Table of Contents

UNITED STATES
SECURITIES AND EXCHANGE COMMISSION
Washington, D.C. 20549
FORMN-CSR
CERTIFIED SHAREHOLDER REPORT OF REGISTERED
MANAGEMENT INVESTMENT COMPANIES
Investment Company Act file number:811-09253
Wells Fargo Funds Trust
(Exact name of registrant as specified in charter)
525 Market St., San Francisco, CA 94105
(Address of principal executive offices) (Zip code)
Catherine Kennedy
Wells Fargo Funds Management, LLC
525 Market St., San Francisco, CA 94105
(Name and address of agent for service)
Registrant’s telephone number, including area code:800-222-8222
Date of fiscal year end: January 31
Registrant is making a filing for 8 of its series:
Wells Fargo 100% Treasury Money Market Fund, Wells Fargo Cash Investment Money Market Fund, Wells Fargo Government Money Market Fund, Wells Fargo Heritage Money Market Fund, Wells Fargo Money Market Fund, Wells Fargo Municipal Cash Management Money Market Fund, Wells Fargo National Tax-Free Money Market Fund, and Wells Fargo Treasury Plus Money Market Fund.
Date of reporting period: January 31, 2020
Table of Contents
ITEM 1. REPORT TO STOCKHOLDERS
Table of Contents

Annual Report
January 31, 2020
Government Money Market Funds
| ∎ | Wells Fargo 100% Treasury Money Market Fund |
Beginning on January 1, 2021, as permitted by new regulations adopted by the Securities and Exchange Commission, paper copies of the Wells Fargo Funds’ annual and semi-annual shareholder reports issued after this date will no longer be sent by mail, unless you specifically request paper copies of the reports. Instead, the reports will be made available on the Funds’ website, and you will be notified by mail each time a report is posted and provided with a website address to access the report.
If you already elected to receive shareholder reports electronically, you will not be affected by this change and you need not take any action. You may elect to receive shareholder reports and other communications from the Fund electronically at any time by contacting your financial intermediary (such as a broker-dealer or bank) or, if you are a direct investor, by calling1-800-222-8222 or by enrolling at wellsfargo.com/advantagedelivery.
You may elect to receive all future reports in paper free of charge. If you invest through a financial intermediary, you can contact your financial intermediary to request that you continue to receive paper copies of your shareholder reports; if you invest directly with the Fund, you can call 1-800-222-8222. Your election to receive reports in paper will apply to all Wells Fargo Funds held in your account with your financial intermediary or, if you are a direct investor, to all Wells Fargo Funds that you hold.
Table of Contents
|
Reduce clutter. Save trees. |
Sign up for electronic delivery of prospectuses and shareholder reports atwellsfargo.com/advantagedelivery |
The views expressed and any forward-looking statements are as of January 31, 2020, unless otherwise noted, and are those of the Fund managers and/or Wells Fargo Asset Management. Discussions of individual securities, or the markets generally, or any Wells Fargo Fund are not intended as individual recommendations. Future events or results may vary significantly from those expressed in any forward-looking statements. The views expressed are subject to change at any time in response to changing circumstances in the market. Wells Fargo Asset Management and the Fund disclaim any obligation to publicly update or revise any views expressed or forward-looking statements.
INVESTMENT PRODUCTS: NOT FDIC INSURED ◾ NO BANK GUARANTEE ◾ MAY LOSE VALUE
Government Money Market Funds | 1
Table of Contents
Letter to shareholders (unaudited)

Andrew Owen
President
Wells Fargo Funds
Dear Shareholder:
We are pleased to offer you this annual report for the Wells Fargo 100% Treasury Money Market Fund for the 12-month period that ended January 31, 2020. Despite some periods of market volatility, the year was strongly positive for financial markets as supportive central banks more than offset concerns over slowing global economic growth and international trade tensions.
Overall, both fixed-income and equity investors enjoyed healthy annual returns, with U.S. markets leading the way. For the period, U.S. stocks, based on the S&P 500 Index,1 gained 21.68% and international stocks, as measured by the MSCI ACWI ex USA Index (Net),2 returned 9.94%. The MSCI EM Index (Net)3 gained a more modest 3.81%. For bond investors, the Bloomberg Barclays U.S. Aggregate Bond Index4 added 9.64%, the Bloomberg Barclays Global Aggregate ex-USD Index5 returned 3.95%, the Bloomberg Barclays Municipal Bond Index6 gained 8.65%, and the ICE BofA U.S. High Yield Index7 added 9.39%.
The year began with a strong market rebound.
Financial markets opened 2019 on a positive note, as investors were encouraged by the U.S. Federal Reserve (Fed) taking a more accommodative stance after a series of increases to the federal funds rate in 2017 and 2018. However, concerns over slowing global growth grew more ominous. Fourth-quarter 2018 gross domestic product (GDP), reported in February 2019, grew at an annualized 2.2% rate, down from the levels of the prior two quarters. The Bank of England forecast the slowest growth since the financial crisis for 2019. China and the U.S. continued to wrangle over trade issues. By the end of the first quarter of 2019, more accommodative Fed sentiment and steady, if not spectacular, U.S. economic and business metrics encouraged domestic investors.
Early second-quarter 2019 enthusiasm among investors faded.
During April, sustained low inflation, solid employment data, and first-quarter U.S. GDP of an annualized rate of 3.2% supported favorable sentiment. During May, however, markets tumbled on mixed investment signals. In the U.S., partisan political wrangling ramped up in advance of the 2020 election. The U.K.’s Brexit disagreements caused Prime Minister Theresa May to resign. Boris Johnson succeeded her, only to add to uncertainty about Brexit’s resolution ahead of an October 2019 deadline. The European Commission downgraded the 2019 growth forecast to 1.2%. The U.S. increased tariffs on
| 1 | The S&P 500 Index consists of 500 stocks chosen for market size, liquidity, and industry group representation. It is a market-value-weighted index with each stock’s weight in the index proportionate to its market value. You cannot invest directly in an index. |
| 2 | The Morgan Stanley Capital International (MSCI) All Country World Index (ACWI) ex USA Index (Net) is a free-float-adjusted market-capitalization-weighted index that is designed to measure the equity market performance of developed markets, excluding the United States. Source: MSCI. MSCI makes no express or implied warranties or representations and shall have no liability whatsoever with respect to any MSCI data contained herein. The MSCI data may not be further redistributed or used as a basis for other indices or any securities or financial products. This report is not approved, reviewed, or produced by MSCI. You cannot invest directly in an index. |
| 3 | The MSCI Emerging Markets (EM) Index (Net) is a free-float-adjusted market-capitalization-weighted index that is designed to measure equity market performance of emerging markets. You cannot invest directly in an index. |
| 4 | The Bloomberg Barclays U.S. Aggregate Bond Index is a broad-based benchmark that measures the investment-grade, U.S. dollar-denominated, fixed-rate taxable bond market, including Treasuries, government-related and corporate securities, mortgage-backed securities (agency fixed-rate and hybrid adjustable-rate mortgage pass-throughs), asset-backed securities, and commercial mortgage-backed securities. You cannot invest directly in an index. |
| 5 | The Bloomberg Barclays Global Aggregate ex-USD Index is an unmanaged index that provides a broad-based measure of the global investment-grade fixed-income markets excluding the U.S. dollar-denominated debt market. You cannot invest directly in an index. |
| 6 | The Bloomberg Barclays Municipal Bond Index is an unmanaged index composed of long-term tax-exempt bonds with a minimum credit rating of Baa. You cannot invest directly in an index. |
| 7 | The ICE BofA U.S. High Yield Index is a market-capitalization-weighted index of domestic and Yankee high-yield bonds. The index tracks the performance of high-yield securities traded in the U.S. bond market. You cannot invest directly in an index. Copyright 2020. ICE Data Indices, LLC. All rights reserved. |
2 | Government Money Market Funds
Table of Contents
Letter to shareholders (unaudited)
products from China, China responded, and then talks broke down. President Donald Trump threatened to turn his foreign policy tariff tool to Mexico over immigration issues.
Midway through the year, investors regrouped, sentiment turned positive, and U.S. equity markets advanced during June and July. The gains, primarily driven by geopolitical and monetary policy events, pushed equity markets to new highs. European Central Bank President Mario Draghi indicated the bank was ready to cut rates or buy more assets to prop up inflation if needed. President Trump backed off of tariff threats against Mexico and China. In the U.S., the Fed implemented a 0.25% federal funds rate cut in July.
Later in July, the U.S. reversed course and threatened to impose higher tariffs on China’s exports after talks failed. China responded with tariff threats of its own and devalued the renminbi, roiling global markets. Major U.S. stock market indices closed July with the worst weekly results of the year. Bond prices gained as Treasury yields fell to multiyear lows, and the yield curve inverted at multiple points along the 30-year arc.
In August, U.S.-China trade tensions continued with no signs of compromise. Evidence of a continued global economic slowdown mounted, and central banks in China, New Zealand, and Thailand cut interest rates. Industrial and manufacturing data declined in China, Canada, Japan, and Germany. Adding to global uncertainty, Italy’s prime minister resigned, many feared a crackdown in Hong Kong as protestors sustained their calls for reform, and Boris Johnson planned to suspend Parliament as Brexit’s deadline neared.
In the U.S., the Fed cut interest rates a second time in September. U.S. manufacturing data disappointed investors. The U.S. Congress announced it would pursue an impeachment investigation of President Trump. Meanwhile, the Brexit impasse showed no signs of resolution. Officials in China said that hitting the country’s economic growth goals for the year would be difficult considering the weight of tariffs and trade restrictions. Although the S&P 500 Index finished the third quarter with the best year-to-date returns in more than 20 years, concerns about future returns remained.
The fourth quarter started on a strong note, with U.S.-China trade tensions relaxing in October along with renewed optimism for a U.K. Brexit deal and positive macroeconomic data. The initial estimate of U.S. third-quarter GDP growth was a resilient 1.9% annualized rate, while the U.S. unemployment rate fell to a 50-year low of 3.5% in September. However, despite resilience among U.S. consumers, business confidence declined while manufacturing activity contracted. Concerned with a potential economic slowdown, the Fed lowered interest rates another quarter point in late October, its third rate cut in four months. This helped push the S&P 500 Index to a new all-time high, while emerging market equities rallied and global bonds declined overall, reflecting a broad pickup in risk appetite.
Equity markets continued to rally in November despite ongoing geopolitical risks. Hopes for a U.S.-China trade deal buoyed investor confidence. U.S. business sentiment improved slightly, and manufacturing and services activity picked up. Throughout the month, central bank actions were on hold. With that positive backdrop, developed market equities outpaced those in emerging markets, and U.S. stocks, as reflected by the S&P 500 Index, outperformed non-U.S. stocks overall. While consumer confidence and purchasing manager activity rose in the eurozone, China reported weakening manufacturing and consumer data. Bond yields rose marginally, leading to slightly negative returns for global government and investment-grade corporate bonds.
Financial markets ended 2019 on a broadly positive note, with the U.S. and China reaching an accord on a Phase One trade deal, with some details to be worked out. That, along with the landslide win by the pro-Brexit U.K. Conservative Party in a national election and ongoing central bank support, gave investors greater certainty and confidence. U.S. economic indicators were generally positive, with the exception of manufacturing activity and business confidence. However, consumer confidence was resilient, fed by a robust labor market, tame inflation, and lower interest rates, which boosted housing affordability and stimulated homebuyer activity. The impeachment of U.S. President Donald Trump,
“Midway through the year, investors regrouped, sentiment turned positive, and U.S. equity markets advanced.”
“Financial markets ended 2019 on a broadly positive note, with the U.S. and China reaching an accord on a Phase One trade deal.”
Government Money Market Funds | 3
Table of Contents
Letter to shareholders (unaudited)
while historically noteworthy, had little impact on markets. Meanwhile, slowing Chinese economic activity, partly attributable to the trade war, led to further government stimulus at year-end through lower reserve ratios, allowing banks to lend more money.
The year-end rally continued in early January 2020. However, capital market volatility picked up in late January on concerns over the unknown impact of the coronavirus on the global economy and stock markets. With sentiment somewhat souring, perceived safe havens did well in January. The U.S. dollar and Japanese yen both rose and government bonds outperformed equities. While the S&P 500 Index held its ground, emerging market equities tumbled, including those in Asia, that are most exposed to viruses—physical or economic—originating in China.
Following the end of the reporting period, the coronavirus continued its global spread, resulting in disruptions to global markets, including through border closings, restrictions on travel and large gatherings, expedited and enhanced health screenings, quarantines, cancellations, business and school closings, disruptions to employment and supply chains, reduced productivity, and reduced customer and client activity in multiple markets and sectors. The risk of further spreading of the coronavirus has led to significant uncertainty and volatility in the financial markets. The full extent of the coronavirus’s impact on the global economy cannot necessarily be foreseen and the impacts may be short term or may last for an extended period of time.
Don’t let short-term uncertainty derail long-term investment goals.
Periods of investment uncertainty can present challenges, but experience has taught us that maintaining long-term investment goals can be an effective way to plan for the future. To help you create a sound strategy based on your personal goals and risk tolerance, Wells Fargo Funds offers more than 100 mutual funds spanning a wide range of asset classes and investment styles. Although diversification cannot guarantee an investment profit or prevent losses, we believe it can be an effective way to manage investment risk and potentially smooth out overall portfolio performance. We encourage investors to know their investments and to understand that appropriate levels of risk-taking may unlock opportunities.
Thank you for choosing to invest with Wells Fargo Funds. We appreciate your confidence in us and remain committed to helping you meet your financial needs.
Sincerely,

Andrew Owen
President
Wells Fargo Funds
|
For further information about your Fund, contact your investment professional, visit our website atwfam.com, or call us directly at1-800-222-8222. |
4 | Government Money Market Funds
Table of Contents
This page is intentionally left blank.
Table of Contents
Performance highlights (unaudited)
Investment objective
The Fund seeks current income exempt from most state and local individual income taxes, while preserving capital and liquidity.
Manager
Wells Fargo Funds Management, LLC
Subadviser
Wells Capital Management Incorporated
Portfolio managers
Michael C. Bird, CFA®‡
Jeffrey L. Weaver, CFA®‡
Laurie White
Average annual total returns (%) as of January 31, 2020
| Expense ratios1 (%) | ||||||||||||||||||||||
| Inception date | 1 year | 5 year | 10 year | Gross | Net2 | |||||||||||||||||
| Class A (WFTXX) | 11-8-1999 | 1.54 | 0.64 | 0.32 | 0.62 | 0.60 | ||||||||||||||||
| Administrator Class (WTRXX)3 | 6-30-2010 | 1.84 | 0.85 | 0.43 | 0.35 | 0.30 | ||||||||||||||||
| Institutional Class (WOTXX)4 | 10-31-2014 | 1.95 | 0.93 | 0.47 | 0.23 | 0.20 | ||||||||||||||||
| Service Class (NWTXX) | 12-3-1990 | 1.64 | 0.71 | 0.36 | 0.52 | 0.50 | ||||||||||||||||
| Sweep Class5 | 6-30-2010 | 1.34 | 0.53 | 0.27 | 0.78 | 0.78 | ||||||||||||||||
Yield summary (%) as of January 31, 20202
| Class A | Administrator Class | Institutional Class | Service Class | Sweep Class | ||||||||||||||
| 7-day current yield | 1.01 | 1.31 | 1.41 | 1.11 | 0.83 | |||||||||||||
| 7-day compound yield | 1.01 | 1.32 | 1.42 | 1.11 | 0.83 | |||||||||||||
| 30-day simple yield | 1.02 | 1.32 | 1.42 | 1.12 | 0.84 | |||||||||||||
| 30-day compound yield | 1.02 | 1.32 | 1.42 | 1.12 | 0.84 | |||||||||||||
Figures quoted represent past performance, which is no guarantee of future results, and do not reflect taxes that shareholder may pay on an investment in a fund. Investment returns will fluctuate. The Fund’s yield figures more closely reflect the current earnings of the Fund than the total return figures. Current performance may be lower or higher than the performance data quoted, which assumes the reinvestment of dividends and capital gains. Currentmonth-end performance is available on the Fund’s website,wfam.com.
Money market funds are sold without a front-end sales charge or contingent deferred sales charge. Other fees and expenses apply to an investment in the Fund and are described in the Fund’s current prospectus.
For government money market funds: You could lose money by investing in the Fund. Although the Fund seeks to preserve the value of your investment at $1.00 per share, it cannot guarantee it will do so. An investment in the Fund is not insured or guaranteed by the Federal Deposit Insurance Corporation or any other government agency. The Fund’s sponsor has no legal obligation to provide financial support to the Fund, and you should not expect that the sponsor will provide financial support to the Fund at any time.
Please see footnotes on page 7.
6 | Government Money Market Funds
Table of Contents
Performance highlights (unaudited)
| Portfolio composition as of January 31, 20206 |
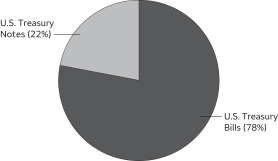 |
| Effective maturity distribution as of January 31, 20206 |
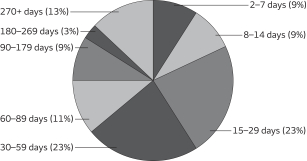 |
| Weighted average maturity as of January 31, 20207 |
40 days |
| Weighted average life as of January 31, 20208 |
94 days |
| ‡ | CFA® and Chartered Financial Analyst®are trademarks owned by CFA Institute. |
| 1 | Reflects the expense ratios as stated in the most recent prospectuses. The expense ratios shown are subject to change and may differ from the annualized expense ratios shown in the financial highlights of this report. |
| 2 | The manager has contractually committed through May 31, 2020, to waive fees and/or reimburse expenses to the extent necessary to cap total annual fund operating expenses after fee waivers at 0.60% for Class A, 0.30% for Administrator Class, 0.20% for Institutional Class, 0.50% for Service Class, and 0.83% for Sweep Class. Brokerage commissions, stamp duty fees, interest, taxes, acquired fund fees and expenses (if any), and extraordinary expenses are excluded from the expense cap. Prior to or after the commitment expiration date, the cap may be increased or the commitment to maintain the cap may be terminated only with the approval of the Board of Trustees. Without this cap, the Fund’s returns would have been lower. Without waived fees and/or reimbursed expenses, the Fund’s7-day current yield would have been 0.99%, 1.26%, 1.38%, 1.09%, and 0.83% for Class A, Administrator Class, Institutional Class, Service Class, and Sweep Class, respectively. The expense ratio paid by an investor is the net expense ratio (the total annual fund operating expenses after fee waivers) as stated in the prospectuses. |
| 3 | Historical performance shown for the Administrator Class shares prior to their inception reflects the performance of Service Class shares, and includes the higher expenses applicable to Service Class shares. If these expenses had not been included, returns for Administrator Class shares would be higher. |
| 4 | Historical performance shown for the Institutional Class shares prior to their inception reflects the performance of Administrator Class shares, and includes the higher expenses applicable to Administrator Class shares. If these expenses had not been included, returns for Institutional Class shares would be higher. |
| 5 | Historical performance shown for the Sweep Class shares prior to their inception reflects the performance of Service Class shares, and includes the higher expenses applicable to Service Class shares. If these expenses had not been included, returns for Sweep Class shares would be higher. |
| 6 | Amounts are calculated based on the total investments of the Fund. These amounts are subject to change and may have changed since the date specified. |
| 7 | Weighted Average Maturity (WAM): WAM is an average of the effective maturities of all securities held in the portfolio, weighted by each security’s percentage of total investments. The maturity of a portfolio security is the period remaining until the date on which the principal amount is unconditionally required to be paid, or in the case of a security called for redemption, the date on which the redemption payment is unconditionally required to be made. WAM calculations allow for the maturities of certain securities with demand features or periodic interest rate resets to be shortened. WAM is a way to measure a fund’s sensitivity to potential interest rate changes. WAM is subject to change and may have changed since the date specified. |
| 8 | Weighted Average Life (WAL): WAL is an average of the final maturities of all securities held in the portfolio, weighted by their percentage of total investments. The maturity of a portfolio security is the period remaining until the date on which the principal amount is unconditionally required to be paid, or in the case of a security called for redemption, the date on which the redemption payment is unconditionally required to be made. In contrast to WAM, the calculation of WAL allows for the maturities of certain securities with demand features to be shortened, but not the periodic interest rate resets. WAL is a way to measure a fund’s potential sensitivity to credit spread changes. WAL is subject to change and may have changed since the date specified. |
| 9 | The Core Personal Consumption Expenditures (PCE) Price Index measures the prices paid by U.S. consumers for domestic goods and services, excluding the prices of food and energy. You cannot invest directly into an index. |
Government Money Market Funds | 7
Table of Contents
Performance highlights (unaudited)
MANAGER’S DISCUSSION
The Fund’s fiscal year that ended January 31, 2020, saw the U.S. Federal Reserve (Fed) end the monetary policy normalization actions it had taken over the past several years, which included both raising interest rates and reducing the size of its balance sheet. The fiscal year began with the Fed targeting the range on the federal funds rate at 2.25% to 2.50%. Despite a generally steady domestic economy, with the drag from a slowing factory sector offset by continued solid consumer activity, the Fed sought to counter the economic risks from trade disputes, slowing global growth, and sluggish U.S. manufacturing by lowering its interest rate target three times—in July, September, and October—by 0.25% each. The resulting federal funds target rate at the end of the fiscal year was 1.50% to 1.75%.
In addition to cutting interest rates, the Fed also reversed course on its balance sheet policy. Since 2017, it had shrunk its balance sheet by systematically allowing a portion of the U.S. Treasury and mortgage-backed securities it acquired during its quantitative easing programs to mature without being reinvested, thereby effectively unwinding the policies it used to assist the economy’s recovery from the financial crisis. The Fed abruptly halted this gradual asset reduction by once again reinvesting all of its maturing investments concurrent with its first interest rate cut in July 2019. Later, in October, the Fed completed the reversal by once again expanding its balance sheet, this time by buying $60 billion of Treasury bills(T-bills) per month with the goal of expanding the banking system’s reserves.
During the year, the U.S. economy grew solidly, with gross domestic product clocking in at an average rate of approximately 2.3% on an annualized basis, only modestly slower than the 2.5% rate posted the prior year. Employment remained strong, with the unemployment rate ending the fiscal year at 3.6%, down from 4.0% a year earlier. In addition, the underemployment rate, which includes workers marginally attached to the labor force and those working part time for economic reasons, fell even further, from 8.0% to 6.9% over the same period. Both measures were at or near50-year lows. Price inflation, however, remained stubbornly below the Fed’s 2% target. After ending the prior fiscal year at 1.8%, the Core PCE Price Index9 deflator, the Fed’s preferred price measure, fell to 1.6% at the end of this fiscal year.
Interest rates on all categories of government money market securities moved lower throughout the year, consistent with the Fed’s moves. In February 2019, the3-monthT-bill yields averaged 2.42%. During January 2020, the last month of the fiscal year, they averaged 1.54%. For the entire fiscal year, the average was 2.01%, down from an average of 2.04% for the prior fiscal year. Similarly, average6-monthT-bill yields were 2.49% in February 2019; 1.55% in January 2020; and 2.01% on average for the whole fiscal year, down from an average of 2.21% in the previous fiscal year. The lower yields onT-bills were due not only to the Fed’s interest rate cuts but also to the Fed’s reserves management purchases of $60 billion per month discussed above.
Our investment strategy remained consistent. We invested inT-bills and U.S. Treasury notes—including floating-rate notes—while taking into account the Fund’s overall level of liquidity and average maturity and seeking to maintain a stable $1.00 net asset value.
Strategic outlook
The economy has continued its solid performance, with a consistently strong labor market and stable—but still below target—inflation. After its third, and last, interest rate reduction of the year in October 2019, the Fed signaled that it intended to keep rates unchanged barring a material change in its outlook. A weaker economy may lead to further cuts, but a stronger economy alone will not necessarily cause higher rates unless it is accompanied by consistently strong inflation. Just as the fiscal year ended, in February and March 2020, the coronavirus began to spread globally, prompting consumers, businesses, and governments to take unusually strong actions in an attempt to limit its impact. In so doing, it appears that there could be a serious toll on the U.S. and global economy. Anticipating this, financial markets experienced a sharp spike in volatility, prompting a series of supportive actions by the Fed. In the face of all this, we continue to believe that our investment strategy, with its focus on capital preservation and liquidity, is as important as ever.
Please see footnotes on page 7.
8 | Government Money Market Funds
Table of Contents
As a shareholder of the Fund, you incur ongoing costs, including management fees, distribution(12b-1) and/or shareholder servicing fees, and other Fund expenses. This example is intended to help you understand your ongoing costs (in dollars) of investing in the Fund and to compare these costs with the ongoing costs of investing in other mutual funds.
The example is based on an investment of $1,000 invested at the beginning of thesix-month period and held for the entire period from August 1, 2019 to January 31, 2020.
Actual expenses
The “Actual” line of the table below provides information about actual account values and actual expenses. You may use the information in this line, together with the amount you invested, to estimate the expenses that you paid over the period. Simply divide your account value by $1,000 (for example, an $8,600 account value divided by $1,000 = 8.6), then multiply the result by the number in the “Actual” line under the heading entitled “Expenses paid during period” for your applicable class of shares to estimate the expenses you paid on your account during this period.
Hypothetical example for comparison purposes
The “Hypothetical” line of the table below provides information about hypothetical account values and hypothetical expenses based on the Fund’s actual expense ratio and an assumed rate of return of 5% per year before expenses, which is not the Fund’s actual return. The hypothetical account values and expenses may not be used to estimate the actual ending account balance or expenses you paid for the period. You may use this information to compare the ongoing costs of investing in the Fund and other funds. To do so, compare this 5% hypothetical example with the 5% hypothetical examples that appear in the shareholder reports of the other funds.
Please note that the expenses shown in the table are meant to highlight your ongoing costs only. Therefore, the “Hypothetical” line of the table is useful in comparing ongoing costs only and will not help you determine the relative total costs of owning different funds.
| Beginning account value 8-1-2019 | Ending account value 1-31-2020 | Expenses paid during the period1 | Annualized net expense ratio | |||||||||||||
Class A | ||||||||||||||||
Actual | $ | 1,000.00 | $ | 1,006.34 | $ | 3.03 | 0.60 | % | ||||||||
Hypothetical (5% return before expenses) | $ | 1,000.00 | $ | 1,022.12 | $ | 3.05 | 0.60 | % | ||||||||
Administrator Class | ||||||||||||||||
Actual | $ | 1,000.00 | $ | 1,007.86 | $ | 1.51 | 0.30 | % | ||||||||
Hypothetical (5% return before expenses) | $ | 1,000.00 | $ | 1,023.63 | $ | 1.53 | 0.30 | % | ||||||||
Institutional Class | ||||||||||||||||
Actual | $ | 1,000.00 | $ | 1,008.37 | $ | 1.01 | 0.20 | % | ||||||||
Hypothetical (5% return before expenses) | $ | 1,000.00 | $ | 1,024.13 | $ | 1.02 | 0.20 | % | ||||||||
Service Class | ||||||||||||||||
Actual | $ | 1,000.00 | $ | 1,006.85 | $ | 2.52 | 0.50 | % | ||||||||
Hypothetical (5% return before expenses) | $ | 1,000.00 | $ | 1,022.62 | $ | 2.54 | 0.50 | % | ||||||||
Sweep Class | ||||||||||||||||
Actual | $ | 1,000.00 | $ | 1,005.45 | $ | 3.93 | 0.78 | % | ||||||||
Hypothetical (5% return before expenses) | $ | 1,000.00 | $ | 1,021.22 | $ | 3.96 | 0.78 | % | ||||||||
| 1 | Expenses paid is equal to the annualized net expense ratio of each class multiplied by the average account value over the period, multiplied by the number of days in the most recent fiscal half-year divided by the number of days in the fiscal year (to reflect theone-half-year period). |
Government Money Market Funds | 9
Table of Contents
Portfolio of investments—January 31, 2020
| Interest rate | Maturity date | Principal | Value | |||||||||||||
| Treasury Debt : 104.44% | ||||||||||||||||
U.S. Treasury Bill (z)## | 1.51 | % | 2-4-2020 | $ | 1,078,210,000 | $ | 1,078,164,827 | |||||||||
U.S. Treasury Bill (z) | 1.52 | 2-18-2020 | 1,375,080,000 | 1,374,211,661 | ||||||||||||
U.S. Treasury Bill (z) | 1.52 | 2-11-2020 | 888,650,000 | 888,350,141 | ||||||||||||
U.S. Treasury Bill (z) | 1.52 | 3-10-2020 | 240,000,000 | 239,635,200 | ||||||||||||
U.S. Treasury Bill (z) | 1.53 | 5-7-2020 | 15,000,000 | 14,940,663 | ||||||||||||
U.S. Treasury Bill (z) | 1.53 | 3-17-2020 | 396,170,000 | 395,448,331 | ||||||||||||
U.S. Treasury Bill (z) | 1.53 | 3-3-2020 | 1,030,000,000 | 1,028,762,644 | ||||||||||||
U.S. Treasury Bill (z) | 1.53 | 7-30-2020 | 15,000,000 | 14,887,638 | ||||||||||||
U.S. Treasury Bill (z) | 1.53 | 6-11-2020 | 15,000,000 | 14,918,300 | ||||||||||||
U.S. Treasury Bill (z) | 1.53 | 3-24-2020 | 290,000,000 | 289,383,750 | ||||||||||||
U.S. Treasury Bill (z) | 1.54 | 2-25-2020 | 1,130,000,000 | 1,128,941,665 | ||||||||||||
U.S. Treasury Bill (z) | 1.54 | 4-30-2020 | 315,000,000 | 313,834,430 | ||||||||||||
U.S. Treasury Bill (z) | 1.54 | 7-9-2020 | 20,000,000 | 19,866,724 | ||||||||||||
U.S. Treasury Bill (z) | 1.54 | 7-16-2020 | 25,000,000 | 24,825,750 | ||||||||||||
U.S. Treasury Bill (z) | 1.54 | 2-13-2020 | 383,680,000 | 383,515,959 | ||||||||||||
U.S. Treasury Bill (z) | 1.54 | 4-23-2020 | 265,000,000 | 264,094,256 | ||||||||||||
U.S. Treasury Bill (z) | 1.55 | 6-18-2020 | 15,000,000 | 14,913,017 | ||||||||||||
U.S. Treasury Bill (z) | 1.55 | 7-23-2020 | 15,000,000 | 14,890,631 | ||||||||||||
U.S. Treasury Bill (z) | 1.55 | 2-20-2020 | 336,420,000 | 336,175,077 | ||||||||||||
U.S. Treasury Bill (z) | 1.55 | 4-16-2020 | 225,000,000 | 224,296,949 | ||||||||||||
U.S. Treasury Bill (z)%% | 1.55 | 3-31-2020 | 290,000,000 | 289,300,778 | ||||||||||||
U.S. Treasury Bill (z) | 1.56 | 5-21-2020 | 15,000,000 | 14,930,340 | ||||||||||||
U.S. Treasury Bill (z) | 1.56 | 7-2-2020 | 45,000,000 | 44,709,375 | ||||||||||||
U.S. Treasury Bill (z) | 1.56 | 3-12-2020 | 285,000,000 | 284,532,230 | ||||||||||||
U.S. Treasury Bill (z) | 1.57 | 5-14-2020 | 25,000,000 | 24,890,934 | ||||||||||||
U.S. Treasury Bill (z) | 1.57 | 5-28-2020 | 25,000,000 | 24,875,576 | ||||||||||||
U.S. Treasury Bill (z) | 1.57 | 3-5-2020 | 245,000,000 | 244,669,725 | ||||||||||||
U.S. Treasury Bill (z) | 1.57 | 6-25-2020 | 20,000,000 | 19,876,067 | ||||||||||||
U.S. Treasury Bill (z) | 1.58 | 4-2-2020 | 325,000,000 | 324,164,437 | ||||||||||||
U.S. Treasury Bill (z) | 1.58 | 4-9-2020 | 370,000,000 | 368,934,330 | ||||||||||||
U.S. Treasury Bill (z) | 1.58 | 6-4-2020 | 25,000,000 | 24,867,156 | ||||||||||||
U.S. Treasury Bill (z) | 1.61 | 2-6-2020 | 185,000,000 | 184,975,365 | ||||||||||||
U.S. Treasury Bill (z) | 1.61 | 3-19-2020 | 305,000,000 | 304,388,088 | ||||||||||||
U.S. Treasury Bill (z) | 1.63 | 2-27-2020 | 295,000,000 | 294,680,297 | ||||||||||||
U.S. Treasury Bill (z) | 1.66 | 3-26-2020 | 355,000,000 | 354,154,487 | ||||||||||||
U.S. Treasury Note | 1.13 | 4-30-2020 | 40,000,000 | 39,941,718 | ||||||||||||
U.S. Treasury Note | 1.25 | 2-29-2020 | 70,000,000 | 69,958,738 | ||||||||||||
U.S. Treasury Note | 1.38 | 2-29-2020 | 20,000,000 | 19,990,448 | ||||||||||||
U.S. Treasury Note | 1.38 | 4-30-2020 | 30,000,000 | 29,948,921 | ||||||||||||
U.S. Treasury Note | 1.38 | 5-31-2020 | 10,000,000 | 9,983,894 | ||||||||||||
U.S. Treasury Note | 1.38 | 8-31-2020 | 20,000,000 | 19,942,476 | ||||||||||||
U.S. Treasury Note | 1.38 | 9-15-2020 | 10,000,000 | 9,982,910 | ||||||||||||
U.S. Treasury Note | 1.50 | 7-15-2020 | 50,000,000 | 49,975,683 | ||||||||||||
U.S. Treasury Note (U.S. Treasury 3 Month Bill Money Market Yield +0.03%)± | 1.57 | 4-30-2020 | 360,000,000 | 359,999,437 | ||||||||||||
U.S. Treasury Note (U.S. Treasury 3 Month Bill Money Market Yield +0.04%)± | 1.58 | 7-31-2020 | 265,000,000 | 264,984,721 | ||||||||||||
U.S. Treasury Note (U.S. Treasury 3 Month Bill Money Market Yield +0.05%)± | 1.58 | 10-31-2020 | 335,000,000 | 334,888,938 | ||||||||||||
U.S. Treasury Note | 1.63 | 6-30-2020 | 10,000,000 | 9,990,637 | ||||||||||||
U.S. Treasury Note | 1.63 | 10-15-2020 | 10,000,000 | 9,999,447 | ||||||||||||
U.S. Treasury Note | 1.63 | 11-30-2020 | 10,000,000 | 9,998,699 | ||||||||||||
U.S. Treasury Note (U.S. Treasury 3 Month Bill Money Market Yield +0.12%)± | 1.65 | 1-31-2021 | 390,000,000 | 389,844,548 | ||||||||||||
U.S. Treasury Note (U.S. Treasury 3 Month Bill Money Market Yield +0.14%)± | 1.67 | 4-30-2021 | 300,000,000 | 299,893,462 | ||||||||||||
The accompanying notes are an integral part of these financial statements.
10 | Government Money Market Funds
Table of Contents
Portfolio of investments—January 31, 2020
| Interest rate | Maturity date | Principal | Value | |||||||||||||
| Treasury Debt (continued) | ||||||||||||||||
U.S. Treasury Note (U.S. Treasury 3 Month Bill Money Market Yield +0.15%)± | 1.69 | % | 1-31-2022 | $ | 40,000,000 | $ | 40,000,000 | |||||||||
U.S. Treasury Note | 1.75 | 11-15-2020 | 20,000,000 | 20,019,399 | ||||||||||||
U.S. Treasury Note (U.S. Treasury 3 Month Bill Money Market Yield +0.22%)± | 1.76 | 7-31-2021 | 170,000,000 | 169,967,065 | ||||||||||||
U.S. Treasury Note (U.S. Treasury 3 Month Bill Money Market Yield +0.30%)± | 1.84 | 10-31-2021 | 290,000,000 | 290,192,917 | ||||||||||||
U.S. Treasury Note | 2.00 | 11-30-2020 | 15,000,000 | 15,042,449 | ||||||||||||
U.S. Treasury Note | 2.13 | 8-31-2020 | 20,000,000 | 20,053,486 | ||||||||||||
U.S. Treasury Note | 2.25 | 2-29-2020 | 20,000,000 | 20,002,688 | ||||||||||||
U.S. Treasury Note | 2.25 | 3-31-2020 | 50,000,000 | 50,023,663 | ||||||||||||
U.S. Treasury Note | 2.38 | 4-30-2020 | 15,000,000 | 15,024,628 | ||||||||||||
U.S. Treasury Note | 2.50 | 5-31-2020 | 83,833,000 | 84,011,168 | ||||||||||||
U.S. Treasury Note | 2.50 | 12-31-2020 | 20,000,000 | 20,158,948 | ||||||||||||
U.S. Treasury Note | 2.63 | 7-31-2020 | 130,000,000 | 130,607,396 | ||||||||||||
U.S. Treasury Note | 2.63 | 11-15-2020 | 150,000,000 | 151,136,328 | ||||||||||||
U.S. Treasury Note | 2.75 | 11-30-2020 | 20,000,000 | 20,179,825 | ||||||||||||
U.S. Treasury Note | 2.88 | 10-31-2020 | 60,000,000 | 60,543,126 | ||||||||||||
U.S. Treasury Note | 3.50 | 5-15-2020 | 20,000,000 | 20,089,729 | ||||||||||||
U.S. Treasury Note | 3.63 | 2-15-2020 | 30,000,000 | 30,014,868 | ||||||||||||
Total Treasury Debt (Cost $13,954,399,158) |
| 13,954,399,158 | ||||||||||||||
|
| |||||||||||||||
| Total investments in securities (Cost $13,954,399,158) | 104.44 | % | 13,954,399,158 | |||||
Other assets and liabilities, net | (4.44 | ) | (593,704,212 | ) | ||||
|
|
|
| |||||
| Total net assets | 100.00 | % | $ | 13,360,694,946 | ||||
|
|
|
| |||||
| (z) | Zero coupon security. The rate represents the current yield to maturity. |
| ## | All or a portion of this security is segregated for when-issued securities. |
| %% | The security is purchased on a when-issued basis. |
| ± | Variable rate investment. The rate shown is the rate in effect at period end. |
The accompanying notes are an integral part of these financial statements.
Government Money Market Funds | 11
Table of Contents
Statement of assets and liabilities—January 31, 2020
Assets | ||||
Investments in unaffiliated securities, at amortized cost | $ | 13,954,399,158 | ||
Cash | 145 | |||
Receivable for investments sold | 492,854,890 | |||
Receivable for Fund shares sold | 4,499,876 | |||
Receivable for interest | 4,850,360 | |||
Prepaid expenses and other assets | 175,660 | |||
|
| |||
Total assets | 14,456,780,089 | |||
|
| |||
Liabilities | ||||
Payable for investments purchased | 1,078,358,834 | |||
Payable for Fund shares redeemed | 6,095,258 | |||
Management fee payable | 1,410,375 | |||
Dividends payable | 7,486,657 | |||
Administration fees payable | 1,141,342 | |||
Distribution fee payable | 171,710 | |||
Trustees’ fees and expenses payable | 4,180 | |||
Accrued expenses and other liabilities | 1,416,787 | |||
|
| |||
Total liabilities | 1,096,085,143 | |||
|
| |||
Total net assets | $ | 13,360,694,946 | ||
|
| |||
Net assets consist of | ||||
Paid-in capital | $ | 13,360,082,196 | ||
Total distributable earnings | 612,750 | |||
|
| |||
Total net assets | $ | 13,360,694,946 | ||
|
| |||
Computation of net asset value per share | ||||
Net assets – Class A | $ | 468,360,481 | ||
Shares outstanding – Class A1 | 468,324,093 | |||
Net asset value per share – Class A | $1.00 | |||
Net assets – Administrator Class | $ | 554,446,907 | ||
Shares outstanding – Administrator Class1 | 554,395,932 | |||
Net asset value per share – Administrator Class | $1.00 | |||
Net assets – Institutional Class | $ | 7,564,484,912 | ||
Shares outstanding – Institutional Class1 | 7,563,853,563 | |||
Net asset value per share – Institutional Class | $1.00 | |||
Net assets – Service Class | $ | 4,230,536,664 | ||
Shares outstanding – Service Class1 | 4,230,174,073 | |||
Net asset value per share – Service Class | $1.00 | |||
Net assets – Sweep Class | $ | 542,865,982 | ||
Shares outstanding – Sweep Class1 | 542,824,083 | |||
Net asset value per share – Sweep Class | $1.00 | |||
| 1 | The Fund has an unlimited number of authorized shares. |
The accompanying notes are an integral part of these financial statements.
12 | Government Money Market Funds
Table of Contents
Statement of operations—year ended January 31, 2020
Investment income | ||||
Interest | $ | 260,758,828 | ||
|
| |||
Expenses | ||||
Management fee | 19,493,460 | |||
Administration fees |
| |||
Class A | 848,941 | |||
Administrator Class | 597,482 | |||
Institutional Class | 5,866,197 | |||
Service Class | 4,313,519 | |||
Sweep Class | 139,729 | |||
Shareholder servicing fees |
| |||
Class A | 964,706 | |||
Administrator Class | 597,132 | |||
Service Class | 8,979,276 | |||
Sweep Class | 1,164,410 | |||
Distribution fee |
| |||
Sweep Class | 1,630,174 | |||
Custody and accounting fees | 243,234 | |||
Professional fees | 52,863 | |||
Registration fees | 124,046 | |||
Shareholder report expenses | 63,234 | |||
Trustees’ fees and expenses | 21,265 | |||
Other fees and expenses | 65,862 | |||
|
| |||
Total expenses | 45,165,530 | |||
Less: Fee waivers and/or expense reimbursements |
| |||
Class A | (120,669 | ) | ||
Administrator Class | (382,083 | ) | ||
Institutional Class | (3,118,686 | ) | ||
Service Class | (1,109,857 | ) | ||
|
| |||
Net expenses | 40,434,235 | |||
|
| |||
Net investment income | 220,324,593 | |||
Net realized gains on investments | 1,197,710 | |||
|
| |||
Net increase in net assets resulting from operations | $ | 221,522,303 | ||
|
| |||
The accompanying notes are an integral part of these financial statements.
Government Money Market Funds | 13
Table of Contents
Statement of changes in net assets
| Year ended January 31, 2020 | Year ended January 31, 2019 | |||||||||||||||
Operations | ||||||||||||||||
Net investment income | $ | 220,324,593 | $ | 174,142,362 | ||||||||||||
Net realized gains (losses) on investments | 1,197,710 | (440,382 | ) | |||||||||||||
|
| |||||||||||||||
Net increase in net assets resulting from operations | 221,522,303 | 173,701,980 | ||||||||||||||
|
| |||||||||||||||
Distributions to shareholders from net investment income and net realized gains | ||||||||||||||||
Class A | (5,743,559 | ) | (3,585,269 | ) | ||||||||||||
Administrator Class | (11,061,889 | ) | (12,151,739 | ) | ||||||||||||
Institutional Class | (141,126,498 | ) | (112,222,067 | ) | ||||||||||||
Service Class | (56,995,623 | ) | (40,839,299 | ) | ||||||||||||
Sweep Class | (6,082,256 | ) | (4,851,067 | ) | ||||||||||||
|
| |||||||||||||||
Total distributions to shareholders | (221,009,825 | ) | (173,649,441 | ) | ||||||||||||
|
| |||||||||||||||
Capital share transactions | Shares | Shares | ||||||||||||||
Proceeds from shares sold | ||||||||||||||||
Class A | 1,190,400,202 | 1,190,400,202 | 1,137,578,905 | 1,137,578,905 | ||||||||||||
Administrator Class | 2,451,512,619 | 2,451,512,619 | 2,946,536,440 | 2,946,536,440 | ||||||||||||
Institutional Class | 25,146,673,331 | 25,146,673,331 | 20,906,716,859 | 20,906,716,859 | ||||||||||||
Service Class | 18,262,618,012 | 18,262,618,012 | 16,011,789,165 | 16,011,789,165 | ||||||||||||
Sweep Class | 4,752,687,515 | 4,752,687,515 | 4,479,924,845 | 4,479,924,845 | ||||||||||||
|
| |||||||||||||||
| 51,803,891,679 | 45,482,546,214 | |||||||||||||||
|
| |||||||||||||||
Reinvestment of distributions | ||||||||||||||||
Class A | 5,712,034 | 5,712,034 | 3,581,445 | 3,581,445 | ||||||||||||
Administrator Class | 6,629,965 | 6,629,965 | 6,604,565 | 6,604,565 | ||||||||||||
Institutional Class | 90,583,672 | 90,583,672 | 78,887,331 | 78,887,331 | ||||||||||||
Service Class | 17,911,478 | 17,911,478 | 9,489,778 | 9,489,778 | ||||||||||||
Sweep Class | 6,057,655 | 6,057,655 | 4,851,067 | 4,851,067 | ||||||||||||
|
| |||||||||||||||
| 126,894,804 | 103,414,186 | |||||||||||||||
|
| |||||||||||||||
Payment for shares redeemed | ||||||||||||||||
Class A | (1,111,780,649 | ) | (1,111,780,649 | ) | (1,048,396,260 | ) | (1,048,396,260 | ) | ||||||||
Administrator Class | (2,595,952,750 | ) | (2,595,952,750 | ) | (3,175,348,441 | ) | (3,175,348,441 | ) | ||||||||
Institutional Class | (24,969,710,678 | ) | (24,969,710,678 | ) | (18,389,742,128 | ) | (18,389,742,128 | ) | ||||||||
Service Class | (16,846,608,441 | ) | (16,846,608,441 | ) | (16,170,354,767 | ) | (16,170,354,767 | ) | ||||||||
Sweep Class | (4,634,944,630 | ) | (4,634,944,630 | ) | (4,547,426,565 | ) | (4,547,426,565 | ) | ||||||||
|
| |||||||||||||||
| (50,158,997,148 | ) | (43,331,268,161 | ) | |||||||||||||
|
| |||||||||||||||
Net increase in net assets resulting from capital share transactions | 1,771,789,335 | 2,254,692,239 | ||||||||||||||
|
| |||||||||||||||
Total increase in net assets | 1,772,301,813 | 2,254,744,778 | ||||||||||||||
|
| |||||||||||||||
Net assets | ||||||||||||||||
Beginning of period | 11,588,393,133 | 9,333,648,355 | ||||||||||||||
|
| |||||||||||||||
End of period | $ | 13,360,694,946 | $ | 11,588,393,133 | ||||||||||||
|
| |||||||||||||||
The accompanying notes are an integral part of these financial statements.
14 | WGovernment Money Market Funds
Table of Contents
(For a share outstanding throughout each period)
| Year ended January 31 | ||||||||||||||||||||
| CLASS A | 2020 | 2019 | 2018 | 2017 | 2016 | |||||||||||||||
Net asset value, beginning of period | $1.00 | $1.00 | $1.00 | $1.00 | $1.00 | |||||||||||||||
Net investment income | 0.02 | 0.01 | 0.00 | 1 | 0.00 | 1 | 0.00 | 1,2 | ||||||||||||
Net realized gains (losses) on investments | 0.00 | 1 | (0.00 | )3 | (0.00 | )3 | 0.00 | 1 | (0.00 | )3 | ||||||||||
|
|
|
|
|
|
|
|
|
| |||||||||||
Total from investment operations | 0.02 | 0.01 | 0.00 | 1 | 0.00 | 1 | (0.00 | )3 | ||||||||||||
Distributions to shareholders from | ||||||||||||||||||||
Net investment income | (0.02 | ) | (0.01 | ) | (0.00 | )1 | (0.00 | )1 | (0.00 | )1 | ||||||||||
Net realized gains | (0.00 | )1 | (0.00 | )1 | (0.00 | )1 | (0.00 | )1 | (0.00 | )1 | ||||||||||
|
|
|
|
|
|
|
|
|
| |||||||||||
Total distributions to shareholders | (0.02 | ) | (0.01 | ) | (0.00 | )1 | (0.00 | )1 | (0.00 | )1 | ||||||||||
Net asset value, end of period | $1.00 | $1.00 | $1.00 | $1.00 | $1.00 | |||||||||||||||
Total return | 1.54 | % | 1.35 | % | 0.32 | % | 0.01 | % | 0.00 | % | ||||||||||
Ratios to average net assets (annualized) | ||||||||||||||||||||
Gross expenses | 0.63 | % | 0.71 | % | 0.79 | % | 0.79 | % | 0.79 | % | ||||||||||
Net expenses | 0.60 | % | 0.62 | % | 0.64 | % | 0.36 | % | 0.08 | % | ||||||||||
Net investment income | 1.49 | % | 1.35 | % | 0.31 | % | 0.00 | % | 0.00 | % | ||||||||||
Supplemental data | ||||||||||||||||||||
Net assets, end of period (000s omitted) | $468,360 | $384,013 | $291,246 | $363,639 | $464,176 | |||||||||||||||
| 1 | Amount is less than $0.005. |
| 2 | Calculated based upon average shares outstanding |
| 3 | Amount is more than $(0.005). |
The accompanying notes are an integral part of these financial statements.
Government Money Market Funds | 15
Table of Contents
Financial highlights
(For a share outstanding throughout each period)
| Year ended January 31 | ||||||||||||||||||||
| ADMINISTRATOR CLASS | 2020 | 2019 | 2018 | 2017 | 2016 | |||||||||||||||
Net asset value, beginning of period | $1.00 | $1.00 | $1.00 | $1.00 | $1.00 | |||||||||||||||
Net investment income | 0.02 | 0.02 | 0.01 | 0.00 | 1 | 0.00 | 1 | |||||||||||||
Net realized gains (losses) on investments | 0.00 | 1 | (0.00 | )2 | (0.00 | )2 | 0.00 | 1 | (0.00 | )2 | ||||||||||
|
|
|
|
|
|
|
|
|
| |||||||||||
Total from investment operations | 0.02 | 0.02 | 0.01 | 0.00 | 1 | (0.00 | )2 | |||||||||||||
Distributions to shareholders from | ||||||||||||||||||||
Net investment income | (0.02 | ) | (0.02 | ) | (0.01 | ) | (0.00 | )1 | (0.00 | )1 | ||||||||||
Net realized gains | (0.00 | )1 | (0.00 | )1 | (0.00 | )1 | (0.00 | )1 | (0.00 | )1 | ||||||||||
|
|
|
|
|
|
|
|
|
| |||||||||||
Total distributions to shareholders | (0.02 | ) | (0.02 | ) | (0.01 | ) | (0.00 | )1 | (0.00 | )1 | ||||||||||
Net asset value, end of period | $1.00 | $1.00 | $1.00 | $1.00 | $1.00 | |||||||||||||||
Total return | 1.84 | % | 1.67 | % | 0.67 | % | 0.07 | % | 0.00 | % | ||||||||||
Ratios to average net assets (annualized) | ||||||||||||||||||||
Gross expenses | 0.36 | % | 0.44 | % | 0.52 | % | 0.52 | % | 0.51 | % | ||||||||||
Net expenses | 0.30 | % | 0.30 | % | 0.30 | % | 0.30 | % | 0.08 | % | ||||||||||
Net investment income | 1.85 | % | 1.63 | % | 0.65 | % | 0.06 | % | 0.00 | % | ||||||||||
Supplemental data | ||||||||||||||||||||
Net assets, end of period (000s omitted) | $554,447 | $692,247 | $914,471 | $1,226,947 | $1,945,991 | |||||||||||||||
| 1 | Amount is less than $0.005. |
| 2 | Amount is more than $(0.005). |
The accompanying notes are an integral part of these financial statements.
16 | Government Money Market Funds
Table of Contents
Financial highlights
(For a share outstanding throughout each period)
| Year ended January 31 | ||||||||||||||||||||
| INSTITUTIONAL CLASS | 2020 | 2019 | 2018 | 2017 | 2016 | |||||||||||||||
Net asset value, beginning of period | $1.00 | $1.00 | $1.00 | $1.00 | $1.00 | |||||||||||||||
Net investment income | 0.02 | 0.02 | 0.01 | 0.00 | 1 | 0.00 | 1 | |||||||||||||
Net realized gains (losses) on investments | 0.00 | 1 | (0.00 | )2 | (0.00 | )2 | 0.00 | 1 | (0.00 | )2 | ||||||||||
|
|
|
|
|
|
|
|
|
| |||||||||||
Total from investment operations | 0.02 | 0.02 | 0.01 | 0.00 | 1 | 0.00 | 1 | |||||||||||||
Distributions to shareholders from | ||||||||||||||||||||
Net investment income | (0.02 | ) | (0.02 | ) | (0.01 | ) | (0.00 | )1 | (0.00 | )1 | ||||||||||
Net realized gains | (0.00 | )1 | (0.00 | )1 | (0.00 | )1 | (0.00 | )1 | (0.00 | )1 | ||||||||||
|
|
|
|
|
|
|
|
|
| |||||||||||
Total distributions to shareholders | (0.02 | ) | (0.02 | ) | (0.01 | ) | (0.00 | )1 | (0.00 | )1 | ||||||||||
Net asset value, end of period | $1.00 | $1.00 | $1.00 | $1.00 | $1.00 | |||||||||||||||
Total return | 1.95 | % | 1.77 | % | 0.77 | % | 0.17 | % | 0.01 | % | ||||||||||
Ratios to average net assets (annualized) | ||||||||||||||||||||
Gross expenses | 0.24 | % | 0.31 | % | 0.40 | % | 0.40 | % | 0.40 | % | ||||||||||
Net expenses | 0.20 | % | 0.20 | % | 0.20 | % | 0.20 | % | 0.11 | % | ||||||||||
Net investment income | 1.92 | % | 1.79 | % | 0.78 | % | 0.18 | % | 0.01 | % | ||||||||||
Supplemental data | ||||||||||||||||||||
Net assets, end of period (000s omitted) | $7,564,485 | $7,296,690 | $4,700,731 | $3,566,678 | $632,263 | |||||||||||||||
| 1 | Amount is less than $0.005. |
| 2 | Amount is more than $(0.005). |
The accompanying notes are an integral part of these financial statements.
Government Money Market Funds | 17
Table of Contents
Financial highlights
(For a share outstanding throughout each period)
| Year ended January 31 | ||||||||||||||||||||
| SERVICE CLASS | 2020 | 2019 | 2018 | 2017 | 2016 | |||||||||||||||
Net asset value, beginning of period | $1.00 | $1.00 | $1.00 | $1.00 | $1.00 | |||||||||||||||
Net investment income | 0.02 | 0.01 | 0.00 | 1 | 0.00 | 1 | 0.00 | 1 | ||||||||||||
Net realized gains (losses) on investments | 0.00 | 1 | (0.00 | )2 | (0.00 | )2 | 0.00 | 1 | (0.00 | )2 | ||||||||||
|
|
|
|
|
|
|
|
|
| |||||||||||
Total from investment operations | 0.02 | 0.01 | 0.00 | 1 | 0.00 | 1 | (0.00 | )2 | ||||||||||||
Distributions to shareholders from | ||||||||||||||||||||
Net investment income | (0.02 | ) | (0.01 | ) | (0.00 | )1 | (0.00 | )1 | (0.00 | )1 | ||||||||||
Net realized gains | (0.00 | )1 | (0.00 | )1 | (0.00 | )1 | (0.00 | )1 | (0.00 | )1 | ||||||||||
|
|
|
|
|
|
|
|
|
| |||||||||||
Total distributions to shareholders | (0.02 | ) | (0.01 | ) | (0.00 | )1 | (0.00 | )1 | (0.00 | )1 | ||||||||||
Net asset value, end of period | $1.00 | $1.00 | $1.00 | $1.00 | $1.00 | |||||||||||||||
Total return | 1.64 | % | 1.46 | % | 0.46 | % | 0.01 | % | 0.00 | % | ||||||||||
Ratios to average net assets (annualized) | ||||||||||||||||||||
Gross expenses | 0.53 | % | 0.61 | % | 0.69 | % | 0.69 | % | 0.69 | % | ||||||||||
Net expenses | 0.50 | % | 0.50 | % | 0.50 | % | 0.36 | % | 0.09 | % | ||||||||||
Net investment income | 1.58 | % | 1.45 | % | 0.45 | % | 0.00 | % | 0.00 | % | ||||||||||
Supplemental data | ||||||||||||||||||||
Net assets, end of period (000s omitted) | $4,230,537 | $2,796,397 | $2,945,498 | $3,337,172 | $5,614,425 | |||||||||||||||
| 1 | Amount is less than $0.005. |
| 2 | Amount is more than $(0.005). |
The accompanying notes are an integral part of these financial statements.
18 | Government Money Market Funds
Table of Contents
Financial highlights
(For a share outstanding throughout each period)
| Year ended January 31 | ||||||||||||||||||||
| SWEEP CLASS | 2020 | 2019 | 2018 | 2017 | 2016 | |||||||||||||||
Net asset value, beginning of period | $1.00 | $1.00 | $1.00 | $1.00 | $1.00 | |||||||||||||||
Net investment income | 0.01 | 0.01 | 0.00 | 1 | 0.00 | 1 | 0.00 | 1 | ||||||||||||
Net realized gains (losses) on investments | 0.00 | 1 | (0.00 | )2 | (0.00 | )2 | 0.00 | 1 | (0.00 | )2 | ||||||||||
|
|
|
|
|
|
|
|
|
| |||||||||||
Total from investment operations | 0.01 | 0.01 | 0.00 | 1 | 0.00 | 1 | (0.00 | )2 | ||||||||||||
Distributions to shareholders from | ||||||||||||||||||||
Net investment income | (0.01 | ) | (0.01 | ) | (0.00 | )1 | (0.00 | )1 | (0.00 | )1 | ||||||||||
Net realized gains | (0.00 | )1 | (0.00 | )1 | (0.00 | )1 | (0.00 | )1 | (0.00 | )1 | ||||||||||
|
|
|
|
|
|
|
|
|
| |||||||||||
Total distributions to shareholders | (0.01 | ) | (0.01 | ) | (0.00 | )1 | (0.00 | )1 | (0.00 | )1 | ||||||||||
Net asset value, end of period | $1.00 | $1.00 | $1.00 | $1.00 | $1.00 | |||||||||||||||
Total return | 1.34 | % | 1.13 | % | 0.18 | % | 0.01 | % | 0.00 | % | ||||||||||
Ratios to average net assets (annualized) | ||||||||||||||||||||
Gross expenses | 0.79 | % | 0.87 | % | 0.95 | % | 1.11 | % | 1.14 | % | ||||||||||
Net expenses | 0.79 | % | 0.83 | % | 0.77 | % | 0.36 | % | 0.09 | % | ||||||||||
Net investment income | 1.30 | % | 1.14 | % | 0.16 | % | 0.00 | % | 0.00 | % | ||||||||||
Supplemental data | ||||||||||||||||||||
Net assets, end of period (000s omitted) | $542,866 | $419,046 | $481,702 | $672,256 | $473,246 | |||||||||||||||
| 1 | Amount is less than $0.005. |
| 2 | Amount is more than $(0.005). |
The accompanying notes are an integral part of these financial statements.
Government Money Market Funds | 19
Table of Contents
1. ORGANIZATION
Wells Fargo Funds Trust (the “Trust”), a Delaware statutory trust organized on March 10, 1999, is anopen-end management investment company registered under the Investment Company Act of 1940, as amended (the “1940 Act”). As an investment company, the Trust follows the accounting and reporting guidance in Financial Accounting Standards Board (“FASB”)Accounting Standards Codification Topic 946, Financial Services – Investment Companies. These financial statements report on the Wells Fargo 100% Treasury Money Market Fund (the “Fund”) which is a diversified series of the Trust.
2. SIGNIFICANT ACCOUNTING POLICIES
The following significant accounting policies, which are consistently followed in the preparation of the financial statements of the Fund, are in conformity with U.S. generally accepted accounting principles which require management to make estimates and assumptions that affect the reported amounts of assets and liabilities, disclosure of contingent assets and liabilities at the date of the financial statements, and the reported amounts of revenues and expenses during the reporting period. Actual results could differ from those estimates.
Securities valuation
As permitted under Rule2a-7 of the 1940 Act, portfolio securities are valued at amortized cost, which approximates fair value. The amortized cost method involves valuing a security at its cost, plus accretion of discount or minus amortization of premium over the period until maturity.
Investments which are not valued using the method discussed above are valued at their fair value, as determined in good faith by the Board of Trustees of the Fund. The Board of Trustees has established a Valuation Committee comprised of the Trustees and has delegated to it the authority to take any actions regarding the valuation of portfolio securities that the Valuation Committee deems necessary or appropriate, including determining the fair value of portfolio securities, unless the determination has been delegated to the Wells Fargo Asset Management Pricing Committee at Wells Fargo Funds Management, LLC (“Funds Management”).The Board of Trustees retains the authority to make or ratify any valuation decisions or approve any changes to the Valuation Procedures as it deems appropriate. On a quarterly basis, the Board of Trustees receives reports on any valuation actions taken by the Valuation Committee or the Wells Fargo Asset Management Pricing Committee which may include items for ratification.
When-issued transactions
The Fund may purchase securities on a forward commitment or when-issued basis. The Fund records a when-issued transaction on the trade date and will segregate assets in an amount at least equal in value to the Fund’s commitment to purchase when-issued securities. Securities purchased on a when-issued basis aremarked-to-market daily and the Fund begins earning interest on the settlement date. Losses may arise due to changes in the market value of the underlying securities or if the counterparty does not perform under the contract.
Security transactions and income recognition
Securities transactions are recorded on a trade date basis. Realized gains or losses are recorded on the basis of identified cost.
Interest income is accrued daily and bond discounts are accreted and premiums are amortized daily. To the extent debt obligations are placed onnon-accrual status, any related interest income may be reduced by writing off interest receivables when the collection of all or a portion of interest has been determined to be doubtful based on consistently applied procedures and the fair value has decreased. If the issuer subsequently resumes interest payments or when the collectability of interest is reasonably assured, the debt obligation is removed fromnon-accrual status.
Distributions to shareholders
Distributions to shareholders from net investment income are declared daily and paid monthly. Distributions from net realized gains, if any, are recorded on theex-dividend date and paid at least annually. Such distributions are determined in accordance with income tax regulations and may differ from U.S. generally accepted accounting principles. Dividend sources are estimated at the time of declaration. The tax character of distributions is determined as of the Fund’s fiscal year end. Therefore, a portion of the Fund’s distributions made prior to the Fund’s fiscal year end may be categorized as a tax return of capital at year end.
Federal and other taxes
The Fund intends to continue to qualify as a regulated investment company by distributing substantially all of its investment company taxable income and any net realized capital gains (after reduction for capital loss carryforwards) sufficient to relieve it from all, or substantially all, federal income taxes. Accordingly, no provision for federal income taxes was required.
The Fund’s income and federal excise tax returns and all financial records supporting those returns for the prior three fiscal years are subject to examination by the federal and Delaware revenue authorities. Management has analyzed the Fund’s tax positions taken on federal, state, and foreign tax returns for all open tax years and does not believe that there are any uncertain tax positions that require recognition of a tax liability.
20 | Government Money Market Funds
Table of Contents
Notes to financial statements
As of January 31, 2020, the cost of investments for federal income tax purposes is substantially the same as for financial reporting purposes.
Class allocations
The separate classes of shares offered by the Fund differ principally in applicable distribution, shareholder servicing, and administration fees. Class specific expenses are charged directly to that share class. Investment income, common fund-level expenses, and realized gains (losses) on investments are allocated daily to each class of shares based on the relative proportion of net assets of each class.
3. FAIR VALUATION MEASUREMENTS
Fair value measurements of investments are determined within a framework that has established a fair value hierarchy based upon the various data inputs utilized in determining the value of the Fund’s investments. The three-level hierarchy gives the highest priority to unadjusted quoted prices in active markets for identical assets or liabilities (Level 1) and the lowest priority to unobservable inputs (Level 3). The Fund’s investments are classified within the fair value hierarchy based on the lowest level of input that is significant to the fair value measurement. The inputs are summarized into three broad levels as follows:
| ∎ | Level 1 – quoted prices in active markets for identical securities |
| ∎ | Level 2 – other significant observable inputs (including quoted prices for similar securities, interest rates, prepayment speeds, credit risk, etc.) |
| ∎ | Level 3 – significant unobservable inputs (including the Fund’s own assumptions in determining the fair value of investments) |
The inputs or methodologies used for valuing investments in securities are not necessarily an indication of the risk associated with investing in those securities.
The following is a summary of the inputs used in valuing the Fund’s assets and liabilities as of January 31, 2020:
| Quoted prices (Level 1) | Other significant observable inputs (Level 2) | Significant (Level 3) | Total | |||||||||||||
Assets | ||||||||||||||||
Investments in: | ||||||||||||||||
Treasury debt | $ | 0 | $ | 13,954,399,158 | $ | 0 | $ | 13,954,399,158 | ||||||||
Additional sector, industry or geographic detail is included in the Portfolio of Investments.
For the year ended January 31, 2020, the Fund did not have any transfers into/out of Level 3.
4. TRANSACTIONS WITH AFFILIATES
Management fee
Funds Management, an indirect wholly owned subsidiary of Wells Fargo & Company (“Wells Fargo”), is the manager of the Fund and provides advisory and fund-level administrative services under an investment management agreement. Under the investment management agreement, Funds Management is responsible for, among other services, implementing the investment objectives and strategies of the Fund, supervising the subadviser and providing fund-level administrative services in connection with the Fund’s operations. As compensation for its services under the investment management agreement, Funds Management is entitled to receive a management fee at the following annual rate based on the Fund’s average daily net assets:
| Management fee | ||||||||
| Average daily net assets | Current rate | Rate prior to June 1, 2019 | ||||||
First $5 billion | 0.15 | % | 0.20 | % | ||||
Next $5 billion | 0.14 | 0.19 | ||||||
Over $10 billion | 0.13 | 0.18 | ||||||
For the year ended January 31, 2020, the management fee was equivalent to an annual rate of 0.16% of the Fund’s average daily net assets.
Government Money Market Funds | 21
Table of Contents
Notes to financial statements
Funds Management has retained the services of a subadviser to provide daily portfolio management to the Fund. The fee for subadvisory services is borne by Funds Management. Wells Capital Management Incorporated, an affiliate of Funds Management and an indirect wholly owned subsidiary of Wells Fargo, is the subadviser to the Fund and is entitled to receive a fee from Funds Management at an annual rate starting at 0.05% and declining to 0.01% as the average daily net assets of the Fund increase.
Administration fees
Under a class-level administration agreement, Funds Management provides class-level administrative services to the Fund, which includes paying fees and expenses for services provided by the transfer agent,sub-transfer agents, omnibus account servicers and record-keepers. As compensation for its services under the class-level administration agreement, Funds Management receives an annual fee which is calculated based on the average daily net assets of each class as follows:
| Class-level administration fee | ||||
Class A | 0.22 | % | ||
Administrator Class | 0.10 | |||
Institutional Class | 0.08 | |||
Service Class | 0.12 | |||
Sweep Class | 0.03 | |||
Waivers and/or expense reimbursements
Funds Management has contractually waived and/or reimbursed management and administration fees to the extent necessary to maintain certain net operating expense ratios for the Fund. When each class of the Fund has exceeded its expense cap, Funds Management has waived fees and/or reimbursed expenses from fund-level expenses on a proportionate basis and then from class specific expenses. When only certain classes exceed their expense caps, waivers and/or reimbursements are applied against class specific expenses before fund-level expenses. Funds Management has committed through May 31, 2020 to waive fees and/or reimburse expenses to the extent necessary to cap the Fund’s expenses at 0.60% for Class A shares, 0.30% for Administrator Class shares, 0.20% for Institutional Class shares, 0.50% for Service Class shares, and 0.83% for Sweep Class shares. Prior to or after the commitment expiration date, the cap may be increased or the commitment to maintain the cap may be terminated only with the approval of the Board of Trustees.
Distribution fee
The Trust has adopted a distribution plan for Sweep Class shares of the Fund pursuant to Rule12b-1 under the 1940 Act. A distribution fee is charged to Sweep Class shares and paid to Wells Fargo Funds Distributor, LLC, the principal underwriter, at an annual rate of 0.35% of the average daily net assets of Sweep shares.
Shareholder servicing fees
The Trust has entered into contracts with one or more shareholder servicing agents, whereby Class A, Service Class, and Sweep Class of the Fund are charged a fee at an annual rate of 0.25% of the respective average daily net assets of each class. Administrator Class is charged a fee at an annual rate of 0.10% of its average daily net assets. A portion of these total shareholder servicing fees were paid to affiliates of Wells Fargo.
Interfund transactions
The Fund may purchase or sell portfolio investment securities to certain other Wells Fargo affiliates pursuant to Rule17a-7 under the 1940 Act and under procedures adopted by the Board of Trustees. The procedures have been designed to ensure that these interfund transactions, which do not incur broker commissions, are effected at current market prices.
5. DISTRIBUTIONS TO SHAREHOLDERS
The tax character of distributions paid was $221,009,825 and $173,649,441 of ordinary income for the years ended January 31, 2020 and January 31, 2019, respectively.
As of January 31, 2020, distributable earnings on a tax basis consisted of $8,102,606 in undistributed ordinary income.
22 | Government Money Market Funds
Table of Contents
Notes to financial statements
6. INDEMNIFICATION
Under the Trust’s organizational documents, the officers and Trustees have been granted certain indemnification rights against certain liabilities that may arise out of performance of their duties to the Trust. Additionally, in the normal course of business, the Trust may enter into contracts with service providers that contain a variety of indemnification clauses. The Trust’s maximum exposure under these arrangements is dependent on future claims that may be made against the Fund and, therefore, cannot be estimated.
7. NEW ACCOUNTING PRONOUNCEMENTS
In August 2018, FASB issued Accounting Standards Update (“ASU”)No. 2018-13, Fair Value Measurement (Topic 820)Disclosure Framework—Changes to the Disclosure Requirements for Fair Value Measurement. ASU2018-13 updates the disclosure requirements for fair value measurements by modifying or removing certain disclosures and adding certain new disclosures. The amendments are effective for fiscal years, and interim periods within those fiscal years, beginning after December 15, 2019. Early adoption is permitted. Management has adopted the removal and modification of disclosures early, as permitted, and will adopt the additional new disclosures at the effective date.
In March 2017, FASB issued ASUNo. 2017-08,Premium Amortization on Purchased Callable Debt Securities. ASU2017-08 shortens the amortization period for certain callable debt securities held at a premium and requires the premium to be amortized to the earliest call date. The amendments do not require an accounting change for securities held at a discount and discounts will continue to be accreted to the maturity date of the security. ASU2017-08 is effective for fiscal years beginning after December 15, 2018 and for interim periods within those fiscal years. During the current reporting period, management of the Fund adopted the change in accounting policy which did not have a material impact to the Fund’s financial statements.
8. SUBSEQUENT EVENT
On March 11, 2020, the World Health Organization announced that it had made the assessment that coronavirus disease 2019 (“COVID-19”) is a pandemic. The impacts of COVID-19 is adversely affecting the entire global economy, individual companies and investment products, and the market in general. There is significant uncertainty around the extent and duration of business disruptions related to COVID-19 and the impact may be short term or may last for an extended period of time. The risk of further spreading of COVID-19 has led to significant uncertainty and volatility in the financial markets and the value of the Fund and the securities in which the Fund invests may be adversely affected by impacts caused by COVID-19.
Government Money Market Funds | 23
Table of Contents
Report of independent registered public accounting firm
TO THE SHAREHOLDERS OF THE FUND AND BOARD OF TRUSTEES OF WELLS FARGO FUNDS TRUST:
Opinion on the Financial Statements
We have audited the accompanying statement of assets and liabilities of Wells Fargo 100% Treasury Money Market Fund (the Fund), one of the funds constituting Wells Fargo Funds Trust, including the portfolio of investments, as of January 31, 2020, the related statement of operations for the year then ended, the statements of changes in net assets for each of the years in the two-year period then ended, and the related notes (collectively, the financial statements) and the financial highlights for each of the years in the five-year period then ended. In our opinion, the financial statements and financial highlights present fairly, in all material respects, the financial position of the Fund as of January 31, 2020, the results of its operations for the year then ended, the changes in its net assets for each of the years in the two-year period then ended, and the financial highlights for each of the years in the five-year period then ended, in conformity with U.S. generally accepted accounting principles.
Basis for Opinion
These financial statements and financial highlights are the responsibility of the Fund’s management. Our responsibility is to express an opinion on these financial statements and financial highlights based on our audits. We are a public accounting firm registered with the Public Company Accounting Oversight Board (United States) (PCAOB) and are required to be independent with respect to the Fund in accordance with the U.S. federal securities laws and the applicable rules and regulations of the Securities and Exchange Commission and the PCAOB.
We conducted our audits in accordance with the standards of the PCAOB. Those standards require that we plan and perform the audit to obtain reasonable assurance about whether the financial statements and financial highlights are free of material misstatement, whether due to error or fraud. Our audits included performing procedures to assess the risks of material misstatement of the financial statements and financial highlights, whether due to error or fraud, and performing procedures that respond to those risks. Such procedures included examining, on a test basis, evidence regarding the amounts and disclosures in the financial statements and financial highlights. Such procedures also included confirmation of securities owned as of January 31, 2020, by correspondence with the custodian and brokers, or by other appropriate auditing procedures. Our audits also included evaluating the accounting principles used and significant estimates made by management, as well as evaluating the overall presentation of the financial statements and financial highlights. We believe that our audits provide a reasonable basis for our opinion.

We have not been able to determine the specific year that we began serving as the auditor of one or more Wells Fargo Funds investment companies; however we are aware that we have served as the auditor of one or more Wells Fargo Funds investment companies since at least 1955.
Boston, Massachusetts
March 31, 2020
24 | Government Money Market Funds
Table of Contents
TAX INFORMATION
For the fiscal year ended January 31, 2020, $220,819,069 has been designated as interest-related dividends for nonresident alien shareholders pursuant to Section 871 of the Internal Revenue Code.
For the fiscal year ended January 31, 2020, $97,153 has been designated as short-term capital gain dividends for nonresident alien shareholders pursuant to Section 871 of the Internal Revenue Code.
For the fiscal year ended January 31, 2020, 100% of the ordinary income distributed was derived from interest on U.S. government securities.
PROXY VOTING INFORMATION
A description of the policies and procedures used to determine how to vote proxies relating to portfolio securities is available, upon request, by calling1-800-222-8222, visiting our website atwfam.com, or visiting the SEC website at sec.gov. Information regarding how the proxies related to portfolio securities were voted during the most recent12-month period ended June 30 is available on the website atwfam.comor by visiting the SEC website at sec.gov.
Government Money Market Funds | 25
Table of Contents
Other information (unaudited)
BOARD OF TRUSTEES AND OFFICERS
Each of the Trustees and Officers1 listed in the table below acts in identical capacities for each fund in the Wells Fargo family of funds, which consists of 149 mutual funds comprising the Wells Fargo Funds Trust, Wells Fargo Variable Trust, Wells Fargo Master Trust and fourclosed-end funds (collectively the “Fund Complex”). This table should be read in conjunction with the Prospectus and the Statement of Additional Information2. The mailing address of each Trustee and Officer is 525 Market Street, 12th Floor, San Francisco, CA 94105. Each Trustee and Officer serves an indefinite term, however, each Trustee serves such term until reaching the mandatory retirement age established by the Trustees.
Independent Trustees
| Name and year of birth | Position held and length of service* | Principal occupations during past five years or longer | Current other public company or investment company directorships | |||
| William R. Ebsworth (Born 1957) | Trustee, since 2015 | Retired. From 1984 to 2013, equities analyst, portfolio manager, research director and chief investment officer at Fidelity Management and Research Company in Boston, Tokyo, and Hong Kong, and retired in 2013 as Chief Investment Officer of Fidelity Strategic Advisers, Inc. where he led a team of investment professionals managing client assets. Prior thereto, Board member of Hong Kong Securities Clearing Co., Hong Kong Options Clearing Corp., the Thailand International Fund, Ltd., Fidelity Investments Life Insurance Company, and Empire Fidelity Investments Life Insurance Company. Audit Committee Chair and Investment Committee Chair of the Vincent Memorial Hospital Endowment(non-profit organization). Mr. Ebsworth is a CFA® charterholder. | N/A | |||
| Jane A. Freeman (Born 1953) | Trustee, since 2015; Chair Liaison, since 2018 | Retired. From 2012 to 2014 and 1999 to 2008, Chief Financial Officer of Scientific Learning Corporation. From 2008 to 2012, Ms. Freeman provided consulting services related to strategic business projects. Prior to 1999, Portfolio Manager at Rockefeller & Co. and Scudder, Stevens & Clark. Board member of the Harding Loevner Funds from 1996 to 2014, serving as both Lead Independent Director and chair of the Audit Committee. Board member of the Russell Exchange Traded Funds Trust from 2011 to 2012 and the chair of the Audit Committee. Ms. Freeman is a Board Member of The Ruth Bancroft Garden(non-profit organization). She is also an inactive Chartered Financial Analyst. | N/A | |||
| Isaiah Harris, Jr. (Born 1952) | Trustee, since 2009; Audit Committee Chairman, since 2019 | Retired. Chairman of the Board of CIGNA Corporation since 2009, and Director since 2005. From 2003 to 2011, Director of Deluxe Corporation. Prior thereto, President and CEO of BellSouth Advertising and Publishing Corp. from 2005 to 2007, President and CEO of BellSouth Enterprises from 2004 to 2005 and President of BellSouth Consumer Services from 2000 to 2003. Emeritus member of the Iowa State University Foundation Board of Governors. Emeritus Member of the Advisory Board of Iowa State University School of Business. Advisory Board Member, Palm Harbor Academy (private school). Advisory Board Member, Child Evangelism Fellowship(non-profit). Mr. Harris is a certified public accountant (inactive status). | CIGNA Corporation | |||
| Judith M. Johnson (Born 1949) | Trustee, since 2008; Audit Committee Chairman, from 2009 to 2018 | Retired. Prior thereto, Chief Executive Officer and Chief Investment Officer of Minneapolis Employees Retirement Fund from 1996 to 2008. Ms. Johnson is an attorney, certified public accountant and a certified managerial accountant. | N/A | |||
26 | Government Money Market Funds
Table of Contents
Other information (unaudited)
| Name and year of birth | Position held and length of service* | Principal occupations during past five years or longer | Current other public company or investment company directorships | |||
| David F. Larcker (Born 1950) | Trustee, since 2009 | James Irvin Miller Professor of Accounting at the Graduate School of Business, Stanford University, Director of the Corporate Governance Research Initiative and Senior Faculty of The Rock Center for Corporate Governance since 2006. From 2005 to 2008, Professor of Accounting at the Graduate School of Business, Stanford University. Prior thereto, Ernst & Young Professor of Accounting at The Wharton School, University of Pennsylvania from 1985 to 2005. | N/A | |||
| Olivia S. Mitchell (Born 1953) | Trustee, since 2006; Nominating and Governance Committee Chair, since 2018 | International Foundation of Employee Benefit Plans Professor, Wharton School of the University of Pennsylvania since 1993. Director of Wharton’s Pension Research Council and Boettner Center on Pensions & Retirement Research, and Research Associate at the National Bureau of Economic Research. Previously, Cornell University Professor from 1978 to 1993. | N/A | |||
| Timothy J. Penny (Born 1951) | Trustee, since 1996; Chairman, since 2018 | President and Chief Executive Officer of Southern Minnesota Initiative Foundation, anon-profit organization, since 2007. Member of the Board of Trustees of NorthStar Education Finance, Inc., anon-profit organization, since 2007. | N/A | |||
| James G. Polisson (Born 1959) | Trustee, since 2018 | Retired. Chief Marketing Officer, Source (ETF) UK Services, Ltd, from 2015 to 2017. From 2012 to 2015, Principal of The Polisson Group, LLC, a management consulting, corporate advisory and principal investing company. Chief Executive Officer and Managing Director at Russell Investments, Global Exchange Traded Funds from 2010 to 2012. Managing Director of Barclays Global Investors from 1998 to 2010 and Global Chief Marketing Officer for iShares and Barclays Global Investors from 2000 to 2010. Trustee of the San Francisco Mechanics’ Institute, anon-profit organization, from 2013 to 2015. Board member of the Russell Exchange Traded Fund Trust from 2011 to 2012. Director of Barclays Global Investors Holdings Deutschland GmbH from 2006 to 2009. Mr. Polisson is an attorney and has a retired status with the Massachusetts and District of Columbia Bar Associations. | N/A | |||
| Pamela Wheelock3 (Born 1959) | Trustee, since January 2020; previously Trustee from January 2018 to July 2019 | Board member of the Destination Medical Center Economic Development Agency, Rochester, Minnesota since 2019. Acting Commissioner, Minnesota Department of Human Services, July 2019 through September 2019. Human Services Manager (part-time), Minnesota Department of Human Services, October 2019 through December 2019. Chief Operating Officer, Twin Cities Habitat for Humanity from 2017 to 2019. Vice President of University Services, University of Minnesota from 2012 to 2016. Prior thereto, on the Board of Directors, Governance Committee and Finance Committee for the Minnesota Philanthropy Partners (Saint Paul Foundation) from 2012 to 2018, Interim Chief Executive Officer of Blue Cross Blue Shield of Minnesota from 2011 to 2012, Chairman of the Board from 2009 to 2012 and Board Director from 2003 to 2015. Vice President, Leadership and Community Engagement, Bush Foundation, Saint Paul, Minnesota (a private foundation) from 2009 to 2011. Executive Vice President and Chief Financial Officer, Minnesota Sports and Entertainment from 2004 to 2009 and Senior Vice President from 2002 to 2004. Executive Vice President of the Minnesota Wild Foundation from 2004 to 2008. Commissioner of Finance, State of Minnesota, from 1999 to 2002. Currently Board Chair of the Minnesota Wild Foundation since 2010. | N/A | |||
| * | Length of service dates reflect the Trustee’s commencement of service with the Trust’s predecessor entities, where applicable. |
Government Money Market Funds | 27
Table of Contents
Other information (unaudited)
Officers
| Name and year of birth | Position held and length of service | Principal occupations during past five years or longer | ||
| Andrew Owen (Born 1960) | President, since 2017 | Executive Vice President of Wells Fargo & Company and Head of Affiliated Managers, Wells Fargo Asset Management, since 2014. In addition, Mr. Owen is currently President, Chief Executive Officer and Director of Wells Fargo Funds Management, LLC since 2017. Prior thereto, Executive Vice President responsible for marketing, investments and product development for Wells Fargo Funds Management, LLC, from 2009 to 2014. | ||
| Nancy Wiser1 (Born 1967) | Treasurer, since 2012 | Executive Vice President of Wells Fargo Funds Management, LLC since 2011. Chief Operating Officer and Chief Compliance Officer at LightBox Capital Management LLC, from 2008 to 2011. | ||
| Michelle Rhee (Born 1966) | Chief Legal Officer, since 2019 | Secretary of Wells Fargo Funds Management, LLC, Chief Legal Counsel of Wells Fargo Asset Management and Assistant General Counsel of Wells Fargo Bank, N.A. since 2018. Associate General Counsel and Managing Director of Bank of America Corporation from 2004 to 2018. | ||
| Catherine Kennedy (Born 1969) | Secretary, since 2019 | Vice President of Wells Fargo Funds Management, LLC and Senior Counsel of the Wells Fargo Legal Department since 2010. Vice President and Senior Counsel of Evergreen Investment Management Company, LLC from 1998 to 2010. | ||
| Michael H. Whitaker(Born 1967) | Chief Compliance Officer, since 2016 | Chief Compliance Officer of Wells Fargo Asset Management since 2016. Senior Vice President and Chief Compliance Officer for Fidelity Investments from 2007 to 2016. | ||
| David Berardi (Born 1975) | Assistant Treasurer, since 2009 | Vice President of Wells Fargo Funds Management, LLC since 2009. Vice President of Evergreen Investment Management Company, LLC from 2008 to 2010. Manager of Fund Reporting and Control for Evergreen Investment Management Company, LLC from 2004 to 2010. | ||
| Jeremy DePalma1 (Born 1974) | Assistant Treasurer, since 2009 | Senior Vice President of Wells Fargo Funds Management, LLC since 2009. Senior Vice President of Evergreen Investment Management Company, LLC from 2008 to 2010 and head of the Fund Reporting and Control Team within Fund Administration from 2005 to 2010. | ||
| 1 | Nancy Wiser acts as Treasurer of 64 funds in the Fund Complex. Jeremy DePalma acts as Treasurer of 85 funds and Assistant Treasurer of 64 funds in the Fund Complex. |
| 2 | The Statement of Additional Information includes additional information about the Trustees and is available, without charge, upon request, by calling1-800-222-8222 or by visiting the website atwfam.com. |
| 3 | Pamela Wheelock wasre-appointed to the Board effective January 1, 2020. |
28 | Government Money Market Funds
Table of Contents
For more information
More information about Wells Fargo Funds is available free upon request. To obtain literature, please write, visit the Fund’s website, or call:
Wells Fargo Funds
P.O. Box 219967
Kansas City, MO 64121-9967
Website:wfam.com
Individual investors:1-800-222-8222
Retail investment professionals:1-888-877-9275
Institutional investment professionals:1-866-765-0778

This report and the financial statements contained herein are submitted for the general information of the shareholders of the Fund. If this report is used for promotional purposes, distribution of the report must be accompanied or preceded by a current prospectus. Before investing, please consider the investment objectives, risks, charges, and expenses of the investment. For a current prospectus and, if available, a summary prospectus, containing this information, call1-800-260-5969 or visit the Fund’s website atwfam.com. Read the prospectus carefully before you invest or send money.
Wells Fargo Asset Management (WFAM) is the trade name for certain investment advisory/management firms owned by Wells Fargo & Company. These firms include but are not limited to Wells Capital Management Incorporated and Wells Fargo Funds Management, LLC. Certain products managed by WFAM entities are distributed by Wells Fargo Funds Distributor, LLC (a broker-dealer and Member FINRA).
This material is for general informational and educational purposes only and is NOT intended to provide investment advice or a recommendation of any kind—including a recommendation for any specific investment, strategy, or plan.
INVESTMENT PRODUCTS: NOT FDIC INSURED ◾ NO BANK GUARANTEE ◾ MAY LOSE VALUE
© 2020 Wells Fargo & Company. All rights reserved
PAR-0220-03786 03-20
A300/AR300 01-20
Table of Contents

Annual Report
January 31, 2020
Institutional Money Market Funds
| ∎ | Wells Fargo Cash Investment Money Market Fund |
Beginning on January 1, 2021, as permitted by new regulations adopted by the Securities and Exchange Commission, paper copies of the Wells Fargo Funds’ annual and semi-annual shareholder reports issued after this date will no longer be sent by mail, unless you specifically request paper copies of the reports. Instead, the reports will be made available on the Funds’ website, and you will be notified by mail each time a report is posted and provided with a website address to access the report.
If you already elected to receive shareholder reports electronically, you will not be affected by this change and you need not take any action. You may elect to receive shareholder reports and other communications from the Fund electronically at any time by contacting your financial intermediary (such as a broker-dealer or bank) or, if you are a direct investor, by calling1-800-222-8222 or by enrolling at wellsfargo.com/advantagedelivery.
You may elect to receive all future reports in paper free of charge. If you invest through a financial intermediary, you can contact your financial intermediary to request that you continue to receive paper copies of your shareholder reports; if you invest directly with the Fund, you can call 1-800-222-8222. Your election to receive reports in paper will apply to all Wells Fargo Funds held in your account with your financial intermediary or, if you are a direct investor, to all Wells Fargo Funds that you hold.
Table of Contents
|
Reduce clutter. Save trees. |
Sign up for electronic delivery of prospectuses and shareholder reports atwellsfargo.com/advantagedelivery |
The views expressed and any forward-looking statements are as of January 31, 2020, unless otherwise noted, and are those of the Fund managers and/or Wells Fargo Asset Management. Discussions of individual securities, or the markets generally, or any Wells Fargo Fund are not intended as individual recommendations. Future events or results may vary significantly from those expressed in any forward-looking statements. The views expressed are subject to change at any time in response to changing circumstances in the market. Wells Fargo Asset Management and the Fund disclaim any obligation to publicly update or revise any views expressed or forward-looking statements.
INVESTMENT PRODUCTS: NOT FDIC INSURED ◾ NO BANK GUARANTEE ◾ MAY LOSE VALUE
Institutional Money Market Funds | 1
Table of Contents
Letter to shareholders (unaudited)

Andrew Owen
President
Wells Fargo Funds
Dear Shareholder:
We are pleased to offer you this annual report for the Wells Fargo Cash Investment Money Market Fund for the 12-month period that ended January 31, 2020. Despite some periods of market volatility, the year was strongly positive for financial markets as supportive central banks more than offset concerns over slowing global economic growth and international trade tensions.
Overall, both fixed-income and equity investors enjoyed healthy annual returns, with U.S. markets leading the way. For the period, U.S. stocks, based on the S&P 500 Index,1 gained 21.68% and international stocks, as measured by the MSCI ACWI ex USA Index (Net),2 returned 9.94%. The MSCI EM Index (Net)3 gained a more modest 3.81%. For bond investors, the Bloomberg Barclays U.S. Aggregate Bond Index4 added 9.64%, the Bloomberg Barclays Global Aggregate ex-USD Index5 returned 3.95%, the Bloomberg Barclays Municipal Bond Index6 gained 8.65%, and the ICE BofA U.S. High Yield Index7 added 9.39%.
The year began with a strong market rebound.
Financial markets opened 2019 on a positive note, as investors were encouraged by the U.S. Federal Reserve (Fed) taking a more accommodative stance after a series of increases to the federal funds rate in 2017 and 2018. However, concerns over slowing global growth grew more ominous. Fourth-quarter 2018 gross domestic product (GDP), reported in February 2019, grew at an annualized 2.2% rate, down from the levels of the prior two quarters. The Bank of England forecast the slowest growth since the financial crisis for 2019. China and the U.S. continued to wrangle over trade issues. By the end of the first quarter of 2019, more accommodative Fed sentiment and steady, if not spectacular, U.S. economic and business metrics encouraged domestic investors.
Early second-quarter 2019 enthusiasm among investors faded.
During April, sustained low inflation, solid employment data, and first-quarter U.S. GDP of an annualized rate of 3.2% supported favorable sentiment. During May, however, markets tumbled on mixed investment signals. In the U.S., partisan political wrangling ramped up in advance of the 2020 election. The U.K.’s Brexit disagreements caused Prime Minister Theresa May to resign. Boris Johnson succeeded her, only to add to uncertainty about Brexit’s resolution ahead of an October 2019 deadline. The European Commission downgraded the 2019 growth forecast to 1.2%. The U.S. increased tariffs on
| 1 | The S&P 500 Index consists of 500 stocks chosen for market size, liquidity, and industry group representation. It is a market-value-weighted index with each stock’s weight in the index proportionate to its market value. You cannot invest directly in an index. |
| 2 | The Morgan Stanley Capital International (MSCI) All Country World Index (ACWI) ex USA Index (Net) is a free-float-adjusted market-capitalization-weighted index that is designed to measure the equity market performance of developed markets, excluding the United States. Source: MSCI. MSCI makes no express or implied warranties or representations and shall have no liability whatsoever with respect to any MSCI data contained herein. The MSCI data may not be further redistributed or used as a basis for other indices or any securities or financial products. This report is not approved, reviewed, or produced by MSCI. You cannot invest directly in an index. |
| 3 | The MSCI Emerging Markets (EM) Index (Net) is a free-float-adjusted market-capitalization-weighted index that is designed to measure equity market performance of emerging markets. You cannot invest directly in an index. |
| 4 | The Bloomberg Barclays U.S. Aggregate Bond Index is a broad-based benchmark that measures the investment-grade, U.S. dollar-denominated, fixed-rate taxable bond market, including Treasuries, government-related and corporate securities, mortgage-backed securities (agency fixed-rate and hybrid adjustable-rate mortgage pass-throughs), asset-backed securities, and commercial mortgage-backed securities. You cannot invest directly in an index. |
| 5 | The Bloomberg Barclays Global Aggregate ex-USD Index is an unmanaged index that provides a broad-based measure of the global investment-grade fixed-income markets excluding the U.S. dollar-denominated debt market. You cannot invest directly in an index. |
| 6 | The Bloomberg Barclays Municipal Bond Index is an unmanaged index composed of long-term tax-exempt bonds with a minimum credit rating of Baa. You cannot invest directly in an index. |
| 7 | The ICE BofA U.S. High Yield Index is a market-capitalization-weighted index of domestic and Yankee high-yield bonds. The index tracks the performance of high-yield securities traded in the U.S. bond market. You cannot invest directly in an index. Copyright 2020. ICE Data Indices, LLC. All rights reserved. |
2 | Institutional Money Market Funds
Table of Contents
Letter to shareholders (unaudited)
products from China, China responded, and then talks broke down. President Donald Trump threatened to turn his foreign policy tariff tool to Mexico over immigration issues.
Midway through the year, investors regrouped, sentiment turned positive, and U.S. equity markets advanced during June and July. The gains, primarily driven by geopolitical and monetary policy events, pushed equity markets to new highs. European Central Bank President Mario Draghi indicated the bank was ready to cut rates or buy more assets to prop up inflation if needed. President Trump backed off of tariff threats against Mexico and China. In the U.S., the Fed implemented a 0.25% federal funds rate cut in July.
Later in July, the U.S. reversed course and threatened to impose higher tariffs on China’s exports after talks failed. China responded with tariff threats of its own and devalued the renminbi, roiling global markets. Major U.S. stock market indices closed July with the worst weekly results of the year. Bond prices gained as Treasury yields fell to multiyear lows, and the yield curve inverted at multiple points along the 30-year arc.
In August, U.S.-China trade tensions continued with no signs of compromise. Evidence of a continued global economic slowdown mounted, and central banks in China, New Zealand, and Thailand cut interest rates. Industrial and manufacturing data declined in China, Canada, Japan, and Germany. Adding to global uncertainty, Italy’s prime minister resigned, many feared a crackdown in Hong Kong as protestors sustained their calls for reform, and Boris Johnson planned to suspend Parliament as Brexit’s deadline neared.
In the U.S., the Fed cut interest rates a second time in September. U.S. manufacturing data disappointed investors. The U.S. Congress announced it would pursue an impeachment investigation of President Trump. Meanwhile, the Brexit impasse showed no signs of resolution. Officials in China said that hitting the country’s economic growth goals for the year would be difficult considering the weight of tariffs and trade restrictions. Although the S&P 500 Index finished the third quarter with the best year-to-date returns in more than 20 years, concerns about future returns remained.
The fourth quarter started on a strong note, with U.S.-China trade tensions relaxing in October along with renewed optimism for a U.K. Brexit deal and positive macroeconomic data. The initial estimate of U.S. third-quarter GDP growth was a resilient 1.9% annualized rate, while the U.S. unemployment rate fell to a 50-year low of 3.5% in September. However, despite resilience among U.S. consumers, business confidence declined while manufacturing activity contracted. Concerned with a potential economic slowdown, the Fed lowered interest rates another quarter point in late October, its third rate cut in four months. This helped push the S&P 500 Index to a new all-time high, while emerging market equities rallied and global bonds declined overall, reflecting a broad pickup in risk appetite.
Equity markets continued to rally in November despite ongoing geopolitical risks. Hopes for a U.S.-China trade deal buoyed investor confidence. U.S. business sentiment improved slightly, and manufacturing and services activity picked up. Throughout the month, central bank actions were on hold. With that positive backdrop, developed market equities outpaced those in emerging markets, and U.S. stocks, as reflected by the S&P 500 Index, outperformed non-U.S. stocks overall. While consumer confidence and purchasing manager activity rose in the eurozone, China reported weakening manufacturing and consumer data. Bond yields rose marginally, leading to slightly negative returns for global government and investment-grade corporate bonds.
Financial markets ended 2019 on a broadly positive note, with the U.S. and China reaching an accord on a Phase One trade deal, with some details to be worked out. That, along with the landslide win by the pro-Brexit U.K. Conservative Party in a national election and ongoing central bank support, gave investors greater certainty and confidence. U.S. economic indicators were generally positive, with the exception of manufacturing activity and business confidence. However, consumer confidence was resilient, fed by a robust labor market, tame inflation, and lower interest rates, which boosted housing affordability and stimulated homebuyer activity. The impeachment of U.S. President Donald Trump, while
“Midway through the year, investors regrouped, sentiment turned positive, and U.S. equity markets advanced.”
“Financial markets ended 2019 on a broadly positive note, with the U.S. and China reaching an accord on a Phase One trade deal.”
Institutional Money Market Funds | 3
Table of Contents
Letter to shareholders (unaudited)
historically noteworthy, had little impact on markets. Meanwhile, slowing Chinese economic activity, partly attributable to the trade war, led to further government stimulus at year-end through lower reserve ratios, allowing banks to lend more money.
The year-end rally continued in early January 2020. However, capital market volatility picked up in late January on concerns over the unknown impact of the coronavirus on the global economy and stock markets. With sentiment somewhat souring, perceived safe havens did well in January. The U.S. dollar and Japanese yen both rose and government bonds outperformed equities. While the S&P 500 Index held its ground, emerging market equities tumbled, including those in Asia, that are most exposed to viruses—physical or economic—originating in China.
Following the end of the reporting period, the coronavirus continued its global spread, resulting in disruptions to global markets, including through border closings, restrictions on travel and large gatherings, expedited and enhanced health screenings, quarantines, cancellations, business and school closings, disruptions to employment and supply chains, reduced productivity, and reduced customer and client activity in multiple markets and sectors. The risk of further spreading of the coronavirus has led to significant uncertainty and volatility in the financial markets. The full extent of the coronavirus’s impact on the global economy cannot necessarily be foreseen and the impacts may be short term or may last for an extended period of time.
Don’t let short-term uncertainty derail long-term investment goals.
Periods of investment uncertainty can present challenges, but experience has taught us that maintaining long-term investment goals can be an effective way to plan for the future. To help you create a sound strategy based on your personal goals and risk tolerance, Wells Fargo Funds offers more than 100 mutual funds spanning a wide range of asset classes and investment styles. Although diversification cannot guarantee an investment profit or prevent losses, we believe it can be an effective way to manage investment risk and potentially smooth out overall portfolio performance. We encourage investors to know their investments and to understand that appropriate levels of risk-taking may unlock opportunities.
Thank you for choosing to invest with Wells Fargo Funds. We appreciate your confidence in us and remain committed to helping you meet your financial needs.
Sincerely,

Andrew Owen
President
Wells Fargo Funds
|
For further information about your Fund, contact your investment professional, visit our website atwfam.com, or call us directly at1-800-222-8222. |
4 | Institutional Money Market Funds
Table of Contents
This page is intentionally left blank.
Table of Contents
Performance highlights (unaudited)
Investment objective
The Fund seeks current income, while preserving capital and liquidity.
Manager
Wells Fargo Funds Management, LLC
Subadvisers
Wells Capital Management Incorporated
Wells Capital Management Singapore
Portfolio managers
Michael C. Bird, CFA®‡
Jeffrey L. Weaver, CFA®‡
Laurie White
Average annual total returns (%) as of January 31, 2020
| Expense ratios1 (%) | ||||||||||||||||||||||
| Inception date | 1 year | 5 year | 10 year | Gross | Net2 | |||||||||||||||||
| Administrator Class (WFAXX) | 7-31-2003 | 2.04 | 1.05 | 0.53 | 0.37 | 0.33 | ||||||||||||||||
| Institutional Class (WFIXX) | 10-14-1987 | 2.17 | 1.17 | 0.62 | 0.25 | 0.20 | ||||||||||||||||
| Select Class (WFQXX) | 6-29-2007 | 2.24 | 1.24 | 0.69 | 0.21 | 0.13 | ||||||||||||||||
| Service Class (NWIXX) | 10-14-1987 | 1.87 | 0.91 | 0.46 | 0.54 | 0.50 | ||||||||||||||||
Yield summary (%) as of January 31, 20202
| Administrator Class | Institutional Class | Select Class | Service Class | |||||||||||
| 7-day current yield | 1.49 | 1.62 | 1.69 | 1.32 | ||||||||||
| 7-day compound yield | 1.50 | 1.63 | 1.70 | 1.33 | ||||||||||
| 30-day simple yield | 1.50 | 1.63 | 1.70 | 1.33 | ||||||||||
| 30-day compound yield | 1.51 | 1.65 | 1.72 | 1.34 | ||||||||||
Figures quoted represent past performance, which is no guarantee of future results, and do not reflect taxes that shareholder may pay on an investment in a fund. Investment returns will fluctuate. The Fund’s yield figures more closely reflect the current earnings of the Fund than the total return figures. Current performance may be lower or higher than the performance data quoted, which assumes the reinvestment of dividends and capital gains. Current month-end performance is available on the Fund’s website,wfam.com.
Money market funds are sold without a front-end sales charge or contingent deferred sales charge. Other fees and expenses apply to an investment in the Fund and are described in the Fund’s current prospectus.
For floating NAV money market funds: You could lose money by investing in the Fund. Because the share price of the Fund will fluctuate, when you sell your shares they may be worth more or less than what you originally paid for them. The Fund may impose a fee upon sale of your shares or may temporarily suspend your ability to sell shares if the Fund’s liquidity falls below required minimums because of market conditions or other factors. An investment in the Fund is not insured or guaranteed by the Federal Deposit Insurance Corporation or any other government agency. The Fund’s sponsor has no legal obligation to provide financial support to the Fund, and you should not expect that the sponsor will provide financial support to the Fund at any time.
Please see footnotes on page 7.
6 | Institutional Money Market Funds
Table of Contents
Performance highlights (unaudited)
| Portfolio composition as of January 31, 20203 |
 |
| Effective maturity distribution as of January 31, 20203 |
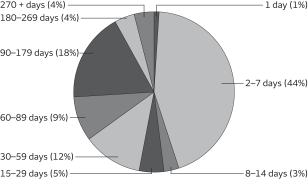 |
| Weighted average maturity as of January 31, 20204 | ||||
28 days | ||||
| Weighted average life as of January 31, 20205 | ||||
62 days | ||||
| ‡ | CFA® and Chartered Financial Analyst® are trademarks owned by CFA Institute. |
| 1 | Reflects the expense ratios as stated in the most recent prospectuses. The expense ratios shown are subject to change and may differ from the annualized expense ratios shown in the financial highlights of this report. |
| 2 | The manager has contractually committed through May 31, 2020, to waive fees and/or reimburse expenses to the extent necessary to cap total annual fund operating expenses after fee waivers at 0.33% for Administrator Class, 0.20% for Institutional Class, 0.13% for Select Class, and 0.50% for Service Class. Brokerage commissions, stamp duty fees, interest, taxes, acquired fund fees and expenses (if any), and extraordinary expenses are excluded from the expense cap. Prior to or after the commitment expiration date, the cap may be increased or the commitment to maintain the cap may be terminated only with the approval of the Board of Trustees. Without this cap, the Fund’s returns would have been lower. Without waived fees and/or reimbursed expenses, the Fund’s 7-day current yield would have been 1.46%, 1.58%, 1.62%, and 1.29% for Administrator Class, Institutional Class, Select Class, and Service Class, respectively. The expense ratio paid by an investor is the net expense ratio (the total annual fund operating expenses after fee waivers) as stated in the prospectuses. |
| 3 | Amounts are calculated based on the total investments of the Fund. These amounts are subject to change and may have changed since the date specified. |
| 4 | Weighted Average Maturity (WAM): WAM is an average of the effective maturities of all securities held in the portfolio, weighted by each security’s percentage of total investments. The maturity of a portfolio security is the period remaining until the date on which the principal amount is unconditionally required to be paid, or in the case of a security called for redemption, the date on which the redemption payment is unconditionally required to be made. WAM calculations allow for the maturities of certain securities with demand features or periodic interest rate resets to be shortened. WAM is a way to measure a fund’s sensitivity to potential interest rate changes. WAM is subject to change and may have changed since the date specified. |
| 5 | Weighted Average Life (WAL): WAL is an average of the final maturities of all securities held in the portfolio, weighted by their percentage of total investments. The maturity of a portfolio security is the period remaining until the date on which the principal amount is unconditionally required to be paid, or in the case of a security called for redemption, the date on which the redemption payment is unconditionally required to be made. In contrast to WAM, the calculation of WAL allows for the maturities of certain securities with demand features to be shortened, but not the periodic interest rate resets. WAL is a way to measure a fund’s potential sensitivity to credit spread changes. WAL is subject to change and may have changed since the date specified. |
Institutional Money Market Funds | 7
Table of Contents
Performance highlights (unaudited)
MANAGERS’ DISCUSSION
The money market sector is heavily influenced by the Federal Open Market Committee’s (FOMC’s) assessment of the economy, its target rates, and expectations of changes to those target rates. Consequently, we try to glean insight about rate moves by dissecting Federal Reserve (Fed) statements and Fed member speeches and by analyzing the Summary of Economic Projections (SEP).
Even as the economic landscape was showing signs of sputtering growth toward the end of 2018, the FOMC raised rates in December. The Fed led us into 2019 indicating that the December rate increase might be the last move in the tightening cycle that had begun two years earlier. But expectations were that the economy was still expanding, albeit at a less robust pace. It therefore seemed reasonable to assume that the move got us to where we needed to be, at a target rate level low enough to not extinguish growth and perhaps let inflation rise to the 2% target but high enough to trim the wings a little. “Patience” was the key word introduced to the lexicon. And after a pause to refresh, rates might continue back on their higher track.
The patient pause didn’t last long. By March, the SEP array exhibited a dovish bias with no participants expecting a hike and one anticipating a cut. In addition to the pause, other signs pointing to the possibility of a cut included the tightening of the London Interbank Offered Rate (LIBOR)/Overnight Interest Swap (OIS) rate from its relatively wide spread of 42.5 basis points (bps; 100 bps equal 1.00%) at the end of 2018 to a low of 14.5 bps in June 2019. By May, more indicators confirmed that this was not a pause on the way to higher rates. In fact, it was looking like a pause before lower rates. While household spending and business fixed investment were slowing, personal consumption expenditures had ticked up and nonfarm payrolls came in strong. Overshadowing everything were trade tensions as negotiations with China, Mexico, Japan, and Europe broke down in various forms. With the central question of what would be the economic impacts of tariffs and trade wars unanswered, equities sold off and a flight to quality ensued. U.S. Treasury yields fell 34–36 bps, with 2-, 3-, and 5-year notes all yielding less than 2%. At that point, federal funds futures showed more than a 70% chance of a25-bp cut at the September FOMC meeting.
At the June FOMC meeting, the Fed downgraded its growth assessment from solid to moderate and removed the word “patient” from its statement, focusing on increased uncertainties in the outlook. The SEP showed a downward shift in rates expectations and now seemed to be queuing up for an ease at the conclusion of the July FOMC meeting. Sentiment had seemingly turned on a dime. Consumers were still consuming, but trade tensions and the weak business sector had participants asking if a recession was looming.
Fast forward to period-end with a total of three consecutive easings—in July, September, and October—and maybe, just maybe, the FOMC executed the perfect landing. Fed Chair Powell set a high bar for further rate cuts after the October move, saying the cumulative easing to date would continue to provide support for the economy as monetary policy stimulus traditionally operates with a lag. That high bar was reiterated in December when it was made clear that the Fed expected to be on hold possibly through the election. No surprises came at the conclusion of the January 2020 meeting, with no change in the target rate range and the statement reflecting a willingness to appropriately continue economic expansion and achieve inflation around 2%.
Strategic outlook
At the close of the reporting period, we were focused on a few unresolved items that could influence markets for the remainder of the calendar year, namely Brexit; trade issues and tariffs; the conclusion or continuation of temporary Fed liquidity operations, Fed Treasury bill purchases, and other quantitative easing measures; and finally, the election. With the Fed appearing to be on hold for now, credit fundamentals continue to be supportive and the yield curve is slightly positively sloped.
However, just as the fiscal year ended, in February and March 2020, the coronavirus began to spread globally, prompting consumers, businesses, and governments to take unusually strong actions in an attempt to limit its impact. In so doing, it appears that there could be a serious toll on the U.S. and global economy. In the face of this uncertainty, equity and bond markets experienced sharp outflows, and short term markets, especially government markets, experienced a high degree of inflows. With liquidity at a premium, volatility flowed through to the short end of the credit markets, prompting a series of supportive actions by the Fed. In the face of all this, we continue to believe that our investment strategy, with its focus on capital preservation and liquidity, is as important as ever.
8 | Institutional Money Market Funds
Table of Contents
As a shareholder of the Fund, you incur ongoing costs, including management fees, shareholder servicing fees, and other Fund expenses. This example is intended to help you understand your ongoing costs (in dollars) of investing in the Fund and to compare these costs with the ongoing costs of investing in other mutual funds.
The example is based on an investment of $1,000 invested at the beginning of the six-month period and held for the entire period from August 1, 2019 to January 31, 2020.
Actual expenses
The “Actual” line of the table below provides information about actual account values and actual expenses. You may use the information in this line, together with the amount you invested, to estimate the expenses that you paid over the period. Simply divide your account value by $1,000 (for example, an $8,600 account value divided by $1,000 = 8.6), then multiply the result by the number in the “Actual” line under the heading entitled “Expenses paid during period” for your applicable class of shares to estimate the expenses you paid on your account during this period.
Hypothetical example for comparison purposes
The “Hypothetical” line of the table below provides information about hypothetical account values and hypothetical expenses based on the Fund’s actual expense ratio and an assumed rate of return of 5% per year before expenses, which is not the Fund’s actual return. The hypothetical account values and expenses may not be used to estimate the actual ending account balance or expenses you paid for the period. You may use this information to compare the ongoing costs of investing in the Fund and other funds. To do so, compare this 5% hypothetical example with the 5% hypothetical examples that appear in the shareholder reports of the other funds.
Please note that the expenses shown in the table are meant to highlight your ongoing costs only. Therefore, the “Hypothetical” line of the table is useful in comparing ongoing costs only and will not help you determine the relative total costs of owning different funds.
| Beginning account value 8-1-2019 | Ending account value 1-31-2020 | Expenses paid during the period1 | Annualized net expense ratio | |||||||||||||
Administrator Class | ||||||||||||||||
Actual | $ | 1,000.00 | $ | 1,008.89 | $ | 1.67 | 0.33 | % | ||||||||
Hypothetical (5% return before expenses) | $ | 1,000.00 | $ | 1,023.48 | $ | 1.68 | 0.33 | % | ||||||||
Institutional Class | ||||||||||||||||
Actual | $ | 1,000.00 | $ | 1,009.55 | $ | 1.01 | 0.20 | % | ||||||||
Hypothetical (5% return before expenses) | $ | 1,000.00 | $ | 1,024.13 | $ | 1.02 | 0.20 | % | ||||||||
Select Class | ||||||||||||||||
Actual | $ | 1,000.00 | $ | 1,009.90 | $ | 0.66 | 0.13 | % | ||||||||
Hypothetical (5% return before expenses) | $ | 1,000.00 | $ | 1,024.48 | $ | 0.66 | 0.13 | % | ||||||||
Service Class | ||||||||||||||||
Actual | $ | 1,000.00 | $ | 1,008.02 | $ | 2.52 | 0.50 | % | ||||||||
Hypothetical (5% return before expenses) | $ | 1,000.00 | $ | 1,022.62 | $ | 2.54 | 0.50 | % | ||||||||
| 1 | Expenses paid is equal to the annualized net expense ratio of each class multiplied by the average account value over the period, multiplied by the number of days in the most recent fiscal half-year divided by the number of days in the fiscal year (to reflect the one-half-year period). |
Institutional Money Market Funds | 9
Table of Contents
Portfolio of investments—January 31, 2020
Interest rate | Maturity date | Principal | Value | |||||||||||||
| Certificates of Deposit: 15.97% |
| |||||||||||||||
Bank of Montreal (1 Month LIBOR +0.18%)± | 1.94 | % | 4-3-2020 | $ | 10,000,000 | $ | 10,001,765 | |||||||||
Bank of Montreal (3 Month LIBOR +0.06%)± | 1.95 | 3-12-2020 | 7,000,000 | 7,001,064 | ||||||||||||
Bank of Montreal (1 Month LIBOR +0.18%)± | 1.96 | 5-1-2020 | 5,000,000 | 5,001,032 | ||||||||||||
Bank of Montreal (3 Month LIBOR +0.14%)± | 2.04 | 11-18-2020 | 7,000,000 | 7,005,461 | ||||||||||||
Bank of Nova Scotia (3 Month LIBOR +0.09%)± | 1.94 | 2-10-2021 | 7,000,000 | 7,000,656 | ||||||||||||
Bank of Nova Scotia (3 Month LIBOR +0.05%)± | 1.96 | 4-3-2020 | 13,000,000 | 13,001,910 | ||||||||||||
Bank of Nova Scotia | 2.00 | 3-3-2020 | 5,000,000 | 5,001,792 | ||||||||||||
Bank of Nova Scotia (3 Month LIBOR +0.10%)± | 2.00 | 8-4-2020 | 6,000,000 | 6,002,384 | ||||||||||||
Bank of Nova Scotia (3 Month LIBOR +0.13%)±144A | 2.03 | 11-9-2020 | 4,000,000 | 4,002,742 | ||||||||||||
Canadian Imperial Bank (1 Month LIBOR +0.18%)± | 1.91 | 4-6-2020 | 10,000,000 | 10,002,893 | ||||||||||||
Canadian Imperial Bank (1 Month LIBOR +0.18%)± | 1.96 | 5-1-2020 | 6,000,000 | 6,002,476 | ||||||||||||
China Construction Bank Corporation NY (1 Month LIBOR +0.21%)± | 1.87 | 10-27-2020 | 15,000,000 | 14,997,962 | ||||||||||||
Cooperatieve Rabobank UA | 1.85 | 5-20-2020 | 11,000,000 | 11,003,615 | ||||||||||||
Credit Industriel et Commercial NY (1 Month LIBOR +0.22%)± | 1.88 | 4-24-2020 | 7,000,000 | 7,002,036 | ||||||||||||
Credit Suisse New York (3 Month LIBOR +0.24%)± | 2.15 | 12-4-2020 | 7,000,000 | 7,008,601 | ||||||||||||
Mitsubishi Trust & Bank Company (1 Month LIBOR +0.20%)± | 1.93 | 5-6-2020 | 13,000,000 | 13,002,567 | ||||||||||||
Mizuho Bank Limited | 1.58 | 2-3-2020 | 2,050,000 | 2,050,000 | ||||||||||||
Mizuho Bank Limited | 1.87 | 5-5-2020 | 7,000,000 | 7,003,171 | ||||||||||||
Mizuho Bank Limited (1 Month LIBOR +0.27%)± | 1.98 | 6-8-2020 | 15,000,000 | 15,010,152 | ||||||||||||
MUFG Bank Limited of New York (3 Month LIBOR +0.14%)± | 2.04 | 5-11-2020 | 5,000,000 | 5,001,472 | ||||||||||||
MUFG Bank Limited of New York (3 Month LIBOR +0.18%)± | 2.10 | 2-27-2020 | 7,000,000 | 7,001,280 | ||||||||||||
National Bank of Canada (3 Month LIBOR +0.07%)±144A | 1.98 | 5-1-2020 | 2,000,000 | 2,000,433 | ||||||||||||
Natixis NY (3 Month LIBOR +0.20%)± | 2.10 | 11-13-2020 | 6,000,000 | 6,006,444 | ||||||||||||
Nordea Bank AB (1 Month LIBOR +0.25%)± | 1.93 | 5-11-2020 | 10,000,000 | 10,004,531 | ||||||||||||
Nordea Bank AB (3 Month LIBOR +0.15%)± | 2.00 | 10-13-2020 | 6,000,000 | 6,004,926 | ||||||||||||
Norinchukin Bank | 1.78 | 7-15-2020 | 15,000,000 | 15,003,268 | ||||||||||||
Norinchukin Bank | 1.90 | 3-5-2020 | 7,000,000 | 7,001,912 | ||||||||||||
Norinchukin Bank | 1.95 | 4-21-2020 | 7,000,000 | 7,004,375 | ||||||||||||
Norinchukin Bank | 2.02 | 2-21-2020 | 11,000,000 | 11,002,637 | ||||||||||||
Norinchukin Bank | 2.20 | 2-4-2020 | 5,000,000 | 5,000,331 | ||||||||||||
Oversea-Chinese Banking (1 Month LIBOR +0.15%)± | 1.88 | 2-6-2020 | 5,000,000 | 5,000,287 | ||||||||||||
Oversea-Chinese Banking | 1.90 | 3-11-2020 | 15,000,000 | 15,003,084 | ||||||||||||
Skandinaviska Enskilda Bank AB (3 Month LIBOR +0.15%)± | 2.06 | 10-2-2020 | 7,000,000 | 7,004,113 | ||||||||||||
Sumitomo Mitsui Banking Corporation 144A(z) | 1.72 | 4-1-2020 | 3,225,000 | 3,216,033 | ||||||||||||
Sumitomo Mitsui Banking Corporation (1 Month LIBOR +0.12%)± | 1.78 | 7-28-2020 | 10,000,000 | 10,000,132 | ||||||||||||
Sumitomo Mitsui Banking Corporation (1 Month LIBOR +0.20%)± | 1.91 | 7-7-2020 | 12,000,000 | 12,006,398 | ||||||||||||
Sumitomo Mitsui Banking Corporation (1 Month LIBOR +0.27%)± | 1.93 | 4-24-2020 | 5,000,000 | 5,002,036 | ||||||||||||
Sumitomo Mitsui Trust NY (1 Month LIBOR +0.26%)± | 1.94 | 4-14-2020 | 13,000,000 | 13,004,035 | ||||||||||||
Svenska Handelsbanken (1 Month LIBOR +0.22%)± | 1.87 | 7-22-2020 | 17,000,000 | 17,010,606 | ||||||||||||
Svenska Handelsbanken (3 Month LIBOR +0.16%)± | 2.00 | 10-16-2020 | 7,000,000 | 7,006,303 | ||||||||||||
Total Certificates of Deposit (Cost $332,264,902) |
| 332,386,915 | ||||||||||||||
|
| |||||||||||||||
Commercial Paper: 51.27% |
| |||||||||||||||
| Asset-Backed Commercial Paper: 28.52% | ||||||||||||||||
Albion Capital Corporation (z) | 1.70 | 2-4-2020 | 5,000,000 | 4,999,144 | ||||||||||||
Anglesea Funding LLC (1 Month LIBOR +0.15%)±144A | 1.80 | 7-27-2020 | 11,000,000 | 10,999,672 | ||||||||||||
Anglesea Funding LLC (1 Month LIBOR +0.23%)±144A | 1.89 | 5-20-2020 | 11,000,000 | 11,004,822 | ||||||||||||
Anglesea Funding LLC (3 Month LIBOR +0.12%)±144A | 2.02 | 5-15-2020 | 15,000,000 | 15,000,014 | ||||||||||||
Antalis US Funding Corporation 144A(z) | 1.83 | 4-3-2020 | 6,730,000 | 6,710,108 | ||||||||||||
Atlantic Asset Securitization Corporation 144A(z) | 1.79 | 4-7-2020 | 10,000,000 | 9,968,194 | ||||||||||||
Atlantic Asset Securitization Corporation 144A(z) | 1.79 | 6-15-2020 | 10,000,000 | 9,934,153 | ||||||||||||
Atlantic Asset Securitization Corporation 144A(z) | 1.91 | 4-8-2020 | 3,000,000 | 2,990,304 | ||||||||||||
Barton Capital Corporation 144A(z) | 1.83 | 4-8-2020 | 7,000,000 | 6,976,795 | ||||||||||||
Barton Capital Corporation 144A(z) | 2.10 | 2-24-2020 | 3,000,000 | 2,996,546 | ||||||||||||
Bedford Row Funding Corporation (1 Month LIBOR +0.24%)±144A | 1.89 | 7-20-2020 | 6,000,000 | 6,003,156 | ||||||||||||
Bedford Row Funding Corporation (1 Month LIBOR +0.15%)±144A | 1.91 | 2-3-2020 | 3,000,000 | 3,000,100 | ||||||||||||
The accompanying notes are an integral part of these financial statements.
10 | Institutional Money Market Funds
Table of Contents
Portfolio of investments—January 31, 2020
Interest rate | Maturity date | Principal | Value | |||||||||||||
| Asset-Backed Commercial Paper (continued) | ||||||||||||||||
Bedford Row Funding Corporation (3 Month LIBOR +0.09%)±144A | 2.00 | % | 10-7-2020 | $ | 7,000,000 | $ | 7,002,791 | |||||||||
Bedford Row Funding Corporation (3 Month LIBOR +0.13%)±144A | 2.03 | 11-24-2020 | 3,000,000 | 3,001,911 | ||||||||||||
Cedar Spring Capital Corporation 144A(z) | 1.69 | 2-6-2020 | 7,998,000 | 7,995,739 | ||||||||||||
Cedar Spring Capital Corporation 144A(z) | 1.96 | 4-1-2020 | 4,000,000 | 3,987,929 | ||||||||||||
Cedar Spring Capital Corporation 144A(z) | 2.01 | 3-18-2020 | 8,000,000 | 7,981,586 | ||||||||||||
Chariot Funding LLC 144A(z) | 1.65 | 2-10-2020 | 4,000,000 | 3,998,229 | ||||||||||||
Chesham Finance Limited 144A(z) | 1.64 | 2-3-2020 | 25,000,000 | 24,996,604 | ||||||||||||
Chesham Finance Limited 144A(z) | 1.64 | 2-3-2020 | 5,000,000 | 4,999,321 | ||||||||||||
Chesham Finance Limited 144A(z) | 1.64 | 2-3-2020 | 7,000,000 | 6,999,035 | ||||||||||||
Collateralized Commercial Paper Flex Company LLC (1 Month LIBOR +0.20%)±144A | 1.86 | 6-23-2020 | 3,000,000 | 3,001,140 | ||||||||||||
Collateralized Commercial Paper Flex Company LLC (3 Month LIBOR +0.12%)±144A | 1.99 | 1-6-2021 | 12,000,000 | 12,002,164 | ||||||||||||
Collateralized Commercial Paper V Company LLC (3 Month LIBOR +0.05%) ± | 1.83 | 10-27-2020 | 10,000,000 | 10,000,000 | ||||||||||||
Collateralized Commercial Paper V Company LLC (3 Month LIBOR +0.10%) ± | 2.01 | 9-28-2020 | 5,000,000 | 5,002,256 | ||||||||||||
Columbia Funding Company 144A(z) | 2.02 | 5-15-2020 | 5,000,000 | 4,974,698 | ||||||||||||
Columbia Funding Company 144A(z) | 2.02 | 6-2-2020 | 4,000,000 | 3,975,974 | ||||||||||||
Columbia Funding Company 144A(z) | 2.02 | 6-3-2020 | 8,000,000 | 7,951,475 | ||||||||||||
Columbia Funding Company 144A(z) | 2.02 | 6-9-2020 | 5,000,000 | 4,967,915 | ||||||||||||
Concord Minutemen Capital Company 144A(z) | 1.62 | 2-4-2020 | 18,000,000 | 17,996,782 | ||||||||||||
Concord Minutemen Capital Company 144A(z) | 1.89 | 7-10-2020 | 7,000,000 | 6,944,276 | ||||||||||||
Concord Minutemen Capital Company 144A(z) | 1.93 | 3-6-2020 | 3,000,000 | 2,995,120 | ||||||||||||
Concord Minutemen Capital Company 144A(z) | 1.96 | 5-15-2020 | 6,043,000 | 6,012,332 | ||||||||||||
Concord Minutemen Capital Company 144A(z) | 1.96 | 4-1-2020 | 3,000,000 | 2,991,353 | ||||||||||||
Concord Minutemen Capital Company 144A(z) | 2.01 | 3-18-2020 | 8,000,000 | 7,982,422 | ||||||||||||
Crown Point Capital Company (1 Month LIBOR +0.30%)±144A | 1.99 | 6-8-2020 | 14,000,000 | 14,002,093 | ||||||||||||
Glencove Funding LLC (3 Month LIBOR +0.12%)±144A | 2.02 | 5-20-2020 | 14,000,000 | 14,001,208 | ||||||||||||
Gotham Funding Corporation 144A(z) | 2.01 | 3-5-2020 | 20,000,000 | 19,968,361 | ||||||||||||
Great Bridge Capital Company LLC 144A(z) | 1.79 | 5-26-2020 | 3,000,000 | 2,983,886 | ||||||||||||
Great Bridge Capital Company LLC 144A(z) | 1.83 | 5-20-2020 | 11,000,000 | 10,944,104 | ||||||||||||
Institutional Secured Funding LLC 144A(z) | 1.70 | 2-3-2020 | 15,000,000 | 14,997,994 | ||||||||||||
Institutional Secured Funding LLC 144A(z) | 1.73 | 2-7-2020 | 30,000,000 | 29,990,550 | ||||||||||||
Kells Funding LLC 144A(z) | 1.87 | 2-21-2020 | 5,000,000 | 4,995,392 | ||||||||||||
Kells Funding LLC 144A(z) | 1.88 | 4-16-2020 | 7,000,000 | 6,976,045 | ||||||||||||
Kells Funding LLC 144A(z) | 1.88 | 4-15-2020 | 5,000,000 | 4,983,125 | ||||||||||||
Kells Funding LLC 144A(z) | 2.02 | 3-13-2020 | 6,000,000 | 5,988,898 | ||||||||||||
Kells Funding LLC 144A(z) | 2.03 | 3-18-2020 | 3,800,000 | 3,792,107 | ||||||||||||
Kells Funding LLC 144A(z) | 2.07 | 3-24-2020 | 8,000,000 | 7,981,214 | ||||||||||||
Legacy Capital Company 144A(z) | 1.70 | 2-12-2020 | 8,797,000 | 8,792,194 | ||||||||||||
Legacy Capital Company 144A(z) | 2.11 | 3-16-2020 | 5,000,000 | 4,989,500 | ||||||||||||
Lexington Parker Capital Company LLC 144A(z) | 1.60 | 2-5-2020 | 25,000,000 | 24,994,368 | ||||||||||||
Lexington Parker Capital Company LLC 144A(z) | 1.63 | 2-6-2020 | 15,000,000 | 14,995,935 | ||||||||||||
Liberty Funding LLC 144A(z) | 2.12 | 3-18-2020 | 3,000,000 | 2,993,408 | ||||||||||||
LMA Americas LLC 144A(z) | 1.82 | 7-6-2020 | 2,300,000 | 2,282,747 | ||||||||||||
LMA Americas LLC 144A(z) | 1.91 | 5-22-2020 | 4,700,000 | 4,675,362 | ||||||||||||
LMA Americas LLC 144A(z) | 2.00 | 2-25-2020 | 11,000,000 | 10,988,106 | ||||||||||||
LMA Americas LLC 144A(z) | 2.06 | 2-5-2020 | 6,000,000 | 5,998,625 | ||||||||||||
LMA Americas LLC 144A(z) | 2.13 | 2-20-2020 | 10,000,000 | 9,991,344 | ||||||||||||
Manhattan Asset Funding Company LLC 144A(z) | 1.68 | 2-18-2020 | 4,000,000 | 3,996,760 | ||||||||||||
Manhattan Asset Funding Company LLC 144A(z) | 1.90 | 2-7-2020 | 5,000,000 | 4,998,425 | ||||||||||||
Matchpoint Finance plc 144A(z) | 1.65 | 2-10-2020 | 5,000,000 | 4,997,804 | ||||||||||||
Matchpoint Finance plc 144A(z) | 1.95 | 2-24-2020 | 5,000,000 | 4,994,643 | ||||||||||||
Matchpoint Finance plc (1 Month LIBOR +0.29%)±144A | 1.99 | 4-9-2020 | 7,000,000 | 7,002,817 | ||||||||||||
Mountcliff Funding LLC 144A(z) | 1.68 | 2-3-2020 | 15,000,000 | 14,997,994 | ||||||||||||
Mountcliff Funding LLC (1 Month LIBOR +0.20%)±144A | 1.85 | 4-24-2020 | 15,000,000 | 15,001,306 | ||||||||||||
The accompanying notes are an integral part of these financial statements.
Institutional Money Market Funds | 11
Table of Contents
Portfolio of investments—January 31, 2020
Interest rate | Maturity date | Principal | Value | |||||||||||||
| Asset-Backed Commercial Paper (continued) | ||||||||||||||||
Mountcliff Funding LLC 144A(z) | 2.01 | % | 2-4-2020 | $ | 2,000,000 | $ | 1,999,642 | |||||||||
Nieuw Amsterdam Receivables Corporation 144A(z) | 1.78 | 3-4-2020 | 14,000,000 | 13,978,543 | ||||||||||||
Regency Markets No.1 LLC 144A(z) | 1.65 | 2-14-2020 | 3,000,000 | 2,998,080 | ||||||||||||
Ridgefield Funding Company (1 Month LIBOR +0.30%)±144A | 1.95 | 4-22-2020 | 5,000,000 | 5,002,321 | ||||||||||||
Thunder Bay Funding LLC 144A(z) | 2.01 | 3-17-2020 | 6,000,000 | 5,987,427 | ||||||||||||
Versailles CDS LLC 144A(z) | 2.06 | 2-14-2020 | 3,000,000 | 2,998,152 | ||||||||||||
Victory Receivables 144A(z) | 1.81 | 3-11-2020 | 14,000,000 | 13,973,913 | ||||||||||||
| 593,578,453 | ||||||||||||||||
|
| |||||||||||||||
| Financial Company Commercial Paper: 11.71% | ||||||||||||||||
Australia & New Zealand Banking Group Limited 144A(z) | 1.88 | 5-21-2020 | 3,000,000 | 2,984,025 | ||||||||||||
Australia & New Zealand Banking Group Limited (3 Month LIBOR +0.11%) ±144A | 2.03 | 11-27-2020 | 3,000,000 | 3,001,687 | ||||||||||||
Commonwealth Bank of Australia (1 Month LIBOR +0.17%)±144A | 1.95 | 4-2-2020 | 10,000,000 | 10,000,880 | ||||||||||||
Commonwealth Bank of Australia (3 Month LIBOR +0.12%)±144A | 2.03 | 11-9-2020 | 6,000,000 | 6,003,656 | ||||||||||||
Commonwealth Bank of Australia (3 Month LIBOR +0.15%)±144A | 2.08 | 9-24-2020 | 7,000,000 | 7,005,724 | ||||||||||||
Commonwealth Bank of Australia (3 Month LIBOR +0.45%)±144A | 2.34 | 3-10-2020 | 3,000,000 | 3,001,759 | ||||||||||||
DBS Bank Limited 144A(z) | 1.82 | 7-6-2020 | 15,000,000 | 14,886,175 | ||||||||||||
DBS Bank Limited 144A(z) | 1.86 | 4-14-2020 | 10,000,000 | 9,965,611 | ||||||||||||
DBS Bank Limited 144A(z) | 1.90 | 6-26-2020 | 14,000,000 | 13,900,644 | ||||||||||||
DBS Bank Limited (3 Month LIBOR +0.06%)±144A | 1.95 | 6-11-2020 | 7,000,000 | 6,999,982 | ||||||||||||
DBS Bank Limited 144A(z) | 2.27 | 2-28-2020 | 4,000,000 | 3,994,882 | ||||||||||||
Dexia Credit Local SA (z) | 1.87 | 4-15-2020 | 17,000,000 | 16,933,948 | ||||||||||||
Dexia Credit Local SA 144A | 1.88 | 3-23-2020 | 8,000,000 | 8,001,844 | ||||||||||||
Federation des Caisses (3 Month LIBOR +0.10%)±144A | 1.99 | 9-9-2020 | 13,000,000 | 12,999,966 | ||||||||||||
ING US Funding LLC (1 Month LIBOR +0.20%)±144A | 1.86 | 5-19-2020 | 7,000,000 | 7,002,408 | ||||||||||||
ING US Funding LLC (3 Month LIBOR +0.19%)±144A | 2.10 | 10-1-2020 | 7,000,000 | 7,005,009 | ||||||||||||
National Australia Bank Limited (1 Month LIBOR +0.16%)±144A | 1.82 | 5-19-2020 | 3,000,000 | 3,000,670 | ||||||||||||
National Australia Bank Limited (1 Month LIBOR +0.13%)±144A | 1.82 | 2-7-2020 | 6,000,000 | 6,000,341 | ||||||||||||
National Australia Bank Limited (1 Month LIBOR +0.26%)±144A | 1.92 | 6-19-2020 | 4,000,000 | 4,002,652 | ||||||||||||
National Australia Bank Limited (3 Month LIBOR +0.12%)±144A | 2.01 | 12-11-2020 | 7,000,000 | 7,004,115 | ||||||||||||
Ontario Teachers Finance Trust 144A(z) | 1.81 | 7-20-2020 | 8,000,000 | 7,936,806 | ||||||||||||
Ontario Teachers Finance Trust 144A(z) | 2.10 | 3-12-2020 | 7,000,000 | 6,987,643 | ||||||||||||
Ontario Teachers Finance Trust 144A(z) | 2.20 | 3-6-2020 | 2,000,000 | 1,996,986 | ||||||||||||
Oversea-Chinese Banking Corporation Limited (3 Month LIBOR +0.04%) ±144A | 1.94 | 2-18-2020 | 7,000,000 | 7,000,398 | ||||||||||||
Oversea-Chinese Banking Corporation Limited (1 Month LIBOR +0.20%) ±144A | 1.90 | 4-9-2020 | 6,000,000 | 6,001,386 | ||||||||||||
Oversea-Chinese Banking Corporation Limited (1 Month LIBOR +0.24%) ±144A | 1.97 | 6-5-2020 | 10,000,000 | 10,005,502 | ||||||||||||
Oversea-Chinese Banking Corporation Limited (3 Month LIBOR +0.10%) ±144A | 2.01 | 8-14-2020 | 5,000,000 | 4,999,732 | ||||||||||||
Royal Bank of Canada (3 Month LIBOR +0.30%)± | 2.10 | 7-22-2020 | 4,000,000 | 4,004,971 | ||||||||||||
Starbird Funding Corporation 144A(z) | 2.02 | 4-6-2020 | 8,000,000 | 7,975,008 | ||||||||||||
Sumitomo Mitsui Trust Bank 144A(z) | 1.95 | 2-28-2020 | 8,000,000 | 7,989,895 | ||||||||||||
Toronto Dominion Bank (3 Month LIBOR +0.12%)± | 1.97 | 10-13-2020 | 5,000,000 | 5,002,731 | ||||||||||||
Toronto Dominion Bank (3 Month LIBOR +0.14%)±144A | 2.05 | 11-13-2020 | 5,000,000 | 5,003,835 | ||||||||||||
Toronto Dominion Bank (3 Month LIBOR +0.19%)±144A | 2.14 | 9-28-2020 | 4,000,000 | 4,004,099 | ||||||||||||
Toronto Dominion Bank (3 Month LIBOR +0.28%)± | 2.17 | 6-11-2020 | 7,000,000 | 7,008,008 | ||||||||||||
United Overseas Bank Limited 144A(z) | 1.85 | 2-4-2020 | 4,000,000 | 3,999,334 | ||||||||||||
| 243,612,312 | ||||||||||||||||
|
| |||||||||||||||
| Other Commercial Paper: 11.04% | ||||||||||||||||
BNG Bank NV 144A(z) | 1.56 | 2-3-2020 | 10,000,000 | 9,998,671 | ||||||||||||
BNG Bank NV (1 Month LIBOR +0.20%)±144A | 1.86 | 5-26-2020 | 7,000,000 | 7,001,586 | ||||||||||||
BNG Bank NV 144A(z) | 1.92 | 5-18-2020 | 9,000,000 | 8,957,016 | ||||||||||||
The accompanying notes are an integral part of these financial statements.
12 | Institutional Money Market Funds
Table of Contents
Portfolio of investments—January 31, 2020
Interest rate | Maturity date | Principal | Value | |||||||||||||
| Other Commercial Paper (continued) | ||||||||||||||||
BNG Bank NV (z) | 2.02 | % | 4-15-2020 | $ | 7,000,000 | $ | 6,977,323 | |||||||||
Caisse des Depots 144A(z) | 1.57 | 2-3-2020 | 20,000,000 | 19,997,450 | ||||||||||||
Caisse des Depots 144A(z) | 1.70 | 4-22-2020 | 4,000,000 | 3,984,976 | ||||||||||||
Caisse des Depots 144A(z) | 2.02 | 3-16-2020 | 12,000,000 | 11,975,700 | ||||||||||||
China International Marine Containers (z) | 2.05 | 2-4-2020 | 14,000,000 | 13,997,612 | ||||||||||||
Erste Abwicklungsanstalt 144A(z) | 1.60 | 2-5-2020 | 8,000,000 | 7,998,272 | ||||||||||||
Erste Bank der oesterreichischen Sparkassen AG (1 Month LIBOR +0.22%) ±144A | 1.88 | 3-27-2020 | 8,000,000 | 8,001,804 | ||||||||||||
European Investment Bank (z) | 1.57 | 2-4-2020 | 25,000,000 | 24,995,745 | ||||||||||||
Komatsu Finance America Incorporated 144A(z) | 1.69 | 2-13-2020 | 8,000,000 | 7,995,459 | ||||||||||||
Mercy Health (z) | 1.70 | 2-12-2020 | 3,000,000 | 2,998,426 | ||||||||||||
Nederlandse Waterschapsbank NV 144A(z) | 1.87 | 4-14-2020 | 6,000,000 | 5,979,736 | ||||||||||||
Nederlandse Waterschapsbank NV 144A(z) | 2.02 | 2-10-2020 | 7,000,000 | 6,997,033 | ||||||||||||
Nederlandse Waterschapsbank NV 144A(z) | 2.05 | 3-2-2020 | 11,000,000 | 10,984,844 | ||||||||||||
NRW Bank 144A(z) | 2.02 | 2-24-2020 | 15,000,000 | 14,984,120 | ||||||||||||
NRW Bank 144A(z) | 2.02 | 3-4-2020 | 7,000,000 | 6,989,727 | ||||||||||||
Province of Alberta 144A(z) | 2.02 | 2-6-2020 | 5,000,000 | 4,998,699 | ||||||||||||
Toyota Credit Canada Incorporated (3 Month LIBOR +0.13%)± | 2.03 | 7-31-2020 | 4,000,000 | 4,001,766 | ||||||||||||
Toyota Finance Australia Limited (1 Month LIBOR +0.27%)± | 1.95 | 6-5-2020 | 6,000,000 | 6,003,779 | ||||||||||||
Toyota Finance Australia Limited (3 Month LIBOR +0.10%)± | 1.98 | 10-5-2020 | 10,000,000 | 10,002,657 | ||||||||||||
Toyota Motor Credit Corporation (3 Month LIBOR +0.08%)± | 1.87 | 10-23-2020 | 10,000,000 | 9,999,995 | ||||||||||||
Toyota Motor Credit Corporation (1 Month LIBOR +0.23%)± | 1.88 | 5-26-2020 | 8,000,000 | 8,003,747 | ||||||||||||
Toyota Motor Credit Corporation (1 Month LIBOR +0.16%)± | 1.89 | 2-27-2020 | 6,000,000 | 6,000,638 | ||||||||||||
| 229,826,781 | ||||||||||||||||
|
| |||||||||||||||
Total Commercial Paper (Cost $1,066,866,071) |
| 1,067,017,546 | ||||||||||||||
|
| |||||||||||||||
Municipal Obligations: 7.08% |
| |||||||||||||||
Colorado: 1.89% |
| |||||||||||||||
| Variable Rate Demand Notes ø: 1.89% | ||||||||||||||||
Colorado HFA MFHR Class II Series B (Housing Revenue, FHLB SPA) | 1.72 | 5-1-2052 | 29,345,000 | 29,345,000 | ||||||||||||
Colorado Southern Ute Indian Tribe Reservation Series 2007 (Miscellaneous Revenue) 144A | 1.60 | 1-1-2027 | 10,000,000 | 10,000,000 | ||||||||||||
| 39,345,000 | ||||||||||||||||
|
| |||||||||||||||
| Georgia: 0.10% | ||||||||||||||||
| Other Municipal Debt: 0.10% | ||||||||||||||||
Municipal Electric Authority of Georgia | 2.05 | 3-17-2020 | 2,000,000 | 2,000,434 | ||||||||||||
|
| |||||||||||||||
Illinois: 0.24% |
| |||||||||||||||
| Variable Rate Demand Note ø: 0.24% | ||||||||||||||||
Illinois Housing Development Authority SeriesA-2 (Housing Revenue, FHLB SPA) | 1.60 | 8-1-2035 | 5,000,000 | 5,000,000 | ||||||||||||
|
| |||||||||||||||
| Kentucky: 0.48% | ||||||||||||||||
| Variable Rate Demand Note ø: 0.48% | ||||||||||||||||
Kentucky Municipal Power Agency Series B002 (Utilities Revenue, AGM Insured, Morgan Stanley Bank LIQ) 144A | 1.75 | 9-1-2037 | 10,000,000 | 10,000,000 | ||||||||||||
|
| |||||||||||||||
Louisiana: 0.40% |
| |||||||||||||||
| Variable Rate Demand Note ø: 0.40% | ||||||||||||||||
East Baton Rouge Parish LA Sewerage Commission Revenue Series 2016-XFT904 (Water & Sewer Revenue, Morgan Stanley Bank LIQ) 144A | 1.75 | 2-1-2045 | 8,280,000 | 8,280,000 | ||||||||||||
|
| |||||||||||||||
The accompanying notes are an integral part of these financial statements.
Institutional Money Market Funds | 13
Table of Contents
Portfolio of investments—January 31, 2020
Interest rate | Maturity date | Principal | Value | |||||||||||||
| New Jersey: 0.86% |
| |||||||||||||||
| Variable Rate Demand Note ø: 0.86% | ||||||||||||||||
Jets Stadium Development SeriesA-4B (Miscellaneous Revenue, Sumitomo Mitsui Banking Corporation LOC) 144A | 1.65 | % | 4-1-2047 | $ | 17,915,000 | $ | 17,915,000 | |||||||||
|
| |||||||||||||||
| New York: 0.14% | ||||||||||||||||
| Variable Rate Demand Note ø: 0.14% | ||||||||||||||||
New York HFA 222 East 44th Street Series B (Housing Revenue, Bank of China LOC) | 1.72 | 5-1-2050 | 3,000,000 | 3,000,000 | ||||||||||||
|
| |||||||||||||||
| Oregon: 0.43% | ||||||||||||||||
| Variable Rate Demand Note ø: 0.43% | ||||||||||||||||
Oregon Tender Option Bond Trust Receipts/Certificates Series ZF2515 (Miscellaneous Revenue, Bank of America NA LIQ) 144A | 1.84 | 5-1-2035 | 9,000,000 | 9,000,000 | ||||||||||||
|
| |||||||||||||||
| Other: 2.54% | ||||||||||||||||
| Variable Rate Demand Notes ø: 2.54% | ||||||||||||||||
Columbus GA Housing Development Authority Puttable Floating Option Taxable Notes SeriesTN-024 (Housing Revenue, ACA Insured, Bank of America NA LIQ) 144A | 1.98 | 10-1-2039 | 4,895,000 | 4,895,000 | ||||||||||||
Providence St. Joseph Health Obligation Series 12-E (Health Revenue, U.S. Bank NA LOC) | 1.68 | 10-1-2042 | 15,000,000 | 15,000,000 | ||||||||||||
Providence St. Joseph Health Obligation Series 16-G (Health Revenue, Bank of Tokyo-Mitsubishi LOC) | 1.62 | 10-1-2047 | 9,000,000 | 9,000,000 | ||||||||||||
SSAB AB Series A (Miscellaneous Revenue, DNB Banking ASA LOC) | 1.62 | 6-1-2035 | 6,000,000 | 6,000,000 | ||||||||||||
Steadfast Crestavilla LLC Series A (Health Revenue, American AgCredit LOC) | 1.62 | 2-1-2056 | 3,000,000 | 3,000,000 | ||||||||||||
Steadfast Crestavilla LLC Series B (Health Revenue, U.S. Bank NA LOC) | 1.62 | 2-1-2056 | 2,000,000 | 2,000,000 | ||||||||||||
Taxable Municipal Funding Trust Various (GO Revenue, Barclays Bank plc LOC) 144A | 2.00 | 9-1-2027 | 12,920,000 | 12,920,000 | ||||||||||||
| 52,815,000 | ||||||||||||||||
|
| |||||||||||||||
Total Municipal Obligations (Cost $147,355,000) |
| 147,355,434 | ||||||||||||||
|
| |||||||||||||||
| Non-Agency Mortgage-Backed Securities: 0.19% | ||||||||||||||||
Pepper Residential Securities Trust Series 20A Class A1U2 (1 Month LIBOR +0.32%)±144A | 1.99 | 3-16-2020 | 4,000,000 | 4,000,614 | ||||||||||||
|
| |||||||||||||||
TotalNon-Agency Mortgage-Backed Securities (Cost $4,000,000) |
| 4,000,614 | ||||||||||||||
|
| |||||||||||||||
| Other Instruments: 2.93% | ||||||||||||||||
Altoona Blair County Development Corporation 144A§øø | 1.64 | 4-1-2035 | 12,000,000 | 12,000,000 | ||||||||||||
Invesco Dynamic Credit Opportunities Fund SeriesW-7 §øø | 1.71 | 6-1-2028 | 15,000,000 | 15,000,000 | ||||||||||||
Mitchell 2019 Irrevocable Life Insurance Trust §øø | 1.60 | 9-1-2059 | 8,495,000 | 8,495,000 | ||||||||||||
Morris Family Insurance Trust §øø | 1.60 | 10-1-2059 | 3,350,000 | 3,350,000 | ||||||||||||
Opus Inspection Incorporated §øø | 1.67 | 1-1-2034 | 11,000,000 | 11,000,000 | ||||||||||||
ROC III California Crossings Chino Hills LLC Series A §øø | 1.62 | 1-1-2057 | 4,000,000 | 4,000,000 | ||||||||||||
Toyota Motor Credit Corporation §øø | 1.97 | 5-22-2020 | 7,000,000 | 7,002,319 | ||||||||||||
Total Other Instruments (Cost $60,845,000) |
| 60,847,319 | ||||||||||||||
|
| |||||||||||||||
| Other Notes: 0.91% | ||||||||||||||||
| Corporate Bonds and Notes: 0.91% | ||||||||||||||||
Cellmark Incorporated Secured § | 1.67 | 6-1-2038 | 19,000,000 | 19,000,000 | ||||||||||||
|
| |||||||||||||||
Total Other Notes (Cost $19,000,000) |
| 19,000,000 | ||||||||||||||
|
| |||||||||||||||
The accompanying notes are an integral part of these financial statements.
14 | Institutional Money Market Funds
Table of Contents
Portfolio of investments—January 31, 2020
Interest rate | Maturity date | Principal | Value | |||||||||||||
| Repurchase Agreements ^^: 21.43% |
| |||||||||||||||
Bank of America Corporation, dated1-31-2020, maturity value $129,017,093 (1) | 1.59 | % | 2-3-2020 | $ | 129,000,000 | $ | 129,000,000 | |||||||||
Bank of Nova Scotia, dated1-31-2020, maturity value $111,014,708 (2) | 1.59 | 2-3-2020 | 111,000,000 | 111,000,000 | ||||||||||||
GX Clarke & Company, dated1-31-2020, maturity value $58,007,830 (3) | 1.62 | 2-3-2020 | 58,000,000 | 58,000,000 | ||||||||||||
MUGF Bank, dated1-31-2020, maturity value $111,014,708 (4) | 1.59 | 2-3-2020 | 111,000,000 | 111,000,000 | ||||||||||||
Standard Charted Bank, dated1-31-2020, maturity value $37,004,933 (5) | 1.60 | 2-3-2020 | 37,000,000 | 37,000,000 | ||||||||||||
Total Repurchase Agreements (Cost $446,000,000) |
| 446,000,000 | ||||||||||||||
|
| |||||||||||||||
| Total investments in securities (Cost $2,076,330,973) | 99.79 | % | 2,076,607,828 | |||||
Other assets and liabilities, net | 0.21 | 4,452,091 | ||||||
|
|
|
| |||||
| Total net assets | 100.00 | % | $ | 2,081,059,919 | ||||
|
|
|
| |||||
| ± | Variable rate investment. The rate shown is the rate in effect at period end. |
| 144A | The security may be resold in transactions exempt from registration, normally to qualified institutional buyers, pursuant to Rule 144A under the Securities Act of 1933. |
| (z) | Zero coupon security. The rate represents the current yield to maturity. |
| ø | Variable rate demand notes are subject to a demand feature which reduces the effective maturity. The maturity date shown represents the final maturity date of the security. The interest rate is determined and reset by the issuer daily, weekly, or monthly depending upon the terms of the security. The rate shown is the rate in effect at period end. |
| § | The security is subject to a demand feature which reduces the effective maturity. |
| øø | The interest rate is determined and reset by the issuer periodically depending upon the terms of the security. The rate shown is the rate in effect at period end. |
| ^^ | Collateralized by: |
| (1) | U.S. government securities, 3.00% to 3.50%,1-20-2045 to7-20-2045, fair value including accrued interest is $132,870,000. |
| (2) | U.S. government securities, 2.40% to 6.00%,1-15-2030 to10-1-2049, fair value including accrued interest is $114,330,000. |
| (3) | U.S. government securities, 0.00% to 7.50%,7-29-2020 to1-20-2050, fair value including accrued interest is $59,292,442. |
| (4) | U.S. government securities, 1.13% to 5.50%,5-31-2020 to1-1-2050, fair value including accrued interest is $114,237,905. |
| (5) | U.S. government securities, 0.00% to 6.50%,3-26-2020 to1-1-2050, fair value including accrued interest is $37,959,612. |
Abbreviations:
| ACA | ACA Financial Guaranty Corporation |
| AGM | Assured Guaranty Municipal |
| FHLB | Federal Home Loan Bank |
| HFA | Housing Finance Authority |
| LIBOR | London Interbank Offered Rate |
| LIQ | Liquidity agreement |
| LOC | Letter of credit |
| MFHR | Multifamily housing revenue |
| ROC | Reset option certificates |
| SPA | Standby purchase agreement |
The accompanying notes are an integral part of these financial statements.
Institutional Money Market Funds | 15
Table of Contents
Statement of assets and liabilities—January 31, 2020
Assets | ||||
Investments in unaffiliated securities, at value (cost $1,630,330,973) | $ | 1,630,607,828 | ||
Investments in repurchase agreements, at value (cost $446,000,000) | 446,000,000 | |||
Cash | 15,395 | |||
Receivable for Fund shares sold | 2,820,050 | |||
Receivable for interest | 2,328,838 | |||
Prepaid expenses and other assets | 4,884 | |||
|
| |||
Total assets | 2,081,776,995 | |||
|
| |||
Liabilities | ||||
Management fee payable | 176,494 | |||
Dividends payable | 191,535 | |||
Administration fees payable | 118,361 | |||
Shareholder report expenses payable | 67,369 | |||
Custody and accounting fees payable | 57,464 | |||
Trustees’ fees and expenses payable | 4,099 | |||
Accrued expenses and other liabilities | 101,754 | |||
|
| |||
Total liabilities | 717,076 | |||
|
| |||
Total net assets | $ | 2,081,059,919 | ||
|
| |||
Net assets consist of | ||||
Paid-in capital | $ | 2,080,743,055 | ||
Total distributable earnings | 316,864 | |||
|
| |||
Total net assets | $ | 2,081,059,919 | ||
|
| |||
Computation of net asset value price per share | ||||
Net assets – Administrator Class | $ | 118,226,447 | ||
Shares outstanding – Administrator Class1 | 118,159,579 | |||
Net asset value per share – Administrator Class | $1.0006 | |||
Net assets – Institutional Class | $ | 854,736,133 | ||
Shares outstanding – Institutional Class1 | 854,253,359 | |||
Net asset value per share – Institutional Class | $1.0006 | |||
Net assets – Select Class | $ | 1,005,822,598 | ||
Shares outstanding – Select Class1 | 1,005,234,003 | |||
Net asset value per share – Select Class | $1.0006 | |||
Net assets – Service Class | $ | 102,274,741 | ||
Shares outstanding – Service Class1 | 102,205,449 | |||
Net asset value per share – Service Class | $1.0007 | |||
| 1 | The Fund has an unlimited number of authorized shares. |
The accompanying notes are an integral part of these financial statements.
16 | Institutional Money Market Funds
Table of Contents
Statement of operations—year ended January 31, 2020
Investment income | ||||
Interest | $ | 40,062,813 | ||
|
| |||
Expenses | ||||
Management fee | 2,609,391 | |||
Administration fees | ||||
Administrator Class | 119,901 | |||
Institutional Class | 559,409 | |||
Select Class | 320,619 | |||
Service Class | 142,661 | |||
Shareholder servicing fees | ||||
Administrator Class | 119,901 | |||
Service Class | 297,211 | |||
Custody and accounting fees | 83,676 | |||
Professional fees | 42,231 | |||
Registration fees | 36,781 | |||
Shareholder report expenses | 25,486 | |||
Trustees’ fees and expenses | 20,942 | |||
Other fees and expenses | 22,178 | |||
|
| |||
Total expenses | 4,400,387 | |||
Less: Fee waivers and/or expense reimbursements | ||||
Fund-level | (581,195 | ) | ||
Administrator Class | (319,882 | ) | ||
Institutional Class | (283 | ) | ||
Select Class | (109 | ) | ||
Service Class | (68,803 | ) | ||
|
| |||
Net expenses | 3,430,115 | |||
|
| |||
Net investment income | 36,632,698 | |||
|
| |||
Realized and unrealized gains (losses) on investments | ||||
Net realized gains on investments | 34,071 | |||
Net change in unrealized gains (losses) on investments | 127,430 | |||
|
| |||
Net realized and unrealized gains (losses) on investments | 161,501 | |||
|
| |||
Net increase in net assets resulting from operations | $ | 36,794,199 | ||
|
| |||
The accompanying notes are an integral part of these financial statements.
Institutional Money Market Funds | 17
Table of Contents
Statement of changes in net assets
| Year ended January 31, 2020 | Year ended January 31, 2019 | |||||||||||||||
Operations | ||||||||||||||||
Net investment income | $ | 36,632,698 | $ | 28,696,485 | ||||||||||||
Net realized gains on investments | 34,071 | 18,043 | ||||||||||||||
Net change in unrealized gains (losses) on investments | 127,430 | (7,945 | ) | |||||||||||||
|
| |||||||||||||||
Net increase in net assets resulting from operations | 36,794,199 | 28,706,583 | ||||||||||||||
|
| |||||||||||||||
Distributions to shareholders from net investment income and net realized gains | ||||||||||||||||
Administrator Class | (2,407,953 | ) | (2,465,614 | ) | ||||||||||||
Institutional Class | (14,579,571 | ) | (9,770,370 | ) | ||||||||||||
Select Class | (17,436,431 | ) | (13,889,010 | ) | ||||||||||||
Service Class | (2,226,786 | ) | (2,571,492 | ) | ||||||||||||
|
| |||||||||||||||
Total distributions to shareholders | (36,650,741 | ) | (28,696,486 | ) | ||||||||||||
|
| |||||||||||||||
Capital share transactions | Shares | Shares | ||||||||||||||
Proceeds from shares sold | ||||||||||||||||
Administrator Class | 166,638,886 | 166,722,945 | 208,831,612 | 208,924,052 | ||||||||||||
Institutional Class | 1,831,980,290 | 1,832,914,828 | 1,335,820,742 | 1,336,437,928 | ||||||||||||
Select Class | 1,684,650,000 | 1,685,556,431 | 3,101,735,175 | 3,103,165,040 | ||||||||||||
Service Class | 602,544,349 | 602,908,075 | 1,098,229,467 | 1,098,801,000 | ||||||||||||
|
| |||||||||||||||
| 4,288,102,279 | 5,747,328,020 | |||||||||||||||
|
| |||||||||||||||
Reinvestment of distributions | ||||||||||||||||
Administrator Class | 2,313,623 | 2,314,813 | �� | 2,416,281 | 2,417,344 | |||||||||||
Institutional Class | 14,345,607 | 14,353,032 | 9,639,093 | 9,643,341 | ||||||||||||
Select Class | 17,299,112 | 17,308,618 | 13,800,113 | 13,806,425 | ||||||||||||
Service Class | 2,160,753 | 2,162,060 | 2,523,025 | 2,524,353 | ||||||||||||
|
| |||||||||||||||
| 36,138,523 | 28,391,463 | |||||||||||||||
|
| |||||||||||||||
Payment for shares redeemed | ||||||||||||||||
Administrator Class | (186,852,404 | ) | (186,947,329 | ) | (184,686,866 | ) | (184,768,170 | ) | ||||||||
Institutional Class | (1,509,798,838 | ) | (1,510,574,286 | ) | (1,467,240,930 | ) | (1,467,914,637 | ) | ||||||||
Select Class | (1,431,658,767 | ) | (1,432,436,357 | ) | (3,097,745,586 | ) | (3,099,164,118 | ) | ||||||||
Service Class | (652,883,191 | ) | (653,275,838 | ) | (1,137,900,078 | ) | (1,138,490,122 | ) | ||||||||
|
| |||||||||||||||
| (3,783,233,810 | ) | (5,890,337,047 | ) | |||||||||||||
|
| |||||||||||||||
Net increase (decrease) in net assets resulting from capital share transactions | 541,006,992 | (114,617,564 | ) | |||||||||||||
|
| |||||||||||||||
Total increase (decrease) in net assets | 541,150,450 | (114,607,467 | ) | |||||||||||||
|
| |||||||||||||||
Net assets | ||||||||||||||||
Beginning of period | 1,539,909,469 | 1,654,516,936 | ||||||||||||||
|
| |||||||||||||||
End of period | $ | 2,081,059,919 | $ | 1,539,909,469 | ||||||||||||
|
| |||||||||||||||
The accompanying notes are an integral part of these financial statements.
18 | Institutional Money Market Funds
Table of Contents
(For a share outstanding throughout each period)
| Year ended January 31 | ||||||||||||||||||||
| ADMINISTRATOR CLASS | 2020 | 2019 | 2018 | 2017 | 20161 | |||||||||||||||
Net asset value, beginning of period | $1.0005 | $1.0005 | $1.0004 | $1.0000 | $1.00 | |||||||||||||||
Net investment income | 0.0202 | 0.0189 | 0.0096 | 0.0029 | 0.00 | 2 | ||||||||||||||
Net realized and unrealized gains (losses) on investments | 0.0001 | 0.0000 | 3 | 0.0001 | 0.0004 | 0.00 | 2 | |||||||||||||
|
|
|
|
|
|
|
|
|
| |||||||||||
Total from investment operations | 0.0203 | 0.0189 | 0.0097 | 0.0033 | 0.00 | 2 | ||||||||||||||
Distributions to shareholders from | ||||||||||||||||||||
Net investment income | (0.0202 | ) | (0.0189 | ) | (0.0096 | ) | (0.0029 | ) | (0.00 | )2 | ||||||||||
Net realized gains | (0.0000 | )3 | 0.0000 | 0.0000 | 0.0000 | 0.00 | ||||||||||||||
|
|
|
|
|
|
|
|
|
| |||||||||||
Total distributions to shareholders | (0.0202 | ) | (0.0189 | ) | (0.0096 | ) | (0.0029 | ) | (0.00 | )2 | ||||||||||
Net asset value, end of period | $1.0006 | $1.0005 | $1.0005 | $1.0004 | $1.00 | |||||||||||||||
Total return | 2.04 | % | 1.91 | % | 0.97 | % | 0.33 | % | 0.03 | % | ||||||||||
Ratios to average net assets (annualized) | ||||||||||||||||||||
Gross expenses | 0.36 | % | 0.37 | % | 0.38 | % | 0.36 | % | 0.35 | % | ||||||||||
Net expenses | 0.33 | % | 0.33 | % | 0.33 | % | 0.33 | % | 0.26 | % | ||||||||||
Net investment income | 2.01 | % | 1.90 | % | 0.96 | % | 0.26 | % | 0.03 | % | ||||||||||
Supplemental data | ||||||||||||||||||||
Net assets, end of period (000s omitted) | $118,226 | $136,126 | $109,551 | $118,548 | $297,396 | |||||||||||||||
| 1 | Amounts reflect the Fund transacting shares at a fixed NAV rounded to two decimal places. Beginning October 11, 2016, the Fund began selling and redeeming shares of the Fund at a floating NAV rounded to the fourth decimal place. |
| 2 | Amount is less than $0.005. |
| 3 | Amount is less than $0.00005. |
The accompanying notes are an integral part of these financial statements.
Institutional Money Market Funds | 19
Table of Contents
Financial highlights
(For a share outstanding throughout each period)
| Year ended January 31 | ||||||||||||||||||||
| INSTITUTIONAL CLASS | 2020 | 2019 | 2018 | 2017 | 20161 | |||||||||||||||
Net asset value, beginning of period | $1.0005 | $1.0005 | $1.0004 | $1.0000 | $1.00 | |||||||||||||||
Net investment income | 0.0215 | 0.0202 | 0.0109 | 0.0043 | 0.00 | 2 | ||||||||||||||
Net realized and unrealized gains (losses) on investments | 0.0001 | 0.0000 | 3 | 0.0001 | 0.0003 | 0.00 | 2 | |||||||||||||
|
|
|
|
|
|
|
|
|
| |||||||||||
Total from investment operations | 0.0216 | 0.0202 | 0.0110 | 0.0046 | 0.00 | 2 | ||||||||||||||
Distributions to shareholders from | ||||||||||||||||||||
Net investment income | (0.0215 | ) | (0.0202 | ) | (0.0109 | ) | (0.0042 | ) | (0.00 | )2 | ||||||||||
Net realized gains | (0.0000 | )3 | 0.0000 | 0.0000 | 0.0000 | 0.00 | ||||||||||||||
|
|
|
|
|
|
|
|
|
| |||||||||||
Total distributions to shareholders | (0.0215 | ) | (0.0202 | ) | (0.0109 | ) | (0.0042 | ) | (0.00 | )2 | ||||||||||
Net asset value, end of period | $1.0006 | $1.0005 | $1.0005 | $1.0004 | $1.00 | |||||||||||||||
Total return | 2.17 | % | 2.04 | % | 1.10 | % | 0.46 | % | 0.09 | % | ||||||||||
Ratios to average net assets (annualized) | ||||||||||||||||||||
Gross expenses | 0.24 | % | 0.25 | % | 0.26 | % | 0.23 | % | 0.23 | % | ||||||||||
Net expenses | 0.20 | % | 0.20 | % | 0.20 | % | 0.20 | % | 0.20 | % | ||||||||||
Net investment income | 2.09 | % | 2.01 | % | 1.08 | % | 0.37 | % | 0.10 | % | ||||||||||
Supplemental data | ||||||||||||||||||||
Net assets, end of period (000s omitted) | $854,736 | $517,981 | $639,823 | $756,218 | $5,027,125 | |||||||||||||||
| 1 | Amounts reflect the Fund transacting shares at a fixed NAV rounded to two decimal places. Beginning October 11, 2016, the Fund began selling and redeeming shares of the Fund at a floating NAV rounded to the fourth decimal place. |
| 2 | Amount is less than $0.005. |
| 3 | Amount is less than $0.00005. |
The accompanying notes are an integral part of these financial statements.
20 | Institutional Money Market Funds
Table of Contents
Financial highlights
(For a share outstanding throughout each period)
| Year ended January 31 | ||||||||||||||||||||
| SELECT CLASS | 2020 | 2019 | 2018 | 2017 | 20161 | |||||||||||||||
Net asset value, beginning of period | $1.0005 | $1.0005 | $1.0000 | $1.0000 | $1.00 | |||||||||||||||
Net investment income | 0.0222 | 0.0209 | 0.0116 | 0.0049 | 0.00 | 2 | ||||||||||||||
Net realized and unrealized gains (losses) on investments | 0.0001 | 0.0000 | 3 | 0.0001 | 0.0004 | 0.00 | 2 | |||||||||||||
|
|
|
|
|
|
|
|
|
| |||||||||||
Total from investment operations | 0.0223 | 0.0209 | 0.0117 | 0.0053 | 0.00 | 2 | ||||||||||||||
Distributions to shareholders from | ||||||||||||||||||||
Net investment income | (0.0222 | ) | (0.0209 | ) | (0.0116 | ) | (0.0049 | ) | (0.00 | )2 | ||||||||||
Net realized gains | (0.0000 | )3 | 0.0000 | 0.0000 | 0.0000 | 0.00 | ||||||||||||||
|
|
|
|
|
|
|
|
|
| |||||||||||
Total distributions to shareholders | (0.0222 | ) | (0.0209 | ) | (0.0116 | ) | (0.0049 | ) | (0.00 | )2 | ||||||||||
Net asset value, end of period | $1.0006 | $1.0005 | $1.0005 | $1.0004 | $1.00 | |||||||||||||||
Total return | 2.24 | % | 2.11 | % | 1.17 | % | 0.53 | % | 0.16 | % | ||||||||||
Ratios to average net assets (annualized) | ||||||||||||||||||||
Gross expenses | 0.20 | % | 0.21 | % | 0.22 | % | 0.19 | % | 0.19 | % | ||||||||||
Net expenses | 0.13 | % | 0.13 | % | 0.13 | % | 0.13 | % | 0.13 | % | ||||||||||
Net investment income | 2.18 | % | 2.08 | % | 1.14 | % | 0.44 | % | 0.16 | % | ||||||||||
Supplemental data | ||||||||||||||||||||
Net assets, end of period (000s omitted) | $1,005,823 | $735,332 | $717,508 | $873,167 | $5,595,704 | |||||||||||||||
| 1 | Amounts reflect the Fund transacting shares at a fixed NAV rounded to two decimal places. Beginning October 11, 2016, the Fund began selling and redeeming shares of the Fund at a floating NAV rounded to the fourth decimal place. |
| 2 | Amount is less than $0.005. |
| 3 | Amount is less than $0.00005. |
The accompanying notes are an integral part of these financial statements.
Institutional Money Market Funds | 21
Table of Contents
Financial highlights
(For a share outstanding throughout each period)
| Year ended January 31 | ||||||||||||||||||||
| SERVICE CLASS | 2020 | 2019 | 2018 | 2017 | 20161 | |||||||||||||||
Net asset value, beginning of period | $1.0006 | $1.0006 | $1.0005 | $1.0000 | $1.00 | |||||||||||||||
Net investment income | 0.0184 | 0.0171 | 0.0079 | 0.0011 | 0.00 | 2 | ||||||||||||||
Net realized and unrealized gains (losses) on investments | 0.0002 | 0.0001 | 0.0001 | 0.0006 | 0.00 | 2 | ||||||||||||||
|
|
|
|
|
|
|
|
|
| |||||||||||
Total from investment operations | 0.0186 | 0.0172 | 0.0080 | 0.0017 | 0.00 | 2 | ||||||||||||||
Distributions to shareholders from | ||||||||||||||||||||
Net investment income | (0.0185 | ) | (0.0172 | ) | (0.0079 | ) | (0.0012 | ) | (0.00 | )2 | ||||||||||
Net realized gains | (0.0000 | )3 | 0.0000 | 0.0000 | 0.0000 | 0.00 | ||||||||||||||
|
|
|
|
|
|
|
|
|
| |||||||||||
Total distributions to shareholders | (0.0185 | ) | (0.0172 | ) | (0.0079 | ) | (0.0012 | ) | (0.00 | )2 | ||||||||||
Net asset value, end of period | $1.0007 | $1.0006 | $1.0006 | $1.0005 | $1.00 | |||||||||||||||
Total return | 1.87 | % | 1.73 | % | 0.80 | % | 0.17 | % | 0.01 | % | ||||||||||
Ratios to average net assets (annualized) | ||||||||||||||||||||
Gross expenses | 0.54 | % | 0.54 | % | 0.55 | % | 0.52 | % | 0.52 | % | ||||||||||
Net expenses | 0.50 | % | 0.50 | % | 0.50 | % | 0.50 | % | 0.28 | % | ||||||||||
Net investment income | 1.88 | % | 1.71 | % | 0.78 | % | 0.08 | % | 0.01 | % | ||||||||||
Supplemental data | ||||||||||||||||||||
Net assets, end of period (000s omitted) | $102,275 | $150,471 | $187,635 | $189,632 | $1,237,014 | |||||||||||||||
| 1 | Amounts reflect the Fund transacting shares at a fixed NAV rounded to two decimal places. Beginning October 11, 2016, the Fund began selling and redeeming shares of the Fund at a floating NAV rounded to the fourth decimal place. |
| 2 | Amount is less than $0.005. |
| 3 | Amount is less than $0.00005. |
The accompanying notes are an integral part of these financial statements.
22 | Institutional Money Market Funds
Table of Contents
1. ORGANIZATION
Wells Fargo Funds Trust (the “Trust”), a Delaware statutory trust organized on March 10, 1999, is an open-end management investment company registered under the Investment Company Act of 1940, as amended (the “1940 Act”). As an investment company, the Trust follows the accounting and reporting guidance in Financial Accounting Standards Board (“FASB”) Accounting Standards Codification Topic 946, Financial Services – Investment Companies. These financial statements report on the Wells Fargo Cash Investment Money Market Fund (the “Fund”) which is a diversified series of the Trust.
The Fund operates as an institutional non-government money market fund. As an institutional non-government money market fund, shareholders will transact at a floating net asset value (NAV) rounded to four decimal places in accordance with the valuation policies below.
Consistent with Rule 2a-7, the Board of Trustees of the Fund is permitted to impose a liquidity fee on redemptions from the Fund or a redemption gate (i.e., a suspension of the right to redeem) in the event that the Fund’s liquidity falls below required minimums because of market conditions or other factors. If the Fund’s weekly liquid assets (as defined in Rule 2a-7(34)) fall below 30% of the Fund’s total assets, the Board of Trustees is permitted, but not required, to: (i) impose a liquidity fee of no more than 2% of the amount redeemed; and/or (ii) impose a redemption gate. If the Fund’s weekly liquid assets fall below 10% of the Fund’s total assets, the Fund must impose, generally as of the beginning of the next business day, a liquidity fee of 1% of the amount redeemed unless the Board of Trustees determines that such a fee is not in the best interest of the Fund or determines that a lower or higher fee (subject to the 2% limit) is in the best interest of the Fund. Liquidity fees reduce the amount a shareholder receives upon redemption of its shares. The Fund retains any liquidity fees for the benefit of remaining shareholders. The Board of Trustees did not impose any liquidity fees and/or redemption gates during the year ended January 31, 2020.
2. SIGNIFICANT ACCOUNTING POLICIES
The following significant accounting policies, which are consistently followed in the preparation of the financial statements of the Fund, are in conformity with U.S. generally accepted accounting principles which require management to make estimates and assumptions that affect the reported amounts of assets and liabilities, disclosure of contingent assets and liabilities at the date of the financial statements, and the reported amounts of revenues and expenses during the reporting period. Actual results could differ from those estimates.
Securities valuation
Debt securities are valued at the evaluated bid price provided by an independent pricing service (e.g. taking into account various factors, including yields, maturities, or credit ratings) or, if a reliable price is not available, the quoted bid price from an independent broker-dealer.
Investments which are not valued using the method discussed above are valued at their fair value, as determined in good faith by the Board of Trustees. The Board of Trustees has established a Valuation Committee comprised of the Trustees and has delegated to it the authority to take any actions regarding the valuation of portfolio securities that the Valuation Committee deems necessary or appropriate, including determining the fair value of portfolio securities, unless the determination has been delegated to the Wells Fargo Asset Management Pricing Committee at Wells Fargo Funds Management, LLC (“Funds Management”). The Board of Trustees retains the authority to make or ratify any valuation decisions or approve any changes to the Valuation Procedures as it deems appropriate. On a quarterly basis, the Board of Trustees receives reports on any valuation actions taken by the Valuation Committee or the Wells Fargo Asset Management Pricing Committee which may include items for ratification.
Repurchase agreements
The Fund may invest in repurchase agreements and may participate in pooled repurchase agreement transactions with other funds advised by Funds Management. Repurchase agreements are agreements where the seller of a security to the Fund agrees to repurchase that security from the Fund at a mutually agreed upon time and price. The repurchase agreements must be fully collateralized based on values that are marked-to-market daily. The collateral may be held by an agent bank under a tri-party agreement. It is the custodian’s responsibility to value collateral daily and to take action to obtain additional collateral as necessary to maintain a market value equal to or greater than the resale price. The repurchase agreements are collateralized by securities issued or guaranteed by the U.S. Government, its agencies or instrumentalities. There could be potential loss to the Fund in the event that the Fund is delayed or prevented from exercising its rights to dispose of the collateral, including the risk of a possible decline in the value of the underlying obligations during the period in which the Fund seeks to assert its rights.
Security transactions and income recognition
Securities transactions are recorded on a trade date basis. Realized gains or losses are recorded on the basis of identified cost.
Institutional Money Market Funds | 23
Table of Contents
Notes to financial statements
Interest income is accrued daily and bond discounts are accreted and premiums are amortized daily. To the extent debt obligations are placed on non-accrual status, any related interest income may be reduced by writing off interest receivables when the collection of all or a portion of interest has been determined to be doubtful based on consistently applied procedures and the fair value has decreased. If the issuer subsequently resumes interest payments or when the collectability of interest is reasonably assured, the debt obligation is removed from non-accrual status.
Distributions to shareholders
Distributions to shareholders from net investment income are declared daily and paid monthly. Distributions from net realized gains, if any, are recorded on the ex-dividend date and paid at least annually. Such distributions are determined in accordance with income tax regulations and may differ from U.S. generally accepted accounting principles. Dividend sources are estimated at the time of declaration. The tax character of distributions is determined as of the Fund’s fiscal year end. Therefore, a portion of the Fund’s distributions made prior to the Fund’s fiscal year end may be categorized as a tax return of capital at year end.
Federal and other taxes
The Fund intends to continue to qualify as a regulated investment company by distributing substantially all of its investment company taxable income and any net realized capital gains (after reduction for capital loss carryforwards) sufficient to relieve it from all, or substantially all, federal income taxes. Accordingly, no provision for federal income taxes was required.
The Fund’s income and federal excise tax returns and all financial records supporting those returns for the prior three fiscal years are subject to examination by the federal and Delaware revenue authorities. Management has analyzed the Fund’s tax positions taken on federal, state, and foreign tax returns for all open tax years and does not believe that there are any uncertain tax positions that require recognition of a tax liability.
As of January 31, 2020, the aggregate cost of all investments for federal income tax purposes was $2,076,330,973 and the unrealized gains (losses) consisted of:
Gross unrealized gains | $ | 322,478 | ||
Gross unrealized losses | (45,623 | ) | ||
Net unrealized gains | $ | 276,855 | ||
Class allocations
The separate classes of shares offered by the Fund differ principally in shareholder servicing and administration fees. Class specific expenses are charged directly to that share class. Investment income, common fund-level expenses, and realized and unrealized gains (losses) on investments are allocated daily to each class of shares based on the relative proportion of net assets of each class.
3. FAIR VALUATION MEASUREMENTS
Fair value measurements of investments are determined within a framework that has established a fair value hierarchy based upon the various data inputs utilized in determining the value of the Fund’s investments. The three-level hierarchy gives the highest priority to unadjusted quoted prices in active markets for identical assets or liabilities (Level 1) and the lowest priority to unobservable inputs (Level 3). The Fund’s investments are classified within the fair value hierarchy based on the lowest level of input that is significant to the fair value measurement. The inputs are summarized into three broad levels as follows:
| ∎ | Level 1 – quoted prices in active markets for identical securities |
| ∎ | Level 2 – other significant observable inputs (including quoted prices for similar securities, interest rates, prepayment speeds, credit risk, etc.) |
| ∎ | Level 3 – significant unobservable inputs (including the Fund’s own assumptions in determining the fair value of investments) |
The inputs or methodologies used for valuing investments in securities are not necessarily an indication of the risk associated with investing in those securities.
24 | Institutional Money Market Funds
Table of Contents
Notes to financial statements
The following is a summary of the inputs used in valuing the Fund’s assets and liabilities as of January 31, 2020:
Quoted prices (Level 1) | Other significant (Level 2) | Significant (Level 3) | Total | |||||||||||||
Assets | ||||||||||||||||
Investments in: | ||||||||||||||||
Certificates of deposit | $ | 0 | $ | 332,386,915 | $ | 0 | $ | 332,386,915 | ||||||||
Commercial paper | 0 | 1,067,017,546 | 0 | 1,067,017,546 | ||||||||||||
Municipal obligations | 0 | 147,355,434 | 0 | 147,355,434 | ||||||||||||
Non-agency mortgage-backed securities | 0 | 4,000,614 | 0 | 4,000,614 | ||||||||||||
Other instruments | 0 | 60,847,319 | 0 | 60,847,319 | ||||||||||||
Other notes | 0 | 19,000,000 | 0 | 19,000,000 | ||||||||||||
Repurchase agreements | 0 | 446,000,000 | 0 | 446,000,000 | ||||||||||||
Total assets | $ | 0 | $ | 2,076,607,828 | $ | 0 | $ | 2,076,607,828 | ||||||||
Additional sector, industry or geographic detail is included in the Portfolio of Investments.
For the year ended January 31, 2020, the Fund did not have any transfers into/out of Level 3.
4. TRANSACTIONS WITH AFFILIATES
Management fee
Funds Management, an indirect wholly owned subsidiary of Wells Fargo & Company (“Wells Fargo”), is the manager of the Fund provides advisory and fund-level administrative services under an investment management agreement. Under the investment management agreement, Funds Management is responsible for, among other services, implementing the investment objectives and strategies of the Fund, supervising the subadvisers and providing fund-level administrative services in connection with the Fund’s operations. As compensation for its services under the investment management agreement, Funds Management is entitled to receive a management fee at the following annual rate based on the Fund’s average daily net assets:
| Average daily net assets | Management fee | |||
First $5 billion | 0.15 | % | ||
Next $5 billion | 0.14 | |||
Over $10 billion | 0.13 | |||
For the year ended January 31, 2020, the management fee was equivalent to an annual rate of 0.15% of the Fund’s average daily net assets.
Funds Management has retained the services of certain subadvisers to provide daily portfolio management to the Fund. The fee for subadvisory services is borne by Funds Management. Wells Capital Management Incorporated, an affiliate of Funds Management and an indirect wholly owned subsidiary of Wells Fargo, is a subadviser to the Fund and is entitled to receive a fee from Funds Management at an annual rate starting at 0.05% and declining to 0.01% as the average daily net assets of the Fund increase. Wells Capital Management Singapore, a separately identifiable department of Wells Fargo Bank, N.A., an affiliate of Funds Management and wholly owned subsidiary of Wells Fargo, is also a subadviser to the Fund and is entitled to receive a fee from Funds Management at an annual rate starting at 0.0025% and declining to 0.0005% as the average daily net assets of the Fund increase.
Institutional Money Market Funds | 25
Table of Contents
Notes to financial statements
Administration fees
Under a class-level administration agreement, Funds Management provides class-level administrative services to the Fund, which includes paying fees and expenses for services provided by the transfer agent, sub-transfer agents, omnibus account servicers and record-keepers. As compensation for its services under the class-level administration agreement, Funds Management receives an annual fee which is calculated based on the average daily net assets of each class as follows:
| Class-level administration fee | ||||
Administrator Class | 0.10 | % | ||
Institutional Class | 0.08 | |||
Select Class | 0.04 | |||
Service Class | 0.12 | |||
Waivers and/or expense reimbursements
Funds Management has contractually waived and/or reimbursed management and administration fees to the extent necessary to maintain certain net operating expense ratios for the Fund. When each class of the Fund has exceeded its expense cap, Funds Management has waived fees and/or reimbursed expenses from fund-level expenses on a proportionate basis and then from class specific expenses. When only certain classes exceed their expense caps, waivers and/or reimbursements are applied against class specific expenses before fund-level expenses. Funds Management has committed through May 31, 2020 to waive fees and/or reimburse expenses to the extent necessary to cap the Fund’s expenses at 0.33% for Administrator Class shares, 0.20% for Institutional Class shares, 0.13% for Select Class shares and 0.50% for Service Class shares. Prior to or after the commitment expiration date, the cap may be increased or the commitment to maintain the cap may be terminated only with the approval of the Board of Trustees.
Shareholder servicing fees
The Trust has entered into contracts with one or more shareholder servicing agents, whereby Service Class of the Fund is charged a fee at an annual rate of 0.25% of its average daily net assets. Administrator Class is charged a fee at an annual rate of 0.10% of its average daily net assets. A portion of these total shareholder servicing fees were paid to affiliates of Wells Fargo.
Interfund transactions
The Fund may purchase or sell portfolio investment securities to certain other Wells Fargo affiliates pursuant to Rule 17a-7 under the 1940 Act and under procedures adopted by the Board of Trustees. The procedures have been designed to ensure that these interfund transactions, which do not incur broker commissions, are effected at current market prices.
5. DISTRIBUTIONS TO SHAREHOLDERS
The tax character of distributions paid was $36,650,741 and $28,696,486 of ordinary income for the years ended January 31, 2020 and January 31, 2019, respectively.
As of January 31, 2020, the components of distributable earnings on a tax basis were as follows:
Undistributed ordinary income | Unrealized gains | |
| $231,544 | $276,855 | |
6. INDEMNIFICATION
Under the Trust’s organizational documents, the officers and Trustees have been granted certain indemnification rights against certain liabilities that may arise out of performance of their duties to the Trust. Additionally, in the normal course of business, the Trust may enter into contracts with service providers that contain a variety of indemnification clauses. The Trust’s maximum exposure under these arrangements is dependent on future claims that may be made against the Fund and, therefore, cannot be estimated.
7. NEW ACCOUNTING PRONOUNCEMENTS
In August 2018, FASB issued Accounting Standards Update (“ASU”) No. 2018-13, Fair Value Measurement (Topic 820)Disclosure Framework—Changes to the Disclosure Requirements for Fair Value Measurement. ASU 2018-13 updates the disclosure
26 | Institutional Money Market Funds
Table of Contents
Notes to financial statements
requirements for fair value measurements by modifying or removing certain disclosures and adding certain new disclosures. The amendments are effective for fiscal years, and interim periods within those fiscal years, beginning after December 15, 2019. Early adoption is permitted. Management has adopted the removal and modification of disclosures early, as permitted, and will adopt the additional new disclosures at the effective date.
In March 2017, FASB issued ASU No. 2017-08,Premium Amortization on Purchased Callable Debt Securities. ASU 2017-08 shortens the amortization period for certain callable debt securities held at a premium and requires the premium to be amortized to the earliest call date. The amendments do not require an accounting change for securities held at a discount and discounts will continue to be accreted to the maturity date of the security. ASU 2017-08 is effective for fiscal years beginning after December 15, 2018 and for interim periods within those fiscal years. During the current reporting period, management of the Fund adopted the change in accounting policy which did not have a material impact to the Fund’s financial statements.
8. SUBSEQUENT EVENT
On March 11, 2020, the World Health Organization announced that it had made the assessment that coronavirus disease 2019(“COVID-19”) is a pandemic. The impacts of COVID-19 is adversely affecting the entire global economy, individual companies and investment products, and the market in general. There is significant uncertainty around the extent and duration of business disruptions related toCOVID-19 and the impact may be short term or may last for an extended period of time. The risk of further spreading ofCOVID-19 has led to significant uncertainty and volatility in the financial markets and the value of the Fund and the securities in which the Fund invests may be adversely affected by impacts caused byCOVID-19. Since fiscal year end, the Fund has seen significant redemptions. The Board and management continue to monitor liquidity in the Fund.
Institutional Money Market Funds | 27
Table of Contents
Report of independent registered public accounting firm
TO THE SHAREHOLDERS OF THE FUND AND BOARD OF TRUSTEES OF WELLS FARGO FUNDS TRUST:
Opinion on the Financial Statements
We have audited the accompanying statement of assets and liabilities of Wells Fargo Cash Investment Money Market Fund (the Fund), one of the funds constituting Wells Fargo Funds Trust, including the portfolio of investments, as of January 31, 2020, the related statement of operations for the year then ended, the statements of changes in net assets for each of the years in the two-year period then ended, and the related notes (collectively, the financial statements) and the financial highlights for each of the years in the five-year period then ended. In our opinion, the financial statements and financial highlights present fairly, in all material respects, the financial position of the Fund as of January 31, 2020, the results of its operations for the year then ended, the changes in its net assets for each of the years in the two-year period then ended, and the financial highlights for each of the years in the five-year period then ended, in conformity with U.S. generally accepted accounting principles.
Basis for Opinion
These financial statements and financial highlights are the responsibility of the Fund’s management. Our responsibility is to express an opinion on these financial statements and financial highlights based on our audits. We are a public accounting firm registered with the Public Company Accounting Oversight Board (United States) (PCAOB) and are required to be independent with respect to the Fund in accordance with the U.S. federal securities laws and the applicable rules and regulations of the Securities and Exchange Commission and the PCAOB.
We conducted our audits in accordance with the standards of the PCAOB. Those standards require that we plan and perform the audit to obtain reasonable assurance about whether the financial statements and financial highlights are free of material misstatement, whether due to error or fraud. Our audits included performing procedures to assess the risks of material misstatement of the financial statements and financial highlights, whether due to error or fraud, and performing procedures that respond to those risks. Such procedures included examining, on a test basis, evidence regarding the amounts and disclosures in the financial statements and financial highlights. Such procedures also included confirmation of securities owned as of January 31, 2020, by correspondence with the custodian and brokers, or by other appropriate auditing procedures. Our audits also included evaluating the accounting principles used and significant estimates made by management, as well as evaluating the overall presentation of the financial statements and financial highlights. We believe that our audits provide a reasonable basis for our opinion.

We have not been able to determine the specific year that we began serving as the auditor of one or more Wells Fargo Funds investment companies; however we are aware that we have served as the auditor of one or more Wells Fargo Funds investment companies since at least 1955.
Boston, Massachusetts
March 31, 2020
28 | Institutional Money Market Funds
Table of Contents
TAX INFORMATION
For the fiscal year ended January 31, 2020, $23,035,565 has been designated as interest-related dividends for nonresident alien shareholders pursuant to Section 871 of the Internal Revenue Code.
For the fiscal year ended January 31, 2020, $18,043 has been designated as short-term capital gain dividends for nonresident alien shareholders pursuant to Section 871 of the Internal Revenue Code.
PROXY VOTING INFORMATION
A description of the policies and procedures used to determine how to vote proxies relating to portfolio securities is available, upon request, by calling1-800-222-8222, visiting our website atwfam.com, or visiting the SEC website at sec.gov. Information regarding how the proxies related to portfolio securities were voted during the most recent 12-month period ended June 30 is available on the website atwfam.comor by visiting the SEC website at sec.gov.
Institutional Money Market Funds | 29
Table of Contents
Other information (unaudited)
BOARD OF TRUSTEES AND OFFICERS
Each of the Trustees and Officers1 listed in the table below acts in identical capacities for each fund in the Wells Fargo family of funds, which consists of 149 mutual funds comprising the Wells Fargo Funds Trust, Wells Fargo Variable Trust, Wells Fargo Master Trust and four closed-end funds (collectively the “Fund Complex”). This table should be read in conjunction with the Prospectus and the Statement of Additional Information2. The mailing address of each Trustee and Officer is 525 Market Street, 12th Floor, San Francisco, CA 94105. Each Trustee and Officer serves an indefinite term, however, each Trustee serves such term until reaching the mandatory retirement age established by the Trustees.
Independent Trustees
Name and year of birth | Position held and length of service* | Principal occupations during past five years or longer | Current other public company or investment company directorships | |||
William R. Ebsworth (Born 1957) | Trustee, since 2015 | Retired. From 1984 to 2013, equities analyst, portfolio manager, research director and chief investment officer at Fidelity Management and Research Company in Boston, Tokyo, and Hong Kong, and retired in 2013 as Chief Investment Officer of Fidelity Strategic Advisers, Inc. where he led a team of investment professionals managing client assets. Prior thereto, Board member of Hong Kong Securities Clearing Co., Hong Kong Options Clearing Corp., the Thailand International Fund, Ltd., Fidelity Investments Life Insurance Company, and Empire Fidelity Investments Life Insurance Company. Audit Committee Chair and Investment Committee Chair of the Vincent Memorial Hospital Endowment (non-profit organization). Mr. Ebsworth is a CFA® charterholder. | N/A | |||
Jane A. Freeman (Born 1953) | Trustee, since 2015; Chair Liaison, since 2018 | Retired. From 2012 to 2014 and 1999 to 2008, Chief Financial Officer of Scientific Learning Corporation. From 2008 to 2012, Ms. Freeman provided consulting services related to strategic business projects. Prior to 1999, Portfolio Manager at Rockefeller & Co. and Scudder, Stevens & Clark. Board member of the Harding Loevner Funds from 1996 to 2014, serving as both Lead Independent Director and chair of the Audit Committee. Board member of the Russell Exchange Traded Funds Trust from 2011 to 2012 and the chair of the Audit Committee. Ms. Freeman is a Board Member of The Ruth Bancroft Garden (non-profit organization). She is also an inactive Chartered Financial Analyst. | N/A | |||
Isaiah Harris, Jr. (Born 1952) | Trustee, since 2009; Audit Committee Chairman, since 2019 | Retired. Chairman of the Board of CIGNA Corporation since 2009, and Director since 2005. From 2003 to 2011, Director of Deluxe Corporation. Prior thereto, President and CEO of BellSouth Advertising and Publishing Corp. from 2005 to 2007, President and CEO of BellSouth Enterprises from 2004 to 2005 and President of BellSouth Consumer Services from 2000 to 2003. Emeritus member of the Iowa State University Foundation Board of Governors. Emeritus Member of the Advisory Board of Iowa State University School of Business. Advisory Board Member, Palm Harbor Academy (private school). Advisory Board Member, Child Evangelism Fellowship (non-profit). Mr. Harris is a certified public accountant (inactive status). | CIGNA Corporation | |||
Judith M. Johnson (Born 1949) | Trustee, since 2008; Audit Committee Chairman, from 2009 to 2018 | Retired. Prior thereto, Chief Executive Officer and Chief Investment Officer of Minneapolis Employees Retirement Fund from 1996 to 2008. Ms. Johnson is an attorney, certified public accountant and a certified managerial accountant. | N/A | |||
30 | Institutional Money Market Funds
Table of Contents
Other information (unaudited)
Name and year of birth | Position held and length of service* | Principal occupations during past five years or longer | Current other public company or investment company directorships | |||
David F. Larcker (Born 1950) | Trustee, since 2009 | James Irvin Miller Professor of Accounting at the Graduate School of Business, Stanford University, Director of the Corporate Governance Research Initiative and Senior Faculty of The Rock Center for Corporate Governance since 2006. From 2005 to 2008, Professor of Accounting at the Graduate School of Business, Stanford University. Prior thereto, Ernst & Young Professor of Accounting at The Wharton School, University of Pennsylvania from 1985 to 2005. | N/A | |||
Olivia S. Mitchell (Born 1953) | Trustee, since 2006; Nominating and Governance Committee Chair, since 2018 | International Foundation of Employee Benefit Plans Professor, Wharton School of the University of Pennsylvania since 1993. Director of Wharton’s Pension Research Council and Boettner Center on Pensions & Retirement Research, and Research Associate at the National Bureau of Economic Research. Previously, Cornell University Professor from 1978 to 1993. | N/A | |||
Timothy J. Penny (Born 1951) | Trustee, since 1996; Chairman, since 2018 | President and Chief Executive Officer of Southern Minnesota Initiative Foundation, a non-profit organization, since 2007. Member of the Board of Trustees of NorthStar Education Finance, Inc., a non-profit organization, since 2007. | N/A | |||
James G. Polisson (Born 1959) | Trustee, since 2018 | Retired. Chief Marketing Officer, Source (ETF) UK Services, Ltd, from 2015 to 2017. From 2012 to 2015, Principal of The Polisson Group, LLC, a management consulting, corporate advisory and principal investing company. Chief Executive Officer and Managing Director at Russell Investments, Global Exchange Traded Funds from 2010 to 2012. Managing Director of Barclays Global Investors from 1998 to 2010 and Global Chief Marketing Officer for iShares and Barclays Global Investors from 2000 to 2010. Trustee of the San Francisco Mechanics’ Institute, a non-profit organization, from 2013 to 2015. Board member of the Russell Exchange Traded Fund Trust from 2011 to 2012. Director of Barclays Global Investors Holdings Deutschland GmbH from 2006 to 2009. Mr. Polisson is an attorney and has a retired status with the Massachusetts and District of Columbia Bar Associations. | N/A | |||
Pamela Wheelock3 (Born 1959) | Trustee, since January 2020; previously Trustee from January 2018 to July 2019 | Board member of the Destination Medical Center Economic Development Agency, Rochester, Minnesota since 2019. Acting Commissioner, Minnesota Department of Human Services, July 2019 through September 2019. Human Services Manager (part-time), Minnesota Department of Human Services, October 2019 through December 2019. Chief Operating Officer, Twin Cities Habitat for Humanity from 2017 to 2019. Vice President of University Services, University of Minnesota from 2012 to 2016. Prior thereto, on the Board of Directors, Governance Committee and Finance Committee for the Minnesota Philanthropy Partners (Saint Paul Foundation) from 2012 to 2018, Interim Chief Executive Officer of Blue Cross Blue Shield of Minnesota from 2011 to 2012, Chairman of the Board from 2009 to 2012 and Board Director from 2003 to 2015. Vice President, Leadership and Community Engagement, Bush Foundation, Saint Paul, Minnesota (a private foundation) from 2009 to 2011. Executive Vice President and Chief Financial Officer, Minnesota Sports and Entertainment from 2004 to 2009 and Senior Vice President from 2002 to 2004. Executive Vice President of the Minnesota Wild Foundation from 2004 to 2008. Commissioner of Finance, State of Minnesota, from 1999 to 2002. Currently Board Chair of the Minnesota Wild Foundation since 2010. | N/A | |||
| * | Length of service dates reflect the Trustee’s commencement of service with the Trust’s predecessor entities, where applicable. |
Institutional Money Market Funds | 31
Table of Contents
Other information (unaudited)
Officers
Name and year of birth | Position held and length of service | Principal occupations during past five years or longer | ||
Andrew Owen (Born 1960) | President, since 2017 | Executive Vice President of Wells Fargo & Company and Head of Affiliated Managers, Wells Fargo Asset Management, since 2014. In addition, Mr. Owen is currently President, Chief Executive Officer and Director of Wells Fargo Funds Management, LLC since 2017. Prior thereto, Executive Vice President responsible for marketing, investments and product development for Wells Fargo Funds Management, LLC, from 2009 to 2014. | ||
Nancy Wiser1 (Born 1967) | Treasurer, since 2012 | Executive Vice President of Wells Fargo Funds Management, LLC since 2011. Chief Operating Officer and Chief Compliance Officer at LightBox Capital Management LLC, from 2008 to 2011. | ||
Michelle Rhee (Born 1966) | Chief Legal Officer, since 2019 | Secretary of Wells Fargo Funds Management, LLC, Chief Legal Counsel of Wells Fargo Asset Management and Assistant General Counsel of Wells Fargo Bank, N.A. since 2018. Associate General Counsel and Managing Director of Bank of America Corporation from 2004 to 2018. | ||
| Catherine Kennedy (Born 1969) | Secretary, since 2019 | Vice President of Wells Fargo Funds Management, LLC and Senior Counsel of the Wells Fargo Legal Department since 2010. Vice President and Senior Counsel of Evergreen Investment Management Company, LLC from 1998 to 2010. | ||
| Michael H. Whitaker (Born 1967) | Chief Compliance Officer, since 2016 | Chief Compliance Officer of Wells Fargo Asset Management since 2016. Senior Vice President and Chief Compliance Officer for Fidelity Investments from 2007 to 2016. | ||
David Berardi (Born 1975) | Assistant Treasurer, since 2009 | Vice President of Wells Fargo Funds Management, LLC since 2009. Vice President of Evergreen Investment Management Company, LLC from 2008 to 2010. Manager of Fund Reporting and Control for Evergreen Investment Management Company, LLC from 2004 to 2010. | ||
| Jeremy DePalma1 (Born 1974) | Assistant Treasurer, since 2009 | Senior Vice President of Wells Fargo Funds Management, LLC since 2009. Senior Vice President of Evergreen Investment Management Company, LLC from 2008 to 2010 and head of the Fund Reporting and Control Team within Fund Administration from 2005 to 2010. | ||
| 1 | Nancy Wiser acts as Treasurer of 64 funds in the Fund Complex. Jeremy DePalma acts as Treasurer of 85 funds and Assistant Treasurer of 64 funds in the Fund Complex. |
| 2 | The Statement of Additional Information includes additional information about the Trustees and is available, without charge, upon request, by calling1-800-222-8222 or by visiting the website atwfam.com. |
| 3 | Pamela Wheelock was re-appointed to the Board effective January 1, 2020. |
32 | Institutional Money Market Funds
Table of Contents
For more information
More information about Wells Fargo Funds is available free upon request. To obtain literature, please write, visit the Fund’s website, or call:
Wells Fargo Funds
P.O. Box 219967
Kansas City, MO 64121-9967
Website:wfam.com
Individual investors:1-800-222-8222
Retail investment professionals:1-888-877-9275
Institutional investment professionals:1-866-765-0778

This report and the financial statements contained herein are submitted for the general information of the shareholders of the Fund. If this report is used for promotional purposes, distribution of the report must be accompanied or preceded by a current prospectus. Before investing, please consider the investment objectives, risks, charges, and expenses of the investment. For a current prospectus and, if available, a summary prospectus, containing this information, call1-800-260-5969 or visit the Fund’s website atwfam.com. Read the prospectus carefully before you invest or send money.
Wells Fargo Asset Management (WFAM) is the trade name for certain investment advisory/management firms owned by Wells Fargo & Company. These firms include but are not limited to Wells Capital Management Incorporated and Wells Fargo Funds Management, LLC. Certain products managed by WFAM entities are distributed by Wells Fargo Funds Distributor, LLC (a broker-dealer and Member FINRA).
This material is for general informational and educational purposes only and is NOT intended to provide investment advice or a recommendation of any kind—including a recommendation for any specific investment, strategy, or plan.
INVESTMENT PRODUCTS: NOT FDIC INSURED ◾ NO BANK GUARANTEE ◾ MAY LOSE VALUE
© 2020 Wells Fargo & Company. All rights reserved
PAR-0220-03780 03-20
A302/AR302 01-20
Table of Contents

Annual Report
January 31, 2020
Government Money Market Funds
| ∎ | Wells Fargo Government Money Market Fund |
Beginning on January 1, 2021, as permitted by new regulations adopted by the Securities and Exchange Commission, paper copies of the Wells Fargo Funds’ annual and semi-annual shareholder reports issued after this date will no longer be sent by mail, unless you specifically request paper copies of the reports. Instead, the reports will be made available on the Funds’ website, and you will be notified by mail each time a report is posted and provided with a website address to access the report.
If you already elected to receive shareholder reports electronically, you will not be affected by this change and you need not take any action. You may elect to receive shareholder reports and other communications from the Fund electronically at any time by contacting your financial intermediary (such as a broker-dealer or bank) or, if you are a direct investor, by calling1-800-222-8222 or by enrolling at wellsfargo.com/advantagedelivery.
You may elect to receive all future reports in paper free of charge. If you invest through a financial intermediary, you can contact your financial intermediary to request that you continue to receive paper copies of your shareholder reports; if you invest directly with the Fund, you can call 1-800-222-8222. Your election to receive reports in paper will apply to all Wells Fargo Funds held in your account with your financial intermediary or, if you are a direct investor, to all Wells Fargo Funds that you hold.
Table of Contents
|
Reduce clutter. Save trees. |
Sign up for electronic delivery of prospectuses and shareholder reports atwellsfargo.com/advantagedelivery |
The views expressed and any forward-looking statements are as of January 31, 2020, unless otherwise noted, and are those of the Fund managers and/or Wells Fargo Asset Management. Discussions of individual securities, or the markets generally, or any Wells Fargo Fund are not intended as individual recommendations. Future events or results may vary significantly from those expressed in any forward-looking statements. The views expressed are subject to change at any time in response to changing circumstances in the market. Wells Fargo Asset Management and the Fund disclaim any obligation to publicly update or revise any views expressed or forward-looking statements.
INVESTMENT PRODUCTS: NOT FDIC INSURED ◾ NO BANK GUARANTEE ◾ MAY LOSE VALUE
Government Money Market Funds | 1
Table of Contents
Letter to shareholders (unaudited)

Andrew Owen
President
Wells Fargo Funds
Dear Shareholder:
We are pleased to offer you this annual report for the Wells Fargo Government Money Market Fund for the12-month period that ended January 31, 2020. Despite some periods of market volatility, the year was strongly positive for financial markets as supportive central banks more than offset concerns over slowing global economic growth and international trade tensions.
Overall, both fixed-income and equity investors enjoyed healthy annual returns, with U.S. markets leading the way. For the period, U.S. stocks, based on the S&P 500 Index,1 gained 21.68% and international stocks, as measured by the MSCI ACWI ex USA Index (Net),2 returned 9.94%. The MSCI EM Index (Net)3 gained a more modest 3.81%. For bond investors, the Bloomberg Barclays U.S. Aggregate Bond Index4 added 9.64%, the Bloomberg Barclays Global Aggregateex-USD Index5 returned 3.95%, the Bloomberg Barclays Municipal Bond Index6 gained 8.65%, and the ICE BofA U.S. High Yield Index7 added 9.39%.
The year began with a strong market rebound.
Financial markets opened 2019 on a positive note, as investors were encouraged by the U.S. Federal Reserve (Fed) taking a more accommodative stance after a series of increases to the federal funds rate in 2017 and 2018. However, concerns over slowing global growth grew more ominous. Fourth-quarter 2018 gross domestic product (GDP), reported in February 2019, grew at an annualized 2.2% rate, down from the levels of the prior two quarters. The Bank of England forecast the slowest growth since the financial crisis for 2019. China and the U.S. continued to wrangle over trade issues. By the end of the first quarter of 2019, more accommodative Fed sentiment and steady, if not spectacular, U.S. economic and business metrics encouraged domestic investors.
Early second-quarter 2019 enthusiasm among investors faded.
During April, sustained low inflation, solid employment data, and first-quarter U.S. GDP of an annualized rate of 3.2% supported favorable sentiment. During May, however, markets tumbled on mixed investment signals. In the U.S., partisan political wrangling ramped up in advance of the 2020 election. The U.K.’s Brexit disagreements caused Prime Minister Theresa May to resign. Boris Johnson succeeded her, only to add to uncertainty about Brexit’s resolution ahead of an October 2019 deadline. The European Commission downgraded the 2019 growth forecast to 1.2%. The U.S. increased tariffs on
| 1 | The S&P 500 Index consists of 500 stocks chosen for market size, liquidity, and industry group representation. It is a market-value-weighted index with each stock’s weight in the index proportionate to its market value. You cannot invest directly in an index. |
| 2 | The Morgan Stanley Capital International (MSCI) All Country World Index (ACWI) ex USA Index (Net) is a free-float-adjusted market-capitalization-weighted index that is designed to measure the equity market performance of developed markets, excluding the United States. Source: MSCI. MSCI makes no express or implied warranties or representations and shall have no liability whatsoever with respect to any MSCI data contained herein. The MSCI data may not be further redistributed or used as a basis for other indices or any securities or financial products. This report is not approved, reviewed, or produced by MSCI. You cannot invest directly in an index. |
| 3 | The MSCI Emerging Markets (EM) Index (Net) is a free-float-adjusted market-capitalization-weighted index that is designed to measure equity market performance of emerging markets. You cannot invest directly in an index. |
| 4 | The Bloomberg Barclays U.S. Aggregate Bond Index is a broad-based benchmark that measures the investment-grade, U.S. dollar-denominated, fixed-rate taxable bond market, including Treasuries, government-related and corporate securities, mortgage-backed securities (agency fixed-rate and hybrid adjustable-rate mortgage pass-throughs), asset-backed securities, and commercial mortgage-backed securities. You cannot invest directly in an index. |
| 5 | The Bloomberg Barclays Global Aggregateex-USD Index is an unmanaged index that provides a broad-based measure of the global investment-grade fixed-income markets excluding the U.S. dollar-denominated debt market. You cannot invest directly in an index. |
| 6 | The Bloomberg Barclays Municipal Bond Index is an unmanaged index composed of long-termtax-exempt bonds with a minimum credit rating of Baa. You cannot invest directly in an index. |
| 7 | The ICE BofA U.S. High Yield Index is a market-capitalization-weighted index of domestic and Yankee high-yield bonds. The index tracks the performance of high-yield securities traded in the U.S. bond market. You cannot invest directly in an index. Copyright 2020. ICE Data Indices, LLC. All rights reserved. |
2 | Government Money Market Funds
Table of Contents
Letter to shareholders (unaudited)
products from China, China responded, and then talks broke down. President Donald Trump threatened to turn his foreign policy tariff tool to Mexico over immigration issues.
Midway through the year, investors regrouped, sentiment turned positive, and U.S. equity markets advanced during June and July. The gains, primarily driven by geopolitical and monetary policy events, pushed equity markets to new highs. European Central Bank President Mario Draghi indicated the bank was ready to cut rates or buy more assets to prop up inflation if needed. President Trump backed off of tariff threats against Mexico and China. In the U.S., the Fed implemented a 0.25% federal funds rate cut in July.
Later in July, the U.S. reversed course and threatened to impose higher tariffs on China’s exports after talks failed. China responded with tariff threats of its own and devalued the renminbi, roiling global markets. Major U.S. stock market indices closed July with the worst weekly results of the year. Bond prices gained as Treasury yields fell to multiyear lows, and the yield curve inverted at multiple points along the30-year arc.
In August, U.S.-China trade tensions continued with no signs of compromise. Evidence of a continued global economic slowdown mounted, and central banks in China, New Zealand, and Thailand cut interest rates. Industrial and manufacturing data declined in China, Canada, Japan, and Germany. Adding to global uncertainty, Italy’s prime minister resigned, many feared a crackdown in Hong Kong as protestors sustained their calls for reform, and Boris Johnson planned to suspend Parliament as Brexit’s deadline neared.
In the U.S., the Fed cut interest rates a second time in September. U.S. manufacturing data disappointed investors. The U.S. Congress announced it would pursue an impeachment investigation of President Trump. Meanwhile, the Brexit impasse showed no signs of resolution. Officials in China said that hitting the country’s economic growth goals for the year would be difficult considering the weight of tariffs and trade restrictions. Although the S&P 500 Index finished the third quarter with the bestyear-to-date returns in more than 20 years, concerns about future returns remained.
The fourth quarter started on a strong note, with U.S.-China trade tensions relaxing in October along with renewed optimism for a U.K. Brexit deal and positive macroeconomic data. The initial estimate of U.S. third-quarter GDP growth was a resilient 1.9% annualized rate, while the U.S. unemployment rate fell to a50-year low of 3.5% in September. However, despite resilience among U.S. consumers, business confidence declined while manufacturing activity contracted. Concerned with a potential economic slowdown, the Fed lowered interest rates another quarter point in late October, its third rate cut in four months. This helped push the S&P 500 Index to a newall-time high, while emerging market equities rallied and global bonds declined overall, reflecting a broad pickup in risk appetite.
Equity markets continued to rally in November despite ongoing geopolitical risks. Hopes for a U.S.-China trade deal buoyed investor confidence. U.S. business sentiment improved slightly, and manufacturing and services activity picked up. Throughout the month, central bank actions were on hold. With that positive backdrop, developed market equities outpaced those in emerging markets, and U.S. stocks, as reflected by the S&P 500 Index, outperformednon-U.S. stocks overall. While consumer confidence and purchasing manager activity rose in the eurozone, China reported weakening manufacturing and consumer data. Bond yields rose marginally, leading to slightly negative returns for global government and investment-grade corporate bonds.
Financial markets ended 2019 on a broadly positive note, with the U.S. and China reaching an accord on a Phase One trade deal, with some details to be worked out. That, along with the landslide win by thepro-Brexit U.K. Conservative Party in a national election and ongoing central bank support, gave investors greater certainty and confidence. U.S. economic indicators were generally positive, with the exception of manufacturing activity and business confidence. However, consumer confidence was resilient, fed by a robust labor market, tame inflation, and lower interest rates, which boosted housing affordability and stimulated homebuyer activity. The impeachment of U.S. President Donald Trump, while
“Midway through the year, investors regrouped, sentiment turned positive, and U.S. equity markets advanced.”
“Financial markets ended 2019 on a broadly positive note, with the U.S. and China reaching an accord on a Phase One trade deal.”
Government Money Market Funds | 3
Table of Contents
Letter to shareholders (unaudited)
historically noteworthy, had little impact on markets. Meanwhile, slowing Chinese economic activity, partly attributable to the trade war, led to further government stimulus at year-end through lower reserve ratios, allowing banks to lend more money.
Theyear-end rally continued in early January 2020. However, capital market volatility picked up in late January on concerns over the unknown impact of the coronavirus on the global economy and stock markets. With sentiment somewhat souring, perceived safe havens did well in January. The U.S. dollar and Japanese yen both rose and government bonds outperformed equities. While the S&P 500 Index held its ground, emerging market equities tumbled, including those in Asia, that are most exposed to viruses—physical or economic—originating in China.
Following the end of the reporting period, the coronavirus continued its global spread, resulting in disruptions to global markets, including through border closings, restrictions on travel and large gatherings, expedited and enhanced health screenings, quarantines, cancellations, business and school closings, disruptions to employment and supply chains, reduced productivity, and reduced customer and client activity in multiple markets and sectors. The risk of further spreading of the coronavirus has led to significant uncertainty and volatility in the financial markets. The full extent of the coronavirus’s impact on the global economy cannot necessarily be foreseen and the impacts may be short term or may last for an extended period of time.
Don’t let short-term uncertainty derail long-term investment goals.
Periods of investment uncertainty can present challenges, but experience has taught us that maintaining long-term investment goals can be an effective way to plan for the future. To help you create a sound strategy based on your personal goals and risk tolerance, Wells Fargo Funds offers more than 100 mutual funds spanning a wide range of asset classes and investment styles. Although diversification cannot guarantee an investment profit or prevent losses, we believe it can be an effective way to manage investment risk and potentially smooth out overall portfolio performance. We encourage investors to know their investments and to understand that appropriate levels of risk-taking may unlock opportunities.
Thank you for choosing to invest with Wells Fargo Funds. We appreciate your confidence in us and remain committed to helping you meet your financial needs.
Sincerely,

Andrew Owen
President
Wells Fargo Funds
|
For further information about your Fund, contact your investment professional, visit our website at wfam.com,or call us directly at1-800-222-8222. |
4 | Government Money Market Funds
Table of Contents
This page is intentionally left blank.
Table of Contents
Performance highlights (unaudited)
Investment objective
The Fund seeks current income, while preserving capital and liquidity.
Manager
Wells Fargo Funds Management, LLC
Subadviser
Wells Capital Management Incorporated
Portfolio managers
Michael C. Bird, CFA®‡
Jeffrey L. Weaver, CFA®‡
Laurie White
Average annual total returns (%) as of January 31, 2020
| Expense ratios1 (%) | ||||||||||||||||||||||
| Inception date | 1 year | 5 year | 10 year | Gross | Net2 | |||||||||||||||||
| Class A (WFGXX) | 11-8-1999 | 1.59 | 0.67 | 0.34 | 0.61 | 0.60 | ||||||||||||||||
| Administrator Class (WGAXX) | 7-31-2003 | 1.85 | 0.85 | 0.43 | 0.34 | 0.34 | ||||||||||||||||
| Institutional Class (GVIXX) | 7-28-2003 | 1.99 | 0.96 | 0.49 | 0.22 | 0.20 | ||||||||||||||||
| Select Class (WFFXX)3 | 6-30-2015 | 2.05 | 1.02 | 0.51 | 0.18 | 0.14 | ||||||||||||||||
| Service Class (NWGXX) | 11-16-1987 | 1.69 | 0.74 | 0.37 | 0.51 | 0.50 | ||||||||||||||||
Yield summary (%) as of January 31, 20202
| Class A | Administrator Class | Institutional Class | Select Class | Service Class | ||||||||||||||
| 7-day current yield | 1.05 | 1.31 | 1.45 | 1.51 | 1.15 | |||||||||||||
| 7-day compound yield | 1.05 | 1.32 | 1.46 | 1.52 | 1.15 | |||||||||||||
| 30-day simple yield | 1.06 | 1.32 | 1.46 | 1.52 | 1.16 | |||||||||||||
| 30-day compound yield | 1.06 | 1.33 | 1.47 | 1.53 | 1.16 | |||||||||||||
Figures quoted represent past performance, which is no guarantee of future results, and do not reflect taxes that shareholder may pay on an investment in a fund. Investment returns will fluctuate. The Fund’s yield figures more closely reflect the current earnings of the Fund than the total return figures. Current performance may be lower or higher than the performance data quoted, which assumes the reinvestment of dividends and capital gains. Currentmonth-end performance is available on the Fund’s website,wfam.com.
Money market funds are sold without a front-end sales charge or contingent deferred sales charge. Other fees and expenses apply to an investment in the Fund and are described in the Fund’s current prospectus.
For government money market funds: You could lose money by investing in the Fund. Although the Fund seeks to preserve the value of your investment at $1.00 per share, it cannot guarantee it will do so. An investment in the Fund is not insured or guaranteed by the Federal Deposit Insurance Corporation or any other government agency. The Fund’s sponsor has no legal obligation to provide financial support to the Fund, and you should not expect that the sponsor will provide financial support to the Fund at any time.
Please see footnotes on page 7.
6 | Government Money Market Funds
Table of Contents
Performance highlights (unaudited)
| Portfolio composition as of January 31, 20204 |
|
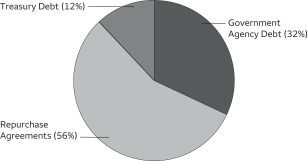
| Effective maturity distribution as of January 31, 20204 |
|
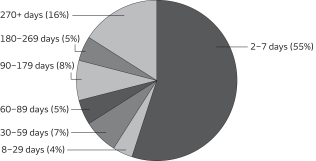
| Weighted average maturity as of January 31, 20205 | ||||
27 days | ||||
| Weighted average life as of January 31, 20206 | ||||
101 days | ||||
| ‡ | CFA® and Chartered Financial Analyst®are trademarks owned by CFA Institute. |
| 1 | Reflects the expense ratios as stated in the most recent prospectuses. The expense ratios shown are subject to change and may differ from the annualized expense ratios shown in the financial highlights of this report. |
| 2 | The manager has contractually committed through May 31, 2020, to waive fees and/or reimburse expenses to the extent necessary to cap total annual fund operating expenses after fee waivers at 0.60% for Class A, 0.34% for Administrator Class, 0.20% for Institutional Class, 0.14% for Select Class, and 0.50% for Service Class. Brokerage commissions, stamp duty fees, interest, taxes, acquired fund fees and expenses (if any), and extraordinary expenses are excluded from the expense cap. Prior to or after the commitment expiration date, the cap may be increased or the commitment to maintain the cap may be terminated only with the approval of the Board of Trustees. Without this cap, the Fund’s returns would have been lower. Without waived fees and/or reimbursed expenses, the Fund’s7-day current yield would have been 1.04%, 1.31%, 1.43%, 1.47%, and 1.14% for Class A, Administrator Class, Institutional Class, Select Class, and Service Class, respectively. The expense ratio paid by an investor is the net expense ratio (the total annual fund operating expenses after fee waivers) as stated in the prospectuses. |
| 3 | Historical performance shown for the Select Class shares prior to their inception reflects the performance of the Institutional Class shares, and includes the higher expenses applicable to Institutional Class shares. If these expenses had not been included, returns for Select Class shares would be higher. |
| 4 | Amounts are calculated based on the total investments of the Fund. These amounts are subject to change and may have changed since the date specified. |
| 5 | Weighted Average Maturity (WAM): WAM is an average of the effective maturities of all securities held in the portfolio, weighted by each security’s percentage of total investments. The maturity of a portfolio security is the period remaining until the date on which the principal amount is unconditionally required to be paid, or in the case of a security called for redemption, the date on which the redemption payment is unconditionally required to be made. WAM calculations allow for the maturities of certain securities with demand features or periodic interest rate resets to be shortened. WAM is a way to measure a fund’s sensitivity to potential interest rate changes. WAM is subject to change and may have changed since the date specified. |
| 6 | Weighted Average Life (WAL): WAL is an average of the final maturities of all securities held in the portfolio, weighted by their percentage of total investments. The maturity of a portfolio security is the period remaining until the date on which the principal amount is unconditionally required to be paid, or in the case of a security called for redemption, the date on which the redemption payment is unconditionally required to be made. In contrast to WAM, the calculation of WAL allows for the maturities of certain securities with demand features to be shortened, but not the periodic interest rate resets. WAL is a way to measure a fund’s potential sensitivity to credit spread changes. WAL is subject to change and may have changed since the date specified. |
| 7 | The Core Personal Consumption Expenditures (PCE) Price Index measures the prices paid by U.S. consumers for domestic goods and services, excluding the prices of food and energy. You cannot invest directly into an index. |
Government Money Market Funds | 7
Table of Contents
Performance highlights (unaudited)
MANAGER’S DISCUSSION
The Fund’s fiscal year that ended January 31, 2020, saw the U.S. Federal Reserve (Fed) end the monetary policy normalization actions it had taken over the past several years, which included both raising interest rates and reducing the size of its balance sheet. The fiscal year began with the Fed targeting the range on the federal funds rate at 2.25% to 2.50%. Despite a generally steady domestic economy, with the drag from a slowing factory sector offset by continued solid consumer activity, the Fed sought to counter the economic risks from trade disputes, slowing global growth, and sluggish U.S. manufacturing by lowering its interest rate target three times—in July, September, and October—by 0.25% each. The resulting federal funds target rate at the end of the fiscal year was 1.50% to 1.75%.
In addition to cutting interest rates, the Fed also reversed course on its balance sheet policy. Since 2017, it had shrunk its balance sheet by systematically allowing a portion of the U.S. Treasury and mortgage-backed securities it acquired during its quantitative easing programs to mature without being reinvested, thereby effectively unwinding the policies it used to assist the economy’s recovery from the financial crisis. The Fed abruptly halted this gradual asset reduction by once again reinvesting all of its maturing investments concurrent with its first interest rate cut in July 2019. Later, in October, the Fed completed the reversal by once again expanding its balance sheet, this time by buying $60 billion of Treasury bills(T-bills) per month with the goal of expanding the banking system’s reserves.
During the year, the U.S. economy grew solidly, with gross domestic product clocking in at an average rate of approximately 2.3% on an annualized basis, only modestly slower than the 2.5% rate posted the prior year. Employment remained strong, with the unemployment rate ending the fiscal year at 3.6%, down from 4.0% a year earlier. In addition, the underemployment rate, which includes workers marginally attached to the labor force and those working part time for economic reasons, fell even further, from 8.0% to 6.9% over the same period. Both measures were at or near50-year lows. Price inflation, however, remains stubbornly below the Fed’s 2% target: After ending the prior fiscal year at 1.8%, the Core PCE Price Index7 deflator, the Fed’s preferred price measure, fell to 1.6% at the end of this fiscal year.
Interest rates on all categories of government money market securities moved lower throughout the year, consistent with the Fed’s moves. In February 2019, the3-monthT-bill yields averaged 2.42%. During January 2020, the last month of the fiscal year, they averaged 1.54%. For the entire fiscal year, the average was 2.01%, down from an average of 2.04% for the prior fiscal year. Similarly, average6-monthT-bill yields were 2.49% in February 2019; 1.55% in January 2020; and 2.01% on average for the whole fiscal year, down from an average of 2.21% in the previous fiscal year. The lower yields onT-bills were due not only to the Fed’s interest rate cuts but also to the Fed’s reserves management purchases of $60 billion per month discussed above. Similarly, yields on government-sponsored enterprise (GSE) securities moved lower in lockstep withT-bills throughout the year.
The yields on repurchase agreements (repos) generally followed the same path and were also heavily influenced by the Fed’s decisions. Overnight Treasury repo rates, as measured by the Fed’s Overnight Treasury repo rates averaged 2.38% in February 2019 and 1.52% in January 2020. For the entire fiscal year, the average Treasury repo yield was 2.10%, up from 1.92% for the previous fiscal year. In addition to being affected by the Fed’s interest rate cuts, repo yields were also affected by the Fed’s balance sheet actions, as discussed above. As a consequence of the Fed shrinking its balance sheet, banking system reserves also fell, which eventually pushed repo rates higher, culminating in a sharp move higher that saw the Overnight Treasury repo rates peak at 5.25% on September 17, 2019. To maintain control of interest rates and prevent a similar move higher, the Fed added cash to the repo market directly in the form of temporary open market operations while methodically adding permanent reserves by buyingT-bills at a rate of $60 billion per month. These actions have succeeded, as repo rates have been well contained near the bottom of the Fed’s target range.
Our investment strategy continued to emphasize maintaining both a stable $1.00 net asset value and adequate liquidity to meet shareholder redemptions. Accordingly, we invested inT-bills; U.S. Treasury notes; GSE discount notes; and other securities, including floating-rate notes and repos collateralized by Treasury securities and GSE obligations.
Strategic outlook
The economy has continued its solid performance, with a consistently strong labor market and stable—but still below target—inflation. After its third, and last, interest rate reduction of the year in October 2019, the Fed signaled that it intended to keep rates unchanged barring a material change in its outlook. A weaker economy may lead to further cuts, but a stronger economy alone will not necessarily cause higher rates unless it is accompanied by consistently strong inflation. Just as the fiscal year ended, in February and March 2020, the coronavirus began to spread globally, prompting consumers, businesses, and
Please see footnotes on page 7.
8 | Government Money Market Funds
Table of Contents
Performance highlights (unaudited)
governments to take unusually strong actions in an attempt to limit its impact. In so doing, it appears that there could be a serious toll on the U.S. and global economy. Anticipating this, financial markets experienced a sharp spike in volatility, prompting a series of supportive actions by the Fed. In the face of all this, we continue to believe that our investment strategy, with its focus on capital preservation and liquidity, is as important as ever.
Government Money Market Funds | 9
Table of Contents
As a shareholder of the Fund, you incur ongoing costs, including management fees, distribution(12b-1) and/or shareholder servicing fees, and other Fund expenses. This example is intended to help you understand your ongoing costs (in dollars) of investing in the Fund and to compare these costs with the ongoing costs of investing in other mutual funds.
The example is based on an investment of $1,000 invested at the beginning of thesix-month period and held for the entire period from August 1, 2019 to January 31, 2020.
Actual expenses
The “Actual” line of the table below provides information about actual account values and actual expenses. You may use the information in this line, together with the amount you invested, to estimate the expenses that you paid over the period. Simply divide your account value by $1,000 (for example, an $8,600 account value divided by $1,000 = 8.6), then multiply the result by the number in the “Actual” line under the heading entitled “Expenses paid during period” for your applicable class of shares to estimate the expenses you paid on your account during this period.
Hypothetical example for comparison purposes
The “Hypothetical” line of the table below provides information about hypothetical account values and hypothetical expenses based on the Fund’s actual expense ratio and an assumed rate of return of 5% per year before expenses, which is not the Fund’s actual return. The hypothetical account values and expenses may not be used to estimate the actual ending account balance or expenses you paid for the period. You may use this information to compare the ongoing costs of investing in the Fund and other funds. To do so, compare this 5% hypothetical example with the 5% hypothetical examples that appear in the shareholder reports of the other funds.
Please note that the expenses shown in the table are meant to highlight your ongoing costs only. Therefore, the “Hypothetical” line of the table is useful in comparing ongoing costs only and will not help you determine the relative total costs of owning different funds.
| Beginning account value 8-1-2019 | Ending account value 1-31-2020 | Expenses paid during the period1 | Annualized net expense ratio | |||||||||||||
Class A | ||||||||||||||||
Actual | $ | 1,000.00 | $ | 1,006.53 | $ | 3.03 | 0.60 | % | ||||||||
Hypothetical (5% return before expenses) | $ | 1,000.00 | $ | 1,022.12 | $ | 3.05 | 0.60 | % | ||||||||
Administrator Class | ||||||||||||||||
Actual | $ | 1,000.00 | $ | 1,007.87 | $ | 1.72 | 0.34 | % | ||||||||
Hypothetical (5% return before expenses) | $ | 1,000.00 | $ | 1,023.43 | $ | 1.73 | 0.34 | % | ||||||||
Institutional Class | ||||||||||||||||
Actual | $ | 1,000.00 | $ | 1,008.56 | $ | 1.01 | 0.20 | % | ||||||||
Hypothetical (5% return before expenses) | $ | 1,000.00 | $ | 1,024.13 | $ | 1.02 | 0.20 | % | ||||||||
Select Class | ||||||||||||||||
Actual | $ | 1,000.00 | $ | 1,008.87 | $ | 0.71 | 0.14 | % | ||||||||
Hypothetical (5% return before expenses) | $ | 1,000.00 | $ | 1,024.43 | $ | 0.71 | 0.14 | % | ||||||||
Service Class | ||||||||||||||||
Actual | $ | 1,000.00 | $ | 1,007.04 | $ | 2.52 | 0.50 | % | ||||||||
Hypothetical (5% return before expenses) | $ | 1,000.00 | $ | 1,022.62 | $ | 2.54 | 0.50 | % | ||||||||
| 1 | Expenses paid is equal to the annualized net expense ratio of each class multiplied by the average account value over the period, multiplied by the number of days in the most recent fiscal half-year divided by the number of days in the fiscal year (to reflect theone-half-year period). |
10 | Government Money Market Funds
Table of Contents
Portfolio of investments—January 31, 2020
| Interest rate | Maturity date | Principal | Value | |||||||||||||
| Government Agency Debt: 31.75% | ||||||||||||||||
FFCB (1 Month LIBOR +0.03%)± | 1.69 | % | 8-25-2020 | $ | 150,000,000 | $ | 149,995,748 | |||||||||
FFCB (U.S. Treasury 3 Month Bill Money Market Yield +0.16%)± | 1.70 | 1-19-2021 | 73,500,000 | 73,486,033 | ||||||||||||
FFCB (1 Month LIBOR +0.04%)± | 1.72 | 2-11-2021 | 175,000,000 | 175,000,000 | ||||||||||||
FFCB (1 Month LIBOR +0.08%)± | 1.72 | 3-29-2021 | 250,000,000 | 249,990,060 | ||||||||||||
FFCB (3 Month LIBOR-0.18%)± | 1.73 | 5-15-2020 | 50,000,000 | 49,999,563 | ||||||||||||
FFCB (U.S. Treasury 3 Month Bill Money Market Yield +0.22%)± | 1.76 | 2-2-2021 | 300,000,000 | 299,988,170 | ||||||||||||
FFCB (3 Month LIBOR-0.07%)± | 1.82 | 12-7-2020 | 25,000,000 | 24,999,166 | ||||||||||||
FFCB (3 Month LIBOR-0.06%)± | 1.84 | 3-15-2021 | 75,000,000 | 74,996,713 | ||||||||||||
FFCB (z) | 2.05 | 3-3-2020 | 25,000,000 | 24,959,319 | ||||||||||||
FFCB (U.S. Treasury 3 Month Bill Money Market Yield +0.05%)± | 1.58 | 3-23-2020 | 200,000,000 | 199,998,931 | ||||||||||||
FFCB (U.S. Treasury 3 Month Bill Money Market Yield +0.05%)± | 1.58 | 6-18-2020 | 100,000,000 | 99,998,326 | ||||||||||||
FFCB (z) | 1.58 | 7-8-2020 | 13,000,000 | 12,911,557 | ||||||||||||
FFCB (U.S. Treasury 3 Month Bill Money Market Yield +0.05%)± | 1.59 | 4-16-2020 | 350,000,000 | 349,997,217 | ||||||||||||
FFCB (z) | 1.59 | 6-9-2020 | 50,000,000 | 49,721,306 | ||||||||||||
FFCB (U.S. Treasury 3 Month Bill Money Market Yield +0.06%)± | 1.59 | 7-22-2020 | 300,000,000 | 299,994,469 | ||||||||||||
FFCB (U.S. Treasury 3 Month Bill Money Market Yield +0.06%)± | 1.59 | 8-6-2020 | 150,000,000 | 149,998,870 | ||||||||||||
FFCB (U.S. Treasury 3 Month Bill Money Market Yield +0.06%)± | 1.59 | 9-4-2020 | 150,000,000 | 149,996,048 | ||||||||||||
FFCB (U.S. Treasury 3 Month Bill Money Market Yield +0.05%)± | 1.59 | 10-21-2020 | 100,000,000 | 99,996,468 | ||||||||||||
FFCB (U.S. Treasury 3 Month Bill Money Market Yield +0.06%)± | 1.60 | 10-15-2020 | 100,000,000 | 99,996,549 | ||||||||||||
FFCB (1 Month LIBOR-0.08%)± | 1.60 | 5-11-2020 | 189,295,000 | 189,268,773 | ||||||||||||
FFCB (U.S. Treasury 3 Month Bill Money Market Yield +0.07%)± | 1.60 | 5-15-2020 | 225,000,000 | 225,000,978 | ||||||||||||
FFCB (z) | 1.60 | 6-16-2020 | 49,000,000 | 48,710,002 | ||||||||||||
FFCB (z) | 1.60 | 7-9-2020 | 37,000,000 | 36,743,436 | ||||||||||||
FFCB (z) | 1.60 | 7-15-2020 | 83,000,000 | 82,406,227 | ||||||||||||
FFCB (U.S. Treasury 3 Month Bill Money Market Yield +0.07%)± | 1.60 | 7-24-2020 | 100,000,000 | 99,998,597 | ||||||||||||
FFCB (1 Month LIBOR-0.06%)± | 1.61 | 2-27-2020 | 48,500,000 | 48,499,873 | ||||||||||||
FFCB (z) | 1.61 | 5-20-2020 | 5,000,000 | 4,976,222 | ||||||||||||
FFCB (1 Month LIBOR-0.05%)± | 1.61 | 8-27-2020 | 25,000,000 | 24,994,956 | ||||||||||||
FFCB (z) | 1.61 | 10-26-2020 | 150,000,000 | 148,248,833 | ||||||||||||
FFCB (z) | 1.62 | 6-2-2020 | 47,000,000 | 46,749,333 | ||||||||||||
FFCB (U.S. Treasury 3 Month Bill Money Market Yield +0.09%)± | 1.62 | 3-26-2020 | 100,000,000 | 99,999,576 | ||||||||||||
FFCB (1 Month LIBOR-0.05%)± | 1.63 | 5-14-2020 | 300,000,000 | 299,996,701 | ||||||||||||
FFCB (1 Month LIBOR-0.07%)± | 1.63 | 7-9-2020 | 137,000,000 | 136,970,786 | ||||||||||||
FFCB (1 Month LIBOR-0.05%)± | 1.64 | 3-12-2020 | 250,000,000 | 249,999,221 | ||||||||||||
FFCB (1 Month LIBOR-0.04%)± | 1.64 | 4-15-2020 | 25,000,000 | 24,996,151 | ||||||||||||
FFCB (z) | 1.64 | 10-5-2020 | 10,000,000 | 9,889,750 | ||||||||||||
FFCB (z) | 1.64 | 10-19-2020 | 50,000,000 | 49,417,250 | ||||||||||||
FFCB (3 Month LIBOR-0.14%)± | 1.64 | 10-29-2020 | 50,000,000 | 49,974,808 | ||||||||||||
FFCB (U.S. SOFR +0.07%)± | 1.65 | 8-20-2021 | 42,000,000 | 42,000,000 | ||||||||||||
FFCB (z) | 1.65 | 11-30-2020 | 28,000,000 | 27,620,740 | ||||||||||||
FFCB (U.S. Treasury 3 Month Bill Money Market Yield +0.11%)± | 1.65 | 12-28-2020 | 84,000,000 | 83,984,908 | ||||||||||||
FFCB (1 Month LIBOR-0.05%)± | 1.66 | 2-7-2020 | 26,530,000 | 26,529,944 | ||||||||||||
FFCB (U.S. SOFR +0.08%)± | 1.66 | 6-10-2021 | 40,000,000 | 40,000,000 | ||||||||||||
FFCB (1 Month LIBOR +0.00%)± | 1.66 | 6-25-2020 | 5,000,000 | 5,000,754 | ||||||||||||
FFCB (1 Month LIBOR-0.03%)± | 1.67 | 4-9-2020 | 250,000,000 | 249,997,752 | ||||||||||||
FFCB (1 Month LIBOR +0.01%)± | 1.67 | 5-26-2020 | 250,000,000 | 249,996,918 | ||||||||||||
FFCB (1 Month LIBOR +0.01%)± | 1.67 | 8-19-2020 | 250,000,000 | 249,990,260 | ||||||||||||
FFCB (1 Month LIBOR +0.01%)± | 1.67 | 11-27-2020 | 100,000,000 | 99,997,982 | ||||||||||||
FFCB (U.S. Treasury 3 Month Bill Money Market Yield +0.13%)± | 1.67 | 2-8-2021 | 100,000,000 | 99,939,248 | ||||||||||||
FFCB (U.S. SOFR +0.10%)± | 1.68 | 5-7-2021 | 84,000,000 | 84,000,000 | ||||||||||||
FFCB (1 Month LIBOR +0.03%)± | 1.68 | 5-20-2021 | 37,500,000 | 37,496,909 | ||||||||||||
FFCB (U.S. Treasury 3 Month Bill Money Market Yield +0.14%)± | 1.68 | 9-17-2021 | 29,600,000 | 29,523,634 | ||||||||||||
FFCB (3 Month LIBOR-0.20%)± | 1.69 | 3-6-2020 | 75,000,000 | 74,999,739 | ||||||||||||
FFCB (3 Month LIBOR-0.21%)± | 1.69 | 5-20-2020 | 125,000,000 | 124,973,344 | ||||||||||||
FFCB (3 Month LIBOR-0.21%)± | 1.70 | 8-6-2020 | 16,500,000 | 16,493,905 | ||||||||||||
FFCB (1 Month LIBOR +0.03%)± | 1.70 | 12-14-2020 | 50,000,000 | 49,998,242 | ||||||||||||
The accompanying notes are an integral part of these financial statements.
Government Money Market Funds | 11
Table of Contents
Portfolio of investments—January 31, 2020
| Interest rate | Maturity date | Principal | Value | |||||||||||||
| Government Agency Debt (continued) | ||||||||||||||||
FFCB (1 Month LIBOR +0.04%)± | 1.70 | % | 1-26-2021 | $ | 35,000,000 | $ | 34,995,573 | |||||||||
FFCB (1 Month LIBOR +0.04%)± | 1.70 | 1-28-2021 | 207,500,000 | 207,500,145 | ||||||||||||
FFCB (1 Month LIBOR +0.02%)± | 1.70 | 6-14-2021 | 295,855,000 | 295,820,284 | ||||||||||||
FFCB (3 Month LIBOR-0.17%)± | 1.71 | 4-9-2020 | 100,000,000 | 99,999,284 | ||||||||||||
FFCB (1 Month LIBOR-0.02%)± | 1.71 | 8-5-2020 | 140,000,000 | 139,980,165 | ||||||||||||
FFCB (1 Month LIBOR +0.04%)± | 1.71 | 12-16-2020 | 300,000,000 | 299,992,201 | ||||||||||||
FFCB (1 Month LIBOR +0.03%)± | 1.71 | 7-13-2021 | 300,000,000 | 299,987,047 | ||||||||||||
FFCB (3 Month LIBOR-0.19%)± | 1.72 | 2-28-2020 | 75,000,000 | 75,000,000 | ||||||||||||
FFCB (1 Month LIBOR +0.02%)± | 1.72 | 9-9-2020 | 100,000,000 | 99,962,511 | ||||||||||||
FFCB (1 Month LIBOR +0.07%)± | 1.72 | 12-28-2020 | 250,000,000 | 250,000,000 | ||||||||||||
FFCB (1 Month LIBOR +0.04%)± | 1.72 | 1-11-2021 | 89,500,000 | 89,495,764 | ||||||||||||
FFCB (1 Month LIBOR +0.07%)± | 1.72 | 4-29-2021 | 225,000,000 | 224,988,953 | ||||||||||||
FFCB (U.S. SOFR +0.14%)± | 1.72 | 9-24-2021 | 240,000,000 | 240,000,000 | ||||||||||||
FFCB (1 Month LIBOR +0.07%)± | 1.73 | 6-24-2021 | 300,000,000 | 299,983,354 | ||||||||||||
FFCB (3 Month LIBOR-0.16%)± | 1.74 | 5-5-2020 | 50,000,000 | 49,999,461 | ||||||||||||
FFCB (1 Month LIBOR +0.08%)± | 1.74 | 5-27-2021 | 300,000,000 | 299,988,319 | ||||||||||||
FFCB (1 Month LIBOR +0.08%)± | 1.74 | 8-25-2021 | 150,000,000 | 150,000,000 | ||||||||||||
FFCB (3 Month LIBOR-0.08%)± | 1.75 | 1-15-2021 | 75,300,000 | 75,300,080 | ||||||||||||
FFCB (1 Month LIBOR +0.07%)± | 1.76 | 1-8-2021 | 300,000,000 | 299,961,405 | ||||||||||||
FFCB (z) | 1.77 | 2-12-2020 | 40,000,000 | 39,982,463 | ||||||||||||
FFCB (3 Month LIBOR-0.15%)± | 1.77 | 3-2-2020 | 100,000,000 | 99,999,848 | ||||||||||||
FFCB (3 Month LIBOR-0.13%)± | 1.77 | 9-4-2020 | 115,000,000 | 115,000,000 | ||||||||||||
FFCB (3 Month LIBOR-0.13%)± | 1.77 | 11-16-2020 | 130,000,000 | 129,994,284 | ||||||||||||
FFCB (1 Month LIBOR +0.11%)± | 1.77 | 3-25-2021 | 200,000,000 | 199,977,209 | ||||||||||||
FFCB (1 Month LIBOR +0.08%)± | 1.77 | 7-8-2021 | 200,000,000 | 200,000,000 | ||||||||||||
FFCB (U.S. Treasury 3 Month Bill Money Market Yield +0.24%)± | 1.77 | 8-20-2021 | 225,000,000 | 224,986,251 | ||||||||||||
FFCB (1 Month LIBOR +0.09%)± | 1.77 | 9-13-2021 | 90,000,000 | 90,000,000 | ||||||||||||
FFCB (U.S. SOFR +0.19%)± | 1.77 | 11-18-2021 | 181,000,000 | 181,000,000 | ||||||||||||
FFCB (U.S. Treasury 3 Month Bill Money Market Yield +0.24%)± | 1.78 | 8-2-2021 | 150,000,000 | 150,000,000 | ||||||||||||
FFCB (3 Month LIBOR-0.12%)± | 1.79 | 11-30-2020 | 75,000,000 | 75,000,000 | ||||||||||||
FFCB (U.S. Treasury 3 Month Bill Money Market Yield +0.26%)± | 1.80 | 5-17-2021 | 98,700,000 | 98,674,657 | ||||||||||||
FFCB (1 Month LIBOR +0.10%)± | 1.80 | 9-9-2021 | 105,000,000 | 105,000,000 | ||||||||||||
FFCB (1 Month LIBOR +0.04%)± | 1.82 | 2-1-2021 | 133,000,000 | 132,989,677 | ||||||||||||
FFCB (1 Month LIBOR +0.09%)± | 1.82 | 5-4-2021 | 75,000,000 | 75,000,000 | ||||||||||||
FFCB (1 Month LIBOR +0.10%)± | 1.83 | 8-5-2021 | 130,000,000 | 130,000,000 | ||||||||||||
FFCB (3 Month LIBOR-0.07%)± | 1.84 | 2-1-2021 | 50,000,000 | 49,998,018 | ||||||||||||
FFCB (3 Month LIBOR-0.06%)± | 1.85 | 5-13-2021 | 25,000,000 | 24,998,799 | ||||||||||||
FFCB (3 Month LIBOR-0.10%)± | 1.86 | 12-28-2020 | 235,000,000 | 234,991,688 | ||||||||||||
FFCB (z) | 1.89 | 5-5-2020 | 47,000,000 | 46,775,392 | ||||||||||||
FFCB (3 Month LIBOR +0.01%)± | 1.90 | 9-13-2021 | 19,600,000 | 19,617,845 | ||||||||||||
FFCB (z) | 1.91 | 4-24-2020 | 45,000,000 | 44,808,638 | ||||||||||||
FFCB (3 Month LIBOR +0.01%)± | 1.92 | 9-20-2021 | 38,600,000 | 38,611,430 | ||||||||||||
FFCB (3 Month LIBOR-0.03%)± | 1.92 | 9-27-2021 | 75,000,000 | 74,995,076 | ||||||||||||
FFCB (1 Month LIBOR +0.16%)± | 1.94 | 7-1-2021 | 35,000,000 | 35,000,000 | ||||||||||||
FFCB (z) | 1.98 | 2-14-2020 | 100,000,000 | 99,940,111 | ||||||||||||
FFCB (z) | 2.02 | 4-2-2020 | 20,000,000 | 19,934,772 | ||||||||||||
FFCB (z) | 2.02 | 4-21-2020 | 50,000,000 | 49,784,417 | ||||||||||||
FFCB (z) | 2.05 | 2-6-2020 | 44,000,000 | 43,992,557 | ||||||||||||
FFCB (z) | 2.05 | 2-7-2020 | 18,000,000 | 17,995,940 | ||||||||||||
FFCB (z) | 2.05 | 3-4-2020 | 17,000,000 | 16,971,383 | ||||||||||||
FFCB (z) | 2.05 | 3-20-2020 | 25,000,000 | 24,935,472 | ||||||||||||
FFCB (z) | 2.12 | 4-16-2020 | 50,000,000 | 49,789,111 | ||||||||||||
FFCB (z) | 2.13 | 4-1-2020 | 110,000,000 | 109,629,606 | ||||||||||||
FHLB (z) | 1.59 | 4-1-2020 | 100,000,000 | 99,745,444 | ||||||||||||
FHLB (U.S. SOFR +0.04%)± | 1.62 | 2-21-2020 | 110,000,000 | 110,000,000 | ||||||||||||
FHLB (U.S. SOFR +0.07%)± | 1.65 | 3-27-2020 | 247,000,000 | 247,000,000 | ||||||||||||
The accompanying notes are an integral part of these financial statements.
12 | Government Money Market Funds
Table of Contents
Portfolio of investments—January 31, 2020
| Interest rate | Maturity date | Principal | Value | |||||||||||||
| Government Agency Debt (continued) | ||||||||||||||||
FHLB (1 Month LIBOR-0.09%)± | 1.57 | % | 3-23-2020 | $ | 250,000,000 | $ | 249,997,333 | |||||||||
FHLB (z) | 1.58 | 2-12-2020 | 205,000,000 | 204,919,435 | ||||||||||||
FHLB (z) | 1.58 | 2-21-2020 | 500,000,000 | 499,606,350 | ||||||||||||
FHLB (z) | 1.58 | 3-11-2020 | 100,000,000 | 99,838,639 | ||||||||||||
FHLB (z) | 1.58 | 3-30-2020 | 100,000,000 | 99,755,778 | ||||||||||||
FHLB (z) | 1.58 | 4-9-2020 | 100,000,000 | 99,712,167 | ||||||||||||
FHLB (z) | 1.58 | 5-15-2020 | 100,000,000 | 99,555,450 | ||||||||||||
FHLB (z) | 1.58 | 5-20-2020 | 56,000,000 | 55,738,849 | ||||||||||||
FHLB (z) | 1.58 | 5-22-2020 | 138,000,000 | 137,344,836 | ||||||||||||
FHLB (z) | 1.58 | 7-6-2020 | 273,740,000 | 271,906,125 | ||||||||||||
FHLB (z) | 1.59 | 3-6-2020 | 300,000,000 | 299,577,778 | ||||||||||||
FHLB | 1.59 | 5-13-2020 | 100,000,000 | 99,995,450 | ||||||||||||
FHLB (z) | 1.60 | 4-3-2020 | 397,000,000 | 395,949,517 | ||||||||||||
FHLB (1 Month LIBOR-0.06%)± | 1.60 | 2-20-2020 | 200,000,000 | 200,000,000 | ||||||||||||
FHLB (1 Month LIBOR-0.06%)± | 1.60 | 2-21-2020 | 125,000,000 | 125,000,000 | ||||||||||||
FHLB (U.S. SOFR +0.02%)± | 1.60 | 5-22-2020 | 172,000,000 | 172,000,000 | ||||||||||||
FHLB (z) | 1.60 | 2-28-2020 | 400,000,000 | 399,556,112 | ||||||||||||
FHLB (z) | 1.61 | 7-1-2020 | 50,000,000 | 49,670,958 | ||||||||||||
FHLB (z) | 1.61 | 7-8-2020 | 50,000,000 | 49,655,500 | ||||||||||||
FHLB (z) | 1.61 | 8-3-2020 | 50,000,000 | 49,598,083 | ||||||||||||
FHLB (z) | 1.61 | 8-4-2020 | 50,000,000 | 49,595,875 | ||||||||||||
FHLB (U.S. SOFR +0.03%)± | 1.61 | 3-6-2020 | 307,000,000 | 307,000,000 | ||||||||||||
FHLB (U.S. SOFR +0.03%)± | 1.61 | 3-27-2020 | 141,000,000 | 141,000,000 | ||||||||||||
FHLB (U.S. SOFR +0.03%)± | 1.61 | 7-17-2020 | 278,000,000 | 278,000,000 | ||||||||||||
FHLB (U.S. SOFR +0.03%)± | 1.61 | 11-6-2020 | 137,000,000 | 137,000,000 | ||||||||||||
FHLB (z) | 1.61 | 4-24-2020 | 100,000,000 | 99,640,000 | ||||||||||||
FHLB | 1.62 | 3-2-2020 | 200,000,000 | 200,000,955 | ||||||||||||
FHLB (U.S. SOFR +0.05%)± | 1.63 | 9-28-2020 | 420,000,000 | 420,000,000 | ||||||||||||
FHLB (z) | 1.63 | 3-13-2020 | 349,425,000 | 348,812,463 | ||||||||||||
FHLB (U.S. SOFR +0.05%)± | 1.63 | 1-28-2021 | 260,000,000 | 260,000,000 | ||||||||||||
FHLB (z) | 1.63 | 4-22-2020 | 156,000,000 | 155,446,105 | ||||||||||||
FHLB (1 Month LIBOR-0.08%)± | 1.63 | 2-7-2020 | 150,000,000 | 150,000,000 | ||||||||||||
FHLB (1 Month LIBOR-0.05%)± | 1.64 | 5-11-2020 | 6,000,000 | 5,998,362 | ||||||||||||
FHLB (1 Month LIBOR-0.05%)± | 1.64 | 5-11-2020 | 18,000,000 | 17,995,085 | ||||||||||||
FHLB (U.S. SOFR +0.07%)± | 1.65 | 3-26-2020 | 425,000,000 | 425,000,000 | ||||||||||||
FHLB (1 Month LIBOR-0.02%)± | 1.65 | 5-26-2020 | 100,000,000 | 99,998,546 | ||||||||||||
FHLB (3 Month LIBOR-0.12%) %%±(z) | 1.65 | 4-30-2021 | 200,000,000 | 200,000,000 | ||||||||||||
FHLB (3 Month LIBOR-0.12%) %%±(z) | 1.65 | 5-3-2021 | 200,000,000 | 200,000,000 | ||||||||||||
FHLB (U.S. SOFR +0.08%)± | 1.66 | 6-11-2021 | 332,000,000 | 332,000,000 | ||||||||||||
FHLB (1 Month LIBOR +0.00%)± | 1.66 | 11-20-2020 | 109,000,000 | 108,925,060 | ||||||||||||
FHLB (z) | 1.66 | 4-8-2020 | 300,000,000 | 299,107,153 | ||||||||||||
FHLB (1 Month LIBOR +0.00%)± | 1.66 | 3-25-2020 | 200,000,000 | 200,000,000 | ||||||||||||
FHLB (1 Month LIBOR +0.00%)± | 1.66 | 10-26-2020 | 230,000,000 | 230,000,136 | ||||||||||||
FHLB (1 Month LIBOR +0.01%)± | 1.67 | 9-28-2021 | 425,000,000 | 425,000,000 | ||||||||||||
FHLB (U.S. SOFR +0.10%)± | 1.68 | 7-17-2020 | 220,000,000 | 220,000,000 | ||||||||||||
FHLB (U.S. SOFR +0.10%)± | 1.68 | 7-29-2020 | 195,000,000 | 195,000,000 | ||||||||||||
FHLB (3 Month LIBOR-0.21%)± | 1.69 | 7-6-2020 | 200,000,000 | 200,000,000 | ||||||||||||
FHLB (3 Month LIBOR-0.11%)± | 1.69 | 1-25-2021 | 50,000,000 | 50,000,379 | ||||||||||||
FHLB (3 Month LIBOR-0.21%)± | 1.69 | 6-19-2020 | 200,000,000 | 200,000,000 | ||||||||||||
FHLB (1 Month LIBOR +0.02%)± | 1.69 | 7-14-2021 | 50,000,000 | 50,000,000 | ||||||||||||
FHLB (3 Month LIBOR-0.20%)± | 1.70 | 2-18-2020 | 250,000,000 | 250,000,000 | ||||||||||||
FHLB (3 Month LIBOR-0.19%)± | 1.71 | 2-20-2020 | 200,000,000 | 200,000,000 | ||||||||||||
FHLB (U.S. SOFR +0.13%)± | 1.71 | 10-16-2020 | 250,000,000 | 250,000,000 | ||||||||||||
FHLB (3 Month LIBOR-0.13%)± | 1.71 | 4-14-2021 | 225,000,000 | 225,000,000 | ||||||||||||
FHLB (z) | 1.74 | 3-20-2020 | 487,496,000 | 486,417,236 | ||||||||||||
FHLB (1 Month LIBOR +0.05%)± | 1.74 | 5-8-2020 | 150,000,000 | 150,000,000 | ||||||||||||
The accompanying notes are an integral part of these financial statements.
Government Money Market Funds | 13
Table of Contents
Portfolio of investments—January 31, 2020
| Interest rate | Maturity date | Principal | Value | |||||||||||||
| Government Agency Debt (continued) | ||||||||||||||||
FHLB (1 Month LIBOR +0.06%)± | 1.74 | % | 6-12-2020 | $ | 250,000,000 | $ | 250,000,000 | |||||||||
FHLB (z) | 1.75 | 2-19-2020 | 150,000,000 | 149,884,022 | ||||||||||||
FHLB (U.S. SOFR +0.17%)± | 1.75 | 4-9-2021 | 189,000,000 | 189,000,000 | ||||||||||||
FHLB (3 Month LIBOR-0.14%)± | 1.76 | 12-18-2020 | 14,010,000 | 14,001,779 | ||||||||||||
FHLB (3 Month LIBOR-0.12%)± | 1.77 | 3-5-2020 | 200,000,000 | 200,000,000 | ||||||||||||
FHLB (3 Month LIBOR-0.10%)± | 1.79 | 9-13-2021 | 29,375,000 | 29,347,221 | ||||||||||||
FHLB (z) | 1.84 | 2-13-2020 | 125,000,000 | 124,936,632 | ||||||||||||
FHLB (z) | 1.90 | 3-18-2020 | 34,320,000 | 34,240,931 | ||||||||||||
FHLB | 1.95 | 6-17-2020 | 150,000,000 | 150,000,000 | ||||||||||||
FHLMC | 1.38 | 5-1-2020 | 115,500,000 | 115,325,625 | ||||||||||||
FHLMC (U.S. SOFR +0.00%)± | 1.58 | 2-20-2020 | 100,000,000 | 99,998,045 | ||||||||||||
FHLMC (U.S. SOFR +0.03%)± | 1.61 | 9-9-2020 | 100,000,000 | 100,000,000 | ||||||||||||
FHLMC (z) | 1.66 | 3-18-2020 | 150,000,000 | 149,697,500 | ||||||||||||
FHLMC (z) | 1.70 | 2-20-2020 | 300,000,000 | 299,760,582 | ||||||||||||
FHLMC | 1.70 | 9-29-2020 | 62,460,000 | 62,460,000 | ||||||||||||
FHLMC | 1.88 | 11-17-2020 | 328,834,000 | 329,377,484 | ||||||||||||
FNMA | 1.50 | 2-28-2020 | 23,150,000 | 23,139,364 | ||||||||||||
FNMA | 1.50 | 6-22-2020 | 97,680,000 | 97,486,335 | ||||||||||||
FNMA | 1.50 | 7-30-2020 | 15,700,000 | 15,691,930 | ||||||||||||
FNMA | 1.50 | 11-30-2020 | 25,000,000 | 24,970,147 | ||||||||||||
FNMA (U.S. SOFR +0.10%)± | 1.68 | 4-30-2020 | 15,000,000 | 15,000,000 | ||||||||||||
Overseas Private Investment Corporation (U.S. Treasury 3 Month Bill +0.00%)±§ | 1.84 | 11-15-2022 | 16,275,000 | 16,275,000 | ||||||||||||
Overseas Private Investment Corporation (U.S. Treasury 3 Month Bill +0.00%)±§ | 1.84 | 11-15-2023 | 20,000,000 | 20,000,000 | ||||||||||||
Overseas Private Investment Corporation (U.S. Treasury 3 Month Bill +0.00%)±§ | 1.84 | 7-19-2027 | 10,000,000 | 10,000,000 | ||||||||||||
Overseas Private Investment Corporation (U.S. Treasury 3 Month Bill +0.00%)±§ | 1.84 | 9-20-2027 | 25,000,000 | 25,000,000 | ||||||||||||
Overseas Private Investment Corporation (U.S. Treasury 3 Month Bill +0.00%)±§ | 1.84 | 6-28-2032 | 28,847,100 | 28,847,100 | ||||||||||||
Overseas Private Investment Corporation (U.S. Treasury 3 Month Bill +0.00%)±§ | 1.84 | 10-15-2039 | 14,965,000 | 14,965,000 | ||||||||||||
Overseas Private Investment Corporation (U.S. Treasury 3 Month Bill +0.00%)±§ | 1.84 | 10-15-2039 | 15,000,000 | 15,000,000 | ||||||||||||
Overseas Private Investment Corporation (U.S. Treasury 3 Month Bill +0.00%)±§ | 1.84 | 7-7-2040 | 19,435,860 | 19,435,860 | ||||||||||||
Overseas Private Investment Corporation (U.S. Treasury 3 Month Bill +0.00%)±§ | 1.84 | 7-7-2040 | 8,357,420 | 8,357,420 | ||||||||||||
Overseas Private Investment Corporation (U.S. Treasury 3 Month Bill +0.00%)±§ | 1.84 | 7-7-2040 | 14,090,999 | 14,090,999 | ||||||||||||
Overseas Private Investment Corporation (U.S. Treasury 3 Month Bill +0.00%)±§ | 1.84 | 7-7-2040 | 10,689,723 | 10,689,723 | ||||||||||||
Overseas Private Investment Corporation (U.S. Treasury 3 Month Bill +0.00%)±§ | 1.84 | 10-15-2040 | 7,000,000 | 7,000,000 | ||||||||||||
Overseas Private Investment Corporation (U.S. Treasury 3 Month Bill +0.00%)±§ | 1.87 | 11-15-2025 | 6,600,000 | 6,600,000 | ||||||||||||
Overseas Private Investment Corporation (U.S. Treasury 3 Month Bill +0.00%)±§ | 1.87 | 7-9-2026 | 61,057,750 | 61,057,750 | ||||||||||||
Overseas Private Investment Corporation (U.S. Treasury 3 Month Bill +0.00%)±§ | 1.87 | 1-15-2030 | 15,094,340 | 15,094,340 | ||||||||||||
Overseas Private Investment Corporation (U.S. Treasury 3 Month Bill +0.00%)±§ | 1.87 | 10-15-2032 | 21,053,846 | 21,053,846 | ||||||||||||
Overseas Private Investment Corporation (U.S. Treasury 3 Month Bill +0.00%)±§ | 1.87 | 6-15-2034 | 17,226,069 | 17,226,069 | ||||||||||||
The accompanying notes are an integral part of these financial statements.
14 | Government Money Market Funds
Table of Contents
Portfolio of investments—January 31, 2020
| Interest rate | Maturity date | Principal | Value | |||||||||||||
| Government Agency Debt (continued) | ||||||||||||||||
Overseas Private Investment Corporation (U.S. Treasury 3 Month Bill +0.00%)±§ | 1.89 | % | 7-15-2026 | $ | 7,127,000 | $ | 7,127,000 | |||||||||
Overseas Private Investment Corporation (U.S. Treasury 3 Month Bill +0.00%)±§ | 1.89 | 9-2-2031 | 11,285,976 | 11,285,976 | ||||||||||||
Overseas Private Investment Corporation (U.S. Treasury 3 Month Bill +0.00%)±§ | 1.89 | 9-2-2031 | 17,118,583 | 17,118,583 | ||||||||||||
Overseas Private Investment Corporation (U.S. Treasury 3 Month Bill +0.00%)±§ | 1.89 | 9-2-2031 | 12,894,143 | 12,894,143 | ||||||||||||
Overseas Private Investment Corporation (U.S. Treasury 3 Month Bill +0.00%)±§ | 1.89 | 9-2-2031 | 11,281,175 | 11,281,175 | ||||||||||||
Overseas Private Investment Corporation (U.S. Treasury 3 Month Bill +0.00%)±§ | 1.89 | 9-2-2031 | 19,202,000 | 19,202,000 | ||||||||||||
Overseas Private Investment Corporation (U.S. Treasury 3 Month Bill +0.00%)±§ | 1.89 | 9-30-2031 | 11,267,440 | 11,267,440 | ||||||||||||
Overseas Private Investment Corporation (U.S. Treasury 3 Month Bill +0.00%)±§ | 1.89 | 12-20-2031 | 35,000,000 | 35,000,000 | ||||||||||||
Overseas Private Investment Corporation (U.S. Treasury 3 Month Bill +0.00%)±§ | 1.89 | 5-15-2033 | 3,715,649 | 3,715,649 | ||||||||||||
Overseas Private Investment Corporation (U.S. Treasury 3 Month Bill +0.00%)±§ | 1.89 | 1-15-2040 | 11,880,000 | 11,880,000 | ||||||||||||
Overseas Private Investment Corporation (U.S. Treasury 3 Month Bill +0.00%)±§ | 1.89 | 1-15-2040 | 7,920,000 | 7,920,000 | ||||||||||||
Overseas Private Investment Corporation (U.S. Treasury 3 Month Bill +0.00%)±§ | 1.89 | 7-15-2040 | 19,581,600 | 19,581,600 | ||||||||||||
Overseas Private Investment Corporation (U.S. Treasury 3 Month Bill +0.00%)±§ | 1.90 | 8-15-2026 | 1,589,270 | 1,589,270 | ||||||||||||
Overseas Private Investment Corporation (U.S. Treasury 3 Month Bill +0.00%)±§ | 1.90 | 1-20-2027 | 68,000,000 | 68,000,000 | ||||||||||||
Overseas Private Investment Corporation (U.S. Treasury 3 Month Bill +0.00%)±§ | 1.90 | 1-20-2035 | 12,000,000 | 12,000,000 | ||||||||||||
Overseas Private Investment Corporation (U.S. Treasury 3 Month Bill +0.00%)±§ | 1.90 | 1-20-2035 | 10,400,000 | 10,400,000 | ||||||||||||
Overseas Private Investment Corporation (U.S. Treasury 3 Month Bill +0.00%)±§ | 1.90 | 1-20-2035 | 9,900,000 | 9,900,000 | ||||||||||||
Overseas Private Investment Corporation (U.S. Treasury 3 Month Bill +0.00%)±§ | 1.90 | 1-20-2035 | 4,000,000 | 4,000,000 | ||||||||||||
Overseas Private Investment Corporation (U.S. Treasury 3 Month Bill +0.00%)±§ | 1.90 | 4-20-2035 | 17,500,000 | 17,500,000 | ||||||||||||
Overseas Private Investment Corporation (U.S. Treasury 3 Month Bill +0.00%)±§ | 1.90 | 4-20-2035 | 5,000,000 | 5,000,000 | ||||||||||||
Overseas Private Investment Corporation (U.S. Treasury 3 Month Bill +0.00%)±§ | 1.90 | 4-20-2035 | 5,000,000 | 5,000,000 | ||||||||||||
Overseas Private Investment Corporation (U.S. Treasury 3 Month Bill +0.00%)±§ | 1.90 | 7-5-2038 | 8,150,000 | 8,150,000 | ||||||||||||
Overseas Private Investment Corporation Series 1 (U.S. Treasury 3 Month Bill +0.00%)±§ | 1.89 | 9-30-2031 | 4,436,000 | 4,436,000 | ||||||||||||
Overseas Private Investment Corporation Series 1 (U.S. Treasury 3 Month Bill +0.00%)±§ | 1.89 | 1-15-2040 | 19,800,000 | 19,800,000 | ||||||||||||
Overseas Private Investment Corporation Series 1 (U.S. Treasury 3 Month Bill +0.00%)±§ | 1.90 | 8-15-2026 | 29,878,276 | 29,878,276 | ||||||||||||
Overseas Private Investment Corporation Series 2 (U.S. Treasury 3 Month Bill +0.00%)±§ | 1.84 | 10-10-2025 | 5,667,030 | 5,667,030 | ||||||||||||
Overseas Private Investment Corporation Series 2 (U.S. Treasury 3 Month Bill +0.00%)±§ | 1.84 | 9-20-2038 | 3,847,272 | 3,847,272 | ||||||||||||
Overseas Private Investment Corporation Series 2 (U.S. Treasury 3 Month Bill +0.00%)±§ | 1.89 | 9-30-2031 | 10,380,240 | 10,380,240 | ||||||||||||
The accompanying notes are an integral part of these financial statements.
Government Money Market Funds | 15
Table of Contents
Portfolio of investments—January 31, 2020
| Interest rate | Maturity date | Principal | Value | |||||||||||||
| Government Agency Debt (continued) | ||||||||||||||||
Overseas Private Investment Corporation Series2-2 (U.S. Treasury 3 Month Bill +0.00%)±§ | 1.89 | % | 7-15-2040 | $ | 6,888,000 | $ | 6,888,000 | |||||||||
Overseas Private Investment Corporation Series 3 (U.S. Treasury 3 Month Bill +0.00%)±§ | 1.84 | 10-10-2025 | 7,367,139 | 7,367,139 | ||||||||||||
Overseas Private Investment Corporation Series 3 (U.S. Treasury 3 Month Bill +0.00%)±§ | 1.89 | 7-15-2026 | 9,336,370 | 9,336,370 | ||||||||||||
Overseas Private Investment Corporation Series 4 (U.S. Treasury 3 Month Bill +0.00%)±§ | 1.87 | 11-15-2033 | 22,700,855 | 22,700,855 | ||||||||||||
Overseas Private Investment Corporation Series 4 (U.S. Treasury 3 Month Bill +0.00%)±§ | 1.89 | 9-2-2031 | 3,360,350 | 3,360,350 | ||||||||||||
Overseas Private Investment Corporation Series 4 (U.S. Treasury 3 Month Bill +0.00%)±§ | 1.89 | 9-30-2031 | 6,032,960 | 6,032,960 | ||||||||||||
Overseas Private Investment Corporation Series 4 (U.S. Treasury 3 Month Bill +0.00%)±§ | 1.90 | 1-20-2035 | 9,000,000 | 9,000,000 | ||||||||||||
Overseas Private Investment Corporation Series 5 (U.S. Treasury 3 Month Bill +0.00%)±§ | 1.89 | 9-30-2031 | 6,210,400 | 6,210,400 | ||||||||||||
Overseas Private Investment Corporation Series 6 (U.S. Treasury 3 Month Bill +0.00%)±§ | 1.84 | 7-7-2040 | 4,761,786 | 4,761,786 | ||||||||||||
Overseas Private Investment Corporation Series 6 (U.S. Treasury 3 Month Bill +0.00%)±§ | 1.89 | 9-30-2031 | 18,010,160 | 18,010,160 | ||||||||||||
Overseas Private Investment Corporation Series 6 (U.S. Treasury 3 Month Bill +0.00%)±§ | 1.90 | 4-20-2035 | 8,900,000 | 8,900,000 | ||||||||||||
Overseas Private Investment Corporation Series 7 (U.S. Treasury 3 Month Bill +0.00%)±§ | 1.89 | 9-30-2031 | 7,097,600 | 7,097,600 | ||||||||||||
Overseas Private Investment Corporation Series 7 (U.S. Treasury 3 Month Bill +0.00%)±§ | 1.90 | 1-20-2035 | 2,900,000 | 2,900,000 | ||||||||||||
Overseas Private Investment Corporation Series 8 (U.S. Treasury 3 Month Bill +0.00%)±§ | 1.89 | 9-30-2031 | 13,308,000 | 13,308,000 | ||||||||||||
Overseas Private Investment Corporation Series 9 (U.S. Treasury 3 Month Bill +0.00%)±§ | 1.87 | 5-15-2030 | 23,256,000 | 23,256,000 | ||||||||||||
Overseas Private Investment Corporation Series 9 (U.S. Treasury 3 Month Bill +0.00%)±§ | 1.89 | 9-30-2031 | 4,169,840 | 4,169,840 | ||||||||||||
Total Government Agency Debt (Cost $27,693,932,432) |
| 27,693,932,432 | ||||||||||||||
|
| |||||||||||||||
Municipal Obligations: 0.01% |
| |||||||||||||||
Wisconsin: 0.01% |
| |||||||||||||||
| Variable Rate Demand Note ø: 0.01% | ||||||||||||||||
Wisconsin PFA Assisted Living Facilities Brannan Park Project (Housing Revenue, FHLB LOC) | 1.58 | 1-1-2048 | 12,320,000 | 12,320,000 | ||||||||||||
|
| |||||||||||||||
Total Municipal Obligations (Cost $12,320,000) |
| 12,320,000 | ||||||||||||||
|
| |||||||||||||||
| Repurchase Agreements ^^: 55.13% | ||||||||||||||||
Bank of America Corporation, dated1-31-2020, maturity value $1,275,168,938 (1) | 1.59 | 2-3-2020 | 1,275,000,000 | 1,275,000,000 | ||||||||||||
Bank of Montreal, dated1-31-2020, maturity value $350,046,375 (2) | 1.59 | 2-3-2020 | 350,000,000 | 350,000,000 | ||||||||||||
Bank of Montreal, dated12-17-2019, maturity value $350,940,722 (3)§¢øø | 1.64 | 2-14-2020 | 350,000,000 | 350,000,000 | ||||||||||||
Bank of Nova Scotia, dated1-31-2020, maturity value $670,088,775 (4) | 1.59 | 2-3-2020 | 670,000,000 | 670,000,000 | ||||||||||||
Barclays Capital Incorporated, dated1-28-2020, maturity value $500,150,694 (5) | 1.55 | 2-4-2020 | 500,000,000 | 500,000,000 | ||||||||||||
Barclays Capital Incorporated, dated1-29-2020, maturity value $500,151,667 (6) | 1.56 | 2-5-2020 | 500,000,000 | 500,000,000 | ||||||||||||
Barclays Capital Incorporated, dated1-31-2020, maturity value $200,026,500 (7) | 1.59 | 2-3-2020 | 200,000,000 | 200,000,000 | ||||||||||||
The accompanying notes are an integral part of these financial statements.
16 | Government Money Market Funds
Table of Contents
Portfolio of investments—January 31, 2020
| Interest rate | Maturity date | Principal | Value | |||||||||||||
| Repurchase Agreements ^^ (continued) | ||||||||||||||||
BNP Paribas Securities Corporation, dated1-13-2020, maturity value $552,238,347 (8) | 1.61 | % | 4-13-2020 | $ | 550,000,000 | $ | 550,000,000 | |||||||||
BNP Paribas Securities Corporation, dated1-17-2020, maturity value $251,017,431 (9) | 1.61 | 4-17-2020 | 250,000,000 | 250,000,000 | ||||||||||||
BNP Paribas Securities Corporation, dated1-31-2020, maturity value $1,900,253,333 (10) | 1.60 | 2-3-2020 | 1,900,000,000 | 1,900,000,000 | ||||||||||||
BNP Paribas Securities Corporation, dated1-31-2020, maturity value $100,013,250 (11) | 1.59 | 2-3-2020 | 100,000,000 | 100,000,000 | ||||||||||||
Citibank NA, dated1-30-2020, maturity value $250,077,292 (12) | 1.59 | 2-6-2020 | 250,000,000 | 250,000,000 | ||||||||||||
Citibank NA, dated1-31-2020, maturity value $250,033,125 (13) | 1.59 | 2-3-2020 | 250,000,000 | 250,000,000 | ||||||||||||
Citigroup Global Markets Incorporated, dated1-28-2020, maturity value $250,074,861 (14) | 1.54 | 2-4-2020 | 250,000,000 | 250,000,000 | ||||||||||||
Citigroup Global Markets Incorporated, dated1-31-2020, maturity value $500,066,250 (15) | 1.59 | 2-3-2020 | 500,000,000 | 500,000,000 | ||||||||||||
Credit Agricole SA, dated1-31-2020, maturity value $300,092,750 (16) | 1.59 | 2-7-2020 | 300,000,000 | 300,000,000 | ||||||||||||
Credit Agricole SA, dated1-31-2020, maturity value $500,066,250 (17) | 1.59 | 2-3-2020 | 500,000,000 | 500,000,000 | ||||||||||||
Credit Agricole SA, dated11-7-2019, maturity value $150,640,167 (18) | 1.67 | 2-7-2020 | 150,000,000 | 150,000,000 | ||||||||||||
Daiwa Capital Markets America Incorporated, dated1-31-2020, maturity value $1,000,132,500 (19) | 1.59 | 2-3-2020 | 1,000,000,000 | 1,000,000,000 | ||||||||||||
Deutsche Bank Securities, dated1-31-2020, maturity value $1,000,132,500 (20) | 1.59 | 2-3-2020 | 1,000,000,000 | 1,000,000,000 | ||||||||||||
Deutsche Bank Securities, dated1-31-2020, maturity value $750,096,875 (21) | 1.55 | 2-3-2020 | 750,000,000 | 750,000,000 | ||||||||||||
Fixed Income Clearing Corporation, dated1-31-2020, maturity value $1,000,131,667 (22) | 1.58 | 2-3-2020 | 1,000,000,000 | 1,000,000,000 | ||||||||||||
Fixed Income Clearing Corporation, dated1-31-2020, maturity value $13,501,789,740 (23) | 1.59 | 2-3-2020 | 13,500,000,990 | 13,500,000,990 | ||||||||||||
Fixed Income Clearing Corporation, dated1-31-2020, maturity value $950,118,750 (24) | 1.50 | 2-3-2020 | 950,000,000 | 950,000,000 | ||||||||||||
Goldman Sachs & Company, dated1-31-2020, maturity value $200,026,000 (25) | 1.56 | 2-3-2020 | 200,000,000 | 200,000,000 | ||||||||||||
Goldman Sachs & Company, dated1-31-2020, maturity value $500,065,833 (26) | 1.58 | 2-3-2020 | 500,000,000 | 500,000,000 | ||||||||||||
ING Financial Markets LLC, dated1-10-2020, maturity value $301,253,333 (27) | 1.60 | 4-13-2020 | 300,000,000 | 300,000,000 | ||||||||||||
ING Financial Markets LLC, dated1-13-2020, maturity value $351,487,014 (28) | 1.61 | 4-17-2020 | 350,000,000 | 350,000,000 | ||||||||||||
ING Financial Markets LLC, dated1-21-2020, maturity value $100,406,972 (29) | 1.61 | 4-21-2020 | 100,000,000 | 100,000,000 | ||||||||||||
ING Financial Markets LLC, dated1-31-2020, maturity value $350,751,333 (30) | 1.68 | 3-17-2020 | 350,000,000 | 350,000,000 | ||||||||||||
ING Financial Markets LLC, dated1-31-2020, maturity value $400,053,277 (31) | 1.59 | 2-3-2020 | 400,000,277 | 400,000,277 | ||||||||||||
ING Financial Markets LLC, dated1-7-2020, maturity value $300,405,583 (32) | 1.57 | 2-7-2020 | 300,000,000 | 300,000,000 | ||||||||||||
ING Financial Markets LLC, dated11-12-2019, maturity value $251,043,750 (33) | 1.67 | 2-10-2020 | 250,000,000 | 250,000,000 | ||||||||||||
ING Financial Markets LLC, dated11-4-2019, maturity value $100,801,417 (34) | 1.63 | 4-29-2020 | 100,000,000 | 100,000,000 | ||||||||||||
JPMorgan Securities, dated1-31-2020, maturity value $502,060,139 (35)§¢øø | 1.63 | 2-3-2020 | 500,000,000 | 500,000,000 | ||||||||||||
JPMorgan Securities, dated1-31-2020, maturity value $625,081,771 (36) | 1.57 | 2-3-2020 | 625,000,000 | 625,000,000 | ||||||||||||
Mitsubishi Bank, dated1-10-2020, maturity value $250,739,792 (37) | 1.59 | 3-17-2020 | 250,000,000 | 250,000,000 | ||||||||||||
Mizuho Bank, dated1-31-2020, maturity value $650,086,125 (38) | 1.59 | 2-3-2020 | 650,000,000 | 650,000,000 | ||||||||||||
The accompanying notes are an integral part of these financial statements.
Government Money Market Funds | 17
Table of Contents
Portfolio of investments—January 31, 2020
| Interest rate | Maturity date | Principal | Value | |||||||||||||
| Repurchase Agreements ^^ (continued) | ||||||||||||||||
MUFG Securities Canada Limited, dated1-28-2020, maturity value $250,074,375 (39)§¢øø | 1.53 | % | 2-4-2020 | $ | 250,000,000 | $ | 250,000,000 | |||||||||
MUFG Securities Canada Limited, dated1-31-2020, maturity value $1,900,251,750 (40) | 1.59 | 2-3-2020 | 1,900,000,000 | 1,900,000,000 | ||||||||||||
MUFG Securities Canada Limited, dated11-13-2019, maturity value $250,928,194 (41)§¢øø | 1.63 | 2-4-2020 | 250,000,000 | 250,000,000 | ||||||||||||
Nomura Securities International Incorporated, dated1-31-2020, maturity value $3,000,397,500 (42) | 1.59 | 2-3-2020 | 3,000,000,000 | 3,000,000,000 | ||||||||||||
Prudential Insurance Company of America, dated1-31-2020, maturity value $566,465,519 (43) | 1.60 | 2-3-2020 | 566,390,000 | 566,390,000 | ||||||||||||
RBC Capital Markets, dated1-31-2020, maturity value $2,500,331,250 (44) | 1.59 | 2-3-2020 | 2,500,000,000 | 2,500,000,000 | ||||||||||||
RBS Securities Incorporated, dated1-31-2020, maturity value $650,085,583 (45) | 1.58 | 2-3-2020 | 650,000,000 | 650,000,000 | ||||||||||||
Royal Bank of Canada, dated1-31-2020, maturity value $1,000,132,500 (46) | 1.59 | 2-3-2020 | 1,000,000,000 | 1,000,000,000 | ||||||||||||
Societe Generale, dated1-31-2020, maturity value $500,154,583 (47) | 1.59 | 2-7-2020 | 500,000,000 | 500,000,000 | ||||||||||||
Standard Chartered Bank, dated1-31-2020, maturity value $1,040,138,667 (48) | 1.60 | 2-3-2020 | 1,040,000,000 | 1,040,000,000 | ||||||||||||
Standard Chartered Bank, dated1-31-2020, maturity value $1,250,164,583 (49) | 1.58 | 2-3-2020 | 1,250,000,000 | 1,250,000,000 | ||||||||||||
Sumitomo Mitsui Banking Corporation, dated1-21-2020, maturity value $237,683,608 (50) | 1.69 | 2-4-2020 | 237,527,500 | 237,527,500 | ||||||||||||
Sumitomo Mitsui Banking Corporation, dated1-23-2020, maturity value $619,798,328 (51) | 1.69 | 2-6-2020 | 619,391,250 | 619,391,250 | ||||||||||||
Sumitomo Mitsui Banking Corporation, dated1-24-2020, maturity value $619,973,443 (52)§¢øø | 1.69 | 2-7-2020 | 619,566,250 | 619,566,250 | ||||||||||||
Sumitomo Mitsui Banking Corporation, dated1-28-2020, maturity value $295,801,661 (53)§¢øø | 1.69 | 2-10-2020 | 295,621,250 | 295,621,250 | ||||||||||||
Sumitomo Mitsui Banking Corporation, dated1-29-2020, maturity value $613,284,286 (54)§¢øø | 1.67 | 2-12-2020 | 612,886,250 | 612,886,250 | ||||||||||||
Sumitomo Mitsui Banking Corporation, dated1-30-2020, maturity value $237,305,026 (55)§¢øø | 1.74 | 2-18-2020 | 237,098,750 | 237,098,750 | ||||||||||||
TD Securities, dated1-31-2020, maturity value $650,086,125 (56) | 1.59 | 2-3-2020 | 650,000,000 | 650,000,000 | ||||||||||||
Total Repurchase Agreements (Cost $48,098,482,517) |
| 48,098,482,517 | ||||||||||||||
|
| |||||||||||||||
| Treasury Debt: 12.23% | ||||||||||||||||
U.S. Treasury Bill (z) | 1.64 | 4-16-2020 | 75,000,000 | 74,752,865 | ||||||||||||
U.S. Treasury Bill (z) | 1.70 | 4-9-2020 | 160,000,000 | 159,506,558 | ||||||||||||
U.S. Treasury Bill (z) | 1.84 | 4-2-2020 | 210,000,000 | 209,372,838 | ||||||||||||
U.S. Treasury Bill (z) | 1.85 | 3-12-2020 | 200,000,000 | 199,613,666 | ||||||||||||
U.S. Treasury Bill (z) | 1.87 | 2-20-2020 | 50,000,000 | 49,956,319 | ||||||||||||
U.S. Treasury Bill (z) | 1.88 | 3-19-2020 | 220,000,000 | 219,488,500 | ||||||||||||
U.S. Treasury Bill (z)## | 1.88 | 3-26-2020 | 620,000,000 | 618,335,407 | ||||||||||||
U.S. Treasury Bill (z) | 1.92 | 2-13-2020 | 70,000,000 | 69,963,056 | ||||||||||||
U.S. Treasury Bill (z) | 1.97 | 2-6-2020 | 250,000,000 | 249,959,417 | ||||||||||||
U.S. Treasury Note | 1.13 | 3-31-2020 | 255,000,000 | 254,660,846 | ||||||||||||
U.S. Treasury Note | 1.13 | 4-30-2020 | 240,000,000 | 239,631,884 | ||||||||||||
U.S. Treasury Note | 1.25 | 2-29-2020 | 370,000,000 | 369,782,608 | ||||||||||||
U.S. Treasury Note | 1.38 | 2-29-2020 | 100,000,000 | 99,952,242 | ||||||||||||
U.S. Treasury Note | 1.38 | 4-30-2020 | 150,000,000 | 149,746,525 | ||||||||||||
U.S. Treasury Note | 1.38 | 5-31-2020 | 120,000,000 | 119,806,722 | ||||||||||||
U.S. Treasury Note | 1.38 | 8-31-2020 | 193,613,000 | 193,119,382 | ||||||||||||
U.S. Treasury Note | 1.38 | 9-15-2020 | 70,000,000 | 69,880,371 | ||||||||||||
U.S. Treasury Note | 1.38 | 9-30-2020 | 80,000,000 | 79,874,144 | ||||||||||||
The accompanying notes are an integral part of these financial statements.
18 | Government Money Market Funds
Table of Contents
Portfolio of investments—January 31, 2020
| Interest rate | Maturity date | Principal | Value | |||||||||||||
| Treasury Debt (continued) | ||||||||||||||||
U.S. Treasury Note | 1.38 | % | 10-31-2020 | $ | 100,000,000 | $ | 99,818,147 | |||||||||
U.S. Treasury Note | 1.50 | 4-15-2020 | 30,000,000 | 29,967,271 | ||||||||||||
U.S. Treasury Note | 1.50 | 5-15-2020 | 80,000,000 | 79,881,987 | ||||||||||||
U.S. Treasury Note (U.S. Treasury 3 Month Bill Money Market Yield +0.05%)± | 1.58 | 10-31-2020 | 390,000,000 | 389,771,818 | ||||||||||||
U.S. Treasury Note | 1.63 | 6-30-2020 | 120,000,000 | 119,887,642 | ||||||||||||
U.S. Treasury Note | 1.63 | 10-15-2020 | 250,000,000 | 250,010,802 | ||||||||||||
U.S. Treasury Note | 1.63 | 11-30-2020 | 80,000,000 | 79,989,593 | ||||||||||||
U.S. Treasury Note (U.S. Treasury 3 Month Bill Money Market Yield +0.12%)± | 1.65 | 1-31-2021 | 1,120,000,000 | 1,119,582,097 | ||||||||||||
U.S. Treasury Note (U.S. Treasury 3 Month Bill Money Market Yield +0.14%)± | 1.67 | 4-30-2021 | 770,000,000 | 769,926,246 | ||||||||||||
U.S. Treasury Note | 1.75 | 11-15-2020 | 184,000,000 | 184,178,474 | ||||||||||||
U.S. Treasury Note (U.S. Treasury 3 Month Bill Money Market Yield +0.22%)± | 1.76 | 7-31-2021 | 120,017,000 | 119,993,946 | ||||||||||||
U.S. Treasury Note (U.S. Treasury 3 Month Bill Money Market Yield +0.30%)± | 1.84 | 10-31-2021 | 770,000,000 | 770,568,214 | ||||||||||||
U.S. Treasury Note | 2.00 | 11-30-2020 | 90,000,000 | 90,265,251 | ||||||||||||
U.S. Treasury Note | 2.13 | 8-31-2020 | 150,000,000 | 150,401,142 | ||||||||||||
U.S. Treasury Note | 2.25 | 2-29-2020 | 50,000,000 | 50,006,720 | ||||||||||||
U.S. Treasury Note | 2.25 | 3-31-2020 | 230,000,000 | 230,106,616 | ||||||||||||
U.S. Treasury Note | 2.38 | 4-30-2020 | 270,000,000 | 270,293,107 | ||||||||||||
U.S. Treasury Note | 2.50 | 5-31-2020 | 220,000,000 | 220,411,989 | ||||||||||||
U.S. Treasury Note | 2.50 | 12-31-2020 | 100,000,000 | 100,794,742 | ||||||||||||
U.S. Treasury Note | 2.63 | 7-31-2020 | 540,000,000 | 542,418,810 | ||||||||||||
U.S. Treasury Note | 2.63 | 11-15-2020 | 531,900,000 | 535,828,474 | ||||||||||||
U.S. Treasury Note (z) | 2.75 | 9-30-2020 | 340,861,000 | 343,385,226 | ||||||||||||
U.S. Treasury Note | 2.75 | 11-30-2020 | 295,000,000 | 297,634,107 | ||||||||||||
U.S. Treasury Note | 2.88 | 10-31-2020 | 200,000,000 | 201,779,502 | ||||||||||||
U.S. Treasury Note | 3.50 | 5-15-2020 | 90,000,000 | 90,403,782 | ||||||||||||
U.S. Treasury Note | 3.63 | 2-15-2020 | 100,000,000 | 100,049,559 | ||||||||||||
Total Treasury Debt (Cost $10,664,758,614) | 10,664,758,614 | |||||||||||||||
|
| |||||||||||||||
| Total investments in securities (Cost $86,469,493,563) | 99.12 | % | 86,469,493,563 | |||||
Other assets and liabilities, net | 0.88 | 769,194,405 | ||||||
|
|
|
| |||||
| Total net assets | 100.00 | % | $ | 87,238,687,968 | ||||
|
|
|
| |||||
| ± | Variable rate investment. The rate shown is the rate in effect at period end. |
| (z) | Zero coupon security. The rate represents the current yield to maturity. |
| %% | The security is purchased on a when-issued basis. |
| § | The security is subject to a demand feature which reduces the effective maturity. |
| ø | Variable rate demand notes are subject to a demand feature which reduces the effective maturity. The maturity date shown represents the final maturity date of the security. The interest rate is determined and reset by the issuer daily, weekly, or monthly depending upon the terms of the security. The rate shown is the rate in effect at period end. |
| ¢ | The security represents a long-dated and extendible repurchase agreement which automatically renews on previously set terms. The maturity date represents the next put date. |
| øø | The interest rate is determined and reset by the issuer periodically depending upon the terms of the security. The rate shown is the rate in effect at period end. |
| ## | All or a portion of this security is segregated for when-issued securities. |
| ^^ | Collateralized by: |
| (1) | U.S. government securities, 3.00% to 3.50%,1-20-2045 to7-20-2045, fair value including accrued interest is $1,313,250,000. |
| (2) | U.S. government securities, 1.76% to 7.50%,7-13-2022 to12-20-2069, fair value including accrued interest is $360,472,102. |
| (3) | U.S. government securities, 2.50% to 5.50%,5-1-2030 to4-20-2069, fair value including accrued interest is $360,500,001. |
| (4) | U.S. government securities, 2.40% to 6.00%,1-15-2030 to10-1-2049, fair value including accrued interest is $690,100,000. |
| (5) | U.S. government securities, 2.50% to 4.00%,1-1-2035 to1-1-2050, fair value including accrued interest is $515,000,000. |
The accompanying notes are an integral part of these financial statements.
Government Money Market Funds | 19
Table of Contents
Portfolio of investments—January 31, 2020
| (6) | U.S. government securities, 3.00%,1-1-2050, fair value including accrued interest is $515,000,001. |
| (7) | U.S. government securities, 3.00% to 3.50%,10-20-2043 to5-20-2046, fair value including accrued interest is $206,000,000. |
| (8) | U.S. government securities, 0.00% to 7.00%,5-15-2020 to1-1-2050, fair value including accrued interest is $562,913,785. |
| (9) | U.S. government securities, 0.00% to 6.50%,2-27-2020 to11-1-2049, fair value including accrued interest is $256,066,839. |
| (10) | U.S. government securities, 0.00% to 8.75%,2-13-2020 to5-15-2049, fair value including accrued interest is $1,938,000,014. |
| (11) | U.S. government securities, 0.00% to 7.00%,11-15-2022 to10-1-2049, fair value including accrued interest is $102,574,422. |
| (12) | U.S. government securities, 0.00% to 8.88%,3-5-2020 to9-15-2065, fair value including accrued interest is $255,070,529. |
| (13) | U.S. government securities, 0.00% to 10.50%,3-5-2020 to9-15-2065, fair value including accrued interest is $255,164,339. |
| (14) | U.S. government securities, 0.00% to 8.13%,9-30-2026 to6-1-2056, fair value including accrued interest is $257,319,396. |
| (15) | U.S. government securities, 0.00% to 9.50%,4-30-2020 to9-15-2060, fair value including accrued interest is $511,696,601. |
| (16) | U.S. government securities, 2.88% to 3.00%,5-31-2025 to10-20-2049, fair value including accrued interest is $308,779,131. |
| (17) | U.S. government securities, 3.50% to 4.00%,2-20-2049 to6-20-2049, fair value including accrued interest is $515,000,000. |
| (18) | U.S. government securities, 1.63% ,5-15-2026, fair value including accrued interest is $153,000,051. |
| (19) | U.S. government securities, 0.00% to 6.50%,2-11-2020 to1-20-2050, fair value including accrued interest is $1,029,535,481. |
| (20) | U.S. government securities, 2.25% to 5.50%,6-30-2023 to1-1-2050, fair value including accrued interest is $1,025,407,929. |
| (21) | U.S. government securities, 0.00% to 6.25%,3-31-2020 to8-15-2048, fair value including accrued interest is $765,000,043. |
| (22) | U.S. government securities, 1.88% to 2.50%,2-15-2022 to3-15-2022, fair value including accrued interest is $1,020,001,038. |
| (23) | U.S. government securities, 0.38% to 4.75%,4-15-2023 to2-15-2049, fair value including accrued interest is $13,770,001,010. |
| (24) | U.S. government securities, 0.00% to 2.63%,1-15-2021 to11-15-2026, fair value including accrued interest is $969,011,610. |
| (25) | U.S. government securities, 0.00% to 8.75%,8-15-2020 to2-15-2049, fair value including accrued interest is $204,007,432. |
| (26) | U.S. government securities, 0.13% to 0.75%,1-15-2030 to2-15-2042, fair value including accrued interest is $510,000,006. |
| (27) | U.S. government securities, 2.40% to 6.00%,12-1-2025 to5-1-2058, fair value including accrued interest is $309,000,000. |
| (28) | U.S. government securities, 2.77% to 7.00%,1-1-2026 to9-1-2057, fair value including accrued interest is $360,500,001. |
| (29) | U.S. government securities, 2.40% to 7.00%,7-1-2024 to9-1-2057, fair value including accrued interest is $103,000,000. |
| (30) | U.S. government securities, 2.35% to 5.50%,8-1-2024 to5-1-2058, fair value including accrued interest is $360,500,000. |
| (31) | U.S. government securities, 1.38% to 2.38%,4-15-2021 to8-31-2026, fair value including accrued interest is $408,163,548. |
| (32) | U.S. government securities, 2.35% to 6.50%,11-1-2027 to9-1-2057, fair value including accrued interest is $309,000,000. |
| (33) | U.S. government securities, 2.31% to 5.50%,2-1-2027 to9-1-2057, fair value including accrued interest is $257,500,379. |
| (34) | U.S. government securities, 2.77% to 5.50%,11-1-2024 to5-1-2058, fair value including accrued interest is $103,000,000. |
| (35) | U.S. government securities, 0.00% to 8.88%,7-15-2022 to5-15-2049, fair value including accrued interest is $510,324,579. |
| (36) | U.S. government securities, 2.88% to 3.00%,9-30-2023 to2-15-2048, fair value including accrued interest is $637,500,034. |
| (37) | U.S. government securities, 0.00% to 5.50%,1-21-2022 to11-1-2049, fair value including accrued interest is $256,961,468. |
| (38) | U.S. government securities, 2.50% to 4.00%,3-20-2049 to1-1-2050 , fair value including accrued interest is $669,500,000. |
| (39) | U.S. government securities, 0.13% to 4.75%,10-15-2024 to2-15-2049, fair value including accrued interest is $255,000,005. |
| (40) | U.S. government securities, 1.13% to 5.50%,5-31-2020 to1-1-2050, fair value including accrued interest is $1,955,423,602. |
| (41) | U.S. government securities, 1.75% to 4.00%,2-28-2022 to4-1-2047, fair value including accrued interest is $257,499,939. |
| (42) | U.S. government securities, 0.00% to 9.50%,2-25-2020 to10-20-2069, fair value including accrued interest is $3,089,232,172. |
| (43) | U.S. government securities, 0.00% to 3.00%,5-15-2020 to5-15-2045, fair value including accrued interest is $577,717,800. |
| (44) | U.S. government securities, 0.00% to 6.00%,3-3-2020 to12-1-2049, fair value including accrued interest is $2,572,540,552. |
| (45) | U.S. government securities, 0.00% to 1.00%,2-15-2020 to11-15-2049, fair value including accrued interest is $663,000,052. |
| (46) | U.S. government securities, 3.00% to 9.50%,8-15-2020 to8-15-2058, fair value including accrued interest is $1,030,000,000. |
| (47) | U.S. government securities, 0.38% to 4.50%,1-15-2027 to12-20-2049, fair value including accrued interest is $514,997,585. |
| (48) | U.S. government securities, 0.00% to 6.50%,3-26-2020 to1-1-2050, fair value including accrued interest is $1,066,972,879. |
| (49) | U.S. government securities, 0.13% to 4.75%,4-15-2020 to11-15-2049, fair value including accrued interest is $1,275,000,021. |
| (50) | U.S. government securities, 2.00% to 3.50%,1-15-2021 to2-1-2047, fair value including accrued interest is $244,937,664. |
| (51) | U.S. government securities, 3.00% to 4.00%,12-1-2046 to11-1-2047, fair value including accrued interest is $638,392,392. |
| (52) | U.S. government securities, 3.50% to 4.00%,8-1-2047 to6-1-2048, fair value including accrued interest is $638,640,658. |
| (53) | U.S. government securities, 3.50% ,10-1-2047 to12-1-2047, fair value including accrued interest is $304,856,635. |
| (54) | U.S. government securities, 1.75% to 3.00%,5-15-2023 to5-15-2047, fair value including accrued interest is $625,217,949. |
| (55) | U.S. government securities, 2.00% to 3.50%,1-15-2021 to2-1-2047, fair value including accrued interest is $244,879,314. |
| (56) | U.S. government securities, 2.50% to 5.00%,9-1-2042 to1-1-2049, fair value including accrued interest is $669,500,001. |
The accompanying notes are an integral part of these financial statements.
20 | Government Money Market Funds
Table of Contents
Portfolio of investments—January 31, 2020
Abbreviations:
| FFCB | Federal Farm Credit Banks |
| FHLB | Federal Home Loan Bank |
| FHLMC | Federal Home Loan Mortgage Corporation |
| FNMA | Federal National Mortgage Association |
| LIBOR | London Interbank Offered Rate |
| LOC | Letter of credit |
| PFA | Public Finance Authority |
| SOFR | Secured Overnight Financing Rate |
The accompanying notes are an integral part of these financial statements.
Government Money Market Funds | 21
Table of Contents
Statement of assets and liabilities—January 31, 2020
Assets | ||||
Investments in repurchase agreements, at amortized cost | $ | 48,098,482,517 | ||
Investments in unaffiliated securities, at amortized cost | 38,371,011,046 | |||
Cash | 1,540,229,702 | |||
Receivable for Fund shares sold | 3,878,426 | |||
Receivable for interest | 77,544,258 | |||
Prepaid expenses and other assets | 1,375,439 | |||
|
| |||
Total assets | 88,092,521,388 | |||
|
| |||
Liabilities | ||||
Payable for investments purchased | 738,821,868 | |||
Payable for Fund shares redeemed | 43,175,434 | |||
Management fee payable | 8,198,037 | |||
Dividends payable | 58,016,154 | |||
Administration fees payable | 4,530,826 | |||
Trustees’ fees and expenses payable | 4,069 | |||
Accrued expenses and other liabilities | 1,087,032 | |||
|
| |||
Total liabilities | 853,833,420 | |||
|
| |||
Total net assets | $ | 87,238,687,968 | ||
|
| |||
Net assets consist of | ||||
Paid-in capital | $ | 87,238,512,631 | ||
Total distributable earnings | 175,337 | |||
|
| |||
Total net assets | $ | 87,238,687,968 | ||
|
| |||
Computation of net asset value per share | ||||
Net assets – Class A | $ | 366,601,099 | ||
Shares outstanding – Class A1 | 366,599,283 | |||
Net asset value per share – Class A | $1.00 | |||
Net assets – Administrator Class | $ | 3,893,928,220 | ||
Shares outstanding – Administrator Class1 | 3,893,914,682 | |||
Net asset value per share – Administrator Class | $1.00 | |||
Net assets – Institutional Class | $ | 29,028,517,328 | ||
Shares outstanding – Institutional Class1 | 29,028,611,134 | |||
Net asset value per share – Institutional Class | $1.00 | |||
Net assets – Select Class | $ | 51,954,718,338 | ||
Shares outstanding – Select Class1 | 51,954,541,905 | |||
Net asset value per share – Select Class | $1.00 | |||
Net assets – Service Class | $ | 1,994,922,983 | ||
Shares outstanding – Service Class1 | 1,994,907,531 | |||
Net asset value per share – Service Class | $1.00 | |||
| 1 | The Fund has an unlimited number of authorized shares. |
The accompanying notes are an integral part of these financial statements.
22 | Government Money Market Funds
Table of Contents
Statement of operations—year ended January 31, 2020
Investment income | ||||
Interest | $ | 1,749,017,383 | ||
|
| |||
Expenses | ||||
Management fee | 107,010,542 | |||
Administration fees |
| |||
Class A | 756,657 | |||
Administrator Class | 2,848,987 | |||
Institutional Class | 22,137,472 | |||
Select Class | 19,332,052 | |||
Service Class | 2,352,790 | |||
Sweep Class | 24 | 1 | ||
Shareholder servicing fees |
| |||
Class A | 859,838 | |||
Administrator Class | 2,848,571 | |||
Service Class | 4,890,050 | |||
Sweep Class | 210 | 1 | ||
Distribution fee |
| |||
Sweep Class | 292 | 1 | ||
Custody and accounting fees | 2,225,884 | |||
Professional fees | 59,861 | |||
Registration fees | 403,872 | |||
Shareholder report expenses | 143,776 | |||
Trustees’ fees and expenses | 21,068 | |||
Other fees and expenses | 546,428 | |||
|
| |||
Total expenses | 166,438,374 | |||
Less: Fee waivers and/or expense reimbursements |
| |||
Class A | (20,999 | ) | ||
Institutional Class | (4,439,380 | ) | ||
Select Class | (17,421,730 | ) | ||
Service Class | (108,575 | ) | ||
|
| |||
Net expenses | 144,447,690 | |||
|
| |||
Net investment income | 1,604,569,693 | |||
Net realized gains on investments | 123,388 | |||
|
| |||
Net increase in net assets resulting from operations | $ | 1,604,693,081 | ||
|
| |||
| 1 | For the period from February 1, 2019 to November 29, 2019. Effective at the close of business on November 29, 2019, Sweep Class shares were liquidated and the class was subsequently closed. Sweep Class shares are no longer offered by the Fund. |
The accompanying notes are an integral part of these financial statements.
Government Money Market Funds | 23
Table of Contents
Statement of changes in net assets
| Year ended January 31, 2020 | Year ended January 31, 2019 | |||||||||||||||
Operations |
| |||||||||||||||
Net investment income | $ | 1,604,569,693 | $ | 1,305,787,958 | ||||||||||||
Net realized gains on investments | 123,388 | 113,882 | ||||||||||||||
|
| |||||||||||||||
Net increase in net assets resulting from operations | 1,604,693,081 | 1,305,901,840 | ||||||||||||||
|
| |||||||||||||||
Distributions to shareholders from net investment income and net realized gains | ||||||||||||||||
Class A | (5,339,379 | ) | (3,957,680 | ) | ||||||||||||
Administrator Class | (51,521,355 | ) | (29,903,434 | ) | ||||||||||||
Institutional Class | (543,232,986 | ) | (426,556,283 | ) | ||||||||||||
Select Class | (971,999,530 | ) | (811,926,883 | ) | ||||||||||||
Service Class | (32,589,068 | ) | (33,480,248 | ) | ||||||||||||
Sweep Class | (1,259 | )1 | (1,208 | ) | ||||||||||||
|
| |||||||||||||||
Total distributions to shareholders | (1,604,683,577 | ) | (1,305,825,736 | ) | ||||||||||||
|
| |||||||||||||||
Capital share transactions | Shares | Shares | ||||||||||||||
Proceeds from shares sold |
| |||||||||||||||
Class A | 361,105,716 | 361,105,716 | 180,404,669 | 180,404,669 | ||||||||||||
Administrator Class | 15,322,500,119 | 15,322,500,119 | 12,061,432,644 | 12,061,432,644 | ||||||||||||
Institutional Class | 194,991,151,341 | 194,991,151,341 | 167,832,722,754 | 167,832,722,754 | ||||||||||||
Select Class | 507,196,735,507 | 507,196,735,507 | 503,603,165,936 | 503,603,165,936 | ||||||||||||
Service Class | 61,032,711,500 | 61,032,711,500 | 67,069,453,268 | 67,069,453,268 | ||||||||||||
|
| |||||||||||||||
| 778,904,204,183 | 750,747,179,271 | |||||||||||||||
|
| |||||||||||||||
Reinvestment of distributions |
| |||||||||||||||
Class A | 5,298,655 | 5,298,655 | 3,921,415 | 3,921,415 | ||||||||||||
Administrator Class | 17,301,405 | 17,301,405 | 9,796,111 | 9,796,111 | ||||||||||||
Institutional Class | 171,548,607 | 171,548,607 | 141,402,397 | 141,402,397 | ||||||||||||
Select Class | 629,171,721 | 629,171,721 | 518,390,777 | 518,390,777 | ||||||||||||
Service Class | 3,567,610 | 3,567,610 | 4,616,938 | 4,616,938 | ||||||||||||
|
| |||||||||||||||
| 826,887,998 | 678,127,638 | |||||||||||||||
|
| |||||||||||||||
Payment for shares redeemed |
| |||||||||||||||
Class A | (311,423,075 | ) | (311,423,075 | ) | (137,442,666 | ) | (137,442,666 | ) | ||||||||
Administrator Class | (13,857,369,572 | ) | (13,857,369,572 | ) | (11,214,508,321 | ) | (11,214,508,321 | ) | ||||||||
Institutional Class | (192,134,616,614 | ) | (192,134,616,614 | ) | (163,904,920,231 | ) | (163,904,920,231 | ) | ||||||||
Select Class | (501,206,742,646 | ) | (501,206,742,646 | ) | (505,074,881,063 | ) | (505,074,881,063 | ) | ||||||||
Service Class | (60,897,748,273 | ) | (60,897,748,273 | ) | (67,724,591,715 | ) | (67,724,591,715 | ) | ||||||||
Sweep Class | (100,075 | )1 | (100,075 | )1 | 0 | 0 | ||||||||||
|
| |||||||||||||||
| (768,408,000,255 | ) | (748,056,343,996 | ) | |||||||||||||
|
| |||||||||||||||
Net increase in net assets resulting from capital share transactions | 11,323,091,926 | 3,368,962,913 | ||||||||||||||
|
| |||||||||||||||
Total increase in net assets | 11,323,101,430 | 3,369,039,017 | ||||||||||||||
|
| |||||||||||||||
Net assets | ||||||||||||||||
Beginning of period | 75,915,586,538 | 72,546,547,521 | ||||||||||||||
|
| |||||||||||||||
End of period | $ | 87,238,687,968 | $ | 75,915,586,538 | ||||||||||||
|
| |||||||||||||||
| 1 | For the period from February 1, 2019 to November 29, 2019. Effective at the close of business on November 29, 2019, Sweep Class shares were liquidated and the class was subsequently closed. Sweep Class shares are no longer offered by the Fund. |
The accompanying notes are an integral part of these financial statements.
24 | Government Money Market Funds
Table of Contents
(For a share outstanding throughout each period)
| Year ended January 31 | ||||||||||||||||||||
| CLASS A | 2020 | 2019 | 2018 | 2017 | 2016 | |||||||||||||||
Net asset value, beginning of period | $1.00 | $1.00 | $1.00 | $1.00 | $1.00 | |||||||||||||||
Net investment income | 0.02 | 0.01 | 0.00 | 1 | 0.00 | 1 | 0.00 | 1 | ||||||||||||
Net realized gains on investments | 0.00 | 1 | 0.00 | 1 | 0.00 | 1 | 0.00 | 1 | 0.00 | 1 | ||||||||||
|
|
|
|
|
|
|
|
|
| |||||||||||
Total from investment operations | 0.02 | 0.01 | 0.00 | 1 | 0.00 | 1 | 0.00 | 1 | ||||||||||||
Distributions to shareholders from | ||||||||||||||||||||
Net investment income | (0.02 | ) | (0.01 | ) | (0.00 | )1 | (0.00 | )1 | (0.00 | )1 | ||||||||||
Net realized gains | (0.00 | )1 | (0.00 | )1 | (0.00 | )1 | 0.00 | 0.00 | ||||||||||||
|
|
|
|
|
|
|
|
|
| |||||||||||
Total distributions to shareholders | (0.02 | ) | (0.01 | ) | (0.00 | )1 | (0.00 | )1 | (0.00 | )1 | ||||||||||
Net asset value, end of period | $1.00 | $1.00 | $1.00 | $1.00 | $1.00 | |||||||||||||||
Total return | 1.59 | % | 1.38 | % | 0.38 | % | 0.01 | % | 0.01 | % | ||||||||||
Ratios to average net assets (annualized) | ||||||||||||||||||||
Gross expenses | 0.61 | % | 0.61 | % | 0.61 | % | 0.61 | % | 0.61 | % | ||||||||||
Net expenses | 0.60 | % | 0.60 | % | 0.61 | % | 0.41 | % | 0.13 | % | ||||||||||
Net investment income | 1.56 | % | 1.39 | % | 0.38 | % | 0.01 | % | 0.01 | % | ||||||||||
Supplemental data | ||||||||||||||||||||
Net assets, end of period (000s omitted) | $366,601 | $311,616 | $264,735 | $274,083 | $265,119 | |||||||||||||||
| 1 | Amount is less than $0.005. |
The accompanying notes are an integral part of these financial statements.
Government Money Market Funds | 25
Table of Contents
Financial highlights
(For a share outstanding throughout each period)
| Year ended January 31 | ||||||||||||||||||||
| ADMINISTRATOR CLASS | 2020 | 2019 | 2018 | 2017 | 2016 | |||||||||||||||
Net asset value, beginning of period | $1.00 | $1.00 | $1.00 | $1.00 | $1.00 | |||||||||||||||
Net investment income | 0.02 | 0.02 | 0.01 | 0.00 | 1 | 0.00 | 1 | |||||||||||||
Net realized gains on investments | 0.00 | 1 | 0.00 | 1 | 0.00 | 1 | 0.00 | 1 | 0.00 | 1 | ||||||||||
|
|
|
|
|
|
|
|
|
| |||||||||||
Total from investment operations | 0.02 | 0.02 | 0.01 | 0.00 | 1 | 0.00 | 1 | |||||||||||||
Distributions to shareholders from | ||||||||||||||||||||
Net investment income | (0.02 | ) | (0.02 | ) | (0.01 | ) | (0.00 | )1 | (0.00 | )1 | ||||||||||
Net realized gains | (0.00 | )1 | (0.00 | )1 | (0.00 | )1 | 0.00 | 0.00 | ||||||||||||
|
|
|
|
|
|
|
|
|
| |||||||||||
Total distributions to shareholders | (0.02 | ) | (0.02 | ) | (0.01 | ) | (0.00 | )1 | (0.00 | )1 | ||||||||||
Net asset value, end of period | $1.00 | $1.00 | $1.00 | $1.00 | $1.00 | |||||||||||||||
Total return | 1.85 | % | 1.65 | % | 0.65 | % | 0.10 | % | 0.01 | % | ||||||||||
Ratios to average net assets (annualized) | ||||||||||||||||||||
Gross expenses | 0.34 | % | 0.34 | % | 0.34 | % | 0.34 | % | 0.34 | % | ||||||||||
Net expenses | 0.34 | % | 0.34 | % | 0.34 | % | 0.31 | % | 0.12 | % | ||||||||||
Net investment income | 1.81 | % | 1.67 | % | 0.72 | % | 0.11 | % | 0.01 | % | ||||||||||
Supplemental data | ||||||||||||||||||||
Net assets, end of period (000s omitted) | $3,893,928 | $2,411,490 | $1,554,764 | $443,500 | $382,043 | |||||||||||||||
| 1 | Amount is less than $0.005. |
The accompanying notes are an integral part of these financial statements.
26 | Government Money Market Funds
Table of Contents
Financial highlights
(For a share outstanding throughout each period)
| Year ended January 31 | ||||||||||||||||||||
| INSTITUTIONAL CLASS | 2020 | 2019 | 2018 | 2017 | 2016 | |||||||||||||||
Net asset value, beginning of period | $1.00 | $1.00 | $1.00 | $1.00 | $1.00 | |||||||||||||||
Net investment income | 0.02 | 0.02 | 0.01 | 0.00 | 1 | 0.00 | 1 | |||||||||||||
Net realized gains on investments | 0.00 | 1 | 0.00 | 1 | 0.00 | 1 | 0.00 | 1 | 0.00 | 1 | ||||||||||
|
|
|
|
|
|
|
|
|
| |||||||||||
Total from investment operations | 0.02 | 0.02 | 0.01 | 0.00 | 1 | 0.00 | 1 | |||||||||||||
Distributions to shareholders from | ||||||||||||||||||||
Net investment income | (0.02 | ) | (0.02 | ) | (0.01 | ) | (0.00 | )1 | (0.00 | )1 | ||||||||||
Net realized gains | (0.00 | )1 | (0.00 | )1 | (0.00 | )1 | 0.00 | 0.00 | ||||||||||||
|
|
|
|
|
|
|
|
|
| |||||||||||
Total distributions to shareholders | (0.02 | ) | (0.02 | ) | (0.01 | ) | (0.00 | )1 | (0.00 | )1 | ||||||||||
Net asset value, end of period | $1.00 | $1.00 | $1.00 | $1.00 | $1.00 | |||||||||||||||
Total return | 1.99 | % | 1.79 | % | 0.79 | % | 0.24 | % | 0.02 | % | ||||||||||
Ratios to average net assets (annualized) | ||||||||||||||||||||
Gross expenses | 0.22 | % | 0.22 | % | 0.22 | % | 0.22 | % | 0.22 | % | ||||||||||
Net expenses | 0.20 | % | 0.20 | % | 0.20 | % | 0.17 | % | 0.12 | % | ||||||||||
Net investment income | 1.97 | % | 1.79 | % | 0.79 | % | 0.25 | % | 0.02 | % | ||||||||||
Supplemental data | ||||||||||||||||||||
Net assets, end of period (000s omitted) | $29,028,517 | $26,000,569 | $21,931,321 | $23,242,417 | $14,212,988 | |||||||||||||||
| 1 | Amount is less than $0.005. |
The accompanying notes are an integral part of these financial statements.
Government Money Market Funds | 27
Table of Contents
Financial highlights
(For a share outstanding throughout each period)
| Year ended January 31 | ||||||||||||||||||||
| SELECT CLASS | 2020 | 2019 | 2018 | 2017 | 20161 | |||||||||||||||
Net asset value, beginning of period | $1.00 | $1.00 | $1.00 | $1.00 | $1.00 | |||||||||||||||
Net investment income | 0.02 | 0.02 | 0.01 | 0.00 | 2 | 0.00 | 2 | |||||||||||||
Net realized gains on investments | 0.00 | 2 | 0.00 | 2 | 0.00 | 2 | 0.00 | 2 | 0.00 | 2 | ||||||||||
|
|
|
|
|
|
|
|
|
| |||||||||||
Total from investment operations | 0.02 | 0.02 | 0.01 | 0.00 | 2 | 0.00 | 2 | |||||||||||||
Distributions to shareholders from | ||||||||||||||||||||
Net investment income | (0.02 | ) | (0.02 | ) | (0.01 | ) | (0.00 | )2 | (0.00 | )2 | ||||||||||
Net realized gains | (0.00 | )2 | (0.00 | )2 | (0.00 | )2 | 0.00 | 0.00 | ||||||||||||
|
|
|
|
|
|
|
|
|
| |||||||||||
Total distributions to shareholders | (0.02 | ) | (0.02 | ) | (0.01 | ) | (0.00 | )2 | (0.00 | )2 | ||||||||||
Net asset value, end of period | $1.00 | $1.00 | $1.00 | $1.00 | $1.00 | |||||||||||||||
Total return3 | 2.05 | % | 1.85 | % | 0.85 | % | 0.30 | % | 0.04 | % | ||||||||||
Ratios to average net assets (annualized) | ||||||||||||||||||||
Gross expenses | 0.18 | % | 0.18 | % | 0.18 | % | 0.18 | % | 0.18 | % | ||||||||||
Net expenses | 0.14 | % | 0.14 | % | 0.14 | % | 0.11 | % | 0.10 | % | ||||||||||
Net investment income | 2.02 | % | 1.82 | % | 0.86 | % | 0.34 | % | 0.08 | % | ||||||||||
Supplemental data | ||||||||||||||||||||
Net assets, end of period (000s omitted) | $51,954,718 | $45,335,385 | $46,288,730 | $38,999,425 | $7,985,195 | |||||||||||||||
| 1 | For the period from June 30, 2015 (commencement of class operations) to January 31, 2016 |
| 2 | Amount is less than $0.005. |
| 3 | Returns for periods of less than one year are not annualized. |
The accompanying notes are an integral part of these financial statements.
28 | Government Money Market Funds
Table of Contents
Financial highlights
(For a share outstanding throughout each period)
| Year ended January 31 | ||||||||||||||||||||
| SERVICE CLASS | 2020 | 2019 | 2018 | 2017 | 2016 | |||||||||||||||
Net asset value, beginning of period | $1.00 | $1.00 | $1.00 | $1.00 | $1.00 | |||||||||||||||
Net investment income | 0.02 | 0.01 | 0.00 | 1 | 0.00 | 1 | 0.00 | 1 | ||||||||||||
Net realized gains on investments | 0.00 | 1 | 0.00 | 1 | 0.00 | 1 | 0.00 | 1 | 0.00 | 1 | ||||||||||
|
|
|
|
|
|
|
|
|
| |||||||||||
Total from investment operations | 0.02 | 0.01 | 0.00 | 1 | 0.00 | 1 | 0.00 | 1 | ||||||||||||
Distributions to shareholders from | ||||||||||||||||||||
Net investment income | (0.02 | ) | (0.01 | ) | (0.00 | )1 | (0.00 | )1 | (0.00 | )1 | ||||||||||
Net realized gains | (0.00 | )1 | (0.00 | )1 | (0.00 | )1 | 0.00 | 0.00 | ||||||||||||
|
|
|
|
|
|
|
|
|
| |||||||||||
Total distributions to shareholders | (0.02 | ) | (0.01 | ) | (0.00 | )1 | (0.00 | )1 | (0.00 | )1 | ||||||||||
Net asset value, end of period | $1.00 | $1.00 | $1.00 | $1.00 | $1.00 | |||||||||||||||
Total return | 1.69 | % | 1.48 | % | 0.49 | % | 0.02 | % | 0.01 | % | ||||||||||
Ratios to average net assets (annualized) | ||||||||||||||||||||
Gross expenses | 0.51 | % | 0.51 | % | 0.51 | % | 0.51 | % | 0.51 | % | ||||||||||
Net expenses | 0.50 | % | 0.50 | % | 0.50 | % | 0.40 | % | 0.13 | % | ||||||||||
Net investment income | 1.67 | % | 1.45 | % | 0.48 | % | 0.02 | % | 0.01 | % | ||||||||||
Supplemental data | ||||||||||||||||||||
Net assets, end of period (000s omitted) | $1,994,923 | $1,856,426 | $2,506,898 | $2,992,780 | $2,963,813 | |||||||||||||||
| 1 | Amount is less than $0.005. |
The accompanying notes are an integral part of these financial statements.
Government Money Market Funds | 29
Table of Contents
1. ORGANIZATION
Wells Fargo Funds Trust (the “Trust”), a Delaware statutory trust organized on March 10, 1999, is anopen-end management investment company registered under the Investment Company Act of 1940, as amended (the “1940 Act”). As an investment company, the Trust follows the accounting and reporting guidance in Financial Accounting Standards Board (“FASB”)Accounting Standards Codification Topic 946, Financial Services – Investment Companies. These financial statements report on the Wells Fargo Government Money Market Fund (the “Fund”) which is a diversified series of the Trust.
Effective at the close of business on November 29, 2019, Sweep Class shares were liquidated and are no longer offered by the Fund. Information for Sweep Class shares reflected in the financial statements represents activity through November 29, 2019.
2. SIGNIFICANT ACCOUNTING POLICIES
The following significant accounting policies, which are consistently followed in the preparation of the financial statements of the Fund, are in conformity with U.S. generally accepted accounting principles which require management to make estimates and assumptions that affect the reported amounts of assets and liabilities, disclosure of contingent assets and liabilities at the date of the financial statements, and the reported amounts of revenues and expenses during the reporting period. Actual results could differ from those estimates.
Securities valuation
As permitted under Rule2a-7 of the 1940 Act, portfolio securities are valued at amortized cost, which approximates fair value. The amortized cost method involves valuing a security at its cost, plus accretion of discount or minus amortization of premium over the period until maturity.
Investments which are not valued using the method discussed above are valued at their fair value, as determined in good faith by the Board of Trustees of the Fund. The Board of Trustees has established a Valuation Committee comprised of the Trustees and has delegated to it the authority to take any actions regarding the valuation of portfolio securities that the Valuation Committee deems necessary or appropriate, including determining the fair value of portfolio securities, unless the determination has been delegated to the Wells Fargo Asset Management Pricing Committee at Wells Fargo Funds Management, LLC (“Funds Management”). The Board of Trustees retains the authority to make or ratify any valuation decisions or approve any changes to the Valuation Procedures as it deems appropriate. On a quarterly basis, the Board of Trustees receives reports on any valuation actions taken by the Valuation Committee or the Wells Fargo Asset Management Pricing Committee which may include items for ratification.
Repurchase agreements
The Fund may invest in repurchase agreements and may participate in pooled repurchase agreement transactions with other funds advised by Funds Management. Repurchase agreements are agreements where the seller of a security to the Fund agrees to repurchase that security from the Fund at a mutually agreed upon time and price. The repurchase agreements must be fully collateralized based on values that aremarked-to-market daily. The collateral may be held by an agent bank under atri-party agreement. It is the custodian’s responsibility to value collateral daily and to take action to obtain additional collateral as necessary to maintain a market value equal to or greater than the resale price. The repurchase agreements are collateralized by securities issued or guaranteed by the U.S. Government, its agencies or instrumentalities. There could be potential loss to the Fund in the event that the Fund is delayed or prevented from exercising its rights to dispose of the collateral, including the risk of a possible decline in the value of the underlying obligations during the period in which the Fund seeks to assert its rights.
When-issued transactions
The Fund may purchase securities on a forward commitment or when-issued basis. The Fund records a when-issued transaction on the trade date and will segregate assets in an amount at least equal in value to the Fund’s commitment to purchase when-issued securities. Securities purchased on a when-issued basis aremarked-to-market daily and the Fund begins earning interest on the settlement date. Losses may arise due to changes in the market value of the underlying securities or if the counterparty does not perform under the contract.
Security transactions and income recognition
Securities transactions are recorded on a trade date basis. Realized gains or losses are recorded on the basis of identified cost.
Interest income is accrued daily and bond discounts are accreted and premiums are amortized daily. To the extent debt obligations are placed onnon-accrual status, any related interest income may be reduced by writing off interest receivables when the collection of all or a portion of interest has been determined to be doubtful based on consistently applied procedures and the fair value has decreased. If the issuer subsequently resumes interest payments or when the collectability of interest is reasonably assured, the debt obligation is removed fromnon-accrual status.
30 | Government Money Market Funds
Table of Contents
Notes to financial statements
Distributions to shareholders
Distributions to shareholders from net investment income are declared daily and paid monthly. Distributions from net realized gains, if any, are recorded on theex-dividend date and paid at least annually. Such distributions are determined in accordance with income tax regulations and may differ from U.S. generally accepted accounting principles. Dividend sources are estimated at the time of declaration. The tax character of distributions is determined as of the Fund’s fiscal year end. Therefore, a portion of the Fund’s distributions made prior to the Fund’s fiscal year end may be categorized as a tax return of capital at year end.
Federal and other taxes
The Fund intends to continue to qualify as a regulated investment company by distributing substantially all of its investment company taxable income and any net realized capital gains (after reduction for capital loss carryforwards) sufficient to relieve it from all, or substantially all, federal income taxes. Accordingly, no provision for federal income taxes was required.
The Fund’s income and federal excise tax returns and all financial records supporting those returns for the prior three fiscal years are subject to examination by the federal and Delaware revenue authorities. Management has analyzed the Fund’s tax positions taken on federal, state, and foreign tax returns for all open tax years and does not believe that there are any uncertain tax positions that require recognition of a tax liability.
As of January 31, 2020, the cost of investments for federal income tax purposes is substantially the same as for financial reporting purposes.
Class allocations
The separate classes of shares offered by the Fund differ principally in distribution, shareholder servicing, and administration fees. Class specific expenses are charged directly to that share class. Investment income, common fund-level expenses, and realized gains (losses) on investments are allocated daily to each class of shares based on the relative proportion of net assets of each class.
3. FAIR VALUATION MEASUREMENTS
Fair value measurements of investments are determined within a framework that has established a fair value hierarchy based upon the various data inputs utilized in determining the value of the Fund’s investments. The three-level hierarchy gives the highest priority to unadjusted quoted prices in active markets for identical assets or liabilities (Level 1) and the lowest priority to unobservable inputs (Level 3). The Fund’s investments are classified within the fair value hierarchy based on the lowest level of input that is significant to the fair value measurement. The inputs are summarized into three broad levels as follows:
| ∎ | Level 1 – quoted prices in active markets for identical securities |
| ∎ | Level 2 – other significant observable inputs (including quoted prices for similar securities, interest rates, prepayment speeds, credit risk, etc.) |
| ∎ | Level 3 – significant unobservable inputs (including the Fund’s own assumptions in determining the fair value of investments) |
The inputs or methodologies used for valuing investments in securities are not necessarily an indication of the risk associated with investing in those securities.
The following is a summary of the inputs used in valuing the Fund’s assets and liabilities as of January 31, 2020:
| Quoted prices (Level 1) | Other significant observable inputs (Level 2) | Significant (Level 3) | Total | |||||||||||||
Assets | ||||||||||||||||
Investments in: | ||||||||||||||||
Government agency debt | $ | 0 | $ | 27,693,932,432 | $ | 0 | $ | 27,693,932,432 | ||||||||
Municipal obligations | 0 | 12,320,000 | 0 | 12,320,000 | ||||||||||||
Repurchase agreements | 0 | 48,098,482,517 | 0 | 48,098,482,517 | ||||||||||||
Treasury debt | 0 | 10,664,758,614 | 0 | 10,664,758,614 | ||||||||||||
Total assets | $ | 0 | $ | 86,469,493,563 | $ | 0 | $ | 86,469,493,563 | ||||||||
Additional sector, industry or geographic detail is included in the Portfolio of Investments.
For the year ended January 31, 2020, the Fund did not have any transfers into/out of Level 3.
Government Money Market Funds | 31
Table of Contents
Notes to financial statements
3. TRANSACTIONS WITH AFFILIATES
Management fee
Funds Management, an indirect wholly owned subsidiary of Wells Fargo & Company (“Wells Fargo”), is the manager of the Fund and provides advisory and fund-level administrative services under an investment management agreement. Under the investment management agreement, Funds Management is responsible for, among other services, implementing the investment objectives and strategies of the Fund, supervising the subadviser and providing fund-level administrative services in connection with the Fund’s operations. As compensation for its services under the investment management agreement, Funds Management is entitled to receive a management fee at the following annual rate based on the Fund’s average daily net assets:
| Average daily net assets | Management fee | |||
First $5 billion | 0.15 | % | ||
Next $5 billion | 0.14 | |||
Over $10 billion | 0.13 | |||
For the year ended January 31, 2020, the management fee was equivalent to an annual rate of 0.13% of the Fund’s average daily net assets.
Funds Management has retained the services of a subadviser to provide daily portfolio management to the Fund. The fee for subadvisory services is borne by Funds Management. Wells Capital Management Incorporated, an affiliate of Funds Management and an indirect wholly owned subsidiary of Wells Fargo, is the subadviser to the Fund and is entitled to receive a fee from Funds Management at an annual rate starting at 0.05% and declining to 0.01% as the average daily net assets of the Fund increase.
Administration fees
Under a class-level administration agreement, Funds Management provides class-level administrative services to the Fund, which includes paying fees and expenses for services provided by the transfer agent,sub-transfer agents, omnibus account servicers and record-keepers. As compensation for its services under the class-level administration agreement, Funds Management receives an annual fee which is calculated based on the average daily net assets of each class as follows:
| Class-level administration fee | ||||
Class A | 0.22 | % | ||
Administrator Class | 0.10 | |||
Institutional Class | 0.08 | |||
Select Class | 0.04 | |||
Service Class | 0.12 | |||
Sweep Class | 0.03 | |||
Waivers and/or expense reimbursements
Funds Management has contractually waived and/or reimbursed management and administration fees to the extent necessary to maintain certain net operating expense ratios for the Fund. When each class of the Fund has exceeded its expense cap, Funds Management has waived fees and/or reimbursed expenses from fund-level expenses on a proportionate basis and then from class specific expenses. When only certain classes exceed their expense caps, waivers and/or reimbursements are applied against class specific expenses before fund-level expenses. Funds Management has committed through May 31, 2020 to waive fees and/or reimburse expenses to the extent necessary to cap the Fund’s expenses at 0.60% for Class A shares, 0.34% for Administrator Class shares, 0.20% for Institutional Class shares, 0.14% for Select Class shares, and 0.50% for Service Class shares. Prior to or after the commitment expiration date, the cap may be increased or the commitment to maintain the cap may be terminated only with the approval of the Board of Trustees. Prior to June 1, 2019, the Fund’s expenses were capped at 0.35% for Administrator Class shares.
Distribution fee
The Trust adopted a distribution plan for Sweep Class shares of the Fund pursuant to Rule12b-1 under the 1940 Act. A distribution fee was charged to Sweep Class shares and paid to Wells Fargo Funds Distributor, LLC, the principal underwriter, at an annual rate of 0.35% of the average daily net assets of Sweep Class shares.
32 | Government Money Market Funds
Table of Contents
Notes to financial statements
Shareholder servicing fees
The Trust has entered into contracts with one or more shareholder servicing agents, whereby Class A, Service Class, and Sweep Class of the Fund are charged a fee at an annual rate of 0.25% of the respective average daily net assets of each class. Administrator Class is charged a fee at an annual rate of 0.10% of its average daily net assets. A portion of these total shareholder servicing fees were paid to affiliates of Wells Fargo.
Interfund transactions
The Fund may purchase or sell portfolio investment securities to certain other Wells Fargo affiliates pursuant to Rule17a-7 under the 1940 Act and under procedures adopted by the Board of Trustees. The procedures have been designed to ensure that these interfund transactions, which do not incur broker commissions, are effected at current market prices.
4. DISTRIBUTIONS TO SHAREHOLDERS
The tax character of distributions paid was $1,604,683,577 and $1,305,825,736 of ordinary income for the years ended January 31, 2020 and January 31, 2019, respectively.
As of January 31, 2020, distributable earnings on a tax basis consisted of $58,226,628 in undistributed ordinary income.
5. INDEMNIFICATION
Under the Trust’s organizational documents, the officers and Trustees have been granted certain indemnification rights against certain liabilities that may arise out of performance of their duties to the Trust. Additionally, in the normal course of business, the Trust may enter into contracts with service providers that contain a variety of indemnification clauses. The Trust’s maximum exposure under these arrangements is dependent on future claims that may be made against the Fund and, therefore, cannot be estimated.
6. NEW ACCOUNTING PRONOUNCEMENTS
In August 2018, FASB issued Accounting Standards Update (“ASU”)No. 2018-13, Fair Value Measurement (Topic 820)Disclosure Framework—Changes to the Disclosure Requirements for Fair Value Measurement. ASU2018-13 updates the disclosure requirements for fair value measurements by modifying or removing certain disclosures and adding certain new disclosures. The amendments are effective for fiscal years, and interim periods within those fiscal years, beginning after December 15, 2019. Early adoption is permitted. Management has adopted the removal and modification of disclosures early, as permitted, and will adopt the additional new disclosures at the effective date.
In March 2017, FASB issued ASUNo. 2017-08,Premium Amortization on Purchased Callable Debt Securities. ASU2017-08 shortens the amortization period for certain callable debt securities held at a premium and requires the premium to be amortized to the earliest call date. The amendments do not require an accounting change for securities held at a discount and discounts will continue to be accreted to the maturity date of the security. ASU2017-08 is effective for fiscal years beginning after December 15, 2018 and for interim periods within those fiscal years. During the current reporting period, management of the Fund adopted the change in accounting policy which did not have a material impact to the Fund’s financial statements.
7. SUBSEQUENT EVENT
On March 11, 2020, the World Health Organization announced that it had made the assessment that coronavirus disease 2019 (“COVID-19”) is a pandemic. The impacts of COVID-19 is adversely affecting the entire global economy, individual companies and investment products, and the market in general. There is significant uncertainty around the extent and duration of business disruptions related to COVID-19 and the impact may be short term or may last for an extended period of time. The risk of further spreading of COVID-19 has led to significant uncertainty and volatility in the financial markets and the value of the Fund and the securities in which the Fund invests may be adversely affected by impacts caused by COVID-19.
Government Money Market Funds | 33
Table of Contents
Report of independent registered public accounting firm
TO THE SHAREHOLDERS OF THE FUND AND BOARD OF TRUSTEES OF WELLS FARGO FUNDS TRUST:
Opinion on the Financial Statements
We have audited the accompanying statement of assets and liabilities of Wells Fargo Government Money Market Fund (the Fund), one of the funds constituting Wells Fargo Funds Trust, including the portfolio of investments, as of January 31, 2020, the related statement of operations for the year then ended, the statements of changes in net assets for each of the years in thetwo-year period then ended, and the related notes (collectively, the financial statements) and the financial highlights for each of the years or periods in the five-year period then ended. In our opinion, the financial statements and financial highlights present fairly, in all material respects, the financial position of the Fund as of January 31, 2020, the results of its operations for the year then ended, the changes in its net assets for each of the years in thetwo-year period then ended, and the financial highlights for each of the years or periods in the five-year period then ended, in conformity with U.S. generally accepted accounting principles.
Basis for Opinion
These financial statements and financial highlights are the responsibility of the Fund’s management. Our responsibility is to express an opinion on these financial statements and financial highlights based on our audits. We are a public accounting firm registered with the Public Company Accounting Oversight Board (United States) (PCAOB) and are required to be independent with respect to the Fund in accordance with the U.S. federal securities laws and the applicable rules and regulations of the Securities and Exchange Commission and the PCAOB.
We conducted our audits in accordance with the standards of the PCAOB. Those standards require that we plan and perform the audit to obtain reasonable assurance about whether the financial statements and financial highlights are free of material misstatement, whether due to error or fraud. Our audits included performing procedures to assess the risks of material misstatement of the financial statements and financial highlights, whether due to error or fraud, and performing procedures that respond to those risks. Such procedures included examining, on a test basis, evidence regarding the amounts and disclosures in the financial statements and financial highlights. Such procedures also included confirmation of securities owned as of January 31, 2020, by correspondence with the custodian and brokers, or by other appropriate auditing procedures. Our audits also included evaluating the accounting principles used and significant estimates made by management, as well as evaluating the overall presentation of the financial statements and financial highlights. We believe that our audits provide a reasonable basis for our opinion.

We have not been able to determine the specific year that we began serving as the auditor of one or more Wells Fargo Funds investment companies; however we are aware that we have served as the auditor of one or more Wells Fargo Funds investment companies since at least 1955.
Boston, Massachusetts
March 31, 2020
34 | Government Money Market Funds
Table of Contents
TAX INFORMATION
For the fiscal year ended January 31, 2020, $1,608,624,704 has been designated as interest-related dividends for nonresident alien shareholders pursuant to Section 871 of the Internal Revenue Code.
For the fiscal year ended January 31, 2020, $113,883 has been designated as short-term capital gain dividends for nonresident alien shareholders pursuant to Section 871 of the Internal Revenue Code.
For the fiscal year ended January 31, 2020, 7.71% of the ordinary income distributed was derived from interest on U.S. government securities.
PROXY VOTING INFORMATION
A description of the policies and procedures used to determine how to vote proxies relating to portfolio securities is available, upon request, by calling1-800-222-8222, visiting our website atwfam.com, or visiting the SEC website at sec.gov. Information regarding how the proxies related to portfolio securities were voted during the most recent12-month period ended June 30 is available on the website atwfam.comor by visiting the SEC website at sec.gov.
Government Money Market Funds | 35
Table of Contents
Other information (unaudited)
BOARD OF TRUSTEES AND OFFICERS
Each of the Trustees and Officers1 listed in the table below acts in identical capacities for each fund in the Wells Fargo family of funds, which consists of 149 mutual funds comprising the Wells Fargo Funds Trust, Wells Fargo Variable Trust, Wells Fargo Master Trust and fourclosed-end funds (collectively the “Fund Complex”). This table should be read in conjunction with the Prospectus and the Statement of Additional Information2. The mailing address of each Trustee and Officer is 525 Market Street, 12th Floor, San Francisco, CA 94105. Each Trustee and Officer serves an indefinite term, however, each Trustee serves such term until reaching the mandatory retirement age established by the Trustees.
Independent Trustees
Name and year of birth | Position held and length of service* | Principal occupations during past five years or longer | Current other public company or investment company directorships | |||
William R. Ebsworth (Born 1957) | Trustee, since 2015 | Retired. From 1984 to 2013, equities analyst, portfolio manager, research director and chief investment officer at Fidelity Management and Research Company in Boston, Tokyo, and Hong Kong, and retired in 2013 as Chief Investment Officer of Fidelity Strategic Advisers, Inc. where he led a team of investment professionals managing client assets. Prior thereto, Board member of Hong Kong Securities Clearing Co., Hong Kong Options Clearing Corp., the Thailand International Fund, Ltd., Fidelity Investments Life Insurance Company, and Empire Fidelity Investments Life Insurance Company. Audit Committee Chair and Investment Committee Chair of the Vincent Memorial Hospital Endowment(non-profit organization). Mr. Ebsworth is a CFA® charterholder. | N/A | |||
Jane A. Freeman (Born 1953) | Trustee, since 2015; Chair Liaison, since 2018 | Retired. From 2012 to 2014 and 1999 to 2008, Chief Financial Officer of Scientific Learning Corporation. From 2008 to 2012, Ms. Freeman provided consulting services related to strategic business projects. Prior to 1999, Portfolio Manager at Rockefeller & Co. and Scudder, Stevens & Clark. Board member of the Harding Loevner Funds from 1996 to 2014, serving as both Lead Independent Director and chair of the Audit Committee. Board member of the Russell Exchange Traded Funds Trust from 2011 to 2012 and the chair of the Audit Committee. Ms. Freeman is a Board Member of The Ruth Bancroft Garden(non-profit organization). She is also an inactive Chartered Financial Analyst. | N/A | |||
Isaiah Harris, Jr. (Born 1952) | Trustee, since 2009; Audit Committee Chairman, since 2019 | Retired. Chairman of the Board of CIGNA Corporation since 2009, and Director since 2005. From 2003 to 2011, Director of Deluxe Corporation. Prior thereto, President and CEO of BellSouth Advertising and Publishing Corp. from 2005 to 2007, President and CEO of BellSouth Enterprises from 2004 to 2005 and President of BellSouth Consumer Services from 2000 to 2003. Emeritus member of the Iowa State University Foundation Board of Governors. Emeritus Member of the Advisory Board of Iowa State University School of Business. Advisory Board Member, Palm Harbor Academy (private school). Advisory Board Member, Child Evangelism Fellowship(non-profit). Mr. Harris is a certified public accountant (inactive status). | CIGNA Corporation | |||
Judith M. Johnson (Born 1949) | Trustee, since 2008; Audit Committee Chairman, from 2009 to 2018 | Retired. Prior thereto, Chief Executive Officer and Chief Investment Officer of Minneapolis Employees Retirement Fund from 1996 to 2008. Ms. Johnson is an attorney, certified public accountant and a certified managerial accountant. | N/A | |||
36 | Government Money Market Funds
Table of Contents
Other information (unaudited)
Name and year of birth | Position held and length of service* | Principal occupations during past five years or longer | Current other public company or investment company directorships | |||
David F. Larcker (Born 1950) | Trustee, since 2009 | James Irvin Miller Professor of Accounting at the Graduate School of Business, Stanford University, Director of the Corporate Governance Research Initiative and Senior Faculty of The Rock Center for Corporate Governance since 2006. From 2005 to 2008, Professor of Accounting at the Graduate School of Business, Stanford University. Prior thereto, Ernst & Young Professor of Accounting at The Wharton School, University of Pennsylvania from 1985 to 2005. | N/A | |||
Olivia S. Mitchell (Born 1953) | Trustee, since 2006; Nominating and Governance Committee Chair, since 2018 | International Foundation of Employee Benefit Plans Professor, Wharton School of the University of Pennsylvania since 1993. Director of Wharton’s Pension Research Council and Boettner Center on Pensions & Retirement Research, and Research Associate at the National Bureau of Economic Research. Previously, Cornell University Professor from 1978 to 1993. | N/A | |||
Timothy J. Penny (Born 1951) | Trustee, since 1996; Chairman, since 2018 | President and Chief Executive Officer of Southern Minnesota Initiative Foundation, anon-profit organization, since 2007. Member of the Board of Trustees of NorthStar Education Finance, Inc., anon-profit organization, since 2007. | N/A | |||
James G. Polisson (Born 1959) | Trustee, since 2018 | Retired. Chief Marketing Officer, Source (ETF) UK Services, Ltd, from 2015 to 2017. From 2012 to 2015, Principal of The Polisson Group, LLC, a management consulting, corporate advisory and principal investing company. Chief Executive Officer and Managing Director at Russell Investments, Global Exchange Traded Funds from 2010 to 2012. Managing Director of Barclays Global Investors from 1998 to 2010 and Global Chief Marketing Officer for iShares and Barclays Global Investors from 2000 to 2010. Trustee of the San Francisco Mechanics’ Institute, anon-profit organization, from 2013 to 2015. Board member of the Russell Exchange Traded Fund Trust from 2011 to 2012. Director of Barclays Global Investors Holdings Deutschland GmbH from 2006 to 2009. Mr. Polisson is an attorney and has a retired status with the Massachusetts and District of Columbia Bar Associations. | N/A | |||
Pamela Wheelock3 (Born 1959) | Trustee, since January 2020; previously Trustee from January 2018 to July 2019 | Board member of the Destination Medical Center Economic Development Agency, Rochester, Minnesota since 2019. Acting Commissioner, Minnesota Department of Human Services, July 2019 through September 2019. Human Services Manager (part-time), Minnesota Department of Human Services, October 2019 through December 2019. Chief Operating Officer, Twin Cities Habitat for Humanity from 2017 to 2019. Vice President of University Services, University of Minnesota from 2012 to 2016. Prior thereto, on the Board of Directors, Governance Committee and Finance Committee for the Minnesota Philanthropy Partners (Saint Paul Foundation) from 2012 to 2018, Interim Chief Executive Officer of Blue Cross Blue Shield of Minnesota from 2011 to 2012, Chairman of the Board from 2009 to 2012 and Board Director from 2003 to 2015. Vice President, Leadership and Community Engagement, Bush Foundation, Saint Paul, Minnesota (a private foundation) from 2009 to 2011. Executive Vice President and Chief Financial Officer, Minnesota Sports and Entertainment from 2004 to 2009 and Senior Vice President from 2002 to 2004. Executive Vice President of the Minnesota Wild Foundation from 2004 to 2008. Commissioner of Finance, State of Minnesota, from 1999 to 2002. Currently Board Chair of the Minnesota Wild Foundation since 2010. | N/A | |||
| * | Length of service dates reflect the Trustee’s commencement of service with the Trust’s predecessor entities, where applicable. |
Government Money Market Funds | 37
Table of Contents
Other information (unaudited)
Officers
Name and year of birth | Position held and length of service | Principal occupations during past five years or longer | ||
Andrew Owen (Born 1960) | President, since 2017 | Executive Vice President of Wells Fargo & Company and Head of Affiliated Managers, Wells Fargo Asset Management, since 2014. In addition, Mr. Owen is currently President, Chief Executive Officer and Director of Wells Fargo Funds Management, LLC since 2017. Prior thereto, Executive Vice President responsible for marketing, investments and product development for Wells Fargo Funds Management, LLC, from 2009 to 2014. | ||
Nancy Wiser1 (Born 1967) | Treasurer, since 2012 | Executive Vice President of Wells Fargo Funds Management, LLC since 2011. Chief Operating Officer and Chief Compliance Officer at LightBox Capital Management LLC, from 2008 to 2011. | ||
Michelle Rhee (Born 1966) | Chief Legal Officer, since 2019 | Secretary of Wells Fargo Funds Management, LLC, Chief Legal Counsel of Wells Fargo Asset Management and Assistant General Counsel of Wells Fargo Bank, N.A. since 2018. Associate General Counsel and Managing Director of Bank of America Corporation from 2004 to 2018. | ||
Catherine Kennedy (Born 1969) | Secretary, since 2019 | Vice President of Wells Fargo Funds Management, LLC and Senior Counsel of the Wells Fargo Legal Department since 2010. Vice President and Senior Counsel of Evergreen Investment Management Company, LLC from 1998 to 2010. | ||
Michael H. Whitaker (Born 1967) | Chief Compliance Officer, since 2016 | Chief Compliance Officer of Wells Fargo Asset Management since 2016. Senior Vice President and Chief Compliance Officer for Fidelity Investments from 2007 to 2016. | ||
David Berardi (Born 1975) | Assistant Treasurer, since 2009 | Vice President of Wells Fargo Funds Management, LLC since 2009. Vice President of Evergreen Investment Management Company, LLC from 2008 to 2010. Manager of Fund Reporting and Control for Evergreen Investment Management Company, LLC from 2004 to 2010. | ||
Jeremy DePalma1 (Born 1974) | Assistant Treasurer, since 2009 | Senior Vice President of Wells Fargo Funds Management, LLC since 2009. Senior Vice President of Evergreen Investment Management Company, LLC from 2008 to 2010 and head of the Fund Reporting and Control Team within Fund Administration from 2005 to 2010. | ||
| 1 | Nancy Wiser acts as Treasurer of 64 funds in the Fund Complex. Jeremy DePalma acts as Treasurer of 85 funds and Assistant Treasurer of 64 funds in the Fund Complex. |
| 2 | The Statement of Additional Information includes additional information about the Trustees and is available, without charge, upon request, by calling1-800-222-8222 or by visiting the website atwfam.com. |
| 3 | Pamela Wheelock wasre-appointed to the Board effective January 1, 2020. |
38 | Government Money Market Funds
Table of Contents
This page is intentionally left blank.
Table of Contents
This page is intentionally left blank.
Table of Contents
For more information
More information about Wells Fargo Funds is available free upon request. To obtain literature, please write, visit the Fund’s website, or call:
Wells Fargo Funds
P.O. Box 219967
Kansas City, MO 64121-9967
Website:wfam.com
Individual investors:1-800-222-8222
Retail investment professionals:1-888-877-9275
Institutional investment professionals:1-866-765-0778

This report and the financial statements contained herein are submitted for the general information of the shareholders of the Fund. If this report is used for promotional purposes, distribution of the report must be accompanied or preceded by a current prospectus. Before investing, please consider the investment objectives, risks, charges, and expenses of the investment. For a current prospectus and, if available, a summary prospectus, containing this information, call1-800-260-5969 or visit the Fund’s website atwfam.com. Read the prospectus carefully before you invest or send money.
Wells Fargo Asset Management (WFAM) is the trade name for certain investment advisory/management firms owned by Wells Fargo & Company. These firms include but are not limited to Wells Capital Management Incorporated and Wells Fargo Funds Management, LLC. Certain products managed by WFAM entities are distributed by Wells Fargo Funds Distributor, LLC (a broker-dealer and Member FINRA).
This material is for general informational and educational purposes only and is NOT intended to provide investment advice or a recommendation of any kind—including a recommendation for any specific investment, strategy, or plan.
INVESTMENT PRODUCTS: NOT FDIC INSURED ◾ NO BANK GUARANTEE ◾ MAY LOSE VALUE
© 2020 Wells Fargo & Company. All rights reserved
PAR-0220-03785 03-20
A303/AR303 01-20
Table of Contents

Annual Report
January 31, 2020
Institutional Money Market Funds
| ∎ | Wells Fargo Heritage Money Market Fund |
Beginning on January 1, 2021, as permitted by new regulations adopted by the Securities and Exchange Commission, paper copies of the Wells Fargo Funds’ annual and semi-annual shareholder reports issued after this date will no longer be sent by mail, unless you specifically request paper copies of the reports. Instead, the reports will be made available on the Funds’ website, and you will be notified by mail each time a report is posted and provided with a website address to access the report.
If you already elected to receive shareholder reports electronically, you will not be affected by this change and you need not take any action. You may elect to receive shareholder reports and other communications from the Fund electronically at any time by contacting your financial intermediary (such as a broker-dealer or bank) or, if you are a direct investor, by calling1-800-222-8222 or by enrolling at wellsfargo.com/advantagedelivery.
You may elect to receive all future reports in paper free of charge. If you invest through a financial intermediary, you can contact your financial intermediary to request that you continue to receive paper copies of your shareholder reports; if you invest directly with the Fund, you can call 1-800-222-8222. Your election to receive reports in paper will apply to all Wells Fargo Funds held in your account with your financial intermediary or, if you are a direct investor, to all Wells Fargo Funds that you hold.
Table of Contents
|
Reduce clutter. Save trees. |
Sign up for electronic delivery of prospectuses and shareholder reports atwellsfargo.com/advantagedelivery |
The views expressed and any forward-looking statements are as of January 31, 2020, unless otherwise noted, and are those of the Fund managers and/or Wells Fargo Asset Management. Discussions of individual securities, or the markets generally, or any Wells Fargo Fund are not intended as individual recommendations. Future events or results may vary significantly from those expressed in any forward-looking statements. The views expressed are subject to change at any time in response to changing circumstances in the market. Wells Fargo Asset Management and the Fund disclaim any obligation to publicly update or revise any views expressed or forward-looking statements.
INVESTMENT PRODUCTS: NOT FDIC INSURED ◾ NO BANK GUARANTEE ◾ MAY LOSE VALUE
Institutional Money Market Funds | 1
Table of Contents
Letter to shareholders (unaudited)

Andrew Owen
President
Wells Fargo Funds
Dear Shareholder:
We are pleased to offer you this annual report for the Wells Fargo Heritage Money Market Fund for the12-month period that ended January 31, 2020. Despite some periods of market volatility, the year was strongly positive for financial markets as supportive central banks more than offset concerns over slowing global economic growth and international trade tensions.
Overall, both fixed-income and equity investors enjoyed healthy annual returns, with U.S. markets leading the way. For the period, U.S. stocks, based on the S&P 500 Index,1 gained 21.68% and international stocks, as measured by the MSCI ACWI ex USA Index (Net),2 returned 9.94%. The MSCI EM Index (Net)3 gained a more modest 3.81%. For bond investors, the Bloomberg Barclays U.S. Aggregate Bond Index4 added 9.64%, the Bloomberg Barclays Global Aggregateex-USD Index5 returned 3.95%, the Bloomberg Barclays Municipal Bond Index6 gained 8.65%, and the ICE BofA U.S. High Yield Index7 added 9.39%.
The year began with a strong market rebound.
Financial markets opened 2019 on a positive note, as investors were encouraged by the U.S. Federal Reserve (Fed) taking a more accommodative stance after a series of increases to the federal funds rate in 2017 and 2018. However, concerns over slowing global growth grew more ominous. Fourth-quarter 2018 gross domestic product (GDP), reported in February 2019, grew at an annualized 2.2% rate, down from the levels of the prior two quarters. The Bank of England forecast the slowest growth since the financial crisis for 2019. China and the U.S. continued to wrangle over trade issues. By the end of the first quarter of 2019, more accommodative Fed sentiment and steady, if not spectacular, U.S. economic and business metrics encouraged domestic investors.
Early second-quarter 2019 enthusiasm among investors faded.
During April, sustained low inflation, solid employment data, and first-quarter U.S. GDP of an annualized rate of 3.2% supported favorable sentiment. During May, however, markets tumbled on mixed investment signals. In the U.S., partisan political wrangling ramped up in advance of the 2020 election. The U.K.’s Brexit disagreements caused Prime Minister Theresa May to resign. Boris Johnson succeeded her, only to add to uncertainty about Brexit’s resolution ahead of an October 2019 deadline. The European Commission downgraded the 2019 growth forecast to 1.2%. The U.S. increased tariffs on
| 1 | The S&P 500 Index consists of 500 stocks chosen for market size, liquidity, and industry group representation. It is a market-value-weighted index with each stock’s weight in the index proportionate to its market value. You cannot invest directly in an index. |
| 2 | The Morgan Stanley Capital International (MSCI) All Country World Index (ACWI) ex USA Index (Net) is a free-float-adjusted market-capitalization-weighted index that is designed to measure the equity market performance of developed markets, excluding the United States. Source: MSCI. MSCI makes no express or implied warranties or representations and shall have no liability whatsoever with respect to any MSCI data contained herein. The MSCI data may not be further redistributed or used as a basis for other indices or any securities or financial products. This report is not approved, reviewed, or produced by MSCI. You cannot invest directly in an index. |
| 3 | The MSCI Emerging Markets (EM) Index (Net) is a free-float-adjusted market-capitalization-weighted index that is designed to measure equity market performance of emerging markets. You cannot invest directly in an index. |
| 4 | The Bloomberg Barclays U.S. Aggregate Bond Index is a broad-based benchmark that measures the investment-grade, U.S. dollar-denominated, fixed-rate taxable bond market, including Treasuries, government-related and corporate securities, mortgage-backed securities (agency fixed-rate and hybrid adjustable-rate mortgage pass-throughs), asset-backed securities, and commercial mortgage-backed securities. You cannot invest directly in an index. |
| 5 | The Bloomberg Barclays Global Aggregateex-USD Index is an unmanaged index that provides a broad-based measure of the global investment-grade fixed-income markets excluding the U.S. dollar-denominated debt market. You cannot invest directly in an index. |
| 6 | The Bloomberg Barclays Municipal Bond Index is an unmanaged index composed of long-termtax-exempt bonds with a minimum credit rating of Baa. You cannot invest directly in an index. |
| 7 | The ICE BofA U.S. High Yield Index is a market-capitalization-weighted index of domestic and Yankee high-yield bonds. The index tracks the performance of high-yield securities traded in the U.S. bond market. You cannot invest directly in an index. Copyright 2020. ICE Data Indices, LLC. All rights reserved. |
2 | Institutional Money Market Funds
Table of Contents
Letter to shareholders (unaudited)
products from China, China responded, and then talks broke down. President Donald Trump threatened to turn his foreign policy tariff tool to Mexico over immigration issues.
Midway through the year, investors regrouped, sentiment turned positive, and U.S. equity markets advanced during June and July. The gains, primarily driven by geopolitical and monetary policy events, pushed equity markets to new highs. European Central Bank President Mario Draghi indicated the bank was ready to cut rates or buy more assets to prop up inflation if needed. President Trump backed off of tariff threats against Mexico and China. In the U.S., the Fed implemented a 0.25% federal funds rate cut in July.
Later in July, the U.S. reversed course and threatened to impose higher tariffs on China’s exports after talks failed. China responded with tariff threats of its own and devalued the renminbi, roiling global markets. Major U.S. stock market indices closed July with the worst weekly results of the year. Bond prices gained as Treasury yields fell to multiyear lows, and the yield curve inverted at multiple points along the30-year arc.
In August, U.S.-China trade tensions continued with no signs of compromise. Evidence of a continued global economic slowdown mounted, and central banks in China, New Zealand, and Thailand cut interest rates. Industrial and manufacturing data declined in China, Canada, Japan, and Germany. Adding to global uncertainty, Italy’s prime minister resigned, many feared a crackdown in Hong Kong as protestors sustained their calls for reform, and Boris Johnson planned to suspend Parliament as Brexit’s deadline neared.
In the U.S., the Fed cut interest rates a second time in September. U.S. manufacturing data disappointed investors. The U.S. Congress announced it would pursue an impeachment investigation of President Trump. Meanwhile, the Brexit impasse showed no signs of resolution. Officials in China said that hitting the country’s economic growth goals for the year would be difficult considering the weight of tariffs and trade restrictions. Although the S&P 500 Index finished the third quarter with the bestyear-to-date returns in more than 20 years, concerns about future returns remained.
The fourth quarter started on a strong note, with U.S.-China trade tensions relaxing in October along with renewed optimism for a U.K. Brexit deal and positive macroeconomic data. The initial estimate of U.S. third-quarter GDP growth was a resilient 1.9% annualized rate, while the U.S. unemployment rate fell to a50-year low of 3.5% in September. However, despite resilience among U.S. consumers, business confidence declined while manufacturing activity contracted. Concerned with a potential economic slowdown, the Fed lowered interest rates another quarter point in late October, its third rate cut in four months. This helped push the S&P 500 Index to a newall-time high, while emerging market equities rallied and global bonds declined overall, reflecting a broad pickup in risk appetite.
Equity markets continued to rally in November despite ongoing geopolitical risks. Hopes for a U.S.-China trade deal buoyed investor confidence. U.S. business sentiment improved slightly, and manufacturing and services activity picked up. Throughout the month, central bank actions were on hold. With that positive backdrop, developed market equities outpaced those in emerging markets, and U.S. stocks, as reflected by the S&P 500 Index, outperformednon-U.S. stocks overall. While consumer confidence and purchasing manager activity rose in the eurozone, China reported weakening manufacturing and consumer data. Bond yields rose marginally, leading to slightly negative returns for global government and investment-grade corporate bonds.
Financial markets ended 2019 on a broadly positive note, with the U.S. and China reaching an accord on a Phase One trade deal, with some details to be worked out. That, along with the landslide win by thepro-Brexit U.K. Conservative Party in a national election and ongoing central bank support, gave investors greater certainty and confidence. U.S. economic indicators were generally positive, with the exception of manufacturing activity and business confidence. However, consumer confidence was resilient, fed by a robust labor market, tame inflation, and lower interest rates, which boosted housing affordability and stimulated homebuyer activity. The impeachment of U.S. President Donald Trump,
“Midway through the year, investors regrouped, sentiment turned positive, and U.S. equity markets advanced.”
“Financial markets ended 2019 on a broadly positive note, with the U.S. and China reaching an accord on a Phase One trade deal.”
Institutional Money Market Funds | 3
Table of Contents
Letter to shareholders (unaudited)
while historically noteworthy, had little impact on markets. Meanwhile, slowing Chinese economic activity, partly attributable to the trade war, led to further government stimulus atyear-end through lower reserve ratios, allowing banks to lend more money.
Theyear-end rally continued in early January 2020. However, capital market volatility picked up in late January on concerns over the unknown impact of the coronavirus on the global economy and stock markets. With sentiment somewhat souring, perceived safe havens did well in January. The U.S. dollar and Japanese yen both rose and government bonds outperformed equities. While the S&P 500 Index held its ground, emerging market equities tumbled, including those in Asia, that are most exposed to viruses—physical or economic—originating in China.
Following the end of the reporting period, the coronavirus continued its global spread, resulting in disruptions to global markets, including through border closings, restrictions on travel and large gatherings, expedited and enhanced health screenings, quarantines, cancellations, business and school closings, disruptions to employment and supply chains, reduced productivity, and reduced customer and client activity in multiple markets and sectors. The risk of further spreading of the coronavirus has led to significant uncertainty and volatility in the financial markets. The full extent of the coronavirus’s impact on the global economy cannot necessarily be foreseen and the impacts may be short term or may last for an extended period of time.
Don’t let short-term uncertainty derail long-term investment goals.
Periods of investment uncertainty can present challenges, but experience has taught us that maintaining long-term investment goals can be an effective way to plan for the future. To help you create a sound strategy based on your personal goals and risk tolerance, Wells Fargo Funds offers more than 100 mutual funds spanning a wide range of asset classes and investment styles. Although diversification cannot guarantee an investment profit or prevent losses, we believe it can be an effective way to manage investment risk and potentially smooth out overall portfolio performance. We encourage investors to know their investments and to understand that appropriate levels of risk-taking may unlock opportunities.
Thank you for choosing to invest with Wells Fargo Funds. We appreciate your confidence in us and remain committed to helping you meet your financial needs.
Sincerely,

Andrew Owen
President
Wells Fargo Funds
|
For further information about your Fund, contact your investment professional, visit our website at wfam.com, or call us directly at1-800-222-8222. |
4 | Institutional Money Market Funds
Table of Contents
This page is intentionally left blank.
Table of Contents
Performance highlights (unaudited)
Investment objective
The Fund seeks current income, while preserving capital and liquidity.
Manager
Wells Fargo Funds Management, LLC
Subadvisers
Wells Capital Management Incorporated
Wells Capital Management Singapore
Portfolio managers
Michael C. Bird, CFA®‡
Jeffrey L. Weaver, CFA®‡
Laurie White
Average annual total returns (%) as of January 31, 2020
| Expense ratios1 (%) | ||||||||||||||||||||||
| Inception date | 1 year | 5 year | 10 year | Gross | Net2 | |||||||||||||||||
| Administrator Class (SHMXX) | 6-29-1995 | 2.05 | 1.05 | 0.53 | 0.36 | 0.33 | ||||||||||||||||
| Institutional Class (SHIXX) | 3-31-2000 | 2.18 | 1.16 | 0.61 | 0.24 | 0.20 | ||||||||||||||||
| Select Class (WFJXX) | 6-29-2007 | 2.25 | 1.24 | 0.68 | 0.20 | 0.13 | ||||||||||||||||
| Service Class (WHTXX)3 | 6-30-2010 | 1.95 | 0.96 | 0.49 | 0.53 | 0.43 | ||||||||||||||||
Yield summary (%) as of January 31, 20202
| Administrator Class | Institutional Class | Select Class | Service Class | |||||||||||
| 7-day current yield | 1.51 | 1.64 | 1.71 | 1.41 | ||||||||||
| 7-day compound yield | 1.52 | 1.65 | 1.72 | 1.42 | ||||||||||
| 30-day simple yield | 1.52 | 1.65 | 1.72 | 1.42 | ||||||||||
| 30-day compound yield | 1.53 | 1.66 | 1.73 | 1.43 | ||||||||||
Figures quoted represent past performance,which is no guarantee of future results, and do not reflect taxes that shareholder may pay on an investment in a fund. Investment returns will fluctuate. The Fund’s yield figures more closely reflect the current earnings of the Fund than the total return figures. Current performance may be lower or higher than the performance data quoted, which assumes the reinvestment of dividends and capital gains. Currentmonth-end performance is available on the Fund’s website,wfam.com.
Money market funds are sold without a front-end sales charge or contingent deferred sales charge. Other fees and expenses apply to an investment in the Fund and are described in the Fund’s current prospectus.
For floating NAV money market funds: You could lose money by investing in the Fund. Because the share price of the Fund will fluctuate, when you sell your shares they may be worth more or less than what you originally paid for them. The Fund may impose a fee upon sale of your shares or may temporarily suspend your ability to sell shares if the Fund’s liquidity falls below required minimums because of market conditions or other factors. An investment in the Fund is not insured or guaranteed by the Federal Deposit Insurance Corporation or any other government agency. The Fund’s sponsor has no legal obligation to provide financial support to the Fund, and you should not expect that the sponsor will provide financial support to the Fund at any time.
Please see footnotes on page 7.
6 | Institutional Money Market Funds
Table of Contents
Performance highlights (unaudited)
| Portfolio composition as of January 31, 20204 |
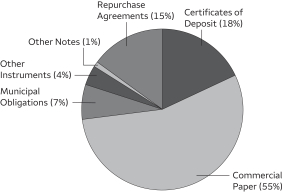 |
| Effective maturity distribution as of January 31, 20204 |
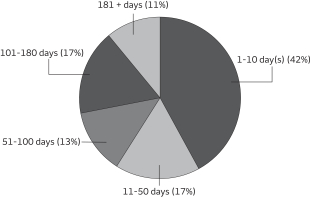 |
| Weighted average maturity as of January 31, 20205 |
29 days |
| Weighted average life as of January 31, 20206 |
72 days |
| ‡ | CFA® and Chartered Financial Analyst®are trademarks owned by CFA Institute. |
| 1 | Reflects the expense ratios as stated in the most recent prospectuses. The expense ratios shown are subject to change and may differ from the annualized expense ratios shown in the financial highlights of this report. |
| 2 | The manager has contractually committed through May 31, 2020, to waive fees and/or reimburse expenses to the extent necessary to cap total annual fund operating expenses after fee waivers at 0.33% for Administrator Class, 0.20% for Institutional Class, 0.13% for Select Class, and 0.43% for Service Class. Brokerage commissions, stamp duty fees, interest, taxes, acquired fund fees and expenses (if any), and extraordinary expenses are excluded from the expense cap. Prior to or after the commitment expiration date, the cap may be increased or the commitment to maintain the cap may be terminated only with the approval of the Board of Trustees. Without this cap, the Fund’s returns would have been lower. Without waived fees and/or reimbursed expenses, the Fund’s7-day current yield would have been 1.49%, 1.61%, 1.65%, and 1.35% for Administrator Class, Institutional Class, Select Class, and Service Class, respectively. The expense ratio paid by an investor is the net expense ratio (the total annual fund operating expenses after fee waivers) as stated in the prospectuses. |
| 3 | Historical performance shown for the Service Class shares prior to their inception reflects the performance of Administrator Class shares and has not been adjusted to reflect the higher expenses applicable to Service Class shares. If these expenses had been adjusted, returns for Service Class shares would be lower. |
| 4 | Amounts are calculated based on the total investments of the Fund. These amounts are subject to change and may have changed since the date specified. |
| 5 | Weighted Average Maturity (WAM): WAM is an average of the effective maturities of all securities held in the portfolio, weighted by each security’s percentage of total investments. The maturity of a portfolio security is the period remaining until the date on which the principal amount is unconditionally required to be paid, or in the case of a security called for redemption, the date on which the redemption payment is unconditionally required to be made. WAM calculations allow for the maturities of certain securities with demand features or periodic interest rate resets to be shortened. WAM is a way to measure a fund’s sensitivity to potential interest rate changes. WAM is subject to change and may have changed since the date specified. |
| 6 | Weighted Average Life (WAL): WAL is an average of the final maturities of all securities held in the portfolio, weighted by their percentage of total investments. The maturity of a portfolio security is the period remaining until the date on which the principal amount is unconditionally required to be paid, or in the case of a security called for redemption, the date on which the redemption payment is unconditionally required to be made. In contrast to WAM, the calculation of WAL allows for the maturities of certain securities with demand features to be shortened, but not the periodic interest rate resets. WAL is a way to measure a fund’s potential sensitivity to credit spread changes. WAL is subject to change and may have changed since the date specified. |
Institutional Money Market Funds | 7
Table of Contents
Performance highlights (unaudited)
MANAGERS’ DISCUSSION
The money market sector is heavily influenced by the Federal Open Market Committee’s (FOMC’s) assessment of the economy, its target rates, and expectations of changes to those target rates. Consequently, we try to glean insight about rate moves by dissecting Federal Reserve (Fed) statements and Fed member speeches and by analyzing the Summary of Economic Projections (SEP).
Even as the economic landscape was showing signs of sputtering growth toward the end of 2018, the FOMC raised rates in December. The Fed led us into 2019 indicating that the December rate increase might be the last move in the tightening cycle that had begun two years earlier. But expectations were that the economy was still expanding, albeit at a less robust pace. It therefore seemed reasonable to assume that the move got us to where we needed to be, at a target rate level low enough to not extinguish growth and perhaps let inflation rise to the 2% target but high enough to trim the wings a little. “Patience” was the key word introduced to the lexicon. And after a pause to refresh, rates might continue back on their higher track.
The patient pause didn’t last long. By March, the SEP array exhibited a dovish bias with no participants expecting a hike and one anticipating a cut. In addition to the pause, other signs pointing to the possibility of a cut included the tightening of the London Interbank Offered Rate (LIBOR)/Overnight Interest Swap (OIS) rate from its relatively wide spread of 42.5 basis points (bps; 100 bps equal 1.00%) at the end of 2018 to a low of 14.5 bps in June 2019. By May, more indicators confirmed that this was not a pause on the way to higher rates. In fact, it was looking like a pause before lower rates. While household spending and business fixed investment were slowing, personal consumption expenditures had ticked up and nonfarm payrolls came in strong. Overshadowing everything were trade tensions as negotiations with China, Mexico, Japan, and Europe broke down in various forms. With the central question of what would be the economic impacts of tariffs and trade wars unanswered, equities sold off and a flight to quality ensued. U.S. Treasury yields fell 34–36 bps, with2-,3-, and5-year notes all yielding less than 2%. At that point, federal funds futures showed more than a 70% chance of a25-bp cut at the September FOMC meeting.
At the June FOMC meeting, the Fed downgraded its growth assessment from solid to moderate and removed the word “patient” from its statement, focusing on increased uncertainties in the outlook. The SEP showed a downward shift in rates expectations and now seemed to be queuing up for an ease at the conclusion of the July FOMC meeting. Sentiment had seemingly turned on a dime. Consumers were still consuming, but trade tensions and the weak business sector had participants asking if a recession was looming.
Fast forward toperiod-end with a total of three consecutive easings—in July, September, and October—and maybe, just maybe, the FOMC executed the perfect landing. Fed Chair Powell set a high bar for further rate cuts after the October move, saying the cumulative easing to date would continue to provide support for the economy as monetary policy stimulus traditionally operates with a lag. That high bar was reiterated in December when it was made clear that the Fed expected to be on hold possibly through the election. No surprises came at the conclusion of the January 2020 meeting, with no change in the target rate range and the statement reflecting a willingness to appropriately continue economic expansion and achieve inflation around 2%.
Strategic outlook
At the close of the reporting period, we were focused on a few unresolved items that could influence markets for the remainder of the calendar year, namely Brexit; trade issues and tariffs; the conclusion or continuation of temporary Fed liquidity operations, Fed Treasury bill purchases, and other quantitative easing measures; and finally, the election. With the Fed appearing to be on hold for now, credit fundamentals continue to be supportive and the yield curve is slightly positively sloped.
However, just as the fiscal year ended, in February and March 2020, the coronavirus began to spread globally, prompting consumers, businesses, and governments to take unusually strong actions in an attempt to limit its impact. In so doing, it appears that there could be a serious toll on the U.S. and global economy. In the face of this uncertainty, equity and bond markets experienced sharp outflows, and short-term markets, especially government markets, experienced a high degree of inflows. With liquidity at a premium, volatility flowed through to the short end of the credit markets, prompting a series of supportive actions by the Fed. In the face of all this, we continue to believe that our investment strategy, with its focus on capital preservation and liquidity, is as important as ever.
8 | Institutional Money Market Funds
Table of Contents
As a shareholder of the Fund, you incur ongoing costs, including management fees, shareholder servicing fees, and other Fund expenses. This example is intended to help you understand your ongoing costs (in dollars) of investing in the Fund and to compare these costs with the ongoing costs of investing in other mutual funds.
The example is based on an investment of $1,000 invested at the beginning of thesix-month period and held for the entire period from August 1, 2019 to January 31, 2020.
Actual expenses
The “Actual” line of the table below provides information about actual account values and actual expenses. You may use the information in this line, together with the amount you invested, to estimate the expenses that you paid over the period. Simply divide your account value by $1,000 (for example, an $8,600 account value divided by $1,000 = 8.6), then multiply the result by the number in the “Actual” line under the heading entitled “Expenses paid during period” for your applicable class of shares to estimate the expenses you paid on your account during this period.
Hypothetical example for comparison purposes
The “Hypothetical” line of the table below provides information about hypothetical account values and hypothetical expenses based on the Fund’s actual expense ratio and an assumed rate of return of 5% per year before expenses, which is not the Fund’s actual return. The hypothetical account values and expenses may not be used to estimate the actual ending account balance or expenses you paid for the period. You may use this information to compare the ongoing costs of investing in the Fund and other funds. To do so, compare this 5% hypothetical example with the 5% hypothetical examples that appear in the shareholder reports of the other funds.
Please note that the expenses shown in the table are meant to highlight your ongoing costs only. Therefore, the “Hypothetical” line of the table is useful in comparing ongoing costs only and will not help you determine the relative total costs of owning different funds.
| Beginning account value 8-1-2019 | Ending account value 1-31-2020 | Expenses paid during the period1 | Annualized net expense ratio | |||||||||||||
Administrator Class | ||||||||||||||||
Actual | $ | 1,000.00 | $ | 1,008.96 | $ | 1.67 | 0.33 | % | ||||||||
Hypothetical (5% return before expenses) | $ | 1,000.00 | $ | 1,023.48 | $ | 1.68 | 0.33 | % | ||||||||
Institutional Class | ||||||||||||||||
Actual | $ | 1,000.00 | $ | 1,009.62 | $ | 1.01 | 0.20 | % | ||||||||
Hypothetical (5% return before expenses) | $ | 1,000.00 | $ | 1,024.13 | $ | 1.02 | 0.20 | % | ||||||||
Select Class | ||||||||||||||||
Actual | $ | 1,000.00 | $ | 1,009.97 | $ | 0.66 | 0.13 | % | ||||||||
Hypothetical (5% return before expenses) | $ | 1,000.00 | $ | 1,024.48 | $ | 0.66 | 0.13 | % | ||||||||
Service Class | ||||||||||||||||
Actual | $ | 1,000.00 | $ | 1,008.45 | $ | 2.17 | 0.43 | % | ||||||||
Hypothetical (5% return before expenses) | $ | 1,000.00 | $ | 1,022.97 | $ | 2.19 | 0.43 | % | ||||||||
| 1 | Expenses paid is equal to the annualized net expense ratio of each class multiplied by the average account value over the period, multiplied by the number of days in the most recent fiscal half-year divided by the number of days in the fiscal year (to reflect theone-half-year period). |
Institutional Money Market Funds | 9
Table of Contents
Portfolio of investments—January 31, 2020
| Interest rate | Maturity date | Principal | Value | |||||||||||||
| Certificates of Deposit: 18.10% | ||||||||||||||||
Bank of Montreal (1 Month LIBOR +0.18%)± | 1.94 | % | 4-3-2020 | $ | 32,000,000 | $ | 32,005,647 | |||||||||
Bank of Montreal (3 Month LIBOR +0.06%)± | 1.95 | 3-12-2020 | 39,000,000 | 39,005,927 | ||||||||||||
Bank of Montreal (1 Month LIBOR +0.18%)± | 1.96 | 5-1-2020 | 58,000,000 | 58,011,971 | ||||||||||||
Bank of Montreal (3 Month LIBOR +0.14%)± | 2.04 | 11-18-2020 | 34,000,000 | 34,026,525 | ||||||||||||
Bank of Nova Scotia (3 Month LIBOR +0.05%)± | 1.96 | 4-3-2020 | 55,000,000 | 55,008,081 | ||||||||||||
Bank of Nova Scotia (3 Month LIBOR +0.09%)± | 1.94 | 2-10-2021 | 33,000,000 | 33,003,094 | ||||||||||||
Bank of Nova Scotia | 2.00 | 3-3-2020 | 13,000,000 | 13,004,660 | ||||||||||||
Bank of Nova Scotia (3 Month LIBOR +0.10%)± | 2.00 | 8-4-2020 | 34,000,000 | 34,013,510 | ||||||||||||
Bank of Nova Scotia (3 Month LIBOR +0.13%) 144A± | 2.03 | 11-9-2020 | 17,000,000 | 17,011,652 | ||||||||||||
Canadian Imperial Bank (1 Month LIBOR +0.18%)± | 1.91 | 4-6-2020 | 35,000,000 | 35,010,124 | ||||||||||||
Canadian Imperial Bank (1 Month LIBOR +0.18%)± | 1.91 | 5-4-2020 | 45,000,000 | 45,019,786 | ||||||||||||
Canadian Imperial Bank (1 Month LIBOR +0.18%)± | 1.96 | 5-1-2020 | 40,000,000 | 40,016,506 | ||||||||||||
China Construction Bank Corporation NY (1 Month LIBOR +0.21%)± | 1.87 | 10-27-2020 | 80,000,000 | 79,989,130 | ||||||||||||
Cooperatieve Rabobank UA (1 Month LIBOR +0.19%)± | 1.85 | 5-20-2020 | 63,000,000 | 63,020,706 | ||||||||||||
Credit Industriel et Commercial NY (1 Month LIBOR +0.22%)± | 1.88 | 4-24-2020 | 40,000,000 | 40,011,633 | ||||||||||||
Credit Suisse New York (3 Month LIBOR +0.24%)± | 2.15 | 12-4-2020 | 39,000,000 | 39,047,918 | ||||||||||||
Mitsubishi Trust & Bank Company (1 Month LIBOR +0.20%)± | 1.93 | 5-6-2020 | 37,000,000 | 37,007,306 | ||||||||||||
Mizuho Bank Limited | 1.58 | 2-3-2020 | 17,650,000 | 17,650,000 | ||||||||||||
Mizuho Bank Limited | 1.87 | 5-5-2020 | 32,000,000 | 32,014,497 | ||||||||||||
Mizuho Bank Limited (1 Month LIBOR +0.27%)± | 1.98 | 6-8-2020 | 70,000,000 | 70,047,377 | ||||||||||||
MUFG Bank Limited of New York (3 Month LIBOR +0.14%)± | 2.04 | 5-11-2020 | 43,000,000 | 43,012,663 | ||||||||||||
MUFG Bank Limited of New York (3 Month LIBOR +0.18%)± | 2.10 | 2-27-2020 | 39,000,000 | 39,007,133 | ||||||||||||
National Bank of Canada (3 Month LIBOR +0.07%) 144A± | 1.98 | 5-1-2020 | 9,000,000 | 9,001,947 | ||||||||||||
Natixis NY (3 Month LIBOR +0.20%)± | 2.10 | 11-13-2020 | 34,000,000 | 34,036,515 | ||||||||||||
Nordea Bank AB (3 Month LIBOR +0.15%)± | 2.00 | 10-13-2020 | 31,000,000 | 31,025,452 | ||||||||||||
Norinchukin Bank | 1.78 | 7-15-2020 | 65,000,000 | 65,014,163 | ||||||||||||
Norinchukin Bank | 1.90 | 3-5-2020 | 35,000,000 | 35,009,562 | ||||||||||||
Norinchukin Bank | 1.95 | 4-21-2020 | 35,000,000 | 35,021,875 | ||||||||||||
Norinchukin Bank | 2.02 | 2-21-2020 | 50,000,000 | 50,011,988 | ||||||||||||
Norinchukin Bank | 2.20 | 2-4-2020 | 30,000,000 | 30,001,988 | ||||||||||||
Oversea-Chinese Banking (1 Month LIBOR +0.15%)± | 1.88 | 2-6-2020 | 43,000,000 | 43,002,471 | ||||||||||||
Oversea-Chinese Banking | 1.90 | 3-11-2020 | 20,000,000 | 20,004,112 | ||||||||||||
Royal Bank of Canada (3 Month LIBOR +0.30%)± | 2.10 | 7-22-2020 | 17,000,000 | 17,021,127 | ||||||||||||
Skandinaviska Enskilda Bank AB (3 Month LIBOR +0.15%)± | 2.06 | 10-2-2020 | 35,000,000 | 35,020,563 | ||||||||||||
Sumitomo Mitsui Banking Corporation (1 Month LIBOR +0.12%)± | 1.78 | 7-28-2020 | 50,000,000 | 50,000,660 | ||||||||||||
Sumitomo Mitsui Banking Corporation (1 Month LIBOR +0.20%)± | 1.91 | 7-7-2020 | 53,000,000 | 53,028,258 | ||||||||||||
Sumitomo Mitsui Banking Corporation (1 Month LIBOR +0.27%)± | 1.93 | 4-24-2020 | 10,000,000 | 10,004,072 | ||||||||||||
Sumitomo Mitsui Banking Corporation (1 Month LIBOR +0.27%)± | 2.05 | 5-1-2020 | 18,000,000 | 18,007,752 | ||||||||||||
Sumitomo Mitsui Trust NY (1 Month LIBOR +0.26%)± | 1.94 | 4-14-2020 | 24,000,000 | 24,007,449 | ||||||||||||
Sumitomo Mitsui Trust NY (1 Month LIBOR +0.21%)± | 1.97 | 2-3-2020 | 12,000,000 | 12,000,460 | ||||||||||||
Svenska Handelsbanken (1 Month LIBOR +0.22%)± | 1.87 | 7-22-2020 | 91,000,000 | 91,056,774 | ||||||||||||
Svenska Handelsbanken (3 Month LIBOR +0.16%)± | 2.00 | 10-16-2020 | 38,000,000 | 38,034,218 | ||||||||||||
Toronto Dominion Bank (3 Month LIBOR +0.28%)± | 2.17 | 6-11-2020 | 32,233,000 | 32,269,874 | ||||||||||||
Total Certificates of Deposit (Cost $1,627,923,770) | 1,628,527,126 | |||||||||||||||
|
| |||||||||||||||
Commercial Paper: 54.87% | ||||||||||||||||
| Asset-Backed Commercial Paper: 27.09% | ||||||||||||||||
Albion Capital Corporation (z) | 1.70 | 2-4-2020 | 31,362,000 | 31,356,651 | ||||||||||||
Anglesea Funding LLC (1 Month LIBOR +0.15%) 144A± | 1.80 | 7-29-2020 | 10,000,000 | 10,000,000 | ||||||||||||
Anglesea Funding LLC (1 Month LIBOR +0.15%) 144A± | 1.80 | 7-27-2020 | 41,000,000 | 40,998,776 | ||||||||||||
Anglesea Funding LLC (1 Month LIBOR +0.23%) 144A± | 1.89 | 5-20-2020 | 52,000,000 | 52,022,795 | ||||||||||||
Anglesea Funding LLC (3 Month LIBOR +0.12%) 144A± | 2.02 | 5-15-2020 | 70,000,000 | 70,000,064 | ||||||||||||
Atlantic Asset Securitization Corporation 144A(z) | 1.79 | 6-15-2020 | 13,699,000 | 13,608,797 | ||||||||||||
Atlantic Asset Securitization Corporation 144A(z) | 1.91 | 4-8-2020 | 17,000,000 | 16,945,058 | ||||||||||||
Barton Capital Corporation 144A(z) | 1.83 | 4-8-2020 | 10,000,000 | 9,966,850 | ||||||||||||
The accompanying notes are an integral part of these financial statements.
10 | Institutional Money Market Funds
Table of Contents
Portfolio of investments—January 31, 2020
| Interest rate | Maturity date | Principal | Value | |||||||||||||
| Asset-Backed Commercial Paper (continued) | ||||||||||||||||
Barton Capital Corporation 144A(z) | 2.10 | % | 2-24-2020 | $ | 15,000,000 | $ | 14,982,730 | |||||||||
Bedford Row Funding Corporation (1 Month LIBOR +0.24%) 144A± | 1.89 | 7-20-2020 | 39,000,000 | 39,020,511 | ||||||||||||
Bedford Row Funding Corporation (1 Month LIBOR +0.15%) 144A± | 1.91 | 2-3-2020 | 20,000,000 | 20,000,667 | ||||||||||||
Bedford Row Funding Corporation (3 Month LIBOR +0.09%) 144A± | 2.00 | 10-7-2020 | 33,000,000 | 33,013,159 | ||||||||||||
Bedford Row Funding Corporation (3 Month LIBOR +0.13%) 144A± | 2.03 | 11-24-2020 | 12,000,000 | 12,007,644 | ||||||||||||
Cedar Spring Capital Corporation 144A(z) | 1.69 | 2-6-2020 | 43,000,000 | 42,987,845 | ||||||||||||
Cedar Spring Capital Corporation 144A(z) | 1.96 | 4-1-2020 | 21,000,000 | 20,936,626 | ||||||||||||
Cedar Spring Capital Corporation 144A(z) | 2.01 | 3-18-2020 | 82,000,000 | 81,811,261 | ||||||||||||
Chariot Funding LLC 144A(z) | 1.65 | 2-10-2020 | 31,950,000 | 31,935,853 | ||||||||||||
Chesham Finance Limited 144A(z) | 1.64 | 2-3-2020 | 100,000,000 | 99,986,417 | ||||||||||||
Chesham Finance Limited 144A(z) | 1.64 | 2-3-2020 | 10,000,000 | 9,998,642 | ||||||||||||
Chesham Finance Limited 144A(z) | 1.64 | 2-3-2020 | 35,000,000 | 34,995,173 | ||||||||||||
Collateralized Commercial Paper Flex Company LLC (1 Month LIBOR +0.20%) 144A± | 1.86 | 6-23-2020 | 17,000,000 | 17,006,458 | ||||||||||||
Columbia Funding Company 144A(z) | 2.02 | 5-15-2020 | 63,000,000 | 62,681,194 | ||||||||||||
Columbia Funding Company 144A(z) | 2.02 | 6-2-2020 | 35,000,000 | 34,789,773 | ||||||||||||
Columbia Funding Company 144A(z) | 2.02 | 6-3-2020 | 40,000,000 | 39,757,373 | ||||||||||||
Columbia Funding Company 144A(z) | 2.02 | 6-9-2020 | 38,000,000 | 37,756,156 | ||||||||||||
Concord Minutemen Capital Company 144A(z) | 1.62 | 2-4-2020 | 65,000,000 | 64,988,379 | ||||||||||||
Concord Minutemen Capital Company 144A(z) | 1.89 | 7-10-2020 | 33,000,000 | 32,737,302 | ||||||||||||
Concord Minutemen Capital Company 144A(z) | 1.93 | 3-6-2020 | 14,000,000 | 13,977,229 | ||||||||||||
Concord Minutemen Capital Company 144A(z) | 1.96 | 5-15-2020 | 32,000,000 | 31,837,600 | ||||||||||||
Concord Minutemen Capital Company 144A(z) | 1.96 | 4-1-2020 | 13,000,000 | 12,962,531 | ||||||||||||
Concord Minutemen Capital Company 144A(z) | 2.01 | 3-18-2020 | 82,000,000 | 81,819,826 | ||||||||||||
Crown Point Capital Company (1 Month LIBOR +0.30%) 144A± | 1.99 | 6-8-2020 | 69,000,000 | 69,010,313 | ||||||||||||
Glencove Funding LLC (3 Month LIBOR +0.12%) 144A± | 2.02 | 5-20-2020 | 70,000,000 | 70,006,042 | ||||||||||||
Great Bridge Capital Company LLC 144A(z) | 1.79 | 5-26-2020 | 14,000,000 | 13,924,800 | ||||||||||||
Great Bridge Capital Company LLC 144A(z) | 1.83 | 5-20-2020 | 49,742,000 | 49,489,242 | ||||||||||||
Institutional Secured Funding LLC 144A(z) | 1.70 | 2-3-2020 | 100,000,000 | 99,986,625 | ||||||||||||
Institutional Secured Funding LLC 144A(z) | 1.73 | 2-7-2020 | 105,000,000 | 104,966,925 | ||||||||||||
Kells Funding LLC 144A(z) | 1.87 | 2-21-2020 | 25,000,000 | 24,976,958 | ||||||||||||
Kells Funding LLC 144A(z) | 1.88 | 4-16-2020 | 35,000,000 | 34,880,226 | ||||||||||||
Kells Funding LLC 144A(z) | 1.88 | 4-15-2020 | 24,000,000 | 23,919,000 | ||||||||||||
Kells Funding LLC 144A(z) | 2.02 | 3-13-2020 | 11,000,000 | 10,979,646 | ||||||||||||
Kells Funding LLC 144A(z) | 2.03 | 3-18-2020 | 12,000,000 | 11,975,074 | ||||||||||||
Kells Funding LLC 144A(z) | 2.07 | 3-24-2020 | 44,000,000 | 43,896,680 | ||||||||||||
Legacy Capital Company 144A(z) | 2.11 | 3-16-2020 | 11,000,000 | 10,976,900 | ||||||||||||
Lexington Parker Capital Company LLC 144A(z) | 1.60 | 2-5-2020 | 65,000,000 | 64,985,357 | ||||||||||||
Lexington Parker Capital Company LLC 144A(z) | 1.63 | 2-6-2020 | 50,000,000 | 49,986,450 | ||||||||||||
Liberty Funding LLC 144A(z) | 2.12 | 3-18-2020 | 34,000,000 | 33,925,294 | ||||||||||||
LMA Americas LLC 144A(z) | 1.82 | 7-6-2020 | 7,000,000 | 6,947,492 | ||||||||||||
LMA Americas LLC 144A(z) | 1.91 | 5-22-2020 | 35,000,000 | 34,816,522 | ||||||||||||
LMA Americas LLC 144A(z) | 2.00 | 2-25-2020 | 10,000,000 | 9,989,188 | ||||||||||||
LMA Americas LLC 144A(z) | 2.06 | 2-5-2020 | 14,750,000 | 14,746,620 | ||||||||||||
Manhattan Asset Funding Company LLC 144A(z) | 1.90 | 2-7-2020 | 15,000,000 | 14,995,275 | ||||||||||||
Matchpoint Finance plc 144A(z) | 1.65 | 2-10-2020 | 38,000,000 | 37,983,312 | ||||||||||||
Matchpoint Finance plc 144A(z) | 1.95 | 2-24-2020 | 10,000,000 | 9,989,287 | ||||||||||||
Matchpoint Finance plc (1 Month LIBOR +0.29%) 144A± | 1.99 | 4-9-2020 | 35,000,000 | 35,014,085 | ||||||||||||
Mountcliff Funding LLC 144A(z) | 1.68 | 2-3-2020 | 120,000,000 | 119,983,950 | ||||||||||||
Mountcliff Funding LLC (1 Month LIBOR +0.20%) 144A± | 1.85 | 4-24-2020 | 110,000,000 | 110,009,577 | ||||||||||||
Mountcliff Funding LLC 144A(z) | 2.01 | 2-4-2020 | 10,000,000 | 9,998,212 | ||||||||||||
Nieuw Amsterdam Receivables Corporation 144A(z) | 1.78 | 3-4-2020 | 67,000,000 | 66,897,311 | ||||||||||||
Regency Markets No.1 LLC 144A(z) | 1.65 | 2-14-2020 | 11,000,000 | 10,992,959 | ||||||||||||
Ridgefield Funding Company (1 Month LIBOR +0.30%) 144A± | 1.95 | 4-22-2020 | 10,000,000 | 10,004,643 | ||||||||||||
Thunder Bay Funding LLC 144A(z) | 2.01 | 3-17-2020 | 33,000,000 | 32,930,847 | ||||||||||||
Versailles CDS LLC 144A(z) | 2.06 | 2-14-2020 | 10,000,000 | 9,993,840 | ||||||||||||
The accompanying notes are an integral part of these financial statements.
Institutional Money Market Funds | 11
Table of Contents
Portfolio of investments—January 31, 2020
| Interest rate | Maturity date | Principal | Value | |||||||||||||
| Asset-Backed Commercial Paper (continued) | ||||||||||||||||
Victory Receivables 144A(z) | 1.81 | % | 3-11-2020 | $ | 67,000,000 | $ | 66,875,157 | |||||||||
| 2,436,943,149 | ||||||||||||||||
|
| |||||||||||||||
| Financial Company Commercial Paper: 15.69% | ||||||||||||||||
Australia & New Zealand Banking Group Limited 144A(z) | 1.88 | 5-21-2020 | 18,600,000 | 18,500,956 | ||||||||||||
Australia & New Zealand Banking Group Limited (3 Month LIBOR | 2.03 | 11-27-2020 | 39,000,000 | 39,021,927 | ||||||||||||
BNG Bank NV (1 Month LIBOR +0.17%) 144A± | 1.82 | 3-31-2020 | 5,000,000 | 5,000,697 | ||||||||||||
Collateralized Commercial Paper FLEX Company LLC (3 Month LIBOR +0.12%) 144A± | 1.99 | 1-6-2021 | 73,000,000 | 73,013,163 | ||||||||||||
Collateralized Commercial Paper V Company LLC (3 Month LIBOR | 1.83 | 10-27-2020 | 25,000,000 | 25,000,000 | ||||||||||||
Collateralized Commercial Paper V Company LLC (3 Month LIBOR +0.10%)± | 2.01 | 9-28-2020 | 65,000,000 | 65,029,323 | ||||||||||||
Commonwealth Bank of Australia (1 Month LIBOR +0.17%) 144A± | 1.95 | 4-2-2020 | 35,000,000 | 35,003,079 | ||||||||||||
Commonwealth Bank of Australia (3 Month LIBOR +0.12%) 144A± | 2.03 | 11-9-2020 | 34,000,000 | 34,020,715 | ||||||||||||
Commonwealth Bank of Australia (3 Month LIBOR +0.15%) 144A± | 2.08 | 9-24-2020 | 35,000,000 | 35,028,622 | ||||||||||||
Commonwealth Bank of Australia (3 Month LIBOR +0.45%) 144A± | 2.34 | 3-10-2020 | 20,757,000 | 20,769,169 | ||||||||||||
DBS Bank Limited 144A(z) | 1.82 | 7-6-2020 | 10,000,000 | 9,924,117 | ||||||||||||
DBS Bank Limited 144A(z) | 1.86 | 5-22-2020 | 20,000,000 | 19,893,289 | ||||||||||||
DBS Bank Limited 144A(z) | 1.86 | 4-14-2020 | 55,000,000 | 54,810,858 | ||||||||||||
DBS Bank Limited 144A(z) | 1.87 | 6-9-2020 | 58,000,000 | 57,638,289 | ||||||||||||
DBS Bank Limited 144A(z) | 1.90 | 6-26-2020 | 21,000,000 | 20,850,967 | ||||||||||||
DBS Bank Limited (3 Month LIBOR +0.06%) 144A± | 1.95 | 6-11-2020 | 30,000,000 | 29,999,924 | ||||||||||||
DBS Bank Limited 144A(z) | 2.27 | 2-28-2020 | 43,000,000 | 42,944,984 | ||||||||||||
Dexia Credit Local SA (z) | 1.87 | 4-15-2020 | 79,000,000 | 78,693,052 | ||||||||||||
Dexia Credit Local SA 144A | 1.88 | 3-23-2020 | 30,000,000 | 30,006,913 | ||||||||||||
Federation des Caisses (3 Month LIBOR +0.10%) 144A± | 1.99 | 9-9-2020 | 70,000,000 | 69,999,818 | ||||||||||||
ING US Funding LLC (1 Month LIBOR +0.20%) 144A± | 1.86 | 5-19-2020 | 39,000,000 | 39,013,413 | ||||||||||||
ING US Funding LLC (3 Month LIBOR +0.19%) 144A± | 2.10 | 10-1-2020 | 35,000,000 | 35,025,046 | ||||||||||||
National Australia Bank Limited (1 Month LIBOR +0.16%) 144A± | 1.82 | 5-19-2020 | 20,000,000 | 20,004,465 | ||||||||||||
National Australia Bank Limited (1 Month LIBOR +0.13%) 144A± | 1.82 | 2-7-2020 | 40,000,000 | 40,002,273 | ||||||||||||
National Australia Bank Limited (1 Month LIBOR +0.26%) 144A± | 1.92 | 6-19-2020 | 24,000,000 | 24,015,910 | ||||||||||||
National Australia Bank Limited (3 Month LIBOR +0.12%) 144A± | 2.01 | 12-11-2020 | 34,000,000 | 34,019,988 | ||||||||||||
Old Line Funding LLC (1 Month LIBOR +0.14%) 144A± | 1.80 | 10-22-2020 | 15,000,000 | 14,999,995 | ||||||||||||
Ontario Teachers Finance Trust 144A(z) | 1.81 | 7-20-2020 | 40,000,000 | 39,684,030 | ||||||||||||
Ontario Teachers Finance Trust 144A(z) | 2.10 | 3-12-2020 | 46,000,000 | 45,918,797 | ||||||||||||
Ontario Teachers Finance Trust 144A(z) | 2.20 | 3-6-2020 | 10,000,000 | 9,984,931 | ||||||||||||
Oversea-Chinese Banking Corporation Limited (3 Month LIBOR + | 1.94 | 2-18-2020 | 40,000,000 | 40,002,274 | ||||||||||||
Oversea-Chinese Banking Corporation Limited 144A(z) | 1.86 | 4-21-2020 | 10,000,000 | 9,961,525 | ||||||||||||
Oversea-Chinese Banking Corporation Limited (1 Month LIBOR + | 1.90 | 4-9-2020 | 35,000,000 | 35,008,087 | ||||||||||||
Oversea-Chinese Banking Corporation Limited (1 Month LIBOR +0.24%) 144A± | 1.97 | 6-5-2020 | 55,000,000 | 55,030,260 | ||||||||||||
Oversea-Chinese Banking Corporation Limited (3 Month LIBOR | 2.01 | 8-14-2020 | 30,000,000 | 29,998,395 | ||||||||||||
Oversea-Chinese Banking Corporation Limited (3 Month LIBOR | 2.04 | 11-4-2020 | 18,000,000 | 17,997,326 | ||||||||||||
Starbird Funding Corporation 144A(z) | 2.02 | 4-6-2020 | 24,000,000 | 23,925,024 | ||||||||||||
Toronto Dominion Bank (3 Month LIBOR +0.12%)± | 1.97 | 10-13-2020 | 35,000,000 | 35,019,116 | ||||||||||||
Toronto Dominion Bank (3 Month LIBOR +0.14%) 144A± | 2.05 | 11-13-2020 | 35,000,000 | 35,026,844 | ||||||||||||
Toronto Dominion Bank (3 Month LIBOR +0.19%) 144A± | 2.14 | 9-28-2020 | 40,000,000 | 40,040,988 | ||||||||||||
United Overseas Bank Limited 144A(z) | 1.85 | 2-4-2020 | 21,000,000 | 20,996,502 | ||||||||||||
| 1,410,825,051 | ||||||||||||||||
|
| |||||||||||||||
The accompanying notes are an integral part of these financial statements.
12 | Institutional Money Market Funds
Table of Contents
Portfolio of investments—January 31, 2020
| Interest rate | Maturity date | Principal | Value | |||||||||||||
| Other Commercial Paper: 12.09% | ||||||||||||||||
BNG Bank NV 144A(z) | 1.56 | % | 2-3-2020 | $ | 43,000,000 | $ | 42,994,284 | |||||||||
BNG Bank NV (1 Month LIBOR +0.20%) 144A± | 1.86 | 5-26-2020 | 38,000,000 | 38,008,607 | ||||||||||||
BNG Bank NV 144A(z) | 1.92 | 5-18-2020 | 47,000,000 | 46,775,528 | ||||||||||||
BNG Bank NV (z) | 2.02 | 4-15-2020 | 10,000,000 | 9,967,604 | ||||||||||||
Caisse des Depots 144A(z) | 1.57 | 2-3-2020 | 155,000,000 | 154,980,229 | ||||||||||||
Caisse des Depots 144A(z) | 1.70 | 4-22-2020 | 12,196,000 | 12,150,191 | ||||||||||||
Caisse des Depots 144A(z) | 2.02 | 3-16-2020 | 21,000,000 | 20,957,475 | ||||||||||||
China International Marine Containers (z) | 2.05 | 2-4-2020 | 55,000,000 | 54,990,619 | ||||||||||||
Equipment Intermediation 144A(z) | 1.60 | 2-3-2020 | 32,000,000 | 31,995,973 | ||||||||||||
Erste Abwicklungsanstalt 144A(z) | 1.60 | 2-5-2020 | 46,520,000 | 46,509,953 | ||||||||||||
Erste Bank der oesterreichischen Sparkassen AG (1 Month LIBOR +0.22%) 144A± | 1.88 | 3-27-2020 | 34,000,000 | 34,007,665 | ||||||||||||
European Investment Bank (z) | 1.57 | 2-4-2020 | 100,000,000 | 99,982,978 | ||||||||||||
Komatsu Finance America Incorporated 144A(z) | 1.69 | 2-13-2020 | 17,000,000 | 16,990,350 | ||||||||||||
Mercy Health (z) | 1.70 | 2-12-2020 | 11,110,000 | 11,104,171 | ||||||||||||
Nederlandse Waterschapsbank NV 144A(z) | 1.87 | 4-14-2020 | 59,000,000 | 58,800,740 | ||||||||||||
Nederlandse Waterschapsbank NV 144A(z) | 2.02 | 2-10-2020 | 40,000,000 | 39,983,044 | ||||||||||||
Nederlandse Waterschapsbank NV 144A(z) | 2.04 | 3-2-2020 | 74,000,000 | 73,898,044 | ||||||||||||
NRW Bank 144A(z) | 2.02 | 2-24-2020 | 20,000,000 | 19,978,827 | ||||||||||||
NRW Bank 144A(z) | 2.02 | 3-4-2020 | 18,000,000 | 17,973,584 | ||||||||||||
Toyota Credit Canada Incorporated (3 Month LIBOR +0.13%)± | 2.03 | 7-31-2020 | 15,000,000 | 15,006,622 | ||||||||||||
Toyota Finance Australia Limited (1 Month LIBOR +0.27%)± | 1.95 | 6-5-2020 | 36,000,000 | 36,022,673 | ||||||||||||
Toyota Finance Australia Limited (3 Month LIBOR +0.10%)± | 1.98 | 10-5-2020 | 50,000,000 | 50,013,286 | ||||||||||||
Toyota Motor Credit Corporation (3 Month LIBOR +0.08%)± | 1.87 | 10-23-2020 | 40,000,000 | 39,999,980 | ||||||||||||
Toyota Motor Credit Corporation (1 Month LIBOR +0.23%)± | 1.88 | 5-26-2020 | 35,000,000 | 35,016,394 | ||||||||||||
Toyota Motor Credit Corporation (1 Month LIBOR +0.16%)± | 1.89 | 2-27-2020 | 40,000,000 | 40,004,252 | ||||||||||||
Toyota Motor Credit Corporation (3 Month LIBOR +0.07%)± | 1.97 | 5-22-2020 | 39,000,000 | 39,012,918 | ||||||||||||
| 1,087,125,991 | ||||||||||||||||
|
| |||||||||||||||
Total Commercial Paper (Cost $4,934,045,924) |
| 4,934,894,191 | ||||||||||||||
|
| |||||||||||||||
Municipal Obligations : 7.36% |
| |||||||||||||||
Colorado: 1.30% |
| |||||||||||||||
Variable Rate Demand Notes ø: 1.30% |
| |||||||||||||||
Colorado HFA MFHR Class II Series B (Housing Revenue, FHLB SPA) | 1.72 | 5-1-2052 | 90,425,000 | 90,425,000 | ||||||||||||
Colorado Southern Ute Indian Tribe Reservation Series 2007 (Miscellaneous Revenue) 144A | 1.60 | 1-1-2027 | 26,490,000 | 26,490,000 | ||||||||||||
| 116,915,000 | ||||||||||||||||
|
| |||||||||||||||
Georgia: 0.12% |
| |||||||||||||||
| Other Municipal Debt: 0.07% | ||||||||||||||||
Municipal Electric Authority of Georgia (Utility Revenue) | 2.05 | 3-17-2020 | 6,007,000 | 6,008,303 | ||||||||||||
|
| |||||||||||||||
| Variable Rate Demand Note ø: 0.05% | ||||||||||||||||
Macon-Bibb County GA IDA Kumho Tire Georgia Incorporated Series A (Industrial Development Revenue, Korea Development LOC) | 1.80 | 12-1-2022 | 5,000,000 | 5,000,000 | ||||||||||||
|
| |||||||||||||||
Illinois: 0.11% |
| |||||||||||||||
| Variable Rate Demand Note ø: 0.11% | ||||||||||||||||
Illinois Housing Development Authority SeriesA-2 (Housing Revenue, FHLB SPA) | 1.60 | 8-1-2035 | 9,700,000 | 9,700,000 | ||||||||||||
|
| |||||||||||||||
The accompanying notes are an integral part of these financial statements.
Institutional Money Market Funds | 13
Table of Contents
Portfolio of investments—January 31, 2020
| Interest rate | Maturity date | Principal | Value | |||||||||||||
Kentucky: 0.17% |
| |||||||||||||||
| Variable Rate Demand Notes ø: 0.17% | ||||||||||||||||
Kentucky Housing Corporation Series O (Housing Revenue, Kentucky Housing Corporation SPA) | 1.60 | % | 1-1-2036 | $ | 10,045,000 | $ | 10,045,000 | |||||||||
Kentucky Housing Corporation Series T (Housing Revenue, Kentucky Housing Corporation SPA) | 1.60 | 7-1-2037 | 5,025,000 | 5,025,000 | ||||||||||||
| 15,070,000 | ||||||||||||||||
|
| |||||||||||||||
Missouri: 0.04% |
| |||||||||||||||
| Variable Rate Demand Note ø: 0.04% | ||||||||||||||||
Bridgeton MO IDA Stolze Printing (Industrial Development Revenue, Carrollton Bank LOC) | 1.62 | 12-1-2047 | 3,800,000 | 3,800,000 | ||||||||||||
|
| |||||||||||||||
New Hampshire: 0.95% |
| |||||||||||||||
| Variable Rate Demand Notes ø: 0.95% | ||||||||||||||||
National Finance Authority New Hampshire (Industrial Development Revenue, Kookmin Bank LOC) 144A | 1.80 | 7-1-2029 | 20,000,000 | 20,000,000 | ||||||||||||
New Hampshire Business Finance Authority CJ Foods Manufacturing Beaumont Corporation Series A (Industrial Development Revenue, Kookmin Bank LOC) 144A | 1.80 | 10-1-2028 | 65,000,000 | 65,000,000 | ||||||||||||
| 85,000,000 | ||||||||||||||||
|
| |||||||||||||||
New Jersey: 0.47% |
| |||||||||||||||
| Variable Rate Demand Note ø: 0.47% | ||||||||||||||||
Jets Stadium Development SeriesA-4B (Miscellaneous Revenue, Sumitomo Mitsui Banking Corporation LOC) 144A | 1.65 | 4-1-2047 | 42,555,000 | 42,555,000 | ||||||||||||
|
| |||||||||||||||
New York: 0.80% |
| |||||||||||||||
| Variable Rate Demand Notes ø: 0.80% | ||||||||||||||||
New York Dormitory Authority Personal Income Tax Revenue Series XFT910 (Tax Revenue, Citibank NA LIQ) 144A | 1.64 | 3-15-2040 | 12,000,000 | 12,000,000 | ||||||||||||
New York Dormitory Authority Secondary Issues Floater SeriesB-4 (Tax Revenue, Morgan Stanley Bank LIQ) 144A | 1.75 | 3-15-2040 | 16,000,000 | 16,000,000 | ||||||||||||
New York HFA 222 East 44th Street Series B (Housing Revenue, Bank of China LOC) | 1.72 | 5-1-2050 | 9,450,000 | 9,450,000 | ||||||||||||
New York HFA 572 11th Avenue Series A (Housing Revenue, Bank of China LOC) | 1.75 | 11-1-2049 | 18,650,000 | 18,650,000 | ||||||||||||
New York Municipal Water Finance Authority SeriesT-30001-I (Water & Sewer Revenue, Citibank NA LIQ) 144A | 1.64 | 6-15-2044 | 16,000,000 | 16,000,000 | ||||||||||||
| 72,100,000 | ||||||||||||||||
|
| |||||||||||||||
Other: 3.40% |
| |||||||||||||||
| Variable Rate Demand Notes ø: 3.40% | ||||||||||||||||
FHLMC MFHR Series M004 Class A(Housing Revenue, FHLMC LIQ) | 1.75 | 1-15-2042 | 36,788,575 | 36,788,575 | ||||||||||||
FHLMC MFHR Series M011 Class A (Housing Revenue, FHLMC LIQ) | 1.75 | 8-15-2021 | 75,000 | 75,000 | ||||||||||||
Fortenbery Children 2017 Irrevocable Trust (Miscellaneous Revenue, FHLB LOC) | 1.62 | 5-1-2037 | 12,275,000 | 12,275,000 | ||||||||||||
Providence St. Joseph Health & Services (Health Revenue, GNMA/FNMA/FHLMC Insured, JPMorgan Chase & Company SPA) | 1.62 | 10-1-2047 | 47,100,000 | 47,100,000 | ||||||||||||
Providence St. Joseph Health Obligation Series 12-E (Health Revenue, U.S. Bank NA LOC) | 1.68 | 10-1-2042 | 41,390,000 | 41,390,000 | ||||||||||||
SSAB AB Series A (Miscellaneous Revenue, DNB Banking ASA LOC) | 1.62 | 6-1-2035 | 28,000,000 | 28,000,000 | ||||||||||||
The accompanying notes are an integral part of these financial statements.
14 | Institutional Money Market Funds
Table of Contents
Portfolio of investments—January 31, 2020
| Interest rate | Maturity date | Principal | Value | |||||||||||||
| Variable Rate Demand Notes ø (continued) | ||||||||||||||||
Steadfast Crestavilla LLC Series A (Health Revenue, American AgCredit LOC) | 1.62 | % | 2-1-2056 | $ | 33,320,000 | $ | 33,320,000 | |||||||||
Steadfast Crestavilla LLC Series B (Health Revenue, U.S. Bank NA LOC) | 1.62 | 2-1-2056 | 22,040,000 | 22,040,000 | ||||||||||||
Taxable Municipal Funding Trust (GO Revenue, Barclays Bank plc LOC) 144A | 1.67 | 9-1-2027 | 12,470,000 | 12,470,000 | ||||||||||||
Taxable Municipal Funding Trust (GO Revenue, Barclays Bank plc LOC) 144A | 2.00 | 9-1-2027 | 72,090,000 | 72,090,000 | ||||||||||||
| 305,548,575 | ||||||||||||||||
|
| |||||||||||||||
Total Municipal Obligations (Cost $661,695,575) | 661,696,878 | |||||||||||||||
|
| |||||||||||||||
| Non-Agency Mortgage-Backed Securities: 0.28% | ||||||||||||||||
Pepper Residential Securities Trust Series 20A Class A1U2 (1 Month LIBOR +0.32%) 144A± | 1.99 | 3-16-2020 | 25,000,000 | 25,003,837 | ||||||||||||
TotalNon-Agency Mortgage-Backed Securities (Cost $25,000,000) | 25,003,837 | |||||||||||||||
|
| |||||||||||||||
| Other Instruments: 3.79% | ||||||||||||||||
Altoona Blair County Development Corporation 144A§øø | 1.64 | 9-1-2038 | 14,850,000 | 14,850,000 | ||||||||||||
Altoona Blair County Development Corporation 144A§øø | 1.64 | 9-1-2038 | 32,000,000 | 32,000,000 | ||||||||||||
ASC Mercer Island LLC §øø | 1.62 | 6-1-2057 | 33,900,000 | 33,900,000 | ||||||||||||
Gerald J Rubin Special Trust Secured §øø | 1.62 | 12-1-2048 | 14,215,000 | 14,215,000 | ||||||||||||
Invesco Dynamic Credit Opportunities Fund SeriesW-7 §øø | 1.71 | 6-1-2028 | 55,000,000 | 55,000,000 | ||||||||||||
Keep Memory Alive §øø | 1.64 | 5-1-2037 | 34,500,000 | 34,500,000 | ||||||||||||
Ken-Vin Life Company LLC Secured §øø | 1.60 | 12-1-2059 | 19,645,000 | 19,645,000 | ||||||||||||
La Mesa Senior Living LP Secured §øø | 1.62 | 8-1-2057 | 25,925,000 | 25,925,000 | ||||||||||||
Opus Group AB §øø | 1.67 | 10-1-2032 | 25,000,000 | 25,000,000 | ||||||||||||
Opus Inspection Incorporated §øø | 1.67 | 1-1-2034 | 28,000,000 | 28,000,000 | ||||||||||||
ROC III CA Crossings Chino Hills LLC Series A §øø | 1.62 | 1-1-2057 | 34,000,000 | 34,000,000 | ||||||||||||
ROC III CA Crossings Chino Hills LLC Series B §øø | 1.62 | 1-1-2057 | 24,000,000 | 24,000,000 | ||||||||||||
Total Other Instruments (Cost $341,035,000) | 341,035,000 | |||||||||||||||
|
| |||||||||||||||
Other Notes: 1.07% | ||||||||||||||||
| Corporate Bonds and Notes : 1.07% | ||||||||||||||||
Cellmark Incorporated Secured §øø | 1.67 | 6-1-2038 | 96,000,000 | 96,000,000 | ||||||||||||
Total Other Notes (Cost $96,000,000) | 96,000,000 | |||||||||||||||
|
| |||||||||||||||
| Repurchase Agreements ^^: 14.42% | ||||||||||||||||
Bank of America Corporation, dated1-31-2020, maturity value $426,056,445 (1) | 1.59 | 2-3-2020 | 426,000,000 | 426,000,000 | ||||||||||||
Bank of Nova Scotia, dated1-31-2020, maturity value $374,049,555 (2) | 1.59 | 2-3-2020 | 374,000,000 | 374,000,000 | ||||||||||||
MUFG Securities, dated1-31-2020, maturity value $374,049,555 (3) | 1.59 | 2-3-2020 | 374,000,000 | 374,000,000 | ||||||||||||
Standard Chartered Bank, dated1-31-2020, maturity value $123,016,400 (4) | 1.60 | 2-3-2020 | 123,000,000 | 123,000,000 | ||||||||||||
Total Repurchase Agreements (Cost $1,297,000,000) | 1,297,000,000 | |||||||||||||||
|
| |||||||||||||||
| Total investments in securities (Cost $8,982,700,269) | 99.89 | % | 8,984,157,032 | |||||
Other assets and liabilities, net | 0.11 | 9,908,024 | ||||||
|
|
|
| |||||
| Total net assets | 100.00 | % | $ | 8,994,065,056 | ||||
|
|
|
| |||||
The accompanying notes are an integral part of these financial statements.
Institutional Money Market Funds | 15
Table of Contents
Portfolio of investments—January 31, 2020
| ± | Variable rate investment. The rate shown is the rate in effect at period end. |
| 144A | The security may be resold in transactions exempt from registration, normally to qualified institutional buyers, pursuant to Rule 144A under the Securities Act of 1933. |
| (z) | Zero coupon security. The rate represents the current yield to maturity. |
| ø | Variable rate demand notes are subject to a demand feature which reduces the effective maturity. The maturity date shown represents the final maturity date of the security. The interest rate is determined and reset by the issuer daily, weekly, or monthly depending upon the terms of the security. The rate shown is the rate in effect at period end. |
| § | The security is subject to a demand feature which reduces the effective maturity. |
| øø | The interest rate is determined and reset by the issuer periodically depending upon the terms of the security. The rate shown is the rate in effect at period end. |
| ^^ | Collateralized by: |
(1) U.S. government securities, 3.00% to 3.50%,1-20-2045 to7-20-2045, fair value including accrued interest is $438,780,000. |
(2) U.S. government securities, 2.40% to 6.00%,1-15-2030 to10-1-2049, fair value including accrued interest is $385,220,000. |
(3) U.S. government securities, 1.13% to 5.50%,5-31-2020 to1-1-2050, fair value including accrued interest is $384,909,699. |
(4) U.S. government securities, 0.00% to 6.50%,3-26-2020 to1-1-2050, fair value including accrued interest is $126,190,062. |
Abbreviations:
| FHLB | Federal Home Loan Bank |
| FHLMC | Federal Home Loan Mortgage Corporation |
| FNMA | Federal National Mortgage Association |
| GNMA | Government National Mortgage Association |
| GO | General obligation |
| HFA | Housing Finance Authority |
| IDA | Industrial Development Authority |
| LIBOR | London Interbank Offered Rate |
| LIQ | Liquidity agreement |
| LOC | Letter of credit |
| MFHR | Multifamily housing revenue |
| ROC | Reset option certificates |
| SPA | Standby purchase agreement |
The accompanying notes are an integral part of these financial statements.
16 | Institutional Money Market Funds
Table of Contents
Statement of assets and liabilities—January 31, 2020
Assets | ||||
Investments in unaffiliated securities, at value (cost $7,685,700,269) | $ | 7,687,157,032 | ||
Investments in repurchase agreements, at value (cost $1,297,000,000) | 1,297,000,000 | |||
Cash | 34,537 | |||
Receivable for Fund shares sold | 5,000,200 | |||
Receivable for interest | 10,880,921 | |||
Prepaid expenses and other assets | 175,354 | |||
|
| |||
Total assets | 9,000,248,044 | |||
|
| |||
Liabilities | ||||
Management fee payable | 2,898,846 | |||
Dividends payable | 2,292,280 | |||
Administration fees payable | 414,189 | |||
Custody and accounting fees payable | 122,903 | |||
Trustees’ fees and expenses payable | 4,085 | |||
Accrued expenses and other liabilities | 450,685 | |||
|
| |||
Total liabilities | 6,182,988 | |||
|
| |||
Total net assets | $ | 8,994,065,056 | ||
|
| |||
Net assets consist of | ||||
Paid-in capital | $ | 8,992,845,687 | ||
Total distributable earnings | 1,219,369 | |||
|
| |||
Total net assets | $ | 8,994,065,056 | ||
|
| |||
Computation of net asset value per share | ||||
Net assets – Administrator Class | $ | 113,554,950 | ||
Shares outstanding – Administrator Class1 | 113,501,417 | |||
Net asset value per share – Administrator Class | $1.0005 | |||
Net assets – Institutional Class | $ | 1,704,935,845 | ||
Shares outstanding – Institutional Class1 | 1,704,170,198 | |||
Net asset value per share – Institutional Class | $1.0004 | |||
Net assets – Select Class | $ | 7,119,681,226 | ||
Shares outstanding – Select Class1 | 7,115,905,672 | |||
Net asset value per share – Select Class | $1.0005 | |||
Net assets – Service Class | $ | 55,893,035 | ||
Shares outstanding – Service Class1 | 55,869,421 | |||
Net asset value per share – Service Class | $1.0004 | |||
| 1 | The Fund has an unlimited number of authorized shares. |
The accompanying notes are an integral part of these financial statements.
Institutional Money Market Funds | 17
Table of Contents
Statement of operations—year ended January 31, 2020
Investment income | ||||
Interest | $ | 214,012,393 | ||
|
| |||
Expenses | ||||
Management fee | 13,334,683 | |||
Administration fees |
| |||
Administrator Class | 122,866 | |||
Institutional Class | 1,293,685 | |||
Select Class | 2,945,920 | |||
Service Class | 73,221 | |||
Shareholder servicing fees |
| |||
Administrator Class | 122,866 | |||
Service Class | 145,042 | |||
Custody and accounting fees | 368,709 | |||
Professional fees | 63,568 | |||
Shareholder report expenses | 17,420 | |||
Trustees’ fees and expenses | 21,121 | |||
Other fees and expenses | 481 | |||
|
| |||
Total expenses | 18,509,582 | |||
Less: Fee waivers and/or expense reimbursements |
| |||
Fund-level | (1,890,391 | ) | ||
Administrator Class | (56 | ) | ||
Institutional Class | (162,019 | ) | ||
Select Class | (2,945,920 | ) | ||
Service Class | (35,257 | ) | ||
|
| |||
Net expenses | 13,475,939 | |||
|
| |||
Net investment income | 200,536,454 | |||
|
| |||
Realized and unrealized gains (losses) on investments | ||||
Net realized gains on investments | 115,159 | |||
Net change in unrealized gains (losses) on investments | 519,257 | |||
|
| |||
Net realized and unrealized gains (losses) on investments | 634,416 | |||
|
| |||
Net increase in net assets resulting from operations | $ | 201,170,870 | ||
|
| |||
The accompanying notes are an integral part of these financial statements.
18 | Institutional Money Market Funds
Table of Contents
Statement of changes in net assets
| Year ended January 31, 2020 | Year ended January 31, 2019 | |||||||||||||||
Operations | ||||||||||||||||
Net investment income | $ | 200,536,454 | $ | 159,851,992 | ||||||||||||
Net realized gains on investments | 115,159 | 56,876 | ||||||||||||||
Net change in unrealized gains (losses) on investments | 519,257 | 431,979 | ||||||||||||||
|
| |||||||||||||||
Net increase in net assets resulting from operations | 201,170,870 | 160,340,847 | ||||||||||||||
|
| |||||||||||||||
Distributions to shareholders from net investment income |
| |||||||||||||||
Administrator Class | (2,463,061 | ) | (1,895,476 | ) | ||||||||||||
Institutional Class | (34,480,790 | ) | (28,249,539 | ) | ||||||||||||
Select Class | (162,480,176 | ) | (128,601,249 | ) | ||||||||||||
Service Class | (1,169,303 | ) | (1,105,728 | ) | ||||||||||||
|
| |||||||||||||||
Total distributions to shareholders | (200,593,330 | ) | (159,851,992 | ) | ||||||||||||
|
| |||||||||||||||
Capital share transactions | Shares | Shares | ||||||||||||||
Proceeds from shares sold |
| |||||||||||||||
Administrator Class | 304,292,625 | 304,417,847 | 211,434,343 | 211,501,197 | ||||||||||||
Institutional Class | 7,307,497,722 | 7,310,378,605 | 9,160,087,234 | 9,162,659,933 | ||||||||||||
Select Class | 43,141,092,358 | 43,162,070,083 | 35,980,466,135 | 35,993,622,643 | ||||||||||||
Service Class | 284,421,114 | 284,525,386 | 239,534,792 | 239,602,726 | ||||||||||||
|
| |||||||||||||||
| 51,061,391,921 | 45,607,386,499 | |||||||||||||||
|
| |||||||||||||||
Reinvestment of distributions |
| |||||||||||||||
Administrator Class | 2,286,271 | 2,287,236 | 1,713,630 | 1,714,172 | ||||||||||||
Institutional Class | 31,083,601 | 31,095,996 | 23,610,733 | 23,617,570 | ||||||||||||
Select Class | 133,529,867 | 133,596,397 | 104,456,935 | 104,496,372 | ||||||||||||
Service Class | 805,331 | 805,647 | 835,422 | 835,654 | ||||||||||||
|
| |||||||||||||||
| 167,785,276 | 130,663,768 | |||||||||||||||
|
| |||||||||||||||
Payment for shares redeemed |
| |||||||||||||||
Administrator Class | (285,711,749 | ) | (285,829,450 | ) | (213,025,903 | ) | (213,088,180 | ) | ||||||||
Institutional Class | (7,207,293,293 | ) | (7,210,108,091 | ) | (8,715,286,298 | ) | (8,717,706,523 | ) | ||||||||
Select Class | (42,615,048,851 | ) | (42,635,758,688 | ) | (35,343,945,454 | ) | (35,356,866,490 | ) | ||||||||
Service Class | (299,657,734 | ) | (299,770,183 | ) | (231,465,196 | ) | (231,531,059 | ) | ||||||||
|
| |||||||||||||||
| (50,431,466,412 | ) | (44,519,192,252 | ) | |||||||||||||
|
| �� | ||||||||||||||
Net increase in net assets resulting from capital share transactions | 797,710,785 | 1,218,858,015 | ||||||||||||||
|
| |||||||||||||||
Total increase in net assets | 798,288,325 | 1,219,346,870 | ||||||||||||||
|
| |||||||||||||||
Net assets | ||||||||||||||||
Beginning of period | 8,195,776,731 | 6,976,429,861 | ||||||||||||||
|
| |||||||||||||||
End of period | $ | 8,994,065,056 | $ | 8,195,776,731 | ||||||||||||
|
| |||||||||||||||
The accompanying notes are an integral part of these financial statements.
Institutional Money Market Funds | 19
Table of Contents
(For a share outstanding throughout each period)
| Year ended January 31 | ||||||||||||||||||||
| ADMINISTRATOR CLASS | 2020 | 2019 | 2018 | 2017 | 20161 | |||||||||||||||
Net asset value, beginning of period | $1.0004 | $1.0003 | $1.0003 | $1.0000 | $1.00 | |||||||||||||||
Net investment income | 0.0203 | 0.0188 | 0.0096 | 0.0028 | 0.00 | 2 | ||||||||||||||
Net realized and unrealized gains (losses) on investments | 0.0001 | 0.0001 | 0.0000 | 3 | 0.0003 | 0.00 | 2 | |||||||||||||
|
|
|
|
|
|
|
|
|
| |||||||||||
Total from investment operations | 0.0204 | 0.0189 | 0.0096 | 0.0031 | 0.00 | 2 | ||||||||||||||
Distributions to shareholders from | ||||||||||||||||||||
Net investment income | (0.0203 | ) | (0.0188 | ) | (0.0096 | ) | (0.0028 | ) | (0.00 | )2 | ||||||||||
Net realized gains | (0.0000 | )3 | 0.0000 | (0.0000 | )3 | 0.0000 | 0.00 | |||||||||||||
|
|
|
|
|
|
|
|
|
| |||||||||||
Total distributions to shareholders | (0.0203 | ) | (0.0188 | ) | (0.0096 | ) | (0.0028 | ) | (0.00 | )2 | ||||||||||
Net asset value, end of period | $1.0005 | $1.0004 | $1.0003 | $1.0003 | $1.00 | |||||||||||||||
Total return | 2.05 | % | 1.91 | % | 0.96 | % | 0.31 | % | 0.03 | % | ||||||||||
Ratios to average net assets (annualized) | ||||||||||||||||||||
Gross expenses | 0.35 | % | 0.36 | % | 0.40 | % | 0.35 | % | 0.34 | % | ||||||||||
Net expenses | 0.33 | % | 0.33 | % | 0.32 | % | 0.33 | % | 0.25 | % | ||||||||||
Net investment income | 2.01 | % | 1.87 | % | 0.96 | % | 0.24 | % | 0.03 | % | ||||||||||
Supplemental data | ||||||||||||||||||||
Net assets, end of period (000s omitted) | $113,555 | $92,671 | $92,542 | $82,591 | $258,152 | |||||||||||||||
| 1 | Amounts reflect the Fund transacting shares at a fixed NAV rounded to two decimal places. Beginning October 11, 2016, the Fund began selling and redeeming shares of the Fund at a floating NAV rounded to the fourth decimal place. |
| 2 | Amount is less than $0.005. |
| 3 | Amount is less than $0.00005. |
The accompanying notes are an integral part of these financial statements.
20 | Institutional Money Market Funds
Table of Contents
Financial highlights
(For a share outstanding throughout each period)
| Year ended January 31 | ||||||||||||||||||||
| INSTITUTIONAL CLASS | 2020 | 2019 | 2018 | 2017 | 20161 | |||||||||||||||
Net asset value, beginning of period | $1.0004 | $1.0003 | $1.0003 | $1.0000 | $1.00 | |||||||||||||||
Net investment income | 0.0216 | 0.0202 | 0.0108 | 0.0039 | 0.00 | 2 | ||||||||||||||
Net realized and unrealized gains (losses) on investments | 0.0000 | 3 | 0.0000 | 3 | 0.0000 | 3 | 0.0005 | 0.00 | 2 | |||||||||||
|
|
|
|
|
|
|
|
|
| |||||||||||
Total from investment operations | 0.0216 | 0.0202 | 0.0108 | 0.0044 | 0.00 | 2 | ||||||||||||||
Distributions to shareholders from | ||||||||||||||||||||
Net investment income | (0.0216 | ) | (0.0201 | ) | (0.0108 | ) | (0.0041 | ) | (0.00 | )2 | ||||||||||
Net realized gains | (0.0000 | )3 | 0.0000 | (0.0000 | )3 | 0.0000 | 0.00 | |||||||||||||
|
|
|
|
|
|
|
|
|
| |||||||||||
Total distributions to shareholders | (0.0216 | ) | (0.0201 | ) | (0.0108 | ) | (0.0041 | ) | (0.00 | )2 | ||||||||||
Net asset value, end of period | $1.0004 | $1.0004 | $1.0003 | $1.0003 | $1.00 | |||||||||||||||
Total return | 2.18 | % | 2.04 | % | 1.09 | % | 0.44 | % | 0.08 | % | ||||||||||
Ratios to average net assets (annualized) | ||||||||||||||||||||
Gross expenses | 0.23 | % | 0.24 | % | 0.28 | % | 0.23 | % | 0.22 | % | ||||||||||
Net expenses | 0.20 | % | 0.20 | % | 0.20 | % | 0.20 | % | 0.20 | % | ||||||||||
Net investment income | 2.14 | % | 2.03 | % | 1.11 | % | 0.36 | % | 0.08 | % | ||||||||||
Supplemental data | ||||||||||||||||||||
Net assets, end of period (000s omitted) | $1,704,936 | $1,573,458 | $1,104,814 | $749,052 | $8,252,614 | |||||||||||||||
| 1 | Amounts reflect the Fund transacting shares at a fixed NAV rounded to two decimal places. Beginning October 11, 2016, the Fund began selling and redeeming shares of the Fund at a floating NAV rounded to the fourth decimal place. |
| 2 | Amount is less than $0.005. |
| 3 | Amount is less than $0.00005. |
The accompanying notes are an integral part of these financial statements.
Institutional Money Market Funds | 21
Table of Contents
Financial highlights
(For a share outstanding throughout each period)
| Year ended January 31 | ||||||||||||||||||||
| SELECT CLASS | 2020 | 2019 | 2018 | 2017 | 20161 | |||||||||||||||
Net asset value, beginning of period | $1.0005 | $1.0004 | $1.0004 | $1.0000 | $1.00 | |||||||||||||||
Net investment income | 0.0223 | 0.0208 | 0.0116 | 0.0048 | 0.00 | 2 | ||||||||||||||
Net realized and unrealized gains (losses) on investments | 0.0000 | 3 | 0.0001 | 0.0000 | 3 | 0.0004 | 0.00 | 2 | ||||||||||||
|
|
|
|
|
|
|
|
|
| |||||||||||
Total from investment operations | 0.0223 | 0.0209 | 0.0116 | 0.0052 | 0.00 | 2 | ||||||||||||||
Distributions to shareholders from | ||||||||||||||||||||
Net investment income | (0.0223 | ) | (0.0208 | ) | (0.0116 | ) | (0.0048 | ) | (0.00 | )2 | ||||||||||
Net realized gains | (0.0000 | )3 | 0.0000 | (0.0000 | )3 | 0.0000 | 0.00 | |||||||||||||
|
|
|
|
|
|
|
|
|
| |||||||||||
Total distributions to shareholders | (0.0223 | ) | (0.0208 | ) | (0.0116 | ) | (0.0048 | ) | (0.00 | )2 | ||||||||||
Net asset value, end of period | $1.0005 | $1.0005 | $1.0004 | $1.0004 | $1.00 | |||||||||||||||
Total return | 2.25 | % | 2.11 | % | 1.16 | % | 0.52 | % | 0.15 | % | ||||||||||
Ratios to average net assets (annualized) | ||||||||||||||||||||
Gross expenses | 0.19 | % | 0.20 | % | 0.24 | % | 0.19 | % | 0.18 | % | ||||||||||
Net expenses | 0.13 | % | 0.13 | % | 0.12 | % | 0.13 | % | 0.13 | % | ||||||||||
Net investment income | 2.21 | % | 2.10 | % | 1.19 | % | 0.43 | % | 0.16 | % | ||||||||||
Supplemental data | ||||||||||||||||||||
Net assets, end of period (000s omitted) | $7,119,681 | $6,459,320 | $5,717,659 | $3,386,093 | $37,219,390 | |||||||||||||||
| 1 | Amounts reflect the Fund transacting shares at a fixed NAV rounded to two decimal places. Beginning October 11, 2016, the Fund began selling and redeeming shares of the Fund at a floating NAV rounded to the fourth decimal place. |
| 2 | Amount is less than $0.005. |
| 3 | Amount is less than $0.00005. |
The accompanying notes are an integral part of these financial statements.
22 | Institutional Money Market Funds
Table of Contents
Financial highlights
(For a share outstanding throughout each period)
| Year ended January 31 | ||||||||||||||||||||
| SERVICE CLASS | 2020 | 2019 | 2018 | 2017 | 20161 | |||||||||||||||
Net asset value, beginning of period | $1.0004 | $1.0003 | $1.0003 | $1.0000 | $1.00 | |||||||||||||||
Net investment income | 0.0194 | 0.0177 | 0.0085 | 0.0016 | 0.00 | 2 | ||||||||||||||
Net realized and unrealized gains (losses) on investments | (0.0001 | ) | 0.0002 | 0.0000 | 3 | 0.0005 | 0.00 | 2 | ||||||||||||
|
|
|
|
|
|
|
|
|
| |||||||||||
Total from investment operations | 0.0193 | 0.0179 | 0.0085 | 0.0021 | 0.00 | 2 | ||||||||||||||
Distributions to shareholders from | ||||||||||||||||||||
Net investment income | (0.0193 | ) | (0.0178 | ) | (0.0085 | ) | (0.0018 | ) | (0.00 | )2 | ||||||||||
Net realized gains | (0.0000 | )3 | 0.0000 | (0.0000 | )3 | 0.0000 | 0.00 | |||||||||||||
|
|
|
|
|
|
|
|
|
| |||||||||||
Total distributions to shareholders | (0.0193 | ) | (0.0178 | ) | (0.0085 | ) | (0.0018 | ) | (0.00 | )2 | ||||||||||
Net asset value, end of period | $1.0004 | $1.0004 | $1.0003 | $1.0003 | $1.00 | |||||||||||||||
Total return | 1.95 | % | 1.81 | % | 0.85 | % | 0.21 | % | 0.02 | % | ||||||||||
Ratios to average net assets (annualized) | ||||||||||||||||||||
Gross expenses | 0.51 | % | 0.51 | % | 0.55 | % | 0.52 | % | 0.51 | % | ||||||||||
Net expenses | 0.43 | % | 0.43 | % | 0.43 | % | 0.43 | % | 0.27 | % | ||||||||||
Net investment income | 1.92 | % | 1.79 | % | 0.84 | % | 0.13 | % | 0.02 | % | ||||||||||
Supplemental data | ||||||||||||||||||||
Net assets, end of period (000s omitted) | $55,893 | $70,327 | $61,415 | $67,439 | $898,288 | |||||||||||||||
| 1 | Amounts reflect the Fund transacting shares at a fixed NAV rounded to two decimal places. Beginning October 11, 2016, the Fund began selling and redeeming shares of the Fund at a floating NAV rounded to the fourth decimal place. |
| 2 | Amount is less than $0.005. |
| 3 | Amount is less than $0.00005. |
The accompanying notes are an integral part of these financial statements.
Institutional Money Market Funds | 23
Table of Contents
1. ORGANIZATION
Wells Fargo Funds Trust (the “Trust”), a Delaware statutory trust organized on March 10, 1999, is anopen-end management investment company registered under the Investment Company Act of 1940, as amended (the “1940 Act”). As an investment company, the Trust follows the accounting and reporting guidance in Financial Accounting Standards Board (“FASB”)Accounting Standards Codification Topic 946, Financial Services – Investment Companies. These financial statements report on the Wells Fargo Heritage Money Market Fund (the “Fund”) which is a diversified series of the Trust.
The Fund operates as an institutionalnon-government money market fund. As an institutionalnon-government money market fund, shareholders will transact at a floating net asset value (NAV) rounded to four decimal places in accordance with the valuation policies below.
Consistent with Rule2a-7, the Board of Trustees of the Fund is permitted to impose a liquidity fee on redemptions from the Fund or a redemption gate (i.e., a suspension of the right to redeem) in the event that the Fund’s liquidity falls below required minimums because of market conditions or other factors. If the Fund’s weekly liquid assets (as defined in Rule2a-7(34)) fall below 30% of the Fund’s total assets, the Board of Trustees is permitted, but not required, to: (i) impose a liquidity fee of no more than 2% of the amount redeemed; and/or (ii) impose a redemption gate. If the Fund’s weekly liquid assets fall below 10% of the Fund’s total assets, the Fund must impose, generally as of the beginning of the next business day, a liquidity fee of 1% of the amount redeemed unless the Board of Trustees determines that such a fee is not in the best interest of the Fund or determines that a lower or higher fee (subject to the 2% limit) is in the best interest of the Fund. Liquidity fees reduce the amount a shareholder receives upon redemption of its shares. The Fund retains any liquidity fees for the benefit of remaining shareholders. The Board of Trustees did not impose any liquidity fees and/or redemption gates during the year ended January 31, 2020.
2. SIGNIFICANT ACCOUNTING POLICIES
The following significant accounting policies, which are consistently followed in the preparation of the financial statements of the Fund, are in conformity with U.S. generally accepted accounting principles which require management to make estimates and assumptions that affect the reported amounts of assets and liabilities, disclosure of contingent assets and liabilities at the date of the financial statements, and the reported amounts of revenues and expenses during the reporting period. Actual results could differ from those estimates.
Securities valuation
Debt securities are valued at the evaluated bid price provided by an independent pricing service (e.g. taking into account various factors, including yields, maturities, or credit ratings) or, if a reliable price is not available, the quoted bid price from an independent broker-dealer.
Investments which are not valued using the method discussed above are valued at their fair value, as determined in good faith by the Board of Trustees. The Board of Trustees has established a Valuation Committee comprised of the Trustees and has delegated to it the authority to take any actions regarding the valuation of portfolio securities that the Valuation Committee deems necessary or appropriate, including determining the fair value of portfolio securities, unless the determination has been delegated to the Wells Fargo Asset Management Pricing Committee at Wells Fargo Funds Management, LLC (“Funds Management”). The Board of Trustees retains the authority to make or ratify any valuation decisions or approve any changes to the Valuation Procedures as it deems appropriate. On a quarterly basis, the Board of Trustees receives reports on any valuation actions taken by the Valuation Committee or the Wells Fargo Asset Management Pricing Committee which may include items for ratification.
Repurchase agreements
The Fund may invest in repurchase agreements and may participate in pooled repurchase agreement transactions with other funds advised by Funds Management. Repurchase agreements are agreements where the seller of a security to the Fund agrees to repurchase that security from the Fund at a mutually agreed upon time and price. The repurchase agreements must be fully collateralized based on values that aremarked-to-market daily. The collateral may be held by an agent bank under atri-party agreement. It is the custodian’s responsibility to value collateral daily and to take action to obtain additional collateral as necessary to maintain a market value equal to or greater than the resale price. The repurchase agreements are collateralized by securities issued or guaranteed by the U.S. Government, its agencies or instrumentalities. There could be potential loss to the Fund in the event that the Fund is delayed or prevented from exercising its rights to dispose of the collateral, including the risk of a possible decline in the value of the underlying obligations during the period in which the Fund seeks to assert its rights.
24 | Institutional Money Market Funds
Table of Contents
Notes to financial statements
When-issued transactions
The Fund may purchase securities on a forward commitment or when-issued basis. The Fund records a when-issued transaction on the trade date and will segregate assets in an amount at least equal in value to the Fund’s commitment to purchase when-issued securities. Securities purchased on a when-issued basis aremarked-to-market daily and the Fund begins earning interest on the settlement date. Losses may arise due to changes in the market value of the underlying securities or if the counterparty does not perform under the contract.
Security transactions and income recognition
Securities transactions are recorded on a trade date basis. Realized gains or losses are recorded on the basis of identified cost.
Interest income is accrued daily and bond discounts are accreted and premiums are amortized daily. To the extent debt obligations are placed onnon-accrual status, any related interest income may be reduced by writing off interest receivables when the collection of all or a portion of interest has been determined to be doubtful based on consistently applied procedures and the fair value has decreased. If the issuer subsequently resumes interest payments or when the collectability of interest is reasonably assured, the debt obligation is removed fromnon-accrual status.
Distributions to shareholders
Distributions to shareholders from net investment income are declared daily and paid monthly. Distributions from net realized gains, if any, are recorded on theex-dividend date and paid at least annually. Such distributions are determined in accordance with income tax regulations and may differ from U.S. generally accepted accounting principles. Dividend sources are estimated at the time of declaration. The tax character of distributions is determined as of the Fund’s fiscal year end. Therefore, a portion of the Fund’s distributions made prior to the Fund’s fiscal year end may be categorized as a tax return of capital at year end.
Federal and other taxes
The Fund intends to continue to qualify as a regulated investment company by distributing substantially all of its investment company taxable income and any net realized capital gains (after reduction for capital loss carryforwards) sufficient to relieve it from all, or substantially all, federal income taxes. Accordingly, no provision for federal income taxes was required.
The Fund’s income and federal excise tax returns and all financial records supporting those returns for the prior three fiscal years are subject to examination by the federal and Delaware revenue authorities. Management has analyzed the Fund’s tax positions taken on federal, state, and foreign tax returns for all open tax years and does not believe that there are any uncertain tax positions that require recognition of a tax liability.
As of January 31, 2020, the aggregate cost of all investments for federal income tax purposes was $8,982,700,271 and the unrealized gains (losses) consisted of:
Gross unrealized gains | $ | 1,662,338 | ||
Gross unrealized losses | (205,577 | ) | ||
Net unrealized gains | $ | 1,456,761 | ||
Class allocations
The separate classes of shares offered by the Fund differ principally in shareholder servicing and administration fees. Class specific expenses are charged directly to that share class. Investment income, common fund-level expenses, and realized and unrealized gains (losses) on investments are allocated daily to each class of shares based on the relative proportion of net assets of each class.
3. FAIR VALUATION MEASUREMENTS
Fair value measurements of investments are determined within a framework that has established a fair value hierarchy based upon the various data inputs utilized in determining the value of the Fund’s investments. The three-level hierarchy gives the highest priority to unadjusted quoted prices in active markets for identical assets or liabilities (Level 1) and the lowest priority to unobservable inputs (Level 3). The Fund’s investments are classified within the fair value hierarchy based on the lowest level of input that is significant to the fair value measurement. The inputs are summarized into three broad levels as follows:
| ∎ | Level 1 – quoted prices in active markets for identical securities |
| ∎ | Level 2 – other significant observable inputs (including quoted prices for similar securities, interest rates, prepayment speeds, credit risk, etc.) |
| ∎ | Level 3 – significant unobservable inputs (including the Fund’s own assumptions in determining the fair value of investments) |
Institutional Money Market Funds | 25
Table of Contents
Notes to financial statements
The inputs or methodologies used for valuing investments in securities are not necessarily an indication of the risk associated with investing in those securities.
The following is a summary of the inputs used in valuing the Fund’s assets and liabilities as of January 31, 2020:
| Quoted prices (Level 1) | Other significant observable inputs (Level 2) | Significant (Level 3) | Total | |||||||||||||
Assets | ||||||||||||||||
Investments in: | ||||||||||||||||
Certificates of deposit | $ | 0 | $ | 1,628,527,126 | $ | 0 | $ | 1,628,527,126 | ||||||||
Commercial paper | 0 | 4,934,894,191 | 0 | 4,934,894,191 | ||||||||||||
Municipal obligations | 0 | 661,696,878 | 0 | 661,696,878 | ||||||||||||
Non-agency mortgage-backed securities | 0 | 25,003,837 | 0 | 25,003,837 | ||||||||||||
Other instruments | 0 | 341,035,000 | 0 | 341,035,000 | ||||||||||||
Other notes | 0 | 96,000,000 | 0 | 96,000,000 | ||||||||||||
Repurchase agreements | 0 | 1,297,000,000 | 0 | 1,297,000,000 | ||||||||||||
Total assets | $ | 0 | $ | 8,984,157,032 | $ | 0 | $ | 8,984,157,032 | ||||||||
Additional sector, industry or geographic detail is included in the Portfolio of Investments.
For the year ended January 31, 2020, the Fund did not have any transfers into/out of Level 3.
4. TRANSACTIONS WITH AFFILIATES
Management fee
Funds Management, an indirect wholly owned subsidiary of Wells Fargo & Company (“Wells Fargo”), is the manager of the Fund and provides advisory and fund-level administrative services under an investment management agreement. Under the investment management agreement, Funds Management is responsible for, among other services, implementing the investment objectives and strategies of the Fund, supervising the subadvisers and providing fund-level administrative services in connection with the Fund’s operations. As compensation for its services under the investment management agreement, Funds Management is entitled to receive a management fee at the following annual rate based on the Fund’s average daily net assets:
| Average daily net assets | Management fee | |
First $5 billion | 0.15% | |
Next $5 billion | 0.14 | |
Over $10 billion | 0.13 | |
For the year ended January 31, 2020, the management fee was equivalent to an annual rate of 0.15% of the Fund’s average daily net assets.
Funds Management has retained the services of certain subadvisers to provide daily portfolio management to the Fund. The fee for subadvisory services is borne by Funds Management. Wells Capital Management Incorporated, an affiliate of Funds Management and an indirect wholly owned subsidiary of Wells Fargo, is a subadviser to the Fund and is entitled to receive a fee from Funds Management at an annual rate starting at 0.05% and declining to 0.01% as the average daily net assets of the Fund increase. Wells Capital Management Singapore, a separately identifiable department of Wells Fargo Bank, N.A, an affiliate of Funds Management and wholly owned subsidiary of Wells Fargo, is also a subadviser to the Fund and is entitled to receive a fee from Funds Management at an annual rate starting at 0.0025% and declining to 0.0005% as the average daily net assets of the Fund increase.
26 | Institutional Money Market Funds
Table of Contents
Notes to financial statements
Administration fees
Under a class-level administration agreement, Funds Management provides class-level administrative services to the Fund, which includes paying fees and expenses for services provided by the transfer agent,sub-transfer agents, omnibus account servicers and record-keepers. As compensation for its services under the class-level administration agreement, Funds Management receives an annual fee which is calculated based on the average daily net assets of each class as follows:
| Class-level administration fee | ||||
Administrator Class | 0.10 | % | ||
Institutional Class | 0.08 | |||
Select Class | 0.04 | |||
Service Class | 0.12 | |||
Waivers and/or expense reimbursements
Funds Management has contractually waived and/or reimbursed management and administration fees to the extent necessary to maintain certain net operating expense ratios for the Fund. When each class of the Fund has exceeded its expense cap, Funds Management has waived fees and/or reimbursed expenses from fund-level expenses on a proportionate basis and then from class specific expenses. When only certain classes exceed their expense caps, waivers and/or reimbursements are applied against class specific expenses before fund-level expenses. Funds Management has committed through May 31, 2020 to waive fees and/or reimburse expenses to the extent necessary to cap the Fund’s expenses at 0.33% for Administrator Class shares, 0.20% for Institutional Class shares, 0.13% for Select Class shares, and 0.43% for Service Class shares. Prior to or after the commitment expiration date, the cap may be increased or the commitment to maintain the cap may be terminated only with the approval of the Board of Trustees. Prior to May 31, 2019, the Fund’s expenses were capped at 0.35% for Administrator Class shares.
Shareholder servicing fees
The Trust has entered into contracts with one or more shareholder servicing agents, whereby Service Class of the Fund is charged a fee at an annual rate of 0.25% of its average daily net assets. Administrator Class is charged a fee at an annual rate of 0.10% of its average daily net assets. A portion of these total shareholder servicing fees were paid to affiliates of Wells Fargo.
Interfund transactions
The Fund may purchase or sell portfolio investment securities to certain other Wells Fargo affiliates pursuant to Rule17a-7 under the 1940 Act and under procedures adopted by the Board of Trustees. The procedures have been designed to ensure that these interfund transactions, which do not incur broker commissions, are effected at current market prices.
5. DISTRIBUTIONS TO SHAREHOLDERS
The tax character of distributions paid was $200,593,330 and $159,851,992 of ordinary income for the years ended January 31, 2020 and January 31, 2019, respectively.
As of January 31, 2020, the components of distributable earnings on a tax basis were as follows:
| Undistributed ordinary income | Unrealized gains | |
| $2,285,003 | $1,456,761 | |
6. INDEMNIFICATION
Under the Trust’s organizational documents, the officers and Trustees have been granted certain indemnification rights against certain liabilities that may arise out of performance of their duties to the Trust. Additionally, in the normal course of business, the Trust may enter into contracts with service providers that contain a variety of indemnification clauses. The Trust’s maximum exposure under these arrangements is dependent on future claims that may be made against the Fund and, therefore, cannot be estimated.
Institutional Money Market Funds | 27
Table of Contents
Notes to financial statements
7. NEW ACCOUNTING PRONOUNCEMENTS
In August 2018, FASB issued Accounting Standards Update (“ASU”)No. 2018-13, Fair Value Measurement (Topic 820)Disclosure Framework—Changes to the Disclosure Requirements for Fair Value Measurement. ASU2018-13 updates the disclosure requirements for fair value measurements by modifying or removing certain disclosures and adding certain new disclosures. The amendments are effective for fiscal years, and interim periods within those fiscal years, beginning after December 15, 2019. Early adoption is permitted. Management has adopted the removal and modification of disclosures early, as permitted, and will adopt the additional new disclosures at the effective date.
In March 2017, FASB issued ASUNo. 2017-08,Premium Amortization on Purchased Callable Debt Securities. ASU2017-08
shortens the amortization period for certain callable debt securities held at a premium and requires the premium to be amortized to the earliest call date. The amendments do not require an accounting change for securities held at a discount and discounts will continue to be accreted to the maturity date of the security. ASU2017-08 is effective for fiscal years beginning after December 15, 2018 and for interim periods within those fiscal years. During the current reporting period, management of the Fund adopted the change in accounting policy which did not have a material impact to the Fund’s financial statements.
8. SUBSEQUENT EVENT
On March 11, 2020, the World Health Organization announced that it had made the assessment that coronavirus disease 2019(“COVID-19”) is a pandemic. The impacts ofCOVID-19 is adversely affecting the entire global economy, individual companies and investment products, and the market in general. There is significant uncertainty around the extent and duration of business disruptions related toCOVID-19 and the impact may be short term or may last for an extended period of time. The risk of further spreading ofCOVID-19 has led to significant uncertainty and volatility in the financial markets and the value of the Fund and the securities in which the Fund invests may be adversely affected by impacts caused by COVID-19. Since fiscal year end, the Fund has seen significant redemptions. The Board and management continue to monitor liquidity in the Fund.
28 | Institutional Money Market Funds
Table of Contents
Report of independent registered public accounting firm
TO THE SHAREHOLDERS OF THE FUND AND BOARD OF TRUSTEES OF WELLS FARGO FUNDS TRUST:
Opinion on the Financial Statements
We have audited the accompanying statement of assets and liabilities of Wells Fargo Heritage Money Market Fund (the Fund), one of the funds constituting Wells Fargo Funds Trust, including the portfolio of investments, as of January 31, 2020, the related statement of operations for the year then ended, the statements of changes in net assets for each of the years in thetwo-year period then ended, and the related notes (collectively, the financial statements) and the financial highlights for each of the years in the five-year period then ended. In our opinion, the financial statements and financial highlights present fairly, in all material respects, the financial position of the Fund as of January 31, 2020, the results of its operations for the year then ended, the changes in its net assets for each of the years in thetwo-year period then ended, and the financial highlights for each of the years in the five-year period then ended, in conformity with U.S. generally accepted accounting principles.
Basis for Opinion
These financial statements and financial highlights are the responsibility of the Fund’s management. Our responsibility is to express an opinion on these financial statements and financial highlights based on our audits. We are a public accounting firm registered with the Public Company Accounting Oversight Board (United States) (PCAOB) and are required to be independent with respect to the Fund in accordance with the U.S. federal securities laws and the applicable rules and regulations of the Securities and Exchange Commission and the PCAOB.
We conducted our audits in accordance with the standards of the PCAOB. Those standards require that we plan and perform the audit to obtain reasonable assurance about whether the financial statements and financial highlights are free of material misstatement, whether due to error or fraud. Our audits included performing procedures to assess the risks of material misstatement of the financial statements and financial highlights, whether due to error or fraud, and performing procedures that respond to those risks. Such procedures included examining, on a test basis, evidence regarding the amounts and disclosures in the financial statements and financial highlights. Such procedures also included confirmation of securities owned as of January 31, 2020, by correspondence with the custodian and brokers, or by other appropriate auditing procedures. Our audits also included evaluating the accounting principles used and significant estimates made by management, as well as evaluating the overall presentation of the financial statements and financial highlights. We believe that our audits provide a reasonable basis for our opinion.

We have not been able to determine the specific year that we began serving as the auditor of one or more Wells Fargo Funds investment companies; however we are aware that we have served as the auditor of one or more Wells Fargo Funds investment companies since at least 1955.
Boston, Massachusetts
March 31, 2020
Institutional Money Market Funds | 29
Table of Contents
TAX INFORMATION
For the fiscal year ended January 31, 2020, $120,830,949 has been designated as interest-related dividends for nonresident alien shareholders pursuant to Section 871 of the Internal Revenue Code.
For the fiscal year ended January 31, 2020, $56,876 has been designated as short-term capital gain dividends for nonresident alien shareholders pursuant to Section 871 of the Internal Revenue Code.
PROXY VOTING INFORMATION
A description of the policies and procedures used to determine how to vote proxies relating to portfolio securities is available, upon request, by calling1-800-222-8222, visiting our website atwfam.com, or visiting the SEC website at sec.gov. Information regarding how the proxies related to portfolio securities were voted during the most recent12-month period ended June 30 is available on the website atwfam.comor by visiting the SEC website at sec.gov.
30 | Institutional Money Market Funds
Table of Contents
Other information (unaudited)
BOARD OF TRUSTEES AND OFFICERS
Each of the Trustees and Officers1 listed in the table below acts in identical capacities for each fund in the Wells Fargo family of funds, which consists of 149 mutual funds comprising the Wells Fargo Funds Trust, Wells Fargo Variable Trust, Wells Fargo Master Trust and fourclosed-end funds (collectively the “Fund Complex”). This table should be read in conjunction with the Prospectus and the Statement of Additional Information2. The mailing address of each Trustee and Officer is 525 Market Street, 12th Floor, San Francisco, CA 94105. Each Trustee and Officer serves an indefinite term, however, each Trustee serves such term until reaching the mandatory retirement age established by the Trustees.
Independent Trustees
| Name and year of birth | Position held and length of service* | Principal occupations during past five years or longer | Current other public company or investment company directorships | |||
| William R. Ebsworth (Born 1957) | Trustee, since 2015 | Retired. From 1984 to 2013, equities analyst, portfolio manager, research director and chief investment officer at Fidelity Management and Research Company in Boston, Tokyo, and Hong Kong, and retired in 2013 as Chief Investment Officer of Fidelity Strategic Advisers, Inc. where he led a team of investment professionals managing client assets. Prior thereto, Board member of Hong Kong Securities Clearing Co., Hong Kong Options Clearing Corp., the Thailand International Fund, Ltd., Fidelity Investments Life Insurance Company, and Empire Fidelity Investments Life Insurance Company. Audit Committee Chair and Investment Committee Chair of the Vincent Memorial Hospital Endowment(non-profit organization). Mr. Ebsworth is a CFA® charterholder. | N/A | |||
| Jane A. Freeman (Born 1953) | Trustee, since 2015; Chair Liaison, since 2018 | Retired. From 2012 to 2014 and 1999 to 2008, Chief Financial Officer of Scientific Learning Corporation. From 2008 to 2012, Ms. Freeman provided consulting services related to strategic business projects. Prior to 1999, Portfolio Manager at Rockefeller & Co. and Scudder, Stevens & Clark. Board member of the Harding Loevner Funds from 1996 to 2014, serving as both Lead Independent Director and chair of the Audit Committee. Board member of the Russell Exchange Traded Funds Trust from 2011 to 2012 and the chair of the Audit Committee. Ms. Freeman is a Board Member of The Ruth Bancroft Garden(non-profit organization). She is also an inactive Chartered Financial Analyst. | N/A | |||
| Isaiah Harris, Jr. (Born 1952) | Trustee, since 2009; Audit Committee Chairman, since 2019 | Retired. Chairman of the Board of CIGNA Corporation since 2009, and Director since 2005. From 2003 to 2011, Director of Deluxe Corporation. Prior thereto, President and CEO of BellSouth Advertising and Publishing Corp. from 2005 to 2007, President and CEO of BellSouth Enterprises from 2004 to 2005 and President of BellSouth Consumer Services from 2000 to 2003. Emeritus member of the Iowa State University Foundation Board of Governors. Emeritus Member of the Advisory Board of Iowa State University School of Business. Advisory Board Member, Palm Harbor Academy (private school). Advisory Board Member, Child Evangelism Fellowship(non-profit). Mr. Harris is a certified public accountant (inactive status). | CIGNA Corporation | |||
| Judith M. Johnson (Born 1949) | Trustee, since 2008; Audit Committee Chairman, from 2009 to 2018 | Retired. Prior thereto, Chief Executive Officer and Chief Investment Officer of Minneapolis Employees Retirement Fund from 1996 to 2008. Ms. Johnson is an attorney, certified public accountant and a certified managerial accountant. | N/A | |||
Institutional Money Market Funds | 31
Table of Contents
Other information (unaudited)
| Name and year of birth | Position held and length of service* | Principal occupations during past five years or longer | Current other public company or investment company directorships | |||
| David F. Larcker (Born 1950) | Trustee, since 2009 | James Irvin Miller Professor of Accounting at the Graduate School of Business, Stanford University, Director of the Corporate Governance Research Initiative and Senior Faculty of The Rock Center for Corporate Governance since 2006. From 2005 to 2008, Professor of Accounting at the Graduate School of Business, Stanford University. Prior thereto, Ernst & Young Professor of Accounting at The Wharton School, University of Pennsylvania from 1985 to 2005. | N/A | |||
| Olivia S. Mitchell (Born 1953) | Trustee, since 2006; Nominating and Governance Committee Chair, since 2018 | International Foundation of Employee Benefit Plans Professor, Wharton School of the University of Pennsylvania since 1993. Director of Wharton’s Pension Research Council and Boettner Center on Pensions & Retirement Research, and Research Associate at the National Bureau of Economic Research. Previously, Cornell University Professor from 1978 to 1993. | N/A | |||
| Timothy J. Penny (Born 1951) | Trustee, since 1996; Chairman, since 2018 | President and Chief Executive Officer of Southern Minnesota Initiative Foundation, anon-profit organization, since 2007. Member of the Board of Trustees of NorthStar Education Finance, Inc., anon-profit organization, since 2007. | N/A | |||
| James G. Polisson (Born 1959) | Trustee, since 2018 | Retired. Chief Marketing Officer, Source (ETF) UK Services, Ltd, from 2015 to 2017. From 2012 to 2015, Principal of The Polisson Group, LLC, a management consulting, corporate advisory and principal investing company. Chief Executive Officer and Managing Director at Russell Investments, Global Exchange Traded Funds from 2010 to 2012. Managing Director of Barclays Global Investors from 1998 to 2010 and Global Chief Marketing Officer for iShares and Barclays Global Investors from 2000 to 2010. Trustee of the San Francisco Mechanics’ Institute, anon-profit organization, from 2013 to 2015. Board member of the Russell Exchange Traded Fund Trust from 2011 to 2012. Director of Barclays Global Investors Holdings Deutschland GmbH from 2006 to 2009. Mr. Polisson is an attorney and has a retired status with the Massachusetts and District of Columbia Bar Associations. | N/A | |||
| Pamela Wheelock3 (Born 1959) | Trustee, since January 2020; previously Trustee from January 2018 to July 2019 | Board member of the Destination Medical Center Economic Development Agency, Rochester, Minnesota since 2019. Acting Commissioner, Minnesota Department of Human Services, July 2019 through September 2019. Human Services Manager (part-time), Minnesota Department of Human Services, October 2019 through December 2019. Chief Operating Officer, Twin Cities Habitat for Humanity from 2017 to 2019. Vice President of University Services, University of Minnesota from 2012 to 2016. Prior thereto, on the Board of Directors, Governance Committee and Finance Committee for the Minnesota Philanthropy Partners (Saint Paul Foundation) from 2012 to 2018, Interim Chief Executive Officer of Blue Cross Blue Shield of Minnesota from 2011 to 2012, Chairman of the Board from 2009 to 2012 and Board Director from 2003 to 2015. Vice President, Leadership and Community Engagement, Bush Foundation, Saint Paul, Minnesota (a private foundation) from 2009 to 2011. Executive Vice President and Chief Financial Officer, Minnesota Sports and Entertainment from 2004 to 2009 and Senior Vice President from 2002 to 2004. Executive Vice President of the Minnesota Wild Foundation from 2004 to 2008. Commissioner of Finance, State of Minnesota, from 1999 to 2002. Currently Board Chair of the Minnesota Wild Foundation since 2010. | N/A | |||
| * | Length of service dates reflect the Trustee’s commencement of service with the Trust’s predecessor entities, where applicable. |
32 | Institutional Money Market Funds
Table of Contents
Other information (unaudited)
Officers
| Name and year of birth | Position held and length of service | Principal occupations during past five years or longer | ||
| Andrew Owen (Born 1960) | President, since 2017 | Executive Vice President of Wells Fargo & Company and Head of Affiliated Managers, Wells Fargo Asset Management, since 2014. In addition, Mr. Owen is currently President, Chief Executive Officer and Director of Wells Fargo Funds Management, LLC since 2017. Prior thereto, Executive Vice President responsible for marketing, investments and product development for Wells Fargo Funds Management, LLC, from 2009 to 2014. | ||
| Nancy Wiser1 (Born 1967) | Treasurer, since 2012 | Executive Vice President of Wells Fargo Funds Management, LLC since 2011. Chief Operating Officer and Chief Compliance Officer at LightBox Capital Management LLC, from 2008 to 2011. | ||
| Michelle Rhee (Born 1966) | Chief Legal Officer, since 2019 | Secretary of Wells Fargo Funds Management, LLC, Chief Legal Counsel of Wells Fargo Asset Management and Assistant General Counsel of Wells Fargo Bank, N.A. since 2018. Associate General Counsel and Managing Director of Bank of America Corporation from 2004 to 2018. | ||
| Catherine Kennedy (Born 1969) | Secretary, since 2019 | Vice President of Wells Fargo Funds Management, LLC and Senior Counsel of the Wells Fargo Legal Department since 2010. Vice President and Senior Counsel of Evergreen Investment Management Company, LLC from 1998 to 2010. | ||
| Michael H. Whitaker(Born 1967) | Chief Compliance Officer, since 2016 | Chief Compliance Officer of Wells Fargo Asset Management since 2016. Senior Vice President and Chief Compliance Officer for Fidelity Investments from 2007 to 2016. | ||
| David Berardi (Born 1975) | Assistant Treasurer, since 2009 | Vice President of Wells Fargo Funds Management, LLC since 2009. Vice President of Evergreen Investment Management Company, LLC from 2008 to 2010. Manager of Fund Reporting and Control for Evergreen Investment Management Company, LLC from 2004 to 2010. | ||
| Jeremy DePalma1 (Born 1974) | Assistant Treasurer, since 2009 | Senior Vice President of Wells Fargo Funds Management, LLC since 2009. Senior Vice President of Evergreen Investment Management Company, LLC from 2008 to 2010 and head of the Fund Reporting and Control Team within Fund Administration from 2005 to 2010. | ||
| 1 | Nancy Wiser acts as Treasurer of 64 funds in the Fund Complex. Jeremy DePalma acts as Treasurer of 85 funds and Assistant Treasurer of 64 funds in the Fund Complex. |
| 2 | The Statement of Additional Information includes additional information about the Trustees and is available, without charge, upon request, by calling1-800-222-8222 or by visiting the website atwfam.com. |
| 3 | Pamela Wheelock wasre-appointed to the Board effective January 1, 2020. |
Institutional Money Market Funds | 33
Table of Contents
This page is intentionally left blank.
Table of Contents
This page is intentionally left blank.
Table of Contents
This page is intentionally left blank.
Table of Contents
For more information
More information about Wells Fargo Funds is available free upon request. To obtain literature, please write, visit the Fund’s website, or call:
Wells Fargo Funds
P.O. Box 219967
Kansas City, MO 64121-9967
Website:wfam.com
Individual investors:1-800-222-8222
Retail investment professionals:1-888-877-9275
Institutional investment professionals:1-866-765-0778

This report and the financial statements contained herein are submitted for the general information of the shareholders of the Fund. If this report is used for promotional purposes, distribution of the report must be accompanied or preceded by a current prospectus. Before investing, please consider the investment objectives, risks, charges, and expenses of the investment. For a current prospectus and, if available, a summary prospectus, containing this information, call1-800-260-5969 or visit the Fund’s website atwfam.com. Read the prospectus carefully before you invest or send money.
Wells Fargo Asset Management (WFAM) is the trade name for certain investment advisory/management firms owned by Wells Fargo & Company. These firms include but are not limited to Wells Capital Management Incorporated and Wells Fargo Funds Management, LLC. Certain products managed by WFAM entities are distributed by Wells Fargo Funds Distributor, LLC (a broker-dealer and Member FINRA).
This material is for general informational and educational purposes only and is NOT intended to provide investment advice or a recommendation of any kind—including a recommendation for any specific investment, strategy, or plan.
INVESTMENT PRODUCTS: NOT FDIC INSURED ◾ NO BANK GUARANTEE ◾ MAY LOSE VALUE
© 2020 Wells Fargo & Company. All rights reserved
PAR-0220-03779 03-20
A304/AR304 01-20
Table of Contents

Annual Report
January 31, 2020
Retail Money Market Funds
| ∎ | Wells Fargo Money Market Fund |
Beginning on January 1, 2021, as permitted by new regulations adopted by the Securities and Exchange Commission, paper copies of the Wells Fargo Funds’ annual and semi-annual shareholder reports issued after this date will no longer be sent by mail, unless you specifically request paper copies of the reports. Instead, the reports will be made available on the Funds’ website, and you will be notified by mail each time a report is posted and provided with a website address to access the report.
If you already elected to receive shareholder reports electronically, you will not be affected by this change and you need not take any action. You may elect to receive shareholder reports and other communications from the Fund electronically at any time by contacting your financial intermediary (such as a broker-dealer or bank) or, if you are a direct investor, by calling1-800-222-8222 or by enrolling at wellsfargo.com/advantagedelivery.
You may elect to receive all future reports in paper free of charge. If you invest through a financial intermediary, you can contact your financial intermediary to request that you continue to receive paper copies of your shareholder reports; if you invest directly with the Fund, you can call 1-800-222-8222. Your election to receive reports in paper will apply to all Wells Fargo Funds held in your account with your financial intermediary or, if you are a direct investor, to all Wells Fargo Funds that you hold.
Table of Contents
|
Reduce clutter. Save trees. |
Sign up for electronic delivery of prospectuses and shareholder reports atwellsfargo.com/advantagedelivery |
The views expressed and any forward-looking statements are as of January 31, 2020, unless otherwise noted, and are those of the Fund managers and/or Wells Fargo Asset Management. Discussions of individual securities, or the markets generally, or any Wells Fargo Fund are not intended as individual recommendations. Future events or results may vary significantly from those expressed in any forward-looking statements. The views expressed are subject to change at any time in response to changing circumstances in the market. Wells Fargo Asset Management and the Fund disclaim any obligation to publicly update or revise any views expressed or forward-looking statements.
INVESTMENT PRODUCTS: NOT FDIC INSURED ◾ NO BANK GUARANTEE ◾ MAY LOSE VALUE
Retail Money Market Funds | 1
Table of Contents
Letter to shareholders (unaudited)

Andrew Owen
President
Wells Fargo Funds
Dear Shareholder:
We are pleased to offer you this annual report for the Wells Fargo Money Market Fund for the 12-month period that ended January 31, 2020. Despite some periods of market volatility, the year was strongly positive for financial markets as supportive central banks more than offset concerns over slowing global economic growth and international trade tensions.
Overall, both fixed-income and equity investors enjoyed healthy annual returns, with U.S. markets leading the way. For the period, U.S. stocks, based on the S&P 500 Index,1 gained 21.68% and international stocks, as measured by the MSCI ACWI ex USA Index (Net),2 returned 9.94%. The MSCI EM Index (Net)3 gained a more modest 3.81%. For bond investors, the Bloomberg Barclays U.S. Aggregate Bond Index4 added 9.64%, the Bloomberg Barclays Global Aggregate ex-USD Index5 returned 3.95%, the Bloomberg Barclays Municipal Bond Index6 gained 8.65%, and the ICE BofA U.S. High Yield Index7 added 9.39%.
The year began with a strong market rebound.
Financial markets opened 2019 on a positive note, as investors were encouraged by the U.S. Federal Reserve (Fed) taking a more accommodative stance after a series of increases to the federal funds rate in 2017 and 2018. However, concerns over slowing global growth grew more ominous. Fourth-quarter 2018 gross domestic product (GDP), reported in February 2019, grew at an annualized 2.2% rate, down from the levels of the prior two quarters. The Bank of England forecast the slowest growth since the financial crisis for 2019. China and the U.S. continued to wrangle over trade issues. By the end of the first quarter of 2019, more accommodative Fed sentiment and steady, if not spectacular, U.S. economic and business metrics encouraged domestic investors.
Early second-quarter 2019 enthusiasm among investors faded.
During April, sustained low inflation, solid employment data, and first-quarter U.S. GDP of an annualized rate of 3.2% supported favorable sentiment. During May, however, markets tumbled on mixed investment signals. In the U.S., partisan political wrangling ramped up in advance of the 2020 election. The U.K.’s Brexit disagreements caused Prime Minister Theresa May to resign. Boris Johnson succeeded her, only to add to uncertainty about Brexit’s resolution ahead of an October 2019 deadline. The European Commission downgraded the 2019 growth forecast to 1.2%. The U.S. increased tariffs on products
| 1 | The S&P 500 Index consists of 500 stocks chosen for market size, liquidity, and industry group representation. It is a market-value-weighted index with each stock’s weight in the index proportionate to its market value. You cannot invest directly in an index. |
| 2 | The Morgan Stanley Capital International (MSCI) All Country World Index (ACWI) ex USA Index (Net) is a free-float-adjusted market-capitalization-weighted index that is designed to measure the equity market performance of developed markets, excluding the United States. Source: MSCI. MSCI makes no express or implied warranties or representations and shall have no liability whatsoever with respect to any MSCI data contained herein. The MSCI data may not be further redistributed or used as a basis for other indices or any securities or financial products. This report is not approved, reviewed, or produced by MSCI. You cannot invest directly in an index. |
| 3 | The MSCI Emerging Markets (EM) Index (Net) is a free-float-adjusted market-capitalization-weighted index that is designed to measure equity market performance of emerging markets. You cannot invest directly in an index. |
| 4 | The Bloomberg Barclays U.S. Aggregate Bond Index is a broad-based benchmark that measures the investment-grade, U.S. dollar-denominated, fixed-rate taxable bond market, including Treasuries, government-related and corporate securities, mortgage-backed securities (agency fixed-rate and hybrid adjustable-rate mortgage pass-throughs), asset-backed securities, and commercial mortgage-backed securities. You cannot invest directly in an index. |
| 5 | The Bloomberg Barclays Global Aggregate ex-USD Index is an unmanaged index that provides a broad-based measure of the global investment-grade fixed-income markets excluding the U.S. dollar-denominated debt market. You cannot invest directly in an index. |
| 6 | The Bloomberg Barclays Municipal Bond Index is an unmanaged index composed of long-term tax-exempt bonds with a minimum credit rating of Baa. You cannot invest directly in an index. |
| 7 | The ICE BofA U.S. High Yield Index is a market-capitalization-weighted index of domestic and Yankee high-yield bonds. The index tracks the performance of high-yield securities traded in the U.S. bond market. You cannot invest directly in an index. Copyright 2020. ICE Data Indices, LLC. All rights reserved. |
2 | Retail Money Market Funds
Table of Contents
Letter to shareholders (unaudited)
from China, China responded, and then talks broke down. President Donald Trump threatened to turn his foreign policy tariff tool to Mexico over immigration issues.
Midway through the year, investors regrouped, sentiment turned positive, and U.S. equity markets advanced during June and July. The gains, primarily driven by geopolitical and monetary policy events, pushed equity markets to new highs. European Central Bank President Mario Draghi indicated the bank was ready to cut rates or buy more assets to prop up inflation if needed. President Trump backed off of tariff threats against Mexico and China. In the U.S., the Fed implemented a 0.25% federal funds rate cut in July.
Later in July, the U.S. reversed course and threatened to impose higher tariffs on China’s exports after talks failed. China responded with tariff threats of its own and devalued the renminbi, roiling global markets. Major U.S. stock market indices closed July with the worst weekly results of the year. Bond prices gained as Treasury yields fell to multiyear lows, and the yield curve inverted at multiple points along the 30-year arc.
In August, U.S.-China trade tensions continued with no signs of compromise. Evidence of a continued global economic slowdown mounted, and central banks in China, New Zealand, and Thailand cut interest rates. Industrial and manufacturing data declined in China, Canada, Japan, and Germany. Adding to global uncertainty, Italy’s prime minister resigned, many feared a crackdown in Hong Kong as protestors sustained their calls for reform, and Boris Johnson planned to suspend Parliament as Brexit’s deadline neared.
In the U.S., the Fed cut interest rates a second time in September. U.S. manufacturing data disappointed investors. The U.S. Congress announced it would pursue an impeachment investigation of President Trump. Meanwhile, the Brexit impasse showed no signs of resolution. Officials in China said that hitting the country’s economic growth goals for the year would be difficult considering the weight of tariffs and trade restrictions. Although the S&P 500 Index finished the third quarter with the best year-to-date returns in more than 20 years, concerns about future returns remained.
The fourth quarter started on a strong note, with U.S.-China trade tensions relaxing in October along with renewed optimism for a U.K. Brexit deal and positive macroeconomic data. The initial estimate of U.S. third-quarter GDP growth was a resilient 1.9% annualized rate, while the U.S. unemployment rate fell to a 50-year low of 3.5% in September. However, despite resilience among U.S. consumers, business confidence declined while manufacturing activity contracted. Concerned with a potential economic slowdown, the Fed lowered interest rates another quarter point in late October, its third rate cut in four months. This helped push the S&P 500 Index to a new all-time high, while emerging market equities rallied and global bonds declined overall, reflecting a broad pickup in risk appetite.
Equity markets continued to rally in November despite ongoing geopolitical risks. Hopes for a U.S.-China trade deal buoyed investor confidence. U.S. business sentiment improved slightly, and manufacturing and services activity picked up. Throughout the month, central bank actions were on hold. With that positive backdrop, developed market equities outpaced those in emerging markets, and U.S. stocks, as reflected by the S&P 500 Index, outperformed non-U.S. stocks overall. While consumer confidence and purchasing manager activity rose in the eurozone, China reported weakening manufacturing and consumer data. Bond yields rose marginally, leading to slightly negative returns for global government and investment-grade corporate bonds.
Financial markets ended 2019 on a broadly positive note, with the U.S. and China reaching an accord on a Phase One trade deal, with some details to be worked out. That, along with the landslide win by the pro-Brexit U.K. Conservative Party in a national election and ongoing central bank support, gave investors greater certainty and confidence. U.S. economic indicators were generally positive, with the exception of manufacturing activity and business confidence. However, consumer confidence was resilient, fed by a robust labor market, tame inflation, and lower interest rates, which boosted housing affordability and stimulated homebuyer activity. The impeachment of U.S. President Donald Trump, while
“Midway through the year, investors regrouped, sentiment turned positive, and U.S. equity markets advanced.”
“Financial markets ended 2019 on a broadly positive note, with the U.S. and China reaching an accord on a Phase One trade deal.”
Retail Money Market Funds | 3
Table of Contents
Letter to shareholders (unaudited)
historically noteworthy, had little impact on markets. Meanwhile, slowing Chinese economic activity, partly attributable to the trade war, led to further government stimulus at year-end through lower reserve ratios, allowing banks to lend more money.
The year-end rally continued in early January 2020. However, capital market volatility picked up in late January on concerns over the unknown impact of the coronavirus on the global economy and stock markets. With sentiment somewhat souring, perceived safe havens did well in January. The U.S. dollar and Japanese yen both rose and government bonds outperformed equities. While the S&P 500 Index held its ground, emerging market equities tumbled, including those in Asia, that are most exposed to viruses—physical or economic—originating in China.
Following the end of the reporting period, the coronavirus continued its global spread, resulting in disruptions to global markets, including through border closings, restrictions on travel and large gatherings, expedited and enhanced health screenings, quarantines, cancellations, business and school closings, disruptions to employment and supply chains, reduced productivity, and reduced customer and client activity in multiple markets and sectors. The risk of further spreading of the coronavirus has led to significant uncertainty and volatility in the financial markets. The full extent of the coronavirus’s impact on the global economy cannot necessarily be foreseen and the impacts may be short term or may last for an extended period of time.
Don’t let short-term uncertainty derail long-term investment goals.
Periods of investment uncertainty can present challenges, but experience has taught us that maintaining long-term investment goals can be an effective way to plan for the future. To help you create a sound strategy based on your personal goals and risk tolerance, Wells Fargo Funds offers more than 100 mutual funds spanning a wide range of asset classes and investment styles. Although diversification cannot guarantee an investment profit or prevent losses, we believe it can be an effective way to manage investment risk and potentially smooth out overall portfolio performance. We encourage investors to know their investments and to understand that appropriate levels of risk-taking may unlock opportunities.
Thank you for choosing to invest with Wells Fargo Funds. We appreciate your confidence in us and remain committed to helping you meet your financial needs.
Sincerely,

Andrew Owen
President
Wells Fargo Funds
|
For further information about your Fund, contact your investment professional, visit our website atwfam.com, or call us directly at1-800-222-8222. |
4 | Retail Money Market Funds
Table of Contents
This page is intentionally left blank.
Table of Contents
Performance highlights (unaudited)
Investment objective
The Fund seeks current income, while preserving capital and liquidity.
Manager
Wells Fargo Funds Management, LLC
Subadvisers
Wells Capital Management Incorporated
Wells Capital Management Singapore
Portfolio managers
Michael C. Bird, CFA®‡
Jeffrey L. Weaver, CFA®‡
Laurie White
Average annual total returns (%) as ofJanuary 31, 2020
| Including sales charge | Excluding sales charge | Expense ratios1 (%) | ||||||||||||||||||||||||||||||||
| Inception date | 1 year | 5 year | 10 year | 1 year | 5 year | 10 year | Gross | Net2 | ||||||||||||||||||||||||||
| Class A (STGXX) | 7-1-1992 | – | – | – | 1.76 | 0.81 | 0.41 | 0.72 | 0.60 | |||||||||||||||||||||||||
| Class C*3 | 6-30-2010 | 0.00 | 0.38 | 0.19 | 1.00 | 0.38 | 0.19 | 1.47 | 1.35 | |||||||||||||||||||||||||
| Premier Class (WMPXX)4 | 3-31-2016 | – | – | – | 2.20 | 1.13 | 0.57 | 0.33 | 0.20 | |||||||||||||||||||||||||
| Service Class (WMOXX)5 | 6-30-2010 | – | – | – | 1.86 | 0.90 | 0.45 | 0.62 | 0.50 | |||||||||||||||||||||||||
Yield summary (%) as of January 31, 20202
| Class A | Class C* | Premier Class | Service Class | |||||||||||
| 7-day current yield | 1.24 | 0.49 | 1.72 | 1.34 | ||||||||||
| 7-day compound yield | 1.25 | 0.50 | 1.73 | 1.35 | ||||||||||
| 30-day simple yield | 1.26 | 0.51 | 1.73 | 1.36 | ||||||||||
| 30-day compound yield | 1.27 | 0.51 | 1.74 | 1.37 | ||||||||||
| * | Class C shares are available only to shareholders making an exchange out of Class C shares of another mutual fund within the Wells Fargo family of funds. |
Figures quoted represent past performance, which is no guarantee of future results, and do not reflect taxes that shareholder may pay on an investment in a fund. Investment returns will fluctuate. The Fund’s yield figures more closely reflect the current earnings of the Fund than the total return figures. Current performance may be lower or higher than the performance data quoted, which assumes the reinvestment of dividends and capital gains. Current month-end performance is available on the Fund’s website, wfam.com.
Class A shares, Premier Class shares, and Service Class shares are sold without a front-end sales charge or contingent deferred sales charge. For Class C shares, the maximum contingent deferred sales charge is 1.00%. Performance including a contingent deferred sales charge assumes the sales charge for the corresponding time period.
For retail money market funds: You could lose money by investing in the Fund. Although the Fund seeks to preserve the value of your investment at $1.00 per share, it cannot guarantee it will do so. The Fund may impose a fee upon sale of your shares or may temporarily suspend your ability to sell shares if the Fund’s liquidity falls below required minimums because of market conditions or other factors. An investment in the Fund is not insured or guaranteed by the Federal Deposit Insurance Corporation or any other government agency. The Fund’s sponsor has no legal obligation to provide financial support to the Fund, and you should not expect that the sponsor will provide financial support to the Fund at any time.
Please see footnotes on page 7.
6 | Retail Money Market Funds
Table of Contents
Performance highlights (unaudited)
| Portfolio composition as of January 31, 20206 |
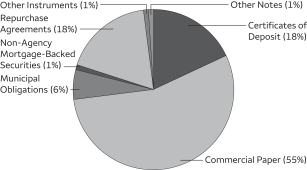 |
| Effective maturity distribution as of January 31, 20206 |
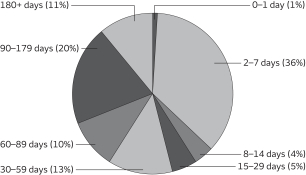 |
| Weighted average maturity as of January 31, 20207 |
32 days |
| Weighted average life as of January 31, 20208 |
71 days |
| ‡ | CFA® and Chartered Financial Analyst® are trademarks owned by CFA Institute. |
| 1 | Reflects the expense ratios as stated in the most recent prospectuses. The expense ratios shown are subject to change and may differ from the annualized expense ratios shown in the financial highlights of this report. |
| 2 | The manager has contractually committed through May 31, 2020, to waive fees and/or reimburse expenses to the extent necessary to cap total annual fund operating expenses after fee waivers at 0.60% for Class A, 1.35% for Class C, 0.20% for Premier Class, and 0.50% for Service Class. Brokerage commissions, stamp duty fees, interest, taxes, acquired fund fees and expenses (if any), and extraordinary expenses are excluded from the expense cap. Prior to or after the commitment expiration date, the cap may be increased or the commitment to maintain the cap may be terminated only with the approval of the Board of Trustees. Without this cap, the Fund’s returns would have been lower. Without waived fees and/or reimbursed expenses, the Fund’s 7-day current yield would have been 1.16%, 0.41%, 1.55%, and 1.26% for Class A, Class C, Premier Class, and Service Class, respectively. The expense ratio paid by an investor is the net expense ratio (the total annual fund operating expenses after fee waivers) as stated in the prospectuses. |
| 3 | Historical performance shown for the Class C shares prior to their inception reflects the performance of the former Class B shares. Class B and Class C shares had the same expenses. |
| 4 | Historical performance shown for the Premier Class shares prior to their inception reflects the performance of the Class A shares, and includes the higher expenses applicable to Class A shares. If these expenses had not been included, returns for Premier Class shares would be higher. |
| 5 | Historical performance shown for the Service Class shares prior to their inception reflects the performance of the former Investor Class shares, and includes the higher expenses applicable to the former Investor Class shares. If these expenses had not been included, returns for Service Class shares would be higher. |
| 6 | Amounts are calculated based on the total investments of the Fund. These amounts are subject to change and may have changed since the date specified. |
| 7 | Weighted Average Maturity (WAM): WAM is an average of the effective maturities of all securities held in the portfolio, weighted by each security’s percentage of total investments. The maturity of a portfolio security is the period remaining until the date on which the principal amount is unconditionally required to be paid, or in the case of a security called for redemption, the date on which the redemption payment is unconditionally required to be made. WAM calculations allow for the maturities of certain securities with demand features or periodic interest rate resets to be shortened. WAM is a way to measure a fund’s sensitivity to potential interest rate changes. WAM is subject to change and may have changed since the date specified. |
| 8 | Weighted Average Life (WAL): WAL is an average of the final maturities of all securities held in the portfolio, weighted by their percentage of total investments. The maturity of a portfolio security is the period remaining until the date on which the principal amount is unconditionally required to be paid, or in the case of a security called for redemption, the date on which the redemption payment is unconditionally required to be made. In contrast to WAM, the calculation of WAL allows for the maturities of certain securities with demand features to be shortened, but not the periodic interest rate resets. WAL is a way to measure a fund’s potential sensitivity to credit spread changes. WAL is subject to change and may have changed since the date specified. |
Retail Money Market Funds | 7
Table of Contents
Performance highlights (unaudited)
MANAGERS’ DISCUSSION
The money market sector is heavily influenced by the Federal Open Market Committee’s (FOMC’s) assessment of the economy, its target rates, and expectations of changes to those target rates. Consequently, we try to glean insight about rate moves by dissecting Federal Reserve (Fed) statements and Fed member speeches and by analyzing the Summary of Economic Projections (SEP).
Even as the economic landscape was showing signs of sputtering growth toward the end of 2018, the FOMC raised rates in December. The Fed led us into 2019 indicating that the December rate increase might be the last move in the tightening cycle that had begun two years earlier. But expectations were that the economy was still expanding, albeit at a less robust pace. It therefore seemed reasonable to assume that the move got us to where we needed to be, at a target rate level low enough to not extinguish growth and perhaps let inflation rise to the 2% target but high enough to trim the wings a little. “Patience” was the key word introduced to the lexicon. And after a pause to refresh, rates might continue back on their higher track.
The patient pause didn’t last long. By March, the SEP array exhibited a dovish bias with no participants expecting a hike and one anticipating a cut. In addition to the pause, other signs pointing to the possibility of a cut included the tightening of the London Interbank Offered Rate (LIBOR)/Overnight Interest Swap (OIS) rate from its relatively wide spread of 42.5 basis points (bps; 100 bps equal 1.00%) at the end of 2018 to a low of 14.5 bps in June. By May, more indicators confirmed that this was not a pause on the way to higher rates. In fact, it was looking like a pause before lower rates. While household spending and business fixed investment were slowing, personal consumption expenditures had ticked up and nonfarm payrolls came in strong. Overshadowing everything were trade tensions as negotiations with China, Mexico, Japan, and Europe broke down in various forms. With the central question of what would be the economic impacts of tariffs and trade wars unanswered, equities sold off and a flight to quality ensued. U.S. Treasury yields fell 34–36 bps, with 2-, 3-, and 5-year notes all yielding less than 2%. At that point, federal funds futures showed more than a 70% chance of a 25-bp cut at the September FOMC meeting.
At the June FOMC meeting, the Fed downgraded its growth assessment from solid to moderate and removed the word “patient” from its statement, focusing on increased uncertainties in the outlook. The SEP showed a downward shift in rates expectations and now seemed to be queuing up for an ease at the conclusion of the July FOMC meeting. Sentiment had seemingly turned on a dime. Consumers were still consuming, but trade tensions and the weak business sector had participants asking if a recession was looming.
Fast forward to period-end with a total of three consecutive easings—in July, September, and October—and maybe, just maybe, the FOMC executed the perfect landing. Fed Chair Powell set a high bar for further rate cuts after the October move, saying the cumulative easing to date would continue to provide support for the economy as monetary policy stimulus traditionally operates with a lag. That high bar was reiterated in December when it was made clear that the Fed expected to be on hold possibly through the election. No surprises came at the conclusion of the January 2020 meeting, with no change in the target rate range and the statement reflecting a willingness to act as appropriate to continue economic expansion and achieve inflation around 2%.
Strategic outlook
At the close of the reporting period, we were focused on a few unresolved items that could influence markets for the remainder of the calendar year, namely Brexit; trade issues and tariffs; the conclusion or continuation of temporary Fed liquidity operations, Fed Treasury bill purchases, and other quantitative easing measures; and finally, the election. With the Fed appearing to be on hold for now, credit fundamentals continue to be supportive and the yield curve is slightly positively sloped.
However, just as the fiscal year ended, in February and March 2020, the coronavirus began to spread globally, prompting consumers, businesses, and governments to take unusually strong actions in an attempt to limit its impact. In so doing, it appears that there could be a serious toll on the U.S. and global economy. In the face of this uncertainty, equity and bond markets experienced sharp outflows, and short term markets, especially government markets, experienced a high degree of inflows. With liquidity at a premium, volatility flowed through to the short end of the credit markets, prompting a series of supportive actions by the Fed. In the face of all this, we continue to believe that our investment strategy, with its focus on capital preservation and liquidity, is as important as ever.
Please see footnotes on page 7.
8 | Retail Money Market Funds
Table of Contents
As a shareholder of the Fund, you incur two types of costs: (1) transaction costs, including contingent deferred sales charges (if any) on redemptions and (2) ongoing costs, including management fees, distribution (12b-1) and/or shareholder servicing fees, and other Fund expenses. This example is intended to help you understand your ongoing costs (in dollars) of investing in the Fund and to compare these costs with the ongoing costs of investing in other mutual funds.
The example is based on an investment of $1,000 invested at the beginning of the six-month period and held for the entire period from August 1, 2019 to January 31, 2020.
Actual expenses
The “Actual” line of the table below provides information about actual account values and actual expenses. You may use the information in this line, together with the amount you invested, to estimate the expenses that you paid over the period. Simply divide your account value by $1,000 (for example, an $8,600 account value divided by $1,000 = 8.6), then multiply the result by the number in the “Actual” line under the heading entitled “Expenses paid during period” for your applicable class of shares to estimate the expenses you paid on your account during this period.
Hypothetical example for comparison purposes
The “Hypothetical” line of the table below provides information about hypothetical account values and hypothetical expenses based on the Fund’s actual expense ratio and an assumed rate of return of 5% per year before expenses, which is not the Fund’s actual return. The hypothetical account values and expenses may not be used to estimate the actual ending account balance or expenses you paid for the period. You may use this information to compare the ongoing costs of investing in the Fund and other funds. To do so, compare this 5% hypothetical example with the 5% hypothetical examples that appear in the shareholder reports of the other funds.
Please note that the expenses shown in the table are meant to highlight your ongoing costs only. Therefore, the “Hypothetical” line of the table is useful in comparing ongoing costs only and will not help you determine the relative total costs of owning different funds. In addition, if these transactional costs were included, your costs would have been higher.
Beginning 8-1-2019 | Ending account value 1-31-2020 | Expenses paid during the period1 | Annualized net expense ratio | |||||||||||||
Class A | ||||||||||||||||
Actual | $ | 1,000.00 | $ | 1,007.45 | $ | 3.03 | 0.60 | % | ||||||||
Hypothetical (5% return before expenses) | $ | 1,000.00 | $ | 1,022.12 | $ | 3.05 | 0.60 | % | ||||||||
Class C | ||||||||||||||||
Actual | $ | 1,000.00 | $ | 1,003.65 | $ | 6.80 | 1.35 | % | ||||||||
Hypothetical (5% return before expenses) | $ | 1,000.00 | $ | 1,018.35 | $ | 6.85 | 1.35 | % | ||||||||
Premier Class | ||||||||||||||||
Actual | $ | 1,000.00 | $ | 1,009.81 | $ | 0.66 | 0.13 | % | ||||||||
Hypothetical (5% return before expenses) | $ | 1,000.00 | $ | 1,024.48 | $ | 0.66 | 0.13 | % | ||||||||
Service Class | ||||||||||||||||
Actual | $ | 1,000.00 | $ | 1,007.95 | $ | 2.52 | 0.50 | % | ||||||||
Hypothetical (5% return before expenses) | $ | 1,000.00 | $ | 1,022.62 | $ | 2.54 | 0.50 | % | ||||||||
| 1 | Expenses paid is equal to the annualized net expense ratio of each class multiplied by the average account value over the period, multiplied by the number of days in the most recent fiscal half-year divided by the number of days in the fiscal year (to reflect the one-half-year period). |
Retail Money Market Funds | 9
Table of Contents
Portfolio of investments—January 31, 2020
| Interest rate | Maturity date | Principal | Value | |||||||||||||
| Certificates of Deposit: 17.67% |
| |||||||||||||||
Bank of Montreal (1 Month LIBOR +0.18%)± | 1.94 | % | 4-3-2020 | $ | 8,000,000 | $ | 8,000,000 | |||||||||
Bank of Montreal (3 Month LIBOR +0.06%)± | 1.95 | 3-12-2020 | 4,000,000 | 4,000,000 | ||||||||||||
Bank of Montreal (1 Month LIBOR +0.18%)± | 1.96 | 5-1-2020 | 2,000,000 | 2,000,000 | ||||||||||||
Bank of Montreal (3 Month LIBOR +0.14%)± | 2.04 | 11-18-2020 | 9,000,000 | 9,000,000 | ||||||||||||
Bank of Nova Scotia (1 Month LIBOR +0.16%) 144A± | 1.82 | 5-19-2020 | 10,000,000 | 9,998,046 | ||||||||||||
Bank of Nova Scotia (3 Month LIBOR +0.09%)± | 1.94 | 2-10-2021 | 10,000,000 | 10,000,000 | ||||||||||||
Bank of Nova Scotia (3 Month LIBOR +0.05%)± | 1.96 | 4-3-2020 | 7,000,000 | 7,000,000 | ||||||||||||
Bank of Nova Scotia | 2.00 | 3-3-2020 | 7,000,000 | 7,000,000 | ||||||||||||
Bank of Nova Scotia (3 Month LIBOR +0.10%)± | 2.00 | 8-4-2020 | 10,000,000 | 10,000,000 | ||||||||||||
Bank of Nova Scotia (3 Month LIBOR +0.13%) 144A± | 2.03 | 11-9-2020 | 4,000,000 | 4,000,000 | ||||||||||||
Canadian Imperial Bank (1 Month LIBOR +0.18%)± | 1.91 | 4-6-2020 | 5,000,000 | 5,000,000 | ||||||||||||
Canadian Imperial Bank (1 Month LIBOR +0.18%)± | 1.91 | 5-4-2020 | 5,000,000 | 5,000,000 | ||||||||||||
Canadian Imperial Bank (1 Month LIBOR +0.18%)± | 1.96 | 5-1-2020 | 4,000,000 | 4,000,000 | ||||||||||||
China Construction Bank Corporation NY (1 Month LIBOR +0.21%)± | 1.87 | 10-27-2020 | 25,000,000 | 25,000,000 | ||||||||||||
Cooperatieve Rabobank UA | 1.85 | 5-20-2020 | 6,000,000 | 6,000,000 | ||||||||||||
Credit Industriel et Commercial NY (1 Month LIBOR +0.22%)± | 1.88 | 4-24-2020 | 3,000,000 | 3,000,000 | ||||||||||||
Credit Suisse New York (3 Month LIBOR +0.24%)± | 2.15 | 12-4-2020 | 9,000,000 | 9,000,000 | ||||||||||||
DNB Bank ASA (3 Month LIBOR +0.22%)± | 2.12 | 2-10-2020 | 5,100,000 | 5,100,191 | ||||||||||||
Mitsubishi Trust & Bank Company (1 Month LIBOR +0.20%)± | 1.93 | 5-6-2020 | 40,000,000 | 40,000,964 | ||||||||||||
Mizuho Bank Limited | 1.58 | 2-3-2020 | 1,400,000 | 1,400,000 | ||||||||||||
Mizuho Bank Limited | 1.87 | 5-5-2020 | 11,000,000 | 11,001,375 | ||||||||||||
Mizuho Bank Limited (1 Month LIBOR +0.27%)± | 1.98 | 6-8-2020 | 15,000,000 | 15,000,000 | ||||||||||||
MUFG Bank Limited of New York (3 Month LIBOR +0.14%)± | 2.04 | 5-11-2020 | 2,000,000 | 2,000,000 | ||||||||||||
MUFG Bank Limited of New York (3 Month LIBOR +0.18%)± | 2.10 | 2-27-2020 | 4,000,000 | 4,000,000 | ||||||||||||
MUFG Bank Limited of New York | 2.80 | 2-25-2020 | 14,000,000 | 14,006,441 | ||||||||||||
National Bank of Canada (3 Month LIBOR +0.07%) 144A± | 1.98 | 5-1-2020 | 13,000,000 | 13,000,291 | ||||||||||||
Natixis NY (3 Month LIBOR +0.20%)± | 2.10 | 11-13-2020 | 10,000,000 | 10,000,000 | ||||||||||||
Nordea Bank AB (1 Month LIBOR +0.25%)± | 1.93 | 5-11-2020 | 13,000,000 | 12,999,695 | ||||||||||||
Nordea Bank AB (3 Month LIBOR +0.15%)± | 2.00 | 10-13-2020 | 13,000,000 | 13,000,000 | ||||||||||||
Norinchukin Bank | 1.78 | 7-15-2020 | 20,000,000 | 20,000,000 | ||||||||||||
Norinchukin Bank | 1.90 | 3-5-2020 | 8,000,000 | 8,000,000 | ||||||||||||
Norinchukin Bank | 1.95 | 4-21-2020 | 8,000,000 | 8,000,000 | ||||||||||||
Norinchukin Bank | 2.02 | 2-21-2020 | 14,000,000 | 13,999,991 | ||||||||||||
Norinchukin Bank | 2.03 | 2-28-2020 | 5,000,000 | 5,000,084 | ||||||||||||
Norinchukin Bank | 2.20 | 2-4-2020 | 5,000,000 | 5,000,000 | ||||||||||||
Oversea-Chinese Banking (1 Month LIBOR +0.15%)± | 1.88 | 2-6-2020 | 2,000,000 | 1,999,999 | ||||||||||||
Oversea-Chinese Banking | 1.90 | 3-11-2020 | 15,000,000 | 15,000,000 | ||||||||||||
Royal Bank of Canada (3 Month LIBOR +0.30%)± | 2.10 | 7-22-2020 | 14,000,000 | 14,014,430 | ||||||||||||
Skandinaviska Enskilda Bank AB (3 Month LIBOR +0.15%)± | 2.06 | 10-2-2020 | 8,000,000 | 8,000,000 | ||||||||||||
Skandinaviska Enskilda Bank AB (3 Month LIBOR +0.27%)± | 2.09 | 10-20-2020 | 4,000,000 | 4,003,087 | ||||||||||||
Sumitomo Mitsui Banking Corporation 144A(z) | 1.72 | 4-1-2020 | 7,000,000 | 6,980,715 | ||||||||||||
Sumitomo Mitsui Banking Corporation (1 Month LIBOR +0.12%)± | 1.78 | 7-28-2020 | 15,000,000 | 15,000,000 | ||||||||||||
Sumitomo Mitsui Banking Corporation (1 Month LIBOR +0.20%)± | 1.91 | 7-7-2020 | 15,000,000 | 15,000,000 | ||||||||||||
Sumitomo Mitsui Banking Corporation (1 Month LIBOR +0.27%)± | 1.93 | 4-24-2020 | 10,000,000 | 10,000,000 | ||||||||||||
Sumitomo Mitsui Banking Corporation (1 Month LIBOR +0.27%)± | 2.05 | 5-1-2020 | 7,000,000 | 7,000,000 | ||||||||||||
Sumitomo Mitsui Trust NY (1 Month LIBOR +0.26%)± | 1.94 | 4-14-2020 | 13,000,000 | 13,000,000 | ||||||||||||
Svenska Handelsbanken (1 Month LIBOR +0.22%)± | 1.87 | 7-22-2020 | 17,000,000 | 16,997,344 | ||||||||||||
Svenska Handelsbanken (3 Month LIBOR +0.16%)± | 2.00 | 10-16-2020 | 5,000,000 | 5,000,000 | ||||||||||||
Svenska Handelsbanken (3 Month LIBOR +0.15%)± | 1.98 | 10-15-2020 | 11,000,000 | 11,000,000 | ||||||||||||
Total Certificates of Deposit (Cost $472,502,653) |
| 472,502,653 | ||||||||||||||
|
| |||||||||||||||
Commercial Paper: 54.95% |
| |||||||||||||||
| Asset-Backed Commercial Paper: 28.34% | ||||||||||||||||
Albion Capital Corporation (z) | 1.70 | 2-4-2020 | 5,000,000 | 4,999,764 | ||||||||||||
Anglesea Funding LLC (1 Month LIBOR +0.15%) 144A± | 1.80 | 7-29-2020 | 15,000,000 | 15,000,000 | ||||||||||||
The accompanying notes are an integral part of these financial statements.
10 | Retail Money Market Funds
Table of Contents
Portfolio of investments—January 31, 2020
| Interest rate | Maturity date | Principal | Value | |||||||||||||
| Asset-Backed Commercial Paper (continued) | ||||||||||||||||
Anglesea Funding LLC (1 Month LIBOR +0.15%) 144A± | 1.80 | % | 7-27-2020 | $ | 8,000,000 | $ | 8,000,000 | |||||||||
Anglesea Funding LLC (1 Month LIBOR +0.23%) 144A± | 1.89 | 5-20-2020 | 12,000,000 | 12,000,000 | ||||||||||||
Anglesea Funding LLC (3 Month LIBOR +0.12%) 144A± | 2.02 | 5-15-2020 | 15,000,000 | 15,000,000 | ||||||||||||
Antalis US Funding Corporation 144A(z) | 1.83 | 4-3-2020 | 15,000,000 | 14,954,500 | ||||||||||||
Atlantic Asset Securitization Corporation 144A(z) | 1.79 | 4-7-2020 | 15,000,000 | 14,952,533 | ||||||||||||
Atlantic Asset Securitization Corporation 144A(z) | 1.79 | 6-15-2020 | 12,000,000 | 11,921,087 | ||||||||||||
Atlantic Asset Securitization Corporation 144A(z) | 1.91 | 4-8-2020 | 4,950,000 | 4,933,019 | ||||||||||||
Atlantic Asset Security LLC (z) | 2.02 | 2-14-2020 | 8,000,000 | 7,995,087 | ||||||||||||
Barton Capital Corporation 144A(z) | 1.83 | 4-8-2020 | 8,000,000 | 7,973,711 | ||||||||||||
Barton Capital Corporation 144A(z) | 2.10 | 2-24-2020 | 4,000,000 | 3,995,147 | ||||||||||||
Bedford Row Funding Corporation (1 Month LIBOR +0.24%) 144A± | 1.89 | 7-20-2020 | 5,000,000 | 5,000,000 | ||||||||||||
Bedford Row Funding Corporation (1 Month LIBOR +0.15%) 144A± | 1.91 | 2-3-2020 | 2,000,000 | 2,000,000 | ||||||||||||
Bedford Row Funding Corporation (3 Month LIBOR +0.09%) 144A± | 2.00 | 10-7-2020 | 10,000,000 | 10,000,000 | ||||||||||||
Bedford Row Funding Corporation (3 Month LIBOR +0.13%) 144A± | 2.03 | 11-24-2020 | 5,000,000 | 5,000,000 | ||||||||||||
Cedar Spring Capital Corporation 144A(z) | 1.69 | 2-6-2020 | 8,000,000 | 7,998,873 | ||||||||||||
Cedar Spring Capital Corporation 144A(z) | 1.96 | 4-1-2020 | 5,000,000 | 4,984,292 | ||||||||||||
Cedar Spring Capital Corporation 144A(z) | 2.01 | 3-18-2020 | 10,000,000 | 9,975,556 | ||||||||||||
Chariot Funding LLC 144A(z) | 1.65 | 2-10-2020 | 5,000,000 | 4,998,396 | ||||||||||||
Chesham Finance Limited 144A(z) | 1.64 | 2-3-2020 | 25,000,000 | 25,000,000 | ||||||||||||
Chesham Finance Limited 144A(z) | 1.64 | 2-3-2020 | 5,000,000 | 5,000,000 | ||||||||||||
Chesham Finance Limited 144A(z) | 1.64 | 2-3-2020 | 8,000,000 | 8,000,000 | ||||||||||||
Collateralized Commercial Paper Flex Company LLC (1 Month LIBOR +0.20%) 144A± | 1.86 | 6-23-2020 | 5,000,000 | 5,000,000 | ||||||||||||
Collateralized Commercial Paper Flex Company LLC (3 Month LIBOR +0.12%) 144A± | 1.99 | 1-6-2021 | 15,000,000 | 15,000,000 | ||||||||||||
Collateralized Commercial Paper II Company LLC (3 Month LIBOR +0.06%) 144A± | 1.96 | 2-10-2020 | 2,638,000 | 2,637,977 | ||||||||||||
Collateralized Commercial Paper V Company LLC (3 Month LIBOR +0.05%) ± | 1.83 | 10-27-2020 | 15,000,000 | 15,000,000 | ||||||||||||
Collateralized Commercial Paper V Company LLC (3 Month LIBOR +0.10%)± | 2.01 | 9-28-2020 | 5,000,000 | 5,000,000 | ||||||||||||
Columbia Funding Company 144A(z) | 1.83 | 4-8-2020 | 14,000,000 | 13,953,996 | ||||||||||||
Columbia Funding Company 144A(z) | 2.02 | 5-15-2020 | 7,000,000 | 6,960,333 | ||||||||||||
Columbia Funding Company 144A(z) | 2.02 | 6-2-2020 | 6,054,000 | 6,013,640 | ||||||||||||
Columbia Funding Company 144A(z) | 2.02 | 6-3-2020 | 12,000,000 | 11,919,333 | ||||||||||||
Columbia Funding Company 144A(z) | 2.02 | 6-9-2020 | 7,000,000 | 6,950,611 | ||||||||||||
Concord Minutemen Capital Company 144A(z) | 1.62 | 2-4-2020 | 17,000,000 | 16,999,235 | ||||||||||||
Concord Minutemen Capital Company 144A(z) | 1.89 | 7-10-2020 | 10,000,000 | 9,917,928 | ||||||||||||
Concord Minutemen Capital Company 144A(z) | 1.93 | 5-15-2020 | 12,500,000 | 12,432,283 | ||||||||||||
Concord Minutemen Capital Company 144A(z) | 1.93 | 3-6-2020 | 3,000,000 | 2,994,880 | ||||||||||||
Concord Minutemen Capital Company 144A(z) | 1.96 | 4-1-2020 | 4,000,000 | 3,987,433 | ||||||||||||
Concord Minutemen Capital Company 144A(z) | 2.01 | 3-18-2020 | 10,000,000 | 9,975,556 | ||||||||||||
Crown Point Capital Company (1 Month LIBOR +0.30%) 144A± | 1.99 | 6-8-2020 | 17,000,000 | 17,000,000 | ||||||||||||
Glencove Funding LLC (3 Month LIBOR +0.12%) 144A± | 2.02 | 5-20-2020 | 16,000,000 | 16,000,000 | ||||||||||||
Gotham Funding Corporation 144A(z) | 1.63 | 2-10-2020 | 12,000,000 | 11,996,197 | ||||||||||||
Gotham Funding Corporation 144A(z) | 1.81 | 3-2-2020 | 5,000,000 | 4,993,000 | ||||||||||||
Great Bridge Capital Company LLC 144A(z) | 1.79 | 5-26-2020 | 3,000,000 | 2,983,238 | ||||||||||||
Great Bridge Capital Company LLC 144A(z) | 1.83 | 5-20-2020 | 19,000,000 | 18,897,221 | ||||||||||||
Institutional Secured Funding LLC 144A(z) | 1.70 | 2-3-2020 | 15,000,000 | 15,000,000 | ||||||||||||
Institutional Secured Funding LLC 144A(z) | 1.73 | 2-7-2020 | 40,000,000 | 39,992,311 | ||||||||||||
Kells Funding LLC 144A(z) | 1.87 | 2-21-2020 | 5,000,000 | 4,995,350 | ||||||||||||
Kells Funding LLC 144A(z) | 1.88 | 4-15-2020 | 6,000,000 | 5,977,560 | ||||||||||||
Kells Funding LLC 144A(z) | 1.88 | 4-16-2020 | 8,000,000 | 7,969,664 | ||||||||||||
Kells Funding LLC 144A(z) | 2.02 | 3-13-2020 | 8,000,000 | 7,982,667 | ||||||||||||
Kells Funding LLC 144A(z) | 2.03 | 3-18-2020 | 8,000,000 | 7,980,347 | ||||||||||||
Kells Funding LLC 144A(z) | 2.07 | 3-24-2020 | 8,000,000 | 7,977,222 | ||||||||||||
Legacy Capital Company 144A(z) | 1.81 | 3-18-2020 | 5,899,000 | 5,886,022 | ||||||||||||
Legacy Capital Company 144A(z) | 1.81 | 5-20-2020 | 3,595,000 | 3,575,767 | ||||||||||||
Legacy Capital Company 144A(z) | 2.11 | 3-16-2020 | 16,000,000 | 15,960,800 | ||||||||||||
Lexington Parker Capital Company LLC 144A(z) | 1.60 | 2-5-2020 | 10,000,000 | 9,999,111 | ||||||||||||
Lexington Parker Capital Company LLC 144A(z) | 1.63 | 2-6-2020 | 15,000,000 | 14,997,963 | ||||||||||||
The accompanying notes are an integral part of these financial statements.
Retail Money Market Funds | 11
Table of Contents
Portfolio of investments—January 31, 2020
| Interest rate | Maturity date | Principal | Value | |||||||||||||
| Asset-Backed Commercial Paper (continued) | ||||||||||||||||
Liberty Funding LLC 144A(z) | 2.12 | % | 3-18-2020 | $ | 2,000,000 | $ | 1,994,867 | |||||||||
LMA Americas LLC 144A(z) | 1.82 | 7-6-2020 | 4,000,000 | 3,969,200 | ||||||||||||
LMA Americas LLC 144A(z) | 1.92 | 5-6-2020 | 9,800,000 | 9,751,898 | ||||||||||||
LMA Americas LLC 144A(z) | 2.00 | 2-25-2020 | 12,000,000 | 11,985,407 | ||||||||||||
LMA Americas LLC 144A(z) | 2.01 | 2-10-2020 | 5,000,000 | 4,998,056 | ||||||||||||
LMA Americas LLC 144A(z) | 2.06 | 2-5-2020 | 5,000,000 | 4,999,433 | ||||||||||||
LMA Americas LLC 144A(z) | 2.13 | 2-20-2020 | 6,800,000 | 6,793,225 | ||||||||||||
Manhattan Asset Funding Company LLC 144A(z) | 1.68 | 2-18-2020 | 4,500,000 | 4,496,850 | ||||||||||||
Manhattan Asset Funding Company LLC 144A(z) | 1.90 | 2-7-2020 | 5,000,000 | 4,998,950 | ||||||||||||
Matchpoint Finance plc 144A(z) | 1.65 | 2-10-2020 | 7,000,000 | 6,997,754 | ||||||||||||
Matchpoint Finance plc 144A(z) | 1.95 | 2-24-2020 | 10,000,000 | 9,988,683 | ||||||||||||
Matchpoint Finance plc (1 Month LIBOR +0.29%) 144A± | 1.99 | 4-9-2020 | 8,000,000 | 8,000,000 | ||||||||||||
Mountcliff Funding LLC 144A(z) | 1.68 | 2-3-2020 | 15,000,000 | 15,000,000 | ||||||||||||
Mountcliff Funding LLC (1 Month LIBOR +0.20%) 144A± | 1.85 | 4-24-2020 | 10,000,000 | 10,000,000 | ||||||||||||
Mountcliff Funding LLC 144A(z) | 2.01 | 2-4-2020 | 3,835,000 | 3,834,787 | ||||||||||||
Nieuw Amsterdam Receivables Corporation 144A(z) | 1.78 | 3-4-2020 | 19,000,000 | 18,971,975 | ||||||||||||
Old Line Funding LLC (1 Month LIBOR +0.14%) 144A± | 1.80 | 10-22-2020 | 5,000,000 | 5,000,000 | ||||||||||||
Regency Markets No.1 LLC 144A(z) | 1.65 | 2-14-2020 | 4,461,000 | 4,458,751 | ||||||||||||
Ridgefield Funding Company (1 Month LIBOR +0.30%) 144A± | 1.95 | 4-22-2020 | 10,000,000 | 10,000,000 | ||||||||||||
Thunder Bay Funding LLC 144A(z) | 2.01 | 3-17-2020 | 11,000,000 | 10,973,722 | ||||||||||||
Versailles CDS LLC 144A(z) | 2.06 | 2-14-2020 | 7,000,000 | 6,995,615 | ||||||||||||
Victory Receivables 144A(z) | 1.81 | 3-11-2020 | 19,000,000 | 18,964,850 | ||||||||||||
| 757,763,633 | ||||||||||||||||
|
| |||||||||||||||
| Financial Company Commercial Paper: 14.94% | ||||||||||||||||
Australia & New Zealand Banking Group Limited 144A(z) | 1.88 | 5-21-2020 | 5,000,000 | 4,972,100 | ||||||||||||
Australia & New Zealand Banking Group Limited (3 Month LIBOR +0.11%) 144A± | 2.03 | 11-27-2020 | 5,000,000 | 5,000,000 | ||||||||||||
Barton Capital SA 144A(z) | 2.01 | 2-4-2020 | 7,000,000 | 6,999,611 | ||||||||||||
BNG Bank NV (1 Month LIBOR +0.17%) 144A± | 1.82 | 3-31-2020 | 5,000,000 | 5,000,002 | ||||||||||||
Commonwealth Bank of Australia (1 Month LIBOR +0.16%) 144A± | 1.89 | 6-5-2020 | 5,400,000 | 5,398,051 | ||||||||||||
Commonwealth Bank of Australia (1 Month LIBOR +0.17%) 144A± | 1.95 | 4-2-2020 | 5,000,000 | 5,000,000 | ||||||||||||
Commonwealth Bank of Australia (3 Month LIBOR +0.12%) 144A± | 2.03 | 11-9-2020 | 10,000,000 | 10,000,000 | ||||||||||||
Commonwealth Bank of Australia (3 Month LIBOR +0.15%) 144A± | 2.08 | 9-24-2020 | 8,000,000 | 8,000,000 | ||||||||||||
Commonwealth Bank of Australia (3 Month LIBOR +0.45%) 144A± | 2.34 | 3-10-2020 | 2,000,000 | 2,000,797 | ||||||||||||
DBS Bank Limited 144A(z) | 1.86 | 5-22-2020 | 2,000,000 | 1,988,858 | ||||||||||||
DBS Bank Limited 144A(z) | 1.86 | 4-14-2020 | 10,000,000 | 9,963,514 | ||||||||||||
DBS Bank Limited 144A(z) | 1.87 | 6-9-2020 | 17,000,000 | 16,889,051 | ||||||||||||
DBS Bank Limited 144A(z) | 1.90 | 6-26-2020 | 15,000,000 | 14,887,200 | ||||||||||||
DBS Bank Limited (3 Month LIBOR +0.06%) 144A± | 1.95 | 6-11-2020 | 8,000,000 | 7,999,003 | ||||||||||||
DBS Bank Limited 144A(z) | 2.01 | 4-8-2020 | 10,000,000 | 9,963,889 | ||||||||||||
DBS Bank Limited 144A(z) | 2.27 | 2-28-2020 | 3,000,000 | 2,995,333 | ||||||||||||
Dexia Credit Local SA (z) | 1.87 | 4-15-2020 | 19,000,000 | 18,929,260 | ||||||||||||
Dexia Credit Local SA 144A(z) | 1.88 | 3-23-2020 | 12,000,000 | 12,000,000 | ||||||||||||
Dexia Credit Local SA (z) | 1.91 | 4-14-2020 | 5,000,000 | 4,981,264 | ||||||||||||
Dexia Credit Local SA (z) | 1.91 | 5-11-2020 | 10,000,000 | 9,948,550 | ||||||||||||
Dexia Credit Local SA (z) | 2.06 | 2-25-2020 | 10,000,000 | 9,987,472 | ||||||||||||
Export Development Canada (z) | 1.87 | 3-10-2020 | 5,150,000 | 5,140,421 | ||||||||||||
Federation des Caisses (3 Month LIBOR +0.10%) 144A± | 1.99 | 9-9-2020 | 17,000,000 | 17,000,000 | ||||||||||||
ING US Funding LLC (1 Month LIBOR +0.20%) 144A± | 1.86 | 5-19-2020 | 4,000,000 | 4,000,000 | ||||||||||||
ING US Funding LLC (3 Month LIBOR +0.19%) 144A± | 2.10 | 10-1-2020 | 8,000,000 | 8,000,000 | ||||||||||||
Intercontinental Exchange Incorporated 144A(z) | 1.68 | 2-4-2020 | 5,225,000 | 5,224,756 | ||||||||||||
MUFG Bank Limited of New York (z) | 2.00 | 2-28-2020 | 4,150,000 | 4,144,265 | ||||||||||||
MUFG Bank Limited of New York (z) | 2.28 | 3-6-2020 | 2,975,000 | 2,969,076 | ||||||||||||
National Australia Bank Limited (1 Month LIBOR +0.13%) 144A± | 1.82 | 2-7-2020 | 4,000,000 | 4,000,000 | ||||||||||||
National Australia Bank Limited (1 Month LIBOR +0.16%) 144A± | 1.82 | 5-19-2020 | 2,000,000 | 2,000,000 | ||||||||||||
National Australia Bank Limited (1 Month LIBOR +0.26%) 144A± | 1.92 | 6-19-2020 | 7,000,000 | 7,000,000 | ||||||||||||
National Australia Bank Limited (3 Month LIBOR +0.12%) 144A± | 2.01 | 12-11-2020 | 9,000,000 | 9,000,000 | ||||||||||||
Oesterreichische Kontrollbank AG (z) | 1.87 | 4-9-2020 | 10,000,000 | 9,966,083 | ||||||||||||
Ontario Teachers Finance Trust 144A(z) | 1.81 | 7-20-2020 | 12,000,000 | 11,899,760 | ||||||||||||
The accompanying notes are an integral part of these financial statements.
12 | Retail Money Market Funds
Table of Contents
Portfolio of investments—January 31, 2020
| Interest rate | Maturity date | Principal | Value | |||||||||||||
| Financial Company Commercial Paper (continued) | ||||||||||||||||
Ontario Teachers Finance Trust 144A(z) | 1.87 | % | 6-5-2020 | $ | 9,350,000 | $ | 9,290,900 | |||||||||
Ontario Teachers Finance Trust 144A(z) | 2.10 | 3-12-2020 | 7,000,000 | 6,984,705 | ||||||||||||
Ontario Teachers Finance Trust 144A(z) | 2.20 | 3-6-2020 | 3,000,000 | 2,994,213 | ||||||||||||
Oversea-Chinese Banking Corporation Limited (3 Month LIBOR +0.04%) 144A± | 1.94 | 2-18-2020 | 3,000,000 | 3,000,000 | ||||||||||||
Oversea-Chinese Banking Corporation Limited 144A(z) | 1.86 | 4-21-2020 | 5,000,000 | 4,979,958 | ||||||||||||
Oversea-Chinese Banking Corporation Limited (1 Month LIBOR +0.20%) 144A± | 1.90 | 4-9-2020 | 9,000,000 | 9,000,000 | ||||||||||||
Oversea-Chinese Banking Corporation Limited (1 Month LIBOR +0.24%) 144A± | 1.97 | 6-5-2020 | 10,000,000 | 10,000,000 | ||||||||||||
Oversea-Chinese Banking Corporation Limited (3 Month LIBOR +0.10%) 144A± | 2.01 | 8-14-2020 | 5,000,000 | 4,999,777 | ||||||||||||
Oversea-Chinese Banking Corporation Limited (3 Month LIBOR +0.14%) 144A± | 2.04 | 11-4-2020 | 7,000,000 | 7,000,000 | ||||||||||||
Ridgefield Funding Company LLC (1 Month LIBOR +0.30%) 144A± | 1.96 | 3-27-2020 | 10,000,000 | 10,001,205 | ||||||||||||
Starbird Funding Corporation 144A(z) | 2.02 | 4-6-2020 | 8,000,000 | 7,972,000 | ||||||||||||
Sumitomo Mitsui Trust Bank 144A(z) | 1.95 | 2-28-2020 | 12,000,000 | 11,983,833 | ||||||||||||
Sumitomo Mitsui Trust Bank Limited New York 144A(z) | 1.92 | 5-12-2020 | 10,000,000 | 9,947,750 | ||||||||||||
Toronto Dominion Bank (3 Month LIBOR +0.12%)± | 1.97 | 10-13-2020 | 10,000,000 | 10,000,000 | ||||||||||||
Toronto Dominion Bank (3 Month LIBOR +0.14%) 144A± | 2.05 | 11-13-2020 | 10,000,000 | 10,000,000 | ||||||||||||
Toronto Dominion Bank (3 Month LIBOR +0.19%) 144A± | 2.14 | 9-28-2020 | 6,000,000 | 6,000,000 | ||||||||||||
Toronto Dominion Bank (3 Month LIBOR +0.28%)± | 2.17 | 6-11-2020 | 7,000,000 | 7,005,491 | ||||||||||||
United Overseas Bank Limited 144A(z) | 1.85 | 2-4-2020 | 5,000,000 | 4,999,744 | ||||||||||||
| 399,407,892 | ||||||||||||||||
|
| |||||||||||||||
| Other Commercial Paper: 11.67% | ||||||||||||||||
BNG Bank NV 144A(z) | 1.56 | 2-3-2020 | 12,000,000 | 12,000,000 | ||||||||||||
BNG Bank NV (1 Month LIBOR +0.20%) 144A± | 1.86 | 5-26-2020 | 5,000,000 | 5,000,000 | ||||||||||||
BNG Bank NV 144A(z) | 1.92 | 5-18-2020 | 12,000,000 | 11,933,616 | ||||||||||||
BNG Bank NV (z) | 2.02 | 4-15-2020 | 8,000,000 | 7,968,000 | ||||||||||||
Caisse des Depots 144A(z) | 1.57 | 2-3-2020 | 25,000,000 | 25,000,000 | ||||||||||||
Caisse des Depots 144A(z) | 1.70 | 4-22-2020 | 5,000,000 | 4,981,457 | ||||||||||||
Caisse des Depots 144A(z) | 2.02 | 3-16-2020 | 17,000,000 | 16,960,334 | ||||||||||||
China International Marine Containers (z) | 2.05 | 2-4-2020 | 15,000,000 | 14,999,146 | ||||||||||||
Erste Abwicklungsanstalt 144A(z) | 1.60 | 2-5-2020 | 12,000,000 | 11,998,933 | ||||||||||||
Erste Bank der oesterreichischen Sparkassen AG (1 Month LIBOR +0.22%) 144A± | 1.88 | 3-27-2020 | 8,000,000 | 8,000,000 | ||||||||||||
European Investment Bank (z) | 1.57 | 2-4-2020 | 25,000,000 | 24,998,910 | ||||||||||||
Komatsu Finance America Incorporated 144A(z) | 1.69 | 2-13-2020 | 15,000,000 | 14,992,958 | ||||||||||||
Mercy Health (z) | 1.70 | 2-12-2020 | 5,000,000 | 4,997,875 | ||||||||||||
Nederlandse Waterschapsbank NV 144A(z) | 1.87 | 4-14-2020 | 10,000,000 | 9,963,317 | ||||||||||||
Nederlandse Waterschapsbank NV 144A(z) | 2.02 | 2-10-2020 | 3,000,000 | 2,998,833 | ||||||||||||
Nederlandse Waterschapsbank NV 144A(z) | 2.05 | 3-2-2020 | 15,000,000 | 14,976,355 | ||||||||||||
NRW Bank 144A(z) | 2.02 | 2-24-2020 | 15,000,000 | 14,982,500 | ||||||||||||
NRW Bank 144A(z) | 2.02 | 3-4-2020 | 15,000,000 | 14,975,000 | ||||||||||||
Province of Alberta 144A(z) | 2.02 | 2-6-2020 | 10,000,000 | 9,998,333 | ||||||||||||
Province of British Columbia (z) | 1.82 | 3-3-2020 | 21,500,000 | 21,468,652 | ||||||||||||
Toyota Credit Canada Incorporated (3 Month LIBOR +0.13%)± | 2.03 | 7-31-2020 | 6,000,000 | 6,000,000 | ||||||||||||
Toyota Finance Australia Limited (1 Month LIBOR +0.27%)± | 1.95 | 6-5-2020 | 8,000,000 | 8,000,000 | ||||||||||||
Toyota Finance Australia Limited (3 Month LIBOR +0.10%)± | 1.98 | 10-5-2020 | 15,000,000 | 15,000,000 | ||||||||||||
Toyota Motor Credit Corporation (3 Month LIBOR +0.08%)± | 1.87 | 10-23-2020 | 15,000,000 | 15,000,000 | ||||||||||||
Toyota Motor Credit Corporation (1 Month LIBOR +0.23%)± | 1.88 | 5-26-2020 | 7,000,000 | 7,000,000 | ||||||||||||
Toyota Motor Credit Corporation (1 Month LIBOR +0.16%)± | 1.89 | 2-27-2020 | 4,000,000 | 4,000,000 | ||||||||||||
Toyota Motor Credit Corporation (3 Month LIBOR +0.07%)± | 1.97 | 5-22-2020 | 4,000,000 | 4,000,000 | ||||||||||||
| 312,194,219 | ||||||||||||||||
|
| |||||||||||||||
Total Commercial Paper (Cost $1,469,365,744) |
| 1,469,365,744 | ||||||||||||||
|
| |||||||||||||||
The accompanying notes are an integral part of these financial statements.
Retail Money Market Funds | 13
Table of Contents
Portfolio of investments—January 31, 2020
| Interest rate | Maturity date | Principal | Value | |||||||||||||
Municipal Obligations: 6.31% |
| |||||||||||||||
California: 0.42% |
| |||||||||||||||
| Other Municipal Debt: 0.42% | ||||||||||||||||
Public Utilities Commission of the City & County of San Francisco (Utilities Revenue) | 2.05 | % | 2-13-2020 | $ | 11,345,000 | $ | 11,345,000 | |||||||||
|
| |||||||||||||||
Colorado: 1.16% |
| |||||||||||||||
| Variable Rate Demand Notes ø: 1.16% | ||||||||||||||||
Colorado HFA MFHR Class II Series B (Housing Revenue, FHLB SPA) | 1.72 | 5-1-2052 | 3,875,000 | 3,875,000 | ||||||||||||
Colorado Housing & Finance Authority SeriesI-2 (Housing Revenue, FHLB SPA) | 1.62 | 5-1-2048 | 17,000,000 | 17,000,000 | ||||||||||||
Colorado Southern Ute Indian Tribe Reservation Series 2007 (Miscellaneous Revenue) 144A | 1.60 | 1-1-2027 | 10,000,000 | 10,000,000 | ||||||||||||
| 30,875,000 | ||||||||||||||||
|
| |||||||||||||||
Georgia: 0.34% |
| |||||||||||||||
| Other Municipal Debt: 0.15% | ||||||||||||||||
Municipal Electric Authority of Georgia (Utilities Revenue) | 2.05 | 3-17-2020 | 4,000,000 | 4,000,000 | ||||||||||||
|
| |||||||||||||||
| Variable Rate Demand Note ø: 0.19% | ||||||||||||||||
Macon-Bibb County GA Industrial Authority Kumho Tire Georgia Incorporated Series A (Industrial Development Revenue, Korea Development Bank LOC) | 1.80 | 12-1-2022 | 5,000,000 | 5,000,000 | ||||||||||||
|
| |||||||||||||||
Kentucky: 0.52% |
| |||||||||||||||
| Variable Rate Demand Notes ø: 0.52% | ||||||||||||||||
Kentucky Housing Corporation Series O (Housing Revenue, Kentucky Housing Corporation SPA) | 1.60 | 1-1-2036 | 3,860,000 | 3,860,000 | ||||||||||||
Kentucky Municipal Power Agency Series B002 (Utilities Revenue, AGM Insured, Morgan Stanley Bank LIQ) 144A | 1.75 | 9-1-2037 | 10,000,000 | 10,000,000 | ||||||||||||
| 13,860,000 | ||||||||||||||||
|
| |||||||||||||||
Louisiana: 0.30% |
| |||||||||||||||
| Variable Rate Demand Note ø: 0.30% | ||||||||||||||||
East Baton Rouge Parish LA Sewerage Commission Revenue Series 2016-XFT904 (Water & Sewer Revenue, Morgan Stanley Bank LIQ) 144A | 1.75 | 2-1-2045 | 8,000,000 | 8,000,000 | ||||||||||||
|
| |||||||||||||||
Michigan: 0.90% |
| |||||||||||||||
| Variable Rate Demand Note ø: 0.90% | ||||||||||||||||
Michigan Finance Authority Series C (Miscellaneous Revenue, Bank of America NA LOC) | 1.63 | 9-1-2049 | 24,000,000 | 24,000,000 | ||||||||||||
|
| |||||||||||||||
New Hampshire: 0.19% |
| |||||||||||||||
| Variable Rate Demand Note ø: 0.19% | ||||||||||||||||
New Hampshire Business Finance Authority CJ Foods Manufacturing Beaumont Corporation Series A (Industrial Development Revenue, Kookmin Bank LOC) 144A | 1.80 | 10-1-2028 | 5,000,000 | 5,000,000 | ||||||||||||
|
| |||||||||||||||
New Jersey: 0.26% |
| |||||||||||||||
| Variable Rate Demand Note ø: 0.26% | ||||||||||||||||
Jets Stadium Development SeriesA-4B (Miscellaneous Revenue, Sumitomo Mitsui Banking Corporation LOC) 144A | 1.65 | 4-1-2047 | 6,930,000 | 6,930,000 | ||||||||||||
|
| |||||||||||||||
The accompanying notes are an integral part of these financial statements.
14 | Retail Money Market Funds
Table of Contents
Portfolio of investments—January 31, 2020
| Interest rate | Maturity date | Principal | Value | |||||||||||||
New York: 0.11% |
| |||||||||||||||
| Variable Rate Demand Note ø: 0.11% | ||||||||||||||||
New York HFA 222 East 44th Street Series B (Housing Revenue, Bank of China LOC) | 1.72 | % | 5-1-2050 | $ | 3,000,000 | $ | 3,000,000 | |||||||||
|
| |||||||||||||||
North Dakota: 0.23% |
| |||||||||||||||
| Variable Rate Demand Note ø: 0.23% | ||||||||||||||||
North Dakota Housing Finance Agency Series E (Housing Revenue, FHLB SPA) | 1.62 | 1-1-2050 | 6,265,000 | 6,265,000 | ||||||||||||
|
| |||||||||||||||
Oregon: 0.26% |
| |||||||||||||||
| Variable Rate Demand Note ø: 0.26% | ||||||||||||||||
Oregon Tender Option Bond Trust Receipts/Certificates Series ZF2515 (Miscellaneous Revenue, Bank of America NA LIQ) 144A | 1.84 | 5-1-2035 | 7,000,000 | 7,000,000 | ||||||||||||
|
| |||||||||||||||
Other: 1.62% |
| |||||||||||||||
| Variable Rate Demand Notes ø: 1.62% | ||||||||||||||||
Columbus GA Housing Development Authority Puttable Floating Option Taxable Notes SeriesTN-024 (Housing Revenue, ACA Insured, Bank of America NA LIQ) 144A | 1.98 | 10-1-2039 | 4,500,000 | 4,500,000 | ||||||||||||
Providence St. Joseph Health & Services (Health Revenue, GNMA/FNMA/FHLMC Insured, JPMorgan Chase & Company SPA) | 1.62 | 10-1-2047 | 8,000,000 | 8,000,000 | ||||||||||||
Providence St. Joseph Health Obligation Series 12E (Health Revenue, U.S. Bank NA LOC) | 1.68 | 10-1-2042 | 15,000,000 | 15,000,000 | ||||||||||||
SSAB AB Series A (Miscellaneous Revenue, DNB Banking ASA LOC) | 1.62 | 6-1-2035 | 1,000,000 | 1,000,000 | ||||||||||||
Steadfast Crestavilla LLC Series A (Health Revenue, American AgCredit LOC) | 1.62 | 2-1-2056 | 4,240,000 | 4,240,000 | ||||||||||||
Steadfast Crestavilla LLC Series B (Health Revenue, U.S. Bank NA LOC) | 1.62 | 2-1-2056 | 3,000,000 | 3,000,000 | ||||||||||||
Taxable Municipal Funding Trust Various (GO Revenue, Barclays Bank plc LOC) 144A | 2.00 | 9-1-2027 | 7,590,000 | 7,590,000 | ||||||||||||
| 43,330,000 | ||||||||||||||||
|
| |||||||||||||||
Total Municipal Obligations (Cost $168,605,000) |
| 168,605,000 | ||||||||||||||
|
| |||||||||||||||
| Non-Agency Mortgage-Backed Securities: 0.11% | ||||||||||||||||
Pepper Residential Securities Trust Series 20A Class A1U2 (1 Month LIBOR +0.32%) 144A± | 1.99 | 3-16-2020 | 3,000,000 | 3,000,000 | ||||||||||||
|
| |||||||||||||||
TotalNon-Agency Mortgage-Backed Securities (Cost $3,000,000) |
| 3,000,000 | ||||||||||||||
|
| |||||||||||||||
| Other Instruments: 1.75% | ||||||||||||||||
Altoona Blair County Development Corporation 144A§øø | 1.64 | 4-1-2035 | 5,850,000 | 5,850,000 | ||||||||||||
Altoona Blair County Development Corporation 144A§øø | 1.64 | 9-1-2038 | 3,000,000 | 3,000,000 | ||||||||||||
Fiddyment Ranch Apartments LP §øø | 1.62 | 9-1-2057 | 1,000,000 | 1,000,000 | ||||||||||||
Fiddyment Ranch Apartments LP §øø | 1.62 | 9-1-2057 | 1,000,000 | 1,000,000 | ||||||||||||
Invesco Dynamic Credit Opportunities Fund SeriesW-7 §øø | 1.71 | 6-1-2028 | 5,000,000 | 5,000,000 | ||||||||||||
Keep Memory Alive §øø | 1.64 | 5-1-2037 | 3,000,000 | 3,000,000 | ||||||||||||
Mitchell 2019 Irrevocable Life Insurance Trust §øø | 1.60 | 9-1-2059 | 10,000,000 | 10,000,000 | ||||||||||||
Opus Inspection Incorporated §øø | 1.67 | 1-1-2034 | 6,000,000 | 6,000,000 | ||||||||||||
ROC III California Crossings Chino Hills LLC Series A §øø | 1.62 | 1-1-2057 | 1,660,000 | 1,660,000 | ||||||||||||
ROC III California Crossings Chino Hills LLC Series B §øø | 1.62 | 1-1-2057 | 2,440,000 | 2,440,000 | ||||||||||||
Southside Brookshore §øø | 1.62 | 9-1-2059 | 7,640,000 | 7,640,000 | ||||||||||||
Total Other Instruments (Cost $46,590,000) |
| 46,590,000 | ||||||||||||||
|
| |||||||||||||||
The accompanying notes are an integral part of these financial statements.
Retail Money Market Funds | 15
Table of Contents
Portfolio of investments—January 31, 2020
| Interest rate | Maturity date | Principal | Value | |||||||||||||
Other Notes: 0.37% |
| |||||||||||||||
| Corporate Bonds and Notes: 0.37% | ||||||||||||||||
Cellmark Incorporated Secured±§ | 1.67 | % | 6-1-2038 | $ | 10,000,000 | $ | 10,000,000 | |||||||||
|
| |||||||||||||||
Total Other Notes (Cost $10,000,000) |
| 10,000,000 | ||||||||||||||
|
| |||||||||||||||
| Repurchase Agreements^^: 17.95% | ||||||||||||||||
Bank of America Corporation, dated1-31-2020, maturity value $135,017,888 (1) | 1.59 | 2-3-2020 | 135,000,000 | 135,000,000 | ||||||||||||
Bank of Nova Scotia, dated1-31-2020, maturity value $115,015,238 (2) | 1.59 | 2-3-2020 | 115,000,000 | 115,000,000 | ||||||||||||
GX Clarke & Company, dated1-31-2020, maturity value $75,010,125 (3) | 1.62 | 2-3-2020 | 75,000,000 | 75,000,000 | ||||||||||||
MUFG Securities Canada Limited, dated1-31-2020, maturity value $115,015,238 (4) | 1.59 | 2-3-2020 | 115,000,000 | 115,000,000 | ||||||||||||
Standard Chartered Bank, dated1-31-2020, maturity value $40,005,333 (5) | 1.60 | 2-3-2020 | 40,000,000 | 40,000,000 | ||||||||||||
Total Repurchase Agreements (Cost $480,000,000) |
| 480,000,000 | ||||||||||||||
|
| |||||||||||||||
| Total investments in securities (Cost $2,650,063,397) | 99.11 | % | 2,650,063,397 | |||||
Other assets and liabilities, net | 0.89 | 23,889,837 | ||||||
|
|
|
| |||||
| Total net assets | 100.00 | % | $ | 2,673,953,234 | ||||
|
|
|
| |||||
| ± | Variable rate investment. The rate shown is the rate in effect at period end. |
| 144A | The security may be resold in transactions exempt from registration, normally to qualified institutional buyers, pursuant to Rule 144A under the Securities Act of 1933. |
| (z) | Zero coupon security. The rate represents the current yield to maturity. |
| ø | Variable rate demand notes are subject to a demand feature which reduces the effective maturity. The maturity date shown represents the final maturity date of the security. The interest rate is determined and reset by the issuer daily, weekly, or monthly depending upon the terms of the security. The rate shown is the rate in effect at period end. |
| § | The security is subject to a demand feature which reduces the effective maturity. |
| øø | The interest rate is determined and reset by the issuer periodically depending upon the terms of the security. The rate shown is the rate in effect at period end. |
| ^^ | Collateralized by: |
| (1) | U.S. government securities, 3.00% to 3.50%,1-20-2045 to7-20-2045, fair value including accrued interest is $139,050,000. |
| (2) | U.S. government securities, 2.40% to 6.00%,1-15-2030 to10-1-2049, fair value including accrued interest is $118,450,000. |
| (3) | U.S. government securities, 0.00% to 7.50%,7-29-2020 to1-20-2050, fair value including accrued interest is $76,671,261. |
| (4) | U.S. government securities, 1.13% to 5.50%,5-31-2020 to1-1-2050, fair value including accrued interest is $118,354,586. |
| (5) | U.S. government securities, 0.00% to 6.50%,3-26-2020 to1-1-2050, fair value including accrued interest is $41,037,418. |
Abbreviations:
| ACA | ACA Financial Guaranty Corporation |
| AGM | Assured Guaranty Municipal |
| FHLB | Federal Home Loan Bank |
| FHLMC | Federal Home Loan Mortgage Corporation |
| FNMA | Federal National Mortgage Association |
| GO | General Obligation |
| GNMA | Government National Mortgage Association |
| HFA | Housing Finance Authority |
| LIBOR | London Interbank Offered Rate |
| LIQ | Liquidity agreement |
| LOC | Letter of credit |
| MFHR | Multifamily housing revenue |
| ROC | Reset option certificates |
| SPA | Standby purchase agreement |
The accompanying notes are an integral part of these financial statements.
16 | Retail Money Market Funds
Table of Contents
Statement of assets and liabilities—January 31, 2020
Assets | ||||
Investments in unaffiliated securities, at amortized cost | $ | 2,170,063,397 | ||
Investments in repurchase agreements, at amortized cost | 480,000,000 | |||
Cash | 16,481 | |||
Receivable for investments sold | 10,024,832 | |||
Receivable for Fund shares sold | 23,133,904 | |||
Receivable for interest | 3,057,867 | |||
Prepaid expenses and other assets | 351,871 | |||
|
| |||
Total assets | 2,686,648,352 | |||
|
| |||
Liabilities | ||||
Payable for Fund shares redeemed | 11,901,143 | |||
Management fee payable | 124,079 | |||
Dividends payable | 246,824 | |||
Administration fees payable | 247,771 | |||
Distribution fee payable | 2,139 | |||
Trustees’ fees and expenses payable | 4,161 | |||
Accrued expenses and other liabilities | 169,001 | |||
|
| |||
Total liabilities | 12,695,118 | |||
|
| |||
Total net assets | $ | 2,673,953,234 | ||
|
| |||
Net assets consist of | ||||
Paid-in capital | $ | 2,674,272,122 | ||
Total distributable loss | (318,888 | ) | ||
|
| |||
Total net assets | $ | 2,673,953,234 | ||
|
| |||
Computation of net asset value per share | ||||
Net assets – Class A | $ | 475,180,197 | ||
Shares outstanding – Class A1 | 475,113,518 | |||
Net asset value per share – Class A | $1.00 | |||
Net assets – Class C | $ | 3,153,297 | ||
Shares outstanding – Class C1 | 3,152,854 | |||
Net asset value per share – Class C | $1.00 | |||
Net assets – Premier Class | $ | 2,183,582,234 | ||
Shares outstanding – Premier Class1 | 2,183,295,704 | |||
Net asset value per share – Premier Class | $1.00 | |||
Net assets – Service Class | $ | 12,037,506 | ||
Shares outstanding – Service Class1 | 12,035,834 | |||
Net asset value per share – Service Class | $1.00 | |||
| 1 | The Fund has an unlimited number of authorized shares. |
The accompanying notes are an integral part of these financial statements.
Retail Money Market Funds | 17
Table of Contents
Statement of operations—year ended January 31, 2020
Investment income | ||||
Interest | $ | 31,179,733 | ||
|
| |||
Expenses | ||||
Management fee | 2,826,737 | |||
Administration fees | ||||
Class A | 1,057,612 | |||
Class C | 8,056 | |||
Premier Class | 733,505 | |||
Service Class | 14,512 | |||
Shareholder servicing fees | ||||
Class A | 1,201,831 | |||
Class C | 9,155 | |||
Service Class | 30,233 | |||
Distribution fee | ||||
Class C | 27,436 | |||
Custody and accounting fees | 26,343 | |||
Professional fees | 51,156 | |||
Registration fees | 201,454 | |||
Shareholder report expenses | 8,451 | |||
Trustees’ fees and expenses | 20,794 | |||
Other fees and expenses | 4,481 | |||
|
| |||
Total expenses | 6,221,756 | |||
Less: Fee waivers and/or expense reimbursements | ||||
Fund-level | (1,353,745 | ) | ||
Class A | (1,705 | ) | ||
Class C | (30 | ) | ||
Premier Class | (520,350 | ) | ||
Service Class | (32 | ) | ||
|
| |||
Net expenses | 4,345,894 | |||
|
| |||
Net investment income | 26,833,839 | |||
Net realized gains on investments | 16,052 | |||
|
| |||
Net increase in net assets resulting from operations | $ | 26,849,891 | ||
|
| |||
The accompanying notes are an integral part of these financial statements.
18 | Retail Money Market Funds
Table of Contents
Statement of changes in net assets
Year ended January 31, 2020 | Year ended January 31, 2019 | |||||||||||||||
Operations | ||||||||||||||||
Net investment income | $ | 26,833,839 | $ | 9,861,868 | ||||||||||||
Net realized gains on investments | 16,052 | 10,335 | ||||||||||||||
|
| |||||||||||||||
Net increase in net assets resulting from operations | 26,849,891 | 9,872,203 | ||||||||||||||
|
| |||||||||||||||
Distributions to shareholders from net investment income and net realized gains | ||||||||||||||||
Class A | (8,361,607 | ) | (7,460,070 | ) | ||||||||||||
Class C | (37,781 | ) | (63,691 | ) | ||||||||||||
Premier Class | (18,212,417 | ) | (2,133,009 | ) | ||||||||||||
Service Class | (222,034 | ) | (205,098 | ) | ||||||||||||
|
| |||||||||||||||
Total distributions to shareholders | (26,833,839 | ) | (9,861,868 | ) | ||||||||||||
|
| |||||||||||||||
Capital share transactions | Shares | Shares | ||||||||||||||
Proceeds from shares sold | ||||||||||||||||
Class A | 160,152,326 | 160,152,326 | 189,447,415 | 189,447,415 | ||||||||||||
Class C | 1,340,300 | 1,340,300 | 10,651,512 | 10,651,512 | ||||||||||||
Premier Class | 2,910,104,056 | 2,910,104,056 | 422,176,563 | 422,176,563 | ||||||||||||
Service Class | 1,520,533 | 1,520,533 | 2,334,760 | 2,334,760 | ||||||||||||
|
| |||||||||||||||
| 3,073,117,215 | 624,610,250 | |||||||||||||||
|
| |||||||||||||||
Reinvestment of distributions | ||||||||||||||||
Class A | 8,230,315 | 8,230,315 | 7,366,361 | 7,366,361 | ||||||||||||
Class C | 37,442 | 37,442 | 62,701 | 62,701 | ||||||||||||
Premier Class | 17,829,814 | 17,829,814 | 2,040,299 | 2,040,299 | ||||||||||||
Service Class | 215,827 | 215,827 | 198,869 | 198,869 | ||||||||||||
|
| |||||||||||||||
| 26,313,398 | 9,668,230 | |||||||||||||||
|
| |||||||||||||||
Payment for shares redeemed | ||||||||||||||||
Class A | (167,103,886 | ) | (167,103,886 | ) | (185,079,647 | ) | (185,079,647 | ) | ||||||||
Class C | (6,449,887 | ) | (6,449,887 | ) | (10,246,505 | ) | (10,246,505 | ) | ||||||||
Premier Class | (1,040,475,070 | ) | (1,040,475,070 | ) | (128,480,875 | ) | (128,480,875 | ) | ||||||||
Service Class | (1,579,489 | ) | (1,579,489 | ) | (2,556,663 | ) | (2,556,663 | ) | ||||||||
|
| |||||||||||||||
| (1,215,608,332 | ) | (326,363,690 | ) | |||||||||||||
|
| |||||||||||||||
Net increase in net assets resulting from capital share transactions | 1,883,822,281 | 307,914,790 | ||||||||||||||
|
| |||||||||||||||
Total increase in net assets | 1,883,838,333 | 307,925,125 | ||||||||||||||
|
| |||||||||||||||
Net assets | ||||||||||||||||
Beginning of period | 790,114,901 | 482,189,776 | ||||||||||||||
|
| |||||||||||||||
End of period | $ | 2,673,953,234 | $ | 790,114,901 | ||||||||||||
|
| |||||||||||||||
The accompanying notes are an integral part of these financial statements.
Retail Money Market Funds | 19
Table of Contents
(For a share outstanding throughout each period)
| Year ended January 31 | ||||||||||||||||||||
| CLASS A | 2020 | 2019 | 2018 | 2017 | 2016 | |||||||||||||||
Net asset value, beginning of period | $1.00 | $1.00 | $1.00 | $1.00 | $1.00 | |||||||||||||||
Net investment income | 0.02 | 0.02 | 0.01 | 0.00 | 1 | 0.00 | 1 | |||||||||||||
Net realized gains on investments | 0.00 | 1 | 0.00 | 1 | 0.00 | 1 | 0.00 | 1 | 0.00 | 1 | ||||||||||
|
|
|
|
|
|
|
|
|
| |||||||||||
Total from investment operations | 0.02 | 0.02 | 0.01 | 0.00 | 1 | 0.00 | 1 | |||||||||||||
Distributions to shareholders from | ||||||||||||||||||||
Net investment income | (0.02 | ) | (0.02 | ) | (0.01 | ) | (0.00 | )1 | (0.00 | )1 | ||||||||||
Net asset value, end of period | $1.00 | $1.00 | $1.00 | $1.00 | $1.00 | |||||||||||||||
Total return | 1.76 | % | 1.61 | % | 0.64 | % | 0.05 | % | 0.01 | % | ||||||||||
Ratios to average net assets (annualized) | ||||||||||||||||||||
Gross expenses | 0.70 | % | 0.76 | % | 0.85 | % | 0.83 | % | 0.82 | % | ||||||||||
Net expenses | 0.60 | % | 0.62 | % | 0.65 | % | 0.55 | % | 0.29 | % | ||||||||||
Net investment income | 1.74 | % | 1.60 | % | 0.63 | % | 0.03 | % | 0.01 | % | ||||||||||
Supplemental data | ||||||||||||||||||||
Net assets, end of period (000s omitted) | $475,180 | $474,040 | $462,416 | $539,989 | $1,205,785 | |||||||||||||||
| 1 | Amount is less than $0.005. |
The accompanying notes are an integral part of these financial statements.
20 | Retail Money Market Funds
Table of Contents
Financial highlights
(For a share outstanding throughout each period)
| Year ended January 31 | ||||||||||||||||||||
| CLASS C | 2020 | 2019 | 2018 | 2017 | 2016 | |||||||||||||||
Net asset value, beginning of period | $1.00 | $1.00 | $1.00 | $1.00 | $1.00 | |||||||||||||||
Net investment income | 0.01 | 0.01 | 0.00 | 1 | 0.00 | 1 | 0.00 | 1 | ||||||||||||
Net realized gains on investments | 0.00 | 1 | 0.00 | 1 | 0.00 | 1 | 0.00 | 1 | 0.00 | 1 | ||||||||||
|
|
|
|
|
|
|
|
|
| |||||||||||
Total from investment operations | 0.01 | 0.01 | 0.00 | 1 | 0.00 | 1 | 0.00 | 1 | ||||||||||||
Distributions to shareholders from | ||||||||||||||||||||
Net investment income | (0.01 | ) | (0.01 | ) | (0.00 | )1 | (0.00 | )1 | (0.00 | )1 | ||||||||||
Net asset value, end of period | $1.00 | $1.00 | $1.00 | $1.00 | $1.00 | |||||||||||||||
Total return | 1.00 | % | 0.84 | % | 0.04 | % | 0.01 | % | 0.01 | % | ||||||||||
Ratios to average net assets (annualized) | ||||||||||||||||||||
Gross expenses | 1.45 | % | 1.51 | % | 1.60 | % | 1.58 | % | 1.57 | % | ||||||||||
Net expenses | 1.35 | % | 1.37 | % | 1.23 | % | 0.60 | % | 0.29 | % | ||||||||||
Net investment income | 1.03 | % | 0.87 | % | 0.03 | % | 0.01 | % | 0.01 | % | ||||||||||
Supplemental data | ||||||||||||||||||||
Net assets, end of period (000s omitted) | $3,153 | $8,229 | $7,763 | $13,293 | $16,617 | |||||||||||||||
| 1 | Amount is less than $0.005. |
The accompanying notes are an integral part of these financial statements.
Retail Money Market Funds | 21
Table of Contents
Financial highlights
(For a share outstanding throughout each period)
| Year ended January 31 | ||||||||||||||||
| PREMIER CLASS | 2020 | 2019 | 2018 | 20171 | ||||||||||||
Net asset value, beginning of period | $1.00 | $1.00 | $1.00 | $1.00 | ||||||||||||
Net investment income | 0.02 | 0.02 | 0.01 | 0.00 | 2 | |||||||||||
Net realized gains on investments | 0.00 | 2 | 0.00 | 2 | 0.00 | 2 | 0.00 | 2 | ||||||||
|
|
|
|
|
|
|
| |||||||||
Total from investment operations | 0.02 | 0.02 | 0.01 | 0.00 | 2 | |||||||||||
Distributions to shareholders from | ||||||||||||||||
Net investment income | (0.02 | ) | (0.02 | ) | (0.01 | ) | (0.00 | )2 | ||||||||
Net asset value, end of period | $1.00 | $1.00 | $1.00 | $1.00 | ||||||||||||
Total return3 | 2.20 | % | 2.03 | % | 1.09 | % | 0.36 | % | ||||||||
Ratios to average net assets (annualized) | ||||||||||||||||
Gross expenses | 0.30 | % | 0.33 | % | 0.45 | % | 0.45 | % | ||||||||
Net expenses | 0.15 | % | 0.20 | % | 0.20 | % | 0.20 | % | ||||||||
Net investment income | 1.99 | % | 2.26 | % | 1.08 | % | 0.43 | % | ||||||||
Supplemental data | ||||||||||||||||
Net assets, end of period (000s omitted) | $2,183,582 | $295,962 | $101 | $100 | ||||||||||||
| 1 | For the period from March 31, 2016 (commencement of class operations) to January 31, 2017 |
| 2 | Amount is less than $0.005. |
| 3 | Returns for periods of less than one year are not annualized. |
The accompanying notes are an integral part of these financial statements.
22 | Retail Money Market Funds
Table of Contents
Financial highlights
(For a share outstanding throughout each period)
| Year ended January 31 | ||||||||||||||||||||
| SERVICE CLASS | 2020 | 2019 | 2018 | 2017 | 2016 | |||||||||||||||
Net asset value, beginning of period | $1.00 | $1.00 | $1.00 | $1.00 | $1.00 | |||||||||||||||
Net investment income | 0.02 | 0.02 | 0.01 | 0.00 | 1 | 0.00 | 1 | |||||||||||||
Net realized gains on investments | 0.00 | 1 | 0.00 | 1 | 0.00 | 1 | 0.00 | 1 | 0.00 | 1 | ||||||||||
|
|
|
|
|
|
|
|
|
| |||||||||||
Total from investment operations | 0.02 | 0.02 | 0.01 | 0.00 | 1 | 0.00 | 1 | |||||||||||||
Distributions to shareholders from | ||||||||||||||||||||
Net investment income | (0.02 | ) | (0.02 | ) | (0.01 | ) | (0.00 | )1 | (0.00 | )1 | ||||||||||
Net asset value, end of period | $1.00 | $1.00 | $1.00 | $1.00 | $1.00 | |||||||||||||||
Total return | 1.86 | % | 1.72 | % | 0.79 | % | 0.11 | % | 0.01 | % | ||||||||||
Ratios to average net assets (annualized) | ||||||||||||||||||||
Gross expenses | 0.60 | % | 0.66 | % | 0.74 | % | 0.72 | % | 0.72 | % | ||||||||||
Net expenses | 0.50 | % | 0.50 | % | 0.50 | % | 0.50 | % | 0.28 | % | ||||||||||
Net investment income | 1.84 | % | 1.71 | % | 0.74 | % | 0.05 | % | 0.01 | % | ||||||||||
Supplemental data | ||||||||||||||||||||
Net assets, end of period (000s omitted) | $12,038 | $11,884 | $11,910 | $21,602 | $274,245 | |||||||||||||||
| 1 | Amount is less than $0.005. |
The accompanying notes are an integral part of these financial statements.
Retail Money Market Funds | 23
Table of Contents
1. ORGANIZATION
Wells Fargo Funds Trust (the “Trust”), a Delaware statutory trust organized on March 10, 1999, is anopen-end management investment company registered under the Investment Company Act of 1940, as amended (the “1940 Act”). As an investment company, the Trust follows the accounting and reporting guidance in Financial Accounting Standards Board (“FASB”)Accounting Standards Codification Topic 946, Financial Services – Investment Companies. These financial statements report on the Wells Fargo Money Market Fund (the “Fund”) which is a diversified series of the Trust.
Consistent with Rule2a-7, the Board of Trustees of the Fund is permitted to impose a liquidity fee on redemptions from the Fund or a redemption gate (i.e., a suspension of the right to redeem) in the event that the Fund’s liquidity falls below required minimums because of market conditions or other factors. If the Fund’s weekly liquid assets (as defined in Rule2a-7(34)) fall below 30% of the Fund’s total assets, the Board of Trustees is permitted, but not required, to: (i) impose a liquidity fee of no more than 2% of the amount redeemed; and/or (ii) impose a redemption gate. If the Fund’s weekly liquid assets fall below 10% of the Fund’s total assets, the Fund must impose, generally as of the beginning of the next business day, a liquidity fee of 1% of the amount redeemed unless the Board of Trustees determines that such a fee is not in the best interest of the Fund or determines that a lower or higher fee (subject to the 2% limit) is in the best interest of the Fund. Liquidity fees reduce the amount a shareholder receives upon redemption of its shares. The Fund retains any liquidity fees for the benefit of remaining shareholders. The Board of Trustees did not impose any liquidity fees and/or redemption gates during the year ended January 31, 2020.
2. SIGNIFICANT ACCOUNTING POLICIES
The following significant accounting policies, which are consistently followed in the preparation of the financial statements of the Fund, are in conformity with U.S. generally accepted accounting principles which require management to make estimates and assumptions that affect the reported amounts of assets and liabilities, disclosure of contingent assets and liabilities at the date of the financial statements, and the reported amounts of revenues and expenses during the reporting period. Actual results could differ from those estimates.
Securities valuation
As permitted under Rule2a-7 of the 1940 Act, portfolio securities are valued at amortized cost, which approximates fair value. The amortized cost method involves valuing a security at its cost, plus accretion of discount or minus amortization of premium over the period until maturity.
Investments which are not valued using the method discussed above are valued at their fair value, as determined in good faith by the Board of Trustees. The Board of Trustees has established a Valuation Committee comprised of the Trustees and has delegated to it the authority to take any actions regarding the valuation of portfolio securities that the Valuation Committee deems necessary or appropriate, including determining the fair value of portfolio securities, unless the determination has been delegated to the Wells Fargo Asset Management Pricing Committee at Wells Fargo Funds Management, LLC (“Funds Management”).The Board of Trustees retains the authority to make or ratify any valuation decisions or approve any changes to the Valuation Procedures as it deems appropriate. On a quarterly basis, the Board of Trustees receives reports on any valuation actions taken by the Valuation Committee or the Wells Fargo Asset Management Pricing Committee which may include items for ratification.
Repurchase agreements
The Fund may invest in repurchase agreements and may participate in pooled repurchase agreement transactions with other funds advised by Funds Management. Repurchase agreements are agreements where the seller of a security to the Fund agrees to repurchase that security from the Fund at a mutually agreed upon time and price. The repurchase agreements must be fully collateralized based on values that aremarked-to-market daily. The collateral may be held by an agent bank under atri-party agreement. It is the custodian’s responsibility to value collateral daily and to take action to obtain additional collateral as necessary to maintain a market value equal to or greater than the resale price. The repurchase agreements are collateralized by securities issued or guaranteed by the U.S. Government, its agencies or instrumentalities. There could be potential loss to the Fund in the event that the Fund is delayed or prevented from exercising its rights to dispose of the collateral, including the risk of a possible decline in the value of the underlying obligations during the period in which the Fund seeks to assert its rights.
When-issued transactions
The Fund may purchase securities on a forward commitment or when-issued basis. The Fund records a when-issued transaction on the trade date and will segregate assets in an amount at least equal in value to the Fund’s commitment to purchase when-issued securities. Securities purchased on a when-issued basis aremarked-to-market daily and the Fund begins earning interest on the settlement date. Losses may arise due to changes in the market value of the underlying securities or if the counterparty does not perform under the contract.
24 | Retail Money Market Funds
Table of Contents
Notes to financial statements
Security transactions and income recognition
Securities transactions are recorded on a trade date basis. Realized gains or losses are recorded on the basis of identified cost.
Interest income is accrued daily and bond discounts are accreted and premiums are amortized daily. To the extent debt obligations are placed onnon-accrual status, any related interest income may be reduced by writing off interest receivables when the collection of all or a portion of interest has been determined to be doubtful based on consistently applied procedures and the fair value has decreased. If the issuer subsequently resumes interest payments or when the collectability of interest is reasonably assured, the debt obligation is removed fromnon-accrual status.
Distributions to shareholders
Distributions to shareholders from net investment income are declared daily and paid monthly. Distributions from net realized gains, if any, are recorded on theex-dividend date and paid at least annually. Such distributions are determined in accordance with income tax regulations and may differ from U.S. generally accepted accounting principles. Dividend sources are estimated at the time of declaration. The tax character of distributions is determined as of the Fund’s fiscal year end. Therefore, a portion of the Fund’s distributions made prior to the Fund’s fiscal year end may be categorized as a tax return of capital at year end.
Federal and other taxes
The Fund intends to continue to qualify as a regulated investment company by distributing substantially all of its investment company taxable income and any net realized capital gains (after reduction for capital loss carryforwards) sufficient to relieve it from all, or substantially all, federal income taxes. Accordingly, no provision for federal income taxes was required.
The Fund’s income and federal excise tax returns and all financial records supporting those returns for the prior three fiscal years are subject to examination by the federal and Delaware revenue authorities. Management has analyzed the Fund’s tax positions taken on federal, state, and foreign tax returns for all open tax years and does not believe that there are any uncertain tax positions that require recognition of a tax liability.
As of January 31, 2020, the cost of investments for federal income tax purposes is substantially the same as for financial reporting purposes.
Class allocations
The separate classes of shares offered by the Fund differ principally in applicable sales charges, distribution, shareholder servicing, and administration fees. Class specific expenses are charged directly to that share class. Investment income, common fund-level expenses, and realized gains (losses) on investments are allocated daily to each class of shares based on the relative proportion of net assets of each class.
3. FAIR VALUATION MEASUREMENTS
Fair value measurements of investments are determined within a framework that has established a fair value hierarchy based upon the various data inputs utilized in determining the value of the Fund’s investments. The three-level hierarchy gives the highest priority to unadjusted quoted prices in active markets for identical assets or liabilities (Level 1) and the lowest priority to unobservable inputs (Level 3). The Fund’s investments are classified within the fair value hierarchy based on the lowest level of input that is significant to the fair value measurement. The inputs are summarized into three broad levels as follows:
| ∎ | Level 1 – quoted prices in active markets for identical securities |
| ∎ | Level 2 – other significant observable inputs (including quoted prices for similar securities, interest rates, prepayment speeds, credit risk, etc.) |
| ∎ | Level 3 – significant unobservable inputs (including the Fund’s own assumptions in determining the fair value of investments) |
The inputs or methodologies used for valuing investments in securities are not necessarily an indication of the risk associated with investing in those securities.
Retail Money Market Funds | 25
Table of Contents
Notes to financial statements
The following is a summary of the inputs used in valuing the Fund’s assets and liabilities as of January 31, 2020:
| Quoted prices (Level 1) | Other significant observable inputs (Level 2) | Significant (Level 3) | Total | |||||||||||||
Assets | ||||||||||||||||
Investments in: | ||||||||||||||||
Certificate of deposit | $ | 0 | $ | 472,502,653 | $ | 0 | $ | 472,502,653 | ||||||||
Commercial paper | 0 | 1,469,365,744 | 0 | 1,469,365,744 | ||||||||||||
Municipal obligations | 0 | 168,605,000 | 0 | 168,605,000 | ||||||||||||
Non-agency mortgage-backed securities | 0 | 3,000,000 | 0 | 3,000,000 | ||||||||||||
Other instruments | 0 | 46,590,000 | 0 | 46,590,000 | ||||||||||||
Other notes | 0 | 10,000,000 | 0 | 10,000,000 | ||||||||||||
Repurchase agreements | 0 | 480,000,000 | 0 | 480,000,000 | ||||||||||||
Total assets | $ | 0 | $ | 2,650,063,397 | $ | 0 | $ | 2,650,063,397 | ||||||||
Additional sector, industry or geographic detail is included in the Portfolio of Investments.
For the year ended January 31, 2020, the Fund did not have any transfers into/out of Level 3.
4. TRANSACTIONS WITH AFFILIATES
Management fee
Funds Management, an indirect wholly owned subsidiary of Wells Fargo & Company (“Wells Fargo”), is the manager of the Fund and provides advisory and fund-level administrative services under an investment management agreement. Under the investment management agreement, Funds Management is responsible for, among other services, implementing the investment objectives and strategies of the Fund, supervising the subadvisers and providing fund-level administrative services in connection with the Fund’s operations. As compensation for its services under the investment management agreement, Funds Management is entitled to receive a management fee at the following annual rate based on the Fund’s average daily net assets:
| Average daily net assets | Management fee | |||
First $5 billion | 0.20 | % | ||
Next $5 billion | 0.19 | |||
Over $10 billion | 0.18 | |||
For the year ended January 31, 2020, the management fee was equivalent to an annual rate of 0.20% of the Fund’s average daily net assets.
Funds Management has retained the services of certain subadvisers to provide daily portfolio management to the Fund. The fee for subadvisory services is borne by Funds Management. Wells Capital Management Incorporated, an affiliate of Funds Management and an indirect wholly owned subsidiary of Wells Fargo, is a subadviser to the Fund and is entitled to receive a fee from Funds Management at an annual rate starting at 0.05% and declining to 0.01% as the average daily net assets of the Fund increase. Wells Capital Management Singapore, a separately identifiable department of Wells Fargo Bank, N.A, an affiliate of Funds Management and wholly owned subsidiary of Wells Fargo, is also a subadviser to the Fund and is entitled to receive a fee from Funds Management at an annual rate starting at 0.0025% and declining to 0.0005% as the average daily net assets of the Fund increase.
26 | Retail Money Market Funds
Table of Contents
Notes to financial statements
Administration fees
Under a class-level administration agreement, Funds Management provides class-level administrative services to the Fund, which includes paying fees and expenses for services provided by the transfer agent,sub-transfer agents, omnibus account servicers and record-keepers. As compensation for its services under the class-level administration agreement, Funds Management receives an annual fee which is calculated based on the average daily net assets of each class as follows:
| Class-level administration fee | ||||
Class A, Class C | 0.22 | % | ||
Premier Class | 0.08 | |||
Service Class | 0.12 | |||
Waivers and/or expense reimbursements
Funds Management has contractually waived and/or reimbursed management and administration fees to the extent necessary to maintain certain net operating expense ratios for the Fund. When each class of the Fund has exceeded its expense cap, Funds Management has waived fees and/or reimbursed expenses from fund-level expenses on a proportionate basis and then from class specific expenses. When only certain classes exceed their expense caps, waivers and/or reimbursements are applied against class specific expenses before fund-level expenses. Funds Management has committed through May 31, 2020 to waive fees and/or reimburse expenses to the extent necessary to cap the Fund’s expenses at 0.60% for Class A shares, 1.35% for Class C shares, 0.20% for Premier Class shares, and 0.50% for Service Class shares. Prior to or after the commitment expiration date, the cap may be increased or the commitment to maintain the cap may be terminated only with the approval of the Board of Trustees. During the year ended January 31, 2020, Funds Management also voluntarily waived class-level expenses which represent 0.05% of the average daily net assets of Premier Class.
Distribution fee
The Trust has adopted a distribution plan for Class C shares of the Fund pursuant to Rule12b-1 under the 1940 Act. A distribution fee is charged to Class C shares and paid to Wells Fargo Funds Distributor, LLC (“Funds Distributor”), the principal underwriter, at an annual rate of 0.75% of the average daily net assets of Class C shares.
In addition, Funds Distributor is entitled to receive the contingent deferred sales charge on the redemption of certain Class C shares. No contingent deferred sales charges were incurred by Class C shares for the year ended January 31, 2020.
Shareholder servicing fees
The Trust has entered into contracts with one or more shareholder servicing agents, whereby Class A, Class C, and Service Class of the Fund are charged a fee at an annual rate of 0.25% of the respective average daily net assets of each class. A portion of these total shareholder servicing fees were paid to affiliates of Wells Fargo.
Interfund transactions
The Fund may purchase or sell portfolio investment securities to certain other Wells Fargo affiliates pursuant to Rule17a-7 under the 1940 Act and under procedures adopted by the Board of Trustees. The procedures have been designed to ensure that these interfund transactions, which do not incur broker commissions, are effected at current market prices.
5. DISTRIBUTIONS TO SHAREHOLDERS
The tax character of distributions paid was $26,833,839 and $9,861,868 of ordinary income for the years ended January 31, 2020 and January 31, 2019, respectively.
As of January 31, 2020, distributable earnings on a tax basis consisted of $159,341 in undistributed ordinary income.
6. INDEMNIFICATION
Under the Trust’s organizational documents, the officers and Trustees have been granted certain indemnification rights against certain liabilities that may arise out of performance of their duties to the Trust. Additionally, in the normal course of business, the Trust may enter into contracts with service providers that contain a variety of indemnification clauses. The Trust’s maximum exposure under these arrangements is dependent on future claims that may be made against the Fund and, therefore, cannot be estimated.
Retail Money Market Funds | 27
Table of Contents
Notes to financial statements
7. NEW ACCOUNTING PRONOUNCEMENTS
In August 2018, FASB issued Accounting Standards Update (“ASU”)No. 2018-13, Fair Value Measurement (Topic 820)Disclosure Framework—Changes to the Disclosure Requirements for Fair Value Measurement.ASU2018-13 updates the disclosure requirements for fair value measurements by modifying or removing certain disclosures and adding certain new disclosures. The amendments are effective for fiscal years, and interim periods within those fiscal years, beginning after December 15, 2019. Early adoption is permitted. Management has adopted the removal and modification of disclosures early, as permitted, and will adopt the additional new disclosures at the effective date.
In March 2017, FASB issued ASUNo. 2017-08,Premium Amortization on Purchased Callable Debt Securities. ASU2017-08 shortens the amortization period for certain callable debt securities held at a premium and requires the premium to be amortized to the earliest call date. The amendments do not require an accounting change for securities held at a discount and discounts will continue to be accreted to the maturity date of the security. ASU2017-08 is effective for fiscal years beginning after December 15, 2018 and for interim periods within those fiscal years. During the current reporting period, management of the Fund adopted the change in accounting policy which did not have a material impact to the Fund’s financial statements.
8. SUBSEQUENT EVENT
On March 11, 2020, the World Health Organization announced that it had made the assessment that coronavirus disease 2019 (“COVID-19”) is a pandemic. The impacts of COVID-19 is adversely affecting the entire global economy, individual companies and investment products, and the market in general. There is significant uncertainty around the extent and duration of business disruptions related to COVID-19 and the impact may be short term or may last for an extended period of time. The risk of further spreading of COVID-19 has led to significant uncertainty and volatility in the financial markets and the value of the Fund and the securities in which the Fund invests may be adversely affected by impacts caused by COVID-19.
28 | Retail Money Market Funds
Table of Contents
Report of independent registered public accounting firm
TO THE SHAREHOLDERS OF THE FUND AND BOARD OF TRUSTEES OF WELLS FARGO FUNDS TRUST:
Opinion on the Financial Statements
We have audited the accompanying statement of assets and liabilities of Wells Fargo Money Market Fund (the Fund), one of the funds constituting Wells Fargo Funds Trust, including the portfolio of investments, as of January 31, 2020, the related statement of operations for the year then ended, the statements of changes in net assets for each of the years in the two-year period then ended, and the related notes (collectively, the financial statements) and the financial highlights for each of the years or periods in the five-year period then ended. In our opinion, the financial statements and financial highlights present fairly, in all material respects, the financial position of the Fund as of January 31, 2020, the results of its operations for the year then ended, the changes in its net assets for each of the years in the two-year period then ended, and the financial highlights for each of the years or periods in the five-year period then ended, in conformity with U.S. generally accepted accounting principles.
Basis for Opinion
These financial statements and financial highlights are the responsibility of the Fund’s management. Our responsibility is to express an opinion on these financial statements and financial highlights based on our audits. We are a public accounting firm registered with the Public Company Accounting Oversight Board (United States) (PCAOB) and are required to be independent with respect to the Fund in accordance with the U.S. federal securities laws and the applicable rules and regulations of the Securities and Exchange Commission and the PCAOB.
We conducted our audits in accordance with the standards of the PCAOB. Those standards require that we plan and perform the audit to obtain reasonable assurance about whether the financial statements and financial highlights are free of material misstatement, whether due to error or fraud. Our audits included performing procedures to assess the risks of material misstatement of the financial statements and financial highlights, whether due to error or fraud, and performing procedures that respond to those risks. Such procedures included examining, on a test basis, evidence regarding the amounts and disclosures in the financial statements and financial highlights. Such procedures also included confirmation of securities owned as of January 31, 2020, by correspondence with the custodian and brokers, or by other appropriate auditing procedures. Our audits also included evaluating the accounting principles used and significant estimates made by management, as well as evaluating the overall presentation of the financial statements and financial highlights. We believe that our audits provide a reasonable basis for our opinion.

We have not been able to determine the specific year that we began serving as the auditor of one or more Wells Fargo Funds investment companies; however we are aware that we have served as the auditor of one or more Wells Fargo Funds investment companies since at least 1955.
Boston, Massachusetts
March 31, 2020
Retail Money Market Funds | 29
Table of Contents
TAX INFORMATION
For the fiscal year ended January 31, 2020, $16,615,574 has been designated as interest-related dividends for nonresident alien shareholders pursuant to Section 871 of the Internal Revenue Code.
PROXY VOTING INFORMATION
A description of the policies and procedures used to determine how to vote proxies relating to portfolio securities is available, upon request, by calling1-800-222-8222, visiting our website atwfam.com, or visiting the SEC website at sec.gov. Information regarding how the proxies related to portfolio securities were voted during the most recent12-month period ended June 30 is available on the website atwfam.comor by visiting the SEC website at sec.gov.
30 | Retail Money Market Funds
Table of Contents
Other information (unaudited)
BOARD OF TRUSTEES AND OFFICERS
Each of the Trustees and Officers1 listed in the table below acts in identical capacities for each fund in the Wells Fargo family of funds, which consists of 149 mutual funds comprising the Wells Fargo Funds Trust, Wells Fargo Variable Trust, Wells Fargo Master Trust and fourclosed-end funds (collectively the “Fund Complex”). This table should be read in conjunction with the Prospectus and the Statement of Additional Information2. The mailing address of each Trustee and Officer is 525 Market Street, 12th Floor, San Francisco, CA 94105. Each Trustee and Officer serves an indefinite term, however, each Trustee serves such term until reaching the mandatory retirement age established by the Trustees.
Independent Trustees
Name and year of birth | Position held and length of service* | Principal occupations during past five years or longer | Current other public company or investment company directorships | |||
| William R. Ebsworth (Born 1957) | Trustee, since 2015 | Retired. From 1984 to 2013, equities analyst, portfolio manager, research director and chief investment officer at Fidelity Management and Research Company in Boston, Tokyo, and Hong Kong, and retired in 2013 as Chief Investment Officer of Fidelity Strategic Advisers, Inc. where he led a team of investment professionals managing client assets. Prior thereto, Board member of Hong Kong Securities Clearing Co., Hong Kong Options Clearing Corp., the Thailand International Fund, Ltd., Fidelity Investments Life Insurance Company, and Empire Fidelity Investments Life Insurance Company. Audit Committee Chair and Investment Committee Chair of the Vincent Memorial Hospital Endowment(non-profit organization). Mr. Ebsworth is a CFA® charterholder. | N/A | |||
| Jane A. Freeman (Born 1953) | Trustee, since 2015; Chair Liaison, since 2018 | Retired. From 2012 to 2014 and 1999 to 2008, Chief Financial Officer of Scientific Learning Corporation. From 2008 to 2012, Ms. Freeman provided consulting services related to strategic business projects. Prior to 1999, Portfolio Manager at Rockefeller & Co. and Scudder, Stevens & Clark. Board member of the Harding Loevner Funds from 1996 to 2014, serving as both Lead Independent Director and chair of the Audit Committee. Board member of the Russell Exchange Traded Funds Trust from 2011 to 2012 and the chair of the Audit Committee. Ms. Freeman is a Board Member of The Ruth Bancroft Garden(non-profit organization). She is also an inactive Chartered Financial Analyst. | N/A | |||
| Isaiah Harris, Jr. (Born 1952) | Trustee, since 2009; Audit Committee Chairman, since 2019 | Retired. Chairman of the Board of CIGNA Corporation since 2009, and Director since 2005. From 2003 to 2011, Director of Deluxe Corporation. Prior thereto, President and CEO of BellSouth Advertising and Publishing Corp. from 2005 to 2007, President and CEO of BellSouth Enterprises from 2004 to 2005 and President of BellSouth Consumer Services from 2000 to 2003. Emeritus member of the Iowa State University Foundation Board of Governors. Emeritus Member of the Advisory Board of Iowa State University School of Business. Advisory Board Member, Palm Harbor Academy (private school). Advisory Board Member, Child Evangelism Fellowship(non-profit). Mr. Harris is a certified public accountant (inactive status). | CIGNA Corporation | |||
| Judith M. Johnson (Born 1949) | Trustee, since 2008; Audit Committee Chairman, from 2009 to 2018 | Retired. Prior thereto, Chief Executive Officer and Chief Investment Officer of Minneapolis Employees Retirement Fund from 1996 to 2008. Ms. Johnson is an attorney, certified public accountant and a certified managerial accountant. | N/A | |||
Retail Money Market Funds | 31
Table of Contents
Other information (unaudited)
Name and year of birth | Position held and length of service* | Principal occupations during past five years or longer | Current other public company or investment company directorships | |||
| David F. Larcker (Born 1950) | Trustee, since 2009 | James Irvin Miller Professor of Accounting at the Graduate School of Business, Stanford University, Director of the Corporate Governance Research Initiative and Senior Faculty of The Rock Center for Corporate Governance since 2006. From 2005 to 2008, Professor of Accounting at the Graduate School of Business, Stanford University. Prior thereto, Ernst & Young Professor of Accounting at The Wharton School, University of Pennsylvania from 1985 to 2005. | N/A | |||
| Olivia S. Mitchell (Born 1953) | Trustee, since 2006; Nominating and Governance Committee Chair, since 2018 | International Foundation of Employee Benefit Plans Professor, Wharton School of the University of Pennsylvania since 1993. Director of Wharton’s Pension Research Council and Boettner Center on Pensions & Retirement Research, and Research Associate at the National Bureau of Economic Research. Previously, Cornell University Professor from 1978 to 1993. | N/A | |||
| Timothy J. Penny (Born 1951) | Trustee, since 1996; Chairman, since 2018 | President and Chief Executive Officer of Southern Minnesota Initiative Foundation, anon-profit organization, since 2007. Member of the Board of Trustees of NorthStar Education Finance, Inc., anon-profit organization, since 2007. | N/A | |||
| James G. Polisson (Born 1959) | Trustee, since 2018 | Retired. Chief Marketing Officer, Source (ETF) UK Services, Ltd, from 2015 to 2017. From 2012 to 2015, Principal of The Polisson Group, LLC, a management consulting, corporate advisory and principal investing company. Chief Executive Officer and Managing Director at Russell Investments, Global Exchange Traded Funds from 2010 to 2012. Managing Director of Barclays Global Investors from 1998 to 2010 and Global Chief Marketing Officer for iShares and Barclays Global Investors from 2000 to 2010. Trustee of the San Francisco Mechanics’ Institute, anon-profit organization, from 2013 to 2015. Board member of the Russell Exchange Traded Fund Trust from 2011 to 2012. Director of Barclays Global Investors Holdings Deutschland GmbH from 2006 to 2009. Mr. Polisson is an attorney and has a retired status with the Massachusetts and District of Columbia Bar Associations. | N/A | |||
| Pamela Wheelock3 (Born 1959) | Trustee, since January 2020; previously Trustee from January 2018 to July 2019 | Board member of the Destination Medical Center Economic Development Agency, Rochester, Minnesota since 2019. Acting Commissioner, Minnesota Department of Human Services, July 2019 through September 2019. Human Services Manager (part-time), Minnesota Department of Human Services, October 2019 through December 2019. Chief Operating Officer, Twin Cities Habitat for Humanity from 2017 to 2019. Vice President of University Services, University of Minnesota from 2012 to 2016. Prior thereto, on the Board of Directors, Governance Committee and Finance Committee for the Minnesota Philanthropy Partners (Saint Paul Foundation) from 2012 to 2018, Interim Chief Executive Officer of Blue Cross Blue Shield of Minnesota from 2011 to 2012, Chairman of the Board from 2009 to 2012 and Board Director from 2003 to 2015. Vice President, Leadership and Community Engagement, Bush Foundation, Saint Paul, Minnesota (a private foundation) from 2009 to 2011. Executive Vice President and Chief Financial Officer, Minnesota Sports and Entertainment from 2004 to 2009 and Senior Vice President from 2002 to 2004. Executive Vice President of the Minnesota Wild Foundation from 2004 to 2008. Commissioner of Finance, State of Minnesota, from 1999 to 2002. Currently Board Chair of the Minnesota Wild Foundation since 2010. | N/A | |||
| * | Length of service dates reflect the Trustee’s commencement of service with the Trust’s predecessor entities, where applicable. |
32 | Retail Money Market Funds
Table of Contents
Other information (unaudited)
Officers
Name and year of birth | Position held and length of service | Principal occupations during past five years or longer | ||
Andrew Owen (Born 1960) | President, since 2017 | Executive Vice President of Wells Fargo & Company and Head of Affiliated Managers, Wells Fargo Asset Management, since 2014. In addition, Mr. Owen is currently President, Chief Executive Officer and Director of Wells Fargo Funds Management, LLC since 2017. Prior thereto, Executive Vice President responsible for marketing, investments and product development for Wells Fargo Funds Management, LLC, from 2009 to 2014. | ||
Nancy Wiser1 (Born 1967) | Treasurer, since 2012 | Executive Vice President of Wells Fargo Funds Management, LLC since 2011. Chief Operating Officer and Chief Compliance Officer at LightBox Capital Management LLC, from 2008 to 2011. | ||
Michelle Rhee (Born 1966) | Chief Legal Officer, since 2019 | Secretary of Wells Fargo Funds Management, LLC, Chief Legal Counsel of Wells Fargo Asset Management and Assistant General Counsel of Wells Fargo Bank, N.A. since 2018. Associate General Counsel and Managing Director of Bank of America Corporation from 2004 to 2018. | ||
Catherine Kennedy (Born 1969) | Secretary, since 2019 | Vice President of Wells Fargo Funds Management, LLC and Senior Counsel of the Wells Fargo Legal Department since 2010. Vice President and Senior Counsel of Evergreen Investment Management Company, LLC from 1998 to 2010. | ||
Michael H. Whitaker (Born 1967) | Chief Compliance Officer, since 2016 | Chief Compliance Officer of Wells Fargo Asset Management since 2016. Senior Vice President and Chief Compliance Officer for Fidelity Investments from 2007 to 2016. | ||
David Berardi (Born 1975) | Assistant Treasurer, since 2009 | Vice President of Wells Fargo Funds Management, LLC since 2009. Vice President of Evergreen Investment Management Company, LLC from 2008 to 2010. Manager of Fund Reporting and Control for Evergreen Investment Management Company, LLC from 2004 to 2010. | ||
Jeremy DePalma1 (Born 1974) | Assistant Treasurer, since 2009 | Senior Vice President of Wells Fargo Funds Management, LLC since 2009. Senior Vice President of Evergreen Investment Management Company, LLC from 2008 to 2010 and head of the Fund Reporting and Control Team within Fund Administration from 2005 to 2010. | ||
| 1 | Nancy Wiser acts as Treasurer of 64 funds in the Fund Complex. Jeremy DePalma acts as Treasurer of 85 funds and Assistant Treasurer of 64 funds in the Fund Complex. |
| 2 | The Statement of Additional Information includes additional information about the Trustees and is available, without charge, upon request, by calling1-800-222-8222 or by visiting the website at wfam.com. |
| 3 | Pamela Wheelock wasre-appointed to the Board effective January 1, 2020. |
Retail Money Market Funds | 33
Table of Contents
This page is intentionally left blank.
Table of Contents
This page is intentionally left blank.
Table of Contents
This page is intentionally left blank.
Table of Contents
For more information
More information about Wells Fargo Funds is available free upon request. To obtain literature, please write, visit the Fund’s website, or call:
Wells Fargo Funds
P.O. Box 219967
Kansas City, MO 64121-9967
Website:wfam.com
Individual investors:1-800-222-8222
Retail investment professionals:1-888-877-9275
Institutional investment professionals:1-866-765-0778

This report and the financial statements contained herein are submitted for the general information of the shareholders of the Fund. If this report is used for promotional purposes, distribution of the report must be accompanied or preceded by a current prospectus. Before investing, please consider the investment objectives, risks, charges, and expenses of the investment. For a current prospectus and, if available, a summary prospectus, containing this information, call1-800-260-5969 or visit the Fund’s website atwfam.com. Read the prospectus carefully before you invest or send money.
Wells Fargo Asset Management (WFAM) is the trade name for certain investment advisory/management firms owned by Wells Fargo & Company. These firms include but are not limited to Wells Capital Management Incorporated and Wells Fargo Funds Management, LLC. Certain products managed by WFAM entities are distributed by Wells Fargo Funds Distributor, LLC (a broker-dealer and Member FINRA).
This material is for general informational and educational purposes only and is NOT intended to provide investment advice or a recommendation of any kind—including a recommendation for any specific investment, strategy, or plan.
INVESTMENT PRODUCTS: NOT FDIC INSURED ◾ NO BANK GUARANTEE ◾ MAY LOSE VALUE
© 2020 Wells Fargo & Company. All rights reserved
PAR-0220-03774 03-20
A306/AR306 01-20
Table of Contents

Annual Report
January 31, 2020
Institutional Money Market Funds
| ∎ | Wells Fargo Municipal Cash Management Money Market Fund |
Beginning on January 1, 2021, as permitted by new regulations adopted by the Securities and Exchange Commission, paper copies of the Wells Fargo Funds’ annual and semi-annual shareholder reports issued after this date will no longer be sent by mail, unless you specifically request paper copies of the reports. Instead, the reports will be made available on the Funds’ website, and you will be notified by mail each time a report is posted and provided with a website address to access the report.
If you already elected to receive shareholder reports electronically, you will not be affected by this change and you need not take any action. You may elect to receive shareholder reports and other communications from the Fund electronically at any time by contacting your financial intermediary (such as a broker-dealer or bank) or, if you are a direct investor, by calling1-800-222-8222 or by enrolling at wellsfargo.com/advantagedelivery.
You may elect to receive all future reports in paper free of charge. If you invest through a financial intermediary, you can contact your financial intermediary to request that you continue to receive paper copies of your shareholder reports; if you invest directly with the Fund, you can call 1-800-222-8222. Your election to receive reports in paper will apply to all Wells Fargo Funds held in your account with your financial intermediary or, if you are a direct investor, to all Wells Fargo Funds that you hold.
Table of Contents
|
Reduce clutter. Save trees. |
Sign up for electronic delivery of prospectuses and shareholder reports atwellsfargo.com/advantagedelivery |
The views expressed and any forward-looking statements are as of January 31, 2020, unless otherwise noted, and are those of the Fund managers and/or Wells Fargo Asset Management. Discussions of individual securities, or the markets generally, or any Wells Fargo Fund are not intended as individual recommendations. Future events or results may vary significantly from those expressed in any forward-looking statements. The views expressed are subject to change at any time in response to changing circumstances in the market. Wells Fargo Asset Management and the Fund disclaim any obligation to publicly update or revise any views expressed or forward-looking statements.
INVESTMENT PRODUCTS: NOT FDIC INSURED ◾ NO BANK GUARANTEE ◾ MAY LOSE VALUE
Institutional Money Market Funds | 1
Table of Contents
Letter to shareholders (unaudited)

Andrew Owen
President
Wells Fargo Funds
Dear Shareholder:
We are pleased to offer you this annual report for the Wells Fargo Municipal Cash Management Money Market Fund for the 12-month period that ended January 31, 2020. Despite some periods of market volatility, the year was strongly positive for financial markets as supportive central banks more than offset concerns over slowing global economic growth and international trade tensions.
Overall, both fixed-income and equity investors enjoyed healthy annual returns, with U.S. markets leading the way. For the period, U.S. stocks, based on the S&P 500 Index,1 gained 21.68% and international stocks, as measured by the MSCI ACWI ex USA Index (Net),2 returned 9.94%. The MSCI EM Index (Net)3 gained a more modest 3.81%. For bond investors, the Bloomberg Barclays U.S. Aggregate Bond Index4 added 9.64%, the Bloomberg Barclays Global Aggregate ex-USD Index5 returned 3.95%, the Bloomberg Barclays Municipal Bond Index6 gained 8.65%, and the ICE BofA U.S. High Yield Index7 added 9.39%.
The year began with a strong market rebound.
Financial markets opened 2019 on a positive note, as investors were encouraged by the U.S. Federal Reserve (Fed) taking a more accommodative stance after a series of increases to the federal funds rate in 2017 and 2018. However, concerns over slowing global growth grew more ominous. Fourth-quarter 2018 gross domestic product (GDP), reported in February 2019, grew at an annualized 2.2% rate, down from the levels of the prior two quarters. The Bank of England forecast the slowest growth since the financial crisis for 2019. China and the U.S. continued to wrangle over trade issues. By the end of the first quarter of 2019, more accommodative Fed sentiment and steady, if not spectacular, U.S. economic and business metrics encouraged domestic investors.
Early second-quarter 2019 enthusiasm among investors faded.
During April, sustained low inflation, solid employment data, and first-quarter U.S. GDP of an annualized rate of 3.2% supported favorable sentiment. During May, however, markets tumbled on mixed investment signals. In the U.S., partisan political wrangling ramped up in advance of the 2020 election. The U.K.’s Brexit disagreements caused Prime Minister Theresa May to resign. Boris Johnson succeeded her, only to add to uncertainty about Brexit’s resolution ahead of an October 2019 deadline. The European Commission downgraded the 2019 growth forecast to 1.2%. The U.S. increased tariffs on
| 1 | The S&P 500 Index consists of 500 stocks chosen for market size, liquidity, and industry group representation. It is a market-value-weighted index with each stock’s weight in the index proportionate to its market value. You cannot invest directly in an index. |
| 2 | The Morgan Stanley Capital International (MSCI) All Country World Index (ACWI) ex USA Index (Net) is a free-float-adjusted market-capitalization-weighted index that is designed to measure the equity market performance of developed markets, excluding the United States. Source: MSCI. MSCI makes no express or implied warranties or representations and shall have no liability whatsoever with respect to any MSCI data contained herein. The MSCI data may not be further redistributed or used as a basis for other indices or any securities or financial products. This report is not approved, reviewed, or produced by MSCI. You cannot invest directly in an index. |
| 3 | The MSCI Emerging Markets (EM) Index (Net) is a free-float-adjusted market-capitalization-weighted index that is designed to measure equity market performance of emerging markets. You cannot invest directly in an index. |
| 4 | The Bloomberg Barclays U.S. Aggregate Bond Index is a broad-based benchmark that measures the investment-grade, U.S. dollar-denominated, fixed-rate taxable bond market, including Treasuries, government-related and corporate securities, mortgage-backed securities (agency fixed-rate and hybrid adjustable-rate mortgage pass-throughs), asset-backed securities, and commercial mortgage-backed securities. You cannot invest directly in an index. |
| 5 | The Bloomberg Barclays Global Aggregate ex-USD Index is an unmanaged index that provides a broad-based measure of the global investment-grade fixed-income markets excluding the U.S. dollar-denominated debt market. You cannot invest directly in an index. |
| 6 | The Bloomberg Barclays Municipal Bond Index is an unmanaged index composed of long-term tax-exempt bonds with a minimum credit rating of Baa. You cannot invest directly in an index. |
| 7 | The ICE BofA U.S. High Yield Index is a market-capitalization-weighted index of domestic and Yankee high-yield bonds. The index tracks the performance of high-yield securities traded in the U.S. bond market. You cannot invest directly in an index. Copyright 2020. ICE Data Indices, LLC. All rights reserved. |
2 | Institutional Money Market Funds
Table of Contents
Letter to shareholders (unaudited)
products from China, China responded, and then talks broke down. President Donald Trump threatened to turn his foreign policy tariff tool to Mexico over immigration issues.
Midway through the year, investors regrouped, sentiment turned positive, and U.S. equity markets advanced during June and July. The gains, primarily driven by geopolitical and monetary policy events, pushed equity markets to new highs. European Central Bank President Mario Draghi indicated the bank was ready to cut rates or buy more assets to prop up inflation if needed. President Trump backed off of tariff threats against Mexico and China. In the U.S., the Fed implemented a 0.25% federal funds rate cut in July.
Later in July, the U.S. reversed course and threatened to impose higher tariffs on China’s exports after talks failed. China responded with tariff threats of its own and devalued the renminbi, roiling global markets. Major U.S. stock market indices closed July with the worst weekly results of the year. Bond prices gained as Treasury yields fell to multiyear lows, and the yield curve inverted at multiple points along the 30-year arc.
In August, U.S.-China trade tensions continued with no signs of compromise. Evidence of a continued global economic slowdown mounted, and central banks in China, New Zealand, and Thailand cut interest rates. Industrial and manufacturing data declined in China, Canada, Japan, and Germany. Adding to global uncertainty, Italy’s prime minister resigned, many feared a crackdown in Hong Kong as protestors sustained their calls for reform, and Boris Johnson planned to suspend Parliament as Brexit’s deadline neared.
In the U.S., the Fed cut interest rates a second time in September. U.S. manufacturing data disappointed investors. The U.S. Congress announced it would pursue an impeachment investigation of President Trump. Meanwhile, the Brexit impasse showed no signs of resolution. Officials in China said that hitting the country’s economic growth goals for the year would be difficult considering the weight of tariffs and trade restrictions. Although the S&P 500 Index finished the third quarter with the best year-to-date returns in more than 20 years, concerns about future returns remained.
The fourth quarter started on a strong note, with U.S.-China trade tensions relaxing in October along with renewed optimism for a U.K. Brexit deal and positive macroeconomic data. The initial estimate of U.S. third-quarter GDP growth was a resilient 1.9% annualized rate, while the U.S. unemployment rate fell to a 50-year low of 3.5% in September. However, despite resilience among U.S. consumers, business confidence declined while manufacturing activity contracted. Concerned with a potential economic slowdown, the Fed lowered interest rates another quarter point in late October, its third rate cut in four months. This helped push the S&P 500 Index to a new all-time high, while emerging market equities rallied and global bonds declined overall, reflecting a broad pickup in risk appetite.
Equity markets continued to rally in November despite ongoing geopolitical risks. Hopes for a U.S.-China trade deal buoyed investor confidence. U.S. business sentiment improved slightly, and manufacturing and services activity picked up. Throughout the month, central bank actions were on hold. With that positive backdrop, developed market equities outpaced those in emerging markets, and U.S. stocks, as reflected by the S&P 500 Index, outperformed non-U.S. stocks overall. While consumer confidence and purchasing manager activity rose in the eurozone, China reported weakening manufacturing and consumer data. Bond yields rose marginally, leading to slightly negative returns for global government and investment-grade corporate bonds.
Financial markets ended 2019 on a broadly positive note, with the U.S. and China reaching an accord on a Phase One trade deal, with some details to be worked out. That, along with the landslide win by the pro-Brexit U.K. Conservative Party in a national election and ongoing central bank support, gave investors greater certainty and confidence. U.S. economic indicators were generally positive, with the exception of manufacturing activity and business confidence. However, consumer confidence was resilient, fed by a robust labor market, tame inflation, and lower interest rates, which boosted housing affordability and stimulated homebuyer activity. The impeachment of U.S. President Donald Trump,
“Midway through the year, investors regrouped, sentiment turned positive, and U.S. equity markets advanced.”
“Financial markets ended 2019 on a broadly positive note, with the U.S. and China reaching an accord on a Phase One trade deal.”
Institutional Money Market Funds | 3
Table of Contents
Letter to shareholders (unaudited)
while historically noteworthy, had little impact on markets. Meanwhile, slowing Chinese economic activity, partly attributable to the trade war, led to further government stimulus at year-end through lower reserve ratios, allowing banks to lend more money.
The year-end rally continued in early January 2020. However, capital market volatility picked up in late January on concerns over the unknown impact of the coronavirus on the global economy and stock markets. With sentiment somewhat souring, perceived safe havens did well in January. The U.S. dollar and Japanese yen both rose and government bonds outperformed equities. While the S&P 500 Index held its ground, emerging market equities tumbled, including those in Asia, that are most exposed to viruses—physical or economic—originating in China.
Following the end of the reporting period, the coronavirus continued its global spread, resulting in disruptions to global markets, including through border closings, restrictions on travel and large gatherings, expedited and enhanced health screenings, quarantines, cancellations, business and school closings, disruptions to employment and supply chains, reduced productivity, and reduced customer and client activity in multiple markets and sectors. The risk of further spreading of the coronavirus has led to significant uncertainty and volatility in the financial markets. The full extent of the coronavirus’s impact on the global economy cannot necessarily be foreseen and the impacts may be short term or may last for an extended period of time.
Don’t let short-term uncertainty derail long-term investment goals.
Periods of investment uncertainty can present challenges, but experience has taught us that maintaining long-term investment goals can be an effective way to plan for the future. To help you create a sound strategy based on your personal goals and risk tolerance, Wells Fargo Funds offers more than 100 mutual funds spanning a wide range of asset classes and investment styles. Although diversification cannot guarantee an investment profit or prevent losses, we believe it can be an effective way to manage investment risk and potentially smooth out overall portfolio performance. We encourage investors to know their investments and to understand that appropriate levels of risk-taking may unlock opportunities.
Thank you for choosing to invest with Wells Fargo Funds. We appreciate your confidence in us and remain committed to helping you meet your financial needs.
Sincerely,

Andrew Owen
President
Wells Fargo Funds
|
For further information about your Fund, contact your investment professional, visit our website atwfam.com, or call us directly at1-800-222-8222. |
4 | Institutional Money Market Funds
Table of Contents
This page is intentionally left blank.
Table of Contents
Performance highlights (unaudited)
Investment objective
The Fund seeks current income exempt from regular federal income tax, while preserving capital and liquidity.
Manager
Wells Fargo Funds Management, LLC
Subadviser
Wells Capital Management Incorporated
Portfolio managers
James Randazzo
Jeffrey L. Weaver, CFA®‡
Average annual total returns (%) as of January 31, 20201
| Expense ratios2 (%) | ||||||||||||||||||||||
| Inception date | 1 year | 5 year | 10 year | Gross | Net3 | |||||||||||||||||
| Administrator Class (WUCXX)4 | 7-9-2010 | 1.29 | 0.73 | 0.39 | 0.43 | 0.30 | ||||||||||||||||
| Institutional Class (EMMXX) | 11-20-1996 | 1.38 | 0.81 | 0.44 | 0.31 | 0.20 | ||||||||||||||||
| Service Class (EISXX) | 11-25-1996 | 1.12 | 0.61 | 0.32 | 0.60 | 0.45 | ||||||||||||||||
Yield summary (%) as of January 31, 20203
| Administrator Class | Institutional Class | Service Class | ||||||||
| 7-day current yield | 0.70 | 0.80 | 0.55 | |||||||
| 7-day compound yield | 0.70 | 0.80 | 0.55 | |||||||
| 30-day simple yield | 0.71 | 0.81 | 0.56 | |||||||
| 30-day compound yield | 0.71 | 0.81 | 0.56 | |||||||
Figures quoted represent past performance, which is no guarantee of future results, and do not reflect taxes that a shareholder may pay on an investment in a fund. Investment returns will fluctuate. The Fund’s yield figures more closely reflect the current earnings of the Fund than the total return figures. Current performance may be lower or higher than the performance data quoted, which assumes the reinvestment of dividends and capital gains. Currentmonth-end performance is available on the Fund’s website,wfam.com.
Money market funds are sold without a front-end sales charge or contingent deferred sales charge. Other fees and expenses apply to an investment in the Fund and are described in the Fund’s current prospectus.
For floating NAV money market funds: You could lose money by investing in the Fund. Because the share price of the Fund will fluctuate, when you sell your shares they may be worth more or less than what you originally paid for them. The Fund may impose a fee upon sale of your shares or may temporarily suspend your ability to sell shares if the Fund’s liquidity falls below required minimums because of market conditions or other factors. An investment in the Fund is not insured or guaranteed by the Federal Deposit Insurance Corporation or any other government agency. The Fund’s sponsor has no legal obligation to provide financial support to the Fund, and you should not expect that the sponsor will provide financial support to the Fund at any time.
Please see footnotes on page 7.
6 | Institutional Money Market Funds
Table of Contents
Performance highlights (unaudited)
| Revenue source as of January 31, 20205 |
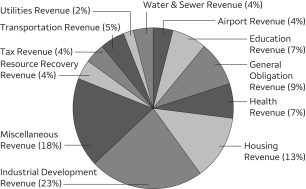 |
| Effective maturity distribution as of January 31, 20205 |
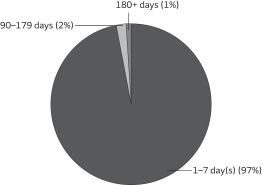 |
| Weighted average maturity as of January 31, 20206 |
10 days |
| Weighted average life as of January 31, 20207 |
11 days |
| ‡ | CFA® and Chartered Financial Analyst®are trademarks owned by CFA Institute. |
| 1 | Historical performance shown prior to July 12, 2010, is based on the performance of the Fund’s predecessor, Evergreen Institutional Municipal Money Market Fund. |
| 2 | Reflects the expense ratios as stated in the most recent prospectuses. The expense ratios shown are subject to change and may differ from the annualized expense ratios shown in the financial highlights of this report. |
| 3 | The manager has contractually committed through May 31, 2020, to waive fees and/or reimburse expenses to the extent necessary to cap total annual fund operating expenses after fee waivers at 0.30% for Administrator Class, 0.20% for Institutional Class, and 0.45% for Service Class. Brokerage commissions, stamp duty fees, interest, taxes, acquired fund fees and expenses (if any), and extraordinary expenses are excluded from the expense cap. Prior to or after the commitment expiration date, the cap may be increased or the commitment to maintain the cap may be terminated only with the approval of the Board of Trustees. Without this cap, the Fund’s returns would have been lower. Without waived fees and/or reimbursed expenses, the Fund’s7-day current yield would have been 0.57%, 0.69%, and 0.40% for Administrator Class, Institutional Class, and Service Class, respectively. The expense ratio paid by an investor is the net expense ratio (the total annual fund operating expenses after fee waivers) as stated in the prospectuses. |
| 4 | Historical performance shown for the Administrator Class shares prior to their inception reflects the performance of the Institutional Class shares, and has not been adjusted to include the higher expenses applicable to Administrator Class shares. If these expenses had been included, returns for Administrator Class shares would be lower. |
| 5 | Amounts are calculated based on the total investments of the Fund. These amounts are subject to change and may have changed since the date specified. |
| 6 | Weighted Average Maturity (WAM): WAM is an average of the effective maturities of all securities held in the portfolio, weighted by each security’s percentage of total investments. The maturity of a portfolio security is the period remaining until the date on which the principal amount is unconditionally required to be paid, or in the case of a security called for redemption, the date on which the redemption payment is unconditionally required to be made. WAM calculations allow for the maturities of certain securities with demand features or periodic interest rate resets to be shortened. WAM is a way to measure a fund’s sensitivity to potential interest rate changes. WAM is subject to change and may have changed since the date specified. |
| 7 | Weighted Average Life (WAL): WAL is an average of the final maturities of all securities held in the portfolio, weighted by their percentage of total investments. The maturity of a portfolio security is the period remaining until the date on which the principal amount is unconditionally required to be paid, or in the case of a security called for redemption, the date on which the redemption payment is unconditionally required to be made. In contrast to WAM, the calculation of WAL allows for the maturities of certain securities with demand features to be shortened, but not the periodic interest rate resets. WAL is a way to measure a fund’s potential sensitivity to credit spread changes. WAL is subject to change and may have changed since the date specified. |
| 8 | The Securities Industry and Financial Markets Association (SIFMA) Municipal Swap Index (SIFMA Index) is aseven-day high-grade market index composed oftax-exempt variable-rate demand obligations with certain characteristics. The index is calculated and published by Bloomberg. The index is overseen by SIFMA’s Municipal Swap Index Committee. You cannot invest directly in an index. |
Institutional Money Market Funds | 7
Table of Contents
Performance highlights (unaudited)
MANAGER’S DISCUSSION
During the period, the municipal money market space continued to be heavily influenced by a combination of macroeconomic factors, the lingering effects of 2017 tax reform, and typical seasonality. Municipal money market rates generally tracked taxable equivalent rates lower as the U.S. Federal Reserve (Fed) embarked on an easing policy highlighted by three cuts to the federal funds rate in the months of July, September, and October. The municipal market in general has also been affected by the tremendous shift in investor appetite fortax-advantaged municipals following the tax reform legislation implemented at the end of 2017. Longer-dated municipal bond funds experienced record-setting inflows as investor demand shifted further out on the curve. Conversely, municipal money market funds experienced roughly $6 billion in outflows throughout the year as ratios oftax-exempt to taxable investments experienced significant pressure due to continuing supply and demand imbalances.
In the short end of the municipal money market sector, the SIFMA Index8 began the period at 1.43%, or 59% of1-week London Interbank Offered Rate (LIBOR), down from 1.71%, or 71% of1-week LIBOR, at the end of 2018. Short-term yields began to quickly grind lower as seasonal cash inflows reinvigorated demand for overnight and weekly variable-rate demand notes (VRDNs) and tender option bonds (TOBs). Throughout the period, the supply/demand dynamic for VRDNs and TOBs experienced typical seasonal swings. For example, during tax time, the SIFMA Index spiked to a multi-year high of 2.30% (95% of1-week LIBOR) on April 24. The SIFMA Index would experience other patches of weakness around quarter-ends, in sympathy with taxable equivalents. For example, the SIFMA Index spiked from 1.40% at the beginning of June to 1.90% byquarter-end. Similarly, the index spiked to 1.58% at the end of September, up from 1.28% at the beginning of the month. Although absolute levels slowly drifted lower as the Federal Open Market Committee (FOMC) continued to cut rates during the fall, atyear-end, the SIFMA Index would spike to 1.61%, or 99% of1-week LIBOR, up from 1.06% at the beginning of the month, due toyear-end pressures.
Further out on the curve, municipal money markets were generally immune to the volatility experienced in the overnight and weekly sectors. Demand for high-grade paper in theone-year area remained consistently strong throughout the period. Yields on high-grade paper in theone-year space began the period at roughly 1.74% but drifted lower as the year progressed. By late June,one-year paper had fallen to a low of approximately 1.30% as note season came into full effect. In August, the state of Texas issued $8 billion in tax and revenue anticipation notes in the 1.25%–1.32% range. The largest deal of the period was priced to attract both money market funds and longer-term investors. After the three rate cuts by the Fed, market participants began to price in the prospects of an FOMC on hold. Accordingly,one-year yields stabilized and closed out the period at roughly 0.95%, driven primarily by strong inflows into municipal fixed-income funds.
Strategic outlook
At the close of the reporting period, we were focused on a few unresolved items that could influence markets for the remainder of the calendar year, namely Brexit; trade issues and tariffs; the conclusion or continuation of temporary Fed liquidity operations, Fed Treasury bill purchases, and other quantitative easing measures; and finally, the election. With the Fed appearing to be on hold for now, credit fundamentals continue to be supportive and the yield curve is slightly positively sloped.
However, just as the fiscal year ended, in February and March 2020, the coronavirus began to spread globally, prompting consumers, businesses, and governments to take unusually strong actions in an attempt to limit its impact. In so doing, it appears that there could be a serious toll on the U.S. and global economy. In the face of this uncertainty, equity and bond markets experienced sharp outflows, and short term markets, especially government markets, experienced a high degree of inflows. With liquidity at a premium, volatility flowed through to the short end of the credit markets, prompting a series of supportive actions by the Fed. In the face of all this, we continue to believe that our investment strategy, with its focus on capital preservation and liquidity, is as important as ever.
Please see footnotes on page 7.
8 | Institutional Money Market Funds
Table of Contents
As a shareholder of the Fund, you incur ongoing costs, including management fees, shareholder servicing fees, and other Fund expenses. This example is intended to help you understand your ongoing costs (in dollars) of investing in the Fund and to compare these costs with the ongoing costs of investing in other mutual funds.
The example is based on an investment of $1,000 invested at the beginning of thesix-month period and held for the entire period from August 1, 2019 to January 31, 2020.
Actual expenses
The “Actual” line of the table below provides information about actual account values and actual expenses. You may use the information in this line, together with the amount you invested, to estimate the expenses that you paid over the period. Simply divide your account value by $1,000 (for example, an $8,600 account value divided by $1,000 = 8.6), then multiply the result by the number in the “Actual” line under the heading entitled “Expenses paid during period” for your applicable class of shares to estimate the expenses you paid on your account during this period.
Hypothetical example for comparison purposes
The “Hypothetical” line of the table below provides information about hypothetical account values and hypothetical expenses based on the Fund’s actual expense ratio and an assumed rate of return of 5% per year before expenses, which is not the Fund’s actual return. The hypothetical account values and expenses may not be used to estimate the actual ending account balance or expenses you paid for the period. You may use this information to compare the ongoing costs of investing in the Fund and other funds. To do so, compare this 5% hypothetical example with the 5% hypothetical examples that appear in the shareholder reports of the other funds.
Please note that the expenses shown in the table are meant to highlight your ongoing costs only. Therefore, the “Hypothetical” line of the table is useful in comparing ongoing costs only and will not help you determine the relative total costs of owning different funds.
| Beginning account value 8-1-2019 | Ending account value 1-31-2020 | Expenses paid during the period1 | Annualized net expense ratio | |||||||||||||
Administrator Class | ||||||||||||||||
Actual | $ | 1,000.00 | $ | 1,005.38 | $ | 1.51 | 0.30 | % | ||||||||
Hypothetical (5% return before expenses) | $ | 1,000.00 | $ | 1,023.63 | $ | 1.53 | 0.30 | % | ||||||||
Institutional Class | ||||||||||||||||
Actual | $ | 1,000.00 | $ | 1,005.89 | $ | 1.01 | 0.20 | % | ||||||||
Hypothetical (5% return before expenses) | $ | 1,000.00 | $ | 1,024.13 | $ | 1.02 | 0.20 | % | ||||||||
Service Class | ||||||||||||||||
Actual | $ | 1,000.00 | $ | 1,004.52 | $ | 2.27 | 0.45 | % | ||||||||
Hypothetical (5% return before expenses) | $ | 1,000.00 | $ | 1,022.87 | $ | 2.29 | 0.45 | % | ||||||||
| 1 | Expenses paid is equal to the annualized net expense ratio of each class multiplied by the average account value over the period, multiplied by the number of days in the most recent fiscal half-year divided by the number of days in the fiscal year (to reflect theone-half-year period). |
Institutional Money Market Funds | 9
Table of Contents
Portfolio of investments—January 31, 2020
| Interest rate | Maturity date | Principal | Value | |||||||||||||
| Municipal Obligations: 89.08% |
| |||||||||||||||
Arizona: 3.08% |
| |||||||||||||||
| Variable Rate Demand Notes ø: 3.08% | ||||||||||||||||
Maricopa County AZ IDA Solid Waste Disposal Series 2006 (Resource Recovery Revenue, Farm Credit Services America LOC) | 1.02 | % | 8-1-2026 | $ | 2,500,000 | $ | 2,500,000 | |||||||||
Pinal County AZ IDA Shamrock Farms Project (Resource Recovery Revenue, Farm Credit Services America LOC) | 1.03 | 8-1-2022 | 3,700,000 | 3,700,000 | ||||||||||||
Pinal County AZ IDA Solid Waste Disposal Feenstra Investments LLC Project Series 2002 (Resource Recovery Revenue, Farm Credit Services America LOC) | 1.03 | 8-1-2027 | 1,250,000 | 1,250,000 | ||||||||||||
| 7,450,000 | ||||||||||||||||
|
| |||||||||||||||
California: 4.47% |
| |||||||||||||||
| Variable Rate Demand Notes ø: 4.47% | ||||||||||||||||
California Tender Option Bond Trust Receipts/Floater Certificates Series 2018-ZM0642 (Airport Revenue, JPMorgan Chase & Company LIQ) 144A | 1.19 | 5-1-2024 | 4,360,000 | 4,360,000 | ||||||||||||
California Tender Option Bond Trust Receipts/Floater Certificates Series 2019-XF2835 (Education Revenue, Mizuho Capital Markets LLC LOC, Mizuho Capital Markets LLC LIQ) 144A | 1.09 | 7-1-2042 | 3,000,000 | 3,000,000 | ||||||||||||
Mizuho Floater/Residual Interest Bond Series 2019-MIZ9007 (Housing Revenue, Mizuho Capital Markets LLC LOC, Mizuho Capital Markets LLC LIQ) 144A | 1.19 | 1-1-2040 | 3,000,000 | 3,000,000 | ||||||||||||
Modesto CA MFHR Live Oak Apartments Project (Tax Revenue, FNMA Insured, FNMA LIQ) | 1.01 | 9-15-2024 | 440,000 | 440,000 | ||||||||||||
| 10,800,000 | ||||||||||||||||
|
| |||||||||||||||
Colorado: 0.12% |
| |||||||||||||||
| Variable Rate Demand Note ø: 0.12% | ||||||||||||||||
Town of Hudson CO Series A (Industrial Development Revenue, U.S. Bank NA LOC) | 1.00 | 11-1-2020 | 300,000 | 300,000 | ||||||||||||
|
| |||||||||||||||
Florida: 0.21% |
| |||||||||||||||
| Variable Rate Demand Note ø: 0.21% | ||||||||||||||||
Florida Tender Option Bond Trust Receipts/Floater Certificates Series 2017-ZM0571 (Health Revenue, Morgan Stanley Bank LIQ) 144A | 1.04 | 8-15-2047 | 500,000 | 500,000 | ||||||||||||
|
| |||||||||||||||
Georgia: 2.18% |
| |||||||||||||||
| Variable Rate Demand Note ø: 2.18% | ||||||||||||||||
Georgia Tender Option Bond Trust Receipts/Certificates Series 2019-XM0766 (Health Revenue, Barclays Bank plc LIQ) 144A | 0.97 | 7-1-2049 | 5,260,000 | 5,260,000 | ||||||||||||
|
| |||||||||||||||
Illinois: 7.36% |
| |||||||||||||||
| Variable Rate Demand Notes ø: 7.36% | ||||||||||||||||
Chicago IL Enterprise Zone Gardner Gibson Project (Industrial Development Revenue, BMO Harris Bank NA LOC) | 1.08 | 7-1-2033 | 1,780,000 | 1,780,000 | ||||||||||||
Illinois Tender Option Bond Trust Receipts/Floater Certificates Series 2017-XG0108 (Tax Revenue, Barclays Bank plc LOC, Barclays Bank plc LIQ) 144A | 1.09 | 4-1-2046 | 7,000,000 | 7,000,000 | ||||||||||||
Lake County IL MFHR (Housing Revenue, FHLMC LIQ) | 1.06 | 11-1-2034 | 4,725,000 | 4,725,000 | ||||||||||||
Peoria County IL Caterpillar Incorporated Project (Industrial Development Revenue, Caterpillar Incorporated LOC) | 1.09 | 2-1-2030 | 4,300,000 | 4,300,000 | ||||||||||||
| 17,805,000 | ||||||||||||||||
|
| |||||||||||||||
The accompanying notes are an integral part of these financial statements.
10 | Institutional Money Market Funds
Table of Contents
Portfolio of investments—January 31, 2020
| Interest rate | Maturity date | Principal | Value | |||||||||||||
| Indiana: 3.33% | ||||||||||||||||
| Variable Rate Demand Notes ø: 3.33% | ||||||||||||||||
Indiana Certificate of Participation ClipperTax-Exempt Certificate Trust Series2009-34 (Miscellaneous Revenue, State Street Bank & Trust Company LIQ) | 0.98 | % | 7-1-2023 | $ | 1,380,000 | $ | 1,380,000 | |||||||||
Indiana Tender Option Bond Trust Receipts/Certificates Series 2019-XF0756 (Miscellaneous Revenue, Bank of America NA LIQ) 144A | 1.02 | 2-1-2049 | 1,875,000 | 1,875,000 | ||||||||||||
Jeffersonville IN Economic Development Eagle Steel Products Incorporated Project (Industrial Development Revenue, Bank of America NA LOC) | 1.12 | 12-1-2027 | 2,540,000 | 2,540,000 | ||||||||||||
Noblesville IN Greystone Apartments Project Series B (Housing Revenue, FHLB LOC) | 1.00 | 3-1-2041 | 1,350,000 | 1,350,000 | ||||||||||||
St. Joseph County IN Midcorr Land Development LLC Project (Industrial Development Revenue, PNC Bank NA LOC) | 0.97 | 10-1-2023 | 910,000 | 910,000 | ||||||||||||
| 8,055,000 | ||||||||||||||||
|
| |||||||||||||||
Iowa: 3.46% |
| |||||||||||||||
| Variable Rate Demand Notes ø: 3.46% | ||||||||||||||||
Iowa Finance Authority John Maassen & Sons Project (Industrial Development Revenue, Farm Credit Services America LOC) | 1.10 | 11-1-2035 | 2,075,000 | 2,075,000 | ||||||||||||
Iowa Finance Authority Midwestern EDA CJ Bio America Incorporated Project (Industrial Development Revenue, Korea Development Bank LOC) | 1.17 | 4-1-2022 | 6,300,000 | 6,300,000 | ||||||||||||
| 8,375,000 | ||||||||||||||||
|
| |||||||||||||||
Kansas: 0.13% |
| |||||||||||||||
| Variable Rate Demand Note ø: 0.13% | ||||||||||||||||
Nemaha County KS Midwest AG Services LLC Project (Industrial Development Revenue, CoBank ACB LOC) | 1.08 | 11-1-2020 | 315,000 | 315,000 | ||||||||||||
|
| |||||||||||||||
Kentucky: 4.49% |
| |||||||||||||||
| Variable Rate Demand Notes ø: 4.49% | ||||||||||||||||
Jefferson County KY Industrial Building Dant Growth LLC Project Series 2002 (Industrial Development Revenue, Stock Yards Bank & Trust LOC) | 0.97 | 9-1-2022 | 850,000 | 850,000 | ||||||||||||
Louisville & Jefferson Counties KY Regional Airport Authority UPS Worldwide Forwarding Series B (Industrial Development Revenue) | 1.35 | 1-1-2029 | 10,000,000 | 10,000,000 | ||||||||||||
| 10,850,000 | ||||||||||||||||
|
| |||||||||||||||
Louisiana: 2.90% |
| |||||||||||||||
| Variable Rate Demand Notes ø: 2.90% | ||||||||||||||||
Louisiana Local Government Environmental Facilities CDA Honeywell International Incorporated Project (Industrial Development Revenue, Honeywell International Incorporated LOC) | 1.08 | 12-1-2036 | 4,000,000 | 4,000,000 | ||||||||||||
Louisiana Tender Option Bond Trust Receipts/Floater Certificates Series 2019-XM0735 (Water & Sewer Revenue, Bank of America NA LOC, Bank of America NA LIQ) 144A | 0.99 | 12-1-2045 | 3,000,000 | 3,000,000 | ||||||||||||
| 7,000,000 | ||||||||||||||||
|
| |||||||||||||||
Michigan: 6.14% |
| |||||||||||||||
| Variable Rate Demand Notes ø: 6.14% | ||||||||||||||||
Michigan Housing Development Authority Series A (Housing Revenue, JPMorgan Chase & Company SPA) | 1.33 | 10-1-2037 | 9,000,000 | 9,000,000 | ||||||||||||
Michigan Tender Option Bond Trust Receipts/Certificates Series 2018-ZM0614 (Education Revenue, Morgan Stanley Bank LIQ) 144A | 1.12 | 11-1-2028 | 5,835,000 | 5,835,000 | ||||||||||||
| 14,835,000 | ||||||||||||||||
|
| |||||||||||||||
The accompanying notes are an integral part of these financial statements.
Institutional Money Market Funds | 11
Table of Contents
Portfolio of investments—January 31, 2020
| Interest rate | Maturity date | Principal | Value | |||||||||||||
| Minnesota: 5.33% | ||||||||||||||||
| Variable Rate Demand Notes ø: 5.33% | ||||||||||||||||
Forest Lake MN Kilkenny Court Apartments Project Series 2008 (Housing Revenue, FNMA LOC, FNMA LIQ) | 1.03 | % | 8-15-2038 | $ | 735,000 | $ | 735,000 | |||||||||
JPMorgan Chase PuttableTax-Exempt Receipts/Derivative InverseTax-Exempt Receipts Trust Series 5027 (GO Revenue, JPMorgan Chase & Company LIQ) 144A | 1.24 | 6-1-2021 | 5,000,000 | 5,000,000 | ||||||||||||
Minnesota Tender Option Bond Trust Receipts/Certificates Series 2018-XF2760 (Education Revenue, Morgan Stanley Bank LIQ) 144A | 1.04 | 11-1-2037 | 7,140,000 | 7,140,000 | ||||||||||||
| 12,875,000 | ||||||||||||||||
|
| |||||||||||||||
Missouri: 3.96% |
| |||||||||||||||
| Variable Rate Demand Notes ø: 3.96% | ||||||||||||||||
Missouri Development Finance Board Nelson Gallery Foundation Series A (Miscellaneous Revenue, Northern Trust Company SPA) | 1.15 | 12-1-2033 | 6,500,000 | 6,500,000 | ||||||||||||
Missouri Tender Option Bond Trust Receipts/Floater Certificates Series 2018-XG0176 (Health Revenue, Royal Bank of Canada LIQ) 144A | 1.04 | 5-15-2041 | 1,895,000 | 1,895,000 | ||||||||||||
St. Charles County MO IDA Kuenz Heating & Sheet Metal Series 2001 (Industrial Development Revenue, U.S. Bank NA LOC) | 1.16 | 4-1-2026 | 1,170,000 | 1,170,000 | ||||||||||||
| 9,565,000 | ||||||||||||||||
|
| |||||||||||||||
Nevada: 1.38% |
| |||||||||||||||
| Variable Rate Demand Note ø: 1.38% | ||||||||||||||||
Nevada Tender Option Bond Trust Receipts/Certificates Series 2018-ZM0634 (GO Revenue, Royal Bank of Canada LIQ) 144A | 0.97 | 12-1-2025 | 3,330,000 | 3,330,000 | ||||||||||||
|
| |||||||||||||||
New Jersey: 0.85% |
| |||||||||||||||
| Variable Rate Demand Note ø: 0.85% | ||||||||||||||||
New Jersey Tender Option Bond Trust Receipts/Floater Certificates Series 2019-XG0258 (Tax Revenue, Barclays Bank plc LOC, Barclays Bank plc LIQ) 144A | 0.97 | 6-15-2050 | 2,055,000 | 2,055,000 | ||||||||||||
|
| |||||||||||||||
New York: 8.69% |
| |||||||||||||||
| Other Municipal Debt: 2.07% | ||||||||||||||||
Westchester County NY Tax Anticipation Notes (GO Revenue) | 1.50 | 5-27-2020 | 5,000,000 | 5,006,897 | ||||||||||||
|
| |||||||||||||||
| Variable Rate Demand Notes ø: 6.62% | ||||||||||||||||
New York Metropolitan Transportation Authority Revenue Bond Subordinate Series2012A-2 (Transportation Revenue, Bank of Montreal LOC) | 0.98 | 11-15-2041 | 11,000,000 | 11,000,000 | ||||||||||||
New York NY Municipal Water Finance Authority Series2008-BB-2 (Water & Sewer Revenue, Bank of America NA SPA) | 1.18 | 6-15-2035 | 5,000,000 | 5,000,000 | ||||||||||||
| 16,000,000 | ||||||||||||||||
|
| |||||||||||||||
North Carolina: 2.11% |
| |||||||||||||||
| Variable Rate Demand Notes ø: 2.11% | ||||||||||||||||
North Carolina Tender Option Bond Trust Receipts/Floater Certificates Series 2017-ZF2490 (Airport Revenue, Barclays Bank plc LIQ) 144A | 0.97 | 7-1-2042 | 3,750,000 | 3,750,000 | ||||||||||||
Rockingham County NC Industrial Facilities & PCFA Innofa USA Project Series 2007 (Industrial Development Revenue, Branch Banking & Trust LOC) | 0.98 | 1-1-2027 | 1,350,000 | 1,350,000 | ||||||||||||
| 5,100,000 | ||||||||||||||||
|
| |||||||||||||||
The accompanying notes are an integral part of these financial statements.
12 | Institutional Money Market Funds
Table of Contents
Portfolio of investments—January 31, 2020
| Interest rate | Maturity date | Principal | Value | |||||||||||||
| North Dakota: 0.25% | ||||||||||||||||
| Variable Rate Demand Note ø: 0.25% | ||||||||||||||||
Mandan ND IDA Cloverdale Foods Company Project (Industrial Development Revenue, BNC National Bank LOC) | 1.35 | % | 12-1-2022 | $ | 605,000 | $ | 605,000 | |||||||||
|
| |||||||||||||||
Ohio: 3.48% |
| |||||||||||||||
| Other Municipal Debt: 0.50% | ||||||||||||||||
Finneytown OH Local School District BAN (GO Revenue) | 2.25 | 4-15-2020 | 200,000 | 200,426 | ||||||||||||
Sycamore OH Community School District BAN (GO Revenue) | 2.25 | 4-15-2020 | 1,000,000 | 1,002,180 | ||||||||||||
| 1,202,606 | ||||||||||||||||
|
| |||||||||||||||
| Variable Rate Demand Notes ø: 2.98% | ||||||||||||||||
Mizuho Floater/Residual Trust Various States Series 2019-MIZ9001 (Housing Revenue, Mizuho Capital Markets LLC LOC, Mizuho Capital Markets LLC LIQ) 144A | 1.14 | 1-1-2032 | 1,000,000 | 1,000,000 | ||||||||||||
Ohio Capital Facilities Lease Adult Correctional Building Fund Series C (Miscellaneous Revenue) | 1.11 | 10-1-2036 | 4,200,000 | 4,200,000 | ||||||||||||
RBC Municipal Products Incorporated Trust SeriesE-110 (Water & Sewer Revenue, Royal Bank of Canada LOC, Royal Bank of Canada LIQ) 144A | 0.97 | 10-1-2020 | 2,000,000 | 2,000,000 | ||||||||||||
| 7,200,000 | ||||||||||||||||
|
| |||||||||||||||
Oregon: 0.12% |
| |||||||||||||||
| Variable Rate Demand Note ø: 0.12% | ||||||||||||||||
Portland OR Portland International Airport Series18-A (Airport Revenue, Bank of China LOC) | 1.10 | 7-1-2026 | 300,000 | 300,000 | ||||||||||||
|
| |||||||||||||||
Other: 0.86% |
| |||||||||||||||
| Variable Rate Demand Note ø: 0.86% | ||||||||||||||||
FHLMC MFHR SeriesM-031 Class A (Housing Revenue, FHLMC LIQ) | 0.97 | 12-15-2045 | 2,085,000 | 2,085,000 | ||||||||||||
|
| |||||||||||||||
Pennsylvania: 0.16% |
| |||||||||||||||
| Variable Rate Demand Note ø: 0.16% | ||||||||||||||||
Pennsylvania EDFA SeriesD-7 (Industrial Development Revenue, PNC Bank NA LOC) | 0.97 | 8-1-2022 | 400,000 | 400,000 | ||||||||||||
|
| |||||||||||||||
South Carolina: 0.83% |
| |||||||||||||||
| Variable Rate Demand Note ø: 0.83% | ||||||||||||||||
South Carolina Tender Option Bond Trust Receipts/Floater Certificates Patriots Energy Group Financing Agency Series 2018-XM0690 (Utilities Revenue, Royal Bank of Canada LIQ) 144A | 0.98 | 10-1-2022 | 2,000,000 | 2,000,000 | ||||||||||||
|
| |||||||||||||||
Tennessee: 5.38% |
| |||||||||||||||
| Variable Rate Demand Notes ø: 5.38% | ||||||||||||||||
Blount County TN Public Building Authority Various Local Govenment Public Improvements Series (Miscellaneous Revenue, Bank of America NA SPA) | 1.15 | 6-1-2034 | 6,500,000 | 6,500,000 | ||||||||||||
Shelby County TN Health Educational & Housing Facilities Board Methodist Le Bonheur Series B (Health Revenue, AGM Insured, U.S. Bank NA SPA) | 1.15 | 6-1-2042 | 6,500,000 | 6,500,000 | ||||||||||||
| 13,000,000 | ||||||||||||||||
|
| |||||||||||||||
Texas: 6.04% |
| |||||||||||||||
| Other Municipal Debt: 0.75% | ||||||||||||||||
Texas Tax Revenue Anticipation Notes (GO Revenue) | 4.00 | 8-27-2020 | 1,795,000 | 1,825,960 | ||||||||||||
|
| |||||||||||||||
The accompanying notes are an integral part of these financial statements.
Institutional Money Market Funds | 13
Table of Contents
Portfolio of investments—January 31, 2020
| Interest rate | Maturity date | Principal | Value | |||||||||||||
| Variable Rate Demand Notes ø: 5.29% | ||||||||||||||||
Brazos County TX Health Facilities Tender Option Bond Trust Receipts/Floater Certificates Series 2019-BAML5021 (Health Revenue, Bank of America NA LOC, Bank of America NA LIQ) 144A | 1.07 | % | 1-1-2028 | $ | 3,595,000 | $ | 3,595,000 | |||||||||
Brazos Harbor TX Industrial Development Corporation (Industrial Development Revenue, BASF SE LOC) | 1.01 | 10-1-2036 | 5,000,000 | 5,000,000 | ||||||||||||
Dallam County TX Industrial Development Corporation Dalhart Jersey Ranch Incorporated Series 2008 (Resource Recovery Revenue, CoBank ACB LOC) | 1.10 | 8-1-2039 | 1,185,000 | 1,185,000 | ||||||||||||
Port Arthur TX Navigation District Jefferson County Total Petrochemicals USA Incorporated Project Series2003-C (Industrial Development Revenue, Total SA LOC) | 0.98 | 4-1-2027 | 3,000,000 | 3,000,000 | ||||||||||||
| 12,780,000 | ||||||||||||||||
|
| |||||||||||||||
Utah: 0.94% |
| |||||||||||||||
| Variable Rate Demand Note ø: 0.94% | ||||||||||||||||
RBC Municipal Products Incorporated Trust SeriesE-142 (Utilities Revenue, Royal Bank of Canada LOC, Royal Bank of Canada LIQ) 144A | 0.97 | 5-1-2022 | 2,280,000 | 2,280,000 | ||||||||||||
|
| |||||||||||||||
Virginia: 0.35% |
| |||||||||||||||
| Variable Rate Demand Note ø: 0.35% | ||||||||||||||||
Chesterfield County VA IDA Super Radiator Coils Project Series A (Industrial Development Revenue, BMO Harris Bank NA LOC) | 1.03 | 4-1-2026 | 850,000 | 850,000 | ||||||||||||
|
| |||||||||||||||
Washington: 0.94% | ||||||||||||||||
| Variable Rate Demand Notes ø: 0.94% | ||||||||||||||||
Washington Finance Authority Smith Brothers Farms Incorporated Series 2001 (Industrial Development Revenue, Northwest Farm Credit LOC) | 1.10 | 9-1-2021 | 1,715,000 | 1,715,000 | ||||||||||||
Yakima County WA Solid Waste Disposal George Deruyter & Son Project Series 2006 (Resource Recovery Revenue, Northwest Farm Credit LOC) | 1.10 | 8-1-2026 | 565,000 | 565,000 | ||||||||||||
| 2,280,000 | ||||||||||||||||
|
| |||||||||||||||
West Virginia: 1.12% | ||||||||||||||||
| Variable Rate Demand Note ø: 1.12% | ||||||||||||||||
West Virginia EDA Collins Hardwood Company LLC (Industrial Development Revenue, American AgCredit LOC) | 1.03 | 10-1-2031 | 2,700,000 | 2,700,000 | ||||||||||||
|
| |||||||||||||||
Wisconsin: 7.18% | ||||||||||||||||
| Variable Rate Demand Notes ø: 7.18% | ||||||||||||||||
Appleton WI Recovery Zone Facilities Foremost Farms Project Series 2010 (Industrial Development Revenue, CoBank ACB LOC) | 1.05 | 5-1-2037 | 2,000,000 | 2,000,000 | ||||||||||||
Manitowoc WI CDA Regency House Project (Housing Revenue, Bank First National LOC) | 1.16 | 11-1-2020 | 925,000 | 925,000 | ||||||||||||
Sheboygan WI Vortex Liquid Color Project (Industrial Development Revenue, Bank First National LOC) | 1.16 | 11-1-2020 | 550,000 | 550,000 | ||||||||||||
Wisconsin Series 2019A (GO Revenue) | 1.09 | 5-1-2029 | 5,000,000 | 5,000,000 | ||||||||||||
Wisconsin Tender Option Bond Trust Receipts/Certificates Series 2019-XF2821 (Housing Revenue, Mizuho Bank Limited LOC, Mizuho Bank Limited LIQ) 144A | 1.09 | 1-1-2026 | 3,860,000 | 3,860,000 | ||||||||||||
Wisconsin Tender Option Bond Trust Receipts/Floater Certificates Series 2019-XF2823 (Housing Revenue, Mizuho Capital Markets LLC LOC, Mizuho Capital Markets LLC LIQ) 144A | 1.09 | 1-1-2026 | 5,015,000 | 5,015,000 | ||||||||||||
| 17,350,000 | ||||||||||||||||
|
| |||||||||||||||
The accompanying notes are an integral part of these financial statements.
14 | Institutional Money Market Funds
Table of Contents
Portfolio of investments—January 31, 2020
| Interest rate | Maturity date | Principal | Value | |||||||||||||
| Wyoming: 1.24% | ||||||||||||||||
| Variable Rate Demand Note ø: 1.24% | ||||||||||||||||
Sublette County WY PCR ExxonMobil Project (Industrial Development Revenue) | 1.24 | % | 10-1-2044 | $ | 3,000,000 | $ | 3,000,000 | |||||||||
|
| |||||||||||||||
Total Municipal Obligations (Cost $215,334,472) | 215,335,463 | |||||||||||||||
|
| |||||||||||||||
Closed End Municipal Bond Fund Obligations: 8.98% | ||||||||||||||||
| California: 1.24% | ||||||||||||||||
Nuveen California Dividend Advantage Municipal Fund Variable Rate Demand Preferred Shares Series 3 (Deutsche Bank LIQ) 144A ø | 1.03 | 3-1-2040 | 3,000,000 | 3,000,000 | ||||||||||||
|
| |||||||||||||||
| Other: 7.74% | ||||||||||||||||
BlackRock MuniYield Quality Fund III Incorporated Variable Rate Demand Preferred Shares (Citibank NA LOC) 144A ø | 1.08 | 6-1-2041 | 5,000,000 | 5,000,000 | ||||||||||||
Nuveen Quality Municipal Income Fund Variable Rate Demand Preferred Shares Series1-2118 (Barclays Bank LIQ) 144A ø | 1.08 | 5-1-2041 | 5,000,000 | 5,000,000 | ||||||||||||
Western Asset Intermediate Municipal Fund Incorporated Variable Rate Demand Preferred Shares Series 1 (Citibank NA LIQ) 144A ø | 1.08 | 2-25-2045 | 5,000,000 | 5,000,000 | ||||||||||||
Western Asset Municipal Partners Incorporated Variable Rate Demand Preferred Shares Series 1 (Citibank NA LIQ) 144A ø | 1.08 | 3-11-2045 | 3,700,000 | 3,700,000 | ||||||||||||
| 18,700,000 | ||||||||||||||||
|
| |||||||||||||||
Total Closed End Municipal Bond Fund Obligations (Cost $21,700,000) | 21,700,000 | |||||||||||||||
|
| |||||||||||||||
| Repurchase Agreements: 1.32% | ||||||||||||||||
Barclays Capital Incorporated, dated 1-31-2020 maturity value $3,200,419^^ | 1.57 | 2-3-2020 | 3,200,000 | 3,200,000 | ||||||||||||
|
| |||||||||||||||
Total Repurchase Agreements (Cost $3,200,000) |
| 3,200,000 | ||||||||||||||
|
| |||||||||||||||
| Total investments in securities (Cost $240,234,472) | 99.38 | % | 240,235,463 | |||||
Other assets and liabilities, net | 0.62 | 1,503,887 | ||||||
|
|
|
| |||||
| Total net assets | 100.00 | % | $ | 241,739,350 | ||||
|
|
|
| |||||
| ø | Variable rate demand notes are subject to a demand feature which reduces the effective maturity. The maturity date shown represents the final maturity date of the security. The interest rate is determined and reset by the issuer daily, weekly, or monthly depending upon the terms of the security. The rate shown is the rate in effect at period end. |
| 144A | The security may be resold in transactions exempt from registration, normally to qualified institutional buyers, pursuant to Rule 144A under the Securities Act of 1933. |
| ^^ | Collateralized by U.S. government securities, 1.75% to 3.63%,6-30-2022 to8-15-2043, fair value including accrued interest is $3,264,000. |
Abbreviations:
| AGM | Assured Guaranty Municipal |
| BAN | Bond Anticipation Notes |
| CDA | Community Development Authority |
| EDA | Economic Development Authority |
| EDFA | Economic Development Finance Authority |
| FHLB | Federal Home Loan Bank |
| FHLMC | Federal Home Loan Mortgage Corporation |
| FNMA | Federal National Mortgage Association |
| GO | General obligation |
| IDA | Industrial Development Authority |
| LIQ | Liquidity agreement |
| LOC | Letter of credit |
| MFHR | Multifamily housing revenue |
| PCFA | Pollution Control Financing Authority |
| PCR | Pollution control revenue |
| SPA | Standby purchase agreement |
The accompanying notes are an integral part of these financial statements.
Institutional Money Market Funds | 15
Table of Contents
Statement of assets and liabilities—January 31, 2020
Assets | ||||
Investments in unaffiliated securities, at value (cost $240,234,472) | $ | 240,235,463 | ||
Cash | 548,301 | |||
Receivable for investments sold | 695,000 | |||
Receivable for interest | 404,416 | |||
Prepaid expenses and other assets | 7,002 | |||
|
| |||
Total assets | 241,890,182 | |||
|
| |||
Liabilities | ||||
Payable for Fund shares redeemed | 4,328 | |||
Management fee payable | 16,056 | |||
Dividends payable | 13,339 | |||
Administration fees payable | 24,697 | |||
Shareholder report expenses payable | 57,441 | |||
Professional fees payable | 25,032 | |||
Trustees’ fees and expenses payable | 4,292 | |||
Accrued expenses and other liabilities | 5,647 | |||
|
| |||
Total liabilities | 150,832 | |||
|
| |||
Total net assets | $ | 241,739,350 | ||
|
| |||
Net assets consist of | ||||
Paid-in capital | $ | 241,813,214 | ||
Total distributable loss | (73,864 | ) | ||
|
| |||
Total net assets | $ | 241,739,350 | ||
|
| |||
Computation of net asset value per share | ||||
Net assets – Administrator Class | $ | 2,237,775 | ||
Shares outstanding – Administrator Class1 | 2,236,940 | |||
Net asset value per share – Administrator Class | $1.0004 | |||
Net assets – Institutional Class | $ | 224,246,751 | ||
Shares outstanding – Institutional Class1 | 224,163,604 | |||
Net asset value per share – Institutional Class | $1.0004 | |||
Net assets – Service Class | $ | 15,254,824 | ||
Shares outstanding – Service Class1 | 15,249,521 | |||
Net asset value per share – Service Class | $1.0003 | |||
| 1 | The Fund has an unlimited number of authorized shares. |
The accompanying notes are an integral part of these financial statements.
16 | Institutional Money Market Funds
Table of Contents
Statement of operations—year ended January 31, 2020
Investment income | ||||
Interest | $ | 4,410,202 | ||
|
| |||
Expenses | ||||
Management fee | 429,399 | |||
Administration fees |
| |||
Administrator Class | 5,964 | |||
Institutional Class | 210,647 | |||
Service Class | 20,392 | |||
Shareholder servicing fees |
| |||
Administrator Class | 5,964 | |||
Service Class | 42,483 | |||
Custody and accounting fees | 38,564 | |||
Professional fees | 39,331 | |||
Registration fees | 79,738 | |||
Shareholder report expenses | 14,185 | |||
Trustees’ fees and expenses | 21,142 | |||
Other fees and expenses | 23,059 | |||
|
| |||
Total expenses | 930,868 | |||
Less: Fee waivers and/or expense reimbursements |
| |||
Fund-level | (300,977 | ) | ||
Administrator Class | (1,325 | ) | ||
Institutional Class | (756 | ) | ||
Service Class | (7,176 | ) | ||
|
| |||
Net expenses | 620,634 | |||
|
| |||
Net investment income | 3,789,568 | |||
|
| |||
Realized and unrealized gains (losses) on investments | ||||
Net realized gains on investments | 71,923 | |||
Net change in unrealized gains (losses) on investments | 991 | |||
|
| |||
Net realized and unrealized gains (losses) on investments | 72,914 | |||
|
| |||
Net increase in net assets resulting from operations | $ | 3,862,482 | ||
|
| |||
The accompanying notes are an integral part of these financial statements.
Institutional Money Market Funds | 17
Table of Contents
Statement of changes in net assets
| Year ended January 31, 2020 | Year ended January 31, 2019 | |||||||||||||||
Operations | ||||||||||||||||
Net investment income | $ | 3,789,568 | $ | 3,272,934 | ||||||||||||
Net realized gains on investments | 71,923 | 1,837 | ||||||||||||||
Net change in unrealized gains (losses) on investments | 991 | 0 | ||||||||||||||
|
| |||||||||||||||
Net increase in net assets resulting from operations | 3,862,482 | 3,274,771 | ||||||||||||||
|
| |||||||||||||||
Distributions to shareholders from net investment income and net realized gains | ||||||||||||||||
Administrator Class | (77,076 | ) | (72,091 | ) | ||||||||||||
Institutional Class | (3,595,687 | ) | (3,175,949 | ) | ||||||||||||
Service Class | (190,180 | ) | (225,713 | ) | ||||||||||||
|
| |||||||||||||||
Total distributions to shareholders | (3,862,943 | ) | (3,473,753 | ) | ||||||||||||
|
| |||||||||||||||
Capital share transactions | Shares | Shares | ||||||||||||||
Proceeds from shares sold | ||||||||||||||||
Administrator Class | 1,285,229 | 1,286,000 | 2,997,003 | 3,000,000 | ||||||||||||
Institutional Class | 4,876,264,698 | 4,879,042,051 | 4,687,583,592 | 4,692,370,298 | ||||||||||||
Service Class | 8,258,192 | 8,262,648 | 11,577,879 | 11,587,521 | ||||||||||||
|
| |||||||||||||||
| 4,888,590,699 | 4,706,957,819 | |||||||||||||||
|
| |||||||||||||||
Reinvestment of distributions | ||||||||||||||||
Administrator Class | 74,357 | 74,399 | 70,709 | 70,768 | ||||||||||||
Institutional Class | 3,580,990 | 3,583,043 | 3,163,888 | 3,166,888 | ||||||||||||
Service Class | 138,321 | 138,396 | 161,224 | 161,362 | ||||||||||||
|
| |||||||||||||||
| 3,795,838 | 3,399,018 | |||||||||||||||
|
| |||||||||||||||
Payment for shares redeemed | ||||||||||||||||
Administrator Class | (5,433,717 | ) | (5,436,590 | ) | 0 | 0 | ||||||||||
Institutional Class | (4,821,641,033 | ) | (4,824,401,081 | ) | (4,860,642,244 | ) | (4,865,545,794 | ) | ||||||||
Service Class | (12,141,730 | ) | (12,147,898 | ) | (12,079,625 | ) | (12,089,936 | ) | ||||||||
|
| |||||||||||||||
| (4,841,985,569 | ) | (4,877,635,730 | ) | |||||||||||||
|
| |||||||||||||||
Net increase (decrease) in net assets resulting from capital share transactions | 50,400,968 | (167,278,893 | ) | |||||||||||||
|
| |||||||||||||||
Total increase (decrease) in net assets | 50,400,507 | (167,477,875 | ) | |||||||||||||
|
| |||||||||||||||
Net assets | ||||||||||||||||
Beginning of period | 191,338,843 | 358,816,718 | ||||||||||||||
|
| |||||||||||||||
End of period | $ | 241,739,350 | $ | 191,338,843 | ||||||||||||
|
| |||||||||||||||
The accompanying notes are an integral part of these financial statements.
18 | Institutional Money Market Funds
Table of Contents
(For a share outstanding throughout each period)
| Year ended January 31 | ||||||||||||||||||||
| ADMINISTRATOR CLASS | 2020 | 2019 | 2018 | 2017 | 20161 | |||||||||||||||
Net asset value, beginning of period | $1.0003 | $1.0010 | $1.0005 | $1.0000 | $1.00 | |||||||||||||||
Net investment income | 0.0124 | 0.0125 | 0.0069 | 0.0031 | 0.00 | 2 | ||||||||||||||
Net realized and unrealized gains (losses) on investments | 0.0005 | (0.0001 | ) | 0.0005 | 0.0008 | 0.00 | 2 | |||||||||||||
|
|
|
|
|
|
|
|
|
| |||||||||||
Total from investment operations | 0.0129 | 0.0124 | 0.0074 | 0.0039 | 0.00 | 2 | ||||||||||||||
Distributions to shareholders from | ||||||||||||||||||||
Net investment income | (0.0125 | ) | (0.0124 | ) | (0.0069 | ) | (0.0030 | ) | (0.00 | )2 | ||||||||||
Net realized gains | (0.0003 | ) | (0.0007 | ) | (0.0000 | )3 | (0.0004 | ) | (0.00 | )2 | ||||||||||
|
|
|
|
|
|
|
|
|
| |||||||||||
Total distributions to shareholders | (0.0128 | ) | (0.0131 | ) | (0.0069 | ) | (0.0034 | ) | (0.00 | )2 | ||||||||||
Net asset value, end of period | $1.0004 | $1.0003 | $1.0010 | $1.0005 | $1.00 | |||||||||||||||
Total return | 1.29 | % | 1.25 | % | 0.74 | % | 0.35 | % | 0.02 | % | ||||||||||
Ratios to average net assets (annualized) | ||||||||||||||||||||
Gross expenses | 0.43 | % | 0.44 | % | 0.41 | % | 0.39 | % | 0.37 | % | ||||||||||
Net expenses | 0.30 | % | 0.30 | % | 0.30 | % | 0.27 | % | 0.10 | % | ||||||||||
Net investment income | 1.28 | % | 1.25 | % | 0.68 | % | 0.29 | % | 0.01 | % | ||||||||||
Supplemental data | ||||||||||||||||||||
Net assets, end of period (000s omitted) | $2,238 | $6,313 | $3,247 | $3,223 | $3,537 | |||||||||||||||
| 1 | Amounts reflect the Fund transacting shares at a fixed NAV rounded to two decimal places. Beginning October 11, 2016, the Fund began selling and redeeming shares of the Fund at a floating NAV rounded to the fourth decimal place. |
| 2 | Amount is less than $0.005. |
| 3 | Amount is less than $0.00005. |
The accompanying notes are an integral part of these financial statements.
Institutional Money Market Funds | 19
Table of Contents
Financial highlights
(For a share outstanding throughout each period)
| Year ended January 31 | ||||||||||||||||||||
| INSTITUTIONAL CLASS | 2020 | 2019 | 2018 | 2017 | 20161 | |||||||||||||||
Net asset value, beginning of period | $1.0004 | $1.0011 | $1.0005 | $1.0000 | $1.00 | |||||||||||||||
Net investment income | 0.0137 | 0.0133 | 2 | 0.0080 | 0.0035 | 0.00 | 3 | |||||||||||||
Net realized and unrealized gains (losses) on investments | 0.0001 | 0.0001 | 0.0005 | 0.0012 | 0.00 | 3 | ||||||||||||||
|
|
|
|
|
|
|
|
|
| |||||||||||
Total from investment operations | 0.0138 | 0.0134 | 0.0085 | 0.0047 | 0.00 | 3 | ||||||||||||||
Distributions to shareholders from | ||||||||||||||||||||
Net investment income | (0.0135 | ) | (0.0134 | ) | (0.0079 | ) | (0.0038 | ) | (0.00 | )3 | ||||||||||
Net realized gains | (0.0003 | ) | (0.0007 | ) | (0.0000 | )4 | (0.0004 | ) | (0.00 | )3 | ||||||||||
|
|
|
|
|
|
|
|
|
| |||||||||||
Total distributions to shareholders | (0.0138 | ) | (0.0141 | ) | (0.0079 | ) | (0.0042 | ) | (0.00 | )3 | ||||||||||
Net asset value, end of period | $1.0004 | $1.0004 | $1.0011 | $1.0005 | $1.00 | |||||||||||||||
Total return | 1.38 | % | 1.35 | % | 0.85 | % | 0.44 | % | 0.02 | % | ||||||||||
Ratios to average net assets (annualized) | ||||||||||||||||||||
Gross expenses | 0.31 | % | 0.31 | % | 0.29 | % | 0.26 | % | 0.25 | % | ||||||||||
Net expenses | 0.20 | % | 0.20 | % | 0.20 | % | 0.18 | % | 0.10 | % | ||||||||||
Net investment income | 1.34 | % | 1.32 | % | 0.79 | % | 0.27 | % | 0.01 | % | ||||||||||
Supplemental data | ||||||||||||||||||||
Net assets, end of period (000s omitted) | $224,247 | $166,024 | $336,215 | $262,511 | $953,036 | |||||||||||||||
| 1 | Amounts reflect the Fund transacting shares at a fixed NAV rounded to two decimal places. Beginning October 11, 2016, the Fund began selling and redeeming shares of the Fund at a floating NAV rounded to the fourth decimal place. |
| 2 | Calculated based upon average shares outstanding |
| 3 | Amount is less than $0.005. |
| 4 | Amount is less than $0.00005. |
The accompanying notes are an integral part of these financial statements.
20 | Institutional Money Market Funds
Table of Contents
Financial highlights
(For a share outstanding throughout each period)
| Year ended January 31 | ||||||||||||||||||||
| SERVICE CLASS | 2020 | 2019 | 2018 | 2017 | 20161 | |||||||||||||||
Net asset value, beginning of period | $1.0004 | $1.0010 | $1.0005 | $1.0000 | $1.00 | |||||||||||||||
Net investment income | 0.0110 | 2 | 0.0109 | 2 | 0.0059 | 0.0037 | 0.00 | 3 | ||||||||||||
Net realized and unrealized gains (losses) on investments | 0.0002 | 0.0001 | 0.0000 | 4 | (0.0010 | ) | 0.00 | 3 | ||||||||||||
|
|
|
|
|
|
|
|
|
| |||||||||||
Total from investment operations | 0.0112 | 0.0110 | 0.0059 | 0.0027 | 0.00 | 3 | ||||||||||||||
Distributions to shareholders from | ||||||||||||||||||||
Net investment income | (0.0110 | ) | (0.0109 | ) | (0.0054 | ) | (0.0018 | ) | (0.00 | )3 | ||||||||||
Net realized gains | (0.0003 | ) | (0.0007 | ) | (0.0000 | )4 | (0.0004 | ) | (0.00 | )3 | ||||||||||
|
|
|
|
|
|
|
|
|
| |||||||||||
Total distributions to shareholders | (0.0113 | ) | (0.0116 | ) | (0.0054 | ) | (0.0022 | ) | (0.00 | )3 | ||||||||||
Net asset value, end of period | $1.0003 | $1.0004 | $1.0010 | $1.0005 | $1.00 | |||||||||||||||
Total return | 1.12 | % | 1.11 | % | 0.59 | % | 0.23 | % | 0.02 | % | ||||||||||
Ratios to average net assets (annualized) | ||||||||||||||||||||
Gross expenses | 0.60 | % | 0.61 | % | 0.58 | % | 0.49 | % | 0.48 | % | ||||||||||
Net expenses | 0.45 | % | 0.45 | % | 0.45 | % | 0.35 | % | 0.10 | % | ||||||||||
Net investment income | 1.09 | % | 1.09 | % | 0.53 | % | 0.09 | % | 0.01 | % | ||||||||||
Supplemental data | ||||||||||||||||||||
Net assets, end of period (000s omitted) | $15,255 | $19,001 | $19,355 | $23,962 | $108,484 | |||||||||||||||
| 1 | Amounts reflect the Fund transacting shares at a fixed NAV rounded to two decimal places. Beginning October 11, 2016, the Fund began selling and redeeming shares of the Fund at a floating NAV rounded to the fourth decimal place. |
| 2 | Calculated based upon average shares outstanding |
| 3 | Amount is less than $0.005. |
| 4 | Amount is less than $0.00005. |
The accompanying notes are an integral part of these financial statements.
Institutional Money Market Funds | 21
Table of Contents
1. ORGANIZATION
Wells Fargo Funds Trust (the “Trust”), a Delaware statutory trust organized on March 10, 1999, is anopen-end management investment company registered under the Investment Company Act of 1940, as amended (the “1940 Act”). As an investment company, the Trust follows the accounting and reporting guidance in Financial Accounting Standards Board (“FASB”)Accounting Standards Codification Topic 946, Financial Services – Investment Companies. These financial statements report on the Wells Fargo Municipal Cash Management Money Market Fund (the “Fund”) which is a diversified series of the Trust.
The Fund operates as an institutionalnon-government money market fund. As an institutionalnon-government money market fund, shareholders will transact at a floating net asset value (NAV) rounded to four decimal places in accordance with the valuation policies below.
Consistent with Rule2a-7, the Board of Trustees of the Fund is permitted to impose a liquidity fee on redemptions from the Fund or a redemption gate (i.e., a suspension of the right to redeem) in the event that the Fund’s liquidity falls below required minimums because of market conditions or other factors. If the Fund’s weekly liquid assets (as defined in Rule2a-7(34)) fall below 30% of the Fund’s total assets, the Board of Trustees is permitted, but not required, to: (i) impose a liquidity fee of no more than 2% of the amount redeemed; and/or (ii) impose a redemption gate. If the Fund’s weekly liquid assets fall below 10% of the Fund’s total assets, the Fund must impose, generally as of the beginning of the next business day, a liquidity fee of 1% of the amount redeemed unless the Board of Trustees determines that such a fee is not in the best interest of the Fund or determines that a lower or higher fee (subject to the 2% limit) is in the best interest of the Fund. Liquidity fees reduce the amount a shareholder receives upon redemption of its shares. The Fund retains any liquidity fees for the benefit of remaining shareholders. The Board of Trustees did not impose any liquidity fees and/or redemption gates during the year ended January 31, 2020.
2. SIGNIFICANT ACCOUNTING POLICIES
The following significant accounting policies, which are consistently followed in the preparation of the financial statements of the Fund, are in conformity with U.S. generally accepted accounting principles which require management to make estimates and assumptions that affect the reported amounts of assets and liabilities, disclosure of contingent assets and liabilities at the date of the financial statements, and the reported amounts of revenues and expenses during the reporting period. Actual results could differ from those estimates.
Securities valuation
Debt securities are valued at the evaluated bid price provided by an independent pricing service (e.g. taking into account various factors, including yields, maturities, or credit ratings) or, if a reliable price is not available, the quoted bid price from an independent broker-dealer.
Investments which are not valued using any of the methods discussed above are valued at their fair value, as determined in good faith by the Board of Trustees. The Board of Trustees has established a Valuation Committee comprised of the Trustees and has delegated to it the authority to take any actions regarding the valuation of portfolio securities that the Valuation Committee deems necessary or appropriate, including determining the fair value of portfolio securities, unless the determination has been delegated to the Wells Fargo Asset Management Pricing Committee at Wells Fargo Funds Management, LLC (“Funds Management”). The Board of Trustees retains the authority to make or ratify any valuation decisions or approve any changes to the Valuation Procedures as it deems appropriate. On a quarterly basis, the Board of Trustees receives reports on any valuation actions taken by the Valuation Committee or the Wells Fargo Asset Management Pricing Committee which may include items for ratification.
Repurchase agreements
The Fund may invest in repurchase agreements and may participate in pooled repurchase agreement transactions with other funds advised by Funds Management. Repurchase agreements are agreements where the seller of a security to the Fund agrees to repurchase that security from the Fund at a mutually agreed upon time and price. The repurchase agreements must be fully collateralized based on values that aremarked-to-market daily. The collateral may be held by an agent bank under atri-party agreement. It is the custodian’s responsibility to value collateral daily and to take action to obtain additional collateral as necessary to maintain a market value equal to or greater than the resale price. The repurchase agreements are collateralized by securities issued or guaranteed by the U.S. Government, its agencies or instrumentalities. There could be potential loss to the Fund in the event that the Fund is delayed or prevented from exercising its rights to dispose of the collateral, including the risk of a possible decline in the value of the underlying obligations during the period in which the Fund seeks to assert its rights.
Security transactions and income recognition
Securities transactions are recorded on a trade date basis. Realized gains or losses are recorded on the basis of identified cost.
22 | Institutional Money Market Funds
Table of Contents
Notes to financial statements
Interest income is accrued daily and bond discounts are accreted and premiums are amortized daily. To the extent debt obligations are placed onnon-accrual status, any related interest income may be reduced by writing off interest receivables when the collection of all or a portion of interest has been determined to be doubtful based on consistently applied procedures and the fair value has decreased. If the issuer subsequently resumes interest payments or when the collectability of interest is reasonably assured, the debt obligation is removed fromnon-accrual status.
Distributions to shareholders
Distributions to shareholders from net investment income are declared daily and paid monthly. Distributions from net realized gains, if any, are recorded on theex-dividend date and paid at least annually. Such distributions are determined in accordance with income tax regulations and may differ from U.S. generally accepted accounting principles. Dividend sources are estimated at the time of declaration. The tax character of distributions is determined as of the Fund’s fiscal year end. Therefore, a portion of the Fund’s distributions made prior to the Fund’s fiscal year end may be categorized as a tax return of capital at year end.
Federal and other taxes
The Fund intends to continue to qualify as a regulated investment company by distributing substantially all of its investment company taxable andtax-exempt income and any net realized capital gains (after reduction for capital loss carryforwards) sufficient to relieve it from all, or substantially all, federal income taxes. Accordingly, no provision for federal income taxes was required.
The Fund’s income and federal excise tax returns and all financial records supporting those returns for the prior three fiscal years are subject to examination by the federal and Delaware revenue authorities. Management has analyzed the Fund’s tax positions taken on federal, state, and foreign tax returns for all open tax years and does not believe that there are any uncertain tax positions that require recognition of a tax liability.
As of January 31, 2020, the aggregate cost of all investments for federal income tax purposes was $240,234,472 and the unrealized gains (losses) consisted of:
Gross unrealized gains | $ | 1,420 | ||
Gross unrealized losses | (429 | ) | ||
Net unrealized gains | $ | 991 | ||
Class allocations
The separate classes of shares offered by the Fund differ principally in shareholder servicing and administration fees. Class specific expenses are charged directly to that share class. Investment income, common fund-level expenses, and realized and unrealized gains (losses) on investments are allocated daily to each class of shares based on the relative proportion of net assets of each class.
3. FAIR VALUATION MEASUREMENTS
Fair value measurements of investments are determined within a framework that has established a fair value hierarchy based upon the various data inputs utilized in determining the value of the Fund’s investments. The three-level hierarchy gives the highest priority to unadjusted quoted prices in active markets for identical assets or liabilities (Level 1) and the lowest priority to unobservable inputs (Level 3). The Fund’s investments are classified within the fair value hierarchy based on the lowest level of input that is significant to the fair value measurement. The inputs are summarized into three broad levels as follows:
| ∎ | Level 1 – quoted prices in active markets for identical securities |
| ∎ | Level 2 – other significant observable inputs (including quoted prices for similar securities, interest rates, prepayment speeds, credit risk, etc.) |
| ∎ | Level 3 – significant unobservable inputs (including the Fund’s own assumptions in determining the fair value of investments) |
The inputs or methodologies used for valuing investments in securities are not necessarily an indication of the risk associated with investing in those securities.
Institutional Money Market Funds | 23
Table of Contents
Notes to financial statements
The following is a summary of the inputs used in valuing the Fund’s assets and liabilities as of January 31, 2020:
| Quoted prices (Level 1) | Other significant observable inputs (Level 2) | Significant (Level 3) | Total | |||||||||||||
Assets | ||||||||||||||||
Investments in: | ||||||||||||||||
Municipal obligations | $ | 0 | $ | 215,335,463 | $ | 0 | $ | 215,335,463 | ||||||||
Closed end municipal bond fund obligations | 0 | 21,700,000 | 0 | 21,700,000 | ||||||||||||
Repurchase agreements | 0 | 3,200,000 | 0 | 3,200,000 | ||||||||||||
Total assets | $ | 0 | $ | 240,235,463 | $ | 0 | $ | 240,235,463 | ||||||||
Additional sector, industry or geographic detail is included in the Portfolio of Investments.
For the year ended January 31, 2020, the Fund did not have any transfers into/out of Level 3.
4. TRANSACTIONS WITH AFFILIATES
Management fee
Funds Management, an indirect wholly owned subsidiary of Wells Fargo & Company (“Wells Fargo”), is the manager of the Fund and provides advisory and fund-level administrative services under an investment management agreement. Under the investment management agreement, Funds Management is responsible for, among other services, implementing the investment objectives and strategies of the Fund, supervising the subadviser and providing fund-level administrative services in connection with the Fund’s operations. As compensation for its services under the investment management agreement, Funds Management is entitled to receive a management fee at the following annual rate based on the Fund’s average daily net assets:
| Average daily net assets | Management fee | |||
First $5 bllion | 0.15 | % | ||
Next $5 billion | 0.14 | |||
Over $10 billion | 0.13 | |||
For the year ended January 31, 2020, the management fee was equivalent to an annual rate of 0.15% of the Fund’s average daily net assets.
Funds Management has retained the services of a subadviser to provide daily portfolio management to the Fund. The fee for subadvisory services is borne by Funds Management. Wells Capital Management Incorporated, an affiliate of Funds Management and an indirect wholly owned subsidiary of Wells Fargo, is the subadviser to the Fund and is entitled to receive a fee from Funds Management at an annual rate starting at 0.05% and declining to 0.01% as the average daily net assets of the Fund increase.
Administration fees
Under a class-level administration agreement, Funds Management provides class-level administrative services to the Fund, which includes paying fees and expenses for services provided by the transfer agent,sub-transfer agents, omnibus account servicers and record-keepers. As compensation for its services under the class-level administration agreement, Funds Management receives an annual fee which is calculated based on the average daily net assets of each class as follows:
| Class-level administration fee | ||||
Administrator Class | 0.10 | % | ||
Institutional Class | 0.08 | |||
Service Class | 0.12 | |||
Waivers and/or expense reimbursements
Funds Management has contractually waived and/or reimbursed management and administration fees to the extent necessary to maintain certain net operating expense ratios for the Fund. When each class of the Fund has exceeded its expense cap, Funds Management has waived fees and/or reimbursed expenses from fund-level expenses on a proportionate basis and then from
24 | Institutional Money Market Funds
Table of Contents
Notes to financial statements
class specific expenses. When only certain classes exceed their expense caps, waivers and/or reimbursements are applied against class specific expenses before fund-level expenses. Funds Management has committed through May 31, 2020 to waive fees and/or reimburse expenses to the extent necessary to cap the Fund’s expenses at 0.30% for Administrator Class shares, 0.20% for Institutional Class shares, and 0.45% for Service Class shares. Prior to or after the commitment expiration date, the cap may be increased or the commitment to maintain the cap may be terminated only with the approval of the Board of Trustees.
Shareholder servicing fees
The Trust has entered into contracts with one or more shareholder servicing agents, whereby Service Class of the Fund is charged a fee at an annual rate of 0.25% of its average daily net assets. Administrator Class is charged a fee at an annual rate of 0.10% of its average daily net assets. A portion of these total shareholder servicing fees were paid to affiliates of Wells Fargo.
Interfund transactions
The Fund may purchase or sell portfolio investment securities to certain other Wells Fargo affiliates pursuant to Rule17a-7 under the 1940 Act and under procedures adopted by the Board of Trustees. The procedures have been designed to ensure that these interfund transactions, which do not incur broker commissions, are effected at current market prices. Pursuant to these procedures, the Fund had $532,100,000 and $477,810,000 in interfund purchases and sales, respectively, during the year ended January 31, 2020.
5. DISTRIBUTIONS TO SHAREHOLDERS
The tax character of distributions paid during the years ended January 31, 2020 and January 31, 2019 were as follows:
| Year ended January 31 | ||||||||
| 2020 | 2019 | |||||||
Ordinary income | $ | 539,047 | $ | 473,017 | ||||
Tax-exempt income | 3,323,896 | 2,857,604 | ||||||
Long-term capital gain | 0 | 143,132 | ||||||
As of January 31, 2020, the components of distributable earnings on a tax basis were as follows:
Undistributed ordinary income | Undistributed tax-exempt income | Unrealized gains | ||
$385 | $42,182 | $991 | ||
6. INDEMNIFICATION
Under the Trust’s organizational documents, the officers and Trustees have been granted certain indemnification rights against certain liabilities that may arise out of performance of their duties to the Trust. Additionally, in the normal course of business, the Trust may enter into contracts with service providers that contain a variety of indemnification clauses. The Trust’s maximum exposure under these arrangements is dependent on future claims that may be made against the Fund and, therefore, cannot be estimated.
7. NEW ACCOUNTING PRONOUNCEMENTS
In August 2018, FASB issued Accounting Standards Update (“ASU”)No. 2018-13, Fair Value Measurement (Topic 820)Disclosure Framework—Changes to the Disclosure Requirements for Fair Value Measurement. ASU2018-13 updates the disclosure requirements for fair value measurements by modifying or removing certain disclosures and adding certain new disclosures. The amendments are effective for fiscal years, and interim periods within those fiscal years, beginning after December 15, 2019. Early adoption is permitted. Management has adopted the removal and modification of disclosures early, as permitted, and will adopt the additional new disclosures at the effective date.
In March 2017, FASB issued ASUNo. 2017-08,Premium Amortization on Purchased Callable Debt Securities. ASU2017-08
shortens the amortization period for certain callable debt securities held at a premium and requires the premium to be amortized to the earliest call date. The amendments do not require an accounting change for securities held at a discount and discounts will continue to be accreted to the maturity date of the security. ASU2017-08 is effective for fiscal years beginning after December 15, 2018 and for interim periods within those fiscal years. During the current reporting period, management of the Fund adopted the change in accounting policy which did not have a material impact to the Fund’s financial statements.
Institutional Money Market Funds | 25
Table of Contents
Notes to financial statements
8. SUBSEQUENT EVENT
On March 11, 2020, the World Health Organization announced that it had made the assessment that coronavirus disease 2019 (“COVID-19”) is a pandemic. The impacts of COVID-19 is adversely affecting the entire global economy, individual companies and investment products, and the market in general. There is significant uncertainty around the extent and duration of business disruptions related to COVID-19 and the impact may be short term or may last for an extended period of time. The risk of further spreading of COVID-19 has led to significant uncertainty and volatility in the financial markets and the value of the Fund and the securities in which the Fund invests may be adversely affected by impacts caused by COVID-19.
26 | Institutional Money Market Funds
Table of Contents
Report of independent registered public accounting firm
TO THE SHAREHOLDERS OF THE FUND AND BOARD OF TRUSTEES OF WELLS FARGO FUNDS TRUST:
Opinion on the Financial Statements
We have audited the accompanying statement of assets and liabilities of Wells Fargo Municipal Cash Management Money Market Fund (the Fund), one of the funds constituting Wells Fargo Funds Trust, including the portfolio of investments, as of January 31, 2020, the related statement of operations for the year then ended, the statements of changes in net assets for each of the years in the two-year period then ended, and the related notes (collectively, the financial statements) and the financial highlights for each of the years in the five-year period then ended. In our opinion, the financial statements and financial highlights present fairly, in all material respects, the financial position of the Fund as of January 31, 2020, the results of its operations for the year then ended, the changes in its net assets for each of the years in the two-year period then ended, and the financial highlights for each of the years in the five-year period then ended, in conformity with U.S. generally accepted accounting principles.
Basis for Opinion
These financial statements and financial highlights are the responsibility of the Fund’s management. Our responsibility is to express an opinion on these financial statements and financial highlights based on our audits. We are a public accounting firm registered with the Public Company Accounting Oversight Board (United States) (PCAOB) and are required to be independent with respect to the Fund in accordance with the U.S. federal securities laws and the applicable rules and regulations of the Securities and Exchange Commission and the PCAOB.
We conducted our audits in accordance with the standards of the PCAOB. Those standards require that we plan and perform the audit to obtain reasonable assurance about whether the financial statements and financial highlights are free of material misstatement, whether due to error or fraud. Our audits included performing procedures to assess the risks of material misstatement of the financial statements and financial highlights, whether due to error or fraud, and performing procedures that respond to those risks. Such procedures included examining, on a test basis, evidence regarding the amounts and disclosures in the financial statements and financial highlights. Such procedures also included confirmation of securities owned as of January 31, 2020, by correspondence with the custodian and brokers, or by other appropriate auditing procedures. Our audits also included evaluating the accounting principles used and significant estimates made by management, as well as evaluating the overall presentation of the financial statements and financial highlights. We believe that our audits provide a reasonable basis for our opinion.

We have not been able to determine the specific year that we began serving as the auditor of one or more Wells Fargo Funds investment companies; however we are aware that we have served as the auditor of one or more Wells Fargo Funds investment companies since at least 1955.
Boston, Massachusetts
March 31, 2020
Institutional Money Market Funds | 27
Table of Contents
TAX INFORMATION
For the fiscal year ended January 31, 2020, $465,672 has been designated as interest-related dividends for nonresident alien shareholders pursuant to Section 871 of the Internal Revenue Code.
For the fiscal year ended January 31, 2020, $73,375 has been designated as short-term capital gain dividends for nonresident alien shareholders pursuant to Section 871 of the Internal Revenue Code.
Pursuant to Section 852 of the Internal Revenue Code, 87.71% of distributions paid from net investment income is designated as exempt-interest dividends for the fiscal year ended January 31, 2020.
PROXY VOTING INFORMATION
A description of the policies and procedures used to determine how to vote proxies relating to portfolio securities is available, upon request, by calling1-800-222-8222, visiting our website atwfam.com, or visiting the SEC website at sec.gov. Information regarding how the proxies related to portfolio securities were voted during the most recent12-month period ended June 30 is available on the website atwfam.comor by visiting the SEC website at sec.gov.
28 | Institutional Money Market Funds
Table of Contents
Other information (unaudited)
BOARD OF TRUSTEES AND OFFICERS
Each of the Trustees and Officers1 listed in the table below acts in identical capacities for each fund in the Wells Fargo family of funds, which consists of 149 mutual funds comprising the Wells Fargo Funds Trust, Wells Fargo Variable Trust, Wells Fargo Master Trust and fourclosed-end funds (collectively the “Fund Complex”). This table should be read in conjunction with the Prospectus and the Statement of Additional Information2. The mailing address of each Trustee and Officer is 525 Market Street, 12th Floor, San Francisco, CA 94105. Each Trustee and Officer serves an indefinite term, however, each Trustee serves such term until reaching the mandatory retirement age established by the Trustees.
Independent Trustees
| Name and year of birth | Position held and length of service* | Principal occupations during past five years or longer | Current other public company or investment company directorships | |||
William R. Ebsworth (Born 1957) | Trustee, since 2015 | Retired. From 1984 to 2013, equities analyst, portfolio manager, research director and chief investment officer at Fidelity Management and Research Company in Boston, Tokyo, and Hong Kong, and retired in 2013 as Chief Investment Officer of Fidelity Strategic Advisers, Inc. where he led a team of investment professionals managing client assets. Prior thereto, Board member of Hong Kong Securities Clearing Co., Hong Kong Options Clearing Corp., the Thailand International Fund, Ltd., Fidelity Investments Life Insurance Company, and Empire Fidelity Investments Life Insurance Company. Audit Committee Chair and Investment Committee Chair of the Vincent Memorial Hospital Endowment(non-profit organization). Mr. Ebsworth is a CFA® charterholder. | N/A | |||
Jane A. Freeman (Born 1953) | Trustee, since 2015; Chair Liaison, since 2018 | Retired. From 2012 to 2014 and 1999 to 2008, Chief Financial Officer of Scientific Learning Corporation. From 2008 to 2012, Ms. Freeman provided consulting services related to strategic business projects. Prior to 1999, Portfolio Manager at Rockefeller & Co. and Scudder, Stevens & Clark. Board member of the Harding Loevner Funds from 1996 to 2014, serving as both Lead Independent Director and chair of the Audit Committee. Board member of the Russell Exchange Traded Funds Trust from 2011 to 2012 and the chair of the Audit Committee. Ms. Freeman is a Board Member of The Ruth Bancroft Garden(non-profit organization). She is also an inactive Chartered Financial Analyst. | N/A | |||
Isaiah Harris, Jr. (Born 1952) | Trustee, since 2009; Audit Committee Chairman, since 2019 | Retired. Chairman of the Board of CIGNA Corporation since 2009, and Director since 2005. From 2003 to 2011, Director of Deluxe Corporation. Prior thereto, President and CEO of BellSouth Advertising and Publishing Corp. from 2005 to 2007, President and CEO of BellSouth Enterprises from 2004 to 2005 and President of BellSouth Consumer Services from 2000 to 2003. Emeritus member of the Iowa State University Foundation Board of Governors. Emeritus Member of the Advisory Board of Iowa State University School of Business. Advisory Board Member, Palm Harbor Academy (private school). Advisory Board Member, Child Evangelism Fellowship(non-profit). Mr. Harris is a certified public accountant (inactive status). | CIGNA Corporation | |||
Judith M. Johnson (Born 1949) | Trustee, since 2008; Audit Committee Chairman, from 2009 to 2018 | Retired. Prior thereto, Chief Executive Officer and Chief Investment Officer of Minneapolis Employees Retirement Fund from 1996 to 2008. Ms. Johnson is an attorney, certified public accountant and a certified managerial accountant. | N/A | |||
Institutional Money Market Funds | 29
Table of Contents
Other information (unaudited)
| Name and year of birth | Position held and length of service* | Principal occupations during past five years or longer | Current other public company or investment company directorships | |||
David F. Larcker (Born 1950) | Trustee, since 2009 | James Irvin Miller Professor of Accounting at the Graduate School of Business, Stanford University, Director of the Corporate Governance Research Initiative and Senior Faculty of The Rock Center for Corporate Governance since 2006. From 2005 to 2008, Professor of Accounting at the Graduate School of Business, Stanford University. Prior thereto, Ernst & Young Professor of Accounting at The Wharton School, University of Pennsylvania from 1985 to 2005. | N/A | |||
Olivia S. Mitchell (Born 1953) | Trustee, since 2006; Nominating and Governance Committee Chair, since 2018 | International Foundation of Employee Benefit Plans Professor, Wharton School of the University of Pennsylvania since 1993. Director of Wharton’s Pension Research Council and Boettner Center on Pensions & Retirement Research, and Research Associate at the National Bureau of Economic Research. Previously, Cornell University Professor from 1978 to 1993. | N/A | |||
Timothy J. Penny (Born 1951) | Trustee, since 1996; Chairman, since 2018 | President and Chief Executive Officer of Southern Minnesota Initiative Foundation, anon-profit organization, since 2007. Member of the Board of Trustees of NorthStar Education Finance, Inc., anon-profit organization, since 2007. | N/A | |||
James G. Polisson (Born 1959) | Trustee, since 2018 | Retired. Chief Marketing Officer, Source (ETF) UK Services, Ltd, from 2015 to 2017. From 2012 to 2015, Principal of The Polisson Group, LLC, a management consulting, corporate advisory and principal investing company. Chief Executive Officer and Managing Director at Russell Investments, Global Exchange Traded Funds from 2010 to 2012. Managing Director of Barclays Global Investors from 1998 to 2010 and Global Chief Marketing Officer for iShares and Barclays Global Investors from 2000 to 2010. Trustee of the San Francisco Mechanics’ Institute, anon-profit organization, from 2013 to 2015. Board member of the Russell Exchange Traded Fund Trust from 2011 to 2012. Director of Barclays Global Investors Holdings Deutschland GmbH from 2006 to 2009. Mr. Polisson is an attorney and has a retired status with the Massachusetts and District of Columbia Bar Associations. | N/A | |||
Pamela Wheelock3 (Born 1959) | Trustee, since January 2020; previously Trustee from January 2018 to July 2019 | Board member of the Destination Medical Center Economic Development Agency, Rochester, Minnesota since 2019. Acting Commissioner, Minnesota Department of Human Services, July 2019 through September 2019. Human Services Manager (part-time), Minnesota Department of Human Services, October 2019 through December 2019. Chief Operating Officer, Twin Cities Habitat for Humanity from 2017 to 2019. Vice President of University Services, University of Minnesota from 2012 to 2016. Prior thereto, on the Board of Directors, Governance Committee and Finance Committee for the Minnesota Philanthropy Partners (Saint Paul Foundation) from 2012 to 2018, Interim Chief Executive Officer of Blue Cross Blue Shield of Minnesota from 2011 to 2012, Chairman of the Board from 2009 to 2012 and Board Director from 2003 to 2015. Vice President, Leadership and Community Engagement, Bush Foundation, Saint Paul, Minnesota (a private foundation) from 2009 to 2011. Executive Vice President and Chief Financial Officer, Minnesota Sports and Entertainment from 2004 to 2009 and Senior Vice President from 2002 to 2004. Executive Vice President of the Minnesota Wild Foundation from 2004 to 2008. Commissioner of Finance, State of Minnesota, from 1999 to 2002. Currently Board Chair of the Minnesota Wild Foundation since 2010. | N/A | |||
| * | Length of service dates reflect the Trustee’s commencement of service with the Trust’s predecessor entities, where applicable. |
30 | Institutional Money Market Funds
Table of Contents
Other information (unaudited)
Officers
| Name and year of birth | Position held and length of service | Principal occupations during past five years or longer | ||
Andrew Owen (Born 1960) | President, since 2017 | Executive Vice President of Wells Fargo & Company and Head of Affiliated Managers, Wells Fargo Asset Management, since 2014. In addition, Mr. Owen is currently President, Chief Executive Officer and Director of Wells Fargo Funds Management, LLC since 2017. Prior thereto, Executive Vice President responsible for marketing, investments and product development for Wells Fargo Funds Management, LLC, from 2009 to 2014. | ||
Nancy Wiser1 (Born 1967) | Treasurer, since 2012 | Executive Vice President of Wells Fargo Funds Management, LLC since 2011. Chief Operating Officer and Chief Compliance Officer at LightBox Capital Management LLC, from 2008 to 2011. | ||
Michelle Rhee (Born 1966) | Chief Legal Officer, since 2019 | Secretary of Wells Fargo Funds Management, LLC, Chief Legal Counsel of Wells Fargo Asset Management and Assistant General Counsel of Wells Fargo Bank, N.A. since 2018. Associate General Counsel and Managing Director of Bank of America Corporation from 2004 to 2018. | ||
Catherine Kennedy (Born 1969) | Secretary, since 2019 | Vice President of Wells Fargo Funds Management, LLC and Senior Counsel of the Wells Fargo Legal Department since 2010. Vice President and Senior Counsel of Evergreen Investment Management Company, LLC from 1998 to 2010. | ||
Michael H. Whitaker (Born 1967) | Chief Compliance Officer, since 2016 | Chief Compliance Officer of Wells Fargo Asset Management since 2016. Senior Vice President and Chief Compliance Officer for Fidelity Investments from 2007 to 2016. | ||
David Berardi (Born 1975) | Assistant Treasurer, since 2009 | Vice President of Wells Fargo Funds Management, LLC since 2009. Vice President of Evergreen Investment Management Company, LLC from 2008 to 2010. Manager of Fund Reporting and Control for Evergreen Investment Management Company, LLC from 2004 to 2010. | ||
Jeremy DePalma1 (Born 1974) | Assistant Treasurer, since 2009 | Senior Vice President of Wells Fargo Funds Management, LLC since 2009. Senior Vice President of Evergreen Investment Management Company, LLC from 2008 to 2010 and head of the Fund Reporting and Control Team within Fund Administration from 2005 to 2010. | ||
| 1 | Nancy Wiser acts as Treasurer of 64 funds in the Fund Complex. Jeremy DePalma acts as Treasurer of 85 funds and Assistant Treasurer of 64 funds in the Fund Complex. |
| 2 | The Statement of Additional Information includes additional information about the Trustees and is available, without charge, upon request, by calling1-800-222-8222 or by visiting the website atwfam.com. |
| 3 | Pamela Wheelock wasre-appointed to the Board effective January 1, 2020. |
Institutional Money Market Funds | 31
Table of Contents
This page is intentionally left blank.
Table of Contents
For more information
More information about Wells Fargo Funds is available free upon request. To obtain literature, please write, visit the Fund’s website, or call:
Wells Fargo Funds
P.O. Box 219967
Kansas City, MO 64121-9967
Website:wfam.com
Individual investors:1-800-222-8222
Retail investment professionals:1-888-877-9275
Institutional investment professionals:1-866-765-0778

This report and the financial statements contained herein are submitted for the general information of the shareholders of the Fund. If this report is used for promotional purposes, distribution of the report must be accompanied or preceded by a current prospectus. Before investing, please consider the investment objectives, risks, charges, and expenses of the investment. For a current prospectus and, if available, a summary prospectus, containing this information, call1-800-260-5969 or visit the Fund’s website atwfam.com. Read the prospectus carefully before you invest or send money.
Wells Fargo Asset Management (WFAM) is the trade name for certain investment advisory/management firms owned by Wells Fargo & Company. These firms include but are not limited to Wells Capital Management Incorporated and Wells Fargo Funds Management, LLC. Certain products managed by WFAM entities are distributed by Wells Fargo Funds Distributor, LLC (a broker-dealer and Member FINRA).
This material is for general informational and educational purposes only and is NOT intended to provide investment advice or a recommendation of any kind—including a recommendation for any specific investment, strategy, or plan.
INVESTMENT PRODUCTS: NOT FDIC INSURED ◾ NO BANK GUARANTEE ◾ MAY LOSE VALUE
© 2020 Wells Fargo & Company. All rights reserved
PAR-0220-03782 03-20
A307/AR307 01-20
Table of Contents

Annual Report
January 31, 2020
Retail Money Market Funds
| ∎ | Wells Fargo National Tax-Free Money Market Fund |
Beginning on January 1, 2021, as permitted by new regulations adopted by the Securities and Exchange Commission, paper copies of the Wells Fargo Funds’ annual and semi-annual shareholder reports issued after this date will no longer be sent by mail, unless you specifically request paper copies of the reports. Instead, the reports will be made available on the Funds’ website, and you will be notified by mail each time a report is posted and provided with a website address to access the report.
If you already elected to receive shareholder reports electronically, you will not be affected by this change and you need not take any action. You may elect to receive shareholder reports and other communications from the Fund electronically at any time by contacting your financial intermediary (such as a broker-dealer or bank) or, if you are a direct investor, by calling1-800-222-8222 or by enrolling at wellsfargo.com/advantagedelivery.
You may elect to receive all future reports in paper free of charge. If you invest through a financial intermediary, you can contact your financial intermediary to request that you continue to receive paper copies of your shareholder reports; if you invest directly with the Fund, you can call 1-800-222-8222. Your election to receive reports in paper will apply to all Wells Fargo Funds held in your account with your financial intermediary or, if you are a direct investor, to all Wells Fargo Funds that you hold.
Table of Contents
|
Reduce clutter. Save trees. |
Sign up for electronic delivery of prospectuses and shareholder reports atwellsfargo.com/advantagedelivery |
The views expressed and any forward-looking statements are as of January 31, 2020, unless otherwise noted, and are those of the Fund managers and/or Wells Fargo Asset Management. Discussions of individual securities, or the markets generally, or any Wells Fargo Fund are not intended as individual recommendations. Future events or results may vary significantly from those expressed in any forward-looking statements. The views expressed are subject to change at any time in response to changing circumstances in the market. Wells Fargo Asset Management and the Fund disclaim any obligation to publicly update or revise any views expressed or forward-looking statements.
INVESTMENT PRODUCTS: NOT FDIC INSURED ◾ NO BANK GUARANTEE ◾ MAY LOSE VALUE
Retail Money Market Funds | 1
Table of Contents
Letter to shareholders (unaudited)

Andrew Owen
President
Wells Fargo Funds
Dear Shareholder:
We are pleased to offer you this annual report for the Wells Fargo NationalTax-Free Money Market Fund for the12-month period that ended January 31, 2020. Despite some periods of market volatility, the year was strongly positive for financial markets as supportive central banks more than offset concerns over slowing global economic growth and international trade tensions.
Overall, both fixed-income and equity investors enjoyed healthy annual returns, with U.S. markets leading the way. For the period, U.S. stocks, based on the S&P 500 Index,1 gained 21.68% and international stocks, as measured by the MSCI ACWI ex USA Index (Net),2 returned 9.94%. The MSCI EM Index (Net)3 gained a more modest 3.81%. For bond investors, the Bloomberg Barclays U.S. Aggregate Bond Index4 added 9.64%, the Bloomberg Barclays Global Aggregateex-USD Index5 returned 3.95%, the Bloomberg Barclays Municipal Bond Index6 gained 8.65%, and the ICE BofA U.S. High Yield Index7 added 9.39%.
The year began with a strong market rebound.
Financial markets opened 2019 on a positive note, as investors were encouraged by the U.S. Federal Reserve (Fed) taking a more accommodative stance after a series of increases to the federal funds rate in 2017 and 2018. However, concerns over slowing global growth grew more ominous. Fourth-quarter 2018 gross domestic product (GDP), reported in February 2019, grew at an annualized 2.2% rate, down from the levels of the prior two quarters. The Bank of England forecast the slowest growth since the financial crisis for 2019. China and the U.S. continued to wrangle over trade issues. By the end of the first quarter of 2019, more accommodative Fed sentiment and steady, if not spectacular, U.S. economic and business metrics encouraged domestic investors.
Early second-quarter 2019 enthusiasm among investors faded.
During April, sustained low inflation, solid employment data, and first-quarter U.S. GDP of an annualized rate of 3.2% supported favorable sentiment. During May, however, markets tumbled on mixed investment signals. In the U.S., partisan political wrangling ramped up in advance of the 2020 election. The U.K.’s Brexit disagreements caused Prime Minister Theresa May to resign. Boris Johnson succeeded her, only to add to uncertainty about Brexit’s resolution ahead of an October 2019 deadline. The European Commission downgraded the 2019 growth forecast to 1.2%. The U.S. increased tariffs on
| 1 | The S&P 500 Index consists of 500 stocks chosen for market size, liquidity, and industry group representation. It is a market-value-weighted index with each stock’s weight in the index proportionate to its market value. You cannot invest directly in an index. |
| 2 | The Morgan Stanley Capital International (MSCI) All Country World Index (ACWI) ex USA Index (Net) is a free-float-adjusted market-capitalization-weighted index that is designed to measure the equity market performance of developed markets, excluding the United States. Source: MSCI. MSCI makes no express or implied warranties or representations and shall have no liability whatsoever with respect to any MSCI data contained herein. The MSCI data may not be further redistributed or used as a basis for other indices or any securities or financial products. This report is not approved, reviewed, or produced by MSCI. You cannot invest directly in an index. |
| 3 | The MSCI Emerging Markets (EM) Index (Net) is a free-float-adjusted market-capitalization-weighted index that is designed to measure equity market performance of emerging markets. You cannot invest directly in an index. |
| 4 | The Bloomberg Barclays U.S. Aggregate Bond Index is a broad-based benchmark that measures the investment-grade, U.S. dollar-denominated, fixed-rate taxable bond market, including Treasuries, government-related and corporate securities, mortgage-backed securities (agency fixed-rate and hybrid adjustable-rate mortgage pass-throughs), asset-backed securities, and commercial mortgage-backed securities. You cannot invest directly in an index. |
| 5 | The Bloomberg Barclays Global Aggregateex-USD Index is an unmanaged index that provides a broad-based measure of the global investment-grade fixed-income markets excluding the U.S. dollar-denominated debt market. You cannot invest directly in an index. |
| 6 | The Bloomberg Barclays Municipal Bond Index is an unmanaged index composed of long-termtax-exempt bonds with a minimum credit rating of Baa. You cannot invest directly in an index. |
| 7 | The ICE BofA U.S. High Yield Index is a market-capitalization-weighted index of domestic and Yankee high-yield bonds. The index tracks the performance of high-yield securities traded in the U.S. bond market. You cannot invest directly in an index. Copyright 2020. ICE Data Indices, LLC. All rights reserved. |
2 | Retail Money Market Funds
Table of Contents
Letter to shareholders (unaudited)
products from China, China responded, and then talks broke down. President Donald Trump threatened to turn his foreign policy tariff tool to Mexico over immigration issues.
Midway through the year, investors regrouped, sentiment turned positive, and U.S. equity markets advanced during June and July. The gains, primarily driven by geopolitical and monetary policy events, pushed equity markets to new highs. European Central Bank President Mario Draghi indicated the bank was ready to cut rates or buy more assets to prop up inflation if needed. President Trump backed off of tariff threats against Mexico and China. In the U.S., the Fed implemented a 0.25% federal funds rate cut in July.
Later in July, the U.S. reversed course and threatened to impose higher tariffs on China’s exports after talks failed. China responded with tariff threats of its own and devalued the renminbi, roiling global markets. Major U.S. stock market indices closed July with the worst weekly results of the year. Bond prices gained as Treasury yields fell to multiyear lows, and the yield curve inverted at multiple points along the30-year arc.
In August, U.S.-China trade tensions continued with no signs of compromise. Evidence of a continued global economic slowdown mounted, and central banks in China, New Zealand, and Thailand cut interest rates. Industrial and manufacturing data declined in China, Canada, Japan, and Germany. Adding to global uncertainty, Italy’s prime minister resigned, many feared a crackdown in Hong Kong as protestors sustained their calls for reform, and Boris Johnson planned to suspend Parliament as Brexit’s deadline neared.
In the U.S., the Fed cut interest rates a second time in September. U.S. manufacturing data disappointed investors. The U.S. Congress announced it would pursue an impeachment investigation of President Trump. Meanwhile, the Brexit impasse showed no signs of resolution. Officials in China said that hitting the country’s economic growth goals for the year would be difficult considering the weight of tariffs and trade restrictions. Although the S&P 500 Index finished the third quarter with the bestyear-to-date returns in more than 20 years, concerns about future returns remained.
The fourth quarter started on a strong note, with U.S.-China trade tensions relaxing in October along with renewed optimism for a U.K. Brexit deal and positive macroeconomic data. The initial estimate of U.S. third-quarter GDP growth was a resilient 1.9% annualized rate, while the U.S. unemployment rate fell to a50-year low of 3.5% in September. However, despite resilience among U.S. consumers, business confidence declined while manufacturing activity contracted. Concerned with a potential economic slowdown, the Fed lowered interest rates another quarter point in late October, its third rate cut in four months. This helped push the S&P 500 Index to a newall-time high, while emerging market equities rallied and global bonds declined overall, reflecting a broad pickup in risk appetite.
Equity markets continued to rally in November despite ongoing geopolitical risks. Hopes for a U.S.-China trade deal buoyed investor confidence. U.S. business sentiment improved slightly, and manufacturing and services activity picked up. Throughout the month, central bank actions were on hold. With that positive backdrop, developed market equities outpaced those in emerging markets, and U.S. stocks, as reflected by the S&P 500 Index, outperformednon-U.S. stocks overall. While consumer confidence and purchasing manager activity rose in the eurozone, China reported weakening manufacturing and consumer data. Bond yields rose marginally, leading to slightly negative returns for global government and investment-grade corporate bonds.
Financial markets ended 2019 on a broadly positive note, with the U.S. and China reaching an accord on a Phase One trade deal, with some details to be worked out. That, along with the landslide win by thepro-Brexit U.K. Conservative Party in a national election and ongoing central bank support, gave investors greater certainty and confidence. U.S. economic indicators were generally positive, with the exception of manufacturing activity and business confidence. However, consumer confidence was resilient, fed by a robust labor market, tame inflation, and lower interest rates, which boosted housing affordability and stimulated homebuyer activity. The impeachment of U.S. President Donald Trump,
“Midway through the year, investors regrouped, sentiment turned positive, and U.S. equity markets advanced.”
“Financial markets ended 2019 on a broadly positive note, with the U.S. and China reaching an accord on a Phase One trade deal.”
Retail Money Market Funds | 3
Table of Contents
Letter to shareholders (unaudited)
while historically noteworthy, had little impact on markets. Meanwhile, slowing Chinese economic activity, partly attributable to the trade war, led to further government stimulus at year-end through lower reserve ratios, allowing banks to lend more money.
Theyear-end rally continued in early January 2020. However, capital market volatility picked up in late January on concerns over the unknown impact of the coronavirus on the global economy and stock markets. With sentiment somewhat souring, perceived safe havens did well in January. The U.S. dollar and Japanese yen both rose and government bonds outperformed equities. While the S&P 500 Index held its ground, emerging market equities tumbled, including those in Asia, that are most exposed to viruses—physical or economic—originating in China.
Following the end of the reporting period, the coronavirus continued its global spread, resulting in disruptions to global markets, including through border closings, restrictions on travel and large gatherings, expedited and enhanced health screenings, quarantines, cancellations, business and school closings, disruptions to employment and supply chains, reduced productivity, and reduced customer and client activity in multiple markets and sectors. The risk of further spreading of the coronavirus has led to significant uncertainty and volatility in the financial markets. The full extent of the coronavirus’s impact on the global economy cannot necessarily be foreseen and the impacts may be short term or may last for an extended period of time.
Don’t let short-term uncertainty derail long-term investment goals.
Periods of investment uncertainty can present challenges, but experience has taught us that maintaining long-term investment goals can be an effective way to plan for the future. To help you create a sound strategy based on your personal goals and risk tolerance, Wells Fargo Funds offers more than 100 mutual funds spanning a wide range of asset classes and investment styles. Although diversification cannot guarantee an investment profit or prevent losses, we believe it can be an effective way to manage investment risk and potentially smooth out overall portfolio performance. We encourage investors to know their investments and to understand that appropriate levels of risk-taking may unlock opportunities.
Thank you for choosing to invest with Wells Fargo Funds. We appreciate your confidence in us and remain committed to helping you meet your financial needs.
Sincerely,

Andrew Owen
President
Wells Fargo Funds
|
For further information about your Fund, contact your investment professional, visit our website atwfam.com, or call us directly at1-800-222-8222. |
4 | Retail Money Market Funds
Table of Contents
This page is intentionally left blank.
Table of Contents
Performance highlights (unaudited)
Investment objective
The Fund seeks current income exempt from federal income tax, while preserving capital and liquidity.
Manager
Wells Fargo Funds Management, LLC
Subadviser
Wells Capital Management Incorporated
Portfolio managers
James Randazzo
Jeffrey L. Weaver, CFA®‡
Average annual total returns (%) as of January 31, 2020
| Expense ratios1 (%) | ||||||||||||||||||||||
| Inception date | 1 year | 5 year | 10 year | Gross | Net2 | |||||||||||||||||
| Class A (NWMXX) | 7-28-2003 | 0.93 | 0.46 | 0.24 | 0.66 | 0.60 | ||||||||||||||||
| Administrator Class (WNTXX) | 4-8-2005 | 1.23 | 0.69 | 0.36 | 0.39 | 0.30 | ||||||||||||||||
| Premier Class (WFNXX) | 11-8-1999 | 1.33 | 0.77 | 0.41 | 0.27 | 0.20 | ||||||||||||||||
| Service Class (MMIXX) | 8-3-1993 | 1.08 | 0.58 | 0.30 | 0.56 | 0.45 | ||||||||||||||||
Yield summary (%) as of January 31, 20202
| Class A | Administrator Class | Premier Class | Service Class | |||||||||||
| 7-day current yield | 0.38 | 0.68 | 0.78 | 0.53 | ||||||||||
| 7-day compound yield | 0.39 | 0.69 | 0.79 | 0.54 | ||||||||||
| 30-day simple yield | 0.44 | 0.74 | 0.84 | 0.59 | ||||||||||
| 30-day compound yield | 0.44 | 0.75 | 0.85 | 0.59 | ||||||||||
Figures quoted represent past performance, which is no guarantee of future results, and do not reflect taxes that shareholder may pay on an investment in a fund. Investment returns will fluctuate. The Fund’s yield figures more closely reflect the current earnings of the Fund than the total return figures. Current performance may be lower or higher than the performance data quoted, which assumes the reinvestment of dividends and capital gains. Currentmonth-end performance is available on the Fund’s website,wfam.com.
Money market funds are sold without a front-end sales charge or contingent deferred sales charge. Other fees and expenses apply to an investment in the Fund and are described in the Fund’s current prospectus.
For retail money market funds: You could lose money by investing in the Fund. Although the Fund seeks to preserve the value of your investment at $1.00 per share, it cannot guarantee it will do so. The Fund may impose a fee upon sale of your shares or may temporarily suspend your ability to sell shares if the Fund’s liquidity falls below required minimums because of market conditions or other factors. An investment in the Fund is not insured or guaranteed by the Federal Deposit Insurance Corporation or any other government agency. The Fund’s sponsor has no legal obligation to provide financial support to the Fund, and you should not expect that the sponsor will provide financial support to the Fund at any time.
Please see footnotes on page 7.
6 | Retail Money Market Funds
Table of Contents
Performance highlights (unaudited)
| Revenue source distribution as of January 31, 20203 |
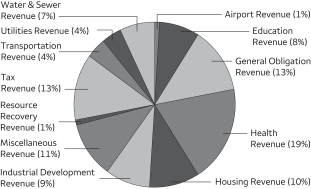 |
| Effective maturity distribution as of January 31, 20203 | ||
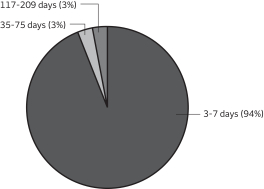 | ||
| Weighted average maturity as of January 31, 20204 |
11 days |
| Weighted average life as of January 31, 20205 |
12 days |
| ‡ | CFA® and Chartered Financial Analyst® are trademarks owned by CFA Institute. |
| 1 | Reflects the expense ratios as stated in the most recent prospectuses. The expense ratios shown are subject to change and may differ from the annualized expense ratios shown in the financial highlights of this report. |
| 2 | The manager has contractually committed through May 31, 2020, to waive fees and/or reimburse expenses to the extent necessary to cap total annual fund operating expenses after fee waivers at 0.60% for Class A, 0.30% for Administrator Class, 0.20% for Premier Class, and 0.45% for Service Class. Brokerage commissions, stamp duty fees, interest, taxes, acquired fund fees and expenses (if any), and extraordinary expenses are excluded from the expense cap. Prior to or after the commitment expiration date, the cap may be increased or the commitment to maintain the cap may be terminated only with the approval of the Board of Trustees. Without this cap, the Fund’s returns would have been lower. Without waived fees and/or reimbursed expenses, the Fund’s7-day current yield would have been 0.33%, 0.60%, 0.72%, and 0.43% for Class A, Administrator Class, Premier Class, and Service Class, respectively. The expense ratio paid by an investor is the net expense ratio (the total annual fund operating expenses after fee waivers) as stated in the prospectuses. |
| 3 | Amounts are calculated based on the total investments of the Fund. These amounts are subject to change and may have changed since the date specified. |
| 4 | Weighted Average Maturity (WAM): WAM is an average of the effective maturities of all securities held in the portfolio, weighted by each security’s percentage of total investments. The maturity of a portfolio security is the period remaining until the date on which the principal amount is unconditionally required to be paid, or in the case of a security called for redemption, the date on which the redemption payment is unconditionally required to be made. WAM calculations allow for the maturities of certain securities with demand features or periodic interest rate resets to be shortened. WAM is a way to measure a fund’s sensitivity to potential interest rate changes. WAM is subject to change and may have changed since the date specified. |
| 5 | Weighted Average Life (WAL): WAL is an average of the final maturities of all securities held in the portfolio, weighted by their percentage of total investments. The maturity of a portfolio security is the period remaining until the date on which the principal amount is unconditionally required to be paid, or in the case of a security called for redemption, the date on which the redemption payment is unconditionally required to be made. In contrast to WAM, the calculation of WAL allows for the maturities of certain securities with demand features to be shortened, but not the periodic interest rate resets. WAL is a way to measure a fund’s potential sensitivity to credit spread changes. WAL is subject to change and may have changed since the date specified. |
| 6 | The Securities Industry and Financial Markets Association (SIFMA) Municipal Swap Index (SIFMA Index) is aseven-day high-grade market index composed oftax-exempt variable-rate demand obligations with certain characteristics. The index is calculated and published by Bloomberg. The index is overseen by SIFMA’s Municipal Swap Index Committee. You cannot invest directly in an index. |
Retail Money Market Funds | 7
Table of Contents
Performance highlights (unaudited)
MANAGER’S DISCUSSION
During the period, the municipal money market space continued to be heavily influenced by a combination of macroeconomic factors, the lingering effects of 2017 tax reform, and typical seasonality. Municipal money market rates generally tracked taxable equivalent rates lower as the U.S. Federal Reserve (Fed) embarked on an easing policy highlighted by three cuts to the federal funds rate in the months of July, September, and October. The municipal market in general has also been affected by the tremendous shift in investor appetite fortax-advantaged municipals following the tax reform legislation implemented at the end of 2017. Longer-dated municipal bond funds experienced record-setting inflows as investor demand shifted further out on the curve. Conversely, municipal money market funds experienced roughly $6 billion in outflows throughout the year as ratios oftax-exempt to taxable investments experienced significant pressure due to continuing supply and demand imbalances.
In the short end of the municipal money market sector, the SIFMA Index6 began the period at 1.43%, or 59% of1-week London Interbank Offered Rate (LIBOR), down from 1.71%, or 71% of1-week LIBOR, at the end of 2018. Short-term yields began to quickly grind lower as seasonal cash inflows reinvigorated demand for overnight and weekly variable-rate demand notes (VRDNs) and tender option bonds (TOBs). Throughout the period, the supply/demand dynamic for VRDNs and TOBs experienced typical seasonal swings. For example, during tax time, the SIFMA Index spiked to a multi-year high of 2.30% (95% of1-week LIBOR) on April 24. The SIFMA Index would experience other patches of weakness around quarter-ends, in sympathy with taxable equivalents. For example, the SIFMA Index spiked from 1.40% at the beginning of June to 1.90% byquarter-end. Similarly, the index spiked to 1.58% at the end of September, up from 1.28% at the beginning of the month. Although absolute levels slowly drifted lower as the Federal Open Market Committee (FOMC) continued to cut rates during the fall, atyear-end, the SIFMA Index would spike to 1.61%, or 99% of1-week LIBOR, up from 1.06% at the beginning of the month, due toyear-end pressures.
Further out on the curve, municipal money markets were generally immune to the volatility experienced in the overnight and weekly sectors. Demand for high-grade paper in theone-year area remained consistently strong throughout the period. Yields on high-grade paper in theone-year space began the period at roughly 1.74% but drifted lower as the year progressed. By late June,one-year paper had fallen to a low of approximately 1.30% as note season came into full effect. In August, the state of Texas issued $8 billion in tax and revenue anticipation notes in the 1.25%–1.32% range. The largest deal of the period was priced to attract both money market funds and longer-term investors. After the three rate cuts by the Fed, market participants began to price in the prospects of an FOMC on hold. Accordingly,one-year yields stabilized and closed out the period at roughly 0.95%, driven primarily by strong inflows into municipal fixed-income funds.
Strategic outlook
At the close of the reporting period, we were focused on a few unresolved items that could influence markets for the remainder of the calendar year, namely Brexit; trade issues and tariffs; the conclusion or continuation of temporary Fed liquidity operations, Fed Treasury bill purchases, and other quantitative easing measures; and finally, the election. With the Fed appearing to be on hold for now, credit fundamentals continue to be supportive and the yield curve is slightly positively sloped.
However, just as the fiscal year ended, in February and March 2020, the coronavirus began to spread globally, prompting consumers, businesses, and governments to take unusually strong actions in an attempt to limit its impact. In so doing, it appears that there could be a serious toll on the U.S. and global economy. In the face of this uncertainty, equity and bond markets experienced sharp outflows, and short-term markets, especially government markets, experienced a high degree of inflows. With liquidity at a premium, volatility flowed through to the short end of the credit markets, prompting a series of supportive actions by the Fed. In the face of all this, we continue to believe that our investment strategy, with its focus on capital preservation and liquidity, is as important as ever.
Please see footnotes on page 7.
8 | Retail Money Market Funds
Table of Contents
As a shareholder of the Fund, you incur ongoing costs, including management fees, shareholder servicing fees, and other Fund expenses. This example is intended to help you understand your ongoing costs (in dollars) of investing in the Fund and to compare these costs with the ongoing costs of investing in other mutual funds.
The example is based on an investment of $1,000 invested at the beginning of thesix-month period and held for the entire period from August 1, 2019 to January 31, 2020.
Actual expenses
The “Actual” line of the table below provides information about actual account values and actual expenses. You may use the information in this line, together with the amount you invested, to estimate the expenses that you paid over the period. Simply divide your account value by $1,000 (for example, an $8,600 account value divided by $1,000 = 8.6), then multiply the result by the number in the “Actual” line under the heading entitled “Expenses paid during period” for your applicable class of shares to estimate the expenses you paid on your account during this period.
Hypothetical example for comparison purposes
The “Hypothetical” line of the table below provides information about hypothetical account values and hypothetical expenses based on the Fund’s actual expense ratio and an assumed rate of return of 5% per year before expenses, which is not the Fund’s actual return. The hypothetical account values and expenses may not be used to estimate the actual ending account balance or expenses you paid for the period. You may use this information to compare the ongoing costs of investing in the Fund and other funds. To do so, compare this 5% hypothetical example with the 5% hypothetical examples that appear in the shareholder reports of the other funds.
Please note that the expenses shown in the table are meant to highlight your ongoing costs only. Therefore, the “Hypothetical” line of the table is useful in comparing ongoing costs only and will not help you determine the relative total costs of owning different funds.
| Beginning account value 8-1-2019 | Ending account value 1-31-2020 | Expenses paid during the period1 | Annualized net expense ratio | |||||||||||||
Class A | ||||||||||||||||
Actual | $ | 1,000.00 | $ | 1,003.80 | $ | 3.02 | 0.60 | % | ||||||||
Hypothetical (5% return before expenses) | $ | 1,000.00 | $ | 1,022.12 | $ | 3.05 | 0.60 | % | ||||||||
Administrator Class | ||||||||||||||||
Actual | $ | 1,000.00 | $ | 1,005.32 | $ | 1.51 | 0.30 | % | ||||||||
Hypothetical (5% return before expenses) | $ | 1,000.00 | $ | 1,023.63 | $ | 1.53 | 0.30 | % | ||||||||
Premier Class | ||||||||||||||||
Actual | $ | 1,000.00 | $ | 1,005.82 | $ | 1.01 | 0.20 | % | ||||||||
Hypothetical (5% return before expenses) | $ | 1,000.00 | $ | 1,024.13 | $ | 1.02 | 0.20 | % | ||||||||
Service Class | ||||||||||||||||
Actual | $ | 1,000.00 | $ | 1,004.56 | $ | 2.27 | 0.45 | % | ||||||||
Hypothetical (5% return before expenses) | $ | 1,000.00 | $ | 1,022.87 | $ | 2.29 | 0.45 | % | ||||||||
| 1 | Expenses paid is equal to the annualized net expense ratio of each class multiplied by the average account value over the period, multiplied by the number of days in the most recent fiscal half-year divided by the number of days in the fiscal year (to reflect theone-half-year period). |
Retail Money Market Funds | 9
Table of Contents
Portfolio of investments—January 31, 2020
| Interest rate | Maturity date | Principal | Value | |||||||||||||
| Municipal Obligations: 97.65% |
| |||||||||||||||
Alabama: 0.85% |
| |||||||||||||||
| Variable Rate Demand Notes ø: 0.85% | ||||||||||||||||
Alabama Federal Aid Highway Finance Authority Series2016-A Tender Option Bond Trust Receipts/Floater Certificates Series 2016-XF2373 (Tax Revenue, Citibank NA LIQ) 144A | 0.97 | % | 9-1-2024 | $ | 5,000,000 | $ | 5,000,000 | |||||||||
Alabama Tender Option Bond Trust Receipts/Floater Certificates Series2018-XL0098 (Utilities Revenue, Royal Bank of Canada LIQ) 144A | 1.03 | 12-1-2022 | 4,500,000 | 4,500,000 | ||||||||||||
| 9,500,000 | ||||||||||||||||
|
| |||||||||||||||
Alaska: 1.17% |
| |||||||||||||||
| Variable Rate Demand Notes ø: 1.17% | ||||||||||||||||
Alaska Housing Finance Corporation Series B (Housing Revenue, FHLB SPA) | 0.94 | 12-1-2041 | 2,400,000 | 2,400,000 | ||||||||||||
Valdez AK Marine Terminal ExxonMobil Pipeline Company Project Series 1985 (Industrial Development Revenue) | 1.19 | 10-1-2025 | 700,000 | 700,000 | ||||||||||||
Valdez AK Marine Terminal ExxonMobil Pipeline Company Project Series 2001 (Industrial Development Revenue) | 1.19 | 12-1-2029 | 10,000,000 | 10,000,000 | ||||||||||||
| 13,100,000 | ||||||||||||||||
|
| |||||||||||||||
Arizona: 2.22% |
| |||||||||||||||
| Variable Rate Demand Notes ø: 2.22% | ||||||||||||||||
Arizona Health Facilities Authority Banner Health Series B (Health Revenue, MUFG Bank Limited LOC) | 1.14 | 1-1-2046 | 10,000,000 | 10,000,000 | ||||||||||||
Arizona Tender Option Bond Trust Receipts/Floater Certificates Series2018-XF2537 (Utilities Revenue, Barclays Bank plc LOC, Barclays Bank plc LIQ) 144A | 0.98 | 12-1-2037 | 3,215,000 | 3,215,000 | ||||||||||||
Mesa AZ Utility System Clipper Tax-Exempt Certificate Trust Series2009-33 (Miscellaneous Revenue, State Street Bank & Trust Company LIQ) | 0.97 | 7-1-2024 | 10,055,000 | 10,055,000 | ||||||||||||
Phoenix AZ IDA Various Mayo Clinic Series A (Health Revenue, Bank of America NA SPA) | 1.17 | 11-15-2052 | 1,500,000 | 1,500,000 | ||||||||||||
| 24,770,000 | ||||||||||||||||
|
| |||||||||||||||
California: 8.32% |
| |||||||||||||||
| Variable Rate Demand Notes ø: 8.32% | ||||||||||||||||
California Municipal Finance Authority High Desert Foundation Project Series 2012A (Education Revenue, Union Bank NA LOC) | 0.98 | 4-1-2042 | 1,150,000 | 1,150,000 | ||||||||||||
California State University Series A Tender Option Bond Trust Receipts/Certificates Series 2017-XF2441 (Education Revenue, JPMorgan Chase & Company LIQ) 144A | 0.92 | 5-1-2024 | 7,670,000 | 7,670,000 | ||||||||||||
California Statewide Community Development Authority Uptown Newport Apartments Series 2017 AA & BB (Housing Revenue, East West Bank LOC) | 0.98 | 3-1-2057 | 6,975,000 | 6,975,000 | ||||||||||||
California Tender Option Bond Trust Receipts/Floater Certificates Santa Clara County CA San Jose Unified School District Series 2015-ZF0179 (GO Revenue, JPMorgan Chase & Company LIQ) 144A | 1.09 | 8-1-2022 | 2,050,000 | 2,050,000 | ||||||||||||
California Tender Option Bond Trust Receipts/Floater Certificates Series2017-XF0580 (GO Revenue, TD Bank NA LIQ) 144A | 0.94 | 11-1-2033 | 3,375,000 | 3,375,000 | ||||||||||||
California Tender Option Bond Trust Receipts/Floater Certificates Series2018-XF0669 (GO Revenue, Royal Bank of Canada LIQ) 144A | 0.95 | 2-1-2026 | 2,500,000 | 2,500,000 | ||||||||||||
California Tender Option Bond Trust Receipts/Floater Certificates Series2018-XF2630 (Health Revenue, Barclays Bank plc LOC, Barclays Bank plc LIQ) 144A | 0.94 | 8-1-2045 | 2,900,000 | 2,900,000 | ||||||||||||
The accompanying notes are an integral part of these financial statements.
10 | Retail Money Market Funds
Table of Contents
Portfolio of investments—January 31, 2020
| Interest rate | Maturity date | Principal | Value | |||||||||||||
| Variable Rate Demand Notes ø (continued) | ||||||||||||||||
California Tender Option Bond Trust Receipts/Floater Certificates Series2018-XG0188 (GO Revenue, Royal Bank of Canada LIQ) 144A | 0.95 | % | 2-1-2026 | $ | 1,600,000 | $ | 1,600,000 | |||||||||
California Tender Option Bond Trust Receipts/Floater Certificates Series2018-ZP0159 (GO Revenue, JPMorgan Chase & Company LIQ) 144A | 1.09 | 8-1-2022 | 4,500,000 | 4,500,000 | ||||||||||||
California Tender Option Bond Trust Receipts/Floater Certificates Series2019-XF2830 (GO Revenue, Mizuho Capital Markets LLC LIQ) 144A | 1.09 | 10-1-2034 | 3,460,000 | 3,460,000 | ||||||||||||
California Tender Option Bond Trust Receipts/Floater Certificates Series2019-XF2835 (Education Revenue, Mizuho Capital Markets LLC LOC, Mizuho Capital Markets LLC LIQ) 144A | 1.09 | 7-1-2042 | 7,235,000 | 7,235,000 | ||||||||||||
Mizuho Floater/Residual Interest Bond Series 2019-MIZ9007 (Housing Revenue, Mizuho Capital Markets LLC LOC, Mizuho Capital Markets LLC LIQ) 144A | 1.19 | 1-1-2040 | 17,000,000 | 17,000,000 | ||||||||||||
Mizuho Tender Option Bond Trust Receipts/Floater Certificates Series2019-MIZ9002 (Tax Revenue, Mizuho Capital Markets LLC LOC, Mizuho Capital Markets LLC LIQ) 144A | 1.11 | 3-1-2021 | 30,000,000 | 30,000,000 | ||||||||||||
San Joaquin CA Delta Community College Tender Option Bond Trust Receipts/Floater Certificates Series 2015-ZF0180 (GO Revenue, JPMorgan Chase & Company LIQ) 144A | 1.04 | 8-1-2022 | 2,415,000 | 2,415,000 | ||||||||||||
| 92,830,000 | ||||||||||||||||
|
| |||||||||||||||
Colorado: 1.20% |
| |||||||||||||||
| Variable Rate Demand Notes ø: 1.20% | ||||||||||||||||
Colorado ECFA Variable Nature Conservancy Project Series 2012 (Miscellaneous Revenue, The National Conservancy DC) | 0.94 | 7-1-2033 | 2,500,000 | 2,500,000 | ||||||||||||
Colorado HFA Catholic Health Initiatives Series2008-D2 (Health Revenue, Morgan Stanley Bank LIQ) 144A | 1.09 | 10-1-2037 | 9,000,000 | 9,000,000 | ||||||||||||
Colorado Tender Option Bond Trust Receipts/Floater Certificates Series2018-XF0668 (Health Revenue, Royal Bank of Canada LIQ) 144A | 0.97 | 5-15-2026 | 1,875,000 | 1,875,000 | ||||||||||||
| 13,375,000 | ||||||||||||||||
|
| |||||||||||||||
Connecticut: 1.55% |
| |||||||||||||||
| Variable Rate Demand Notes ø: 1.55% | ||||||||||||||||
Connecticut HFA Home Mortgage Finance Program Bonds SeriesD-3 (Housing Revenue, State Street Bank & Trust Company SPA) | 0.92 | 11-15-2043 | 10,000,000 | 10,000,000 | ||||||||||||
Connecticut Residual Interest Bond Floater Trust Series2017-016 (Miscellaneous Revenue, Barclays Bank plc LOC, Barclays Bank plc LIQ) 144A | 0.98 | 6-1-2037 | 2,800,000 | 2,800,000 | ||||||||||||
Connecticut Tender Option Bond Trust Receipts/Floater Certificates Series 2017-YX1077 (Tax Revenue, Barclays Bank plc LIQ) 144A | 1.00 | 1-1-2036 | 4,550,000 | 4,550,000 | ||||||||||||
| 17,350,000 | ||||||||||||||||
|
| |||||||||||||||
Delaware: 0.13% |
| |||||||||||||||
| Variable Rate Demand Note ø: 0.13% | ||||||||||||||||
University of Delaware Series C (Education Revenue, TD Bank NA SPA) | 1.21 | 11-1-2037 | 1,500,000 | 1,500,000 | ||||||||||||
|
| |||||||||||||||
District of Columbia: 1.08% |
| |||||||||||||||
| Variable Rate Demand Notes ø: 1.08% | ||||||||||||||||
District of Columbia Community Connection Real Estate Foundation Issue Series2007-A (Miscellaneous Revenue, Manufacturers & Traders LOC) | 0.99 | 7-1-2032 | 3,165,000 | 3,165,000 | ||||||||||||
District of Columbia Tender Option Bond Trust Receipts/Floater Certificates Series 2018-XF0621 (Water & Sewer Revenue, Royal Bank of Canada LIQ) 144A | 0.97 | 4-1-2026 | 4,000,000 | 4,000,000 | ||||||||||||
The accompanying notes are an integral part of these financial statements.
Retail Money Market Funds | 11
Table of Contents
Portfolio of investments—January 31, 2020
| Interest rate | Maturity date | Principal | Value | |||||||||||||
| Variable Rate Demand Notes ø (continued) | ||||||||||||||||
District of Columbia Tender Option Bond Trust Receipts/Floater Certificates Series 2019-ZF2784 (Housing Revenue, FHA Insured, Morgan Stanley Bank LIQ) 144A | 0.98 | % | 9-1-2039 | $ | 2,800,000 | $ | 2,800,000 | |||||||||
District of Columbia Tender Option Bond Trust Receipts/Floater Certificates Series 2019-ZF2785 (Housing Revenue, FHA Insured, Morgan Stanley Bank LIQ) 144A | 0.98 | 9-1-2039 | 2,070,000 | 2,070,000 | ||||||||||||
| 12,035,000 | ||||||||||||||||
|
| |||||||||||||||
Florida: 6.49% |
| |||||||||||||||
| Variable Rate Demand Notes ø: 6.49% | ||||||||||||||||
Florida Tender Option Bond Trust Receipts/Floater Certificates Series2017-XF2517 (Health Revenue, Morgan Stanley Bank LIQ) 144A | 1.04 | 8-15-2047 | 7,920,000 | 7,920,000 | ||||||||||||
Florida Tender Option Bond Trust Receipts/Floater Certificates Series2017-ZM0571 (Health Revenue, Morgan Stanley Bank LIQ) 144A | 1.04 | 8-15-2047 | 4,730,000 | 4,730,000 | ||||||||||||
Florida Tender Option Bond Trust Receipts/Floater Certificates Series2018-XF2523 (Health Revenue, Barclays Bank plc LIQ) 144A | 1.04 | 8-15-2047 | 6,000,000 | 6,000,000 | ||||||||||||
Florida Tender Option Bond Trust Receipts/Floater Certificates Series2018-XF2530 (Health Revenue, Citibank NA LIQ) 144A | 1.04 | 8-15-2025 | 3,000,000 | 3,000,000 | ||||||||||||
Florida Tender Option Bond Trust Receipts/Floater Certificates Series2018-XG0173 (Health Revenue, Credit Suisse LIQ) 144A | 1.04 | 10-1-2025 | 11,000,000 | 11,000,000 | ||||||||||||
Highlands County FL Health Facilities Authority Adventist Health System Sunbelt Obligated Group Series 2012I-2 (Health Revenue, Adventist Health System) | 0.91 | 11-15-2032 | 600,000 | 600,000 | ||||||||||||
Highlands County FL HFA Adventist Health System Series I5 (Health Revenue) | 0.95 | 11-15-2035 | 19,450,000 | 19,450,000 | ||||||||||||
Orlando & Orange County FL Expressway Authority Series 2007 (Transportation Revenue, BHAC/AGM Insured, Citibank NA LIQ) | 0.97 | 7-1-2042 | 6,000,000 | 6,000,000 | ||||||||||||
Pinellas County FL IDA Neighborly Care Network Project Series 2008 (Miscellaneous Revenue, Branch Banking & Trust LOC) | 0.93 | 8-1-2028 | 2,985,000 | 2,985,000 | ||||||||||||
Saint Lucie County FL Florida Power & Light Company (Industrial Development Revenue) | 1.20 | 9-1-2028 | 5,485,000 | 5,485,000 | ||||||||||||
Seminole County FL Tender Option Bond Trust Receipts/Floater Certificates Series 2016-ZF0444 (Tax Revenue, National Insured, JPMorgan Chase & Company LIQ) 144A | 1.09 | 4-1-2027 | 5,250,000 | 5,250,000 | ||||||||||||
| 72,420,000 | ||||||||||||||||
|
| |||||||||||||||
Georgia: 1.77% |
| |||||||||||||||
| Variable Rate Demand Notes ø: 1.77% | ||||||||||||||||
Georgia Tender Option Bond Trust Receipts/Floater Certificates Series2017-ZF0589 (Education Revenue, Bank of America NA LIQ) 144A | 0.98 | 6-1-2049 | 3,750,000 | 3,750,000 | ||||||||||||
Georgia Tender Option Bond Trust Receipts/Floater Certificates Series 2019-XF2847 (Education Revenue, Barclays Bank plc LOC, Barclays Bank plc LIQ) 144A | 0.98 | 1-1-2056 | 4,315,000 | 4,315,000 | ||||||||||||
Monroe County GA Development Authority Poll Control Oglethorpe Power Corporation Scherer Project Series A (Utilities Revenue, Truist Bank LOC) | 0.88 | 1-1-2036 | 11,650,000 | 11,650,000 | ||||||||||||
| 19,715,000 | ||||||||||||||||
|
| |||||||||||||||
Idaho: 0.09% |
| |||||||||||||||
| Variable Rate Demand Note ø: 0.09% | ||||||||||||||||
Idaho Health Facilities Authority Revenue Bonds St. Luke’s Health System Project Series 2018C (Health Revenue, U.S. Bank NA LOC) | 1.15 | 3-1-2048 | 1,000,000 | 1,000,000 | ||||||||||||
|
| |||||||||||||||
Illinois: 10.20% |
| |||||||||||||||
| Variable Rate Demand Notes ø: 10.20% | ||||||||||||||||
Chicago IL Education Marine Project Series 1984 (Industrial Development Revenue, FHLB LOC) | 1.00 | 7-1-2023 | 4,200,000 | 4,200,000 | ||||||||||||
The accompanying notes are an integral part of these financial statements.
12 | Retail Money Market Funds
Table of Contents
Portfolio of investments—January 31, 2020
| Interest rate | Maturity date | Principal | Value | |||||||||||||
| Variable Rate Demand Notes ø (continued) | ||||||||||||||||
Illinois Development Finance Authority Evanston Northwestern Healthcare Corporation Series B (Health Revenue, JPMorgan Chase & Company SPA) | 1.18 | % | 5-1-2031 | $ | 2,700,000 | $ | 2,700,000 | |||||||||
Illinois Educational Facilities Authority Aurora University (Education Revenue, Harris NA LOC) | 0.93 | 3-1-2032 | 4,600,000 | 4,600,000 | ||||||||||||
Illinois Finance Authority Bradley University Series B (Other Revenue, Northern Trust Corporation LOC) (Education Revenue, PNC Bank NA LOC) | 0.95 | 4-1-2038 | 4,600,000 | 4,600,000 | ||||||||||||
Illinois Finance Authority Northwestern University Series B (Education Revenue) | 1.00 | 12-1-2046 | 6,050,000 | 6,050,000 | ||||||||||||
Illinois Health Facilities Authority Evanston Hospital Corporation Series 1995 (Health Revenue, JPMorgan Chase & Company SPA) | 0.98 | 6-1-2035 | 9,500,000 | 9,500,000 | ||||||||||||
Illinois International Port District Facilities (Airport Revenue, U.S. Bank NA LOC) | 0.97 | 1-1-2023 | 3,950,000 | 3,950,000 | ||||||||||||
Illinois Tender Option Bond Trust Receipts/Floater Certificates Series 2015-XF2202 (Transportation Revenue, Citibank NA LIQ) 144A | 0.97 | 7-1-2023 | 1,140,000 | 1,140,000 | ||||||||||||
Illinois Tender Option Bond Trust Receipts/Floater Certificates Series 2015-ZM0120 (Transportation Revenue, Royal Bank of Canada LIQ) 144A | 1.00 | 7-1-2023 | 3,100,000 | 3,100,000 | ||||||||||||
Illinois Tender Option Bond Trust Receipts/Floater Certificates Series 2017-XG0108 (Tax Revenue, Barclays Bank plc LOC, Barclays Bank plc LIQ) 144A | 1.09 | 4-1-2046 | 18,000,000 | 18,000,000 | ||||||||||||
Illinois Tender Option Bond Trust Receipts/Floater Certificates Series 2018-XF0722 (Tax Revenue, Royal Bank of Canada LIQ) 144A | 1.09 | 7-1-2026 | 7,900,000 | 7,900,000 | ||||||||||||
Illinois Tender Option Bond Trust Receipts/Floater Certificates Series 2018-XM0683 (Tax Revenue, Bank of America NA LIQ) 144A | 1.11 | 1-1-2048 | 8,340,000 | 8,340,000 | ||||||||||||
Illinois Tender Option Bond Trust Receipts/Floater Certificates Series 2018-XX1081 (Miscellaneous Revenue, Barclays Bank plc LOC, Barclays Bank plc LIQ) 144A | 1.00 | 11-1-2023 | 6,000,000 | 6,000,000 | ||||||||||||
Illinois Tender Option Bond Trust Receipts/Floater Certificates Series 2019-XF0779 (Tax Revenue, BAM Insured, TD Bank NA LIQ) 144A | 1.02 | 1-1-2048 | 15,500,000 | 15,500,000 | ||||||||||||
lllinois Tender Option Bond Trust Receipts/Floater Certificates Series 2018-XF0603 (Tax Revenue, Royal Bank of Canada LIQ) 144A | 1.09 | 1-1-2026 | 3,615,000 | 3,615,000 | ||||||||||||
lllinois Tender Option Bond Trust Receipts/Floater Certificates Series 2018-XM0713 (Tax Revenue, Morgan Stanley Bank LIQ) 144A | 1.09 | 1-1-2043 | 10,000,000 | 10,000,000 | ||||||||||||
Quad Cities Illinois Regional EDA Augustana College Series 2005 (Education Revenue, Harris NA LOC) | 0.94 | 10-1-2035 | 4,700,000 | 4,700,000 | ||||||||||||
| 113,895,000 | ||||||||||||||||
|
| |||||||||||||||
Indiana: 2.17% |
| |||||||||||||||
| Variable Rate Demand Notes ø: 2.17% | ||||||||||||||||
Indiana Certificate of Participation Clipper Tax-Exempt Certificate Trust Series2009-34 (Miscellaneous Revenue, State Street Bank & Trust Company LIQ) | 0.98 | 7-1-2023 | 9,915,000 | 9,915,000 | ||||||||||||
Indiana Finance Authority Duke Energy Indiana Incorporated Series2009A-4 (Industrial Development Revenue, Sumitomo Mitsui Banking LOC) | 1.20 | 12-1-2039 | 14,355,000 | 14,355,000 | ||||||||||||
| 24,270,000 | ||||||||||||||||
|
| |||||||||||||||
Iowa: 3.06% |
| |||||||||||||||
| Variable Rate Demand Notes ø: 3.06% | ||||||||||||||||
Iowa Finance Authority Midwestern EDA CJ Bio America Incorporated Project (Industrial Development Revenue, Korea Development Bank LOC) | 1.17 | 4-1-2022 | 28,615,000 | 28,615,000 | ||||||||||||
Iowa Finance Authority Mortgage Securities Program Series D (Housing Revenue, GNMA/FNMA/FHLMC Insured, FNMA LIQ, FHLB SPA) | 0.94 | 1-1-2047 | 5,500,000 | 5,500,000 | ||||||||||||
| 34,115,000 | ||||||||||||||||
|
| |||||||||||||||
Kentucky: 0.49% |
| |||||||||||||||
| Variable Rate Demand Note ø: 0.49% | ||||||||||||||||
Kentucky Tender Option Bond Trust Receipts/Floater Certificates Series 2018-XG0161 (Tax Revenue, Bank of America NA LOC, AGM Insured, Bank of America NA LIQ) 144A | 0.97 | 12-1-2041 | 5,460,000 | 5,460,000 | ||||||||||||
|
| |||||||||||||||
The accompanying notes are an integral part of these financial statements.
Retail Money Market Funds | 13
Table of Contents
Portfolio of investments—January 31, 2020
| Interest rate | Maturity date | Principal | Value | |||||||||||||
Louisiana: 1.10% |
| |||||||||||||||
| Variable Rate Demand Note ø: 1.10% | ||||||||||||||||
Louisiana Tender Option Bond Trust Receipts/Floater Certificates Series 2018-BAML7002 (Health Revenue, Bank of America NA LOC, Bank of America NA LIQ) 144A | 0.99 | % | 9-1-2057 | $ | 12,325,000 | $ | 12,325,000 | |||||||||
|
| |||||||||||||||
Maryland: 1.72% |
| |||||||||||||||
| Variable Rate Demand Notes ø: 1.72% | ||||||||||||||||
Maryland Tender Option Bond Trust Receipts/Floater Certificates Series 2018-XF0605 (Education Revenue, Bank of America NA LIQ) 144A | 0.99 | 5-1-2047 | 3,300,000 | 3,300,000 | ||||||||||||
Maryland Tender Option Bond Trust Receipts/Floater Certificates Series 2019-XF2832 (Housing Revenue, Mizuho Capital Markets LLC LOC, Mizuho Capital Markets LLC LIQ) 144A | 1.09 | 7-1-2037 | 15,900,000 | 15,900,000 | ||||||||||||
| 19,200,000 | ||||||||||||||||
|
| |||||||||||||||
Massachusetts: 0.08% |
| |||||||||||||||
| Variable Rate Demand Note ø: 0.08% | ||||||||||||||||
Massachusetts HEFA Partners Healthcare Systems Series F3 (Health Revenue, TD Bank NA LOC) | 0.90 | 7-1-2040 | 900,000 | 900,000 | ||||||||||||
|
| |||||||||||||||
Michigan: 0.99% |
| |||||||||||||||
| Variable Rate Demand Notes ø: 0.99% | ||||||||||||||||
Michigan Housing Development Authority Series D (Housing Revenue, Industrial & Commercial Bank of China Limited SPA) | 1.04 | 6-1-2030 | 2,165,000 | 2,165,000 | ||||||||||||
St. Joseph MI Hospital Finance Authority Lakeland Hospital Niles & St. Joseph Obligated Group Series 2002 (Health Revenue, AGM Insured, JPMorgan Chase & Company SPA) | 1.04 | 1-1-2032 | 8,855,000 | 8,855,000 | ||||||||||||
| 11,020,000 | ||||||||||||||||
|
| |||||||||||||||
Minnesota: 1.56% |
| |||||||||||||||
| Variable Rate Demand Notes ø: 1.56% | ||||||||||||||||
Burnsville MN Bridgeway Apartments Project Series 2003 (Housing Revenue, FNMA LOC, FNMA LIQ) | 1.02 | 10-15-2033 | 2,375,000 | 2,375,000 | ||||||||||||
Forest Lake MN Kilkenny Court Apartments Project Series 2008 (Housing Revenue, FNMA LOC, FNMA LIQ) | 1.03 | 8-15-2038 | 4,415,000 | 4,415,000 | ||||||||||||
Minneapolis & St. Paul MN Housing & RDA Allina Health Systems SeriesB-1 (Health Revenue, JPMorgan Chase & Company LOC) | 1.17 | 11-15-2035 | 3,500,000 | 3,500,000 | ||||||||||||
Minneapolis & St. Paul MN Housing & RDA Children’s Hospital Clinics Series A (Miscellaneous Revenue, AGM Insured, U.S. Bank NA LIQ, U.S. Bank NA SPA) | 1.08 | 8-15-2037 | 4,200,000 | 4,200,000 | ||||||||||||
Plymouth MN Lancaster Village Apartments Project Series 2001 (Housing Revenue, FNMA LOC, FNMA LIQ) | 1.02 | 9-15-2031 | 2,865,000 | 2,865,000 | ||||||||||||
| 17,355,000 | ||||||||||||||||
|
| |||||||||||||||
Missouri: 1.63% |
| |||||||||||||||
| Variable Rate Demand Notes ø: 1.63% | ||||||||||||||||
Missouri Tender Option Bond Trust Receipts/Floater Certificates Series 2015-XF2198 (Water & Sewer Revenue, Citibank NA LIQ) 144A | 0.97 | 5-1-2023 | 2,670,000 | 2,670,000 | ||||||||||||
Missouri Tender Option Bond Trust Receipts/Floater Certificates Series 2018-XG0176 (Health Revenue, Royal Bank of Canada LIQ) 144A | 1.04 | 5-15-2041 | 8,000,000 | 8,000,000 | ||||||||||||
St. Louis County MO Sewer District Wastewater System Series2013-B (Water & Sewer Revenue, Morgan Stanley Bank LIQ) 144A | 0.97 | 5-1-2043 | 7,500,000 | 7,500,000 | ||||||||||||
| 18,170,000 | ||||||||||||||||
|
| |||||||||||||||
The accompanying notes are an integral part of these financial statements.
14 | Retail Money Market Funds
Table of Contents
Portfolio of investments—January 31, 2020
| Interest rate | Maturity date | Principal | Value | |||||||||||||
Nebraska: 0.94% |
| |||||||||||||||
| Variable Rate Demand Note ø: 0.94% | ||||||||||||||||
Nebraska Investment Finance Authority MFHR Apple Creek Associates Project Series1985-A (Housing Revenue, Northern Trust Company LOC) | 1.73 | % | 9-1-2031 | $ | 10,500,000 | $ | 10,500,000 | |||||||||
|
| |||||||||||||||
Nevada: 0.74% |
| |||||||||||||||
| Variable Rate Demand Notes ø: 0.74% | ||||||||||||||||
Nevada Tender Option Bond Trust Receipts/Floater Certificates Series 2015-ZF0155 (GO Revenue, JPMorgan Chase & Company LIQ) 144A | 1.12 | 6-1-2020 | 5,000,000 | 5,000,000 | ||||||||||||
Nevada Tender Option Bond Trust Receipts/Floater Certificates Series 2018-ZM0639 (GO Revenue, JPMorgan Chase & Company LIQ) 144A | 0.97 | 12-1-2025 | 3,240,000 | 3,240,000 | ||||||||||||
| 8,240,000 | ||||||||||||||||
|
| |||||||||||||||
New Jersey: 3.35% |
| |||||||||||||||
| Variable Rate Demand Notes ø: 3.35% | ||||||||||||||||
New Jersey Tender Option Bond Trust Receipts/Floater Certificates Series 2016-XM0226 (Miscellaneous Revenue, BHAC/National Insured, Bank of America NA LIQ) 144A | 0.94 | 7-1-2026 | 10,220,000 | 10,220,000 | ||||||||||||
New Jersey Tender Option Bond Trust Receipts/Floater Certificates Series 2018-XF2538 (Education Revenue, Barclays Bank plc LOC, Barclays Bank plc LIQ) 144A | 0.97 | 6-15-2040 | 2,810,000 | 2,810,000 | ||||||||||||
New Jersey Tender Option Bond Trust Receipts/Floater Certificates Series 2018-XG0205 (Education Revenue, Barclays Bank plc LOC, Barclays Bank plc LIQ) 144A | 0.97 | 12-15-2034 | 5,600,000 | 5,600,000 | ||||||||||||
New Jersey Tender Option Bond Trust Receipts/Floater Certificates Series 2018-XX1093 (Education Revenue, Barclays Bank plc LOC, Barclays Bank plc LIQ) 144A | 0.97 | 6-15-2031 | 9,500,000 | 9,500,000 | ||||||||||||
New Jersey Tender Option Bond Trust Receipts/Floater Certificates Series 2019-XG0258 (Tax Revenue, Barclays Bank plc LOC, Barclays Bank plc LIQ) 144A | 0.97 | 6-15-2050 | 9,265,000 | 9,265,000 | ||||||||||||
| 37,395,000 | ||||||||||||||||
|
| |||||||||||||||
New York: 12.35% |
| |||||||||||||||
| Other Municipal Debt: 1.80% | ||||||||||||||||
Westchester County NY Tax Anticipation Notes (GO Revenue) | 1.50 | 5-27-2020 | 20,000,000 | 20,030,863 | ||||||||||||
|
| |||||||||||||||
| Variable Rate Demand Notes ø: 10.55% | ||||||||||||||||
New York Dormitory Authority Catholic Health Systems Obligated Group Revenue Bond Series 2019B (Health Revenue, Manufacturers & Traders LOC) | 0.94 | 7-1-2048 | 9,925,000 | 9,925,000 | ||||||||||||
New York Dormitory Authority Series 12 ClipperTax-Exempt Certificate Trust Series2009-35 (Miscellaneous Revenue, State Street Bank & Trust Company LIQ) 144A | 0.97 | 3-15-2022 | 3,770,000 | 3,770,000 | ||||||||||||
New York Metropolitan Transportation Authority Revenue Bond Subordinate Series2012A-2 (Transportation Revenue, Bank of Montreal LOC) | 0.98 | 11-15-2041 | 31,300,000 | 31,300,000 | ||||||||||||
New York Metropolitan Transportation Authority Revenue Bond Subordinate Series 2015E (Transportation Revenue, PNC Bank NA LOC) | 0.95 | 11-15-2045 | 1,700,000 | 1,700,000 | ||||||||||||
New York Municipal Water Finance Authority Series 2011 (Water & Sewer Revenue, LandesbankHessen-Thüringen SPA) | 1.18 | 6-15-2044 | 16,050,000 | 16,050,000 | ||||||||||||
New York NY Fiscal Subordinate Bond Series2017A-6 (GO Revenue, LandesbankHessen-Thüringen SPA) | 1.18 | 8-1-2044 | 13,180,000 | 13,180,000 | ||||||||||||
New York NY Municipal Water Authority SeriesBB-1 (Water & Sewer Revenue, State Street Bank & Trust Company SPA) | 1.16 | 6-15-2049 | 4,100,000 | 4,100,000 | ||||||||||||
The accompanying notes are an integral part of these financial statements.
Retail Money Market Funds | 15
Table of Contents
Portfolio of investments—January 31, 2020
| Interest rate | Maturity date | Principal | Value | |||||||||||||
| Variable Rate Demand Notes ø (continued) | ||||||||||||||||
New York NY Municipal Water Finance Authority 2nd Generation Resolution Fiscal Year 2019 Series BB (Water & Sewer Revenue, Industrial & Commercial Bank of China Limited SPA) | 0.95 | % | 6-15-2051 | $ | 10,000,000 | $ | 10,000,000 | |||||||||
New York NY Transitional Finance Authority Future Tax SecuredTax-Exempt Bond Fiscal 2015 Subordinate Bonds SeriesA-3 (Tax Revenue, Mizuho Bank Limited SPA) | 1.19 | 8-1-2043 | 8,890,000 | 8,890,000 | ||||||||||||
New York Tender Option Bond Trust Receipts/Floater Certificates Series 2019-BAML3002 (Miscellaneous Revenue, Bank of America NA LIQ) 144A | 1.02 | 1-15-2056 | 18,854,961 | 18,854,961 | ||||||||||||
| 117,769,961 | ||||||||||||||||
|
| |||||||||||||||
North Carolina: 1.02% |
| |||||||||||||||
| Variable Rate Demand Notes ø: 1.02% | ||||||||||||||||
Charlotte NC Water & Sewer Tender Option Bond Trust Receipts/Certificates Series 2018-XG0170 (Water & Sewer Revenue, Royal Bank of Canada LIQ) 144A | 0.97 | 1-1-2026 | 2,430,000 | 2,430,000 | ||||||||||||
Charlotte-Mecklenburg NC Hospital Authority Health Care System Series B (Health Revenue, JPMorgan Chase & Company SPA) | 1.15 | 1-15-2038 | 1,385,000 | 1,385,000 | ||||||||||||
Greensboro NC Public Improvement Series B (GO Revenue, Bank of America NA SPA) | 0.90 | 2-1-2022 | 25,000 | 25,000 | ||||||||||||
Greensboro NC Public Improvement Series B (GO Revenue, Bank of America NA SPA) | 0.92 | 2-1-2028 | 400,000 | 400,000 | ||||||||||||
North Carolina Tender Option Bond Trust Receipts/Floater Certificates Series 2015-ZM0105 (Education Revenue, Morgan Stanley Bank LIQ) 144A | 0.97 | 10-1-2055 | 2,250,500 | 2,250,500 | ||||||||||||
North Carolina Tender Option Bond Trust Receipts/Floater Certificates Series 2017-ZF2490 (Airport Revenue, Barclays Bank plc LIQ) 144A | 0.97 | 7-1-2042 | 3,750,000 | 3,750,000 | ||||||||||||
University of North Carolina Chapel Hill Series 2009- A (Education Revenue, TD Bank NA SPA) | 0.91 | 2-1-2024 | 1,100,000 | 1,100,000 | ||||||||||||
| 11,340,500 | ||||||||||||||||
|
| |||||||||||||||
Ohio: 4.67% |
| |||||||||||||||
| Other Municipal Debt: 0.57% | ||||||||||||||||
Finneytown OH Local School District BAN (GO Revenue) | 2.25 | 4-15-2020 | 1,300,000 | 1,302,535 | ||||||||||||
Sycamore OH Community School District BAN (GO Revenue) | 2.25 | 4-15-2020 | 5,000,000 | 5,009,753 | ||||||||||||
| 6,312,288 | ||||||||||||||||
|
| |||||||||||||||
| Variable Rate Demand Notes ø: 4.10% | ||||||||||||||||
Allen County OH Catholic Healthcare Series C (Health Revenue, Bank of Montreal LOC) | 1.15 | 6-1-2034 | 3,000,000 | 3,000,000 | ||||||||||||
Mizuho Floater/Residual Trust Various States Series 2019-MIZ9001 (Housing Revenue, Mizuho Capital Markets LLC LOC, Mizuho Capital Markets LLC LIQ) 144A | 1.14 | 1-1-2032 | 3,990,000 | 3,990,000 | ||||||||||||
Ohio Capital Facilities Lease Adult Correctional Building Fund Series C (Miscellaneous Revenue) | 1.11 | 10-1-2036 | 13,800,000 | 13,800,000 | ||||||||||||
Ohio Tender Option Bond Trust Receipts/Floater Certificates Northeast Regional Ohio Sewer District Wastewater Series 2015-XF0225 (Water & Sewer Revenue, TD Bank NA LIQ) 144A | 0.97 | 3-1-2021 | 9,375,000 | 9,375,000 | ||||||||||||
Ohio Tender Option Bond Trust Receipts/Floater Certificates Series 2017-XF2438 (Education Revenue, JPMorgan Chase & Company LIQ) 144A | 0.97 | 12-1-2024 | 2,000,000 | 2,000,000 | ||||||||||||
Ohio Tender Option Bond Trust Receipts/Floater Certificates Series 2018-XL0074 (Health Revenue, JPMorgan Chase & Company LIQ) 144A | 1.14 | 8-1-2024 | 5,580,000 | 5,580,000 | ||||||||||||
RBC Municipal Products Incorporated Trust SeriesE-110 (Water & Sewer Revenue, Royal Bank of Canada LOC, Royal Bank of Canada LIQ) 144A | 0.97 | 10-1-2020 | 8,000,000 | 8,000,000 | ||||||||||||
| 45,745,000 | ||||||||||||||||
|
| |||||||||||||||
The accompanying notes are an integral part of these financial statements.
16 | Retail Money Market Funds
Table of Contents
Portfolio of investments—January 31, 2020
| Interest rate | Maturity date | Principal | Value | |||||||||||||
Oregon: 0.85% |
| |||||||||||||||
| Variable Rate Demand Notes ø: 0.85% | ||||||||||||||||
Oregon Tender Option Bond Trust Receipts/Floater Certificates Series 2020-XM0813 (Health Revenue, Royal Bank of Canada LIQ) 144A | 0.99 | % | 5-15-2027 | $ | 2,220,000 | $ | 2,220,000 | |||||||||
Oregon Tender Option Bond Trust Receipts/Floater Certificates Series 2020-XM0814 (Education Revenue, Royal Bank of Canada LIQ) 144A | 0.97 | 1-1-2028 | 7,305,000 | 7,305,000 | ||||||||||||
| 9,525,000 | ||||||||||||||||
|
| |||||||||||||||
Other: 1.30% |
| |||||||||||||||
| Variable Rate Demand Notes ø: 1.30% | ||||||||||||||||
ClipperTax-Exempt Certificate Trust AMT Series2009-54 (Miscellaneous Revenue, State Street Bank & Trust Company LIQ) 144A | 0.99 | 2-15-2028 | 13,500,000 | 13,500,000 | ||||||||||||
FHLMC MFHR SeriesM-031 Class A (Housing Revenue, FHLMC LIQ) | 0.97 | 12-15-2045 | 980,000 | 980,000 | ||||||||||||
| 14,480,000 | ||||||||||||||||
|
| |||||||||||||||
Pennsylvania: 5.03% |
| |||||||||||||||
| Variable Rate Demand Notes ø: 5.03% | ||||||||||||||||
Allegheny County PA Hospital Development Authority Series E (Health Revenue, Royal Bank of Canada LOC, Royal Bank of Canada LIQ) 144A | 1.20 | 4-1-2022 | 7,820,000 | 7,820,000 | ||||||||||||
Butler County PA Hospital Authority Series A (Health Revenue, BMO Harris Bank NA LOC) | 0.98 | 10-1-2042 | 700,000 | 700,000 | ||||||||||||
Mizuho Floater/Residual Trust Series 2020-MIZ9009 (Housing Revenue, Mizuho Capital Markets LLC LOC, Mizuho Capital Markets LLC LIQ) 144A | 1.19 | 12-1-2036 | 6,650,000 | 6,650,000 | ||||||||||||
Pennsylvania Tender Option Bond Trust Receipts/Floater Certificates Series 2015-ZM0081 (Health Revenue, Morgan Stanley Bank LIQ) 144A | 0.97 | 6-1-2044 | 3,000,000 | 3,000,000 | ||||||||||||
Pennsylvania Tender Option Bond Trust Receipts/Floater Certificates Series 2016-ZF0504 (Water & Sewer Revenue, TD Bank NA LIQ) 144A | 1.09 | 8-15-2042 | 4,875,000 | 4,875,000 | ||||||||||||
Pennsylvania Tender Option Bond Trust Receipts/Floater Certificates Series 2018-YX1089 (GO Revenue, Barclays Bank plc LIQ) 144A | 0.97 | 3-1-2035 | 2,540,000 | 2,540,000 | ||||||||||||
Pennsylvania Tender Option Bond Trust Receipts/Floater Certificates Series 2019-XF2836 (Education Revenue, Mizuho Capital Markets LLC LOC, Mizuho Capital Markets LLC LIQ) 144A | 1.09 | 6-15-2039 | 3,935,000 | 3,935,000 | ||||||||||||
Residual Interest Bond Floater Trust Series2019-003 (Health Revenue, Barclays Bank plc LOC, Barclays Bank plc LIQ) 144A | 1.09 | 8-15-2038 | 19,615,000 | 19,615,000 | ||||||||||||
South Central Pennsylvania General Authority WellSpan Health Obliged Group Series 2019E (Health Revenue, U.S. Bank NA SPA) | 1.16 | 6-1-2035 | 4,380,000 | 4,380,000 | ||||||||||||
Westmoreland County PA Municipal Authority Service Series 2016 Tender Option Bond Trust Receipts/Floater Certificates Series 2017-ZF0539 (Water & Sewer Revenue, BAM Insured, TD Bank NA LIQ) 144A | 1.09 | 8-15-2038 | 2,615,000 | 2,615,000 | ||||||||||||
| 56,130,000 | ||||||||||||||||
|
| |||||||||||||||
Rhode Island: 0.90% |
| |||||||||||||||
| Variable Rate Demand Note ø: 0.90% | ||||||||||||||||
Narragansett Bay RI Commission Wastewater System Series2013-A Tender Option Trust Receipts/Floater Certificates Series 2016-XM0140 (Water & Sewer Revenue, Royal Bank of Canada LIQ) 144A | 0.99 | 9-1-2020 | 10,000,000 | 10,000,000 | ||||||||||||
|
| |||||||||||||||
South Carolina: 2.79% |
| |||||||||||||||
| Variable Rate Demand Notes ø: 2.79% | ||||||||||||||||
Columbia SC Waterworks Series 2009 (Water & Sewer Revenue, Sumitomo Mitsui Banking LOC) | 0.94 | 2-1-2038 | 1,760,000 | 1,760,000 | ||||||||||||
South Carolina EDA Brashier Charter LLC Project (Education Revenue, SunTrust Bank LOC) | 0.96 | 12-1-2038 | 1,870,000 | 1,870,000 | ||||||||||||
The accompanying notes are an integral part of these financial statements.
Retail Money Market Funds | 17
Table of Contents
Portfolio of investments—January 31, 2020
| Interest rate | Maturity date | Principal | Value | |||||||||||||
| Variable Rate Demand Notes ø (continued) | ||||||||||||||||
South Carolina Educational Facilities Authority for Private Non-Profit Institutions Higher Learning Educational Facilities Spartanburg Methodist Series 2005 (Education Revenue, Branch Banking & Trust LOC) | 0.95 | % | 8-1-2025 | $ | 2,100,000 | $ | 2,100,000 | |||||||||
South Carolina Jobs EDA Institutional Business & Home Safety Project Series 2009 (Industrial Development Revenue, Branch Banking & Trust LOC) | 0.97 | 11-1-2034 | 1,075,000 | 1,075,000 | ||||||||||||
South Carolina Jobs EDA Prisma Health Obligated Group Series 2018B (Health Revenue, U.S. Bank NA LOC) | 1.15 | 5-1-2048 | 6,335,000 | 6,335,000 | ||||||||||||
South Carolina Public Service Authority Series A (Utilities Revenue, Bank of America NA LOC) | 0.98 | 1-1-2036 | 10,000,000 | 10,000,000 | ||||||||||||
South Carolina Tender Option Bond Trust Receipts/Floater Certificates Patriots Energy Group Financing Agency Series 2018-XM0690 (Utilities Revenue, Royal Bank of Canada LIQ) 144A | 0.98 | 10-1-2022 | 8,000,000 | 8,000,000 | ||||||||||||
| 31,140,000 | ||||||||||||||||
|
| |||||||||||||||
Tennessee: 0.38% |
| |||||||||||||||
| Variable Rate Demand Notes ø: 0.38% | ||||||||||||||||
Sevier County TN Public Building Authority Local Government Public Improvement Series6-A1 (Miscellaneous Revenue, Branch Banking & Trust SPA) | 0.95 | 6-1-2029 | 3,260,000 | 3,260,000 | ||||||||||||
Shelby County TN Health Educational & Housing Facilities Board Methodist Le Bonheur Series B (Health Revenue, AGM Insured, U.S. Bank NA SPA) | 1.15 | 6-1-2042 | 1,000,000 | 1,000,000 | ||||||||||||
| 4,260,000 | ||||||||||||||||
|
| |||||||||||||||
Texas: 6.40% |
| |||||||||||||||
| Other Municipal Debt: 1.02% | ||||||||||||||||
Texas Tax Revenue Anticipation Notes (GO Revenue) | 4.00 | 8-27-2020 | 11,150,000 | 11,335,061 | ||||||||||||
|
| |||||||||||||||
| Variable Rate Demand Notes ø: 5.38% | ||||||||||||||||
Bexar County TX Housing Finance Corporation Palisades Park Apartments Project Series 2009 (Housing Revenue, FHLMC LIQ) | 1.02 | 9-1-2039 | 3,700,000 | 3,700,000 | ||||||||||||
Brazos County TX Health Facilities Tender Option Bond Trust Receipts/Floater Certificates Series 2019-BAML5021 (Health Revenue, Bank of America NA LOC, Bank of America NA LIQ) 144A | 1.07 | 1-1-2028 | 10,280,000 | 10,280,000 | ||||||||||||
Brazos Harbor TX Industrial Development Corporation BASF Corporation Project Series 2001 (Industrial Development Revenue, BASF SE) | 0.98 | 7-1-2022 | 4,900,000 | 4,900,000 | ||||||||||||
Harris County TX Industrial Development Corporation Exxon Mobil Corporation Project (Industrial Development Revenue) | 1.19 | 3-1-2024 | 7,500,000 | 7,500,000 | ||||||||||||
Port Arthur TX Navigation District Industrial Development Corporation Total Petrochemicals USA Incorporated Project (Industrial Development Revenue, Total SA) | 0.98 | 6-1-2041 | 5,000,000 | 5,000,000 | ||||||||||||
Port Corpus Christi TX Solid Waste Disposal Flint Hills Resources Project Series 2002-B (Resource Recovery Revenue, Flint Hills Resources LLC) | 0.97 | 7-1-2029 | 4,200,000 | 4,200,000 | ||||||||||||
Texas Tender Option Bond Trust Receipts/Floater Certificates Series 2019-XM0722 (GO Revenue, JPMorgan Chase & Company LIQ) 144A | 0.98 | 6-15-2025 | 3,670,000 | 3,670,000 | ||||||||||||
Texas Veterans Bonds (Miscellaneous Revenue, Sumitomo Mitsui Banking SPA) | 0.95 | 12-1-2047 | 830,000 | 830,000 | ||||||||||||
Texas Veterans Bonds (GO Revenue, FHLB SPA) | 1.00 | 12-1-2050 | 20,000,000 | 20,000,000 | ||||||||||||
| 60,080,000 | ||||||||||||||||
|
| |||||||||||||||
Utah: 0.96% |
| |||||||||||||||
| Variable Rate Demand Notes ø: 0.96% | ||||||||||||||||
Murray UT City Hospital IHC Health Services Incorporated Series C (Health Revenue) | 1.13 | 5-15-2036 | 5,000,000 | 5,000,000 | ||||||||||||
The accompanying notes are an integral part of these financial statements.
18 | Retail Money Market Funds
Table of Contents
Portfolio of investments—January 31, 2020
| Interest rate | Maturity date | Principal | Value | |||||||||||||
| Variable Rate Demand Notes ø (continued) | ||||||||||||||||
Utah Tender Option Bond Trust Receipts/Floater Certificates Series 2017-ZF0540 (Airport Revenue, JPMorgan Chase & Company LIQ) 144A | 1.14 | % | 1-1-2025 | $ | 2,700,000 | $ | 2,700,000 | |||||||||
Utah Tender Option Bond Trust Receipts/Floater Certificates Series 2018-XG0171 (Health Revenue, Royal Bank of Canada LIQ) 144A | 1.00 | 11-15-2022 | 3,000,000 | 3,000,000 | ||||||||||||
| 10,700,000 | ||||||||||||||||
|
| |||||||||||||||
Vermont: 0.22% |
| |||||||||||||||
| Variable Rate Demand Note ø: 0.22% | ||||||||||||||||
Vermont Educational & Health Buildings Financing Agency Landmark College Project Series2008-A (Education Revenue, TD Bank NA LOC) | 1.22 | 7-1-2033 | 2,490,000 | 2,490,000 | ||||||||||||
|
| |||||||||||||||
Virginia: 0.07% |
| |||||||||||||||
| Variable Rate Demand Note ø: 0.07% | ||||||||||||||||
Fairfax County VA EDA Mount Vernon Ladies Association Project (Industrial Development Revenue, SunTrust Bank LOC) | 0.96 | 6-1-2037 | 740,000 | 740,000 | ||||||||||||
|
| |||||||||||||||
Washington: 2.22% |
| |||||||||||||||
| Variable Rate Demand Notes ø: 2.22% | ||||||||||||||||
King County WA Multi-Modal Limited Refunding Bond Series A (GO Revenue, TD Bank NA SPA) | 1.15 | 1-1-2046 | 14,750,000 | 14,750,000 | ||||||||||||
Washington Tender Option Bond Trust Receipts/Floater Certificates Series 2018-XM0681 (Tax Revenue, Citibank NA LIQ) 144A | 1.00 | 7-1-2026 | 10,000,000 | 10,000,000 | ||||||||||||
| 24,750,000 | ||||||||||||||||
|
| |||||||||||||||
Wisconsin: 4.40% |
| |||||||||||||||
| Variable Rate Demand Notes ø: 4.40% | ||||||||||||||||
Appleton WI Recovery Zone Facilities Foremost Farms Project Series 2010 (Industrial Development Revenue, CoBank ACB LOC) | 1.05 | 5-1-2037 | 14,200,000 | 14,200,000 | ||||||||||||
Wisconsin PFA Hospital WakeMed Obligated Group Series B (Health Revenue, Barclays Bank plc LOC) | 0.96 | 10-1-2049 | 100,000 | 100,000 | ||||||||||||
Wisconsin PFA Midwestern Disaster Area Program Series 2011 (Industrial Development Revenue, Farm Credit Services America LOC) | 1.05 | 9-1-2036 | 2,965,000 | 2,965,000 | ||||||||||||
Wisconsin Series 2019A (GO Revenue) | 1.09 | 5-1-2029 | 20,200,000 | 20,200,000 | ||||||||||||
Wisconsin Tender Option Bond Trust Receipts/Floater Certificates Series 2015-XF0127 (Health Revenue, JPMorgan Chase & Company LIQ) 144A | 1.12 | 10-1-2020 | 3,815,000 | 3,815,000 | ||||||||||||
Wisconsin Tender Option Bond Trust Receipts/Floater Certificates Series 2018-XF2634 (Health Revenue, Credit Suisse LIQ) 144A | 0.97 | 8-15-2025 | 2,000,000 | 2,000,000 | ||||||||||||
Wisconsin Tender Option Bond Trust Receipts/Floater Certificates Series 2019-XF2823 (Housing Revenue, Mizuho Capital Markets LLC LOC, Mizuho Capital Markets LLC LIQ) 144A | 1.09 | 1-1-2026 | 4,000,000 | 4,000,000 | ||||||||||||
Wisconsin Tender Option Bond Trust Receipts/Floater Certificates Series 2019-XF2831 (Housing Revenue, Mizuho Capital Markets LLC LIQ) 144A | 1.09 | 7-1-2029 | 1,800,000 | 1,800,000 | ||||||||||||
| 49,080,000 | ||||||||||||||||
|
| |||||||||||||||
Wyoming: 1.19% |
| |||||||||||||||
| Variable Rate Demand Note ø: 1.19% | ||||||||||||||||
Wyoming Tender Option Bond Trust Receipts/Floater Certificates Series 2018-XL0070 (Utilities Revenue, BAM Insured, JPMorgan Chase & Company LIQ) 144A | 0.97 | 1-1-2025 | 13,330,000 | 13,330,000 | ||||||||||||
|
| |||||||||||||||
Total Municipal Obligations (Cost $1,089,678,673) |
| 1,089,678,673 | ||||||||||||||
|
| |||||||||||||||
The accompanying notes are an integral part of these financial statements.
Retail Money Market Funds | 19
Table of Contents
Portfolio of investments—January 31, 2020
| Interest rate | Maturity date | Principal | Value | |||||||||||||
Closed End Municipal Bond Fund Obligations: 0.90% |
| |||||||||||||||
| California: 0.90% | ||||||||||||||||
Nuveen CaliforniaAMT-Free Quality Municipal Income Fund Variable Rate Demand Preferred Shares Series 4 ø144A | 1.00 | % | 9-11-2026 | $ | 10,000,000 | $ | 10,000,000 | |||||||||
|
| |||||||||||||||
Total Closed End Municipal Bond Fund Obligations (Cost $10,000,000) |
| 10,000,000 | ||||||||||||||
|
| |||||||||||||||
| Repurchase Agreements: 0.90% | ||||||||||||||||
Barclays Capital Incorporated, dated1-31-2020, maturity value $10,001,308 ^^ | 1.57 | 2-3-2020 | 10,000,000 | 10,000,000 | ||||||||||||
|
| |||||||||||||||
Total Repurchase Agreements (Cost $10,000,000) |
| 10,000,000 | ||||||||||||||
|
| |||||||||||||||
| Total investments in securities (Cost $1,109,678,673) | 99.45 | % | 1,109,678,673 | |||||
Other assets and liabilities, net | 0.55 | 6,083,810 | ||||||
|
|
|
| |||||
| Total net assets | 100.00 | % | $ | 1,115,762,483 | ||||
|
|
|
| |||||
| ø | Variable rate demand notes are subject to a demand feature which reduces the effective maturity. The maturity date shown represents the final maturity date of the security. The interest rate is determined and reset by the issuer daily, weekly, or monthly depending upon the terms of the security. The rate shown is the rate in effect at period end. |
| 144A | The security may be resold in transactions exempt from registration, normally to qualified institutional buyers, pursuant to Rule 144A under the Securities Act of 1933. |
| ^^ | Collateralized by U.S. government securities, 1.75% to 3.63%,6-30-2022 to8-15-2043, fair value including accrued interest is $10,200,001. |
Abbreviations:
| AGM | Assured Guaranty Municipal |
| AMT | Alternative minimum tax |
| BAM | Build America Mutual Assurance Company |
| BAN | Bond anticipation notes |
| BHAC | Berkshire Hathaway Assurance Corporation |
| ECFA | Educational & Cultural Facilities Authority |
| EDA | Economic Development Authority |
| FHA | Federal Housing Administration |
| FHLB | Federal Home Loan Bank |
| FHLMC | Federal Home Loan Mortgage Corporation |
| FNMA | Federal National Mortgage Association |
| GNMA | Government National Mortgage Association |
| GO | General obligation |
| HEFA | Health & Educational Facilities Authority |
| HFA | Housing Finance Authority |
| IDA | Industrial Development Authority |
| LIQ | Liquidity agreement |
| LOC | Letter of credit |
| MFHR | Multifamily housing revenue National |
| National | Public Finance Guarantee Corporation |
| PFA | Public Finance Authority |
| RDA | Redevelopment Authority |
| SPA | Standby purchase agreement |
The accompanying notes are an integral part of these financial statements.
20 | Retail Money Market Funds
Table of Contents
Statement of assets and liabilities—January 31, 2020
Assets | ||||
Investments in unaffiliated securities, at amortized cost | $ | 1,109,678,673 | ||
Cash | 494,151 | |||
Receivable for investments sold | 17,211,188 | |||
Receivable for Fund shares sold | 1,386,041 | |||
Receivable for interest | 2,183,390 | |||
Prepaid expenses and other assets | 21,587 | |||
|
| |||
Total assets | 1,130,975,030 | |||
|
| |||
Liabilities | ||||
Payable for investments purchased | 8,550,128 | |||
Payable for Fund shares redeemed | 5,942,879 | |||
Management fee payable | 86,461 | |||
Dividends payable | 268,432 | |||
Administration fees payable | 99,128 | |||
Trustees’ fees and expenses payable | 4,258 | |||
Accrued expenses and other liabilities | 261,261 | |||
|
| |||
Total liabilities | 15,212,547 | |||
|
| |||
Total net assets | $ | 1,115,762,483 | ||
|
| |||
Net assets consist of | ||||
Paid-in capital | $ | 1,115,827,498 | ||
Total distributable loss | (65,015 | ) | ||
|
| |||
Total net assets | $ | 1,115,762,483 | ||
|
| |||
Computation of net asset value per share | ||||
Net assets – Class A | $ | 95,632,140 | ||
Shares outstanding – Class A1 | 95,625,334 | |||
Net asset value per share – Class A | $1.00 | |||
Net assets – Administrator Class | $ | 107,457,458 | ||
Shares outstanding – Administrator Class1 | 107,448,660 | |||
Net asset value per share – Administrator Class | $1.00 | |||
Net assets – Premier Class | $ | 847,870,956 | ||
Shares outstanding – Premier Class1 | 847,809,758 | |||
Net asset value per share – Premier Class | $1.00 | |||
Net assets – Service Class | $ | 64,801,929 | ||
Shares outstanding – Service Class1 | 64,797,310 | |||
Net asset value per share – Service Class | $1.00 | |||
| 1 | The Fund has an unlimited number of authorized shares. |
The accompanying notes are an integral part of these financial statements.
Retail Money Market Funds | 21
Table of Contents
Statement of operations — year ended January 31, 2020
Investment income | ||||
Interest | $ | 13,878,197 | ||
|
| |||
Expenses | ||||
Management fee | 1,402,018 | |||
Administration fees |
| |||
Class A | 214,035 | |||
Administrator Class | 123,515 | |||
Premier Class | 518,895 | |||
Service Class | 78,307 | |||
Shareholder servicing fees |
| |||
Class A | 243,222 | |||
Administrator Class | 123,515 | |||
Service Class | 162,712 | |||
Custody and accounting fees | 59,700 | |||
Professional fees | 43,346 | |||
Registration fees | 201,454 | |||
Shareholder report expenses | 37,397 | |||
Trustees’ fees and expenses | 21,886 | |||
Other fees and expenses | 14,498 | |||
|
| |||
Total expenses | 3,244,500 | |||
Less: Fee waivers and/or expense reimbursements |
| |||
Fund-level | (569,024 | ) | ||
Class A | (162 | ) | ||
Administrator Class | (37,353 | ) | ||
Premier Class | (60,847 | ) | ||
Service Class | (32,293 | ) | ||
|
| |||
Net expenses | 2,544,821 | |||
|
| |||
Net investment income | 11,333,376 | |||
Net realized gains on investments | 155,732 | |||
|
| |||
Net increase in net assets resulting from operations | $ | 11,489,108 | ||
|
| |||
The accompanying notes are an integral part of these financial statements.
22 | Retail Money Market Funds
Table of Contents
Statement of changes in net assets
| Year ended January 31, 2020 | Year ended January 31, 2019 | |||||||||||||||
Operations |
| |||||||||||||||
Net investment income | $ | 11,333,376 | $ | 10,059,433 | ||||||||||||
Net realized gains on investments | 155,732 | 38,078 | ||||||||||||||
|
| |||||||||||||||
Net increase in net assets resulting from operations | 11,489,108 | 10,097,511 | ||||||||||||||
|
| |||||||||||||||
Distributions to shareholders from net investment income and net |
| |||||||||||||||
Class A | (900,478 | ) | (983,009 | ) | ||||||||||||
Administrator Class | (1,516,842 | ) | (1,676,616 | ) | ||||||||||||
Premier Class | (8,389,054 | ) | (6,724,447 | ) | ||||||||||||
Service Class | (700,424 | ) | (680,815 | ) | ||||||||||||
|
| |||||||||||||||
Total distributions to shareholders | (11,506,798 | ) | (10,064,887 | ) | ||||||||||||
|
| |||||||||||||||
Capital share transactions | Shares | Shares | ||||||||||||||
Proceeds from shares sold |
| |||||||||||||||
Class A | 27,183,406 | 27,183,406 | 35,451,170 | 35,451,170 | ||||||||||||
Administrator Class | 33,693,350 | 33,693,350 | 66,742,195 | 66,742,195 | ||||||||||||
Premier Class | 951,883,288 | 951,883,288 | 1,042,791,893 | 1,042,791,893 | ||||||||||||
Service Class | 4,331,878 | 4,331,878 | 9,248,032 | 9,248,032 | ||||||||||||
|
| |||||||||||||||
| 1,017,091,922 | 1,154,233,290 | |||||||||||||||
|
| |||||||||||||||
Reinvestment of distributions |
| |||||||||||||||
Class A | 874,165 | 874,165 | 958,425 | 958,425 | ||||||||||||
Administrator Class | 1,477,726 | 1,477,726 | 1,643,597 | 1,643,597 | ||||||||||||
Premier Class | 6,873,538 | 6,873,538 | 5,170,672 | 5,170,672 | ||||||||||||
Service Class | 213,497 | 213,497 | 226,056 | 226,056 | ||||||||||||
|
| |||||||||||||||
| 9,438,926 | 7,998,750 | |||||||||||||||
|
| |||||||||||||||
Payment for shares redeemed |
| |||||||||||||||
Class A | (34,097,192 | ) | (34,097,192 | ) | (54,253,118 | ) | (54,253,118 | ) | ||||||||
Administrator Class | (59,099,979 | ) | (59,099,979 | ) | (69,954,513 | ) | (69,954,513 | ) | ||||||||
Premier Class | (704,849,931 | ) | (704,849,931 | ) | (793,365,730 | ) | (793,365,730 | ) | ||||||||
Service Class | (5,421,874 | ) | (5,421,874 | ) | (10,252,475 | ) | (10,252,475 | ) | ||||||||
|
| |||||||||||||||
| (803,468,976 | ) | (927,825,836 | ) | |||||||||||||
|
| |||||||||||||||
Net increase in net assets resulting from capital share transactions | 223,061,872 | 234,406,204 | ||||||||||||||
|
| |||||||||||||||
Total increase in net assets | 223,044,182 | 234,438,828 | ||||||||||||||
|
| |||||||||||||||
Net assets | ||||||||||||||||
Beginning of period | 892,718,301 | 658,279,473 | ||||||||||||||
|
| |||||||||||||||
End of period | $ | 1,115,762,483 | $ | 892,718,301 | ||||||||||||
|
| |||||||||||||||
The accompanying notes are an integral part of these financial statements.
Retail Money Market Funds | 23
Table of Contents
(For a share outstanding throughout each period)
| Year ended January 31 | ||||||||||||||||||||
| CLASS A | 2020 | 2019 | 2018 | 2017 | 2016 | |||||||||||||||
Net asset value, beginning of period | $1.00 | $1.00 | $1.00 | $1.00 | $1.00 | |||||||||||||||
Net investment income | 0.01 | 0.01 | 0.00 | 1 | 0.00 | 1 | 0.00 | 1 | ||||||||||||
Net realized gains on investments | 0.00 | 1 | 0.00 | 1 | 0.00 | 1 | 0.00 | 1 | 0.00 | 1 | ||||||||||
|
|
|
|
|
|
|
|
|
| |||||||||||
Total from investment operations | 0.01 | 0.01 | 0.00 | 1 | 0.00 | 1 | 0.00 | 1 | ||||||||||||
Distributions to shareholders from | ||||||||||||||||||||
Net investment income | (0.01 | ) | (0.01 | ) | (0.00 | )1 | (0.00 | )1 | (0.00 | )1 | ||||||||||
Net realized gains | (0.00 | )1 | (0.00 | )1 | (0.00 | )1 | (0.00 | )1 | (0.00 | )1 | ||||||||||
|
|
|
|
|
|
|
|
|
| |||||||||||
Total distributions to shareholders | (0.01 | ) | (0.01 | ) | (0.00 | )1 | (0.00 | )1 | (0.00 | )1 | ||||||||||
Net asset value, end of period | $1.00 | $1.00 | $1.00 | $1.00 | $1.00 | |||||||||||||||
Total return | 0.93 | % | 0.89 | % | 0.35 | % | 0.13 | % | 0.02 | % | ||||||||||
Ratios to average net assets (annualized) | ||||||||||||||||||||
Gross expenses | 0.66 | % | 0.66 | % | 0.68 | % | 0.65 | % | 0.63 | % | ||||||||||
Net expenses | 0.60 | % | 0.61 | % | 0.64 | % | 0.39 | % | 0.08 | % | ||||||||||
Net investment income | 0.92 | % | 0.88 | % | 0.30 | % | 0.02 | % | 0.01 | % | ||||||||||
Supplemental data | ||||||||||||||||||||
Net assets, end of period (000s omitted) | $95,632 | $101,680 | $119,524 | $135,704 | $172,725 | |||||||||||||||
| 1 | Amount is less than $0.005. |
The accompanying notes are an integral part of these financial statements.
24 | Retail Money Market Funds
Table of Contents
Financial highlights
(For a share outstanding throughout each period)
| Year ended January 31 | ||||||||||||||||||||
| ADMINISTRATOR CLASS | 2020 | 2019 | 2018 | 2017 | 2016 | |||||||||||||||
Net asset value, beginning of period | $1.00 | $1.00 | $1.00 | $1.00 | $1.00 | |||||||||||||||
Net investment income | 0.01 | 0.01 | 0.01 | 0.00 | 1 | 0.00 | 1 | |||||||||||||
Net realized gains on investments | 0.00 | 1 | 0.00 | 1 | 0.00 | 1 | 0.00 | 1 | 0.00 | 1 | ||||||||||
|
|
|
|
|
|
|
|
|
| |||||||||||
Total from investment operations | 0.01 | 0.01 | 0.01 | 0.00 | 1 | 0.00 | 1 | |||||||||||||
Distributions to shareholders from | ||||||||||||||||||||
Net investment income | (0.01 | ) | (0.01 | ) | (0.01 | ) | (0.00 | )1 | (0.00 | )1 | ||||||||||
Net realized gains | (0.00 | )1 | (0.00 | )1 | (0.00 | )1 | (0.00 | )1 | (0.00 | )1 | ||||||||||
|
|
|
|
|
|
|
|
|
| |||||||||||
Total distributions to shareholders | (0.01 | ) | (0.01 | ) | (0.01 | ) | (0.00 | )1 | (0.00 | )1 | ||||||||||
Net asset value, end of period | $1.00 | $1.00 | $1.00 | $1.00 | $1.00 | |||||||||||||||
Total return | 1.23 | % | 1.21 | % | 0.69 | % | 0.33 | % | 0.02 | % | ||||||||||
Ratios to average net assets (annualized) | ||||||||||||||||||||
Gross expenses | 0.39 | % | 0.39 | % | 0.41 | % | 0.40 | % | 0.36 | % | ||||||||||
Net expenses | 0.30 | % | 0.30 | % | 0.30 | % | 0.27 | % | 0.08 | % | ||||||||||
Net investment income | 1.22 | % | 1.21 | % | 0.64 | % | 0.22 | % | 0.01 | % | ||||||||||
Supplemental data | ||||||||||||||||||||
Net assets, end of period (000s omitted) | $107,457 | $131,395 | $132,964 | $155,448 | $179,171 | |||||||||||||||
| 1 | Amount is less than $0.005. |
The accompanying notes are an integral part of these financial statements.
Retail Money Market Funds | 25
Table of Contents
Financial highlights
(For a share outstanding throughout each period)
| Year ended January 31 | ||||||||||||||||||||
| PREMIER CLASS1 | 2020 | 2019 | 2018 | 2017 | 2016 | |||||||||||||||
Net asset value, beginning of period | $1.00 | $1.00 | $1.00 | $1.00 | $1.00 | |||||||||||||||
Net investment income | 0.01 | 0.01 | 0.01 | 0.00 | 2 | 0.00 | 2 | |||||||||||||
Net realized gains on investments | 0.00 | 2 | 0.00 | 2 | 0.00 | 2 | 0.00 | 2 | 0.00 | 2 | ||||||||||
|
|
|
|
|
|
|
|
|
| |||||||||||
Total from investment operations | 0.01 | 0.01 | 0.01 | 0.00 | 2 | 0.00 | 2 | |||||||||||||
Distributions to shareholders from | ||||||||||||||||||||
Net investment income | (0.01 | ) | (0.01 | ) | (0.01 | ) | (0.00 | )2 | (0.00 | )2 | ||||||||||
Net realized gains | (0.00 | )2 | (0.00 | )2 | (0.00 | )2 | (0.00 | )2 | (0.00 | )2 | ||||||||||
|
|
|
|
|
|
|
|
|
| |||||||||||
Total distributions to shareholders | (0.01 | ) | (0.01 | ) | (0.01 | ) | (0.00 | )2 | (0.00 | )2 | ||||||||||
Net asset value, end of period | $1.00 | $1.00 | $1.00 | $1.00 | $1.00 | |||||||||||||||
Total return | 1.33 | % | 1.31 | % | 0.79 | % | 0.41 | % | 0.02 | % | ||||||||||
Ratios to average net assets (annualized) | ||||||||||||||||||||
Gross expenses | 0.27 | % | 0.27 | % | 0.28 | % | 0.25 | % | 0.24 | % | ||||||||||
Net expenses | 0.20 | % | 0.20 | % | 0.20 | % | 0.18 | % | 0.08 | % | ||||||||||
Net investment income | 1.28 | % | 1.31 | % | 0.79 | % | 0.18 | % | 0.01 | % | ||||||||||
Supplemental data | ||||||||||||||||||||
Net assets, end of period (000s omitted) | $847,871 | $593,961 | $339,331 | $105,881 | $1,677,748 | |||||||||||||||
| 1 | Effective April 1, 2016, Institutional Class was renamed Premier Class. |
| 2 | Amount is less than $0.005. |
The accompanying notes are an integral part of these financial statements.
26 | Retail Money Market Funds
Table of Contents
Financial highlights
(For a share outstanding throughout each period)
| Year ended January 31 | ||||||||||||||||||||
| SERVICE CLASS | 2020 | 2019 | 2018 | 2017 | 2016 | |||||||||||||||
Net asset value, beginning of period | $1.00 | $1.00 | $1.00 | $1.00 | $1.00 | |||||||||||||||
Net investment income | 0.01 | 0.01 | 0.01 | 0.00 | 1 | 0.00 | 1 | |||||||||||||
Net realized gains on investments | 0.00 | 1 | 0.00 | 1 | 0.00 | 1 | 0.00 | 1 | 0.00 | 1 | ||||||||||
|
|
|
|
|
|
|
|
|
| |||||||||||
Total from investment operations | 0.01 | 0.01 | 0.01 | 0.00 | 1 | 0.00 | 1 | |||||||||||||
Distributions to shareholders from | ||||||||||||||||||||
Net investment income | (0.01 | ) | (0.01 | ) | (0.01 | ) | (0.00 | )1 | (0.00 | )1 | ||||||||||
Net realized gains | (0.00 | )1 | (0.00 | )1 | (0.00 | )1 | (0.00 | )1 | (0.00 | )1 | ||||||||||
|
|
|
|
|
|
|
|
|
| |||||||||||
Total distributions to shareholders | (0.01 | ) | (0.01 | ) | (0.01 | ) | (0.00 | )1 | (0.00 | )1 | ||||||||||
Net asset value, end of period | $1.00 | $1.00 | $1.00 | $1.00 | $1.00 | |||||||||||||||
Total return | 1.08 | % | 1.06 | % | 0.54 | % | 0.20 | % | 0.02 | % | ||||||||||
Ratios to average net assets (annualized) | ||||||||||||||||||||
Gross expenses | 0.56 | % | 0.56 | % | 0.58 | % | 0.54 | % | 0.53 | % | ||||||||||
Net expenses | 0.45 | % | 0.45 | % | 0.45 | % | 0.32 | % | 0.08 | % | ||||||||||
Net investment income | 1.06 | % | 1.05 | % | 0.49 | % | 0.03 | % | 0.01 | % | ||||||||||
Supplemental data | ||||||||||||||||||||
Net assets, end of period (000s omitted) | $64,802 | $65,682 | $66,460 | $73,472 | $162,593 | |||||||||||||||
| 1 | Amount is less than $0.005. |
The accompanying notes are an integral part of these financial statements.
Retail Money Market Funds | 27
Table of Contents
1. ORGANIZATION
Wells Fargo Funds Trust (the “Trust”), a Delaware statutory trust organized on March 10, 1999, is anopen-end management investment company registered under the Investment Company Act of 1940, as amended (the “1940 Act”). As an investment company, the Trust follows the accounting and reporting guidance in Financial Accounting Standards Board (“FASB”)Accounting Standards Codification Topic 946, Financial Services – Investment Companies. These financial statements report on the Wells Fargo NationalTax-Free Money Market Fund (the “Fund”) which is a diversified series of the Trust.
Consistent with Rule2a-7, the Board of Trustees of the Fund is permitted to impose a liquidity fee on redemptions from the Fund or a redemption gate (i.e., a suspension of the right to redeem) in the event that the Fund’s liquidity falls below required minimums because of market conditions or other factors. If the Fund’s weekly liquid assets (as defined in Rule2a-7(34)) fall below 30% of the Fund’s total assets, the Board of Trustees is permitted, but not required, to: (i) impose a liquidity fee of no more than 2% of the amount redeemed; and/or (ii) impose a redemption gate. If the Fund’s weekly liquid assets fall below 10% of the Fund’s total assets, the Fund must impose, generally as of the beginning of the next business day, a liquidity fee of 1% of the amount redeemed unless the Board of Trustees determines that such a fee is not in the best interest of the Fund or determines that a lower or higher fee (subject to the 2% limit) is in the best interest of the Fund. Liquidity fees reduce the amount a shareholder receives upon redemption of its shares. The Fund retains any liquidity fees for the benefit of remaining shareholders. The Board of Trustees did not impose any liquidity fees and/or redemption gates during the year ended January 31, 2020.
2. SIGNIFICANT ACCOUNTING POLICIES
The following significant accounting policies, which are consistently followed in the preparation of the financial statements of the Fund, are in conformity with U.S. generally accepted accounting principles which require management to make estimates and assumptions that affect the reported amounts of assets and liabilities, disclosure of contingent assets and liabilities at the date of the financial statements, and the reported amounts of revenues and expenses during the reporting period. Actual results could differ from those estimates.
Securities valuation
As permitted under Rule2a-7 of the 1940 Act, portfolio securities are valued at amortized cost, which approximates fair value. The amortized cost method involves valuing a security at its cost, plus accretion of discount or minus amortization of premium over the period until maturity.
Investments which are not valued using the method discussed above are valued at their fair value, as determined in good faith by the Board of Trustees. The Board of Trustees has established a Valuation Committee comprised of the Trustees and has delegated to it the authority to take any actions regarding the valuation of portfolio securities that the Valuation Committee deems necessary or appropriate, including determining the fair value of portfolio securities, unless the determination has been delegated to the Wells Fargo Asset Management Pricing Committee at Wells Fargo Funds Management, LLC (“Funds Management”). The Board of Trustees retains the authority to make or ratify any valuation decisions or approve any changes to the Valuation Procedures as it deems appropriate. On a quarterly basis, the Board of Trustees receives reports on any valuation actions taken by the Valuation Committee or the Wells Fargo Asset Management Pricing Committee which may include items for ratification.
Repurchase agreements
The Fund may invest in repurchase agreements and may participate in pooled repurchase agreement transactions with other funds advised by Funds Management. Repurchase agreements are agreements where the seller of a security to the Fund agrees to repurchase that security from the Fund at a mutually agreed upon time and price. The repurchase agreements must be fully collateralized based on values that aremarked-to-market daily. The collateral may be held by an agent bank under atri-party agreement. It is the custodian’s responsibility to value collateral daily and to take action to obtain additional collateral as necessary to maintain a market value equal to or greater than the resale price. The repurchase agreements are collateralized by securities issued or guaranteed by the U.S. Government, its agencies or instrumentalities. There could be potential loss to the Fund in the event that the Fund is delayed or prevented from exercising its rights to dispose of the collateral, including the risk of a possible decline in the value of the underlying obligations during the period in which the Fund seeks to assert its rights.
Security transactions and income recognition
Securities transactions are recorded on a trade date basis. Realized gains or losses are recorded on the basis of identified cost.
Interest income is accrued daily and bond discounts are accreted and premiums are amortized daily. To the extent debt obligations are placed onnon-accrual status, any related interest income may be reduced by writing off interest receivables
28 | Retail Money Market Funds
Table of Contents
Notes to financial statements
when the collection of all or a portion of interest has been determined to be doubtful based on consistently applied procedures and the fair value has decreased. If the issuer subsequently resumes interest payments or when the collectability of interest is reasonably assured, the debt obligation is removed fromnon-accrual status.
Distributions to shareholders
Distributions to shareholders from net investment income are declared daily and paid monthly. Distributions from net realized gains, if any, are recorded on theex-dividend date and paid at least annually. Such distributions are determined in accordance with income tax regulations and may differ from U.S. generally accepted accounting principles. Dividend sources are estimated at the time of declaration. The tax character of distributions is determined as of the Fund’s fiscal year end. Therefore, a portion of the Fund’s distributions made prior to the Fund’s fiscal year end may be categorized as a tax return of capital at year end.
Federal and other taxes
The Fund intends to continue to qualify as a regulated investment company by distributing substantially all of its investment company taxable and tax-exempt income and any net realized capital gains (after reduction for capital loss carryforwards) sufficient to relieve it from all, or substantially all, federal income taxes. Accordingly, no provision for federal income taxes was required.
The Fund’s income and federal excise tax returns and all financial records supporting those returns for the prior three fiscal years are subject to examination by the federal and Delaware revenue authorities. Management has analyzed the Fund’s tax positions taken on federal, state, and foreign tax returns for all open tax years and does not believe that there are any uncertain tax positions that require recognition of a tax liability.
As of January 31, 2020, the cost of investments for federal income tax purposes is substantially the same as for financial reporting purposes.
Class allocations
The separate classes of shares offered by the Fund differ principally in shareholder servicing and administration fees. Class specific expenses are charged directly to that share class. Investment income, common fund-level expenses, and realized gains (losses) on investments are allocated daily to each class of shares based on the relative proportion of net assets of each class.
3. FAIR VALUATION MEASUREMENTS
Fair value measurements of investments are determined within a framework that has established a fair value hierarchy based upon the various data inputs utilized in determining the value of the Fund’s investments. The three-level hierarchy gives the highest priority to unadjusted quoted prices in active markets for identical assets or liabilities (Level 1) and the lowest priority to unobservable inputs (Level 3). The Fund’s investments are classified within the fair value hierarchy based on the lowest level of input that is significant to the fair value measurement. The inputs are summarized into three broad levels as follows:
| ∎ | Level 1 – quoted prices in active markets for identical securities |
| ∎ | Level 2 – other significant observable inputs (including quoted prices for similar securities, interest rates, prepayment speeds, credit risk, etc.) |
| ∎ | Level 3 – significant unobservable inputs (including the Fund’s own assumptions in determining the fair value of investments) |
The inputs or methodologies used for valuing investments in securities are not necessarily an indication of the risk associated with investing in those securities.
The following is a summary of the inputs used in valuing the Fund’s assets and liabilities as of January 31, 2020:
| Quoted prices (Level 1) | Other significant observable inputs (Level 2) | Significant (Level 3) | Total | |||||||||||||
Assets | ||||||||||||||||
Investments in: | ||||||||||||||||
Municipal obligations | $ | 0 | $ | 1,089,678,673 | $ | 0 | $ | 1,089,678,673 | ||||||||
Closed end municipal bond fund obligations | 0 | 10,000,000 | 0 | 10,000,000 | ||||||||||||
Repurchase agreements | 0 | 10,000,000 | 0 | 10,000,000 | ||||||||||||
Total assets | $ | 0 | $ | 1,109,678,673 | $ | 0 | $ | 1,109,678,673 | ||||||||
Retail Money Market Funds | 29
Table of Contents
Notes to financial statements
Additional sector, industry or geographic detail is included in the Portfolio of Investments.
For the year ended January 31, 2020, the Fund did not have any transfers into/out of Level 3.
4. TRANSACTIONS WITH AFFILIATES
Management fee
Funds Management, an indirect wholly owned subsidiary of Wells Fargo & Company (“Wells Fargo”), is the manager of the Fund and provides advisory and fund-level administrative services under an investment management agreement. Under the investment management agreement, Funds Management is responsible for, among other services, implementing the investment objectives and strategies of the Fund, supervising the subadviser and providing fund-level administrative services in connection with the Fund’s operations. As compensation for its services under the investment management agreement, Funds Management is entitled to receive a management fee at the following annual rate based on the Fund’s average daily net assets:
| Average daily net assets | Management fee | |||
First $5 billion | 0.15 | % | ||
Next $5 billion | 0.14 | |||
Over $10 billion | 0.13 | |||
For the year ended January 31, 2020, the management fee was equivalent to an annual rate of 0.15% of the Fund’s average daily net assets.
Funds Management has retained the services of a subadviser to provide daily portfolio management to the Fund. The fee for subadvisory services is borne by Funds Management. Wells Capital Management Incorporated, an affiliate of Funds Management and an indirect wholly owned subsidiary of Wells Fargo, is the subadviser to the Fund and is entitled to receive a fee from Funds Management at an annual rate starting at 0.05% and declining to 0.01% as the average daily net assets of the Fund increase.
Administration fees
Under a class-level administration agreement, Funds Management provides class-level administrative services to the Fund, which includes paying fees and expenses for services provided by the transfer agent,sub-transfer agents, omnibus account servicers and record-keepers. As compensation for its services under the class-level administration agreement, Funds Management receives an annual fee which is calculated based on the average daily net assets of each class as follows:
| Class-level administration fee | ||||
Class A | 0.22 | % | ||
Administrator Class | 0.10 | |||
Premier Class | 0.08 | |||
Service Class | 0.12 | |||
Waivers and/or expense reimbursements
Funds Management has contractually waived and/or reimbursed management and administration fees to the extent necessary to maintain certain net operating expense ratios for the Fund. When each class of the Fund has exceeded its expense cap, Funds Management has waived fees and/or reimbursed expenses from fund-level expenses on a proportionate basis and then from class specific expenses. When only certain classes exceed their expense caps, waivers and/or reimbursements are applied against class specific expenses before fund-level expenses. Funds Management has committed through May 31, 2020 to waive fees and/or reimburse expenses to the extent necessary to cap the Fund’s expenses at 0.60% for Class A shares, 0.30% for Administrator Class shares, 0.20% for Premier Class shares, and 0.45% for Service Class shares. Prior to or after the commitment expiration date, the cap may be increased or the commitment to maintain the cap may be terminated only with the approval of the Board of Trustees.
Shareholder servicing fees
The Trust has entered into contracts with one or more shareholder servicing agents, whereby Class A and Service Class of the Fund are charged a fee at an annual rate of 0.25% of the respective average daily net assets of each class. Administrator Class is charged a fee at an annual rate of 0.10% of its average daily net assets. A portion of these total shareholder servicing fees were paid to affiliates of Wells Fargo.
30 | Retail Money Market Funds
Table of Contents
Notes to financial statements
Interfund transactions
The Fund may purchase or sell portfolio investment securities to certain other Wells Fargo affiliates pursuant to Rule17a-7 under the 1940 Act and under procedures adopted by the Board of Trustees. The procedures have been designed to ensure that these interfund transactions, which do not incur broker commissions, are effected at current market prices. Pursuant to these procedures, the Fund had $585,430,000 and $527,810,000 in interfund purchases and sales, respectively, during the year ended January 31, 2020.
5. DISTRIBUTIONS TO SHAREHOLDERS
The tax character of distributions paid during the years ended January 31, 2020 and January 31, 2019 were as follows:
| Year ended January 31 | ||||||||
| 2020 | 2019 | |||||||
Ordinary income | $ | 766,512 | $ | 722,557 | ||||
Tax-exempt income | 10,700,101 | 9,342,088 | ||||||
Long-term capital gain | 40,185 | 242 | ||||||
As of January 31, 2020, the components of distributable earnings on a tax basis were as follows:
| Undistributed tax-exempt income | Undistributed long-term gain | |
| $247,939 | $15,176 | |
6. INDEMNIFICATION
Under the Trust’s organizational documents, the officers and Trustees have been granted certain indemnification rights against certain liabilities that may arise out of performance of their duties to the Trust. Additionally, in the normal course of business, the Trust may enter into contracts with service providers that contain a variety of indemnification clauses. The Trust’s maximum exposure under these arrangements is dependent on future claims that may be made against the Fund and, therefore, cannot be estimated.
7. NEW ACCOUNTING PRONOUNCEMENTS
In August 2018, FASB issued Accounting Standards Update (“ASU”)No. 2018-13, Fair Value Measurement (Topic 820)Disclosure Framework—Changes to the Disclosure Requirements for Fair Value Measurement. ASU2018-13 updates the disclosure requirements for fair value measurements by modifying or removing certain disclosures and adding certain new disclosures. The amendments are effective for fiscal years, and interim periods within those fiscal years, beginning after December 15, 2019. Early adoption is permitted. Management has adopted the removal and modification of disclosures early, as permitted, and will adopt the additional new disclosures at the effective date.
In March 2017, FASB issued ASUNo. 2017-08,Premium Amortization on Purchased Callable Debt Securities. ASU2017-08 shortens the amortization period for certain callable debt securities held at a premium and requires the premium to be amortized to the earliest call date. The amendments do not require an accounting change for securities held at a discount and discounts will continue to be accreted to the maturity date of the security. ASU2017-08 is effective for fiscal years beginning after December 15, 2018 and for interim periods within those fiscal years. During the current reporting period, management of the Fund adopted the change in accounting policy which did not have a material impact to the Fund’s financial statements.
8. SUBSEQUENT EVENT
On March 11, 2020, the World Health Organization announced that it had made the assessment that coronavirus disease 2019 (“COVID-19”) is a pandemic. The impacts of COVID-19 is adversely affecting the entire global economy, individual companies and investment products, and the market in general. There is significant uncertainty around the extent and duration of business disruptions related to COVID-19 and the impact may be short term or may last for an extended period of time. The risk of further spreading of COVID-19 has led to significant uncertainty and volatility in the financial markets and the value of the Fund and the securities in which the Fund invests may be adversely affected by impacts caused by COVID-19.
Retail Money Market Funds | 31
Table of Contents
Report of independent registered public accounting firm
TO THE SHAREHOLDERS OF THE FUND AND BOARD OF TRUSTEES OF WELLS FARGO FUNDS TRUST:
Opinion on the Financial Statements
We have audited the accompanying statement of assets and liabilities of Wells Fargo NationalTax-Free Money Market Fund (the Fund), one of the funds constituting Wells Fargo Funds Trust, including the portfolio of investments, as of January 31, 2020, the related statement of operations for the year then ended, the statements of changes in net assets for each of the years in thetwo-year period then ended, and the related notes (collectively, the financial statements) and the financial highlights for each of the years in the five-year period then ended. In our opinion, the financial statements and financial highlights present fairly, in all material respects, the financial position of the Fund as of January 31, 2020, the results of its operations for the year then ended, the changes in its net assets for each of the years in thetwo-year period then ended, and the financial highlights for each of the years in the five-year period then ended, in conformity with U.S. generally accepted accounting principles.
Basis for Opinion
These financial statements and financial highlights are the responsibility of the Fund’s management. Our responsibility is to express an opinion on these financial statements and financial highlights based on our audits. We are a public accounting firm registered with the Public Company Accounting Oversight Board (United States) (PCAOB) and are required to be independent with respect to the Fund in accordance with the U.S. federal securities laws and the applicable rules and regulations of the Securities and Exchange Commission and the PCAOB.
We conducted our audits in accordance with the standards of the PCAOB. Those standards require that we plan and perform the audit to obtain reasonable assurance about whether the financial statements and financial highlights are free of material misstatement, whether due to error or fraud. Our audits included performing procedures to assess the risks of material misstatement of the financial statements and financial highlights, whether due to error or fraud, and performing procedures that respond to those risks. Such procedures included examining, on a test basis, evidence regarding the amounts and disclosures in the financial statements and financial highlights. Such procedures also included confirmation of securities owned as of January 31, 2020, by correspondence with the custodian and brokers, or by other appropriate auditing procedures. Our audits also included evaluating the accounting principles used and significant estimates made by management, as well as evaluating the overall presentation of the financial statements and financial highlights. We believe that our audits provide a reasonable basis for our opinion.

We have not been able to determine the specific year that we began serving as the auditor of one or more Wells Fargo Funds investment companies; however we are aware that we have served as the auditor of one or more Wells Fargo Funds investment companies since at least 1955.
Boston, Massachusetts
March 31, 2020
32 | Retail Money Market Funds
Table of Contents
TAX INFORMATION
Pursuant to Section 852 of the Internal Revenue Code, $40,185 was designated as a 20% rate gain distribution for the fiscal year ended January 31, 2020.
For the fiscal year ended January 31, 2020, $633,275 has been designated as interest-related dividends for nonresident alien shareholders pursuant to Section 871 of the Internal Revenue Code.
For the fiscal year ended January 31, 2020, $133,237 has been designated as short-term capital gain dividends for nonresident alien shareholders pursuant to Section 871 of the Internal Revenue Code.
Pursuant to Section 852 of the Internal Revenue Code, 94.41% of distributions paid from net investment income is designated as exempt-interest dividends for the fiscal year ended January 31, 2020.
PROXY VOTING INFORMATION
A description of the policies and procedures used to determine how to vote proxies relating to portfolio securities is available, upon request, by calling1-800-222-8222, visiting our website atwfam.com, or visiting the SEC website at sec.gov. Information regarding how the proxies related to portfolio securities were voted during the most recent12-month period ended June 30 is available on the website atwfam.comor by visiting the SEC website at sec.gov.
Retail Money Market Funds | 33
Table of Contents
Other information (unaudited)
BOARD OF TRUSTEES AND OFFICERS
Each of the Trustees and Officers1 listed in the table below acts in identical capacities for each fund in the Wells Fargo family of funds, which consists of 149 mutual funds comprising the Wells Fargo Funds Trust, Wells Fargo Variable Trust, Wells Fargo Master Trust and fourclosed-end funds (collectively the “Fund Complex”). This table should be read in conjunction with the Prospectus and the Statement of Additional Information2. The mailing address of each Trustee and Officer is 525 Market Street, 12th Floor, San Francisco, CA 94105. Each Trustee and Officer serves an indefinite term, however, each Trustee serves such term until reaching the mandatory retirement age established by the Trustees.
Independent Trustees
| Name and year of birth | Position held and length of service* | Principal occupations during past five years or longer | Current other public company or investment company directorships | |||
William R. Ebsworth (Born 1957) | Trustee, since 2015 | Retired. From 1984 to 2013, equities analyst, portfolio manager, research director and chief investment officer at Fidelity Management and Research Company in Boston, Tokyo, and Hong Kong, and retired in 2013 as Chief Investment Officer of Fidelity Strategic Advisers, Inc. where he led a team of investment professionals managing client assets. Prior thereto, Board member of Hong Kong Securities Clearing Co., Hong Kong Options Clearing Corp., the Thailand International Fund, Ltd., Fidelity Investments Life Insurance Company, and Empire Fidelity Investments Life Insurance Company. Audit Committee Chair and Investment Committee Chair of the Vincent Memorial Hospital Endowment(non-profit organization). Mr. Ebsworth is a CFA® charterholder. | N/A | |||
Jane A. Freeman (Born 1953) | Trustee, since 2015; Chair Liaison, since 2018 | Retired. From 2012 to 2014 and 1999 to 2008, Chief Financial Officer of Scientific Learning Corporation. From 2008 to 2012, Ms. Freeman provided consulting services related to strategic business projects. Prior to 1999, Portfolio Manager at Rockefeller & Co. and Scudder, Stevens & Clark. Board member of the Harding Loevner Funds from 1996 to 2014, serving as both Lead Independent Director and chair of the Audit Committee. Board member of the Russell Exchange Traded Funds Trust from 2011 to 2012 and the chair of the Audit Committee. Ms. Freeman is a Board Member of The Ruth Bancroft Garden(non-profit organization). She is also an inactive Chartered Financial Analyst. | N/A | |||
Isaiah Harris, Jr. (Born 1952) | Trustee, since 2009; Audit Committee Chairman, since 2019 | Retired. Chairman of the Board of CIGNA Corporation since 2009, and Director since 2005. From 2003 to 2011, Director of Deluxe Corporation. Prior thereto, President and CEO of BellSouth Advertising and Publishing Corp. from 2005 to 2007, President and CEO of BellSouth Enterprises from 2004 to 2005 and President of BellSouth Consumer Services from 2000 to 2003. Emeritus member of the Iowa State University Foundation Board of Governors. Emeritus Member of the Advisory Board of Iowa State University School of Business. Advisory Board Member, Palm Harbor Academy (private school). Advisory Board Member, Child Evangelism Fellowship(non-profit). Mr. Harris is a certified public accountant (inactive status). | CIGNA Corporation | |||
Judith M. Johnson (Born 1949) | Trustee, since 2008; Audit Committee Chairman, from 2009 to 2018 | Retired. Prior thereto, Chief Executive Officer and Chief Investment Officer of Minneapolis Employees Retirement Fund from 1996 to 2008. Ms. Johnson is an attorney, certified public accountant and a certified managerial accountant. | N/A | |||
34 | Retail Money Market Funds
Table of Contents
Other information (unaudited)
| Name and year of birth | Position held and length of service* | Principal occupations during past five years or longer | Current other public company or investment company directorships | |||
David F. Larcker (Born 1950) | Trustee, since 2009 | James Irvin Miller Professor of Accounting at the Graduate School of Business, Stanford University, Director of the Corporate Governance Research Initiative and Senior Faculty of The Rock Center for Corporate Governance since 2006. From 2005 to 2008, Professor of Accounting at the Graduate School of Business, Stanford University. Prior thereto, Ernst & Young Professor of Accounting at The Wharton School, University of Pennsylvania from 1985 to 2005. | N/A | |||
Olivia S. Mitchell (Born 1953) | Trustee, since 2006; Nominating and Governance Committee Chair, since 2018 | International Foundation of Employee Benefit Plans Professor, Wharton School of the University of Pennsylvania since 1993. Director of Wharton’s Pension Research Council and Boettner Center on Pensions & Retirement Research, and Research Associate at the National Bureau of Economic Research. Previously, Cornell University Professor from 1978 to 1993. | N/A | |||
Timothy J. Penny (Born 1951) | Trustee, since 1996; Chairman, since 2018 | President and Chief Executive Officer of Southern Minnesota Initiative Foundation, anon-profit organization, since 2007. Member of the Board of Trustees of NorthStar Education Finance, Inc., anon-profit organization, since 2007. | N/A | |||
James G. Polisson (Born 1959) | Trustee, since 2018 | Retired. Chief Marketing Officer, Source (ETF) UK Services, Ltd, from 2015 to 2017. From 2012 to 2015, Principal of The Polisson Group, LLC, a management consulting, corporate advisory and principal investing company. Chief Executive Officer and Managing Director at Russell Investments, Global Exchange Traded Funds from 2010 to 2012. Managing Director of Barclays Global Investors from 1998 to 2010 and Global Chief Marketing Officer for iShares and Barclays Global Investors from 2000 to 2010. Trustee of the San Francisco Mechanics’ Institute, anon-profit organization, from 2013 to 2015. Board member of the Russell Exchange Traded Fund Trust from 2011 to 2012. Director of Barclays Global Investors Holdings Deutschland GmbH from 2006 to 2009. Mr. Polisson is an attorney and has a retired status with the Massachusetts and District of Columbia Bar Associations. | N/A | |||
Pamela Wheelock3 (Born 1959) | Trustee, since January 2020; previously Trustee from January 2018 to July 2019 | Board member of the Destination Medical Center Economic Development Agency, Rochester, Minnesota since 2019. Acting Commissioner, Minnesota Department of Human Services, July 2019 through September 2019. Human Services Manager (part-time), Minnesota Department of Human Services, October 2019 through December 2019. Chief Operating Officer, Twin Cities Habitat for Humanity from 2017 to 2019. Vice President of University Services, University of Minnesota from 2012 to 2016. Prior thereto, on the Board of Directors, Governance Committee and Finance Committee for the Minnesota Philanthropy Partners (Saint Paul Foundation) from 2012 to 2018, Interim Chief Executive Officer of Blue Cross Blue Shield of Minnesota from 2011 to 2012, Chairman of the Board from 2009 to 2012 and Board Director from 2003 to 2015. Vice President, Leadership and Community Engagement, Bush Foundation, Saint Paul, Minnesota (a private foundation) from 2009 to 2011. Executive Vice President and Chief Financial Officer, Minnesota Sports and Entertainment from 2004 to 2009 and Senior Vice President from 2002 to 2004. Executive Vice President of the Minnesota Wild Foundation from 2004 to 2008. Commissioner of Finance, State of Minnesota, from 1999 to 2002. Currently Board Chair of the Minnesota Wild Foundation since 2010. | N/A | |||
| * | Length of service dates reflect the Trustee’s commencement of service with the Trust’s predecessor entities, where applicable. |
Retail Money Market Funds | 35
Table of Contents
Other information (unaudited)
Officers
| Name and year of birth | Position held and length of service | Principal occupations during past five years or longer | ||
Andrew Owen (Born 1960) | President, since 2017 | Executive Vice President of Wells Fargo & Company and Head of Affiliated Managers, Wells Fargo Asset Management, since 2014. In addition, Mr. Owen is currently President, Chief Executive Officer and Director of Wells Fargo Funds Management, LLC since 2017. Prior thereto, Executive Vice President responsible for marketing, investments and product development for Wells Fargo Funds Management, LLC, from 2009 to 2014. | ||
Nancy Wiser1 (Born 1967) | Treasurer, since 2012 | Executive Vice President of Wells Fargo Funds Management, LLC since 2011. Chief Operating Officer and Chief Compliance Officer at LightBox Capital Management LLC, from 2008 to 2011. | ||
Michelle Rhee (Born 1966) | Chief Legal Officer, since 2019 | Secretary of Wells Fargo Funds Management, LLC, Chief Legal Counsel of Wells Fargo Asset Management and Assistant General Counsel of Wells Fargo Bank, N.A. since 2018. Associate General Counsel and Managing Director of Bank of America Corporation from 2004 to 2018. | ||
Catherine Kennedy (Born 1969) | Secretary, since 2019 | Vice President of Wells Fargo Funds Management, LLC and Senior Counsel of the Wells Fargo Legal Department since 2010. Vice President and Senior Counsel of Evergreen Investment Management Company, LLC from 1998 to 2010. | ||
Michael H. Whitaker (Born 1967) | Chief Compliance Officer, since 2016 | Chief Compliance Officer of Wells Fargo Asset Management since 2016. Senior Vice President and Chief Compliance Officer for Fidelity Investments from 2007 to 2016. | ||
David Berardi (Born 1975) | Assistant Treasurer, since 2009 | Vice President of Wells Fargo Funds Management, LLC since 2009. Vice President of Evergreen Investment Management Company, LLC from 2008 to 2010. Manager of Fund Reporting and Control for Evergreen Investment Management Company, LLC from 2004 to 2010. | ||
Jeremy DePalma1 (Born 1974) | Assistant Treasurer, since 2009 | Senior Vice President of Wells Fargo Funds Management, LLC since 2009. Senior Vice President of Evergreen Investment Management Company, LLC from 2008 to 2010 and head of the Fund Reporting and Control Team within Fund Administration from 2005 to 2010. | ||
| 1 | Nancy Wiser acts as Treasurer of 64 funds in the Fund Complex. Jeremy DePalma acts as Treasurer of 85 funds and Assistant Treasurer of 64 funds in the Fund Complex. |
| 2 | The Statement of Additional Information includes additional information about the Trustees and is available, without charge, upon request, by calling1-800-222-8222 or by visiting the website atwfam.com. |
| 3 | Pamela Wheelock wasre-appointed to the Board effective January 1, 2020. |
36 | Retail Money Market Funds
Table of Contents
For more information
More information about Wells Fargo Funds is available free upon request. To obtain literature, please write, visit the Fund’s website, or call:
Wells Fargo Funds
P.O. Box 219967
Kansas City, MO 64121-9967
Website:wfam.com
Individual investors:1-800-222-8222
Retail investment professionals:1-888-877-9275
Institutional investment professionals:1-866-765-0778

This report and the financial statements contained herein are submitted for the general information of the shareholders of the Fund. If this report is used for promotional purposes, distribution of the report must be accompanied or preceded by a current prospectus. Before investing, please consider the investment objectives, risks, charges, and expenses of the investment. For a current prospectus and, if available, a summary prospectus, containing this information, call1-800-260-5969 or visit the Fund’s website atwfam.com. Read the prospectus carefully before you invest or send money.
Wells Fargo Asset Management (WFAM) is the trade name for certain investment advisory/management firms owned by Wells Fargo & Company. These firms include but are not limited to Wells Capital Management Incorporated and Wells Fargo Funds Management, LLC. Certain products managed by WFAM entities are distributed by Wells Fargo Funds Distributor, LLC (a broker-dealer and Member FINRA).
This material is for general informational and educational purposes only and is NOT intended to provide investment advice or a recommendation of any kind—including a recommendation for any specific investment, strategy, or plan.
INVESTMENT PRODUCTS: NOT FDIC INSURED ◾ NO BANK GUARANTEE ◾ MAY LOSE VALUE
© 2020 Wells Fargo & Company. All rights reserved
PAR-0220-03778 03-20
A309/AR309 01-20
Table of Contents

Annual Report
January 31, 2020
Government Money Market Funds
| ∎ | Wells Fargo Treasury Plus Money Market Fund |
Beginning on January 1, 2021, as permitted by new regulations adopted by the Securities and Exchange Commission, paper copies of the Wells Fargo Funds’ annual and semi-annual shareholder reports issued after this date will no longer be sent by mail, unless you specifically request paper copies of the reports. Instead, the reports will be made available on the Funds’ website, and you will be notified by mail each time a report is posted and provided with a website address to access the report.
If you already elected to receive shareholder reports electronically, you will not be affected by this change and you need not take any action. You may elect to receive shareholder reports and other communications from the Fund electronically at any time by contacting your financial intermediary (such as a broker-dealer or bank) or, if you are a direct investor, by calling1-800-222-8222 or by enrolling at wellsfargo.com/advantagedelivery.
You may elect to receive all future reports in paper free of charge. If you invest through a financial intermediary, you can contact your financial intermediary to request that you continue to receive paper copies of your shareholder reports; if you invest directly with the Fund, you can call 1-800-222-8222. Your election to receive reports in paper will apply to all Wells Fargo Funds held in your account with your financial intermediary or, if you are a direct investor, to all Wells Fargo Funds that you hold.
Table of Contents
|
Reduce clutter. Save trees. |
Sign up for electronic delivery of prospectuses and shareholder reports atwellsfargo.com/advantagedelivery |
The views expressed and any forward-looking statements are as of January 31, 2020, unless otherwise noted, and are those of the Fund managers and/or Wells Fargo Asset Management. Discussions of individual securities, or the markets generally, or any Wells Fargo Fund are not intended as individual recommendations. Future events or results may vary significantly from those expressed in any forward-looking statements. The views expressed are subject to change at any time in response to changing circumstances in the market. Wells Fargo Asset Management and the Fund disclaim any obligation to publicly update or revise any views expressed or forward-looking statements.
INVESTMENT PRODUCTS: NOT FDIC INSURED ◾ NO BANK GUARANTEE ◾ MAY LOSE VALUE
Government Money Market Funds | 1
Table of Contents
Letter to shareholders (unaudited)

Andrew Owen
President
Wells Fargo Funds
Dear Shareholder:
We are pleased to offer you this annual report for the Wells Fargo Treasury Plus Money Market Fund for the 12-month period that ended January 31, 2020. Despite some periods of market volatility, the year was strongly positive for financial markets as supportive central banks more than offset concerns over slowing global economic growth and international trade tensions.
Overall, both fixed-income and equity investors enjoyed healthy annual returns, with U.S. markets leading the way. For the period, U.S. stocks, based on the S&P 500 Index,1 gained 21.68% and international stocks, as measured by the MSCI ACWI ex USA Index (Net),2 returned 9.94%. The MSCI EM Index (Net)3 gained a more modest 3.81%. For bond investors, the Bloomberg Barclays U.S. Aggregate Bond Index4 added 9.64%, the Bloomberg Barclays Global Aggregate ex-USD Index5 returned 3.95%, the Bloomberg Barclays Municipal Bond Index6 gained 8.65%, and the ICE BofA U.S. High Yield Index7 added 9.39%.
The year began with a strong market rebound.
Financial markets opened 2019 on a positive note, as investors were encouraged by the U.S. Federal Reserve (Fed) taking a more accommodative stance after a series of increases to the federal funds rate in 2017 and 2018. However, concerns over slowing global growth grew more ominous. Fourth-quarter 2018 gross domestic product (GDP), reported in February 2019, grew at an annualized 2.2% rate, down from the levels of the prior two quarters. The Bank of England forecast the slowest growth since the financial crisis for 2019. China and the U.S. continued to wrangle over trade issues. By the end of the first quarter of 2019, more accommodative Fed sentiment and steady, if not spectacular, U.S. economic and business metrics encouraged domestic investors.
Early second-quarter 2019 enthusiasm among investors faded.
During April, sustained low inflation, solid employment data, and first-quarter U.S. GDP of an annualized rate of 3.2% supported favorable sentiment. During May, however, markets tumbled on mixed investment signals. In the U.S., partisan political wrangling ramped up in advance of the 2020 election. The U.K.’s Brexit disagreements caused Prime Minister Theresa May to resign. Boris Johnson succeeded her, only to add to uncertainty about Brexit’s resolution ahead of an October 2019 deadline. The European Commission downgraded the 2019 growth forecast to 1.2%. The U.S. increased tariffs on
| 1 | The S&P 500 Index consists of 500 stocks chosen for market size, liquidity, and industry group representation. It is a market-value-weighted index with each stock’s weight in the index proportionate to its market value. You cannot invest directly in an index. |
| 2 | The Morgan Stanley Capital International (MSCI) All Country World Index (ACWI) ex USA Index (Net) is a free-float-adjusted market-capitalization-weighted index that is designed to measure the equity market performance of developed markets, excluding the United States. Source: MSCI. MSCI makes no express or implied warranties or representations and shall have no liability whatsoever with respect to any MSCI data contained herein. The MSCI data may not be further redistributed or used as a basis for other indices or any securities or financial products. This report is not approved, reviewed, or produced by MSCI. You cannot invest directly in an index. |
| 3 | The MSCI Emerging Markets (EM) Index (Net) is a free-float-adjusted market-capitalization-weighted index that is designed to measure equity market performance of emerging markets. You cannot invest directly in an index. |
| 4 | The Bloomberg Barclays U.S. Aggregate Bond Index is a broad-based benchmark that measures the investment-grade, U.S. dollar-denominated, fixed-rate taxable bond market, including Treasuries, government-related and corporate securities, mortgage-backed securities (agency fixed-rate and hybrid adjustable-rate mortgage pass-throughs), asset-backed securities, and commercial mortgage-backed securities. You cannot invest directly in an index. |
| 5 | The Bloomberg Barclays Global Aggregate ex-USD Index is an unmanaged index that provides a broad-based measure of the global investment-grade fixed-income markets excluding the U.S. dollar-denominated debt market. You cannot invest directly in an index. |
| 6 | The Bloomberg Barclays Municipal Bond Index is an unmanaged index composed of long-term tax-exempt bonds with a minimum credit rating of Baa. You cannot invest directly in an index. |
| 7 | The ICE BofA U.S. High Yield Index is a market-capitalization-weighted index of domestic and Yankee high-yield bonds. The index tracks the performance of high-yield securities traded in the U.S. bond market. You cannot invest directly in an index. Copyright 2020. ICE Data Indices, LLC. All rights reserved. |
2 | Government Money Market Funds
Table of Contents
Letter to shareholders (unaudited)
products from China, China responded, and then talks broke down. President Donald Trump threatened to turn his foreign policy tariff tool to Mexico over immigration issues.
Midway through the year, investors regrouped, sentiment turned positive, and U.S. equity markets advanced during June and July. The gains, primarily driven by geopolitical and monetary policy events, pushed equity markets to new highs. European Central Bank President Mario Draghi indicated the bank was ready to cut rates or buy more assets to prop up inflation if needed. President Trump backed off of tariff threats against Mexico and China. In the U.S., the Fed implemented a 0.25% federal funds rate cut in July.
Later in July, the U.S. reversed course and threatened to impose higher tariffs on China’s exports after talks failed. China responded with tariff threats of its own and devalued the renminbi, roiling global markets. Major U.S. stock market indices closed July with the worst weekly results of the year. Bond prices gained as Treasury yields fell to multiyear lows, and the yield curve inverted at multiple points along the 30-year arc.
In August, U.S.-China trade tensions continued with no signs of compromise. Evidence of a continued global economic slowdown mounted, and central banks in China, New Zealand, and Thailand cut interest rates. Industrial and manufacturing data declined in China, Canada, Japan, and Germany. Adding to global uncertainty, Italy’s prime minister resigned, many feared a crackdown in Hong Kong as protestors sustained their calls for reform, and Boris Johnson planned to suspend Parliament as Brexit’s deadline neared.
In the U.S., the Fed cut interest rates a second time in September. U.S. manufacturing data disappointed investors. The U.S. Congress announced it would pursue an impeachment investigation of President Trump. Meanwhile, the Brexit impasse showed no signs of resolution. Officials in China said that hitting the country’s economic growth goals for the year would be difficult considering the weight of tariffs and trade restrictions. Although the S&P 500 Index finished the third quarter with the best year-to-date returns in more than 20 years, concerns about future returns remained.
The fourth quarter started on a strong note, with U.S.-China trade tensions relaxing in October along with renewed optimism for a U.K. Brexit deal and positive macroeconomic data. The initial estimate of U.S. third-quarter GDP growth was a resilient 1.9% annualized rate, while the U.S. unemployment rate fell to a 50-year low of 3.5% in September. However, despite resilience among U.S. consumers, business confidence declined while manufacturing activity contracted. Concerned with a potential economic slowdown, the Fed lowered interest rates another quarter point in late October, its third rate cut in four months. This helped push the S&P 500 Index to a new all-time high, while emerging market equities rallied and global bonds declined overall, reflecting a broad pickup in risk appetite.
Equity markets continued to rally in November despite ongoing geopolitical risks. Hopes for a U.S.-China trade deal buoyed investor confidence. U.S. business sentiment improved slightly, and manufacturing and services activity picked up. Throughout the month, central bank actions were on hold. With that positive backdrop, developed market equities outpaced those in emerging markets, and U.S. stocks, as reflected by the S&P 500 Index, outperformed non-U.S. stocks overall. While consumer confidence and purchasing manager activity rose in the eurozone, China reported weakening manufacturing and consumer data. Bond yields rose marginally, leading to slightly negative returns for global government and investment-grade corporate bonds.
Financial markets ended 2019 on a broadly positive note, with the U.S. and China reaching an accord on a Phase One trade deal, with some details to be worked out. That, along with the landslide win by the pro-Brexit U.K. Conservative Party in a national election and ongoing central bank support, gave investors greater certainty and confidence. U.S. economic indicators were generally positive, with the exception of manufacturing activity and business confidence. However, consumer confidence was resilient, fed by a robust labor market, tame inflation, and lower interest rates, which boosted housing affordability and stimulated homebuyer activity. The impeachment of U.S. President Donald Trump, while
“Midway through the year, investors regrouped, sentiment turned positive, and U.S. equity markets advanced.”
“Financial markets ended 2019 on a broadly positive note, with the U.S. and China reaching an accord on a Phase One trade deal.”
Government Money Market Funds | 3
Table of Contents
Letter to shareholders (unaudited)
historically noteworthy, had little impact on markets. Meanwhile, slowing Chinese economic activity, partly attributable to the trade war, led to further government stimulus at year-end through lower reserve ratios, allowing banks to lend more money.
The year-end rally continued in early January 2020. However, capital market volatility picked up in late January on concerns over the unknown impact of the coronavirus on the global economy and stock markets. With sentiment somewhat souring, perceived safe havens did well in January. The U.S. dollar and Japanese yen both rose and government bonds outperformed equities. While the S&P 500 Index held its ground, emerging market equities tumbled, including those in Asia, that are most exposed to viruses—physical or economic—originating in China.
Following the end of the reporting period, the coronavirus continued its global spread, resulting in disruptions to global markets, including through border closings, restrictions on travel and large gatherings, expedited and enhanced health screenings, quarantines, cancellations, business and school closings, disruptions to employment and supply chains, reduced productivity, and reduced customer and client activity in multiple markets and sectors. The risk of further spreading of the coronavirus has led to significant uncertainty and volatility in the financial markets. The full extent of the coronavirus’s impact on the global economy cannot necessarily be foreseen and the impacts may be short term or may last for an extended period of time.
Don’t let short-term uncertainty derail long-term investment goals.
Periods of investment uncertainty can present challenges, but experience has taught us that maintaining long-term investment goals can be an effective way to plan for the future. To help you create a sound strategy based on your personal goals and risk tolerance, Wells Fargo Funds offers more than 100 mutual funds spanning a wide range of asset classes and investment styles. Although diversification cannot guarantee an investment profit or prevent losses, we believe it can be an effective way to manage investment risk and potentially smooth out overall portfolio performance. We encourage investors to know their investments and to understand that appropriate levels of risk-taking may unlock opportunities.
Thank you for choosing to invest with Wells Fargo Funds. We appreciate your confidence in us and remain committed to helping you meet your financial needs.
Sincerely,

Andrew Owen
President
Wells Fargo Funds
|
For further information about your Fund, contact your investment professional, visit our website atwfam.com, or call us directly at1-800-222-8222. |
4 | Government Money Market Funds
Table of Contents
This page is intentionally left blank.
Table of Contents
Performance highlights (unaudited)
Investment objective
The Fund seeks current income, while preserving capital and liquidity.
Manager
Wells Fargo Funds Management, LLC
Subadviser
Wells Capital Management Incorporated
Portfolio managers
Michael C. Bird, CFA®‡
Jeffrey L. Weaver, CFA®‡
Laurie White
Average annual total returns (%) as of January 31, 2020
| Expense ratios1 (%) | ||||||||||||||||||||||
| Inception date | 1 year | 5 year | 10 year | Gross | Net2 | |||||||||||||||||
| Class A (PIVXX) | 7-28-2003 | 1.56 | 0.66 | 0.34 | 0.61 | 0.60 | ||||||||||||||||
| Administrator Class (WTPXX) | 3-31-2008 | 1.83 | 0.83 | 0.42 | 0.34 | 0.34 | ||||||||||||||||
| Institutional Class (PISXX) | 8-11-1995 | 1.97 | 0.95 | 0.48 | 0.22 | 0.20 | ||||||||||||||||
| Select Class3 | 3-15-2019 | 2.01 | 0.96 | 0.48 | 0.18 | 0.14 | ||||||||||||||||
| Service Class (PRVXX) | 10-1-1985 | 1.72 | 0.76 | 0.38 | 0.51 | 0.45 | ||||||||||||||||
Yield summary (%) as of January 31, 20202
| Class A | Administrator Class | Institutional Class | Select Class | Service Class | ||||||||||||||
| 7-day current yield | 1.04 | 1.30 | 1.44 | 1.50 | 1.19 | |||||||||||||
| 7-day compound yield | 1.04 | 1.30 | 1.45 | 1.51 | 1.19 | |||||||||||||
| 30-day simple yield | 1.03 | 1.29 | 1.43 | 1.49 | 1.18 | |||||||||||||
| 30-day compound yield | 1.04 | 1.30 | 1.44 | 1.50 | 1.19 | |||||||||||||
Figures quoted represent past performance, which is no guarantee of future results, and do not reflect taxes that shareholder may pay on an investment in a fund. Investment returns will fluctuate. The Fund’s yield figures more closely reflect the current earnings of the Fund than the total return figures. Current performance may be lower or higher than the performance data quoted, which assumes the reinvestment of dividends and capital gains. Currentmonth-end performance is available on the Fund’s website,wfam.com.
Money market funds are sold without a front-end sales charge or contingent deferred sales charge. Other fees and expenses apply to an investment in the Fund and are described in the Fund’s current prospectus.
For government money market funds: You could lose money by investing in the Fund. Although the Fund seeks to preserve the value of your investment at $1.00 per share, it cannot guarantee it will do so. An investment in the Fund is not insured or guaranteed by the Federal Deposit Insurance Corporation or any other government agency. The Fund’s sponsor has no legal obligation to provide financial support to the Fund, and you should not expect that the sponsor will provide financial support to the Fund at any time.
Please see footnotes on page 7.
6 | Government Money Market Funds
Table of Contents
Performance highlights (unaudited)
| Portfolio composition as of January 31, 20204 | ||
| ||
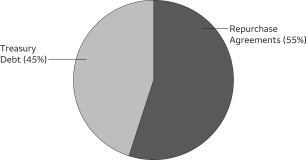
| Effective maturity distribution as of January 31, 20204 | ||
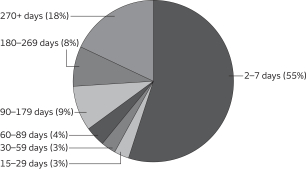 | ||
| Weighted average maturity as of January 31, 20205 |
30 days |
| Weighted average life as of January 31, 20206 |
110 days |
| ‡ | CFA® and Chartered Financial Analyst®are trademarks owned by CFA Institute. |
| 1 | Reflects the expense ratios as stated in the most recent prospectuses. The expense ratios shown are subject to change and may differ from the annualized expense ratios shown in the financial highlights of this report. |
| 2 | The manager has contractually committed through May 31, 2020, to waive fees and/or reimburse expenses to the extent necessary to cap total annual fund operating expenses after fee waivers at 0.60% for Class A, 0.34% for Administrator Class, 0.20% for Institutional Class, 0.14% for Select Class, and 0.45% for Service Class. Brokerage commissions, stamp duty fees, interest, taxes, acquired fund fees and expenses (if any), and extraordinary expenses are excluded from the expense cap. Prior to or after the commitment expiration date, the cap may be increased or the commitment to maintain the cap may be terminated only with the approval of the Board of Trustees. Without this cap, the Fund’s returns would have been lower. Without waived fees and/or reimbursed expenses, the Fund’s7-day current yield would have been 1.02%, 1.29%, 1.41%, 1.45%, and 1.12% for Class A, Administrator Class, Institutional Class, Select Class, and Service Class, respectively. The expense ratio paid by an investor is the net expense ratio (the total annual fund operating expenses after fee waivers) as stated in the prospectuses. |
| 3 | Historical performance shown for the Select Class shares prior to their inception reflects the performance of the Institutional Class shares, and includes the higher expenses applicable to Institutional Class shares. If these expenses had not been included, returns for Select Class shares would be higher. |
| 4 | Amounts are calculated based on the total investments of the Fund. These amounts are subject to change and may have changed since the date specified. |
| 5 | Weighted Average Maturity (WAM): WAM is an average of the effective maturities of all securities held in the portfolio, weighted by each security’s percentage of total investments. The maturity of a portfolio security is the period remaining until the date on which the principal amount is unconditionally required to be paid, or in the case of a security called for redemption, the date on which the redemption payment is unconditionally required to be made. WAM calculations allow for the maturities of certain securities with demand features or periodic interest rate resets to be shortened. WAM is a way to measure a fund’s sensitivity to potential interest rate changes. WAM is subject to change and may have changed since the date specified. |
| 6 | Weighted Average Life (WAL): WAL is an average of the final maturities of all securities held in the portfolio, weighted by their percentage of total investments. The maturity of a portfolio security is the period remaining until the date on which the principal amount is unconditionally required to be paid, or in the case of a security called for redemption, the date on which the redemption payment is unconditionally required to be made. In contrast to WAM, the calculation of WAL allows for the maturities of certain securities with demand features to be shortened, but not the periodic interest rate resets. WAL is a way to measure a fund’s potential sensitivity to credit spread changes. WAL is subject to change and may have changed since the date specified. |
| 7 | The Core Personal Consumption Expenditures (PCE) Price Index measures the prices paid by U.S. consumers for domestic goods and services, excluding the prices of food and energy. You cannot invest directly into an index. |
Government Money Market Funds | 7
Table of Contents
Performance highlights (unaudited)
MANAGER’S DISCUSSION
The Fund’s fiscal year that ended January 31, 2020, saw the U.S. Federal Reserve (Fed) end the monetary policy normalization actions it had taken over the past several years, which included both raising interest rates and reducing the size of its balance sheet. The fiscal year began with the Fed targeting the range on the federal funds rate at 2.25% to 2.50%. Despite a generally steady domestic economy, with the drag from a slowing factory sector offset by continued solid consumer activity, the Fed sought to counter the economic risks from trade disputes, slowing global growth, and sluggish U.S. manufacturing by lowering its interest rate target three times—in July, September, and October—by 0.25% each. The resulting federal funds target rate at the end of the fiscal year was 1.50% to 1.75%.
In addition to cutting interest rates, the Fed also reversed course on its balance sheet policy. Since 2017, it had shrunk its balance sheet by systematically allowing a portion of the U.S. Treasury and mortgage-backed securities it acquired during its quantitative easing programs to mature without being reinvested, thereby effectively unwinding the policies it used to assist the economy’s recovery from the financial crisis. The Fed abruptly halted this gradual asset reduction by once again reinvesting all of its maturing investments concurrent with its first interest rate cut in July 2019. Later, in October, the Fed completed the reversal by once again expanding its balance sheet, this time by buying $60 billion of Treasury bills(T-bills) per month with the goal of expanding the banking system’s reserves.
During the year, the U.S. economy grew solidly, with gross domestic product clocking in at an average rate of approximately 2.3% on an annualized basis, only modestly slower than the 2.5% rate posted the prior year. Employment remained strong, with the unemployment rate ending the fiscal year at 3.6%, down from 4.0% a year earlier. In addition, the underemployment rate, which includes workers marginally attached to the labor force and those working part time for economic reasons, fell even further, from 8.0% to 6.9% over the same period. Both measures were at or near50-year lows. Price inflation, however, remains stubbornly below the Fed’s 2% target. After ending the prior fiscal year at 1.8%, the Core PCE Price Index7 deflator, the Fed’s preferred price measure, fell to 1.6% at the end of this fiscal year.
Interest rates on all categories of government money market securities moved lower throughout the year, consistent with the Fed’s moves. In February 2019, the3-monthT-bill yields averaged 2.42%. During January 2020, the last month of the fiscal year, they averaged 1.54%. For the entire fiscal year, the average was 2.01%, down from an average of 2.04% for the prior fiscal year. Similarly, average6-monthT-bill yields were 2.49% in February 2019; 1.55% in January 2020; and 2.01% on average for the whole fiscal year, down from an average of 2.21% in the previous fiscal year. The lower yields onT-bills were due not only to the Fed’s interest rate cuts but also to the Fed’s reserves management purchases of $60 billion per month discussed above.
The yields on repurchase agreements (repos) generally followed the same path and were also heavily influenced by the Fed’s decisions. Overnight Treasury repo rates, as measured by the Fed’s Overnight Treasury repo rates averaged 2.38% in February 2019 and 1.52% in January 2020. For the entire fiscal year, the average Treasury repo yield was 2.10%, up from 1.92% for the previous fiscal year. In addition to being affected by the Fed’s interest rate cuts, repo yields were also affected by the Fed’s balance sheet actions, as discussed above. As a consequence of the Fed shrinking its balance sheet, banking system reserves also fell, which eventually pushed repo rates higher, culminating in a sharp move higher that saw the Overnight Treasury repo rates peak at 5.25% on September 17, 2019. To maintain control of interest rates and prevent a similar move higher, the Fed added cash to the repo market directly in the form of temporary open market operations while methodically adding permanent reserves by buyingT-bills at a rate of $60 billion per month. These actions have succeeded, as repo rates have been well contained near the bottom of the Fed’s target range.
Our investment strategy remained consistent throughout the year. We invested inT-bills and U.S. Treasury notes—including floating-rate notes—as well as repos collateralized by Treasury securities, while taking into account the Fund’s overall level of liquidity and average maturity.
Strategic outlook
The economy has continued its solid performance, with a consistently strong labor market and stable—but still below target—inflation. After its third, and last, interest rate reduction of the year in October 2019, the Fed signaled that it intended to keep rates unchanged barring a material change in its outlook. A weaker economy may lead to further cuts, but a stronger economy alone will not necessarily cause higher rates unless it is accompanied by consistently strong inflation. Just as the fiscal year ended, in February and March 2020, the coronavirus began to spread globally, prompting consumers, businesses, and governments to take unusually strong actions in an attempt to limit its impact. In so doing, it appears that there could be a serious toll on the U.S. and global economy. Anticipating this, financial markets experienced a sharp spike in volatility, prompting a series of supportive actions by the Fed. In the face of all this, we continue to believe that our investment strategy, with its focus on capital preservation and liquidity, is as important as ever.
Please see footnotes on page 7.
8 | Government Money Market Funds
Table of Contents
As a shareholder of the Fund, you incur ongoing costs, including management fees, distribution(12b-1) and/or shareholder servicing fees, and other Fund expenses. This example is intended to help you understand your ongoing costs (in dollars) of investing in the Fund and to compare these costs with the ongoing costs of investing in other mutual funds.
The example is based on an investment of $1,000 invested at the beginning of thesix-month period and held for the entire period from August 1, 2019 to January 31, 2020.
Actual expenses
The “Actual” line of the table below provides information about actual account values and actual expenses. You may use the information in this line, together with the amount you invested, to estimate the expenses that you paid over the period. Simply divide your account value by $1,000 (for example, an $8,600 account value divided by $1,000 = 8.6), then multiply the result by the number in the “Actual” line under the heading entitled “Expenses paid during period” for your applicable class of shares to estimate the expenses you paid on your account during this period.
Hypothetical example for comparison purposes
The “Hypothetical” line of the table below provides information about hypothetical account values and hypothetical expenses based on the Fund’s actual expense ratio and an assumed rate of return of 5% per year before expenses, which is not the Fund’s actual return. The hypothetical account values and expenses may not be used to estimate the actual ending account balance or expenses you paid for the period. You may use this information to compare the ongoing costs of investing in the Fund and other funds. To do so, compare this 5% hypothetical example with the 5% hypothetical examples that appear in the shareholder reports of the other funds.
Please note that the expenses shown in the table are meant to highlight your ongoing costs only. Therefore, the “Hypothetical” line of the table is useful in comparing ongoing costs only and will not help you determine the relative total costs of owning different funds.
| Beginning account value 8-1-2019 | Ending account value 1-31-2020 | Expenses paid during the period1 | Annualized net expense ratio | |||||||||||||
Class A | ||||||||||||||||
Actual | $ | 1,000.00 | $ | 1,006.40 | $ | 3.03 | 0.60 | % | ||||||||
Hypothetical (5% return before expenses) | $ | 1,000.00 | $ | 1,022.12 | $ | 3.05 | 0.60 | % | ||||||||
Administrator Class | ||||||||||||||||
Actual | $ | 1,000.00 | $ | 1,007.72 | $ | 1.72 | 0.34 | % | ||||||||
Hypothetical (5% return before expenses) | $ | 1,000.00 | $ | 1,023.43 | $ | 1.73 | 0.34 | % | ||||||||
Institutional Class | ||||||||||||||||
Actual | $ | 1,000.00 | $ | 1,008.43 | $ | 1.01 | 0.20 | % | ||||||||
Hypothetical (5% return before expenses) | $ | 1,000.00 | $ | 1,024.13 | $ | 1.02 | 0.20 | % | ||||||||
Select Class | ||||||||||||||||
Actual | $ | 1,000.00 | $ | 1,008.73 | $ | 0.71 | 0.14 | % | ||||||||
Hypothetical (5% return before expenses) | $ | 1,000.00 | $ | 1,024.43 | $ | 0.71 | 0.14 | % | ||||||||
Service Class | ||||||||||||||||
Actual | $ | 1,000.00 | $ | 1,007.16 | $ | 2.27 | 0.45 | % | ||||||||
Hypothetical (5% return before expenses) | $ | 1,000.00 | $ | 1,022.87 | $ | 2.29 | 0.45 | % | ||||||||
| 1 | Expenses paid is equal to the annualized net expense ratio of each class multiplied by the average account value over the period, multiplied by the number of days in the most recent fiscal half-year divided by the number of days in the fiscal year (to reflect theone-half-year period). |
Government Money Market Funds | 9
Table of Contents
Portfolio of investments—January 31, 2020
| Interest rate | Maturity date | Principal | Value | |||||||||||||
| Repurchase Agreements ^^: 54.25% | ||||||||||||||||
Bank of America, dated1-31-2020, maturity value $200,026,167 (1) | 1.57 | % | 2-3-2020 | $ | 200,000,000 | $ | 200,000,000 | |||||||||
Bank of Nova Scotia, dated1-31-2020, maturity value $200,026,167 (2) | 1.57 | 2-3-2020 | 200,000,000 | 200,000,000 | ||||||||||||
Barclays Capital Incorporated, dated1-31-2020, maturity value | 1.57 | 2-3-2020 | 1,446,800,000 | 1,446,800,000 | ||||||||||||
BNP Paribas, dated1-31-2020, maturity value $350,046,667 (4) | 1.60 | 2-3-2020 | 350,000,000 | 350,000,000 | ||||||||||||
Citigroup Global Markets Incorporated, dated1-30-2020, maturity value $250,076,319 (5) | 1.57 | 2-6-2020 | 250,000,000 | 250,000,000 | ||||||||||||
Credit Agricole SA, dated1-31-2020, maturity value $250,076,319 (6) | 1.57 | 2-7-2020 | 250,000,000 | 250,000,000 | ||||||||||||
Fixed Income Clearing Corporation, dated1-31-2020, maturity value $2,000,265,063 (7) | 1.59 | 2-3-2020 | 2,000,000,063 | 2,000,000,063 | ||||||||||||
Fixed Income Clearing Corporation, dated1-31-2020, maturity value $250,033,125 (8) | 1.59 | 2-3-2020 | 250,000,000 | 250,000,000 | ||||||||||||
Fixed Income Clearing Corporation, dated1-31-2020, maturity value $400,050,000 (9) | 1.50 | 2-3-2020 | 400,000,000 | 400,000,000 | ||||||||||||
ING Financial Markets LLC, dated1-31-2020, maturity value $100,013,790 (10) | 1.59 | 2-3-2020 | 100,000,540 | 100,000,540 | ||||||||||||
JPMorgan Securities, dated1-2-2020, maturity value $100,134,167 (11) ¢øø§ | 1.61 | 2-1-2020 | 100,000,000 | 100,000,000 | ||||||||||||
MetLife Incorporated, dated1-31-2020, maturity value $250,039,395 (12) | 1.59 | 2-3-2020 | 250,006,269 | 250,006,269 | ||||||||||||
MUFG Securities Canada Limited, dated1-28-2020, maturity value $250,074,375 (13) | 1.53 | 2-4-2020 | 250,000,000 | 250,000,000 | ||||||||||||
MUFG Securities Canada Limited, dated1-29-2020, maturity value $500,150,694 (14) | 1.55 | 2-5-2020 | 500,000,000 | 500,000,000 | ||||||||||||
MUFG Securities Canada Limited, dated1-30-2020, maturity value $250,076,319 (15) | 1.57 | 2-6-2020 | 250,000,000 | 250,000,000 | ||||||||||||
MUFG Securities Canada Limited, dated1-31-2020, maturity value $240,031,400 (16) | 1.57 | 2-3-2020 | 240,000,000 | 240,000,000 | ||||||||||||
Prudential, dated1-31-2020, maturity value $6,187,075 (17) | 1.60 | 2-3-2020 | 6,186,250 | 6,186,250 | ||||||||||||
Prudential, dated1-31-2020, maturity value $67,014,559 (18) | 1.60 | 2-3-2020 | 67,005,625 | 67,005,625 | ||||||||||||
Royal Bank of Scotland Securities Incorporated, dated1-31-2020, maturity value $600,079,000 (19) | 1.58 | 2-3-2020 | 600,000,000 | 600,000,000 | ||||||||||||
Standard Chartered Bank, dated1-31-2020, maturity value $250,032,917 (20) | 1.58 | 2-3-2020 | 250,000,000 | 250,000,000 | ||||||||||||
Total Repurchase Agreements (Cost $7,959,998,747) | 7,959,998,747 | |||||||||||||||
|
| |||||||||||||||
| Treasury Debt: 44.69% | ||||||||||||||||
U.S. Treasury Bill (z) | 1.57 | 3-5-2020 | 80,000,000 | 79,892,156 | ||||||||||||
U.S. Treasury Bill (z) | 1.57 | 5-14-2020 | 20,000,000 | 19,912,747 | ||||||||||||
U.S. Treasury Bill (z) | 1.58 | 6-4-2020 | 80,000,000 | 79,574,898 | ||||||||||||
U.S. Treasury Bill (z) | 1.61 | 4-23-2020 | 25,000,000 | 24,911,111 | ||||||||||||
U.S. Treasury Bill (z) | 1.63 | 4-30-2020 | 25,000,000 | 24,902,034 | ||||||||||||
U.S. Treasury Bill (z) | 1.64 | 4-16-2020 | 40,000,000 | 39,868,194 | ||||||||||||
U.S. Treasury Bill (z) | 1.68 | 4-9-2020 | 260,000,000 | 259,207,541 | ||||||||||||
U.S. Treasury Bill (z) | 1.84 | 4-2-2020 | 50,000,000 | 49,850,861 | ||||||||||||
U.S. Treasury Bill (z) | 1.85 | 3-12-2020 | 55,000,000 | 54,893,771 | ||||||||||||
U.S. Treasury Bill (z) | 1.87 | 2-20-2020 | 30,000,000 | 29,973,792 | ||||||||||||
U.S. Treasury Bill (z) | 1.88 | 3-26-2020 | 165,000,000 | 164,557,177 | ||||||||||||
U.S. Treasury Bill (z) | 1.89 | 3-19-2020 | 165,000,000 | 164,613,225 | ||||||||||||
U.S. Treasury Bill (z) | 1.92 | 2-13-2020 | 15,000,000 | 14,992,083 | ||||||||||||
U.S. Treasury Bill (z) | 1.97 | 2-6-2020 | 55,000,000 | 54,991,073 | ||||||||||||
U.S. Treasury Bill (z) | 1.99 | 2-27-2020 | 95,000,000 | 94,875,847 | ||||||||||||
U.S. Treasury Note | 1.13 | 3-31-2020 | 75,000,000 | 74,902,278 | ||||||||||||
U.S. Treasury Note | 1.13 | 4-30-2020 | 60,000,000 | 59,912,577 | ||||||||||||
U.S. Treasury Note | 1.25 | 2-29-2020 | 110,000,000 | 109,934,872 | ||||||||||||
The accompanying notes are an integral part of these financial statements.
10 | Government Money Market Funds
Table of Contents
Portfolio of investments—January 31, 2020
| Interest rate | Maturity date | Principal | Value | |||||||||||||
| Treasury Debt (continued) | ||||||||||||||||
U.S. Treasury Note | 1.38 | % | 2-29-2020 | $ | 30,000,000 | $ | 29,985,673 | |||||||||
U.S. Treasury Note | 1.38 | 4-30-2020 | 100,000,000 | 99,829,227 | ||||||||||||
U.S. Treasury Note | 1.38 | 5-31-2020 | 20,000,000 | 19,967,787 | ||||||||||||
U.S. Treasury Note | 1.38 | 8-31-2020 | 90,000,000 | 89,825,623 | ||||||||||||
U.S. Treasury Note | 1.38 | 9-15-2020 | 120,000,000 | 119,829,753 | ||||||||||||
U.S. Treasury Note | 1.38 | 9-30-2020 | 20,000,000 | 19,968,536 | ||||||||||||
U.S. Treasury Note | 1.50 | 4-15-2020 | 20,000,000 | 19,978,181 | ||||||||||||
U.S. Treasury Note | 1.50 | 5-15-2020 | 20,000,000 | 19,970,497 | ||||||||||||
U.S. Treasury Note (U.S. Treasury 3 Month Bill Money Market Yield +0.03%) ± | 1.57 | 4-30-2020 | 650,000,000 | 650,000,198 | ||||||||||||
U.S. Treasury Note (U.S. Treasury 3 Month Bill Money Market Yield +0.04%) ± | 1.58 | 7-31-2020 | 460,000,000 | 459,998,329 | ||||||||||||
U.S. Treasury Note (U.S. Treasury 3 Month Bill Money Market Yield +0.05%) ± | 1.58 | 10-31-2020 | 528,000,000 | 527,818,192 | ||||||||||||
U.S. Treasury Note | 1.63 | 6-30-2020 | 20,000,000 | 19,981,274 | ||||||||||||
U.S. Treasury Note | 1.63 | 7-31-2020 | 50,000,000 | 50,002,293 | ||||||||||||
U.S. Treasury Note | 1.63 | 10-15-2020 | 10,000,000 | 9,999,447 | ||||||||||||
U.S. Treasury Note | 1.63 | 11-30-2020 | 10,000,000 | 9,998,699 | ||||||||||||
U.S. Treasury Note (U.S. Treasury 3 Month Bill Money Market Yield +0.12%) ± | 1.65 | 1-31-2021 | 520,000,000 | 519,795,225 | ||||||||||||
U.S. Treasury Note (U.S. Treasury 3 Month Bill Money Market Yield +0.14%) ± | 1.67 | 4-30-2021 | 430,000,000 | 429,823,691 | ||||||||||||
U.S. Treasury Note (U.S. Treasury 3 Month Bill Money Market Yield +0.15%) ± | 1.69 | 1-31-2022 | 60,000,000 | 60,000,000 | ||||||||||||
U.S. Treasury Note (U.S. Treasury 3 Month Bill Money Market Yield +0.22%) ± | 1.76 | 7-31-2021 | 370,000,000 | 369,801,074 | ||||||||||||
U.S. Treasury Note (U.S. Treasury 3 Month Bill Money Market Yield +0.30%) ± | 1.84 | 10-31-2021 | 390,000,000 | 390,254,932 | ||||||||||||
U.S. Treasury Note | 2.00 | 11-30-2020 | 20,000,000 | 20,056,599 | ||||||||||||
U.S. Treasury Note | 2.13 | 8-31-2020 | 30,000,000 | 30,080,228 | ||||||||||||
U.S. Treasury Note | 2.25 | �� | 2-29-2020 | 30,000,000 | 30,004,032 | |||||||||||
U.S. Treasury Note | 2.25 | 3-31-2020 | 70,000,000 | 70,032,569 | ||||||||||||
U.S. Treasury Note | 2.38 | 4-30-2020 | 127,000,000 | 127,131,764 | ||||||||||||
U.S. Treasury Note | 2.50 | 5-31-2020 | 135,000,000 | 135,258,458 | ||||||||||||
U.S. Treasury Note | 2.50 | 12-31-2020 | 60,000,000 | 60,480,346 | ||||||||||||
U.S. Treasury Note | 2.63 | 7-31-2020 | 180,000,000 | 180,820,861 | ||||||||||||
U.S. Treasury Note | 2.63 | 8-15-2020 | 45,000,000 | 45,234,087 | ||||||||||||
U.S. Treasury Note | 2.63 | 8-31-2020 | 30,000,000 | 30,166,181 | ||||||||||||
U.S. Treasury Note | 2.63 | 11-15-2020 | 80,000,000 | 80,586,348 | ||||||||||||
U.S. Treasury Note | 2.75 | 9-30-2020 | 170,000,000 | 171,242,183 | ||||||||||||
U.S. Treasury Note | 2.75 | 11-30-2020 | 65,000,000 | 65,583,636 | ||||||||||||
U.S. Treasury Note | 2.88 | 10-31-2020 | 90,000,000 | 90,814,688 | ||||||||||||
U.S. Treasury Note | 3.50 | 5-15-2020 | 30,000,000 | 30,134,594 | ||||||||||||
U.S. Treasury Note | 3.63 | 2-15-2020 | 70,000,000 | 70,034,692 | ||||||||||||
Total Treasury Debt (Cost $6,556,256,134) |
| 6,556,256,134 | ||||||||||||||
|
| |||||||||||||||
| Total investments in securities (Cost $14,516,254,881) | 98.94 | % | 14,516,254,881 | |||||
Other assets and liabilities, net | 1.06 | 155,858,321 | ||||||
|
|
|
| |||||
| Total net assets | 100.00 | % | $ | 14,672,113,202 | ||||
|
|
|
| |||||
The accompanying notes are an integral part of these financial statements.
Government Money Market Funds | 11
Table of Contents
Portfolio of investments—January 31, 2020
| ^^ | Collateralized by: |
| (1) | U.S. government securities, 1.00% to 2.25%,4-30-2021 to2-15-2046, fair value including accrued interest is $204,000,085. |
| (2) | U.S. government securities, 0.00% to 3.13%,2-27-2020 to5-15-2048, fair value including accrued interest is $204,000,000. |
| (3) | U.S. government securities, 1.75% to 3.63%,6-30-2022 to8-15-2043, fair value including accrued interest is $1,475,736,129. |
| (4) | U.S. government securities, 0.00% to 8.75%,2-13-2020 to5-15-2049, fair value including accrued interest is $357,000,003. |
| (5) | U.S. government securities, 0.38% to 2.25%,9-30-2026 to2-15-2027, fair value including accrued interest is $255,000,007. |
| (6) | U.S. government securities, 2.00% to 3.38%,5-31-2024 to5-15-2044, fair value including accrued interest is $255,000,044. |
| (7) | U.S. government securities, 0.13% to 2.13%,4-15-2020 to1-15-2030, fair value including accrued interest is $2,040,000,064. |
| (8) | U.S. government securities, 2.50% to 3.00%,8-15-2045 to5-15-2047, fair value including accrued interest is $255,000,658. |
| (9) | U.S. government securities, 1.38% to 1.75%,1-31-2022 to10-31-2026, fair value including accrued interest is $408,003,369. |
| (10) | U.S. government securities, 2.13%,5-15-2022, fair value including accrued interest is $102,071,345. |
| (11) | U.S. government securities, 4.38%,5-15-2040, fair value including accrued interest is $102,000,002. |
| (12) | U.S. government securities, 1.38% to 4.50%,1-31-2021 to2-15-2036, fair value including accrued interest is $253,098,793. |
| (13) | U.S. government securities, 0.13% to 4.75%,10-15-2024 to2-15-2049, fair value including accrued interest is $255,000,005. |
| (14) | U.S. government securities, 2.25% to 4.25%,5-15-2039 to8-15-2049 , fair value including accrued interest is $510,000,041. |
| (15) | U.S. government securities, 0.63% to 4.75%,4-15-2023 to8-15-2049, fair value including accrued interest is $255,000,059. |
| (16) | U.S. government securities, 0.63% to 4.25%,1-15-2024 to5-15-2039, fair value including accrued interest is $244,800,018. |
| (17) | U.S. government securities, 0.00%,11-15-2026, fair value is $6,309,975. |
| (18) | U.S. government securities, 0.00% to 3.00%,11-15-2021 to11-15-2047, fair value including accrued interest is $68,345,738. |
| (19) | U.S. government securities, 0.00% to 1.00%,2-15-2020 to11-15-2049, fair value including accrued interest is $612,000,048. |
| (20) | U.S. government securities, 0.13% to 4.63%,4-15-2020 to11-15-2049, fair value including accrued interest is $255,000,000. |
| ¢ | The security represents a long-dated and extendible repurchase agreement which automatically renews on previously set terms. The maturity date represents the next put date. |
| øø | The interest rate is determined and reset by the issuer periodically depending upon the terms of the security. The rate shown is the rate in effect at period end. |
| § | The security is subject to a demand feature which reduces the effective maturity. |
| (z) | Zero coupon security. The rate represents the current yield to maturity. |
| ± | Variable rate investment. The rate shown is the rate in effect at period end. |
The accompanying notes are an integral part of these financial statements.
12 | Government Money Market Funds
Table of Contents
Statement of assets and liabilities—January 31, 2020
Assets | ||||
Investments in repurchase agreements, at amortized cost | $ | 7,959,998,747 | ||
Investments in unaffiliated securities, at amortized cost | 6,556,256,134 | |||
Cash | 207,094,407 | |||
Receivable for Fund shares sold | 2,205,222 | |||
Receivable for interest | 13,024,557 | |||
Prepaid expenses and other assets | 1,032,870 | |||
|
| |||
Total assets | 14,739,611,937 | |||
|
| |||
Liabilities | ||||
Payable for investments purchased | 50,861,559 | |||
Payable for Fund shares redeemed | 1,240,685 | |||
Management fee payable | 1,593,997 | |||
Dividends payable | 11,993,027 | |||
Administration fees payable | 1,310,637 | |||
Trustees’ fees and expenses payable | 4,255 | |||
Accrued expenses and other liabilities | 494,575 | |||
|
| |||
Total liabilities | 67,498,735 | |||
|
| |||
Total net assets | $ | 14,672,113,202 | ||
|
| |||
Net assets consist of | ||||
Paid-in capital | $ | 14,672,325,766 | ||
Total distributable loss | (212,564 | ) | ||
|
| |||
Total net assets | $ | 14,672,113,202 | ||
|
| |||
Computation of net asset value per share | ||||
Net assets – Class A | $ | 1,379,058,852 | ||
Shares outstanding – Class A1 | 1,378,885,082 | |||
Net asset value per share – Class A | $1.00 | |||
Net assets – Administrator Class | $ | 137,102,062 | ||
Shares outstanding – Administrator Class1 | 137,084,567 | |||
Net asset value per share – Administrator Class | $1.00 | |||
Net assets – Institutional Class | $ | 11,295,226,396 | ||
Shares outstanding – Institutional Class1 | 11,293,735,677 | |||
Net asset value per share – Institutional Class | $1.00 | |||
Net assets – Select Class | $ | 691,824,640 | ||
Shares outstanding – Select Class1 | 691,750,090 | |||
Net asset value per share – Select Class | $1.00 | |||
Net assets – Service Class | $ | 1,168,901,252 | ||
Shares outstanding – Service Class1 | 1,168,751,752 | |||
Net asset value per share – Service Class | $1.00 | |||
| 1 | The Fund has an unlimited number of authorized shares. |
The accompanying notes are an integral part of these financial statements.
Government Money Market Funds | 13
Table of Contents
Statement of operations—year ended January 31, 2020
Investment income | ||||
Interest | $ | 333,432,655 | ||
|
| |||
Expenses | ||||
Management fee | 21,798,504 | |||
Administration fees | ||||
Class A | 2,866,747 | |||
Administrator Class | 96,367 | |||
Institutional Class | 9,603,022 | |||
Select Class | 328,315 | 1 | ||
Service Class | 1,660,597 | |||
Sweep Class | 24 | 2 | ||
Shareholder servicing fees | ||||
Class A | 3,257,667 | |||
Administrator Class | 96,367 | |||
Service Class | 3,456,324 | |||
Sweep Class | 210 | 2 | ||
Distribution fee | ||||
Sweep Class | 292 | 2 | ||
Custody and accounting fees | 224,630 | |||
Professional fees | 49,835 | |||
Registration fees | 91,552 | |||
Shareholder report expenses | 39,357 | |||
Trustees’ fees and expenses | 20,954 | |||
Other fees and expenses | 97,045 | |||
|
| |||
Total expenses | 43,687,809 | |||
Less: Fee waivers and/or expense reimbursements | ||||
Fund-level | (283,370 | ) | ||
Class A | (146,924 | ) | ||
Administrator Class | (1,422 | ) | ||
Institutional Class | (2,552,724 | ) | ||
Select Class | (328,315 | )1 | ||
Service Class | (844,835 | ) | ||
|
| |||
Net expenses | 39,530,219 | |||
|
| |||
Net investment income | 293,902,436 | |||
Net realized gains on investments | 77,169 | |||
|
| |||
Net increase in net assets resulting from operations | $ | 293,979,605 | ||
|
| |||
| 1 | For the period from March 15, 2019 (commencement of class operations) to January 31, 2020 |
| 2 | For the period from February 1, 2019 to November 29, 2019. Effective at the close of business on November 29, 2019, Sweep Class shares were liquidated and the class was subsequently closed. Sweep Class shares are no longer offered by the Fund. |
The accompanying notes are an integral part of these financial statements.
14 | Government Money Market Funds
Table of Contents
Statement of changes in net assets
| Year ended January 31, 2020 | Year ended January 31, 2019 | |||||||||||||||
Operations | ||||||||||||||||
Net investment income | $ | 293,902,436 | $ | 252,918,099 | ||||||||||||
Net realized gains on investments | 77,169 | 48,547 | ||||||||||||||
|
| |||||||||||||||
Net increase in net assets resulting from operations | 293,979,605 | 252,966,646 | ||||||||||||||
|
| |||||||||||||||
Distributions to shareholders from net investment income and net realized gains | ||||||||||||||||
Class A | (19,977,039 | ) | (19,056,287 | ) | ||||||||||||
Administrator Class | (1,774,446 | ) | (1,412,617 | ) | ||||||||||||
Institutional Class | (233,671,816 | ) | (211,798,222 | ) | ||||||||||||
Select Class | (14,829,426 | )1 | N/A | |||||||||||||
Service Class | (23,697,019 | ) | (20,731,069 | ) | ||||||||||||
Sweep Class | (1,237 | )2 | (1,194 | ) | ||||||||||||
|
| |||||||||||||||
Total distributions to shareholders | (293,950,983 | ) | (252,999,389 | ) | ||||||||||||
|
| |||||||||||||||
Capital share transactions | Shares | Shares | ||||||||||||||
Proceeds from shares sold | ||||||||||||||||
Class A | 8,983,130,114 | 8,983,130,114 | 11,127,666,658 | 11,127,666,658 | ||||||||||||
Administrator Class | 648,439,409 | 648,439,409 | 897,131,428 | 897,131,428 | ||||||||||||
Institutional Class | 92,366,552,858 | 92,366,552,858 | 96,585,943,995 | 96,585,943,995 | ||||||||||||
Select Class | 4,951,631,188 | 1 | 4,951,631,188 | 1 | N/A | N/A | ||||||||||
Service Class | 7,712,455,249 | 7,712,455,249 | 5,871,089,621 | 5,871,089,621 | ||||||||||||
|
| |||||||||||||||
| 114,662,208,818 | 114,481,831,702 | |||||||||||||||
|
| |||||||||||||||
Reinvestment of distributions | ||||||||||||||||
Class A | 10,091,843 | 10,091,843 | 9,016,382 | 9,016,382 | ||||||||||||
Administrator Class | 1,739,531 | 1,739,531 | 1,299,659 | 1,299,659 | ||||||||||||
Institutional Class | 86,905,773 | 86,905,773 | 73,636,342 | 73,636,342 | ||||||||||||
Select Class | 11,537,230 | 1 | 11,537,230 | 1 | N/A | N/A | ||||||||||
Service Class | 5,190,841 | 5,190,841 | 5,760,060 | 5,760,060 | ||||||||||||
|
| |||||||||||||||
| 115,465,218 | 89,712,443 | |||||||||||||||
|
| |||||||||||||||
Payment for shares redeemed | ||||||||||||||||
Class A | (8,816,940,672 | ) | (8,816,940,672 | ) | (11,225,626,967 | ) | (11,225,626,967 | ) | ||||||||
Administrator Class | (614,418,973 | ) | (614,418,973 | ) | (939,295,687 | ) | (939,295,687 | ) | ||||||||
Institutional Class | (93,625,030,718 | ) | (93,625,030,718 | ) | (97,277,939,890 | ) | (97,277,939,890 | ) | ||||||||
Select Class | (4,271,418,328 | )1 | (4,271,418,328 | )1 | N/A | N/A | ||||||||||
Service Class | (7,980,153,399 | ) | (7,980,153,399 | ) | (5,904,735,073 | ) | (5,904,735,073 | ) | ||||||||
Sweep Class | (100,073 | )2 | (100,073 | )2 | 0 | 0 | ||||||||||
|
| |||||||||||||||
| (115,308,062,163 | ) | (115,347,597,617 | ) | |||||||||||||
|
| |||||||||||||||
Net decrease in net assets resulting from capital share transactions | (530,388,127 | ) | (776,053,472 | ) | ||||||||||||
|
| |||||||||||||||
Total decrease in net assets | (530,359,505 | ) | (776,086,215 | ) | ||||||||||||
|
| |||||||||||||||
Net assets | ||||||||||||||||
Beginning of period | 15,202,472,707 | 15,978,558,922 | ||||||||||||||
|
| |||||||||||||||
End of period | $ | 14,672,113,202 | $ | 15,202,472,707 | ||||||||||||
|
| |||||||||||||||
| 1 | For the period from March 15, 2019 (commencement of class operations) to January 31, 2020 |
| 2 | For the period from February 1, 2019 to November 29, 2019. Effective at the close of business on November 29, 2019, Sweep Class shares were liquidated and the class was subsequently closed. Sweep Class shares are no longer offered by the Fund. |
The accompanying notes are an integral part of these financial statements.
Government Money Market Funds | 15
Table of Contents
(For a share outstanding throughout each period)
| Year ended January 31 | ||||||||||||||||||||
| CLASS A | 2020 | 2019 | 2018 | 2017 | 2016 | |||||||||||||||
Net asset value, beginning of period | $1.00 | $1.00 | $1.00 | $1.00 | $1.00 | |||||||||||||||
Net investment income | 0.02 | 0.01 | 0.00 | 1 | 0.00 | 1 | 0.00 | 1 | ||||||||||||
Net realized gains on investments | 0.00 | 1 | 0.00 | 1 | 0.00 | 1 | 0.00 | 1 | 0.00 | 1 | ||||||||||
|
|
|
|
|
|
|
|
|
| |||||||||||
Total from investment operations | 0.02 | 0.01 | 0.00 | 1 | 0.00 | 1 | 0.00 | 1 | ||||||||||||
Distributions to shareholders from | ||||||||||||||||||||
Net investment income | (0.02 | ) | (0.01 | ) | (0.00 | )1 | (0.00 | )1 | (0.00 | )1 | ||||||||||
Net realized gains | (0.00 | )1 | (0.00 | )1 | (0.00 | )1 | 0.00 | 0.00 | ||||||||||||
|
|
|
|
|
|
|
|
|
| |||||||||||
Total distributions to shareholders | (0.02 | ) | (0.01 | ) | (0.00 | )1 | (0.00 | )1 | (0.00 | )1 | ||||||||||
Net asset value, end of period | $1.00 | $1.00 | $1.00 | $1.00 | $1.00 | |||||||||||||||
Total return | 1.56 | % | 1.37 | % | 0.38 | % | 0.01 | % | 0.01 | % | ||||||||||
Ratios to average net assets (annualized) | ||||||||||||||||||||
Gross expenses | 0.61 | % | 0.61 | % | 0.62 | % | 0.62 | % | 0.62 | % | ||||||||||
Net expenses | 0.60 | % | 0.60 | % | 0.61 | % | 0.39 | % | 0.11 | % | ||||||||||
Net investment income | 1.53 | % | 1.36 | % | 0.38 | % | 0.01 | % | 0.01 | % | ||||||||||
Supplemental data | ||||||||||||||||||||
Net assets, end of period (000s omitted) | $1,379,059 | $1,202,749 | $1,291,723 | $1,745,419 | $1,956,626 | |||||||||||||||
| 1 | Amount is less than $0.005. |
The accompanying notes are an integral part of these financial statements.
16 | Government Money Market Funds
Table of Contents
Financial highlights
(For a share outstanding throughout each period)
| Year ended January 31 | ||||||||||||||||||||
| ADMINISTRATOR CLASS | 2020 | 2019 | 2018 | 2017 | 2016 | |||||||||||||||
Net asset value, beginning of period | $1.00 | $1.00 | $1.00 | $1.00 | $1.00 | |||||||||||||||
Net investment income | 0.02 | 0.02 | 0.01 | 0.00 | 1 | 0.00 | 1 | |||||||||||||
Net realized gains on investments | 0.00 | 1 | 0.00 | 1 | 0.00 | 1 | 0.00 | 1 | 0.00 | 1 | ||||||||||
|
|
|
|
|
|
|
|
|
| |||||||||||
Total from investment operations | 0.02 | 0.02 | 0.01 | 0.00 | 1 | 0.00 | 1 | |||||||||||||
Distributions to shareholders from | ||||||||||||||||||||
Net investment income | (0.02 | ) | (0.02 | ) | (0.01 | ) | (0.00 | )1 | (0.00 | )1 | ||||||||||
Net realized gains | (0.00 | )1 | (0.00 | )1 | (0.00 | )1 | 0.00 | 0.00 | ||||||||||||
|
|
|
|
|
|
|
|
|
| |||||||||||
Total distributions to shareholders | (0.02 | ) | (0.02 | ) | (0.01 | ) | (0.00 | )1 | (0.00 | )1 | ||||||||||
Net asset value, end of period | $1.00 | $1.00 | $1.00 | $1.00 | $1.00 | |||||||||||||||
Total return | 1.83 | % | 1.63 | % | 0.65 | % | 0.06 | % | 0.01 | % | ||||||||||
Ratios to average net assets (annualized) | ||||||||||||||||||||
Gross expenses | 0.34 | % | 0.35 | % | 0.35 | % | 0.34 | % | 0.34 | % | ||||||||||
Net expenses | 0.34 | % | 0.35 | % | 0.35 | % | 0.34 | % | 0.10 | % | ||||||||||
Net investment income | 1.84 | % | 1.48 | % | 0.61 | % | 0.05 | % | 0.01 | % | ||||||||||
Supplemental data | ||||||||||||||||||||
Net assets, end of period (000s omitted) | $137,102 | $101,340 | $142,198 | $106,246 | $101,432 | |||||||||||||||
| 1 | Amount is less than $0.005. |
The accompanying notes are an integral part of these financial statements.
Government Money Market Funds | 17
Table of Contents
Financial highlights
(For a share outstanding throughout each period)
| Year ended January 31 | ||||||||||||||||||||
| INSTITUTIONAL CLASS | 2020 | 2019 | 2018 | 2017 | 2016 | |||||||||||||||
Net asset value, beginning of period | $1.00 | $1.00 | $1.00 | $1.00 | $1.00 | |||||||||||||||
Net investment income | 0.02 | 0.02 | 0.01 | 0.00 | 1 | 0.00 | 1 | |||||||||||||
Net realized gains on investments | 0.00 | 1 | 0.00 | 1 | 0.00 | 1 | 0.00 | 1 | 0.00 | 1 | ||||||||||
|
|
|
|
|
|
|
|
|
| |||||||||||
Total from investment operations | 0.02 | 0.02 | 0.01 | 0.00 | 1 | 0.00 | 1 | |||||||||||||
Distributions to shareholders from | ||||||||||||||||||||
Net investment income | (0.02 | ) | (0.02 | ) | (0.01 | ) | (0.00 | )1 | (0.00 | )1 | ||||||||||
Net realized gains | (0.00 | )1 | (0.00 | )1 | (0.00 | )1 | 0.00 | 0.00 | ||||||||||||
|
|
|
|
|
|
|
|
|
| |||||||||||
Total distributions to shareholders | (0.02 | ) | (0.02 | ) | (0.01 | ) | (0.00 | )1 | (0.00 | )1 | ||||||||||
Net asset value, end of period | $1.00 | $1.00 | $1.00 | $1.00 | $1.00 | |||||||||||||||
Total return | 1.97 | % | 1.78 | % | 0.79 | % | 0.20 | % | 0.02 | % | ||||||||||
Ratios to average net assets (annualized) | ||||||||||||||||||||
Gross expenses | 0.22 | % | 0.22 | % | 0.23 | % | 0.23 | % | 0.23 | % | ||||||||||
Net expenses | 0.20 | % | 0.20 | % | 0.20 | % | 0.20 | % | 0.10 | % | ||||||||||
Net investment income | 1.95 | % | 1.77 | % | 0.81 | % | 0.20 | % | 0.02 | % | ||||||||||
Supplemental data | ||||||||||||||||||||
Net assets, end of period (000s omitted) | $11,295,226 | $12,466,864 | $13,085,244 | $11,489,674 | $12,617,153 | |||||||||||||||
| 1 | Amount is less than $0.005. |
The accompanying notes are an integral part of these financial statements.
18 | Government Money Market Funds
Table of Contents
Financial highlights
(For a share outstanding throughout the period)
| Year ended | ||||
| SELECT CLASS | January 31, 20201 | |||
Net asset value, beginning of period | $1.00 | |||
Net investment income | 0.02 | |||
Net realized gains on investments | 0.00 | 2 | ||
|
| |||
Total from investment operations | 0.02 | |||
Distributions to shareholders from | ||||
Net investment income | (0.02 | ) | ||
Net realized gains | (0.00 | )2 | ||
|
| |||
Total distributions to shareholders | (0.02 | ) | ||
Net asset value, end of period | $1.00 | |||
Total return3 | 1.74 | % | ||
Ratios to average net assets (annualized) | ||||
Gross expenses | 0.18 | % | ||
Net expenses | 0.14 | % | ||
Net investment income | 1.81 | % | ||
Supplemental data | ||||
Net assets, end of period (000s omitted) | $691,825 | |||
��
| 1 | For the period from March 15, 2019 (commencement of class operations) to January 31, 2020 |
| 2 | Amount is less than $0.005. |
| 3 | Returns for periods of less than one year are not annualized. |
The accompanying notes are an integral part of these financial statements.
Government Money Market Funds | 19
Table of Contents
Financial highlights
(For a share outstanding throughout each period)
| Year ended January 31 | ||||||||||||||||||||
| SERVICE CLASS | 2020 | 2019 | 2018 | 2017 | 2016 | |||||||||||||||
Net asset value, beginning of period | $1.00 | $1.00 | $1.00 | $1.00 | $1.00 | |||||||||||||||
Net investment income | 0.02 | 0.02 | 0.01 | 0.00 | 1 | 0.00 | 1 | |||||||||||||
Net realized gains on investments | 0.00 | 1 | 0.00 | 1 | 0.00 | 1 | 0.00 | 1 | 0.00 | 1 | ||||||||||
|
|
|
|
|
|
|
|
|
| |||||||||||
Total from investment operations | 0.02 | 0.02 | 0.01 | 0.00 | 1 | 0.00 | 1 | |||||||||||||
Distributions to shareholders from | ||||||||||||||||||||
Net investment income | (0.02 | ) | (0.02 | ) | (0.01 | ) | (0.00 | )1 | (0.00 | )1 | ||||||||||
Net realized gains | (0.00 | )1 | (0.00 | )1 | (0.00 | )1 | 0.00 | 0.00 | ||||||||||||
|
|
|
|
|
|
|
|
|
| |||||||||||
Total distributions to shareholders | (0.02 | ) | (0.02 | ) | (0.01 | ) | (0.00 | )1 | (0.00 | )1 | ||||||||||
Net asset value, end of period | $1.00 | $1.00 | $1.00 | $1.00 | $1.00 | |||||||||||||||
Total return | 1.72 | % | 1.53 | % | 0.54 | % | 0.02 | % | 0.01 | % | ||||||||||
Ratios to average net assets (annualized) | ||||||||||||||||||||
Gross expenses | 0.51 | % | 0.51 | % | 0.52 | % | 0.52 | % | 0.52 | % | ||||||||||
Net expenses | 0.45 | % | 0.45 | % | 0.45 | % | 0.38 | % | 0.11 | % | ||||||||||
Net investment income | 1.71 | % | 1.51 | % | 0.54 | % | 0.03 | % | 0.01 | % | ||||||||||
Supplemental data | ||||||||||||||||||||
Net assets, end of period (000s omitted) | $1,168,901 | $1,431,420 | $1,459,295 | $1,500,467 | $1,339,895 | |||||||||||||||
| 1 | Amount is less than $0.005. |
The accompanying notes are an integral part of these financial statements.
20 | Government Money Market Funds
Table of Contents
1. ORGANIZATION
Wells Fargo Funds Trust (the “Trust”), a Delaware statutory trust organized on March 10, 1999, is anopen-end management investment company registered under the Investment Company Act of 1940, as amended (the “1940 Act”). As an investment company, the Trust follows the accounting and reporting guidance in Financial Accounting Standards Board (“FASB”)Accounting Standards Codification Topic 946, Financial Services – Investment Companies. These financial statements report on the Wells Fargo Treasury Plus Money Market Fund (the “Fund”) which is a diversified series of the Trust.
Effective at the close of business on November 29, 2019, Sweep Class shares of the Fund were liquidated and the class was subsequently closed. Sweep class shares are no longer offered by the Fund. Information for Sweep Class shares reflected in the financial statements represents activity through November 29, 2019.
2. SIGNIFICANT ACCOUNTING POLICIES
The following significant accounting policies, which are consistently followed in the preparation of the financial statements of the Fund, are in conformity with U.S. generally accepted accounting principles which require management to make estimates and assumptions that affect the reported amounts of assets and liabilities, disclosure of contingent assets and liabilities at the date of the financial statements, and the reported amounts of revenues and expenses during the reporting period. Actual results could differ from those estimates.
Securities valuation
As permitted under Rule2a-7 of the 1940 Act, portfolio securities are valued at amortized cost, which approximates fair value. The amortized cost method involves valuing a security at its cost, plus accretion of discount or minus amortization of premium over the period until maturity.
Investments which are not valued using the method discussed above are valued at their fair value, as determined in good faith by the Board of Trustees of the Fund. The Board of Trustees has established a Valuation Committee comprised of the Trustees and has delegated to it the authority to take any actions regarding the valuation of portfolio securities that the Valuation Committee deems necessary or appropriate, including determining the fair value of portfolio securities, unless the determination has been delegated to the Wells Fargo Asset Management Pricing Committee at Wells Fargo Funds Management, LLC (“Funds Management”).The Board of Trustees retains the authority to make or ratify any valuation decisions or approve any changes to the Valuation Procedures as it deems appropriate. On a quarterly basis, the Board of Trustees receives reports on any valuation actions taken by the Valuation Committee or the Wells Fargo Asset Management Pricing Committee which may include items for ratification.
Repurchase agreements
The Fund may invest in repurchase agreements and may participate in pooled repurchase agreement transactions with other funds advised by Funds Management. Repurchase agreements are agreements where the seller of a security to the Fund agrees to repurchase that security from the Fund at a mutually agreed upon time and price. The repurchase agreements must be fully collateralized based on values that aremarked-to-market daily. The collateral may be held by an agent bank under atri-party agreement. It is the custodian’s responsibility to value collateral daily and to take action to obtain additional collateral as necessary to maintain a market value equal to or greater than the resale price. The repurchase agreements are collateralized by securities issued or guaranteed by the U.S. Government, its agencies or instrumentalities. There could be potential loss to the Fund in the event that the Fund is delayed or prevented from exercising its rights to dispose of the collateral, including the risk of a possible decline in the value of the underlying obligations during the period in which the Fund seeks to assert its rights.
Security transactions and income recognition
Securities transactions are recorded on a trade date basis. Realized gains or losses are recorded on the basis of identified cost.
Interest income is accrued daily and bond discounts are accreted and premiums are amortized daily. To the extent debt obligations are placed onnon-accrual status, any related interest income may be reduced by writing off interest receivables when the collection of all or a portion of interest has been determined to be doubtful based on consistently applied procedures and the fair value has decreased. If the issuer subsequently resumes interest payments or when the collectability of interest is reasonably assured, the debt obligation is removed fromnon-accrual status.
Distributions to shareholders
Distributions to shareholders from net investment income are declared daily and paid monthly. Distributions from net realized gains, if any, are recorded on theex-dividend date and paid at least annually. Such distributions are determined in accordance with income tax regulations and may differ from U.S. generally accepted accounting principles. Dividend sources are estimated at the time of declaration. The tax character of distributions is determined as of the Fund’s fiscal year end. Therefore, a portion of the Fund’s distributions made prior to the Fund’s fiscal year end may be categorized as a tax return of capital at year end.
Government Money Market Funds | 21
Table of Contents
Notes to financial statements
Federal and other taxes
The Fund intends to continue to qualify as a regulated investment company by distributing substantially all of its investment company taxable income and any net realized capital gains (after reduction for capital loss carryforwards) sufficient to relieve it from all, or substantially all, federal income taxes. Accordingly, no provision for federal income taxes was required.
The Fund’s income and federal excise tax returns and all financial records supporting those returns for the prior three fiscal years are subject to examination by the federal and Delaware revenue authorities. Management has analyzed the Fund’s tax positions taken on federal, state, and foreign tax returns for all open tax years and does not believe that there are any uncertain tax positions that require recognition of a tax liability.
As of January 31, 2020, the cost of investments for federal income tax purposes is substantially the same as for financial reporting purposes.
Class allocations
The separate classes of shares offered by the Fund differ principally in distribution, shareholder servicing, and administration fees. Class specific expenses are charged directly to that share class. Investment income, common fund-level expenses, and realized gains (losses) on investments are allocated daily to each class of shares based on the relative proportion of net assets of each class.
3. FAIR VALUATION MEASUREMENTS
Fair value measurements of investments are determined within a framework that has established a fair value hierarchy based upon the various data inputs utilized in determining the value of the Fund’s investments. The three-level hierarchy gives the highest priority to unadjusted quoted prices in active markets for identical assets or liabilities (Level 1) and the lowest priority to unobservable inputs (Level 3). The Fund’s investments are classified within the fair value hierarchy based on the lowest level of input that is significant to the fair value measurement. The inputs are summarized into three broad levels as follows:
| ∎ | Level 1 – quoted prices in active markets for identical securities |
| ∎ | Level 2 – other significant observable inputs (including quoted prices for similar securities, interest rates, prepayment speeds, credit risk, etc.) |
| ∎ | Level 3 – significant unobservable inputs (including the Fund’s own assumptions in determining the fair value of investments) |
The inputs or methodologies used for valuing investments in securities are not necessarily an indication of the risk associated with investing in those securities.
The following is a summary of the inputs used in valuing the Fund’s assets and liabilities as of January 31, 2020:
| Quoted prices (Level 1) | Other significant observable inputs (Level 2) | Significant (Level 3) | Total | |||||||||||||
Assets | ||||||||||||||||
Investments in: | ||||||||||||||||
Repurchase agreements | $ | 0 | $ | 7,959,998,747 | $ | 0 | $ | 7,959,998,747 | ||||||||
Treasury debt | 0 | 6,556,256,134 | 0 | 6,556,256,134 | ||||||||||||
Total assets | $ | 0 | $ | 14,516,254,881 | $ | 0 | $ | 14,516,254,881 | ||||||||
Additional sector, industry or geographic detail is included in the Portfolio of Investments.
For the year ended January 31, 2020, the Fund did not have any transfers into/out of Level 3.
22 | Government Money Market Funds
Table of Contents
Notes to financial statements
4. TRANSACTIONS WITH AFFILIATES
Management fee
Funds Management, an indirect wholly owned subsidiary of Wells Fargo & Company (“Wells Fargo”), is the manager of the Fund and provides advisory and fund-level administrative services under an investment management agreement. Under the investment management agreement, Funds Management is responsible for, among other services, implementing the investment objectives and strategies of the Fund, supervising the subadviser and providing fund-level administrative services in connection with the Fund’s operations. As compensation for its services under the investment management agreement, Funds Management is entitled to receive a management fee at the following annual rate based on the Fund’s average daily net assets:
| Average daily net assets | Management fee | |||
First $5 billion | 0.15 | % | ||
Next $5 billion | 0.14 | |||
Over $10 billion | 0.13 | |||
For the year ended January 31, 2020, the management fee was equivalent to an annual rate of 0.14% of the Fund’s average daily net assets.
Funds Management has retained the services of a subadviser to provide daily portfolio management to the Fund. The fee for subadvisory services is borne by Funds Management. Wells Capital Management Incorporated, an affiliate of Funds Management and an indirect wholly owned subsidiary of Wells Fargo, is the subadviser to the Fund and is entitled to receive a fee from Funds Management at an annual rate starting at 0.05% and declining to 0.01% as the average daily net assets of the Fund increase.
Administration fees
Under a class-level administration agreement, Funds Management provides class-level administrative services to the Fund, which includes paying fees and expenses for services provided by the transfer agent,sub-transfer agents, omnibus account servicers and record-keepers. As compensation for its services under the class-level administration agreement, Funds Management receives an annual fee which is calculated based on the average daily net assets of each class as follows:
| Class-level administration fee | ||||
Class A | 0.22 | % | ||
Administrator Class | 0.10 | |||
Institutional Class | 0.08 | |||
Select Class | 0.04 | |||
Service Class | 0.12 | |||
Sweep Class | 0.03 | |||
Waivers and/or expense reimbursements
Funds Management has contractually waived and/or reimbursed management and administration fees to the extent necessary to maintain certain net operating expense ratios for the Fund. When each class of the Fund has exceeded its expense cap, Funds Management has waived fees and/or reimbursed expenses from fund-level expenses on a proportionate basis and then from class specific expenses. When only certain classes exceed their expense caps, waivers and/or reimbursements are applied against class specific expenses before fund-level expenses. Funds Management has committed through May 31, 2020 to waive fees and/or reimburse expenses to the extent necessary to cap the Fund’s expenses at 0.60% for Class A shares, 0.34% for Administrator Class shares, 0.20% for Institutional Class shares, 0.14% for Select Class shares, and 0.45% for Service Class shares. Prior to or after the commitment expiration date, the cap may be increased or the commitment to maintain the cap may be terminated only with the approval of the Board of Trustees.
Distribution fee
The Trust adopted a distribution plan for Sweep Class shares of the Fund pursuant to Rule12b-1 under the 1940 Act. A distribution fee was charged to Sweep Class shares and paid to Wells Fargo Funds Distributor, LLC, the principal underwriter, at an annual rate of 0.35% of the average daily net assets of Sweep Class shares.
Government Money Market Funds | 23
Table of Contents
Notes to financial statements
Shareholder servicing fees
The Trust has entered into contracts with one or more shareholder servicing agents, whereby Class A, Service Class, and Sweep Class of the Fund are charged a fee at an annual rate of 0.25% of the respective average daily net assets of each class. Administrator Class is charged a fee at an annual rate of 0.10% of its average daily net assets. A portion of these total shareholder servicing fees were paid to affiliates of Wells Fargo.
Interfund transactions
The Fund may purchase or sell portfolio investment securities to certain other Wells Fargo affiliates pursuant to Rule17a-7 under the 1940 Act and under procedures adopted by the Board of Trustees. The procedures have been designed to ensure that these interfund transactions, which do not incur broker commissions, are effected at current market prices.
5. DISTRIBUTIONS TO SHAREHOLDERS
The tax character of distributions paid was $293,950,983 and $252,999,389 of ordinary income for the years ended January 31, 2020 and January 31, 2019, respectively.
As of January 31, 2020, distributable earnings on a tax basis consisted of $11,953,797 in undistributed ordinary income.
6. INDEMNIFICATION
Under the Trust’s organizational documents, the officers and Trustees have been granted certain indemnification rights against certain liabilities that may arise out of performance of their duties to the Trust. Additionally, in the normal course of business, the Trust may enter into contracts with service providers that contain a variety of indemnification clauses. The Trust’s maximum exposure under these arrangements is dependent on future claims that may be made against the Fund and, therefore, cannot be estimated.
7. NEW ACCOUNTING PRONOUNCEMENTS
In August 2018, FASB issued Accounting Standards Update (“ASU”)No. 2018-13, Fair Value Measurement (Topic 820)Disclosure Framework—Changes to the Disclosure Requirements for Fair Value Measurement. ASU2018-13 updates the disclosure requirements for fair value measurements by modifying or removing certain disclosures and adding certain new disclosures. The amendments are effective for fiscal years, and interim periods within those fiscal years, beginning after December 15, 2019. Early adoption is permitted. Management has adopted the removal and modification of disclosures early, as permitted, and will adopt the additional new disclosures at the effective date.
In March 2017, FASB issued ASUNo. 2017-08,Premium Amortization on Purchased Callable Debt Securities. ASU2017-08 shortens the amortization period for certain callable debt securities held at a premium and requires the premium to be amortized to the earliest call date. The amendments do not require an accounting change for securities held at a discount and discounts will continue to be accreted to the maturity date of the security. ASU2017-08 is effective for fiscal years beginning after December 15, 2018 and for interim periods within those fiscal years. During the current reporting period, management of the Fund adopted the change in accounting policy which did not have a material impact to the Fund’s financial statements.
8. SUBSEQUENT EVENT
On March 11, 2020, the World Health Organization announced that it had made the assessment that coronavirus disease 2019 (“COVID-19”) is a pandemic. The impacts of COVID-19 is adversely affecting the entire global economy, individual companies and investment products, and the market in general. There is significant uncertainty around the extent and duration of business disruptions related to COVID-19 and the impact may be short term or may last for an extended period of time. The risk of further spreading of COVID-19 has led to significant uncertainty and volatility in the financial markets and the value of the Fund and the securities in which the Fund invests may be adversely affected by impacts caused by COVID-19.
24 | Government Money Market Funds
Table of Contents
Report of independent registered public accounting firm
TO THE SHAREHOLDERS OF THE FUND AND BOARD OF TRUSTEES OF WELLS FARGO FUNDS TRUST:
Opinion on the Financial Statements
We have audited the accompanying statement of assets and liabilities of Wells Fargo Treasury Plus Money Market Fund (the Fund), one of the funds constituting Wells Fargo Funds Trust, including the portfolio of investments, as of January 31, 2020, the related statement of operations for the year then ended, the statements of changes in net assets for each of the years in the two-year period then ended, and the related notes (collectively, the financial statements) and the financial highlights for each of the years or periods in the five-year period then ended. In our opinion, the financial statements and financial highlights present fairly, in all material respects, the financial position of the Fund as of January 31, 2020, the results of its operations for the year then ended, the changes in its net assets for each of the years in the two-year period then ended, and the financial highlights for each of the years or periods in the five-year period then ended, in conformity with U.S. generally accepted accounting principles.
Basis for Opinion
These financial statements and financial highlights are the responsibility of the Fund’s management. Our responsibility is to express an opinion on these financial statements and financial highlights based on our audits. We are a public accounting firm registered with the Public Company Accounting Oversight Board (United States) (PCAOB) and are required to be independent with respect to the Fund in accordance with the U.S. federal securities laws and the applicable rules and regulations of the Securities and Exchange Commission and the PCAOB.
We conducted our audits in accordance with the standards of the PCAOB. Those standards require that we plan and perform the audit to obtain reasonable assurance about whether the financial statements and financial highlights are free of material misstatement, whether due to error or fraud. Our audits included performing procedures to assess the risks of material misstatement of the financial statements and financial highlights, whether due to error or fraud, and performing procedures that respond to those risks. Such procedures included examining, on a test basis, evidence regarding the amounts and disclosures in the financial statements and financial highlights. Such procedures also included confirmation of securities owned as of January 31, 2020, by correspondence with the custodian and brokers, or by other appropriate auditing procedures. Our audits also included evaluating the accounting principles used and significant estimates made by management, as well as evaluating the overall presentation of the financial statements and financial highlights. We believe that our audits provide a reasonable basis for our opinion.

We have not been able to determine the specific year that we began serving as the auditor of one or more Wells Fargo Funds investment companies; however we are aware that we have served as the auditor of one or more Wells Fargo Funds investment companies since at least 1955.
Boston, Massachusetts
March 31, 2020
Government Money Market Funds | 25
Table of Contents
TAX INFORMATION
For the fiscal year ended January 31, 2020, $300,658,051 has been designated as interest-related dividends for nonresident alien shareholders pursuant to Section 871 of the Internal Revenue Code.
For the fiscal year ended January 31, 2020, $48,547 has been designated as short-term capital gain dividends for nonresident alien shareholders pursuant to Section 871 of the Internal Revenue Code.
For the fiscal year ended January 31, 2020, 40.14% of the ordinary income distributed was derived from interest on U.S. government securities.
PROXY VOTING INFORMATION
A description of the policies and procedures used to determine how to vote proxies relating to portfolio securities is available, upon request, by calling1-800-222-8222, visiting our website atwfam.com, or visiting the SEC website at sec.gov. Information regarding how the proxies related to portfolio securities were voted during the most recent12-month period ended June 30 is available on the website atwfam.comor by visiting the SEC website at sec.gov.
26 | Government Money Market Funds
Table of Contents
Other information (unaudited)
BOARD OF TRUSTEES AND OFFICERS
Each of the Trustees and Officers1 listed in the table below acts in identical capacities for each fund in the Wells Fargo family of funds, which consists of 149 mutual funds comprising the Wells Fargo Funds Trust, Wells Fargo Variable Trust, Wells Fargo Master Trust and fourclosed-end funds (collectively the “Fund Complex”). This table should be read in conjunction with the Prospectus and the Statement of Additional Information2. The mailing address of each Trustee and Officer is 525 Market Street, 12th Floor, San Francisco, CA 94105. Each Trustee and Officer serves an indefinite term, however, each Trustee serves such term until reaching the mandatory retirement age established by the Trustees.
Independent Trustees
Name and year of birth | Position held and length of service* | Principal occupations during past five years or longer | Current other public company or investment company directorships | |||
William R. Ebsworth (Born 1957) | Trustee, since 2015 | Retired. From 1984 to 2013, equities analyst, portfolio manager, research director and chief investment officer at Fidelity Management and Research Company in Boston, Tokyo, and Hong Kong, and retired in 2013 as Chief Investment Officer of Fidelity Strategic Advisers, Inc. where he led a team of investment professionals managing client assets. Prior thereto, Board member of Hong Kong Securities Clearing Co., Hong Kong Options Clearing Corp., the Thailand International Fund, Ltd., Fidelity Investments Life Insurance Company, and Empire Fidelity Investments Life Insurance Company. Audit Committee Chair and Investment Committee Chair of the Vincent Memorial Hospital Endowment(non-profit organization). Mr. Ebsworth is a CFA® charterholder. | N/A | |||
| Jane A. Freeman (Born 1953) | Trustee, since 2015; Chair Liaison, since 2018 | Retired. From 2012 to 2014 and 1999 to 2008, Chief Financial Officer of Scientific Learning Corporation. From 2008 to 2012, Ms. Freeman provided consulting services related to strategic business projects. Prior to 1999, Portfolio Manager at Rockefeller & Co. and Scudder, Stevens & Clark. Board member of the Harding Loevner Funds from 1996 to 2014, serving as both Lead Independent Director and chair of the Audit Committee. Board member of the Russell Exchange Traded Funds Trust from 2011 to 2012 and the chair of the Audit Committee. Ms. Freeman is a Board Member of The Ruth Bancroft Garden(non-profit organization). She is also an inactive Chartered Financial Analyst. | N/A | |||
| Isaiah Harris, Jr. (Born 1952) | Trustee, since 2009; Audit Committee Chairman, since 2019 | Retired. Chairman of the Board of CIGNA Corporation since 2009, and Director since 2005. From 2003 to 2011, Director of Deluxe Corporation. Prior thereto, President and CEO of BellSouth Advertising and Publishing Corp. from 2005 to 2007, President and CEO of BellSouth Enterprises from 2004 to 2005 and President of BellSouth Consumer Services from 2000 to 2003. Emeritus member of the Iowa State University Foundation Board of Governors. Emeritus Member of the Advisory Board of Iowa State University School of Business. Advisory Board Member, Palm Harbor Academy (private school). Advisory Board Member, Child Evangelism Fellowship(non-profit). Mr. Harris is a certified public accountant (inactive status). | CIGNA Corporation | |||
| Judith M. Johnson (Born 1949) | Trustee, since 2008; Audit Committee Chairman, from 2009 to 2018 | Retired. Prior thereto, Chief Executive Officer and Chief Investment Officer of Minneapolis Employees Retirement Fund from 1996 to 2008. Ms. Johnson is an attorney, certified public accountant and a certified managerial accountant. | N/A | |||
Government Money Market Funds | 27
Table of Contents
Other information (unaudited)
Name and year of birth | Position held and length of service* | Principal occupations during past five years or longer | Current other public company or investment company directorships | |||
| David F. Larcker (Born 1950) | Trustee, since 2009 | James Irvin Miller Professor of Accounting at the Graduate School of Business, Stanford University, Director of the Corporate Governance Research Initiative and Senior Faculty of The Rock Center for Corporate Governance since 2006. From 2005 to 2008, Professor of Accounting at the Graduate School of Business, Stanford University. Prior thereto, Ernst & Young Professor of Accounting at The Wharton School, University of Pennsylvania from 1985 to 2005. | N/A | |||
| Olivia S. Mitchell (Born 1953) | Trustee, since 2006; Nominating and Governance Committee Chair, since 2018 | International Foundation of Employee Benefit Plans Professor, Wharton School of the University of Pennsylvania since 1993. Director of Wharton’s Pension Research Council and Boettner Center on Pensions & Retirement Research, and Research Associate at the National Bureau of Economic Research. Previously, Cornell University Professor from 1978 to 1993. | N/A | |||
| Timothy J. Penny (Born 1951) | Trustee, since 1996; Chairman, since 2018 | President and Chief Executive Officer of Southern Minnesota Initiative Foundation, anon-profit organization, since 2007. Member of the Board of Trustees of NorthStar Education Finance, Inc., anon-profit organization, since 2007. | N/A | |||
| James G. Polisson (Born 1959) | Trustee, since 2018 | Retired. Chief Marketing Officer, Source (ETF) UK Services, Ltd, from 2015 to 2017. From 2012 to 2015, Principal of The Polisson Group, LLC, a management consulting, corporate advisory and principal investing company. Chief Executive Officer and Managing Director at Russell Investments, Global Exchange Traded Funds from 2010 to 2012. Managing Director of Barclays Global Investors from 1998 to 2010 and Global Chief Marketing Officer for iShares and Barclays Global Investors from 2000 to 2010. Trustee of the San Francisco Mechanics’ Institute, anon-profit organization, from 2013 to 2015. Board member of the Russell Exchange Traded Fund Trust from 2011 to 2012. Director of Barclays Global Investors Holdings Deutschland GmbH from 2006 to 2009. Mr. Polisson is an attorney and has a retired status with the Massachusetts and District of Columbia Bar Associations. | N/A | |||
| Pamela Wheelock3 (Born 1959) | Trustee, since January 2020; previously Trustee from January 2018 to July 2019 | Board member of the Destination Medical Center Economic Development Agency, Rochester, Minnesota since 2019. Acting Commissioner, Minnesota Department of Human Services, July 2019 through September 2019. Human Services Manager (part-time), Minnesota Department of Human Services, October 2019 through December 2019. Chief Operating Officer, Twin Cities Habitat for Humanity from 2017 to 2019. Vice President of University Services, University of Minnesota from 2012 to 2016. Prior thereto, on the Board of Directors, Governance Committee and Finance Committee for the Minnesota Philanthropy Partners (Saint Paul Foundation) from 2012 to 2018, Interim Chief Executive Officer of Blue Cross Blue Shield of Minnesota from 2011 to 2012, Chairman of the Board from 2009 to 2012 and Board Director from 2003 to 2015. Vice President, Leadership and Community Engagement, Bush Foundation, Saint Paul, Minnesota (a private foundation) from 2009 to 2011. Executive Vice President and Chief Financial Officer, Minnesota Sports and Entertainment from 2004 to 2009 and Senior Vice President from 2002 to 2004. Executive Vice President of the Minnesota Wild Foundation from 2004 to 2008. Commissioner of Finance, State of Minnesota, from 1999 to 2002. Currently Board Chair of the Minnesota Wild Foundation since 2010. | N/A | |||
| * | Length of service dates reflect the Trustee’s commencement of service with the Trust’s predecessor entities, where applicable. |
28 | Government Money Market Funds
Table of Contents
Other information (unaudited)
Officers
Name and year of birth | Position held and length of service | Principal occupations during past five years or longer | ||
| Andrew Owen (Born 1960) | President, since 2017 | Executive Vice President of Wells Fargo & Company and Head of Affiliated Managers, Wells Fargo Asset Management, since 2014. In addition, Mr. Owen is currently President, Chief Executive Officer and Director of Wells Fargo Funds Management, LLC since 2017. Prior thereto, Executive Vice President responsible for marketing, investments and product development for Wells Fargo Funds Management, LLC, from 2009 to 2014. | ||
| Nancy Wiser1 (Born 1967) | Treasurer, since 2012 | Executive Vice President of Wells Fargo Funds Management, LLC since 2011. Chief Operating Officer and Chief Compliance Officer at LightBox Capital Management LLC, from 2008 to 2011. | ||
| Michelle Rhee (Born 1966) | Chief Legal Officer, since 2019 | Secretary of Wells Fargo Funds Management, LLC, Chief Legal Counsel of Wells Fargo Asset Management and Assistant General Counsel of Wells Fargo Bank, N.A. since 2018. Associate General Counsel and Managing Director of Bank of America Corporation from 2004 to 2018. | ||
| Catherine Kennedy (Born 1969) | Secretary, since 2019 | Vice President of Wells Fargo Funds Management, LLC and Senior Counsel of the Wells Fargo Legal Department since 2010. Vice President and Senior Counsel of Evergreen Investment Management Company, LLC from 1998 to 2010. | ||
| Michael H. Whitaker(Born 1967) | Chief Compliance Officer, since 2016 | Chief Compliance Officer of Wells Fargo Asset Management since 2016. Senior Vice President and Chief Compliance Officer for Fidelity Investments from 2007 to 2016. | ||
| David Berardi (Born 1975) | Assistant Treasurer, since 2009 | Vice President of Wells Fargo Funds Management, LLC since 2009. Vice President of Evergreen Investment Management Company, LLC from 2008 to 2010. Manager of Fund Reporting and Control for Evergreen Investment Management Company, LLC from 2004 to 2010. | ||
| Jeremy DePalma1 (Born 1974) | Assistant Treasurer, since 2009 | Senior Vice President of Wells Fargo Funds Management, LLC since 2009. Senior Vice President of Evergreen Investment Management Company, LLC from 2008 to 2010 and head of the Fund Reporting and Control Team within Fund Administration from 2005 to 2010. | ||
| 1 | Nancy Wiser acts as Treasurer of 64 funds in the Fund Complex. Jeremy DePalma acts as Treasurer of 85 funds and Assistant Treasurer of 64 funds in the Fund Complex. |
| 2 | The Statement of Additional Information includes additional information about the Trustees and is available, without charge, upon request, by calling1-800-222-8222 or by visiting the website atwfam.com. |
| 3 | Pamela Wheelock wasre-appointed to the Board effective January 1, 2020. |
Government Money Market Funds | 29
Table of Contents
This page is intentionally left blank.
Table of Contents
This page is intentionally left blank.
Table of Contents
This page is intentionally left blank.
Table of Contents
For more information
More information about Wells Fargo Funds is available free upon request. To obtain literature, please write, visit the Fund’s website, or call:
Wells Fargo Funds
P.O. Box 219967
Kansas City, MO 64121-9967
Website:wfam.com
Individual investors:1-800-222-8222
Retail investment professionals:1-888-877-9275
Institutional investment professionals:1-866-765-0778

This report and the financial statements contained herein are submitted for the general information of the shareholders of the Fund. If this report is used for promotional purposes, distribution of the report must be accompanied or preceded by a current prospectus. Before investing, please consider the investment objectives, risks, charges, and expenses of the investment. For a current prospectus and, if available, a summary prospectus, containing this information, call1-800-260-5969 or visit the Fund’s website atwfam.com. Read the prospectus carefully before you invest or send money.
Wells Fargo Asset Management (WFAM) is the trade name for certain investment advisory/management firms owned by Wells Fargo & Company. These firms include but are not limited to Wells Capital Management Incorporated and Wells Fargo Funds Management, LLC. Certain products managed by WFAM entities are distributed by Wells Fargo Funds Distributor, LLC (a broker-dealer and Member FINRA).
This material is for general informational and educational purposes only and is NOT intended to provide investment advice or a recommendation of any kind—including a recommendation for any specific investment, strategy, or plan.
INVESTMENT PRODUCTS: NOT FDIC INSURED ◾ NO BANK GUARANTEE ◾ MAY LOSE VALUE
© 2020 Wells Fargo & Company. All rights reserved
PAR-0220-03806 03-20
A314/AR314 01-20
Table of Contents
ITEM 2. CODE OF ETHICS
(a) As of the end of the period covered by the report, Wells Fargo Funds Trust has adopted a code of ethics that applies to its President and Treasurer. A copy of the code of ethics is filed as an exhibit to this FormN-CSR.
(c) During the period covered by this report, there were no amendments to the provisions of the code of ethics adopted in Item 2(a) above.
(d) During the period covered by this report, there were no implicit or explicit waivers to the provisions of the code of ethics adopted in Item 2(a) above.
ITEM 3. AUDIT COMMITTEE FINANCIAL EXPERT
The Board of Trustees of Wells Fargo Funds Trust has determined that Judith Johnson is an audit committee financial expert, as defined in Item 3 of FormN-CSR. Mrs. Johnson is independent for purposes of Item 3 of FormN-CSR.
ITEM 4. PRINCIPAL ACCOUNTANT FEES AND SERVICES
(a), (b), (c), (d) The following table presents aggregate fees billed in each of the last two fiscal years for services rendered to the Registrant by the Registrant’s principal accountant. These fees were billed to the registrant and were approved by the Registrant’s audit committee.
| Fiscal year ended January 31, 2020 | Fiscal year ended January 31, 2019 | |||||||
Audit fees | $ | 343,480 | $ | 317,230 | ||||
Audit-related fees | — | — | ||||||
Tax fees (1) | 15,840 | 15,520 | ||||||
All other fees | — | — | ||||||
|
|
|
| |||||
| $359,320 | $332,750 | |||||||
|
|
|
| |||||
(1) Tax fees consist of fees for tax compliance, tax advice, tax planning and excise tax.
(e) The Chairman of the Audit Committees is authorized topre-approve: (1) audit services for the mutual funds of Wells Fargo Funds Trust;(2) non-audit tax or compliance consulting or training services provided to the Funds by the independent auditors (“Auditors”) if the fees for any particular engagement are not anticipated to exceed $50,000; and(3) non-audit tax or compliance consulting or training services provided by the Auditors to a Fund’s investment adviser and its controlling entities (wherepre-approval is required because the engagement relates directly to the operations and financial reporting of the Fund) if the fee to the Auditors for any particular engagement is not anticipated to exceed $50,000. For any suchpre-approval sought from the Chairman, Management shall prepare a brief description of the proposed services.
If the Chairman approves of such service, he or she shall sign the statement prepared by Management. Such written statement shall be presented to the full Committees at their next regularly scheduled meetings.
Table of Contents
(f) Not applicable
(g) Not applicable
(h) Not applicable
ITEM 5. AUDIT COMMITTEE OF LISTED REGISTRANTS
Not applicable.
ITEM 6. INVESTMENTS
A Portfolio of Investments for each series of Wells Fargo Funds Trust is included as part of the report to shareholders filed under Item 1 of this Form.
ITEM 7. DISCLOSURE OF PROXY VOTING POLICIES AND PROCEDURES FORCLOSED-END MANAGEMENT INVESTMENT COMPANIES
Not applicable.
ITEM 8. PORTFOLIO MANAGERS OFCLOSED-END MANAGEMENT INVESTMENT COMPANIES
Not applicable.
ITEM 9. PURCHASES OF EQUITY SECURITIES BYCLOSED-END MANAGEMENT INVESTMENT COMPANY AND AFFILIATED PURCHASERS
Not applicable.
ITEM 10. SUBMISSION OF MATTERS TO A VOTE OF SECURITY HOLDERS
There have been no material changes to the procedures by which shareholders may recommend nominees to the registrant’s Board of Trustees that have been implemented since the registrant’s last provided disclosure in response to the requirements of this Item.
ITEM 11. CONTROLS AND PROCEDURES
(a) The President and Treasurer have concluded that the Wells Fargo Funds Trust disclosure controls and procedures (as defined in Rule30a-3(c) under the Investment Company Act of 1940) provide reasonable assurances that material information relating to the registrant is made known to them by the appropriate persons based on their evaluation of these controls and procedures as of a date within 90 days of the filing of this report.
(b) There were no significant changes in the registrant’s internal controls over financial reporting (as defined in Rule30a-3(d) under the Investment Company Act of 1940) that occurred during the most recent fiscal half-year of the period covered by this report that materially affected, or is reasonably likely to materially affect, the registrant’s internal control over financial reporting.
Table of Contents
ITEM 12. DISCLOSURES OF SECURITIES LENDING ACTIVITIES FORCLOSED-END MANAGEMENT INVESTMENT COMPANIES
Not applicable.
ITEM 13. EXHIBITS
(a)(1)Code of Ethics pursuant to Item 2 of FormN-CSR is filed and attached hereto as Exhibit 99.CODE
Table of Contents
SIGNATURES
Pursuant to the requirements of the Securities Exchange Act of 1934 and the Investment Company Act of 1940, the registrant has duly caused this report to be signed on its behalf by the undersigned, thereunto duly authorized.
Wells Fargo Funds Trust | ||
| By: | ||
| /s/ Andrew Owen | ||
| Andrew Owen | ||
| President | ||
| Date: | March 31, 2020 | |
Pursuant to the requirements of the Securities Exchange Act of 1934 and the Investment Company Act of 1940, this report has been signed below by the following persons on behalf of the registrant and in the capacities and on the date indicated.
| Wells Fargo Funds Trust | ||
| By: | ||
| /s/ Andrew Owen | ||
| Andrew Owen | ||
| President | ||
| Date: | March 31, 2020 | |
| By: | ||
| /s/ Nancy Wiser | ||
| Nancy Wiser | ||
| Treasurer | ||
| Date: | March 31, 2020 | |