Table of Contents

UNITED STATES
SECURITIES AND EXCHANGE COMMISSION
Washington, D.C. 20549
FORMN-CSR
CERTIFIED SHAREHOLDER REPORT OF REGISTERED
MANAGEMENT INVESTMENT COMPANIES
Investment Company Act file number:811-09253
Wells Fargo Funds Trust
(Exact name of registrant as specified in charter)
525 Market St., San Francisco, CA 94105
(Address of principal executive offices) (Zip code)
Catherine Kennedy
Wells Fargo Funds Management, LLC
525 Market St., San Francisco, CA 94105
(Name and address of agent for service)
Registrant’s telephone number, including area code:800-222-8222
Date of fiscal year end: February 29
Registrant is making a filing for 27 of its series:
Wells Fargo Dynamic Target Today Fund, Wells Fargo Dynamic Target 2015 Fund, Wells Fargo Dynamic Target 2020 Fund, Wells Fargo Dynamic Target 2025 Fund, Wells Fargo Dynamic Target 2030 Fund, Wells Fargo Dynamic Target 2035 Fund, Wells Fargo Dynamic Target 2040 Fund, Wells Fargo Dynamic Target 2045 Fund, Wells Fargo Dynamic Target 2050 Fund, Wells Fargo Dynamic Target 2055 Fund, Wells Fargo Dynamic Target 2060 Fund, Wells Fargo Target Today Fund, Wells Fargo Target 2010 Fund, Wells Fargo Target 2015 Fund, Wells Fargo Target 2020 Fund, Wells Fargo Target 2025 Fund, Wells Fargo Target 2030 Fund, Wells Fargo Target 2035 Fund, Wells Fargo Target 2040 Fund, Wells Fargo Target 2045 Fund, Wells Fargo Target 2050 Fund, Wells Fargo Target 2055 Fund, Wells Fargo Target 2060 Fund, Wells Fargo Emerging Markets Bond Fund, Wells Fargo High Yield Corporate Bond Fund, Wells Fargo International Government Bond Fund, and Wells Fargo U.S. Core Bond Fund.
Date of reporting period: February 29, 2020
Table of Contents
| ITEM 1. | REPORT TO STOCKHOLDERS |
Table of Contents

Annual Report
February 29, 2020
Target Date Retirement Funds
| ∎ | Wells Fargo Target Today Fund |
| ∎ | Wells Fargo Target 2010 Fund |
| ∎ | Wells Fargo Target 2015 Fund |
| ∎ | Wells Fargo Target 2020 Fund |
| ∎ | Wells Fargo Target 2025 Fund |
| ∎ | Wells Fargo Target 2030 Fund |
| ∎ | Wells Fargo Target 2035 Fund |
| ∎ | Wells Fargo Target 2040 Fund |
| ∎ | Wells Fargo Target 2045 Fund |
| ∎ | Wells Fargo Target 2050 Fund |
| ∎ | Wells Fargo Target 2055 Fund |
| ∎ | Wells Fargo Target 2060 Fund |
Beginning on January 1, 2021, as permitted by new regulations adopted by the Securities and Exchange Commission, paper copies of the Wells Fargo Funds’ annual and semi-annual shareholder reports issued after this date will no longer be sent by mail, unless you specifically request paper copies of the reports. Instead, the reports will be made available on the Funds’ website, and you will be notified by mail each time a report is posted and provided with a website address to access the report.
If you already elected to receive shareholder reports electronically, you will not be affected by this change and you need not take any action. You may elect to receive shareholder reports and other communications from the Fund electronically at any time by contacting your financial intermediary (such as a broker-dealer or bank) or, if you are a direct investor, by calling1-800-222-8222 or by enrolling at wellsfargo.com/advantagedelivery.
You may elect to receive all future reports in paper free of charge. If you invest through a financial intermediary, you can contact your financial intermediary to request that you continue to receive paper copies of your shareholder reports; if you invest directly with the Fund, you can call 1-800-222-8222. Your election to receive reports in paper will apply to all Wells Fargo Funds held in your account with your financial intermediary or, if you are a direct investor, to all Wells Fargo Funds that you hold.
Table of Contents
|
Reduce clutter. Save trees. |
Sign up for electronic delivery of prospectuses and shareholder reports at wellsfargo.com/ advantagedelivery |
The views expressed and any forward-looking statements are as of February 29, 2020, unless otherwise noted, and are those of the Fund managers and/or Wells Fargo Asset Management. Discussions of individual securities, or the markets generally, or any Wells Fargo Fund are not intended as individual recommendations. Future events or results may vary significantly from those expressed in any forward-looking statements. The views expressed are subject to change at any time in response to changing circumstances in the market. Wells Fargo Asset Management and the Fund disclaim any obligation to publicly update or revise any views expressed or forward-looking statements.
INVESTMENT PRODUCTS: NOT FDIC INSURED ◾ NO BANK GUARANTEE ◾ MAY LOSE VALUE
Target Date Retirement Funds | 1
Table of Contents
Letter to shareholders (unaudited)

Andrew Owen
President
Wells Fargo Funds
Dear Shareholder:
We are pleased to offer you this annual report for the Wells Fargo Target Date Funds for the 12-month period that ended February 29, 2020. Despite periods of market volatility, particularly at the end of the reporting period in February and with the onset of the novel coronavirus (COVID-19), returns were positive overall for financial markets as supportive central banks addressed concerns over slowing global economic growth and international trade tensions.
Fixed-income and equity investors had mixed annual returns, as U.S. markets led the way, with much stronger annual returns than non-U.S. markets, among both equities and fixed-income investments. For the period, U.S. stocks, based on the S&P 500 Index,1 gained 8.19% and international stocks, as measured by the MSCI ACWI ex USA Index (Net),2 returned -0.69%. The MSCI EM Index (Net)3 trailed, with a -1.88% return. For bond investors, the Bloomberg Barclays U.S. Aggregate Bond Index4 added a healthy 11.68%, the Bloomberg Barclays Global Aggregate ex-USD Index5 gained a more modest 4.83%, the Bloomberg Barclays Municipal Bond Index6 returned 9.46%, and the ICE BofA U.S. High Yield Index7 added 5.91%.
The year began on a strong note but enthusiasm faded.
Financial markets began the period with a tailwind from an increase in central bank supportive actions in response to slowing global growth and ongoing U.S.-China trade issues. By the end of the first quarter of 2019, more accommodative U.S. Federal Reserve (Fed) sentiment and steady U.S. economic and business metrics encouraged domestic investors.
During April, sustained low inflation, solid employment data, and first-quarter U.S. gross domestic product (GDP) of an annualized rate of 3.2% supported favorable sentiment. During May, however, markets tumbled on mixed investment signals. In the U.S., partisan political wrangling ramped up in advance of the 2020 election. The U.K.’s Brexit disagreements caused Prime Minister Theresa May to resign. Boris Johnson succeeded her, only to add to uncertainty about Brexit’s resolution ahead of an October 2019 deadline. The European Commission downgraded the 2019 growth forecast to 1.2%. The U.S. increased tariffs on products from China, China responded, and then talks broke down. President Donald Trump threatened to turn his foreign policy tariff tool to Mexico over immigration issues.
| 1 | The S&P 500 Index consists of 500 stocks chosen for market size, liquidity, and industry group representation. It is a market-value-weighted index with each stock’s weight in the index proportionate to its market value. You cannot invest directly in an index. |
| 2 | The Morgan Stanley Capital International (MSCI) All Country World Index (ACWI) ex USA Index (Net) is a free-float-adjusted market-capitalization-weighted index that is designed to measure the equity market performance of developed markets, excluding the United States. Source: MSCI. MSCI makes no express or implied warranties or representations and shall have no liability whatsoever with respect to any MSCI data contained herein. The MSCI data may not be further redistributed or used as a basis for other indices or any securities or financial products. This report is not approved, reviewed, or produced by MSCI. You cannot invest directly in an index. |
| 3 | The MSCI Emerging Markets (EM) Index (Net) is a free-float-adjusted market-capitalization-weighted index that is designed to measure equity market performance of emerging markets. You cannot invest directly in an index. |
| 4 | The Bloomberg Barclays U.S. Aggregate Bond Index is a broad-based benchmark that measures the investment-grade, U.S. dollar denominated, fixed-rate taxable bond market, including Treasuries, government-related and corporate securities, mortgage-backed securities (agency fixed-rate and hybrid adjustable-rate mortgage pass-throughs), asset-backed securities, and commercial mortgage backed securities. You cannot invest directly in an index. |
| 5 | The Bloomberg Barclays Global Aggregateex-USD Index is an unmanaged index that provides a broad-based measure of the global investment-grade fixed-income markets excluding the U.S. dollar-denominated debt market. You cannot invest directly in an index. |
| 6 | The Bloomberg Barclays Municipal Bond Index is an unmanaged index composed of long-termtax-exempt bonds with a minimum credit rating of Baa. You cannot invest directly in an index. |
| 7 | The ICE BofA U.S. High Yield Index is a market-capitalization-weighted index of domestic and Yankee high-yield bonds. The index tracks the performance of high-yield securities traded in the U.S. bond market. You cannot invest directly in an index. Copyright 2020. ICE Data Indices, LLC. All rights reserved. |
2 | Target Date Retirement Funds
Table of Contents
Letter to shareholders (unaudited)
Midway through the year, investors regrouped, sentiment turned positive, and U.S. equity markets advanced during June and July. The gains, primarily driven by geopolitical and monetary policy events, pushed equity markets to new highs. European Central Bank President Mario Draghi indicated the bank was ready to cut rates or buy more assets to prop up inflation if needed. President Trump backed off of tariff threats against Mexico and China. In the U.S., the Fed implemented a 0.25% federal funds rate cut in July.
Later in July, the U.S. reversed course and threatened to impose higher tariffs on China’s exports after talks failed. China responded with tariff threats of its own and devalued the renminbi, roiling global markets. Major U.S. stock market indices closed July with the worst weekly results of the year. Bond prices gained as Treasury yields fell to multiyear lows, and the yield curve inverted at multiple points along the30-year arc.
In August, U.S.-China trade tensions continued with no signs of compromise. Evidence of a continued global economic slowdown mounted, and central banks in China, New Zealand, and Thailand cut interest rates. Industrial and manufacturing data declined in China, Canada, Japan, and Germany. Adding to global uncertainty, Italy’s prime minister resigned, many feared a crackdown in Hong Kong as protestors sustained their calls for reform, and Boris Johnson planned to suspend Parliament as Brexit’s deadline neared.
In the U.S., the Fed cut interest rates a second time in September. U.S. manufacturing data disappointed investors. The U.S. Congress announced it would pursue an impeachment investigation of President Trump. Meanwhile, the Brexit impasse showed no signs of resolution. Officials in China said that hitting the country’s economic growth goals for the year would be difficult considering the weight of tariffs and trade restrictions. Although the S&P 500 Index finished the third quarter with the bestyear-to-date returns in more than 20 years, concerns about future returns remained.
The fourth quarter started on a strong note, with U.S.-China trade tensions relaxing in October along with renewed optimism for a U.K. Brexit deal and positive macroeconomic data. The initial estimate of U.S. third-quarter GDP growth was a resilient 1.9% annualized rate, while the U.S. unemployment rate fell to a50-year low of 3.5% in September. However, despite resilience among U.S. consumers, business confidence declined while manufacturing activity contracted. Concerned with a potential economic slowdown, the Fed lowered interest rates another quarter point in late October—its third rate cut in four months. This helped push the S&P 500 Index to a newall-time high while emerging market equities rallied and global bonds declined overall, reflecting a broad pickup in risk appetite.
Equity markets continued to rally in November despite ongoing geopolitical risks. Hopes for a U.S.-China trade deal buoyed investor confidence. U.S. business sentiment improved slightly, and manufacturing and services activity picked up. With that positive backdrop, developed market equities outpaced those in emerging markets, and U.S. stocks, as reflected by the S&P 500 Index, outperformednon-U.S. stocks overall. While consumer confidence and purchasing manager activity rose in the eurozone, China reported weakening manufacturing and consumer data. Bond yields rose marginally, leading to slightly negative returns for global government and investment-grade corporate bonds.
Financial markets ended 2019 with a boost from the U.S. and China accord on a Phase One trade deal. That, along with the landslide win by the pro-Brexit U.K. Conservative Party in a national election and ongoing central bank support, gave investors greater confidence. U.S. economic indicators were generally positive, with the exception of manufacturing activity and business confidence. Consumer confidence was resilient, fed by a robust labor market, tame inflation, and lower interest rates, which boosted housing affordability and stimulated homebuyer activity. The impeachment of U.S.
President Donald Trump had little impact on markets. Meanwhile, slowing Chinese economic activity, partly attributable to the trade war, led to further government stimulus atyear-end through lower reserve ratios, allowing banks to lend more money.
“Midway through the year, investors regrouped, sentiment turned positive, and U.S. equity markets advanced.”
Target Date Retirement Funds | 3
Table of Contents
Letter to shareholders (unaudited)
“Capital market volatility picked up sharply in late January on concerns over the unknown impact of the coronavirus on the global economy and stock markets.”
|
For further information about your Fund, contact your investment professional, visit our website atwfam.com, or call us directly at1-800-222-8222. |
Theyear-end rally continued in early January 2020. However, capital market volatility picked up sharply in late January on concerns over the unknown impact of the coronavirus on the global economy and stock markets. With sentiment somewhat souring, perceived safe havens did well in January. The U.S. dollar and Japanese yen both rose and government bonds outperformed equities. While the S&P 500 Index held its ground, emerging market equities tumbled, including those in Asia, that are most exposed to viruses—physical or economic—originating in China.
In February, the coronavirus became the major market focus. Fears of the virus’s impact on Chinese and global growth led to expectations of increased global central bank monetary policy support. That led the10-year Treasury yield to fall to anall-time low of 1.1% by the end of the month. Although equity markets initially shrugged off concerns about the outbreak, focusing instead on strong fourth-quarter earnings and improving business confidence in January, market sentiment turned sharply lower towardmonth-end and the S&P 500 Index lost 8.2% for the month. Oil prices tumbled as Russia and the Organization of the Petroleum Exporting Countries compounded a major decline in oil demand with a brutal price war, partly aimed at dissuading further U.S. shale production. As a result, the price of West Texas Intermediate crude oil fell 13% in February and 27% for 2020 year to date.
Don’t let short-term uncertainty derail long-term investment goals.
Periods of investment uncertainty can present challenges, but experience has taught us that maintaining long-term investment goals can be an effective way to plan for the future. To help you create a sound strategy based on your personal goals and risk tolerance, Wells Fargo Funds offers more than 100 mutual funds spanning a wide range of asset classes and investment styles. Although diversification cannot guarantee an investment profit or prevent losses, we believe it can be an effective way to manage investment risk and potentially smooth out overall portfolio performance. We encourage investors to know their investments and to understand that appropriate levels of risk-taking may unlock opportunities.
Thank you for choosing to invest with Wells Fargo Funds. We appreciate your confidence in us and remain committed to helping you meet your financial needs.
Sincerely,

Andrew Owen
President
Wells Fargo Funds
Notice to shareholders
Effective July 1, 2020, the Funds’ underlying U.S. large- and small-capitalization companies, international(non-U.S.) developed and emerging markets allocations will no longer seek to track proprietary indexes and their portfolios will be realigned with the methodology summarized below (the “Factor Enhanced Methodology”) over a period of approximately three months. Also effective July 1, 2020, each of the Wells Fargo Target Today Fund, Wells Fargo Target 2010 Fund, Wells Fargo Target 2015 Fund, Wells Fargo Target 2020 Fund, Wells Fargo Target 2025 Fund and Wells Fargo Target 2030 Fund will invest a portion of its assets in a new low volatility equity allocation.
Factor Enhanced Methodology.A systematic, rules based methodology designed to build a portfolio of stocks that provides exposure to factors (or characteristics) commonly tied to a stock’s potential for enhanced risk-adjusted returns relative to the market. Those factors include, but are not limited to, value, quality, momentum, size, and low volatility.
4 | Target Date Retirement Funds
Table of Contents
This page is intentionally left blank.
Table of Contents
Performance highlights (unaudited)
Wells Fargo Target Date Funds
Investment objective
Each Fund seeks total return over time, consistent with its strategic target asset allocation.
Manager
Wells Fargo Funds Management, LLC
Subadviser
Wells Capital Management Incorporated
Portfolio managers
Kandarp R. Acharya, CFA®‡, FRM
Petros N. Bocray, CFA®‡, FRM
Christian L. Chan, CFA®‡
The target date represents the year in which investors may likely begin withdrawing assets. The Funds gradually seek to reduce market risk as the target date approaches and after it arrives by decreasing equity exposure and increasing fixed income exposure. The principal value is not guaranteed at any time, including at the target date. The Funds will indirectly be exposed to all of the risks of an investment in the affiliated master portfolios and will bear expenses of the underlying affiliated master portfolios.
Stock values fluctuate in response to the activities of individual companies and general market and economic conditions. Bond values fluctuate in response to the financial condition of individual issuers, general market and economic conditions, and changes in interest rates. Changes in market conditions and government policies may lead to periods of heightened volatility in the bond market and reduced liquidity for certain bonds held by the Funds. In general, when interest rates rise, bond values fall and investors may lose principal value. Interest rate changes and their impact on the Funds and its share price can be sudden and unpredictable. High-yield securities have a greater risk of default and tend to be more volatile than higher-rated debt securities. The use of derivatives may reduce returns and/or increase volatility. Securities issued by U.S. government agencies or government sponsored entities may not be guaranteed by the U.S. Treasury. Certain investment strategies tend to increase the total risk of an investment (relative to the broader market). The Funds are exposed to foreign investment risk,mortgage-and asset-backed securities risk, and smaller-company investment risk. Consult the Funds’ prospectus for additional information on these and other risks.
| ‡ | CFA® and Chartered Financial Analyst® are trademarks owned by CFA Institute. |
6 | Target Date Retirement Funds
Table of Contents
Performance highlights (unaudited)
Average annual total returns (%) as of February 29, 2020
| Including sales charge | Excluding sales charge | Expense ratios1 (%) | ||||||||||||||||||||||||||||||||
| Inception date | 1 year | 5 year | 10 year | 1 year | 5 year | 10 year | Gross | Net2 | ||||||||||||||||||||||||||
| Class A (STWRX) | 3-1-1994 | 1.43 | 1.73 | 2.82 | 7.64 | 2.94 | 3.43 | 0.94 | 0.65 | |||||||||||||||||||||||||
| Class C (WFODX) | 12-1-1998 | 5.80 | 2.16 | 2.65 | 6.80 | 2.16 | 2.65 | 1.69 | 1.40 | |||||||||||||||||||||||||
| Class R (WFRRX)3 | 6-28-2013 | – | – | – | 7.35 | 2.66 | 3.21 | 1.19 | 0.90 | |||||||||||||||||||||||||
| Class R4 (WOTRX)4 | 11-30-2012 | – | – | – | 7.98 | 3.18 | 3.79 | 0.66 | 0.34 | |||||||||||||||||||||||||
| Class R6 (WOTDX) | 6-30-2004 | – | – | – | 8.16 | 3.40 | 3.94 | 0.51 | 0.19 | |||||||||||||||||||||||||
| Administrator Class (WFLOX) | 11-8-1999 | – | – | – | 7.76 | 3.05 | 3.57 | 0.86 | 0.54 | |||||||||||||||||||||||||
| S&P Target Date Retirement Income Index5 | – | – | – | – | 7.04 | 3.97 | 5.31 | – | – | |||||||||||||||||||||||||
| Wells Fargo Target Today Blended Index6 | – | – | – | – | 8.18 | – | – | – | – | |||||||||||||||||||||||||
Figures quoted represent past performance, which is no guarantee of future results, and do not reflect taxes that a shareholder may pay on an investment in a fund. Investment return and principal value of an investment will fluctuate so that an investor’s shares, when redeemed, may be worth more or less than their original cost. Performance shown without sales charges would be lower if sales charges were reflected. Current performance may be lower or higher than the performance data quoted and assumes the reinvestment of dividends and capital gains. Currentmonth-end performance is available on the Fund’s website, wfam.com.
Index returns do not include transaction costs associated with buying and selling securities, any mutual fund fees or expenses, or any taxes. It is not possible to invest directly in an index.
For Class A shares, the maximumfront-end sales charge is 5.75%. For Class C shares, the maximum contingent deferred sales charge is 1.00%. Performance including a contingent deferred sales charge assumes the sales charge for the corresponding time period. Class R, Class R4, Class R6, and Administrator Class shares are sold without afront-end sales charge or contingent deferred sales charge.
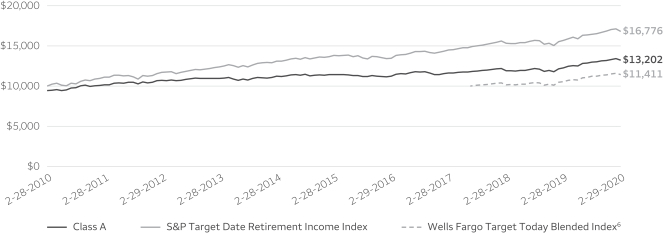
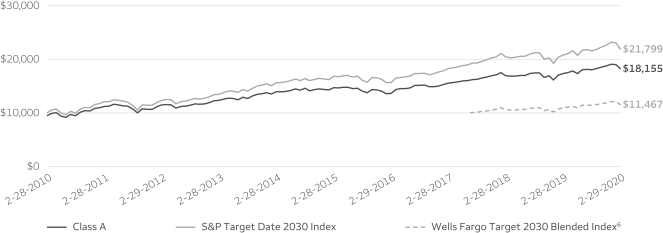
| Growth of $10,000 investment as of February 29, 20207 |
|
Please see footnotes on page 9.
Target Date Retirement Funds | 7
Table of Contents
Performance highlights (unaudited)
Target Today Fund (continued)
| Holdings (%) as of February 29, 20208 | ||||
Wells Fargo Bloomberg Barclays US Aggregateex-Corporate Portfolio | 35.69 | |||
Wells Fargo Investment Grade Corporate Bond Portfolio | 18.50 | |||
Wells Fargo Factor Enhanced Large Cap Portfolio | 13.01 | |||
Wells Fargo Strategic Retirement Bond Portfolio | 12.04 | |||
Wells Fargo Factor Enhanced International Portfolio | 6.92 | |||
Wells Fargo Factor Enhanced Small Cap Portfolio | 3.23 | |||
Wells Fargo Emerging Markets Bond Portfolio | 2.95 | |||
Wells Fargo High Yield Corporate Bond Portfolio | 2.91 | |||
Wells Fargo U.S. REIT Portfolio | 2.26 | |||
Wells Fargo Factor Enhanced Emerging Markets Portfolio | 2.06 | |||
| Volatility metrics as of February 29, 202010 | ||||||||||||
| Beta11 | Standard deviation12 | R-squared13 | ||||||||||
Class A | 0.87 | 3.70 | % | 0.91 | ||||||||
Class C | 0.87 | 3.72 | % | 0.91 | ||||||||
Class R | 0.87 | 3.72 | % | 0.91 | ||||||||
Class R4 | 0.86 | 3.68 | % | 0.90 | ||||||||
Class R6 | 0.86 | 3.68 | % | 0.91 | ||||||||
Administrator Class | 0.86 | 3.69 | % | 0.91 | ||||||||
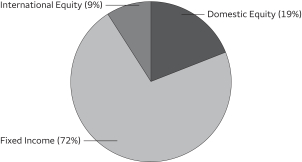
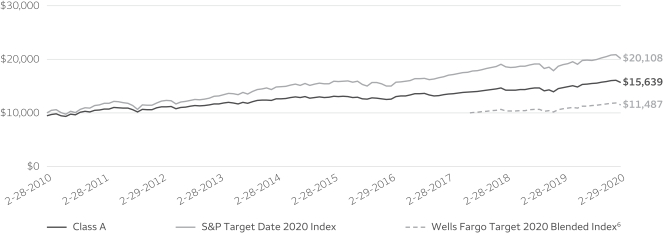
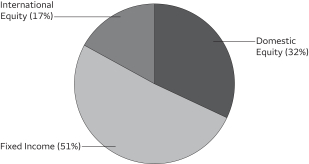
| Portfolio allocation as of February 29, 20209 |
 |
Please see footnotes on page 9.
8 | Target Date Retirement Funds
Table of Contents
Performance highlights (unaudited)
Target Today Fund (continued)
| 1 | Reflects the expense ratios as stated in the most recent prospectuses, which include the impact of 0.13% of acquired fund fees and expenses representing the net expenses from the affiliated master portfolios. The expense ratios shown are subject to change and may differ from the annualized expense ratios shown in the financial highlights of this report. |
| 2 | The manager has contractually committed through June 30, 2020, to waive fees and/or reimburse expenses to the extent necessary to cap total annual fund operating expenses after fee waivers at 0.65% for Class A, 1.40% for Class C, 0.90% for Class R, 0.34% for Class R4, 0.19% for Class R6, and 0.54% for Administrator Class. Brokerage commissions, stamp duty fees, interest, taxes, acquired fund fees and expenses (if any) from funds in which the affiliated master portfolios invest and from money market funds, and extraordinary expenses are excluded from the expense caps. All other acquired fund fees from the affiliated master portfolios are included in the expense caps. Prior to or after the commitment expiration date, the caps may be increased or the commitment to maintain the caps may be terminated only with the approval of the Board of Trustees. Without these caps, the Fund’s returns would have been lower. The expense ratio paid by an investor is the net expense ratio (the total annual fund operating expenses after fee waivers) as stated in the prospectuses. |
| 3 | Historical performance shown for the Class R shares prior to their inception reflects the performance of the Class A shares and has been adjusted to reflect the higher expenses applicable to the Class R shares. |
| 4 | Historical performance shown for the Class R4 shares prior to their inception reflects the performance of the Class R6 shares and has been adjusted to reflect the higher expenses applicable to the Class R4 shares. |
| 5 | The S&P Target Date Index is designed as a benchmark for multi-asset class portfolios with risk profiles that become more conservative over time, corresponding to the target retirement date. This index is representative of the investment opportunity available to investors for the target date horizon, with asset class exposures driven by a survey of available target date funds for that horizon. You cannot invest directly in an index. |
| 6 | Source: Wells Fargo Funds Management, LLC. The Wells Fargo Target Blended Index is designed as a benchmark for multi-asset class portfolios with risk profiles that become more conservative over time, each corresponding to the target retirement date. The index weightings among the major asset classes are adjusted annually. The inception date of the index is July 14, 2017. See Appendix I for additional information. You cannot invest directly in an index. |
| 7 | The chart compares the performance of Class A shares for the most recent ten years with the S&P Target Date Retirement Income Index and the Wells Fargo Target Today Blended Index. The chart assumes a hypothetical investment of $10,000 in Class A shares and reflects all operating expenses and assumes the maximum initial sales charge of 5.75%. |
| 8 | Holdings, excluding cash, cash equivalents and any money market funds, are calculated based on the value of the investments divided by total net assets of the Fund. Holdings are subject to change and may have changed since the date specified. |
| 9 | Amounts are calculated based on the total long-term investments of the Fund. These amounts are subject to change and may have changed since the date specified. |
| 10 | These metrics show the degree and timing of the Fund’s fluctuations compared to S&P Target Date Retirement Income Index over 36 months. |
| 11 | Beta measures fund volatility relative to general market movements. It is a standardized measure of systematic risk in comparison with a specified index. The benchmark beta is 1.00 by definition. Beta is based on historical performance and does not represent future results. |
| 12 | Standard deviation is the square root of the sum of squared deviations from the mean. It is often used as a measure of volatility, variability, or risk. Standard deviation is based on historical performance and does not represent future results. |
| 13 | R-squared (R2) is a statistical measure that reflects the percentage of a fund’s movements that can be explained by movements in its benchmark index. The measure ranges from 0.0, which means that the fund’s performance bears no relationship to the performance of the index, to 1.0, which means that the fund’s performance was perfectly synchronized with the performance of the benchmark. R2 is based on historical performance and does not represent future results. |
Target Date Retirement Funds | 9
Table of Contents
Performance highlights (unaudited)
Average annual total returns (%) as of February 29, 2020
| Including sales charge | Excluding sales charge | Expense ratios1 (%) | ||||||||||||||||||||||||||||||||
| Inception date | 1 year | 5 year | 10 year | 1 year | 5 year | 10 year | Gross | Net2 | ||||||||||||||||||||||||||
| Class A (STNRX) | 3-1-1994 | 1.37 | 1.82 | 3.21 | 7.57 | 3.03 | 3.82 | 0.91 | 0.65 | |||||||||||||||||||||||||
| Class C (WFOCX) | 12-1-1998 | 5.70 | 2.25 | 3.04 | 6.70 | 2.25 | 3.04 | 1.66 | 1.40 | |||||||||||||||||||||||||
| Class R (WFARX)3 | 6-28-2013 | – | – | – | 7.29 | 2.76 | 3.61 | 1.16 | 0.90 | |||||||||||||||||||||||||
| Class R4 (WFORX)4 | 11-30-2012 | – | – | – | 7.90 | 3.34 | 4.22 | 0.63 | 0.34 | |||||||||||||||||||||||||
| Class R6 (WFOAX) | 6-30-2004 | – | – | – | 8.07 | 3.50 | 4.33 | 0.48 | 0.19 | |||||||||||||||||||||||||
| Administrator Class (WFLGX) | 11-8-1999 | – | – | – | 7.77 | 3.14 | 3.96 | 0.83 | 0.54 | |||||||||||||||||||||||||
| S&P Target Date 2010 Index5 | – | – | – | – | 6.76 | 4.27 | 6.00 | – | – | |||||||||||||||||||||||||
| Wells Fargo Target 2010 Blended Index6 | – | – | – | – | 8.09 | – | – | – | – | |||||||||||||||||||||||||
Figures quoted represent past performance, which is no guarantee of future results, and do not reflect taxes that a shareholder may pay on an investment in a fund. Investment return and principal value of an investment will fluctuate so that an investor’s shares, when redeemed, may be worth more or less than their original cost. Performance shown without sales charges would be lower if sales charges were reflected. Current performance may be lower or higher than the performance data quoted and assumes the reinvestment of dividends and capital gains. Currentmonth-end performance is available on the Fund’s website,wfam.com.
Index returns do not include transaction costs associated with buying and selling securities, any mutual fund fees or expenses, or any taxes. It is not possible to invest directly in an index.
For Class A shares, the maximumfront-end sales charge is 5.75%. For Class C shares, the maximum contingent deferred sales charge is 1.00%. Performance including a contingent deferred sales charge assumes the sales charge for the corresponding time period. Class R, Class R4, Class R6, and Administrator Class shares are sold without afront-end sales charge or contingent deferred sales charge.
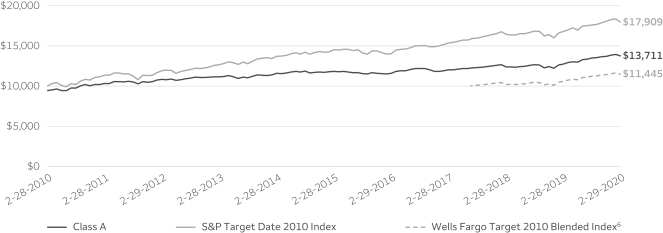
| Growth of $10,000 investment as of February 29, 20207 |
|
Please see footnotes on page 12.
10 | Target Date Retirement Funds
Table of Contents
Performance highlights (unaudited)
Target 2010 Fund (continued)
| Holdings (%) as of February 29, 20208 | ||||
Wells Fargo Bloomberg Barclays US Aggregateex-Corporate Portfolio | 35.28 | |||
Wells Fargo Investment Grade Corporate Bond Portfolio | 18.22 | |||
Wells Fargo Factor Enhanced Large Cap Portfolio | 13.59 | |||
Wells Fargo Strategic Retirement Bond Portfolio | 11.88 | |||
Wells Fargo Factor Enhanced International Portfolio | 7.30 | |||
Wells Fargo Factor Enhanced Small Cap Portfolio | 3.38 | |||
Wells Fargo Emerging Markets Bond Portfolio | 2.91 | |||
Wells Fargo High Yield Corporate Bond Portfolio | 2.86 | |||
Wells Fargo U.S. REIT Portfolio | 2.37 | |||
Wells Fargo Factor Enhanced Emerging Markets Portfolio | 2.21 | |||
| Volatility metrics as of February 29, 202010 | ||||||||||||
| Beta11 | Standard deviation12 | R-squared13 | ||||||||||
Class A | 0.80 | 3.95 | % | 0.91 | ||||||||
Class C | 0.79 | 3.93 | % | 0.90 | ||||||||
Class R | 0.79 | 3.92 | % | 0.90 | ||||||||
Class R4 | 0.79 | 3.90 | % | 0.90 | ||||||||
Class R6 | 0.79 | 3.90 | % | 0.90 | ||||||||
Administrator Class | 0.78 | 3.87 | % | 0.90 | ||||||||
| Portfolio allocation as of February 29, 20209 |
 |
Please see footnotes on page 12.
Target Date Retirement Funds | 11
Table of Contents
Performance highlights (unaudited)
Target 2010 Fund (continued)
| 1 | Reflects the expense ratios as stated in the most recent prospectuses, which include the impact of 0.13% of acquired fund fees and expenses representing the net expenses from the affiliated master portfolios. The expense ratios shown are subject to change and may differ from the annualized expense ratios shown in the financial highlights of this report. |
| 2 | The manager has contractually committed through June 30, 2020, to waive fees and/or reimburse expenses to the extent necessary to cap total annual fund operating expenses after fee waivers at 0.65% for Class A, 1.40% for Class C, 0.90% for Class R, 0.34% for Class R4, 0.19% for Class R6, and 0.54% for Administrator Class. Brokerage commissions, stamp duty fees, interest, taxes, acquired fund fees and expenses (if any) from funds in which the affiliated master portfolios invest and from money market funds, and extraordinary expenses are excluded from the expense caps. All other acquired fund fees from the affiliated master portfolios are included in the expense caps. Prior to or after the commitment expiration date, the caps may be increased or the commitment to maintain the caps may be terminated only with the approval of the Board of Trustees. Without these caps, the Fund’s returns would have been lower. The expense ratio paid by an investor is the net expense ratio (the total annual fund operating expenses after fee waivers) as stated in the prospectuses. |
| 3 | Historical performance shown for the Class R shares prior to their inception reflects the performance of the Class A shares and has been adjusted to reflect the higher expenses applicable to the Class R shares. |
| 4 | Historical performance shown for the Class R4 shares prior to their inception reflects the performance of the Class R6 shares and has been adjusted to reflect the higher expenses applicable to the Class R4 shares. |
| 5 | The S&P Target Date Index is designed as a benchmark for multi-asset class portfolios with risk profiles that become more conservative over time, corresponding to the target retirement date. This index is representative of the investment opportunity available to investors for the target date horizon, with asset class exposures driven by a survey of available target date funds for that horizon. You cannot invest directly in an index. |
| 6 | Source: Wells Fargo Funds Management, LLC. The Wells Fargo Target Blended Index is designed as a benchmark for multi-asset class portfolios with risk profiles that become more conservative over time, each corresponding to the target retirement date. The index weightings among the major asset classes are adjusted annually. The inception date of the index is July 14, 2017. See Appendix I for additional information. You cannot invest directly in an index. |
| 7 | The chart compares the performance of Class A shares for the most recent ten years with the S&P Target Date 2010 Index and the Wells Fargo Target 2010 Blended Index. The chart assumes a hypothetical investment of $10,000 in Class A shares and reflects all operating expenses and assumes the maximum initial sales charge of 5.75%. |
| 8 | Holdings, excluding cash, cash equivalents and any money market funds, are calculated based on the value of the investments divided by total net assets of the Fund. Holdings are subject to change and may have changed since the date specified. |
| 9 | Amounts are calculated based on the total long-term investments of the Fund. These amounts are subject to change and may have changed since the date specified. |
| 10 | These metrics show the degree and timing of the Fund’s fluctuations compared to S&P Target Date 2010 Index over 36 months. |
| 11 | Beta measures fund volatility relative to general market movements. It is a standardized measure of systematic risk in comparison with a specified index. The benchmark beta is 1.00 by definition. Beta is based on historical performance and does not represent future results. |
| 12 | Standard deviation is the square root of the sum of squared deviations from the mean. It is often used as a measure of volatility, variability, or risk. Standard deviation is based on historical performance and does not represent future results. |
| 13 | R-squared (R2) is a statistical measure that reflects the percentage of a fund’s movements that can be explained by movements in its benchmark index. The measure ranges from 0.0, which means that the fund’s performance bears no relationship to the performance of the index, to 1.0, which means that the fund’s performance was perfectly synchronized with the performance of the benchmark. R2 is based on historical performance and does not represent future results. |
12 | Target Date Retirement Funds
Table of Contents
Performance highlights (unaudited)
Average annual total returns (%) as of February 29, 2020
| Including sales charge | Excluding sales charge | Expense ratios1 (%) | ||||||||||||||||||||||||||||||||
| Inception date | 1 year | 5 year | 10 year | 1 year | 5 year | 10 year | Gross | Net2 | ||||||||||||||||||||||||||
| Class A (WFACX)3 | 11-30-2012 | 1.01 | 2.11 | 3.87 | 7.18 | 3.31 | 4.48 | 0.89 | 0.65 | |||||||||||||||||||||||||
| Class R (WFBRX)4 | 6-28-2013 | – | – | – | 6.80 | 3.05 | 4.22 | 1.14 | 0.90 | |||||||||||||||||||||||||
| Class R4 (WFSRX)5 | 11-30-2012 | – | – | – | 7.57 | 3.64 | 4.83 | 0.61 | 0.34 | |||||||||||||||||||||||||
| Class R6 (WFSCX) | 6-29-2007 | – | – | – | 7.74 | 3.80 | 4.94 | 0.46 | 0.19 | |||||||||||||||||||||||||
| Administrator Class (WFFFX) | 6-29-2007 | – | – | – | 7.20 | 3.45 | 4.58 | 0.81 | 0.54 | |||||||||||||||||||||||||
| S&P Target Date 2015 Index6 | – | – | – | – | 6.33 | 4.58 | 6.66 | – | – | |||||||||||||||||||||||||
| Wells Fargo Target 2015 Blended Index7 | – | – | – | – | 7.60 | – | – | – | – | |||||||||||||||||||||||||
Figures quoted represent past performance, which is no guarantee of future results, and do not reflect taxes that a shareholder may pay on an investment in a fund. Investment return and principal value of an investment will fluctuate so that an investor’s shares, when redeemed, may be worth more or less than their original cost. Performance shown without sales charges would be lower if sales charges were reflected. Current performance may be lower or higher than the performance data quoted and assumes the reinvestment of dividends and capital gains. Currentmonth-end performance is available on the Fund’s website,wfam.com.
Index returns do not include transaction costs associated with buying and selling securities, any mutual fund fees or expenses, or any taxes. It is not possible to invest directly in an index.
For Class A shares, the maximumfront-end sales charge is 5.75%. Class R, Class R4, Class R6, and Administrator Class shares are sold without afront-end sales charge or contingent deferred sales charge.
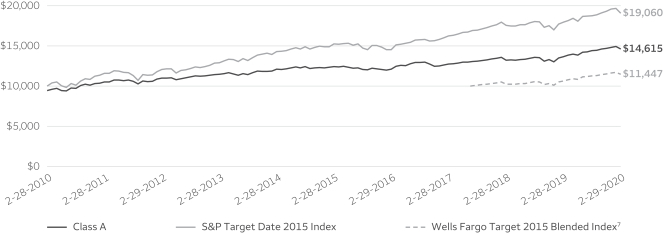
| Growth of $10,000 investment as of February 29, 20208 |
|
Please see footnotes on page 15.
Target Date Retirement Funds | 13
Table of Contents
Performance highlights (unaudited)
Target 2015 Fund (continued)
| Holdings (%) as of February 29, 20209 | ||||
Wells Fargo Bloomberg Barclays US Aggregateex-Corporate Portfolio | 33.26 | |||
Wells Fargo Investment Grade Corporate Bond Portfolio | 17.17 | |||
Wells Fargo Factor Enhanced Large Cap Portfolio | 15.85 | |||
Wells Fargo Strategic Retirement Bond Portfolio | 11.20 | |||
Wells Fargo Factor Enhanced International Portfolio | 8.44 | |||
Wells Fargo Factor Enhanced Small Cap Portfolio | 3.94 | |||
Wells Fargo U.S. REIT Portfolio | 2.80 | |||
Wells Fargo Emerging Markets Bond Portfolio | 2.74 | |||
Wells Fargo High Yield Corporate Bond Portfolio | 2.69 | |||
Wells Fargo Factor Enhanced Emerging Markets Portfolio | 2.56 | |||
| Volatility metrics as of February 29, 202011 | ||||||||||||
| Beta12 | Standard deviation13 | R-squared14 | ||||||||||
Class A | 0.78 | 4.42 | % | 0.92 | ||||||||
Class R | 0.78 | 4.42 | % | 0.92 | ||||||||
Class R4 | 0.78 | 4.43 | % | 0.92 | ||||||||
Class R6 | 0.77 | 4.38 | % | 0.92 | ||||||||
Administrator Class | 0.78 | 4.41 | % | 0.92 | ||||||||
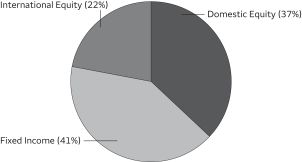
| Portfolio allocation as of February 29, 202010 |
 |
Please see footnotes on page 15.
14 | Target Date Retirement Funds
Table of Contents
Performance highlights (unaudited)
Target 2015 Fund (continued)
| 1 | Reflects the expense ratios as stated in the most recent prospectuses, which include the impact of 0.14% of acquired fund fees and expenses representing the net expenses from the affiliated master portfolios. The expense ratios shown are subject to change and may differ from the annualized expense ratios shown in the financial highlights of this report. |
| 2 | The manager has contractually committed through June 30, 2020, to waive fees and/or reimburse expenses to the extent necessary to cap total annual fund operating expenses after fee waivers at 0.65% for Class A, 0.90% for Class R, 0.34% for Class R4, 0.19% for Class R6, and 0.54% for Administrator Class. Brokerage commissions, stamp duty fees, interest, taxes, acquired fund fees and expenses (if any) from funds in which the affiliated master portfolios invest and from money market funds, and extraordinary expenses are excluded from the expense caps. All other acquired fund fees from the affiliated master portfolios are included in the expense caps. Prior to or after the commitment expiration date, the caps may be increased or the commitment to maintain the caps may be terminated only with the approval of the Board of Trustees. Without these caps, the Fund’s returns would have been lower. The expense ratio paid by an investor is the net expense ratio (the total annual fund operating expenses after fee waivers) as stated in the prospectuses. |
| 3 | Historical performance shown for the Class A shares prior to their inception reflects the performance of the Class R6 shares and has been adjusted to reflect the higher expenses applicable to the Class A shares. |
| 4 | Historical performance shown for the Class R shares prior to their inception reflects the performance of the Class A shares and has been adjusted to reflect the higher expenses applicable to the Class R shares. |
| 5 | Historical performance shown for the Class R4 shares prior to their inception reflects the performance of the Class R6 shares and has been adjusted to reflect the higher expenses applicable to the Class R4 shares. |
| 6 | The S&P Target Date Index is designed as a benchmark for multi-asset class portfolios with risk profiles that become more conservative over time, corresponding to the target retirement date. This index is representative of the investment opportunity available to investors for the target date horizon, with asset class exposures driven by a survey of available target date funds for that horizon. You cannot invest directly in an index. |
| 7 | Source: Wells Fargo Funds Management, LLC. The Wells Fargo Target Blended Index is designed as a benchmark for multi-asset class portfolios with risk profiles that become more conservative over time, each corresponding to the target retirement date. The index weightings among the major asset classes are adjusted annually. The inception date of the index is July 14, 2017. See Appendix I for additional information. You cannot invest directly in an index. |
| 8 | The chart compares the performance of Class A shares for the most recent ten years with the S&P Target Date 2015 Index and the Wells Fargo Target 2015 Blended Index. The chart assumes a hypothetical investment of $10,000 in Class A shares and reflects all operating expenses and assumes the maximum initial sales charge of 5.75%. |
| 9 | Holdings, excluding cash, cash equivalents and any money market funds, are calculated based on the value of the investments divided by total net assets of the Fund. Holdings are subject to change and may have changed since the date specified. |
| 10 | Amounts are calculated based on the total long-term investments of the Fund. These amounts are subject to change and may have changed since the date specified. |
| 11 | These metrics show the degree and timing of the Fund’s fluctuations compared to S&P Target Date 2015 Index over 36 months. |
| 12 | Beta measures fund volatility relative to general market movements. It is a standardized measure of systematic risk in comparison with a specified index. The benchmark beta is 1.00 by definition. Beta is based on historical performance and does not represent future results. |
| 13 | Standard deviation is the square root of the sum of squared deviations from the mean. It is often used as a measure of volatility, variability, or risk. Standard deviation is based on historical performance and does not represent future results. |
| 14 | R-squared (R2) is a statistical measure that reflects the percentage of a fund’s movements that can be explained by movements in its benchmark index. The measure ranges from 0.0, which means that the fund’s performance bears no relationship to the performance of the index, to 1.0, which means that the fund’s performance was perfectly synchronized with the performance of the benchmark. R2 is based on historical performance and does not represent future results. |
Target Date Retirement Funds | 15
Table of Contents
Performance highlights (unaudited)
Average annual total returns (%) as of February 29, 2020
| Including sales charge | Excluding sales charge | Expense ratios1 (%) | ||||||||||||||||||||||||||||||||
| Inception date | 1 year | 5 year | 10 year | 1 year | 5 year | 10 year | Gross | Net2 | ||||||||||||||||||||||||||
| Class A (STTRX) | 3-1-1994 | 0.40 | 2.44 | 4.57 | 6.53 | 3.66 | 5.20 | 0.75 | 0.65 | |||||||||||||||||||||||||
| Class C (WFLAX) | 12-1-1998 | 4.79 | 2.90 | 4.42 | 5.79 | 2.90 | 4.42 | 1.50 | 1.40 | |||||||||||||||||||||||||
| Class R (WFURX)3 | 6-28-2013 | – | – | – | 6.32 | 3.43 | 5.01 | 1.00 | 0.90 | |||||||||||||||||||||||||
| Class R4 (WFLRX)4 | 11-30-2012 | – | – | – | 6.90 | * | 4.00 | 5.61 | 0.47 | 0.34 | ||||||||||||||||||||||||
| Class R6 (WFOBX) | 6-30-2004 | – | – | – | 7.06 | 4.15 | 5.72 | 0.32 | 0.19 | |||||||||||||||||||||||||
| Administrator Class (WFLPX) | 11-08-1999 | – | – | – | 6.73 | 3.77 | 5.34 | 0.67 | 0.54 | |||||||||||||||||||||||||
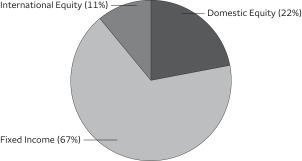
| S&P Target Date 2020 Index5 | – | – | – | – | 6.06 | 4.86 | 7.24 | – | – | |||||||||||||||||||||||||
| Wells Fargo Target 2020 Blended Index6 | – | – | – | – | 7.05 | – | – | – | – | |||||||||||||||||||||||||
| * | Total return differs from the return in the Financial Highlights in this report. The total return presented is calculated based on the NAV at which the shareholder transactions were processed. The NAV and total return presented in the Financial Highlights reflects certain adjustments made to the net assets of the Fund that are necessary under U.S. generally accepted accounting principles. |
Figures quoted represent past performance, which is no guarantee of future results, and do not reflect taxes that a shareholder may pay on an investment in a fund. Investment return and principal value of an investment will fluctuate so that an investor’s shares, when redeemed, may be worth more or less than their original cost. Performance shown without sales charges would be lower if sales charges were reflected. Current performance may be lower or higher than the performance data quoted and assumes the reinvestment of dividends and capital gains. Currentmonth-end performance is available on the Fund’s website,wfam.com.
Index returns do not include transaction costs associated with buying and selling securities, any mutual fund fees or expenses, or any taxes. It is not possible to invest directly in an index.
For Class A shares, the maximumfront-end sales charge is 5.75%. For Class C shares, the maximum contingent deferred sales charge is 1.00%. Performance including a contingent deferred sales charge assumes the sales charge for the corresponding time period. Class R, Class R4, Class R6, and Administrator Class shares are sold without afront-end sales charge or contingent deferred sales charge.
| Growth of $10,000 investment as of February 29, 20207 |
|
Please see footnotes on page 18.
16 | Target Date Retirement Funds
Table of Contents
Performance highlights (unaudited)
Target 2020 Fund (continued)
| Holdings (%) as of February 29, 20208 | ||||
Wells Fargo Bloomberg Barclays US Aggregateex-Corporate Portfolio | 30.63 | |||
Wells Fargo Factor Enhanced Large Cap Portfolio | 18.69 | |||
Wells Fargo Investment Grade Corporate Bond Portfolio | 15.80 | |||
Wells Fargo Factor Enhanced International Portfolio | 10.00 | |||
Wells Fargo Strategic Retirement Bond Portfolio | 9.48 | |||
Wells Fargo Factor Enhanced Small Cap Portfolio | 4.69 | |||
Wells Fargo Factor Enhanced Emerging Markets Portfolio | 3.04 | |||
Wells Fargo U.S. REIT Portfolio | 2.93 | |||
Wells Fargo Emerging Markets Bond Portfolio | 2.52 | |||
Wells Fargo High Yield Corporate Bond Portfolio | 2.48 | |||
| Volatility metrics as of February 29, 202010 | ||||||||||||
| Beta11 | Standard deviation12 | R-squared13 | ||||||||||
Class A | 0.83 | 5.20 | % | 0.95 | ||||||||
Class C | 0.83 | 5.20 | % | 0.95 | ||||||||
Class R | 0.81 | 5.13 | % | 0.95 | ||||||||
Class R4 | 0.82 | 5.16 | % | 0.95 | ||||||||
Class R6 | 0.82 | 5.17 | % | 0.95 | ||||||||
Administrator Class | 0.82 | 5.18 | % | 0.95 | ||||||||
| Portfolio allocation as of February 29, 20209 |
 |
Please see footnotes on page 18.
Target Date Retirement Funds | 17
Table of Contents
Performance highlights (unaudited)
Target 2020 Fund (continued)
| 1 | Reflects the expense ratios as stated in the most recent prospectuses, which include the impact of 0.14% of acquired fund fees and expenses representing the net expenses from the affiliated master portfolios. The expense ratios shown are subject to change and may differ from the annualized expense ratios shown in the financial highlights of this report. |
| 2 | The manager has contractually committed through June 30, 2020, to waive fees and/or reimburse expenses to the extent necessary to cap total annual fund operating expenses after fee waivers at 0.65% for Class A, 1.40% for Class C, 0.90% for Class R, 0.34% for Class R4, 0.19% for Class R6, and 0.54% for Administrator Class. Brokerage commissions, stamp duty fees, interest, taxes, acquired fund fees and expenses (if any) from funds in which the affiliated master portfolios invest and from money market funds, and extraordinary expenses are excluded from the expense caps. All other acquired fund fees from the affiliated master portfolios are included in the expense caps. Prior to or after the commitment expiration date, the caps may be increased or the commitment to maintain the caps may be terminated only with the approval of the Board of Trustees. Without these caps, the Fund’s returns would have been lower. The expense ratio paid by an investor is the net expense ratio (the total annual fund operating expenses after fee waivers) as stated in the prospectuses. |
| 3 | Historical performance shown for the Class R shares prior to their inception reflects the performance of the Class A shares and has been adjusted to reflect the higher expenses applicable to the Class R shares. |
| 4 | Historical performance shown for the Class R4 shares prior to their inception reflects the performance of the Class R6 shares and has been adjusted to reflect the higher expenses applicable to the Class R4 shares. |
| 5 | The S&P Target Date Index is designed as a benchmark for multi-asset class portfolios with risk profiles that become more conservative over time, corresponding to the target retirement date. This index is representative of the investment opportunity available to investors for the target date horizon, with asset class exposures driven by a survey of available target date funds for that horizon. You cannot invest directly in an index. |
| 6 | Source: Wells Fargo Funds Management, LLC. The Wells Fargo Target Blended Index is designed as a benchmark for multi-asset class portfolios with risk profiles that become more conservative over time, each corresponding to the target retirement date. The index weightings among the major asset classes are adjusted annually. The inception date of the index is July 14, 2017. See Appendix I for additional information. You cannot invest directly in an index. |
| 7 | The chart compares the performance of Class A shares for the most recent ten years with the S&P Target Date 2020 Index and the Wells Fargo Target 2020 Blended Index. The chart assumes a hypothetical investment of $10,000 in Class A shares and reflects all operating expenses and assumes the maximum initial sales charge of 5.75%. |
| 8 | Holdings, excluding cash, cash equivalents and any money market funds, are calculated based on the value of the investments divided by total net assets of the Fund. Holdings are subject to change and may have changed since the date specified. |
| 9 | Amounts are calculated based on the total long-term investments of the Fund. These amounts are subject to change and may have changed since the date specified. |
| 10 | These metrics show the degree and timing of the Fund’s fluctuations compared to S&P Target Date 2020 Index over 36 months. |
| 11 | Beta measures fund volatility relative to general market movements. It is a standardized measure of systematic risk in comparison with a specified index. The benchmark beta is 1.00 by definition. Beta is based on historical performance and does not represent future results. |
| 12 | Standard deviation is the square root of the sum of squared deviations from the mean. It is often used as a measure of volatility, variability, or risk. Standard deviation is based on historical performance and does not represent future results. |
| 13 | R-squared (R2) is a statistical measure that reflects the percentage of a fund’s movements that can be explained by movements in its benchmark index. The measure ranges from 0.0, which means that the fund’s performance bears no relationship to the performance of the index, to 1.0, which means that the fund’s performance was perfectly synchronized with the performance of the benchmark. R2 is based on historical performance and does not represent future results. |
18 | Target Date Retirement Funds
Table of Contents
Performance highlights (unaudited)
Average annual total returns (%) as of February 29, 2020
| Including sales charge | Excluding sales charge | Expense ratios1 (%) | ||||||||||||||||||||||||||||||||
| Inception date | 1 year | 5 year | 10 year | 1 year | 5 year | 10 year | Gross | Net2 | ||||||||||||||||||||||||||
| Class A (WFAYX)3 | 11-30-2012 | -0.37 | 2.76 | 5.44 | 5.71 | 3.98 | 6.07 | 0.78 | 0.65 | |||||||||||||||||||||||||
| Class R (WFHRX)4 | 6-28-2013 | – | – | – | 5.37 | 3.56 | 5.71 | 1.03 | 0.90 | |||||||||||||||||||||||||
| Class R4 (WFGRX)5 | 11-30-2012 | – | – | – | 6.16 | 4.30 | 6.43 | 0.50 | 0.34 | |||||||||||||||||||||||||
| Class R6 (WFTYX) | 6-29-2007 | – | – | – | 6.15 | 4.48 | 6.54 | 0.35 | 0.19 | |||||||||||||||||||||||||
| Administrator Class (WFTRX) | 6-29-2007 | – | – | – | 5.88 | 4.13 | 6.18 | 0.70 | 0.54 | |||||||||||||||||||||||||
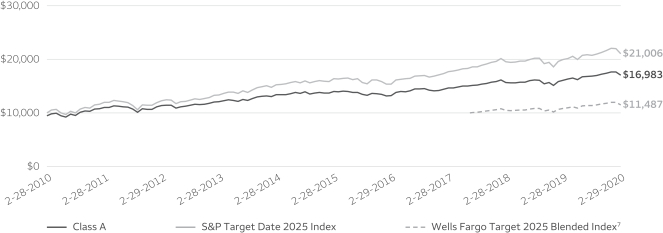
| S&P Target Date 2025 Index6 | – | – | – | – | 5.49 | 5.13 | 7.70 | – | – | |||||||||||||||||||||||||
| Wells Fargo Target 2025 Blended Index7 | – | – | – | – | 6.10 | – | – | – | – | |||||||||||||||||||||||||
Figures quoted represent past performance, which is no guarantee of future results, and do not reflect taxes that a shareholder may pay on an investment in a fund. Investment return and principal value of an investment will fluctuate so that an investor’s shares, when redeemed, may be worth more or less than their original cost. Performance shown without sales charges would be lower if sales charges were reflected. Current performance may be lower or higher than the performance data quoted and assumes the reinvestment of dividends and capital gains. Currentmonth-end performance is available on the Fund’s website,wfam.com.
Index returns do not include transaction costs associated with buying and selling securities, any mutual fund fees or expenses, or any taxes. It is not possible to invest directly in an index.
For Class A shares, the maximumfront-end sales charge is 5.75%. Class R, Class R4, Class R6, and Administrator Class shares are sold without afront-end sales charge or contingent deferred sales charge.
| Growth of $10,000 investment as of February 29, 20208 |
|
Please see footnotes on page 21.
Target Date Retirement Funds | 19
Table of Contents
Performance highlights (unaudited)
Target 2025 Fund (continued)
| Holdings (%) as of February 29, 20209 | ||||
Wells Fargo Bloomberg Barclays US Aggregateex-Corporate Portfolio | 27.49 | |||
Wells Fargo Factor Enhanced Large Cap Portfolio | 23.84 | |||
Wells Fargo Investment Grade Corporate Bond Portfolio | 14.24 | |||
Wells Fargo Factor Enhanced International Portfolio | 13.40 | |||
Wells Fargo Factor Enhanced Small Cap Portfolio | 5.96 | |||
Wells Fargo Strategic Retirement Bond Portfolio | 4.51 | |||
Wells Fargo Factor Enhanced Emerging Markets Portfolio | 4.07 | |||
Wells Fargo Emerging Markets Bond Portfolio | 2.26 | |||
Wells Fargo High Yield Corporate Bond Portfolio | 2.22 | |||
Wells Fargo U.S. REIT Portfolio | 2.09 | |||
| Volatility metrics as of February 29, 202011 | ||||||||||||
| Beta12 | Standard deviation13 | �� | R-squared14 | |||||||||
Class A | 0.83 | 6.18 | % | 0.97 | ||||||||
Class R | 0.84 | 6.27 | % | 0.96 | ||||||||
Class R4 | 0.82 | 6.13 | % | 0.97 | ||||||||
Class R6 | 0.85 | 6.33 | % | 0.97 | ||||||||
Administrator Class | 0.83 | 6.21 | % | 0.97 | ||||||||
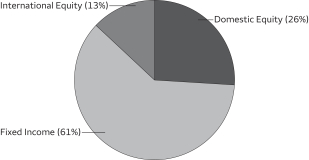
| Portfolio allocation as of February 29, 202010 |
 |
Please see footnotes on page 21.
20 | Target Date Retirement Funds
Table of Contents
Performance highlights (unaudited)
Target 2025 Fund (continued)
| 1 | Reflects the expense ratios as stated in the most recent prospectuses, which include the impact of 0.15% of acquired fund fees and expenses representing the net expenses from the affiliated master portfolios. The expense ratios shown are subject to change and may differ from the annualized expense ratios shown in the financial highlights of this report. |
| 2 | The manager has contractually committed through June 30, 2020, to waive fees and/or reimburse expenses to the extent necessary to cap total annual fund operating expenses after fee waivers at 0.65% for Class A, 0.90% for Class R, 0.34% for Class R4, 0.19% for Class R6, and 0.54% for Administrator Class. Brokerage commissions, stamp duty fees, interest, taxes, acquired fund fees and expenses (if any) from funds in which the affiliated master portfolios invest and from money market funds, and extraordinary expenses are excluded from the expense caps. All other acquired fund fees from the affiliated master portfolios are included in the expense caps. Prior to or after the commitment expiration date, the caps may be increased or the commitment to maintain the caps may be terminated only with the approval of the Board of Trustees. Without these caps, the Fund’s returns would have been lower. The expense ratio paid by an investor is the net expense ratio (the total annual fund operating expenses after fee waivers) as stated in the prospectuses. |
| 3 | Historical performance shown for the Class A shares prior to their inception reflects the performance of the Class R6 shares and has been adjusted to reflect the higher expenses applicable to the Class A shares. |
| 4 | Historical performance shown for the Class R shares prior to their inception reflects the performance of the Class A shares and has been adjusted to reflect the higher expenses applicable to the Class R shares. |
| 5 | Historical performance shown for the Class R4 shares prior to their inception reflects the performance of the Class R6 shares and has been adjusted to reflect the higher expenses applicable to the Class R4 shares. |
| 6 | The S&P Target Date Index is designed as a benchmark for multi-asset class portfolios with risk profiles that become more conservative over time, corresponding to the target retirement date. This index is representative of the investment opportunity available to investors for the target date horizon, with asset class exposures driven by a survey of available target date funds for that horizon. You cannot invest directly in an index. |
| 7 | Source: Wells Fargo Funds Management, LLC. The Wells Fargo Target Blended Index is designed as a benchmark for multi-asset class portfolios with risk profiles that become more conservative over time, each corresponding to the target retirement date. The index weightings among the major asset classes are adjusted annually. The inception date of the index is July 14, 2017. See Appendix I for additional information. You cannot invest directly in an index. |
| 8 | The chart compares the performance of Class A shares for the most recent ten years with the S&P Target Date 2025 Index and the Wells Fargo Target 2025 Blended Index. The chart assumes a hypothetical investment of $10,000 in Class A shares and reflects all operating expenses and assumes the maximum initial sales charge of 5.75%. |
| 9 | Holdings, excluding cash, cash equivalents and any money market funds, are calculated based on the value of the investments divided by total net assets of the Fund. Holdings are subject to change and may have changed since the date specified. |
| 10 | Amounts are calculated based on the total long-term investments of the Fund. These amounts are subject to change and may have changed since the date specified. |
| 11 | These metrics show the degree and timing of the Fund’s fluctuations compared to S&P Target Date 2025 Index over 36 months. |
| 12 | Beta measures fund volatility relative to general market movements. It is a standardized measure of systematic risk in comparison with a specified index. The benchmark beta is 1.00 by definition. Beta is based on historical performance and does not represent future results. |
| 13 | Standard deviation is the square root of the sum of squared deviations from the mean. It is often used as a measure of volatility, variability, or risk. Standard deviation is based on historical performance and does not represent future results. |
| 14 | R-squared (R2) is a statistical measure that reflects the percentage of a fund’s movements that can be explained by movements in its benchmark index. The measure ranges from 0.0, which means that the fund’s performance bears no relationship to the performance of the index, to 1.0, which means that the fund’s performance was perfectly synchronized with the performance of the benchmark. R2 is based on historical performance and does not represent future results. |
Target Date Retirement Funds | 21
Table of Contents
Performance highlights (unaudited)
Average annual total returns (%) as of February 29, 2020
| Including sales charge | Excluding sales charge | Expense ratios1 (%) | ||||||||||||||||||||||||||||||||
| Inception date | 1 year | 5 year | 10 year | 1 year | 5 year | 10 year | Gross | Net2 | ||||||||||||||||||||||||||
| Class A (STHRX) | 3-1-1994 | -1.27 | 3.08 | 6.15 | 4.72 | 4.32 | 6.77 | 0.76 | 0.65 | |||||||||||||||||||||||||
| Class C (WFDMX) | 12-1-1998 | 2.92 | 3.53 | 5.97 | 3.92 | 3.53 | 5.97 | 1.51 | 1.40 | |||||||||||||||||||||||||
| Class R (WFJRX)3 | 6-28-2013 | – | – | – | 4.48 | 4.04 | 6.56 | 1.01 | 0.90 | |||||||||||||||||||||||||
| Class R4 (WTHRX)4 | 11-30-2012 | – | – | – | 5.07 | 4.65 | 7.19 | 0.48 | 0.34 | |||||||||||||||||||||||||
| Class R6 (WFOOX) | 6-30-2004 | – | – | – | 5.15 | 4.79 | 7.29 | 0.33 | 0.19 | |||||||||||||||||||||||||
| Administrator Class (WFLIX) | 11-8-1999 | – | – | – | 4.86 | 4.44 | 6.92 | 0.68 | 0.54 | |||||||||||||||||||||||||
| S&P Target Date 2030 Index5 | – | – | – | – | 4.83 | 5.34 | 8.10 | – | – | |||||||||||||||||||||||||
| Wells Fargo Target 2030 Blended Index6 | – | – | – | – | 5.07 | – | – | – | – | |||||||||||||||||||||||||
Figures quoted represent past performance, which is no guarantee of future results, and do not reflect taxes that a shareholder may pay on an investment in a fund. Investment return and principal value of an investment will fluctuate so that an investor’s shares, when redeemed, may be worth more or less than their original cost. Performance shown without sales charges would be lower if sales charges were reflected. Current performance may be lower or higher than the performance data quoted and assumes the reinvestment of dividends and capital gains. Currentmonth-end performance is available on the Fund’s website,wfam.com.
Index returns do not include transaction costs associated with buying and selling securities, any mutual fund fees or expenses, or any taxes. It is not possible to invest directly in an index.
For Class A shares, the maximumfront-end sales charge is 5.75%. For Class C shares, the maximum contingent deferred sales charge is 1.00%. Performance including a contingent deferred sales charge assumes the sales charge for the corresponding time period. Class R, Class R4, Class R6, and Administrator Class shares are sold without afront-end sales charge or contingent deferred sales charge.
| Growth of $10,000 investment as of February 29, 20207 |
|
Please see footnotes on page 24.
22 | Target Date Retirement Funds
Table of Contents
Performance highlights (unaudited)
Target 2030 Fund (continued)
| Holdings (%) as of February 29, 20208 | ||||
Wells Fargo Factor Enhanced Large Cap Portfolio | 29.09 | |||
Wells Fargo Bloomberg Barclays US Aggregateex-Corporate Portfolio | 23.61 | |||
Wells Fargo Factor Enhanced International Portfolio | 17.06 | |||
Wells Fargo Investment Grade Corporate Bond Portfolio | 12.23 | |||
Wells Fargo Factor Enhanced Small Cap Portfolio | 7.26 | |||
Wells Fargo Factor Enhanced Emerging Markets Portfolio | 5.17 | |||
Wells Fargo Emerging Markets Bond Portfolio | 1.92 | |||
Wells Fargo High Yield Corporate Bond Portfolio | 1.90 | |||
Wells Fargo Strategic Retirement Bond Portfolio | 1.15 | |||
Wells Fargo U.S. REIT Portfolio | 0.76 | |||
| Volatility metrics as of February 29, 202010 | ||||||||||||
| Beta11 | Standard deviation12 | R-squared13 | ||||||||||
Class A | 0.85 | 7.40 | % | 0.98 | ||||||||
Class C | 0.85 | 7.38 | % | 0.98 | ||||||||
Class R | 0.85 | 7.41 | % | 0.98 | ||||||||
Class R4 | 0.85 | 7.36 | % | 0.98 | ||||||||
Class R6 | 0.85 | 7.41 | % | 0.98 | ||||||||
Administrator Class | 0.85 | 7.40 | % | 0.98 | ||||||||
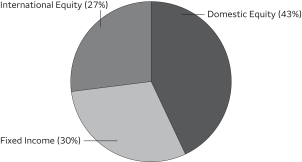
| Portfolio allocation as of February 29, 20209 |
 |
Please see footnotes on page 24.
Target Date Retirement Funds | 23
Table of Contents
Performance highlights (unaudited)
Target 2030 Fund (continued)
| 1 | Reflects the expense ratios as stated in the most recent prospectuses, which include the impact of 0.15% of acquired fund fees and expenses represeningt the net expenses from the affiliated master portfolios. The expense ratios shown are subject to change and may differ from the annualized expense ratios shown in the financial highlights of this report. |
| 2 | The manager has contractually committed through June 30, 2020, to waive fees and/or reimburse expenses to the extent necessary to cap total annual fund operating expenses after fee waivers at 0.65% for Class A, 1.40% for Class C, 0.90% for Class R, 0.34% for Class R4, 0.19% for Class R6, and 0.54% for Administrator Class. Brokerage commissions, stamp duty fees, interest, taxes, acquired fund fees and expenses (if any) from funds in which the affiliated master portfolios invest and from money market funds, and extraordinary expenses are excluded from the expense caps. All other acquired fund fees from the affiliated master portfolios are included in the expense caps. Prior to or after the commitment expiration date, the caps may be increased or the commitment to maintain the caps may be terminated only with the approval of the Board of Trustees. Without these caps, the Fund’s returns would have been lower. The expense ratio paid by an investor is the net expense ratio (the total annual fund operating expenses after fee waivers) as stated in the prospectuses. |
| 3 | Historical performance shown for the Class R shares prior to their inception reflects the performance of the Class A shares and has been adjusted to reflect the higher expenses applicable to the Class R shares. |
| 4 | Historical performance shown for the Class R4 shares prior to their inception reflects the performance of the Class R6 shares and has been adjusted to reflect the higher expenses applicable to the Class R4 shares. |
| 5 | The S&P Target Date Index is designed as a benchmark for multi-asset class portfolios with risk profiles that become more conservative over time, corresponding to the target retirement date. This index is representative of the investment opportunity available to investors for the target date horizon, with asset class exposures driven by a survey of available target date funds for that horizon. You cannot invest directly in an index. |
| 6 | Source: Wells Fargo Funds Management, LLC. The Wells Fargo Target Blended Index is designed as a benchmark for multi-asset class portfolios with risk profiles that become more conservative over time, each corresponding to the target retirement date. The index weightings among the major asset classes are adjusted annually. The inception date of the index is July 14, 2017. See Appendix I for additional information. You cannot invest directly in an index. |
| 7 | The chart compares the performance of Class A shares for the most recent ten years with the S&P Target Date 2030 Index and the Wells Fargo Target 2030 Blended Index. The chart assumes a hypothetical investment of $10,000 in Class A shares and reflects all operating expenses and assumes the maximum initial sales charge of 5.75%. |
| 8 | Holdings, excluding cash, cash equivalents and any money market funds, are calculated based on the value of the investments divided by total net assets of the Fund. Holdings are subject to change and may have changed since the date specified. |
| 9 | Amounts are calculated based on the total long-term investments of the Fund. These amounts are subject to change and may have changed since the date specified. |
| 10 | These metrics show the degree and timing of the Fund’s fluctuations compared to S&P Target Date 2030 Index over 36 months. |
| 11 | Beta measures fund volatility relative to general market movements. It is a standardized measure of systematic risk in comparison with a specified index. The benchmark beta is 1.00 by definition. Beta is based on historical performance and does not represent future results. |
| 12 | Standard deviation is the square root of the sum of squared deviations from the mean. It is often used as a measure of volatility, variability, or risk. Standard deviation is based on historical performance and does not represent future results. |
| 13 | R-squared (R2) is a statistical measure that reflects the percentage of a fund’s movements that can be explained by movements in its benchmark index. The measure ranges from 0.0, which means that the fund’s performance bears no relationship to the performance of the index, to 1.0, which means that the fund’s performance was perfectly synchronized with the performance of the benchmark. R2 is based on historical performance and does not represent future results. |
24 | Target Date Retirement Funds
Table of Contents
Performance highlights (unaudited)
Average annual total returns (%) as of February 29, 2020
| Including sales charge | Excluding sales charge | Expense ratios1 (%) | ||||||||||||||||||||||||||||||||
| Inception date | 1 year | 5 year | 10 year | 1 year | 5 year | 10 year | Gross | Net2 | ||||||||||||||||||||||||||
| Class A (WFQBX)3 | 11-30-2012 | -2.26 | 3.28 | 6.78 | 3.70 | 4.51 | 7.41 | 0.80 | 0.65 | |||||||||||||||||||||||||
| Class R (WFKRX)4 | 6-28-2013 | – | – | – | 3.46 | 4.24 | 7.14 | 1.05 | 0.90 | |||||||||||||||||||||||||
| Class R4 (WTTRX)5 | 11-30-2012 | – | – | – | 3.99 | 4.84 | 7.76 | 0.52 | 0.34 | |||||||||||||||||||||||||
| Class R6 (WFQRX) | 6-29-2007 | – | – | – | 4.16 | 4.99 | 7.87 | 0.37 | 0.19 | |||||||||||||||||||||||||
| Administrator Class (WFQWX) | 6-29-2007 | – | – | – | 3.75 | 4.61 | 7.49 | 0.72 | 0.54 | |||||||||||||||||||||||||
| S&P Target Date 2035 Index6 | – | – | – | – | 4.15 | 5.52 | 8.44 | – | – | |||||||||||||||||||||||||
| Wells Fargo Target 2035 Blended Index7 | – | – | – | – | 3.93 | – | – | – | – | |||||||||||||||||||||||||
Figures quoted represent past performance, which is no guarantee of future results, and do not reflect taxes that a shareholder may pay on an investment in a fund. Investment return and principal value of an investment will fluctuate so that an investor’s shares, when redeemed, may be worth more or less than their original cost. Performance shown without sales charges would be lower if sales charges were reflected. Current performance may be lower or higher than the performance data quoted and assumes the reinvestment of dividends and capital gains. Currentmonth-end performance is available on the Fund’s website,wfam.com.
Index returns do not include transaction costs associated with buying and selling securities, any mutual fund fees or expenses, or any taxes. It is not possible to invest directly in an index.
For Class A shares, the maximumfront-end sales charge is 5.75%. Class R, Class R4, Class R6, and Administrator Class shares are sold without afront-end sales charge or contingent deferred sales charge.
| Growth of $10,000 investment as of February 29, 20208 |
|

Please see footnotes on page 27.
Target Date Retirement Funds | 25
Table of Contents
Performance highlights (unaudited)
Target 2035 Fund (continued)
| Holdings (%) as of February 29, 20209 | ||||
Wells Fargo Factor Enhanced Large Cap Portfolio | 34.13 | |||
Wells Fargo Factor Enhanced International Portfolio | 20.86 | |||
Wells Fargo Bloomberg Barclays US Aggregateex-Corporate Portfolio | 18.05 | |||
Wells Fargo Investment Grade Corporate Bond Portfolio | 9.34 | |||
Wells Fargo Factor Enhanced Small Cap Portfolio | 8.53 | |||
Wells Fargo Factor Enhanced Emerging Markets Portfolio | 6.28 | |||
Wells Fargo Emerging Markets Bond Portfolio | 1.49 | |||
Wells Fargo High Yield Corporate Bond Portfolio | 1.46 | |||
| Volatility metrics as of February 29, 202011 | ||||||||||||
| Beta12 | Standard deviation13 | R-squared14 | ||||||||||
Class A | 0.86 | 8.50 | % | 0.98 | ||||||||
Class R | 0.86 | 8.48 | % | 0.98 | ||||||||
Class R4 | 0.87 | 8.60 | % | 0.98 | ||||||||
Class R6 | 0.86 | 8.52 | % | 0.98 | ||||||||
Administrator Class | 0.87 | 8.55 | % | 0.98 | ||||||||
| Portfolio allocation as of February 29, 202010 |
 |
Please see footnotes on page 27.
26 | Target Date Retirement Funds
Table of Contents
Performance highlights (unaudited)
Target 2035 Fund (continued)
| 1 | Reflects the expense ratios as stated in the most recent prospectuses, which include the impact of 0.16% of acquired fund fees and expenses representing the net expenses from the affiliated master portfolios. The expense ratios shown are subject to change and may differ from the annualized expense ratios shown in the financial highlights of this report. |
| 2 | The manager has contractually committed through June 30, 2020, to waive fees and/or reimburse expenses to the extent necessary to cap total annual fund operating expenses after fee waivers at 0.65% for Class A, 0.90% for Class R, 0.34% for Class R4, 0.19% for Class R6, and 0.54% for Administrator Class. Brokerage commissions, stamp duty fees, interest, taxes, acquired fund fees and expenses (if any) from funds in which the affiliated master portfolios invest and from money market funds, and extraordinary expenses are excluded from the expense caps. All other acquired fund fees from the affiliated master portfolios are included in the expense caps. Prior to or after the commitment expiration date, the caps may be increased or the commitment to maintain the caps may be terminated only with the approval of the Board of Trustees. Without these caps, the Fund’s returns would have been lower. The expense ratio paid by an investor is the net expense ratio (the total annual fund operating expenses after fee waivers) as stated in the prospectuses. |
| 3 | Historical performance shown for the Class A shares prior to their inception reflects the performance of the Class R6 shares and has been adjusted to reflect the higher expenses applicable to the Class A shares. |
| 4 | Historical performance shown for the Class R shares prior to their inception reflects the performance of the Class A shares and has been adjusted to reflect the higher expenses applicable to the Class R shares. |
| 5 | Historical performance shown for the Class R4 shares prior to their inception reflects the performance of the Class R6 shares and has been adjusted to reflect the higher expenses applicable to the Class R4 shares. |
| 6 | The S&P Target Date Index is designed as a benchmark for multi-asset class portfolios with risk profiles that become more conservative over time, corresponding to the target retirement date. This index is representative of the investment opportunity available to investors for the target date horizon, with asset class exposures driven by a survey of available target date funds for that horizon. You cannot invest directly in an index. |
| 7 | Source: Wells Fargo Funds Management, LLC. The Wells Fargo Target Blended Index is designed as a benchmark for multi-asset class portfolios with risk profiles that become more conservative over time, each corresponding to the target retirement date. The index weightings among the major asset classes are adjusted annually. The inception date of the index is July 14, 2017. See Appendix I for additional information. You cannot invest directly in an index. |
| 8 | The chart compares the performance of Class A shares for the most recent ten years with the S&P Target Date 2035 Index and the Wells Fargo Target 2035 Blended Index. The chart assumes a hypothetical investment of $10,000 in Class A shares and reflects all operating expenses and assumes the maximum initial sales charge of 5.75%. |
| 9 | Holdings, excluding cash, cash equivalents and any money market funds, are calculated based on the value of the investments divided by total net assets of the Fund. Holdings are subject to change and may have changed since the date specified. |
| 10 | Amounts are calculated based on the total long-term investments of the Fund. These amounts are subject to change and may have changed since the date specified. |
| 11 | These metrics show the degree and timing of the Fund’s fluctuations compared to S&P Target Date 2035 Index over 36 months. |
| 12 | Beta measures fund volatility relative to general market movements. It is a standardized measure of systematic risk in comparison with a specified index. The benchmark beta is 1.00 by definition. Beta is based on historical performance and does not represent future results. |
| 13 | Standard deviation is the square root of the sum of squared deviations from the mean. It is often used as a measure of volatility, variability, or risk. Standard deviation is based on historical performance and does not represent future results. |
| 14 | R-squared (R2) is a statistical measure that reflects the percentage of a fund’s movements that can be explained by movements in its benchmark index. The measure ranges from 0.0, which means that the fund’s performance bears no relationship to the performance of the index, to 1.0, which means that the fund’s performance was perfectly synchronized with the performance of the benchmark. R2 is based on historical performance and does not represent future results. |
Target Date Retirement Funds | 27
Table of Contents
Performance highlights (unaudited)
Average annual total returns (%) as of February 29, 2020
| Including sales charge | Excluding sales charge | Expense ratios1 (%) | ||||||||||||||||||||||||||||||||
| Inception date | 1 year | 5 year | 10 year | 1 year | 5 year | 10 year | Gross | Net2 | ||||||||||||||||||||||||||
| Class A (STFRX) | 3-1-1994 | -3.23 | 3.37 | 7.13 | 2.68 | 4.60 | 7.76 | 0.78 | 0.65 | |||||||||||||||||||||||||
| Class C (WFOFX) | 7-1-1998 | 0.87 | 3.81 | 6.95 | 1.87 | 3.81 | 6.95 | 1.53 | 1.40 | |||||||||||||||||||||||||
| Class R (WFMRX)3 | 6-28-2013 | – | – | – | 2.44 | 4.35 | 7.56 | 1.03 | 0.90 | |||||||||||||||||||||||||
| Class R4 (WTFRX)4 | 11-30-2012 | – | – | – | 2.94 | 4.93 | 8.17 | 0.50 | 0.34 | |||||||||||||||||||||||||
| Class R6 (WFOSX) | 6-30-2004 | – | – | – | 3.09 | 5.07 | 8.28 | 0.35 | 0.19 | |||||||||||||||||||||||||
| Administrator Class (WFLWX) | 11-8-1999 | – | – | – | 2.82 | 4.72 | 7.91 | 0.70 | 0.54 | |||||||||||||||||||||||||
| S&P Target Date 2040 Index5 | – | – | – | – | 3.70 | 5.65 | 8.68 | – | – | |||||||||||||||||||||||||
| Wells Fargo Target 2040 Blended Index6 | – | – | – | – | 2.90 | – | – | – | – | |||||||||||||||||||||||||
Figures quoted represent past performance, which is no guarantee of future results, and do not reflect taxes that a shareholder may pay on an investment in a fund. Investment return and principal value of an investment will fluctuate so that an investor’s shares, when redeemed, may be worth more or less than their original cost. Performance shown without sales charges would be lower if sales charges were reflected. Current performance may be lower or higher than the performance data quoted and assumes the reinvestment of dividends and capital gains. Currentmonth-end performance is available on the Fund’s website,wfam.com.
Index returns do not include transaction costs associated with buying and selling securities, any mutual fund fees or expenses, or any taxes. It is not possible to invest directly in an index.
For Class A shares, the maximumfront-end sales charge is 5.75%. For Class C shares, the maximum contingent deferred sales charge is 1.00%. Performance including a contingent deferred sales charge assumes the sales charge for the corresponding time period. Class R, Class R4, Class R6, and Administrator Class shares are sold without afront-end sales charge or contingent deferred sales charge.
| Growth of $10,000 investment as of February 29, 20207 |
|

Please see footnotes on page 30.
28 | Target Date Retirement Funds
Table of Contents
Performance highlights (unaudited)
Target 2040 Fund (continued)
| Holdings (%) as of February 29, 20208 | ||||
Wells Fargo Factor Enhanced Large Cap Portfolio | 38.24 | |||
Wells Fargo Factor Enhanced International Portfolio | 24.19 | |||
Wells Fargo Bloomberg Barclays US Aggregateex-Corporate Portfolio | 12.33 | |||
Wells Fargo Factor Enhanced Small Cap Portfolio | 9.52 | |||
Wells Fargo Factor Enhanced Emerging Markets Portfolio | 7.34 | |||
Wells Fargo Investment Grade Corporate Bond Portfolio | 6.39 | |||
Wells Fargo Emerging Markets Bond Portfolio | 1.01 | |||
Wells Fargo High Yield Corporate Bond Portfolio | 1.00 | |||
| Volatility metrics as of February 29, 202010 | ||||||||||||
| Beta11 | Standard deviation12 | R-squared13 | ||||||||||
Class A | 0.89 | 9.42 | % | 0.99 | ||||||||
Class C | 0.89 | 9.43 | % | 0.99 | ||||||||
Class R | 0.89 | 9.40 | % | 0.99 | ||||||||
Class R4 | 0.89 | 9.41 | % | 0.98 | ||||||||
Class R6 | 0.89 | 9.39 | % | 0.99 | ||||||||
Administrator Class | 0.89 | 9.39 | % | 0.99 | ||||||||
| Portfolio allocation as of February 29, 20209 |
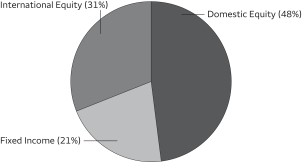 |
Please see footnotes on page 30.
Target Date Retirement Funds | 29
Table of Contents
Performance highlights (unaudited)
Target 2040 Fund (continued)
| 1 | Reflects the expense ratios as stated in the most recent prospectuses, which include the impact of 0.17% of acquired fund fees and expenses representing the net expenses from the affiliated master portfolios. The expense ratios shown are subject to change and may differ from the annualized expense ratios shown in the financial highlights of this report. |
| 2 | The manager has contractually committed through June 30, 2020, to waive fees and/or reimburse expenses to the extent necessary to cap total annual fund operating expenses after fee waivers at 0.65% for Class A, 1.40% for Class C, 0.90% for Class R, 0.34% for Class R4, 0.19% for Class R6, and 0.54% for Administrator Class. Brokerage commissions, stamp duty fees, interest, taxes, acquired fund fees and expenses (if any) from funds in which the affiliated master portfolios invest and from money market funds, and extraordinary expenses are excluded from the expense caps. All other acquired fund fees from the affiliated master portfolios are included in the expense caps. Prior to or after the commitment expiration date, the caps may be increased or the commitment to maintain the caps may be terminated only with the approval of the Board of Trustees. Without these caps, the Fund’s returns would have been lower. The expense ratio paid by an investor is the net expense ratio (the total annual fund operating expenses after fee waivers) as stated in the prospectuses. |
| 3 | Historical performance shown for the Class R shares prior to their inception reflects the performance of the Class A shares and has been adjusted to reflect the higher expenses applicable to the Class R shares. |
| 4 | Historical performance shown for the Class R4 shares prior to their inception reflects the performance of the Class R6 shares and has been adjusted to reflect the higher expenses applicable to the Class R4 shares. |
| 5 | The S&P Target Date Index is designed as a benchmark for multi-asset class portfolios with risk profiles that become more conservative over time, corresponding to the target retirement date. This index is representative of the investment opportunity available to investors for the target date horizon, with asset class exposures driven by a survey of available target date funds for that horizon. You cannot invest directly in an index. |
| 6 | Source: Wells Fargo Funds Management, LLC. The Wells Fargo Target Blended Index is designed as a benchmark for multi-asset class portfolios with risk profiles that become more conservative over time, each corresponding to the target retirement date. The index weightings among the major asset classes are adjusted annually. The inception date of the index is July 14, 2017. See Appendix I for additional information. You cannot invest directly in an index. |
| 7 | The chart compares the performance of Class A shares for the most recent ten years with the S&P Target Date 2040 Index and the Wells Fargo Target 2040 Blended Index. The chart assumes a hypothetical investment of $10,000 in Class A shares and reflects all operating expenses and assumes the maximum initial sales charge of 5.75%. |
| 8 | Holdings, excluding cash, cash equivalents and any money market funds, are calculated based on the value of the investments divided by total net assets of the Fund. Holdings are subject to change and may have changed since the date specified. |
| 9 | Amounts are calculated based on the total long-term investments of the Fund. These amounts are subject to change and may have changed since the date specified. |
| 10 | These metrics show the degree and timing of the Fund’s fluctuations compared to S&P Target Date 2040 Index over 36 months. |
| 11 | Beta measures fund volatility relative to general market movements. It is a standardized measure of systematic risk in comparison with a specified index. The benchmark beta is 1.00 by definition. Beta is based on historical performance and does not represent future results. |
| 12 | Standard deviation is the square root of the sum of squared deviations from the mean. It is often used as a measure of volatility, variability, or risk. Standard deviation is based on historical performance and does not represent future results. |
| 13 | R-squared (R2) is a statistical measure that reflects the percentage of a fund’s movements that can be explained by movements in its benchmark index. The measure ranges from 0.0, which means that the fund’s performance bears no relationship to the performance of the index, to 1.0, which means that the fund’s performance was perfectly synchronized with the performance of the benchmark. R2 is based on historical performance and does not represent future results. |
30 | Target Date Retirement Funds
Table of Contents
Performance highlights (unaudited)
Average annual total returns (%) as of February 29, 2020
| Including sales charge | Excluding sales charge | Expense ratios1 (%) | ||||||||||||||||||||||||||||||||
| Inception date | 1 year | 5 year | 10 year | 1 year | 5 year | 10 year | Gross | Net2 | ||||||||||||||||||||||||||
| Class A (WFQVX)3 | 11-30-2012 | -3.78 | 3.47 | 7.41 | 2.14 | 4.69 | 8.04 | 0.85 | 0.65 | |||||||||||||||||||||||||
| Class R (WFNRX)4 | 6-28-2013 | – | – | – | 1.81 | 4.44 | 7.78 | 1.10 | 0.90 | |||||||||||||||||||||||||
| Class R4 (WFFRX)5 | 11-30-2012 | – | – | – | 2.46 | * | 5.01 | 8.41 | 0.57 | 0.34 | ||||||||||||||||||||||||
| Class R6 (WFQPX) | 6-29-2007 | – | – | – | 2.64 | 5.19 | 8.51 | 0.42 | 0.19 | |||||||||||||||||||||||||
| Administrator Class (WFQYX) | 6-29-2007 | – | – | – | 2.21 | 4.79 | 8.11 | 0.77 | 0.54 | |||||||||||||||||||||||||
| S&P Target Date 2045 Index6 | – | – | – | – | 3.43 | 5.73 | 8.84 | – | – | |||||||||||||||||||||||||
| Wells Fargo Target 2045 Blended Index7 | – | – | – | – | 2.32 | – | – | – | – | |||||||||||||||||||||||||
| * | Total return differs from the return in the Financial Highlights in this report. The total return presented is calculated based on the NAV at which the shareholder transactions were processed. The NAV and total return presented in the Financial Highlights reflects certain adjustments made to the net assets of the Fund that are necessary under U.S. generally accepted accounting principles. |
Figures quoted represent past performance, which is no guarantee of future results, and do not reflect taxes that a shareholder may pay on an investment in a fund. Investment return and principal value of an investment will fluctuate so that an investor’s shares, when redeemed, may be worth more or less than their original cost. Performance shown without sales charges would be lower if sales charges were reflected. Current performance may be lower or higher than the performance data quoted and assumes the reinvestment of dividends and capital gains. Currentmonth-end performance is available on the Fund’s website,wfam.com.
Index returns do not include transaction costs associated with buying and selling securities, any mutual fund fees or expenses, or any taxes. It is not possible to invest directly in an index.
For Class A shares, the maximumfront-end sales charge is 5.75%. Class R, Class R4, Class R6, and Administrator Class shares are sold without afront-end sales charge or contingent deferred sales charge.
| Growth of $10,000 investment as of February 29, 20208 |
|
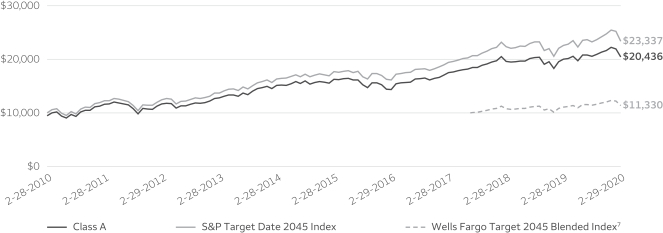
Please see footnotes on page 33.
Target Date Retirement Funds | 31
Table of Contents
Performance highlights (unaudited)
Target 2045 Fund (continued)
| Holdings (%) as of February 29, 20209 | ||||
Wells Fargo Factor Enhanced Large Cap Portfolio | 40.46 | |||
Wells Fargo Factor Enhanced International Portfolio | 26.09 | |||
Wells Fargo Factor Enhanced Small Cap Portfolio | 10.18 | |||
Wells Fargo Bloomberg Barclays US Aggregateex-Corporate Portfolio | 9.24 | |||
Wells Fargo Factor Enhanced Emerging Markets Portfolio | 7.91 | |||
Wells Fargo Investment Grade Corporate Bond Portfolio | 4.76 | |||
Wells Fargo Emerging Markets Bond Portfolio | 0.75 | |||
Wells Fargo High Yield Corporate Bond Portfolio | 0.75 | |||
| Volatility metrics as of February 29, 202011 | ||||||||||||
| Beta12 | Standard deviation13 | R-squared14 | ||||||||||
Class A | 0.91 | 10.03 | % | 0.99 | ||||||||
Class R | 0.90 | 9.97 | % | 0.99 | ||||||||
Class R4 | 0.91 | 10.00 | % | 0.99 | ||||||||
Class R6 | 0.91 | 9.98 | % | 0.99 | ||||||||
Administrator Class | 0.90 | 9.96 | % | 0.99 | ||||||||
| Portfolio allocation as of February 29, 202010 |
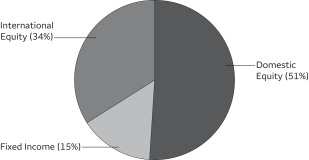 |
Please see footnotes on page 33.
32 | Target Date Retirement Funds
Table of Contents
Performance highlights (unaudited)
Target 2045 Fund (continued)
| 1 | Reflects the expense ratios as stated in the most recent prospectuses, which include the impact of 0.17% of acquired fund fees and expenses representing the net expenses from the affiliated master portfolios. The expense ratios shown are subject to change and may differ from the annualized expense ratios shown in the financial highlights of this report. |
| 2 | The manager has contractually committed through June 30, 2020, to waive fees and/or reimburse expenses to the extent necessary to cap total annual fund operating expenses after fee waivers at 0.65% for Class A, 0.90% for Class R, 0.34% for Class R4, 0.19% for Class R6, and 0.54% for Administrator Class. Brokerage commissions, stamp duty fees, interest, taxes, acquired fund fees and expenses (if any) from funds in which the affiliated master portfolios invest and from money market funds, and extraordinary expenses are excluded from the expense caps. All other acquired fund fees from the affiliated master portfolios are included in the expense caps. Prior to or after the commitment expiration date, the caps may be increased or the commitment to maintain the caps may be terminated only with the approval of the Board of Trustees. Without these caps, the Fund’s returns would have been lower. The expense ratio paid by an investor is the net expense ratio (the total annual fund operating expenses after fee waivers) as stated in the prospectuses. |
| 3 | Historical performance shown for the Class A shares prior to their inception reflects the performance of the Class R6 shares and has been adjusted to reflect the higher expenses applicable to the Class A shares. |
| 4 | Historical performance shown for the Class R4 shares prior to their inception reflects the performance of the Class R6 shares and has been adjusted to reflect the higher expenses applicable to the Class R4 shares. |
| 6 | The S&P Target Date Index is designed as a benchmark for multi-asset class portfolios with risk profiles that become more conservative over time, corresponding to the target retirement date. This index is representative of the investment opportunity available to investors for the target date horizon, with asset class exposures driven by a survey of available target date funds for that horizon. You cannot invest directly in an index. |
| 7 | Source: Wells Fargo Funds Management, LLC. The Wells Fargo Target Blended Index is designed as a benchmark for multi-asset class portfolios with risk profiles that become more conservative over time, each corresponding to the target retirement date. The index weightings among the major asset classes are adjusted annually. The inception date of the index is July 14, 2017. See Appendix I for additional information. You cannot invest directly in an index. |
| 8 | The chart compares the performance of Class A shares for the most recent ten years with the S&P Target Date 2045 Index and the Wells Fargo Target 2045 Blended Index. The chart assumes a hypothetical investment of $10,000 in Class A shares and reflects all operating expenses and assumes the maximum initial sales charge of 5.75%. |
| 9 | Holdings, excluding cash, cash equivalents and any money market funds, are calculated based on the value of the investments divided by total net assets of the Fund. Holdings are subject to change and may have changed since the date specified. |
| 10 | Amounts are calculated based on the total long-term investments of the Fund. These amounts are subject to change and may have changed since the date specified. |
| 11 | These metrics show the degree and timing of the Fund’s fluctuations compared to S&P Target Date 2045 Index over 36 months. |
| 12 | Beta measures fund volatility relative to general market movements. It is a standardized measure of systematic risk in comparison with a specified index. The benchmark beta is 1.00 by definition. Beta is based on historical performance and does not represent future results. |
| 13 | Standard deviation is the square root of the sum of squared deviations from the mean. It is often used as a measure of volatility, variability, or risk. Standard deviation is based on historical performance and does not represent future results. |
| 14 | R-squared (R2) is a statistical measure that reflects the percentage of a fund’s movements that can be explained by movements in its benchmark index. The measure ranges from 0.0, which means that the fund’s performance bears no relationship to the performance of the index, to 1.0, which means that the fund’s performance was perfectly synchronized with the performance of the benchmark. R2 is based on historical performance and does not represent future results. |
Target Date Retirement Funds | 33
Table of Contents
Performance highlights (unaudited)
Average annual total returns (%) as of February 29, 2020
| Including sales charge | Excluding sales charge | Expense ratios1 (%) | ||||||||||||||||||||||||||||||||
| Inception date | 1 year | 5 year | 10 year | 1 year | 5 year | 10 year | Gross | Net2 | ||||||||||||||||||||||||||
| Class A (WFQAX)3 | 11-30-2012 | -4.04 | 3.47 | 7.44 | 1.74 | 4.70 | 8.07 | 0.81 | 0.65 | |||||||||||||||||||||||||
| Class C (WFQCX)4 | 11-30-2012 | -0.12 | 3.90 | 7.26 | 0.88 | 3.90 | 7.26 | 1.56 | 1.40 | |||||||||||||||||||||||||
| Class R (WFWRX)5 | 6-28-2013 | – | – | – | 1.38 | 4.41 | 7.79 | 1.06 | 0.90 | |||||||||||||||||||||||||
| Class R4 (WQFRX)6 | 11-30-2012 | – | – | – | 1.89 | 5.01 | 8.43 | 0.53 | 0.34 | |||||||||||||||||||||||||
| Class R6 (WFQFX) | 6-29-2007 | – | – | – | 2.18 | 5.18 | 8.54 | 0.38 | 0.19 | |||||||||||||||||||||||||
| Administrator Class (WFQDX) | 6-29-2007 | – | – | – | 1.70 | 4.81 | 8.15 | 0.73 | 0.54 | |||||||||||||||||||||||||
| S&P Target Date 2045 Index7 | – | – | – | – | 3.43 | 5.73 | 8.84 | – | – | |||||||||||||||||||||||||
| S&P Target Date 2050 Index7 | – | – | – | – | 3.24 | 5.81 | – | – | – | |||||||||||||||||||||||||
| Wells Fargo Target 2050 Blended Index8 | – | – | – | – | 1.87 | – | – | – | – | |||||||||||||||||||||||||
Figures quoted represent past performance, which is no guarantee of future results, and do not reflect taxes that a shareholder may pay on an investment in a fund. Investment return and principal value of an investment will fluctuate so that an investor’s shares, when redeemed, may be worth more or less than their original cost. Performance shown without sales charges would be lower if sales charges were reflected. Current performance may be lower or higher than the performance data quoted and assumes the reinvestment of dividends and capital gains. Currentmonth-end performance is available on the Fund’s website,wfam.com.
Index returns do not include transaction costs associated with buying and selling securities, any mutual fund fees or expenses, or any taxes. It is not possible to invest directly in an index.
For Class A shares, the maximumfront-end sales charge is 5.75%. For Class C shares, the maximum contingent deferred sales charge is 1.00%. Performance including a contingent deferred sales charge assumes the sales charge for the corresponding time period. Class R, Class R4, Class R6, and Administrator Class shares are sold without afront-end sales charge or contingent deferred sales charge.
| Growth of $10,000 investment as of February 29, 20209 |
|
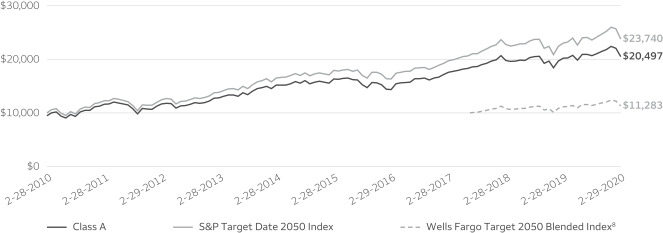
Please see footnotes on page 36.
34 | Target Date Retirement Funds
Table of Contents
Performance highlights (unaudited)
Target 2050 Fund (continued)
| Holdings (%) as of February 29, 202010 | ||||
Wells Fargo Factor Enhanced Large Cap Portfolio | 42.25 | |||
Wells Fargo Factor Enhanced International Portfolio | 27.80 | |||
Wells Fargo Factor Enhanced Small Cap Portfolio | 10.55 | |||
Wells Fargo Factor Enhanced Emerging Markets Portfolio | 8.39 | |||
Wells Fargo Bloomberg Barclays US Aggregateex-Corporate Portfolio | 6.49 | |||
Wells Fargo Investment Grade Corporate Bond Portfolio | 3.37 | |||
Wells Fargo Emerging Markets Bond Portfolio | 0.53 | |||
Wells Fargo High Yield Corporate Bond Portfolio | 0.53 | |||
| Volatility metrics as of February 29, 202012 | ||||||||||||
| Beta13 | Standard deviation14 | R-squared15 | ||||||||||
Class A | 0.91 | 10.25 | % | 0.99 | ||||||||
Class C | 0.91 | 10.32 | % | 0.99 | ||||||||
Class R | 0.91 | 10.28 | % | 0.99 | ||||||||
Class R4 | 0.91 | 10.32 | % | 0.99 | ||||||||
Class R6 | 0.92 | 10.33 | % | 0.99 | ||||||||
Administrator Class | 0.91 | 10.28 | % | 0.99 | ||||||||
| Portfolio allocation as of February 29, 202011 |
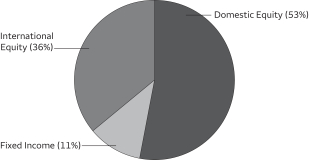 |
Please see footnotes on page 36.
Target Date Retirement Funds | 35
Table of Contents
Performance highlights (unaudited)
Target 2050 Fund (continued)
| 1 | Reflects the expense ratios as stated in the most recent prospectuses, which include the impact of 0.17% of acquired fund fees and expenses representing the net expenses from the affiliated master portfolios. The expense ratios shown are subject to change and may differ from the annualized expense ratios shown in the financial highlights of this report. |
| 2 | The manager has contractually committed through June 30, 2020, to waive fees and/or reimburse expenses to the extent necessary to cap total annual fund operating expenses after fee waivers at 0.65% for Class A, 1.40% for Class C, 0.90% for Class R, 0.34% for Class R4, 0.19% for Class R6, and 0.54% for Administrator Class. Brokerage commissions, stamp duty fees, interest, taxes, acquired fund fees and expenses (if any) from funds in which the affiliated master portfolios invest and from money market funds, and extraordinary expenses are excluded from the expense caps. All other acquired fund fees from the affiliated master portfolios are included in the expense caps. Prior to or after the commitment expiration date, the caps may be increased or the commitment to maintain the caps may be terminated only with the approval of the Board of Trustees. Without these caps, the Fund’s returns would have been lower. The expense ratio paid by an investor is the net expense ratio (the total annual fund operating expenses after fee waivers) as stated in the prospectuses. |
| 3 | Historical performance shown for the Class A shares prior to their inception reflects the performance of the Class R6 shares and has been adjusted to reflect the higher expenses applicable to the Class A shares. |
| 4 | Historical performance shown for Class C shares prior to their inception reflects the performance of the Class R6 shares and has been adjusted to reflect the higher expenses applicable to the Class C shares. |
| 5 | Historical performance shown for the Class R shares prior to their inception reflects the performance of the Class A shares and has been adjusted to reflect the higher expenses applicable to the Class R shares. |
| 6 | Historical performance shown for the Class R4 shares prior to their inception reflects the performance of the Class R6 shares and has been adjusted to reflect the higher expenses applicable to the Class R4 shares. |
| 7 | The S&P Target Date Index is designed as a benchmark for multi-asset class portfolios with risk profiles that become more conservative over time, corresponding to the target retirement date. This index is representative of the investment opportunity available to investors for the target date horizon, with asset class exposures driven by a survey of available target date funds for that horizon. You cannot invest directly in an index. |
| 8 | Source: Wells Fargo Funds Management, LLC. The Wells Fargo Target Blended Index is designed as a benchmark for multi-asset class portfolios with risk profiles that become more conservative over time, each corresponding to the target retirement date. The index weightings among the major asset classes are adjusted annually. The inception date of the index is July 14, 2017. See Appendix I for additional information. You cannot invest directly in an index. |
| 9 | The chart compares the performance of Class A shares for the most recent ten years with the S&P Target Date 2050 Index and the Wells Fargo Target 2050 Blended Index. The performance shown for the S&P Target Date 2050 Index represents the returns of the S&P Target Date 2045 Index from 2/28/2009 to 05/31/2012 and the S&P Target Date 2050 Index from 6/1/2012 (index inception date) through period end. The chart assumes a hypothetical investment of $10,000 in Class A shares and reflects all operating expenses and assumes the maximum initial sales charge of 5.75%. |
| 10 | Holdings, excluding cash, cash equivalents and any money market funds, are calculated based on the value of the investments divided by total net assets of the Fund. Holdings are subject to change and may have changed since the date specified. |
| 11 | Amounts are calculated based on the total long-term investments of the Fund. These amounts are subject to change and may have changed since the date specified. |
| 12 | These metrics show the degree and timing of the Fund’s fluctuations compared to S&P Target Date 2050 Index over 36 months. |
| 13 | Beta measures fund volatility relative to general market movements. It is a standardized measure of systematic risk in comparison with a specified index. The benchmark beta is 1.00 by definition. Beta is based on historical performance and does not represent future results. |
| 14 | Standard deviation is the square root of the sum of squared deviations from the mean. It is often used as a measure of volatility, variability, or risk. Standard deviation is based on historical performance and does not represent future results. |
| 15 | R-squared (R2) is a statistical measure that reflects the percentage of a fund’s movements that can be explained by movements in its benchmark index. The measure ranges from 0.0, which means that the fund’s performance bears no relationship to the performance of the index, to 1.0, which means that the fund’s performance was perfectly synchronized with the performance of the benchmark. R2 is based on historical performance and does not represent future results. |
36 | Target Date Retirement Funds
Table of Contents
Performance highlights (unaudited)
Average annual total returns (%) as of February 29, 2020
| Including sales charge | Excluding sales charge | Expense ratios1 (%) | ||||||||||||||||||||||||||||||||
| Inception date | 1 year | 5 year | Since inception | 1 year | 5 year | Since inception | Gross | Net2 | ||||||||||||||||||||||||||
| Class A (WFQZX)3 | 11-30-2012 | -4.26 | 3.45 | 6.05 | 1.62 | 4.68 | 6.78 | 1.27 | 0.65 | |||||||||||||||||||||||||
| Class R (WFYRX)4 | 6-28-2013 | – | – | – | 1.43 | 4.42 | 6.44 | 1.52 | 0.90 | |||||||||||||||||||||||||
| Class R4 (WFVRX)5 | 11-30-2012 | – | – | – | 1.98 | 5.00 | 7.13 | 0.99 | 0.34 | |||||||||||||||||||||||||
| Class R6 (WFQUX) | 6-30-2011 | – | – | – | 2.10 | 5.17 | 7.25 | 0.84 | 0.19 | |||||||||||||||||||||||||
| Administrator Class (WFLHX) | 6-30-2011 | – | – | – | 1.74 | 4.81 | 6.88 | 1.19 | 0.54 | |||||||||||||||||||||||||
| S&P Target Date 2055 Index6 | – | – | – | – | 3.17 | 5.86 | 7.95 | * | – | – | ||||||||||||||||||||||||
| Wells Fargo Target 2055 Blended Index7 | – | – | – | – | 1.87 | – | – | – | – | |||||||||||||||||||||||||
| * | Based on the inception date of the oldest Fund class. |
Figures quoted represent past performance, which is no guarantee of future results, and do not reflect taxes that a shareholder may pay on an investment in a fund. Investment return and principal value of an investment will fluctuate so that an investor’s shares, when redeemed, may be worth more or less than their original cost. Performance shown without sales charges would be lower if sales charges were reflected. Current performance may be lower or higher than the performance data quoted and assumes the reinvestment of dividends and capital gains. Currentmonth-end performance is available on the Fund’s website,wfam.com.
Index returns do not include transaction costs associated with buying and selling securities, any mutual fund fees or expenses, or any taxes. It is not possible to invest directly in an index.
For Class A shares, the maximumfront-end sales charge is 5.75%. Class R, Class R4, Class R6, and Administrator Class shares are sold without afront-end sales charge or contingent deferred sales charge.
| Growth of $10,000 investment as of February 29, 20208 |
|
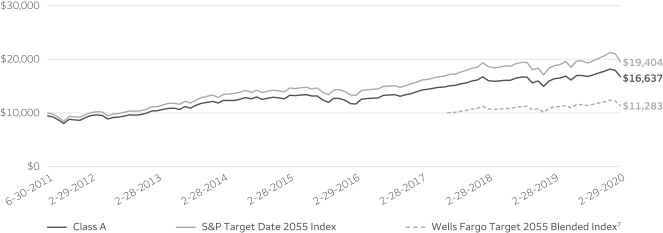
Please see footnotes on page 39.
Target Date Retirement Funds | 37
Table of Contents
Performance highlights (unaudited)
Target 2055 Fund (continued)
| Holdings (%) as of February 29, 20209 | ||||
Wells Fargo Factor Enhanced Large Cap Portfolio | 42.42 | |||
Wells Fargo Factor Enhanced International Portfolio | 28.08 | |||
Wells Fargo Factor Enhanced Small Cap Portfolio | 10.58 | |||
Wells Fargo Factor Enhanced Emerging Markets Portfolio | 8.48 | |||
Wells Fargo Bloomberg Barclays US Aggregateex-Corporate Portfolio | 6.58 | |||
Wells Fargo Investment Grade Corporate Bond Portfolio | 3.40 | |||
Wells Fargo Emerging Markets Bond Portfolio | 0.54 | |||
Wells Fargo High Yield Corporate Bond Portfolio | 0.54 | |||
| Volatility metrics as of February 29, 202011 | ||||||||||||
| Beta12 | Standard deviation13 | R-squared14 | ||||||||||
Class A | 0.90 | 10.25 | % | 0.99 | ||||||||
Class R | 0.90 | 10.28 | % | 0.99 | ||||||||
Class R4 | 0.91 | 10.30 | % | 0.99 | ||||||||
Class R6 | 0.91 | 10.33 | % | 0.99 | ||||||||
Administrator Class | 0.91 | 10.31 | % | 0.99 | ||||||||
| Portfolio allocation as of February 29, 202010 |
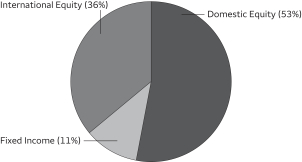 |
Please see footnotes on page 39.
38 | Target Date Retirement Funds
Table of Contents
Performance highlights (unaudited)
Target 2055 Fund (continued)
| 1 | Reflects the expense ratios as stated in the most recent prospectuses, which include the impact of 0.18% of acquired fund fees and expenses representing the net expenses from the affiliated master portfolios. The expense ratios shown are subject to change and may differ from the annualized expense ratios shown in the financial highlights of this report. |
| 2 | The manager has contractually committed through June 30, 2020, to waive fees and/or reimburse expenses to the extent necessary to cap total annual fund operating expenses after fee waivers at 0.65% for Class A, 0.90% for Class R, 0.34% for Class R4, 0.19% for Class R6, and 0.54% for Administrator Class. Brokerage commissions, stamp duty fees, interest, taxes, acquired fund fees and expenses (if any) from funds in which the affiliated master portfolios invest and from money market funds, and extraordinary expenses are excluded from the expense caps. All other acquired fund fees from the affiliated master portfolios are included in the expense caps. Prior to or after the commitment expiration date, the caps may be increased or the commitment to maintain the caps may be terminated only with the approval of the Board of Trustees. Without these caps, the Fund’s returns would have been lower. The expense ratio paid by an investor is the net expense ratio (the total annual fund operating expenses after fee waivers) as stated in the prospectuses. |
| 3 | Historical performance shown for the Class A shares prior to their inception reflects the performance of the Class R6 shares and has been adjusted to reflect the higher expenses applicable to the Class A shares. |
| 4 | Historical performance shown for the Class R shares prior to their inception reflects the performance of the Class A shares and has been adjusted to reflect the higher expenses applicable to the Class R shares. |
| 5 | Historical performance shown for the Class R4 shares prior to their inception reflects the performance of the Class R6 shares and has been adjusted to reflect the higher expenses applicable to the Class R4 shares. |
| 6 | The S&P Target Date Index is designed as a benchmark for multi-asset class portfolios with risk profiles that become more conservative over time, corresponding to the target retirement date. This index is representative of the investment opportunity available to investors for the target date horizon, with asset class exposures driven by a survey of available target date funds for that horizon. You cannot invest directly in an index. |
| 7 | Source: Wells Fargo Funds Management, LLC. The Wells Fargo Target Blended Index is designed as a benchmark for multi-asset class portfolios with risk profiles that become more conservative over time, each corresponding to the target retirement date. The index weightings among the major asset classes are adjusted annually. The inception date of the index is July 14, 2017. See Appendix I for additional information. You cannot invest directly in an index. |
| 8 | The chart compares the performance of Class A shares for the most recent ten years with the S&P Target Date 2055 Index and the Wells Fargo Target 2055 Blended Index. The chart assumes a hypothetical investment of $10,000 in Class A shares and reflects all operating expenses and assumes the maximum initial sales charge of 5.75%. |
| 9 | Holdings, excluding cash, cash equivalents and any money market funds, are calculated based on the value of the investments divided by total net assets of the Fund. Holdings are subject to change and may have changed since the date specified. |
| 10 | Amounts are calculated based on the total long-term investments of the Fund. These amounts are subject to change and may have changed since the date specified. |
| 11 | These metrics show the degree and timing of the Fund’s fluctuations compared to S&P Target Date 2055 Index over 36 months. |
| 12 | Beta measures fund volatility relative to general market movements. It is a standardized measure of systematic risk in comparison with a specified index. The benchmark beta is 1.00 by definition. Beta is based on historical performance and does not represent future results. |
| 13 | Standard deviation is the square root of the sum of squared deviations from the mean. It is often used as a measure of volatility, variability, or risk. Standard deviation is based on historical performance and does not represent future results. |
| 14 | R-squared (R2) is a statistical measure that reflects the percentage of a fund’s movements that can be explained by movements in its benchmark index. The measure ranges from 0.0, which means that the fund’s performance bears no relationship to the performance of the index, to 1.0, which means that the fund’s performance was perfectly synchronized with the performance of the benchmark. R2 is based on historical performance and does not represent future results. |
Target Date Retirement Funds | 39
Table of Contents
Performance highlights (unaudited)
Average annual total returns (%) as of February 29, 2020
| Including Sales Charge | Excluding Sales Charge | Expense ratios1 (%) | ||||||||||||||||||||||||||||||||
| Inception date | 1 year | Since inception | 1 year | Since inception | Gross | Net2 | ||||||||||||||||||||||||||||
| Class A (WFAFX) | 6-30-2015 | -4.19 | 3.99 | 1.67 | 5.32 | 2.51 | 0.65 | |||||||||||||||||||||||||||
| Class C (WFCFX) | 6-30-2015 | -0.06 | 4.54 | 0.94 | 4.54 | 3.26 | 1.40 | |||||||||||||||||||||||||||
| Class R (WFRFX) | 6-30-2015 | – | – | 1.42 | 5.04 | 2.76 | 0.90 | |||||||||||||||||||||||||||
| Class R4 (WFSFX) | 6-30-2015 | – | – | 1.94 | 5.66 | 2.23 | 0.34 | |||||||||||||||||||||||||||
| Class R6 (WFUFX) | 6-30-2015 | – | – | 2.07 | 5.79 | 2.08 | 0.19 | |||||||||||||||||||||||||||
| Administrator Class (WFDFX) | 6-30-2015 | – | – | 1.79 | 5.45 | 2.43 | 0.54 | |||||||||||||||||||||||||||
| S&P Target Date 2055 Index3 | – | – | – | 3.17 | 6.48 | * | – | – | ||||||||||||||||||||||||||
| S&P Target Date 2060+ Index3,** | – | – | – | 3.25 | – | – | – | |||||||||||||||||||||||||||
| Wells Fargo Target 2060 Blended Index4 | – | – | – | 1.87 | – | – | – | |||||||||||||||||||||||||||
| * | Based on the inception date of the oldest Fund class. |
| ** | The inception date of the index is May 31, 2016. |
Figures quoted represent past performance, which is no guarantee of future results, and do not reflect taxes that a shareholder may pay on an investment in a fund. Investment return and principal value of an investment will fluctuate so that an investor’s shares, when redeemed, may be worth more or less than their original cost. Performance shown without sales charges would be lower if sales charges were reflected. Current performance may be lower or higher than the performance data quoted and assumes the reinvestment of dividends and capital gains. Current month-end performance is available on the Fund’s website, wfam.com.
Index returns do not include transaction costs associated with buying and selling securities, any mutual fund fees or expenses, or any taxes. It is not possible to invest directly in an index.
For Class A shares, the maximumfront-end sales charge is 5.75%. For Class C shares, the maximum contingent deferred sales charge is 1.00%. Performance including a contingent deferred sales charge assumes the sales charge for the corresponding time period. Class R, Class R4, Class R6, and Administrator Class shares are sold without afront-end sales charge or contingent deferred sales charge.
| Growth of $10,000 investment as of February 29, 20205 |
|
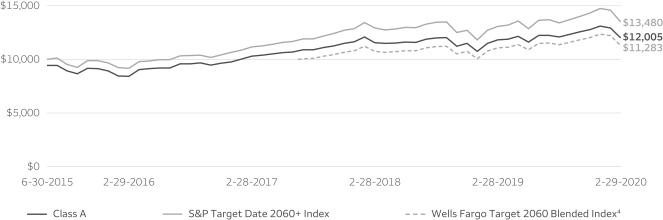
Please see footnotes on page 42.
40 | Target Date Retirement Funds
Table of Contents
Performance highlights (unaudited)
Target 2060 Fund (continued)
| Holdings (%) as of February 29, 20206 | ||||
Wells Fargo Factor Enhanced Large Cap Portfolio | 42.48 | |||
Wells Fargo Factor Enhanced International Portfolio | 28.13 | |||
Wells Fargo Factor Enhanced Small Cap Portfolio | 10.60 | |||
Wells Fargo Factor Enhanced Emerging Markets Portfolio | 8.48 | |||
Wells Fargo Bloomberg Barclays US Aggregateex-Corporate Portfolio | 6.39 | |||
Wells Fargo Investment Grade Corporate Bond Portfolio | 3.29 | |||
Wells Fargo Emerging Markets Bond Portfolio | 0.52 | |||
Wells Fargo High Yield Corporate Bond Portfolio | 0.52 | |||
| Volatility metrics as of February 29, 20208 | ||||||||||||
| Beta9 | Standard deviation10 | R-squared11 | ||||||||||
Class A | 0.90 | 10.37 | % | 0.99 | ||||||||
Class C | 0.90 | 10.38 | % | 0.99 | ||||||||
Class R | 0.90 | 10.36 | % | 0.99 | ||||||||
Class R4 | 0.90 | 10.35 | % | 0.99 | ||||||||
Class R6 | 0.90 | 10.36 | % | 0.99 | ||||||||
Administrator Class | 0.90 | 10.33 | % | 0.99 | ||||||||
| Portfolio allocation as of February 29, 20207 |
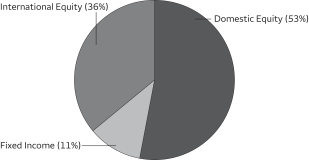 |
Please see footnotes on page 42.
Target Date Retirement Funds | 41
Table of Contents
Performance highlights (unaudited)
Target 2060 Fund (continued)
| 1 | Reflects the expense ratios as stated in the most recent prospectuses, which include the impact of 0.18% of acquired fund fees and expenses representing the net expenses from the affiliated master portfolios. The expense ratios shown are subject to change and may differ from the annualized expense ratios shown in the financial highlights of this report. |
| 2 | The manager has contractually committed through June 30, 2020, to waive fees and/or reimburse expenses to the extent necessary to cap total annual fund operating expenses after fee waivers at 0.65% for Class A, 1.40% for Class C, 0.90% for Class R, 0.34% for Class R4, 0.19% for Class R6, and 0.54% for Administrator Class. Brokerage commissions, stamp duty fees, interest, taxes, acquired fund fees and expenses (if any) from funds in which the affiliated master portfolios invest and from money market funds, and extraordinary expenses are excluded from the expense caps. All other acquired fund fees and expenses from the affiliated master portfolios are included in the expense caps. Prior to or after the commitment expiration date, the caps may be increased or the commitment to maintain the caps may be terminated only with the approval of the Board of Trustees. Without these caps, the Fund’s returns would have been lower. The expense ratio paid by an investor is the net expense ratio (the total annual fund operating expenses after fee waivers) as stated in the prospectuses. |
| 3 | The S&P Target Date Index is designed as a benchmark for multi-asset class portfolios with risk profiles that become more conservative over time, corresponding to the target retirement date. This index is representative of the investment opportunity available to investors for the target date horizon, with asset class exposures driven by a survey of available target date funds for that horizon. You cannot invest directly in an index. |
| 4 | Source: Wells Fargo Funds Management, LLC. The Wells Fargo Target Blended Index is designed as a benchmark for multi-asset class portfolios with risk profiles that become more conservative over time, each corresponding to the target retirement date. The index weightings among the major asset classes are adjusted annually. The inception date of the index is July 14, 2017. See Appendix I for additional information. You cannot invest directly in an index. |
| 5 | The chart compares the performance of Class A shares since inception with the S&P Target Date 2060+ Index and the Wells Fargo Target 2060 Blended Index. The performance shown for the S&P Target Date 2060+ Index represents the returns of the S&P Target Date 2055 Index from 6/30/2015 to 4/30/2016 and the S&P Target Date 2060+ Index from 5/1/2016 (index inception date) through period end. The chart assumes a hypothetical investment of $10,000 in Class A shares and reflects all operating expenses and assumes the maximum initial sales charge of 5.75%. |
| 6 | Holdings, excluding cash, cash equivalents and any money market funds, are calculated based on the value of the investments divided by total net assets of the Fund. Holdings are subject to change and may have changed since the date specified. |
| 7 | Amounts are calculated based on the total long-term investments of the Fund. These amounts are subject to change and may have changed since the date specified. |
| 8 | These metrics show the degree and timing of the Fund’s fluctuations compared to S&P Target Date 2060+ Index over 36 months. |
| 9 | Beta measures fund volatility relative to general market movements. It is a standardized measure of systematic risk in comparison with a specified index. The benchmark beta is 1.00 by definition. Beta is based on historical performance and does not represent future results. |
| 10 | Standard deviation is the square root of the sum of squared deviations from the mean. It is often used as a measure of volatility, variability, or risk. Standard deviation is based on historical performance and does not represent future results. |
| 11 | R-squared (R2) is a statistical measure that reflects the percentage of a fund’s movements that can be explained by movements in its benchmark index. The measure ranges from 0.0, which means that the fund’s performance bears no relationship to the performance of the index, to 1.0, which means that the fund’s performance was perfectly synchronized with the performance of the benchmark. R2 is based on historical performance and does not represent future results. |
42 | Target Date Retirement Funds
Table of Contents
Performance highlights (unaudited)
MANAGER’S DISCUSSION
Highlights
The Wells Fargo Target Date Funds seek to manage the asset allocation and risk profile of multi-asset-class funds for investors as they save for their target retirement date. The strategic asset allocations are designed to provide high levels of diversification across equity and fixed-income investments. Our approach to portfolio construction helps investors make more aggressive allocations when they may be most beneficial while remaining diversified to manage risks during bear markets.
All of the Wells Fargo Target Date Funds invest at different allocation levels in the same underlying portfolios that seek to replicate indices comprising a blend of factor-enhanced equity and factor-enhanced bond investments, including domestic, international, and emerging market equities and debt. The breadth and depth of diversification and disciplined asset allocation help manage risk but do not eliminate it. The factor-enhanced equity indices contain a broad mix oflarge-cap,mid-cap,small-cap, growth, value, and international stocks, including emerging markets. The fixed-income indices invest in several types of fixed-income securities, including U.S. andnon-U.S. government bonds, corporate bonds, and high-yield securities. In addition, depending on the number of years to the target retirement date, the portfolios invest in other assets: real estate investment trusts (REITs) and Treasury Inflation-Protected Securities.
The Funds address investment risk through diversification and disciplined asset allocation.
The Wells Fargo Target Date Funds are designed to become more conservative as a fund moves down the glide path and its target date approaches. Our goal is to manage the relative risk of each Fund as dictated by the glide path. A fund’s targeted risk is not the same as a fund’s equity allocation percentage because fixed-income securities, other assets, and cash equivalents carry risks. While asset allocation and diversification do not ensure or guarantee better performance and cannot eliminate the risk of investment losses, on a monthly basis, we adjust each Target Date Fund’s allocations to equities, fixed income, other assets, and cash equivalents in response to changing market conditions and the Fund’s movement down the strategic glide path that represents relative risk as it moves toward the target retirement date.
Global equity markets experienced a steepsell-off beginning in February 2020.
For the12-month period that ended February 29, 2020, each Wells Fargo Target Date Fund posted positive returns, with the near-dated funds generating higher absolute returns due to their higher fixed-income allocations. Twelve funds comprise the Wells Fargo Target Date Funds. Seven of the funds offer six share classes, including two classes with sales charges. Five of the funds offer five share classes, including one class with sales charges. In general, the relative performance was stronger in the near-dated funds.
After ending the fourth quarter of 2019 on a high note, some of those gains were reversed at the end of February as a result of the novel coronavirus(COVID-19) expanding globally. Domestically, the S&P 500 Index1 rose 8.19% for the12-month period that ended February 29, 2020. For the same period, the Russell 2000® Index2 returned-4.92% while foreign markets also did not fare well, with the MSCI EAFE Index (Net)3 falling 0.57% and the MSCI EM Index (Net)4 declining 1.88%. The Bloomberg Barclays U.S. Aggregate Bond Index5 rose 11.68% for the period while the Bloomberg Barclays Global Aggregate ex U.S. Index6 returned 4.83%.
During theone-year period, while stocks as a whole produced positive results, both large caps and REITs were the main contributors, while foreign andsmall-cap stocks produced negative results. On a relative basis, the REIT, international, andsmall-cap stocks in the portfolio tended to outperform their market benchmarks. Meanwhile, thelarge-cap and emerging market portfolios lagged their benchmark during the period. The exposure to foreign andsmall-cap stocks detracted from absolute performance. Funds with larger fixed-income allocations relative to other funds achieved higher absolute returns than funds with relatively larger allocations tosmall-cap, international, and emerging market equities, which delivered negative results during the year. The Target 2050 Fund, Target 2055 Fund, and Target 2060 Fund, which had not begun to move down the glide path, had the highest total equity exposures over the past 12 months. The shortest-dated Target Today Fund remained invested at its minimum allowable equity allocation during the period.
Global macroeconomic conditions are clouded by the coronavirus.
At the time of this writing, the impact of the coronavirus is the major source of global uncertainty. The full impact the coronavirus will have on the economy and the financial markets is unknown. The situation has quickly escalated, but we don’t know if it will hit catastrophic and tragic levels. Initial economic reports show some signs of weakness from the supply and demand disruption caused by the quarantine in China. Concerns over travel are also having a negative impact on the economy.
Please see footnotes on page 44.
Target Date Retirement Funds | 43
Table of Contents
Performance highlights (unaudited)
Governments have started to take actions but these efforts are limited and not coordinated. Global central banks have also started to take action as more countries beyond China are being affected by the virus.
So, we return to the question we cannot yet answer: How deep is the damage from the coronavirus? Time will provide us a clearer picture as more data is released. Could the virus kill the economic expansion and hopes of a global rebound from the malaise of 2019? The prognosis is unclear at the moment, but do not count out a U.S. economy that has proven to be resilient. As ofperiod-end, unemployment and inflation were low. Central banks have been accommodative. Industrial production and retail sales have been disappointing. Economic growth forecasts have fallen, so at least the market seems to be pricing in lower growth. As more information becomes available, we will continue to reevaluate the portfolio’s risk/reward composition and make adjustments as required.
| 1 | The S&P 500 Index consists of 500 stocks chosen for market size, liquidity, and industry group representation. It is a market-value-weighted index with each stock’s weight in the index proportionate to its market value. You cannot invest directly in an index. |
| 2 | The Russell 2000® Index measures the performance of the 2,000 smallest companies in the Russell 3000® Index, which represents approximately 8% of the total market capitalization of the Russell 3000® Index. You cannot invest directly in an index. |
| 3 | The Morgan Stanley Capital International (MSCI) Europe, Australasia, Far East (EAFE) Index (Net) is a free-float-adjusted market-capitalization weighted index that is designed to measure the equity market performance of developed markets, excluding the United States and Canada. You cannot invest directly in an index. |
| 4 | The MSCI Emerging Markets (EM) Index (Net) is a free-float-adjusted market-capitalization-weighted index that is designed to measure large- andmid-cap equity market performance of emerging markets. You cannot invest directly in an index. |
| 5 | The Bloomberg Barclays U.S. Aggregate Bond Index is a broad-based benchmark that measures the investment-grade, U.S. dollar-denominated, fixed rate taxable bond market, including Treasuries, government-related and corporate securities, mortgage-backed securities (agency fixed-rate and hybrid adjustable-rate mortgage pass-throughs), asset-backed securities, and commercial mortgage-backed securities. You cannot invest directly in an index. |
| 6 | Bloomberg Barclays Global Aggregate ex U.S. Index is an unmanaged index that provides a broad-based measure of the global investment-grade fixed-income markets excluding the U.S.-dollar-denominated debt market. You cannot invest directly in an index. |
44 | Target Date Retirement Funds
Table of Contents
As a shareholder of the Fund, you incur two types of costs: (1) transaction costs, including sales charges (loads) on purchase payments and contingent deferred sales charges (if any) on redemptions and (2) ongoing costs, including management fees, distribution(12b-1) and/or shareholder servicing fees, and other Fund expenses. This example is intended to help you understand your ongoing costs (in dollars) of investing in the Fund and to compare these costs with the ongoing costs of investing in other mutual funds.
The example is based on an investment of $1,000 invested at the beginning of thesix-month period and held for the entire period from September 1, 2019 to February 29, 2020.
Actual expenses
The “Actual” line of the table below provides information about actual account values and actual expenses. You may use the information in this line, together with the amount you invested, to estimate the expenses that you paid over the period. Simply divide your account value by $1,000 (for example, an $8,600 account value divided by $1,000 = 8.6), then multiply the result by the number in the “Actual” line under the heading entitled “Expenses paid during period” for your applicable class of shares to estimate the expenses you paid on your account during this period.
Hypothetical example for comparison purposes
The “Hypothetical” line of the table below provides information about hypothetical account values and hypothetical expenses based on the Fund’s actual expense ratio and an assumed rate of return of 5% per year before expenses, which is not the Fund’s actual return. The hypothetical account values and expenses may not be used to estimate the actual ending account balance or expenses you paid for the period. You may use this information to compare the ongoing costs of investing in the Fund and other funds. To do so, compare this 5% hypothetical example with the 5% hypothetical examples that appear in the shareholder reports of the other funds.
Please note that the expenses shown in the table are meant to highlight your ongoing costs only and do not reflect any transactional costs, such as sales charges (loads) and contingent deferred sales charges. Therefore, the “Hypothetical” line of the table is useful in comparing ongoing costs only and will not help you determine the relative total costs of owning different funds. In addition, if these transactional costs were included, your costs would have been higher.
| Target Today Fund | Beginning account value 9-1-2019 | Ending account value 2-29-2020 | Expenses paid during the period¹ | Annualized net expense ratio | ||||||||||||
Class A | ||||||||||||||||
Actual | $ | 1,000.00 | $ | 1,016.29 | $ | 3.06 | 0.61 | % | ||||||||
Hypothetical (5% return before expenses) | $ | 1,000.00 | $ | 1,021.83 | $ | 3.07 | 0.61 | % | ||||||||
Class C | ||||||||||||||||
Actual | $ | 1,000.00 | $ | 1,011.87 | $ | 7.00 | 1.40 | % | ||||||||
Hypothetical (5% return before expenses) | $ | 1,000.00 | $ | 1,017.90 | $ | 7.02 | 1.40 | % | ||||||||
Class R | ||||||||||||||||
Actual | $ | 1,000.00 | $ | 1,014.55 | $ | 4.51 | 0.90 | % | ||||||||
Hypothetical (5% return before expenses) | $ | 1,000.00 | $ | 1,020.39 | $ | 4.52 | 0.90 | % | ||||||||
Class R4 | ||||||||||||||||
Actual | $ | 1,000.00 | $ | 1,017.37 | $ | 1.71 | 0.34 | % | ||||||||
Hypothetical (5% return before expenses) | $ | 1,000.00 | $ | 1,023.17 | $ | 1.71 | 0.34 | % | ||||||||
Class R6 | ||||||||||||||||
Actual | $ | 1,000.00 | $ | 1,019.30 | $ | 0.95 | 0.19 | % | ||||||||
Hypothetical (5% return before expenses) | $ | 1,000.00 | $ | 1,023.92 | $ | 0.96 | 0.19 | % | ||||||||
Administrator Class | ||||||||||||||||
Actual | $ | 1,000.00 | $ | 1,017.38 | $ | 2.66 | 0.53 | % | ||||||||
Hypothetical (5% return before expenses) | $ | 1,000.00 | $ | 1,022.23 | $ | 2.66 | 0.53 | % | ||||||||
| 1 | Expenses paid is equal to the annualized net expense ratio of each class multiplied by the average account value over the period, multiplied by the number of days in the most recent fiscal half-year divided by the number of days in the fiscal year (to reflect theone-half-year period). |
Target Date Retirement Funds | 45
Table of Contents
Fund expenses (unaudited)
| Target 2010 Fund | Beginning account value 9-1-2019 | Ending account value 2-29-2020 | Expenses paid during the period¹ | Annualized net expense ratio | ||||||||||||
Class A | ||||||||||||||||
Actual | $ | 1,000.00 | $ | 1,016.88 | $ | 3.11 | 0.62 | % | ||||||||
Hypothetical (5% return before expenses) | $ | 1,000.00 | $ | 1,021.78 | $ | 3.12 | 0.62 | % | ||||||||
Class C | ||||||||||||||||
Actual | $ | 1,000.00 | $ | 1,012.30 | $ | 7.00 | 1.40 | % | ||||||||
Hypothetical (5% return before expenses) | $ | 1,000.00 | $ | 1,017.90 | $ | 7.02 | 1.40 | % | ||||||||
Class R | ||||||||||||||||
Actual | $ | 1,000.00 | $ | 1,015.07 | $ | 4.56 | 0.90 | % | ||||||||
Hypothetical (5% return before expenses) | $ | 1,000.00 | $ | 1,020.34 | $ | 4.57 | 0.90 | % | ||||||||
Class R4 | ||||||||||||||||
Actual | $ | 1,000.00 | $ | 1,018.35 | $ | 1.71 | 0.34 | % | ||||||||
Hypothetical (5% return before expenses) | $ | 1,000.00 | $ | 1,023.17 | $ | 1.71 | 0.34 | % | ||||||||
Class R6 | ||||||||||||||||
Actual | $ | 1,000.00 | $ | 1,019.11 | $ | 0.95 | 0.19 | % | ||||||||
Hypothetical (5% return before expenses) | $ | 1,000.00 | $ | 1,023.92 | $ | 0.96 | 0.19 | % | ||||||||
Administrator Class | ||||||||||||||||
Actual | $ | 1,000.00 | $ | 1,017.13 | $ | 2.71 | 0.54 | % | ||||||||
Hypothetical (5% return before expenses) | $ | 1,000.00 | $ | 1,022.18 | $ | 2.72 | 0.54 | % | ||||||||
| Target 2015 Fund | ||||||||||||||||
Class A | ||||||||||||||||
Actual | $ | 1,000.00 | $ | 1,015.18 | $ | 3.01 | 0.60 | % | ||||||||
Hypothetical (5% return before expenses) | $ | 1,000.00 | $ | 1,021.88 | $ | 3.02 | 0.60 | % | ||||||||
Class R | ||||||||||||||||
Actual | $ | 1,000.00 | $ | 1,012.77 | $ | 4.50 | 0.90 | % | ||||||||
Hypothetical (5% return before expenses) | $ | 1,000.00 | $ | 1,020.39 | $ | 4.52 | 0.90 | % | ||||||||
Class R4 | ||||||||||||||||
Actual | $ | 1,000.00 | $ | 1,016.49 | $ | 1.70 | 0.34 | % | ||||||||
Hypothetical (5% return before expenses) | $ | 1,000.00 | $ | 1,023.17 | $ | 1.71 | 0.34 | % | ||||||||
Class R6 | ||||||||||||||||
Actual | $ | 1,000.00 | $ | 1,017.40 | $ | 0.95 | 0.19 | % | ||||||||
Hypothetical (5% return before expenses) | $ | 1,000.00 | $ | 1,023.92 | $ | 0.96 | 0.19 | % | ||||||||
Administrator Class | ||||||||||||||||
Actual | $ | 1,000.00 | $ | 1,015.09 | $ | 2.71 | 0.54 | % | ||||||||
Hypothetical (5% return before expenses) | $ | 1,000.00 | $ | 1,022.18 | $ | 2.72 | 0.54 | % | ||||||||
| Target 2020 Fund | ||||||||||||||||
Class A | ||||||||||||||||
Actual | $ | 1,000.00 | $ | 1,013.06 | $ | 3.05 | 0.61 | % | ||||||||
Hypothetical (5% return before expenses) | $ | 1,000.00 | $ | 1,021.83 | $ | 3.07 | 0.61 | % | ||||||||
Class C | ||||||||||||||||
Actual | $ | 1,000.00 | $ | 1,009.23 | $ | 6.99 | 1.40 | % | ||||||||
Hypothetical (5% return before expenses) | $ | 1,000.00 | $ | 1,017.90 | $ | 7.02 | 1.40 | % | ||||||||
Class R | ||||||||||||||||
Actual | $ | 1,000.00 | $ | 1,011.46 | $ | 4.50 | 0.90 | % | ||||||||
Hypothetical (5% return before expenses) | $ | 1,000.00 | $ | 1,020.39 | $ | 4.52 | 0.90 | % | ||||||||
Class R4 | ||||||||||||||||
Actual | $ | 1,000.00 | $ | 1,014.83 | $ | 1.70 | 0.34 | % | ||||||||
Hypothetical (5% return before expenses) | $ | 1,000.00 | $ | 1,023.17 | $ | 1.71 | 0.34 | % | ||||||||
Class R6 | ||||||||||||||||
Actual | $ | 1,000.00 | $ | 1,015.51 | $ | 0.95 | 0.19 | % | ||||||||
Hypothetical (5% return before expenses) | $ | 1,000.00 | $ | 1,023.92 | $ | 0.96 | 0.19 | % | ||||||||
Administrator Class | ||||||||||||||||
Actual | $ | 1,000.00 | $ | 1,013.65 | $ | 2.70 | 0.54 | % | ||||||||
Hypothetical (5% return before expenses) | $ | 1,000.00 | $ | 1,022.18 | $ | 2.72 | 0.54 | % | ||||||||
| 1 | Expenses paid is equal to the annualized net expense ratio of each class multiplied by the average account value over the period, multiplied by the number of days in the most recent fiscal half-year divided by the number of days in the fiscal year (to reflect theone-half-year period). |
46 | Target Date Retirement Funds
Table of Contents
Fund expenses (unaudited)
| Target 2025 Fund | Beginning account value 9-1-2019 | Ending account value 2-29-2020 | Expenses paid during the period¹ | Annualized net expense ratio | ||||||||||||
Class A | ||||||||||||||||
Actual | $ | 1,000.00 | $ | 1,009.99 | $ | 3.00 | 0.60 | % | ||||||||
Hypothetical (5% return before expenses) | $ | 1,000.00 | $ | 1,021.88 | $ | 3.02 | 0.60 | % | ||||||||
Class R | ||||||||||||||||
Actual | $ | 1,000.00 | $ | 1,007.91 | $ | 4.49 | 0.90 | % | ||||||||
Hypothetical (5% return before expenses) | $ | 1,000.00 | $ | 1,020.39 | $ | 4.52 | 0.90 | % | ||||||||
Class R4 | ||||||||||||||||
Actual | $ | 1,000.00 | $ | 1,012.82 | $ | 1.70 | 0.34 | % | ||||||||
Hypothetical (5% return before expenses) | $ | 1,000.00 | $ | 1,023.17 | $ | 1.71 | 0.34 | % | ||||||||
Class R6 | ||||||||||||||||
Actual | $ | 1,000.00 | $ | 1,012.72 | $ | 0.95 | 0.19 | % | ||||||||
Hypothetical (5% return before expenses) | $ | 1,000.00 | $ | 1,023.92 | $ | 0.96 | 0.19 | % | ||||||||
Administrator Class | ||||||||||||||||
Actual | $ | 1,000.00 | $ | 1,010.59 | $ | 2.70 | 0.54 | % | ||||||||
Hypothetical (5% return before expenses) | $ | 1,000.00 | $ | 1,022.18 | $ | 2.72 | 0.54 | % | ||||||||
| Target 2030 Fund | ||||||||||||||||
Class A | ||||||||||||||||
Actual | $ | 1,000.00 | $ | 1,006.23 | $ | 3.09 | 0.62 | % | ||||||||
Hypothetical (5% return before expenses) | $ | 1,000.00 | $ | 1,021.78 | $ | 3.12 | 0.62 | % | ||||||||
Class C | ||||||||||||||||
Actual | $ | 1,000.00 | $ | 1,002.56 | $ | 6.97 | 1.40 | % | ||||||||
Hypothetical (5% return before expenses) | $ | 1,000.00 | $ | 1,017.90 | $ | 7.02 | 1.40 | % | ||||||||
Class R | ||||||||||||||||
Actual | $ | 1,000.00 | $ | 1,005.58 | $ | 4.44 | 0.89 | % | ||||||||
Hypothetical (5% return before expenses) | $ | 1,000.00 | $ | 1,020.44 | $ | 4.47 | 0.89 | % | ||||||||
Class R4 | ||||||||||||||||
Actual | $ | 1,000.00 | $ | 1,008.17 | $ | 1.70 | 0.34 | % | ||||||||
Hypothetical (5% return before expenses) | $ | 1,000.00 | $ | 1,023.17 | $ | 1.71 | 0.34 | % | ||||||||
Class R6 | ||||||||||||||||
Actual | $ | 1,000.00 | $ | 1,008.85 | $ | 0.95 | 0.19 | % | ||||||||
Hypothetical (5% return before expenses) | $ | 1,000.00 | $ | 1,023.92 | $ | 0.96 | 0.19 | % | ||||||||
Administrator Class | ||||||||||||||||
Actual | $ | 1,000.00 | $ | 1,006.95 | $ | 2.69 | 0.54 | % | ||||||||
Hypothetical (5% return before expenses) | $ | 1,000.00 | $ | 1,022.18 | $ | 2.72 | 0.54 | % | ||||||||
| Target 2035 Fund | ||||||||||||||||
Class A | ||||||||||||||||
Actual | $ | 1,000.00 | $ | 1,003.01 | $ | 3.04 | 0.61 | % | ||||||||
Hypothetical (5% return before expenses) | $ | 1,000.00 | $ | 1,021.83 | $ | 3.07 | 0.61 | % | ||||||||
Class R | ||||||||||||||||
Actual | $ | 1,000.00 | $ | 1,001.01 | $ | 4.48 | 0.90 | % | ||||||||
Hypothetical (5% return before expenses) | $ | 1,000.00 | $ | 1,020.39 | $ | 4.52 | 0.90 | % | ||||||||
Class R4 | ||||||||||||||||
Actual | $ | 1,000.00 | $ | 1,004.65 | $ | 1.69 | 0.34 | % | ||||||||
Hypothetical (5% return before expenses) | $ | 1,000.00 | $ | 1,023.17 | $ | 1.71 | 0.34 | % | ||||||||
Class R6 | ||||||||||||||||
Actual | $ | 1,000.00 | $ | 1,004.85 | $ | 0.95 | 0.19 | % | ||||||||
Hypothetical (5% return before expenses) | $ | 1,000.00 | $ | 1,023.92 | $ | 0.96 | 0.19 | % | ||||||||
Administrator Class | ||||||||||||||||
Actual | $ | 1,000.00 | $ | 1,002.56 | $ | 2.69 | 0.54 | % | ||||||||
Hypothetical (5% return before expenses) | $ | 1,000.00 | $ | 1,022.18 | $ | 2.72 | 0.54 | % | ||||||||
| 1 | Expenses paid is equal to the annualized net expense ratio of each class multiplied by the average account value over the period, multiplied by the number of days in the most recent fiscal half-year divided by the number of days in the fiscal year (to reflect theone-half-year period). |
Target Date Retirement Funds | 47
Table of Contents
Fund expenses (unaudited)
| Target 2040 Fund | Beginning account value 9-1-2019 | Ending account value 2-29-2020 | Expenses paid during the period¹ | Annualized net expense ratio | ||||||||||||
Class A | ||||||||||||||||
Actual | $ | 1,000.00 | $ | 998.45 | $ | 3.13 | 0.63 | % | ||||||||
Hypothetical (5% return before expenses) | $ | 1,000.00 | $ | 1,021.73 | $ | 3.17 | 0.63 | % | ||||||||
Class C | ||||||||||||||||
Actual | $ | 1,000.00 | $ | 993.58 | $ | 6.94 | 1.40 | % | ||||||||
Hypothetical (5% return before expenses) | $ | 1,000.00 | $ | 1,017.90 | $ | 7.02 | 1.40 | % | ||||||||
Class R | ||||||||||||||||
Actual | $ | 1,000.00 | $ | 996.78 | $ | 4.47 | 0.90 | % | ||||||||
Hypothetical (5% return before expenses) | $ | 1,000.00 | $ | 1,020.39 | $ | 4.52 | 0.90 | % | ||||||||
Class R4 | ||||||||||||||||
Actual | $ | 1,000.00 | $ | 999.30 | $ | 1.69 | 0.34 | % | ||||||||
Hypothetical (5% return before expenses) | $ | 1,000.00 | $ | 1,023.17 | $ | 1.71 | 0.34 | % | ||||||||
Class R6 | ||||||||||||||||
Actual | $ | 1,000.00 | $ | 1,000.08 | $ | 0.94 | 0.19 | % | ||||||||
Hypothetical (5% return before expenses) | $ | 1,000.00 | $ | 1,023.92 | $ | 0.96 | 0.19 | % | ||||||||
Administrator Class | ||||||||||||||||
Actual | $ | 1,000.00 | $ | 998.71 | $ | 2.68 | 0.54 | % | ||||||||
Hypothetical (5% return before expenses) | $ | 1,000.00 | $ | 1,022.18 | $ | 2.72 | 0.54 | % | ||||||||
| Target 2045 Fund | ||||||||||||||||
Class A | ||||||||||||||||
Actual | $ | 1,000.00 | $ | 995.65 | $ | 3.08 | 0.62 | % | ||||||||
Hypothetical (5% return before expenses) | $ | 1,000.00 | $ | 1,021.78 | $ | 3.12 | 0.62 | % | ||||||||
Class R | ||||||||||||||||
Actual | $ | 1,000.00 | $ | 994.15 | $ | 4.46 | 0.90 | % | ||||||||
Hypothetical (5% return before expenses) | $ | 1,000.00 | $ | 1,020.39 | $ | 4.52 | 0.90 | % | ||||||||
Class R4 | ||||||||||||||||
Actual | $ | 1,000.00 | $ | 996.61 | $ | 1.69 | 0.34 | % | ||||||||
Hypothetical (5% return before expenses) | $ | 1,000.00 | $ | 1,023.17 | $ | 1.71 | 0.34 | % | ||||||||
Class R6 | ||||||||||||||||
Actual | $ | 1,000.00 | $ | 998.26 | $ | 0.94 | 0.19 | % | ||||||||
Hypothetical (5% return before expenses) | $ | 1,000.00 | $ | 1,023.92 | $ | 0.96 | 0.19 | % | ||||||||
Administrator Class | ||||||||||||||||
Actual | $ | 1,000.00 | $ | 995.65 | $ | 2.68 | 0.54 | % | ||||||||
Hypothetical (5% return before expenses) | $ | 1,000.00 | $ | 1,022.18 | $ | 2.72 | 0.54 | % | ||||||||
| Target 2050 Fund | ||||||||||||||||
Class A | ||||||||||||||||
Actual | $ | 1,000.00 | $ | 993.74 | $ | 3.07 | 0.62 | % | ||||||||
Hypothetical (5% return before expenses) | $ | 1,000.00 | $ | 1,021.78 | $ | 3.12 | 0.62 | % | ||||||||
Class C | ||||||||||||||||
Actual | $ | 1,000.00 | $ | 989.26 | $ | 6.92 | 1.40 | % | ||||||||
Hypothetical (5% return before expenses) | $ | 1,000.00 | $ | 1,017.90 | $ | 7.02 | 1.40 | % | ||||||||
Class R | ||||||||||||||||
Actual | $ | 1,000.00 | $ | 991.58 | $ | 4.46 | 0.90 | % | ||||||||
Hypothetical (5% return before expenses) | $ | 1,000.00 | $ | 1,020.39 | $ | 4.52 | 0.90 | % | ||||||||
Class R4 | ||||||||||||||||
Actual | $ | 1,000.00 | $ | 993.98 | $ | 1.69 | 0.34 | % | ||||||||
Hypothetical (5% return before expenses) | $ | 1,000.00 | $ | 1,023.17 | $ | 1.71 | 0.34 | % | ||||||||
Class R6 | ||||||||||||||||
Actual | $ | 1,000.00 | $ | 995.40 | $ | 0.94 | 0.19 | % | ||||||||
Hypothetical (5% return before expenses) | $ | 1,000.00 | $ | 1,023.92 | $ | 0.96 | 0.19 | % | ||||||||
Administrator Class | ||||||||||||||||
Actual | $ | 1,000.00 | $ | 993.38 | $ | 2.68 | 0.54 | % | ||||||||
Hypothetical (5% return before expenses) | $ | 1,000.00 | $ | 1,022.18 | $ | 2.72 | 0.54 | % | ||||||||
| 1 | Expenses paid is equal to the annualized net expense ratio of each class multiplied by the average account value over the period, multiplied by the number of days in the most recent fiscal half-year divided by the number of days in the fiscal year (to reflect theone-half-year period). |
48 | Target Date Retirement Funds
Table of Contents
Fund expenses (unaudited)
| Target 2055 Fund | Beginning account value 9-1-2019 | Ending account value 2-29-2020 | Expenses paid during the period¹ | Annualized net expense ratio | ||||||||||||
Class A | ||||||||||||||||
Actual | $ | 1,000.00 | $ | 993.03 | $ | 3.07 | 0.62 | % | ||||||||
Hypothetical (5% return before expenses) | $ | 1,000.00 | $ | 1,021.78 | $ | 3.12 | 0.62 | % | ||||||||
Class R | ||||||||||||||||
Actual | $ | 1,000.00 | $ | 992.53 | $ | 4.46 | 0.90 | % | ||||||||
Hypothetical (5% return before expenses) | $ | 1,000.00 | $ | 1,020.39 | $ | 4.52 | 0.90 | % | ||||||||
Class R4 | ||||||||||||||||
Actual | $ | 1,000.00 | $ | 994.91 | $ | 1.69 | 0.34 | % | ||||||||
Hypothetical (5% return before expenses) | $ | 1,000.00 | $ | 1,023.17 | $ | 1.71 | 0.34 | % | ||||||||
Class R6 | ||||||||||||||||
Actual | $ | 1,000.00 | $ | 995.18 | $ | 0.94 | 0.19 | % | ||||||||
Hypothetical (5% return before expenses) | $ | 1,000.00 | $ | 1,023.92 | $ | 0.96 | 0.19 | % | ||||||||
Administrator Class | ||||||||||||||||
Actual | $ | 1,000.00 | $ | 994.15 | $ | 2.68 | 0.54 | % | ||||||||
Hypothetical (5% return before expenses) | $ | 1,000.00 | $ | 1,022.18 | $ | 2.72 | 0.54 | % | ||||||||
| Target 2060 Fund | ||||||||||||||||
Class A | ||||||||||||||||
Actual | $ | 1,000.00 | $ | 993.27 | $ | 3.17 | 0.64 | % | ||||||||
Hypothetical (5% return before expenses) | $ | 1,000.00 | $ | 1,021.68 | $ | 3.22 | 0.64 | % | ||||||||
Class C | ||||||||||||||||
Actual | $ | 1,000.00 | $ | 989.49 | $ | 6.93 | 1.40 | % | ||||||||
Hypothetical (5% return before expenses) | $ | 1,000.00 | $ | 1,017.90 | $ | 7.02 | 1.40 | % | ||||||||
Class R | ||||||||||||||||
Actual | $ | 1,000.00 | $ | 992.06 | $ | 4.46 | 0.90 | % | ||||||||
Hypothetical (5% return before expenses) | $ | 1,000.00 | $ | 1,020.39 | $ | 4.52 | 0.90 | % | ||||||||
Class R4 | ||||||||||||||||
Actual | $ | 1,000.00 | $ | 994.65 | $ | 1.69 | 0.34 | % | ||||||||
Hypothetical (5% return before expenses) | $ | 1,000.00 | $ | 1,023.17 | $ | 1.71 | 0.34 | % | ||||||||
Class R6 | ||||||||||||||||
Actual | $ | 1,000.00 | $ | 995.03 | $ | 0.94 | 0.19 | % | ||||||||
Hypothetical (5% return before expenses) | $ | 1,000.00 | $ | 1,023.92 | $ | 0.96 | 0.19 | % | ||||||||
Administrator Class | ||||||||||||||||
Actual | $ | 1,000.00 | $ | 993.69 | $ | 2.68 | 0.54 | % | ||||||||
Hypothetical (5% return before expenses) | $ | 1,000.00 | $ | 1,022.18 | $ | 2.72 | 0.54 | % | ||||||||
| 1 | Expenses paid is equal to the annualized net expense ratio of each class multiplied by the average account value over the period, multiplied by the number of days in the most recent fiscal half-year divided by the number of days in the fiscal year (to reflect theone-half-year period). |
Target Date Retirement Funds | 49
Table of Contents
Portfolio of investments—February 29, 2020
| Value | ||||||||||||||||
| Investment Companies: 99.57% | ||||||||||||||||
| Affiliated Master Portfolios: 99.57% | ||||||||||||||||
Wells Fargo Bloomberg Barclays US Aggregateex-Corporate Portfolio | $ | 22,901,338 | ||||||||||||||
Wells Fargo Emerging Markets Bond Portfolio | 1,895,415 | |||||||||||||||
Wells Fargo Factor Enhanced Emerging Markets Portfolio | 1,323,937 | |||||||||||||||
Wells Fargo Factor Enhanced International Portfolio | 4,440,914 | |||||||||||||||
Wells Fargo Factor Enhanced Large Cap Portfolio | 8,346,795 | |||||||||||||||
Wells Fargo Factor Enhanced Small Cap Portfolio | 2,075,970 | |||||||||||||||
Wells Fargo High Yield Corporate Bond Portfolio | 1,865,859 | |||||||||||||||
Wells Fargo Investment Grade Corporate Bond Portfolio | 11,869,651 | |||||||||||||||
Wells Fargo Strategic Retirement Bond Portfolio | 7,722,631 | |||||||||||||||
Wells Fargo U.S. REIT Portfolio | 1,450,556 | |||||||||||||||
Total Investment Companies (Cost $56,495,254) | 63,893,066 | |||||||||||||||
|
| |||||||||||||||
| Total investments in securities (Cost $56,495,254) | 99.57 | % | 63,893,066 | |||||
Other assets and liabilities, net | 0.43 | 273,647 | ||||||
|
|
|
| |||||
| Total net assets | 100.00 | % | $ | 64,166,713 | ||||
|
|
|
| |||||
Transactions with the affiliated Master Portfolios were as follows:
| % of ownership, beginning of period | % of ownership, end of period | Net realized gains (losses) on securities transactions allocated from affiliated Master Portfolios | Net change in unrealized gains (losses) on securities transactions allocated from affiliated Master Portfolios | Interest allocated from affiliated Master Portfolios | Dividends allocated from affiliated Master Portfolios | Affiliated income allocated from affiliated Master Portfolios | Value, of period | % of net | ||||||||||||||||||||||||||||
Affiliated Master Portfolios | ||||||||||||||||||||||||||||||||||||
Wells Fargo Bloomberg Barclays US Aggregateex-Corporate Portfolio | 3.85 | % | 3.44 | % | $ | 154,813 | $ | 1,610,053 | $ | 559,441 | $ | 0 | $ | 6,898 | $ | 22,901,338 | ||||||||||||||||||||
Wells Fargo Emerging Markets Bond Portfolio | 4.56 | 4.45 | 19,585 | 45,063 | 106,738 | 0 | 343 | 1,895,415 | ||||||||||||||||||||||||||||
Wells Fargo Factor Enhanced Emerging Markets Portfolio | 0.58 | 0.61 | (43,922 | ) | (68,181 | ) | 202 | 42,691 | 827 | 1,323,937 | ||||||||||||||||||||||||||
Wells Fargo Factor Enhanced International Portfolio | 0.73 | 0.76 | 10,428 | (25,441 | ) | 312 | 137,615 | 2647 | 4,440,914 | |||||||||||||||||||||||||||
Wells Fargo Factor Enhanced Large Cap Portfolio | 0.84 | 0.87 | 718,058 | (399,248 | ) | 980 | 211,321 | 5,236 | 8,346,795 | |||||||||||||||||||||||||||
Wells Fargo Factor Enhanced Small Cap Portfolio | 0.88 | 0.90 | 71,983 | (210,279 | ) | 298 | 35,287 | 1,677 | 2,075,970 | |||||||||||||||||||||||||||
Wells Fargo High Yield Corporate Bond Portfolio | 2.31 | 3.46 | (37,249 | ) | 3,568 | 117,779 | 0 | 543 | 1,865,859 | |||||||||||||||||||||||||||
Wells Fargo Investment Grade Corporate Bond Portfolio | 4.64 | 4.53 | 175,309 | 1,178,785 | 450,272 | 0 | 1,326 | 11,869,651 | ||||||||||||||||||||||||||||
Wells Fargo Strategic Retirement Bond Portfolio | 10.90 | 10.17 | 35,893 | 374,173 | 190,142 | 0 | 511 | 7,722,631 | ||||||||||||||||||||||||||||
Wells Fargo U.S. REIT Portfolio | 3.85 | 5.66 | 191,301 | (169,839 | ) | 0 | 44,785 | 134 | 1,450,556 | |||||||||||||||||||||||||||
|
|
|
|
|
|
|
|
|
|
|
|
|
| |||||||||||||||||||||||
| $ | 1,296,199 | $ | 2,338,654 | $ | 1,426,164 | $ | 471,699 | $ | 20,142 | $ | 63,893,066 | 99.57 | % | |||||||||||||||||||||||
|
|
|
|
|
|
|
|
|
|
|
|
|
| |||||||||||||||||||||||
The accompanying notes are an integral part of these financial statements.
50 | Target Date Retirement Funds
Table of Contents
Portfolio of investments—February 29, 2020
| Value | ||||||||||||||||
| Investment Companies: 100.00% | ||||||||||||||||
| Affiliated Master Portfolios: 100.00% | ||||||||||||||||
Wells Fargo Bloomberg Barclays US Aggregateex-Corporate Portfolio | $ | 20,362,341 | ||||||||||||||
Wells Fargo Emerging Markets Bond Portfolio | 1,679,191 | |||||||||||||||
Wells Fargo Factor Enhanced Emerging Markets Portfolio | 1,277,250 | |||||||||||||||
Wells Fargo Factor Enhanced International Portfolio | 4,215,131 | |||||||||||||||
Wells Fargo Factor Enhanced Large Cap Portfolio | 7,844,881 | |||||||||||||||
Wells Fargo Factor Enhanced Small Cap Portfolio | 1,952,689 | |||||||||||||||
Wells Fargo High Yield Corporate Bond Portfolio | 1,648,043 | |||||||||||||||
Wells Fargo Investment Grade Corporate Bond Portfolio | 10,514,999 | |||||||||||||||
Wells Fargo Strategic Retirement Bond Portfolio | 6,859,297 | |||||||||||||||
Wells Fargo U.S. REIT Portfolio | 1,368,029 | |||||||||||||||
Total Investment Companies (Cost $37,841,350) | 57,721,851 | |||||||||||||||
|
| |||||||||||||||
| Total investments in securities (Cost $37,841,350) | 100.00 | % | 57,721,851 | |||||
Other assets and liabilities, net | 0.00 | (2,054 | ) | |||||
|
|
|
| |||||
| Total net assets | 100.00 | % | $ | 57,719,797 | ||||
|
|
|
| |||||
Transactions with the affiliated Master Portfolios were as follows:
| % of ownership, beginning of period | % of ownership, end of period | Net realized gains (losses) on securities transactions allocated from affiliated Master Portfolios | Net change in unrealized gains (losses) on securities transactions allocated from affiliated Master Portfolios | Interest allocated from affiliated Master Portfolios | Dividends allocated from affiliated Master Portfolios | Affiliated income allocated from affiliated Master Portfolios | Value, end of period | % of net assets | ||||||||||||||||||||||||||||
Affiliated Master Portfolios | ||||||||||||||||||||||||||||||||||||
Wells Fargo Bloomberg Barclays US Aggregateex-Corporate Portfolio | 3.71 | % | 3.06 | % | $ | 152,750 | $ | 1,459,564 | $ | 505,252 | $ | 0 | $ | 6,219 | $ | 20,362,341 | ||||||||||||||||||||
Wells Fargo Emerging Markets Bond Portfolio | 4.40 | 3.95 | 18,280 | 43,468 | 96,254 | 0 | 312 | 1,679,191 | ||||||||||||||||||||||||||||
Wells Fargo Factor Enhanced Emerging Markets Portfolio | 0.62 | 0.59 | (42,337 | ) | (72,513 | ) | 203 | 42,538 | 828 | 1,277,250 | ||||||||||||||||||||||||||
Wells Fargo Factor Enhanced International Portfolio | 0.77 | 0.72 | 10,260 | (12,739 | ) | 308 | 138,268 | 2,640 | 4,215,131 | |||||||||||||||||||||||||||
Wells Fargo Factor Enhanced Large Cap Portfolio | 0.89 | 0.82 | 704,241 | (329,098 | ) | 980 | 208,032 | 5,206 | 7,844,881 | |||||||||||||||||||||||||||
Wells Fargo Factor Enhanced Small Cap Portfolio | 0.93 | 0.85 | 69,007 | (201,500 | ) | 298 | 35,037 | 1,665 | 1,952,689 | |||||||||||||||||||||||||||
Wells Fargo High Yield Corporate Bond Portfolio | 2.22 | 3.05 | (32,718 | ) | 3,778 | 105,999 | 0 | 489 | 1,648,043 | |||||||||||||||||||||||||||
Wells Fargo Investment Grade Corporate Bond Portfolio | 4.48 | 4.01 | 164,029 | 1,076,774 | 406,283 | 0 | 1,194 | 10,514,999 | ||||||||||||||||||||||||||||
Wells Fargo Strategic Retirement Bond Portfolio | 10.52 | 9.04 | 36,664 | 335,600 | 174,193 | 0 | 462 | 6,859,297 | ||||||||||||||||||||||||||||
Wells Fargo U.S. REIT Portfolio | 4.12 | 5.34 | 189,501 | (158,103 | ) | 0 | 44,986 | 131 | 1,368,029 | |||||||||||||||||||||||||||
|
|
|
|
|
|
|
|
|
|
|
|
|
| |||||||||||||||||||||||
| $ | 1,269,677 | $ | 2,145,231 | $ | 1,289,770 | $ | 468,861 | $ | 19,146 | $ | 57,721,851 | 100.00 | % | |||||||||||||||||||||||
|
|
|
|
|
|
|
|
|
|
|
|
|
| |||||||||||||||||||||||
The accompanying notes are an integral part of these financial statements.
Target Date Retirement Funds | 51
Table of Contents
Portfolio of investments—February 29, 2020
| Value | ||||||||||||||||
| Investment Companies: 100.65% | ||||||||||||||||
| Affiliated Master Portfolios: 100.65% | ||||||||||||||||
Wells Fargo Bloomberg Barclays US Aggregateex-Corporate Portfolio | $ | 20,816,591 | ||||||||||||||
Wells Fargo Emerging Markets Bond Portfolio | 1,717,830 | |||||||||||||||
Wells Fargo Factor Enhanced Emerging Markets Portfolio | 1,600,463 | |||||||||||||||
Wells Fargo Factor Enhanced International Portfolio | 5,282,239 | |||||||||||||||
Wells Fargo Factor Enhanced Large Cap Portfolio | 9,919,645 | |||||||||||||||
Wells Fargo Factor Enhanced Small Cap Portfolio | 2,465,329 | |||||||||||||||
Wells Fargo High Yield Corporate Bond Portfolio | 1,683,087 | |||||||||||||||
Wells Fargo Investment Grade Corporate Bond Portfolio | 10,749,102 | |||||||||||||||
Wells Fargo Strategic Retirement Bond Portfolio | 7,012,044 | |||||||||||||||
Wells Fargo U.S. REIT Portfolio | 1,752,489 | |||||||||||||||
Total Investment Companies (Cost $50,801,015) | 62,998,819 | |||||||||||||||
|
| |||||||||||||||
| Total investments in securities (Cost $50,801,015) | 100.65 | % | 62,998,819 | |||||
Other assets and liabilities, net | (0.65 | ) | (406,385 | ) | ||||
|
|
|
| |||||
| Total net assets | 100.00 | % | $ | 62,592,434 | ||||
|
|
|
| |||||
Transactions with the affiliated Master Portfolios were as follows:
| % of ownership, beginning of period | % of ownership, end of period | Net realized gains (losses) on securities transactions allocated from affiliated Master Portfolios | Net change in unrealized gains (losses) on securities transactions allocated from affiliated Master Portfolios | Interest allocated from affiliated Master Portfolios | Dividends allocated from affiliated Master Portfolios | Affiliated income allocated from affiliated Master Portfolios | Value, end of period | % of net assets | ||||||||||||||||||||||||||||
Affiliated Master Portfolios | ||||||||||||||||||||||||||||||||||||
Wells Fargo Bloomberg Barclays US Aggregateex-Corporate Portfolio | 4.14 | % | 3.13 | % | $ | 314,318 | $ | 1,454,515 | $ | 541,945 | $ | 0 | $ | 6,687 | $ | 20,816,591 | ||||||||||||||||||||
Wells Fargo Emerging Markets Bond Portfolio | 4.96 | 4.04 | 31,519 | 36,299 | 103,247 | 0 | 337 | 1,717,830 | ||||||||||||||||||||||||||||
Wells Fargo Factor Enhanced Emerging Markets Portfolio | 0.86 | 0.74 | (44,089 | ) | (99,411 | ) | 275 | 57,034 | 1,124 | 1,600,463 | ||||||||||||||||||||||||||
Wells Fargo Factor Enhanced International Portfolio | 1.08 | 0.90 | 51,296 | (41,670 | ) | 413 | 188,296 | 3,572 | 5,282,239 | |||||||||||||||||||||||||||
Wells Fargo Factor Enhanced Large Cap Portfolio | 1.24 | 1.03 | 1,005,915 | (497,798 | ) | 1,323 | 279,817 | 7,032 | 9,919,645 | |||||||||||||||||||||||||||
Wells Fargo Factor Enhanced Small Cap Portfolio | 1.30 | 1.07 | 107,498 | (285,912 | ) | 402 | 47,326 | 2,248 | 2,465,329 | |||||||||||||||||||||||||||
Wells Fargo High Yield Corporate Bond Portfolio | 2.52 | 3.12 | (23,485 | ) | (4,719 | ) | 113,982 | 0 | 525 | 1,683,087 | ||||||||||||||||||||||||||
Wells Fargo Investment Grade Corporate Bond Portfolio | 5.01 | 4.10 | 254,795 | 1,093,411 | 436,094 | 0 | 1,281 | 10,749,102 | ||||||||||||||||||||||||||||
Wells Fargo Strategic Retirement Bond Portfolio | 11.73 | 9.24 | 90,076 | 323,012 | 188,421 | 0 | 493 | 7,012,044 | ||||||||||||||||||||||||||||
Wells Fargo U.S. REIT Portfolio | 5.75 | 6.84 | 263,926 | (220,885 | ) | 0 | 61,187 | 173 | 1,752,489 | |||||||||||||||||||||||||||
|
|
|
|
|
|
|
|
|
|
|
|
|
| |||||||||||||||||||||||
| $ | 2,051,769 | $ | 1,756,842 | $ | 1,386,102 | $ | 633,660 | $ | 23,472 | $ | 62,998,819 | 100.65 | % | |||||||||||||||||||||||
|
|
|
|
|
|
|
|
|
|
|
|
|
| |||||||||||||||||||||||
The accompanying notes are an integral part of these financial statements.
52 | Target Date Retirement Funds
Table of Contents
Portfolio of investments—February 29, 2020
| Value | ||||||||||||||||
| Investment Companies: 100.26% | ||||||||||||||||
| Affiliated Master Portfolios: 100.26% | ||||||||||||||||
Wells Fargo Bloomberg Barclays US Aggregateex-Corporate Portfolio | $ | 112,966,054 | ||||||||||||||
Wells Fargo Emerging Markets Bond Portfolio | 9,302,103 | |||||||||||||||
Wells Fargo Factor Enhanced Emerging Markets Portfolio | 11,199,559 | |||||||||||||||
Wells Fargo Factor Enhanced International Portfolio | 36,889,478 | |||||||||||||||
Wells Fargo Factor Enhanced Large Cap Portfolio | 68,909,574 | |||||||||||||||
Wells Fargo Factor Enhanced Small Cap Portfolio | 17,314,004 | |||||||||||||||
Wells Fargo High Yield Corporate Bond Portfolio | 9,152,870 | |||||||||||||||
Wells Fargo Investment Grade Corporate Bond Portfolio | 58,277,803 | |||||||||||||||
Wells Fargo Strategic Retirement Bond Portfolio | 34,971,188 | |||||||||||||||
Wells Fargo U.S. REIT Portfolio | 10,800,296 | |||||||||||||||
Total Investment Companies (Cost $325,671,894) | 369,782,929 | |||||||||||||||
|
| |||||||||||||||
| Total investments in securities (Cost $325,671,894) | 100.26 | % | 369,782,929 | |||||
Other assets and liabilities, net | (0.26 | ) | (960,593 | ) | ||||
|
|
|
| |||||
| Total net assets | 100.00 | % | $ | 368,822,336 | ||||
|
|
|
| |||||
Transactions with the affiliated Master Portfolios were as follows:
| % of ownership, beginning of period | % of ownership, end of period | Net realized gains (losses) on securities transactions allocated from affiliated Master Portfolios | Net change in unrealized gains (losses) on securities transactions allocated from affiliated Master Portfolios | Interest allocated from affiliated Master Portfolios | Dividends allocated from affiliated Master Portfolios | Affiliated income allocated from affiliated Master Portfolios | Value, end of period | % of net assets | ||||||||||||||||||||||||||||
Affiliated Master Portfolios | ||||||||||||||||||||||||||||||||||||
Wells Fargo Bloomberg Barclays US Aggregateex-Corporate Portfolio | 18.88 | % | 16.98 | % | $ | 726,103 | $ | 7,601,672 | $ | 2,708,243 | $ | 0 | $ | 33,386 | $ | 112,966,054 | ||||||||||||||||||||
Wells Fargo Emerging Markets Bond Portfolio | 22.29 | 21.86 | 92,129 | 208,085 | 514,798 | 0 | 1,657 | 9,302,103 | ||||||||||||||||||||||||||||
Wells Fargo Factor Enhanced Emerging Markets Portfolio | 5.25 | 5.16 | (386,758 | ) | (559,469 | ) | 1,799 | 376,598 | 7,299 | 11,199,559 | ||||||||||||||||||||||||||
Wells Fargo Factor Enhanced International Portfolio | 6.54 | 6.30 | 65,244 | 104,819 | 2,739 | 1,216,579 | 23,365 | 36,889,478 | ||||||||||||||||||||||||||||
Wells Fargo Factor Enhanced Large Cap Portfolio | 7.38 | 7.17 | 6,154,316 | (2,693,895 | ) | 8,496 | 1,822,832 | 45,424 | 68,909,574 | |||||||||||||||||||||||||||
Wells Fargo Factor Enhanced Small Cap Portfolio | 7.78 | 7.54 | 610,381 | (1,676,733 | ) | 2,594 | 304,109 | 14,498 | 17,314,004 | |||||||||||||||||||||||||||
Wells Fargo High Yield Corporate Bond Portfolio | 11.26 | 16.95 | (181,941 | ) | 10,478 | 568,020 | 0 | 2,621 | 9,152,870 | |||||||||||||||||||||||||||
Wells Fargo Investment Grade Corporate Bond Portfolio | 22.77 | 22.25 | 835,289 | 5,605,583 | 2,179,217 | 0 | 6,415 | 58,277,803 | ||||||||||||||||||||||||||||
Wells Fargo Strategic Retirement Bond Portfolio | 44.53 | 46.07 | 144,524 | 1,450,969 | 769,602 | 0 | 2,121 | 34,971,188 | ||||||||||||||||||||||||||||
Wells Fargo U.S. REIT Portfolio | 27.64 | 42.17 | 1,350,597 | (1,246,152 | ) | 0 | 315,823 | 952 | 10,800,296 | |||||||||||||||||||||||||||
|
|
|
|
|
|
|
|
|
|
|
|
|
| |||||||||||||||||||||||
| $ | 9,409,884 | $ | 8,805,357 | $ | 6,755,508 | $ | 4,035,941 | $ | 137,738 | $ | 369,782,929 | 100.26 | % | |||||||||||||||||||||||
|
|
|
|
|
|
|
|
|
|
|
|
|
| |||||||||||||||||||||||
The accompanying notes are an integral part of these financial statements.
Target Date Retirement Funds | 53
Table of Contents
Portfolio of investments—February 29, 2020
| Value | ||||||||||||||||
| Investment Companies: 100.08% | ||||||||||||||||
| Affiliated Master Portfolios: 100.08% | ||||||||||||||||
Wells Fargo Bloomberg Barclays US Aggregateex-Corporate Portfolio | $ | 68,135,753 | ||||||||||||||
Wells Fargo Emerging Markets Bond Portfolio | 5,606,503 | |||||||||||||||
Wells Fargo Factor Enhanced Emerging Markets Portfolio | 10,103,923 | |||||||||||||||
Wells Fargo Factor Enhanced International Portfolio | 33,225,318 | |||||||||||||||
Wells Fargo Factor Enhanced Large Cap Portfolio | 59,131,208 | |||||||||||||||
Wells Fargo Factor Enhanced Small Cap Portfolio | 14,779,867 | |||||||||||||||
Wells Fargo High Yield Corporate Bond Portfolio | 5,512,065 | |||||||||||||||
Wells Fargo Investment Grade Corporate Bond Portfolio | 35,320,544 | |||||||||||||||
Wells Fargo Strategic Retirement Bond Portfolio | 11,196,647 | |||||||||||||||
Wells Fargo U.S. REIT Portfolio | 5,183,218 | |||||||||||||||
Total Investment Companies (Cost $224,424,110) | 248,195,046 | |||||||||||||||
|
| |||||||||||||||
| Total investments in securities (Cost $224,424,110) | 100.08 | % | 248,195,046 | |||||
Other assets and liabilities, net | (0.08 | ) | (204,792 | ) | ||||
|
|
|
| |||||
| Total net assets | 100.00 | % | $ | 247,990,254 | ||||
|
|
|
| |||||
Transactions with the affiliated Master Portfolios were as follows:
| % of ownership, beginning of period | % of ownership, end of period | Net realized gains (losses) on securities transactions allocated from affiliated Master Portfolios | Net change in unrealized gains (losses) on securities transactions allocated from affiliated Master Portfolios | Interest allocated from affiliated Master Portfolios | Dividends allocated from affiliated Master Portfolios | Affiliated income allocated from affiliated Master Portfolios | Value, end of period | % of net assets | ||||||||||||||||||||||||||||
Affiliated Master Portfolios | ||||||||||||||||||||||||||||||||||||
Wells Fargo Bloomberg Barclays US Aggregateex-Corporate Portfolio | 12.05 | % | 10.24 | % | $ | 1,085,241 | $ | 4,307,405 | $ | 1,702,847 | $ | 0 | $ | 21,017 | $ | 68,135,753 | ||||||||||||||||||||
Wells Fargo Emerging Markets Bond Portfolio | 14.31 | 13.18 | 107,949 | 97,092 | 320,929 | 0 | 1,038 | 5,606,503 | ||||||||||||||||||||||||||||
Wells Fargo Factor Enhanced Emerging Markets Portfolio | 4.98 | 4.66 | (262,364 | ) | (572,066 | ) | 1,620 | 349,830 | 6,816 | 10,103,923 | ||||||||||||||||||||||||||
Wells Fargo Factor Enhanced International Portfolio | 6.25 | 5.67 | 364,754 | (217,509 | ) | 2,377 | 1,138,685 | 21,787 | 33,225,318 | |||||||||||||||||||||||||||
Wells Fargo Factor Enhanced Large Cap Portfolio | 6.78 | 6.15 | 5,984,995 | (3,020,982 | ) | 7,296 | 1,620,097 | 40,561 | 59,131,208 | |||||||||||||||||||||||||||
Wells Fargo Factor Enhanced Small Cap Portfolio | 7.13 | 6.44 | 667,171 | (1,605,419 | ) | 2,247 | 270,519 | 12,960 | 14,779,867 | |||||||||||||||||||||||||||
Wells Fargo High Yield Corporate Bond Portfolio | 7.26 | 10.21 | (63,357 | ) | (22,742 | ) | 353,972 | 0 | 1,633 | 5,512,065 | ||||||||||||||||||||||||||
Wells Fargo Investment Grade Corporate Bond Portfolio | 14.61 | 13.49 | 853,504 | 3,296,130 | 1,370,421 | 0 | 4,032 | 35,320,544 | ||||||||||||||||||||||||||||
Wells Fargo Strategic Retirement Bond Portfolio | 14.18 | 14.75 | 150,098 | 393,274 | 243,800 | 0 | 674 | 11,196,647 | ||||||||||||||||||||||||||||
Wells Fargo U.S. REIT Portfolio | 12.83 | 20.24 | 655,090 | (633,626 | ) | 0 | 143,932 | 435 | 5,183,218 | |||||||||||||||||||||||||||
|
|
|
|
|
|
|
|
|
|
|
|
|
| |||||||||||||||||||||||
| $ | 9,543,081 | $ | 2,021,557 | $ | 4,005,509 | $ | 3,523,063 | $ | 110,953 | $ | 248,195,046 | 100.08 | % | |||||||||||||||||||||||
|
|
|
|
|
|
|
|
|
|
|
|
|
| |||||||||||||||||||||||
The accompanying notes are an integral part of these financial statements.
54 | Target Date Retirement Funds
Table of Contents
Portfolio of investments—February 29, 2020
| Value | ||||||||||||||||
| Investment Companies: 100.15% | ||||||||||||||||
| Affiliated Master Portfolios: 100.15% | ||||||||||||||||
Wells Fargo Bloomberg Barclays US Aggregateex-Corporate Portfolio | $ | 124,815,696 | ||||||||||||||
Wells Fargo Emerging Markets Bond Portfolio | 10,173,419 | |||||||||||||||
Wells Fargo Factor Enhanced Emerging Markets Portfolio | 27,330,320 | |||||||||||||||
Wells Fargo Factor Enhanced International Portfolio | 90,174,111 | |||||||||||||||
Wells Fargo Factor Enhanced Large Cap Portfolio | 153,797,438 | |||||||||||||||
Wells Fargo Factor Enhanced Small Cap Portfolio | 38,386,472 | |||||||||||||||
Wells Fargo High Yield Corporate Bond Portfolio | 10,044,507 | |||||||||||||||
Wells Fargo Investment Grade Corporate Bond Portfolio | 64,677,796 | |||||||||||||||
Wells Fargo Strategic Retirement Bond Portfolio | 6,071,987 | |||||||||||||||
Wells Fargo U.S. REIT Portfolio | 3,997,079 | |||||||||||||||
Total Investment Companies (Cost $486,322,891) | 529,468,825 | |||||||||||||||
|
| |||||||||||||||
| Total investments in securities (Cost $486,322,891) | 100.15 | % | 529,468,825 | |||||
Other assets and liabilities, net | (0.15 | ) | (799,549 | ) | ||||
|
|
|
| |||||
| Total net assets | 100.00 | % | $ | 528,669,276 | ||||
|
|
|
| |||||
Transactions with the affiliated Master Portfolios were as follows:
| % of ownership, beginning of period | % of ownership, end of period | Net realized gains (losses) on securities transactions allocated from affiliated Master Portfolios | Net change in unrealized gains (losses) on securities transactions allocated from affiliated Master Portfolios | Interest allocated from affiliated Master Portfolios | Dividends allocated from affiliated Master Portfolios | Affiliated income allocated from affiliated Master Portfolios | Value, end of period | % of net assets | ||||||||||||||||||||||||||||
Affiliated Master Portfolios | ||||||||||||||||||||||||||||||||||||
Wells Fargo Bloomberg Barclays US Aggregateex-Corporate Portfolio | 18.92 | % | 18.76 | % | $ | 826,077 | $ | 8,231,024 | $ | 2,812,223 | $ | 0 | $ | 34,616 | $ | 124,815,696 | ||||||||||||||||||||
Wells Fargo Emerging Markets Bond Portfolio | 22.13 | 23.91 | 102,589 | 221,633 | 529,763 | 0 | 1,700 | 10,173,419 | ||||||||||||||||||||||||||||
Wells Fargo Factor Enhanced Emerging Markets Portfolio | 11.68 | 12.59 | (883,282 | ) | (1,496,042 | ) | 3,948 | 861,177 | 16,570 | 27,330,320 | ||||||||||||||||||||||||||
Wells Fargo Factor Enhanced International Portfolio | 14.90 | 15.39 | 228,681 | (514,268 | ) | 5,953 | 2,835,861 | 54,704 | 90,174,111 | |||||||||||||||||||||||||||
Wells Fargo Factor Enhanced Large Cap Portfolio | 15.17 | 16.00 | 13,310,342 | (7,752,029 | ) | 17,166 | 3,880,424 | 96,087 | 153,797,438 | |||||||||||||||||||||||||||
Wells Fargo Factor Enhanced Small Cap Portfolio | 15.48 | 16.72 | 1,317,529 | (4,029,811 | ) | 5,115 | 625,877 | 29,769 | 38,386,472 | |||||||||||||||||||||||||||
Wells Fargo High Yield Corporate Bond Portfolio | 11.18 | 18.60 | (178,543 | ) | 421 | 585,266 | 0 | 2,701 | 10,044,507 | |||||||||||||||||||||||||||
Wells Fargo Investment Grade Corporate Bond Portfolio | 22.84 | 24.69 | 902,045 | 5,953,035 | 2,264,971 | 0 | 6,686 | 64,677,796 | ||||||||||||||||||||||||||||
Wells Fargo Strategic Retirement Bond Portfolio | 6.08 | 8.00 | 25,429 | 231,092 | 108,479 | 0 | 318 | 6,071,987 | ||||||||||||||||||||||||||||
Wells Fargo U.S. REIT Portfolio | 6.30 | 15.61 | 331,520 | (447,548 | ) | 0 | 76,897 | 254 | 3,997,079 | |||||||||||||||||||||||||||
|
|
|
|
|
|
|
|
|
|
|
|
|
| |||||||||||||||||||||||
| $ | 15,982,387 | $ | 397,507 | $ | 6,332,884 | $ | 8,280,236 | $ | 243,405 | $ | 529,468,825 | 100.15 | % | |||||||||||||||||||||||
|
|
|
|
|
|
|
|
|
|
|
|
|
| |||||||||||||||||||||||
The accompanying notes are an integral part of these financial statements.
Target Date Retirement Funds | 55
Table of Contents
Portfolio of investments—February 29, 2020
| Value | ||||||||||||||||
| Investment Companies: 100.14% | ||||||||||||||||
| Affiliated Master Portfolios: 100.14% | ||||||||||||||||
Wells Fargo Bloomberg Barclays US Aggregateex-Corporate Portfolio | $ | 39,411,021 | ||||||||||||||
Wells Fargo Emerging Markets Bond Portfolio | 3,242,850 | |||||||||||||||
Wells Fargo Factor Enhanced Emerging Markets Portfolio | 13,703,377 | |||||||||||||||
Wells Fargo Factor Enhanced International Portfolio | 45,557,652 | |||||||||||||||
Wells Fargo Factor Enhanced Large Cap Portfolio | 74,536,900 | |||||||||||||||
Wells Fargo Factor Enhanced Small Cap Portfolio | 18,621,674 | |||||||||||||||
Wells Fargo High Yield Corporate Bond Portfolio | 3,187,292 | |||||||||||||||
Wells Fargo Investment Grade Corporate Bond Portfolio | 20,397,848 | |||||||||||||||
Total Investment Companies (Cost $203,523,534) | 218,658,614 | |||||||||||||||
|
| |||||||||||||||
| Total investments in securities (Cost $203,523,534) | 100.14 | % | 218,658,614 | |||||
Other assets and liabilities, net | (0.14 | ) | (312,214 | ) | ||||
|
|
|
| |||||
| Total net assets | 100.00 | % | $ | 218,346,400 | ||||
|
|
|
| |||||
Transactions with the affiliated Master Portfolios were as follows:
| % of ownership, beginning of period | % of ownership, end of period | Net realized gains (losses) on securities transactions allocated from affiliated Master Portfolios | Net change in unrealized gains (losses) on securities transactions allocated from affiliated Master Portfolios | Interest allocated from affiliated Master Portfolios | Dividends allocated from affiliated Master Portfolios | Affiliated income allocated from affiliated Master Portfolios | Value, end of period | % of net assets | ||||||||||||||||||||||||||||
Affiliated Master Portfolios | ||||||||||||||||||||||||||||||||||||
Wells Fargo Bloomberg Barclays US Aggregateex-Corporate Portfolio | 6.69 | % | 5.92 | % | $ | 264,646 | $ | 2,716,463 | $ | 926,096 | $ | 0 | $ | 11,422 | $ | 39,411,021 | ||||||||||||||||||||
Wells Fargo Emerging Markets Bond Portfolio | 7.91 | 7.62 | 32,021 | 77,153 | 175,100 | 0 | 569 | 3,242,850 | ||||||||||||||||||||||||||||
Wells Fargo Factor Enhanced Emerging Markets Portfolio | 6.61 | 6.31 | (467,362 | ) | (689,622 | ) | 2,119 | 463,658 | 9,074 | 13,703,377 | ||||||||||||||||||||||||||
Wells Fargo Factor Enhanced International Portfolio | 8.33 | 7.78 | 96,333 | (66,573 | ) | 3,054 | 1,517,411 | 29,037 | 45,557,652 | |||||||||||||||||||||||||||
Wells Fargo Factor Enhanced Large Cap Portfolio | 8.33 | 7.75 | 6,656,095 | (3,381,176 | ) | 8,735 | 1,980,776 | 49,518 | 74,536,900 | |||||||||||||||||||||||||||
Wells Fargo Factor Enhanced Small Cap Portfolio | 8.77 | 8.11 | 644,631 | (1,867,433 | ) | 2,705 | 332,467 | 15,891 | 18,621,674 | |||||||||||||||||||||||||||
Wells Fargo High Yield Corporate Bond Portfolio | 4.01 | 5.90 | (60,883 | ) | 7,763 | 193,327 | 0 | 891 | 3,187,292 | |||||||||||||||||||||||||||
Wells Fargo Investment Grade Corporate Bond Portfolio | 8.06 | 7.79 | 293,554 | 1,975,678 | 744,925 | 0 | 2,200 | 20,397,848 | ||||||||||||||||||||||||||||
|
|
|
|
|
|
|
|
|
|
|
|
|
| |||||||||||||||||||||||
| $ | 7,459,035 | $ | (1,227,747 | ) | $ | 2,056,061 | $ | 4,294,312 | $ | 118,602 | $ | 218,658,614 | 100.14 | % | ||||||||||||||||||||||
|
|
|
|
|
|
|
|
|
|
|
|
|
| |||||||||||||||||||||||
The accompanying notes are an integral part of these financial statements.
56 | Target Date Retirement Funds
Table of Contents
Portfolio of investments—February 29, 2020
| Value | ||||||||||||||||
| Investment Companies: 100.02% | ||||||||||||||||
| Affiliated Master Portfolios: 100.02% | ||||||||||||||||
Wells Fargo Bloomberg Barclays US Aggregateex-Corporate Portfolio | $ | 57,737,605 | ||||||||||||||
Wells Fargo Emerging Markets Bond Portfolio | 4,748,930 | |||||||||||||||
Wells Fargo Factor Enhanced Emerging Markets Portfolio | 34,374,422 | |||||||||||||||
Wells Fargo Factor Enhanced International Portfolio | 113,276,195 | |||||||||||||||
Wells Fargo Factor Enhanced Large Cap Portfolio | 179,070,472 | |||||||||||||||
Wells Fargo Factor Enhanced Small Cap Portfolio | 44,600,910 | |||||||||||||||
Wells Fargo High Yield Corporate Bond Portfolio | 4,673,222 | |||||||||||||||
Wells Fargo Investment Grade Corporate Bond Portfolio | 29,902,864 | |||||||||||||||
Total Investment Companies (Cost $441,025,905) | 468,384,620 | |||||||||||||||
|
| |||||||||||||||
| Total investments in securities (Cost $441,025,905) | 100.02 | % | 468,384,620 | |||||
Other assets and liabilities, net | (0.02 | ) | (84,275 | ) | ||||
|
|
|
| |||||
| Total net assets | 100.00 | % | $ | 468,300,345 | ||||
|
|
|
| |||||
Transactions with the affiliated Master Portfolios were as follows:
| % of ownership, beginning of period | % of ownership, end of period | Net realized gains (losses) on securities transactions allocated from affiliated Master Portfolios | Net change in unrealized gains (losses) on securities transactions allocated from affiliated Master Portfolios | Interest allocated from affiliated Master Portfolios | Dividends allocated from affiliated Master Portfolios | Affiliated income allocated from affiliated Master Portfolios | Value, end of period | % of net assets | ||||||||||||||||||||||||||||
Affiliated Master Portfolios | ||||||||||||||||||||||||||||||||||||
Wells Fargo Bloomberg Barclays US Aggregateex-Corporate Portfolio | 8.60 | % | 8.68 | % | $ | 158,737 | $ | 3,986,592 | $ | 1,275,891 | $ | 0 | $ | 15,688 | $ | 57,737,605 | ||||||||||||||||||||
Wells Fargo Emerging Markets Bond Portfolio | 10.09 | 11.16 | 29,403 | 116,357 | 241,470 | 0 | 775 | 4,748,930 | ||||||||||||||||||||||||||||
Wells Fargo Factor Enhanced Emerging Markets Portfolio | 13.86 | 15.84 | (1,195,695 | ) | (1,813,741 | ) | 4,693 | 1,038,597 | 19,937 | 34,374,422 | ||||||||||||||||||||||||||
Wells Fargo Factor Enhanced International Portfolio | 17.50 | 19.34 | (114,833 | ) | (901,067 | ) | 6,827 | 3,345,442 | 64,620 | 113,276,195 | ||||||||||||||||||||||||||
Wells Fargo Factor Enhanced Large Cap Portfolio | 16.87 | 18.63 | 14,288,383 | (9,046,755 | ) | 18,837 | 4,344,360 | 107,220 | 179,070,472 | |||||||||||||||||||||||||||
Wells Fargo Factor Enhanced Small Cap Portfolio | 17.79 | 19.43 | 1,356,514 | (4,546,703 | ) | 5,806 | 719,560 | 34,192 | 44,600,910 | |||||||||||||||||||||||||||
Wells Fargo High Yield Corporate Bond Portfolio | 5.10 | 8.66 | (98,415 | ) | 13,040 | 266,475 | 0 | 1,228 | 4,673,222 | |||||||||||||||||||||||||||
Wells Fargo Investment Grade Corporate Bond Portfolio | 10.36 | 11.42 | 295,296 | 2,830,022 | 1,026,709 | 0 | 3,034 | 29,902,864 | ||||||||||||||||||||||||||||
|
|
|
|
|
|
|
|
|
|
|
|
|
| |||||||||||||||||||||||
| $ | 14,719,390 | $ | (9,362,255 | ) | $ | 2,846,708 | $ | 9,447,959 | $ | 246,694 | $ | 468,384,620 | 100.02 | % | ||||||||||||||||||||||
|
|
|
|
|
|
|
|
|
|
|
|
|
| |||||||||||||||||||||||
The accompanying notes are an integral part of these financial statements.
Target Date Retirement Funds | 57
Table of Contents
Portfolio of investments—February 29, 2020
| Value | ||||||||||||||||
| Investment Companies: 100.14% | ||||||||||||||||
| Affiliated Master Portfolios: 100.14% | ||||||||||||||||
Wells Fargo Bloomberg Barclays US Aggregateex-Corporate Portfolio | $ | 10,213,782 | ||||||||||||||
Wells Fargo Emerging Markets Bond Portfolio | 834,101 | |||||||||||||||
Wells Fargo Factor Enhanced Emerging Markets Portfolio | 8,734,141 | |||||||||||||||
Wells Fargo Factor Enhanced International Portfolio | 28,834,801 | |||||||||||||||
Wells Fargo Factor Enhanced Large Cap Portfolio | 44,718,161 | |||||||||||||||
Wells Fargo Factor Enhanced Small Cap Portfolio | 11,248,915 | |||||||||||||||
Wells Fargo High Yield Corporate Bond Portfolio | 822,220 | |||||||||||||||
Wells Fargo Investment Grade Corporate Bond Portfolio | 5,260,423 | |||||||||||||||
Total Investment Companies (Cost $104,512,593) | 110,666,544 | |||||||||||||||
|
| |||||||||||||||
| Total investments in securities (Cost $104,512,593) | 100.14 | % | 110,666,544 | |||||
Other assets and liabilities, net | (0.14 | ) | (149,410 | ) | ||||
|
|
|
| |||||
| Total net assets | 100.00 | % | $ | 110,517,134 | ||||
|
|
|
| |||||
Transactions with the affiliated Master Portfolios were as follows:
| % of ownership, beginning of period | % of ownership, end of period | Net realized gains (losses) on securities transactions allocated from affiliated Master Portfolios | Net change in unrealized gains (losses) on securities transactions allocated from affiliated Master Portfolios | Interest allocated from affiliated Master Portfolios | Dividends allocated from affiliated Master Portfolios | Affiliated Income allocated from affiliated Master Portfolios | Value, end of period | % of net assets | ||||||||||||||||||||||||||||
Affiliated Master Portfolios | ||||||||||||||||||||||||||||||||||||
Wells Fargo Bloomberg Barclays US Aggregateex-Corporate Portfolio | 1.97 | % | 1.53 | % | $ | 44,311 | $ | 725,129 | $ | 254,860 | $ | 0 | $ | 3,150 | $ | 10,213,782 | ||||||||||||||||||||
Wells Fargo Emerging Markets Bond Portfolio | 2.33 | 1.96 | 5,923 | 23,444 | 48,072 | 0 | 159 | 834,101 | ||||||||||||||||||||||||||||
Wells Fargo Factor Enhanced Emerging Markets Portfolio | 4.82 | 4.02 | (322,609 | ) | (408,695 | ) | 1,509 | 314,178 | 6,242 | 8,734,141 | ||||||||||||||||||||||||||
Wells Fargo Factor Enhanced International Portfolio | 5.96 | 4.92 | (24,622 | ) | 80,787 | 2,227 | 1,040,464 | 19,706 | 28,834,801 | |||||||||||||||||||||||||||
Wells Fargo Factor Enhanced Large Cap Portfolio | 5.61 | 4.65 | 3,894,894 | (1,596,226 | ) | 5,905 | 1,251,553 | 31,616 | 44,718,161 | |||||||||||||||||||||||||||
Wells Fargo Factor Enhanced Small Cap Portfolio | 5.91 | 4.90 | 337,100 | (1,071,664 | ) | 1,810 | 212,951 | 10,141 | 11,248,915 | |||||||||||||||||||||||||||
Wells Fargo High Yield Corporate Bond Portfolio | 1.18 | 1.52 | (18,673 | ) | 5,887 | 53,114 | 0 | 245 | 822,220 | |||||||||||||||||||||||||||
Wells Fargo Investment Grade Corporate Bond Portfolio | 2.38 | 2.01 | 64,659 | 526,176 | 204,762 | 0 | 605 | 5,260,423 | ||||||||||||||||||||||||||||
|
|
|
|
|
|
|
|
|
|
|
|
|
| |||||||||||||||||||||||
| $ | 3,980,983 | $ | (1,715,162 | ) | $ | 572,259 | $ | 2,819,146 | $ | 71,864 | $ | 110,666,544 | 100.14 | % | ||||||||||||||||||||||
|
|
|
|
|
|
|
|
|
|
|
|
|
| |||||||||||||||||||||||
The accompanying notes are an integral part of these financial statements.
58 | Target Date Retirement Funds
Table of Contents
Portfolio of investments—February 29, 2020
| Value | ||||||||||||||||
| Investment Companies: 99.91% | ||||||||||||||||
| Affiliated Master Portfolios: 99.91% | ||||||||||||||||
Wells Fargo Bloomberg Barclays US Aggregateex-Corporate Portfolio | $ | 13,822,144 | ||||||||||||||
Wells Fargo Emerging Markets Bond Portfolio | 1,135,056 | |||||||||||||||
Wells Fargo Factor Enhanced Emerging Markets Portfolio | 17,871,989 | |||||||||||||||
Wells Fargo Factor Enhanced International Portfolio | 59,213,487 | |||||||||||||||
Wells Fargo Factor Enhanced Large Cap Portfolio | 89,984,400 | |||||||||||||||
Wells Fargo Factor Enhanced Small Cap Portfolio | 22,471,197 | |||||||||||||||
Wells Fargo High Yield Corporate Bond Portfolio | 1,120,313 | |||||||||||||||
Wells Fargo Investment Grade Corporate Bond Portfolio | 7,167,964 | |||||||||||||||
Total Investment Companies (Cost $199,632,732) | 212,786,550 | |||||||||||||||
|
| |||||||||||||||
| Total investments in securities (Cost $199,632,732) | 99.91 | % | 212,786,550 | |||||
Other assets and liabilities, net | 0.09 | 184,614 | ||||||
|
|
|
| |||||
| Total net assets | 100.00 | % | $ | 212,971,164 | ||||
|
|
|
| |||||
Transactions with the affiliated Master Portfolios were as follows:
| % of ownership, beginning of period | % of ownership, end of period | Net realized gains (losses) on securities transactions allocated from affiliated Master Portfolios | Net change in unrealized gains (losses) on securities transactions allocated from affiliated Master Portfolios | Interest allocated from affiliated Master Portfolios | Dividends allocated from affiliated Master Portfolios | Affiliated Income allocated from affiliated Master Portfolios | Value, end of period | % of net assets | ||||||||||||||||||||||||||||
Affiliated Master Portfolios | ||||||||||||||||||||||||||||||||||||
Wells Fargo Bloomberg Barclays US Aggregateex-Corporate Portfolio | 2.15 | % | 2.08 | % | $ | 68,989 | $ | 1,152,855 | $ | 321,561 | $ | 0 | $ | 3,969 | $ | 13,822,144 | ||||||||||||||||||||
Wells Fargo Emerging Markets Bond Portfolio | 2.52 | 2.67 | 10,368 | 34,008 | 60,797 | 0 | 195 | 1,135,056 | ||||||||||||||||||||||||||||
Wells Fargo Factor Enhanced Emerging Markets Portfolio | 7.10 | 8.24 | (674,367 | ) | (1,125,409 | ) | 2,520 | 533,429 | 10,252 | 17,871,989 | ||||||||||||||||||||||||||
Wells Fargo Factor Enhanced International Portfolio | 8.80 | 10.11 | 25,406 | (808,643 | ) | 3,855 | 1,708,197 | 33,029 | 59,213,487 | |||||||||||||||||||||||||||
Wells Fargo Factor Enhanced Large Cap Portfolio | 8.18 | 9.36 | 8,217,965 | (5,638,871 | ) | 9,822 | 2,139,149 | 52,721 | 89,984,400 | |||||||||||||||||||||||||||
Wells Fargo Factor Enhanced Small Cap Portfolio | 8.61 | 9.79 | 803,139 | (2,677,493 | ) | 3,012 | 356,179 | 16,952 | 22,471,197 | |||||||||||||||||||||||||||
Wells Fargo High Yield Corporate Bond Portfolio | 1.27 | 2.08 | (26,761 | ) | 4,619 | 67,119 | 0 | 310 | 1,120,313 | |||||||||||||||||||||||||||
Wells Fargo Investment Grade Corporate Bond Portfolio | 2.59 | 2.74 | 97,690 | 824,402 | 258,660 | 0 | 766 | 7,167,964 | ||||||||||||||||||||||||||||
|
|
|
|
|
|
|
|
|
|
|
|
|
| |||||||||||||||||||||||
| $ | 8,522,429 | $ | (8,234,532 | ) | $ | 727,346 | $ | 4,736,954 | $ | 118,194 | $ | 212,786,550 | 99.91 | % | ||||||||||||||||||||||
|
|
|
|
|
|
|
|
|
|
|
|
|
| |||||||||||||||||||||||
The accompanying notes are an integral part of these financial statements.
Target Date Retirement Funds | 59
Table of Contents
Portfolio of investments—February 29, 2020
| Value | ||||||||||||||||
| Investment Companies: 100.62% | ||||||||||||||||
| Affiliated Master Portfolios: 100.62% | ||||||||||||||||
Wells Fargo Bloomberg Barclays US Aggregateex-Corporate Portfolio | $ | 2,286,147 | ||||||||||||||
Wells Fargo Emerging Markets Bond Portfolio | 186,727 | |||||||||||||||
Wells Fargo Factor Enhanced Emerging Markets Portfolio | 2,947,668 | |||||||||||||||
Wells Fargo Factor Enhanced International Portfolio | 9,756,886 | |||||||||||||||
Wells Fargo Factor Enhanced Large Cap Portfolio | 14,740,495 | |||||||||||||||
Wells Fargo Factor Enhanced Small Cap Portfolio | 3,677,320 | |||||||||||||||
Wells Fargo High Yield Corporate Bond Portfolio | 184,338 | |||||||||||||||
Wells Fargo Investment Grade Corporate Bond Portfolio | 1,180,319 | |||||||||||||||
Total Investment Companies (Cost $35,299,236) | 34,959,900 | |||||||||||||||
|
| |||||||||||||||
| Total investments in securities (Cost $35,299,236) | 100.62 | % | 34,959,900 | |||||
Other assets and liabilities, net | (0.62 | ) | (214,030 | ) | ||||
|
|
|
| |||||
| Total net assets | 100.00 | % | $ | 34,745,870 | ||||
|
|
|
| |||||
Transactions with the affiliated Master Portfolios were as follows:
| % of ownership, beginning of period | % of ownership, end of period | Net realized gains (losses) on securities transactions allocated from affiliated Master Portfolios | Net change in unrealized gains (losses) on securities transactions allocated from affiliated Master Portfolios | Interest allocated from affiliated Master Portfolios | Dividends allocated from affiliated Master Portfolios | Affiliated Income allocated from affiliated Master Portfolios | Value, end of period | % of net assets | ||||||||||||||||||||||||||||
Affiliated Master Portfolios | ||||||||||||||||||||||||||||||||||||
Wells Fargo Bloomberg Barclays US Aggregateex-Corporate Portfolio | 0.37 | % | 0.34 | % | $ | 6,263 | $ | 88,033 | $ | 54,555 | $ | 0 | $ | 676 | $ | 2,286,147 | ||||||||||||||||||||
Wells Fargo Emerging Markets Bond Portfolio | 0.44 | 0.44 | 914 | 2,671 | 10,321 | 0 | 33 | 186,727 | ||||||||||||||||||||||||||||
Wells Fargo Factor Enhanced Emerging Markets Portfolio | 1.24 | 1.36 | (61,577 | ) | (87,210 | ) | 428 | 90,733 | 1,760 | 2,947,668 | ||||||||||||||||||||||||||
Wells Fargo Factor Enhanced International Portfolio | 1.53 | 1.67 | 209 | (48,871 | ) | 654 | 290,211 | 5,631 | 9,756,886 | |||||||||||||||||||||||||||
Wells Fargo Factor Enhanced Large Cap Portfolio | 1.43 | 1.53 | 740,700 | (395,880 | ) | 1,660 | 362,449 | 8,948 | 14,740,495 | |||||||||||||||||||||||||||
Wells Fargo Factor Enhanced Small Cap Portfolio | 1.50 | 1.60 | 71,413 | (196,891 | ) | 510 | 60,929 | 2,894 | 3,677,320 | |||||||||||||||||||||||||||
Wells Fargo High Yield Corporate Bond Portfolio | 0.22 | 0.34 | (2,466 | ) | 541 | 11,399 | 0 | 53 | 184,338 | |||||||||||||||||||||||||||
Wells Fargo Investment Grade Corporate Bond Portfolio | 0.45 | 0.45 | 9,007 | 64,186 | 43,864 | 0 | 130 | 1,180,319 | ||||||||||||||||||||||||||||
|
|
|
|
|
|
|
|
|
|
|
|
|
| |||||||||||||||||||||||
| $ | 764,463 | $ | (573,421 | ) | $ | 123,391 | $ | 804,322 | $ | 20,125 | $ | 34,959,900 | 100.62 | % | ||||||||||||||||||||||
|
|
|
|
|
|
|
|
|
|
|
|
|
| |||||||||||||||||||||||
The accompanying notes are an integral part of these financial statements.
60 | Target Date Retirement Funds
Table of Contents
Portfolio of investments—February 29, 2020
| Value | ||||||||||||||||
| Investment Companies: 100.41% | ||||||||||||||||
| Affiliated Master Portfolios: 100.41% | ||||||||||||||||
Wells Fargo Bloomberg Barclays US Aggregateex-Corporate Portfolio | $ | 1,445,369 | ||||||||||||||
Wells Fargo Emerging Markets Bond Portfolio | 118,025 | |||||||||||||||
Wells Fargo Factor Enhanced Emerging Markets Portfolio | 1,920,457 | |||||||||||||||
Wells Fargo Factor Enhanced International Portfolio | 6,370,300 | |||||||||||||||
Wells Fargo Factor Enhanced Large Cap Portfolio | 9,618,683 | |||||||||||||||
Wells Fargo Factor Enhanced Small Cap Portfolio | 2,400,090 | |||||||||||||||
Wells Fargo High Yield Corporate Bond Portfolio | 116,473 | |||||||||||||||
Wells Fargo Investment Grade Corporate Bond Portfolio | 745,444 | |||||||||||||||
Total Investment Companies (Cost $22,576,917) | 22,734,841 | |||||||||||||||
|
| |||||||||||||||
| Total investments in securities (Cost $22,576,917) | 100.41 | % | 22,734,841 | |||||
Other assets and liabilities, net | (0.41 | ) | (92,132 | ) | ||||
|
|
|
| |||||
| Total net assets | 100.00 | % | $ | 22,642,709 | ||||
|
|
|
| |||||
Transactions with the affiliated Master Portfolios were as follows:
| % of ownership, beginning of period | % of ownership, end of period | Net realized gains (losses) on securities transactions allocated from affiliated Master Portfolios | Net change in unrealized gains (losses) on securities transactions allocated from affiliated Master Portfolios | Interest allocated from affiliated Master Portfolios | Dividends allocated from affiliated Master Portfolios | Affiliated Income allocated from affiliated Master Portfolios | Value, end of period | % of net assets | ||||||||||||||||||||||||||||
Affiliated Master Portfolios | ||||||||||||||||||||||||||||||||||||
Wells Fargo Bloomberg Barclays US Aggregateex-Corporate Portfolio | 0.16 | % | 0.22 | % | $ | 3,325 | $ | 54,151 | $ | 29,860 | $ | 0 | $ | 367 | $ | 1,445,369 | ||||||||||||||||||||
Wells Fargo Emerging Markets Bond Portfolio | 0.19 | 0.28 | 546 | 1,286 | 5,665 | 0 | 18 | 118,025 | ||||||||||||||||||||||||||||
Wells Fargo Factor Enhanced Emerging Markets Portfolio | 0.54 | 0.88 | (31,973 | ) | (72,290 | ) | 227 | 48,748 | 913 | 1,920,457 | ||||||||||||||||||||||||||
Wells Fargo Factor Enhanced International Portfolio | 0.66 | 1.09 | 5,089 | (91,176 | ) | 355 | 151,116 | 2,987 | 6,370,300 | |||||||||||||||||||||||||||
Wells Fargo Factor Enhanced Large Cap Portfolio | 0.62 | 1.00 | 398,299 | (385,640 | ) | 882 | 199,145 | 4,780 | 9,618,683 | |||||||||||||||||||||||||||
Wells Fargo Factor Enhanced Small Cap Portfolio | 0.65 | 1.05 | 41,750 | (149,111 | ) | 271 | 32,484 | 1,536 | 2,400,090 | |||||||||||||||||||||||||||
Wells Fargo High Yield Corporate Bond Portfolio | 0.10 | 0.22 | (1,197 | ) | (268 | ) | 6,249 | 0 | 29 | 116,473 | ||||||||||||||||||||||||||
Wells Fargo Investment Grade Corporate Bond Portfolio | 0.20 | 0.28 | 4,545 | 39,851 | 24,034 | 0 | 72 | 745,444 | ||||||||||||||||||||||||||||
|
|
|
|
|
|
|
|
|
|
|
|
|
| |||||||||||||||||||||||
| $ | 420,384 | $ | (603,197 | ) | $ | 67,543 | $ | 431,493 | $ | 10,702 | $ | 22,734,841 | 100.41 | % | ||||||||||||||||||||||
|
|
|
|
|
|
|
|
|
|
|
|
|
| |||||||||||||||||||||||
The accompanying notes are an integral part of these financial statements.
Target Date Retirement Funds | 61
Table of Contents
Statements of assets and liabilities—February 29, 2020
| Target Today Fund | Target 2010 Fund | |||||||
Assets | ||||||||
Investments in affiliated Master Portfolios, at value (see cost below) | $ | 63,893,066 | $ | 57,721,851 | ||||
Receivable for Fund shares sold | 402,182 | 49,077 | ||||||
Receivable from manager | 0 | 14,268 | ||||||
Prepaid expenses and other assets | 20,052 | 28,584 | ||||||
|
|
|
| |||||
Total assets | 64,315,300 | 57,813,780 | ||||||
|
|
|
| |||||
Liabilities | ||||||||
Payable for Fund shares redeemed | 53,078 | 18,967 | ||||||
Due to manager | 18,135 | 0 | ||||||
Administration fees payable | 7,990 | 7,342 | ||||||
Distribution fees payable | 336 | 365 | ||||||
Shareholder report expenses payable | 19,279 | 14,302 | ||||||
Shareholder servicing fees payable | 9,595 | 8,955 | ||||||
Professional fees payable | 28,593 | 31,212 | ||||||
Trustees’ fees and expenses payable | 4,576 | 4,568 | ||||||
Accrued expenses and other liabilities | 7,005 | 8,272 | ||||||
|
|
|
| |||||
Total liabilities | 148,587 | 93,983 | ||||||
|
|
|
| |||||
Total net assets | $ | 64,166,713 | $ | 57,719,797 | ||||
|
|
|
| |||||
Net assets consist of | ||||||||
Paid-in capital | $ | 56,369,911 | $ | 37,467,542 | ||||
Total distributable earnings | 7,796,802 | 20,252,255 | ||||||
|
|
|
| |||||
Total net assets | $ | 64,166,713 | $ | 57,719,797 | ||||
|
|
|
| |||||
Computation of net asset value and offering price per share | ||||||||
Net assets – Class A | $ | 36,877,632 | $ | 33,505,414 | ||||
Shares outstanding – Class A1 | 4,080,446 | 3,175,607 | ||||||
Net asset value per share – Class A | $9.04 | $10.55 | ||||||
Maximum offering price per share – Class A2 | $9.59 | $11.19 | ||||||
Net assets – Class C | $ | 528,684 | $ | 576,056 | ||||
Shares outstanding – Class C1 | 56,828 | 53,972 | ||||||
Net asset value per share – Class C | $9.30 | $10.67 | ||||||
Net assets – Class R | $ | 30,644 | $ | 23,026 | ||||
Shares outstanding – Class R1 | 3,403 | 2,201 | ||||||
Net asset value per share – Class R | $9.00 | $10.46 | ||||||
Net assets – Class R4 | $ | 2,436,515 | $ | 1,155,309 | ||||
Share outstanding – Class R41 | 262,178 | 107,963 | ||||||
Net asset value per share – Class R4 | $9.29 | $10.70 | ||||||
Net assets – Class R6 | $ | 17,264,134 | $ | 14,128,008 | ||||
Shares outstanding – Class R61 | 1,860,921 | 1,322,891 | ||||||
Net asset value per share – Class R6 | $9.28 | $10.68 | ||||||
Net assets – Administrator Class | $ | 7,029,104 | $ | 8,331,984 | ||||
Shares outstanding – Administrator Class1 | 756,044 | 778,298 | ||||||
Net asset value per share – Administrator Class | $9.30 | $10.71 | ||||||
Investments in affiliated Master Portfolios, at cost | $ | 56,495,254 | $ | 37,841,350 | ||||
|
|
|
| |||||
| 1 | Each Fund has an unlimited number of authorized shares. |
| 2 | Maximum offering price is computed as 100/94.25 of net asset value. On investments of $50,000 or more, the offering price is reduced. |
The accompanying notes are an integral part of these financial statements.
62 | Target Date Retirement Funds
Table of Contents
Statements of assets and liabilities—February 29, 2020
| Target 2015 Fund | Target 2020 Fund | Target 2025 Fund | Target 2030 Fund | Target 2035 Fund | Target 2040 Fund | Target 2045 Fund | ||||||||||||||||||||
| $ | 62,998,819 | $ | 369,782,929 | $ | 248,195,046 | $ | 529,468,825 | $ | 218,658,614 | $ | 468,384,620 | $ | 110,666,544 | |||||||||||||
| 16,295 | 332,996 | 208,934 | 511,271 | 171,039 | 527,038 | 83,933 | ||||||||||||||||||||
| 0 | 0 | 0 | 0 | 0 | 0 | 0 | ||||||||||||||||||||
| 12,013 | 374 | 31,901 | 15,805 | 9,062 | 29,240 | 13,262 | ||||||||||||||||||||
|
|
|
|
|
|
|
|
|
|
|
|
|
| |||||||||||||
| 63,027,127 | 370,116,299 | 248,435,881 | 529,995,901 | 218,838,715 | 468,940,898 | 110,763,739 | ||||||||||||||||||||
|
|
|
|
|
|
|
|
|
|
|
|
|
| |||||||||||||
| 300,086 | 956,938 | 254,824 | 929,398 | 243,445 | 317,549 | 98,762 | ||||||||||||||||||||
| 61,262 | 172,541 | 52,133 | 196,341 | 111,479 | 126,078 | 52,136 | ||||||||||||||||||||
| 7,320 | 36,107 | 23,558 | 48,873 | 22,553 | 48,178 | 10,850 | ||||||||||||||||||||
| 2 | 1,842 | 10 | 1,466 | 64 | 1,277 | 8 | ||||||||||||||||||||
| 19,105 | 37,318 | 43,460 | 44,081 | 42,926 | 44,416 | 34,643 | ||||||||||||||||||||
| 8,601 | 43,023 | 25,835 | 57,792 | 24,773 | 57,057 | 11,866 | ||||||||||||||||||||
| 27,874 | 29,112 | 25,695 | 29,752 | 28,353 | 29,388 | 28,631 | ||||||||||||||||||||
| 4,578 | 4,680 | 4,681 | 4,666 | 4,675 | 4,753 | 4,923 | ||||||||||||||||||||
| 5,865 | 12,402 | 15,431 | 14,256 | 14,047 | 11,857 | 4,786 | ||||||||||||||||||||
|
|
|
|
|
|
|
|
|
|
|
|
|
| |||||||||||||
| 434,693 | 1,293,963 | 445,627 | 1,326,625 | 492,315 | 640,553 | 246,605 | ||||||||||||||||||||
|
|
|
|
|
|
|
|
|
|
|
|
|
| |||||||||||||
| $ | 62,592,434 | $ | 368,822,336 | $ | 247,990,254 | $ | 528,669,276 | $ | 218,346,400 | $ | 468,300,345 | $ | 110,517,134 | |||||||||||||
|
|
|
|
|
|
|
|
|
|
|
|
|
| |||||||||||||
| $ | 50,188,715 | $ | 322,003,842 | $ | 222,705,214 | $ | 479,895,799 | $ | 200,669,374 | $ | 435,199,234 | $ | 103,272,149 | |||||||||||||
| 12,403,719 | 46,818,494 | 25,285,040 | 48,773,477 | 17,677,026 | 33,101,111 | 7,244,985 | ||||||||||||||||||||
|
|
|
|
|
|
|
|
|
|
|
|
|
| |||||||||||||
| $ | 62,592,434 | $ | 368,822,336 | $ | 247,990,254 | $ | 528,669,276 | $ | 218,346,400 | $ | 468,300,345 | $ | 110,517,134 | |||||||||||||
|
|
|
|
|
|
|
|
|
|
|
|
|
| |||||||||||||
| $ | 32,650,094 | $ | 132,754,690 | $ | 94,504,596 | $ | 163,774,081 | $ | 95,284,112 | $ | 175,941,540 | $ | 42,792,019 | |||||||||||||
| 4,553,096 | 11,077,687 | 16,957,176 | 13,486,278 | 12,913,351 | 12,553,204 | 5,301,329 | ||||||||||||||||||||
| $7.17 | $11.98 | $5.57 | $12.14 | $7.38 | $14.02 | $8.07 | ||||||||||||||||||||
| $7.61 | $12.71 | $5.91 | $12.88 | $7.83 | $14.88 | $8.56 | ||||||||||||||||||||
| N/A | $ | 2,784,740 | N/A | $ | 2,059,518 | N/A | $ | 1,905,830 | N/A | |||||||||||||||||
| N/A | 236,956 | N/A | 177,472 | N/A | 151,687 | N/A | ||||||||||||||||||||
| N/A | $11.75 | N/A | $11.60 | N/A | $12.56 | N/A | ||||||||||||||||||||
| $ | 19,915 | $ | 119,270 | $ | 56,641 | $ | 44,111 | $ | 318,213 | $ | 65,956 | $ | 49,083 | |||||||||||||
| 2,716 | 10,056 | 10,309 | 3,628 | 42,768 | 4,709 | 5,971 | ||||||||||||||||||||
| $7.33 | $11.86 | $5.49 | $12.16 | $7.44 | $14.01 | $8.22 | ||||||||||||||||||||
| $ | 5,852,746 | $ | 31,138,520 | $ | 36,023,124 | $ | 51,595,294 | $ | 26,748,452 | $ | 41,864,138 | $ | 15,459,981 | |||||||||||||
| 808,700 | 2,519,857 | 6,412,613 | 4,145,120 | 3,615,591 | 2,879,144 | 1,902,917 | ||||||||||||||||||||
| $7.24 | $12.36 | $5.62 | $12.45 | $7.40 | $14.54 | $8.12 | ||||||||||||||||||||
| $ | 18,724,618 | $ | 147,589,946 | $ | 106,756,242 | $ | 231,644,550 | $ | 89,107,586 | $ | 185,291,041 | $ | 47,671,567 | |||||||||||||
| 2,587,691 | 11,949,161 | 19,038,078 | 18,645,756 | 12,056,059 | 12,757,272 | 5,895,289 | ||||||||||||||||||||
| $7.24 | $12.35 | $5.61 | $12.42 | $7.39 | $14.52 | $8.09 | ||||||||||||||||||||
| $ | 5,345,061 | $ | 54,435,170 | $ | 10,649,651 | $ | 79,551,722 | $ | 6,888,037 | $ | 63,231,840 | $ | 4,544,484 | |||||||||||||
| 724,044 | 4,435,911 | 1,879,239 | 6,389,967 | 921,967 | 4,358,762 | 553,275 | ||||||||||||||||||||
| $7.38 | $12.27 | $5.67 | $12.45 | $7.47 | $14.51 | $8.21 | ||||||||||||||||||||
| $ | 50,801,015 | $ | 325,671,894 | $ | 224,424,110 | $ | 486,322,891 | $ | 203,523,534 | $ | 441,025,905 | $ | 104,512,593 | |||||||||||||
|
|
|
|
|
|
|
|
|
|
|
|
|
| |||||||||||||
The accompanying notes are an integral part of these financial statements.
Target Date Retirement Funds | 63
Table of Contents
Statements of assets and liabilities—February 29, 2020
| Target 2050 Fund | Target 2055 Fund | Target 2060 Fund | ||||||||||
Assets | ||||||||||||
Investments in affiliated Master Portfolios, at value (see cost below) | $ | 212,786,550 | $ | 34,959,900 | $ | 22,734,841 | ||||||
Receivable for Fund shares sold | 558,257 | 69,911 | 133,617 | |||||||||
Prepaid expenses and other assets | 10,512 | 5,765 | 3,105 | |||||||||
|
|
|
|
|
| |||||||
Total assets | 213,355,319 | 35,035,576 | 22,871,563 | |||||||||
|
|
|
|
|
| |||||||
Liabilities | ||||||||||||
Payable for Fund shares redeemed | 210,949 | 86,810 | 23,057 | |||||||||
Due to manager | 54,718 | 116,684 | 132,499 | |||||||||
Administration fees payable | 17,613 | 2,492 | 1,213 | |||||||||
Distribution fees payable | 359 | 6 | 100 | |||||||||
Shareholder report expenses payable | 39,164 | 38,752 | 29,263 | |||||||||
Shareholder servicing fees payable | 20,958 | 2,451 | 1,279 | |||||||||
Professional fees payable | 30,710 | 31,679 | 31,196 | |||||||||
Trustees’ fees and expenses payable | 4,178 | 4,749 | 4,662 | |||||||||
Accrued expenses and other liabilities | 5,506 | 6,083 | 5,585 | |||||||||
|
|
|
|
|
| |||||||
Total liabilities | 384,155 | 289,706 | 228,854 | |||||||||
|
|
|
|
|
| |||||||
Total net assets | $ | 212,971,164 | $ | 34,745,870 | $ | 22,642,709 | ||||||
|
|
|
|
|
| |||||||
Net assets consist of | ||||||||||||
Paid-in capital | $ | 197,192,253 | $ | 35,443,298 | $ | 22,441,495 | ||||||
Total distributable earnings/(loss) | 15,778,911 | (697,428 | ) | 201,214 | ||||||||
|
|
|
|
|
| |||||||
Total net assets | $ | 212,971,164 | $ | 34,745,870 | $ | 22,642,709 | ||||||
|
|
|
|
|
| |||||||
Computation of net asset value and offering price per share | ||||||||||||
Net assets – Class A | $ | 47,059,950 | $ | 7,374,451 | $ | 973,466 | ||||||
Shares outstanding – Class A1 | 6,774,615 | 639,130 | 85,124 | |||||||||
Net asset value per share – Class A | $6.95 | $11.54 | $11.44 | |||||||||
Maximum offering price per share – Class A2 | $7.37 | $12.24 | $12.14 | |||||||||
Net assets – Class C | $ | 519,450 | N/A | $ | 141,623 | |||||||
Shares outstanding – Class C1 | 75,129 | N/A | 12,395 | |||||||||
Net asset value per share – Class C | $6.91 | N/A | $11.43 | |||||||||
Net assets – Class R | $ | 37,278 | $ | 41,167 | $ | 67,034 | ||||||
Shares outstanding – Class R1 | 5,354 | 3,628 | 5,982 | |||||||||
Net asset value per share – Class R | $6.96 | $11.35 | $11.21 | |||||||||
Net assets – Class R4 | $ | 17,988,928 | $ | 7,233,363 | $ | 2,296,769 | ||||||
Share outstanding – Class R41 | 2,568,534 | 624,852 | 196,855 | |||||||||
Net asset value per share – Class R4 | $7.00 | $11.58 | $11.67 | |||||||||
Net assets – Class R6 | $ | 107,867,914 | $ | 19,338,013 | $ | 15,540,868 | ||||||
Shares outstanding – Class R61 | 15,434,940 | 1,673,726 | 1,337,449 | |||||||||
Net asset value per share – Class R6 | $6.99 | $11.55 | $11.62 | |||||||||
Net assets – Administrator Class | $ | 39,497,644 | $ | 758,876 | $ | 3,622,949 | ||||||
Shares outstanding – Administrator Class1 | 5,663,751 | 65,267 | 315,449 | |||||||||
Net asset value per share – Administrator Class | $6.97 | $11.63 | $11.49 | |||||||||
Investments in affiliated Master Portfolios, at cost | $ | 199,632,732 | $ | 35,299,236 | $ | 22,576,917 | ||||||
|
|
|
|
|
| |||||||
| 1 | Each Fund has an unlimited number of authorized shares. |
| 2 | Maximum offering price is computed as 100/94.25 of net asset value. On investments of $50,000 or more, the offering price is reduced. |
The accompanying notes are an integral part of these financial statements.
64 | Target Date Retirement Funds
Table of Contents
This page is intentionally left blank.
Table of Contents
Statements of operations—year ended February 29, 2020
| Target Today Fund | Target 2010 Fund | |||||||
Investment income | ||||||||
Interest allocated from affiliated Master Portfolios | $ | 1,426,164 | $ | 1,289,770 | ||||
Dividends allocated from affiliated Master Portfolios* | 471,699 | 468,861 | ||||||
Affiliated income allocated from affiliated Master Portfolios | 20,142 | 19,146 | ||||||
Expenses allocated from affiliated Master Portfolios | (109,409 | ) | (102,371 | ) | ||||
Waivers allocated from affiliated Master Portfolios | 29,724 | 27,732 | ||||||
|
|
|
| |||||
Total investment income | 1,838,320 | 1,703,138 | ||||||
|
|
|
| |||||
Expenses | ||||||||
Management fee | 68,672 | 63,666 | ||||||
Administration fees | ||||||||
Class A | 80,340 | 73,737 | ||||||
Class C | 1,601 | 1,328 | ||||||
Class R | 62 | 48 | ||||||
Class R4 | 2,159 | 1,204 | ||||||
Class R6 | 5,330 | 4,772 | ||||||
Administrator Class | 11,906 | 13,634 | ||||||
Shareholder servicing fees | ||||||||
Class A | 95,642 | 87,782 | ||||||
Class C | 1,905 | 1,581 | ||||||
Class R | 74 | 58 | ||||||
Class R4 | 2,699 | 1,505 | ||||||
Administrator Class | 22,895 | 26,219 | ||||||
Distribution fees | ||||||||
Class C | 5,712 | 4,716 | ||||||
Class R | 54 | 37 | ||||||
Custody and accounting fees | 5,729 | 5,968 | ||||||
Professional fees | 39,705 | 39,041 | ||||||
Registration fees | 85,528 | 84,348 | ||||||
Shareholder report expenses | 41,100 | 40,804 | ||||||
Trustees’ fees and expenses | 21,886 | 21,886 | ||||||
Other fees and expenses | 15,039 | 14,596 | ||||||
|
|
|
| |||||
Total expenses | 508,038 | 486,930 | ||||||
Less: Fee waivers and/or expense reimbursements | ||||||||
Fund-level | (226,785 | ) | (223,134 | ) | ||||
Class A | (8,650 | ) | (7,511 | ) | ||||
Class C | (44 | ) | 0 | |||||
Class R4 | (838 | ) | (442 | ) | ||||
Class R6 | (5,330 | ) | (4,772 | ) | ||||
Administrator Class | (3,315 | ) | (3,515 | ) | ||||
|
|
|
| |||||
Net expenses | 263,076 | 247,556 | ||||||
|
|
|
| |||||
Net investment income | 1,575,244 | 1,455,582 | ||||||
|
|
|
| |||||
Realized and unrealized gains (losses) on investments | ||||||||
Net realized gains on securities transactions allocated from affiliated Master Portfolios | 1,296,199 | 1,269,677 | ||||||
Net change in unrealized gains (losses) on securities transactions allocated from affiliated Master Portfolios | 2,338,654 | 2,145,231 | ||||||
|
|
|
| |||||
Net realized and unrealized gains (losses) on investments | 3,634,853 | 3,414,908 | ||||||
|
|
|
| |||||
Net increase in net assets resulting from operations | $ | 5,210,097 | $ | 4,870,490 | ||||
|
|
|
| |||||
* Net of foreign dividend withholding taxes allocated from affiliated Master Portfolios in the amount of | $30,498 | $30,271 | ||||||
The accompanying notes are an integral part of these financial statements.
66 | Target Date Retirement Funds
Table of Contents
Statements of operations—year ended February 29, 2020
| Target 2015 Fund | Target 2020 Fund | Target 2025 Fund | Target 2030 Fund | Target 2035 Fund | Target 2040 Fund | Target 2045 Fund | ||||||||||||||||||||
| $ | 1,386,102 | $ | 6,755,508 | $ | 4,005,509 | $ | 6,332,884 | $ | 2,056,061 | $ | 2,846,708 | $ | 572,259 | |||||||||||||
| 633,660 | 4,035,941 | 3,523,063 | 8,280,236 | 4,294,312 | 9,447,959 | 2,819,146 | ||||||||||||||||||||
| 23,472 | 137,738 | 110,953 | 243,405 | 118,602 | 246,694 | 71,864 | ||||||||||||||||||||
| (121,949 | ) | (681,767 | ) | (493,038 | ) | (1,003,749 | ) | (466,330 | ) | (968,302 | ) | (273,784 | ) | |||||||||||||
| 32,823 | 176,673 | 115,578 | 211,282 | 93,564 | 191,024 | 54,005 | ||||||||||||||||||||
|
| |||||||||||||||||||||||||
| 1,954,108 | 10,424,093 | 7,262,065 | 14,064,058 | 6,096,209 | 11,764,083 | 3,243,490 | ||||||||||||||||||||
|
| |||||||||||||||||||||||||
| 73,702 | 402,684 | 285,839 | 569,372 | 253,241 | 505,423 | 138,900 | ||||||||||||||||||||
| 73,378 | 301,866 | 219,371 | 370,328 | 224,648 | 399,780 | 112,983 | ||||||||||||||||||||
| N/A | 6,679 | N/A | 5,308 | N/A | 4,541 | N/A | ||||||||||||||||||||
| 43 | 220 | 106 | 90 | 589 | 140 | 93 | ||||||||||||||||||||
| 5,439 | 29,438 | 31,754 | 44,813 | 22,853 | 36,241 | 14,261 | ||||||||||||||||||||
| 7,663 | 47,602 | 38,335 | 73,843 | 32,561 | 59,031 | 18,274 | ||||||||||||||||||||
| 8,317 | 78,237 | 18,005 | 114,783 | 11,549 | 91,978 | 8,208 | ||||||||||||||||||||
| 87,355 | 359,364 | 261,156 | 440,867 | 267,438 | 475,928 | 134,503 | ||||||||||||||||||||
| N/A | 7,951 | N/A | 6,319 | N/A | 5,406 | N/A | ||||||||||||||||||||
| 51 | 262 | 127 | 106 | 701 | 166 | 110 | ||||||||||||||||||||
| 6,583 | 36,797 | 39,692 | 56,016 | 28,566 | 45,302 | 17,827 | ||||||||||||||||||||
| 15,995 | 150,456 | 34,624 | 220,737 | 22,210 | 176,880 | 15,785 | ||||||||||||||||||||
| N/A | 23,849 | N/A | 18,942 | N/A | 16,217 | N/A | ||||||||||||||||||||
| 33 | 242 | 112 | 86 | 682 | 145 | 90 | ||||||||||||||||||||
| 7,009 | 31,581 | 17,739 | 36,302 | 16,280 | 31,223 | 10,921 | ||||||||||||||||||||
| 39,777 | 39,816 | 39,569 | 39,818 | 39,748 | 39,733 | 39,757 | ||||||||||||||||||||
| 75,772 | 92,563 | 79,065 | 93,253 | 81,238 | 91,277 | 81,598 | ||||||||||||||||||||
| 42,457 | 53,191 | 51,035 | 56,900 | 50,314 | 59,106 | 47,836 | ||||||||||||||||||||
| 21,886 | 21,893 | 21,912 | 21,886 | 21,886 | 21,993 | 22,056 | ||||||||||||||||||||
| 15,298 | 29,917 | 22,230 | 31,839 | 20,942 | 28,649 | 17,381 | ||||||||||||||||||||
|
| |||||||||||||||||||||||||
| 480,758 | 1,714,608 | 1,160,671 | 2,201,608 | 1,095,446 | 2,089,159 | 680,583 | ||||||||||||||||||||
| (222,255 | ) | (406,604 | ) | (347,131 | ) | (569,372 | ) | (379,851 | ) | (606,507 | ) | (319,468 | ) | |||||||||||||
| (12,457 | ) | (32,501 | ) | (29,426 | ) | (30,264 | ) | (24,224 | ) | (19,147 | ) | (7,656 | ) | |||||||||||||
| N/A | (285 | ) | N/A | (139 | ) | N/A | (131 | ) | N/A | |||||||||||||||||
| (2,349 | ) | (12,217 | ) | (13,564 | ) | (16,470 | ) | (8,568 | ) | (12,809 | ) | (5,124 | ) | |||||||||||||
| (7,663 | ) | (47,602 | ) | (38,335 | ) | (70,441 | ) | (30,863 | ) | (54,056 | ) | (16,093 | ) | |||||||||||||
| (2,446 | ) | (20,852 | ) | (4,862 | ) | (26,945 | ) | (2,731 | ) | (20,768 | ) | (1,787 | ) | |||||||||||||
|
| |||||||||||||||||||||||||
| 233,588 | 1,194,547 | 727,353 | 1,487,977 | 649,209 | 1,375,741 | 330,455 | ||||||||||||||||||||
|
| |||||||||||||||||||||||||
| 1,720,520 | 9,229,546 | 6,534,712 | 12,576,081 | 5,447,000 | 10,388,342 | 2,913,035 | ||||||||||||||||||||
|
| |||||||||||||||||||||||||
| 2,051,769 | 9,409,883 | 9,543,081 | 15,982,387 | 7,459,035 | 14,719,390 | 3,980,983 | ||||||||||||||||||||
| 1,756,842 | 8,805,358 | 2,021,557 | 397,507 | (1,227,747 | ) | (9,362,255 | ) | (1,715,162 | ) | |||||||||||||||||
|
| |||||||||||||||||||||||||
| 3,808,611 | 18,215,241 | 11,564,638 | 16,379,894 | 6,231,288 | 5,357,135 | 2,265,821 | ||||||||||||||||||||
|
| |||||||||||||||||||||||||
| $ | 5,529,131 | $ | 27,444,787 | $ | 18,099,350 | $ | 28,955,975 | $ | 11,678,288 | $ | 15,745,477 | $ | 5,178,856 | |||||||||||||
|
| |||||||||||||||||||||||||
| $40,790 | $270,489 | $251,548 | $630,046 | $332,819 | $746,102 | $222,133 | ||||||||||||||||||||
The accompanying notes are an integral part of these financial statements.
Target Date Retirement Funds | 67
Table of Contents
Statements of operations—year ended February 29, 2020
| Target 2050 Fund | Target 2055 Fund | Target 2060 Fund | ||||||||||
Investment income | ||||||||||||
Interest allocated from affiliated Master Portfolios | $ | 727,346 | $ | 123,391 | $ | 67,543 | ||||||
Dividends allocated from affiliated Master Portfolios* | 4,736,954 | 804,322 | 431,493 | |||||||||
Affiliated income allocated from affiliated Master Portfolios | 118,194 | 20,125 | 10,702 | |||||||||
Expenses allocated from affiliated Master Portfolios | (459,722 | ) | (78,014 | ) | (42,777 | ) | ||||||
Waivers allocated from affiliated Master Portfolios | 89,649 | 15,234 | 8,284 | |||||||||
|
| |||||||||||
Total investment income | 5,212,421 | 885,058 | 475,245 | |||||||||
|
| |||||||||||
Expenses | ||||||||||||
Management fee | 230,025 | 38,821 | 21,246 | |||||||||
Administration fees | ||||||||||||
Class A | 110,213 | 20,493 | 1,756 | |||||||||
Class C | 1,716 | N/A | 405 | |||||||||
Class R | 76 | 88 | 133 | |||||||||
Class R4 | 15,901 | 5,984 | 2,076 | |||||||||
Class R6 | 34,638 | 6,134 | 4,226 | |||||||||
Administrator Class | 53,759 | 1,421 | 4,512 | |||||||||
Shareholder servicing fees | ||||||||||||
Class A | 131,206 | 24,396 | 2,090 | |||||||||
Class C | 2,043 | N/A | 482 | |||||||||
Class R | 90 | 105 | 158 | |||||||||
Class R4 | 19,876 | 7,480 | 2,595 | |||||||||
Administrator Class | 103,383 | 2,733 | 8,678 | |||||||||
Distribution fees | ||||||||||||
Class C | 6,109 | N/A | 1,402 | |||||||||
Class R | 71 | 80 | 137 | |||||||||
Custody and accounting fees | 17,247 | 3,905 | 1,729 | |||||||||
Professional fees | 39,753 | 38,316 | 38,082 | |||||||||
Registration fees | 92,605 | 71,639 | 80,138 | |||||||||
Shareholder report expenses | 50,138 | 43,201 | 35,312 | |||||||||
Trustees’ fees and expenses | 21,396 | 20,370 | 20,927 | |||||||||
Other fees and expenses | 21,196 | 12,980 | 13,014 | |||||||||
|
| |||||||||||
Total expenses | 951,441 | 298,146 | 239,098 | |||||||||
Less: Fee waivers and/or expense reimbursements | ||||||||||||
Fund-level | (414,053 | ) | (218,303 | ) | (204,363 | ) | ||||||
Class A | (7,365 | ) | (1,365 | ) | (48 | ) | ||||||
Class C | 0 | N/A | 0 | |||||||||
Class R4 | (5,347 | ) | (2,348 | ) | (887 | ) | ||||||
Class R6 | (30,141 | ) | (6,134 | ) | (4,226 | ) | ||||||
Administrator Class | (11,574 | ) | (331 | ) | (1,034 | ) | ||||||
|
| |||||||||||
Net expenses | 482,961 | 69,665 | 28,540 | |||||||||
|
| |||||||||||
Net investment income | 4,729,460 | 815,393 | 446,705 | |||||||||
|
| |||||||||||
Realized and unrealized gains (losses) on investments | ||||||||||||
Net realized gains on securities transactions allocated from affiliated Master Portfolios | 8,522,429 | 764,463 | 420,384 | |||||||||
Net change in unrealized gains (losses) on securities transactions allocated from affiliated Master Portfolios | (8,234,532 | ) | (573,421 | ) | (603,197 | ) | ||||||
|
| |||||||||||
Net realized and unrealized gains (losses) on investments | 287,897 | 191,042 | (182,813 | ) | ||||||||
|
| |||||||||||
Net increase in net assets resulting from operations | $ | 5,017,357 | $ | 1,006,435 | $ | 263,892 | ||||||
|
| |||||||||||
* Net of foreign dividend withholding taxes allocated from affiliated Master Portfolios in the amount of | $379,589 | $64,675 | $35,132 | |||||||||
The accompanying notes are an integral part of these financial statements.
68 | Target Date Retirement Funds
Table of Contents
Statements of changes in net assets
| Target Today Fund | ||||||||||||||||
| Year ended February 29, 2020 | Year ended February 28, 2019 | |||||||||||||||
Operations |
| |||||||||||||||
Net investment income | $ | 1,575,244 | $ | 2,429,304 | ||||||||||||
Net realized gains on investments | 1,296,199 | 620,996 | ||||||||||||||
Net change in unrealized gains (losses) on investments | 2,338,654 | (581,592 | ) | |||||||||||||
|
| |||||||||||||||
Net increase in net assets resulting from operations | 5,210,097 | 2,468,708 | ||||||||||||||
|
| |||||||||||||||
Distributions to shareholders from net investment income and net | ||||||||||||||||
Class A | (1,169,652 | ) | (2,517,852 | ) | ||||||||||||
Class C | (14,676 | ) | (93,263 | ) | ||||||||||||
Class R | (830 | ) | (1,841 | ) | ||||||||||||
Class R4 | (87,043 | ) | (432,768 | ) | ||||||||||||
Class R6 | (609,311 | ) | (1,980,408 | ) | ||||||||||||
Administrator Class | (276,829 | ) | (799,525 | ) | ||||||||||||
|
| |||||||||||||||
Total distributions to shareholders | (2,158,341 | ) | (5,825,657 | ) | ||||||||||||
|
| |||||||||||||||
Capital share transactions | Shares | Shares | ||||||||||||||
Proceeds from shares sold |
| |||||||||||||||
Class A | 149,359 | 1,345,551 | 206,784 | 1,804,359 | ||||||||||||
Class C | 2,571 | 24,041 | 7,343 | 65,185 | ||||||||||||
Class R | 200 | 1,806 | 224 | 1,991 | ||||||||||||
Class R4 | 40,010 | 368,117 | 325,203 | 2,970,200 | ||||||||||||
Class R6 | 399,954 | 3,688,490 | 1,452,538 | 12,845,113 | ||||||||||||
Administrator Class | 209,192 | 1,938,421 | 273,358 | 2,477,519 | ||||||||||||
|
| |||||||||||||||
| 7,366,426 | 20,164,367 | |||||||||||||||
|
| |||||||||||||||
Reinvestment of distributions |
| |||||||||||||||
Class A | 129,020 | 1,161,402 | 292,451 | 2,499,654 | ||||||||||||
Class C | 1,560 | 14,465 | 10,639 | 92,963 | ||||||||||||
Class R | 21 | 191 | 53 | 450 | ||||||||||||
Class R4 | 9,416 | 87,032 | 48,915 | 432,768 | ||||||||||||
Class R6 | 66,048 | 609,311 | 224,739 | 1,978,037 | ||||||||||||
Administrator Class | 29,930 | 276,829 | 90,290 | 799,264 | ||||||||||||
|
| |||||||||||||||
| 2,149,230 | 5,803,136 | |||||||||||||||
|
| |||||||||||||||
Payment for shares redeemed |
| |||||||||||||||
Class A | (571,838 | ) | (5,149,559 | ) | (1,367,602 | ) | (12,067,104 | ) | ||||||||
Class C | (51,100 | ) | (475,980 | ) | (159,312 | ) | (1,428,671 | ) | ||||||||
Class R | (32 | ) | (291 | ) | (265 | ) | (2,218 | ) | ||||||||
Class R4 | (104,841 | ) | (966,970 | ) | (1,453,840 | ) | (13,174,601 | ) | ||||||||
Class R6 | (521,023 | ) | (4,824,708 | ) | (4,168,399 | ) | (37,155,432 | ) | ||||||||
Administrator Class | (561,652 | ) | (5,233,763 | ) | (1,930,361 | ) | (17,559,794 | ) | ||||||||
|
| |||||||||||||||
| (16,651,271 | ) | (81,387,820 | ) | |||||||||||||
|
| |||||||||||||||
Net decrease in net assets resulting from capital share transactions | (7,135,615 | ) | (55,420,317 | ) | ||||||||||||
|
| |||||||||||||||
Total decrease in net assets | (4,083,859 | ) | (58,777,266 | ) | ||||||||||||
|
| |||||||||||||||
Net assets | ||||||||||||||||
Beginning of period | 68,250,572 | 127,027,838 | ||||||||||||||
|
| |||||||||||||||
End of period | $ | 64,166,713 | $ | 68,250,572 | ||||||||||||
|
| |||||||||||||||
The accompanying notes are an integral part of these financial statements.
Target Date Retirement Funds | 69
Table of Contents
Statements of changes in net assets
| Target 2010 Fund | ||||||||||||||||
| Year ended February 29, 2020 | Year ended February 28, 2019 | |||||||||||||||
Operations |
| |||||||||||||||
Net investment income | $ | 1,455,582 | $ | 2,476,072 | ||||||||||||
Net realized gains on investments | 1,269,677 | 869,510 | ||||||||||||||
Net change in unrealized gains (losses) on investments | 2,145,231 | (1,027,544 | ) | |||||||||||||
|
| |||||||||||||||
Net increase in net assets resulting from operations | 4,870,490 | 2,318,038 | ||||||||||||||
|
| |||||||||||||||
Distributions to shareholders from net investment income and net | ||||||||||||||||
Class A | (1,123,354 | ) | (3,011,177 | ) | ||||||||||||
Class C | (14,364 | ) | (77,674 | ) | ||||||||||||
Class R | (679 | ) | (1,897 | ) | ||||||||||||
Class R4 | (49,133 | ) | (506,744 | ) | ||||||||||||
Class R6 | (566,122 | ) | (1,963,261 | ) | ||||||||||||
Administrator Class | (336,532 | ) | (1,356,706 | ) | ||||||||||||
|
| |||||||||||||||
Total distributions to shareholders | (2,090,184 | ) | (6,917,459 | ) | ||||||||||||
|
| |||||||||||||||
Capital share transactions | Shares | Shares | ||||||||||||||
Proceeds from shares sold |
| |||||||||||||||
Class A | 119,861 | 1,269,307 | 181,308 | 1,846,882 | ||||||||||||
Class C | 1,188 | 12,639 | 257 | 2,723 | ||||||||||||
Class R4 | 32,005 | 346,187 | 143,760 | 1,546,412 | ||||||||||||
Class R6 | 342,017 | 3,639,221 | 814,993 | 8,655,220 | ||||||||||||
Administrator Class | 161,826 | 1,741,823 | 167,432 | 1,795,350 | ||||||||||||
|
| |||||||||||||||
| 7,009,177 | 13,846,587 | |||||||||||||||
|
| |||||||||||||||
Reinvestment of distributions | ||||||||||||||||
Class A | 106,000 | 1,116,451 | 297,632 | 2,981,123 | ||||||||||||
Class C | 1,345 | 14,364 | 7,707 | 77,674 | ||||||||||||
Class R4 | 4,613 | 49,133 | 49,077 | 506,744 | ||||||||||||
Class R6 | 53,171 | 565,811 | 191,587 | 1,960,435 | ||||||||||||
Administrator Class | 31,544 | 336,532 | 131,892 | 1,356,706 | ||||||||||||
|
| |||||||||||||||
| 2,082,291 | 6,882,682 | |||||||||||||||
|
| |||||||||||||||
Payment for shares redeemed | ||||||||||||||||
Class A | (581,970 | ) | (6,128,210 | ) | (1,768,153 | ) | (18,765,615 | ) | ||||||||
Class C | (20,313 | ) | (213,841 | ) | (58,488 | ) | (611,087 | ) | ||||||||
Class R4 | (106,342 | ) | (1,137,025 | ) | (1,600,821 | ) | (17,053,647 | ) | ||||||||
Class R6 | (710,084 | ) | (7,580,672 | ) | (3,088,623 | ) | (32,928,845 | ) | ||||||||
Administrator Class | (620,178 | ) | (6,621,402 | ) | (2,098,785 | ) | (22,448,123 | ) | ||||||||
|
| |||||||||||||||
| (21,681,150 | ) | (91,807,317 | ) | |||||||||||||
|
| |||||||||||||||
Net decrease in net assets resulting from capital share transactions | (12,589,682 | ) | (71,078,048 | ) | ||||||||||||
|
| |||||||||||||||
Total decrease in net assets | (9,809,376 | ) | (75,677,469 | ) | ||||||||||||
|
| |||||||||||||||
Net assets | ||||||||||||||||
Beginning of period | 67,529,173 | 143,206,642 | ||||||||||||||
|
| |||||||||||||||
End of period | $ | 57,719,797 | $ | 67,529,173 | ||||||||||||
|
| |||||||||||||||
The accompanying notes are an integral part of these financial statements.
70 | Target Date Retirement Funds
Table of Contents
Statements of changes in net assets
| Target 2015 Fund | ||||||||||||||||
| Year ended February 29, 2020 | Year ended February 28, 2019 | |||||||||||||||
Operations |
| |||||||||||||||
Net investment income | $ | 1,720,520 | $ | 3,124,396 | ||||||||||||
Net realized gains on investments | 2,051,769 | 3,264,482 | ||||||||||||||
Net change in unrealized gains (losses) on investments | 1,756,842 | (2,732,451 | ) | |||||||||||||
|
| |||||||||||||||
Net increase in net assets resulting from operations | 5,529,131 | 3,656,427 | ||||||||||||||
|
| |||||||||||||||
Distributions to shareholders from net investment income and net | ||||||||||||||||
Class A | (1,744,646 | ) | (5,010,100 | ) | ||||||||||||
Class R | (947 | ) | (2,803 | ) | ||||||||||||
Class R4 | (361,340 | ) | (2,377,135 | ) | ||||||||||||
Class R6 | (1,303,361 | ) | (5,562,746 | ) | ||||||||||||
Administrator Class | (301,496 | ) | (1,088,842 | ) | ||||||||||||
|
| |||||||||||||||
Total distributions to shareholders | (3,711,790 | ) | (14,041,626 | ) | ||||||||||||
|
| |||||||||||||||
Capital share transactions | Shares | Shares | ||||||||||||||
Proceeds from shares sold | ||||||||||||||||
Class A | 147,058 | 1,081,348 | 131,682 | 1,017,030 | ||||||||||||
Class R4 | 72,085 | 529,173 | 710,739 | 5,613,679 | ||||||||||||
Class R6 | 629,700 | 4,615,080 | 1,023,599 | 8,000,244 | ||||||||||||
Administrator Class | 59,225 | 443,896 | 84,246 | 671,519 | ||||||||||||
|
| |||||||||||||||
| 6,669,497 | 15,302,472 | |||||||||||||||
|
| |||||||||||||||
Reinvestment of distributions | ||||||||||||||||
Class A | 239,738 | 1,740,335 | 720,306 | 5,000,087 | ||||||||||||
Class R4 | 49,330 | 361,340 | 335,009 | 2,377,135 | ||||||||||||
Class R6 | 178,070 | 1,303,361 | 786,251 | 5,543,091 | ||||||||||||
Administrator Class | 40,369 | 301,484 | 151,014 | 1,086,815 | ||||||||||||
|
| |||||||||||||||
| 3,706,520 | 14,007,128 | |||||||||||||||
|
| |||||||||||||||
Payment for shares redeemed | ||||||||||||||||
Class A | (979,311 | ) | (7,123,522 | ) | (1,103,238 | ) | (8,484,983 | ) | ||||||||
Class R4 | (347,613 | ) | (2,542,630 | ) | (5,467,351 | ) | (42,554,274 | ) | ||||||||
Class R6 | (2,609,415 | ) | (19,141,227 | ) | (5,135,152 | ) | (39,351,197 | ) | ||||||||
Administrator Class | (317,780 | ) | (2,395,510 | ) | (1,261,057 | ) | (9,993,094 | ) | ||||||||
|
| |||||||||||||||
| (31,202,889 | ) | (100,383,548 | ) | |||||||||||||
|
| |||||||||||||||
Net decrease in net assets resulting from capital share transactions | (20,826,872 | ) | (71,073,948 | ) | ||||||||||||
|
| |||||||||||||||
Total decrease in net assets | (19,009,531 | ) | (81,459,147 | ) | ||||||||||||
|
| |||||||||||||||
Net assets | ||||||||||||||||
Beginning of period | 81,601,965 | 163,061,112 | ||||||||||||||
|
| |||||||||||||||
End of period | $ | 62,592,434 | $ | 81,601,965 | ||||||||||||
|
| |||||||||||||||
The accompanying notes are an integral part of these financial statements.
Target Date Retirement Funds | 71
Table of Contents
Statements of changes in net assets
| Target 2020 Fund | ||||||||||||||||
| Year ended February 29, 2020 | Year ended February 28, 2019 | |||||||||||||||
Operations |
| |||||||||||||||
Net investment income | $ | 9,229,546 | $ | 16,649,802 | ||||||||||||
Net realized gains on investments | 9,409,883 | 11,172,686 | ||||||||||||||
Net change in unrealized gains (losses) on investments | 8,805,358 | (14,923,343 | ) | |||||||||||||
|
| |||||||||||||||
Net increase in net assets resulting from operations | 27,444,787 | 12,899,145 | ||||||||||||||
|
| |||||||||||||||
Distributions to shareholders from net investment income and net realized gains | ||||||||||||||||
Class A | (4,792,200 | ) | (14,798,931 | ) | ||||||||||||
Class C | (80,283 | ) | (423,325 | ) | ||||||||||||
Class R | (3,847 | ) | (8,143 | ) | ||||||||||||
Class R4 | (1,208,604 | ) | (7,102,885 | ) | ||||||||||||
Class R6 | (5,927,221 | ) | (28,569,283 | ) | ||||||||||||
Administrator Class | (1,999,953 | ) | (6,837,883 | ) | ||||||||||||
|
| |||||||||||||||
Total distributions to shareholders | (14,012,108 | ) | (57,740,450 | ) | ||||||||||||
|
| |||||||||||||||
Capital share transactions | Shares | Shares | ||||||||||||||
Proceeds from shares sold |
| |||||||||||||||
Class A | 321,410 | 3,909,959 | 726,663 | 8,665,616 | ||||||||||||
Class C | 36,987 | 437,245 | 10,238 | 116,378 | ||||||||||||
Class R | 2,393 | 28,833 | 1,977 | 24,240 | ||||||||||||
Class R4 | 386,925 | 4,825,572 | 1,930,520 | 24,820,810 | ||||||||||||
Class R6 | 2,376,361 | 29,697,307 | 6,313,856 | 77,738,219 | ||||||||||||
Administrator Class | 748,329 | 9,345,037 | 1,097,867 | 13,895,391 | ||||||||||||
|
| |||||||||||||||
| 48,243,953 | 125,260,654 | |||||||||||||||
|
| |||||||||||||||
Reinvestment of distributions |
| |||||||||||||||
Class A | 384,564 | 4,723,271 | 1,279,396 | 14,591,417 | ||||||||||||
Class C | 6,244 | 75,187 | 35,841 | 400,497 | ||||||||||||
Class R | 252 | 3,058 | 509 | 5,753 | ||||||||||||
Class R4 | 95,454 | 1,208,604 | 604,855 | 7,102,885 | ||||||||||||
Class R6 | 468,154 | 5,924,470 | 2,411,804 | 28,542,013 | ||||||||||||
Administrator Class | 159,038 | 1,999,004 | 585,944 | 6,835,171 | ||||||||||||
|
| |||||||||||||||
| 13,933,594 | 57,477,736 | |||||||||||||||
|
| |||||||||||||||
Payment for shares redeemed |
| |||||||||||||||
Class A | (2,279,102 | ) | (27,764,232 | ) | (5,218,829 | ) | (64,719,624 | ) | ||||||||
Class C | (102,178 | ) | (1,214,362 | ) | (255,519 | ) | (3,016,804 | ) | ||||||||
Class R | (71 | ) | (852 | ) | (335 | ) | (4,226 | ) | ||||||||
Class R4 | (1,178,150 | ) | (14,819,303 | ) | (9,417,929 | ) | (117,856,517 | ) | ||||||||
Class R6 | (3,758,077 | ) | (47,286,332 | ) | (26,888,456 | ) | (328,696,013 | ) | ||||||||
Administrator Class | (1,821,031 | ) | (22,673,905 | ) | (5,060,064 | ) | (64,081,593 | ) | ||||||||
|
| |||||||||||||||
| (113,758,986 | ) | (578,374,777 | ) | |||||||||||||
|
| |||||||||||||||
Net decrease in net assets resulting from capital share transactions | (51,581,439 | ) | (395,636,387 | ) | ||||||||||||
|
| |||||||||||||||
Total decrease in net assets | (38,148,760 | ) | (440,477,692 | ) | ||||||||||||
|
| |||||||||||||||
Net assets | ||||||||||||||||
Beginning of period | 406,971,096 | 847,448,788 | ||||||||||||||
|
| |||||||||||||||
End of period | $ | 368,822,336 | $ | 406,971,096 | ||||||||||||
|
| |||||||||||||||
The accompanying notes are an integral part of these financial statements.
72 | Target Date Retirement Funds
Table of Contents
Statements of changes in net assets
| Target 2025 Fund | ||||||||||||||||
| Year ended February 29, 2020 | Year ended February 28, 2019 | |||||||||||||||
Operations |
| |||||||||||||||
Net investment income | $ | 6,534,712 | $ | 9,134,567 | ||||||||||||
Net realized gains on investments | 9,543,081 | 18,776,534 | ||||||||||||||
Net change in unrealized gains (losses) on investments | 2,021,557 | (18,226,292 | ) | |||||||||||||
|
| |||||||||||||||
Net increase in net assets resulting from operations | 18,099,350 | 9,684,809 | ||||||||||||||
|
| |||||||||||||||
Distributions to shareholders from net investment income and net realized gains | ||||||||||||||||
Class A | (5,548,280 | ) | (16,634,094 | ) | ||||||||||||
Class R | (2,895 | ) | (6,636 | ) | ||||||||||||
Class R4 | (2,288,579 | ) | (10,413,427 | ) | ||||||||||||
Class R6 | (7,333,390 | ) | (23,953,308 | ) | ||||||||||||
Administrator Class | (717,546 | ) | (2,458,518 | ) | ||||||||||||
|
| |||||||||||||||
Total distributions to shareholders | (15,890,690 | ) | (53,465,983 | ) | ||||||||||||
|
| |||||||||||||||
Capital share transactions | Shares | Shares | ||||||||||||||
Proceeds from shares sold |
| |||||||||||||||
Class A | 1,087,121 | 6,287,403 | 1,662,800 | 10,444,038 | ||||||||||||
Class R | 2,498 | 14,335 | 2,734 | 17,059 | ||||||||||||
Class R4 | 989,423 | 5,756,100 | 3,487,417 | 22,273,083 | ||||||||||||
Class R6 | 4,761,176 | 27,698,312 | 6,519,281 | 41,133,598 | ||||||||||||
Administrator Class | 217,491 | 1,275,211 | 720,680 | 4,555,243 | ||||||||||||
|
| |||||||||||||||
| 41,031,361 | 78,423,021 | |||||||||||||||
|
| |||||||||||||||
Reinvestment of distributions |
| |||||||||||||||
Class A | 950,220 | 5,515,105 | 3,038,024 | 16,527,940 | ||||||||||||
Class R | 349 | 2,001 | 724 | 3,889 | ||||||||||||
Class R4 | 390,756 | 2,288,579 | 1,895,969 | 10,413,427 | ||||||||||||
Class R6 | 1,255,125 | 7,330,906 | 4,355,013 | 23,899,900 | ||||||||||||
Administrator Class | 121,550 | 717,546 | 445,228 | 2,458,518 | ||||||||||||
|
| |||||||||||||||
| 15,854,137 | 53,303,674 | |||||||||||||||
|
| |||||||||||||||
Payment for shares redeemed |
| |||||||||||||||
Class A | (4,190,988 | ) | (24,369,316 | ) | (3,912,642 | ) | (24,272,954 | ) | ||||||||
Class R | (526 | ) | (3,085 | ) | (44 | ) | (281 | ) | ||||||||
Class R4 | (2,457,717 | ) | (14,208,062 | ) | (11,477,637 | ) | (69,488,672 | ) | ||||||||
Class R6 | (10,404,250 | ) | (60,864,548 | ) | (18,795,141 | ) | (116,041,739 | ) | ||||||||
Administrator Class | (1,173,695 | ) | (6,909,384 | ) | (5,176,297 | ) | (33,280,447 | ) | ||||||||
|
| |||||||||||||||
| (106,354,395 | ) | (243,084,093 | ) | |||||||||||||
|
| |||||||||||||||
Net decrease in net assets resulting from capital share transactions | (49,468,897 | ) | (111,357,398 | ) | ||||||||||||
|
| |||||||||||||||
Total decrease in net assets | (47,260,237 | ) | (155,138,572 | ) | ||||||||||||
|
| |||||||||||||||
Net assets | ||||||||||||||||
Beginning of period | 295,250,491 | 450,389,063 | ||||||||||||||
|
| |||||||||||||||
End of period | $ | 247,990,254 | $ | 295,250,491 | ||||||||||||
|
| |||||||||||||||
The accompanying notes are an integral part of these financial statements.
Target Date Retirement Funds | 73
Table of Contents
Statements of changes in net assets
| Target 2030 Fund | ||||||||||||||||
| Year ended February 29, 2020 | Year ended February 28, 2019 | |||||||||||||||
Operations |
| |||||||||||||||
Net investment income | $ | 12,576,081 | $ | 17,929,294 | ||||||||||||
Net realized gains on investments | 15,982,387 | 21,369,543 | ||||||||||||||
Net change in unrealized gains (losses) on investments | 397,507 | (21,586,663 | ) | |||||||||||||
|
| |||||||||||||||
Net increase in net assets resulting from operations | 28,955,975 | 17,712,174 | ||||||||||||||
|
| |||||||||||||||
Distributions to shareholders from net investment income and net realized gains | ||||||||||||||||
Class A | (6,430,044 | ) | (23,857,770 | ) | ||||||||||||
Class C | (67,659 | ) | (517,667 | ) | ||||||||||||
Class R | (1,549 | ) | (5,296 | ) | ||||||||||||
Class R4 | (2,104,186 | ) | (12,770,471 | ) | ||||||||||||
Class R6 | (10,088,137 | ) | (36,810,881 | ) | ||||||||||||
Administrator Class | (3,230,154 | ) | (12,493,202 | ) | ||||||||||||
|
| |||||||||||||||
Total distributions to shareholders | (21,921,729 | ) | (86,455,287 | ) | ||||||||||||
|
| |||||||||||||||
Capital share transactions | Shares | Shares | ||||||||||||||
Proceeds from shares sold |
| |||||||||||||||
Class A | 486,798 | 6,107,933 | 1,235,784 | 15,641,688 | ||||||||||||
Class C | 18,025 | 217,663 | 29,267 | 359,851 | ||||||||||||
Class R | 487 | 6,135 | 612 | 8,209 | ||||||||||||
Class R4 | 677,292 | 8,716,604 | 2,359,710 | 32,163,857 | ||||||||||||
Class R6 | 4,054,583 | 51,911,578 | 8,160,569 | 105,824,109 | ||||||||||||
Administrator Class | 1,226,067 | 15,794,715 | 1,824,427 | 24,481,447 | ||||||||||||
|
| |||||||||||||||
| 82,754,628 | 178,479,161 | |||||||||||||||
|
| |||||||||||||||
Reinvestment of distributions |
| |||||||||||||||
Class A | 494,750 | 6,317,784 | 2,007,781 | 23,475,108 | ||||||||||||
Class C | 5,313 | 64,760 | 45,371 | 506,109 | ||||||||||||
Class R | 56 | 715 | 177 | 2,070 | ||||||||||||
Class R4 | 160,801 | 2,104,186 | 1,066,085 | 12,770,471 | ||||||||||||
Class R6 | 771,741 | 10,079,787 | 3,073,794 | 36,782,051 | ||||||||||||
Administrator Class | 246,692 | 3,228,681 | 1,043,459 | 12,488,536 | ||||||||||||
|
| |||||||||||||||
| 21,795,913 | 86,024,345 | |||||||||||||||
|
| |||||||||||||||
Payment for shares redeemed |
| |||||||||||||||
Class A | (2,256,546 | ) | (28,367,579 | ) | (5,339,051 | ) | (69,930,807 | ) | ||||||||
Class C | (93,773 | ) | (1,117,920 | ) | (191,660 | ) | (2,297,899 | ) | ||||||||
Class R | (238 | ) | (2,947 | ) | (6 | ) | (78 | ) | ||||||||
Class R4 | (1,349,153 | ) | (17,323,715 | ) | (14,686,400 | ) | (196,256,211 | ) | ||||||||
Class R6 | (4,960,799 | ) | (64,120,631 | ) | (18,119,135 | ) | (238,042,805 | ) | ||||||||
Administrator Class | (2,306,946 | ) | (29,822,957 | ) | (7,351,969 | ) | (99,462,934 | ) | ||||||||
|
| |||||||||||||||
| (140,755,749 | ) | (605,990,734 | ) | |||||||||||||
|
| |||||||||||||||
Net decrease in net assets resulting from capital share transactions | (36,205,208 | ) | (341,487,228 | ) | ||||||||||||
|
| |||||||||||||||
Total decrease in net assets | (29,170,962 | ) | (410,230,341 | ) | ||||||||||||
|
| |||||||||||||||
Net assets | ||||||||||||||||
Beginning of period | 557,840,238 | 968,070,579 | ||||||||||||||
|
| |||||||||||||||
End of period | $ | 528,669,276 | $ | 557,840,238 | ||||||||||||
|
| |||||||||||||||
The accompanying notes are an integral part of these financial statements.
74 | Target Date Retirement Funds
Table of Contents
Statements of changes in net assets
| Target 2035 Fund | ||||||||||||||||
| Year ended February 29, 2020 | Year ended February 28, 2019 | |||||||||||||||
Operations |
| |||||||||||||||
Net investment income | $ | 5,447,000 | $ | 8,021,063 | ||||||||||||
Net realized gains on investments | 7,459,035 | 10,893,935 | ||||||||||||||
Net change in unrealized gains (losses) on investments | (1,227,747 | ) | (12,779,105 | ) | ||||||||||||
|
| |||||||||||||||
Net increase in net assets resulting from operations | 11,678,288 | 6,135,893 | ||||||||||||||
|
| |||||||||||||||
Distributions to shareholders from net investment income and net | ||||||||||||||||
Class A | (3,717,098 | ) | (14,755,385 | ) | ||||||||||||
Class R | (10,348 | ) | (30,775 | ) | ||||||||||||
Class R4 | (1,141,365 | ) | (7,980,148 | ) | ||||||||||||
Class R6 | (4,226,161 | ) | (19,477,075 | ) | ||||||||||||
Administrator Class | (329,081 | ) | (1,369,169 | ) | ||||||||||||
|
| |||||||||||||||
Total distributions to shareholders | (9,424,053 | ) | (43,612,552 | ) | ||||||||||||
|
| |||||||||||||||
Capital share transactions | Shares | Shares | ||||||||||||||
Proceeds from shares sold | ||||||||||||||||
Class A | 1,003,096 | 7,678,231 | 1,578,518 | 12,844,648 | ||||||||||||
Class R | 8,162 | 63,766 | 6,995 | 56,742 | ||||||||||||
Class R4 | 733,952 | 5,655,205 | 2,451,098 | 20,206,867 | ||||||||||||
Class R6 | 2,932,915 | 22,487,188 | 5,344,920 | 44,142,406 | ||||||||||||
Administrator Class | 218,809 | 1,711,018 | 497,674 | 4,150,302 | ||||||||||||
|
| |||||||||||||||
| 37,595,408 | 81,400,965 | |||||||||||||||
|
| |||||||||||||||
Reinvestment of distributions |
| |||||||||||||||
Class A | 471,566 | 3,705,773 | 2,057,285 | 14,678,376 | ||||||||||||
Class R | 1,209 | 9,577 | 3,846 | 27,658 | ||||||||||||
Class R4 | 144,784 | 1,141,365 | 1,114,355 | 7,980,148 | ||||||||||||
Class R6 | 536,623 | 4,226,161 | 2,720,348 | 19,464,137 | ||||||||||||
Administrator Class | 41,355 | 329,081 | 189,877 | 1,369,169 | ||||||||||||
|
| |||||||||||||||
| 9,411,957 | 43,519,488 | |||||||||||||||
|
| |||||||||||||||
Payment for shares redeemed |
| |||||||||||||||
Class A | (3,249,331 | ) | (25,183,350 | ) | (3,073,219 | ) | (24,856,182 | ) | ||||||||
Class R | (124 | ) | (966 | ) | (110 | ) | (797 | ) | ||||||||
Class R4 | (1,910,906 | ) | (14,506,476 | ) | (8,784,984 | ) | (69,688,097 | ) | ||||||||
Class R6 | (6,568,616 | ) | (51,007,636 | ) | (15,125,719 | ) | (120,242,533 | ) | ||||||||
Administrator Class | (624,558 | ) | (4,872,916 | ) | (3,641,319 | ) | (30,376,662 | ) | ||||||||
|
| |||||||||||||||
| (95,571,344 | ) | (245,164,271 | ) | |||||||||||||
|
| |||||||||||||||
Net decrease in net assets resulting from capital share transactions | (48,563,979 | ) | (120,243,818 | ) | ||||||||||||
|
| |||||||||||||||
Total decrease in net assets | (46,309,744 | ) | (157,720,477 | ) | ||||||||||||
|
| |||||||||||||||
Net assets | ||||||||||||||||
Beginning of period | 264,656,144 | 422,376,621 | ||||||||||||||
|
| |||||||||||||||
End of period | $ | 218,346,400 | $ | 264,656,144 | ||||||||||||
|
| |||||||||||||||
The accompanying notes are an integral part of these financial statements.
Target Date Retirement Funds | 75
Table of Contents
Statements of changes in net assets
| Target 2040 Fund | ||||||||||||||||
| Year ended February 29, 2020 | Year ended February 28, 2019 | |||||||||||||||
Operations |
| |||||||||||||||
Net investment income | $ | 10,388,342 | $ | 14,790,993 | ||||||||||||
Net realized gains on investments | 14,719,390 | 18,164,625 | ||||||||||||||
Net change in unrealized gains (losses) on investments | (9,362,255 | ) | (19,275,537 | ) | ||||||||||||
|
| |||||||||||||||
Net increase in net assets resulting from operations | 15,745,477 | 13,680,081 | ||||||||||||||
|
| |||||||||||||||
Distributions to shareholders from net investment income and net realized gains | ||||||||||||||||
Class A | (5,969,824 | ) | (26,387,910 | ) | ||||||||||||
Class C | (54,085 | ) | (566,862 | ) | ||||||||||||
Class R | (2,012 | ) | (8,566 | ) | ||||||||||||
Class R4 | (1,494,907 | ) | (11,144,854 | ) | ||||||||||||
Class R6 | (6,885,470 | ) | (30,251,781 | ) | ||||||||||||
Administrator Class | (2,236,336 | ) | (10,424,413 | ) | ||||||||||||
|
| |||||||||||||||
Total distributions to shareholders | (16,642,634 | ) | (78,784,386 | ) | ||||||||||||
|
| |||||||||||||||
Capital share transactions | Shares | Shares | ||||||||||||||
Proceeds from shares sold |
| |||||||||||||||
Class A | 435,086 | 6,386,306 | 975,217 | 14,543,125 | ||||||||||||
Class C | 5,156 | 66,943 | 14,600 | 185,493 | ||||||||||||
Class R | 361 | 5,289 | 546 | 8,708 | ||||||||||||
Class R4 | 539,927 | 8,201,151 | 1,612,529 | 26,355,724 | ||||||||||||
Class R6 | 2,897,179 | 43,953,952 | 6,170,841 | 96,045,196 | ||||||||||||
Administrator Class | 801,012 | 12,206,638 | 1,225,528 | 19,649,251 | ||||||||||||
|
| |||||||||||||||
| 70,820,279 | 156,787,497 | |||||||||||||||
|
| |||||||||||||||
Reinvestment of distributions |
| |||||||||||||||
Class A | 392,281 | 5,915,396 | 1,920,022 | 26,095,251 | ||||||||||||
Class C | 3,965 | 53,572 | 46,258 | 564,325 | ||||||||||||
Class R | 84 | 1,267 | 365 | 4,951 | ||||||||||||
Class R4 | 95,568 | 1,494,907 | 791,271 | 11,144,854 | ||||||||||||
Class R6 | 438,966 | 6,859,433 | 2,148,298 | 30,244,963 | ||||||||||||
Administrator Class | 143,305 | 2,236,336 | 742,370 | 10,421,862 | ||||||||||||
|
| |||||||||||||||
| 16,560,911 | 78,476,206 | |||||||||||||||
|
| |||||||||||||||
Payment for shares redeemed |
| |||||||||||||||
Class A | (1,759,927 | ) | (25,918,147 | ) | (3,380,962 | ) | (52,026,465 | ) | ||||||||
Class C | (74,926 | ) | (968,759 | ) | (205,482 | ) | (2,752,752 | ) | ||||||||
Class R | (146 | ) | (2,122 | ) | (4 | ) | (53 | ) | ||||||||
Class R4 | (851,440 | ) | (12,910,537 | ) | (10,810,527 | ) | (171,991,630 | ) | ||||||||
Class R6 | (3,239,228 | ) | (49,632,121 | ) | (12,842,572 | ) | (202,067,993 | ) | ||||||||
Administrator Class | (1,488,491 | ) | (22,741,073 | ) | (5,102,104 | ) | (82,271,545 | ) | ||||||||
|
| |||||||||||||||
| (112,172,759 | ) | (511,110,438 | ) | |||||||||||||
|
| |||||||||||||||
Net decrease in net assets resulting from capital share transactions | (24,791,569 | ) | (275,846,735 | ) | ||||||||||||
|
| |||||||||||||||
Total decrease in net assets | (25,688,726 | ) | (340,951,040 | ) | ||||||||||||
|
| |||||||||||||||
Net assets | ||||||||||||||||
Beginning of period | 493,989,071 | 834,940,111 | ||||||||||||||
|
| |||||||||||||||
End of period | $ | 468,300,345 | $ | 493,989,071 | ||||||||||||
|
| |||||||||||||||
The accompanying notes are an integral part of these financial statements.
76 | Target Date Retirement Funds
Table of Contents
Statements of changes in net assets
| Target 2045 Fund | ||||||||||||||||
| Year ended February 29, 2020 | Year ended February 28, 2019 | |||||||||||||||
Operations | ||||||||||||||||
Net investment income | $ | 2,913,035 | $ | 4,977,067 | ||||||||||||
Net realized gains on investments | 3,980,983 | 5,191,613 | ||||||||||||||
Net change in unrealized gains (losses) on investments | (1,715,162 | ) | (8,363,923 | ) | ||||||||||||
|
| |||||||||||||||
Net increase in net assets resulting from operations | 5,178,856 | 1,804,757 | ||||||||||||||
|
| |||||||||||||||
Distributions to shareholders from net investment income and net realized gains | ||||||||||||||||
Class A | (1,321,523 | ) | (7,665,404 | ) | ||||||||||||
Class R | (1,378 | ) | (4,825 | ) | ||||||||||||
Class R4 | (576,633 | ) | (5,266,755 | ) | ||||||||||||
Class R6 | (1,865,727 | ) | (13,021,360 | ) | ||||||||||||
Administrator Class | (168,990 | ) | (951,220 | ) | ||||||||||||
|
| |||||||||||||||
Total distributions to shareholders | (3,934,251 | ) | (26,909,564 | ) | ||||||||||||
|
| |||||||||||||||
Capital share transactions | Shares | Shares | ||||||||||||||
Proceeds from shares sold |
| |||||||||||||||
Class A | 789,569 | 6,621,798 | 1,268,596 | 11,274,214 | ||||||||||||
Class R | 1,634 | 14,129 | 332 | 3,049 | ||||||||||||
Class R4 | 473,522 | 4,020,747 | 1,528,232 | 13,873,019 | ||||||||||||
Class R6 | 1,565,972 | 13,262,234 | 3,469,897 | 31,474,217 | ||||||||||||
Administrator Class | 149,633 | 1,286,485 | 410,954 | 3,787,158 | ||||||||||||
|
| |||||||||||||||
| 25,205,393 | 60,411,657 | |||||||||||||||
|
| |||||||||||||||
Reinvestment of distributions |
| |||||||||||||||
Class A | 151,196 | 1,320,351 | 977,784 | 7,647,168 | ||||||||||||
Class R | 81 | 724 | 205 | 1,629 | ||||||||||||
Class R4 | 65,625 | 576,633 | 668,576 | 5,266,755 | ||||||||||||
Class R6 | 213,282 | 1,865,727 | 1,658,603 | 13,021,360 | ||||||||||||
Administrator Class | 19,022 | 168,990 | 119,796 | 951,220 | ||||||||||||
|
| |||||||||||||||
| 3,932,425 | 26,888,132 | |||||||||||||||
|
| |||||||||||||||
Payment for shares redeemed |
| |||||||||||||||
Class A | (2,587,303 | ) | (22,123,618 | ) | (2,042,382 | ) | (17,742,050 | ) | ||||||||
Class R | (151 | ) | (1,260 | ) | (3 | ) | (28 | ) | ||||||||
Class R4 | (1,333,356 | ) | (11,263,976 | ) | (4,568,498 | ) | (38,963,130 | ) | ||||||||
Class R6 | (4,403,251 | ) | (37,539,591 | ) | (11,113,510 | ) | (95,882,723 | ) | ||||||||
Administrator Class | (487,259 | ) | (4,188,921 | ) | (2,913,889 | ) | (26,895,091 | ) | ||||||||
|
| |||||||||||||||
| (75,117,366 | ) | (179,483,022 | ) | |||||||||||||
|
| |||||||||||||||
Net decrease in net assets resulting from capital share transactions | (45,979,548 | ) | (92,183,233 | ) | ||||||||||||
|
| |||||||||||||||
Total decrease in net assets | (44,734,943 | ) | (117,288,040 | ) | ||||||||||||
|
| |||||||||||||||
Net assets | ||||||||||||||||
Beginning of period | 155,252,077 | 272,540,117 | ||||||||||||||
|
| |||||||||||||||
End of period | $ | 110,517,134 | $ | 155,252,077 | ||||||||||||
|
| |||||||||||||||
The accompanying notes are an integral part of these financial statements.
Target Date Retirement Funds | 77
Table of Contents
Statements of changes in net assets
| Target 2050 Fund | ||||||||||||||||
| Year ended February 29, 2020 | Year ended February 28, 2019 | |||||||||||||||
Operations | ||||||||||||||||
Net investment income | $ | 4,729,460 | $ | 7,675,206 | ||||||||||||
Net realized gains on investments | 8,522,429 | 14,913,484 | ||||||||||||||
Net change in unrealized gains (losses) on investments | (8,234,532 | ) | (16,129,644 | ) | ||||||||||||
|
| |||||||||||||||
Net increase in net assets resulting from operations | 5,017,357 | 6,459,046 | ||||||||||||||
|
| |||||||||||||||
Distributions to shareholders from net investments income and realized gains | ||||||||||||||||
Class A | (2,142,046 | ) | (9,998,721 | ) | ||||||||||||
Class C | (22,272 | ) | (229,385 | ) | ||||||||||||
Class R | (1,574 | ) | (6,315 | ) | ||||||||||||
Class R4 | (891,969 | ) | (7,268,509 | ) | ||||||||||||
Class R6 | (5,471,850 | ) | (25,908,320 | ) | ||||||||||||
Administrator Class | (1,843,022 | ) | (8,372,773 | ) | ||||||||||||
|
| |||||||||||||||
Total distributions to shareholders | (10,372,733 | ) | (51,784,023 | ) | ||||||||||||
|
| |||||||||||||||
Capital share transactions | Shares | Shares | ||||||||||||||
Proceeds from shares sold |
| |||||||||||||||
Class A | 777,411 | 5,706,122 | 1,473,336 | 11,485,855 | ||||||||||||
Class C | 5,495 | 40,328 | 18,446 | 154,231 | ||||||||||||
Class R | 832 | 6,201 | 966 | 8,274 | ||||||||||||
Class R4 | 674,678 | 5,020,086 | 2,154,392 | 18,358,680 | ||||||||||||
Class R6 | 4,116,817 | 30,609,669 | 7,548,457 | 60,871,822 | ||||||||||||
Administrator Class | 1,300,441 | 9,682,291 | 2,112,559 | 17,602,897 | ||||||||||||
|
| |||||||||||||||
| 51,064,697 | 108,481,759 | |||||||||||||||
|
| |||||||||||||||
Reinvestment of distributions |
| |||||||||||||||
Class A | 282,055 | 2,134,628 | 1,445,068 | 9,953,000 | ||||||||||||
Class C | 2,734 | 20,489 | 32,594 | 222,303 | ||||||||||||
Class R | 88 | 665 | 258 | 1,780 | ||||||||||||
Class R4 | 116,874 | 891,969 | 1,046,261 | 7,268,509 | ||||||||||||
Class R6 | 717,883 | 5,470,712 | 3,728,317 | 25,889,708 | ||||||||||||
Administrator Class | 242,411 | 1,843,022 | 1,210,420 | 8,372,773 | ||||||||||||
|
| |||||||||||||||
| 10,361,485 | 51,708,073 | |||||||||||||||
|
| |||||||||||||||
Payment for shares redeemed |
| |||||||||||||||
Class A | (1,721,275 | ) | (12,792,520 | ) | (3,308,100 | ) | (26,774,618 | ) | ||||||||
Class C | (76,091 | ) | (558,912 | ) | (68,750 | ) | (505,169 | ) | ||||||||
Class R | (26 | ) | (191 | ) | (8 | ) | (67 | ) | ||||||||
Class R4 | (942,718 | ) | (7,031,823 | ) | (14,586,164 | ) | (121,468,189 | ) | ||||||||
Class R6 | (4,423,086 | ) | (33,198,589 | ) | (17,066,989 | ) | (137,002,569 | ) | ||||||||
Administrator Class | (1,498,842 | ) | (11,155,991 | ) | (7,277,621 | ) | (60,967,722 | ) | ||||||||
|
| |||||||||||||||
| (64,738,026 | ) | (346,718,334 | ) | |||||||||||||
|
| |||||||||||||||
Net decrease in net assets resulting from capital share transactions | (3,311,844 | ) | (186,528,502 | ) | ||||||||||||
|
| |||||||||||||||
Total decrease in net assets | (8,667,220 | ) | (231,853,479 | ) | ||||||||||||
|
| |||||||||||||||
Net assets | ||||||||||||||||
Beginning of period | 221,638,384 | 453,491,863 | ||||||||||||||
|
| |||||||||||||||
End of period | $ | 212,971,164 | $ | 221,638,384 | ||||||||||||
|
| |||||||||||||||
The accompanying notes are an integral part of these financial statements.
78 | Target Date Retirement Funds
Table of Contents
Statements of changes in net assets
| Target 2055 Fund | ||||||||||||||||
| Year ended February 29, 2020 | Year ended February 28, 2019 | |||||||||||||||
Operations | ||||||||||||||||
Net investment income | $ | 815,393 | $ | 1,593,380 | ||||||||||||
Net realized gains on investments | 764,463 | 388,557 | ||||||||||||||
Net change in unrealized gains (losses) on investments | (573,421 | ) | (2,137,811 | ) | ||||||||||||
|
| |||||||||||||||
Net increase (decrease) in net assets resulting from operations | 1,006,435 | (155,874 | ) | |||||||||||||
|
| |||||||||||||||
Distributions to shareholders from net investment income and net | ||||||||||||||||
Class A | (142,934 | ) | (1,154,610 | ) | ||||||||||||
Class R | (779 | ) | (4,713 | ) | ||||||||||||
Class R4 | (177,218 | ) | (1,589,454 | ) | ||||||||||||
Class R6 | (505,416 | ) | (3,851,682 | ) | ||||||||||||
Administrator Class | (12,907 | ) | (132,101 | ) | ||||||||||||
|
| |||||||||||||||
Total distributions to shareholders | (839,254 | ) | (6,732,560 | ) | ||||||||||||
|
| |||||||||||||||
Capital share transactions | Shares | Shares | ||||||||||||||
Proceeds from shares sold |
| |||||||||||||||
Class A | 249,844 | 2,989,458 | 271,189 | 3,342,526 | ||||||||||||
Class R | 498 | 5,843 | 673 | 8,354 | ||||||||||||
Class R4 | 329,687 | 3,988,255 | 562,108 | 7,049,850 | ||||||||||||
Class R6 | 638,993 | 7,729,212 | 1,422,335 | 17,984,319 | ||||||||||||
Administrator Class | 29,947 | 360,117 | 104,231 | 1,320,409 | ||||||||||||
|
| |||||||||||||||
| 15,072,885 | 29,705,458 | |||||||||||||||
|
| |||||||||||||||
Reinvestment of distributions |
| |||||||||||||||
Class A | 11,368 | 142,357 | 103,856 | 1,150,306 | ||||||||||||
Class R | 20 | 245 | 136 | 1,486 | ||||||||||||
Class R4 | 14,106 | 177,218 | 142,902 | 1,589,454 | ||||||||||||
Class R6 | 40,325 | 505,416 | 346,774 | 3,849,401 | ||||||||||||
Administrator Class | 1,023 | 12,907 | 11,912 | 132,101 | ||||||||||||
|
| |||||||||||||||
| 838,143 | 6,722,748 | |||||||||||||||
|
| |||||||||||||||
Payment for shares redeemed |
| |||||||||||||||
Class A | (537,744 | ) | (6,501,930 | ) | (272,876 | ) | (3,315,786 | ) | ||||||||
Class R | (657 | ) | (7,725 | ) | (419 | ) | (5,283 | ) | ||||||||
Class R4 | (372,361 | ) | (4,499,286 | ) | (1,286,858 | ) | (15,246,998 | ) | ||||||||
Class R6 | (603,431 | ) | (7,381,450 | ) | (4,613,789 | ) | (55,622,123 | ) | ||||||||
Administrator Class | (68,444 | ) | (823,710 | ) | (458,190 | ) | (5,851,842 | ) | ||||||||
|
| |||||||||||||||
| (19,214,101 | ) | (80,042,032 | ) | |||||||||||||
|
| |||||||||||||||
Net decrease in net assets resulting from capital share transactions | (3,303,073 | ) | (43,613,826 | ) | ||||||||||||
|
| |||||||||||||||
Total decrease in net assets | (3,135,892 | ) | (50,502,260 | ) | ||||||||||||
|
| |||||||||||||||
Net assets | ||||||||||||||||
Beginning of period | 37,881,762 | 88,384,022 | ||||||||||||||
|
| |||||||||||||||
End of period | $ | 34,745,870 | $ | 37,881,762 | ||||||||||||
|
| |||||||||||||||
The accompanying notes are an integral part of these financial statements.
Target Date Retirement Funds | 79
Table of Contents
Statements of changes in net assets
| Target 2060 Fund | ||||||||||||||||
| Year ended February 29, 2020 | Year ended February 28, 2019 | |||||||||||||||
Operations | ||||||||||||||||
Net investment income | $ | 446,705 | $ | 490,747 | ||||||||||||
Net realized gains (losses) on investments | 420,384 | (316,135 | ) | |||||||||||||
Net change in unrealized gains (losses) on investments | (603,197 | ) | 310,679 | |||||||||||||
|
| |||||||||||||||
Net increase in net assets resulting from operations | 263,892 | 485,291 | ||||||||||||||
|
| |||||||||||||||
Distributions to shareholders from net investment income and net realized gain | ||||||||||||||||
Class A | (15,694 | ) | (24,635 | ) | ||||||||||||
Class C | (1,689 | ) | (10,144 | ) | ||||||||||||
Class R | (1,057 | ) | (2,753 | ) | ||||||||||||
Class R4 | (53,088 | ) | (123,761 | ) | ||||||||||||
Class R6 | (310,399 | ) | (688,736 | ) | ||||||||||||
Administrator Class | (63,995 | ) | (189,691 | ) | ||||||||||||
|
| |||||||||||||||
Total distributions to shareholders | (445,922 | ) | (1,039,720 | ) | ||||||||||||
|
| |||||||||||||||
Capital share transactions | Shares | Shares | ||||||||||||||
Proceeds from shares sold |
| |||||||||||||||
Class A | 59,651 | 719,273 | 76,768 | 896,544 | ||||||||||||
Class C | 1,122 | 13,049 | 1,954 | 22,381 | ||||||||||||
Class R | 1,141 | 13,327 | 789 | 9,061 | ||||||||||||
Class R4 | 108,478 | 1,308,060 | 201,859 | 2,403,910 | ||||||||||||
Class R6 | 748,398 | 9,084,784 | 923,279 | 10,972,269 | ||||||||||||
Administrator Class | 141,839 | 1,711,085 | 285,112 | 3,375,609 | ||||||||||||
|
| |||||||||||||||
| 12,849,578 | 17,679,774 | |||||||||||||||
|
| |||||||||||||||
Reinvestment of distributions |
| |||||||||||||||
Class A | 1,250 | 15,523 | 2,229 | 24,138 | ||||||||||||
Class C | 118 | 1,471 | 831 | 8,994 | ||||||||||||
Class R | 55 | 674 | 139 | 1,480 | ||||||||||||
Class R4 | 4,178 | 52,899 | 11,186 | 123,228 | ||||||||||||
Class R6 | 24,598 | 310,197 | 62,764 | 688,177 | ||||||||||||
Administrator Class | 5,118 | 63,822 | 17,416 | 189,167 | ||||||||||||
|
| |||||||||||||||
| 444,586 | 1,035,184 | |||||||||||||||
|
| |||||||||||||||
Payment for shares redeemed |
| |||||||||||||||
Class A | (33,471 | ) | (403,008 | ) | (97,949 | ) | (1,159,367 | ) | ||||||||
Class C | (8,193 | ) | (99,186 | ) | 0 | 0 | ||||||||||
Class R | (27 | ) | (314 | ) | (436 | ) | (5,264 | ) | ||||||||
Class R4 | (90,634 | ) | (1,118,012 | ) | (462,721 | ) | (5,517,303 | ) | ||||||||
Class R6 | (339,934 | ) | (4,197,518 | ) | (1,089,048 | ) | (12,971,855 | ) | ||||||||
Administrator Class | (98,703 | ) | (1,189,286 | ) | (394,173 | ) | (4,623,482 | ) | ||||||||
|
| |||||||||||||||
| (7,007,324 | ) | (24,277,271 | ) | |||||||||||||
|
| |||||||||||||||
Net increase (decrease) in net assets resulting from capital share transactions | 6,286,840 | (5,562,313 | ) | |||||||||||||
|
| |||||||||||||||
Total increase (decrease) in net assets | 6,104,810 | (6,116,742 | ) | |||||||||||||
|
| |||||||||||||||
Net assets | ||||||||||||||||
Beginning of period | 16,537,899 | 22,654,641 | ||||||||||||||
|
| |||||||||||||||
End of period | $ | 22,642,709 | $ | 16,537,899 | ||||||||||||
|
| |||||||||||||||
The accompanying notes are an integral part of these financial statements.
80 | Target Date Retirement Funds
Table of Contents
This page is intentionally left blank.
Table of Contents
| Beginning net asset value per share | Net investment income | Net realized and unrealized gains (losses) on investments | Distributions from net investment income | Distributions from net realized gains | Ending net asset value per share | |||||||||||||||||||
Target Today Fund | ||||||||||||||||||||||||
Class A | ||||||||||||||||||||||||
Year ended February 29, 2020 | $ | 8.66 | 0.19 | 0.47 | (0.20 | ) | (0.08 | ) | $ | 9.04 | ||||||||||||||
Year ended February 28, 2019 | $ | 8.97 | 0.19 | 0.07 | (0.21 | ) | (0.36 | ) | $ | 8.66 | ||||||||||||||
Year ended February 28, 2018 | $ | 10.56 | 0.17 | 0.13 | (0.08 | ) | (1.81 | ) | $ | 8.97 | ||||||||||||||
Year ended February 28, 2017 | $ | 10.41 | 0.12 | 0.23 | (0.11 | ) | (0.09 | ) | $ | 10.56 | ||||||||||||||
Year ended February 29, 2016 | $ | 10.81 | 0.10 | 4 | (0.29 | ) | (0.03 | ) | (0.18 | ) | $ | 10.41 | ||||||||||||
Class C | ||||||||||||||||||||||||
Year ended February 29, 2020 | $ | 8.89 | 0.14 | 4 | 0.47 | (0.12 | ) | (0.08 | ) | $ | 9.30 | |||||||||||||
Year ended February 28, 2019 | $ | 9.18 | 0.14 | 4 | 0.06 | (0.13 | ) | (0.36 | ) | $ | 8.89 | |||||||||||||
Year ended February 28, 2018 | $ | 10.77 | 0.10 | 0.13 | (0.01 | ) | (1.81 | ) | $ | 9.18 | ||||||||||||||
Year ended February 28, 2017 | $ | 10.63 | 0.03 | 0.24 | (0.04 | ) | (0.09 | ) | $ | 10.77 | ||||||||||||||
Year ended February 29, 2016 | $ | 11.08 | 0.02 | 4 | (0.29 | ) | 0.00 | (0.18 | ) | $ | 10.63 | |||||||||||||
Class R | ||||||||||||||||||||||||
Year ended February 29, 2020 | $ | 8.62 | 0.17 | 0.46 | (0.17 | ) | (0.08 | ) | $ | 9.00 | ||||||||||||||
Year ended February 28, 2019 | $ | 8.94 | 0.17 | 0.06 | (0.19 | ) | (0.36 | ) | $ | 8.62 | ||||||||||||||
Year ended February 28, 2018 | $ | 10.53 | 0.14 | 0.14 | (0.06 | ) | (1.81 | ) | $ | 8.94 | ||||||||||||||
Year ended February 28, 2017 | $ | 10.39 | 0.09 | 0.23 | (0.09 | ) | (0.09 | ) | $ | 10.53 | ||||||||||||||
Year ended February 29, 2016 | $ | 10.80 | 0.07 | (0.29 | ) | (0.01 | ) | (0.18 | ) | $ | 10.39 | |||||||||||||
Class R4 | ||||||||||||||||||||||||
Year ended February 29, 2020 | $ | 8.89 | 0.23 | 4 | 0.48 | (0.23 | ) | (0.08 | ) | $ | 9.29 | |||||||||||||
Year ended February 28, 2019 | $ | 9.20 | 0.24 | 4 | 0.05 | (0.24 | ) | (0.36 | ) | $ | 8.89 | |||||||||||||
Year ended February 28, 2018 | $ | 10.81 | 0.17 | 4 | 0.13 | (0.10 | ) | (1.81 | ) | $ | 9.20 | |||||||||||||
Year ended February 28, 2017 | $ | 10.65 | 0.14 | 0.25 | (0.14 | ) | (0.09 | ) | $ | 10.81 | ||||||||||||||
Year ended February 29, 2016 | $ | 11.06 | 0.14 | (0.30 | ) | (0.07 | ) | (0.18 | ) | $ | 10.65 | |||||||||||||
Class R6 | ||||||||||||||||||||||||
Year ended February 29, 2020 | $ | 8.88 | 0.24 | 4 | 0.48 | (0.24 | ) | (0.08 | ) | $ | 9.28 | |||||||||||||
Year ended February 28, 2019 | $ | 9.19 | 0.25 | 4 | 0.06 | (0.26 | ) | (0.36 | ) | $ | 8.88 | |||||||||||||
Year ended February 28, 2018 | $ | 10.78 | 0.21 | 4 | 0.15 | (0.14 | ) | (1.81 | ) | $ | 9.19 | |||||||||||||
Year ended February 28, 2017 | $ | 10.64 | 0.17 | 4 | 0.23 | (0.17 | ) | (0.09 | ) | $ | 10.78 | |||||||||||||
Year ended February 29, 2016 | $ | 11.05 | 0.15 | (0.29 | ) | (0.09 | ) | (0.18 | ) | $ | 10.64 | |||||||||||||
Administrator Class | ||||||||||||||||||||||||
Year ended February 29, 2020 | $ | 8.90 | 0.21 | 4 | 0.48 | (0.21 | ) | (0.08 | ) | $ | 9.30 | |||||||||||||
Year ended February 28, 2019 | $ | 9.21 | 0.22 | 4 | 0.05 | (0.22 | ) | (0.36 | ) | $ | 8.90 | |||||||||||||
Year ended February 28, 2018 | $ | 10.78 | 0.18 | 0.15 | (0.09 | ) | (1.81 | ) | $ | 9.21 | ||||||||||||||
Year ended February 28, 2017 | $ | 10.63 | 0.13 | 4 | 0.23 | (0.12 | ) | (0.09 | ) | $ | 10.78 | |||||||||||||
Year ended February 29, 2016 | $ | 11.03 | 0.12 | 4 | (0.29 | ) | (0.05 | ) | (0.18 | ) | $ | 10.63 | ||||||||||||
| 1 | Ratios include net expenses allocated from the affiliated Master Portfolios which were as follows: |
Year ended | Year ended February 28 | Year ended February 29, 2016 | ||||||||||||||||||
| 2019 | 2018 | 2017 | ||||||||||||||||||
Class A | 0.12 | % | 0.13 | % | 0.15 | % | 0.15 | % | 0.15 | % | ||||||||||
Class C | 0.12 | 0.13 | 0.15 | 0.15 | 0.15 | |||||||||||||||
Class R | 0.17 | 0.11 | 0.16 | 0.16 | 0.14 | |||||||||||||||
Class R4 | 0.12 | 0.13 | 0.16 | 0.15 | 0.15 | |||||||||||||||
Class R6 | 0.12 | 0.13 | 0.15 | 0.15 | 0.15 | |||||||||||||||
Administrator Class | 0.12 | 0.13 | 0.15 | 0.15 | 0.15 | |||||||||||||||
| 2 | Total return calculations do not include any sales charges. |
| 3 | Portfolio turnover rate is calculated by multiplying the Fund’s ownership percentage in each respective affiliated Master Portfolio by the corresponding affiliated Master Portfolio’s purchases and sales. |
| 4 | Calculated based upon average shares outstanding |
The accompanying notes are an integral part of these financial statements.
82 | Target Date Retirement Funds
Table of Contents
Financial highlights
| Ratio to average net assets (annualized) | Total | Portfolio | Net assets at | |||||||||||||||||||
| Net investment income1 | Gross expenses1 | Net expenses1 | ||||||||||||||||||||
| 2.16 | % | 0.98 | % | 0.63 | % | 7.64 | % | 37 | % | $ | 36,878 | |||||||||||
| 2.21 | % | 0.93 | % | 0.65 | % | 3.09 | % | 45 | % | $ | 37,865 | |||||||||||
| 1.59 | % | 0.87 | % | 0.69 | % | 2.54 | % | 80 | % | $ | 47,030 | |||||||||||
| 1.06 | % | 0.85 | % | 0.76 | % | 3.39 | % | 41 | % | $ | 55,965 | |||||||||||
| 0.98 | % | 0.86 | % | 0.77 | % | (1.74 | )% | 36 | % | $ | 66,656 | |||||||||||
| 1.46 | % | 1.73 | % | 1.39 | % | 6.80 | % | 37 | % | $ | 529 | |||||||||||
| 1.50 | % | 1.68 | % | 1.40 | % | 2.31 | % | 45 | % | $ | 923 | |||||||||||
| 0.83 | % | 1.62 | % | 1.44 | % | 1.76 | % | 80 | % | $ | 2,250 | |||||||||||
| 0.31 | % | 1.61 | % | 1.51 | % | 2.57 | % | 41 | % | $ | 2,822 | |||||||||||
| 0.19 | % | 1.63 | % | 1.53 | % | (2.44 | )% | 36 | % | $ | 2,763 | |||||||||||
| 1.88 | % | 1.23 | % | 0.90 | % | 7.35 | % | 37 | % | $ | 31 | |||||||||||
| 1.96 | % | 1.16 | % | 0.89 | % | 2.72 | % | 45 | % | $ | 28 | |||||||||||
| 1.36 | % | 1.13 | % | 0.94 | % | 2.31 | % | 80 | % | $ | 29 | |||||||||||
| 0.79 | % | 1.12 | % | 1.01 | % | 3.13 | % | 41 | % | $ | 32 | |||||||||||
| 0.69 | % | 1.12 | % | 1.02 | % | (2.00 | )% | 36 | % | $ | 29 | |||||||||||
| 2.46 | % | 0.70 | % | 0.34 | % | 7.98 | % | 37 | % | $ | 2,437 | |||||||||||
| 2.62 | % | 0.67 | % | 0.34 | % | 3.35 | % | 45 | % | $ | 2,825 | |||||||||||
| 1.54 | % | 0.60 | % | 0.44 | % | 2.46 | % | 80 | % | $ | 12,858 | |||||||||||
| 1.37 | % | 0.58 | % | 0.45 | % | 3.71 | % | 41 | % | $ | 248,734 | |||||||||||
| 1.27 | % | 0.59 | % | 0.45 | % | (1.40 | )% | 36 | % | $ | 271,674 | |||||||||||
| 2.60 | % | 0.55 | % | 0.19 | % | 8.16 | % | 37 | % | $ | 17,264 | |||||||||||
| 2.72 | % | 0.51 | % | 0.19 | % | 3.52 | % | 45 | % | $ | 17,013 | |||||||||||
| 1.99 | % | 0.44 | % | 0.24 | % | 2.99 | % | 80 | % | $ | 40,511 | |||||||||||
| 1.53 | % | 0.42 | % | 0.30 | % | 3.81 | % | 41 | % | $ | 72,643 | |||||||||||
| 1.42 | % | 0.43 | % | 0.30 | % | (1.25 | )% | 36 | % | $ | 243,820 | |||||||||||
| 2.29 | % | 0.90 | % | 0.53 | % | 7.76 | % | 37 | % | $ | 7,029 | |||||||||||
| 2.38 | % | 0.86 | % | 0.54 | % | 3.11 | % | 45 | % | $ | 9,597 | |||||||||||
| 1.66 | % | 0.79 | % | 0.59 | % | 2.77 | % | 80 | % | $ | 24,351 | |||||||||||
| 1.17 | % | 0.77 | % | 0.65 | % | 3.41 | % | 41 | % | $ | 39,234 | |||||||||||
| 1.07 | % | 0.78 | % | 0.65 | % | (1.56 | )% | 36 | % | $ | 61,887 | |||||||||||
The accompanying notes are an integral part of these financial statements.
Target Date Retirement Funds | 83
Table of Contents
Financial highlights
| Beginning net asset value per share | Net investment income | Net realized and unrealized gains (losses) on investments | Distributions from net investment income | Distributions from net realized gains | Ending net asset value per share | |||||||||||||||||||
Target 2010 Fund | ||||||||||||||||||||||||
Class A | ||||||||||||||||||||||||
Year ended February 29, 2020 | $ | 10.13 | 0.23 | 4 | 0.53 | (0.23 | ) | (0.11 | ) | $ | 10.55 | |||||||||||||
Year ended February 28, 2019 | $ | 10.72 | 0.23 | 4 | 0.07 | (0.27 | ) | (0.62 | ) | $ | 10.13 | |||||||||||||
Year ended February 28, 2018 | $ | 12.41 | 0.19 | 0.22 | (0.04 | ) | (2.06 | ) | $ | 10.72 | ||||||||||||||
Year ended February 28, 2017 | $ | 12.26 | 0.15 | 0.30 | (0.09 | ) | (0.21 | ) | $ | 12.41 | ||||||||||||||
Year ended February 29, 2016 | $ | 13.16 | 0.14 | 4 | (0.40 | ) | (0.06 | ) | (0.58 | ) | $ | 12.26 | ||||||||||||
Class C | ||||||||||||||||||||||||
Year ended February 29, 2020 | $ | 10.24 | 0.15 | 4 | 0.54 | (0.15 | ) | (0.11 | ) | $ | 10.67 | |||||||||||||
Year ended February 28, 2019 | $ | 10.82 | 0.16 | 4 | 0.06 | (0.18 | ) | (0.62 | ) | $ | 10.24 | |||||||||||||
Year ended February 28, 2018 | $ | 12.56 | 0.13 | 0.19 | 0.00 | (2.06 | ) | $ | 10.82 | |||||||||||||||
Year ended February 28, 2017 | $ | 12.42 | 0.07 | 0.30 | (0.02 | ) | (0.21 | ) | $ | 12.56 | ||||||||||||||
Year ended February 29, 2016 | $ | 13.36 | 0.04 | 4 | (0.40 | ) | 0.00 | (0.58 | ) | $ | 12.42 | |||||||||||||
Class R | ||||||||||||||||||||||||
Year ended February 29, 2020 | $ | 10.04 | 0.20 | 0.53 | (0.20 | ) | (0.11 | ) | $ | 10.46 | ||||||||||||||
Year ended February 28, 2019 | $ | 10.63 | 0.20 | 0.07 | (0.24 | ) | (0.62 | ) | $ | 10.04 | ||||||||||||||
Year ended February 28, 2018 | $ | 12.33 | 0.16 | 0.22 | (0.02 | ) | (2.06 | ) | $ | 10.63 | ||||||||||||||
Year ended February 28, 2017 | $ | 12.19 | 0.11 | 0.31 | (0.07 | ) | (0.21 | ) | $ | 12.33 | ||||||||||||||
Year ended February 29, 2016 | $ | 13.11 | 0.11 | 4 | (0.41 | ) | (0.04 | ) | (0.58 | ) | $ | 12.19 | ||||||||||||
Class R4 | ||||||||||||||||||||||||
Year ended February 29, 2020 | $ | 10.27 | 0.27 | 4 | 0.54 | (0.27 | ) | (0.11 | ) | $ | 10.70 | |||||||||||||
Year ended February 28, 2019 | $ | 10.86 | 0.29 | 4 | 0.04 | (0.30 | ) | (0.62 | ) | $ | 10.27 | |||||||||||||
Year ended February 28, 2018 | $ | 12.55 | 0.23 | 4 | 0.22 | (0.08 | ) | (2.06 | ) | $ | 10.86 | |||||||||||||
Year ended February 28, 2017 | $ | 12.38 | 0.19 | 4 | 0.32 | (0.13 | ) | (0.21 | ) | $ | 12.55 | |||||||||||||
Year ended February 29, 2016 | $ | 13.30 | 0.18 | 4 | (0.41 | ) | (0.11 | ) | (0.58 | ) | $ | 12.38 | ||||||||||||
Class R6 | ||||||||||||||||||||||||
Year ended February 29, 2020 | $ | 10.25 | 0.28 | 4 | 0.54 | (0.28 | ) | (0.11 | ) | $ | 10.68 | |||||||||||||
Year ended February 28, 2019 | $ | 10.84 | 0.29 | 4 | 0.06 | (0.32 | ) | (0.62 | ) | $ | 10.25 | |||||||||||||
Year ended February 28, 2018 | $ | 12.54 | 0.25 | 4 | 0.22 | (0.11 | ) | (2.06 | ) | $ | 10.84 | |||||||||||||
Year ended February 28, 2017 | $ | 12.37 | 0.21 | 4 | 0.32 | (0.15 | ) | (0.21 | ) | $ | 12.54 | |||||||||||||
Year ended February 29, 2016 | $ | 13.29 | 0.19 | (0.40 | ) | (0.13 | ) | (0.58 | ) | $ | 12.37 | |||||||||||||
Administrator Class | ||||||||||||||||||||||||
Year ended February 29, 2020 | $ | 10.27 | 0.24 | 4 | 0.55 | (0.24 | ) | (0.11 | ) | $ | 10.71 | |||||||||||||
Year ended February 28, 2019 | $ | 10.86 | 0.26 | 4 | 0.05 | (0.28 | ) | (0.62 | ) | $ | 10.27 | |||||||||||||
Year ended February 28, 2018 | $ | 12.55 | 0.21 | 4 | 0.21 | (0.05 | ) | (2.06 | ) | $ | 10.86 | |||||||||||||
Year ended February 28, 2017 | $ | 12.39 | 0.16 | 0.31 | (0.10 | ) | (0.21 | ) | $ | 12.55 | ||||||||||||||
Year ended February 29, 2016 | $ | 13.29 | 0.16 | 4 | (0.41 | ) | (0.07 | ) | (0.58 | ) | $ | 12.39 | ||||||||||||
| 1 | Ratios include net expenses allocated from the affiliated Master Portfolios which were as follows: |
Year ended February 29, 2020 | Year ended February 28 | Year ended February 29, 2016 | ||||||||||||||||||
| 2019 | 2018 | 2017 | ||||||||||||||||||
Class A | 0.12 | % | 0.13 | % | 0.15 | % | 0.16 | % | 0.15 | % | ||||||||||
Class C | 0.12 | 0.13 | 0.15 | 0.16 | 0.15 | |||||||||||||||
Class R | 0.20 | 0.13 | 0.16 | 0.16 | 0.15 | |||||||||||||||
Class R4 | 0.12 | 0.13 | 0.15 | 0.16 | 0.15 | |||||||||||||||
Class R6 | 0.12 | 0.13 | 0.15 | 0.16 | 0.15 | |||||||||||||||
Administrator Class | 0.12 | 0.13 | 0.15 | 0.16 | 0.15 | |||||||||||||||
| 2 | Total return calculations do not include any sales charges. |
| 3 | Portfolio turnover rate is calculated by multiplying the Fund’s ownership percentage in each respective affiliated Master Portfolio by the corresponding affiliated Master Portfolio’s purchases and sales. |
| 4 | Calculated based upon average shares outstanding |
The accompanying notes are an integral part of these financial statements.
84 | Target Date Retirement Funds
Table of Contents
Financial highlights
| Ratio to average net assets (annualized) | Total | Portfolio | Net assets at | |||||||||||||||||||
| Net investment income1 | Gross expenses1 | Net expenses1 | ||||||||||||||||||||
| 2.15 | % | 1.00 | % | 0.63 | % | 7.57 | % | 37 | % | $ | 33,505 | |||||||||||
| 2.20 | % | 0.91 | % | 0.65 | % | 3.03 | % | 45 | % | $ | 35,777 | |||||||||||
| 1.58 | % | 0.87 | % | 0.70 | % | 3.04 | % | 79 | % | $ | 51,677 | |||||||||||
| 1.14 | % | 0.87 | % | 0.78 | % | 3.71 | % | 41 | % | $ | 60,237 | |||||||||||
| 1.11 | % | 0.88 | % | 0.79 | % | (1.99 | )% | 36 | % | $ | 67,826 | |||||||||||
| 1.40 | % | 1.75 | % | 1.39 | % | 6.70 | % | 37 | % | $ | 576 | |||||||||||
| 1.47 | % | 1.65 | % | 1.40 | % | 2.25 | % | 45 | % | $ | 735 | |||||||||||
| 0.83 | % | 1.62 | % | 1.45 | % | 2.25 | % | 79 | % | $ | 1,323 | |||||||||||
| 0.39 | % | 1.62 | % | 1.53 | % | 2.96 | % | 41 | % | $ | 1,761 | |||||||||||
| 0.34 | % | 1.65 | % | 1.55 | % | (2.69 | )% | 36 | % | $ | 1,984 | |||||||||||
| 1.87 | % | 1.24 | % | 0.90 | % | 7.29 | % | 37 | % | $ | 23 | |||||||||||
| 1.94 | % | 1.14 | % | 0.90 | % | 2.82 | % | 45 | % | $ | 22 | |||||||||||
| 1.32 | % | 1.13 | % | 0.96 | % | 2.75 | % | 79 | % | $ | 23 | |||||||||||
| 0.88 | % | 1.14 | % | 1.03 | % | 3.45 | % | 41 | % | $ | 53 | |||||||||||
| 0.84 | % | 1.16 | % | 1.05 | % | (2.27 | )% | 36 | % | $ | 52 | |||||||||||
| 2.50 | % | 0.72 | % | 0.34 | % | 7.90 | % | 37 | % | $ | 1,155 | |||||||||||
| 2.65 | % | 0.66 | % | 0.34 | % | 3.35 | % | 45 | % | $ | 1,825 | |||||||||||
| 1.83 | % | 0.59 | % | 0.41 | % | 3.30 | % | 79 | % | $ | 17,218 | |||||||||||
| 1.45 | % | 0.59 | % | 0.47 | % | 4.11 | % | 41 | % | $ | 48,885 | |||||||||||
| 1.42 | % | 0.61 | % | 0.47 | % | (1.73 | )% | 36 | % | $ | 70,528 | |||||||||||
| 2.61 | % | 0.57 | % | 0.19 | % | 8.07 | % | 37 | % | $ | 14,128 | |||||||||||
| 2.71 | % | 0.48 | % | 0.19 | % | 3.53 | % | 45 | % | $ | 16,789 | |||||||||||
| 2.00 | % | 0.44 | % | 0.25 | % | 3.42 | % | 79 | % | $ | 40,332 | |||||||||||
| 1.61 | % | 0.44 | % | 0.32 | % | 4.27 | % | 41 | % | $ | 82,474 | |||||||||||
| 1.57 | % | 0.45 | % | 0.32 | % | (1.59 | )% | 36 | % | $ | 200,168 | |||||||||||
| 2.29 | % | 0.92 | % | 0.54 | % | 7.77 | % | 37 | % | $ | 8,332 | |||||||||||
| 2.37 | % | 0.83 | % | 0.54 | % | 3.08 | % | 45 | % | $ | 12,382 | |||||||||||
| 1.68 | % | 0.79 | % | 0.59 | % | 3.09 | % | 79 | % | $ | 32,634 | |||||||||||
| 1.26 | % | 0.79 | % | 0.67 | % | 3.84 | % | 41 | % | $ | 49,565 | |||||||||||
| 1.22 | % | 0.80 | % | 0.67 | % | (1.83 | )% | 36 | % | $ | 91,381 | |||||||||||
The accompanying notes are an integral part of these financial statements.
Target Date Retirement Funds | 85
Table of Contents
Financial highlights
| Beginning net asset value per share | Net investment income | Net realized and unrealized gains (losses) on investments | Distributions from net investment income | Distributions from net realized gains | Ending net asset value per share | |||||||||||||||||||
Target 2015 Fund | ||||||||||||||||||||||||
Class A | ||||||||||||||||||||||||
Year ended February 29, 2020 | $ | 7.04 | 0.16 | 4 | 0.34 | (0.16 | ) | (0.21 | ) | $ | 7.17 | |||||||||||||
Year ended February 28, 2019 | $ | 7.88 | 0.16 | 0.06 | (0.17 | ) | (0.89 | ) | $ | 7.04 | ||||||||||||||
Year ended February 28, 2018 | $ | 10.12 | 0.15 | 0.27 | (0.02 | ) | (2.64 | ) | $ | 7.88 | ||||||||||||||
Year ended February 28, 2017 | $ | 9.87 | 0.15 | 4 | 0.37 | (0.10 | ) | (0.17 | ) | $ | 10.12 | |||||||||||||
Year ended February 29, 2016 | $ | 10.40 | 0.15 | (0.41 | ) | (0.09 | ) | (0.18 | ) | $ | 9.87 | |||||||||||||
Class R | ||||||||||||||||||||||||
Year ended February 29, 2020 | $ | 7.19 | 0.14 | 0.35 | (0.14 | ) | (0.21 | ) | $ | 7.33 | ||||||||||||||
Year ended February 28, 2019 | $ | 8.02 | 0.15 | 0.05 | (0.14 | ) | (0.89 | ) | $ | 7.19 | ||||||||||||||
Year ended February 28, 2018 | $ | 10.26 | 0.13 | 0.27 | (0.00 | )5 | (2.64 | ) | $ | 8.02 | ||||||||||||||
Year ended February 28, 2017 | $ | 10.01 | 0.13 | 0.37 | (0.08 | ) | (0.17 | ) | $ | 10.26 | ||||||||||||||
Year ended February 29, 2016 | $ | 10.55 | 0.13 | (0.42 | ) | (0.07 | ) | (0.18 | ) | $ | 10.01 | |||||||||||||
Class R4 | ||||||||||||||||||||||||
Year ended February 29, 2020 | $ | 7.10 | 0.18 | 4 | 0.35 | (0.18 | ) | (0.21 | ) | $ | 7.24 | |||||||||||||
Year ended February 28, 2019 | $ | 7.94 | 0.21 | 4 | 0.03 | (0.19 | ) | (0.89 | ) | $ | 7.10 | |||||||||||||
Year ended February 28, 2018 | $ | 10.16 | 0.19 | 4 | 0.26 | (0.03 | ) | (2.64 | ) | $ | 7.94 | |||||||||||||
Year ended February 28, 2017 | $ | 9.91 | 0.18 | 4 | 0.37 | (0.13 | ) | (0.17 | ) | $ | 10.16 | |||||||||||||
Year ended February 29, 2016 | $ | 10.43 | 0.18 | (0.41 | ) | (0.11 | ) | (0.18 | ) | $ | 9.91 | |||||||||||||
Class R6 | ||||||||||||||||||||||||
Year ended February 29, 2020 | $ | 7.10 | 0.19 | 4 | 0.35 | (0.19 | ) | (0.21 | ) | $ | 7.24 | |||||||||||||
Year ended February 28, 2019 | $ | 7.94 | 0.21 | 4 | 0.04 | (0.20 | ) | (0.89 | ) | $ | 7.10 | |||||||||||||
Year ended February 28, 2018 | $ | 10.15 | 0.25 | 0.22 | (0.04 | ) | (2.64 | ) | $ | 7.94 | ||||||||||||||
Year ended February 28, 2017 | $ | 9.90 | 0.20 | 4 | 0.37 | (0.15 | ) | (0.17 | ) | $ | 10.15 | |||||||||||||
Year ended February 29, 2016 | $ | 10.42 | 0.20 | (0.42 | ) | (0.12 | ) | (0.18 | ) | $ | 9.90 | |||||||||||||
Administrator Class | ||||||||||||||||||||||||
Year ended February 29, 2020 | $ | 7.24 | 0.17 | 4 | 0.35 | (0.17 | ) | (0.21 | ) | $ | 7.38 | |||||||||||||
Year ended February 28, 2019 | $ | 8.07 | 0.19 | 4 | 0.04 | (0.17 | ) | (0.89 | ) | $ | 7.24 | |||||||||||||
Year ended February 28, 2018 | $ | 10.29 | 0.18 | 4 | 0.26 | (0.02 | ) | (2.64 | ) | $ | 8.07 | |||||||||||||
Year ended February 28, 2017 | $ | 10.02 | 0.17 | 4 | 0.38 | (0.11 | ) | (0.17 | ) | $ | 10.29 | |||||||||||||
Year ended February 29, 2016 | $ | 10.55 | 0.17 | (0.43 | ) | (0.09 | ) | (0.18 | ) | $ | 10.02 | |||||||||||||
| 1 | Ratios include net expenses allocated from the affiliated Master Portfolios which were as follows: |
Year ended | Year ended February 28 | Year ended February 29, 2016 | ||||||||||||||||||
| 2019 | 2018 | 2017 | ||||||||||||||||||
Class A | 0.12 | % | 0.14 | % | 0.16 | % | 0.16 | % | 0.16 | % | ||||||||||
Class R | 0.19 | 0.12 | 0.17 | 0.16 | 0.16 | |||||||||||||||
Class R4 | 0.12 | 0.14 | 0.16 | 0.16 | 0.16 | |||||||||||||||
Class R6 | 0.12 | 0.14 | 0.16 | 0.16 | 0.16 | |||||||||||||||
Administrator Class | 0.12 | 0.14 | 0.16 | 0.16 | 0.16 | |||||||||||||||
| 2 | Total return calculations do not include any sales charges. |
| 3 | Portfolio turnover rate is calculated by multiplying the Fund’s ownership percentage in each respective affiliated Master Portfolio by the corresponding affiliated Master Portfolio’s purchases and sales. |
| 4 | Calculated based upon average shares outstanding |
| 5 | Amount is less than $0.005. |
The accompanying notes are an integral part of these financial statements.
86 | Target Date Retirement Funds
Table of Contents
Financial highlights
| Ratio to average net assets (annualized) | Total | Portfolio | Net assets at | |||||||||||||||||||
| Net investment income1 | Gross expenses1 | Net expenses1 | ||||||||||||||||||||
| 2.13 | % | 0.96 | % | 0.62 | % | 7.18 | % | 36 | % | $ | 32,650 | |||||||||||
| 2.16 | % | 0.90 | % | 0.65 | % | 3.17 | % | 44 | % | $ | 36,236 | |||||||||||
| 1.65 | % | 0.86 | % | 0.71 | % | 3.72 | % | 76 | % | $ | 42,542 | |||||||||||
| 1.43 | % | 0.87 | % | 0.79 | % | 5.30 | % | 41 | % | $ | 54,770 | |||||||||||
| 1.55 | % | 0.85 | % | 0.79 | % | (2.54 | )% | 36 | % | $ | 74,807 | |||||||||||
| 1.83 | % | 1.19 | % | 0.90 | % | 6.80 | % | 36 | % | $ | 20 | |||||||||||
| 1.91 | % | 1.14 | % | 0.90 | % | 2.98 | % | 44 | % | $ | 20 | |||||||||||
| 1.41 | % | 1.12 | % | 0.96 | % | 3.52 | % | 76 | % | $ | 22 | |||||||||||
| 1.18 | % | 1.12 | % | 1.04 | % | 4.99 | % | 41 | % | $ | 37 | |||||||||||
| 1.25 | % | 1.14 | % | 1.06 | % | (2.78 | )% | 36 | % | $ | 42 | |||||||||||
| 2.42 | % | 0.67 | % | 0.34 | % | 7.57 | % | 36 | % | $ | 5,853 | |||||||||||
| 2.62 | % | 0.60 | % | 0.34 | % | 3.50 | % | 44 | % | $ | 7,352 | |||||||||||
| 1.91 | % | 0.59 | % | 0.41 | % | 4.05 | % | 76 | % | $ | 43,346 | |||||||||||
| 1.73 | % | 0.59 | % | 0.48 | % | 5.57 | % | 41 | % | $ | 105,773 | |||||||||||
| 1.83 | % | 0.59 | % | 0.48 | % | (2.22 | )% | 36 | % | $ | 127,503 | |||||||||||
| 2.62 | % | 0.52 | % | 0.19 | % | 7.74 | % | 36 | % | $ | 18,725 | |||||||||||
| 2.67 | % | 0.46 | % | 0.19 | % | 3.65 | % | 44 | % | $ | 31,174 | |||||||||||
| 2.08 | % | 0.44 | % | 0.26 | % | 4.27 | % | 76 | % | $ | 61,265 | |||||||||||
| 1.92 | % | 0.43 | % | 0.33 | % | 5.74 | % | 41 | % | $ | 125,438 | |||||||||||
| 1.97 | % | 0.44 | % | 0.33 | % | (2.12 | )% | 36 | % | $ | 367,041 | |||||||||||
| 2.24 | % | 0.87 | % | 0.54 | % | 7.20 | % | 36 | % | $ | 5,345 | |||||||||||
| 2.33 | % | 0.81 | % | 0.54 | % | 3.33 | % | 44 | % | $ | 6,821 | |||||||||||
| 1.76 | % | 0.77 | % | 0.60 | % | 3.89 | % | 76 | % | $ | 15,886 | |||||||||||
| 1.59 | % | 0.78 | % | 0.68 | % | 5.52 | % | 41 | % | $ | 21,910 | |||||||||||
| 1.62 | % | 0.78 | % | 0.68 | % | (2.45 | )% | 36 | % | $ | 122,329 | |||||||||||
The accompanying notes are an integral part of these financial statements.
Target Date Retirement Funds | 87
Table of Contents
Financial highlights
| Beginning net asset value per share | Net investment income | Net realized and unrealized gains (losses) on investments | Distributions from net investment income | Distributions from net realized gains | Ending net asset value per share | |||||||||||||||||||
Target 2020 Fund | ||||||||||||||||||||||||
Class A | ||||||||||||||||||||||||
Year ended February 29, 2020 | $ | 11.64 | 0.25 | 4 | 0.51 | (0.27 | ) | (0.15 | ) | $ | 11.98 | |||||||||||||
Year ended February 28, 2019 | $ | 12.55 | 0.26 | 0.06 | (0.41 | ) | (0.82 | ) | $ | 11.64 | ||||||||||||||
Year ended February 28, 2018 | $ | 14.87 | 0.24 | 0.61 | 0.00 | (3.17 | ) | $ | 12.55 | |||||||||||||||
Year ended February 28, 2017 | $ | 14.19 | 0.21 | 0.85 | (0.17 | ) | (0.21 | ) | $ | 14.87 | ||||||||||||||
Year ended February 29, 2016 | $ | 15.24 | 0.22 | 4 | (0.81 | ) | (0.10 | ) | (0.36 | ) | $ | 14.19 | ||||||||||||
Class C | ||||||||||||||||||||||||
Year ended February 29, 2020 | $ | 11.41 | 0.16 | 4 | 0.50 | (0.17 | ) | (0.15 | ) | $ | 11.75 | |||||||||||||
Year ended February 28, 2019 | $ | 12.31 | 0.17 | 4 | 0.06 | (0.31 | ) | (0.82 | ) | $ | 11.41 | |||||||||||||
Year ended February 28, 2018 | $ | 14.75 | 0.13 | 0.60 | 0.00 | (3.17 | ) | $ | 12.31 | |||||||||||||||
Year ended February 28, 2017 | $ | 14.10 | 0.10 | 0.84 | (0.08 | ) | (0.21 | ) | $ | 14.75 | ||||||||||||||
Year ended February 29, 2016 | $ | 15.16 | 0.11 | 4 | (0.79 | ) | (0.02 | ) | (0.36 | ) | $ | 14.10 | ||||||||||||
Class R | ||||||||||||||||||||||||
Year ended February 29, 2020 | $ | 11.53 | 0.21 | 4 | 0.52 | (0.25 | ) | (0.15 | ) | $ | 11.86 | |||||||||||||
Year ended February 28, 2019 | $ | 12.46 | 0.22 | 4 | 0.08 | (0.41 | ) | (0.82 | ) | $ | 11.53 | |||||||||||||
Year ended February 28, 2018 | $ | 14.81 | 0.22 | 4 | 0.60 | 0.00 | (3.17 | ) | $ | 12.46 | ||||||||||||||
Year ended February 28, 2017 | $ | 14.14 | 0.18 | 0.84 | (0.14 | ) | (0.21 | ) | $ | 14.81 | ||||||||||||||
Year ended February 29, 2016 | $ | 15.18 | 0.17 | 4 | (0.79 | ) | (0.06 | ) | (0.36 | ) | $ | 14.14 | ||||||||||||
Class R4 | ||||||||||||||||||||||||
Year ended February 29, 2020 | $ | 11.98 | 0.30 | 4 | 0.54 | (0.31 | ) | (0.15 | ) | $ | 12.36 | |||||||||||||
Year ended February 28, 2019 | $ | 12.89 | 0.33 | 4 | 0.04 | (0.46 | ) | (0.82 | ) | $ | 11.98 | |||||||||||||
Year ended February 28, 2018 | $ | 15.15 | 0.31 | 4 | 0.60 | 0.00 | (3.17 | ) | $ | 12.89 | ||||||||||||||
Year ended February 28, 2017 | $ | 14.44 | 0.27 | 4 | 0.86 | (0.21 | ) | (0.21 | ) | $ | 15.15 | |||||||||||||
Year ended February 29, 2016 | $ | 15.50 | 0.26 | (0.81 | ) | (0.15 | ) | (0.36 | ) | $ | 14.44 | |||||||||||||
Class R6 | ||||||||||||||||||||||||
Year ended February 29, 2020 | $ | 11.98 | 0.32 | 4 | 0.53 | (0.33 | ) | (0.15 | ) | $ | 12.35 | |||||||||||||
Year ended February 28, 2019 | $ | 12.90 | 0.34 | 4 | 0.06 | (0.50 | ) | (0.82 | ) | $ | 11.98 | |||||||||||||
Year ended February 28, 2018 | $ | 15.14 | 0.33 | 4 | 0.61 | (0.01 | ) | (3.17 | ) | $ | 12.90 | |||||||||||||
Year ended February 28, 2017 | $ | 14.43 | 0.29 | 4 | 0.86 | (0.23 | ) | (0.21 | ) | $ | 15.14 | |||||||||||||
Year ended February 29, 2016 | $ | 15.50 | 0.27 | (0.80 | ) | (0.18 | ) | (0.36 | ) | $ | 14.43 | |||||||||||||
Administrator Class | ||||||||||||||||||||||||
Year ended February 29, 2020 | $ | 11.90 | 0.27 | 4 | 0.53 | (0.28 | ) | (0.15 | ) | $ | 12.27 | |||||||||||||
Year ended February 28, 2019 | $ | 12.80 | 0.31 | 0.04 | (0.43 | ) | (0.82 | ) | $ | 11.90 | ||||||||||||||
Year ended February 28, 2018 | $ | 15.09 | 0.29 | 0.59 | 0.00 | (3.17 | ) | $ | 12.80 | |||||||||||||||
Year ended February 28, 2017 | $ | 14.40 | 0.24 | 4 | 0.84 | (0.18 | ) | (0.21 | ) | $ | 15.09 | |||||||||||||
Year ended February 29, 2016 | $ | 15.46 | 0.23 | (0.81 | ) | (0.12 | ) | (0.36 | ) | $ | 14.40 | |||||||||||||
| 1 | Ratios include net expenses allocated from the affiliated Master Portfolios which were as follows: |
Year ended February 29, 2020 | Year ended February 28 | Year ended February 29, 2016 | ||||||||||||||||||
| 2019 | 2018 | 2017 | ||||||||||||||||||
Class A | 0.13 | % | 0.14 | % | 0.16 | % | 0.17 | % | 0.16 | % | ||||||||||
Class C | 0.13 | 0.14 | 0.16 | 0.17 | 0.16 | |||||||||||||||
Class R | 0.14 | 0.13 | 0.17 | 0.17 | 0.16 | |||||||||||||||
Class R4 | 0.13 | 0.14 | 0.17 | 0.17 | 0.16 | |||||||||||||||
Class R6 | 0.13 | 0.14 | 0.17 | 0.17 | 0.16 | |||||||||||||||
Administrator Class | 0.13 | 0.14 | 0.17 | 0.17 | 0.16 | |||||||||||||||
| 2 | Total return calculations do not include any sales charges. |
| 3 | Portfolio turnover rate is calculated by multiplying the Fund’s ownership percentage in each respective affiliated Master Portfolio by the corresponding affiliated Master Portfolio’s purchases and sales. |
| 4 | Calculated based upon average shares outstanding |
The accompanying notes are an integral part of these financial statements.
88 | Target Date Retirement Funds
Table of Contents
Financial highlights
| Ratio to average net assets (annualized) | Total | Portfolio | Net assets at | |||||||||||||||||||
| Net investment income1 | Gross expenses1 | Net expenses1 | ||||||||||||||||||||
| 2.08 | % | 0.75 | % | 0.63 | % | 6.53 | % | 36 | % | $ | 132,755 | |||||||||||
| 2.14 | % | 0.75 | % | 0.65 | % | 3.12 | % | 43 | % | $ | 147,196 | |||||||||||
| 1.74 | % | 0.79 | % | 0.71 | % | 5.40 | % | 73 | % | $ | 199,069 | |||||||||||
| 1.44 | % | 0.85 | % | 0.81 | % | 7.53 | % | 39 | % | $ | 218,652 | |||||||||||
| 1.49 | % | 0.86 | % | 0.82 | % | (3.86 | )% | 34 | % | $ | 230,667 | |||||||||||
| 1.33 | % | 1.50 | % | 1.39 | % | 5.79 | % | 36 | % | $ | 2,785 | |||||||||||
| 1.41 | % | 1.50 | % | 1.40 | % | 2.28 | % | 43 | % | $ | 3,377 | |||||||||||
| 0.99 | % | 1.54 | % | 1.46 | % | 4.60 | % | 73 | % | $ | 6,219 | |||||||||||
| 0.69 | % | 1.60 | % | 1.56 | % | 6.71 | % | 39 | % | $ | 6,713 | |||||||||||
| 0.74 | % | 1.62 | % | 1.58 | % | (4.50 | )% | 34 | % | $ | 6,355 | |||||||||||
| 1.76 | % | 0.99 | % | 0.90 | % | 6.32 | % | 36 | % | $ | 119 | |||||||||||
| 1.84 | % | 1.00 | % | 0.90 | % | 2.84 | % | 43 | % | $ | 86 | |||||||||||
| 1.51 | % | 1.06 | % | 0.98 | % | 5.20 | % | 73 | % | $ | 66 | |||||||||||
| 1.21 | % | 1.10 | % | 1.06 | % | 7.27 | % | 39 | % | $ | 321 | |||||||||||
| 1.25 | % | 1.14 | % | 1.08 | % | (4.08 | )% | 34 | % | $ | 409 | |||||||||||
| 2.39 | % | 0.47 | % | 0.34 | % | 6.99 | % | 36 | % | $ | 31,139 | |||||||||||
| 2.54 | % | 0.47 | % | 0.34 | % | 3.36 | % | 43 | % | $ | 38,539 | |||||||||||
| 2.05 | % | 0.53 | % | 0.42 | % | 5.70 | % | 73 | % | $ | 130,172 | |||||||||||
| 1.76 | % | 0.56 | % | 0.50 | % | 7.89 | % | 39 | % | $ | 357,823 | |||||||||||
| 1.82 | % | 0.58 | % | 0.50 | % | (3.52 | )% | 34 | % | $ | 408,501 | |||||||||||
| 2.52 | % | 0.32 | % | 0.19 | % | 7.06 | % | 36 | % | $ | 147,590 | �� | ||||||||||
| 2.66 | % | 0.32 | % | 0.19 | % | 3.58 | % | 43 | % | $ | 154,089 | |||||||||||
| 2.20 | % | 0.37 | % | 0.26 | % | 5.89 | % | 73 | % | $ | 400,206 | |||||||||||
| 1.92 | % | 0.41 | % | 0.35 | % | 8.04 | % | 39 | % | $ | 645,237 | |||||||||||
| 1.97 | % | 0.43 | % | 0.35 | % | (3.42 | )% | 34 | % | $ | 1,116,419 | |||||||||||
| 2.18 | % | 0.67 | % | 0.54 | % | 6.73 | % | 36 | % | $ | 54,435 | |||||||||||
| 2.28 | % | 0.67 | % | 0.54 | % | 3.18 | % | 43 | % | $ | 63,684 | |||||||||||
| 1.85 | % | 0.72 | % | 0.61 | % | 5.51 | % | 73 | % | $ | 111,716 | |||||||||||
| 1.60 | % | 0.76 | % | 0.70 | % | 7.58 | % | 39 | % | $ | 197,835 | |||||||||||
| 1.62 | % | 0.77 | % | 0.70 | % | (3.72 | )% | 34 | % | $ | 526,327 | |||||||||||
The accompanying notes are an integral part of these financial statements.
Target Date Retirement Funds | 89
Table of Contents
Financial highlights
| Beginning net asset value per share | Net investment income | Net realized and unrealized gains (losses) on investments | Distributions from net investment income | Distributions from net realized gains | Ending net asset value per share | |||||||||||||||||||
Target 2025 Fund | ||||||||||||||||||||||||
Class A | ||||||||||||||||||||||||
Year ended February 29, 2020 | $ | 5.57 | 0.12 | 4 | 0.21 | (0.13 | ) | (0.20 | ) | $ | 5.57 | |||||||||||||
Year ended February 28, 2019 | $ | 6.41 | 0.13 | 4 | (0.00 | )5 | (0.14 | ) | (0.83 | ) | $ | 5.57 | ||||||||||||
Year ended February 28, 2018 | $ | 10.48 | 0.17 | 4 | 0.63 | (0.03 | ) | (4.84 | ) | $ | 6.41 | |||||||||||||
Year ended February 28, 2017 | $ | 9.77 | 0.13 | 0.90 | (0.15 | ) | (0.17 | ) | $ | 10.48 | ||||||||||||||
Year ended February 29, 2016 | $ | 10.69 | 0.14 | 4 | (0.73 | ) | (0.08 | ) | (0.25 | ) | $ | 9.77 | ||||||||||||
Class R | ||||||||||||||||||||||||
Year ended February 29, 2020 | $ | 5.50 | 0.10 | 4 | 0.20 | (0.11 | ) | (0.20 | ) | $ | 5.49 | |||||||||||||
Year ended February 28, 2019 | $ | 6.34 | 0.11 | 4 | 0.02 | (0.14 | ) | (0.83 | ) | $ | 5.50 | |||||||||||||
Year ended February 28, 2018 | $ | 10.49 | 0.16 | 4 | 0.53 | 0.00 | (4.84 | ) | $ | 6.34 | ||||||||||||||
Year ended February 28, 2017 | $ | 9.79 | 0.12 | 0.88 | (0.13 | ) | (0.17 | ) | $ | 10.49 | ||||||||||||||
Year ended February 29, 2016 | $ | 10.71 | 0.13 | (0.73 | ) | (0.07 | ) | (0.25 | ) | $ | 9.79 | |||||||||||||
Class R4 | ||||||||||||||||||||||||
Year ended February 29, 2020 | $ | 5.61 | 0.14 | 4 | 0.21 | (0.14 | ) | (0.20 | ) | $ | 5.62 | |||||||||||||
Year ended February 28, 2019 | $ | 6.45 | 0.16 | 4 | (0.01 | ) | (0.16 | ) | (0.83 | ) | $ | 5.61 | ||||||||||||
Year ended February 28, 2018 | $ | 10.52 | 0.20 | 0.63 | (0.06 | ) | (4.84 | ) | $ | 6.45 | ||||||||||||||
Year ended February 28, 2017 | $ | 9.80 | 0.17 | 0.90 | (0.18 | ) | (0.17 | ) | $ | 10.52 | ||||||||||||||
Year ended February 29, 2016 | $ | 10.72 | 0.18 | (0.73 | ) | (0.12 | ) | (0.25 | ) | $ | 9.80 | |||||||||||||
Class R6 | ||||||||||||||||||||||||
Year ended February 29, 2020 | $ | 5.61 | 0.15 | 4 | 0.20 | (0.15 | ) | (0.20 | ) | $ | 5.61 | |||||||||||||
Year ended February 28, 2019 | $ | 6.44 | 0.16 | 4 | 0.01 | (0.17 | ) | (0.83 | ) | $ | 5.61 | |||||||||||||
Year ended February 28, 2018 | $ | 10.51 | 0.25 | 0.60 | (0.08 | ) | (4.84 | ) | $ | 6.44 | ||||||||||||||
Year ended February 28, 2017 | $ | 9.80 | 0.20 | 4 | 0.87 | (0.19 | ) | (0.17 | ) | $ | 10.51 | |||||||||||||
Year ended February 29, 2016 | $ | 10.71 | 0.20 | (0.73 | ) | (0.13 | ) | (0.25 | ) | $ | 9.80 | |||||||||||||
Administrator Class | ||||||||||||||||||||||||
Year ended February 29, 2020 | $ | 5.66 | 0.13 | 4 | 0.21 | (0.13 | ) | (0.20 | ) | $ | 5.67 | |||||||||||||
Year ended February 28, 2019 | $ | 6.48 | 0.15 | 4 | (0.00 | )5 | (0.14 | ) | (0.83 | ) | $ | 5.66 | ||||||||||||
Year ended February 28, 2018 | $ | 10.55 | 0.19 | 0.62 | (0.04 | ) | (4.84 | ) | $ | 6.48 | ||||||||||||||
Year ended February 28, 2017 | $ | 9.82 | 0.17 | 4 | 0.89 | (0.16 | ) | (0.17 | ) | $ | 10.55 | |||||||||||||
Year ended February 29, 2016 | $ | 10.74 | 0.16 | (0.74 | ) | (0.09 | ) | (0.25 | ) | $ | 9.82 | |||||||||||||
| 1 | Ratios include net expenses allocated from the affiliated Master Portfolios which were as follows: |
Year ended February 29, 2020 | Year ended February 28 | Year ended February 29, 2016 | ||||||||||||||||||
| 2019 | 2018 | 2017 | ||||||||||||||||||
Class A | 0.13 | % | 0.15 | % | 0.17 | % | 0.17 | % | 0.16 | % | ||||||||||
Class R | 0.15 | 0.13 | 0.18 | 0.17 | 0.16 | |||||||||||||||
Class R4 | 0.13 | 0.15 | 0.17 | 0.17 | 0.16 | |||||||||||||||
Class R6 | 0.13 | 0.15 | 0.17 | 0.16 | 0.16 | |||||||||||||||
Administrator Class | 0.13 | 0.15 | 0.17 | 0.16 | 0.16 | |||||||||||||||
| 2 | Total return calculations do not include any sales charges. |
| 3 | Portfolio turnover rate is calculated by multiplying the Fund’s ownership percentage in each respective affiliated Master Portfolio by the corresponding affiliated Master Portfolio’s portfolio purchases and sales. |
| 4 | Calculated based upon average shares outstanding |
| 5 | Amount is more than $(0.005). |
The accompanying notes are an integral part of these financial statements.
90 | Target Date Retirement Funds
Table of Contents
Financial highlights
| Ratio to average net assets (annualized) | Total | Portfolio | Net assets at | |||||||||||||||||||
| Net investment income1 | Gross expenses1 | Net expenses1 | ||||||||||||||||||||
| 2.04 | % | 0.77 | % | 0.62 | % | 5.71 | % | 36 | % | $ | 94,505 | |||||||||||
| 2.08 | % | 0.78 | % | 0.65 | % | 2.78 | % | 43 | % | $ | 106,485 | |||||||||||
| 1.70 | % | 0.81 | % | 0.71 | % | 7.09 | % | 67 | % | $ | 117,382 | |||||||||||
| 1.37 | % | 0.84 | % | 0.81 | % | 10.61 | % | 36 | % | $ | 140,428 | |||||||||||
| 1.40 | % | 0.84 | % | 0.81 | % | (5.56 | )% | 32 | % | $ | 175,373 | |||||||||||
| 1.73 | % | 1.01 | % | 0.89 | % | 5.37 | % | 36 | % | $ | 57 | |||||||||||
| 1.78 | % | 1.02 | % | 0.90 | % | 2.67 | % | 43 | % | $ | 44 | |||||||||||
| 1.53 | % | 1.10 | % | 1.02 | % | 5.94 | % | 67 | % | $ | 29 | |||||||||||
| 1.12 | % | 1.10 | % | 1.06 | % | 10.22 | % | 36 | % | $ | 610 | |||||||||||
| 1.20 | % | 1.13 | % | 1.08 | % | (5.72 | )% | 32 | % | $ | 830 | |||||||||||
| 2.31 | % | 0.49 | % | 0.34 | % | 6.16 | % | 36 | % | $ | 36,023 | |||||||||||
| 2.45 | % | 0.50 | % | 0.34 | % | 3.05 | % | 43 | % | $ | 42,046 | |||||||||||
| 2.01 | % | 0.55 | % | 0.43 | % | 7.33 | % | 67 | % | $ | 87,607 | |||||||||||
| 1.65 | % | 0.57 | % | 0.50 | % | 10.98 | % | 36 | % | $ | 274,639 | |||||||||||
| 1.78 | % | 0.58 | % | 0.50 | % | (5.26 | )% | 32 | % | $ | 279,663 | |||||||||||
| 2.49 | % | 0.34 | % | 0.19 | % | 6.15 | % | 36 | % | $ | 106,756 | |||||||||||
| 2.57 | % | 0.35 | % | 0.19 | % | 3.41 | % | 43 | % | $ | 131,314 | |||||||||||
| 2.16 | % | 0.39 | % | 0.26 | % | 7.54 | % | 67 | % | $ | 201,812 | |||||||||||
| 1.92 | % | 0.41 | % | 0.35 | % | 11.04 | % | 36 | % | $ | 372,101 | |||||||||||
| 1.92 | % | 0.43 | % | 0.35 | % | (5.02 | )% | 32 | % | $ | 1,416,984 | |||||||||||
| 2.16 | % | 0.69 | % | 0.54 | % | 5.88 | % | 36 | % | $ | 10,650 | |||||||||||
| 2.27 | % | 0.70 | % | 0.54 | % | 2.94 | % | 43 | % | $ | 15,362 | |||||||||||
| 1.81 | % | 0.73 | % | 0.61 | % | 7.12 | % | 67 | % | $ | 43,559 | |||||||||||
| 1.59 | % | 0.76 | % | 0.70 | % | 10.87 | % | 36 | % | $ | 65,620 | |||||||||||
| 1.58 | % | 0.77 | % | 0.70 | % | (5.45 | )% | 32 | % | $ | 298,492 | |||||||||||
The accompanying notes are an integral part of these financial statements.
Target Date Retirement Funds | 91
Table of Contents
Financial highlights
| Beginning net asset value per share | Net investment income | Net realized and unrealized gains (losses) on investments | Distributions from net investment income | Distributions from net realized gains | Ending net asset value per share | |||||||||||||||||||
Target 2030 Fund | ||||||||||||||||||||||||
Class A | ||||||||||||||||||||||||
Year ended February 29, 2020 | $ | 12.03 | 0.25 | 0.34 | (0.27 | ) | (0.21 | ) | $ | 12.14 | ||||||||||||||
Year ended February 28, 2019 | $ | 13.53 | 0.26 | (0.00 | )4 | (0.33 | ) | (1.43 | ) | $ | 12.03 | |||||||||||||
Year ended February 28, 2018 | $ | 16.70 | 0.27 | 1.25 | (0.15 | ) | (4.54 | ) | $ | 13.53 | ||||||||||||||
Year ended February 28, 2017 | $ | 15.17 | 0.23 | 1.90 | (0.31 | ) | (0.29 | ) | $ | 16.70 | ||||||||||||||
Year ended February 29, 2016 | $ | 16.97 | 0.21 | 5 | (1.44 | ) | (0.14 | ) | (0.43 | ) | $ | 15.17 | ||||||||||||
Class C | ||||||||||||||||||||||||
Year ended February 29, 2020 | $ | 11.50 | 0.15 | 5 | 0.32 | (0.16 | ) | (0.21 | ) | $ | 11.60 | |||||||||||||
Year ended February 28, 2019 | $ | 13.01 | 0.16 | 5 | (0.00 | )4 | (0.24 | ) | (1.43 | ) | $ | 11.50 | ||||||||||||
Year ended February 28, 2018 | $ | 16.24 | 0.18 | 1.17 | (0.04 | ) | (4.54 | ) | $ | 13.01 | ||||||||||||||
Year ended February 28, 2017 | $ | 14.79 | 0.07 | 1.88 | (0.21 | ) | (0.29 | ) | $ | 16.24 | ||||||||||||||
Year ended February 29, 2016 | $ | 16.58 | 0.10 | (1.41 | ) | (0.05 | ) | (0.43 | ) | $ | 14.79 | |||||||||||||
Class R | ||||||||||||||||||||||||
Year ended February 29, 2020 | $ | 12.05 | 0.22 | 5 | 0.34 | (0.24 | ) | (0.21 | ) | $ | 12.16 | |||||||||||||
Year ended February 28, 2019 | $ | 13.55 | 0.23 | 5 | (0.00 | )4 | (0.30 | ) | (1.43 | ) | $ | 12.05 | ||||||||||||
Year ended February 28, 2018 | $ | 16.66 | 0.26 | 5 | 1.17 | 0.00 | (4.54 | ) | $ | 13.55 | ||||||||||||||
Year ended February 28, 2017 | $ | 15.14 | 0.18 | 1.90 | (0.27 | ) | (0.29 | ) | $ | 16.66 | ||||||||||||||
Year ended February 29, 2016 | $ | 16.95 | 0.18 | (1.44 | ) | (0.12 | ) | (0.43 | ) | $ | 15.14 | |||||||||||||
Class R4 | ||||||||||||||||||||||||
Year ended February 29, 2020 | $ | 12.32 | 0.29 | 5 | 0.36 | (0.31 | ) | (0.21 | ) | $ | 12.45 | |||||||||||||
Year ended February 28, 2019 | $ | 13.81 | 0.34 | 5 | (0.03 | ) | (0.37 | ) | (1.43 | ) | $ | 12.32 | ||||||||||||
Year ended February 28, 2018 | $ | 16.95 | 0.34 | 5 | 1.25 | (0.19 | ) | (4.54 | ) | $ | 13.81 | |||||||||||||
Year ended February 28, 2017 | $ | 15.38 | 0.27 | 1.94 | (0.35 | ) | (0.29 | ) | $ | 16.95 | ||||||||||||||
Year ended February 29, 2016 | $ | 17.20 | 0.28 | (1.47 | ) | (0.20 | ) | (0.43 | ) | $ | 15.38 | |||||||||||||
Class R6 | ||||||||||||||||||||||||
Year ended February 29, 2020 | $ | 12.30 | 0.32 | 0.33 | (0.32 | ) | (0.21 | ) | $ | 12.42 | ||||||||||||||
Year ended February 28, 2019 | $ | 13.79 | 0.34 | 5 | (0.01 | ) | (0.39 | ) | (1.43 | ) | $ | 12.30 | ||||||||||||
Year ended February 28, 2018 | $ | 16.93 | 0.36 | 5 | 1.26 | (0.22 | ) | (4.54 | ) | $ | 13.79 | |||||||||||||
Year ended February 28, 2017 | $ | 15.37 | 0.31 | 5 | 1.92 | (0.38 | ) | (0.29 | ) | $ | 16.93 | |||||||||||||
Year ended February 29, 2016 | $ | 17.19 | 0.30 | (1.46 | ) | (0.23 | ) | (0.43 | ) | $ | 15.37 | |||||||||||||
Administrator Class | ||||||||||||||||||||||||
Year ended February 29, 2020 | $ | 12.32 | 0.27 | 5 | 0.35 | (0.28 | ) | (0.21 | ) | $ | 12.45 | |||||||||||||
Year ended February 28, 2019 | $ | 13.80 | 0.30 | 5 | (0.02 | ) | (0.33 | ) | (1.43 | ) | $ | 12.32 | ||||||||||||
Year ended February 28, 2018 | $ | 16.94 | 0.28 | 1.27 | (0.15 | ) | (4.54 | ) | $ | 13.80 | ||||||||||||||
Year ended February 28, 2017 | $ | 15.37 | 0.25 | 5 | 1.93 | (0.32 | ) | (0.29 | ) | $ | 16.94 | |||||||||||||
Year ended February 29, 2016 | $ | 17.19 | 0.25 | (1.47 | ) | (0.17 | ) | (0.43 | ) | $ | 15.37 | |||||||||||||
| 1 | Ratios include net expenses allocated from the affiliated Master Portfolios which were as follows: |
Year ended February 29, 2020 | Year ended February 28 | Year ended February 29, 2016 | ||||||||||||||||||
| 2019 | 2018 | 2017 | ||||||||||||||||||
Class A | 0.14 | % | 0.15 | % | 0.17 | % | 0.17 | % | 0.16 | % | ||||||||||
Class C | 0.14 | 0.15 | 0.17 | 0.17 | 0.16 | |||||||||||||||
Class R | 0.16 | 0.15 | 0.19 | 0.17 | 0.16 | |||||||||||||||
Class R4 | 0.14 | 0.15 | 0.17 | 0.17 | 0.16 | |||||||||||||||
Class R6 | 0.14 | 0.15 | 0.17 | 0.16 | 0.16 | |||||||||||||||
Administrator Class | 0.14 | 0.15 | 0.17 | 0.17 | 0.16 | |||||||||||||||
| 2 | Total return calculations do not include any sales charges. |
| 3 | Portfolio turnover rate is calculated by multiplying the Fund’s ownership percentage in each respective affiliated Master Portfolio by the corresponding affiliated Master Portfolio’s purchases and sales. |
| 4 | Amount is more than $(0.005). |
| 5 | Calculated based upon average shares outstanding |
The accompanying notes are an integral part of these financial statements.
92 | Target Date Retirement Funds
Table of Contents
Financial highlights
| Ratio to average net assets (annualized) | Total | Portfolio | Net assets at | |||||||||||||||||||
| Net investment income1 | Gross expenses1 | Net expenses1 | ||||||||||||||||||||
| 1.98 | % | 0.75 | % | 0.63 | % | 4.72 | % | 36 | % | $ | 163,774 | |||||||||||
| 2.04 | % | 0.76 | % | 0.65 | % | 2.55 | % | 43 | % | $ | 177,608 | |||||||||||
| 1.63 | % | 0.80 | % | 0.71 | % | 8.79 | % | 61 | % | $ | 228,015 | |||||||||||
| 1.32 | % | 0.84 | % | 0.82 | % | 14.15 | % | 31 | % | $ | 230,044 | |||||||||||
| 1.32 | % | 0.86 | % | 0.83 | % | (7.37 | )% | 30 | % | $ | 227,928 | |||||||||||
| 1.24 | % | 1.50 | % | 1.39 | % | 3.92 | % | 36 | % | $ | 2,060 | |||||||||||
| 1.30 | % | 1.51 | % | 1.40 | % | 1.82 | % | 43 | % | $ | 2,851 | |||||||||||
| 0.88 | % | 1.55 | % | 1.46 | % | 7.95 | % | 61 | % | $ | 4,748 | |||||||||||
| 0.57 | % | 1.59 | % | 1.57 | % | 13.28 | % | 31 | % | $ | 4,630 | |||||||||||
| 0.63 | % | 1.63 | % | 1.59 | % | (8.05 | )% | 30 | % | $ | 4,662 | |||||||||||
| 1.72 | % | 0.97 | % | 0.87 | % | 4.48 | % | 36 | % | $ | 44 | |||||||||||
| 1.76 | % | 1.01 | % | 0.89 | % | 2.37 | % | 43 | % | $ | 40 | |||||||||||
| 1.54 | % | 1.10 | % | 1.04 | % | 8.28 | % | 61 | % | $ | 34 | |||||||||||
| 1.06 | % | 1.10 | % | 1.07 | % | 13.88 | % | 31 | % | $ | 904 | |||||||||||
| 1.11 | % | 1.12 | % | 1.08 | % | (7.57 | )% | 30 | % | $ | 853 | |||||||||||
| 2.28 | % | 0.47 | % | 0.34 | % | 5.07 | % | 36 | % | $ | 51,595 | |||||||||||
| 2.45 | % | 0.48 | % | 0.34 | % | 2.88 | % | 43 | % | $ | 57,366 | |||||||||||
| 1.95 | % | 0.53 | % | 0.42 | % | 9.09 | % | 61 | % | $ | 219,799 | |||||||||||
| 1.64 | % | 0.56 | % | 0.51 | % | 14.52 | % | 31 | % | $ | 507,587 | |||||||||||
| 1.73 | % | 0.58 | % | 0.51 | % | (7.07 | )% | 30 | % | $ | 513,864 | |||||||||||
| 2.41 | % | 0.32 | % | 0.19 | % | 5.15 | % | 36 | % | $ | 231,645 | |||||||||||
| 2.51 | % | 0.33 | % | 0.19 | % | 3.08 | % | 43 | % | $ | 230,953 | |||||||||||
| 2.10 | % | 0.38 | % | 0.26 | % | 9.28 | % | 61 | % | $ | 353,891 | |||||||||||
| 1.87 | % | 0.41 | % | 0.36 | % | 14.63 | % | 31 | % | $ | 618,551 | |||||||||||
| 1.85 | % | 0.43 | % | 0.36 | % | (6.93 | )% | 30 | % | $ | 1,284,324 | |||||||||||
| 2.08 | % | 0.67 | % | 0.54 | % | 4.86 | % | 36 | % | $ | 79,552 | |||||||||||
| 2.18 | % | 0.68 | % | 0.54 | % | 2.69 | % | 43 | % | $ | 89,022 | |||||||||||
| 1.75 | % | 0.72 | % | 0.61 | % | 8.86 | % | 61 | % | $ | 161,583 | |||||||||||
| 1.51 | % | 0.76 | % | 0.71 | % | 14.32 | % | 31 | % | $ | 262,336 | |||||||||||
| 1.52 | % | 0.77 | % | 0.71 | % | (7.27 | )% | 30 | % | $ | 498,554 | |||||||||||
The accompanying notes are an integral part of these financial statements.
Target Date Retirement Funds | 93
Table of Contents
Financial highlights
| Beginning net asset value per share | Net investment income | Net realized and unrealized gains (losses) on investments | Distributions from net investment income | Distributions from net realized gains | Ending net asset value per share | |||||||||||||||||||
Target 2035 Fund | ||||||||||||||||||||||||
Class A | ||||||||||||||||||||||||
Year ended February 29, 2020 | $ | 7.38 | 0.15 | 0.14 | (0.16 | ) | (0.13 | ) | $ | 7.38 | ||||||||||||||
Year ended February 28, 2019 | $ | 8.35 | 0.15 | (0.00 | )4 | (0.18 | ) | (0.94 | ) | $ | 7.38 | |||||||||||||
Year ended February 28, 2018 | $ | 11.25 | 0.18 | 1.01 | (0.12 | ) | (3.97 | ) | $ | 8.35 | ||||||||||||||
Year ended February 28, 2017 | $ | 9.89 | 0.13 | 1.56 | (0.15 | ) | (0.18 | ) | $ | 11.25 | ||||||||||||||
Year ended February 29, 2016 | $ | 11.32 | 0.15 | (1.18 | ) | (0.11 | ) | (0.29 | ) | $ | 9.89 | |||||||||||||
Class R | ||||||||||||||||||||||||
Year ended February 29, 2020 | $ | 7.44 | 0.13 | 0.15 | (0.15 | ) | (0.13 | ) | $ | 7.44 | ||||||||||||||
Year ended February 28, 2019 | $ | 8.42 | 0.12 | 0.01 | (0.17 | ) | (0.94 | ) | $ | 7.44 | ||||||||||||||
Year ended February 28, 2018 | $ | 11.32 | 0.15 | 1.01 | (0.09 | ) | (3.97 | ) | $ | 8.42 | ||||||||||||||
Year ended February 28, 2017 | $ | 9.95 | 0.11 | 1.57 | (0.13 | ) | (0.18 | ) | $ | 11.32 | ||||||||||||||
Year ended February 29, 2016 | $ | 11.39 | 0.11 | (1.17 | ) | (0.09 | ) | (0.29 | ) | $ | 9.95 | |||||||||||||
Class R4 | ||||||||||||||||||||||||
Year ended February 29, 2020 | $ | 7.40 | 0.17 | 5 | 0.15 | (0.19 | ) | (0.13 | ) | $ | 7.40 | |||||||||||||
Year ended February 28, 2019 | $ | 8.37 | 0.20 | 5 | (0.03 | ) | (0.20 | ) | (0.94 | ) | $ | 7.40 | ||||||||||||
Year ended February 28, 2018 | $ | 11.27 | 0.21 | 5 | 1.02 | (0.16 | ) | (3.97 | ) | $ | 8.37 | |||||||||||||
Year ended February 28, 2017 | $ | 9.91 | 0.17 | 5 | 1.56 | (0.19 | ) | (0.18 | ) | $ | 11.27 | |||||||||||||
Year ended February 29, 2016 | $ | 11.33 | 0.18 | (1.17 | ) | (0.14 | ) | (0.29 | ) | $ | 9.91 | |||||||||||||
Class R6 | ||||||||||||||||||||||||
Year ended February 29, 2020 | $ | 7.39 | 0.18 | 5 | 0.15 | (0.20 | ) | (0.13 | ) | $ | 7.39 | |||||||||||||
Year ended February 28, 2019 | $ | 8.37 | 0.25 | (0.07 | ) | (0.22 | ) | (0.94 | ) | $ | 7.39 | |||||||||||||
Year ended February 28, 2018 | $ | 11.27 | 0.27 | 0.98 | (0.18 | ) | (3.97 | ) | $ | 8.37 | ||||||||||||||
Year ended February 28, 2017 | $ | 9.91 | 0.20 | 5 | 1.55 | (0.21 | ) | (0.18 | ) | $ | 11.27 | |||||||||||||
Year ended February 29, 2016 | $ | 11.33 | 0.19 | (1.16 | ) | (0.16 | ) | (0.29 | ) | $ | 9.91 | |||||||||||||
Administrator Class | ||||||||||||||||||||||||
Year ended February 29, 2020 | $ | 7.47 | 0.16 | 5 | 0.14 | (0.17 | ) | (0.13 | ) | $ | 7.47 | |||||||||||||
Year ended February 28, 2019 | $ | 8.41 | 0.18 | (0.01 | ) | (0.17 | ) | (0.94 | ) | $ | 7.47 | |||||||||||||
Year ended February 28, 2018 | $ | 11.30 | 0.19 | 1.02 | (0.13 | ) | (3.97 | ) | $ | 8.41 | ||||||||||||||
Year ended February 28, 2017 | $ | 9.94 | 0.16 | 5 | 1.55 | (0.17 | ) | (0.18 | ) | $ | 11.30 | |||||||||||||
Year ended February 29, 2016 | $ | 11.37 | 0.16 | (1.18 | ) | (0.12 | ) | (0.29 | ) | $ | 9.94 | |||||||||||||
| 1 | Ratios include net expenses allocated from the affiliated Master Portfolios which were as follows: |
| Year ended February 29, 2020 | Year ended February 28 | Year ended February 29, 2016 | ||||||||||||||||||
| 2019 | 2018 | 2017 | ||||||||||||||||||
Class A | 0.15 | % | 0.16 | % | 0.18 | % | 0.17 | % | 0.17 | % | ||||||||||
Class R | 0.15 | 0.16 | 0.18 | 0.17 | 0.17 | |||||||||||||||
Class R4 | 0.15 | 0.16 | 0.18 | 0.17 | 0.16 | |||||||||||||||
Class R6 | 0.15 | 0.16 | 0.18 | 0.16 | 0.16 | |||||||||||||||
Administrator Class | 0.15 | 0.16 | 0.18 | 0.16 | 0.16 | |||||||||||||||
| 2 | Total return calculations do not include any sales charges. |
| 3 | Portfolio turnover rate is calculated by multiplying the Fund’s ownership percentage in each respective affiliated Master Portfolio by the corresponding affiliated Master Portfolio’s purchases and sales. |
| 4 | Amount is more than $(0.005). |
| 5 | Calculated based upon average shares outstanding |
The accompanying notes are an integral part of these financial statements.
94 | Target Date Retirement Funds
Table of Contents
Financial highlights
| Ratio to average net assets (annualized) | Total return2 | Portfolio turnover rate3 | Net assets at end of period (000s omitted) | |||||||||||||||||||
| Net investment income1 | Gross expenses1 | Net expenses1 | ||||||||||||||||||||
| 1.92 | % | 0.80 | % | 0.63 | % | 3.70 | % | 36 | % | $ | 95,284 | |||||||||||
| 1.97 | % | 0.81 | % | 0.65 | % | 2.48 | % | 41 | % | $ | 108,389 | |||||||||||
| 1.56 | % | 0.83 | % | 0.72 | % | 10.21 | % | 55 | % | $ | 118,000 | |||||||||||
| 1.28 | % | 0.85 | % | 0.83 | % | 17.33 | % | 27 | % | $ | 127,294 | |||||||||||
| 1.19 | % | 0.84 | % | 0.83 | % | (9.28 | )% | 28 | % | $ | 142,817 | |||||||||||
| 1.60 | % | 1.04 | % | 0.90 | % | 3.46 | % | 36 | % | $ | 318 | |||||||||||
| 1.68 | % | 1.06 | % | 0.90 | % | 2.16 | % | 41 | % | $ | 250 | |||||||||||
| 1.32 | % | 1.08 | % | 0.97 | % | 9.87 | % | 55 | % | $ | 192 | |||||||||||
| 0.89 | % | 1.11 | % | 1.08 | % | 17.09 | % | 27 | % | $ | 171 | |||||||||||
| 1.02 | % | 1.13 | % | 1.09 | % | (9.48 | )% | 28 | % | $ | 73 | |||||||||||
| 2.20 | % | 0.52 | % | 0.34 | % | 3.99 | % | 36 | % | $ | 26,748 | |||||||||||
| 2.37 | % | 0.53 | % | 0.34 | % | 2.80 | % | 41 | % | $ | 34,388 | |||||||||||
| 1.90 | % | 0.56 | % | 0.43 | % | 10.53 | % | 55 | % | $ | 82,617 | |||||||||||
| 1.54 | % | 0.57 | % | 0.52 | % | 17.68 | % | 27 | % | $ | 240,025 | |||||||||||
| 1.66 | % | 0.59 | % | 0.52 | % | (8.92 | )% | 28 | % | $ | 228,810 | |||||||||||
| 2.38 | % | 0.37 | % | 0.19 | % | 4.16 | % | 36 | % | $ | 89,108 | |||||||||||
| 2.48 | % | 0.38 | % | 0.19 | % | 2.86 | % | 41 | % | $ | 112,021 | |||||||||||
| 2.04 | % | 0.41 | % | 0.27 | % | 10.76 | % | 55 | % | $ | 185,889 | |||||||||||
| 1.83 | % | 0.42 | % | 0.37 | % | 17.86 | % | 27 | % | $ | 317,594 | |||||||||||
| 1.80 | % | 0.44 | % | 0.37 | % | (8.78 | )% | 28 | % | $ | 714,884 | |||||||||||
| 2.04 | % | 0.72 | % | 0.54 | % | 3.75 | % | 36 | % | $ | 6,888 | |||||||||||
| 2.20 | % | 0.72 | % | 0.54 | % | 2.64 | % | 41 | % | $ | 9,608 | |||||||||||
| 1.67 | % | 0.74 | % | 0.61 | % | 10.33 | % | 55 | % | $ | 35,678 | |||||||||||
| 1.52 | % | 0.77 | % | 0.72 | % | 17.38 | % | 27 | % | $ | 50,898 | |||||||||||
| 1.46 | % | 0.78 | % | 0.72 | % | (9.17 | )% | 28 | % | $ | 182,599 | |||||||||||
The accompanying notes are an integral part of these financial statements.
Target Date Retirement Funds | 95
Table of Contents
Financial highlights
| Beginning net asset value per share | Net investment income | Net realized and unrealized gains (losses) on investments | Distributions from net investment income | Distributions from net realized gains | Ending net asset value per share | |||||||||||||||||||
Target 2040 Fund | ||||||||||||||||||||||||
Class A | ||||||||||||||||||||||||
Year ended February 29, 2020 | $ | 14.09 | 0.28 | 0.12 | (0.29 | ) | (0.18 | ) | $ | 14.02 | ||||||||||||||
Year ended February 28, 2019 | $ | 16.02 | 0.29 | (0.05 | ) | (0.36 | ) | (1.81 | ) | $ | 14.09 | |||||||||||||
Year ended February 28, 2018 | $ | 19.43 | 0.31 | 1.93 | (0.31 | ) | (5.34 | ) | $ | 16.02 | ||||||||||||||
Year ended February 28, 2017 | $ | 16.74 | 0.23 | 3.08 | (0.27 | ) | (0.35 | ) | $ | 19.43 | ||||||||||||||
Year ended February 29, 2016 | $ | 19.53 | 0.22 | 4 | (2.27 | ) | (0.20 | ) | (0.54 | ) | $ | 16.74 | ||||||||||||
Class C | ||||||||||||||||||||||||
Year ended February 29, 2020 | $ | 12.66 | 0.15 | 4 | 0.11 | (0.18 | ) | (0.18 | ) | $ | 12.56 | |||||||||||||
Year ended February 28, 2019 | $ | 14.61 | 0.17 | 4 | (0.06 | ) | (0.25 | ) | (1.81 | ) | $ | 12.66 | ||||||||||||
Year ended February 28, 2018 | $ | 18.19 | 0.14 | 4 | 1.81 | (0.19 | ) | (5.34 | ) | $ | 14.61 | |||||||||||||
Year ended February 28, 2017 | $ | 15.71 | 0.04 | 4 | 2.94 | (0.15 | ) | (0.35 | ) | $ | 18.19 | |||||||||||||
Year ended February 29, 2016 | $ | 18.38 | 0.09 | 4 | (2.15 | ) | (0.07 | ) | (0.54 | ) | $ | 15.71 | ||||||||||||
Class R | ||||||||||||||||||||||||
Year ended February 29, 2020 | $ | 14.08 | 0.25 | 0.12 | (0.26 | ) | (0.18 | ) | $ | 14.01 | ||||||||||||||
Year ended February 28, 2019 | $ | 16.02 | 0.25 | 4 | (0.05 | ) | (0.33 | ) | (1.81 | ) | $ | 14.08 | ||||||||||||
Year ended February 28, 2018 | $ | 19.36 | 0.27 | 4 | 1.93 | (0.20 | ) | (5.34 | ) | $ | 16.02 | |||||||||||||
Year ended February 28, 2017 | $ | 16.69 | 0.18 | 3.07 | (0.23 | ) | (0.35 | ) | $ | 19.36 | ||||||||||||||
Year ended February 29, 2016 | $ | 19.51 | 0.18 | (2.28 | ) | (0.18 | ) | (0.54 | ) | $ | 16.69 | |||||||||||||
Class R4 | ||||||||||||||||||||||||
Year ended February 29, 2020 | $ | 14.60 | 0.33 | 4 | 0.13 | (0.34 | ) | (0.18 | ) | $ | 14.54 | |||||||||||||
Year ended February 28, 2019 | $ | 16.51 | 0.39 | 4 | (0.08 | ) | (0.41 | ) | (1.81 | ) | $ | 14.60 | ||||||||||||
Year ended February 28, 2018 | $ | 19.86 | 0.36 | 1.99 | (0.36 | ) | (5.34 | ) | $ | 16.51 | ||||||||||||||
Year ended February 28, 2017 | $ | 17.09 | 0.27 | 3.18 | (0.33 | ) | (0.35 | ) | $ | 19.86 | ||||||||||||||
Year ended February 29, 2016 | $ | 19.93 | 0.28 | (2.32 | ) | (0.26 | ) | (0.54 | ) | $ | 17.09 | |||||||||||||
Class R6 | ||||||||||||||||||||||||
Year ended February 29, 2020 | $ | 14.58 | 0.35 | 0.13 | (0.36 | ) | (0.18 | ) | $ | 14.52 | ||||||||||||||
Year ended February 28, 2019 | $ | 16.50 | 0.39 | 4 | (0.06 | ) | (0.44 | ) | (1.81 | ) | $ | 14.58 | ||||||||||||
Year ended February 28, 2018 | $ | 19.85 | 0.40 | 4 | 1.98 | (0.39 | ) | (5.34 | ) | $ | 16.50 | |||||||||||||
Year ended February 28, 2017 | $ | 17.09 | 0.41 | 3.06 | (0.36 | ) | (0.35 | ) | $ | 19.85 | ||||||||||||||
Year ended February 29, 2016 | $ | 19.93 | 0.32 | (2.33 | ) | (0.29 | ) | (0.54 | ) | $ | 17.09 | |||||||||||||
Administrator Class | ||||||||||||||||||||||||
Year ended February 29, 2020 | $ | 14.56 | 0.32 | 0.12 | (0.31 | ) | (0.18 | ) | $ | 14.51 | ||||||||||||||
Year ended February 28, 2019 | $ | 16.47 | 0.34 | 4 | (0.07 | ) | (0.37 | ) | (1.81 | ) | $ | 14.56 | ||||||||||||
Year ended February 28, 2018 | $ | 19.82 | 0.33 | 4 | 1.98 | (0.32 | ) | (5.34 | ) | $ | 16.47 | |||||||||||||
Year ended February 28, 2017 | $ | 17.07 | 0.25 | 3.14 | (0.29 | ) | (0.35 | ) | $ | 19.82 | ||||||||||||||
Year ended February 29, 2016 | $ | 19.89 | 0.27 | (2.33 | ) | (0.22 | ) | (0.54 | ) | $ | 17.07 | |||||||||||||
| 1 | Ratios include net expenses allocated from the affiliated Master Portfolios which were as follows: |
| Year ended February 29, 2020 | Year ended February 28 | Year ended February 29, 2016 | ||||||||||||||||||
| 2019 | 2018 | 2017 | ||||||||||||||||||
Class A | 0.15 | % | 0.17 | % | 0.18 | % | 0.17 | % | 0.16 | % | ||||||||||
Class C | 0.15 | 0.17 | 0.18 | 0.17 | 0.16 | |||||||||||||||
Class R | 0.18 | 0.16 | 0.18 | 0.17 | 0.17 | |||||||||||||||
Class R4 | 0.15 | 0.17 | 0.18 | 0.17 | 0.16 | |||||||||||||||
Class R6 | 0.15 | 0.17 | 0.18 | 0.16 | 0.16 | |||||||||||||||
Administrator Class | 0.15 | 0.17 | 0.18 | 0.17 | 0.16 | |||||||||||||||
| 2 | Total return calculations do not include any sales charges. |
| 3 | Portfolio turnover rate is calculated by multiplying the Fund’s ownership percentage each respective affiliated Master Portfolio by the corresponding affiliated Master Portfolio’s purchases and sales. |
| 4 | Calculated based upon average shares outstanding |
The accompanying notes are an integral part of these financial statements.
96 | Target Date Retirement Funds
Table of Contents
Financial highlights
| Ratio to average net assets (annualized) | Total return2 | Portfolio turnover rate3 | Net assets at end of period (000s omitted) | |||||||||||||||||||
| Net investment income1 | Gross expenses1 | Net expenses1 | ||||||||||||||||||||
| 1.85 | % | 0.77 | % | 0.64 | % | 2.68 | % | 36 | % | $ | 175,942 | |||||||||||
| 1.91 | % | 0.78 | % | 0.65 | % | 2.32 | % | 40 | % | $ | 189,990 | |||||||||||
| 1.51 | % | 0.81 | % | 0.72 | % | 11.24 | % | 51 | % | $ | 223,769 | |||||||||||
| 1.21 | % | 0.85 | % | 0.83 | % | 20.01 | % | 24 | % | $ | 218,689 | |||||||||||
| 1.23 | % | 0.87 | % | 0.84 | % | (10.72 | )% | 27 | % | $ | 202,038 | |||||||||||
| 1.12 | % | 1.52 | % | 1.39 | % | 1.87 | % | 36 | % | $ | 1,906 | |||||||||||
| 1.21 | % | 1.53 | % | 1.40 | % | 1.55 | % | 40 | % | $ | 2,754 | |||||||||||
| 0.76 | % | 1.56 | % | 1.46 | % | 10.41 | % | 51 | % | $ | 5,292 | |||||||||||
| 0.47 | % | 1.60 | % | 1.58 | % | 19.11 | % | 24 | % | $ | 4,782 | |||||||||||
| 0.54 | % | 1.63 | % | 1.60 | % | (11.39 | )% | 27 | % | $ | 4,621 | |||||||||||
| 1.57 | % | 1.02 | % | 0.89 | % | 2.44 | % | 36 | % | $ | 66 | |||||||||||
| 1.63 | % | 1.02 | % | 0.90 | % | 2.04 | % | 40 | % | $ | 62 | |||||||||||
| 1.40 | % | 1.08 | % | 1.01 | % | 11.07 | % | 51 | % | $ | 56 | |||||||||||
| 0.94 | % | 1.10 | % | 1.08 | % | 19.68 | % | 24 | % | $ | 394 | |||||||||||
| 0.97 | % | 1.12 | % | 1.09 | % | (10.96 | )% | 27 | % | $ | 289 | |||||||||||
| 2.14 | % | 0.49 | % | 0.34 | % | 2.94 | % | 36 | % | $ | 41,864 | |||||||||||
| 2.38 | % | 0.50 | % | 0.34 | % | 2.69 | % | 40 | % | $ | 45,177 | |||||||||||
| 1.85 | % | 0.54 | % | 0.42 | % | 11.56 | % | 51 | % | $ | 189,896 | |||||||||||
| 1.54 | % | 0.57 | % | 0.52 | % | 20.43 | % | 24 | % | $ | 388,622 | |||||||||||
| 1.64 | % | 0.59 | % | 0.52 | % | (10.45 | )% | 27 | % | $ | 385,259 | |||||||||||
| 2.29 | % | 0.34 | % | 0.19 | % | 3.09 | % | 36 | % | $ | 185,291 | |||||||||||
| 2.40 | % | 0.35 | % | 0.19 | % | 2.81 | % | 40 | % | $ | 184,594 | |||||||||||
| 2.00 | % | 0.39 | % | 0.27 | % | 11.74 | % | 51 | % | $ | 283,562 | |||||||||||
| 1.80 | % | 0.41 | % | 0.37 | % | 20.56 | % | 24 | % | $ | 489,693 | |||||||||||
| 1.75 | % | 0.43 | % | 0.37 | % | (10.32 | )% | 27 | % | $ | 929,672 | |||||||||||
| 1.95 | % | 0.69 | % | 0.54 | % | 2.82 | % | 36 | % | $ | 63,232 | |||||||||||
| 2.09 | % | 0.70 | % | 0.54 | % | 2.40 | % | 40 | % | $ | 71,411 | |||||||||||
| 1.63 | % | 0.73 | % | 0.61 | % | 11.38 | % | 51 | % | $ | 132,365 | |||||||||||
| 1.43 | % | 0.76 | % | 0.72 | % | 20.09 | % | 24 | % | $ | 197,272 | |||||||||||
| 1.42 | % | 0.78 | % | 0.72 | % | (10.56 | )% | 27 | % | $ | 320,415 | |||||||||||
The accompanying notes are an integral part of these financial statements.
Target Date Retirement Funds | 97
Table of Contents
Financial highlights
| Beginning net asset value per share | Net investment income | Net realized and unrealized gains (losses) on investments | Distributions from net investment income | Distributions from net realized gains | Ending net asset value per share | |||||||||||||||||||
Target 2045 Fund | ||||||||||||||||||||||||
Class A | ||||||||||||||||||||||||
Year ended February 29, 2020 | $ | 8.13 | 0.16 | 4 | 0.03 | (0.19 | ) | (0.06 | ) | $ | 8.07 | |||||||||||||
Year ended February 28, 2019 | $ | 9.18 | 0.16 | (0.03 | ) | (0.19 | ) | (0.99 | ) | $ | 8.13 | |||||||||||||
Year ended February 28, 2018 | $ | 11.91 | 0.18 | 4 | 1.28 | (0.20 | ) | (3.99 | ) | $ | 9.18 | |||||||||||||
Year ended February 28, 2017 | $ | 10.07 | 0.13 | 2.05 | (0.17 | ) | (0.17 | ) | $ | 11.91 | ||||||||||||||
Year ended February 29, 2016 | $ | 11.85 | 0.16 | (1.52 | ) | (0.13 | ) | (0.29 | ) | $ | 10.07 | |||||||||||||
Class R | ||||||||||||||||||||||||
Year ended February 29, 2020 | $ | 8.29 | 0.13 | 0.03 | (0.17 | ) | (0.06 | ) | $ | 8.22 | ||||||||||||||
Year ended February 28, 2019 | $ | 9.33 | 0.14 | (0.02 | ) | (0.17 | ) | (0.99 | ) | $ | 8.29 | |||||||||||||
Year ended February 28, 2018 | $ | 12.04 | 0.16 | 1.29 | (0.17 | ) | (3.99 | ) | $ | 9.33 | ||||||||||||||
Year ended February 28, 2017 | $ | 10.19 | 0.11 | 2.05 | (0.14 | ) | (0.17 | ) | $ | 12.04 | ||||||||||||||
Year ended February 29, 2016 | $ | 11.97 | 0.11 | (1.51 | ) | (0.09 | ) | (0.29 | ) | $ | 10.19 | |||||||||||||
Class R4 | ||||||||||||||||||||||||
Year ended February 29, 2020 | $ | 8.19 | 0.18 | 4 | 0.03 | (0.22 | ) | (0.06 | ) | $ | 8.12 | |||||||||||||
Year ended February 28, 2019 | $ | 9.24 | 0.20 | 4 | (0.04 | ) | (0.22 | ) | (0.99 | ) | $ | 8.19 | ||||||||||||
Year ended February 28, 2018 | $ | 11.96 | 0.22 | 4 | 1.28 | (0.23 | ) | (3.99 | ) | $ | 9.24 | |||||||||||||
Year ended February 28, 2017 | $ | 10.11 | 0.16 | 2.06 | (0.20 | ) | (0.17 | ) | $ | 11.96 | ||||||||||||||
Year ended February 29, 2016 | $ | 11.89 | 0.18 | (1.51 | ) | (0.16 | ) | (0.29 | ) | $ | 10.11 | |||||||||||||
Class R6 | ||||||||||||||||||||||||
Year ended February 29, 2020 | $ | 8.15 | 0.20 | 4 | 0.03 | (0.23 | ) | (0.06 | ) | $ | 8.09 | |||||||||||||
Year ended February 28, 2019 | $ | 9.21 | 0.22 | 4 | (0.05 | ) | (0.24 | ) | (0.99 | ) | $ | 8.15 | ||||||||||||
Year ended February 28, 2018 | $ | 11.93 | 0.29 | 1.24 | (0.26 | ) | (3.99 | ) | $ | 9.21 | ||||||||||||||
Year ended February 28, 2017 | $ | 10.10 | 0.23 | 1.99 | (0.22 | ) | (0.17 | ) | $ | 11.93 | ||||||||||||||
Year ended February 29, 2016 | $ | 11.87 | 0.19 | (1.49 | ) | (0.18 | ) | (0.29 | ) | $ | 10.10 | |||||||||||||
Administrator Class | ||||||||||||||||||||||||
Year ended February 29, 2020 | $ | 8.27 | 0.17 | 4 | 0.03 | (0.20 | ) | (0.06 | ) | $ | 8.21 | |||||||||||||
Year ended February 28, 2019 | $ | 9.29 | 0.20 | 4 | (0.05 | ) | (0.18 | ) | (0.99 | ) | $ | 8.27 | ||||||||||||
Year ended February 28, 2018 | $ | 12.01 | 0.19 | 4 | 1.28 | (0.20 | ) | (3.99 | ) | $ | 9.29 | |||||||||||||
Year ended February 28, 2017 | $ | 10.16 | 0.16 | 4 | 2.04 | (0.18 | ) | (0.17 | ) | $ | 12.01 | |||||||||||||
Year ended February 29, 2016 | $ | 11.94 | 0.16 | (1.51 | ) | (0.14 | ) | (0.29 | ) | $ | 10.16 | |||||||||||||
| 1 | Ratios include net expenses allocated from the affiliated Master Portfolios which were as follows: |
| Year ended February 29, 2020 | Year ended February 28 | Year ended February 29, 2016 | ||||||||||||||||||
| 2019 | 2018 | 2017 | ||||||||||||||||||
Class A | 0.16 | % | 0.17 | % | 0.19 | % | 0.17 | % | 0.17 | % | ||||||||||
Class R | 0.20 | 0.16 | 0.18 | 0.16 | 0.16 | |||||||||||||||
Class R4 | 0.16 | 0.17 | 0.19 | 0.17 | 0.16 | |||||||||||||||
Class R6 | 0.16 | 0.17 | 0.19 | 0.16 | 0.16 | |||||||||||||||
Administrator Class | 0.16 | 0.17 | 0.19 | 0.17 | 0.16 | |||||||||||||||
| 2 | Total return calculations do not include any sales charges. |
| 3 | Portfolio turnover rate is calculated by multiplying the Fund’s ownership percentage in each respective affiliated Master Portfolio by the corresponding affiliated Master Portfolio’s purchases and sales. |
| 4 | Calculated based upon average shares outstanding |
The accompanying notes are an integral part of these financial statements.
98 | Target Date Retirement Funds
Table of Contents
Financial highlights
| Ratio to average net assets (annualized) | Total return2 | Portfolio turnover rate3 | Net assets at end of period (000s omitted) | |||||||||||||||||||
| Net investment income1 | Gross expenses1 | Net expenses1 | ||||||||||||||||||||
| 1.85 | % | 0.88 | % | 0.63 | % | 2.14 | % | 36 | % | $ | 42,792 | |||||||||||
| 1.88 | % | 0.85 | % | 0.65 | % | 2.21 | % | 39 | % | $ | 56,491 | |||||||||||
| 1.48 | % | 0.86 | % | 0.72 | % | 11.98 | % | 48 | % | $ | 61,914 | |||||||||||
| 1.22 | % | 0.86 | % | 0.83 | % | 21.85 | % | 22 | % | $ | 70,570 | |||||||||||
| 1.09 | % | 0.86 | % | 0.83 | % | (11.70 | )% | 26 | % | $ | 77,062 | |||||||||||
| 1.47 | % | 1.13 | % | 0.90 | % | 1.81 | % | 36 | % | $ | 49 | |||||||||||
| 1.62 | % | 1.09 | % | 0.90 | % | 2.03 | % | 39 | % | $ | 37 | |||||||||||
| 1.25 | % | 1.10 | % | 0.97 | % | 11.77 | % | 48 | % | $ | 36 | |||||||||||
| 0.88 | % | 1.11 | % | 1.08 | % | 21.41 | % | 22 | % | $ | 42 | |||||||||||
| 1.01 | % | 1.14 | % | 1.09 | % | (11.84 | )% | 26 | % | $ | 30 | |||||||||||
| 2.12 | % | 0.60 | % | 0.34 | % | 2.34 | % | 36 | % | $ | 15,460 | |||||||||||
| 2.26 | % | 0.57 | % | 0.34 | % | 2.53 | % | 39 | % | $ | 22,076 | |||||||||||
| 1.84 | % | 0.59 | % | 0.44 | % | 12.39 | % | 48 | % | $ | 46,811 | |||||||||||
| 1.46 | % | 0.59 | % | 0.52 | % | 22.25 | % | 22 | % | $ | 151,999 | |||||||||||
| 1.61 | % | 0.60 | % | 0.52 | % | (11.41 | )% | 26 | % | $ | 131,789 | |||||||||||
| 2.32 | % | 0.45 | % | 0.19 | % | 2.64 | % | 36 | % | $ | 47,672 | |||||||||||
| 2.41 | % | 0.42 | % | 0.19 | % | 2.61 | % | 39 | % | $ | 69,435 | |||||||||||
| 1.97 | % | 0.43 | % | 0.27 | % | 12.61 | % | 48 | % | $ | 133,524 | |||||||||||
| 1.77 | % | 0.43 | % | 0.37 | % | 22.26 | % | 22 | % | $ | 219,922 | |||||||||||
| 1.73 | % | 0.45 | % | 0.37 | % | (11.21 | )% | 26 | % | $ | 407,094 | |||||||||||
| 1.98 | % | 0.80 | % | 0.54 | % | 2.21 | % | 36 | % | $ | 4,544 | |||||||||||
| 2.14 | % | 0.76 | % | 0.54 | % | 2.32 | % | 39 | % | $ | 7,213 | |||||||||||
| 1.60 | % | 0.77 | % | 0.61 | % | 12.05 | % | 48 | % | $ | 30,255 | |||||||||||
| 1.46 | % | 0.78 | % | 0.72 | % | 21.89 | % | 22 | % | $ | 41,504 | |||||||||||
| 1.39 | % | 0.79 | % | 0.72 | % | (11.55 | )% | 26 | % | $ | 108,091 | |||||||||||
The accompanying notes are an integral part of these financial statements.
Target Date Retirement Funds | 99
Table of Contents
Financial highlights
| Beginning net asset value per share | Net investment income | Net realized and unrealized gains (losses) on investments | Distributions from net investment income | Distributions from net realized gains | Ending net asset value per share | |||||||||||||||||||
Target 2050 Fund | ||||||||||||||||||||||||
Class A | ||||||||||||||||||||||||
Year ended February 29, 2020 | $ | 7.13 | 0.13 | 4 | 0.02 | (0.14 | ) | (0.19 | ) | $ | 6.95 | |||||||||||||
Year ended February 28, 2019 | $ | 8.61 | 0.14 | (0.05 | ) | (0.20 | ) | (1.37 | ) | $ | 7.13 | |||||||||||||
Year ended February 28, 2018 | $ | 11.40 | 0.20 | 1.23 | (0.19 | ) | (4.03 | ) | $ | 8.61 | ||||||||||||||
Year ended February 28, 2017 | $ | 9.61 | 0.12 | 2.02 | (0.18 | ) | (0.17 | ) | $ | 11.40 | ||||||||||||||
Year ended February 29, 2016 | $ | 11.34 | 0.11 | 4 | (1.44 | ) | (0.12 | ) | (0.28 | ) | $ | 9.61 | ||||||||||||
Class C | ||||||||||||||||||||||||
Year ended February 29, 2020 | $ | 7.08 | 0.08 | 4 | 0.00 | 5 | (0.06 | ) | (0.19 | ) | $ | 6.91 | ||||||||||||
Year ended February 28, 2019 | $ | 8.56 | 0.06 | (0.03 | ) | (0.14 | ) | (1.37 | ) | $ | 7.08 | |||||||||||||
Year ended February 28, 2018 | $ | 11.36 | 0.11 | 1.22 | (0.10 | ) | (4.03 | ) | $ | 8.56 | ||||||||||||||
Year ended February 28, 2017 | $ | 9.58 | 0.04 | 2.02 | (0.11 | ) | (0.17 | ) | $ | 11.36 | ||||||||||||||
Year ended February 29, 2016 | $ | 11.30 | 0.06 | (1.46 | ) | (0.04 | ) | (0.28 | ) | $ | 9.58 | |||||||||||||
Class R | ||||||||||||||||||||||||
Year ended February 29, 2020 | $ | 7.15 | 0.12 | 0.00 | 5 | (0.12 | ) | (0.19 | ) | $ | 6.96 | |||||||||||||
Year ended February 28, 2019 | $ | 8.63 | 0.13 | (0.05 | ) | (0.19 | ) | (1.37 | ) | $ | 7.15 | |||||||||||||
Year ended February 28, 2018 | $ | 11.43 | 0.15 | 1.24 | (0.16 | ) | (4.03 | ) | $ | 8.63 | ||||||||||||||
Year ended February 28, 2017 | $ | 9.63 | 0.09 | 2.04 | (0.16 | ) | (0.17 | ) | $ | 11.43 | ||||||||||||||
Year ended February 29, 2016 | $ | 11.37 | 0.11 | (1.47 | ) | (0.10 | ) | (0.28 | ) | $ | 9.63 | |||||||||||||
Class R4 | ||||||||||||||||||||||||
Year ended February 29, 2020 | $ | 7.19 | 0.16 | 4 | 0.00 | 5 | (0.16 | ) | (0.19 | ) | $ | 7.00 | ||||||||||||
Year ended February 28, 2019 | $ | 8.66 | 0.20 | 4 | (0.07 | ) | (0.23 | ) | (1.37 | ) | $ | 7.19 | ||||||||||||
Year ended February 28, 2018 | $ | 11.45 | 0.21 | 4 | 1.25 | (0.22 | ) | (4.03 | ) | $ | 8.66 | |||||||||||||
Year ended February 28, 2017 | $ | 9.64 | 0.16 | 4 | 2.03 | (0.21 | ) | (0.17 | ) | $ | 11.45 | |||||||||||||
Year ended February 29, 2016 | $ | 11.38 | 0.17 | (1.48 | ) | (0.15 | ) | (0.28 | ) | $ | 9.64 | |||||||||||||
Class R6 | ||||||||||||||||||||||||
Year ended February 29, 2020 | $ | 7.17 | 0.17 | 0.02 | (0.18 | ) | (0.19 | ) | $ | 6.99 | ||||||||||||||
Year ended February 28, 2019 | $ | 8.65 | 0.25 | (0.12 | ) | (0.24 | ) | (1.37 | ) | $ | 7.17 | |||||||||||||
Year ended February 28, 2018 | $ | 11.44 | 0.26 | 1.22 | (0.24 | ) | (4.03 | ) | $ | 8.65 | ||||||||||||||
Year ended February 28, 2017 | $ | 9.64 | 0.19 | 4 | 2.01 | (0.23 | ) | (0.17 | ) | $ | 11.44 | |||||||||||||
Year ended February 29, 2016 | $ | 11.37 | 0.18 | (1.46 | ) | (0.17 | ) | (0.28 | ) | $ | 9.64 | |||||||||||||
Administrator Class | ||||||||||||||||||||||||
Year ended February 29, 2020 | $ | 7.16 | 0.14 | 0.01 | (0.15 | ) | (0.19 | ) | $ | 6.97 | ||||||||||||||
Year ended February 28, 2019 | $ | 8.62 | 0.18 | (0.07 | ) | (0.20 | ) | (1.37 | ) | $ | 7.16 | |||||||||||||
Year ended February 28, 2018 | $ | 11.41 | 0.20 | 1.24 | (0.20 | ) | (4.03 | ) | $ | 8.62 | ||||||||||||||
Year ended February 28, 2017 | $ | 9.61 | 0.15 | 4 | 2.01 | (0.19 | ) | (0.17 | ) | $ | 11.41 | |||||||||||||
Year ended February 29, 2016 | $ | 11.34 | 0.15 | (1.47 | ) | (0.13 | ) | (0.28 | ) | $ | 9.61 | |||||||||||||
| 1 | Ratios include net expenses allocated from the affiliated Master Portfolios which were as follows: |
Year ended February 29, 2020 | Year ended February 28 | Year ended February 29, 2016 | ||||||||||||||||||
| 2019 | 2018 | 2017 | ||||||||||||||||||
Class A | 0.16 | % | 0.17 | % | 0.19 | % | 0.17 | % | 0.17 | % | ||||||||||
Class C | 0.16 | 0.17 | 0.18 | 0.17 | 0.16 | |||||||||||||||
Class R | 0.21 | 0.18 | 0.23 | 0.19 | 0.19 | |||||||||||||||
Class R4 | 0.16 | 0.18 | 0.19 | 0.17 | 0.16 | |||||||||||||||
Class R6 | 0.16 | 0.17 | 0.19 | 0.16 | 0.16 | |||||||||||||||
Administrator Class | 0.16 | 0.17 | 0.19 | 0.17 | 0.16 | |||||||||||||||
| 2 | Total return calculations do not include any sales charges. |
| 3 | Portfolio turnover rate is calculated by multiplying the Fund’s ownership percentage in each respective affiliated Master Portfolio by the corresponding affiliated Master Portfolio’s purchases and sales. |
| 4 | Calculated based upon average shares outstanding |
| 5 | Amount is less than $0.005. |
The accompanying notes are an integral part of these financial statements.
100 | Target Date Retirement Funds
Table of Contents
Financial highlights
| Ratio to average net assets (annualized) | Total | Portfolio | Net assets at end of period (000s omitted) | |||||||||||||||||||
| Net investment income1 | Gross expenses1 | Net expenses1 | ||||||||||||||||||||
| 1.81 | % | 0.83 | % | 0.63 | % | 1.74 | % | 36 | % | $ | 47,060 | |||||||||||
| 1.88 | % | 0.82 | % | 0.65 | % | 2.10 | % | 39 | % | $ | 53,038 | |||||||||||
| 1.47 | % | 0.83 | % | 0.72 | % | 12.26 | % | 46 | % | $ | 67,360 | |||||||||||
| 1.13 | % | 0.85 | % | 0.83 | % | 22.48 | % | 21 | % | $ | 64,356 | |||||||||||
| 1.05 | % | 0.86 | % | 0.83 | % | (11.93 | )% | 26 | % | $ | 58,749 | |||||||||||
| 1.12 | % | 1.57 | % | 1.39 | % | 0.88 | % | 36 | % | $ | 519 | |||||||||||
| 1.13 | % | 1.57 | % | 1.40 | % | 1.38 | % | 39 | % | $ | 1,013 | |||||||||||
| 0.72 | % | 1.58 | % | 1.46 | % | 11.38 | % | 46 | % | $ | 1,376 | |||||||||||
| 0.33 | % | 1.61 | % | 1.58 | % | 21.58 | % | 21 | % | $ | 1,218 | |||||||||||
| 0.49 | % | 1.64 | % | 1.60 | % | (12.56 | )% | 26 | % | $ | 894 | |||||||||||
| 1.50 | % | 1.07 | % | 0.89 | % | 1.38 | % | 36 | % | $ | 37 | |||||||||||
| 1.58 | % | 1.08 | % | 0.90 | % | 1.93 | % | 39 | % | $ | 32 | |||||||||||
| 1.24 | % | 1.12 | % | 0.97 | % | 11.88 | % | 46 | % | $ | 28 | |||||||||||
| 0.94 | % | 1.13 | % | 1.08 | % | 22.29 | % | 21 | % | $ | 34 | |||||||||||
| 1.00 | % | 1.17 | % | 1.10 | % | (12.21 | )% | 26 | % | $ | 32 | |||||||||||
| 2.08 | % | 0.55 | % | 0.34 | % | 1.89 | % | 36 | % | $ | 17,989 | |||||||||||
| 2.40 | % | 0.53 | % | 0.34 | % | 2.57 | % | 39 | % | $ | 19,551 | |||||||||||
| 1.82 | % | 0.56 | % | 0.42 | % | 12.54 | % | 46 | % | $ | 122,118 | |||||||||||
| 1.45 | % | 0.57 | % | 0.52 | % | 23.00 | % | 21 | % | $ | 243,339 | |||||||||||
| 1.61 | % | 0.59 | % | 0.52 | % | (11.72 | )% | 26 | % | $ | 219,157 | |||||||||||
| 2.23 | % | 0.40 | % | 0.19 | % | 2.18 | % | 36 | % | $ | 107,868 | |||||||||||
| 2.37 | % | 0.39 | % | 0.19 | % | 2.61 | % | 39 | % | $ | 107,769 | |||||||||||
| 1.95 | % | 0.41 | % | 0.27 | % | 12.73 | % | 46 | % | $ | 180,036 | |||||||||||
| 1.81 | % | 0.42 | % | 0.37 | % | 23.09 | % | 21 | % | $ | 287,423 | |||||||||||
| 1.72 | % | 0.44 | % | 0.37 | % | (11.51 | )% | 26 | % | �� | $ | 806,152 | ||||||||||
| 1.88 | % | 0.75 | % | 0.54 | % | 1.70 | % | 36 | % | $ | 39,498 | |||||||||||
| 2.07 | % | 0.74 | % | 0.54 | % | 2.37 | % | 39 | % | $ | 40,236 | |||||||||||
| 1.59 | % | 0.75 | % | 0.61 | % | 12.29 | % | 46 | % | $ | 82,574 | |||||||||||
| 1.37 | % | 0.76 | % | 0.72 | % | 22.72 | % | 21 | % | $ | 121,028 | |||||||||||
| 1.39 | % | 0.78 | % | 0.72 | % | (11.86 | )% | 26 | % | $ | 185,008 | |||||||||||
The accompanying notes are an integral part of these financial statements.
Target Date Retirement Funds | 101
Table of Contents
Financial highlights
| Beginning net asset value per share | Net investment income | Net realized and unrealized gains (losses) on investments | Distributions from net investment income | Distributions from net realized gains | Ending net asset value per share | |||||||||||||||||||
Target 2055 Fund | ||||||||||||||||||||||||
Class A | ||||||||||||||||||||||||
Year ended February 29, 2020 | $ | 11.56 | 0.22 | 4 | (0.01 | ) | (0.22 | ) | (0.01 | ) | $ | 11.54 | ||||||||||||
Year ended February 28, 2019 | $ | 12.72 | 0.22 | (0.02 | ) | (0.30 | ) | (1.06 | ) | $ | 11.56 | |||||||||||||
Year ended February 28, 2018 | $ | 13.91 | 0.21 | 4 | 1.50 | (0.23 | ) | (2.67 | ) | $ | 12.72 | |||||||||||||
Year ended February 28, 2017 | $ | 11.56 | 0.14 | 2.44 | (0.23 | ) | 0.00 | $ | 13.91 | |||||||||||||||
Year ended February 29, 2016 | $ | 13.28 | 0.14 | 4 | (1.71 | ) | (0.12 | ) | (0.03 | ) | $ | 11.56 | ||||||||||||
Class R | ||||||||||||||||||||||||
Year ended February 29, 2020 | $ | 11.39 | 0.18 | 0.00 | 5 | (0.21 | ) | (0.01 | ) | $ | 11.35 | |||||||||||||
Year ended February 28, 2019 | $ | 12.56 | 0.19 | (0.03 | ) | (0.27 | ) | (1.06 | ) | $ | 11.39 | |||||||||||||
Year ended February 28, 2018 | $ | 13.76 | 0.18 | 1.49 | (0.20 | ) | (2.67 | ) | $ | 12.56 | ||||||||||||||
Year ended February 28, 2017 | $ | 11.45 | 0.10 | 2.41 | (0.20 | ) | 0.00 | $ | 13.76 | |||||||||||||||
Year ended February 29, 2016 | $ | 13.16 | 0.12 | (1.71 | ) | (0.09 | ) | (0.03 | ) | $ | 11.45 | |||||||||||||
Class R4 | ||||||||||||||||||||||||
Year ended February 29, 2020 | $ | 11.60 | 0.25 | 4 | 0.00 | 5 | (0.26 | ) | (0.01 | ) | $ | 11.58 | ||||||||||||
Year ended February 28, 2019 | $ | 12.76 | 0.28 | 4 | (0.05 | ) | (0.33 | ) | (1.06 | ) | $ | 11.60 | ||||||||||||
Year ended February 28, 2018 | $ | 13.94 | 0.27 | 4 | 1.50 | (0.28 | ) | (2.67 | ) | $ | 12.76 | |||||||||||||
Year ended February 28, 2017 | $ | 11.59 | 0.18 | 2.44 | (0.27 | ) | 0.00 | $ | 13.94 | |||||||||||||||
Year ended February 29, 2016 | $ | 13.32 | 0.20 | (1.74 | ) | (0.16 | ) | (0.03 | ) | $ | 11.59 | |||||||||||||
Class R6 | ||||||||||||||||||||||||
Year ended February 29, 2020 | $ | 11.57 | 0.27 | 4 | 0.00 | 5 | (0.28 | ) | (0.01 | ) | $ | 11.55 | ||||||||||||
Year ended February 28, 2019 | $ | 12.73 | 0.31 | 4 | (0.06 | ) | (0.35 | ) | (1.06 | ) | $ | 11.57 | ||||||||||||
Year ended February 28, 2018 | $ | 13.91 | 0.31 | 1.48 | (0.30 | ) | (2.67 | ) | $ | 12.73 | ||||||||||||||
Year ended February 28, 2017 | $ | 11.57 | 0.23 | 4 | 2.40 | (0.29 | ) | 0.00 | $ | 13.91 | ||||||||||||||
Year ended February 29, 2016 | $ | 13.29 | 0.21 | (1.72 | ) | (0.18 | ) | (0.03 | ) | $ | 11.57 | |||||||||||||
Administrator Class | ||||||||||||||||||||||||
Year ended February 29, 2020 | $ | 11.57 | 0.24 | 4 | (0.03 | ) | (0.14 | ) | (0.01 | ) | $ | 11.63 | ||||||||||||
Year ended February 28, 2019 | $ | 12.73 | 0.28 | 4 | (0.07 | ) | (0.31 | ) | (1.06 | ) | $ | 11.57 | ||||||||||||
Year ended February 28, 2018 | $ | 13.91 | 0.23 | 4 | 1.50 | (0.24 | ) | (2.67 | ) | $ | 12.73 | |||||||||||||
Year ended February 28, 2017 | $ | 11.57 | 0.17 | 4 | 2.41 | (0.24 | ) | 0.00 | $ | 13.91 | ||||||||||||||
Year ended February 29, 2016 | $ | 13.28 | 0.17 | (1.71 | ) | (0.14 | ) | (0.03 | ) | $ | 11.57 | |||||||||||||
1 Ratios include net expenses allocated from the affiliated Master Portfolios which were as follows:
Year ended February 29, 2020 | Year ended February 28 | Year ended February 29, 2016 | ||||||||||||||||||
| 2019 | 2018 | 2017 | ||||||||||||||||||
Class A | 0.16 | % | 0.17 | % | 0.19 | % | 0.17 | % | 0.17 | % | ||||||||||
Class R | 0.21 | 0.17 | 0.19 | 0.17 | 0.20 | |||||||||||||||
Class R4 | 0.16 | 0.18 | 0.19 | 0.17 | 0.16 | |||||||||||||||
Class R6 | 0.16 | 0.18 | 0.19 | 0.16 | 0.16 | |||||||||||||||
Administrator Class | 0.16 | 0.18 | 0.19 | 0.17 | 0.16 | |||||||||||||||
| 2 | Total return calculations do not include any sales charges. |
| 3 | Portfolio turnover rate is calculated by multiplying the Fund’s ownership percentage in each respective affiliated Master Portfolio by the corresponding affiliated Master Portfolio’s purchases and sales. |
| 4 | Calculated based upon average shares outstanding |
| 5 | Amount is less than $0.005. |
The accompanying notes are an integral part of these financial statements.
102 | Target Date Retirement Funds
Table of Contents
Financial highlights
| Ratio to average net assets (annualized) | Total | Portfolio | Net assets at | |||||||||||||||||||
| Net investment income1 | Gross expenses1 | Net expenses1 | ||||||||||||||||||||
| 1.87 | % | 1.21 | % | 0.63 | % | 1.62 | % | 36 | % | $ | 7,374 | |||||||||||
| 1.86 | % | 1.17 | % | 0.65 | % | 2.29 | % | 39 | % | $ | 10,582 | |||||||||||
| 1.47 | % | 1.04 | % | 0.71 | % | 12.15 | % | 46 | % | $ | 10,352 | |||||||||||
| 1.13 | % | 0.91 | % | 0.83 | % | 22.45 | % | 21 | % | $ | 9,270 | |||||||||||
| 1.15 | % | 0.94 | % | 0.84 | % | (11.93 | )% | 26 | % | $ | 8,940 | |||||||||||
| 1.52 | % | 1.45 | % | 0.89 | % | 1.43 | % | 36 | % | $ | 41 | |||||||||||
| 1.60 | % | 1.39 | % | 0.89 | % | 1.96 | % | 39 | % | $ | 43 | |||||||||||
| 1.22 | % | 1.29 | % | 0.96 | % | 11.99 | % | 46 | % | $ | 42 | |||||||||||
| 0.98 | % | 1.16 | % | 1.08 | % | 22.04 | % | 21 | % | $ | 40 | |||||||||||
| 0.98 | % | 1.24 | % | 1.09 | % | (12.16 | )% | 26 | % | $ | 42 | |||||||||||
| 2.08 | % | 0.93 | % | 0.34 | % | 1.98 | % | 36 | % | $ | 7,233 | |||||||||||
| 2.24 | % | 0.93 | % | 0.34 | % | 2.57 | % | 39 | % | $ | 7,578 | |||||||||||
| 1.85 | % | 0.73 | % | 0.44 | % | 12.56 | % | 46 | % | $ | 15,764 | |||||||||||
| 1.32 | % | 0.64 | % | 0.52 | % | 22.78 | % | 21 | % | $ | 43,147 | |||||||||||
| 1.61 | % | 0.66 | % | 0.52 | % | (11.70 | )% | 26 | % | $ | 27,193 | |||||||||||
| 2.23 | % | 0.78 | % | 0.19 | % | 2.10 | % | 36 | % | $ | 19,338 | |||||||||||
| 2.46 | % | 0.87 | % | 0.19 | % | 2.71 | % | 39 | % | $ | 18,491 | |||||||||||
| 1.94 | % | 0.60 | % | 0.26 | % | 12.76 | % | 46 | % | $ | 56,563 | |||||||||||
| 1.79 | % | 0.47 | % | 0.37 | % | 22.97 | % | 21 | % | $ | 65,516 | |||||||||||
| 1.72 | % | 0.51 | % | 0.37 | % | (11.52 | )% | 26 | % | $ | 161,764 | |||||||||||
| 1.97 | % | 1.13 | % | 0.54 | % | 1.74 | % | 36 | % | $ | 759 | |||||||||||
| 2.22 | % | 1.37 | % | 0.54 | % | 2.37 | % | 39 | % | $ | 1,188 | |||||||||||
| 1.62 | % | 0.94 | % | 0.62 | % | 12.32 | % | 46 | % | $ | 5,662 | |||||||||||
| 1.34 | % | 0.83 | % | 0.72 | % | 22.50 | % | 21 | % | $ | 9,700 | |||||||||||
| 1.37 | % | 0.85 | % | 0.72 | % | (11.75 | )% | 26 | % | $ | 14,747 | |||||||||||
The accompanying notes are an integral part of these financial statements.
Target Date Retirement Funds | 103
Table of Contents
Financial highlights
| Beginning net asset value per share | Net investment income | Net realized and unrealized gains (losses) on investments | Distributions from net investment income | Distributions from net realized gains | Ending net asset value per share | |||||||||||||||||||
Target 2060 Fund | ||||||||||||||||||||||||
Class A | ||||||||||||||||||||||||
Year ended February 29, 2020 | $ | 11.44 | 0.19 | 0.02 | (0.21 | ) | 0.00 | $ | 11.44 | |||||||||||||||
Year ended February 28, 2019 | $ | 11.83 | 0.22 | 4 | (0.01 | ) | (0.25 | ) | (0.35) | $ | 11.44 | |||||||||||||
Year ended February 28, 2018 | $ | 10.69 | 0.15 | 1.15 | (0.16 | ) | 0.00 | $ | 11.83 | |||||||||||||||
Year ended February 28, 2017 | $ | 8.84 | 0.09 | 4 | 1.86 | (0.10 | ) | 0.00 | $ | 10.69 | ||||||||||||||
Year ended February 29, 20165 | $ | 10.00 | 0.06 | (1.11 | ) | (0.11 | ) | 0.00 | $ | 8.84 | ||||||||||||||
Class C | ||||||||||||||||||||||||
Year ended February 29, 2020 | $ | 11.42 | 0.08 | 0.04 | (0.11 | ) | 0.00 | $ | 11.43 | |||||||||||||||
Year ended February 28, 2019 | $ | 11.85 | 0.13 | (0.00 | )6 | (0.21 | ) | (0.35) | $ | 11.42 | ||||||||||||||
Year ended February 28, 2018 | $ | 10.71 | 0.07 | 1.15 | (0.08 | ) | 0.00 | $ | 11.85 | |||||||||||||||
Year ended February 28, 2017 | $ | 8.90 | 0.04 | 1.84 | (0.07 | ) | 0.00 | $ | 10.71 | |||||||||||||||
Year ended February 29, 20165 | $ | 10.00 | 0.01 | (1.11 | ) | 0.00 | 0.00 | $ | 8.90 | |||||||||||||||
Class R | ||||||||||||||||||||||||
Year ended February 29, 2020 | $ | 11.22 | 0.18 | 4 | (0.01 | ) | (0.18 | ) | 0.00 | $ | 11.21 | |||||||||||||
Year ended February 28, 2019 | $ | 11.65 | 0.19 | 4 | (0.01 | ) | (0.26 | ) | (0.35) | $ | 11.22 | |||||||||||||
Year ended February 28, 2018 | $ | 10.53 | 0.14 | 4 | 1.11 | (0.13 | ) | 0.00 | $ | 11.65 | ||||||||||||||
Year ended February 28, 2017 | $ | 8.84 | 0.09 | 4 | 1.80 | (0.20 | ) | 0.00 | $ | 10.53 | ||||||||||||||
Year ended February 29, 20165 | $ | 10.00 | 0.05 | (1.11 | ) | (0.10 | ) | 0.00 | $ | 8.84 | ||||||||||||||
Class R4 | ||||||||||||||||||||||||
Year ended February 29, 2020 | $ | 11.66 | 0.22 | 0.02 | (0.23 | ) | 0.00 | $ | 11.67 | |||||||||||||||
Year ended February 28, 2019 | $ | 12.06 | 0.28 | 4 | (0.02 | ) | (0.31 | ) | (0.35) | $ | 11.66 | |||||||||||||
Year ended February 28, 2018 | $ | 10.88 | 0.21 | 1.16 | (0.19 | ) | 0.00 | $ | 12.06 | |||||||||||||||
Year ended February 28, 2017 | $ | 8.97 | 0.12 | 4 | 1.89 | (0.10 | ) | 0.00 | $ | 10.88 | ||||||||||||||
Year ended February 29, 20165 | $ | 10.00 | 0.08 | 4 | (1.11 | ) | 0.00 | 0.00 | $ | 8.97 | ||||||||||||||
Class R6 | ||||||||||||||||||||||||
Year ended February 29, 2020 | $ | 11.61 | 0.25 | 0.01 | (0.25 | ) | 0.00 | $ | 11.62 | |||||||||||||||
Year ended February 28, 2019 | $ | 12.03 | 0.28 | 4 | (0.01 | ) | (0.34 | ) | (0.35) | $ | 11.61 | |||||||||||||
Year ended February 28, 2018 | $ | 10.86 | 0.24 | 1.14 | (0.21 | ) | 0.00 | $ | 12.03 | |||||||||||||||
Year ended February 28, 2017 | $ | 8.95 | 0.13 | 4 | 1.90 | (0.12 | ) | 0.00 | $ | 10.86 | ||||||||||||||
Year ended February 29, 20165 | $ | 10.00 | 0.09 | 4 | (1.12 | ) | (0.02 | ) | 0.00 | $ | 8.95 | |||||||||||||
Administrator Class | ||||||||||||||||||||||||
Year ended February 29, 2020 | $ | 11.48 | 0.21 | 0.01 | (0.21 | ) | 0.00 | $ | 11.49 | |||||||||||||||
Year ended February 28, 2019 | $ | 11.89 | 0.24 | 4 | (0.01 | ) | (0.29 | ) | (0.35) | $ | 11.48 | |||||||||||||
Year ended February 28, 2018 | $ | 10.74 | 0.19 | 1.13 | (0.17 | ) | 0.00 | $ | 11.89 | |||||||||||||||
Year ended February 28, 2017 | $ | 8.89 | 0.10 | 4 | 1.88 | (0.13 | ) | 0.00 | $ | 10.74 | ||||||||||||||
Year ended February 29, 20165 | $ | 10.00 | 0.07 | (1.12 | ) | (0.06 | ) | 0.00 | $ | 8.89 | ||||||||||||||
| 1 | Ratios include net expenses allocated from the affiliated Master Portfolios which were as follows: |
Year ended February 29, 2020 | Year ended February 28 | Year ended February 29, 20165 | ||||||||||||||||||
| 2019 | 2018 | 2017 | ||||||||||||||||||
Class A | 0.16 | % | 0.17 | % | 0.18 | % | 0.17 | % | 0.15 | % | ||||||||||
Class C | 0.18 | 0.17 | 0.18 | 0.16 | 0.16 | |||||||||||||||
Class R | 0.19 | 0.18 | 0.20 | 0.19 | 0.17 | |||||||||||||||
Class R4 | 0.16 | 0.18 | 0.19 | 0.17 | 0.16 | |||||||||||||||
Class R6 | 0.16 | 0.18 | 0.19 | 0.17 | 0.16 | |||||||||||||||
Administrator Class | 0.16 | 0.18 | 0.19 | 0.17 | 0.16 | |||||||||||||||
| 2 | Total return calculations do not include any sales charges. |
| 3 | Portfolio turnover rate is calculated by multiplying the Fund’s ownership percentage in each respective affiliated Master Portfolio by the corresponding affiliated Master Portfolio’s purchases and sales. |
| 4 | Calculated based upon average shares outstanding |
| 5 | For the period from June 30, 2015 (commencement of class operations) to February 29, 2016 |
| 6 | Amount is more than $(0.005). |
The accompanying notes are an integral part of these financial statements.
104 | Target Date Retirement Funds
Table of Contents
Financial highlights
| Ratio to average net assets (annualized) | Total | Portfolio | Net assets at end of period (000s omitted) | |||||||||||||||||||
| Net investment income1 | Gross expenses1 | Net expenses1 | ||||||||||||||||||||
| 1.74 | % | 1.61 | % | 0.64 | % | 1.67 | % | 36 | % | $ | 973 | |||||||||||
| 1.88 | % | 2.69 | % | 0.65 | % | 2.18 | % | 39 | % | $ | 660 | |||||||||||
| 1.45 | % | 1.79 | % | 0.71 | % | 12.20 | % | 46 | % | $ | 907 | |||||||||||
| 0.90 | % | 3.21 | % | 0.83 | % | 22.23 | % | 21 | % | $ | 671 | |||||||||||
| 0.97 | % | 14.47 | % | 0.83 | % | (10.59 | )% | 26 | % | $ | 100 | |||||||||||
| 1.09 | % | 2.35 | % | 1.39 | % | 0.94 | % | 36 | % | $ | 142 | |||||||||||
| 1.10 | % | 3.06 | % | 1.40 | % | 1.42 | % | 39 | % | $ | 221 | |||||||||||
| 0.73 | % | 2.41 | % | 1.47 | % | 11.37 | % | 46 | % | $ | 196 | |||||||||||
| 0.39 | % | 5.30 | % | 1.58 | % | 21.22 | % | 21 | % | $ | 252 | |||||||||||
| 0.21 | % | 15.14 | % | 1.58 | % | (11.00 | )% | 26 | % | $ | 173 | |||||||||||
| 1.50 | % | 1.85 | % | 0.90 | % | 1.42 | % | 36 | % | $ | 67 | |||||||||||
| 1.62 | % | 2.59 | % | 0.90 | % | 1.91 | % | 39 | % | $ | 54 | |||||||||||
| 1.24 | % | 1.81 | % | 0.97 | % | 11.90 | % | 46 | % | $ | 50 | |||||||||||
| 0.89 | % | 4.69 | % | 1.08 | % | 21.73 | % | 21 | % | $ | 127 | |||||||||||
| 0.72 | % | 14.73 | % | 1.08 | % | (10.66 | )% | 26 | % | $ | 89 | |||||||||||
| 2.07 | % | 1.33 | % | 0.34 | % | 1.94 | % | 36 | % | $ | 2,297 | |||||||||||
| 2.34 | % | 3.01 | % | 0.34 | % | 2.56 | % | 39 | % | $ | 2,038 | |||||||||||
| 1.81 | % | 1.38 | % | 0.41 | % | 12.61 | % | 46 | % | $ | 5,119 | |||||||||||
| 1.14 | % | 1.88 | % | 0.52 | % | 22.45 | % | 21 | % | $ | 6,443 | |||||||||||
| 1.29 | % | 14.19 | % | 0.52 | % | (10.30 | )% | 26 | % | $ | 195 | |||||||||||
| 2.20 | % | 1.18 | % | 0.19 | % | 2.07 | % | 36 | % | $ | 15,541 | |||||||||||
| 2.36 | % | 1.88 | % | 0.19 | % | 2.68 | % | 39 | % | $ | 10,497 | |||||||||||
| 1.95 | % | 1.29 | % | 0.26 | % | 12.70 | % | 46 | % | $ | 12,115 | |||||||||||
| 1.31 | % | 1.82 | % | 0.37 | % | 22.75 | % | 21 | % | $ | 12,518 | |||||||||||
| 1.41 | % | 14.05 | % | 0.37 | % | (10.30 | )% | 26 | % | $ | 573 | |||||||||||
| 1.87 | % | 1.53 | % | 0.54 | % | 1.79 | % | 36 | % | $ | 3,623 | |||||||||||
| 2.06 | % | 2.42 | % | 0.54 | % | 2.32 | % | 39 | % | $ | 3,068 | |||||||||||
| 1.58 | % | 1.61 | % | 0.61 | % | 12.27 | % | 46 | % | $ | 4,267 | |||||||||||
| 0.98 | % | 2.31 | %�� | 0.72 | % | 22.38 | % | 21 | % | $ | 4,427 | |||||||||||
| 1.10 | % | 14.35 | % | 0.72 | % | (10.50 | )% | 26 | % | $ | 359 | |||||||||||
The accompanying notes are an integral part of these financial statements.
Target Date Retirement Funds | 105
Table of Contents
1. ORGANIZATION
Wells Fargo Funds Trust (the “Trust”), a Delaware statutory trust organized on March 10, 1999, is anopen-end management investment company registered under the Investment Company Act of 1940, as amended (the “1940 Act”). As an investment company, the Trust follows the accounting and reporting guidance in Financial Accounting Standards BoardAccounting Standards Codification Topic 946, Financial Services – Investment Companies. These financial statements report on the following funds: Wells Fargo Target Today Fund (“Target Today Fund”), Wells Fargo Target 2010 Fund (“Target 2010 Fund”), Wells Fargo Target 2015 Fund (“Target 2015 Fund”), Wells Fargo Target 2020 Fund (“Target 2020 Fund”), Wells Fargo Target 2025 Fund (“Target 2025 Fund”), Wells Fargo Target 2030 Fund (“Target 2030 Fund”), Wells Fargo Target 2035 Fund (“Target 2035 Fund”), Wells Fargo Target 2040 Fund (“Target 2040 Fund”), Wells Fargo Target 2045 Fund (“Target 2045 Fund”), Wells Fargo Target 2050 Fund (“Target 2050 Fund”), Wells Fargo Target 2055 Fund (“Target 2055 Fund”), and Wells Fargo Target 2060 Fund (“Target 2060 Fund”) (each, a “Fund”, collectively, the “Funds”). Each Fund is a diversified series of the Trust.
Each Fund is afund-of-funds which seeks to achieve its investment objective by investing in multiple diversified portfolios (collectively, the “affiliated Master Portfolios”) of Wells Fargo Master Trust, a registeredopen-end management investment company. Each affiliated Master Portfolio directly acquires portfolio securities, and a Fund investing in an affiliated Master Portfolio acquires an indirect interest in those securities. Each Fund accounts for its investment in the affiliated Master Portfolios as partnership investments and records on a daily basis its share of each affiliated Master Portfolio’s income, expense and realized and unrealized gains and losses. The financial statements of the affiliated Master Portfolios are presented in separate financial statements and may be obtained free of charge by contacting Investor Services or by visiting the SEC website at sec.gov. The financial statements of the affiliated Master Portfolios are filed with the SEC under Wells Fargo Master Trust.
2. SIGNIFICANT ACCOUNTING POLICIES
The following significant accounting policies, which are consistently followed in the preparation of the financial statements of each Fund, are in conformity with U.S. generally accepted accounting principles which require management to make estimates and assumptions that affect the reported amounts of assets and liabilities, disclosure of contingent assets and liabilities at the date of the financial statements, and the reported amounts of revenues and expenses during the reporting period. Actual results could differ from those estimates.
Securities valuation
All investments are valued each business day as of the close of regular trading on the New York Stock Exchange (generally 4 p.m. Eastern Time), although the Funds may deviate from this calculation time under unusual or unexpected circumstances.
Investments in the affiliated Master Portfolios are valued daily based on each Fund’s proportionate share of each affiliated Master Portfolio’s net assets, which are also valued daily.
Investment transactions, income and expenses
Investments in affiliated Master Portfolios are recorded on a trade date basis.
Each Fund records daily its proportionate share of each affiliated Master Portfolio’s income, expenses and realized and unrealized gains or losses. Each Fund also accrues its own expenses.
Distributions to shareholders
For each Fund (except Target Today Fund, Target 2010 Fund and Target 2015 Fund), distributions to shareholders from net investment income and any net realized gains are recorded on theex-dividend date and paid at least annually. For Target Today Fund, Target 2010 Fund and Target 2015 Fund, distributions to shareholders are recorded on theex-dividend date and paid from net investment income quarterly and any net realized gains are paid at least annually. Such distributions are determined in accordance with income tax regulations and may differ from U.S. generally accepted accounting principles. Dividend sources are estimated at the time of declaration. The tax character of distributions is determined as of each Fund’s fiscal year end. Therefore, a portion of each Fund’s distributions made prior the Fund’s fiscal year end may be categorized as a tax return of capital at year end.
Federal and other taxes
Each Fund is treated as a separate entity for federal income tax purposes. Each Fund intends to continue to qualify as a regulated investment company by distributing substantially all of its investment company taxable income and any net realized capital gains (after reduction for capital loss carryforwards) sufficient to relieve it from all, or substantially all, federal income taxes. Accordingly, no provision for federal income taxes was required.
106 | Target Date Retirement Funds
Table of Contents
Notes to financial statements
Each Fund’s income and federal excise tax returns and all financial records supporting those returns for the prior three fiscal years are subject to examination by the federal and Delaware revenue authorities. Management has analyzed each Fund’s tax positions taken on federal, state, and foreign tax returns for all open tax years and does not believe that there are any uncertain tax positions that require recognition of a tax liability.
As of February 29, 2020, the aggregate cost of all investments for federal income tax purposes and the unrealized gains (losses) were as follows:
| Tax cost | Gross unrealized gains | Gross unrealized losses | Net unrealized gains (losses) | |||||||||||||
Target Today Fund | $ | 56,804,484 | $ | 7,088,582 | $ | 0 | $ | 7,088,582 | ||||||||
Target 2010 Fund | 38,149,182 | 19,572,669 | 0 | 19,572,669 | ||||||||||||
Target 2015 Fund | 51,598,820 | 11,399,999 | 0 | 11,399,999 | ||||||||||||
Target 2020 Fund | 327,980,840 | 41,802,089 | 0 | 41,802,089 | ||||||||||||
Target 2025 Fund | 227,815,743 | 20,379,303 | 0 | 20,379,303 | ||||||||||||
Target 2030 Fund | 489,651,056 | 39,817,769 | 0 | 39,817,769 | ||||||||||||
Target 2035 Fund | 205,153,966 | 13,504,648 | 0 | 13,504,648 | ||||||||||||
Target 2040 Fund | 443,600,981 | 24,783,639 | 0 | 24,783,639 | ||||||||||||
Target 2045 Fund | 105,679,385 | 4,987,159 | 0 | 4,987,159 | ||||||||||||
Target 2050 Fund | 201,584,536 | 11,202,014 | 0 | 11,202,014 | ||||||||||||
Target 2055 Fund | 35,646,316 | 0 | (686,416 | ) | (686,416 | ) | ||||||||||
Target 2060 Fund | 22,598,219 | 136,622 | 0 | 136,622 | ||||||||||||
Reclassifications are made to each Fund’s capital accounts for permanent tax differences to reflect income and gains available for distribution (or available capital loss carryforwards) under federal income tax regulations. U.S. generally accepted accounting principles require that certain components of net assets be adjusted to reflect permanent differences between financial and tax reporting. These reclassifications have no effect on net assets or net asset values per share. At February 29, 2020, as a result of permanentbook-to-tax differences, the following reclassification adjustments were made on the Statements of Assets and Liabilities:
| Paid-in capital | Total distributable earnings (loss) | |||||||
Target Today Fund | $ | 10,089 | $ | (10,089 | ) | |||
Target 2010 Fund | 9,056 | (9,056 | ) | |||||
Target 2015 Fund | 10,084 | (10,084 | ) | |||||
Target 2020 Fund | 50,788 | (50,788 | ) | |||||
Target 2025 Fund | 27,573 | (27,573 | ) | |||||
Target 2030 Fund | 44,910 | (44,910 | ) | |||||
Target 2035 Fund | 14,407 | (14,407 | ) | |||||
Target 2040 Fund | 20,015 | (20,015 | ) | |||||
Target 2045 Fund | 3,782 | (3,782 | ) | |||||
Target 2050 Fund | 4,843 | (4,843 | ) | |||||
Target 2055 Fund | 809 | (809 | ) | |||||
Target 2060 Fund | 482 | (482 | ) | |||||
As of February 29, 2020, Target 2055 Fund had capital loss carryforwards which consist of $56,604 in short-term capital losses.
Target Date Retirement Funds | 107
Table of Contents
Notes to financial statements
Class allocations
The separate classes of shares offered by each Fund differ principally in applicable sales charges, distribution, shareholder servicing, and administration fees. Class specific expenses are charged directly to that share class. Investment income, common fund-level expenses, and realized and unrealized gains (losses) on investments are allocated daily to each class of shares based on the relative proportion of net assets of each class.
3. FAIR VALUATION MEASUREMENTS
At February 29, 2020, each Fund’s investment in an affiliated Master Portfolio was measured at fair value using the net asset value per share (or its equivalent) as a practical expedient. The aggregate fair value of affiliated Master Portfolios held in each Fund was as follows:
| Aggregate fair value of affiliated Master Portfolios | ||||
Target Today Fund | $ | 63,893,066 | ||
Target 2010 Fund | 57,721,851 | |||
Target 2015 Fund | 62,998,819 | |||
Target 2020 Fund | 369,782,929 | |||
Target 2025 Fund | 248,195,046 | |||
Target 2030 Fund | 529,468,825 | |||
Target 2035 Fund | 218,658,614 | |||
Target 2040 Fund | 468,384,620 | |||
Target 2045 Fund | 110,666,544 | |||
Target 2050 Fund | 212,786,550 | |||
Target 2055 Fund | 34,959,900 | |||
Target 2060 Fund | 22,734,841 | |||
The investment objective of each affiliated Master Portfolio is as follows:
| Affiliated Master Portfolio | Investment objective | |
Wells Fargo Bloomberg Barclays US Aggregate ex-Corporate Portfolio | Seeks to replicate the total return of the Bloomberg Barclays U.S. Aggregate ex-Corporate Index, before fees and expenses | |
Wells Fargo Emerging Markets Bond Portfolio | Seeks to replicate the total return of the JP Morgan EMBI Global Diversified Index, before fees and expenses | |
Wells Fargo Factor Enhanced Emerging Markets Portfolio | Seeks to replicate the total return of the Wells Fargo Factor Enhanced Emerging Markets Index (Net), before fees and expenses | |
Wells Fargo Factor Enhanced International Portfolio | Seeks to replicate the total return of the Wells Fargo Factor Enhanced International Index (Net), before fees and expenses | |
Wells Fargo Factor Enhanced Large Cap Portfolio | Seeks to replicate the total return of the Wells Fargo Factor Enhanced Large Cap Index, before fees and expenses | |
Wells Fargo Factor Enhanced Small Cap Portfolio | Seeks to replicate the total return of the Wells Fargo Factor Enhanced Small Cap Index, before fees and expenses | |
Wells Fargo High Yield Corporate Bond Portfolio | Seeks to replicate the total return of the Wells Fargo U.S. High Yield Bond Index, before fees and expenses | |
Wells Fargo Investment Grade Corporate Bond Portfolio | Seeks to replicate the total return of the Wells Fargo U.S. Investment Grade Corporate Bond Index, before fees and expenses | |
Wells Fargo Strategic Retirement Bond Portfolio | Seeks to replicate the total return of a blended index that is weighted 50% to the Bloomberg Barclays U.S. Treasury Inflation-Linked 1-10 Year Bond Index and 50% to the Bloomberg Barclays U.S. Intermediate Government Bond Index, before fees and expenses | |
Wells Fargo U.S. REIT Portfolio | Seeks to replicate the total return of the Wells Fargo U.S. REIT Index, before fees and expenses | |
Each affiliated Master Portfolio does not have a redemption period notice, can be redeemed daily and does not have any unfunded commitments.
108 | Target Date Retirement Funds
Table of Contents
Notes to financial statements
4. TRANSACTIONS WITH AFFILIATES
Management fee
Wells Fargo Funds Management, LLC (“Funds Management”), an indirect wholly owned subsidiary of Wells Fargo & Company (“Wells Fargo”), is the manager of each Fund and provides advisory and fund-level administrative services under an investment management agreement. Under the investment management agreement, Funds Management is responsible for, among other services, implementing the investment objectives and strategies of each Fund, supervising the subadviser and providingfund-level administrative services in connection with each Fund’s operations. As compensation for its services under the investment management agreement, Funds Management is entitled to receive a management fee at the following annual rate based on each Fund’s average daily net assets:
| Average daily net assets | Management fee | |||||
First $5 billion | 0.10 | % | ||||
Next $5 billion | 0.09 | |||||
Over $10 billion | 0.08 | |||||
For the year ended February 29, 2020, the management fee was equivalent to an annual rate of 0.10% of each Fund’s average daily net assets.
Funds Management has retained the services of a subadviser to provide daily portfolio management to the Funds. The fees for subadvisory services is borne by Funds Management. Wells Capital Management Incorporated, an affiliate of Funds Management and an indirect wholly owned subsidiary of Wells Fargo, is the subadviser to each Fund and is entitled to receive a fee from Funds Management at an annual rate starting at 0.05% and declining to 0.03% as the average daily net assets of each Fund increase.
Funds Management also serves as the adviser to each affiliated Master Portfolio and is entitled to receive a fee from each affiliated Master Portfolio for those services.
Administration fees
Under a class-level administration agreement, Funds Management provides class-level administrative services to each Fund, which includes paying fees and expenses for services provided by the transfer agent,sub-transfer agents, omnibus account servicers and record-keepers. As compensation for its services under the class-level administration agreement, Funds Management receives an annual fee which is calculated based on the average daily net assets of each class as follows:
| Class-level administration fee | ||||||
Class A, Class C, Class R | 0.21 | % | ||||
Class R4 | 0.08 | |||||
Class R6 | 0.03 | |||||
Administrator Class | 0.13 | |||||
Waivers and/or expense reimbursements
Funds Management has contractually waived and/or reimbursed management and administration fees to the extent necessary to maintain certain net operating expense ratios for the Fund. When each class of the Fund has exceeded its expense cap, Funds Management has waived fees and/or reimbursed expenses from fund-level expenses on a proportionate basis and then from class specific expenses. When only certain classes exceed their expense caps, waivers and/or reimbursements are applied against class specific expenses before fund-level expenses. Funds Management has committed through June 30, 2020 to waive fees and/or reimburse expenses to the extent necessary to cap the Fund’s expenses at 0.65% for Class A shares, 1.40% for Class C shares, 0.90% for Class R shares, 0.34% for Class R4 shares, 0.19% for Class R6 shares, and 0.54% for Administrator Class shares. Prior to or after the commitment expiration date, the cap may be increased or the commitment to maintain the cap may be terminated only with the approval of the Board of Trustees.
Distribution fees
The Trust has adopted a Distribution Plan for Class C and Class R shares of the Funds pursuant to Rule12b-1 under the 1940 Act. Distribution fees are charged to Class C and Class R shares and paid to Wells Fargo Funds Distributor, LLC (“Funds Distributor”), the principal underwriter of each Fund, at an annual rate of 0.75% of the average daily net assets of Class C shares and 0.25% of the average daily net assets of Class R shares.
Target Date Retirement Funds | 109
Table of Contents
Notes to financial statements
In addition, Funds Distributor is entitled to receive thefront-end sales charge from the purchase of Class A shares and a contingent deferred sales charge on the redemption of certain Class A shares. Funds Distributor is also entitled to receive the contingent deferred sales charges from redemptions of Class C shares. For the year ended February 29, 2020, Funds Distributor receivedfront-end sales charges and contingent deferred sales charges from the following Funds:
| Front-end sales charges
| Contingent deferred sales charges
| |||||||
| Class A | Class C | |||||||
Target Today Fund | $ | 5 | $6 | |||||
Target 2010 Fund | 82 | 6 | ||||||
Target 2020 Fund | 1,776 | 0 | ||||||
Target 2025 Fund | 302 | N/A | ||||||
Target 2030 Fund | 1,480 | 0 | ||||||
Target 2035 Fund | 867 | N/A | ||||||
Target 2040 Fund | 1,183 | 0 | ||||||
Target 2045 Fund | 641 | N/A | ||||||
Target 2050 Fund | 713 | 50 | ||||||
Target 2055 Fund | 112 | N/A | ||||||
Target 2060 Fund | 73 | 0 | ||||||
For the year ended February 29, 2020, the Funds did not received any contingent deferred sales charges on Class A shares.
Shareholder servicing fees
The Trust has entered into contracts with one or more shareholder servicing agents, whereby Class A, Class C, Class R, and Administrator Class of each Fund are charged a fee at an annual rate of 0.25% of the average daily net assets of each respective class. Class R4 is charged a fee at an annual rate of 0.10% of its average daily net assets. A portion of these total shareholder servicing fees were paid to affiliates of Wells Fargo.
5. INVESTMENT PORTFOLIO TRANSACTIONS
The Funds seek to achieve their investment objectives by investing substantially all of their investable assets in affiliated Master Portfolios. Purchases and sales related to these investments have been calculated by aggregating the results of multiplying each Fund’s ownership percentage in the respective affiliated Master Portfolio by the corresponding affiliated Master Portfolio’s purchases and sales. Purchases and sales of investments, excluding short-term securities, for the year ended February 29, 2020 were as follows:
| Purchases at cost
| Sales proceeds
| |||||||||||||||
| U.S. government | Non-U.S. government | U.S. government | Non-U.S. government | |||||||||||||
Target Today Fund | $ | 13,576,702 | $ | 11,659,357 | $ | 11,932,055 | $ | 18,274,868 | ||||||||
Target 2010 Fund | 12,068,680 | 10,736,509 | 10,606,241 | 16,829,550 | ||||||||||||
Target 2015 Fund | 12,337,808 | 12,494,391 | 10,842,739 | 19,666,010 | ||||||||||||
Target 2020 Fund | 65,774,931 | 79,767,954 | 57,607,527 | 125,187,620 | ||||||||||||
Target 2025 Fund | 35,886,275 | 61,906,922 | 30,786,433 | 95,063,404 | ||||||||||||
Target 2030 Fund | 60,214,488 | 148,985,240 | 50,618,877 | 223,318,420 | ||||||||||||
Target 2035 Fund | 18,279,344 | 68,310,129 | 15,215,850 | 101,032,597 | ||||||||||||
Target 2040 Fund | 26,779,494 | 159,037,890 | 22,291,440 | 234,466,423 | ||||||||||||
Target 2045 Fund | 4,737,231 | 39,227,128 | 3,943,293 | 57,723,076 | ||||||||||||
Target 2050 Fund | 6,410,920 | 78,225,792 | 5,336,498 | 114,953,847 | ||||||||||||
Target 2055 Fund | 1,060,338 | 12,855,541 | 882,632 | 18,884,604 | ||||||||||||
Target 2060 Fund | 670,375 | 8,378,778 | 558,023 | 12,308,262 | ||||||||||||
110 | Target Date Retirement Funds
Table of Contents
Notes to financial statements
6. BANK BORROWINGS
The Trust (excluding the money market funds), Wells Fargo Master Trust and Wells Fargo Variable Trust are parties to a $280,000,000 revolving credit agreement whereby each Fund is permitted to use bank borrowings for temporary or emergency purposes, such as to fund shareholder redemption requests. Interest under the credit agreement is charged to each Fund based on a borrowing rate equal to the higher of the Federal Funds rate in effect on that day plus 1.25% or the overnight LIBOR rate in effect on that day plus 1.25%. In addition, an annual commitment fee equal to 0.25% of the unused balance is allocated to each participating fund.
For the year ended February 29, 2020, there were no borrowings by the Funds under the agreement.
7. DISTRIBUTIONS TO SHAREHOLDERS
The tax character of distributions paid during the years ended February 29, 2020, and February 28, 2019, were as follows:
| Ordinary income
| Long-term capital gain
| |||||||||||||||
| 2020 | 2019 | 2020 | 2019 | |||||||||||||
Target Today Fund | $ | 1,674,354 | $ | 2,598,411 | $ | 483,987 | $ | 3,227,246 | ||||||||
Target 2010 Fund | 1,528,224 | 3,122,464 | 561,960 | 3,794,995 | ||||||||||||
Target 2015 Fund | 1,905,919 | 4,694,034 | 1,805,871 | 9,347,592 | ||||||||||||
Target 2020 Fund | 9,353,571 | 25,139,928 | 4,658,537 | 32,600,522 | ||||||||||||
Target 2025 Fund | 7,456,663 | 15,835,434 | 8,434,027 | 37,630,549 | ||||||||||||
Target 2030 Fund | 13,067,359 | 33,293,575 | 8,854,370 | 53,161,712 | ||||||||||||
Target 2035 Fund | 5,613,342 | 15,806,349 | 3,810,711 | 27,806,203 | ||||||||||||
Target 2040 Fund | 10,673,051 | 30,356,656 | 5,969,583 | 48,427,730 | ||||||||||||
Target 2045 Fund | 3,024,677 | 10,355,033 | 909,574 | 16,554,531 | ||||||||||||
Target 2050 Fund | 4,871,843 | 17,429,561 | 5,500,890 | 34,354,462 | ||||||||||||
Target 2055 Fund | 839,254 | 2,008,124 | 0 | 4,724,436 | ||||||||||||
Target 2060 Fund | 443,733 | 505,426 | 2,189 | 534,294 | ||||||||||||
As of February 29, 2020, the components of distributable earnings on a tax basis were as follows:
| Undistributed ordinary income | Undistributed long-term gain | Unrealized gains (losses) | Capital loss carryforward | |||||||||||||
Target Today Fund | $ | 233,038 | $ | 475,182 | $ | 7,088,582 | $ | 0 | ||||||||
Target 2010 Fund | 211,086 | 468,500 | 19,572,669 | 0 | ||||||||||||
Target 2015 Fund | 268,644 | 735,076 | 11,399,999 | 0 | ||||||||||||
Target 2020 Fund | 1,395,790 | 3,620,615 | 41,802,089 | 0 | ||||||||||||
Target 2025 Fund | 1,235,341 | 3,670,396 | 20,379,303 | 0 | ||||||||||||
Target 2030 Fund | 2,363,104 | 6,592,604 | 39,817,769 | 0 | ||||||||||||
Target 2035 Fund | 838,536 | 3,333,842 | 13,504,648 | 0 | ||||||||||||
Target 2040 Fund | 1,445,492 | 6,871,980 | 24,783,639 | 0 | ||||||||||||
Target 2045 Fund | 211,407 | 2,046,419 | 4,987,159 | 0 | ||||||||||||
Target 2050 Fund | 857,019 | 3,719,878 | 11,202,014 | 0 | ||||||||||||
Target 2055 Fund | 45,592 | 0 | (686,416 | ) | (56,604 | ) | ||||||||||
Target 2060 Fund | 48,417 | 16,175 | 136,622 | 0 | ||||||||||||
Target Date Retirement Funds | 111
Table of Contents
Notes to financial statements
8. INDEMNIFICATION
Under the Trust’s organizational documents, the officers and Trustees have been granted certain indemnification rights against certain liabilities that may arise out of performance of their duties to the Trust. Additionally, in the normal course of business, the Trust may enter into contracts with service providers that contain a variety of indemnification clauses. The Trust’s maximum exposure under these arrangements is dependent on future claims that may be made against the Funds and, therefore, cannot be estimated.
9. NEW ACCOUNTING PRONOUNCEMENT
In August 2018, FASB issued Accounting Standards Update (“ASU”)No. 2018-13, Fair Value Measurement (Topic 820)Disclosure Framework—Changes to the Disclosure Requirements for Fair Value Measurement. ASU2018-13 updates the disclosure requirements for fair value measurements by modifying or removing certain disclosures and adding certain new disclosures. The amendments are effective for fiscal years, and interim periods within those fiscal years, beginning after December 15, 2019. Early adoption is permitted. Management has adopted the removal and modification of disclosures early, as permitted, and will adopt the additional new disclosures at the effective date.
10. SUBSEQUENT EVENT
On March 11, 2020, the World Health Organization announced that it had made the assessment that coronavirus disease 2019(“COVID-19”) is a pandemic. The impacts ofCOVID-19 is adversely affecting the entire global economy, individual companies and investment products, and the market in general. There is significant uncertainty around the extent and duration of business disruptions related toCOVID-19 and the impact may be short term or may last for an extended period of time. The risk of further spreading ofCOVID-19 has led to significant uncertainty and volatility in the financial markets and the value of the Funds and the securities in which the Funds invest have generally been adversely affected by impacts caused byCOVID-19.
112 | Target Date Retirement Funds
Table of Contents
Report of independent registered public accounting firm
To the Shareholders of the Funds and Board of Trustees
Wells Fargo Funds Trust:
Opinion on the Financial Statements
We have audited the accompanying statements of assets and liabilities of Wells Fargo Target Today Fund, Wells Fargo Target 2010 Fund, Wells Fargo Target 2015 Fund, Wells Fargo Target 2020 Fund, Wells Fargo Target 2025 Fund, Wells Fargo Target 2030 Fund, Wells Fargo Target 2035 Fund, Wells Fargo Target 2040 Fund, Wells Fargo Target 2045 Fund, Wells Fargo Target 2050 Fund, Wells Fargo Target 2055 Fund, and Wells Fargo Target 2060 Fund (collectively, the Funds), twelve of the funds constituting Wells Fargo Funds Trust, including the portfolios of investments, as of February 29, 2020, the related statements of operations for the year then ended, the statements of changes in net assets for each of the years in the two-year period then ended, and the related notes (collectively, the financial statements) and the financial highlights for each of the years or periods in the five-year period then ended. In our opinion, the financial statements and financial highlights present fairly, in all material- respects, the financial position of the Funds as of February 29, 2020, the results of their operations for the year then ended, the changes in their net assets for each of the years in the two-year period then ended, and the financial highlights for each of the years or periods in the five-year period then ended, in conformity with U.S. generally accepted accounting principles.
Basis for Opinion
These financial statements and financial highlights are the responsibility of the Funds’ management. Our responsibility is to express an opinion on these financial statements and financial highlights based on our audits. We are a public accounting firm registered with the Public Company Accounting Oversight Board (United States) (PCAOB) and are required to be independent with respect to the Funds in accordance with the U.S. federal securities laws and the applicable rules and regulations of the Securities and Exchange Commission and the PCAOB.
We conducted our audits in accordance with the standards of the PCAOB. Those standards require that we plan and perform the audit to obtain reasonable assurance about whether the financial statements and financial highlights are free of material misstatement, whether due to error or fraud. Our audits included performing procedures to assess the risks of material misstatement of the financial statements and financial highlights, whether due to error or fraud, and performing procedures that respond to those risks. Such procedures included examining, on a test basis, evidence regarding the amounts and disclosures in the financial statements and financial highlights. Such procedures also included confirmation of securities owned as of February 29, 2020, by correspondence with the transfer agent. Our audits also included evaluating the accounting principles used and significant estimates made by management, as well as evaluating the overall presentation of the financial statements and financial highlights. We believe that our audits provide a reasonable basis for our opinion.

We have not been able to determine the specific year that we began serving as the auditor of one or more Wells Fargo Funds investment companies; however we are aware that we have served as the auditor of one or more Wells Fargo Funds investment companies since at least 1955.
Boston, Massachusetts
April 28, 2020
Target Date Retirement Funds | 113
Table of Contents
TAX INFORMATION
For corporate shareholders, pursuant to Section 854 of the Internal Revenue Code, the percentage of ordinary income dividends qualifying for the corporate dividends-received deduction was as follows for the fiscal year ended February 29, 2020:
Dividends-received deduction | ||||
Target Today Fund | 12.52 | % | ||
Target 2010 Fund | 13.47 | |||
Target 2015 Fund | 14.21 | |||
Target 2020 Fund | 18.63 | |||
Target 2025 Fund | 20.48 | |||
Target 2030 Fund | 27.76 | |||
Target 2035 Fund | 33.67 | |||
Target 2040 Fund | 39.02 | |||
Target 2045 Fund | 42.16 | |||
Target 2050 Fund | 40.14 | |||
Target 2055 Fund | 43.99 | |||
Target 2060 Fund | 44.32 | |||
Pursuant to Section 852 of the Internal Revenue Code, the following amounts were designated as a 20% rate gain distribution for the fiscal year ended February 29, 2020:
20% rate gain distribution | ||||
Target Today Fund | $ | 483,987 | ||
Target 2010 Fund | 561,960 | |||
Target 2015 Fund | 1,805,871 | |||
Target 2020 Fund | 4,658,537 | |||
Target 2025 Fund | 8,434,027 | |||
Target 2030 Fund | 8,854,370 | |||
Target 2035 Fund | 3,810,711 | |||
Target 2040 Fund | 5,969,583 | |||
Target 2045 Fund | 909,574 | |||
Target 2050 Fund | 5,500,890 | |||
Target 2060 Fund | 2,189 | |||
114 | Target Date Retirement Funds
Table of Contents
Other information (unaudited)
Pursuant to Section 854 of the Internal Revenue Code, the following amounts of income dividends paid during the fiscal year ended February 29, 2020 have been designated as qualified dividend income (QDI):
| QDI | ||||
Target Today Fund | $ | 386,500 | ||
Target 2010 Fund | 382,770 | |||
Target 2015 Fund | 504,632 | |||
Target 2020 Fund | 3,238,642 | |||
Target 2025 Fund | 2,899,534 | |||
Target 2030 Fund | 7,049,093 | |||
Target 2035 Fund | 3,737,588 | |||
Target 2040 Fund | 8,304,205 | |||
Target 2045 Fund | 2,616,010 | |||
Target 2050 Fund | 3,970,807 | |||
Target 2055 Fund | 749,367 | |||
Target 2060 Fund | 392,161 | |||
For the fiscal year ended February 29, 2020, the following amounts have been designated as interest-related dividends for nonresident alien shareholders pursuant to Section 871 of the Internal Revenue Code:
Interest-related dividends | ||||
Target Today Fund | $ | 1,014,736 | ||
Target 2010 Fund | 915,884 | |||
Target 2015 Fund | 1,028,880 | |||
Target 2020 Fund | 4,841,354 | |||
Target 2025 Fund | 3,014,003 | |||
Target 2030 Fund | 4,651,071 | |||
Target 2035 Fund | 1,526,876 | |||
Target 2040 Fund | 2,140,704 | |||
Target 2045 Fund | 457,440 | |||
Target 2050 Fund | 614,117 | |||
Target 2055 Fund | 104,308 | |||
Target 2060 Fund | 55,770 | |||
Target Date Retirement Funds | 115
Table of Contents
Other information (unaudited)
For the fiscal year ended February 29, 2020, the following amounts have been designated as short-term capital gain dividends for nonresident alien shareholders pursuant to Section 871 of the Internal Revenue Code:
| Short-term capital gain dividends | ||||
Target Today Fund | $ | 71,713 | ||
Target 2010 Fund | 44,183 | |||
Target 2015 Fund | 141,783 | |||
Target 2020 Fund | 100,449 | |||
Target 2025 Fund | 741,468 | |||
Target 2030 Fund | 159,114 | |||
For the fiscal year ended February 29, 2020, the percentage of ordinary income distributed which was derived from interest on U.S. government securities was as follows:
% of U.S. government | ||||
Target Today Fund | 18.52 | % | ||
Target 2010 Fund | 18.38 | |||
Target 2015 Fund | 16.37 | |||
Target 2020 Fund | 15.51 | |||
Target 2025 Fund | 11.19 | |||
Target 2030 Fund | 9.38 | |||
Target 2035 Fund | 6.88 | |||
Target 2040 Fund | 4.88 | |||
Target 2045 Fund | 3.53 | |||
Target 2050 Fund | 2.76 | |||
Target 2055 Fund | 2.68 | |||
Target 2060 Fund | 2.81 | |||
PROXY VOTING INFORMATION
A description of the policies and procedures used to determine how to vote proxies relating to portfolio securities is available without charge, upon request, by calling1-800-222-8222, visiting our website atwfam.com, or visiting the SEC website at sec.gov. Information regarding how the proxies related to portfolio securities were voted during the most recent12-month period ended June 30 is available on the website atwfam.com or by visiting the SEC website at sec.gov.
QUARTERLY PORTFOLIO HOLDINGS INFORMATION
The Funds file their complete schedule of portfolio holdings with the SEC for the first and third quarters of each fiscal year as an exhibit to their reports on FormN-PORT. Shareholders may view the filed FormN-PORT by visiting the SEC website at sec.gov.
116 | Target Date Retirement Funds
Table of Contents
Other information (unaudited)
BOARD OF TRUSTEES AND OFFICERS
Each of the Trustees and Officers1 listed in the table below acts in identical capacities for each fund in the Wells Fargo family of funds, which consists of 146 mutual funds comprising the Wells Fargo Funds Trust, Wells Fargo Variable Trust, Wells Fargo Master Trust and fourclosed-end funds (collectively the “Fund Complex”). This table should be read in conjunction with the Prospectus and the Statement of Additional Information2. The mailing address of each Trustee and Officer is 525 Market Street, 12th Floor, San Francisco, CA 94105. Each Trustee and Officer serves an indefinite term, however, each Trustee serves such term until reaching the mandatory retirement age established by the Trustees.
Independent Trustees
Name and year of birth | Position held and length of service* | Principal occupations during past five years or longer | Current other public company or investment company directorships | |||
| William R. Ebsworth (Born 1957) | Trustee, since 2015 | Retired. From 1984 to 2013, equities analyst, portfolio manager, research director and chief investment officer at Fidelity Management and Research Company in Boston, Tokyo, and Hong Kong, and retired in 2013 as Chief Investment Officer of Fidelity Strategic Advisers, Inc. where he led a team of investment professionals managing client assets. Prior thereto, Board member of Hong Kong Securities Clearing Co., Hong Kong Options Clearing Corp., the Thailand International Fund, Ltd., Fidelity Investments Life Insurance Company, and Empire Fidelity Investments Life Insurance Company. Audit Committee Chair and Investment Committee Chair of the Vincent Memorial Hospital Endowment(non-profit organization). Mr. Ebsworth is a CFA® charterholder. | N/A | |||
| Jane A. Freeman (Born 1953) | Trustee, since 2015; Chair Liaison, since 2018 | Retired. From 2012 to 2014 and 1999 to 2008, Chief Financial Officer of Scientific Learning Corporation. From 2008 to 2012, Ms. Freeman provided consulting services related to strategic business projects. Prior to 1999, Portfolio Manager at Rockefeller & Co. and Scudder, Stevens & Clark. Board member of the Harding Loevner Funds from 1996 to 2014, serving as both Lead Independent Director and chair of the Audit Committee. Board member of the Russell Exchange Traded Funds Trust from 2011 to 2012 and the chair of the Audit Committee. Ms. Freeman is a Board Member of The Ruth Bancroft Garden(non-profit organization). She is also an inactive Chartered Financial Analyst. | N/A | |||
| Isaiah Harris, Jr. (Born 1952) | Trustee, since 2009; Audit Committee Chairman, since 2019 | Retired. Chairman of the Board of CIGNA Corporation since 2009, and Director since 2005. From 2003 to 2011, Director of Deluxe Corporation. Prior thereto, President and CEO of BellSouth Advertising and Publishing Corp. from 2005 to 2007, President and CEO of BellSouth Enterprises from 2004 to 2005 and President of BellSouth Consumer Services from 2000 to 2003. Emeritus member of the Iowa State University Foundation Board of Governors. Emeritus Member of the Advisory Board of Iowa State University School of Business. Advisory Board Member, Palm Harbor Academy (private school). Advisory Board Member, Child Evangelism Fellowship(non-profit). Mr. Harris is a certified public accountant (inactive status). | CIGNA Corporation | |||
| Judith M. Johnson (Born 1949) | Trustee, since 2008; Audit Committee Chairman, from 2009 to 2018 | Retired. Prior thereto, Chief Executive Officer and Chief Investment Officer of Minneapolis Employees Retirement Fund from 1996 to 2008. Ms. Johnson is an attorney, certified public accountant and a certified managerial accountant. | N/A | |||
Target Date Retirement Funds | 117
Table of Contents
Other information (unaudited)
Name and year of birth | Position held and length of service* | Principal occupations during past five years or longer | Current other public company or investment company directorships | |||
| David F. Larcker (Born 1950) | Trustee, since 2009 | James Irvin Miller Professor of Accounting at the Graduate School of Business, Stanford University, Director of the Corporate Governance Research Initiative and Senior Faculty of The Rock Center for Corporate Governance since 2006. From 2005 to 2008, Professor of Accounting at the Graduate School of Business, Stanford University. Prior thereto, Ernst & Young Professor of Accounting at The Wharton School, University of Pennsylvania from 1985 to 2005. | N/A | |||
| Olivia S. Mitchell (Born 1953) | Trustee, since 2006; Nominating and Governance Committee Chair, since 2018 | International Foundation of Employee Benefit Plans Professor, Wharton School of the University of Pennsylvania since 1993. Director of Wharton’s Pension Research Council and Boettner Center on Pensions & Retirement Research, and Research Associate at the National Bureau of Economic Research. Previously, Cornell University Professor from 1978 to 1993. | N/A | |||
| Timothy J. Penny (Born 1951) | Trustee, since 1996; Chairman, since 2018 | President and Chief Executive Officer of Southern Minnesota Initiative Foundation, anon-profit organization, since 2007. Member of the Board of Trustees of NorthStar Education Finance, Inc., anon-profit organization, since 2007. | N/A | |||
| James G. Polisson (Born 1959) | Trustee, since 2018 | Retired. Chief Marketing Officer, Source (ETF) UK Services, Ltd, from 2015 to 2017. From 2012 to 2015, Principal of The Polisson Group, LLC, a management consulting, corporate advisory and principal investing company. Chief Executive Officer and Managing Director at Russell Investments, Global Exchange Traded Funds from 2010 to 2012. Managing Director of Barclays Global Investors from 1998 to 2010 and Global Chief Marketing Officer for iShares and Barclays Global Investors from 2000 to 2010. Trustee of the San Francisco Mechanics’ Institute, anon-profit organization, from 2013 to 2015. Board member of the Russell Exchange Traded Fund Trust from 2011 to 2012. Director of Barclays Global Investors Holdings Deutschland GmbH from 2006 to 2009. Mr. Polisson is an attorney and has a retired status with the Massachusetts and District of Columbia Bar Associations. | N/A | |||
| Pamela Wheelock3(Born 1959) | Trustee, since January 2020; previously Trustee from January 2018 to July 2019 | Board member of the Destination Medical Center Economic Development Agency, Rochester, Minnesota since 2019. Acting Commissioner, Minnesota Department of Human Services, July 2019 through September 2019. Human Services Manager (part-time), Minnesota Department of Human Services, October 2019 through December 2019. Chief Operating Officer, Twin Cities Habitat for Humanity from 2017 to 2019. Vice President of University Services, University of Minnesota from 2012 to 2016. Prior thereto, on the Board of Directors, Governance Committee and Finance Committee for the Minnesota Philanthropy Partners (Saint Paul Foundation) from 2012 to 2018, Interim Chief Executive Officer of Blue Cross Blue Shield of Minnesota from 2011 to 2012, Chairman of the Board from 2009 to 2012 and Board Director from 2003 to 2015. Vice President, Leadership and Community Engagement, Bush Foundation, Saint Paul, Minnesota (a private foundation) from 2009 to 2011. Executive Vice President and Chief Financial Officer, Minnesota Sports and Entertainment from 2004 to 2009 and Senior Vice President from 2002 to 2004. Executive Vice President of the Minnesota Wild Foundation from 2004 to 2008. Commissioner of Finance, State of Minnesota, from 1999 to 2002. Currently Board Chair of the Minnesota Wild Foundation since 2010. | N/A | |||
| * | Length of service dates reflect the Trustee’s commencement of service with the Trust’s predecessor entities, where applicable. |
118 | Target Date Retirement Funds
Table of Contents
Other information (unaudited)
Officers
Name and year of birth | Position held and length of service | Principal occupations during past five years or longer | ||
Andrew Owen (Born 1960) | President, since 2017 | Executive Vice President of Wells Fargo & Company and Head of Affiliated Managers, Wells Fargo Asset Management, since 2014. In addition, Mr. Owen is currently President, Chief Executive Officer and Director of Wells Fargo Funds Management, LLC since 2017. Prior thereto, Executive Vice President responsible for marketing, investments and product development for Wells Fargo Funds Management, LLC, from 2009 to 2014. | ||
| Jeremy DePalma1(Born 1974) | Treasurer, since 2012 | Senior Vice President of Wells Fargo Funds Management, LLC since 2009. Senior Vice President of Evergreen Investment Management Company, LLC from 2008 to 2010 and head of the Fund Reporting and Control Team within Fund Administration from 2005 to 2010. | ||
Michelle Rhee (Born 1966) | Chief Legal Officer, since 2019 | Secretary of Wells Fargo Funds Management, LLC, Chief Legal Counsel of Wells Fargo Asset Management and Assistant General Counsel of Wells Fargo Bank, N.A. since 2018. Associate General Counsel and Managing Director of Bank of America Corporation from 2004 to 2018. | ||
| Catherine Kennedy (Born 1969) | Secretary, since 2019 | Vice President of Wells Fargo Funds Management, LLC and Senior Counsel of the Wells Fargo Legal Department since 2010. Vice President and Senior Counsel of Evergreen Investment Management Company, LLC from 1998 to 2010. | ||
| Michael H. Whitaker(Born 1967) | Chief Compliance Officer, since 2016 | Chief Compliance Officer of Wells Fargo Asset Management since 2016. Senior Vice President and Chief Compliance Officer for Fidelity Investments from 2007 to 2016. | ||
David Berardi (Born 1975) | Assistant Treasurer, since 2009 | Vice President of Wells Fargo Funds Management, LLC since 2009. Vice President of Evergreen Investment Management Company, LLC from 2008 to 2010. Manager of Fund Reporting and Control for Evergreen Investment Management Company, LLC from 2004 to 2010. | ||
| 1 | Jeremy DePalma acts as Treasurer of 82 funds and Assistant Treasurer of 64 funds in the Fund Complex. |
| 2 | The Statement of Additional Information includes additional information about the Trustees and is available, without charge, upon request, by calling1-800-222-8222 or by visiting the website atwfam.com. |
| 3 | Pamela Wheelock wasre-appointed to the Board effective January 1, 2020. |
Target Date Retirement Funds | 119
Table of Contents
On February 29, 2020, the Wells Fargo Target Blended Indexes were composed of the following indexes:
| Wells Fargo Target Today Blended Index | Wells Fargo Target 2010 Blended Index | Wells Fargo Target 2015 Blended Index | ||||||||||
Bloomberg Barclays U.S. Aggregateex-Corporate Index | 34.50 | % | 34.00 | % | 31.55 | % | ||||||
Bloomberg Barclays U.S. Government Intermediate Bond Index | 5.83 | % | 5.75 | % | 5.33 | % | ||||||
Bloomberg Barclays U.S. Treasury Inflation Notes:1-10 Year Index | 5.83 | % | 5.75 | % | 5.33 | % | ||||||
JP Morgan EMBI Global Diversified Index | 2.94 | % | 2.90 | % | 2.69 | % | ||||||
Wells Fargo Factor Enhanced Emerging Markets Index (Net) | 2.22 | % | 2.29 | % | 2.66 | % | ||||||
Wells Fargo Factor Enhanced International Index (Net) | 7.41 | % | 7.66 | % | 8.89 | % | ||||||
Wells Fargo Factor Enhanced Large Cap Index | 14.31 | % | 14.79 | % | 17.17 | % | ||||||
Wells Fargo Factor Enhanced Small Cap Index | 3.57 | % | 3.69 | % | 4.28 | % | ||||||
Wells Fargo U.S. High Yield Bond Index | 2.94 | % | 2.90 | % | 2.69 | % | ||||||
Wells Fargo U.S. Investment Grade Corporate Bond Index | 17.95 | % | 17.69 | % | 16.41 | % | ||||||
Wells Fargo U.S. REIT Index | 2.50 | % | 2.58 | % | 3.00 | % | ||||||
Average annual total returns (%) as of February 29, 2020
| 1 year | 5 year | 10 year | ||||||||||
Bloomberg Barclays U.S. Aggregateex-Corporate Index1* | 10.34 | – | – | |||||||||
Bloomberg Barclays U.S. Government Intermediate Bond Index2 | 8.05 | 2.46 | 2.52 | |||||||||
Bloomberg Barclays U.S. Treasury Inflation Notes:1-10 Year Index3 | 7.86 | 2.48 | 2.70 | |||||||||
JP Morgan EMBI Global Diversified Index4 | 9.68 | 5.98 | 6.78 | |||||||||
Wells Fargo Factor Enhanced Emerging Markets Index (Net)5** | (6.74 | ) | – | – | ||||||||
Wells Fargo Factor Enhanced International Index (Net)6** | 0.57 | – | – | |||||||||
Wells Fargo Factor Enhanced Large Cap Index7** | 3.85 | – | – | |||||||||
Wells Fargo Factor Enhanced Small Cap Index8** | (5.66 | ) | – | – | ||||||||
Wells Fargo U.S. High Yield Bond Index9** | 5.02 | – | – | |||||||||
Wells Fargo U.S. Investment Grade Corporate Bond Index10** | 15.67 | – | – | |||||||||
Wells Fargo U.S. REIT Index11*** | 2.85 | – | – | |||||||||
| * | The inception date of the index is December 2015. |
| ** | The inception date of the index is April 2017. |
| *** | The inception date is March 2017. |
| 1 | The Bloomberg Barclays U.S. Aggregateex-Corporate Index is a broad-based benchmark that includes Treasuries, government-related securities, mortgage-backed securities (agency fixed-rate and hybrid adjustable-rate mortgage pass-throughs), asset-backed securities and commercial mortgage-backed securities (agency andnon-agency). You cannot invest directly in an index. |
| 2 | The Bloomberg Barclays U.S. Government Intermediate Bond Index is an unmanaged index composed of U.S. government securities with maturities in the1- to10-year range, including securities issued by the U.S. Treasury and U.S. government agencies. You cannot invest directly in an index. |
| 3 | Bloomberg Barclays U.S. Treasury Inflation Notes:1-10 Year Index measures the performance of the U.S. Treasury Inflation Protected Securities (TIPS) market with maturities more than 1 year and less than 10 years. Federal Reserve holdings of U.S. TIPS are not index eligible and are excluded from the face amount outstanding of each bond in the index. You cannot invest directly in an index. |
| 4 | The JP Morgan Emerging Markets Bond Index (“EMBI”) Global Diversified Index is a composite index representing an unleveraged investment in emerging market bonds that is broadly based across the spectrum of emerging market bonds and includes reinvestment of income (to represent real assets). You cannot invest directly in an index. |
| 5 | The Wells Fargo Factor Enhanced Emerging Markets Index (Net) is an index of equity securities that is derived from a universe of companies domiciled in various emerging markets countries and that possess, in aggregate, diversified exposure to investment factors (or characteristics) that are commonly tied to a stock’s potential for enhanced risk-adjusted returns relative to the market. You cannot invest directly in an index. |
120 | Target Date Retirement Funds
Table of Contents
Appendix I (unaudited)
| Wells Fargo Target 2020 Blended Index | Wells Fargo Target 2025 Blended Index | Wells Fargo Target 2030 Blended Index | Wells Fargo Target 2035 Blended Index | Wells Fargo Target 2040 Blended Index | Wells Fargo Target 2045 Blended Index | Wells Fargo Target 2050 Blended Index | Wells Fargo Target 2055 Blended Index | Wells Fargo Target 2060 Blended Index | |||||||||||||||||||||||||||||||||||
| 28.97 | % | 25.90 | % | 21.86 | % | 16.58 | % | 11.24 | % | 8.29 | % | 5.92 | % | 5.92 | % | 5.92 | % | ||||||||||||||||||||||||||
| 4.50 | % | 2.13 | % | 0.53 | % | 0.00 | % | 0.00 | % | 0.00 | % | 0.00 | % | 0.00 | % | 0.00 | % | ||||||||||||||||||||||||||
| 4.50 | % | 2.13 | % | 0.53 | % | 0.00 | % | 0.00 | % | 0.00 | % | 0.00 | % | 0.00 | % | 0.00 | % | ||||||||||||||||||||||||||
| 2.47 | % | 2.18 | % | 1.84 | % | 1.40 | % | 0.95 | % | 0.70 | % | 0.50 | % | 0.50 | % | 0.50 | % | ||||||||||||||||||||||||||
| 3.16 | % | 4.17 | % | 5.25 | % | 6.31 | % | 7.31 | % | 7.84 | % | 8.28 | % | 8.28 | % | 8.28 | % | ||||||||||||||||||||||||||
| 10.53 | % | 13.88 | % | 17.54 | % | 21.21 | % | 24.37 | % | 26.22 | % | 27.72 | % | 27.72 | % | 27.72 | % | ||||||||||||||||||||||||||
| 20.12 | % | 25.39 | % | 30.74 | % | 35.58 | % | 39.46 | % | 41.55 | % | 43.20 | % | 43.20 | % | 43.20 | % | ||||||||||||||||||||||||||
| 5.03 | % | 6.37 | % | 7.69 | % | 8.90 | % | 9.87 | % | 10.39 | % | 10.80 | % | 10.80 | % | 10.80 | % | ||||||||||||||||||||||||||
| 2.47 | % | 2.18 | % | 1.84 | % | 1.40 | % | 0.95 | % | 0.70 | % | 0.50 | % | 0.50 | % | 0.50 | % | ||||||||||||||||||||||||||
| 15.08 | % | 13.47 | % | 11.38 | % | 8.62 | % | 5.85 | % | 4.31 | % | 3.08 | % | 3.08 | % | 3.08 | % | ||||||||||||||||||||||||||
| 3.17 | % | 2.20 | % | 0.80 | % | 0.00 | % | 0.00 | % | 0.00 | % | 0.00 | % | 0.00 | % | 0.00 | % | ||||||||||||||||||||||||||
| 6 | The Wells Fargo Factor Enhanced International Index (Net) is an index of equity securities that is derived from a universe of companies domiciled in various developed markets outside the U.S. and that possess, in aggregate, diversified exposure to investment factors (or characteristics) that are commonly tied to a stock’s potential for enhanced risk-adjusted returns relative to the market. You cannot invest directly in an index. |
| 7 | The Wells Fargo Factor Enhanced Large Cap Index is an index of equity securities that is derived from a universe of the largest 1,000 companies in the U.S. market and that possess, in aggregate, diversified exposure to investment factors (or characteristics) that are commonly tied to a stock’s potential for enhanced risk-adjusted returns relative to the market. You cannot invest directly in an index. |
| 8 | The Wells Fargo Factor Enhanced Small Cap Index is an index of equity securities that is derived from a universe of the smallest 2,000 companies in the U.S. market and that possess, in aggregate, diversified exposure to investment factors (or characteristics) that are commonly tied to a stock’s potential for enhanced risk-adjusted returns relative to the market. You cannot invest directly in an index. |
| 9 | The Wells Fargo U.S. High Yield Bond Index is a rules-based index designed to measure the performance of U.S. dollar-denominated below investment-grade corporate debt issued by U.S. or foreign issuers that have a remaining maturity of at least one year, regardless of optionality; it is constructed to provide increased diversification and liquidity versus traditional passive high yield bond indexes. You cannot invest directly in an index. |
| 10 | The Wells Fargo U.S. Investment Grade Corporate Bond Index is a rules-based index designed to measure the performance of publicly issued U.S. dollar-denominated investment grade, fixed rate corporate bonds issued by U.S. or foreign issuers that have a remaining maturity of at least one year, regardless of optionality; it is constructed to provide increased diversification and liquidity versus traditional passive corporate credit indexes. You cannot invest directly in an index. |
| 11 | The Wells Fargo U.S. REIT Index is a float-adjusted, capitalization-weighted index of all applicable NYSE MKT or NASDAQ-listed classes of REIT stock that satisfy specified market capitalization and other eligibility requirements. You cannot invest directly in an index. |
Target Date Retirement Funds | 121
Table of Contents
Effective on or about May 1, 2020, if you purchase Fund shares through a Janney Montgomery Scott LLC (“Janney”) brokerage account, you will be eligible for the following load waivers (front-end sales charge waivers and contingent deferred sales charge (“CDSC”), or back-end sales charge, waivers) and discounts, which may differ from those disclosed elsewhere in the Fund’s Prospectus or SAI.
| Front-end sales charge* waivers on Class A shares available at Janney |
| Shares purchased through reinvestment of capital gains distributions and dividend reinvestment when purchasing shares of the same fund (but not any other fund within the fund family). |
| Shares purchased by employees and registered representatives of Janney or its affiliates and their family members as designated by Janney. |
| Shares purchased from the proceeds of redemptions within the same fund family, provided (1) the repurchase occurs within ninety (90) days following the redemption, (2) the redemption and purchase occur in the same account, and (3) redeemed shares were subject to a front-end or deferred sales load (i.e., right of reinstatement). |
| Employer-sponsored retirement plans (e.g., 401(k) plans, 457 plans, employer-sponsored 403(b) plans, profit sharing and money purchase pension plans and defined benefit plans). For purposes of this provision, employer-sponsored retirement plans do not include SEP IRAs, Simple IRAs, SAR-SEPs or Keogh plans. |
| Shares acquired through a right of reinstatement. |
Class C shares that are no longer subject to a contingent deferred sales charge and are converted to Class A shares of the same fund pursuant to Janney’s policies and procedures.
|
| CDSC waivers on Class A and Class C shares available at Janney |
| Shares sold upon the death or disability of the shareholder. |
| Shares sold as part of a systematic withdrawal plan as described in the Fund’s Prospectus. |
| Shares purchased in connection with a return of excess contributions from an IRA account. |
| Shares sold as part of a required minimum distribution for IRA and retirement accounts if the redemption is taken in or after the year the shareholder reaches qualified age based on applicable IRS regulations. |
| Shares sold to pay Janney fees but only if the transaction is initiated by Janney. |
| Shares acquired through a right of reinstatement. |
Shares exchanged into the same share class of a different fund.
|
| Front-end sales charge* discounts available at Janney; breakpoints, rights of accumulation and/or letters of intent |
| Breakpoints as described in the Fund’s Prospectus. |
| Rights of accumulation (“ROA”), which entitle shareholders to breakpoint discounts, will be automatically calculated based on the aggregated holding of fund family assets held by accounts within the purchaser’s household at Janney. Eligible fund family assets not held at Janney may be included in the ROA calculation only if the shareholder notifies his or her financial advisor about such assets. |
| Letters of intent which allow for breakpoint discounts based on anticipated purchases within a fund family, over a 13-month time period. Eligible fund family assets not held at Janney Montgomery Scott may be included in the calculation of letters of intent only if the shareholder notifies his or her financial advisor about such assets. |
| * | Also referred to as an “initial sales charge.” |
122 | Target Date Retirement Funds
Table of Contents
Effective on or after May 1, 2020, clients of Edward Jones (also referred to as “shareholders”) purchasing Fund shares on the Edward Jones commission andfee-based platforms are eligible only for the following sales charge discounts (also referred to as “breakpoints”) and waivers, which can differ from breakpoints and waivers described elsewhere in this Prospectus or SAI or through another broker-dealer. In all instances, it is the shareholder’s responsibility to inform Edward Jones at the time of purchase of any relationship, holdings of Wells Fargo Funds or other facts qualifying the purchaser for breakpoints or waivers. Edward Jones can ask for documentation of such circumstance.
Breakpoints available at Edward Jones |
| Rights of Accumulation (ROA) |
The applicable sales charge on a purchase of Class A shares is determined by taking into account all share classes (except any money market funds and retirement plan share classes) of Wells Fargo Funds held by the shareholder or in an account grouped by Edward Jones with other accounts for the purpose of providing certain pricing considerations (“pricing groups”). This includes all share classes held on the Edward Jones platform and/or held on another platform. The inclusion of eligible fund family assets in the rights of accumulation calculation is dependent on the shareholder notifying his or her financial advisor of such assets at the time of calculation. |
ROA is determined by calculating the higher of cost or market value (current shares x NAV). |
| Letter of Intent (LOI) |
Through a LOI, shareholders can receive the sales charge and breakpoint discounts for purchases shareholders intend to makeover a13-month period from the date Edward Jones receives the LOI. The LOI is determined by calculating the higher of cost or market value of qualifying holdings at LOI initiation in combination with the value that the shareholder intends to buy over a13-month period to calculate thefront-end sales charge and any breakpoint discounts. Each purchase the shareholder makes during that13-month period will receive the sales charge and breakpoint discount that applies to the total amount. The inclusion of eligible fund family assets in the LOI calculation is dependent on the shareholder notifying his or her financial advisor of such assets at the time of calculation. Purchases made before the LOI is received by Edward Jones are not covered under the LOI and will not reduce the sales charge previously paid. Sales charges will be adjusted if LOI is not met.
|
| Sales charges are waived for the following shareholders and in the following situations at Edward Jones: |
● Associates of Edward Jones and its affiliates and their family members who are in the same pricing group (as determined by Edward Jones under its policies and procedures) as the associate. This waiver will continue for the remainder of the associate’s life if the associate retires from Edward Jones in good-standing. |
● Shares purchased in an Edward Jonesfee-based program. |
● Shares purchased through reinvestment of capital gains distributions and dividend reinvestment. |
● Shares purchased from the proceeds of redeemed shares of the same fund family so long as the following conditions are met: 1)the proceeds are from the sale of shares within 60 days of the purchase, and 2) the sale and purchase are made in the same share class and the same account or the purchase is made in an individual retirement account with proceeds from liquidations in anon-retirement account. |
● Shares exchanged into Class A shares from another share class so long as the exchange is into the same fund and was initiated at the discretion of Edward Jones. Edward Jones is responsible for any remaining CDSC due to the fund company, if applicable. Any future purchases are subject to the applicable sales charge as disclosed in the prospectus. |
● Exchanges from Class C shares to Class A shares of the same fund, generally, in the 84th month following the anniversary of the purchase date or earlier at the discretion of Edward Jones.
|
| If the shareholder purchases shares that are subject to a CDSC and those shares are redeemed before the CDSC is expired, the shareholder is responsible to pay the CDSC except in the following conditions available at Edward Jones: |
● The death or disability of the shareholder. |
● Systematic withdrawals with up to 10% per year of the account value. |
● Return of excess contributions from an Individual Retirement Account (IRA). |
● Shares sold as part of a required minimum distribution for IRA and retirement accounts if the redemption is taken in or after the year the shareholder reaches qualified age based on applicable IRS regulation. |
● Shares sold to pay Edward Jones fees or costs in such cases where the transaction is initiated by Edward Jones. |
● Shares exchanged in an Edward Jonesfee-based program. |
● Shares acquired through NAV reinstatement. |
Target Date Retirement Funds | 123
Table of Contents
Appendix III (unaudited)
| Other Important Information for accounts at Edward Jones: |
Minimum Purchase Amounts ● $250 initial purchase minimum ● $50 subsequent purchase minimum |
Minimum Balances Edward Jones has the right to redeem at its discretion fund holdings with a balance of $250 or less. The following are examples of accounts that are not included in this policy: ● Afee-based account held on an Edward Jones platform ● A 529 account held on an Edward Jones platform ● An account with an active systematic investment plan or letter of intent (LOI) |
Changing Share Classes At any time it deems necessary, Edward Jones has the authority to exchange at NAV a shareholder’s holdings in a fund to Class A shares. |
124 | Target Date Retirement Funds
Table of Contents
This page is intentionally left blank.
Table of Contents
This page is intentionally left blank.
Table of Contents
This page is intentionally left blank.
Table of Contents
This page is intentionally left blank.
Table of Contents
For more information
More information about Wells Fargo Funds is available free upon request. To obtain literature, please write, visit the Funds’ website, or call:
Wells Fargo Funds
P.O. Box 219967
Kansas City, MO 64121-9967
Website:wfam.com
Individual investors:1-800-222-8222
Retail investment professionals:1-888-877-9275
Institutional investment professionals:1-866-765-0778

This report and the financial statements contained herein are submitted for the general information of the shareholders of Wells Fargo Funds. If this report is used for promotional purposes, distribution of the report must be accompanied or preceded by a current prospectus. Before investing, please consider the investment objectives, risks, charges, and expenses of the investment. For a current prospectus and, if available, a summary prospectus, containing this information, call1-800-222-8222 or visit the Funds’ website atwfam.com. Read the prospectus carefully before you invest or send money.
Wells Fargo Asset Management (WFAM) is the trade name for certain investment advisory/management firms owned by Wells Fargo & Company. These firms include but are not limited to Wells Capital Management Incorporated and Wells Fargo Funds Management, LLC. Certain products managed by WFAM entities are distributed by Wells Fargo Funds Distributor, LLC (a broker-dealer and Member FINRA).
This material is for general informational and educational purposes only and is NOT intended to provide investment advice or a recommendation of any kind—including a recommendation for any specific investment, strategy, or plan.
INVESTMENT PRODUCTS: NOT FDIC INSURED ◾ NO BANK GUARANTEE ◾ MAY LOSE VALUE
© 2020 Wells Fargo & Company. All rights reserved
PAR-0220-04675 04-20
AOUTLD/AR003 02-20
Table of Contents

Annual Report
February 29, 2020
Target Date Retirement Funds
| ∎ | Wells Fargo Dynamic Target Today Fund |
| ∎ | Wells Fargo Dynamic Target 2015 Fund |
| ∎ | Wells Fargo Dynamic Target 2020 Fund |
| ∎ | Wells Fargo Dynamic Target 2025 Fund |
| ∎ | Wells Fargo Dynamic Target 2030 Fund |
| ∎ | Wells Fargo Dynamic Target 2035 Fund |
| ∎ | Wells Fargo Dynamic Target 2040 Fund |
| ∎ | Wells Fargo Dynamic Target 2045 Fund |
| ∎ | Wells Fargo Dynamic Target 2050 Fund |
| ∎ | Wells Fargo Dynamic Target 2055 Fund |
| ∎ | Wells Fargo Dynamic Target 2060 Fund |
Beginning on January 1, 2021, as permitted by new regulations adopted by the Securities and Exchange Commission, paper copies of the Wells Fargo Funds’ annual and semi-annual shareholder reports issued after this date will no longer be sent by mail, unless you specifically request paper copies of the reports. Instead, the reports will be made available on the Funds’ website, and you will be notified by mail each time a report is posted and provided with a website address to access the report.
If you already elected to receive shareholder reports electronically, you will not be affected by this change and you need not take any action. You may elect to receive shareholder reports and other communications from the Fund electronically at any time by contacting your financial intermediary (such as a broker-dealer or bank) or, if you are a direct investor, by calling1-800-222-8222 or by enrolling at wellsfargo.com/advantagedelivery.
You may elect to receive all future reports in paper free of charge. If you invest through a financial intermediary, you can contact your financial intermediary to request that you continue to receive paper copies of your shareholder reports; if you invest directly with the Fund, you can call 1-800-222-8222. Your election to receive reports in paper will apply to all Wells Fargo Funds held in your account with your financial intermediary or, if you are a direct investor, to all Wells Fargo Funds that you hold.
Table of Contents
|
Reduce clutter. Save trees. |
Sign up for electronic delivery of prospectuses and shareholder reports at wellsfargo.com/ advantagedelivery |
The views expressed and any forward-looking statements are as of February 29, 2020, unless otherwise noted, and are those of the Fund managers and/or Wells Fargo Asset Management. Discussions of individual securities, or the markets generally, or any Wells Fargo Fund are not intended as individual recommendations. Future events or results may vary significantly from those expressed in any forward-looking statements. The views expressed are subject to change at any time in response to changing circumstances in the market. Wells Fargo Asset Management and the Fund disclaim any obligation to publicly update or revise any views expressed or forward-looking statements.
INVESTMENT PRODUCTS: NOT FDIC INSURED ◾ NO BANK GUARANTEE ◾ MAY LOSE VALUE
Target Date Retirement Funds | 1
Table of Contents
Letter to shareholders (unaudited)

Andrew Owen
President
Wells Fargo Funds
Dear Shareholder:
We are pleased to offer you this annual report for the Wells Fargo Dynamic Target Date Funds for the12-month period that ended February 29, 2020. Despite periods of market volatility, particularly at the end of the reporting period in February and with the onset of the coronavirus, returns were positive overall for financial markets as supportive central banks addressed concerns over slowing global economic growth and international trade tensions.
Fixed-income and equity investors had mixed annual returns, as U.S. markets led the way, with much stronger annual returns thannon-U.S. markets, among both equities and fixed-income investments. For the period, U.S. stocks, based on the S&P 500 Index,1 gained 8.19% and international stocks, as measured by the MSCI ACWI ex USA Index (Net),2 returned-0.69%. The MSCI EM Index (Net)3 trailed, with a-1.88% return. For bond investors, the Bloomberg Barclays U.S. Aggregate Bond Index4 added a healthy 11.68%, the Bloomberg Barclays Global Aggregateex-USD Index5 gained a more modest 4.83%, the Bloomberg Barclays Municipal Bond Index6 returned 9.46%, and the ICE BofA U.S. High Yield Index7 added 5.91%.
The year began on a strong note but enthusiasm faded.
Financial markets began the period with a tailwind from an increase in central bank supportive actions in response to slowing global growth and ongoing U.S.-China trade issues. By the end of the first quarter of 2019, more accommodative U.S. Federal Reserve (Fed) sentiment and steady U.S. economic and business metrics encouraged domestic investors.
During April, sustained low inflation, solid employment data, and first-quarter U.S. gross domestic product (GDP) of an annualized rate of 3.2% supported favorable sentiment. During May, however, markets tumbled on mixed investment signals. In the U.S., partisan political wrangling ramped up in advance of the 2020 election. The U.K.’s Brexit disagreements caused Prime Minister Theresa May to resign. Boris Johnson succeeded her, only to add to uncertainty about Brexit’s resolution ahead of an October 2019 deadline. The European Commission downgraded the 2019 growth forecast to 1.2%. The U.S. increased tariffs on products from China, China responded, and then talks broke down. President Donald Trump threatened to turn his foreign policy tariff tool to Mexico over immigration issues.
| 1 | The S&P 500 Index consists of 500 stocks chosen for market size, liquidity, and industry group representation. It is a market-value-weighted index with each stock’s weight in the index proportionate to its market value. You cannot invest directly in an index. |
| 2 | The Morgan Stanley Capital International (MSCI) All Country World Index (ACWI) ex USA Index (Net) is a free-float-adjusted market-capitalization-weighted index that is designed to measure the equity market performance of developed markets, excluding the United States. Source: MSCI. MSCI makes no express or implied warranties or representations and shall have no liability whatsoever with respect to any MSCI data contained herein. The MSCI data may not be further redistributed or used as a basis for other indices or any securities or financial products. This report is not approved, reviewed, or produced by MSCI. You cannot invest directly in an index. |
| 3 | The MSCI Emerging Markets (EM) Index (Net) is a free-float-adjusted market-capitalization-weighted index that is designed to measure equity market performance of emerging markets. You cannot invest directly in an index. |
| 4 | The Bloomberg Barclays U.S. Aggregate Bond Index is a broad-based benchmark that measures the investment-grade, U.S. dollar-denominated, fixed-rate taxable bond market, including Treasuries, government-related and corporate securities, mortgage-backed securities (agency fixed-rate and hybrid adjustable-rate mortgage pass-throughs), asset-backed securities, and commercial mortgage backed securities. You cannot invest directly in an index. |
| 5 | The Bloomberg Barclays Global Aggregateex-USD Index is an unmanaged index that provides a broad-based measure of the global investment-grade fixed-income markets excluding the U.S. dollar-denominated debt market. You cannot invest directly in an index. |
| 6 | The Bloomberg Barclays Municipal Bond Index is an unmanaged index composed of long-termtax-exempt bonds with a minimum credit rating of Baa. You cannot invest directly in an index. |
| 7 | The ICE BofA U.S. High Yield Index is a market-capitalization-weighted index of domestic and Yankee high-yield bonds. The index tracks the performance of high-yield securities traded in the U.S. bond market. You cannot invest directly in an index. Copyright 2020. ICE Data Indices, LLC. All rights reserved. |
2 | Target Date Retirement Funds
Table of Contents
Letter to shareholders (unaudited)
Midway through the year, investors regrouped, sentiment turned positive, and U.S. equity markets advanced during June and July. The gains, primarily driven by geopolitical and monetary policy events, pushed equity markets to new highs. European Central Bank President Mario Draghi indicated the bank was ready to cut rates or buy more assets to prop up inflation if needed. President Trump backed off of tariff threats against Mexico and China. In the U.S., the Fed implemented a 0.25% federal funds rate cut in July.
Later in July, the U.S. reversed course and threatened to impose higher tariffs on China’s exports after talks failed. China responded with tariff threats of its own and devalued the renminbi, roiling global markets. Major U.S. stock market indices closed July with the worst weekly results of the year. Bond prices gained as Treasury yields fell to multiyear lows, and the yield curve inverted at multiple points along the30-year arc.
In August, U.S.-China trade tensions continued with no signs of compromise. Evidence of a continued global economic slowdown mounted, and central banks in China, New Zealand, and Thailand cut interest rates. Industrial and manufacturing data declined in China, Canada, Japan, and Germany. Adding to global uncertainty, Italy’s prime minister resigned, many feared a crackdown in Hong Kong as protestors sustained their calls for reform, and Boris Johnson planned to suspend Parliament as Brexit’s deadline neared.
In the U.S., the Fed cut interest rates a second time in September. U.S. manufacturing data disappointed investors. The U.S. Congress announced it would pursue an impeachment investigation of President Trump. Meanwhile, the Brexit impasse showed no signs of resolution. Officials in China said that hitting the country’s economic growth goals for the year would be difficult considering the weight of tariffs and trade restrictions. Although the S&P 500 Index finished the third quarter with the bestyear-to-date returns in more than 20 years, concerns about future returns remained.
The fourth quarter started on a strong note, with U.S.-China trade tensions relaxing in October along with renewed optimism for a U.K. Brexit deal and positive macroeconomic data. The initial estimate of U.S. third-quarter GDP growth was a resilient 1.9% annualized rate, while the U.S. unemployment rate fell to a50-year low of 3.5% in September. However, despite resilience among U.S. consumers, business confidence declined while manufacturing activity contracted. Concerned with a potential economic slowdown, the Fed lowered interest rates another quarter point in late October—its third rate cut in four months. This helped push the S&P 500 Index to a newall-time high while emerging market equities rallied and global bonds declined overall, reflecting a broad pickup in risk appetite.
Equity markets continued to rally in November despite ongoing geopolitical risks. Hopes for a U.S.-China trade deal buoyed investor confidence. U.S. business sentiment improved slightly, and manufacturing and services activity picked up. With that positive backdrop, developed market equities outpaced those in emerging markets, and U.S. stocks, as reflected by the S&P 500 Index, outperformednon-U.S. stocks overall. While consumer confidence and purchasing manager activity rose in the eurozone, China reported weakening manufacturing and consumer data. Bond yields rose marginally, leading to slightly negative returns for global government and investment-grade corporate bonds.
Financial markets ended 2019 with a boost from the U.S. and China accord on a Phase One trade deal. That, along with the landslide win by thepro-Brexit U.K. Conservative Party in a national election and ongoing central bank support, gave investors greater confidence. U.S. economic indicators were generally positive, with the exception of manufacturing activity and business confidence. Consumer confidence was resilient, fed by a robust labor market, tame inflation, and lower interest rates, which boosted housing affordability and stimulated homebuyer activity. The impeachment of U.S. President Donald Trump had little impact on markets. Meanwhile, slowing Chinese economic activity, partly attributable to the trade war, led to further government stimulus atyear-end through lower reserve ratios, allowing banks to lend more money.
“Midway through the year, investors regrouped, sentiment turned positive, and U.S. equity markets advanced.”
Target Date Retirement Funds | 3
Table of Contents
Letter to shareholders (unaudited)
“Capital market volatility picked up sharply in late January on concerns over the unknown impact of the coronavirus on the global economy and stock markets.”
|
For further information about your Fund, contact your investment professional, visit our website at wfam.com, or call us directly at1-800-222-8222. |
Theyear-end rally continued in early January 2020. However, capital market volatility picked up sharply in late January on concerns over the unknown impact of the coronavirus on the global economy and stock markets. With sentiment somewhat souring, perceived safe havens did well in January. The U.S. dollar and Japanese yen both rose and government bonds outperformed equities. While the S&P 500 Index held its ground, emerging market equities tumbled, including those in Asia, that are most exposed to viruses—physical or economic—originating in China.
In February, the coronavirus became the major market focus. Fears of the virus’s impact on global growth led to expectations of increased global central bank monetary policy support. That led the10-year Treasury yield to fall to anall-time low of 1.1% by the end of the month. Although equity markets initially shrugged off concerns about the outbreak, focusing instead on strong fourth-quarter earnings and improving business confidence in January, market sentiment turned sharply lower towardmonth-end and the S&P 500 Index lost 8.2% for the month. Oil prices tumbled as Russia and the Organization of the Petroleum Exporting Countries compounded a major decline in oil demand with a brutal price war, partly aimed at dissuading further U.S. shale production. As a result, the price of West Texas Intermediate crude oil fell 13% in February and 27% for 2020 year to date.
Don’t let short-term uncertainty derail long-term investment goals.
Periods of investment uncertainty can present challenges, but experience has taught us that maintaining long-term investment goals can be an effective way to plan for the future. To help you create a sound strategy based on your personal goals and risk tolerance, Wells Fargo Funds offers more than 100 mutual funds spanning a wide range of asset classes and investment styles. Although diversification cannot guarantee an investment profit or prevent losses, we believe it can be an effective way to manage investment risk and potentially smooth out overall portfolio performance. We encourage investors to know their investments and to understand that appropriate levels of risk-taking may unlock opportunities.
Thank you for choosing to invest with Wells Fargo Funds. We appreciate your confidence in us and remain committed to helping you meet your financial needs.
Sincerely,

Andrew Owen
President
Wells Fargo Funds
Notice to shareholders
Effective July 1, 2020, the Funds’ underlying U.S. large- and small-capitalization companies, international(non-U.S.) developed and emerging markets allocations will no longer seek to track proprietary indexes and their portfolios will be realigned with the methodology summarized below (the “Factor Enhanced Methodology”) over a period of approximately three months.
Factor Enhanced Methodology.A systematic, rules based methodology designed to build a portfolio of stocks that provides exposure to factors (or characteristics) commonly tied to a stock’s potential for enhanced risk-adjusted returns relative to the market. Those factors include, but are not limited to, value, quality, momentum, size, and low volatility.
4 | Target Date Retirement Funds
Table of Contents
This page is intentionally left blank.
Table of Contents
Performance highlights (unaudited)
Wells Fargo Dynamic Target Date Funds
Investment objective
Each Fund seeks total return over time, consistent with its strategic target allocation.
Manager
Wells Fargo Funds Management, LLC
Subadviser
Wells Capital Management Incorporated
Portfolio managers
Kandarp R. Acharya, CFA®‡, FRM
Petros N. Bocray, CFA®‡, FRM
Christian L. Chan, CFA®‡
The target date represents the year in which investors may likely begin withdrawing assets. The Funds gradually seek to reduce market risk as the target date approaches and after it arrives by decreasing equity exposure and increasing fixed income exposure. The principal value is not guaranteed at any time, including at the target date.
Stock values fluctuate in response to the activities of individual companies and general market and economic conditions. Bond values fluctuate in response to the financial condition of individual issuers, general market and economic conditions, and changes in interest rates. Changes in market conditions and government policies may lead to periods of heightened volatility in the bond market and reduced liquidity for certain bonds held by each Fund. In general, when interest rates rise, bond values fall and investors may lose principal value. Interest rate changes and their impact on each Fund and its share price can be sudden and unpredictable. High-yield securities have a greater risk of default and tend to be more volatile than higher-rated debt securities. The use of derivatives may reduce returns and/or increase volatility. Securities issued by U.S. government agencies or government-sponsored entities may not be guaranteed by the U.S. Treasury. The Funds will indirectly be exposed to all of the risks of an investment in the underlying funds and will indirectly bear expenses of the underlying funds. Certain investment strategies tend to increase the total risk of an investment (relative to the broader market). The Funds are exposed to foreign investment risk, mortgage- and asset-backed securities risk, regulatory risk, and smaller-company investment risk. Consult the Funds’ prospectus for additional information on these and other risks.
| ‡ | CFA® and Chartered Financial Analyst® are trademarks owned by CFA Institute. |
6 | Target Date Retirement Funds
Table of Contents
Performance highlights (unaudited)
Average annual total returns (%) as of February 29, 2020
| Including sales charge | Excluding sales charge | Expense ratios1 (%) | ||||||||||||||||||||||||
| Inception date | 1 year | Since inception | 1 year | Since inception | Gross | Net2 | ||||||||||||||||||||
| Class A (WDYAX) | 11-30-2015 | 0.77 | 4.12 | 6.95 | 5.59 | 4.39 | 0.68 | |||||||||||||||||||
| Class C (WDYCX) | 11-30-2015 | 5.11 | 4.80 | 6.11 | 4.80 | 5.14 | 1.43 | |||||||||||||||||||
| Class R4 (WDYYX) | 11-30-2015 | 7.33 | 5.92 | 4.11 | 0.37 | |||||||||||||||||||||
| Class R6 (WDYZX) | 11-30-2015 | – | – | 7.48 | 6.07 | 3.96 | 0.22 | |||||||||||||||||||
| S&P Target Date Retirement Income Index3 | – | – | – | 7.04 | 4.96 | * | – | – | ||||||||||||||||||
| Wells Fargo Dynamic Target Today Blended Index4 | – | – | – | 7.20 | – | – | – | |||||||||||||||||||
| * | Based on the inception date of the oldest Fund class. |
Figures quoted represent past performance, which is no guarantee of future results, and do not reflect taxes that a shareholder may pay on an investment in a fund. Investment return and principal value of an investment will fluctuate so that an investor’s shares, when redeemed, may be worth more or less than their original cost. Performance shown without sales charges would be lower if sales charges were reflected. Current performance may be lower or higher than the performance data quoted and assumes the reinvestment of dividends and capital gains. Currentmonth-end performance is available on the Fund’s website,wfam.com
Index returns do not include transaction costs associated with buying and selling securities, any mutual fund fees or expenses, or any taxes. It is not possible to invest directly in an index.
For Class A shares, the maximumfront-end sales charge is 5.75%. For Class C shares, the maximum contingent deferred sales charge is 1.00%. Performance including a contingent deferred sales charge assumes the sales charge for the corresponding time period. Class R4 and Class R6 shares are sold without afront-end sales charge or contingent deferred sales charge.
| Growth of $10,000 investment as of February 29, 20205 |
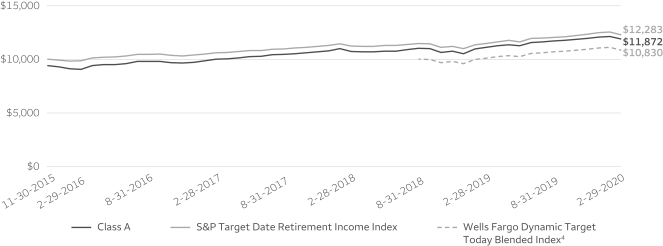 |
Please see footnotes on page 9.
Target Date Retirement Funds | 7
Table of Contents
Performance highlights (unaudited)
Dynamic Target Today Fund (continued)
| Holdings (%) as of February 29, 20206 | ||||
Wells Fargo Bloomberg Barclays US Aggregateex-Corporate Portfolio | 31.29 | |||
Wells Fargo Factor Enhanced Large Cap Portfolio | 17.86 | |||
Wells Fargo Investment Grade Corporate Bond Portfolio | 16.21 | |||
Wells Fargo Strategic Retirement Bond Portfolio | 10.55 | |||
Wells Fargo Factor Enhanced International Portfolio | 9.47 | |||
Wells Fargo Factor Enhanced Small Cap Portfolio | 4.46 | |||
Wells Fargo U.S. REIT Portfolio | 3.15 | |||
Wells Fargo Factor Enhanced Emerging Markets Portfolio | 2.87 | |||
Wells Fargo Emerging Markets Bond Portfolio | 2.60 | |||
Wells Fargo High Yield Corporate Bond Portfolio | 2.55 | |||
| Volatility metrics as of February 29, 20208 | ||||||||||||
| Beta9 | Standard deviation10 | R-squared11 | ||||||||||
Class A | 1.14 | 4.74 | % | 0.96 | ||||||||
Class C | 1.14 | 4.75 | % | 0.96 | ||||||||
Class R4 | 1.14 | 4.74 | % | 0.96 | ||||||||
Class R6 | 1.14 | 4.74 | % | 0.96 | ||||||||
| Allocations (%) as of February 29, 2020 | ||||||||
| Neutral Allocation | Effective Allocation7 | |||||||
Equity | 40 | 40 | ||||||
Fixed Income | 60 | 60 | ||||||
Please see footnotes on page 9.
8 | Target Date Retirement Funds
Table of Contents
Performance highlights (unaudited)
Dynamic Target Today Fund (continued)
| 1 | Reflects the expense ratios as stated in the most recent prospectuses, which include the impact of 0.13% of acquired fund fees and expenses. Net expenses from affiliated master portfolios are included in the acquired fund fees and expense amount. The expense ratios shown are subject to change and may differ from the annualized expense ratios shown in the financial highlights of this report, which only include net expenses from affiliated master portfolios. |
| 2 | The manager has contractually committed through June 30, 2020, to waive fees and/or reimburse expenses to the extent necessary to cap total annual fund operating expenses after fee waivers at 0.68% for Class A, 1.43% for Class C, 0.37% for Class R4, and 0.22% for Class R6. Brokerage commissions, stamp duty fees, interest, taxes, acquired fund fees and expenses (if any) from funds in which the affiliated master portfolios invest and from money market funds, and extraordinary expenses are excluded from the expense caps. All other acquired fund fees and expenses from the affiliated master portfolios are included in the expense caps. Prior to or after the commitment expiration date, the caps may be increased or the commitment to maintain the caps may be terminated only with the approval of the Board of Trustees. Without these caps, the Fund’s returns would have been lower. The expense ratio paid by an investor is the net expense ratio (the total annual fund operating expenses after fee waivers) as stated in the prospectuses. |
| 3 | The S&P Target Date Index is designed as a benchmark for multi-asset class portfolios with risk profiles that become more conservative over time, corresponding to the target retirement date. This index is representative of the investment opportunity available to investors for the target date horizon, with asset class exposures driven by a survey of available target date funds for that horizon. You cannot invest directly in an index. |
| 4 | Source: Wells Fargo Funds Management, LLC. The Wells Fargo Dynamic Target Blended Index is designed as a benchmark for multi-asset class portfolios with risk profiles that become more conservative over time, corresponding to the target retirement date. The index weightings among the major asset classes are adjusted annually. The inception date of the index is September 21, 2018. See Appendix I for additional information. You cannot invest directly in an index. |
| 5 | The chart compares the performance of Class A shares since inception with the S&P Target Date Retirement Income Index and the Wells Fargo Dynamic Target Today Blended Index. The chart assumes a hypothetical investment of $10,000 in Class A shares and reflects all operating expenses and assumes the maximum initial sales charge of 5.75%. |
| 6 | Holdings, excluding cash, cash equivalents and any money market funds, are calculated based on the value of the investments divided by total net assets of the Fund. Holdings are subject to change and may have changed since the date specified. |
| 7 | The effective allocation includes the effect of any tactical futures overlay that may be in place. Effective cash, if any, represents the net offset to such future positions. The effective allocation does not reflect futures positions held in dynamic risk hedging strategies. Effective allocations are subject to change and may have changed since the date specified. |
| 8 | These metrics show the degree and timing of the Fund’s fluctuations compared to S&P Target Date Retirement Income Index over 36 months. |
| 9 | Beta measures fund volatility relative to general market movements. It is a standardized measure of systematic risk in comparison with a specified index. The benchmark beta is 1.00 by definition. Beta is based on historical performance and does not represent future results. |
| 10 | Standard deviation is the square root of the sum of squared deviations from the mean. It is often used as a measure of volatility, variability, or risk. Standard deviation is based on historical performance and does not represent future results. |
| 11 | R-squared (R2) is a statistical measure that reflects the percentage of a fund’s movements that can be explained by movements in its benchmark index. The measure ranges from 0.0, which means that the fund’s performance bears no relationship to the performance of the index, to 1.0, which means that the fund’s performance was perfectly synchronized with the performance of the benchmark. R2 is based on historical performance and does not represent future results. |
Target Date Retirement Funds | 9
Table of Contents
Performance highlights (unaudited)
Average annual total returns (%) as of February 29, 2020
| Including sales charge | Excluding sales charge | Expense ratios1 (%) | ||||||||||||||||||||||||
| Inception date | 1 year | Since inception | 1 year | Since inception | Gross | Net2 | ||||||||||||||||||||
| Class A (WDTAX) | 11-30-2015 | 0.11 | 4.65 | 6.22 | 6.12 | 4.23 | 0.68 | |||||||||||||||||||
| Class C (WDTCX) | 11-30-2015 | 4.49 | 5.33 | 5.49 | 5.33 | 4.98 | 1.43 | |||||||||||||||||||
| Class R4 (WDTYX) | 11-30-2015 | – | – | 6.51 | 6.44 | 3.95 | 0.37 | |||||||||||||||||||
| Class R6 (WDTZX) | 11-30-2015 | – | – | 6.77 | 6.61 | 3.80 | 0.22 | |||||||||||||||||||
| S&P Target Date 2015 Index3 | – | – | – | 6.33 | 5.74 | * | – | – | ||||||||||||||||||
| Wells Fargo Dynamic Target 2015 Blended Index4 | – | – | – | 6.32 | – | – | – | |||||||||||||||||||
| * | Based on the inception date of the oldest Fund class. |
Figures quoted represent past performance, which is no guarantee of future results, and do not reflect taxes that a shareholder may pay on an investment in a fund. Investment return and principal value of an investment will fluctuate so that an investor’s shares, when redeemed, may be worth more or less than their original cost. Performance shown without sales charges would be lower if sales charges were reflected. Current performance may be lower or higher than the performance data quoted and assumes the reinvestment of dividends and capital gains. Currentmonth-end performance is available on the Fund’s website,wfam.com.
Index returns do not include transaction costs associated with buying and selling securities, any mutual fund fees or expenses, or any taxes. It is not possible to invest directly in an index.
For Class A shares, the maximumfront-end sales charge is 5.75%. For Class C shares, the maximum contingent deferred sales charge is 1.00%. Performance including a contingent deferred sales charge assumes the sales charge for the corresponding time period. Class R4 and Class R6 shares are sold without afront-end sales charge or contingent deferred sales charge.
| Growth of $10,000 investment as of February 29, 20205 |
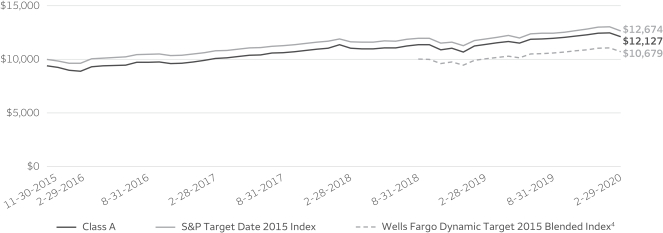 |
Please see footnotes on page 12.
10 | Target Date Retirement Funds
Table of Contents
Performance highlights (unaudited)
Dynamic Target 2015 Fund (continued)
| Holdings (%) as of February 29, 20206 | ||||
Wells Fargo Bloomberg Barclays US Aggregateex-Corporate Portfolio | 26.97 | |||
Wells Fargo Factor Enhanced Large Cap Portfolio | 22.07 | |||
Wells Fargo Investment Grade Corporate Bond Portfolio | 13.95 | |||
Wells Fargo Factor Enhanced International Portfolio | 11.65 | |||
Wells Fargo Strategic Retirement Bond Portfolio | 9.05 | |||
Wells Fargo Factor Enhanced Small Cap Portfolio | 5.51 | |||
Wells Fargo U.S. REIT Portfolio | 3.86 | |||
Wells Fargo Factor Enhanced Emerging Markets Portfolio | 3.51 | |||
Wells Fargo Emerging Markets Bond Portfolio | 2.23 | |||
Wells Fargo High Yield Corporate Bond Portfolio | 2.18 | |||
| Volatility metrics as of February 29, 20208 | ||||||||||||
| Beta9 | Standard deviation10 | R-squared11 | ||||||||||
Class A | 1.08 | 5.97 | % | 0.97 | ||||||||
Class C | 1.07 | 5.93 | % | 0.97 | ||||||||
Class R4 | 1.07 | 5.94 | % | 0.96 | ||||||||
Class R6 | 1.08 | 5.98 | % | 0.96 | ||||||||
| Allocations (%) as of February 29, 2020 | ||||||||
| Neutral Allocation | Effective Allocation7 | |||||||
Equity | 49 | 49 | ||||||
Fixed Income | 51 | 51 | ||||||
Please see footnotes on page 12.
Target Date Retirement Funds | 11
Table of Contents
Performance highlights (unaudited)
Dynamic Target 2015 Fund (continued)
| 1 | Reflects the expense ratios as stated in the most recent prospectuses, which include the impact of 0.14% of acquired fund fees and expenses. Net expenses from affiliated master portfolios are included in the acquired fund fees and expense amount. The expense ratios shown are subject to change and may differ from the annualized expense ratios shown in the financial highlights of this report, which only include net expenses from affiliated master portfolios. |
| 2 | The manager has contractually committed through June 30, 2020, to waive fees and/or reimburse expenses to the extent necessary to cap total annual fund operating expenses after fee waivers at 0.68% for Class A, 1.43% for Class C, 0.37% for Class R4, and 0.22% for Class R6. Brokerage commissions, stamp duty fees, interest, taxes, acquired fund fees and expenses (if any) from funds in which the affiliated master portfolios invest and from money market funds, and extraordinary expenses are excluded from the expense caps. All other acquired fund fees and expenses from the affiliated master portfolios are included in the expense caps. Prior to or after the commitment expiration date, the caps may be increased or the commitment to maintain the caps may be terminated only with the approval of the Board of Trustees. Without these caps, the Fund’s returns would have been lower. The expense ratio paid by an investor is the net expense ratio (the total annual fund operating expenses after fee waivers) as stated in the prospectuses. |
| 3 | The S&P Target Date Index is designed as a benchmark for multi-asset class portfolios with risk profiles that become more conservative over time, corresponding to the target retirement date. This index is representative of the investment opportunity available to investors for the target date horizon, with asset class exposures driven by a survey of available target date funds for that horizon. You cannot invest directly in an index. |
| 4 | Source: Wells Fargo Funds Management, LLC. The Wells Fargo Dynamic Target Blended Index is designed as a benchmark for multi-asset class portfolios with risk profiles that become more conservative over time, corresponding to the target retirement date. The index weightings among the major asset classes are adjusted annually. The inception date of the index is September 21, 2018. See Appendix I for additional information. You cannot invest directly in an index. |
| 5 | The chart compares the performance of Class A shares since inception with the S&P Target Date 2015 Index and the Wells Fargo Dynamic Target 2015 Blended Index. The chart assumes a hypothetical investment of $10,000 in Class A shares and reflects all operating expenses and assumes the maximum initial sales charge of 5.75%. |
| 6 | Holdings, excluding cash, cash equivalents and any money market funds, are calculated based on the value of the investments divided by total net assets of the Fund. Holdings are subject to change and may have changed since the date specified. |
| 7 | The effective allocation includes the effect of any tactical futures overlay that may be in place. Effective cash, if any, represents the net offset to such future positions. The effective allocation does not reflect futures positions held in dynamic risk hedging strategies. Effective allocations |
| 8 | These metrics show the degree and timing of the Fund’s fluctuations compared to S&P Target Date 2015 Index over 36 months. |
| 9 | Beta measures fund volatility relative to general market movements. It is a standardized measure of systematic risk in comparison with a specified index. The benchmark beta is 1.00 by definition. Beta is based on historical performance and does not represent future results. |
| 10 | Standard deviation is the square root of the sum of squared deviations from the mean. It is often used as a measure of volatility, variability, or risk. Standard deviation is based on historical performance and does not represent future results. |
| 11 | R-squared (R2) is a statistical measure that reflects the percentage of a fund’s movements that can be explained by movements in its benchmark index. The measure ranges from 0.0, which means that the fund’s performance bears no relationship to the performance of the index, to 1.0, which means that the fund’s performance was perfectly synchronized with the performance of the benchmark. R2 is based on historical performance and does not represent future results. |
12 | Target Date Retirement Funds
Table of Contents
Performance highlights (unaudited)
Average annual total returns (%) as of February 29, 2020
| Including sales charge | Excluding sales charge | Expense ratios1 (%) | ||||||||||||||||||||||||
| Inception date | 1 year | Since inception | 1 year | Since inception | Gross | Net2 | ||||||||||||||||||||
| Class A (WDTDX) | 11-30-2015 | -0.77 | 5.04 | 5.31 | 6.52 | 4.04 | 0.68 | |||||||||||||||||||
| Class C (WDTEX) | 11-30-2015 | 3.61 | 5.73 | 4.61 | 5.73 | 4.79 | 1.43 | |||||||||||||||||||
| Class R4 (WDTGX) | 11-30-2015 | – | – | 5.62 | 6.84 | 3.76 | 0.37 | |||||||||||||||||||
| Class R6 (WDTHX) | 11-30-2015 | – | – | 5.77 | 6.99 | 3.61 | 0.22 | |||||||||||||||||||
| S&P Target Date 2020 Index3 | – | – | – | 6.06 | 6.11 | * | – | – | ||||||||||||||||||
| Wells Fargo Dynamic Target 2020 Blended Index4 | – | – | – | 5.53 | – | – | – | |||||||||||||||||||
| * | Based on the inception date of the oldest Fund class. |
Figures quoted represent past performance, which is no guarantee of future results, and do not reflect taxes that a shareholder may pay on an investment in a fund. Investment return and principal value of an investment will fluctuate so that an investor’s shares, when redeemed, may be worth more or less than their original cost. Performance shown without sales charges would be lower if sales charges were reflected. Current performance may be lower or higher than the performance data quoted and assumes the reinvestment of dividends and capital gains. Currentmonth-end performance is available on the Fund’s website,wfam.com.
Index returns do not include transaction costs associated with buying and selling securities, any mutual fund fees or expenses, or any taxes. It is not possible to invest directly in an index.
For Class A shares, the maximumfront-end sales charge is 5.75%. For Class C shares, the maximum contingent deferred sales charge is 1.00%. Performance including a contingent deferred sales charge assumes the sales charge for the corresponding time period. Class R4 and Class R6 shares are sold without afront-end sales charge or contingent deferred sales charge.
| Growth of $10,000 investment as of February 29, 20205 |
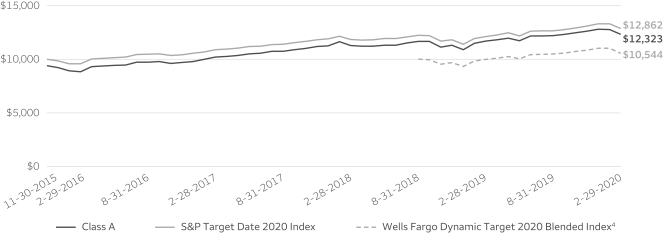 |
Please see footnotes on page 15.
Target Date Retirement Funds | 13
Table of Contents
Performance highlights (unaudited)
Dynamic Target 2020 Fund (continued)
| Holdings (%) as of February 29, 20206 | ||||
Wells Fargo Factor Enhanced Large Cap Portfolio | 26.15 | |||
Wells Fargo Bloomberg Barclays US Aggregateex-Corporate Portfolio | 22.78 | |||
Wells Fargo Factor Enhanced International Portfolio | 14.10 | |||
Wells Fargo Investment Grade Corporate Bond Portfolio | 11.78 | |||
Wells Fargo Strategic Retirement Bond Portfolio | 7.05 | |||
Wells Fargo Factor Enhanced Small Cap Portfolio | 6.53 | |||
Wells Fargo Factor Enhanced Emerging Markets Portfolio | 4.26 | |||
Wells Fargo U.S. REIT Portfolio | 4.12 | |||
Wells Fargo Emerging Markets Bond Portfolio | 1.88 | |||
Wells Fargo High Yield Corporate Bond Portfolio | 1.84 | |||
| Volatility metrics as of February 29, 20208 | ||||||||||||
| Beta9 | Standard deviation10 | R-squared11 | ||||||||||
Class A | 1.09 | 6.82 | % | 0.97 | ||||||||
Class C | 1.09 | 6.77 | % | 0.97 | ||||||||
Class R4 | 1.09 | 6.80 | % | 0.97 | ||||||||
Class R6 | 1.10 | 6.84 | % | 0.97 | ||||||||
| Allocations (%) as of February 29, 2020 | ||||||||
| Neutral Allocation | Effective Allocation7 | |||||||
Equity | 57 | 57 | ||||||
Fixed Income | 43 | 43 | ||||||
Please see footnotes on page 15.
14 | Target Date Retirement Funds
Table of Contents
Performance highlights (unaudited)
Dynamic Target 2020 Fund (continued)
| 1 | Reflects the expense ratios as stated in the most recent prospectuses, which include the impact of 0.13% of acquired fund fees and expenses. Net expenses from affiliated master portfolios are included in the acquired fund fees and expense amount. The expense ratios shown are subject to change and may differ from the annualized expense ratios shown in the financial highlights of this report, which only include net expenses from affiliated master portfolios. |
| 2 | The manager has contractually committed through June 30, 2020, to waive fees and/or reimburse expenses to the extent necessary to cap total annual fund operating expenses after fee waivers at 0.68% for Class A, 1.43% for Class C, 0.37% for Class R4, and 0.22% for Class R6. Brokerage commissions, stamp duty fees, interest, taxes, acquired fund fees and expenses (if any) from funds in which the affiliated master portfolios invest and from money market funds, and extraordinary expenses are excluded from the expense caps. All other acquired fund fees and expenses from the affiliated master portfolios are included in the expense caps. Prior to or after the commitment expiration date, the caps may be increased or the commitment to maintain the caps may be terminated only with the approval of the Board of Trustees. Without these caps, the Fund’s returns would have been lower. The expense ratio paid by an investor is the net expense ratio (the total annual fund operating expenses after fee waivers) as stated in the prospectuses. |
| 3 | The S&P Target Date Index is designed as a benchmark for multi-asset class portfolios with risk profiles that become more conservative over time, corresponding to the target retirement date. This index is representative of the investment opportunity available to investors for the target date horizon, with asset class exposures driven by a survey of available target date funds for that horizon. You cannot invest directly in an index. |
| 4 | Source: Wells Fargo Funds Management, LLC. The Wells Fargo Dynamic Target Blended Index is designed as a benchmark for multi-asset class portfolios with risk profiles that become more conservative over time, corresponding to the target retirement date. The index weightings among the major asset classes are adjusted annually. The inception date of the index is September 21, 2018. See Appendix I for additional information. You cannot invest directly in an index. |
| 5 | The chart compares the performance of Class A shares since inception with the S&P Target Date 2020 Index and the Wells Fargo Dynamic Target 2020 Blended Index. The chart assumes a hypothetical investment of $10,000 in Class A shares and reflects all operating expenses and assumes the maximum initial sales charge of 5.75%. |
| 6 | Holdings, excluding cash, cash equivalents and any money market funds, are calculated based on the value of the investments divided by total net assets of the Fund. Holdings are subject to change and may have changed since the date specified. |
| 7 | The effective allocation includes the effect of any tactical futures overlay that may be in place. Effective cash, if any, represents the net offset to such future positions. The effective allocation does not reflect futures positions held in dynamic risk hedging strategies. Effective allocations are subject to change and may have changed since the date specified. |
| 8 | These metrics show the degree and timing of the Fund’s fluctuations compared to S&P Target Date 2020 Index over 36 months. |
| 9 | Beta measures fund volatility relative to general market movements. It is a standardized measure of systematic risk in comparison with a specified index. The benchmark beta is 1.00 by definition. Beta is based on historical performance and does not represent future results. |
| 10 | Standard deviation is the square root of the sum of squared deviations from the mean. It is often used as a measure of volatility, variability, or risk. Standard deviation is based on historical performance and does not represent future results. |
| 11 | R-squared (R2) is a statistical measure that reflects the percentage of a fund’s movements that can be explained by movements in its benchmark index. The measure ranges from 0.0, which means that the fund’s performance bears no relationship to the performance of the index, to 1.0, which means that the fund’s performance was perfectly synchronized with the performance of the benchmark. R2 is based on historical performance and does not represent future results. |
Target Date Retirement Funds | 15
Table of Contents
Performance highlights (unaudited)
Average annual total returns (%) as of February 29, 2020
| Including sales charge | Excluding sales charge | Expense ratios1 (%) | ||||||||||||||||||||||||
| Inception date | 1 year | Since inception | 1 year | Since inception | Gross | Net2 | ||||||||||||||||||||
| Class A (WDTIX) | 11-30-2015 | -1.74 | 5.14 | 4.29 | 6.62 | 3.81 | 0.68 | |||||||||||||||||||
| Class C (WDTJX) | 11-30-2015 | 2.55 | 5.82 | 3.55 | 5.82 | 4.56 | 1.43 | |||||||||||||||||||
| Class R4 (WDTLX) | 11-30-2015 | – | – | 4.68 | 6.93 | 3.53 | 0.37 | |||||||||||||||||||
| Class R6 (WDTMX) | 11-30-2015 | – | – | 4.83 | 7.10 | 3.38 | 0.22 | |||||||||||||||||||
| S&P Target Date 2025 Index3 | – | – | – | 5.49 | 6.46 | * | – | – | ||||||||||||||||||
| Wells Fargo Dynamic Target 2025 Blended Index4 | – | – | – | 4.50 | – | – | – | |||||||||||||||||||
| * | Based on the inception date of the oldest Fund class. |
Figures quoted represent past performance, which is no guarantee of future results, and do not reflect taxes that a shareholder may pay on an investment in a fund. Investment return and principal value of an investment will fluctuate so that an investor’s shares, when redeemed, may be worth more or less than their original cost. Performance shown without sales charges would be lower if sales charges were reflected. Current performance may be lower or higher than the performance data quoted and assumes the reinvestment of dividends and capital gains. Currentmonth-end performance is available on the Fund’s website,wfam.com.
Index returns do not include transaction costs associated with buying and selling securities, any mutual fund fees or expenses, or any taxes. It is not possible to invest directly in an index.
For Class A shares, the maximumfront-end sales charge is 5.75%. For Class C shares, the maximum contingent deferred sales charge is 1.00%. Performance including a contingent deferred sales charge assumes the sales charge for the corresponding time period. Class R4 and Class R6 shares are sold without afront-end sales charge or contingent deferred sales charge.
| Growth of $10,000 investment as of February 29, 20205 |
|
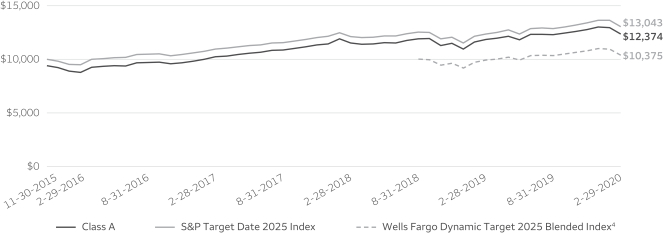
Please see footnotes on page 18.
16 | Target Date Retirement Funds
Table of Contents
Performance highlights (unaudited)
Dynamic Target 2025 Fund (continued)
| Holdings (%) as of February 29, 20206 | ||||
Wells Fargo Factor Enhanced Large Cap Portfolio | 31.64 | |||
Wells Fargo Bloomberg Barclays US Aggregateex-Corporate Portfolio | 19.46 | |||
Wells Fargo Factor Enhanced International Portfolio | 17.56 | |||
Wells Fargo Investment Grade Corporate Bond Portfolio | 10.03 | |||
Wells Fargo Factor Enhanced Small Cap Portfolio | 7.95 | |||
Wells Fargo Factor Enhanced Emerging Markets Portfolio | 5.31 | |||
Wells Fargo Strategic Retirement Bond Portfolio | 3.19 | |||
Wells Fargo U.S. REIT Portfolio | 2.75 | |||
Wells Fargo Emerging Markets Bond Portfolio | 1.58 | |||
Wells Fargo High Yield Corporate Bond Portfolio | 1.56 | |||
| Allocations (%) as of February 29, 2020 | ||||||||
| Neutral Allocation | Effective Allocation7 | |||||||
Equity | 67 | 67 | ||||||
Fixed Income | 33 | 33 | ||||||
| Volatility metrics as of February 29, 20208 | ||||||||||||
| Beta9 | Standard deviation10 | R-squared11 | ||||||||||
Class A | 1.09 | 8.02% | 0.98 | |||||||||
Class C | 1.08 | 7.99% | 0.98 | |||||||||
Class R4 | 1.08 | 7.98% | 0.98 | |||||||||
Class R6 | 1.08 | 7.99% | 0.98 | |||||||||
Please see footnotes on page 18.
Target Date Retirement Funds | 17
Table of Contents
Performance highlights (unaudited)
Dynamic Target 2025 Fund (continued)
| 1 | Reflects the expense ratios as stated in the most recent prospectuses, which include the impact of 0.14% of acquired fund fees and expenses. Net expenses from affiliated master portfolios are included in the acquired fund fees and expense amount. The expense ratios shown are subject to change and may differ from the annualized expense ratios shown in the financial highlights of this report, which only include net expenses from affiliated master portfolios. |
| 2 | The manager has contractually committed through June 30, 2020, to waive fees and/or reimburse expenses to the extent necessary to cap total annual fund operating expenses after fee waivers at 0.68% for Class A, 1.43% for Class C, 0.37% for Class R4, and 0.22% for Class R6. Brokerage commissions, stamp duty fees, interest, taxes, acquired fund fees and expenses (if any) from funds in which the affiliated master portfolios invest and from money market funds, and extraordinary expenses are excluded from the expense caps. All other acquired fund fees and expenses from the affiliated master portfolios are included in the expense caps. Prior to or after the commitment expiration date, the caps may be increased or the commitment to maintain the caps may be terminated only with the approval of the Board of Trustees. Without these caps, the Fund’s returns would have been lower. The expense ratio paid by an investor is the net expense ratio (the total annual fund operating expenses after fee waivers) as stated in the prospectuses. |
| 3 | The S&P Target Date Index is designed as a benchmark for multi-asset class portfolios with risk profiles that become more conservative over time, corresponding to the target retirement date. This index is representative of the investment opportunity available to investors for the target date horizon, with asset class exposures driven by a survey of available target date funds for that horizon. You cannot invest directly in an index. |
| 4 | Source: Wells Fargo Funds Management, LLC. The Wells Fargo Dynamic Target Blended Index is designed as a benchmark for multi-asset class portfolios with risk profiles that become more conservative over time, corresponding to the target retirement date. The index weightings among the major asset classes are adjusted annually. The inception date of the index is September 21, 2018. See Appendix I for additional information. You cannot invest directly in an index. |
| 5 | The chart compares the performance of Class A shares since inception with the S&P Target Date 2025 Index and the Wells Fargo Dynamic Target 2025 Blended Index. The chart assumes a hypothetical investment of $10,000 in Class A shares and reflects all operating expenses and assumes the maximum initial sales charge of 5.75%. |
| 6 | Holdings, excluding cash, cash equivalents and any money market funds, are calculated based on the value of the investments divided by total net assets of the Fund. Holdings are subject to change and may have changed since the date specified. |
| 7 | The effective allocation includes the effect of any tactical futures overlay that may be in place. Effective cash, if any, represents the net offset to such future positions. The effective allocation does not reflect futures positions held in dynamic risk hedging strategies. Effective allocations are subject to change and may have changed since the date specified. |
| 8 | These metrics show the degree and timing of the Fund’s fluctuations compared to S&P Target Date 2025 Index over 36 months. |
| 9 | Beta measures fund volatility relative to general market movements. It is a standardized measure of systematic risk in comparison with a specified index. The benchmark beta is 1.00 by definition. Beta is based on historical performance and does not represent future results. |
| 10 | Standard deviation is the square root of the sum of squared deviations from the mean. It is often used as a measure of volatility, variability, or risk. Standard deviation is based on historical performance and does not represent future results. |
| 11 | R-squared (R2) is a statistical measure that reflects the percentage of a fund’s movements that can be explained by movements in its benchmark index. The measure ranges from 0.0, which means that the fund’s performance bears no relationship to the performance of the index, to 1.0, which means that the fund’s performance was perfectly synchronized with the performance of the benchmark. R2 is based on historical performance and does not represent future results. |
18 | Target Date Retirement Funds
Table of Contents
Performance highlights (unaudited)
Average annual total returns (%) as of February 29, 2020
| Including sales charge | Excluding sales charge | Expense ratios1 (%) | ||||||||||||||||||||||||
| Inception date | 1 year | Since inception | 1 year | Since inception | Gross | Net2 | ||||||||||||||||||||
| Class A (WDTNX) | 11-30-2015 | -2.57 | 5.44 | 3.40 | 6.92 | 4.07 | 0.68 | |||||||||||||||||||
| Class C (WDTOX) | 11-30-2015 | 1.64 | 6.09 | 2.64 | * | 6.09 | 4.82 | 1.43 | ||||||||||||||||||
| Class R4 (WDTQX) | 11-30-2015 | – | – | 3.74 | 7.22 | 3.79 | 0.37 | |||||||||||||||||||
| Class R6 (WDTSX) | 11-30-2015 | – | – | 3.99 | 7.40 | 3.64 | 0.22 | |||||||||||||||||||
| S&P Target Date 2030 Index3 | – | – | – | 4.83 | 6.73 | ** | – | – | ||||||||||||||||||
| Wells Fargo Dynamic Target 2030 Blended Index4 | – | – | – | 3.53 | – | – | – | |||||||||||||||||||
| * | Total return differs from the return in the Financial Highlights in this report. The total return presented is calculated based on the NAV at which the shareholder transactions were processed. The NAV and total return presented in the Financial Highlights reflects certain adjustments made to the net assets of the Fund that are necessary under U.S. generally accepted accounting principles. |
| ** | Based on the inception date of the oldest Fund class. |
Figures quoted represent past performance, which is no guarantee of future results, and do not reflect taxes that a shareholder may pay on an investment in a fund. Investment return and principal value of an investment will fluctuate so that an investor’s shares, when redeemed, may be worth more or less than their original cost. Performance shown without sales charges would be lower if sales charges were reflected. Current performance may be lower or higher than the performance data quoted and assumes the reinvestment of dividends and capital gains. Currentmonth-end performance is available on the Fund’s website,wfam.com.
Index returns do not include transaction costs associated with buying and selling securities, any mutual fund fees or expenses, or any taxes. It is not possible to invest directly in an index.
For Class A shares, the maximumfront-end sales charge is 5.75%. For Class C shares, the maximum contingent deferred sales charge is 1.00%. Performance including a contingent deferred sales charge assumes the sales charge for the corresponding time period. Class R4 and Class R6 shares are sold without afront-end sales charge or contingent deferred sales charge.
| Growth of $10,000 investment as of February 29, 20205 |
|
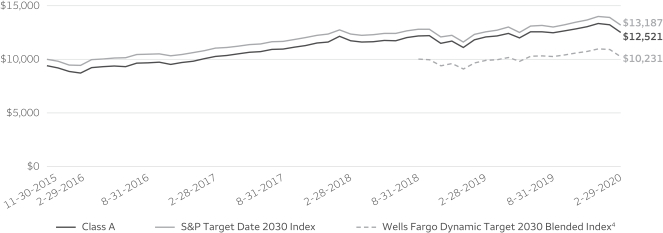
Please see footnotes on page 21.
Target Date Retirement Funds | 19
Table of Contents
Performance highlights (unaudited)
Dynamic Target 2030 Fund (continued)
| Holdings (%) as of February 29, 20206 | ||||
Wells Fargo Factor Enhanced Large Cap Portfolio | 36.41 | |||
Wells Fargo Factor Enhanced International Portfolio | 21.26 | |||
Wells Fargo Bloomberg Barclays US Aggregateex-Corporate Portfolio | 15.10 | |||
Wells Fargo Factor Enhanced Small Cap Portfolio | 9.12 | |||
Wells Fargo Investment Grade Corporate Bond Portfolio | 7.78 | |||
Wells Fargo Factor Enhanced Emerging Markets Portfolio | 6.44 | |||
Wells Fargo Emerging Markets Bond Portfolio | 1.23 | |||
Wells Fargo High Yield Corporate Bond Portfolio | 1.22 | |||
Wells Fargo U.S. REIT Portfolio | 0.95 | |||
Wells Fargo Strategic Retirement Bond Portfolio | 0.73 | |||
| Allocations (%) as of February 29, 2020 | ||||||||
| Neutral Allocation | Effective Allocation7 | |||||||
Equity | 76 | 76 | ||||||
Fixed Income | 24 | 24 | ||||||
| Volatility metrics as of February 29, 20208 | ||||||||||||
| Beta9 | Standard deviation10 | R-squared11 | ||||||||||
Class A | 1.03 | 8.90 | % | 0.98 | ||||||||
Class C | 1.03 | 8.90 | % | 0.98 | ||||||||
Class R4 | 1.03 | 8.94 | % | 0.98 | ||||||||
Class R6 | 1.03 | 8.91 | % | 0.98 | ||||||||
Please see footnotes on page 21.
20 | Target Date Retirement Funds
Table of Contents
Performance highlights (unaudited)
Dynamic Target 2030 Fund (continued)
| 1 | Reflects the expense ratios as stated in the most recent prospectuses, which include the impact of 0.14% of acquired fund fees and expenses. Net expenses from affiliated master portfolios are included in the acquired fund fees and expense amount. The expense ratios shown are subject to change and may differ from the annualized expense ratios shown in the financial highlights of this report, which only include net expenses from affiliated master portfolios. |
| 2 | The manager has contractually committed through June 30, 2020, to waive fees and/or reimburse expenses to the extent necessary to cap total annual fund operating expenses after fee waivers at 0.68% for Class A, 1.43% for Class C, 0.37% for Class R4, and 0.22% for Class R6. Brokerage commissions, stamp duty fees, interest, taxes, acquired fund fees and expenses (if any) from funds in which the affiliated master portfolios invest and from money market funds, and extraordinary expenses are excluded from the expense caps. All other acquired fund fees and expenses from the affiliated master portfolios are included in the expense caps. Prior to or after the commitment expiration date, the caps may be increased or the commitment to maintain the caps may be terminated only with the approval of the Board of Trustees. Without these caps, the Fund’s returns would have been lower. The expense ratio paid by an investor is the net expense ratio (the total annual fund operating expenses after fee waivers) as stated in the prospectuses. |
| 3 | The S&P Target Date Index is designed as a benchmark for multi-asset class portfolios with risk profiles that become more conservative over time, corresponding to the target retirement date. This index is representative of the investment opportunity available to investors for the target date horizon, with asset class exposures driven by a survey of available target date funds for that horizon. You cannot invest directly in an index. |
| 4 | Source: Wells Fargo Funds Management, LLC. The Wells Fargo Dynamic Target Blended Index is designed as a benchmark for multi-asset class portfolios with risk profiles that become more conservative over time, corresponding to the target retirement date. The index weightings among the major asset classes are adjusted annually. The inception date of the index is September 21, 2018. See Appendix I for additional information. You cannot invest directly in an index. |
| 5 | The chart compares the performance of Class A shares since inception with the S&P Target Date 2030 Index and the Wells Fargo Dynamic Target 2030 Blended Index. The chart assumes a hypothetical investment of $10,000 in Class A shares and reflects all operating expenses and assumes the maximum initial sales charge of 5.75%. |
| 6 | Holdings, excluding cash, cash equivalents and any money market funds, are calculated based on the value of the investments divided by total net assets of the Fund. Holdings are subject to change and may have changed since the date specified. |
| 7 | The effective allocation includes the effect of any tactical futures overlay that may be in place. Effective cash, if any, represents the net offset to such future positions. The effective allocation does not reflect futures positions held in dynamic risk hedging strategies. Effective allocations are subject to change and may have changed since the date specified. |
| 8 | These metrics show the degree and timing of the Fund’s fluctuations compared to S&P Target Date 2030 Index over 36 months. |
| 9 | Beta measures fund volatility relative to general market movements. It is a standardized measure of systematic risk in comparison with a specified index. The benchmark beta is 1.00 by definition. Beta is based on historical performance and does not represent future results. |
| 10 | Standard deviation is the square root of the sum of squared deviations from the mean. It is often used as a measure of volatility, variability, or risk. Standard deviation is based on historical performance and does not represent future results. |
| 11 | R-squared (R2) is a statistical measure that reflects the percentage of a fund’s movements that can be explained by movements in its benchmark index. The measure ranges from 0.0, which means that the fund’s performance bears no relationship to the performance of the index, to 1.0, which means that the fund’s performance was perfectly synchronized with the performance of the benchmark. R2 is based on historical performance and does not represent future results. |
Target Date Retirement Funds | 21
Table of Contents
Performance highlights (unaudited)
Average annual total returns (%) as of February 29, 2020
| Including sales charge | Excluding sales charge | Expense ratios1 (%) | ||||||||||||||||||||||||
| Inception date | 1 year | Since inception | 1 year | Since inception | Gross | Net2 | ||||||||||||||||||||
| Class A (WDTTX) | 11-30-2015 | -3.15 | 5.68 | 2.76 | * | 7.16 | 4.33 | 0.68 | ||||||||||||||||||
| Class C (WDCTX) | 11-30-2015 | 0.99 | 6.34 | 1.99 | 6.34 | 5.08 | 1.43 | |||||||||||||||||||
| Class R4 (WDTVX) | 11-30-2015 | – | – | 3.05 | 7.47 | 4.05 | 0.37 | |||||||||||||||||||
| Class R6 (WDTWX) | 11-30-2015 | – | – | 3.19 | 7.62 | 3.90 | 0.22 | |||||||||||||||||||
| S&P Target Date 2035 Index3 | – | – | – | 4.15 | 6.97 | ** | – | – | ||||||||||||||||||
| Wells Fargo Dynamic Target 2035 Blended Index4 | – | – | – | 2.92 | – | – | – | |||||||||||||||||||
| * | Total return differs from the return in the Financial Highlights in this report. The total return presented is calculated based on the NAV at which the shareholder transactions were processed. The NAV and total return presented in the Financial Highlights reflects certain adjustments made to the net assets of the Fund that are necessary under U.S. generally accepted accounting principles. |
| ** | Based on the inception date of the oldest Fund class. |
Figures quoted represent past performance, which is no guarantee of future results, and do not reflect taxes that a shareholder may pay on an investment in a fund. Investment return and principal value of an investment will fluctuate so that an investor’s shares, when redeemed, may be worth more or less than their original cost. Performance shown without sales charges would be lower if sales charges were reflected. Current performance may be lower or higher than the performance data quoted and assumes the reinvestment of dividends and capital gains. Currentmonth-end performance is available on the Fund’s website,wfam.com.
Index returns do not include transaction costs associated with buying and selling securities, any mutual fund fees or expenses, or any taxes. It is not possible to invest directly in an index.
For Class A shares, the maximumfront-end sales charge is 5.75%. For Class C shares, the maximum contingent deferred sales charge is 1.00%. Performance including a contingent deferred sales charge assumes the sales charge for the corresponding time period. Class R4 and Class R6 shares are sold without afront-end sales charge or contingent deferred sales charge.
| Growth of $10,000 investment as of February 29, 20205 |
|
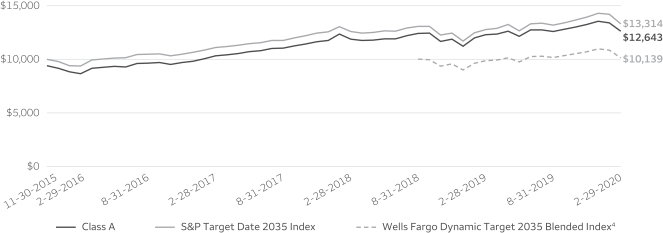
Please see footnotes on page 24.
22 | Target Date Retirement Funds
Table of Contents
Performance highlights (unaudited)
Dynamic Target 2035 Fund (continued)
| Holdings (%) as of February 29, 20206 | ||||
Wells Fargo Factor Enhanced Large Cap Portfolio | 39.24 | |||
Wells Fargo Factor Enhanced International Portfolio | 24.00 | |||
Wells Fargo Bloomberg Barclays US Aggregateex-Corporate Portfolio | 12.57 | |||
Wells Fargo Factor Enhanced Small Cap Portfolio | 9.82 | |||
Wells Fargo Factor Enhanced Emerging Markets Portfolio | 7.22 | |||
Wells Fargo Investment Grade Corporate Bond Portfolio | 6.47 | |||
Wells Fargo Emerging Markets Bond Portfolio | 1.02 | |||
Wells Fargo High Yield Corporate Bond Portfolio | 1.01 | |||
| Allocations (%) as of February 29, 2020 | ||||||||
| Neutral Allocation | Effective Allocation7 | |||||||
Equity | 81 | 81 | ||||||
Fixed Income | 19 | 19 | ||||||
| Volatility metrics as of February 29, 20208 | ||||||||||||
| Beta9 | Standard deviation10 | R-squared11 | ||||||||||
Class A | 0.97 | 9.58 | % | 0.98 | ||||||||
Class C | 0.97 | 9.55 | % | 0.98 | ||||||||
Class R4 | 0.97 | 9.55 | % | 0.98 | ||||||||
Class R6 | 0.97 | 9.52 | % | 0.98 | ||||||||
Please see footnotes on page 24.
Target Date Retirement Funds | 23
Table of Contents
Performance highlights (unaudited)
Dynamic Target 2035 Fund (continued)
| 1 | Reflects the expense ratios as stated in the most recent prospectuses, which include the impact of 0.14% of acquired fund fees and expenses. Net expenses from affiliated master portfolios are included in the acquired fund fees and expense amount. The expense ratios shown are subject to change and may differ from the annualized expense ratios shown in the financial highlights of this report, which only include net expenses from affiliated master portfolios. |
| 2 | The manager has contractually committed through June 30, 2020, to waive fees and/or reimburse expenses to the extent necessary to cap total annual fund operating expenses after fee waivers at 0.68% for Class A, 1.43% for Class C, 0.37% for Class R4, and 0.22% for Class R6. Brokerage commissions, stamp duty fees, interest, taxes, acquired fund fees and expenses (if any) from funds in which the affiliated master portfolios invest and from money market funds, and extraordinary expenses are excluded from the expense caps. All other acquired fund fees and expenses from the affiliated master portfolios are included in the expense caps. Prior to or after the commitment expiration date, the caps may be increased or the commitment to maintain the caps may be terminated only with the approval of the Board of Trustees. Without these caps, the Fund’s returns would have been lower. The expense ratio paid by an investor is the net expense ratio (the total annual fund operating expenses after fee waivers) as stated in the prospectuses. |
| 3 | The S&P Target Date Index is designed as a benchmark for multi-asset class portfolios with risk profiles that become more conservative over time, corresponding to the target retirement date. This index is representative of the investment opportunity available to investors for the target date horizon, with asset class exposures driven by a survey of available target date funds for that horizon. You cannot invest directly in an index. |
| 4 | Source: Wells Fargo Funds Management, LLC. The Wells Fargo Dynamic Target Blended Index is designed as a benchmark for multi-asset class portfolios with risk profiles that become more conservative over time, corresponding to the target retirement date. The index weightings among the major asset classes are adjusted annually. The inception date of the index is September 21, 2018. See Appendix I for additional information. You cannot invest directly in an index. |
| 5 | The chart compares the performance of Class A shares since inception with the S&P Target Date 2035 Index and the Wells Fargo Dynamic Target 2035 Blended Index. The chart assumes a hypothetical investment of $10,000 in Class A shares and reflects all operating expenses and assumes the maximum initial sales charge of 5.75%. |
| 6 | Holdings, excluding cash, cash equivalents and any money market funds, are calculated based on the value of the investments divided by total net assets of the Fund. Holdings are subject to change and may have changed since the date specified. |
| 7 | The effective allocation includes the effect of any tactical futures overlay that may be in place. Effective cash, if any, represents the net offset to such future positions. The effective allocation does not reflect futures positions held in dynamic risk hedging strategies. Effective allocations are subject to change and may have changed since the date specified. |
| 8 | These metrics show the degree and timing of the Fund’s fluctuations compared to S&P Target Date 2035 Index over 36 months. |
| 9 | Beta measures fund volatility relative to general market movements. It is a standardized measure of systematic risk in comparison with a specified index. The benchmark beta is 1.00 by definition. Beta is based on historical performance and does not represent future results. |
| 10 | Standard deviation is the square root of the sum of squared deviations from the mean. It is often used as a measure of volatility, variability, or risk. Standard deviation is based on historical performance and does not represent future results. |
| 11 | R-squared (R2) is a statistical measure that reflects the percentage of a fund’s movements that can be explained by movements in its benchmark index. The measure ranges from 0.0, which means that the fund’s performance bears no relationship to the performance of the index, to 1.0, which means that the fund’s performance was perfectly synchronized with the performance of the benchmark. R2 is based on historical performance and does not represent future results. |
24 | Target Date Retirement Funds
Table of Contents
Performance highlights (unaudited)
Average annual total returns (%) as of February 29, 2020
| Including sales charge | Excluding sales charge | Expense ratios1 (%) | ||||||||||||||||||||||||
| Inception date | 1 year | Since inception | 1 year | Since inception | Gross | Net2 | ||||||||||||||||||||
| Class A (WTDAX) | 11-30-2015 | -3.59 | 5.68 | 2.33 | 7.16 | 4.09 | 0.68 | |||||||||||||||||||
| Class C (WTDCX) | 11-30-2015 | 0.53 | 6.37 | 1.53 | 6.37 | 4.84 | 1.43 | |||||||||||||||||||
| Class R4 (WTDEX) | 11-30-2015 | – | – | 2.61 | 7.49 | 3.81 | 0.37 | |||||||||||||||||||
| Class R6 (WTDFX) | 11-30-2015 | – | – | 2.75 | 7.66 | 3.66 | 0.22 | |||||||||||||||||||
| S&P Target Date 2040 Index3 | – | – | – | 3.70 | 7.15 | * | – | – | ||||||||||||||||||
| Wells Fargo Dynamic Target 2040 Blended Index4 | – | – | – | 2.34 | – | – | – | |||||||||||||||||||
| * | Based on the inception date of the oldest Fund class. |
Figures quoted represent past performance, which is no guarantee of future results, and do not reflect taxes that a shareholder may pay on an investment in a fund. Investment return and principal value of an investment will fluctuate so that an investor’s shares, when redeemed, may be worth more or less than their original cost. Performance shown without sales charges would be lower if sales charges were reflected. Current performance may be lower or higher than the performance data quoted and assumes the reinvestment of dividends and capital gains. Currentmonth-end performance is available on the Fund’s website,wfam.com.
Index returns do not include transaction costs associated with buying and selling securities, any mutual fund fees or expenses, or any taxes. It is not possible to invest directly in an index.
For Class A shares, the maximumfront-end sales charge is 5.75%. For Class C shares, the maximum contingent deferred sales charge is 1.00%. Performance including a contingent deferred sales charge assumes the sales charge for the corresponding time period. Class R4 and Class R6 shares are sold without afront-end sales charge or contingent deferred sales charge.
| Growth of $10,000 investment as of February 29, 20205 |
|

Please see footnotes on page 27.
Target Date Retirement Funds | 25
Table of Contents
Performance highlights (unaudited)
Dynamic Target 2040 Fund (continued)
| Holdings (%) as of February 29, 20206 | ||||
Wells Fargo Factor Enhanced Large Cap Portfolio | 41.24 | |||
Wells Fargo Factor Enhanced International Portfolio | 25.94 | |||
Wells Fargo Factor Enhanced Small Cap Portfolio | 10.31 | |||
Wells Fargo Bloomberg Barclays US Aggregateex-Corporate Portfolio | 9.26 | |||
Wells Fargo Factor Enhanced Emerging Markets Portfolio | 7.83 | |||
Wells Fargo Investment Grade Corporate Bond Portfolio | 4.78 | |||
Wells Fargo Emerging Markets Bond Portfolio | 0.76 | |||
Wells Fargo High Yield Corporate Bond Portfolio | 0.74 | |||
| Volatility metrics as of February 29, 20208 | ||||||||||||
| Beta9 | Standard deviation10 | R-squared11 | ||||||||||
Class A | 0.95 | 10.04 | % | 0.98 | ||||||||
Class C | 0.95 | 10.06 | % | 0.98 | ||||||||
Class R4 | 0.95 | 10.07 | % | 0.98 | ||||||||
Class R6 | 0.95 | 10.09 | % | 0.98 | ||||||||
| Allocations (%) as of February 29, 2020 | ||||||||
| Neutral Allocation | Effective Allocation7 | |||||||
Equity | 86 | 86 | ||||||
Fixed Income | 14 | 14 | ||||||
Please see footnotes on page 27.
26 | Target Date Retirement Funds
Table of Contents
Performance highlights (unaudited)
Dynamic Target 2040 Fund (continued)
| 1 | Reflects the expense ratios as stated in the most recent prospectuses, which include the impact of 0.14% of acquired fund fees and expenses. Net expenses from affiliated master portfolios are included in the acquired fund fees and expense amount. The expense ratios shown are subject to change and may differ from the annualized expense ratios shown in the financial highlights of this report, which only include net expenses from affiliated master portfolios. |
| 2 | The manager has contractually committed through June 30, 2020, to waive fees and/or reimburse expenses to the extent necessary to cap total annual fund operating expenses after fee waivers at 0.68% for Class A, 1.43% for Class C, 0.37% for Class R4, and 0.22% for Class R6. Brokerage commissions, stamp duty fees, interest, taxes, acquired fund fees and expenses (if any) from funds in which the affiliated master portfolios invest and from money market funds, and extraordinary expenses are excluded from the expense caps. All other acquired fund fees and expenses from the affiliated master portfolios are included in the expense caps. Prior to or after the commitment expiration date, the caps may be increased or the commitment to maintain the caps may be terminated only with the approval of the Board of Trustees. Without these caps, the Fund’s returns would have been lower. The expense ratio paid by an investor is the net expense ratio (the total annual fund operating expenses after fee waivers) as stated in the prospectuses. |
| 3 | The S&P Target Date Index is designed as a benchmark for multi-asset class portfolios with risk profiles that become more conservative over time, corresponding to the target retirement date. This index is representative of the investment opportunity available to investors for the target date horizon, with asset class exposures driven by a survey of available target date funds for that horizon. You cannot invest directly in an index. |
| 4 | Source: Wells Fargo Funds Management, LLC. The Wells Fargo Dynamic Target Blended Index is designed as a benchmark for multi-asset class portfolios with risk profiles that become more conservative over time, corresponding to the target retirement date. The index weightings among the major asset classes are adjusted annually. The inception date of the index is September 21, 2018. See Appendix I for additional information. You cannot invest directly in an index. |
| 5 | The chart compares the performance of Class A shares since inception with the S&P Target Date 2040 Index and the Wells Fargo Dynamic Target 2040 Blended Index. The chart assumes a hypothetical investment of $10,000 in Class A shares and reflects all operating expenses and assumes the maximum initial sales charge of 5.75%. |
| 6 | Holdings, excluding cash, cash equivalents and any money market funds, are calculated based on the value of the investments divided by total net assets of the Fund. Holdings are subject to change and may have changed since the date specified. |
| 7 | The effective allocation includes the effect of any tactical futures overlay that may be in place. Effective cash, if any, represents the net offset to such future positions. The effective allocation does not reflect futures positions held in dynamic risk hedging strategies. Effective allocations are subject to change and may have changed since the date specified. |
| 8 | These metrics show the degree and timing of the Fund’s fluctuations compared to S&P Target Date 2040 Index over 36 months. |
| 9 | Beta measures fund volatility relative to general market movements. It is a standardized measure of systematic risk in comparison with a specified index. The benchmark beta is 1.00 by definition. Beta is based on historical performance and does not represent future results. |
| 10 | Standard deviation is the square root of the sum of squared deviations from the mean. It is often used as a measure of volatility, variability, or risk. Standard deviation is based on historical performance and does not represent future results. |
| 11 | R-squared (R2) is a statistical measure that reflects the percentage of a fund’s movements that can be explained by movements in its benchmark index. The measure ranges from 0.0, which means that the fund’s performance bears no relationship to the performance of the index, to 1.0, which means that the fund’s performance was perfectly synchronized with the performance of the benchmark. R2 is based on historical performance and does not represent future results. |
Target Date Retirement Funds | 27
Table of Contents
Performance highlights (unaudited)
Average annual total returns (%) as of February 29, 2020
| Including sales charge | Excluding sales charge | Expense ratios1 (%) | ||||||||||||||||||||||||
| Inception date | 1 year | Since inception | 1 year | Since inception | Gross | Net2 | ||||||||||||||||||||
| Class A (WTDGX) | 11-30-2015 | -4.27 | 5.59 | 1.53 | 7.08 | 4.17 | 0.68 | |||||||||||||||||||
| Class C (WTDHX) | 11-30-2015 | -0.22 | 6.26 | 0.78 | 6.26 | 4.92 | 1.43 | |||||||||||||||||||
| Class R4 (WTDJX) | 11-30-2015 | – | – | 1.83 | 7.38 | 3.89 | 0.37 | |||||||||||||||||||
| Class R6 (WTDKX) | 11-30-2015 | – | – | 1.97 | 7.54 | 3.74 | 0.22 | |||||||||||||||||||
| S&P Target Date 2045 Index3 | – | – | – | 3.43 | 7.26 | * | – | – | ||||||||||||||||||
| Wells Fargo Dynamic Target 2045 Blended Index4 | – | – | – | 1.75 | – | – | – | |||||||||||||||||||
| * | Based on the inception date of the oldest Fund class. |
Figures quoted represent past performance, which is no guarantee of future results, and do not reflect taxes that a shareholder may pay on an investment in a fund. Investment return and principal value of an investment will fluctuate so that an investor’s shares, when redeemed, may be worth more or less than their original cost. Performance shown without sales charges would be lower if sales charges were reflected. Current performance may be lower or higher than the performance data quoted and assumes the reinvestment of dividends and capital gains. Currentmonth-end performance is available on the Fund’s website,wfam.com.
Index returns do not include transaction costs associated with buying and selling securities, any mutual fund fees or expenses, or any taxes. It is not possible to invest directly in an index.
For Class A shares, the maximumfront-end sales charge is 5.75%. For Class C shares, the maximum contingent deferred sales charge is 1.00%. Performance including a contingent deferred sales charge assumes the sales charge for the corresponding time period. Class R4 and Class R6 shares are sold without afront-end sales charge or contingent deferred sales charge.
| Growth of $10,000 investment as of February 29, 20205 |
|

Please see footnotes on page 30.
28 | Target Date Retirement Funds
Table of Contents
Performance highlights (unaudited)
Dynamic Target 2045 Fund (continued)
| Holdings (%) as of February 29, 20206 | ||||
Wells Fargo Factor Enhanced Large Cap Portfolio | 43.76 | |||
Wells Fargo Factor Enhanced International Portfolio | 28.19 | |||
Wells Fargo Factor Enhanced Small Cap Portfolio | 10.95 | |||
Wells Fargo Factor Enhanced Emerging Markets Portfolio | 8.48 | |||
Wells Fargo Bloomberg Barclays US Aggregateex-Corporate Portfolio | 5.97 | |||
Wells Fargo Investment Grade Corporate Bond Portfolio | 3.08 | |||
Wells Fargo Emerging Markets Bond Portfolio | 0.49 | |||
Wells Fargo High Yield Corporate Bond Portfolio | 0.48 | |||
| Volatility metrics as of February 29, 20208 | ||||||||||||
| Beta9 | Standard deviation10 | R-squared11 | ||||||||||
Class A | 0.96 | 10.61 | % | 0.98 | ||||||||
Class C | 0.96 | 10.62 | % | 0.98 | ||||||||
Class R4 | 0.96 | 10.59 | % | 0.98 | ||||||||
Class R6 | 0.96 | 10.56 | % | 0.98 | ||||||||
| Allocations (%) as of February 29, 2020 | ||||||||
| Neutral Allocation | Effective Allocation7 | |||||||
Equity | 91 | 91 | ||||||
Fixed Income | 9 | 9 | ||||||
Please see footnotes on page 30.
Target Date Retirement Funds | 29
Table of Contents
Performance highlights (unaudited)
Dynamic Target 2045 Fund (continued)
| 1 | Reflects the expense ratios as stated in the most recent prospectuses, which include the impact of 0.15% of acquired fund fees and expenses. Net expenses from affiliated master portfolios are included in the acquired fund fees and expense amount. The expense ratios shown are subject to change and may differ from the annualized expense ratios shown in the financial highlights of this report, which only include net expenses from affiliated master portfolios. |
| 2 | The manager has contractually committed through June 30, 2020, to waive fees and/or reimburse expenses to the extent necessary to cap total annual fund operating expenses after fee waivers at 0.68% for Class A, 1.43% for Class C, 0.37% for Class R4, and 0.22% for Class R6. Brokerage commissions, stamp duty fees, interest, taxes, acquired fund fees and expenses (if any) from funds in which the affiliated master portfolios invest and from money market funds, and extraordinary expenses are excluded from the expense caps. All other acquired fund fees and expenses from the affiliated master portfolios are included in the expense caps. Prior to or after the commitment expiration date, the caps may be increased or the commitment to maintain the caps may be terminated only with the approval of the Board of Trustees. Without these caps, the Fund’s returns would have been lower. The expense ratio paid by an investor is the net expense ratio (the total annual fund operating expenses after fee waivers) as stated in the prospectuses. |
| 3 | The S&P Target Date Index is designed as a benchmark for multi-asset class portfolios with risk profiles that become more conservative over time, corresponding to the target retirement date. This index is representative of the investment opportunity available to investors for the target date horizon, with asset class exposures driven by a survey of available target date funds for that horizon. You cannot invest directly in an index. |
| 4 | Source: Wells Fargo Funds Management, LLC. The Wells Fargo Dynamic Target Blended Index is designed as a benchmark for multi-asset class portfolios with risk profiles that become more conservative over time, corresponding to the target retirement date. The index weightings among the major asset classes are adjusted annually. The inception date of the index is September 21, 2018. See Appendix I for additional information. You cannot invest directly in an index. |
| 5 | The chart compares the performance of Class A shares since inception with the S&P Target Date 2045 Index and the Wells Fargo Dynamic Target 2045 Blended Index. The chart assumes a hypothetical investment of $10,000 in Class A shares and reflects all operating expenses and assumes the maximum initial sales charge of 5.75%. |
| 6 | Holdings, excluding cash, cash equivalents and any money market funds, are calculated based on the value of the investments divided by total net assets of the Fund. Holdings are subject to change and may have changed since the date specified. |
| 7 | The effective allocation includes the effect of any tactical futures overlay that may be in place. Effective cash, if any, represents the net offset to such future positions. The effective allocation does not reflect futures positions held in dynamic risk hedging strategies. Effective allocations are subject to change and may have changed since the date specified. |
| 8 | These metrics show the degree and timing of the Fund’s fluctuations compared to S&P Target Date 2045 Index over 36 months. |
| 9 | Beta measures fund volatility relative to general market movements. It is a standardized measure of systematic risk in comparison with a specified index. The benchmark beta is 1.00 by definition. Beta is based on historical performance and does not represent future results. |
| 10 | Standard deviation is the square root of the sum of squared deviations from the mean. It is often used as a measure of volatility, variability, or risk. Standard deviation is based on historical performance and does not represent future results. |
| 11 | R-squared (R2) is a statistical measure that reflects the percentage of a fund’s movements that can be explained by movements in its benchmark index. The measure ranges from 0.0, which means that the fund’s performance bears no relationship to the performance of the index, to 1.0, which means that the fund’s performance was perfectly synchronized with the performance of the benchmark. R2 is based on historical performance and does not represent future results. |
30 | Target Date Retirement Funds
Table of Contents
Performance highlights (unaudited)
Average annual total returns (%) as of February 29, 2020
| Including sales charge | Excluding sales charge | Expense ratios1 (%) | ||||||||||||||||||||||||
| Inception date | 1 year | Since inception | 1 year | Since inception | Gross | Net2 | ||||||||||||||||||||
| Class A (WTDLX) | 11-30-2015 | -4.87 | 5.40 | 0.90 | * | 6.88 | 4.33 | 0.68 | ||||||||||||||||||
| Class C (WTDMX) | 11-30-2015 | -0.74 | 6.10 | 0.26 | 6.10 | 5.08 | 1.43 | |||||||||||||||||||
| Class R4 (WTDOX) | 11-30-2015 | – | – | 1.22 | 7.21 | 4.05 | 0.37 | |||||||||||||||||||
| Class R6 (WTDPX) | 11-30-2015 | – | – | 1.47 | 7.38 | 3.90 | 0.22 | |||||||||||||||||||
| S&P Target Date 2050 Index3 | – | – | – | 3.24 | 7.36 | ** | – | – | ||||||||||||||||||
| Wells Fargo Dynamic Target 2050 Blended Index4 | – | – | – | 1.29 | – | – | – | |||||||||||||||||||
| * | Total return differs from the return in the Financial Highlights in this report. The total return presented is calculated based on the NAV at which the shareholder transactions were processed. The NAV and total return presented in the Financial Highlights reflects certain adjustments made to the net assets of the Fund that are necessary under U.S. generally accepted accounting principles. |
| ** | Based on the inception date of the oldest Fund class. |
Figures quoted represent past performance, which is no guarantee of future results, and do not reflect taxes that a shareholder may pay on an investment in a fund. Investment return and principal value of an investment will fluctuate so that an investor’s shares, when redeemed, may be worth more or less than their original cost. Performance shown without sales charges would be lower if sales charges were reflected. Current performance may be lower or higher than the performance data quoted and assumes the reinvestment of dividends and capital gains. Currentmonth-end performance is available on the Fund’s website, wfam.com.
Index returns do not include transaction costs associated with buying and selling securities, any mutual fund fees or expenses, or any taxes. It is not possible to invest directly in an index.
For Class A shares, the maximumfront-end sales charge is 5.75%. For Class C shares, the maximum contingent deferred sales charge is 1.00%. Performance including a contingent deferred sales charge assumes the sales charge for the corresponding time period. Class R4 and Class R6 shares are sold without afront-end sales charge or contingent deferred sales charge.
| Growth of $10,000 investment as of February 29, 20205 |
|
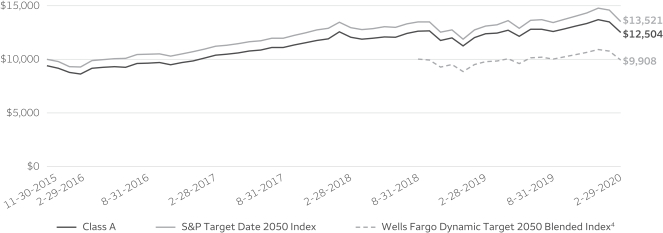
Please see footnotes on page 33.
Target Date Retirement Funds | 31
Table of Contents
Performance highlights (unaudited)
Dynamic Target 2050 Fund (continued)
| Holdings (%) as of February 29, 20206 | ||||
Wells Fargo Factor Enhanced Large Cap Portfolio | 45.55 | |||
Wells Fargo Factor Enhanced International Portfolio | 29.85 | |||
Wells Fargo Factor Enhanced Small Cap Portfolio | 11.38 | |||
Wells Fargo Factor Enhanced Emerging Markets Portfolio | 8.98 | |||
Wells Fargo Bloomberg Barclays US Aggregateex-Corporate Portfolio | 3.37 | |||
Wells Fargo Investment Grade Corporate Bond Portfolio | 1.74 | |||
Wells Fargo Emerging Markets Bond Portfolio | 0.27 | |||
Wells Fargo High Yield Corporate Bond Portfolio | 0.27 | |||
| Volatility metrics as of February 29, 20208 | ||||||||||||
| Beta9 | Standard deviation10 | R-squared11 | ||||||||||
Class A | 0.97 | 10.93 | % | 0.99 | ||||||||
Class C | 0.96 | 10.89 | % | 0.98 | ||||||||
Class R4 | 0.96 | 10.87 | % | 0.99 | ||||||||
Class R6 | 0.96 | 10.87 | % | 0.98 | ||||||||
| Allocations (%) as of February 29, 2020 | ||||||||
| Neutral Allocation | Effective Allocation7 | |||||||
Equity | 95 | 95 | ||||||
Fixed Income | 5 | 5 | ||||||
Please see footnotes on page 33.
32 | Target Date Retirement Funds
Table of Contents
Performance highlights (unaudited)
Dynamic Target 2050 Fund (continued)
| 1 | Reflects the expense ratios as stated in the most recent prospectuses, which include the impact of 0.15% of acquired fund fees and expenses. Net expenses from affiliated master portfolios are included in the acquired fund fees and expense amount. The expense ratios shown are subject to change and may differ from the annualized expense ratios shown in the financial highlights of this report, which only include net expenses from affiliated master portfolios. |
| 2 | The manager has contractually committed through June 30, 2020, to waive fees and/or reimburse expenses to the extent necessary to cap total annual fund operating expenses after fee waivers at 0.68% for Class A, 1.43% for Class C, 0.37% for Class R4, and 0.22% for Class R6. Brokerage commissions, stamp duty fees, interest, taxes, acquired fund fees and expenses (if any) from funds in which the affiliated master portfolios invest and from money market funds, and extraordinary expenses are excluded from the expense caps. All other acquired fund fees and expenses from the affiliated master portfolios are included in the expense caps. Prior to or after the commitment expiration date, the caps may be increased or the commitment to maintain the caps may be terminated only with the approval of the Board of Trustees. Without these caps, the Fund’s returns would have been lower. The expense ratio paid by an investor is the net expense ratio (the total annual fund operating expenses after fee waivers) as stated in the prospectuses. |
| 3 | The S&P Target Date Index is designed as a benchmark for multi-asset class portfolios with risk profiles that become more conservative over time, corresponding to the target retirement date. This index is representative of the investment opportunity available to investors for the target date horizon, with asset class exposures driven by a survey of available target date funds for that horizon. You cannot invest directly in an index. |
| 4 | Source: Wells Fargo Funds Management, LLC. The Wells Fargo Dynamic Target Blended Index is designed as a benchmark for multi-asset class portfolios with risk profiles that become more conservative over time, corresponding to the target retirement date. The index weightings among the major asset classes are adjusted annually. The inception date of the index is September 21, 2018. See Appendix I for additional information. You cannot invest directly in an index. |
| 5 | The chart compares the performance of Class A shares since inception with the S&P Target Date 2050 Index and the Wells Fargo Dynamic Target 2050 Blended Index. The chart assumes a hypothetical investment of $10,000 in Class A shares and reflects all operating expenses and assumes the maximum initial sales charge of 5.75%. |
| 6 | Holdings, excluding cash, cash equivalents and any money market funds, are calculated based on the value of the investments divided by total net assets of the Fund. Holdings are subject to change and may have changed since the date specified. |
| 7 | The effective allocation includes the effect of any tactical futures overlay that may be in place. Effective cash, if any represents the net offset to such future positions. The effective allocation does not reflect futures positions held in dynamic risk hedging strategies. Effective allocations are subject to change and may have changed since the date specified. |
| 8 | These metrics show the degree and timing of the Fund’s fluctuations compared to S&P Target Date 2050 Index over 36 months. |
| 9 | Beta measures fund volatility relative to general market movements. It is a standardized measure of systematic risk in comparison with a specified index. The benchmark beta is 1.00 by definition. Beta is based on historical performance and does not represent future results. |
| 10 | Standard deviation is the square root of the sum of squared deviations from the mean. It is often used as a measure of volatility, variability, or risk. Standard deviation is based on historical performance and does not represent future results. |
| 11 | R-squared (R2) is a statistical measure that reflects the percentage of a fund’s movements that can be explained by movements in its benchmark index. The measure ranges from 0.0, which means that the fund’s performance bears no relationship to the performance of the index, to 1.0, which means that the fund’s performance was perfectly synchronized with the performance of the benchmark. R2 is based on historical performance and does not represent future results. |
Target Date Retirement Funds | 33
Table of Contents
Performance highlights (unaudited)
Average annual total returns (%) as of February 29, 2020
| Including sales charge | Excluding sales charge | Expense ratios1 (%) | ||||||||||||||||||||||||
| Inception date | 1 year | Since inception | 1 year | Since inception | Gross | Net2 | ||||||||||||||||||||
| Class A (WTDQX) | 11-30-2015 | -4.82 | 5.41 | 0.95 | 6.89 | 4.29 | 0.68 | |||||||||||||||||||
| Class C (WTDRX) | 11-30-2015 | -0.74 | 6.10 | 0.26 | 6.10 | 5.04 | 1.43 | |||||||||||||||||||
| Class R4 (WTDTX) | 11-30-2015 | – | – | 1.24 | 7.20 | 4.01 | 0.37 | |||||||||||||||||||
| Class R6 (WTDUX) | 11-30-2015 | – | – | 1.38 | 7.36 | 3.86 | 0.22 | |||||||||||||||||||
| S&P Target Date 2055 Index3 | – | – | – | 3.17 | 7.44 | * | – | – | ||||||||||||||||||
| Wells Fargo Dynamic Target 2055 Blended Index4 | – | – | – | 1.29 | – | – | – | |||||||||||||||||||
| * | Based on the inception date of the oldest Fund class. |
Figures quoted represent past performance, which is no guarantee of future results, and do not reflect taxes that a shareholder may pay on an investment in a fund. Investment return and principal value of an investment will fluctuate so that an investor’s shares, when redeemed, may be worth more or less than their original cost. Performance shown without sales charges would be lower if sales charges were reflected. Current performance may be lower or higher than the performance data quoted and assumes the reinvestment of dividends and capital gains. Currentmonth-end performance is available on the Fund’s website,wfam.com.
Index returns do not include transaction costs associated with buying and selling securities, any mutual fund fees or expenses, or any taxes. It is not possible to invest directly in an index.
For Class A shares, the maximumfront-end sales charge is 5.75%. For Class C shares, the maximum contingent deferred sales charge is 1.00%. Performance including a contingent deferred sales charge assumes the sales charge for the corresponding time period. Class R4 and Class R6 shares are sold without afront-end sales charge or contingent deferred sales charge.
| Growth of $10,000 investment as of February 29, 20205 |
|

Please see footnotes on page 36.
34 | Target Date Retirement Funds
Table of Contents
Performance highlights (unaudited)
Dynamic Target 2055 Fund (continued)
| Holdings (%) as of February 29, 20206 | ||||
Wells Fargo Factor Enhanced Large Cap Portfolio | 45.47 | |||
Wells Fargo Factor Enhanced International Portfolio | 29.79 | |||
Wells Fargo Factor Enhanced Small Cap Portfolio | 11.38 | |||
Wells Fargo Factor Enhanced Emerging Markets Portfolio | 8.95 | |||
Wells Fargo Bloomberg Barclays US Aggregateex-Corporate Portfolio | 3.37 | |||
Wells Fargo Investment Grade Corporate Bond Portfolio | 1.73 | |||
Wells Fargo Emerging Markets Bond Portfolio | 0.27 | |||
Wells Fargo High Yield Corporate Bond Portfolio | 0.27 | |||
| Allocations (%) as of February 29, 2020 | ||||||||
| Neutral Allocation | Effective Allocation7 | |||||||
Equity | 95 | 95 | ||||||
Fixed Income | 5 | 5 | ||||||
| Volatility metrics as of February 29, 20208 | ||||||||||||
| Beta9 | Standard deviation10 | R-squared11 | ||||||||||
Class A | 0.96 | 10.88 | % | 0.99 | ||||||||
Class C | 0.96 | 10.90 | % | 0.99 | ||||||||
Class R4 | 0.95 | 10.86 | % | 0.99 | ||||||||
Class R6 | 0.96 | 10.90 | % | 0.99 | ||||||||
Please see footnotes on page 36.
Target Date Retirement Funds | 35
Table of Contents
Performance highlights (unaudited)
Dynamic Target 2055 Fund (continued)
| 1 | Reflects the expense ratios as stated in the most recent prospectuses, which include the impact of 0.15% of acquired fund fees and expenses. Net expenses from affiliated master portfolios are included in the acquired fund fees and expense amount. The expense ratios shown are subject to change and may differ from the annualized expense ratios shown in the financial highlights of this report, which only include net expenses from affiliated master portfolios. |
| 2 | The manager has contractually committed through June 30, 2020, to waive fees and/or reimburse expenses to the extent necessary to cap total annual fund operating expenses after fee waivers at 0.68% for Class A, 1.43% for Class C, 0.37% for Class R4, and 0.22% for Class R6. Brokerage commissions, stamp duty fees, interest, taxes, acquired fund fees and expenses (if any) from funds in which the affiliated master portfolios invest and from money market funds, and extraordinary expenses are excluded from the expense caps. All other acquired fund fees and expenses from the affiliated master portfolios are included in the expense caps. Prior to or after the commitment expiration date, the caps may be increased or the commitment to maintain the caps may be terminated only with the approval of the Board of Trustees. Without these caps, the Fund’s returns would have been lower. The expense ratio paid by an investor is the net expense ratio (the total annual fund operating expenses after fee waivers) as stated in the prospectuses. |
| 3 | The S&P Target Date Index is designed as a benchmark for multi-asset class portfolios with risk profiles that become more conservative over time, corresponding to the target retirement date. This index is representative of the investment opportunity available to investors for the target date horizon, with asset class exposures driven by a survey of available target date funds for that horizon. You cannot invest directly in an index. |
| 4 | Source: Wells Fargo Funds Management, LLC. The Wells Fargo Dynamic Target Blended Index is designed as a benchmark for multi-asset class portfolios with risk profiles that become more conservative over time, corresponding to the target retirement date. The index weightings among the major asset classes are adjusted annually. The inception date of the index is September 21, 2018. See Appendix I for additional information. You cannot invest directly in an index. |
| 5 | The chart compares the performance of Class A shares since inception with the S&P Target Date 2055 Index and the Wells Fargo Dynamic Target 2055 Blended Index. The chart assumes a hypothetical investment of $10,000 in Class A shares and reflects all operating expenses and assumes the maximum initial sales charge of 5.75%. |
| 6 | Holdings, excluding cash, cash equivalents and any money market funds, are calculated based on the value of the investments divided by total net assets of the Fund. Holdings are subject to change and may have changed since the date specified. |
| 7 | The effective allocation includes the effect of any tactical futures overlay that may be in place. Effective cash, if any, represents the net offset to such future positions. The effective allocation does not reflect futures positions held in dynamic risk hedging strategies. Effective allocations are subject to change and may have changed since the date specified. |
| 8 | These metrics show the degree and timing of the Fund’s fluctuations compared to S&P Target Date 2055 Index over 36 months. |
| 9 | Beta measures fund volatility relative to general market movements. It is a standardized measure of systematic risk in comparison with a specified index. The benchmark beta is 1.00 by definition. Beta is based on historical performance and does not represent future results. |
| 10 | Standard deviation is the square root of the sum of squared deviations from the mean. It is often used as a measure of volatility, variability, or risk. Standard deviation is based on historical performance and does not represent future results. |
| 11 | R-squared (R2) is a statistical measure that reflects the percentage of a fund’s movements that can be explained by movements in its benchmark index. The measure ranges from 0.0, which means that the fund’s performance bears no relationship to the performance of the index, to 1.0, which means that the fund’s performance was perfectly synchronized with the performance of the benchmark. R2 is based on historical performance and does not represent future results. |
36 | Target Date Retirement Funds
Table of Contents
Performance highlights (unaudited)
Average annual total returns (%) as of February 29, 2020
| Including sales charge | Excluding sales charge | Expense ratios1 (%) | ||||||||||||||||||||||||
| Inception date | 1 year | Since inception | 1 year | Since inception | Gross | Net2 | ||||||||||||||||||||
| Class A (WTDVX) | 11-30-2015 | -4.76 | 5.46 | 1.01 | 6.94 | 4.29 | 0.68 | |||||||||||||||||||
| Class C (WTDWX) | 11-30-2015 | -0.74 | 6.13 | 0.26 | * | 6.13 | 5.04 | 1.43 | ||||||||||||||||||
| Class R4 (WTDZX) | 11-30-2015 | – | – | 1.34 | 7.26 | 4.01 | 0.37 | |||||||||||||||||||
| Class R6 (WTSZX) | 11-30-2015 | – | – | 1.38 | * | 7.41 | 3.86 | 0.22 | ||||||||||||||||||
| S&P Target Date 2055 Index3 | 3.17 | 7.44 | ** | – | – | |||||||||||||||||||||
| S&P Target Date 2060+ Index3,*** | – | – | – | 3.25 | – | – | – | |||||||||||||||||||
| Wells Fargo Dynamic Target 2060 Blended Index4 | – | – | – | 1.29 | – | – | – | |||||||||||||||||||
| * | Total return differs from the return in the Financial Highlights in this report. The total return presented is calculated based on the NAV at which the shareholder transactions were processed. The NAV and total return presented in the Financial Highlights reflects certain adjustments made to the net assets of the Fund that are necessary under U.S. generally accepted accounting principles. |
| ** | Based on the inception date of the oldest Fund class. |
| *** | The inception date of the index is May 31, 2016. |
Figures quoted represent past performance, which is no guarantee of future results, and do not reflect taxes that a shareholder may pay on an investment in a fund. Investment return and principal value of an investment will fluctuate so that an investor’s shares, when redeemed, may be worth more or less than their original cost. Performance shown without sales charges would be lower if sales charges were reflected. Current performance may be lower or higher than the performance data quoted and assumes the reinvestment of dividends and capital gains. Currentmonth-end performance is available on the Fund’s website, wfam.com.
Index returns do not include transaction costs associated with buying and selling securities, any mutual fund fees or expenses, or any taxes. It is not possible to invest directly in an index.
For Class A shares, the maximumfront-end sales charge is 5.75%. For Class C shares, the maximum contingent deferred sales charge is 1.00%. Performance including a contingent deferred sales charge assumes the sales charge for the corresponding time period. Class R4 and Class R6 shares are sold without afront-end sales charge or contingent deferred sales charge.
| Growth of $10,000 investment as of February 29, 20205 |
|
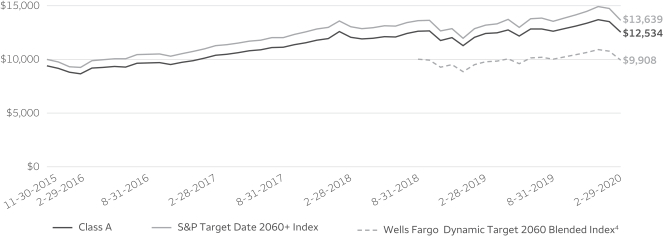
Please see footnotes on page 39.
Target Date Retirement Funds | 37
Table of Contents
Performance highlights (unaudited)
Dynamic Target 2060 Fund (continued)
| Holdings (%) as of February 29, 20206 | ||||
Wells Fargo Factor Enhanced Large Cap Portfolio | 45.48 | |||
Wells Fargo Factor Enhanced International Portfolio | 29.82 | |||
Wells Fargo Factor Enhanced Small Cap Portfolio | 11.37 | |||
Wells Fargo Factor Enhanced Emerging Markets Portfolio | 8.97 | |||
Wells Fargo Bloomberg Barclays US Aggregateex-Corporate Portfolio | 3.37 | |||
Wells Fargo Investment Grade Corporate Bond Portfolio | 1.73 | |||
Wells Fargo Emerging Markets Bond Portfolio | 0.28 | |||
Wells Fargo High Yield Corporate Bond Portfolio | 0.27 | |||
Wells Fargo U.S. REIT Portfolio | 0.12 | |||
| Allocations (%) as of February 29, 2020 | ||||||||
| Neutral Allocation | Effective Allocation7 | |||||||
Equity | 95 | 95 | ||||||
Fixed Income | 5 | 5 | ||||||
| Volatility metrics as of February 29, 20208 | ||||||||||||
| Beta9 | Standard deviation10 | R-squared11 | ||||||||||
Class A | 0.95 | 10.87 | % | 0.99 | ||||||||
Class C | 0.95 | 10.85 | % | 0.99 | ||||||||
Class R4 | 0.95 | 10.87 | % | 0.99 | ||||||||
Class R6 | 0.95 | 10.89 | % | 0.99 | ||||||||
Please see footnotes on page 39.
38 | Target Date Retirement Funds
Table of Contents
Performance highlights (unaudited)
Dynamic Target 2060 Fund (continued)
| 1 | Reflects the expense ratios as stated in the most recent prospectuses, which include the impact of 0.15% of acquired fund fees and expenses. Net expenses from affiliated master portfolios are included in the acquired fund fees and expense amount. The expense ratios shown are subject to change and may differ from the annualized expense ratios shown in the financial highlights of this report, which only include net expenses from affiliated master portfolios. |
| 2 | The manager has contractually committed through June 30, 2020, to waive fees and/or reimburse expenses to the extent necessary to cap total annual fund operating expenses after fee waivers at 0.68% for Class A, 1.43% for Class C, 0.37% for Class R4, and 0.22% for Class R6. Brokerage commissions, stamp duty fees, interest, taxes, acquired fund fees and expenses (if any) from funds in which the affiliated master portfolios invest and from money market funds, and extraordinary expenses are excluded from the expense caps. All other acquired fund fees and expenses from the affiliated master portfolios are included in the expense caps. Prior to or after the commitment expiration date, the caps may be increased or the commitment to maintain the caps may be terminated only with the approval of the Board of Trustees. Without these caps, the Fund’s returns would have been lower. The expense ratio paid by an investor is the net expense ratio (the total annual fund operating expenses after fee waivers) as stated in the prospectuses. |
| 3 | The S&P Target Date Index is designed as a benchmark for multi-asset class portfolios with risk profiles that become more conservative over time, corresponding to the target retirement date. This index is representative of the investment opportunity available to investors for the target date horizon, with asset class exposures driven by a survey of available target date funds for that horizon. You cannot invest directly in an index. |
| 4 | Source: Wells Fargo Funds Management, LLC. The Wells Fargo Dynamic Target Blended Index is designed as a benchmark for multi-asset class portfolios with risk profiles that become more conservative over time, corresponding to the target retirement date. The index weightings among the major asset classes are adjusted annually. The inception date of the index is September 21, 2018. See Appendix I for additional information. You cannot invest directly in an index. |
| 5 | The chart compares the performance of Class A shares since inception with the S&P Target Date 2060+ Index and the Wells Fargo Dynamic Target 2060 Blended Index. The performance shown for the S&P Target Date 2060+ Index represents the returns of the S&P Target Date 2055 Index from 11/30/2015 to 4/30/2016 and the S&P Target Date 2060+ Index from 5/31/2016 (index inception date) through period end. The chart assumes a hypothetical investment of $10,000 in Class A shares and reflects all operating expenses and assumes the maximum initial sales charge of 5.75%. |
| 6 | Holdings, excluding cash, cash equivalents and any money market funds, are calculated based on the value of the investments divided by total net assets of the Fund. Holdings are subject to change and may have changed since the date specified. |
| 7 | The effective allocation includes the effect of any tactical futures overlay that may be in place. Effective cash, if any, represents the net offset to such future positions. The effective allocation does not reflect futures positions held in dynamic risk hedging strategies. Effective allocations are subject to change and may have changed since the date specified. |
| 8 | These metrics show the degree and timing of the Fund’s fluctuations compared to S&P Target Date 2060+ Index over 36 months. |
| 9 | Beta measures fund volatility relative to general market movements. It is a standardized measure of systematic risk in comparison with a specified index. The benchmark beta is 1.00 by definition. Beta is based on historical performance and does not represent future results. |
| 10 | Standard deviation is the square root of the sum of squared deviations from the mean. It is often used as a measure of volatility, variability, or risk. Standard deviation is based on historical performance and does not represent future results. |
| 11 | R-squared (R2) is a statistical measure that reflects the percentage of a fund’s movements that can be explained by movements in its benchmark index. The measure ranges from 0.0, which means that the fund’s performance bears no relationship to the performance of the index, to 1.0, which means that the fund’s performance was perfectly synchronized with the performance of the benchmark. R2 is based on historical performance and does not represent future results. |
Target Date Retirement Funds | 39
Table of Contents
Performance highlights (unaudited)
MANAGER’S DISCUSSION
Highlights
The Wells Fargo Dynamic Target Date Funds seek to manage the asset allocation and risk profile of multi-asset-class funds for investors as they save for their target retirement date. The strategic asset allocations are designed with the goal of providing high levels of diversification across equity and fixed-income investments. Our approach to portfolio construction helps investors make more aggressive allocations when they may be most beneficial while remaining diversified to manage risks during bear markets. In September 2018, we introduced a number of factor-based equity strategies and passively managed fixed-income strategies into the Funds. The results over the period have contributed to relative performance.
The portfolio management team employs three levers as it seeks to manage investment risk.
The Dynamic Target Date Funds portfolio management team incorporates three levers as it seeks to manage investment risk over each Fund’s investment time horizon: tactical asset allocation, volatility management, and tail risk management. Tactical asset allocation, a futures overlay, uses timely shifts toward assets with higher expected returns and is driven by the market outlook of the Wells Fargo Multi-Asset Solutions team. Volatility management reduces exposure to risk assets in high-volatility markets and adds risk assets inlow-volatility markets. Tail risk management uses institutional hedging techniques in an effort to mitigate risk during severe market downturns when a portfolio’s value falls to a specific level. Together, volatility management and tail risk management comprise the Funds’ dynamic risk hedging (DRH) strategy.
During the period, tactical asset allocation benefited all Funds and DRH reduced the Funds’ volatility.
For the12-month period that ended February 29, 2020, each Wells Fargo Dynamic Target Date Fund posted positive returns. The near-dated Funds generated slightly higher absolute returns due to their higher fixed-income allocations.
Eleven funds—each offering four share classes, including two classes with sales charges—comprise the Dynamic Target Date Funds series. In general, the benchmark-relative performance tended to be higher for the near-dated Funds, as those Funds have a higher allocation to fixed-income investments, which tended to outperform over this period. As a whole, the Funds’ underlying style selection contributed to benchmark-relative performance. Domestic assets, both stocks and bonds, tended to have stronger performance than did foreign stocks and bonds.
Over the period, tactical asset allocation activities executed within the Funds detracted from relative performance. The largest contributor to performance was a long yen trade we initiated at the end of March and closed outmid-August. Our bearish market view resulted in losses in the final months of 2019 and beginning of 2020. We initiated a short S&P 500 Index1 position at the end of August, which we subsequently sold out of at the end of October. Additionally, we implemented a long10-year Treasury position in August and consequently closed it out at a loss in January of this year.
The DRH overlay contributed to performance during the period. As the period was marked by low volatility with limited downside movements, the DRH downside risk management was inactive for most of the period with no impact on performance. The period’s low volatility allowed for the volatility management to capitalize on this trend and take positions that added to performance.
Global macroeconomic conditions are clouded by the cornoavirus.
At the time of this writing, the impact of the coronavirus is the major source of global uncertainty. The full impact the coronavirus will have on the economy and the financial markets is unknown. The situation has quickly escalated, but we don’t know if it will hit catastrophic and tragic levels. Initial economic reports show some signs of weakness from the supply and demand disruption caused by the quarantine in China. Concerns over travel are also having a negative impact on the economy. Governments have started to take actions but these efforts are limited and not coordinated. Global central banks have also started to take action as more countries beyond China are being affected by the virus.
So, we return to the question we cannot yet answer: How deep is the damage from the coronavirus? Time will provide us a clearer picture as more data is released. Could the virus kill the economic expansion and hopes of a global rebound from the malaise of 2019? The prognosis is unclear at the moment, but do not count out a U.S. economy that has proven to be resilient. As ofperiod-end, unemployment and inflation were low. Central banks have been accommodative. Industrial production and retail sales have been disappointing. Economic growth forecasts have fallen, so at least the market seems to be pricing in lower growth. As more information becomes available, we will continue to reevaluate the portfolio’s risk/reward composition and make adjustments as required.
| 1 | The S&P 500 Index consists of 500 stocks chosen for market size, liquidity, and industry group representation. It is a market-value-weighted index with each stock’s weight in the index proportionate to its market value. You cannot invest directly in an index. |
40 | Target Date Retirement Funds
Table of Contents
As a shareholder of the Fund, you incur two types of costs: (1) transaction costs, including sales charges (loads) on purchase payments and contingent deferred sales charges (if any) on redemptions and (2) ongoing costs, including management fees, distribution(12b-1) and/or shareholder servicing fees, and other Fund expenses. This example is intended to help you understand your ongoing costs (in dollars) of investing in the Fund and to compare these costs with the ongoing costs of investing in other mutual funds.
The example is based on an investment of $1,000 invested at the beginning of thesix-month period and held for the entire period from September 1, 2019 to February 29, 2020.
Actual expenses
The “Actual” line of the table below provides information about actual account values and actual expenses. You may use the information in this line, together with the amount you invested, to estimate the expenses that you paid over the period. Simply divide your account value by $1,000 (for example, an $8,600 account value divided by $1,000 = 8.6), then multiply the result by the number in the “Actual” line under the heading entitled “Expenses paid during period” for your applicable class of shares to estimate the expenses you paid on your account during this period.
Hypothetical example for comparison purposes
The “Hypothetical” line of the table below provides information about hypothetical account values and hypothetical expenses based on the Fund’s actual expense ratio and an assumed rate of return of 5% per year before expenses, which is not the Fund’s actual return. The hypothetical account values and expenses may not be used to estimate the actual ending account balance or expenses you paid for the period. You may use this information to compare the ongoing costs of investing in the Fund and other funds. To do so, compare this 5% hypothetical example with the 5% hypothetical examples that appear in the shareholder reports of the other funds.
Please note that the expenses shown in the table are meant to highlight your ongoing costs only and do not reflect any transactional costs, such as sales charges (loads) and contingent deferred sales charges. Therefore, the “Hypothetical” line of the table is useful in comparing ongoing costs only and will not help you determine the relative total costs of owning different funds. In addition, if these transactional costs were included, your costs would have been higher.
| Dynamic Target Today Fund | Beginning account value 9-1-2019 | Ending account value 2-29-2020 | Expenses paid during the period¹ | Annualized net expense ratio | ||||||||||||
Class A | ||||||||||||||||
Actual | $ | 1,000.00 | $ | 1,014.30 | $ | 3.36 | 0.67 | % | ||||||||
Hypothetical (5% return before expenses) | $ | 1,000.00 | $ | 1,021.53 | $ | 3.37 | 0.67 | % | ||||||||
Class C | ||||||||||||||||
Actual | $ | 1,000.00 | $ | 1,009.95 | $ | 7.10 | 1.42 | % | ||||||||
Hypothetical (5% return before expenses) | $ | 1,000.00 | $ | 1,017.80 | $ | 7.12 | 1.42 | % | ||||||||
Class R4 | ||||||||||||||||
Actual | $ | 1,000.00 | $ | 1,015.97 | $ | 1.85 | 0.37 | % | ||||||||
Hypothetical (5% return before expenses) | $ | 1,000.00 | $ | 1,023.02 | $ | 1.86 | 0.37 | % | ||||||||
Class R6 | ||||||||||||||||
Actual | $ | 1,000.00 | $ | 1,016.45 | $ | 1.10 | 0.22 | % | ||||||||
Hypothetical (5% return before expenses) | $ | 1,000.00 | $ | 1,023.77 | $ | 1.11 | 0.22 | % | ||||||||
| Dynamic Target 2015 Fund | ||||||||||||||||
Class A | ||||||||||||||||
Actual | $ | 1,000.00 | $ | 1,012.56 | $ | 3.25 | 0.65 | % | ||||||||
Hypothetical (5% return before expenses) | $ | 1,000.00 | $ | 1,021.63 | $ | 3.27 | 0.65 | % | ||||||||
Class C | ||||||||||||||||
Actual | $ | 1,000.00 | $ | 1,009.29 | $ | 7.14 | 1.43 | % | ||||||||
Hypothetical (5% return before expenses) | $ | 1,000.00 | $ | 1,017.75 | $ | 7.17 | 1.43 | % | ||||||||
Class R4 | ||||||||||||||||
Actual | $ | 1,000.00 | $ | 1,013.41 | $ | 1.85 | 0.37 | % | ||||||||
Hypothetical (5% return before expenses) | $ | 1,000.00 | $ | 1,023.02 | $ | 1.86 | 0.37 | % | ||||||||
Class R6 | ||||||||||||||||
Actual | $ | 1,000.00 | $ | 1,014.85 | $ | 1.10 | 0.22 | % | ||||||||
Hypothetical (5% return before expenses) | $ | 1,000.00 | $ | 1,023.77 | $ | 1.11 | 0.22 | % | ||||||||
| 1 | Expenses paid is equal to the annualized net expense ratio of each class multiplied by the average account value over the period, multiplied by the number of days in the most recent fiscal half-year divided by the number of days in the fiscal year (to reflect theone-half-year period). |
Target Date Retirement Funds | 41
Table of Contents
Fund expenses (unaudited)
| Dynamic Target 2020 Fund | Beginning account value 9-1-2019 | Ending account value 2-29-2020 | Expenses paid during the period¹ | Annualized net expense ratio | ||||||||||||
Class A | ||||||||||||||||
Actual | $ | 1,000.00 | $ | 1,008.52 | $ | 3.35 | 0.67 | % | ||||||||
Hypothetical (5% return before expenses) | $ | 1,000.00 | $ | 1,021.53 | $ | 3.37 | 0.67 | % | ||||||||
Class C | ||||||||||||||||
Actual | $ | 1,000.00 | $ | 1,005.66 | $ | 7.13 | 1.43 | % | ||||||||
Hypothetical (5% return before expenses) | $ | 1,000.00 | $ | 1,017.75 | $ | 7.17 | 1.43 | % | ||||||||
Class R4 | ||||||||||||||||
Actual | $ | 1,000.00 | $ | 1,010.68 | $ | 1.85 | 0.37 | % | ||||||||
Hypothetical (5% return before expenses) | $ | 1,000.00 | $ | 1,023.02 | $ | 1.86 | 0.37 | % | ||||||||
Class R6 | ||||||||||||||||
Actual | $ | 1,000.00 | $ | 1,010.15 | $ | 1.10 | 0.22 | % | ||||||||
Hypothetical (5% return before expenses) | $ | 1,000.00 | $ | 1,023.77 | $ | 1.11 | 0.22 | % | ||||||||
| Dynamic Target 2025 Fund | ||||||||||||||||
Class A | ||||||||||||||||
Actual | $ | 1,000.00 | $ | 1,006.05 | $ | 3.24 | 0.65 | % | ||||||||
Hypothetical (5% return before expenses) | $ | 1,000.00 | $ | 1,021.63 | $ | 3.27 | 0.65 | % | ||||||||
Class C | ||||||||||||||||
Actual | $ | 1,000.00 | $ | 1,002.75 | $ | 7.12 | 1.43 | % | ||||||||
Hypothetical (5% return before expenses) | $ | 1,000.00 | $ | 1,017.75 | $ | 7.17 | 1.43 | % | ||||||||
Class R4 | ||||||||||||||||
Actual | $ | 1,000.00 | $ | 1,007.11 | $ | 1.85 | 0.37 | % | ||||||||
Hypothetical (5% return before expenses) | $ | 1,000.00 | $ | 1,023.02 | $ | 1.86 | 0.37 | % | ||||||||
Class R6 | ||||||||||||||||
Actual | $ | 1,000.00 | $ | 1,008.56 | $ | 1.10 | 0.22 | % | ||||||||
Hypothetical (5% return before expenses) | $ | 1,000.00 | $ | 1,023.77 | $ | 1.11 | 0.22 | % | ||||||||
| Dynamic Target 2030 Fund | ||||||||||||||||
Class A | ||||||||||||||||
Actual | $ | 1,000.00 | $ | 1,003.75 | $ | 3.29 | 0.66 | % | ||||||||
Hypothetical (5% return before expenses) | $ | 1,000.00 | $ | 1,021.58 | $ | 3.32 | 0.66 | % | ||||||||
Class C | ||||||||||||||||
Actual | $ | 1,000.00 | $ | 999.07 | $ | 7.11 | 1.43 | % | ||||||||
Hypothetical (5% return before expenses) | $ | 1,000.00 | $ | 1,017.75 | $ | 7.17 | 1.43 | % | ||||||||
Class R4 | ||||||||||||||||
Actual | $ | 1,000.00 | $ | 1,005.23 | $ | 1.84 | 0.37 | % | ||||||||
Hypothetical (5% return before expenses) | $ | 1,000.00 | $ | 1,023.02 | $ | 1.86 | 0.37 | % | ||||||||
Class R6 | ||||||||||||||||
Actual | $ | 1,000.00 | $ | 1,005.68 | $ | 1.10 | 0.22 | % | ||||||||
Hypothetical (5% return before expenses) | $ | 1,000.00 | $ | 1,023.77 | $ | 1.11 | 0.22 | % | ||||||||
| Dynamic Target 2035 Fund | ||||||||||||||||
Class A | ||||||||||||||||
Actual | $ | 1,000.00 | $ | 1,002.12 | $ | 3.24 | 0.65 | % | ||||||||
Hypothetical (5% return before expenses) | $ | 1,000.00 | $ | 1,021.63 | $ | 3.27 | 0.65 | % | ||||||||
Class C | ||||||||||||||||
Actual | $ | 1,000.00 | $ | 997.53 | $ | 7.10 | 1.43 | % | ||||||||
Hypothetical (5% return before expenses) | $ | 1,000.00 | $ | 1,017.75 | $ | 7.17 | 1.43 | % | ||||||||
Class R4 | ||||||||||||||||
Actual | $ | 1,000.00 | $ | 1,003.07 | $ | 1.84 | 0.37 | % | ||||||||
Hypothetical (5% return before expenses) | $ | 1,000.00 | $ | 1,023.02 | $ | 1.86 | 0.37 | % | ||||||||
Class R6 | ||||||||||||||||
Actual | $ | 1,000.00 | $ | 1,003.51 | $ | 1.10 | 0.22 | % | ||||||||
Hypothetical (5% return before expenses) | $ | 1,000.00 | $ | 1,023.77 | $ | 1.11 | 0.22 | % | ||||||||
| 1 | Expenses paid is equal to the annualized net expense ratio of each class multiplied by the average account value over the period, multiplied by the number of days in the most recent fiscal half-year divided by the number of days in the fiscal year (to reflect theone-half-year period). |
42 | Target Date Retirement Funds
Table of Contents
Fund expenses (unaudited)
| Dynamic Target 2040 Fund | Beginning account value 9-1-2019 | Ending account value 2-29-2020 | Expenses paid during the period¹ | Annualized net expense ratio | ||||||||||||
Class A | ||||||||||||||||
Actual | $ | 1,000.00 | $ | 1,000.79 | $ | 3.33 | 0.67 | % | ||||||||
Hypothetical (5% return before expenses) | $ | 1,000.00 | $ | 1,021.53 | $ | 3.37 | 0.67 | % | ||||||||
Class C | ||||||||||||||||
Actual | $ | 1,000.00 | $ | 995.87 | $ | 7.10 | 1.43 | % | ||||||||
Hypothetical (5% return before expenses) | $ | 1,000.00 | $ | 1,017.75 | $ | 7.17 | 1.43 | % | ||||||||
Class R4 | ||||||||||||||||
Actual | $ | 1,000.00 | $ | 1,001.63 | $ | 1.84 | 0.37 | % | ||||||||
Hypothetical (5% return before expenses) | $ | 1,000.00 | $ | 1,023.02 | $ | 1.86 | 0.37 | % | ||||||||
Class R6 | ||||||||||||||||
Actual | $ | 1,000.00 | $ | 1,003.03 | $ | 1.10 | 0.22 | % | ||||||||
Hypothetical (5% return before expenses) | $ | 1,000.00 | $ | 1,023.77 | $ | 1.11 | 0.22 | % | ||||||||
| Dynamic Target 2045 Fund | ||||||||||||||||
Class A | ||||||||||||||||
Actual | $ | 1,000.00 | $ | 996.86 | $ | 3.23 | 0.65 | % | ||||||||
Hypothetical (5% return before expenses) | $ | 1,000.00 | $ | 1,021.63 | $ | 3.27 | 0.65 | % | ||||||||
Class C | ||||||||||||||||
Actual | $ | 1,000.00 | $ | 992.45 | $ | 7.08 | 1.43 | % | ||||||||
Hypothetical (5% return before expenses) | $ | 1,000.00 | $ | 1,017.75 | $ | 7.17 | 1.43 | % | ||||||||
Class R4 | ||||||||||||||||
Actual | $ | 1,000.00 | $ | 996.87 | $ | 1.84 | 0.37 | % | ||||||||
Hypothetical (5% return before expenses) | $ | 1,000.00 | $ | 1,023.02 | $ | 1.86 | 0.37 | % | ||||||||
Class R6 | ||||||||||||||||
Actual | $ | 1,000.00 | $ | 998.27 | $ | 1.09 | 0.22 | % | ||||||||
Hypothetical (5% return before expenses) | $ | 1,000.00 | $ | 1,023.77 | $ | 1.11 | 0.22 | % | ||||||||
| Dynamic Target 2050 Fund | ||||||||||||||||
Class A | ||||||||||||||||
Actual | $ | 1,000.00 | $ | 991.69 | $ | 3.27 | 0.66 | % | ||||||||
Hypothetical (5% return before expenses) | $ | 1,000.00 | $ | 1,021.58 | $ | 3.32 | 0.66 | % | ||||||||
Class C | ||||||||||||||||
Actual | $ | 1,000.00 | $ | 988.31 | $ | 7.07 | 1.43 | % | ||||||||
Hypothetical (5% return before expenses) | $ | 1,000.00 | $ | 1,017.75 | $ | 7.17 | 1.43 | % | ||||||||
Class R4 | ||||||||||||||||
Actual | $ | 1,000.00 | $ | 993.91 | $ | 1.83 | 0.37 | % | ||||||||
Hypothetical (5% return before expenses) | $ | 1,000.00 | $ | 1,023.02 | $ | 1.86 | 0.37 | % | ||||||||
Class R6 | ||||||||||||||||
Actual | $ | 1,000.00 | $ | 994.29 | $ | 1.09 | 0.22 | % | ||||||||
Hypothetical (5% return before expenses) | $ | 1,000.00 | $ | 1,023.77 | $ | 1.11 | 0.22 | % | ||||||||
| Dynamic Target 2055 Fund | ||||||||||||||||
Class A | ||||||||||||||||
Actual | $ | 1,000.00 | $ | 992.19 | $ | 3.32 | 0.67 | % | ||||||||
Hypothetical (5% return before expenses) | $ | 1,000.00 | $ | 1,021.53 | $ | 3.37 | 0.67 | % | ||||||||
Class C | ||||||||||||||||
Actual | $ | 1,000.00 | $ | 989.33 | $ | 7.07 | 1.43 | % | ||||||||
Hypothetical (5% return before expenses) | $ | 1,000.00 | $ | 1,017.75 | $ | 7.17 | 1.43 | % | ||||||||
Class R4 | ||||||||||||||||
Actual | $ | 1,000.00 | $ | 994.05 | $ | 1.83 | 0.37 | % | ||||||||
Hypothetical (5% return before expenses) | $ | 1,000.00 | $ | 1,023.02 | $ | 1.86 | 0.37 | % | ||||||||
Class R6 | ||||||||||||||||
Actual | $ | 1,000.00 | $ | 994.42 | $ | 1.09 | 0.22 | % | ||||||||
Hypothetical (5% return before expenses) | $ | 1,000.00 | $ | 1,023.77 | $ | 1.11 | 0.22 | % | ||||||||
| 1 | Expenses paid is equal to the annualized net expense ratio of each class multiplied by the average account value over the period, multiplied by the number of days in the most recent fiscal half-year divided by the number of days in the fiscal year (to reflect theone-half-year period). |
Target Date Retirement Funds | 43
Table of Contents
Fund expenses (unaudited)
| Dynamic Target 2060 Fund | Beginning account value 9-1-2019 | Ending account value 2-29-2020 | Expenses paid during the period¹ | Annualized net expense ratio | ||||||||||||
Class A | ||||||||||||||||
Actual | $ | 1,000.00 | $ | 992.76 | $ | 3.32 | 0.67 | % | ||||||||
Hypothetical (5% return before expenses) | $ | 1,000.00 | $ | 1,021.53 | $ | 3.37 | 0.67 | % | ||||||||
Class C | ||||||||||||||||
Actual | $ | 1,000.00 | $ | 988.37 | $ | 7.07 | 1.43 | % | ||||||||
Hypothetical (5% return before expenses) | $ | 1,000.00 | $ | 1,017.75 | $ | 7.17 | 1.43 | % | ||||||||
Class R4 | ||||||||||||||||
Actual | $ | 1,000.00 | $ | 994.13 | $ | 1.83 | 0.37 | % | ||||||||
Hypothetical (5% return before expenses) | $ | 1,000.00 | $ | 1,023.02 | $ | 1.86 | 0.37 | % | ||||||||
Class R6 | ||||||||||||||||
Actual | $ | 1,000.00 | $ | 994.50 | $ | 1.09 | 0.22 | % | ||||||||
Hypothetical (5% return before expenses) | $ | 1,000.00 | $ | 1,023.77 | $ | 1.11 | 0.22 | % | ||||||||
| 1 | Expenses paid is equal to the annualized net expense ratio of each class multiplied by the average account value over the period, multiplied by the number of days in the most recent fiscal half-year divided by the number of days in the fiscal year (to reflect theone-half-year period). |
44 | Target Date Retirement Funds
Table of Contents
Portfolio of investments—February 29, 2020
| Value | ||||||||||||||||
Investment Companies: 101.01% | ||||||||||||||||
| Affiliated Master Portfolios: 101.01% | ||||||||||||||||
Wells Fargo Bloomberg Barclays US Aggregateex-Corporate Portfolio | $ | 2,122,216 | ||||||||||||||
Wells Fargo Emerging Markets Bond Portfolio | 176,660 | |||||||||||||||
Wells Fargo Factor Enhanced Emerging Markets Portfolio | 194,992 | |||||||||||||||
Wells Fargo Factor Enhanced International Portfolio | 642,073 | |||||||||||||||
Wells Fargo Factor Enhanced Large Cap Portfolio | 1,211,162 | |||||||||||||||
Wells Fargo Factor Enhanced Small Cap Portfolio | 302,309 | |||||||||||||||
Wells Fargo High Yield Corporate Bond Portfolio | 172,668 | |||||||||||||||
Wells Fargo Investment Grade Corporate Bond Portfolio | 1,099,864 | |||||||||||||||
Wells Fargo Strategic Retirement Bond Portfolio | 715,576 | |||||||||||||||
Wells Fargo U.S. REIT Portfolio | 214,010 | |||||||||||||||
Total Investment Companies (Cost $6,546,517) | 6,851,530 | |||||||||||||||
|
| |||||||||||||||
| Yield | Maturity date | Principal | ||||||||||||||
| Short-Term Investments: 0.24% | ||||||||||||||||
| U.S. Treasury Securities: 0.24% | ||||||||||||||||
U.S. Treasury Bill #(z) | 1.28 | % | 3-12-2020 | $ | 16,000 | 15,993 | ||||||||||
|
| |||||||||||||||
Total Short-Term Investments (Cost $15,993) | 15,993 | |||||||||||||||
|
| |||||||||||||||
| Total investments in securities (Cost $6,562,510) | 101.25 | % | 6,867,523 | |||||
Other assets and liabilities, net | (1.25 | ) | (84,570 | ) | ||||
|
|
|
| |||||
| Total net assets | 100.00 | % | $ | 6,782,953 | ||||
|
|
|
| |||||
| # | All or a portion of this security is segregated as collateral for investments in derivative instruments. |
| (z) | Zero coupon security. The rate represents the current yield to maturity. |
Futures Contracts
| Description | Number of contracts | Expiration date | Notional cost | Notional value | Unrealized gains | Unrealized losses | ||||||||||||||||||
Short | ||||||||||||||||||||||||
MSCI EAFE Index | (1) | 3-20-2020 | $ | (96,030 | ) | $ | (90,800 | ) | $ | 5,230 | $ | 0 | ||||||||||||
Russell 2000E-Mini Index | (1) | 3-20-2020 | (81,247 | ) | (73,745 | ) | 7,502 | 0 | ||||||||||||||||
S&P 500E-Mini Index | (1) | 3-20-2020 | (161,681 | ) | (147,555 | ) | 14,126 | 0 | ||||||||||||||||
|
|
|
| |||||||||||||||||||||
| $ | 26,858 | $ | 0 | |||||||||||||||||||||
|
|
|
| |||||||||||||||||||||
The accompanying notes are an integral part of these financial statements.
Target Date Retirement Funds | 45
Table of Contents
Portfolio of investments—February 29, 2020
DYNAMIC TARGET TODAY FUND
Transactions with the affiliated Master Portfolios were as follows:
| % of ownership, beginning of period | % of ownership, end of period | Net realized gains (losses) on securities transactions allocated from affiliated Master Portfolios | Net change in unrealized gains (losses) on securities transactions allocated from affiliated Master Portfolios | Interest allocated from affiliated Master Portfolios | Dividends allocated from affiliated Master Portfolios | Affiliated income allocated from affiliated Master Portfolios | Value, end of period | % of net assets | ||||||||||||||||||||||||||||
Affiliated Master Portfolios | ||||||||||||||||||||||||||||||||||||
Wells Fargo Bloomberg Barclays US Aggregateex-Corporate Portfolio | 0.26 | % | 0.32 | % | $ | 2,825 | $ | 134,842 | $ | 43,608 | $ | 0 | $ | 532 | $ | 2,122,216 | ||||||||||||||||||||
Wells Fargo Emerging Markets Bond Portfolio | 0.31 | 0.42 | 913 | 3,950 | 8,362 | 0 | 26 | 176,660 | ||||||||||||||||||||||||||||
Wells Fargo Factor Enhanced Emerging Markets Portfolio | 0.06 | 0.09 | (6,031 | ) | (8,399 | ) | 25 | 5,035 | 96 | 194,992 | ||||||||||||||||||||||||||
Wells Fargo Factor Enhanced International Portfolio | 0.08 | 0.11 | (812 | ) | (6,908 | ) | 49 | 15,885 | 302 | 642,073 | ||||||||||||||||||||||||||
Wells Fargo Factor Enhanced Large Cap Portfolio | 0.09 | 0.13 | 87,156 | (67,754 | ) | 115 | 25,830 | 622 | 1,211,162 | |||||||||||||||||||||||||||
Wells Fargo Factor Enhanced Small Cap Portfolio | 0.09 | 0.13 | 8,613 | (28,317 | ) | 35 | 4,210 | 198 | 302,309 | |||||||||||||||||||||||||||
Wells Fargo High Yield Corporate Bond Portfolio | 0.16 | 0.32 | (3,536 | ) | 477 | 9,226 | 0 | 42 | 172,668 | |||||||||||||||||||||||||||
Wells Fargo Investment Grade Corporate Bond Portfolio | 0.32 | 0.42 | 8,613 | 93,832 | 35,145 | 0 | 104 | 1,099,864 | ||||||||||||||||||||||||||||
Wells Fargo Strategic Retirement Bond Portfolio | 0.74 | 0.94 | (295 | ) | 32,766 | 14,277 | 0 | 41 | 715,576 | |||||||||||||||||||||||||||
Wells Fargo U.S. REIT Portfolio | 0.41 | 0.84 | 21,847 | (22,909 | ) | 0 | 5,181 | 17 | 214,010 | |||||||||||||||||||||||||||
|
|
|
|
|
|
|
|
|
|
|
|
|
| |||||||||||||||||||||||
| $ | 119,293 | $ | 131,580 | $ | 110,842 | $ | 56,141 | $ | 1,980 | $ | 6,851,530 | 101.01 | % | |||||||||||||||||||||||
|
|
|
|
|
|
|
|
|
|
|
|
|
| |||||||||||||||||||||||
The accompanying notes are an integral part of these financial statements.
46 | Target Date Retirement Funds
Table of Contents
Portfolio of investments—February 29, 2020
| Value | ||||||||||||||||
Investment Companies: 100.98% | ||||||||||||||||
| Affiliated Master Portfolios: 100.98% | ||||||||||||||||
Wells Fargo Bloomberg Barclays US Aggregateex-Corporate Portfolio | $ | 1,512,361 | ||||||||||||||
Wells Fargo Emerging Markets Bond Portfolio | 125,249 | |||||||||||||||
Wells Fargo Factor Enhanced Emerging Markets Portfolio | 197,094 | |||||||||||||||
Wells Fargo Factor Enhanced International Portfolio | 653,633 | |||||||||||||||
Wells Fargo Factor Enhanced Large Cap Portfolio | 1,237,489 | |||||||||||||||
Wells Fargo Factor Enhanced Small Cap Portfolio | 309,278 | |||||||||||||||
Wells Fargo High Yield Corporate Bond Portfolio | 122,443 | |||||||||||||||
Wells Fargo Investment Grade Corporate Bond Portfolio | 782,579 | |||||||||||||||
Wells Fargo Strategic Retirement Bond Portfolio | 507,719 | |||||||||||||||
Wells Fargo U.S. REIT Portfolio | 216,626 | |||||||||||||||
Total Investment Companies (Cost $5,354,981) | 5,664,471 | |||||||||||||||
|
| |||||||||||||||
| Yield | Maturity date | Principal | ||||||||||||||
| Short-Term Investments: 0.29% | ||||||||||||||||
| U.S. Treasury Securities: 0.29% | ||||||||||||||||
U.S. Treasury Bill #(z) | 1.28 | % | 3-12-2020 | $ | 16,000 | 15,993 | ||||||||||
|
| |||||||||||||||
Total Short-Term Investments (Cost $15,993) | 15,993 | |||||||||||||||
|
| |||||||||||||||
| Total investments in securities (Cost $5,370,974) | 101.27 | % | 5,680,464 | |||||
Other assets and liabilities, net | (1.27 | ) | (71,002 | ) | ||||
|
|
|
| |||||
| Total net assets | 100.00 | % | $ | 5,609,462 | ||||
|
|
|
| |||||
| # | All or a portion of this security is segregated as collateral for investments in derivative instruments. |
| (z) | Zero coupon security. The rate represents the current yield to maturity. |
Futures Contracts
| Description | Number of contracts | Expiration date | Notional cost | Notional value | Unrealized gains | Unrealized losses | ||||||||||||||||||
Short | ||||||||||||||||||||||||
MSCI EAFE Index | (1) | 3-20-2020 | $ | (96,030 | ) | $ | (90,800 | ) | $ | 5,230 | $ | 0 | ||||||||||||
Russell 2000E-Mini Index | (1) | 3-20-2020 | (81,247 | ) | (73,745 | ) | 7,502 | 0 | ||||||||||||||||
S&P 500E-Mini Index | (1) | 3-20-2020 | (161,681 | ) | (147,555 | ) | 14,126 | 0 | ||||||||||||||||
|
|
|
| |||||||||||||||||||||
| $ | 26,858 | $ | 0 | |||||||||||||||||||||
|
|
|
| |||||||||||||||||||||
The accompanying notes are an integral part of these financial statements.
Target Date Retirement Funds | 47
Table of Contents
Portfolio of investments—February 29, 2020
DYNAMIC TARGET 2015 FUND
Transactions with the affiliated Master Portfolios were as follows:
| % of ownership, beginning of period | % of ownership, end of period | Net realized gains (losses) on securities transactions allocated from affiliated Master Portfolios | Net change in unrealized gains (losses) on securities transactions allocated from affiliated Master Portfolios | Interest allocated from affiliated Master Portfolios | Dividends allocated from affiliated Master Portfolios | Affiliated income allocated from affiliated Master Portfolios | Value, end of period | % of net assets | ||||||||||||||||||||||||||||
Affiliated Master Portfolios | ||||||||||||||||||||||||||||||||||||
Wells Fargo Bloomberg Barclays US Aggregateex-Corporate Portfolio | 0.21 | % | 0.23 | % | $ | (35 | ) | $ | 105,891 | $ | 32,994 | $ | 0 | $ | 405 | $ | 1,512,361 | |||||||||||||||||||
Wells Fargo Emerging Markets Bond Portfolio | 0.25 | 0.29 | 441 | 3,318 | 6,304 | 0 | 20 | 125,249 | ||||||||||||||||||||||||||||
Wells Fargo Factor Enhanced Emerging Markets Portfolio | 0.08 | 0.09 | (7,192 | ) | (9,398 | ) | 28 | 5,925 | 114 | 197,094 | ||||||||||||||||||||||||||
Wells Fargo Factor Enhanced International Portfolio | 0.10 | 0.11 | (2,679 | ) | (2,308 | ) | 58 | 18,912 | 353 | 653,633 | ||||||||||||||||||||||||||
Wells Fargo Factor Enhanced Large Cap Portfolio | 0.11 | 0.13 | 94,318 | (57,945 | ) | 136 | 29,634 | 729 | 1,237,489 | |||||||||||||||||||||||||||
Wells Fargo Factor Enhanced Small Cap Portfolio | 0.12 | 0.13 | 8,474 | (29,424 | ) | 41 | 4,893 | 233 | 309,278 | |||||||||||||||||||||||||||
Wells Fargo High Yield Corporate Bond Portfolio | 0.13 | 0.23 | (2,898 | ) | 712 | 6,954 | 0 | 32 | 122,443 | |||||||||||||||||||||||||||
Wells Fargo Investment Grade Corporate Bond Portfolio | 0.26 | 0.30 | 5,509 | 73,368 | 26,558 | 0 | 78 | 782,579 | ||||||||||||||||||||||||||||
Wells Fargo Strategic Retirement Bond Portfolio | 0.60 | 0.67 | (963 | ) | 25,683 | 11,032 | 0 | 30 | 507,719 | |||||||||||||||||||||||||||
Wells Fargo U.S. REIT Portfolio | 0.51 | 0.85 | 26,951 | (23,870 | ) | 0 | 6,118 | 19 | 216,626 | |||||||||||||||||||||||||||
|
|
|
|
|
|
|
|
|
|
|
|
|
| |||||||||||||||||||||||
| $ | 121,926 | $ | 86,027 | $ | 84,105 | $ | 65,482 | $ | 2,013 | $ | 5,664,471 | 100.98 | % | |||||||||||||||||||||||
|
|
|
|
|
|
|
|
|
|
|
|
|
| |||||||||||||||||||||||
The accompanying notes are an integral part of these financial statements.
48 | Target Date Retirement Funds
Table of Contents
Portfolio of investments—February 29, 2020
| Value | ||||||||||||||||
Investment Companies: 100.49% | ||||||||||||||||
| Affiliated Master Portfolios: 100.49% | ||||||||||||||||
Wells Fargo Bloomberg Barclays US Aggregateex-Corporate Portfolio | $ | 1,541,187 | ||||||||||||||
Wells Fargo Emerging Markets Bond Portfolio | 126,955 | |||||||||||||||
Wells Fargo Factor Enhanced Emerging Markets Portfolio | 288,039 | |||||||||||||||
Wells Fargo Factor Enhanced International Portfolio | 954,089 | |||||||||||||||
Wells Fargo Factor Enhanced Large Cap Portfolio | 1,769,093 | |||||||||||||||
Wells Fargo Factor Enhanced Small Cap Portfolio | 441,750 | |||||||||||||||
Wells Fargo High Yield Corporate Bond Portfolio | 124,660 | |||||||||||||||
Wells Fargo Investment Grade Corporate Bond Portfolio | 796,795 | |||||||||||||||
Wells Fargo Strategic Retirement Bond Portfolio | 477,259 | |||||||||||||||
Wells Fargo U.S. REIT Portfolio | 278,613 | |||||||||||||||
Total Investment Companies (Cost $6,510,221) | 6,798,440 | |||||||||||||||
|
| |||||||||||||||
| Yield | Maturity date | Principal | ||||||||||||||
| Short-Term Investments: 0.26% | ||||||||||||||||
| U.S. Treasury Securities: 0.26% | ||||||||||||||||
U.S. Treasury Bill #(z) | 1.33 | % | 3-12-2020 | $ | 18,000 | 17,992 | ||||||||||
|
| |||||||||||||||
Total Short-Term Investments (Cost $17,992) | 17,992 | |||||||||||||||
|
| |||||||||||||||
| Total investments in securities (Cost $6,528,213) | 100.75 | % | 6,816,432 | |||||
Other assets and liabilities, net | (0.75 | ) | (51,022 | ) | ||||
|
|
|
| |||||
| Total net assets | 100.00 | % | $ | 6,765,410 | ||||
|
|
|
| |||||
| # | All or a portion of this security is segregated as collateral for investments in derivative instruments. |
| (z) | Zero coupon security. The rate represents the current yield to maturity. |
Futures Contracts
| Description | Number of contracts | Expiration date | Notional cost | Notional value | Unrealized gains | Unrealized losses | ||||||||||||||||||
Short | ||||||||||||||||||||||||
MSCI EAFE Index | (1) | 3-20-2020 | $ | (96,030 | ) | $ | (90,800 | ) | $ | 5,230 | $ | 0 | ||||||||||||
MSCI Emerging Markets Index | (1) | 3-20-2020 | (52,548 | ) | (50,440 | ) | 2,108 | 0 | ||||||||||||||||
Russell 2000E-Mini Index | (1) | 3-20-2020 | (81,247 | ) | (73,745 | ) | 7,502 | 0 | ||||||||||||||||
S&P 500E-Mini Index | (1) | 3-20-2020 | (161,681 | ) | (147,555 | ) | 14,126 | 0 | ||||||||||||||||
|
|
|
| |||||||||||||||||||||
| $ | 28,966 | $ | 0 | |||||||||||||||||||||
|
|
|
| |||||||||||||||||||||
The accompanying notes are an integral part of these financial statements.
Target Date Retirement Funds | 49
Table of Contents
Portfolio of investments—February 29, 2020
DYNAMIC TARGET 2020 FUND
Transactions with the affiliated Master Portfolios were as follows:
| % of ownership, beginning of period | % of ownership, end of period | Net realized gains (losses) on securities transactions allocated from affiliated Master Portfolios | Net change in unrealized gains (losses) on securities transactions allocated from affiliated Master Portfolios | Interest allocated from affiliated Master Portfolios | Dividends allocated from affiliated Master Portfolios | Affiliated income allocated from affiliated Master Portfolios | Value, end of period | % of net assets | ||||||||||||||||||||||||||||
Affiliated Master Portfolios | ||||||||||||||||||||||||||||||||||||
Wells Fargo Bloomberg Barclays US Aggregateex-Corporate Portfolio | 0.19 | % | 0.23 | % | $ | (3,425 | ) | $ | 180,072 | $ | 31,274 | $ | 0 | $ | 384 | $ | 1,541,187 | |||||||||||||||||||
Wells Fargo Emerging Markets Bond Portfolio | 0.23 | 0.30 | 199 | 10,874 | 5,971 | 0 | 19 | 126,955 | ||||||||||||||||||||||||||||
Wells Fargo Factor Enhanced Emerging Markets Portfolio | 0.10 | 0.13 | (10,684 | ) | 8,396 | 37 | 9,217 | 148 | 288,039 | |||||||||||||||||||||||||||
Wells Fargo Factor Enhanced International Portfolio | 0.12 | 0.16 | (4,767 | ) | (31,921 | ) | 76 | 30,444 | 464 | 954,089 | ||||||||||||||||||||||||||
Wells Fargo Factor Enhanced Large Cap Portfolio | 0.14 | 0.18 | 121,678 | (210,212 | ) | 174 | 33,594 | 956 | 1,769,093 | |||||||||||||||||||||||||||
Wells Fargo Factor Enhanced Small Cap Portfolio | 0.15 | 0.19 | 10,996 | (74,088 | ) | 53 | 5,021 | 301 | 441,750 | |||||||||||||||||||||||||||
Wells Fargo High Yield Corporate Bond Portfolio | 0.11 | 0.23 | (2,965 | ) | 6,482 | 6,585 | 0 | 30 | 124,660 | |||||||||||||||||||||||||||
Wells Fargo Investment Grade Corporate Bond Portfolio | 0.23 | 0.30 | 3,323 | 106,985 | 25,204 | 0 | 75 | 796,795 | ||||||||||||||||||||||||||||
Wells Fargo Strategic Retirement Bond Portfolio | 0.45 | 0.63 | (1,981 | ) | 44,118 | 8,580 | 0 | 26 | 477,259 | |||||||||||||||||||||||||||
Wells Fargo U.S. REIT Portfolio | 0.51 | 1.09 | 26,220 | (19,840 | ) | 0 | 5,663 | 21 | 278,613 | |||||||||||||||||||||||||||
|
|
|
|
|
|
|
|
|
|
|
|
|
| |||||||||||||||||||||||
| $ | 138,594 | $ | 20,866 | $ | 77,954 | $ | 83,939 | $ | 2,424 | $ | 6,798,440 | 100.49 | % | |||||||||||||||||||||||
|
|
|
|
|
|
|
|
|
|
|
|
|
| |||||||||||||||||||||||
The accompanying notes are an integral part of these financial statements.
50 | Target Date Retirement Funds
Table of Contents
Portfolio of investments—February 29, 2020
| Value | ||||||||||||||||
Investment Companies: 101.03% | ||||||||||||||||
| Affiliated Master Portfolios: 101.03% | ||||||||||||||||
Wells Fargo Bloomberg Barclays US Aggregateex-Corporate Portfolio | $ | 1,892,662 | ||||||||||||||
Wells Fargo Emerging Markets Bond Portfolio | 154,044 | |||||||||||||||
Wells Fargo Factor Enhanced Emerging Markets Portfolio | 516,155 | |||||||||||||||
Wells Fargo Factor Enhanced International Portfolio | 1,707,722 | |||||||||||||||
Wells Fargo Factor Enhanced Large Cap Portfolio | 3,077,326 | |||||||||||||||
Wells Fargo Factor Enhanced Small Cap Portfolio | 773,538 | |||||||||||||||
Wells Fargo High Yield Corporate Bond Portfolio | 151,426 | |||||||||||||||
Wells Fargo Investment Grade Corporate Bond Portfolio | 974,900 | |||||||||||||||
Wells Fargo Strategic Retirement Bond Portfolio | 309,890 | |||||||||||||||
Wells Fargo U.S. REIT Portfolio | 266,986 | |||||||||||||||
Total Investment Companies (Cost $9,510,108) | 9,824,649 | |||||||||||||||
|
| |||||||||||||||
| Yield | Maturity date | Principal | ||||||||||||||
| Short-Term Investments: 0.34% | ||||||||||||||||
| U.S. Treasury Securities: 0.34% | ||||||||||||||||
U.S. Treasury Bill #(z) | 1.24 | % | 3-12-2020 | $ | 33,000 | 32,986 | ||||||||||
|
| |||||||||||||||
Total Short-Term Investments (Cost $32,986) | 32,986 | |||||||||||||||
|
| |||||||||||||||
| Total investments in securities (Cost $9,543,094) | 101.37 | % | 9,857,635 | |||||
Other assets and liabilities, net | (1.37 | ) | (133,500 | ) | ||||
|
|
|
| |||||
| Total net assets | 100.00 | % | $ | 9,724,135 | ||||
|
|
|
| |||||
| # | All or a portion of this security is segregated as collateral for investments in derivative instruments. |
| (z) | Zero coupon security. The rate represents the current yield to maturity. |
Futures Contracts
| Description | Number of contracts | Expiration date | Notional cost | Notional value | Unrealized gains | Unrealized losses | ||||||||||||||||||
Short | ||||||||||||||||||||||||
MSCI EAFE Index | (2) | 3-20-2020 | $ | (191,329 | ) | $ | (181,600 | ) | $ | 9,729 | $ | 0 | ||||||||||||
MSCI Emerging Markets Index | (1) | 3-20-2020 | (52,548 | ) | (50,440 | ) | 2,108 | 0 | ||||||||||||||||
Russell 2000E-Mini Index | (2) | 3-20-2020 | (160,290 | ) | (147,490 | ) | 12,800 | 0 | ||||||||||||||||
S&P 500E-Mini Index | (2) | 3-20-2020 | (319,393 | ) | (295,110 | ) | 24,283 | 0 | ||||||||||||||||
|
|
|
| |||||||||||||||||||||
| $ | 48,920 | $ | 0 | |||||||||||||||||||||
|
|
|
| |||||||||||||||||||||
The accompanying notes are an integral part of these financial statements.
Target Date Retirement Funds | 51
Table of Contents
Portfolio of investments—February 29, 2020
DYNAMIC TARGET 2025 FUND
Transactions with the affiliated Master Portfolios were as follows:
| % of ownership, beginning of period | % of ownership, end of period | Net realized gains (losses) on securities transactions allocated from affiliated Master Portfolios | Net change in unrealized gains (losses) on securities transactions allocated from affiliated Master Portfolios | Interest allocated from affiliated Master Portfolios | Dividends allocated from affiliated Master Portfolios | Affiliated income allocated from affiliated Master Portfolios | Value, end of period | % of net assets | ||||||||||||||||||||||||||||
Affiliated Master Portfolios | ||||||||||||||||||||||||||||||||||||
Wells Fargo Bloomberg Barclays US Aggregateex-Corporate Portfolio | 0.20 | % | 0.28 | % | $ | (9,299 | ) | $ | 206,463 | $ | 34,994 | $ | 0 | $ | 427 | $ | 1,892,662 | |||||||||||||||||||
Wells Fargo Emerging Markets Bond Portfolio | 0.23 | 0.36 | (172 | ) | 12,868 | 6,651 | 0 | 21 | 154,044 | |||||||||||||||||||||||||||
Wells Fargo Factor Enhanced Emerging Markets Portfolio | 0.15 | 0.24 | (19,433 | ) | 19,355 | 61 | 15,416 | 249 | 516,155 | |||||||||||||||||||||||||||
Wells Fargo Factor Enhanced International Portfolio | 0.19 | 0.29 | (11,209 | ) | (27,603 | ) | 128 | 50,848 | 785 | 1,707,722 | ||||||||||||||||||||||||||
Wells Fargo Factor Enhanced Large Cap Portfolio | 0.21 | 0.32 | 196,441 | (300,166 | ) | 281 | 54,588 | 1,552 | 3,077,326 | |||||||||||||||||||||||||||
Wells Fargo Factor Enhanced Small Cap Portfolio | 0.22 | 0.34 | 17,821 | (104,880 | ) | 86 | 7,999 | 490 | 773,538 | |||||||||||||||||||||||||||
Wells Fargo High Yield Corporate Bond Portfolio | 0.12 | 0.28 | (3,684 | ) | 8,198 | 7,337 | 0 | 34 | 151,426 | |||||||||||||||||||||||||||
Wells Fargo Investment Grade Corporate Bond Portfolio | 0.24 | 0.37 | 928 | 125,761 | 28,196 | 0 | 84 | 974,900 | ||||||||||||||||||||||||||||
Wells Fargo Strategic Retirement Bond Portfolio | 0.23 | 0.41 | (2,108 | ) | 27,943 | 4,708 | 0 | 15 | 309,890 | |||||||||||||||||||||||||||
Wells Fargo U.S. REIT Portfolio | 0.40 | 1.04 | 20,525 | (16,656 | ) | 0 | 4,526 | 18 | 266,986 | |||||||||||||||||||||||||||
|
|
|
|
|
|
|
|
|
|
|
|
|
| |||||||||||||||||||||||
| $ | 189,810 | $ | (48,717 | ) | $ | 82,442 | $ | 133,377 | $ | 3,675 | $ | 9,824,649 | 101.03 | % | ||||||||||||||||||||||
|
|
|
|
|
|
|
|
|
|
|
|
|
| |||||||||||||||||||||||
The accompanying notes are an integral part of these financial statements.
52 | Target Date Retirement Funds
Table of Contents
Portfolio of investments—February 29, 2020
| Value | ||||||||||||||||
Investment Companies: 100.24% | ||||||||||||||||
| Affiliated Master Portfolios: 100.24% | ||||||||||||||||
Wells Fargo Bloomberg Barclays US Aggregateex-Corporate Portfolio | $ | 1,218,176 | ||||||||||||||
Wells Fargo Emerging Markets Bond Portfolio | 99,036 | |||||||||||||||
Wells Fargo Factor Enhanced Emerging Markets Portfolio | 519,383 | |||||||||||||||
Wells Fargo Factor Enhanced International Portfolio | 1,715,939 | |||||||||||||||
Wells Fargo Factor Enhanced Large Cap Portfolio | 2,938,621 | |||||||||||||||
Wells Fargo Factor Enhanced Small Cap Portfolio | 735,642 | |||||||||||||||
Wells Fargo High Yield Corporate Bond Portfolio | 98,589 | |||||||||||||||
Wells Fargo Investment Grade Corporate Bond Portfolio | 627,785 | |||||||||||||||
Wells Fargo Strategic Retirement Bond Portfolio | 59,097 | |||||||||||||||
Wells Fargo U.S. REIT Portfolio | 76,492 | |||||||||||||||
Total Investment Companies (Cost $7,785,056) | 8,088,760 | |||||||||||||||
|
| |||||||||||||||
| Yield | Maturity date | Principal | ||||||||||||||
| Short-Term Investments: 0.36% | ||||||||||||||||
| U.S. Treasury Securities: 0.36% | ||||||||||||||||
U.S. Treasury Bill #(z) | 1.24 | % | 3-12-2020 | $ | 29,000 | 28,988 | ||||||||||
|
| |||||||||||||||
Total Short-Term Investments (Cost $28,988) | 28,988 | |||||||||||||||
|
| |||||||||||||||
| Total investments in securities (Cost $7,814,044) | 100.60 | % | 8,117,748 | |||||
Other assets and liabilities, net | (0.60 | ) | (48,371 | ) | ||||
|
|
|
| |||||
| Total net assets | 100.00 | % | $ | 8,069,377 | ||||
|
|
|
| |||||
| # | All or a portion of this security is segregated as collateral for investments in derivative instruments. |
| (z) | Zero coupon security. The rate represents the current yield to maturity. |
Futures Contracts
| Description | Number of contracts | Expiration date | Notional cost | Notional value | Unrealized gains | Unrealized losses | ||||||||||||||||||
Short | ||||||||||||||||||||||||
MSCI EAFE Index | (1) | 3-20-2020 | $ | (96,030 | ) | $ | (90,800 | ) | $ | 5,230 | $ | 0 | ||||||||||||
MSCI Emerging Markets Index | (1) | 3-20-2020 | (52,548 | ) | (50,440 | ) | 2,108 | 0 | ||||||||||||||||
Russell 2000E-Mini Index | (2) | 3-20-2020 | (160,290 | ) | (147,490 | ) | 12,800 | 0 | ||||||||||||||||
S&P 500E-Mini Index | (2) | 3-20-2020 | (319,393 | ) | (295,110 | ) | 24,283 | 0 | ||||||||||||||||
|
|
|
| |||||||||||||||||||||
| $ | 44,421 | $ | 0 | |||||||||||||||||||||
|
|
|
| |||||||||||||||||||||
The accompanying notes are an integral part of these financial statements.
Target Date Retirement Funds | 53
Table of Contents
Portfolio of investments—February 29, 2020
DYNAMIC TARGET 2030 FUND
Transactions with the affiliated Master Portfolios were as follows:
| % of ownership, beginning of period | % of ownership, end of period | Net realized gains (losses) on securities transactions allocated from affiliated Master Portfolios | Net change in unrealized gains (losses) on securities transactions allocated from affiliated Master Portfolios | Interest allocated from affiliated Master Portfolios | Dividends allocated from affiliated Master Portfolios | Affiliated income allocated from affiliated Master Portfolios | Value, end of period | % of net assets | ||||||||||||||||||||||||||||
Affiliated Master Portfolios | ||||||||||||||||||||||||||||||||||||
Wells Fargo Bloomberg Barclays US Aggregateex-Corporate Portfolio | 0.13 | % | 0.18 | % | $ | (7,321 | ) | $ | 64,795 | $ | 22,938 | $ | 0 | $ | 283 | $ | 1,218,176 | |||||||||||||||||||
Wells Fargo Emerging Markets Bond Portfolio | 0.15 | 0.23 | (238 | ) | 2,644 | 4,354 | 0 | 14 | 99,036 | |||||||||||||||||||||||||||
Wells Fargo Factor Enhanced Emerging Markets Portfolio | 0.15 | 0.24 | (19,704 | ) | (13,477 | ) | 60 | 14,951 | 244 | 519,383 | ||||||||||||||||||||||||||
Wells Fargo Factor Enhanced International Portfolio | 0.20 | 0.29 | (13,649 | ) | 7,951 | 129 | 50,973 | 789 | 1,715,939 | |||||||||||||||||||||||||||
Wells Fargo Factor Enhanced Large Cap Portfolio | 0.20 | 0.31 | 176,521 | (128,702 | ) | 266 | 50,888 | 1,472 | 2,938,621 | |||||||||||||||||||||||||||
Wells Fargo Factor Enhanced Small Cap Portfolio | 0.21 | 0.32 | 14,029 | (56,621 | ) | 79 | 7,057 | 448 | 735,642 | |||||||||||||||||||||||||||
Wells Fargo High Yield Corporate Bond Portfolio | 0.08 | 0.18 | (2,585 | ) | 970 | 4,805 | 0 | 22 | 98,589 | |||||||||||||||||||||||||||
Wells Fargo Investment Grade Corporate Bond Portfolio | 0.16 | 0.24 | (4 | ) | 54,540 | 18,551 | 0 | 55 | 627,785 | |||||||||||||||||||||||||||
Wells Fargo Strategic Retirement Bond Portfolio | 0.04 | 0.08 | (474 | ) | 2,668 | 852 | 0 | 3 | 59,097 | |||||||||||||||||||||||||||
Wells Fargo U.S. REIT Portfolio | 0.08 | 0.30 | 4,102 | (7,492 | ) | 0 | 875 | 4 | 76,492 | |||||||||||||||||||||||||||
|
|
|
|
|
|
|
|
|
|
|
|
|
| |||||||||||||||||||||||
| $ | 150,677 | $ | (72,724 | ) | $ | 52,034 | $ | 124,744 | $ | 3,334 | $ | 8,088,760 | 100.24 | % | ||||||||||||||||||||||
|
|
|
|
|
|
|
|
|
|
|
|
|
| |||||||||||||||||||||||
The accompanying notes are an integral part of these financial statements.
54 | Target Date Retirement Funds
Table of Contents
Portfolio of investments—February 29, 2020
| Value | ||||||||||||||||
Investment Companies: 101.35% | ||||||||||||||||
| Affiliated Master Portfolios: 101.35% | ||||||||||||||||
Wells Fargo Bloomberg Barclays US Aggregateex-Corporate Portfolio | $ | 971,206 | ||||||||||||||
Wells Fargo Emerging Markets Bond Portfolio | 79,077 | |||||||||||||||
Wells Fargo Factor Enhanced Emerging Markets Portfolio | 558,027 | |||||||||||||||
Wells Fargo Factor Enhanced International Portfolio | 1,853,778 | |||||||||||||||
Wells Fargo Factor Enhanced Large Cap Portfolio | 3,030,221 | |||||||||||||||
Wells Fargo Factor Enhanced Small Cap Portfolio | 758,514 | |||||||||||||||
Wells Fargo High Yield Corporate Bond Portfolio | 77,730 | |||||||||||||||
Wells Fargo Investment Grade Corporate Bond Portfolio | 499,940 | |||||||||||||||
Total Investment Companies (Cost $7,575,688) |
| 7,828,493 | ||||||||||||||
|
| |||||||||||||||
| Yield | Maturity date | Principal | ||||||||||||||
| Short-Term Investments: 0.43% | ||||||||||||||||
| U.S. Treasury Securities: 0.43% | ||||||||||||||||
U.S. Treasury Bill #(z) | 1.27 | % | 3-12-2020 | $ | 33,000 | 32,986 | ||||||||||
|
| |||||||||||||||
Total Short-Term Investments (Cost $32,986) | 32,986 | |||||||||||||||
|
| |||||||||||||||
| Total investments in securities (Cost $7,608,674) | 101.78 | % | 7,861,479 | |||||
Other assets and liabilities, net | (1.78 | ) | (137,439 | ) | ||||
|
|
|
| |||||
| Total net assets | 100.00 | % | $ | 7,724,040 | ||||
|
|
|
| |||||
| # | All or a portion of this security is segregated as collateral for investments in derivative instruments. |
| (z) | Zero coupon security. The rate represents the current yield to maturity. |
Futures Contracts
| Description | Number of contracts | Expiration date | Notional cost | Notional value | Unrealized gains | Unrealized losses | ||||||||||||||||||
Short | ||||||||||||||||||||||||
MSCI EAFE Index | (2) | 3-20-2020 | $ | (184,775 | ) | $ | (181,600 | ) | $ | 3,175 | $ | 0 | ||||||||||||
MSCI Emerging Markets Index | (1) | 3-20-2020 | (52,548 | ) | (50,440 | ) | 2,108 | 0 | ||||||||||||||||
Russell 2000E-Mini Index | (2) | 3-20-2020 | (160,290 | ) | (147,490 | ) | 12,800 | 0 | ||||||||||||||||
S&P 500E-Mini Index | (2) | 3-20-2020 | (319,393 | ) | (295,110 | ) | 24,283 | 0 | ||||||||||||||||
|
|
|
| |||||||||||||||||||||
| $ | 42,366 | $ | 0 | |||||||||||||||||||||
|
|
|
| |||||||||||||||||||||
The accompanying notes are an integral part of these financial statements.
Target Date Retirement Funds | 55
Table of Contents
Portfolio of investments—February 29, 2020
DYNAMIC TARGET 2035 FUND
Transactions with the affiliated Master Portfolios were as follows:
| % of ownership, beginning of period | % of ownership, end of period | Net realized gains (losses) on securities transactions allocated from affiliated Master Portfolios | Net change in unrealized gains (losses) on securities transactions allocated from affiliated Master Portfolios | Interest allocated from affiliated Master Portfolios | Dividends allocated from affiliated Master Portfolios | Affiliated income allocated from affiliated Master Portfolios | Value, end of period | % of net assets | ||||||||||||||||||||||||||||
Affiliated Master Portfolios | ||||||||||||||||||||||||||||||||||||
Wells Fargo Bloomberg Barclays US Aggregateex-Corporate Portfolio | 0.10 | % | 0.15 | % | $ | (7,163 | ) | $ | 63,528 | $ | 17,346 | $ | 0 | $ | 213 | $ | 971,206 | |||||||||||||||||||
Wells Fargo Emerging Markets Bond Portfolio | 0.11 | 0.19 | (277 | ) | 2,110 | 3,316 | 0 | 10 | 79,077 | |||||||||||||||||||||||||||
Wells Fargo Factor Enhanced Emerging Markets Portfolio | 0.15 | 0.26 | (21,347 | ) | (13,536 | ) | 62 | 15,268 | 250 | 558,027 | ||||||||||||||||||||||||||
Wells Fargo Factor Enhanced International Portfolio | 0.19 | 0.32 | (15,584 | ) | 2,543 | 131 | 51,457 | 805 | 1,853,778 | |||||||||||||||||||||||||||
Wells Fargo Factor Enhanced Large Cap Portfolio | 0.19 | 0.32 | 179,087 | (158,517 | ) | 264 | 51,058 | 1,465 | 3,030,221 | |||||||||||||||||||||||||||
Wells Fargo Factor Enhanced Small Cap Portfolio | 0.21 | 0.33 | 15,471 | (58,103 | ) | 80 | 7,254 | 457 | 758,514 | |||||||||||||||||||||||||||
Wells Fargo High Yield Corporate Bond Portfolio | 0.06 | 0.14 | (2,046 | ) | 710 | 3,662 | 0 | 17 | 77,730 | |||||||||||||||||||||||||||
Wells Fargo Investment Grade Corporate Bond Portfolio | 0.11 | 0.19 | (859 | ) | 41,760 | 14,042 | 0 | 42 | 499,940 | |||||||||||||||||||||||||||
|
|
|
|
|
|
|
|
|
|
|
|
|
| |||||||||||||||||||||||
| $ | 147,282 | $ | (119,505 | ) | $ | 38,903 | $ | 125,037 | $ | 3,259 | $ | 7,828,493 | 101.35 | % | ||||||||||||||||||||||
|
|
|
|
|
|
|
|
|
|
|
|
|
| |||||||||||||||||||||||
The accompanying notes are an integral part of these financial statements.
56 | Target Date Retirement Funds
Table of Contents
Portfolio of investments—February 29, 2020
| Value | ||||||||||||||||
| Investment Companies: 100.86% | ||||||||||||||||
| Affiliated Master Portfolios: 100.86% | ||||||||||||||||
Wells Fargo Bloomberg Barclays US Aggregateex-Corporate Portfolio | $ | 644,675 | ||||||||||||||
Wells Fargo Emerging Markets Bond Portfolio | 52,653 | |||||||||||||||
Wells Fargo Factor Enhanced Emerging Markets Portfolio | 545,039 | |||||||||||||||
Wells Fargo Factor Enhanced International Portfolio | 1,805,152 | |||||||||||||||
Wells Fargo Factor Enhanced Large Cap Portfolio | 2,870,114 | |||||||||||||||
Wells Fargo Factor Enhanced Small Cap Portfolio | 717,849 | |||||||||||||||
Wells Fargo High Yield Corporate Bond Portfolio | 51,742 | |||||||||||||||
Wells Fargo Investment Grade Corporate Bond Portfolio | 332,894 | |||||||||||||||
Total Investment Companies (Cost $6,797,508) |
| 7,020,118 | ||||||||||||||
|
| |||||||||||||||
| Yield | Maturity date | Principal | ||||||||||||||
| Short-Term Investments: 0.42% | ||||||||||||||||
| U.S. Treasury Securities: 0.42% | ||||||||||||||||
U.S. Treasury Bill #(z) | 1.25 | % | 3-12-2020 | $ | 29,000 | 28,988 | ||||||||||
|
| |||||||||||||||
Total Short-Term Investments (Cost $28,988) | 28,988 | |||||||||||||||
|
| |||||||||||||||
| Total investments in securities (Cost $6,826,496) | 101.28 | % | 7,049,106 | |||||
Other assets and liabilities, net | (1.28 | ) | (89,002 | ) | ||||
|
|
|
| |||||
| Total net assets | 100.00 | % | $ | 6,960,104 | ||||
|
|
|
| |||||
| # | All or a portion of this security is segregated as collateral for investments in derivative instruments. |
| (z) | Zero coupon security. The rate represents the current yield to maturity. |
Futures Contracts
| Description | Number of contracts | Expiration date | Notional cost | Notional value | Unrealized gains | Unrealized losses | ||||||||||||||||||
Short | ||||||||||||||||||||||||
MSCI EAFE Index | (1) | 3-20-2020 | $ | (96,030 | ) | $ | (90,800 | ) | $ | 5,230 | $ | 0 | ||||||||||||
MSCI Emerging Markets Index | (1) | 3-20-2020 | (52,548 | ) | (50,440 | ) | 2,108 | 0 | ||||||||||||||||
Russell 2000E-Mini Index | (2) | 3-20-2020 | (160,290 | ) | (147,490 | ) | 12,800 | 0 | ||||||||||||||||
S&P 500E-Mini Index | (2) | 3-20-2020 | (319,393 | ) | (295,110 | ) | 24,283 | 0 | ||||||||||||||||
|
|
|
| |||||||||||||||||||||
| $ | 44,421 | $ | 0 | |||||||||||||||||||||
|
|
|
| |||||||||||||||||||||
The accompanying notes are an integral part of these financial statements.
Target Date Retirement Funds | 57
Table of Contents
Portfolio of investments—February 29, 2020
DYNAMIC TARGET 2040 FUND
Transactions with the affiliated Master Portfolios were as follows:
| % of ownership, beginning of period | % of ownership, end of period | Net realized gains (losses) on securities transactions allocated from affiliated Master Portfolios | Net change in unrealized gains (losses) on securities transactions allocated from affiliated Master Portfolios | Interest allocated from affiliated Master Portfolios | Dividends allocated from affiliated Master Portfolios | Affiliated income allocated from affiliated Master Portfolios | Value, end of period | % of net assets | ||||||||||||||||||||||||||||
Affiliated Master Portfolios | ||||||||||||||||||||||||||||||||||||
Wells Fargo Bloomberg Barclays US Aggregate ex-Corporate Portfolio | 0.07 | % | 0.10 | % | $ | (6,370 | ) | $ | 45,672 | $ | 11,837 | $ | 0 | $ | 146 | $ | 644,675 | |||||||||||||||||||
Wells Fargo Emerging Markets Bond Portfolio | 0.08 | 0.12 | (325 | ) | 1,538 | 2,257 | 0 | 7 | 52,653 | |||||||||||||||||||||||||||
Wells Fargo Factor Enhanced Emerging Markets Portfolio | 0.16 | 0.25 | (23,326 | ) | (5,754 | ) | 65 | 14,004 | 263 | 545,039 | ||||||||||||||||||||||||||
Wells Fargo Factor Enhanced International Portfolio | 0.20 | 0.31 | (21,988 | ) | (11,338 | ) | 135 | 43,448 | 827 | 1,805,152 | ||||||||||||||||||||||||||
Wells Fargo Factor Enhanced Large Cap Portfolio | 0.20 | 0.30 | 166,971 | (160,653 | ) | 263 | 59,275 | 1,476 | 2,870,114 | |||||||||||||||||||||||||||
Wells Fargo Factor Enhanced Small Cap Portfolio | 0.21 | 0.31 | 12,087 | (62,724 | ) | 81 | 9,680 | 457 | 717,849 | |||||||||||||||||||||||||||
Wells Fargo High Yield Corporate Bond Portfolio | 0.04 | 0.10 | (1,517 | ) | 436 | 2,489 | 0 | 11 | 51,742 | |||||||||||||||||||||||||||
Wells Fargo Investment Grade Corporate Bond Portfolio | 0.08 | 0.13 | (1,384 | ) | 30,145 | 9,570 | 0 | 28 | 332,894 | |||||||||||||||||||||||||||
|
|
|
|
|
|
|
|
|
|
|
|
|
| |||||||||||||||||||||||
| $ | 124,148 | $ | (162,678 | ) | $ | 26,697 | $ | 126,407 | $ | 3,215 | $ | 7,020,118 | 100.86 | % | ||||||||||||||||||||||
|
|
|
|
|
|
|
|
|
|
|
|
|
| |||||||||||||||||||||||
The accompanying notes are an integral part of these financial statements.
58 | Target Date Retirement Funds
Table of Contents
Portfolio of investments—February 29, 2020
| Value | ||||||||||||||||
| Investment Companies: 101.40% | ||||||||||||||||
| Affiliated Master Portfolios: 101.40% | ||||||||||||||||
Wells Fargo Bloomberg Barclays US Aggregateex-Corporate Portfolio | $ | 360,916 | ||||||||||||||
Wells Fargo Emerging Markets Bond Portfolio | 29,424 | |||||||||||||||
Wells Fargo Factor Enhanced Emerging Markets Portfolio | 512,656 | |||||||||||||||
Wells Fargo Factor Enhanced International Portfolio | 1,703,465 | |||||||||||||||
Wells Fargo Factor Enhanced Large Cap Portfolio | 2,645,478 | |||||||||||||||
Wells Fargo Factor Enhanced Small Cap Portfolio | 661,979 | |||||||||||||||
Wells Fargo High Yield Corporate Bond Portfolio | 28,907 | |||||||||||||||
Wells Fargo Investment Grade Corporate Bond Portfolio | 185,883 | |||||||||||||||
Total Investment Companies (Cost $5,880,786) |
| 6,128,708 | ||||||||||||||
|
| |||||||||||||||
| Yield | Maturity date | Principal | ||||||||||||||
| Short-Term Investments: 0.30% | ||||||||||||||||
| U.S. Treasury Securities: 0.30% | ||||||||||||||||
U.S. Treasury Bill #(z) | 1.27 | % | 3-12-2020 | $ | 18,000 | 17,992 | ||||||||||
|
| |||||||||||||||
Total Short-Term Investments (Cost $17,992) | 17,992 | |||||||||||||||
|
| |||||||||||||||
| Total investments in securities (Cost $5,898,778) | 101.70 | % | 6,146,700 | |||||
Other assets and liabilities, net | (1.70 | ) | (102,836 | ) | ||||
|
|
|
| |||||
| Total net assets | 100.00 | % | $ | 6,043,864 | ||||
|
|
|
| |||||
| # | All or a portion of this security is segregated as collateral for investments in derivative instruments. |
| (z) | Zero coupon security. The rate represents the purchase yield to maturity. |
Futures Contracts
| Description | Number of contracts | Expiration date | Notional cost | Notional value | Unrealized gains | Unrealized losses | ||||||||||||||||||
Short | ||||||||||||||||||||||||
MSCI EAFE Index | (1) | 3-20-2020 | $ | (96,030 | ) | $ | (90,800 | ) | $ | 5,230 | $ | 0 | ||||||||||||
MSCI Emerging Markets Index | (1) | 3-20-2020 | (52,548 | ) | (50,440 | ) | 2,108 | 0 | ||||||||||||||||
Russell 2000E-Mini Index | (1) | 3-20-2020 | (79,044 | ) | (73,745 | ) | 5,299 | 0 | ||||||||||||||||
S&P 500E-Mini Index | (1) | 3-20-2020 | (161,681 | ) | (147,555 | ) | 14,126 | 0 | ||||||||||||||||
|
|
|
| |||||||||||||||||||||
| $ | 26,763 | $ | 0 | |||||||||||||||||||||
|
|
|
| |||||||||||||||||||||
The accompanying notes are an integral part of these financial statements.
Target Date Retirement Funds | 59
Table of Contents
Portfolio of investments—February 29, 2020
DYNAMIC TARGET 2045 FUND
Transactions with the affiliated Master Portfolios were as follows:
| % of ownership, beginning of period | % of ownership, end of period | Net realized gains (losses) on securities transactions allocated from affiliated Master Portfolios | Net change in unrealized gains (losses) on securities transactions allocated from affiliated Master Portfolios | Interest allocated from affiliated Master Portfolios | Dividends allocated from affiliated Master Portfolios | Affiliated income allocated from affiliated Master Portfolios | Value, end of period | % of net assets | ||||||||||||||||||||||||||||
Affiliated Master Portfolios | ||||||||||||||||||||||||||||||||||||
Wells Fargo Bloomberg Barclays US Aggregate ex-Corporate Portfolio | 0.04 | % | 0.05 | % | $ | (3,519 | ) | $ | 15,962 | $ | 6,684 | $ | 0 | $ | 82 | $ | 360,916 | |||||||||||||||||||
Wells Fargo Emerging Markets Bond Portfolio | 0.05 | 0.07 | (181 | ) | 865 | 1,276 | 0 | 4 | 29,424 | |||||||||||||||||||||||||||
Wells Fargo Factor Enhanced Emerging Markets Portfolio | 0.17 | 0.24 | (22,279 | ) | (17,052 | ) | 64 | 13,560 | 259 | 512,656 | ||||||||||||||||||||||||||
Wells Fargo Factor Enhanced International Portfolio | 0.21 | 0.29 | (20,037 | ) | 10,725 | 133 | 43,124 | 816 | 1,703,465 | |||||||||||||||||||||||||||
Wells Fargo Factor Enhanced Large Cap Portfolio | 0.20 | 0.28 | 160,809 | (118,291 | ) | 255 | 56,956 | 1,425 | 2,645,478 | |||||||||||||||||||||||||||
Wells Fargo Factor Enhanced Small Cap Portfolio | 0.21 | 0.29 | 11,715 | (54,986 | ) | 78 | 9,300 | 439 | 661,979 | |||||||||||||||||||||||||||
Wells Fargo High Yield Corporate Bond Portfolio | 0.02 | 0.05 | (853 | ) | 278 | 1,407 | 0 | 6 | 28,907 | |||||||||||||||||||||||||||
Wells Fargo Investment Grade Corporate Bond Portfolio | 0.05 | 0.07 | (731 | ) | 16,810 | 5,417 | 0 | 16 | 185,883 | |||||||||||||||||||||||||||
|
|
|
|
|
|
|
|
|
|
|
|
|
| |||||||||||||||||||||||
| $ | 124,924 | $ | (145,689 | ) | $ | 15,314 | $ | 122,940 | $ | 3,047 | $ | 6,128,708 | 101.40 | % | ||||||||||||||||||||||
|
|
|
|
|
|
|
|
|
|
|
|
|
| |||||||||||||||||||||||
The accompanying notes are an integral part of these financial statements.
60 | Target Date Retirement Funds
Table of Contents
Portfolio of investments—February 29, 2020
| Value | ||||||||||||||||
| Investment Companies: 101.41% | ||||||||||||||||
| Affiliated Master Portfolios: 101.41% | ||||||||||||||||
Wells Fargo Bloomberg Barclays US Aggregateex-Corporate Portfolio | $ | 180,255 | ||||||||||||||
Wells Fargo Emerging Markets Bond Portfolio | 14,677 | |||||||||||||||
Wells Fargo Factor Enhanced Emerging Markets Portfolio | 479,982 | |||||||||||||||
Wells Fargo Factor Enhanced International Portfolio | 1,595,207 | |||||||||||||||
Wells Fargo Factor Enhanced Large Cap Portfolio | 2,433,748 | |||||||||||||||
Wells Fargo Factor Enhanced Small Cap Portfolio | 608,453 | |||||||||||||||
Wells Fargo High Yield Corporate Bond Portfolio | 14,420 | |||||||||||||||
Wells Fargo Investment Grade Corporate Bond Portfolio | 92,788 | |||||||||||||||
Total Investment Companies (Cost $5,177,655) |
| 5,419,530 | ||||||||||||||
|
| |||||||||||||||
| Yield | Maturity date | Principal | ||||||||||||||
| Short-Term Investments: 0.22% | ||||||||||||||||
| U.S. Treasury Securities: 0.22% | ||||||||||||||||
U.S. Treasury Bill #(z) | 1.28 | % | 3-12-2020 | $ | 12,000 | 11,995 | ||||||||||
|
| |||||||||||||||
Total Short-Term Investments (Cost $11,995) | 11,995 | |||||||||||||||
|
| |||||||||||||||
| Total investments in securities (Cost $5,189,650) | 101.63 | % | 5,431,525 | |||||
Other assets and liabilities, net | (1.63 | ) | (86,905 | ) | ||||
|
|
|
| |||||
| Total net assets | 100.00 | % | $ | 5,344,620 | ||||
|
|
|
| |||||
| # | All or a portion of this security is segregated as collateral for investments in derivative instruments. |
| (z) | Zero coupon security. The rate represents the current yield to maturity. |
Futures Contracts
| Description | Number of contracts | Expiration date | Notional cost | Notional value | Unrealized gains | Unrealized losses | ||||||||||||||||||
Short | �� | |||||||||||||||||||||||
S&P 500E-Mini Index | (1) | 3-20-2020 | $ | (161,681 | ) | $ | (147,555 | ) | $ | 14,126 | $ | 0 | ||||||||||||
The accompanying notes are an integral part of these financial statements.
Target Date Retirement Funds | 61
Table of Contents
Portfolio of investments—February 29, 2020
DYNAMIC TARGET 2050 FUND
Transactions with the affiliated Master Portfolios were as follows:
| % of ownership, beginning of period | % of ownership, end of period | Net realized gains (losses) on securities transactions allocated from affiliated Master Portfolios | Net change in unrealized gains (losses) on securities transactions allocated from affiliated Master Portfolios | Interest allocated from affiliated Master Portfolios | Dividends allocated from affiliated Master Portfolios | Affiliated income allocated from affiliated Master Portfolios | Value, end of period | % of net assets | ||||||||||||||||||||||||||||
Affiliated Master Portfolios | ||||||||||||||||||||||||||||||||||||
Wells Fargo Bloomberg Barclays US Aggregateex-Corporate Portfolio | 0.02 | % | 0.03 | % | $ | (1,855 | ) | $ | 8,597 | $ | 3,834 | $ | 0 | $ | 47 | $ | 180,255 | |||||||||||||||||||
Wells Fargo Emerging Markets Bond Portfolio | 0.03 | 0.03 | (95 | ) | 535 | 733 | 0 | 2 | 14,677 | |||||||||||||||||||||||||||
Wells Fargo Factor Enhanced Emerging Markets Portfolio | 0.17 | 0.22 | (21,895 | ) | (17,917 | ) | 63 | 13,330 | 255 | 479,982 | ||||||||||||||||||||||||||
Wells Fargo Factor Enhanced International Portfolio | 0.22 | 0.27 | (21,219 | ) | 6,178 | 130 | 42,526 | 797 | 1,595,207 | |||||||||||||||||||||||||||
Wells Fargo Factor Enhanced Large Cap Portfolio | 0.20 | 0.25 | 150,213 | (104,910 | ) | 247 | 54,455 | 1,360 | 2,433,748 | |||||||||||||||||||||||||||
Wells Fargo Factor Enhanced Small Cap Portfolio | 0.21 | 0.27 | 9,856 | (52,617 | ) | 76 | 8,988 | 425 | 608,453 | |||||||||||||||||||||||||||
Wells Fargo High Yield Corporate Bond Portfolio | 0.01 | 0.03 | (484 | ) | 219 | 810 | 0 | 4 | 14,420 | |||||||||||||||||||||||||||
Wells Fargo Investment Grade Corporate Bond Portfolio | 0.03 | 0.04 | (318 | ) | 9,710 | 3,112 | 0 | 9 | 92,788 | |||||||||||||||||||||||||||
|
|
|
|
|
|
|
|
|
|
|
|
|
| |||||||||||||||||||||||
| $ | 114,203 | $ | (150,205 | ) | $ | 9,005 | $ | 119,299 | $ | 2,899 | $ | 5,419,530 | 101.41 | % | ||||||||||||||||||||||
|
|
|
|
|
|
|
|
|
|
|
|
|
| |||||||||||||||||||||||
The accompanying notes are an integral part of these financial statements.
62 | Target Date Retirement Funds
Table of Contents
Portfolio of investments—February 29, 2020
| Value | ||||||||||||||||
| Investment Companies: 101.23% | ||||||||||||||||
| Affiliated Master Portfolios: 101.23% | ||||||||||||||||
Wells Fargo Bloomberg Barclays US Aggregateex-Corporate Portfolio | $ | 184,142 | ||||||||||||||
Wells Fargo Emerging Markets Bond Portfolio | 14,993 | |||||||||||||||
Wells Fargo Factor Enhanced Emerging Markets Portfolio | 489,774 | |||||||||||||||
Wells Fargo Factor Enhanced International Portfolio | 1,629,436 | |||||||||||||||
Wells Fargo Factor Enhanced Large Cap Portfolio | 2,487,185 | |||||||||||||||
Wells Fargo Factor Enhanced Small Cap Portfolio | 622,563 | |||||||||||||||
Wells Fargo High Yield Corporate Bond Portfolio | 14,733 | |||||||||||||||
Wells Fargo Investment Grade Corporate Bond Portfolio | 94,791 | |||||||||||||||
Total Investment Companies (Cost $5,302,159) | 5,537,617 | |||||||||||||||
|
| |||||||||||||||
| Yield | Maturity date | Principal | ||||||||||||||
| Short-Term Investments: 0.22% | ||||||||||||||||
| U.S. Treasury Securities: 0.22% | ||||||||||||||||
U.S. Treasury Bill #(z) | 1.27 | % | 3-12-2020 | $ | 12,000 | 11,995 | ||||||||||
|
| |||||||||||||||
Total Short-Term Investments (Cost $11,995) | 11,995 | |||||||||||||||
|
| |||||||||||||||
| Total investments in securities (Cost $5,314,154) | 101.45 | % | 5,549,612 | |||||
Other assets and liabilities, net | (1.45 | ) | (79,514 | ) | ||||
|
|
|
| |||||
| Total net assets | 100.00 | % | $ | 5,470,098 | ||||
|
|
|
| |||||
| # | All or a portion of this security is segregated as collateral for investments in derivative instruments. |
| (z) | Zero coupon security. The rate represents the purchase yield to maturity. |
Futures Contracts
| Description | Number of contracts | Expiration date | Notional cost | Notional value | Unrealized gains | Unrealized losses | ||||||||||||||||||
Short | ||||||||||||||||||||||||
S&P 500E-Mini Index | (1) | 3-20-2020 | $ | (161,681 | ) | $ | (147,555 | ) | $ | 14,126 | $ | 0 | ||||||||||||
The accompanying notes are an integral part of these financial statements.
Target Date Retirement Funds | 63
Table of Contents
Portfolio of investments—February 29, 2020
DYNAMIC TARGET 2055 FUND
Transactions with the affiliated Master Portfolios were as follows:
| % of ownership, beginning of period | % of ownership, end of period | Net realized gains (losses) on securities transactions allocated from affiliated Master Portfolios | Net change in unrealized gains (losses) on securities transactions allocated from affiliated Master Portfolios | Interest allocated from affiliated Master Portfolios | Dividends allocated from affiliated Master Portfolios | Affiliated income allocated from affiliated Master Portfolios | Value, end of period | % of net assets | ||||||||||||||||||||||||||||
Affiliated Master Portfolios | ||||||||||||||||||||||||||||||||||||
Wells Fargo Bloomberg Barclays US Aggregateex-Corporate Portfolio | 0.03 | % | 0.03 | % | $ | (1,889 | ) | $ | 8,626 | $ | 3,856 | $ | 0 | $ | 48 | $ | 184,142 | |||||||||||||||||||
Wells Fargo Emerging Markets Bond Portfolio | 0.03 | 0.04 | (96 | ) | 529 | 737 | 0 | 2 | 14,993 | |||||||||||||||||||||||||||
Wells Fargo Factor Enhanced Emerging Markets Portfolio | 0.17 | 0.23 | (22,049 | ) | (17,435 | ) | 63 | 13,330 | 255 | 489,774 | ||||||||||||||||||||||||||
Wells Fargo Factor Enhanced International Portfolio | 0.21 | 0.28 | (21,211 | ) | 6,655 | 130 | 42,467 | 798 | 1,629,436 | |||||||||||||||||||||||||||
Wells Fargo Factor Enhanced Large Cap Portfolio | 0.20 | 0.26 | 151,715 | (108,886 | ) | 247 | 54,746 | 1,363 | 2,487,185 | |||||||||||||||||||||||||||
Wells Fargo Factor Enhanced Small Cap Portfolio | 0.21 | 0.27 | 10,176 | (53,026 | ) | 76 | 9,009 | 426 | 622,563 | |||||||||||||||||||||||||||
Wells Fargo High Yield Corporate Bond Portfolio | 0.01 | 0.03 | (487 | ) | 215 | 815 | 0 | 4 | 14,733 | |||||||||||||||||||||||||||
Wells Fargo Investment Grade Corporate Bond Portfolio | 0.03 | 0.04 | (334 | ) | 9,706 | 3,131 | 0 | 9 | 94,791 | |||||||||||||||||||||||||||
|
|
|
|
|
|
|
|
|
|
|
|
|
| |||||||||||||||||||||||
| $ | 115,825 | $ | (153,616 | ) | $ | 9,055 | $ | 119,552 | $ | 2,905 | $ | 5,537,617 | 101.23 | % | ||||||||||||||||||||||
|
|
|
|
|
|
|
|
|
|
|
|
|
| |||||||||||||||||||||||
The accompanying notes are an integral part of these financial statements.
64 | Target Date Retirement Funds
Table of Contents
Portfolio of investments—February 29, 2020
| Value | ||||||||||||||||
Investment Companies: 101.41% | ||||||||||||||||
| Affiliated Master Portfolios: 101.41% | ||||||||||||||||
Wells Fargo Bloomberg Barclays US Aggregateex-Corporate Portfolio | $ | 176,135 | ||||||||||||||
Wells Fargo Emerging Markets Bond Portfolio | 14,341 | |||||||||||||||
Wells Fargo Factor Enhanced Emerging Markets Portfolio | 469,332 | |||||||||||||||
Wells Fargo Factor Enhanced International Portfolio | 1,559,315 | |||||||||||||||
Wells Fargo Factor Enhanced Large Cap Portfolio | 2,378,601 | |||||||||||||||
Wells Fargo Factor Enhanced Small Cap Portfolio | 594,758 | |||||||||||||||
Wells Fargo High Yield Corporate Bond Portfolio | 14,085 | |||||||||||||||
Wells Fargo Investment Grade Corporate Bond Portfolio | 90,668 | |||||||||||||||
Wells Fargo U.S. REIT Portfolio | 6,228 | |||||||||||||||
Total Investment Companies (Cost $5,050,333) | 5,303,463 | |||||||||||||||
|
| |||||||||||||||
| Yield | Maturity date | Principal | ||||||||||||||
| Short-Term Investments: 0.23% | ||||||||||||||||
| U.S. Treasury Securities: 0.23% | ||||||||||||||||
U.S. Treasury Bill #(z) | 1.28 | % | 3-12-2020 | $ | 12,000 | 11,995 | ||||||||||
|
| |||||||||||||||
Total Short-Term Investments (Cost $11,995) | 11,995 | |||||||||||||||
|
| |||||||||||||||
| Total investments in securities (Cost $5,062,328) | 101.64 | % | 5,315,458 | |||||
Other assets and liabilities, net | (1.64 | ) | (85,590 | ) | ||||
|
|
|
| |||||
| Total net assets | 100.00 | % | $ | 5,229,868 | ||||
|
|
|
| |||||
| # | All or a portion of this security is segregated as collateral for investments in derivative instruments. |
| (z) | Zero coupon security. The rate represents the current yield to maturity. |
Futures Contracts
| Description | Number of contracts | Expiration date | Notional cost | Notional value | Unrealized gains | Unrealized losses | ||||||||||||||||||
Short | ||||||||||||||||||||||||
S&P 500E-Mini Index | (1) | 3-20-2020 | $ | (161,681 | ) | $ | (147,555 | ) | $ | 14,126 | $ | 0 | ||||||||||||
The accompanying notes are an integral part of these financial statements.
Target Date Retirement Funds | 65
Table of Contents
Portfolio of investments—February 29, 2020
DYNAMIC TARGET 2060 FUND
Transactions with the affiliated Master Portfolios were as follows:
| % of ownership, beginning of period | % of ownership, end of period | Net realized gains (losses) on securities transactions allocated from affiliated Master Portfolios | Net change in unrealized gains (losses) on securities transactions allocated from affiliated Master Portfolios | Interest allocated from affiliated Master Portfolios | Dividends allocated from affiliated Master Portfolios | Affiliated income allocated from affiliated Master Portfolios | Value, end of period | % of net assets | ||||||||||||||||||||||||||||
Affiliated Master Portfolios | ||||||||||||||||||||||||||||||||||||
Wells Fargo Bloomberg Barclays US Aggregateex-Corporate Portfolio | 0.02 | % | 0.03 | % | $ | (1,852 | ) | $ | 8,676 | $ | 3,889 | $ | 0 | $ | 47 | $ | 176,135 | |||||||||||||||||||
Wells Fargo Emerging Markets Bond Portfolio | 0.03 | 0.03 | (96 | ) | 550 | 733 | 0 | 3 | 14,341 | |||||||||||||||||||||||||||
Wells Fargo Factor Enhanced Emerging Markets Portfolio | 0.17 | 0.22 | (21,251 | ) | (18,466 | ) | 63 | 13,394 | 255 | 469,332 | ||||||||||||||||||||||||||
Wells Fargo Factor Enhanced International Portfolio | 0.22 | 0.27 | (22,002 | ) | 894 | 130 | 42,718 | 799 | 1,559,315 | |||||||||||||||||||||||||||
Wells Fargo Factor Enhanced Large Cap Portfolio | 0.21 | 0.25 | 150,188 | (93,485 | ) | 248 | 54,521 | 1,332 | 2,378,601 | |||||||||||||||||||||||||||
Wells Fargo Factor Enhanced Small Cap Portfolio | 0.22 | 0.26 | 9,729 | (52,822 | ) | 77 | 9,017 | 425 | 594,758 | |||||||||||||||||||||||||||
Wells Fargo High Yield Corporate Bond Portfolio | 0.02 | 0.03 | (483 | ) | 231 | 809 | 0 | 4 | 14,085 | |||||||||||||||||||||||||||
Wells Fargo Investment Grade Corporate Bond Portfolio | 0.03 | 0.03 | (318 | ) | 9,794 | 3,109 | 0 | 9 | 90,668 | |||||||||||||||||||||||||||
Wells Fargo U.S. REIT Portfolio | 0.00 | 0.02 | (47 | ) | (719 | ) | 0 | 15 | 1 | 6,228 | ||||||||||||||||||||||||||
|
|
|
|
|
|
|
|
|
|
|
|
|
| |||||||||||||||||||||||
| $ | 113,868 | $ | (145,347 | ) | $ | 9,058 | $ | 119,665 | $ | 2,875 | $ | 5,303,463 | 101.41 | % | ||||||||||||||||||||||
|
|
|
|
|
|
|
|
|
|
|
|
|
| |||||||||||||||||||||||
The accompanying notes are an integral part of these financial statements.
66 | Target Date Retirement Funds
Table of Contents
This page is intentionally left blank.
Table of Contents
Statements of assets and liabilities—February 29, 2020
| Dynamic Target Today Fund | Dynamic Target 2015 Fund | |||||||
Assets | ||||||||
Investments in affiliated Master Portfolios, at value (see cost below) | $ | 6,851,530 | $ | 5,664,471 | ||||
Investments in unaffiliated securities, at value (see cost below) | 15,993 | 15,993 | ||||||
Cash | 10,000 | 10,000 | ||||||
Receivable for Fund shares sold | 0 | 0 | ||||||
Receivable for daily variation margin on open futures contracts | 1,498 | 1,498 | ||||||
Prepaid expenses and other assets | 37,116 | 34,857 | ||||||
|
| |||||||
Total assets | 6,916,137 | 5,726,819 | ||||||
|
| |||||||
Liabilities | ||||||||
Payable for Fund shares redeemed | 13,880 | 0 | ||||||
Due to manager | 70,410 | 68,994 | ||||||
Professional fees payable | 22,147 | 21,897 | ||||||
Shareholder report expenses payable | 19,866 | 19,647 | ||||||
Trustees’ fees and expenses payable | 4,177 | 4,237 | ||||||
Custody and accounting fees payable | 1,332 | 1,335 | ||||||
Administration fees payable | 357 | 234 | ||||||
Distribution fee payable | 68 | 67 | ||||||
Accrued expenses and other liabilities | 947 | 946 | ||||||
|
| |||||||
Total liabilities | 133,184 | 117,357 | ||||||
|
| |||||||
Total net assets | $ | 6,782,953 | $ | 5,609,462 | ||||
|
| |||||||
Net assets consist of | ||||||||
Paid-in capital | $ | 6,421,690 | $ | 5,301,587 | ||||
Total distributable earnings (loss) | 361,263 | 307,875 | ||||||
|
| |||||||
Total net assets | $ | 6,782,953 | $ | 5,609,462 | ||||
|
| |||||||
Computation of net asset value and offering price per share | ||||||||
Net assets – Class A | $ | 1,021,909 | $ | 460,196 | ||||
Shares outstanding – Class A1 | 96,383 | 44,235 | ||||||
Net asset value per share – Class A | $10.60 | $10.40 | ||||||
Maximum offering price per share – Class A2 | $11.25 | $11.03 | ||||||
Net assets – Class C | $ | 107,356 | $ | 105,352 | ||||
Shares outstanding – Class C1 | 10,163 | 10,180 | ||||||
Net asset value per share – Class C | $10.56 | $10.35 | ||||||
Net assets – Class R4 | $ | 109,116 | $ | 107,100 | ||||
Share outstanding – Class R41 | 10,279 | 10,296 | ||||||
Net asset value per share – Class R4 | $10.62 | $10.40 | ||||||
Net assets – Class R6 | $ | 5,544,572 | $ | 4,936,814 | ||||
Shares outstanding – Class R61 | 522,147 | 474,416 | ||||||
Net asset value per share – Class R6 | $10.62 | $10.41 | ||||||
Investments in affiliated Master Portfolios, at cost | $ | 6,546,517 | $ | 5,354,981 | ||||
|
| |||||||
Investments in unaffiliated securities, at cost | $ | 15,993 | $ | 15,993 | ||||
|
| |||||||
| 1 | Each Fund has an unlimited number of authorized shares. |
| 2 | Maximum offering price is computed as 100/94.25 of net asset value. On investments of $50,000 or more, the offering price is reduced. |
The accompanying notes are an integral part of these financial statements.
68 | Target Date Retirement Funds
Table of Contents
Statements of assets and liabilities—February 29, 2020
| Dynamic Target 2020 Fund | Dynamic Target 2025 Fund | Dynamic Target 2030 Fund | Dynamic Target 2035 Fund | Dynamic Target 2040 Fund | Dynamic Target 2045 Fund | Dynamic Target 2050 Fund | ||||||||||||||||||||
| $ | 6,798,440 | $ | 9,824,649 | $ | 8,088,760 | $ | 7,828,493 | $ | 7,020,118 | $ | 6,128,708 | $ | 5,419,530 | |||||||||||||
| 17,992 | 32,986 | 28,988 | 32,986 | 28,988 | 17,992 | 11,995 | ||||||||||||||||||||
| 10,000 | 3,556 | 4,550 | 3,557 | 4,550 | 10,000 | 10,000 | ||||||||||||||||||||
| 2,920 | 250 | 97,173 | 0 | 0 | 352 | 134 | ||||||||||||||||||||
| 1,670 | 3,177 | 2,504 | 1,168 | 2,503 | 1,677 | 1,860 | ||||||||||||||||||||
| 40,097 | 30,941 | 30,186 | 30,425 | 32,919 | 33,188 | 33,430 | ||||||||||||||||||||
|
| |||||||||||||||||||||||||
| 6,871,119 | 9,895,559 | 8,252,161 | 7,896,629 | 7,089,078 | 6,191,917 | 5,476,949 | ||||||||||||||||||||
|
| |||||||||||||||||||||||||
| 0 | 1,250 | 20,780 | 10,298 | 0 | 24,921 | 0 | ||||||||||||||||||||
| 56,958 | 118,139 | 109,444 | 110,878 | 79,525 | 76,177 | 80,790 | ||||||||||||||||||||
| 21,368 | 24,296 | 24,252 | 23,918 | 21,093 | 20,236 | 24,149 | ||||||||||||||||||||
| 20,204 | 20,179 | 20,987 | 20,580 | 20,770 | 20,020 | 20,560 | ||||||||||||||||||||
| 4,237 | 4,278 | 4,348 | 4,348 | 4,531 | 4,237 | 4,216 | ||||||||||||||||||||
| 1,385 | 1,374 | 1,347 | 1,301 | 1,357 | 1,317 | 1,367 | ||||||||||||||||||||
| 432 | 718 | 517 | 338 | 497 | 254 | 206 | ||||||||||||||||||||
| 68 | 85 | 68 | 71 | 67 | 73 | 71 | ||||||||||||||||||||
| 1,057 | 1,105 | 1,041 | 857 | 1,134 | 818 | 970 | ||||||||||||||||||||
|
| |||||||||||||||||||||||||
| 105,709 | 171,424 | 182,784 | 172,589 | 128,974 | 148,053 | 132,329 | ||||||||||||||||||||
|
| |||||||||||||||||||||||||
| $ | 6,765,410 | $ | 9,724,135 | $ | 8,069,377 | $ | 7,724,040 | $ | 6,960,104 | $ | 6,043,864 | $ | 5,344,620 | |||||||||||||
|
| |||||||||||||||||||||||||
| $ | 6,488,680 | $ | 9,477,118 | $ | 7,891,418 | $ | 7,612,738 | $ | 6,915,365 | $ | 6,014,700 | $ | 5,349,856 | |||||||||||||
| 276,730 | 247,017 | 177,959 | 111,302 | 44,739 | 29,164 | (5,236 | ) | |||||||||||||||||||
|
| |||||||||||||||||||||||||
| $ | 6,765,410 | $ | 9,724,135 | $ | 8,069,377 | $ | 7,724,040 | $ | 6,960,104 | $ | 6,043,864 | $ | 5,344,620 | |||||||||||||
|
| |||||||||||||||||||||||||
| $ | 1,435,254 | $ | 2,855,915 | $ | 2,316,852 | $ | 733,040 | $ | 1,858,368 | $ | 413,595 | $ | 254,120 | |||||||||||||
| 139,606 | 275,539 | 229,124 | 73,638 | 189,130 | 42,563 | 26,316 | ||||||||||||||||||||
| $10.28 | $10.36 | $10.11 | $9.95 | $9.83 | $9.72 | $9.66 | ||||||||||||||||||||
| $10.91 | $10.99 | $10.73 | $10.56 | $10.43 | $10.31 | $10.25 | ||||||||||||||||||||
| $ | 105,322 | $ | 125,151 | $ | 104,011 | $ | 106,599 | $ | 101,370 | $ | 109,457 | $ | 105,672 | |||||||||||||
| 10,250 | 12,095 | 10,303 | 10,740 | 10,331 | 11,311 | 11,020 | ||||||||||||||||||||
| $10.28 | $10.35 | $10.10 | $9.93 | $9.81 | $9.68 | $9.59 | ||||||||||||||||||||
| $ | 107,061 | $ | 107,841 | $ | 105,607 | $ | 104,045 | $ | 102,963 | $ | 101,819 | $ | 100,912 | |||||||||||||
| 10,356 | 10,347 | 10,369 | 10,388 | 10,387 | 10,408 | 10,410 | ||||||||||||||||||||
| $10.34 | $10.42 | $10.18 | $10.02 | $9.91 | $9.78 | $9.69 | ||||||||||||||||||||
| $ | 5,117,773 | $ | 6,635,228 | $ | 5,542,907 | $ | 6,780,356 | $ | 4,897,403 | $ | 5,418,993 | $ | 4,883,916 | |||||||||||||
| 494,779 | 636,347 | 543,896 | 676,511 | 493,742 | 553,437 | 503,498 | ||||||||||||||||||||
| $10.34 | $10.43 | $10.19 | $10.02 | $9.92 | $9.79 | $9.70 | ||||||||||||||||||||
| $ | 6,510,221 | $ | 9,510,108 | $ | 7,785,056 | $ | 7,575,688 | $ | 6,797,508 | $ | 5,880,786 | $ | 5,177,655 | |||||||||||||
|
| |||||||||||||||||||||||||
| $ | 17,992 | $ | 32,986 | $ | 28,988 | $ | 32,986 | $ | 28,988 | $ | 17,992 | $ | 11,995 | |||||||||||||
|
| |||||||||||||||||||||||||
The accompanying notes are an integral part of these financial statements.
Target Date Retirement Funds | 69
Table of Contents
Statements of assets and liabilities—February 29, 2020
| Dynamic Target 2055 Fund | Dynamic Target 2060 Fund | |||||||
Assets | ||||||||
Investments in affiliated Master Portfolios, at value (see cost below) | $ | 5,537,617 | $ | 5,303,463 | ||||
Investments in unaffiliated securities, at value (see cost below) | 11,995 | 11,995 | ||||||
Cash | 10,000 | 10,000 | ||||||
Receivable for daily variation margin on open futures contracts | 1,860 | 1,856 | ||||||
Prepaid expenses and other assets | 33,327 | 32,036 | ||||||
|
| |||||||
Total assets | 5,594,799 | 5,359,350 | ||||||
|
| |||||||
Liabilities | ||||||||
Due to manager | 72,929 | 77,837 | ||||||
Professional fees payable | 24,120 | 24,120 | ||||||
Shareholder report expenses payable | 20,605 | 20,529 | ||||||
Trustees’ fees and expenses payable | 4,232 | 4,232 | ||||||
Custody and accounting fees payable | 1,376 | 1,389 | ||||||
Administration fees payable | 205 | 222 | ||||||
Distribution fee payable | 67 | 67 | ||||||
Accrued expenses and other liabilities | 1,167 | 1,086 | ||||||
|
| |||||||
Total liabilities | 124,701 | 129,482 | ||||||
|
| |||||||
Total net assets | $ | 5,470,098 | $ | 5,229,868 | ||||
|
| |||||||
Net assets consist of | ||||||||
Paid-in capital | $ | 5,478,727 | $ | 5,227,190 | ||||
Total distributable earnings (loss) | (8,629 | ) | 2,678 | |||||
|
| |||||||
Total net assets | $ | 5,470,098 | $ | 5,229,868 | ||||
|
| |||||||
Computation of net asset value and offering price per share | ||||||||
Net assets – Class A | $ | 238,770 | $ | 344,594 | ||||
Shares outstanding – Class A1 | 24,717 | 35,678 | ||||||
Net asset value per share – Class A | $9.66 | $9.66 | ||||||
Maximum offering price per share – Class A2 | $10.25 | $10.25 | ||||||
Net assets – Class C | $ | 99,894 | $ | 99,306 | ||||
Shares outstanding – Class C1 | 10,419 | 10,319 | ||||||
Net asset value per share – Class C | $9.59 | $9.62 | ||||||
Net assets – Class R4 | $ | 100,925 | $ | 101,429 | ||||
Share outstanding – Class R41 | 10,413 | 10,424 | ||||||
Net asset value per share – Class R4 | $9.69 | $9.73 | ||||||
Net assets – Class R6 | $ | 5,030,509 | $ | 4,684,539 | ||||
Shares outstanding – Class R61 | 518,905 | 481,147 | ||||||
Net asset value per share – Class R6 | $9.69 | $9.74 | ||||||
Investments in affiliated Master Portfolios, at cost | $ | 5,302,159 | $ | 5,050,333 | ||||
|
| |||||||
Investments in unaffiliated securities, at cost | $ | 11,995 | $ | 11,995 | ||||
|
| |||||||
| 1 | Each Fund has an unlimited number of authorized shares. |
| 2 | Maximum offering price is computed as 100/94.25 of net asset value. On investments of $50,000 or more, the offering price is reduced. |
The accompanying notes are an integral part of these financial statements.
70 | Target Date Retirement Funds
Table of Contents
This page is intentionally left blank.
Table of Contents
Statements of operations—year ended February 29, 2020
| Dynamic Target Today Fund | Dynamic Target 2015 Fund | |||||||
Investment income | ||||||||
Interest allocated from affiliated Master Portfolios | $ | 110,842 | $ | 84,105 | ||||
Dividends allocated from affiliated Master Portfolios* | 56,141 | 65,482 | ||||||
Affiliated income allocated from affiliated Master Portfolios | 1,980 | 2,013 | ||||||
Interest | 255 | 262 | ||||||
Expenses allocated from affiliated Master Portfolios | (10,571 | ) | (10,155 | ) | ||||
Waivers allocated from affiliated Master Portfolios | 2,843 | 2,696 | ||||||
|
| |||||||
Total investment income | 161,490 | 144,403 | ||||||
|
| |||||||
Expenses | ||||||||
Management fee | 9,323 | 8,522 | ||||||
Administration fees |
| |||||||
Class A | 1,420 | 1,008 | ||||||
Class C | 234 | 223 | ||||||
Class R4 | 87 | 87 | ||||||
Class R6 | 1,596 | 1,496 | ||||||
Shareholder servicing fees |
| |||||||
Class A | 1,690 | 1,200 | ||||||
Class C | 279 | 266 | ||||||
Class R4 | 109 | 108 | ||||||
Distribution fee |
| |||||||
Class C | 641 | 603 | ||||||
Custody and accounting fees | 18,004 | 18,086 | ||||||
Professional fees | 32,486 | 32,575 | ||||||
Registration fees | 64,302 | 64,047 | ||||||
Shareholder report expenses | 22,030 | 20,063 | ||||||
Trustees’ fees and expenses | 21,712 | 21,773 | ||||||
Other fees and expenses | 10,100 | 7,782 | ||||||
|
| |||||||
Total expenses | 184,013 | 177,839 | ||||||
Less: Fee waivers and/or expense reimbursements |
| |||||||
Fund-level | (172,145 | ) | (167,955 | ) | ||||
Class A | 0 | (113 | ) | |||||
Class R4 | (104 | ) | (31 | ) | ||||
Class R6 | (1,596 | ) | (1,496 | ) | ||||
|
| |||||||
Net expenses | 10,168 | 8,244 | ||||||
|
| |||||||
Net investment income | 151,322 | 136,159 | ||||||
|
| |||||||
Realized and unrealized gains (losses) on investments | ||||||||
Net realized gains (losses) on | ||||||||
Securities transactions allocated from affiliated Master Portfolios | 119,293 | 121,926 | ||||||
Futures contracts | (10,517 | ) | (8,386 | ) | ||||
|
| |||||||
Net realized gains on investments | 108,776 | 113,540 | ||||||
|
| |||||||
Net change in unrealized gains (losses) on | ||||||||
Securities transactions allocated from affiliated Master Portfolios | 131,580 | 86,027 | ||||||
Futures contracts | 26,675 | 26,675 | ||||||
|
| |||||||
Net change in unrealized gains (losses) on investments | 158,255 | 112,702 | ||||||
|
| |||||||
Net realized and unrealized gains (losses) on investments | 267,031 | 226,242 | ||||||
|
| |||||||
Net increase in net assets resulting from operations | $ | 418,353 | $ | 362,401 | ||||
|
| |||||||
* Net of foreign dividend withholding taxes allocated from affiliated Master Portfolios in the amount of | $3,726 | $4,277 | ||||||
The accompanying notes are an integral part of these financial statements.
72 | Target Date Retirement Funds
Table of Contents
Statements of operations—year ended February 29, 2020
| Dynamic Target 2020 Fund | Dynamic Target 2025 Fund | Dynamic Target 2030 Fund | Dynamic Target 2035 Fund | Dynamic Target 2040 Fund | Dynamic Target 2045 Fund | Dynamic Target 2050 Fund | ||||||||||||||||||||
| $ | 77,954 | $ | 82,442 | $ | 52,034 | $ | 38,903 | $ | 26,697 | $ | 15,314 | $ | 9,005 | |||||||||||||
| 83,939 | 133,377 | 124,744 | 125,037 | 126,407 | 122,940 | 119,299 | ||||||||||||||||||||
| 2,424 | 3,675 | 3,334 | 3,259 | 3,215 | 3,047 | 2,899 | ||||||||||||||||||||
| 293 | 485 | 381 | 399 | 326 | 307 | 277 | ||||||||||||||||||||
| (11,646 | ) | (16,249 | ) | (13,714 | ) | (13,230 | ) | (12,755 | ) | (11,977 | ) | (11,299 | ) | |||||||||||||
| 2,973 | 3,717 | 2,800 | 2,584 | 2,479 | 2,316 | 2,181 | ||||||||||||||||||||
|
| |||||||||||||||||||||||||
| 155,937 | 207,447 | 169,579 | 156,952 | 146,369 | 131,947 | 122,362 | ||||||||||||||||||||
|
| |||||||||||||||||||||||||
| 9,521 | 13,013 | 10,861 | 10,285 | 9,697 | 8,874 | 8,213 | ||||||||||||||||||||
| 2,148 | 5,401 | 2,962 | 1,264 | 2,591 | 819 | 509 | ||||||||||||||||||||
| 224 | 285 | 310 | 226 | 220 | 232 | 229 | ||||||||||||||||||||
| 87 | 88 | 87 | 86 | 86 | 85 | 85 | ||||||||||||||||||||
| 1,533 | 1,757 | 1,672 | 1,812 | 1,506 | 1,593 | 1,505 | ||||||||||||||||||||
| 2,557 | 6,430 | 3,526 | 1,505 | 3,084 | 975 | 607 | ||||||||||||||||||||
| 267 | 340 | 369 | 270 | 262 | 276 | 273 | ||||||||||||||||||||
| 109 | 110 | 109 | 108 | 107 | 107 | 106 | ||||||||||||||||||||
| 607 | 822 | 913 | 616 | 595 | 638 | 629 | ||||||||||||||||||||
| 18,086 | 18,094 | 18,094 | 18,086 | 18,086 | 18,083 | 18,681 | ||||||||||||||||||||
| 32,575 | 32,575 | 32,575 | 32,575 | 35,075 | 32,575 | 32,575 | ||||||||||||||||||||
| 63,737 | 64,491 | 58,481 | 58,481 | 69,414 | 68,427 | 58,481 | ||||||||||||||||||||
| 20,063 | 23,063 | 20,063 | 20,063 | 25,063 | 20,063 | 20,063 | ||||||||||||||||||||
| 21,773 | 21,773 | 21,773 | 21,773 | 21,773 | 21,773 | 21,773 | ||||||||||||||||||||
| 7,120 | 10,434 | 8,432 | 8,434 | 12,620 | 7,120 | 7,120 | ||||||||||||||||||||
|
| |||||||||||||||||||||||||
| 180,407 | 198,676 | 180,227 | 175,584 | 200,179 | 181,640 | 170,849 | ||||||||||||||||||||
| (167,812 | ) | (178,639 | ) | (164,731 | ) | (167,153 | ) | (187,961 | ) | (173,749 | ) | (164,128 | ) | |||||||||||||
| 0 | 0 | (814 | ) | (147 | ) | 0 | (29 | ) | (41 | ) | ||||||||||||||||
| (67 | ) | (27 | ) | (121 | ) | (62 | ) | (117 | ) | (37 | ) | (35 | ) | |||||||||||||
| (1,533 | ) | (602 | ) | (1,672 | ) | 0 | (1,506 | ) | (1,593 | ) | (1,505 | ) | ||||||||||||||
|
| |||||||||||||||||||||||||
| 10,995 | 19,408 | 12,889 | 8,222 | 10,595 | 6,232 | 5,140 | ||||||||||||||||||||
|
| |||||||||||||||||||||||||
| 144,942 | 188,039 | 156,690 | 148,730 | 135,774 | 125,715 | 117,222 | ||||||||||||||||||||
|
| |||||||||||||||||||||||||
| 138,594 | 189,810 | 150,677 | 147,282 | 124,148 | 124,924 | 114,203 | ||||||||||||||||||||
| (14,716 | ) | (33,127 | ) | (25,577 | ) | (34,840 | ) | (26,682 | ) | (25,282 | ) | (17,574 | ) | |||||||||||||
|
| |||||||||||||||||||||||||
| 123,878 | 156,683 | 125,100 | 112,442 | 97,466 | 99,642 | 96,629 | ||||||||||||||||||||
|
| |||||||||||||||||||||||||
| 20,866 | (48,717 | ) | (72,724 | ) | (119,505 | ) | (162,678 | ) | (145,689 | ) | (150,205 | ) | ||||||||||||||
| 28,783 | 48,829 | 44,297 | 42,194 | 44,238 | 26,580 | 13,943 | ||||||||||||||||||||
|
| |||||||||||||||||||||||||
| 49,649 | 112 | (28,427 | ) | (77,311 | ) | (118,440 | ) | (119,109 | ) | (136,262 | ) | |||||||||||||||
|
| |||||||||||||||||||||||||
| 173,527 | 156,795 | 96,673 | 35,131 | (20,974 | ) | (19,467 | ) | (39,633 | ) | |||||||||||||||||
|
| |||||||||||||||||||||||||
| $ | 318,469 | $ | 344,834 | $ | 253,363 | $ | 183,861 | $ | 114,800 | $ | 106,248 | $ | 77,589 | |||||||||||||
|
| |||||||||||||||||||||||||
| $5,690 | $9,671 | $9,758 | $9,954 | $10,132 | $9,959 | $9,657 | ||||||||||||||||||||
The accompanying notes are an integral part of these financial statements.
Target Date Retirement Funds | 73
Table of Contents
Statements of operations—year ended February 29, 2020
| Dynamic Target 2055 Fund | Dynamic Target 2060 Fund | |||||||
Investment income | ||||||||
Interest allocated from affiliated Master Portfolios | $ | 9,055 | $ | 9,058 | ||||
Dividends allocated from affiliated Master Portfolios* | 119,552 | 119,665 | ||||||
Affiliated income allocated from affiliated Master Portfolios | 2,905 | 2,875 | ||||||
Interest | 281 | 255 | ||||||
Expenses allocated from affiliated Master Portfolios | (11,363 | ) | (11,301 | ) | ||||
Waivers allocated from affiliated Master Portfolios | 2,192 | 2,184 | ||||||
|
| |||||||
Total investment income | 122,622 | 122,736 | ||||||
|
| |||||||
Expenses | ||||||||
Management fee | 8,279 | 8,218 | ||||||
Administration fees |
| |||||||
Class A | 448 | 716 | ||||||
Class C | 220 | 220 | ||||||
Class R4 | 85 | 85 | ||||||
Class R6 | 1,528 | 1,478 | ||||||
Shareholder servicing fees |
| |||||||
Class A | 534 | 852 | ||||||
Class C | 262 | 261 | ||||||
Class R4 | 106 | 107 | ||||||
Distribution fee |
| |||||||
Class C | 597 | 593 | ||||||
Custody and accounting fees | 18,685 | 18,083 | ||||||
Professional fees | 32,575 | 32,575 | ||||||
Registration fees | 68,824 | 58,481 | ||||||
Shareholder report expenses | 20,063 | 20,063 | ||||||
Trustees’ fees and expenses | 21,773 | 21,773 | ||||||
Other fees and expenses | 7,175 | 7,175 | ||||||
|
| |||||||
Total expenses | 181,154 | 170,680 | ||||||
Less: Fee waivers and/or expense reimbursements |
| |||||||
Fund-level | (174,564 | ) | (163,628 | ) | ||||
Class R4 | (43 | ) | (32 | ) | ||||
Class R6 | (1,528 | ) | (1,478 | ) | ||||
|
| |||||||
Net expenses | 5,019 | 5,542 | ||||||
|
| |||||||
Net investment income | 117,603 | 117,194 | ||||||
|
| |||||||
Realized and unrealized gains (losses) on investments | ||||||||
Net realized gains (losses) on | ||||||||
Securities transactions allocated from affiliated Master Portfolios | 115,825 | 113,868 | ||||||
Futures contracts | (18,682 | ) | (17,049 | ) | ||||
|
| |||||||
Net realized gains on investments | 97,143 | 96,819 | ||||||
|
| |||||||
Net change in unrealized gains (losses) on | ||||||||
Securities transactions allocated from affiliated Master Portfolios | (153,616 | ) | (145,347 | ) | ||||
Futures contracts | 13,954 | 13,943 | ||||||
|
| |||||||
Net change in unrealized gains (losses) on investments | (139,662 | ) | (131,404 | ) | ||||
|
| |||||||
Net realized and unrealized gains (losses) on investments | (42,519 | ) | (34,585 | ) | ||||
|
| |||||||
Net increase in net assets resulting from operations | $ | 75,084 | $ | 82,609 | ||||
|
| |||||||
* Net of foreign dividend withholding taxes allocated from affiliated Master Portfolio(s) in the amount of | $9,698 | $9,706 | ||||||
The accompanying notes are an integral part of these financial statements.
74 | Target Date Retirement Funds
Table of Contents
Statements of changes in net assets
| Dynamic Target Today Fund | ||||||||||||||||||||||||
| Year ended February 29, 2020 | Year ended February 28, 20191 | Year ended May 31, 20182 | ||||||||||||||||||||||
Operations |
| |||||||||||||||||||||||
Net investment income | $ | 151,322 | $ | 88,772 | $ | 100,782 | ||||||||||||||||||
Net realized gains on investments | 108,776 | 204,973 | 134,802 | |||||||||||||||||||||
Net change in unrealized gains (losses) on investments | 158,255 | (117,841 | ) | 62,695 | ||||||||||||||||||||
|
| |||||||||||||||||||||||
Net increase in net assets resulting from operations | 418,353 | 175,904 | 298,279 | |||||||||||||||||||||
|
| |||||||||||||||||||||||
Distributions to shareholders from net investment income and |
| |||||||||||||||||||||||
Class A | (21,015 | ) | (36,024 | ) | (8,659 | ) | ||||||||||||||||||
Class C | (1,480 | ) | (9,345 | ) | (2,744 | ) | ||||||||||||||||||
Class R4 | (2,302 | ) | (10,587 | ) | (3,896 | ) | ||||||||||||||||||
Class R6 | (126,076 | ) | (495,495 | ) | (187,081 | ) | ||||||||||||||||||
|
| |||||||||||||||||||||||
Total distributions to shareholders | (150,873 | ) | (551,451 | ) | (202,380 | ) | ||||||||||||||||||
|
| |||||||||||||||||||||||
Capital share transactions | Shares | Shares | Shares | |||||||||||||||||||||
Proceeds from shares sold |
| |||||||||||||||||||||||
Class A | 64,419 | 692,848 | 5,826 | 59,358 | 15,000 | 163,052 | ||||||||||||||||||
Class C | 566 | 5,800 | 0 | 0 | 0 | 0 | ||||||||||||||||||
Class R6 | 53,955 | 572,915 | 0 | 0 | 0 | 0 | ||||||||||||||||||
|
| |||||||||||||||||||||||
| 1,271,563 | 59,358 | 163,052 | ||||||||||||||||||||||
|
| |||||||||||||||||||||||
Reinvestment of distributions |
| |||||||||||||||||||||||
Class A | 1,743 | 18,807 | 2,634 | 25,760 | 460 | 5,007 | ||||||||||||||||||
Class C | 7 | 78 | 0 | 0 | 0 | 0 | ||||||||||||||||||
Class R6 | 1,162 | 12,544 | 0 | 0 | 0 | 0 | ||||||||||||||||||
|
| |||||||||||||||||||||||
| 31,429 | 25,760 | 5,007 | ||||||||||||||||||||||
|
| |||||||||||||||||||||||
Payment for shares redeemed |
| |||||||||||||||||||||||
Class A | (9,330 | ) | (100,493 | ) | (4,404 | ) | (46,017 | ) | (2,288 | ) | (25,033 | ) | ||||||||||||
Class C | (573 | ) | (6,241 | ) | 0 | 0 | 0 | 0 | ||||||||||||||||
Class R | N/A | N/A | N/A | N/A | (10,219 | )3 | (111,799 | )3 | ||||||||||||||||
Class R6 | (6,593 | ) | (71,668 | ) | 0 | 0 | 0 | 0 | ||||||||||||||||
|
| |||||||||||||||||||||||
| (178,402 | ) | (46,017 | ) | (136,832 | ) | |||||||||||||||||||
|
| |||||||||||||||||||||||
Net increase in net assets resulting from capital share transactions | 1,124,590 | 39,101 | 31,227 | |||||||||||||||||||||
|
| |||||||||||||||||||||||
Total increase (decrease) in net assets | 1,392,070 | (336,446 | ) | 127,126 | ||||||||||||||||||||
|
| |||||||||||||||||||||||
Net assets | ||||||||||||||||||||||||
Beginning of period | 5,390,883 | 5,727,329 | 5,600,203 | |||||||||||||||||||||
|
| |||||||||||||||||||||||
End of period | $ | 6,782,953 | $ | 5,390,883 | $ | 5,727,329 | ||||||||||||||||||
|
| |||||||||||||||||||||||
| 1 | For the nine months ended February 28, 2019. The Fund changed its fiscal year end from May 31 to February 28, effective February 28, 2019. |
| 2 | Effective for all filings after November 4, 2018, the SEC prospectively eliminated the requirement to parenthetically disclose undistributed net investment income at the end of the period and permitted the aggregation of distributions, with the exception of tax basis returns of capital. Undistributed net investment income at May 31, 2018 was $23,461. The disaggregated distributions information for the year ended May 31, 2018 is included in Note 9,Distributions to Shareholders, in the notes to the financial statements. |
| 3 | For the period from June 1, 2017 to November 13, 2017. Effective at the close of business on November 13, 2017, Class R shares were liquidated and the class was subsequently closed. Class R shares are no longer offered by the Fund. |
The accompanying notes are an integral part of these financial statements.
Target Date Retirement Funds | 75
Table of Contents
Statements of changes in net assets
| Dynamic Target 2015 Fund | ||||||||||||||||||||||||
| Year ended February 29, 2020 | Year ended February 28, 20191 | Year ended May 31, 20182 | ||||||||||||||||||||||
Operations |
| |||||||||||||||||||||||
Net investment income | $ | 136,159 | $ | 82,845 | $ | 98,476 | ||||||||||||||||||
Net realized gains on investments | 113,540 | 270,816 | 185,614 | |||||||||||||||||||||
Net change in unrealized gains (losses) on investments | 112,702 | (191,326 | ) | 123,486 | ||||||||||||||||||||
|
| |||||||||||||||||||||||
Net increase in net assets resulting from operations | 362,401 | 162,335 | 407,576 | |||||||||||||||||||||
|
| |||||||||||||||||||||||
Distributions to shareholders from net investment income and |
| |||||||||||||||||||||||
Class A | (9,562 | ) | (49,785 | ) | (17,269 | ) | ||||||||||||||||||
Class C | (1,643 | ) | (12,834 | ) | (3,262 | ) | ||||||||||||||||||
Class R4 | (2,549 | ) | (14,143 | ) | (4,434 | ) | ||||||||||||||||||
Class R6 | (124,757 | ) | (659,519 | ) | (212,012 | ) | ||||||||||||||||||
|
| |||||||||||||||||||||||
Total distributions to shareholders | (138,511 | ) | (736,281 | ) | (236,977 | ) | ||||||||||||||||||
|
| |||||||||||||||||||||||
Capital share transactions | Shares | Shares | Shares | |||||||||||||||||||||
Proceeds from shares sold |
| |||||||||||||||||||||||
Class A | 18,133 | 187,636 | 3,093 | 34,587 | 20,386 | 225,685 | ||||||||||||||||||
|
| |||||||||||||||||||||||
Reinvestment of distributions |
| |||||||||||||||||||||||
Class A | 685 | 7,332 | 3,744 | 36,027 | 1,177 | 13,065 | ||||||||||||||||||
|
| |||||||||||||||||||||||
Payment for shares redeemed |
| |||||||||||||||||||||||
Class A | (13,627 | ) | (143,495 | ) | (9,037 | ) | (98,206 | ) | (14,072 | ) | (157,011 | ) | ||||||||||||
Class R | N/A | N/A | N/A | N/A | (10,237 | )3 | (114,241 | )3 | ||||||||||||||||
|
| |||||||||||||||||||||||
| (143,495 | ) | (98,206 | ) | (271,252 | ) | |||||||||||||||||||
|
| |||||||||||||||||||||||
Net increase (decrease) in net assets resulting from capital share transactions | 51,473 | (27,592 | ) | (32,502 | ) | |||||||||||||||||||
|
| |||||||||||||||||||||||
Total increase (decrease) in net assets | 275,363 | (601,538 | ) | 138,097 | ||||||||||||||||||||
|
| |||||||||||||||||||||||
Net assets | ||||||||||||||||||||||||
Beginning of period | 5,334,099 | 5,935,637 | 5,797,540 | |||||||||||||||||||||
|
| |||||||||||||||||||||||
End of period | $ | 5,609,462 | $ | 5,334,099 | $ | 5,935,637 | ||||||||||||||||||
|
| |||||||||||||||||||||||
| 1 | For the nine months ended February 28, 2019. The Fund changed its fiscal year end from May 31 to February 28, effective February 28, 2019. |
| 2 | Effective for all filings after November 4, 2018, the SEC prospectively eliminated the requirement to parenthetically disclose undistributed net investment income at the end of the period and permitted the aggregation of distributions, with the exception of tax basis returns of capital. Undistributed net investment income at May 31, 2018 was $18,398. The disaggregated distributions information for the year ended May 31, 2018 is included in Note 9,Distributions to Shareholders, in the notes to the financial statements. |
| 3 | For the period from June 1, 2017 to November 13, 2017. Effective at the close of business on November 13, 2017, Class R shares were liquidated and the class was subsequently closed. Class R shares are no longer offered by the Fund. |
The accompanying notes are an integral part of these financial statements.
76 | Target Date Retirement Funds
Table of Contents
Statements of changes in net assets
| Dynamic Target 2020 Fund | ||||||||||||||||||||||||
| Year ended February 29, 2020 | Year ended February 28, 20191 | Year ended May 31, 20182 | ||||||||||||||||||||||
Operations |
| |||||||||||||||||||||||
Net investment income | $ | 144,942 | $ | 79,004 | $ | 94,850 | ||||||||||||||||||
Net realized gains on investments | 123,878 | 318,626 | 207,399 | |||||||||||||||||||||
Net change in unrealized gains (losses) on investments | 49,649 | (216,125 | ) | 178,376 | ||||||||||||||||||||
|
| |||||||||||||||||||||||
Net increase in net assets resulting from operations | 318,469 | 181,505 | 480,625 | |||||||||||||||||||||
|
| |||||||||||||||||||||||
Distributions to shareholders from net investment income and |
| |||||||||||||||||||||||
Class A | (25,690 | ) | (60,870 | ) | (17,727 | ) | ||||||||||||||||||
Class C | (1,373 | ) | (14,641 | ) | (3,584 | ) | ||||||||||||||||||
Class R4 | (2,277 | ) | (15,976 | ) | (4,812 | ) | ||||||||||||||||||
Class R6 | (116,241 | ) | (744,080 | ) | (229,454 | ) | ||||||||||||||||||
|
| |||||||||||||||||||||||
Total distributions to shareholders | (145,581 | ) | (835,567 | ) | (255,577 | ) | ||||||||||||||||||
|
| |||||||||||||||||||||||
Capital share transactions | Shares | Shares | Shares | |||||||||||||||||||||
Proceeds from shares sold |
| |||||||||||||||||||||||
Class A | 107,841 | 1,133,041 | 25,542 | 246,644 | 37,638 | 417,972 | ||||||||||||||||||
Class R6 | 17,310 | 180,246 | 0 | 0 | 0 | 0 | ||||||||||||||||||
|
| |||||||||||||||||||||||
| 1,313,287 | 246,644 | 417,972 | ||||||||||||||||||||||
|
| |||||||||||||||||||||||
Reinvestment of distributions |
| |||||||||||||||||||||||
Class A | 2,193 | 23,471 | 4,744 | 45,187 | 1,179 | 13,202 | ||||||||||||||||||
Class R6 | 367 | 3,947 | 0 | 0 | 0 | 0 | ||||||||||||||||||
|
| |||||||||||||||||||||||
| 27,418 | 45,187 | 13,202 | ||||||||||||||||||||||
|
| |||||||||||||||||||||||
Payment for shares redeemed |
| |||||||||||||||||||||||
Class A | (32,999 | ) | (343,229 | ) | (16,021 | ) | (171,963 | ) | (25,710 | ) | (288,158 | ) | ||||||||||||
Class R | N/A | N/A | N/A | N/A | (10,299 | )3 | (116,280 | )3 | ||||||||||||||||
Class R6 | (13 | ) | (142 | ) | 0 | 0 | 0 | 0 | ||||||||||||||||
|
| |||||||||||||||||||||||
| (343,371 | ) | (171,963 | ) | (404,438 | ) | |||||||||||||||||||
|
| |||||||||||||||||||||||
Net increase in net assets resulting from capital share transactions | 997,334 | 119,868 | 26,736 | |||||||||||||||||||||
|
| |||||||||||||||||||||||
Total increase (decrease) in net assets | 1,170,222 | (534,194 | ) | 251,784 | ||||||||||||||||||||
|
| |||||||||||||||||||||||
Net assets | ||||||||||||||||||||||||
Beginning of period | 5,595,188 | 6,129,382 | 5,877,598 | |||||||||||||||||||||
|
| |||||||||||||||||||||||
End of period | $ | 6,765,410 | $ | 5,595,188 | $ | 6,129,382 | ||||||||||||||||||
|
| |||||||||||||||||||||||
| 1 | For the nine months ended February 28, 2019. The Fund changed its fiscal year end from May 31 to February 28, effective February 28, 2019. |
| 2 | Effective for all filings after November 4, 2018, the SEC prospectively eliminated the requirement to parenthetically disclose undistributed net investment income at the end of the period and permitted the aggregation of distributions, with the exception of tax basis returns of capital. Undistributed net investment income at May 31, 2018 was $14,722. The disaggregated distributions information for the year ended May 31, 2018 is included in Note 9,Distributions to Shareholders, in the notes to the financial statements. |
| 3 | For the period from June 1, 2017 to November 13, 2017. Effective at the close of business on November 13, 2017, Class R shares were liquidated and the class was subsequently closed. Class R shares are no longer offered by the Fund. |
The accompanying notes are an integral part of these financial statements.
Target Date Retirement Funds | 77
Table of Contents
Statements of changes in net assets
| Dynamic Target 2025 Fund | ||||||||||||||||||||||||
| Year ended February 29, 2020 | Year ended February 28, 20191 | Year ended May 31, 20182 | ||||||||||||||||||||||
Operations |
| |||||||||||||||||||||||
Net investment income | $ | 188,039 | $ | 87,236 | $ | 95,477 | ||||||||||||||||||
Net realized gains on investments | 156,683 | 304,336 | 233,441 | |||||||||||||||||||||
Net change in unrealized gains (losses) on investments | 112 | (213,852 | ) | 227,374 | ||||||||||||||||||||
|
| |||||||||||||||||||||||
Net increase in net assets resulting from operations | 344,834 | 177,720 | 556,292 | |||||||||||||||||||||
|
| |||||||||||||||||||||||
Distributions to shareholders from net investment income and net realized gains | ||||||||||||||||||||||||
Class A | (47,670 | ) | (211,810 | ) | (30,732 | ) | ||||||||||||||||||
Class C | (1,476 | ) | (17,720 | ) | (4,346 | ) | ||||||||||||||||||
Class R4 | (2,127 | ) | (15,828 | ) | (5,079 | ) | ||||||||||||||||||
Class R6 | (134,882 | ) | (737,362 | ) | (241,848 | ) | ||||||||||||||||||
|
| |||||||||||||||||||||||
Total distributions to shareholders | (186,155 | ) | (982,720 | ) | (282,005 | ) | ||||||||||||||||||
|
| |||||||||||||||||||||||
Capital share transactions | Shares | Shares | Shares | |||||||||||||||||||||
Proceeds from shares sold |
| |||||||||||||||||||||||
Class A | 124,386 | 1,302,775 | 50,265 | 506,905 | 103,325 | 1,193,158 | ||||||||||||||||||
Class C | 268 | 2,900 | 2,262 | 26,062 | 40 | 460 | ||||||||||||||||||
Class R6 | 163,537 | 1,735,695 | 0 | 0 | 0 | 0 | ||||||||||||||||||
|
| |||||||||||||||||||||||
| 3,041,370 | 532,967 | 1,193,618 | ||||||||||||||||||||||
|
| |||||||||||||||||||||||
Reinvestment of distributions |
| |||||||||||||||||||||||
Class A | 4,188 | 45,780 | 20,342 | 196,231 | 2,278 | 25,877 | ||||||||||||||||||
Class C | 28 | 301 | 332 | 3,183 | 0 | 0 | ||||||||||||||||||
Class R6 | 2,659 | 29,225 | 0 | 0 | 0 | 0 | ||||||||||||||||||
|
| |||||||||||||||||||||||
| 75,306 | 199,414 | 25,877 | ||||||||||||||||||||||
|
| |||||||||||||||||||||||
Payment for shares redeemed |
| |||||||||||||||||||||||
Class A | (44,031 | ) | (469,581 | ) | (11,116 | ) | (107,757 | ) | (20,981 | ) | (239,625 | ) | ||||||||||||
Class C | (1,039 | ) | (11,500 | ) | (1,246 | ) | (13,796 | ) | 0 | 0 | ||||||||||||||
Class R | N/A | N/A | N/A | N/A | (10,291 | )3 | (117,732 | )3 | ||||||||||||||||
Class R6 | (6,576 | ) | (71,845 | ) | 0 | 0 | 0 | 0 | ||||||||||||||||
|
| |||||||||||||||||||||||
| (552,926 | ) | (121,553 | ) | (357,357 | ) | |||||||||||||||||||
|
| |||||||||||||||||||||||
Net increase in net assets resulting from capital share transactions | 2,563,750 | 610,828 | 862,138 | |||||||||||||||||||||
|
| |||||||||||||||||||||||
Total increase (decrease) in net assets | 2,722,429 | (194,172 | ) | 1,136,425 | ||||||||||||||||||||
|
| |||||||||||||||||||||||
Net assets | ||||||||||||||||||||||||
Beginning of period | 7,001,706 | 7,195,878 | 6,059,453 | |||||||||||||||||||||
|
| |||||||||||||||||||||||
End of period | $ | 9,724,135 | $ | 7,001,706 | $ | 7,195,878 | ||||||||||||||||||
|
| |||||||||||||||||||||||
| 1 | For the nine months ended February 28, 2019. The Fund changed its fiscal year end from May 31 to February 28, effective February 28, 2019. |
| 2 | Effective for all filings after November 4, 2018, the SEC prospectively eliminated the requirement to parenthetically disclose undistributed net investment income at the end of the period and permitted the aggregation of distributions, with the exception of tax basis returns of capital. Undistributed net investment income at May 31, 2018 was $12,057. The disaggregated distributions information for the year ended May 31, 2018 is included in Note 9,Distributions to Shareholders, in the notes to the financial statements. |
| 3 | For the period from June 1, 2017 to November 13, 2017. Effective at the close of business on November 13, 2017, Class R shares were liquidated and the class was subsequently closed. Class R shares are no longer offered by the Fund. |
The accompanying notes are an integral part of these financial statements.
78 | Target Date Retirement Funds
Table of Contents
Statements of changes in net assets
| Dynamic Target 2030 Fund | ||||||||||||||||||||||||
| Year ended February 29, 2020 | Year ended February 28, 20191 | Year ended May 31, 20182 | ||||||||||||||||||||||
Operations |
| |||||||||||||||||||||||
Net investment income | $ | 156,690 | $ | 76,778 | $ | 90,167 | ||||||||||||||||||
Net realized gains on investments | 125,100 | 360,992 | 271,306 | |||||||||||||||||||||
Net change in unrealized gains (losses) on investments | (28,427 | ) | (279,792 | ) | 288,238 | |||||||||||||||||||
|
| |||||||||||||||||||||||
Net increase in net assets resulting from operations | 253,363 | 157,978 | 649,711 | |||||||||||||||||||||
|
| |||||||||||||||||||||||
Distributions to shareholders from net investment income and net realized gains | ||||||||||||||||||||||||
Class A | (29,569 | ) | (159,867 | ) | (33,469 | ) | ||||||||||||||||||
Class C | (558 | ) | (18,837 | ) | (4,147 | ) | ||||||||||||||||||
Class R4 | (2,035 | ) | (19,212 | ) | (5,342 | ) | ||||||||||||||||||
Class R6 | (125,609 | ) | (893,363 | ) | (253,969 | ) | ||||||||||||||||||
|
| |||||||||||||||||||||||
Total distributions to shareholders | (157,771 | ) | (1,091,279 | ) | (296,927 | ) | ||||||||||||||||||
|
| |||||||||||||||||||||||
Capital share transactions | Shares | Shares | Shares | |||||||||||||||||||||
Proceeds from shares sold |
| |||||||||||||||||||||||
Class A | 144,551 | 1,511,865 | 20,826 | 215,923 | 42,081 | 487,575 | ||||||||||||||||||
Class C | 0 | 0 | 5,158 | 47,355 | 23 | 253 | ||||||||||||||||||
Class R6 | 119,094 | 1,224,410 | 0 | 0 | 0 | 0 | ||||||||||||||||||
|
| |||||||||||||||||||||||
| 2,736,275 | 263,278 | 487,828 | ||||||||||||||||||||||
|
| |||||||||||||||||||||||
Reinvestment of distributions |
| |||||||||||||||||||||||
Class A | 2,428 | 26,197 | 13,298 | 125,493 | 2,468 | 28,325 | ||||||||||||||||||
Class C | 0 | 0 | 40 | 362 | 0 | 0 | ||||||||||||||||||
Class R6 | 2,241 | 24,358 | 0 | 0 | 0 | 0 | ||||||||||||||||||
|
| |||||||||||||||||||||||
| 50,555 | 125,855 | 28,325 | ||||||||||||||||||||||
|
| |||||||||||||||||||||||
Payment for shares redeemed |
| |||||||||||||||||||||||
Class A | (19,512 | ) | (201,894 | ) | (11,891 | ) | (113,848 | ) | (14,800 | ) | (168,809 | ) | ||||||||||||
Class C | (5,192 | ) | (55,089 | ) | (1 | ) | (10 | ) | (1 | ) | (10 | ) | ||||||||||||
Class R | N/A | N/A | N/A | N/A | (10,313 | )3 | (119,216 | )3 | ||||||||||||||||
Class R6 | (55,148 | ) | (597,605 | ) | 0 | 0 | 0 | 0 | ||||||||||||||||
|
| |||||||||||||||||||||||
| (854,588 | ) | (113,858 | ) | (288,035 | ) | |||||||||||||||||||
|
| |||||||||||||||||||||||
Net increase in net assets resulting from capital share transactions | 1,932,242 | 275,275 | 228,118 | |||||||||||||||||||||
|
| |||||||||||||||||||||||
Total increase (decrease) in net assets | 2,027,834 | (658,026 | ) | 580,902 | ||||||||||||||||||||
|
| |||||||||||||||||||||||
Net assets | ||||||||||||||||||||||||
Beginning of period | 6,041,543 | 6,699,569 | 6,118,667 | |||||||||||||||||||||
|
| |||||||||||||||||||||||
End of period | $ | 8,069,377 | $ | 6,041,543 | $ | 6,699,569 | ||||||||||||||||||
|
| |||||||||||||||||||||||
| 1 | For the nine months ended February 28, 2019. The Fund changed its fiscal year end from May 31 to February 28, effective February 28, 2019. |
| 2 | Effective for all filings after November 4, 2018, the SEC prospectively eliminated the requirement to parenthetically disclose undistributed net investment income at the end of the period and permitted the aggregation of distributions, with the exception of tax basis returns of capital. Undistributed net investment income at May 31, 2018 was $6,806. The disaggregated distributions information for the year ended May 31, 2018 is included in Note 9,Distributions to Shareholders, in the notes to the financial statements. |
| 3 | For the period from June 1, 2017 to November 13, 2017. Effective at the close of business on November 13, 2017, Class R shares were liquidated and the class was subsequently closed. Class R shares are no longer offered by the Fund. |
The accompanying notes are an integral part of these financial statements.
Target Date Retirement Funds | 79
Table of Contents
Statements of changes in net assets
| Dynamic Target 2035 Fund | ||||||||||||||||||||||||
| Year ended February 29, 2020 | Year ended February 28, 20191 | Year ended May 31, 20182 | ||||||||||||||||||||||
Operations | ||||||||||||||||||||||||
Net investment income | $ | 148,730 | $ | 68,442 | $ | 84,130 | ||||||||||||||||||
Net realized gains on investments | 112,442 | 403,375 | 281,177 | |||||||||||||||||||||
Net change in unrealized gains (losses) on investments | (77,311 | ) | (326,225 | ) | 319,827 | |||||||||||||||||||
|
| |||||||||||||||||||||||
Net increase in net assets resulting from operations | 183,861 | 145,592 | 685,134 | |||||||||||||||||||||
|
| |||||||||||||||||||||||
Distributions to shareholders from net investment income and net realized gains | ||||||||||||||||||||||||
Class A | (10,587 | ) | (92,213 | ) | (20,258 | ) | ||||||||||||||||||
Class C | (1,100 | ) | (20,401 | ) | (4,536 | ) | ||||||||||||||||||
Class R4 | (1,911 | ) | (21,533 | ) | (5,751 | ) | ||||||||||||||||||
Class R6 | (133,706 | ) | (1,000,400 | ) | (272,883 | ) | ||||||||||||||||||
|
| |||||||||||||||||||||||
Total distributions to shareholders | (147,304 | ) | (1,134,547 | ) | (303,428 | ) | ||||||||||||||||||
|
| |||||||||||||||||||||||
Capital share transactions | Shares | Shares | Shares | |||||||||||||||||||||
Proceeds from shares sold | ||||||||||||||||||||||||
Class A | 26,199 | 273,961 | 7,644 | 86,194 | 11,749 | 136,284 | ||||||||||||||||||
Class C | 948 | 10,002 | 28 | 311 | 33 | 371 | ||||||||||||||||||
Class R6 | 199,224 | 2,018,216 | 0 | 0 | 0 | 0 | ||||||||||||||||||
|
| |||||||||||||||||||||||
| 2,302,179 | 86,505 | 136,655 | ||||||||||||||||||||||
|
| |||||||||||||||||||||||
Reinvestment of distributions | ||||||||||||||||||||||||
Class A | 831 | 8,898 | 7,619 | 70,937 | 1,274 | 14,733 | ||||||||||||||||||
Class C | 4 | 47 | 11 | 101 | 0 | 0 | ||||||||||||||||||
Class R6 | 3,543 | 38,157 | 0 | 0 | 0 | 0 | ||||||||||||||||||
|
| |||||||||||||||||||||||
| 47,102 | 71,038 | 14,733 | ||||||||||||||||||||||
|
| |||||||||||||||||||||||
Payment for shares redeemed | ||||||||||||||||||||||||
Class A | (6,312 | ) | (63,239 | ) | (1,204 | ) | (12,540 | ) | (4,960 | ) | (57,989 | ) | ||||||||||||
Class C | (561 | ) | (6,055 | ) | (1 | ) | (10 | ) | (1 | ) | (10 | ) | ||||||||||||
Class R | N/A | N/A | N/A | N/A | (10,332 | )3 | (120,471 | )3 | ||||||||||||||||
Class R6 | (4,838 | ) | (51,447 | ) | 0 | 0 | 0 | 0 | ||||||||||||||||
|
| |||||||||||||||||||||||
| (120,741 | ) | (12,550 | ) | (178,470 | ) | |||||||||||||||||||
|
| |||||||||||||||||||||||
Net increase (decrease) in net assets resulting from capital share transactions | 2,228,540 | 144,993 | (27,082 | ) | ||||||||||||||||||||
|
| |||||||||||||||||||||||
Total increase (decrease) in net assets | 2,265,097 | (843,962 | ) | 354,624 | ||||||||||||||||||||
|
| |||||||||||||||||||||||
Net assets | ||||||||||||||||||||||||
Beginning of period | 5,458,943 | 6,302,905 | 5,948,281 | |||||||||||||||||||||
|
| |||||||||||||||||||||||
End of period | $ | 7,724,040 | $ | 5,458,943 | $ | 6,302,905 | ||||||||||||||||||
|
| |||||||||||||||||||||||
| 1 | For the nine months ended February 28, 2019. The Fund changed its fiscal year end from May 31 to February 28, effective February 28, 2019. |
| 2 | Effective for all filings after November 4, 2018, the SEC prospectively eliminated the requirement to parenthetically disclose undistributed net investment income at the end of the period and permitted the aggregation of distributions, with the exception of tax basis returns of capital. Undistributed net investment income at May 31, 2018 was $3,822. The disaggregated distributions information for the year ended May 31, 2018 is included in Note 9,Distributions to Shareholders, in the notes to the financial statements. |
| 3 | For the period from June 1, 2017 to November 13, 2017. Effective at the close of business on November 13, 2017, Class R shares were liquidated and the class was subsequently closed. Class R shares are no longer offered by the Fund. |
The accompanying notes are an integral part of these financial statements.
80 | Target Date Retirement Funds
Table of Contents
Statements of changes in net assets
| Dynamic Target 2040 Fund | ||||||||||||||||||||||||
| Year ended February 29, 2020 | Year ended February 28, 20191 | Year ended May 31, 20182 | ||||||||||||||||||||||
Operations | ||||||||||||||||||||||||
Net investment income | $ | 135,774 | $ | 62,655 | $ | 81,629 | ||||||||||||||||||
Net realized gains on investments | 97,466 | 425,134 | 289,487 | |||||||||||||||||||||
Net change in unrealized gains (losses) on investments | (118,440 | ) | (358,045 | ) | 345,801 | |||||||||||||||||||
|
| |||||||||||||||||||||||
Net increase in net assets resulting from operations | 114,800 | 129,744 | 716,917 | |||||||||||||||||||||
|
| |||||||||||||||||||||||
Distributions to shareholders from net investment income and net realized gains | ||||||||||||||||||||||||
Class A | (30,165 | ) | (81,122 | ) | (23,446 | ) | ||||||||||||||||||
Class C | (1,101 | ) | (21,572 | ) | (4,589 | ) | ||||||||||||||||||
Class R4 | (1,982 | ) | (22,716 | ) | (5,818 | ) | ||||||||||||||||||
Class R6 | (101,722 | ) | (1,054,983 | ) | (276,025 | ) | ||||||||||||||||||
|
| |||||||||||||||||||||||
Total distributions to shareholders | (134,970 | ) | (1,180,393 | ) | (309,878 | ) | ||||||||||||||||||
|
| |||||||||||||||||||||||
Capital share transactions | Shares | Shares | Shares | |||||||||||||||||||||
Proceeds from shares sold | ||||||||||||||||||||||||
Class A | 143,696 | 1,472,631 | 4,693 | 45,463 | 22,665 | 262,751 | ||||||||||||||||||
Class C | 53 | 548 | 0 | 0 | 0 | 0 | ||||||||||||||||||
Class R6 | 18,839 | 189,983 | 0 | 0 | 0 | 0 | ||||||||||||||||||
|
| |||||||||||||||||||||||
| 1,663,162 | 45,463 | 262,751 | ||||||||||||||||||||||
|
| |||||||||||||||||||||||
Reinvestment of distributions |
| |||||||||||||||||||||||
Class A | 2,661 | 28,283 | 6,359 | 58,731 | 1,531 | 17,789 | ||||||||||||||||||
Class R6 | 299 | 3,204 | 0 | 0 | 0 | 0 | ||||||||||||||||||
|
| |||||||||||||||||||||||
| 31,487 | 58,731 | 17,789 | ||||||||||||||||||||||
|
| |||||||||||||||||||||||
Payment for shares redeemed |
| |||||||||||||||||||||||
Class A | (3,647 | ) | (37,457 | ) | (4,887 | ) | (56,564 | ) | (11,843 | ) | (133,335 | ) | ||||||||||||
Class R | N/A | N/A | N/A | N/A | (10,331 | )3 | (121,078 | )3 | ||||||||||||||||
Class R6 | (3,916 | ) | (40,282 | ) | 0 | 0 | 0 | 0 | ||||||||||||||||
|
| |||||||||||||||||||||||
| (77,739 | ) | (56,564 | ) | (254,413 | ) | |||||||||||||||||||
|
| |||||||||||||||||||||||
Net increase in net assets resulting from capital share transactions | 1,616,910 | 47,630 | 26,127 | |||||||||||||||||||||
|
| |||||||||||||||||||||||
Total increase (decrease) in net assets | 1,596,740 | (1,003,019 | ) | 433,166 | ||||||||||||||||||||
|
| |||||||||||||||||||||||
Net assets | ||||||||||||||||||||||||
Beginning of period | 5,363,364 | 6,366,383 | 5,933,217 | |||||||||||||||||||||
|
| |||||||||||||||||||||||
End of period | $ | 6,960,104 | $ | 5,363,364 | $ | 6,366,383 | ||||||||||||||||||
|
| |||||||||||||||||||||||
| 1 | For the nine months ended February 28, 2019. The Fund changed its fiscal year end from May 31 to February 28, effective February 28, 2019. |
| 2 | Effective for all filings after November 4, 2018, the SEC prospectively eliminated the requirement to parenthetically disclose undistributed net investment income at the end of the period and permitted the aggregation of distributions, with the exception of tax basis returns of capital. Undistributed net investment income at May 31, 2018 was $1,231. The disaggregated distributions information for the year ended May 31, 2018 is included in Note 9,Distributions to Shareholders, in the notes to the financial statements. |
| 3 | For the period from June 1, 2017 to November 13, 2017. Effective at the close of business on November 13, 2017, Class R shares were liquidated and the class was subsequently closed. Class R shares are no longer offered by the Fund. |
The accompanying notes are an integral part of these financial statements.
Target Date Retirement Funds | 81
Table of Contents
Statements of changes in net assets
| Dynamic Target 2045 Fund | ||||||||||||||||||||||||
| Year ended February 29, 2020 | Year ended February 28, 20191 | Year ended May 31, 20182 | ||||||||||||||||||||||
Operations | ||||||||||||||||||||||||
Net investment income | $ | 125,715 | $ | 60,220 | $ | 79,429 | ||||||||||||||||||
Net realized gains on investments | 99,642 | 388,694 | 303,822 | |||||||||||||||||||||
Net change in unrealized gains (losses) on investments | (119,109 | ) | (344,323 | ) | 339,121 | |||||||||||||||||||
|
| |||||||||||||||||||||||
Net increase in net assets resulting from operations | 106,248 | 104,591 | 722,372 | |||||||||||||||||||||
|
| |||||||||||||||||||||||
Distributions to shareholders from net investment income and net realized gains | ||||||||||||||||||||||||
Class A | (7,258 | ) | (61,549 | ) | (12,713 | ) | ||||||||||||||||||
Class C | (1,297 | ) | (22,266 | ) | (4,745 | ) | ||||||||||||||||||
Class R4 | (2,030 | ) | (23,244 | ) | (5,966 | ) | ||||||||||||||||||
Class R6 | (115,733 | ) | (1,078,242 | ) | (282,869 | ) | ||||||||||||||||||
|
| |||||||||||||||||||||||
Total distributions to shareholders | (126,318 | ) | (1,185,301 | ) | (306,293 | ) | ||||||||||||||||||
|
| |||||||||||||||||||||||
Capital share transactions | Shares | Shares | Shares | |||||||||||||||||||||
Proceeds from shares sold | ||||||||||||||||||||||||
Class A | 14,979 | 152,471 | 4,514 | 47,669 | 7,143 | 83,118 | ||||||||||||||||||
Class C | 792 | 7,984 | 198 | 1,981 | 107 | 1,260 | ||||||||||||||||||
Class R6 | 74,309 | 741,092 | 0 | 0 | 0 | 0 | ||||||||||||||||||
|
| |||||||||||||||||||||||
| 901,547 | 49,650 | 84,378 | ||||||||||||||||||||||
|
| |||||||||||||||||||||||
Reinvestment of distributions | ||||||||||||||||||||||||
Class A | 515 | 5,458 | 4,186 | 38,472 | 602 | 7,025 | ||||||||||||||||||
Class C | 10 | 108 | 16 | 145 | 0 | 0 | ||||||||||||||||||
Class R6 | 1,399 | 14,937 | 0 | 0 | 0 | 0 | ||||||||||||||||||
|
| |||||||||||||||||||||||
| 20,503 | 38,617 | 7,025 | ||||||||||||||||||||||
|
| |||||||||||||||||||||||
Payment for shares redeemed | ||||||||||||||||||||||||
Class A | (6,739 | ) | (67,305 | ) | (2,637 | ) | (30,241 | ) | (87 | ) | (1,040 | ) | ||||||||||||
Class C | (4 | ) | (40 | ) | (1 | ) | (10 | ) | (107 | ) | (1,258 | ) | ||||||||||||
Class R | N/A | N/A | N/A | N/A | (10,352 | )3 | (121,641 | )3 | ||||||||||||||||
Class R6 | (1,775 | ) | (18,548 | ) | 0 | 0 | 0 | 0 | ||||||||||||||||
|
| |||||||||||||||||||||||
| (85,893 | ) | (30,251 | ) | (123,939 | ) | |||||||||||||||||||
|
| |||||||||||||||||||||||
Net increase (decrease) in net assets resulting from capital share transactions | 836,157 | 58,016 | (32,536 | ) | ||||||||||||||||||||
|
| |||||||||||||||||||||||
Total increase (decrease) in net assets | 816,087 | (1,022,694 | ) | 383,543 | ||||||||||||||||||||
|
| |||||||||||||||||||||||
Net assets | ||||||||||||||||||||||||
Beginning of period | 5,227,777 | 6,250,471 | 5,866,928 | |||||||||||||||||||||
|
| |||||||||||||||||||||||
End of period | $ | 6,043,864 | $ | 5,227,777 | $ | 6,250,471 | ||||||||||||||||||
|
| |||||||||||||||||||||||
| 1 | For the nine months ended February 28, 2019. The Fund changed its fiscal year end from May 31 to February 28, effective February 28, 2019. |
| 2 | Effective for all filings after November 4, 2018, the SEC prospectively eliminated the requirement to parenthetically disclose undistributed net investment income at the end of the period and permitted the aggregation of distributions, with the exception of tax basis returns of capital. Undistributed net investment income at May 31, 2018 was $589. The disaggregated distributions information for the year ended May 31, 2018 is included in Note 9,Distributions to Shareholders, in the notes to the financial statements. |
| 3 | For the period from June 1, 2017 to November 13, 2017. Effective at the close of business on November 13, 2017, Class R shares were liquidated and the class was subsequently closed. Class R shares are no longer offered by the Fund. |
The accompanying notes are an integral part of these financial statements.
82 | Target Date Retirement Funds
Table of Contents
Statements of changes in net assets
| Dynamic Target 2050 Fund | ||||||||||||||||||||||||
| Year ended February 29, 2020 | Year ended February 28, 20191 | Year ended May 31, 20182 | ||||||||||||||||||||||
Operations | ||||||||||||||||||||||||
Net investment income | $ | 117,222 | $ | 59,299 | $ | 78,691 | ||||||||||||||||||
Net realized gains on investments | 96,629 | 365,335 | 300,614 | |||||||||||||||||||||
Net change in unrealized gains (losses) on investments | (136,262 | ) | (334,760 | ) | 334,798 | |||||||||||||||||||
|
| |||||||||||||||||||||||
Net increase in net assets resulting from operations | 77,589 | 89,874 | 714,103 | |||||||||||||||||||||
|
| |||||||||||||||||||||||
Distributions to shareholders from net investment income and net realized gains | ||||||||||||||||||||||||
Class A | (4,640 | ) | (40,596 | ) | (8,611 | ) | ||||||||||||||||||
Class C | (1,391 | ) | (22,330 | ) | (4,797 | ) | ||||||||||||||||||
Class R4 | (2,164 | ) | (23,283 | ) | (6,031 | ) | ||||||||||||||||||
Class R6 | (111,777 | ) | (1,081,115 | ) | (285,870 | ) | ||||||||||||||||||
|
| |||||||||||||||||||||||
Total distributions to shareholders | (119,972 | ) | (1,167,324 | ) | (305,309 | ) | ||||||||||||||||||
|
| |||||||||||||||||||||||
Capital share transactions | Shares | Shares | Shares | |||||||||||||||||||||
Proceeds from shares sold | ||||||||||||||||||||||||
Class A | 6,271 | 62,921 | 1,021 | 11,491 | 10,646 | 126,421 | ||||||||||||||||||
Class C | 650 | 6,474 | 222 | 2,200 | 0 | 0 | ||||||||||||||||||
Class R6 | 23,548 | 234,939 | 0 | 0 | 0 | 0 | ||||||||||||||||||
|
| |||||||||||||||||||||||
| 304,334 | 13,691 | 126,421 | ||||||||||||||||||||||
|
| |||||||||||||||||||||||
Reinvestment of distributions | ||||||||||||||||||||||||
Class A | 257 | 2,728 | 1,930 | 17,714 | 241 | 2,807 | ||||||||||||||||||
Class C | 8 | 86 | 16 | 147 | 0 | 0 | ||||||||||||||||||
Class R6 | 460 | 4,893 | 0 | 0 | 0 | 0 | ||||||||||||||||||
|
| |||||||||||||||||||||||
| 7,707 | 17,861 | 2,807 | ||||||||||||||||||||||
|
| |||||||||||||||||||||||
Payment for shares redeemed | ||||||||||||||||||||||||
Class A | (555 | ) | (5,520 | ) | (4,313 | ) | (51,547 | ) | (1,328 | ) | (15,284 | ) | ||||||||||||
Class C | (176 | ) | (1,772 | ) | (2 | ) | (20 | ) | 0 | 0 | ||||||||||||||
Class R | N/A | N/A | N/A | N/A | (10,355 | )3 | (121,770 | )3 | ||||||||||||||||
Class R6 | (110 | ) | (1,112 | ) | 0 | 0 | 0 | 0 | ||||||||||||||||
|
| |||||||||||||||||||||||
| (8,404 | ) | (51,567 | ) | (137,054 | ) | |||||||||||||||||||
|
| |||||||||||||||||||||||
Net increase (decrease) in net assets resulting from capital share transactions | 303,637 | (20,015 | ) | (7,826 | ) | |||||||||||||||||||
|
| |||||||||||||||||||||||
Total increase (decrease) in net assets | 261,254 | (1,097,465 | ) | 400,968 | ||||||||||||||||||||
|
| |||||||||||||||||||||||
Net assets | ||||||||||||||||||||||||
Beginning of period | 5,083,366 | 6,180,831 | 5,779,863 | |||||||||||||||||||||
|
| |||||||||||||||||||||||
End of period | $ | 5,344,620 | $ | 5,083,366 | $ | 6,180,831 | ||||||||||||||||||
|
| |||||||||||||||||||||||
| 1 | For the nine months ended February 28, 2019. The Fund changed its fiscal year end from May 31 to February 28, effective February 28, 2019. |
| 2 | Effective for all filings after November 4, 2018, the SEC prospectively eliminated the requirement to parenthetically disclose undistributed net investment income at the end of the period and permitted the aggregation of distributions, with the exception of tax basis returns of capital. Undistributed net investment income at May 31, 2018 was $583. The disaggregated distributions information for the year ended May 31, 2018 is included in Note 9,Distributions to Shareholders, in the notes to the financial statements. |
| 3 | For the period from June 1, 2017 to November 13, 2017. Effective at the close of business on November 13, 2017, Class R shares were liquidated and the class was subsequently closed. Class R shares are no longer offered by the Fund. |
The accompanying notes are an integral part of these financial statements.
Target Date Retirement Funds | 83
Table of Contents
Statements of changes in net assets
| Dynamic Target 2055 Fund | ||||||||||||||||||||||||
| Year ended February 29, 2020 | Year ended February 28, 20191 | Year ended May 31, 20182 | ||||||||||||||||||||||
Operations | ||||||||||||||||||||||||
Net investment income | $ | 117,603 | $ | 58,065 | $ | 78,193 | ||||||||||||||||||
Net realized gains on investments | 97,143 | 361,406 | 301,891 | |||||||||||||||||||||
Net change in unrealized gains (losses) on investments | (139,662 | ) | (332,495 | ) | 331,888 | |||||||||||||||||||
|
| |||||||||||||||||||||||
Net increase in net assets resulting from operations | 75,084 | 86,976 | 711,972 | |||||||||||||||||||||
|
| |||||||||||||||||||||||
Distributions to shareholders from net investment income and net realized gains | ||||||||||||||||||||||||
Class A | (4,235 | ) | (35,463 | ) | (7,154 | ) | ||||||||||||||||||
Class C | (1,208 | ) | (22,192 | ) | (4,817 | ) | ||||||||||||||||||
Class R4 | (2,066 | ) | (23,284 | ) | (6,052 | ) | ||||||||||||||||||
Class R6 | (110,175 | ) | (1,082,903 | ) | (286,844 | ) | ||||||||||||||||||
|
| |||||||||||||||||||||||
Total distributions to shareholders | (117,684 | ) | (1,163,842 | ) | (304,867 | ) | ||||||||||||||||||
|
| |||||||||||||||||||||||
Capital share transactions | Shares | Shares | Shares | |||||||||||||||||||||
Proceeds from shares sold | ||||||||||||||||||||||||
Class A | 8,776 | 87,647 | 2,394 | 26,457 | 2,190 | 25,733 | ||||||||||||||||||
Class C | 114 | 1,104 | 0 | 0 | 0 | 0 | ||||||||||||||||||
Class R6 | 39,081 | 388,425 | 0 | 0 | 0 | 0 | ||||||||||||||||||
|
| |||||||||||||||||||||||
| 477,176 | 26,457 | 25,733 | ||||||||||||||||||||||
|
| |||||||||||||||||||||||
Reinvestment of distributions | ||||||||||||||||||||||||
Class A | 225 | 2,380 | 1,365 | 12,548 | 121 | 1,413 | ||||||||||||||||||
Class C | 1 | 13 | 0 | 0 | 0 | 0 | ||||||||||||||||||
Class R6 | 732 | 7,780 | 0 | 0 | 0 | 0 | ||||||||||||||||||
|
| |||||||||||||||||||||||
| 10,173 | 12,548 | 1,413 | ||||||||||||||||||||||
|
| |||||||||||||||||||||||
Payment for shares redeemed | ||||||||||||||||||||||||
Class A | (802 | ) | (8,231 | ) | (1,685 | ) | (15,080 | ) | (1 | ) | (10 | ) | ||||||||||||
Class C | (1 | ) | (10 | ) | 0 | 0 | 0 | 0 | ||||||||||||||||
Class R | N/A | N/A | N/A | N/A | (10,358 | )3 | (121,701 | )3 | ||||||||||||||||
Class R6 | (644 | ) | (6,738 | ) | 0 | 0 | 0 | 0 | ||||||||||||||||
|
| |||||||||||||||||||||||
| (14,979 | ) | (15,080 | ) | (121,711 | ) | |||||||||||||||||||
|
| |||||||||||||||||||||||
Net increase (decrease) in net assets resulting from capital share transactions | 472,370 | 23,925 | (94,565 | ) | ||||||||||||||||||||
|
| |||||||||||||||||||||||
Total increase (decrease) in net assets | 429,770 | (1,052,941 | ) | 312,540 | ||||||||||||||||||||
|
| |||||||||||||||||||||||
Net assets | ||||||||||||||||||||||||
Beginning of period | 5,040,328 | 6,093,269 | 5,780,729 | |||||||||||||||||||||
|
| |||||||||||||||||||||||
End of period | $ | 5,470,098 | $ | 5,040,328 | $ | 6,093,269 | ||||||||||||||||||
|
| |||||||||||||||||||||||
| 1 | For the nine months ended February 28, 2019. The Fund changed its fiscal year end from May 31 to February 28, effective February 28, 2019. |
| 2 | Effective for all filings after November 4, 2018, the SEC prospectively eliminated the requirement to parenthetically disclose undistributed net investment income at the end of the period and permitted the aggregation of distributions, with the exception of tax basis returns of capital. Undistributed net investment income at May 31, 2018 was $573. The disaggregated distributions information for the year ended May 31, 2018 is included in Note 9,Distributions to Shareholders, in the notes to the financial statements. |
| 3 | For the period from June 1, 2017 to November 13, 2017. Effective at the close of business on November 13, 2017, Class R shares were liquidated and the class was subsequently closed. Class R shares are no longer offered by the Fund. |
The accompanying notes are an integral part of these financial statements.
84 | Target Date Retirement Funds
Table of Contents
Statements of changes in net assets
| Dynamic Target 2060 Fund | ||||||||||||||||||||||||
| Year ended February 29, 2020 | Year ended February 28, 20191 | Year ended May 31, 20182 | ||||||||||||||||||||||
Operations | ||||||||||||||||||||||||
Net investment income | $ | 117,194 | $ | 59,658 | $ | 79,482 | ||||||||||||||||||
Net realized gains on investments | 96,819 | 368,119 | 296,222 | |||||||||||||||||||||
Net change in unrealized gains (losses) on investments | (131,404 | ) | (335,354 | ) | 344,108 | |||||||||||||||||||
|
| |||||||||||||||||||||||
Net increase in net assets resulting from operations | 82,609 | 92,423 | 719,812 | |||||||||||||||||||||
|
| |||||||||||||||||||||||
Distributions to shareholders from net investment income and net realized gains | ||||||||||||||||||||||||
Class A | (8,688 | ) | (56,802 | ) | (12,696 | ) | ||||||||||||||||||
Class C | (1,309 | ) | (21,948 | ) | (4,746 | ) | ||||||||||||||||||
Class R4 | (2,188 | ) | (23,022 | ) | (5,982 | ) | ||||||||||||||||||
Class R6 | (108,103 | ) | (1,069,143 | ) | (283,632 | ) | ||||||||||||||||||
|
| |||||||||||||||||||||||
Total distributions to shareholders | (120,288 | ) | (1,170,915 | ) | (307,056 | ) | ||||||||||||||||||
|
| |||||||||||||||||||||||
Capital share transactions | Shares | Shares | Shares | |||||||||||||||||||||
Proceeds from shares sold | ||||||||||||||||||||||||
Class A | 16,240 | 169,838 | 7,237 | 85,061 | 15,177 | 179,059 | ||||||||||||||||||
Class C | 0 | 0 | 0 | 0 | 5 | 51 | ||||||||||||||||||
Class R6 | 876 | 9,231 | 0 | 0 | 0 | 0 | ||||||||||||||||||
|
| |||||||||||||||||||||||
| 179,069 | 85,061 | 179,110 | ||||||||||||||||||||||
|
| |||||||||||||||||||||||
Reinvestment of distributions | ||||||||||||||||||||||||
Class A | 628 | 6,654 | 3,703 | 34,050 | 585 | 6,830 | ||||||||||||||||||
Class C | 0 | 0 | 1 | 8 | 0 | 0 | ||||||||||||||||||
Class R6 | 10 | 102 | 0 | 0 | 0 | 0 | ||||||||||||||||||
|
| |||||||||||||||||||||||
| 6,756 | 34,058 | 6,830 | ||||||||||||||||||||||
|
| |||||||||||||||||||||||
Payment for shares redeemed | ||||||||||||||||||||||||
Class A | (10,916 | ) | (115,961 | ) | (3,315 | ) | (40,040 | ) | (5,149 | ) | (60,843 | ) | ||||||||||||
Class C | (1 | ) | (10 | ) | (1 | ) | (10 | ) | 0 | 0 | ||||||||||||||
Class R | N/A | N/A | N/A | N/A | (10,369 | )3 | (121,936 | )3 | ||||||||||||||||
|
| |||||||||||||||||||||||
| (115,971 | ) | (40,050 | ) | (182,779 | ) | |||||||||||||||||||
|
| |||||||||||||||||||||||
Net increase in net assets resulting from capital share transactions | 69,854 | 79,069 | 3,161 | |||||||||||||||||||||
|
| |||||||||||||||||||||||
Total increase (decrease) in net assets | 32,175 | (999,423 | ) | 415,917 | ||||||||||||||||||||
|
| |||||||||||||||||||||||
Net assets | ||||||||||||||||||||||||
Beginning of period | 5,197,693 | 6,197,116 | 5,781,199 | |||||||||||||||||||||
|
| |||||||||||||||||||||||
End of period | $ | 5,229,868 | $ | 5,197,693 | $ | 6,197,116 | ||||||||||||||||||
|
| |||||||||||||||||||||||
| 1 | For the nine months ended February 28, 2019. The Fund changed its fiscal year end from May 31 to February 28, effective February 28, 2019. |
| 2 | Effective for all filings after November 4, 2018, the SEC prospectively eliminated the requirement to parenthetically disclose undistributed net investment income at the end of the period and permitted the aggregation of distributions, with the exception of tax basis returns of capital. Undistributed net investment income at May 31, 2018 was $507. The disaggregated distributions information for the year ended May 31, 2018 is included in Note 9,Distributions to Shareholders, in the notes to the financial statements. |
| 3 | For the period from June 1, 2017 to November 13, 2017. Effective at the close of business on November 13, 2017, Class R shares were liquidated and the class was subsequently closed. Class R shares are no longer offered by the Fund. |
The accompanying notes are an integral part of these financial statements.
Target Date Retirement Funds | 85
Table of Contents
| Beginning net asset value per share | Net investment income | Net realized and unrealized gains (losses) on investments | Distributions from net investment income | Distributions from net realized gains | Ending net asset value per share | |||||||||||||||||||
Dynamic Target Today Fund | ||||||||||||||||||||||||
Class A | ||||||||||||||||||||||||
Year ended February 29, 2020 | $ | 10.11 | 0.21 | 3 | 0.50 | (0.22 | ) | 0.00 | $ | 10.60 | ||||||||||||||
Year ended February 28, 20195 | $ | 10.82 | 0.13 | 0.16 | (0.15 | ) | (0.85 | ) | $ | 10.11 | ||||||||||||||
Year ended May 31, 2018 | $ | 10.65 | 0.15 | 0.38 | (0.19 | ) | (0.17 | ) | $ | 10.82 | ||||||||||||||
Year ended May 31, 2017 | $ | 10.06 | 0.12 | 3 | 0.65 | (0.09 | ) | (0.09 | ) | $ | 10.65 | |||||||||||||
Year ended May 31, 20167 | $ | 10.00 | 0.06 | 0.03 | (0.03 | ) | 0.00 | $ | 10.06 | |||||||||||||||
Class C | ||||||||||||||||||||||||
Year ended February 29, 2020 | $ | 10.08 | 0.14 | 0.48 | (0.14 | ) | 0.00 | $ | 10.56 | |||||||||||||||
Year ended February 28, 20195 | $ | 10.76 | 0.08 | 0.15 | (0.06 | ) | (0.85 | ) | $ | 10.08 | ||||||||||||||
Year ended May 31, 2018 | $ | 10.58 | 0.07 | 0.38 | (0.10 | ) | (0.17 | ) | $ | 10.76 | ||||||||||||||
Year ended May 31, 2017 | $ | 10.03 | 0.05 | 0.64 | (0.05 | ) | (0.09 | ) | $ | 10.58 | ||||||||||||||
Year ended May 31, 20167 | $ | 10.00 | 0.03 | 0.03 | (0.03 | ) | 0.00 | $ | 10.03 | |||||||||||||||
Class R4 | ||||||||||||||||||||||||
Year ended February 29, 2020 | $ | 10.10 | 0.25 | 0.49 | (0.22 | ) | 0.00 | $ | 10.62 | |||||||||||||||
Year ended February 28, 20195 | $ | 10.81 | 0.16 | 0.16 | (0.18 | ) | (0.85 | ) | $ | 10.10 | ||||||||||||||
Year ended May 31, 2018 | $ | 10.63 | 0.18 | 0.38 | (0.21 | ) | (0.17 | ) | $ | 10.81 | ||||||||||||||
Year ended May 31, 2017 | $ | 10.07 | 0.16 | 0.64 | (0.15 | ) | (0.09 | ) | $ | 10.63 | ||||||||||||||
Year ended May 31, 20167 | $ | 10.00 | 0.08 | 0.03 | (0.04 | ) | 0.00 | $ | 10.07 | |||||||||||||||
Class R6 | ||||||||||||||||||||||||
Year ended February 29, 2020 | $ | 10.10 | 0.27 | 3 | 0.49 | (0.24 | ) | 0.00 | $ | 10.62 | ||||||||||||||
Year ended February 28, 20195 | $ | 10.82 | 0.17 | 0.15 | (0.19 | ) | (0.85 | ) | $ | 10.10 | ||||||||||||||
Year ended May 31, 2018 | $ | 10.64 | 0.20 | 0.38 | (0.23 | ) | (0.17 | ) | $ | 10.82 | ||||||||||||||
Year ended May 31, 2017 | $ | 10.08 | 0.17 | 0.65 | (0.17 | ) | (0.09 | ) | $ | 10.64 | ||||||||||||||
Year ended May 31, 20167 | $ | 10.00 | 0.09 | 0.03 | (0.04 | ) | 0.00 | $ | 10.08 | |||||||||||||||
| 1 | Total return calculations do not include any sales charges. Returns for periods of less than one year are not annualized. |
| 2 | Portfolio turnover rate is calculated by multiplying the Fund’s ownership percentage in each respective affiliated Master Portfolio by the corresponding affiliated Master Portfolio’s purchases and sales. These purchase and sale amounts are aggregated with the direct purchases and sales in Underlying Funds and unaffiliated securities and included in the portfolio turnover calculation. |
| 3 | Calculated based upon average shares outstanding |
| 4 | Ratios reflect net expenses allocated from the affiliated Master Portfolios which were as follows: |
| Year ended February 29, 2020 | Year ended February 28, 20195 | |||||||
Class A | 0.12 | % | 0.12 | % | ||||
Class C | 0.11 | 0.11 | ||||||
Class R4 | 0.11 | 0.11 | ||||||
Class R6 | 0.12 | 0.12 | ||||||
| 5 | For the nine months ended February 28, 2019. The Fund changed its fiscal year end from May 31 to February 28, effective February 28, 2019. |
| 6 | Ratios do not reflect net expenses allocated from the affiliated Master Portfolios. Including annualized net expenses allocated from the affiliated Master Portfolios, the expense ratios would be increased by the following amounts: |
| Year ended May 31 | ||||||||||||
| 2018 | 2017 | 20167 | ||||||||||
Class A | 0.10 | % | 0.10 | % | 0.11 | % | ||||||
Class C | 0.10 | 0.10 | 0.10 | |||||||||
Class R4 | 0.10 | 0.10 | 0.11 | |||||||||
Class R6 | 0.10 | 0.11 | 0.11 | |||||||||
| 7 | For the period from November 30, 2015 (commencement of class operations) to May 31, 2016 |
The accompanying notes are an integral part of these financial statements.
86 | Target Date Retirement Funds
Table of Contents
Financial highlights
| Ratio to average net assets (annualized) | Portfolio |
Net assets at | ||||||||||||||||||||
| Net investment income | Gross expenses | Net expenses | Total return1 | |||||||||||||||||||
| 1.95 | %4 | 3.37 | %4 | 0.66 | %4 | 6.95 | % | 39 | % | $ | 1,022 | |||||||||||
| 1.75 | %4 | 4.39 | %4 | 0.59 | %4 | 3.16 | % | 48 | % | $ | 400 | |||||||||||
| 1.37 | % | 4.39 | %6 | 0.48 | %6 | 4.96 | % | 94 | % | $ | 384 | |||||||||||
| 1.16 | % | 4.67 | %6 | 0.53 | %6 | 7.97 | % | 97 | % | $ | 238 | |||||||||||
| 1.31 | % | 5.22 | %6 | 0.53 | %6 | 0.95 | % | 66 | % | $ | 101 | |||||||||||
| 1.33 | %4 | 4.02 | %4 | 1.41 | %4 | 6.11 | % | 39 | % | $ | 107 | |||||||||||
| 0.99 | %4 | 5.14 | %4 | 1.34 | %4 | 2.60 | % | 48 | % | $ | 102 | |||||||||||
| 0.65 | % | 5.14 | %6 | 1.24 | %6 | 4.25 | % | 94 | % | $ | 109 | |||||||||||
| 0.45 | % | 5.45 | %6 | 1.28 | %6 | 7.12 | % | 97 | % | $ | 108 | |||||||||||
| 0.56 | % | 5.97 | %6 | 1.28 | %6 | 0.58 | % | 66 | % | $ | 101 | |||||||||||
| 2.38 | %4 | 3.17 | %4 | 0.36 | %4 | 7.33 | % | 39 | % | $ | 109 | |||||||||||
| 2.02 | %4 | 4.11 | %4 | 0.31 | %4 | 3.42 | % | 48 | % | $ | 104 | |||||||||||
| 1.67 | % | 4.11 | %6 | 0.22 | %6 | 5.27 | % | 94 | % | $ | 111 | |||||||||||
| 1.51 | % | 4.42 | %6 | 0.22 | %6 | 8.21 | % | 97 | % | $ | 109 | |||||||||||
| 1.62 | % | 4.94 | %6 | 0.22 | %6 | 1.08 | % | 66 | % | $ | 101 | |||||||||||
| 2.51 | %4 | 3.02 | %4 | 0.21 | %4 | 7.48 | % | 39 | % | $ | 5,545 | |||||||||||
| 2.17 | %4 | 3.97 | %4 | 0.16 | %4 | 3.49 | % | 48 | % | $ | 4,785 | |||||||||||
| 1.82 | % | 3.96 | %6 | 0.07 | %6 | 5.42 | % | 94 | % | $ | 5,123 | |||||||||||
| 1.67 | % | 4.27 | %6 | 0.06 | %6 | 8.48 | % | 97 | % | $ | 5,037 | |||||||||||
| 1.77 | % | 4.79 | %6 | 0.07 | %6 | 1.19 | % | 66 | % | $ | 4,654 | |||||||||||
The accompanying notes are an integral part of these financial statements.
Target Date Retirement Funds | 87
Table of Contents
Financial highlights
| Beginning net asset value per share | Net investment income | Net realized and unrealized gains (losses) on investments | Distributions from net investment income | Distributions from net realized gains | Ending net asset value per share | |||||||||||||||||||
Dynamic Target 2015 Fund | ||||||||||||||||||||||||
Class A | ||||||||||||||||||||||||
Year ended February 29, 2020 | $ | 9.99 | 0.22 | 0.41 | (0.22 | ) | 0.00 | $ | 10.40 | |||||||||||||||
Year ended February 28, 20194 | $ | 11.06 | 0.12 | 0.15 | (0.13 | ) | (1.21 | ) | $ | 9.99 | ||||||||||||||
Year ended May 31, 2018 | $ | 10.76 | 0.15 | 5 | 0.56 | (0.19 | ) | (0.22 | ) | $ | 11.06 | |||||||||||||
Year ended May 31, 2017 | $ | 9.99 | 0.11 | 0.86 | (0.09 | ) | (0.11 | ) | $ | 10.76 | ||||||||||||||
Year ended May 31, 20167 | $ | 10.00 | 0.07 | (0.04 | ) | (0.04 | ) | 0.00 | $ | 9.99 | ||||||||||||||
Class C | ||||||||||||||||||||||||
Year ended February 29, 2020 | $ | 9.96 | 0.13 | �� | 0.42 | (0.16 | ) | 0.00 | $ | 10.35 | ||||||||||||||
Year ended February 28, 20194 | $ | 11.01 | 0.06 | 0.15 | (0.05 | ) | (1.21 | ) | $ | 9.96 | ||||||||||||||
Year ended May 31, 2018 | $ | 10.71 | 0.06 | 0.56 | (0.10 | ) | (0.22 | ) | $ | 11.01 | ||||||||||||||
Year ended May 31, 2017 | $ | 9.97 | 0.04 | 0.85 | (0.04 | ) | (0.11 | ) | $ | 10.71 | ||||||||||||||
Year ended May 31, 20167 | $ | 10.00 | 0.03 | (0.02 | ) | (0.04 | ) | 0.00 | $ | 9.97 | ||||||||||||||
Class R4 | ||||||||||||||||||||||||
Year ended February 29, 2020 | $ | 9.99 | 0.24 | 0.42 | (0.25 | ) | 0.00 | $ | 10.40 | |||||||||||||||
Year ended February 28, 20194 | $ | 11.07 | 0.15 | 0.14 | (0.16 | ) | (1.21 | ) | $ | 9.99 | ||||||||||||||
Year ended May 31, 2018 | $ | 10.75 | 0.17 | 0.58 | (0.21 | ) | (0.22 | ) | $ | 11.07 | ||||||||||||||
Year ended May 31, 2017 | $ | 10.01 | 0.15 | 0.84 | (0.14 | ) | (0.11 | ) | $ | 10.75 | ||||||||||||||
Year ended May 31, 20167 | $ | 10.00 | 0.08 | (0.02 | ) | (0.05 | ) | 0.00 | $ | 10.01 | ||||||||||||||
Class R6 | ||||||||||||||||||||||||
Year ended February 29, 2020 | $ | 9.99 | 0.26 | 0.42 | (0.26 | ) | 0.00 | $ | 10.41 | |||||||||||||||
Year ended February 28, 20194 | $ | 11.07 | 0.16 | 0.15 | (0.18 | ) | (1.21 | ) | $ | 9.99 | ||||||||||||||
Year ended May 31, 2018 | $ | 10.76 | 0.19 | 0.57 | (0.23 | ) | (0.22 | ) | $ | 11.07 | ||||||||||||||
Year ended May 31, 2017 | $ | 10.01 | 0.16 | 0.86 | (0.16 | ) | (0.11 | ) | $ | 10.76 | ||||||||||||||
Year ended May 31, 20167 | $ | 10.00 | 0.09 | (0.03 | ) | (0.05 | ) | 0.00 | $ | 10.01 | ||||||||||||||
| 1 | Total return calculations do not include any sales charges. Returns for periods of less than one year are not annualized. |
| 2 | Portfolio turnover rate is calculated by multiplying the Fund’s ownership percentage in each respective affiliated Master Portfolio by the corresponding affiliated Master Portfolio’s purchases and sales. These purchase and sale amounts are aggregated with the direct purchases and sales in Underlying Funds and unaffiliated securities and included in the portfolio turnover calculation. |
| 3 | Ratios reflect net expenses allocated from the affiliated Master Portfolios which were as follows: |
| Year ended February 29, 2020 | Year ended February 28, 20194 | |||||||
Class A | 0.13 | % | 0.12 | % | ||||
Class C | 0.12 | 0.11 | ||||||
Class R4 | 0.12 | 0.11 | ||||||
Class R6 | 0.13 | 0.12 | ||||||
| 4 | For the nine months ended February 28, 2019. The Fund changed its fiscal year end from May 31 to February 28, effective February 28, 2019. |
| 5 | Calculated based upon average shares outstanding |
| 6 | Ratios do not reflect net expenses allocated from the affiliated Master Portfolios. Including annualized net expenses allocated from the affiliated Master Portfolios, the expense ratios would be increased by the following amounts: |
| Year ended May 31 | ||||||||||||
| �� | 2018 | 2017 | 20167 | |||||||||
Class A | 0.10 | % | 0.11 | % | 0.10 | % | ||||||
Class C | 0.09 | 0.10 | 0.10 | |||||||||
Class R4 | 0.09 | 0.10 | 0.10 | |||||||||
Class R6 | 0.10 | 0.11 | 0.11 | |||||||||
| 7 | For the period from November 30, 2015 (commencement of class operations) to May 31, 2016 |
The accompanying notes are an integral part of these financial statements.
88 | Target Date Retirement Funds
Table of Contents
Financial highlights
| Ratio to average net assets (annualized) | Portfolio |
Net assets at | ||||||||||||||||||||
| Net investment income | Gross expenses | Net expenses | Total return1 | |||||||||||||||||||
| 2.00 | %3 | 3.63 | %3 | 0.65 | %3 | 6.22 | % | 38 | % | $ | 460 | |||||||||||
| 1.50 | %3 | 4.23 | %3 | 0.61 | %3 | 3.09 | % | 45 | % | $ | 390 | |||||||||||
| 1.33 | % | 4.14 | %6 | 0.51 | %6 | 6.62 | % | 82 | % | $ | 456 | |||||||||||
| 1.14 | % | 4.42 | %6 | 0.51 | %6 | 9.95 | % | 81 | % | $ | 363 | |||||||||||
| 1.16 | % | 5.21 | %6 | 0.45 | %6 | 0.34 | % | 38 | % | $ | 199 | |||||||||||
| 1.26 | %3 | 4.19 | %3 | 1.42 | %3 | 5.49 | % | 38 | % | $ | 105 | |||||||||||
| 0.76 | %3 | 4.97 | %3 | 1.36 | %3 | 2.46 | % | 45 | % | $ | 101 | |||||||||||
| 0.52 | % | 4.89 | %6 | 1.27 | %6 | 5.80 | % | 82 | % | $ | 112 | |||||||||||
| 0.40 | % | 5.18 | %6 | 1.27 | %6 | 9.18 | % | 81 | % | $ | 109 | |||||||||||
| 0.56 | % | 5.96 | %6 | 1.28 | %6 | 0.07 | % | 38 | % | $ | 100 | |||||||||||
| 2.31 | %3 | 3.34 | %3 | 0.36 | %3 | 6.51 | % | 38 | % | $ | 107 | |||||||||||
| 1.77 | %3 | 3.94 | %3 | 0.31 | %3 | 3.30 | % | 45 | % | $ | 103 | |||||||||||
| 1.56 | % | 3.86 | %6 | 0.23 | %6 | 7.01 | % | 82 | % | $ | 114 | |||||||||||
| 1.45 | % | 4.15 | %6 | 0.22 | %6 | 10.28 | % | 81 | % | $ | 111 | |||||||||||
| 1.61 | % | 4.93 | %6 | 0.22 | %6 | 0.57 | % | 38 | % | $ | 101 | |||||||||||
| 2.46 | %3 | 3.20 | %3 | 0.21 | %3 | 6.77 | % | 38 | % | $ | 4,937 | |||||||||||
| 1.91 | %3 | 3.80 | %3 | 0.16 | %3 | 3.47 | % | 45 | % | $ | 4,740 | |||||||||||
| 1.72 | % | 3.71 | %6 | 0.07 | %6 | 7.06 | % | 82 | % | $ | 5,253 | |||||||||||
| 1.60 | % | 4.00 | %6 | 0.06 | %6 | 10.44 | % | 81 | % | $ | 5,105 | |||||||||||
| 1.77 | % | 4.78 | %6 | 0.06 | %6 | 0.58 | % | 38 | % | $ | 4,629 | |||||||||||
The accompanying notes are an integral part of these financial statements.
Target Date Retirement Funds | 89
Table of Contents
Financial highlights
| Beginning net asset value per share | Net investment income | Net realized and unrealized gains (losses) on investments | Distributions from net investment income | Distributions from net realized gains | Ending net asset value per share | |||||||||||||||||||
Dynamic Target 2020 Fund | ||||||||||||||||||||||||
Class A | ||||||||||||||||||||||||
Year ended February 29, 2020 | $ | 9.95 | 0.19 | 3 | 0.35 | (0.21 | ) | 0.00 | $ | 10.28 | ||||||||||||||
Year ended February 28, 20195 | $ | 11.18 | 0.11 | 0.18 | (0.12 | ) | (1.40 | ) | $ | 9.95 | ||||||||||||||
Year ended May 31, 2018 | $ | 10.78 | 0.14 | 0.70 | (0.19 | ) | (0.25 | ) | $ | 11.18 | ||||||||||||||
Year ended May 31, 2017 | $ | 9.99 | 0.11 | 3 | 0.97 | (0.12 | ) | (0.17 | ) | $ | 10.78 | |||||||||||||
Year ended May 31, 20167 | $ | 10.00 | 0.06 | (0.03 | ) | (0.04 | ) | 0.00 | $ | 9.99 | ||||||||||||||
Class C | ||||||||||||||||||||||||
Year ended February 29, 2020 | $ | 9.95 | 0.13 | 0.33 | (0.13 | ) | 0.00 | $ | 10.28 | |||||||||||||||
Year ended February 28, 20195 | $ | 11.15 | 0.06 | 0.17 | (0.03 | ) | (1.40 | ) | $ | 9.95 | ||||||||||||||
Year ended May 31, 2018 | $ | 10.76 | 0.05 | 0.69 | (0.10 | ) | (0.25 | ) | $ | 11.15 | ||||||||||||||
Year ended May 31, 2017 | $ | 9.96 | 0.03 | 0.98 | (0.04 | ) | (0.17 | ) | $ | 10.76 | ||||||||||||||
Year ended May 31, 20167 | $ | 10.00 | 0.03 | (0.03 | ) | (0.04 | ) | 0.00 | $ | 9.96 | ||||||||||||||
Class R4 | ||||||||||||||||||||||||
Year ended February 29, 2020 | $ | 9.99 | 0.24 | 0.33 | (0.22 | ) | 0.00 | $ | 10.34 | |||||||||||||||
Year ended February 28, 20195 | $ | 11.22 | 0.14 | 0.17 | (0.14 | ) | (1.40 | ) | $ | 9.99 | ||||||||||||||
Year ended May 31, 2018 | $ | 10.82 | 0.17 | 0.69 | (0.21 | ) | (0.25 | ) | $ | 11.22 | ||||||||||||||
Year ended May 31, 2017 | $ | 10.01 | 0.14 | 0.97 | (0.13 | ) | (0.17 | ) | $ | 10.82 | ||||||||||||||
Year ended May 31, 20167 | $ | 10.00 | 0.08 | (0.02 | ) | (0.05 | ) | 0.00 | $ | 10.01 | ||||||||||||||
Class R6 | ||||||||||||||||||||||||
Year ended February 29, 2020 | $ | 9.99 | 0.25 | 0.34 | (0.24 | ) | 0.00 | $ | 10.34 | |||||||||||||||
Year ended February 28, 20195 | $ | 11.23 | 0.15 | 0.17 | (0.16 | ) | (1.40 | ) | $ | 9.99 | ||||||||||||||
Year ended May 31, 2018 | $ | 10.82 | 0.18 | 0.71 | (0.23 | ) | (0.25 | ) | $ | 11.23 | ||||||||||||||
Year ended May 31, 2017 | $ | 10.01 | 0.16 | 0.97 | (0.15 | ) | (0.17 | ) | $ | 10.82 | ||||||||||||||
Year ended May 31, 20167 | $ | 10.00 | 0.08 | (0.02 | ) | (0.05 | ) | 0.00 | $ | 10.01 | ||||||||||||||
| 1 | Total return calculations do not include any sales charges. Returns for periods of less than one year are not annualized. |
| 2 | Portfolio turnover rate is calculated by multiplying the Fund’s ownership percentage in the respective affiliated Master Portfolio by the corresponding affiliated Master Portfolio’s purchases and sales. These purchase and sale amounts are aggregated with the direct purchases and sales in Underlying Funds and unaffiliated securities and included in the portfolio turnover calculation. |
| 3 | Calculated based upon average shares outstanding |
| 4 | Ratios reflect net expenses allocated from the affiliated Master Portfolios which were as follows: |
| Year ended February 29, 2020 | Year ended February 28, 20194 | |||||||
Class A | 0.14 | % | 0.12 | % | ||||
Class C | 0.12 | 0.11 | ||||||
Class R4 | 0.12 | 0.11 | ||||||
Class R6 | 0.14 | 0.13 | ||||||
| 5 | For the nine months ended February 28, 2019. The Fund changed its fiscal year end from May 31 to February 28, effective February 28, 2019. |
| 6 | Ratios do not reflect net expenses allocated from the affiliated Master Portfolios. Including annualized net expenses allocated from the affiliated Master Portfolios, the expense ratios would be increased by the following amounts: |
| Year ended May 31 | ||||||||||||
| 2018 | 2017 | 20167 | ||||||||||
Class A | 0.10 | % | 0.10 | % | 0.10 | % | ||||||
Class C | 0.09 | 0.10 | 0.10 | |||||||||
Class R4 | 0.09 | 0.10 | 0.10 | |||||||||
Class R6 | 0.10 | 0.11 | 0.11 | |||||||||
| 7 | For the period from November 30, 2015 (commencement of class operations) to May 31, 2016 |
The accompanying notes are an integral part of these financial statements.
90 | Target Date Retirement Funds
Table of Contents
Financial highlights
| Ratio to average net assets (annualized) | Portfolio |
Net assets at | ||||||||||||||||||||
| Net investment income | Gross expenses | Net expenses | Total return1 | |||||||||||||||||||
| 1.81 | %4 | 3.27 | %4 | 0.67 | %4 | 5.31 | % | 38 | % | $ | 1,435 | |||||||||||
| 1.38 | %4 | 4.04 | %4 | 0.61 | %4 | 3.33 | % | 42 | % | $ | 623 | |||||||||||
| 1.15 | % | 3.96 | %6 | 0.52 | %6 | 7.80 | % | 72 | % | $ | 540 | |||||||||||
| 1.09 | % | 4.32 | %6 | 0.51 | %6 | 11.18 | % | 69 | % | $ | 380 | |||||||||||
| 1.33 | % | 5.21 | %6 | 0.54 | %6 | 0.35 | % | 38 | % | $ | 119 | |||||||||||
| 1.21 | %4 | 3.88 | %4 | 1.42 | %4 | 4.61 | % | 38 | % | $ | 105 | |||||||||||
| 0.66 | %4 | 4.79 | %4 | 1.37 | %4 | 2.72 | % | 42 | % | $ | 102 | |||||||||||
| 0.43 | % | 4.71 | %6 | 1.28 | %6 | 6.89 | % | 72 | % | $ | 114 | |||||||||||
| 0.33 | % | 5.09 | %6 | 1.28 | %6 | 10.39 | % | 69 | % | $ | 110 | |||||||||||
| 0.53 | % | 5.97 | %6 | 1.29 | %6 | 0.01 | % | 38 | % | $ | 100 | |||||||||||
| 2.26 | %4 | 3.03 | %4 | 0.36 | %4 | 5.62 | % | 38 | % | $ | 107 | |||||||||||
| 1.71 | %4 | 3.77 | %4 | 0.32 | %4 | 3.59 | % | 42 | % | $ | 103 | |||||||||||
| 1.47 | % | 3.68 | %6 | 0.24 | %6 | 8.03 | % | 72 | % | $ | 116 | |||||||||||
| 1.39 | % | 4.06 | %6 | 0.23 | %6 | 11.60 | % | 69 | % | $ | 112 | |||||||||||
| 1.59 | % | 4.94 | %6 | 0.23 | %6 | 0.61 | % | 38 | % | $ | 101 | |||||||||||
| 2.40 | %4 | 2.90 | %4 | 0.21 | %4 | 5.77 | % | 38 | % | $ | 5,118 | |||||||||||
| 1.86 | %4 | 3.63 | %4 | 0.17 | %4 | 3.65 | % | 42 | % | $ | 4,767 | |||||||||||
| 1.63 | % | 3.53 | %6 | 0.08 | %6 | 8.28 | % | 72 | % | $ | 5,359 | |||||||||||
| 1.54 | % | 3.91 | %6 | 0.07 | %6 | 11.64 | % | 69 | % | $ | 5,165 | |||||||||||
| 1.74 | % | 4.79 | %6 | 0.07 | %6 | 0.62 | % | 38 | % | $ | 4,631 | |||||||||||
The accompanying notes are an integral part of these financial statements.
Target Date Retirement Funds | 91
Table of Contents
Financial highlights
| Beginning net asset value per share | Net investment income | Net realized and unrealized gains (losses) on investments | Distributions from net investment income | Distributions from net realized gains | Ending net asset value per share | |||||||||||||||||||
Dynamic Target 2025 Fund | ||||||||||||||||||||||||
Class A | ||||||||||||||||||||||||
Year ended February 29, 2020 | $ | 10.10 | 0.19 | 0.25 | (0.18 | ) | 0.00 | $ | 10.36 | |||||||||||||||
Year ended February 28, 20194 | $ | 11.38 | 0.10 | 0.12 | (0.10 | ) | (1.40 | ) | $ | 10.10 | ||||||||||||||
Year ended May 31, 2018 | $ | 10.87 | 0.11 | 5 | 0.87 | (0.19 | ) | (0.28 | ) | $ | 11.38 | |||||||||||||
Year ended May 31, 2017 | $ | 9.94 | 0.09 | 1.13 | (0.12 | ) | (0.17 | ) | $ | 10.87 | ||||||||||||||
Year ended May 31, 20167 | $ | 10.00 | 0.07 | (0.08 | ) | (0.05 | ) | 0.00 | $ | 9.94 | ||||||||||||||
Class C | ||||||||||||||||||||||||
Year ended February 29, 2020 | $ | 10.10 | 0.12 | 0.24 | (0.11 | ) | 0.00 | $ | 10.35 | |||||||||||||||
Year ended February 28, 20194 | $ | 11.35 | 0.05 | 0.12 | (0.02 | ) | (1.40 | ) | $ | 10.10 | ||||||||||||||
Year ended May 31, 2018 | $ | 10.84 | 0.04 | 0.85 | (0.10 | ) | (0.28 | ) | $ | 11.35 | ||||||||||||||
Year ended May 31, 2017 | $ | 9.91 | 0.03 | 1.10 | (0.03 | ) | (0.17 | ) | $ | 10.84 | ||||||||||||||
Year ended May 31, 20167 | $ | 10.00 | 0.02 | (0.06 | ) | (0.05 | ) | 0.00 | $ | 9.91 | ||||||||||||||
Class R4 | ||||||||||||||||||||||||
Year ended February 29, 2020 | $ | 10.14 | 0.24 | 0.25 | (0.21 | ) | 0.00 | $ | 10.42 | |||||||||||||||
Year ended February 28, 20194 | $ | 11.42 | 0.14 | 0.11 | (0.13 | ) | (1.40 | ) | $ | 10.14 | ||||||||||||||
Year ended May 31, 2018 | $ | 10.90 | 0.16 | 0.85 | (0.21 | ) | (0.28 | ) | $ | 11.42 | ||||||||||||||
Year ended May 31, 2017 | $ | 9.96 | 0.14 | 1.10 | (0.13 | ) | (0.17 | ) | $ | 10.90 | ||||||||||||||
Year ended May 31, 20167 | $ | 10.00 | 0.08 | (0.07 | ) | (0.05 | ) | 0.00 | $ | 9.96 | ||||||||||||||
Class R6 | ||||||||||||||||||||||||
Year ended February 29, 2020 | $ | 10.15 | 0.25 | 5 | 0.25 | (0.22 | ) | 0.00 | $ | 10.43 | ||||||||||||||
Year ended February 28, 20194 | $ | 11.43 | 0.15 | 0.11 | (0.14 | ) | (1.40 | ) | $ | 10.15 | ||||||||||||||
Year ended May 31, 2018 | $ | 10.91 | 0.18 | 0.85 | (0.23 | ) | (0.28 | ) | $ | 11.43 | ||||||||||||||
Year ended May 31, 2017 | $ | 9.96 | 0.15 | 1.11 | (0.14 | ) | (0.17 | ) | $ | 10.91 | ||||||||||||||
Year ended May 31, 20167 | $ | 10.00 | 0.08 | (0.06 | ) | (0.06 | ) | 0.00 | $ | 9.96 | ||||||||||||||
| 1 | Total return calculations do not include any sales charges. Returns for periods of less than one year are not annualized. |
| 2 | Portfolio turnover rate is calculated by multiplying the Fund’s ownership percentage in the respective affiliated Master Portfolio by the corresponding affiliated Master Portfolio’s purchases and sales. These purchase and sale amounts are aggregated with the direct purchases and sales in Underlying Funds and unaffiliated securities and included in the portfolio turnover calculation. |
| 3 | Ratios reflect net expenses allocated from the affiliated Master Portfolios which were as follows: |
| Year ended February 29, 2020 | Year ended February 28, 20194 | |||||||
Class A | 0.14 | % | 0.13 | % | ||||
Class C | 0.13 | 0.12 | ||||||
Class R4 | 0.12 | 0.12 | ||||||
Class R6 | 0.15 | 0.13 | ||||||
| 4 | For the nine months ended February 28, 2019. The Fund changed its fiscal year end from May 31 to February 28, effective February 28, 2019. |
| 5 | Calculated based upon average shares outstanding |
| 6 | Ratios do not reflect net expenses allocated from the affiliated Master Portfolios. Including annualized net expenses allocated from the affiliated Master Portfolios, the expense ratios would be increased by the following amounts: |
| Year ended May 31 | ||||||||||||
| 2018 | 2017 | 20167 | ||||||||||
Class A | 0.10 | % | 0.10 | % | 0.10 | % | ||||||
Class C | 0.09 | 0.10 | 0.10 | |||||||||
Class R4 | 0.09 | 0.10 | 0.11 | |||||||||
Class R6 | 0.10 | 0.11 | 0.11 | |||||||||
| 7 | For the period from November 30, 2015 (commencement of class operations) to May 31, 2016 |
The accompanying notes are an integral part of these financial statements.
92 | Target Date Retirement Funds
Table of Contents
Financial highlights
| Ratio to average net assets (annualized) | Portfolio |
Net assets at | ||||||||||||||||||||
| Net investment income | Gross expenses | Net expenses | Total return1 | |||||||||||||||||||
| 1.88 | %3 | 2.72 | %3 | 0.66 | %3 | 4.29 | % | 37 | % | $ | 2,856 | |||||||||||
| 1.31 | %3 | 3.81 | %3 | 0.60 | %3 | 2.76 | % | 41 | % | $ | 1,929 | |||||||||||
| 1.00 | % | 4.06 | %6 | 0.52 | %6 | 9.07 | % | 62 | % | $ | 1,497 | |||||||||||
| 1.07 | % | 4.75 | %6 | 0.49 | %6 | 12.62 | % | 58 | % | $ | 510 | |||||||||||
| 1.09 | % | 5.25 | %6 | 0.46 | %6 | (0.07 | )% | 38 | % | $ | 188 | |||||||||||
| 1.17 | %3 | 3.34 | %3 | 1.42 | %3 | 3.55 | % | 37 | % | $ | 125 | |||||||||||
| 0.56 | %3 | 4.56 | %3 | 1.36 | %3 | 2.17 | % | 41 | % | $ | 130 | |||||||||||
| 0.36 | % | 4.88 | %6 | 1.28 | %6 | 8.24 | % | 62 | % | $ | 130 | |||||||||||
| 0.29 | % | 5.55 | %6 | 1.29 | %6 | 11.77 | % | 58 | % | $ | 124 | |||||||||||
| 0.52 | % | 6.00 | %6 | 1.30 | %6 | (0.44 | )% | 38 | % | $ | 100 | |||||||||||
| 2.22 | %3 | 2.45 | %3 | 0.36 | %3 | 4.68 | % | 37 | % | $ | 108 | |||||||||||
| 1.62 | %3 | 3.53 | %3 | 0.31 | %3 | 2.96 | % | 41 | % | $ | 105 | |||||||||||
| 1.41 | % | 3.85 | %6 | 0.24 | %6 | 9.33 | % | 62 | % | $ | 118 | |||||||||||
| 1.35 | % | 4.52 | %6 | 0.23 | %6 | 12.84 | % | 58 | % | $ | 113 | |||||||||||
| 1.58 | % | 4.97 | %6 | 0.23 | %6 | 0.16 | % | 38 | % | $ | 100 | |||||||||||
| 2.31 | %3 | 2.29 | %3 | 0.22 | %3 | 4.83 | % | 37 | % | $ | 6,635 | |||||||||||
| 1.77 | %3 | 3.39 | %3 | 0.16 | %3 | 3.13 | % | 41 | % | $ | 4,838 | |||||||||||
| 1.56 | % | 3.70 | %6 | 0.09 | %6 | 9.48 | % | 62 | % | $ | 5,451 | |||||||||||
| 1.50 | % | 4.37 | %6 | 0.08 | %6 | 13.10 | % | 58 | % | $ | 5,201 | |||||||||||
| 1.73 | % | 4.82 | %6 | 0.08 | %6 | 0.17 | % | 38 | % | $ | 4,609 | |||||||||||
The accompanying notes are an integral part of these financial statements.
Target Date Retirement Funds | 93
Table of Contents
Financial highlights
| Beginning net asset value per share | Net investment income | Net realized and unrealized gains (losses) on investments | Distributions from net investment income | Distributions from net realized gains | Ending net asset value per share | |||||||||||||||||||
Dynamic Target 2030 Fund | ||||||||||||||||||||||||
Class A | ||||||||||||||||||||||||
Year ended February 29, 2020 | $ | 9.94 | 0.18 | 0.17 | (0.18 | ) | 0.00 | $ | 10.11 | |||||||||||||||
Year ended February 28, 20194 | $ | 11.54 | 0.11 | 0.12 | (0.09 | ) | (1.74 | ) | $ | 9.94 | ||||||||||||||
Year ended May 31, 2018 | $ | 10.92 | 0.13 | 0.98 | (0.19 | ) | (0.30 | ) | $ | 11.54 | ||||||||||||||
Year ended May 31, 2017 | $ | 9.91 | 0.09 | 1.22 | (0.11 | ) | (0.19 | ) | $ | 10.92 | ||||||||||||||
Year ended May 31, 20167 | $ | 10.00 | 0.06 | (0.10 | ) | (0.05 | ) | 0.00 | $ | 9.91 | ||||||||||||||
Class C | ||||||||||||||||||||||||
Year ended February 29, 2020 | $ | 9.88 | 0.12 | 6 | 0.15 | (0.05 | ) | 0.00 | $ | 10.10 | ||||||||||||||
Year ended February 28, 20194 | $ | 11.52 | 0.05 | 0.11 | (0.06 | ) | (1.74 | ) | $ | 9.88 | ||||||||||||||
Year ended May 31, 2018 | $ | 10.90 | 0.03 | 0.99 | (0.10 | ) | (0.30 | ) | $ | 11.52 | ||||||||||||||
Year ended May 31, 2017 | $ | 9.88 | 0.02 | 1.21 | (0.02 | ) | (0.19 | ) | $ | 10.90 | ||||||||||||||
Year ended May 31, 20167 | $ | 10.00 | 0.02 | (0.09 | ) | (0.05 | ) | 0.00 | $ | 9.88 | ||||||||||||||
Class R4 | ||||||||||||||||||||||||
Year ended February 29, 2020 | $ | 9.99 | 0.23 | 0.16 | (0.20 | ) | 0.00 | $ | 10.18 | |||||||||||||||
Year ended February 28, 20194 | $ | 11.59 | 0.13 | 0.12 | (0.11 | ) | (1.74 | ) | $ | 9.99 | ||||||||||||||
Year ended May 31, 2018 | $ | 10.96 | 0.15 | 0.99 | (0.21 | ) | (0.30 | ) | $ | 11.59 | ||||||||||||||
Year ended May 31, 2017 | $ | 9.93 | 0.13 | 1.21 | (0.12 | ) | (0.19 | ) | $ | 10.96 | ||||||||||||||
Year ended May 31, 20167 | $ | 10.00 | 0.07 | (0.08 | ) | (0.06 | ) | 0.00 | $ | 9.93 | ||||||||||||||
Class R6 | ||||||||||||||||||||||||
Year ended February 29, 2020 | $ | 9.99 | 0.24 | 6 | 0.17 | (0.21 | ) | 0.00 | $ | 10.19 | ||||||||||||||
Year ended February 28, 20194 | $ | 11.60 | 0.14 | 0.12 | (0.13 | ) | (1.74 | ) | $ | 9.99 | ||||||||||||||
Year ended May 31, 2018 | $ | 10.96 | 0.17 | 1.00 | (0.23 | ) | (0.30 | ) | $ | 11.60 | ||||||||||||||
Year ended May 31, 2017 | $ | 9.93 | 0.14 | 1.22 | (0.14 | ) | (0.19 | ) | $ | 10.96 | ||||||||||||||
Year ended May 31, 20167 | $ | 10.00 | 0.08 | (0.09 | ) | (0.06 | ) | 0.00 | $ | 9.93 | ||||||||||||||
| 1 | Total return calculations do not include any sales charges. Returns for periods of less than one year are not annualized. |
| 2 | Portfolio turnover rate is calculated by multiplying the Fund’s ownership percentage in the respective affiliated Master Portfolio by the corresponding affiliated Master Portfolio’s purchases and sales. These purchase and sale amounts are aggregated with the direct purchases and sales in Underlying Funds and unaffiliated securities and included in the portfolio turnover calculation. |
| 3 | Ratios reflect net expenses allocated from the affiliated Master Portfolios which were as follows: |
| Year ended February 29, 2020 | Year ended February 28, 20194 | |||||||
Class A | 0.15 | % | 0.13 | % | ||||
Class C | 0.14 | 0.12 | ||||||
Class R4 | 0.13 | 0.12 | ||||||
Class R6 | 0.15 | 0.13 | ||||||
| 4 | For the nine months ended February 28, 2019. The Fund changed its fiscal year end from May 31 to February 28, effective February 28, 2019. |
| 5 | Ratios do not reflect net expenses allocated from the affiliated Master Portfolios. Including annualized net expenses allocated from the affiliated Master Portfolios, the expense ratios would be increased by the following amounts: |
| Year ended May 31 | ||||||||||||
| 2018 | 2017 | 20167 | ||||||||||
Class A | 0.10 | % | 0.10 | % | 0.10 | % | ||||||
Class C | 0.09 | 0.10 | 0.10 | |||||||||
Class R4 | 0.09 | 0.10 | 0.10 | |||||||||
Class R6 | 0.10 | 0.11 | 0.11 | |||||||||
| 6 | Calculated based upon average shares outstanding |
| 7 | For the period from November 30, 2015 (commencement of class operations) to May 31, 2016 |
The accompanying notes are an integral part of these financial statements.
94 | Target Date Retirement Funds
Table of Contents
Financial highlights
| Ratio to average net assets (annualized) | Portfolio |
Net assets at | ||||||||||||||||||||
| Net investment income | Gross expenses | Net expenses | Total return1 | |||||||||||||||||||
| 1.77 | %3 | 2.94 | %3 | 0.66 | %3 | 3.40 | % | 36 | % | $ | 2,317 | |||||||||||
| 1.23 | %3 | 4.08 | %3 | 0.60 | %3 | 2.99 | % | 37 | % | $ | 1,010 | |||||||||||
| 1.08 | % | 4.20 | %5 | 0.53 | %5 | 10.30 | % | 53 | % | $ | 917 | |||||||||||
| 1.04 | % | 4.76 | %5 | 0.48 | %5 | 13.72 | % | 46 | % | $ | 543 | |||||||||||
| 1.19 | % | 5.29 | %5 | 0.45 | %5 | (0.34 | )% | 22 | % | $ | 173 | |||||||||||
| 1.17 | %3 | 3.62 | %3 | 1.42 | %3 | 2.74 | % | 36 | % | $ | 104 | |||||||||||
| 0.49 | %3 | 4.81 | %3 | 1.35 | %3 | 2.32 | % | 37 | % | $ | 153 | |||||||||||
| 0.27 | % | 4.95 | %5 | 1.29 | %5 | 9.43 | % | 53 | % | $ | 119 | |||||||||||
| 0.24 | % | 5.59 | %5 | 1.29 | %5 | 12.86 | % | 46 | % | $ | 112 | |||||||||||
| 0.49 | % | 6.03 | %5 | 1.30 | %5 | (0.70 | )% | 22 | % | $ | 99 | |||||||||||
| 2.17 | %3 | 2.70 | %3 | 0.36 | %3 | 3.74 | % | 36 | % | $ | 106 | |||||||||||
| 1.51 | %3 | 3.80 | %3 | 0.31 | %3 | 3.19 | % | 37 | % | $ | 104 | |||||||||||
| 1.32 | % | 3.92 | %5 | 0.25 | %5 | 10.53 | % | 53 | % | $ | 120 | |||||||||||
| 1.29 | % | 4.56 | %5 | 0.24 | %5 | 13.99 | % | 46 | % | $ | 114 | |||||||||||
| 1.55 | % | 5.00 | %5 | 0.24 | %5 | (0.10 | )% | 22 | % | $ | 100 | |||||||||||
| 2.29 | %3 | 2.54 | %3 | 0.22 | %3 | 3.99 | % | 36 | % | $ | 5,543 | |||||||||||
| 1.66 | %3 | 3.66 | %3 | 0.16 | %3 | 3.26 | % | 37 | % | $ | 4,775 | |||||||||||
| 1.47 | % | 3.77 | %5 | 0.09 | %5 | 10.77 | % | 53 | % | $ | 5,544 | |||||||||||
| 1.44 | % | 4.41 | %5 | 0.08 | %5 | 14.15 | % | 46 | % | $ | 5,238 | |||||||||||
| 1.70 | % | 4.85 | %5 | 0.09 | %5 | (0.09 | )% | 22 | % | $ | 4,597 | |||||||||||
The accompanying notes are an integral part of these financial statements.
Target Date Retirement Funds | 95
Table of Contents
Financial highlights
| Beginning net asset value per share | Net investment income | Net realized and unrealized gains (losses) on investments | Distributions from net investment income | Distributions from net realized gains | Ending net asset value per share | |||||||||||||||||||
Dynamic Target 2035 Fund | ||||||||||||||||||||||||
Class A | ||||||||||||||||||||||||
Year ended February 29, 2020 | $ | 9.84 | 0.18 | 0.09 | (0.16 | ) | 0.00 | $ | 9.95 | |||||||||||||||
Year ended February 28, 20194 | $ | 11.66 | 0.09 | 0.14 | (0.08 | ) | (1.97 | ) | $ | 9.84 | ||||||||||||||
Year ended May 31, 2018 | $ | 10.97 | 0.11 | 1.11 | (0.19 | ) | (0.34 | ) | $ | 11.66 | ||||||||||||||
Year ended May 31, 2017 | $ | 9.88 | 0.09 | 1.32 | (0.11 | ) | (0.21 | ) | $ | 10.97 | ||||||||||||||
Year ended May 31, 20167 | $ | 10.00 | 0.06 | (0.12 | ) | (0.06 | ) | 0.00 | $ | 9.88 | ||||||||||||||
Class C | ||||||||||||||||||||||||
Year ended February 29, 2020 | $ | 9.83 | 0.11 | 0.09 | (0.10 | ) | 0.00 | $ | 9.93 | |||||||||||||||
Year ended February 28, 20194 | $ | 11.63 | 0.03 | 0.14 | 0.00 | (1.97 | ) | $ | 9.83 | |||||||||||||||
Year ended May 31, 2018 | $ | 10.95 | 0.02 | 1.10 | (0.10 | ) | (0.34 | ) | $ | 11.63 | ||||||||||||||
Year ended May 31, 2017 | $ | 9.84 | 0.02 | 1.32 | (0.02 | ) | (0.21 | ) | $ | 10.95 | ||||||||||||||
Year ended May 31, 20167 | $ | 10.00 | 0.02 | (0.13 | ) | (0.05 | ) | 0.00 | $ | 9.84 | ||||||||||||||
Class R4 | ||||||||||||||||||||||||
Year ended February 29, 2020 | $ | 9.89 | 0.22 | 0.09 | (0.18 | ) | 0.00 | $ | 10.02 | |||||||||||||||
Year ended February 28, 20194 | $ | 11.71 | 0.12 | 0.13 | (0.10 | ) | (1.97 | ) | $ | 9.89 | ||||||||||||||
Year ended May 31, 2018 | $ | 11.00 | 0.15 | 1.11 | (0.21 | ) | (0.34 | ) | $ | 11.71 | ||||||||||||||
Year ended May 31, 2017 | $ | 9.89 | 0.13 | 1.31 | (0.12 | ) | (0.21 | ) | $ | 11.00 | ||||||||||||||
Year ended May 31, 20167 | $ | 10.00 | 0.07 | (0.12 | ) | (0.06 | ) | 0.00 | $ | 9.89 | ||||||||||||||
Class R6 | ||||||||||||||||||||||||
Year ended February 29, 2020 | $ | 9.89 | 0.23 | 6 | 0.10 | (0.20 | ) | 0.00 | $ | 10.02 | ||||||||||||||
Year ended February 28, 20194 | $ | 11.72 | 0.13 | 0.13 | (0.12 | ) | (1.97 | ) | $ | 9.89 | ||||||||||||||
Year ended May 31, 2018 | $ | 11.01 | 0.16 | 1.12 | (0.23 | ) | (0.34 | ) | $ | 11.72 | ||||||||||||||
Year ended May 31, 2017 | $ | 9.89 | 0.14 | 1.33 | (0.14 | ) | (0.21 | ) | $ | 11.01 | ||||||||||||||
Year ended May 31, 20167 | $ | 10.00 | 0.08 | (0.13 | ) | (0.06 | ) | 0.00 | $ | 9.89 | ||||||||||||||
| 1 | Total return calculations do not include any sales charges. Returns for periods of less than one year are not annualized. |
| 2 | Portfolio turnover rate is calculated by multiplying the Fund’s ownership percentage in the respective affiliated Master Portfolio by the corresponding affiliated Master Portfolio’s purchases and sales. These purchase and sale amounts are aggregated with the direct purchases and sales in Underlying Funds and unaffiliated securities and included in the portfolio turnover calculation. |
| 3 | Ratios reflect net expenses allocated from the affiliated Master Portfolios which were as follows: |
| Year ended February 29, 2020 | Year ended February 28, 20194 | |||||||
Class A | 0.15 | % | 0.13 | % | ||||
Class C | 0.14 | 0.13 | ||||||
Class R4 | 0.14 | 0.13 | ||||||
Class R6 | 0.16 | 0.13 | ||||||
| 4 | For the nine months ended February 28, 2019. The Fund changed its fiscal year end from May 31 to February 28, effective February 28, 2019. |
| 5 | Ratios do not reflect net expenses allocated from the affiliated Master Portfolios. Including annualized net expenses allocated from the affiliated Master Portfolios, the expense ratios would be increased by the following amounts: |
| Year ended May 31 | ||||||||||||
| 2018 | 2017 | 20167 | ||||||||||
Class A | 0.09 | % | 0.10 | % | 0.10 | % | ||||||
Class C | 0.09 | 0.10 | 0.10 | |||||||||
Class R4 | 0.09 | 0.10 | 0.10 | |||||||||
Class R6 | 0.10 | 0.11 | 0.11 | |||||||||
| 6 | Calculated based upon average shares outstanding |
| 7 | For the period from November 30, 2015 (commencement of class operations) to May 31, 2016 |
The accompanying notes are an integral part of these financial statements.
96 | Target Date Retirement Funds
Table of Contents
Financial highlights
| Ratio to average net assets (annualized) | Portfolio |
Net assets at | ||||||||||||||||||||
| Net investment income | Gross expenses | Net expenses | Total return1 | |||||||||||||||||||
| 1.81 | %3 | 3.12 | %3 | 0.66 | %3 | 2.65 | % | 36 | % | $ | 733 | |||||||||||
| 1.16 | %3 | 4.34 | %3 | 0.60 | %3 | 3.13 | % | 34 | % | $ | 521 | |||||||||||
| 0.99 | % | 4.32 | %5 | 0.53 | %5 | 11.24 | % | 44 | % | $ | 453 | |||||||||||
| 1.05 | % | 4.86 | %5 | 0.49 | %5 | 14.74 | % | 39 | % | $ | 338 | |||||||||||
| 1.24 | % | 5.32 | %5 | 0.55 | %5 | (0.62 | )% | 19 | % | $ | 119 | |||||||||||
| 1.09 | %3 | 3.71 | %3 | 1.42 | %3 | 1.99 | % | 36 | % | $ | 107 | |||||||||||
| 0.37 | %3 | 5.08 | %3 | 1.36 | %3 | 2.55 | % | 34 | % | $ | 102 | |||||||||||
| 0.21 | % | 5.07 | %5 | 1.29 | %5 | 10.30 | % | 44 | % | $ | 120 | |||||||||||
| 0.21 | % | 5.67 | %5 | 1.29 | %5 | 14.02 | % | 39 | % | $ | 113 | |||||||||||
| 0.48 | % | 6.06 | %5 | 1.30 | %5 | (1.08 | )% | 19 | % | $ | 99 | |||||||||||
| 2.15 | %3 | 2.86 | %3 | 0.36 | %3 | 3.05 | % | 36 | % | $ | 104 | |||||||||||
| 1.42 | %3 | 4.06 | %3 | 0.31 | %3 | 3.34 | % | 34 | % | $ | 103 | |||||||||||
| 1.26 | % | 4.04 | %5 | 0.25 | %5 | 11.59 | % | 44 | % | $ | 122 | |||||||||||
| 1.26 | % | 4.64 | %5 | 0.24 | %5 | 15.05 | % | 39 | % | $ | 114 | |||||||||||
| 1.54 | % | 5.03 | %5 | 0.24 | %5 | (0.48 | )% | 19 | % | $ | 99 | |||||||||||
| 2.22 | %3 | 2.66 | %3 | 0.22 | %3 | 3.19 | % | 36 | % | $ | 6,780 | |||||||||||
| 1.57 | %3 | 3.91 | %3 | 0.16 | %3 | 3.41 | % | 34 | % | $ | 4,734 | |||||||||||
| 1.41 | % | 3.89 | %5 | 0.09 | %5 | 11.73 | % | 44 | % | $ | 5,608 | |||||||||||
| 1.41 | % | 4.49 | %5 | 0.08 | %5 | 15.31 | % | 39 | % | $ | 5,270 | |||||||||||
| 1.69 | % | 4.88 | %5 | 0.08 | %5 | (0.46 | )% | 19 | % | $ | 4,580 | |||||||||||
The accompanying notes are an integral part of these financial statements.
Target Date Retirement Funds | 97
Table of Contents
Financial highlights
| Beginning net asset value per share | Net investment income | Net realized and unrealized gains (losses) on investments | Distributions from net investment income | Distributions from net realized gains | Ending net asset value per share | |||||||||||||||||||
Dynamic Target 2040 Fund | ||||||||||||||||||||||||
Class A | ||||||||||||||||||||||||
Year ended February 29, 2020 | $ | 9.77 | 0.16 | 0.08 | (0.18 | ) | 0.00 | $ | 9.83 | |||||||||||||||
Year ended February 28, 20194 | $ | 11.74 | 0.08 | 0.11 | (0.06 | ) | (2.10 | ) | $ | 9.77 | ||||||||||||||
Year ended May 31, 2018 | $ | 11.00 | 0.09 | 1.20 | (0.20 | ) | (0.35 | ) | $ | 11.74 | ||||||||||||||
Year ended May 31, 2017 | $ | 9.85 | 0.09 | 1.37 | (0.11 | ) | (0.20 | ) | $ | 11.00 | ||||||||||||||
Year ended May 31, 20166 | $ | 10.00 | 0.06 | (0.15 | ) | (0.06 | ) | 0.00 | $ | 9.85 | ||||||||||||||
Class C | ||||||||||||||||||||||||
Year ended February 29, 2020 | $ | 9.76 | 0.11 | 0.05 | (0.11 | ) | 0.00 | $ | 9.81 | |||||||||||||||
Year ended February 28, 20194 | $ | 11.72 | 0.02 | 0.12 | 0.00 | (2.10 | ) | $ | 9.76 | |||||||||||||||
Year ended May 31, 2018 | $ | 10.98 | 0.02 | 1.17 | (0.10 | ) | (0.35 | ) | $ | 11.72 | ||||||||||||||
Year ended May 31, 2017 | $ | 9.82 | 0.02 | 1.36 | (0.02 | ) | (0.20 | ) | $ | 10.98 | ||||||||||||||
Year ended May 31, 20166 | $ | 10.00 | 0.02 | (0.15 | ) | (0.05 | ) | 0.00 | $ | 9.82 | ||||||||||||||
Class R4 | ||||||||||||||||||||||||
Year ended February 29, 2020 | $ | 9.83 | 0.22 | 0.05 | (0.19 | ) | 0.00 | $ | 9.91 | |||||||||||||||
Year ended February 28, 20194 | $ | 11.80 | 0.11 | 0.11 | (0.09 | ) | (2.10 | ) | $ | 9.83 | ||||||||||||||
Year ended May 31, 2018 | $ | 11.04 | 0.14 | 1.18 | (0.21 | ) | (0.35 | ) | $ | 11.80 | ||||||||||||||
Year ended May 31, 2017 | $ | 9.86 | 0.13 | 1.37 | (0.12 | ) | (0.20 | ) | $ | 11.04 | ||||||||||||||
Year ended May 31, 20166 | $ | 10.00 | 0.07 | (0.15 | ) | (0.06 | ) | 0.00 | $ | 9.86 | ||||||||||||||
Class R6 | ||||||||||||||||||||||||
Year ended February 29, 2020 | $ | 9.84 | 0.23 | 0.06 | (0.21 | ) | 0.00 | $ | 9.92 | |||||||||||||||
Year ended February 28, 20194 | $ | 11.81 | 0.12 | 0.12 | (0.11 | ) | (2.10 | ) | $ | 9.84 | ||||||||||||||
Year ended May 31, 2018 | $ | 11.04 | 0.16 | 1.19 | (0.23 | ) | (0.35 | ) | $ | 11.81 | ||||||||||||||
Year ended May 31, 2017 | $ | 9.87 | 0.14 | 1.36 | (0.13 | ) | (0.20 | ) | $ | 11.04 | ||||||||||||||
Year ended May 31, 20166 | $ | 10.00 | 0.08 | (0.14 | ) | (0.07 | ) | 0.00 | $ | 9.87 | ||||||||||||||
| 1 | Total return calculations do not include any sales charges. Returns for periods of less than one year are not annualized. |
| 2 | Portfolio turnover rate is calculated by multiplying the Fund’s ownership percentage in each respective affiliated Master Portfolio by the corresponding affiliated Master Portfolio’s purchases and sales. These purchase and sale amounts are aggregated with the direct purchases and sales in Underlying Funds and unaffiliated securities and included in the portfolio turnover calculation. |
| 3 | Ratios reflect net expenses allocated from the affiliated Master Portfolios which were as follows: |
| Year ended February 29, 2020 | Year ended February 28, 20194 | |||||||
Class A | 0.16 | % | 0.13 | % | ||||
Class C | 0.14 | 0.13 | ||||||
Class R4 | 0.14 | 0.13 | ||||||
Class R6 | 0.16 | 0.13 | ||||||
| 4 | For the nine months ended February 28, 2019. The Fund changed its fiscal year end from May 31 to February 28, effective February 28, 2019. |
| 5 | Ratios do not reflect net expenses allocated from the affiliated Master Portfolios. Including annualized net expenses allocated from the affiliated Master Portfolios, the expense ratios would be increased by the following amounts: |
| Year ended May 31 | ||||||||||||
| 2018 | 2017 | 20166 | ||||||||||
Class A | 0.09 | % | 0.10 | % | 0.10 | % | ||||||
Class C | 0.09 | 0.10 | 0.10 | |||||||||
Class R4 | 0.09 | 0.10 | 0.10 | |||||||||
Class R6 | 0.10 | 0.11 | 0.11 | |||||||||
| 6 | For the period from November 30, 2015 (commencement of class operations) to May 31, 2016 |
The accompanying notes are an integral part of these financial statements.
98 | Target Date Retirement Funds
Table of Contents
Financial highlights
| Ratio to average net assets (annualized) | Portfolio |
Net assets at | ||||||||||||||||||||
| Net investment income | Gross expenses | Net expenses | Total return1 | |||||||||||||||||||
| 1.62 | %3 | 3.57 | %3 | 0.67 | %3 | 2.33 | % | 36 | % | $ | 1,858 | |||||||||||
| 0.99 | %3 | 4.11 | %3 | 0.63 | %3 | 2.80 | % | 32 | % | $ | 454 | |||||||||||
| 1.02 | % | 3.93 | %5 | 0.54 | %5 | 11.79 | % | 40 | % | $ | 472 | |||||||||||
| 1.01 | % | 4.46 | %5 | 0.51 | %5 | 15.34 | % | 33 | % | $ | 307 | |||||||||||
| 1.22 | % | 5.33 | %5 | 0.53 | %5 | (0.90 | )% | 15 | % | $ | 157 | |||||||||||
| 1.05 | %3 | 4.35 | %3 | 1.42 | %3 | 1.53 | % | 36 | % | $ | 101 | |||||||||||
| 0.25 | %3 | 4.85 | %3 | 1.38 | %3 | 2.30 | % | 32 | % | $ | 100 | |||||||||||
| 0.16 | % | 4.70 | %5 | 1.29 | %5 | 10.88 | % | 40 | % | $ | 120 | |||||||||||
| 0.18 | % | 5.25 | %5 | 1.30 | %5 | 14.52 | % | 33 | % | $ | 113 | |||||||||||
| 0.47 | % | 6.07 | %5 | 1.30 | %5 | (1.25 | )% | 15 | % | $ | 99 | |||||||||||
| 2.10 | %3 | 3.31 | %3 | 0.36 | %3 | 2.61 | % | 36 | % | $ | 103 | |||||||||||
| 1.29 | %3 | 3.82 | %3 | 0.34 | %3 | 3.06 | % | 32 | % | $ | 102 | |||||||||||
| 1.21 | % | 3.67 | %5 | 0.25 | %5 | 12.07 | % | 40 | % | $ | 123 | |||||||||||
| 1.24 | % | 4.22 | %5 | 0.24 | %5 | 15.78 | % | 33 | % | $ | 115 | |||||||||||
| 1.53 | % | 5.04 | %5 | 0.24 | %5 | (0.76 | )% | 15 | % | $ | 99 | |||||||||||
| 2.24 | %3 | 3.15 | %3 | 0.21 | %3 | 2.75 | % | 36 | % | $ | 4,897 | |||||||||||
| 1.44 | %3 | 3.67 | %3 | 0.19 | %3 | 3.24 | % | 32 | % | $ | 4,707 | |||||||||||
| 1.36 | % | 3.52 | %5 | 0.10 | %5 | 12.31 | % | 40 | % | $ | 5,651 | |||||||||||
| 1.39 | % | 4.07 | %5 | 0.09 | %5 | 15.82 | % | 33 | % | $ | 5,285 | |||||||||||
| 1.69 | % | 4.90 | %5 | 0.09 | %5 | (0.64 | )% | 15 | % | $ | 4,571 | |||||||||||
The accompanying notes are an integral part of these financial statements.
Target Date Retirement Funds | 99
Table of Contents
Financial highlights
| Beginning net asset value per share | Net investment income | Net realized and unrealized gains (losses) on investments | Distributions from net investment income | Distributions from net realized gains | Ending net asset value per share | |||||||||||||||||||
Dynamic Target 2045 Fund | ||||||||||||||||||||||||
Class A | ||||||||||||||||||||||||
Year ended February 29, 2020 | $ | 9.73 | 0.16 | 0.00 | 3 | (0.17 | ) | 0.00 | $ | 9.72 | ||||||||||||||
Year ended February 28, 20195 | $ | 11.79 | 0.08 | 0.08 | (0.07 | ) | (2.15 | ) | $ | 9.73 | ||||||||||||||
Year ended May 31, 2018 | $ | 11.02 | 0.12 | 1.20 | (0.19 | ) | (0.36 | ) | $ | 11.79 | ||||||||||||||
Year ended May 31, 2017 | $ | 9.86 | 0.08 | 1.41 | (0.10 | ) | (0.23 | ) | $ | 11.02 | ||||||||||||||
Year ended May 31, 20167 | $ | 10.00 | 0.06 | (0.14 | ) | (0.06 | ) | 0.00 | $ | 9.86 | ||||||||||||||
Class C | ||||||||||||||||||||||||
Year ended February 29, 2020 | $ | 9.71 | 0.10 | (0.01 | ) | (0.12 | ) | 0.00 | $ | 9.68 | ||||||||||||||
Year ended February 28, 20195 | $ | 11.75 | 0.02 | 0.09 | 0.00 | (2.15 | ) | $ | 9.71 | |||||||||||||||
Year ended May 31, 2018 | $ | 10.99 | 0.02 | 1.20 | (0.10 | ) | (0.36 | ) | $ | 11.75 | ||||||||||||||
Year ended May 31, 2017 | $ | 9.83 | 0.02 | 1.39 | (0.02 | ) | (0.23 | ) | $ | 10.99 | ||||||||||||||
Year ended May 31, 20167 | $ | 10.00 | 0.02 | (0.14 | ) | (0.05 | ) | 0.00 | $ | 9.83 | ||||||||||||||
Class R4 | ||||||||||||||||||||||||
Year ended February 29, 2020 | $ | 9.78 | 0.21 | (0.01 | ) | (0.20 | ) | 0.00 | $ | 9.78 | ||||||||||||||
Year ended February 28, 20195 | $ | 11.83 | 0.11 | 0.08 | (0.09 | ) | (2.15 | ) | $ | 9.78 | ||||||||||||||
Year ended May 31, 2018 | $ | 11.05 | 0.14 | 1.22 | (0.22 | ) | (0.36 | ) | $ | 11.83 | ||||||||||||||
Year ended May 31, 2017 | $ | 9.88 | 0.13 | 1.39 | (0.12 | ) | (0.23 | ) | $ | 11.05 | ||||||||||||||
Year ended May 31, 20167 | $ | 10.00 | 0.07 | (0.13 | ) | (0.06 | ) | 0.00 | $ | 9.88 | ||||||||||||||
Class R6 | ||||||||||||||||||||||||
Year ended February 29, 2020 | $ | 9.79 | 0.22 | 8 | (0.01 | ) | (0.21 | ) | 0.00 | $ | 9.79 | |||||||||||||
Year ended February 28, 20195 | $ | 11.84 | 0.12 | 0.08 | (0.10 | ) | (2.15 | ) | $ | 9.79 | ||||||||||||||
Year ended May 31, 2018 | $ | 11.06 | 0.16 | 1.21 | (0.23 | ) | (0.36 | ) | $ | 11.84 | ||||||||||||||
Year ended May 31, 2017 | $ | 9.88 | 0.14 | 1.40 | (0.13 | ) | (0.23 | ) | $ | 11.06 | ||||||||||||||
Year ended May 31, 20167 | $ | 10.00 | 0.08 | (0.13 | ) | (0.07 | ) | 0.00 | $ | 9.88 | ||||||||||||||
| 1 | Total return calculations do not include any sales charges. Returns for periods of less than one year are not annualized. |
| 2 | Portfolio turnover rate is calculated by multiplying the Fund’s ownership percentage in each respective affiliated Master Portfolio by the corresponding affiliated Master Portfolio’s purchases and sales. These purchase and sale amounts are aggregated with the direct purchases and sales in Underlying Funds and unaffiliated securities and included in the portfolio turnover calculation. |
| 3 | Amount is less than $0.005. |
| 4 | Ratios reflect net expenses allocated from the affiliated Master Portfolios which were as follows: |
| Year ended February 29, 2020 | Year ended February 28, 20195 | |||||||
Class A | 0.16 | % | 0.14 | % | ||||
Class C | 0.15 | 0.13 | ||||||
Class R4 | 0.15 | 0.13 | ||||||
Class R6 | 0.16 | 0.14 | ||||||
| 5 | For the nine months ended February 28, 2019. The Fund changed its fiscal year end from May 31 to February 28, effective February 28, 2019. |
| 6 | Ratios do not reflect net expenses allocated from the affiliated Master Portfolios. Including annualized net expenses allocated from the affiliated Master Portfolios, the expense ratios would be increased by the following amounts: |
| Year ended May 31 | ||||||||||||
| 2018 | 2017 | 20167 | ||||||||||
Class A | 0.09 | % | 0.10 | % | 0.10 | % | ||||||
Class C | 0.09 | 0.10 | 0.10 | |||||||||
Class R4 | 0.09 | 0.10 | 0.10 | |||||||||
Class R6 | 0.10 | 0.11 | 0.11 | |||||||||
| 7 | For the period from November 30, 2015 (commencement of class operations) to May 31, 2016 |
| 8 | Calculated based upon average shares outstanding |
The accompanying notes are an integral part of these financial statements.
100 | Target Date Retirement Funds
Table of Contents
Financial highlights
| Ratio to average net assets (annualized) | Portfolio |
Net assets at | ||||||||||||||||||||
| Net investment income | Gross expenses | Net expenses | Total return1 | |||||||||||||||||||
| 1.72 | %4 | 3.61 | %4 | 0.66 | %4 | 1.53 | % | 36 | % | $ | 414 | |||||||||||
| 0.97 | %4 | 4.18 | %4 | 0.61 | %4 | 2.62 | % | 31 | % | $ | 329 | |||||||||||
| 0.90 | % | 4.09 | %6 | 0.54 | %6 | 12.06 | % | 35 | % | $ | 327 | |||||||||||
| 0.98 | % | 4.58 | %6 | 0.51 | %6 | 15.64 | % | 31 | % | $ | 221 | |||||||||||
| 1.23 | % | 5.36 | %6 | 0.53 | %6 | (0.79 | )% | 14 | % | $ | 121 | |||||||||||
| 1.00 | %4 | 4.19 | %4 | 1.42 | %4 | 0.78 | % | 36 | % | $ | 109 | |||||||||||
| 0.21 | %4 | 4.92 | %4 | 1.36 | %4 | 2.06 | % | 31 | % | $ | 102 | |||||||||||
| 0.15 | % | 4.84 | %6 | 1.29 | %6 | 11.18 | % | 35 | % | $ | 121 | |||||||||||
| 0.17 | % | 5.37 | %6 | 1.30 | %6 | 14.74 | % | 31 | % | $ | 113 | |||||||||||
| 0.48 | % | 6.10 | %6 | 1.30 | %6 | (1.15 | )% | 14 | % | $ | 99 | |||||||||||
| 2.06 | %4 | 3.34 | %4 | 0.36 | %4 | 1.83 | % | 36 | % | $ | 102 | |||||||||||
| 1.25 | %4 | 3.89 | %4 | 0.32 | %4 | 2.81 | % | 31 | % | $ | 102 | |||||||||||
| 1.19 | % | 3.81 | %6 | 0.25 | %6 | 12.36 | % | 35 | % | $ | 123 | |||||||||||
| 1.23 | % | 4.34 | %6 | 0.24 | %6 | 15.88 | % | 31 | % | $ | 115 | |||||||||||
| 1.54 | % | 5.07 | %6 | 0.24 | %6 | (0.55 | )% | 14 | % | $ | 99 | |||||||||||
| 2.18 | %4 | 3.18 | %4 | 0.21 | %4 | 1.97 | % | 36 | % | $ | 5,419 | |||||||||||
| 1.40 | %4 | 3.75 | %4 | 0.17 | %4 | 2.97 | % | 31 | % | $ | 4,695 | |||||||||||
| 1.35 | % | 3.66 | %6 | 0.10 | %6 | 12.51 | % | 35 | % | $ | 5.679 | |||||||||||
| 1.38 | % | 4.19 | %6 | 0.09 | %6 | 16.14 | % | 31 | % | $ | 5,303 | |||||||||||
| 1.69 | % | 4.92 | %6 | 0.09 | %6 | (0.53 | )% | 14 | % | $ | 4,576 | |||||||||||
The accompanying notes are an integral part of these financial statements.
Target Date Retirement Funds | 101
Table of Contents
Financial highlights
| Beginning net asset value per share | Net investment income | Net realized and unrealized gains (losses) on investments | Distributions from net investment income | Distributions from net realized gains | Ending net asset value per share | |||||||||||||||||||
Dynamic Target 2050 Fund | ||||||||||||||||||||||||
Class A | ||||||||||||||||||||||||
Year ended February 29, 2020 | $ | 9.73 | 0.17 | (0.06 | ) | (0.18 | ) | 0.00 | $ | 9.66 | ||||||||||||||
Year ended February 28, 20194 | $ | 11.80 | 0.07 | 0.06 | (0.05 | ) | (2.15 | ) | $ | 9.73 | ||||||||||||||
Year ended May 31, 2018 | $ | 11.03 | 0.11 | 1.22 | (0.20 | ) | (0.36 | ) | $ | 11.80 | ||||||||||||||
Year ended May 31, 2017 | $ | 9.86 | 0.09 | 1.40 | (0.09 | ) | (0.23 | ) | $ | 11.03 | ||||||||||||||
Year ended May 31, 20166 | $ | 10.00 | 0.06 | (0.14 | ) | (0.06 | ) | 0.00 | $ | 9.86 | ||||||||||||||
Class C | ||||||||||||||||||||||||
Year ended February 29, 2020 | $ | 9.68 | 0.10 | (0.06 | ) | (0.13 | ) | 0.00 | $ | 9.59 | ||||||||||||||
Year ended February 28, 20194 | $ | 11.76 | 0.02 | 0.05 | 0.00 | (2.15 | ) | $ | 9.68 | |||||||||||||||
Year ended May 31, 2018 | $ | 10.99 | 0.02 | 1.21 | (0.10 | ) | (0.36 | ) | $ | 11.76 | ||||||||||||||
Year ended May 31, 2017 | $ | 9.83 | 0.02 | 1.39 | (0.02 | ) | (0.23 | ) | $ | 10.99 | ||||||||||||||
Year ended May 31, 20166 | $ | 10.00 | 0.02 | (0.14 | ) | (0.05 | ) | 0.00 | $ | 9.83 | ||||||||||||||
Class R4 | ||||||||||||||||||||||||
Year ended February 29, 2020 | $ | 9.76 | 0.21 | (0.07 | ) | (0.21 | ) | 0.00 | $ | 9.69 | ||||||||||||||
Year ended February 28, 20194 | $ | 11.83 | 0.10 | 0.06 | (0.08 | ) | (2.15 | ) | $ | 9.76 | ||||||||||||||
Year ended May 31, 2018 | $ | 11.05 | 0.14 | 1.22 | (0.22 | ) | (0.36 | ) | $ | 11.83 | ||||||||||||||
Year ended May 31, 2017 | $ | 9.88 | 0.13 | 1.39 | (0.12 | ) | (0.23 | ) | $ | 11.05 | ||||||||||||||
Year ended May 31, 20166 | $ | 10.00 | 0.07 | (0.13 | ) | (0.06 | ) | 0.00 | $ | 9.88 | ||||||||||||||
Class R6 | ||||||||||||||||||||||||
Year ended February 29, 2020 | $ | 9.76 | 0.22 | (0.06 | ) | (0.22 | ) | 0.00 | $ | 9.70 | ||||||||||||||
Year ended February 28, 20194 | $ | 11.84 | 0.12 | 0.05 | (0.10 | ) | (2.15 | ) | $ | 9.76 | ||||||||||||||
Year ended May 31, 2018 | $ | 11.06 | 0.16 | 1.21 | (0.23 | ) | (0.36 | ) | $ | 11.84 | ||||||||||||||
Year ended May 31, 2017 | $ | 9.88 | 0.14 | 1.40 | (0.13 | ) | (0.23 | ) | $ | 11.06 | ||||||||||||||
Year ended May 31, 20166 | $ | 10.00 | 0.08 | (0.13 | ) | (0.07 | ) | 0.00 | $ | 9.88 | ||||||||||||||
| 1 | Total return calculations do not include any sales charges. Returns for periods of less than one year are not annualized. |
| 2 | Portfolio turnover rate is calculated by multiplying the Fund’s ownership percentage in each respective affiliated Master Portfolio by the corresponding affiliated Master Portfolio’s purchases and sales. These purchase and sale amounts are aggregated with the direct purchases and sales in Underlying Funds and unaffiliated securities and included in the portfolio turnover calculation. |
| 3 | Ratios reflect net expenses allocated from the affiliated Master Portfolios which were as follows: |
| Year ended February 29, 2020 | Year ended February 28, 20194 | |||||||
Class A | 0.16 | % | 0.13 | % | ||||
Class C | 0.16 | 0.13 | ||||||
Class R4 | 0.15 | 0.13 | ||||||
Class R6 | 0.17 | 0.14 | ||||||
| 4 | For the nine months ended February 28, 2019. The Fund changed its fiscal year end from May 31 to February 28, effective February 28, 2019. |
| 5 | Ratios do not reflect net expenses allocated from the affiliated Master Portfolios. Including annualized net expenses allocated from the affiliated Master Portfolios, the expense ratios would be increased by the following amounts: |
| Year ended May 31 | ||||||||||||
| 2018 | 2017 | 20166 | ||||||||||
Class A | 0.09 | % | 0.10 | % | 0.10 | % | ||||||
Class C | 0.09 | 0.10 | 0.10 | |||||||||
Class R4 | 0.09 | 0.10 | 0.10 | |||||||||
Class R6 | 0.10 | 0.11 | 0.11 | |||||||||
| 6 | For the period from November 30, 2015 (commencement of class operations) to May 31, 2016 |
The accompanying notes are an integral part of these financial statements.
102 | Target Date Retirement Funds
Table of Contents
Financial highlights
| Ratio to average net assets (annualized) | Portfolio |
Net assets at | ||||||||||||||||||||
| Net investment income | Gross expenses | Net expenses | Total return1 | |||||||||||||||||||
| 1.72 | %3 | 3.67 | %3 | 0.66 | %3 | 1.01 | % | 36 | % | $ | 254 | |||||||||||
| 0.96 | %3 | 4.34 | %3 | 0.60 | %3 | 2.37 | % | 31 | % | $ | 198 | |||||||||||
| 0.83 | % | 4.26 | %5 | 0.54 | %5 | 12.16 | % | 35 | % | $ | 256 | |||||||||||
| 0.91 | % | 4.80 | %5 | 0.53 | %5 | 15.65 | % | 31 | % | $ | 134 | |||||||||||
| 1.22 | % | 5.25 | %5 | 0.53 | %5 | (0.78 | )% | 14 | % | $ | 108 | |||||||||||
| 0.99 | %3 | 4.24 | %3 | 1.42 | %3 | 0.26 | % | 36 | % | $ | 106 | |||||||||||
| 0.21 | %3 | 5.09 | %3 | 1.35 | %3 | 1.77 | % | 31 | % | $ | 102 | |||||||||||
| 0.15 | % | 5.02 | %5 | 1.29 | %5 | 11.33 | % | 35 | % | $ | 121 | |||||||||||
| 0.18 | % | 5.56 | %5 | 1.29 | %5 | 14.77 | % | 31 | % | $ | 113 | |||||||||||
| 0.48 | % | 6.00 | %5 | 1.30 | %5 | (1.15 | )% | 14 | % | $ | 99 | |||||||||||
| 2.05 | %3 | 3.39 | %3 | 0.36 | %3 | 1.22 | % | 36 | % | $ | 101 | |||||||||||
| 1.25 | %3 | 4.06 | %3 | 0.30 | %3 | 2.67 | % | 31 | % | $ | 102 | |||||||||||
| 1.19 | % | 3.99 | %5 | 0.25 | %5 | 12.42 | % | 35 | % | $ | 123 | |||||||||||
| 1.23 | % | 4.53 | %5 | 0.24 | %5 | 15.90 | % | 31 | % | $ | 115 | |||||||||||
| 1.53 | % | 4.97 | %5 | 0.24 | %5 | (0.55 | )% | 14 | % | $ | 99 | |||||||||||
| 2.19 | %3 | 3.25 | %3 | 0.21 | %3 | 1.47 | % | 36 | % | $ | 4,884 | |||||||||||
| 1.40 | %3 | 3.92 | %3 | 0.15 | %3 | 2.75 | % | 31 | % | $ | 4,682 | |||||||||||
| 1.35 | % | 3.84 | %5 | 0.10 | %5 | 12.56 | % | 35 | % | $ | 5,681 | |||||||||||
| 1.39 | % | 4.38 | %5 | 0.09 | %5 | 16.17 | % | 31 | % | $ | 5,304 | |||||||||||
| 1.69 | % | 4.82 | %5 | 0.09 | %5 | (0.53 | )% | 14 | % | $ | 4,576 | |||||||||||
The accompanying notes are an integral part of these financial statements.
Target Date Retirement Funds | 103
Table of Contents
Financial highlights
| Beginning net asset value per share | Net investment income | Net realized and unrealized gains (losses) on investments | Distributions from net investment income | Distributions from net realized gains | Ending net asset value per share | |||||||||||||||||||
Dynamic Target 2055 Fund | ||||||||||||||||||||||||
Class A | ||||||||||||||||||||||||
Year ended February 29, 2020 | $ | 9.73 | 0.15 | (0.04 | ) | (0.18 | ) | 0.00 | $ | 9.66 | ||||||||||||||
Year ended February 28, 20194 | $ | 11.80 | 0.08 | 0.05 | (0.05 | ) | (2.15 | ) | $ | 9.73 | ||||||||||||||
Year ended May 31, 2018 | $ | 11.03 | 0.11 | 1.22 | (0.19 | ) | (0.37 | ) | $ | 11.80 | ||||||||||||||
Year ended May 31, 2017 | $ | 9.87 | 0.09 | 1.39 | (0.09 | ) | (0.23 | ) | $ | 11.03 | ||||||||||||||
Year ended May 31, 20166 | $ | 10.00 | 0.06 | (0.13 | ) | (0.06 | ) | 0.00 | $ | 9.87 | ||||||||||||||
Class C | ||||||||||||||||||||||||
Year ended February 29, 2020 | $ | 9.67 | 0.10 | (0.06 | ) | (0.12 | ) | 0.00 | $ | 9.59 | ||||||||||||||
Year ended February 28, 20194 | $ | 11.75 | 0.02 | 0.05 | 0.00 | (2.15 | ) | $ | 9.67 | |||||||||||||||
Year ended May 31, 2018 | $ | 10.99 | 0.02 | 1.21 | (0.10 | ) | (0.37 | ) | $ | 11.75 | ||||||||||||||
Year ended May 31, 2017 | $ | 9.84 | 0.02 | 1.38 | (0.02 | ) | (0.23 | ) | $ | 10.99 | ||||||||||||||
Year ended May 31, 20166 | $ | 10.00 | 0.02 | (0.13 | ) | (0.05 | ) | 0.00 | $ | 9.84 | ||||||||||||||
Class R4 | ||||||||||||||||||||||||
Year ended February 29, 2020 | $ | 9.75 | 0.21 | (0.07 | ) | (0.20 | ) | 0.00 | $ | 9.69 | ||||||||||||||
Year ended February 28, 20194 | $ | 11.83 | 0.10 | 0.05 | (0.08 | ) | (2.15 | ) | $ | 9.75 | ||||||||||||||
Year ended May 31, 2018 | $ | 11.05 | 0.14 | 1.23 | (0.22 | ) | (0.37 | ) | $ | 11.83 | ||||||||||||||
Year ended May 31, 2017 | $ | 9.88 | 0.13 | 1.39 | (0.12 | ) | (0.23 | ) | $ | 11.05 | ||||||||||||||
Year ended May 31, 20166 | $ | 10.00 | 0.07 | (0.13 | ) | (0.06 | ) | 0.00 | $ | 9.88 | ||||||||||||||
Class R6 | ||||||||||||||||||||||||
Year ended February 29, 2020 | $ | 9.75 | 0.22 | 7 | (0.07 | ) | (0.21 | ) | 0.00 | $ | 9.69 | |||||||||||||
Year ended February 28, 20194 | $ | 11.84 | 0.12 | 0.04 | (0.10 | ) | (2.15 | ) | $ | 9.75 | ||||||||||||||
Year ended May 31, 2018 | $ | 11.06 | 0.16 | 1.22 | (0.23 | ) | (0.37 | ) | $ | 11.84 | ||||||||||||||
Year ended May 31, 2017 | $ | 9.89 | 0.14 | 1.39 | (0.13 | ) | (0.23 | ) | $ | 11.06 | ||||||||||||||
Year ended May 31, 20166 | $ | 10.00 | 0.08 | (0.12 | ) | (0.07 | ) | 0.00 | $ | 9.89 | ||||||||||||||
| 1 | Total return calculations do not include any sales charges. Returns for periods of less than one year are not annualized. |
| 2 | Portfolio turnover rate is calculated by multiplying the Fund’s ownership percentage in each respective affiliated Master Portfolio by the corresponding affiliated Master Portfolio’s purchases and sales. These purchase and sale amounts are aggregated with the direct purchases and sales in Underlying Funds and unaffiliated securities and included in the portfolio turnover calculation. |
| 3 | Ratios reflect net expenses allocated from the affiliated Master Portfolios which were as follows: |
| Year ended February 29, 2020 | Year ended February 28, 20194 | |||||||
Class A | 0.16 | % | 0.13 | % | ||||
Class C | 0.15 | 0.13 | ||||||
Class R4 | 0.15 | 0.13 | ||||||
Class R6 | 0.17 | 0.14 | ||||||
| 4 | For the nine months ended February 28, 2019. The Fund changed its fiscal year end from May 31 to February 28, effective February 28, 2019. |
| 5 | Ratios do not reflect net expenses allocated from the affiliated Master Portfolios. Including annualized net expenses allocated from the affiliated Master Portfolios, the expense ratios would be increased by the following amounts: |
| Year ended May 31 | ||||||||||||
| 2018 | 2017 | 20166 | ||||||||||
Class A | 0.09 | % | 0.10 | % | 0.10 | % | ||||||
Class C | 0.09 | 0.10 | 0.10 | |||||||||
Class R4 | 0.09 | 0.10 | 0.10 | |||||||||
Class R6 | 0.10 | 0.11 | 0.11 | |||||||||
| 6 | For the period from November 30, 2015 (commencement of class operations) to May 31, 2016 |
| 7 | Calculated based upon average shares outstanding |
The accompanying notes are an integral part of these financial statements.
104 | Target Date Retirement Funds
Table of Contents
Financial highlights
| Ratio to average net assets (annualized) | Portfolio |
Net assets at | ||||||||||||||||||||
| Net investment income | Gross expenses | Net expenses | Total return1 | |||||||||||||||||||
| 1.68 | %3 | 3.82 | %3 | 0.67 | %3 | 0.95 | % | 36 | % | $ | 239 | |||||||||||
| 0.95 | %3 | 4.31 | %3 | 0.61 | %3 | 2.37 | % | 31 | % | $ | 161 | |||||||||||
| 0.89 | % | 4.18 | %5 | 0.54 | %5 | 12.10 | % | 34 | % | $ | 170 | |||||||||||
| 0.90 | % | 4.67 | %5 | 0.54 | %5 | 15.56 | % | 31 | % | $ | 134 | |||||||||||
| 1.21 | % | 5.23 | %5 | 0.54 | %5 | (0.68 | )% | 14 | % | $ | 103 | |||||||||||
| 0.99 | %3 | 4.40 | %3 | 1.42 | %3 | 0.26 | % | 36 | % | $ | 100 | |||||||||||
| 0.18 | %3 | 5.04 | %3 | 1.36 | %3 | 1.77 | % | 31 | % | $ | 100 | |||||||||||
| 0.15 | % | 4.93 | %5 | 1.29 | %5 | 11.25 | % | 34 | % | $ | 121 | |||||||||||
| 0.17 | % | 5.42 | %5 | 1.30 | %5 | 14.68 | % | 31 | % | $ | 113 | |||||||||||
| 0.47 | % | 5.98 | %5 | 1.30 | %5 | (1.05 | )% | 14 | % | $ | 99 | |||||||||||
| 2.04 | %3 | 3.55 | %3 | 0.36 | %3 | 1.24 | % | 36 | % | $ | 101 | |||||||||||
| 1.23 | %3 | 4.02 | %3 | 0.32 | %3 | 2.58 | % | 31 | % | $ | 102 | |||||||||||
| 1.19 | % | 3.90 | %5 | 0.25 | %5 | 12.44 | % | 34 | % | $ | 123 | |||||||||||
| 1.23 | % | 4.39 | %5 | 0.24 | %5 | 15.94 | % | 31 | % | $ | 115 | |||||||||||
| 1.53 | % | 4.95 | %5 | 0.24 | %5 | (0.55 | )% | 14 | % | $ | 99 | |||||||||||
| 2.18 | %3 | 3.41 | %3 | 0.21 | %3 | 1.38 | % | 36 | % | $ | 5,031 | |||||||||||
| 1.38 | %3 | 3.87 | %3 | 0.17 | %3 | 2.70 | % | 31 | % | $ | 4,678 | |||||||||||
| 1.34 | % | 3.75 | %5 | 0.10 | %5 | 12.58 | % | 34 | % | $ | 5,679 | |||||||||||
| 1.38 | % | 4.25 | %5 | 0.09 | %5 | 16.08 | % | 31 | % | $ | 5,305 | |||||||||||
| 1.69 | % | 4.80 | %5 | 0.09 | %5 | (0.43 | )% | 14 | % | $ | 4,579 | |||||||||||
The accompanying notes are an integral part of these financial statements.
Target Date Retirement Funds | 105
Table of Contents
Financial highlights
| Beginning net asset value per share | Net investment income | Net realized and unrealized gains (losses) on investments | Distributions from net investment income | Distributions from net realized gains | Ending net asset value per share | |||||||||||||||||||
Dynamic Target 2060 Fund | ||||||||||||||||||||||||
Class A | ||||||||||||||||||||||||
Year ended February 29, 2020 | $ | 9.74 | 0.17 | 3 | (0.05 | ) | (0.20 | ) | 0.00 | $ | 9.66 | |||||||||||||
Year ended February 28, 20195 | $ | 11.79 | 0.08 | 0.06 | (0.06 | ) | (2.13 | ) | $ | 9.74 | ||||||||||||||
Year ended May 31, 2018 | $ | 11.03 | 0.09 | 1.23 | (0.20 | ) | (0.36 | ) | $ | 11.79 | ||||||||||||||
Year ended May 31, 2017 | $ | 9.88 | 0.09 | 1.39 | (0.09 | ) | (0.24 | ) | $ | 11.03 | ||||||||||||||
Year ended May 31, 20167 | $ | 10.00 | 0.06 | (0.12 | ) | (0.06 | ) | 0.00 | $ | 9.88 | ||||||||||||||
Class C | ||||||||||||||||||||||||
Year ended February 29, 2020 | $ | 9.72 | 0.10 | (0.07 | ) | (0.13 | ) | 0.00 | $ | 9.62 | ||||||||||||||
Year ended February 28, 20195 | $ | 11.76 | 0.02 | 0.07 | 0.00 | (2.13 | ) | $ | 9.72 | |||||||||||||||
Year ended May 31, 2018 | $ | 10.99 | 0.02 | 1.21 | (0.10 | ) | (0.36 | ) | $ | 11.76 | ||||||||||||||
Year ended May 31, 2017 | $ | 9.85 | 0.02 | 1.38 | (0.02 | ) | (0.24 | ) | $ | 10.99 | ||||||||||||||
Year ended May 31, 20167 | $ | 10.00 | 0.02 | (0.12 | ) | (0.05 | ) | 0.00 | $ | 9.85 | ||||||||||||||
Class R4 | ||||||||||||||||||||||||
Year ended February 29, 2020 | $ | 9.79 | 0.21 | (0.06 | ) | (0.21 | ) | 0.00 | $ | 9.73 | ||||||||||||||
Year ended February 28, 20195 | $ | 11.84 | 0.10 | 0.06 | (0.08 | ) | (2.13 | ) | $ | 9.79 | ||||||||||||||
Year ended May 31, 2018 | $ | 11.05 | 0.14 | 1.22 | (0.21 | ) | (0.36 | ) | $ | 11.84 | ||||||||||||||
Year ended May 31, 2017 | $ | 9.89 | 0.13 | 1.39 | (0.12 | ) | (0.24 | ) | $ | 11.05 | ||||||||||||||
Year ended May 31, 20167 | $ | 10.00 | 0.07 | (0.12 | ) | (0.06 | ) | 0.00 | $ | 9.89 | ||||||||||||||
Class R6 | ||||||||||||||||||||||||
Year ended February 29, 2020 | $ | 9.80 | 0.23 | (0.06 | ) | (0.23 | ) | 0.00 | $ | 9.74 | ||||||||||||||
Year ended February 28, 20195 | $ | 11.85 | 0.12 | 0.06 | (0.10 | ) | (2.13 | ) | $ | 9.80 | ||||||||||||||
Year ended May 31, 2018 | $ | 11.06 | 0.16 | 1.22 | (0.23 | ) | (0.36 | ) | $ | 11.85 | ||||||||||||||
Year ended May 31, 2017 | $ | 9.90 | 0.14 | 1.39 | (0.13 | ) | (0.24 | ) | $ | 11.06 | ||||||||||||||
Year ended May 31, 20167 | $ | 10.00 | 0.08 | (0.11 | ) | (0.07 | ) | 0.00 | $ | 9.90 | ||||||||||||||
| 1 | Total return calculations do not include any sales charges. Returns for periods of less than one year are not annualized. |
| 2 | Portfolio turnover rate is calculated by multiplying the Fund’s ownership percentage in each respective affiliated Master Portfolio by the corresponding affiliated Master Portfolio’s purchases and sales. These purchase and sale amounts are aggregated with the direct purchases and sales in Underlying Funds and unaffiliated securities and included in the portfolio turnover calculation. |
| 3 | Calculated based upon average shares outstanding |
| 4 | Ratios reflect net expenses allocated from the affiliated Master Portfolios which were as follows: |
| Year ended February 29, 2020 | Year ended February 28, 20195 | |||||||
Class A | 0.16 | % | 0.14 | % | ||||
Class C | 0.15 | 0.13 | ||||||
Class R4 | 0.15 | 0.13 | ||||||
Class R6 | 0.17 | 0.14 | ||||||
| 5 | For the nine months ended February 28, 2019. The Fund changed its fiscal year end from May 31 to February 28, effective February 28, 2019. |
| 6 | Ratios do not reflect net expenses allocated from the affiliated Master Portfolios. Including annualized net expenses allocated from the affiliated Master Portfolios, the expense ratios would be increased by the following amounts: |
| Year ended May 31 | ||||||||||||
| 2018 | 2017 | 20167 | ||||||||||
Class A | 0.09 | % | 0.10 | % | 0.10 | % | ||||||
Class C | 0.09 | 0.10 | 0.10 | |||||||||
Class R4 | 0.09 | 0.10 | 0.10 | |||||||||
Class R6 | 0.10 | 0.11 | 0.11 | |||||||||
| 7 | For the period from November 30, 2015 (commencement of class operations) to May 31, 2016 |
The accompanying notes are an integral part of these financial statements.
106 | Target Date Retirement Funds
Table of Contents
Financial highlights
| Ratio to average net assets (annualized) | Portfolio |
Net assets at | ||||||||||||||||||||
| Net investment income | Gross expenses | Net expenses | Total return1 | |||||||||||||||||||
| 1.67 | %4 | 3.64 | %4 | 0.66 | %4 | 1.01 | % | 36 | % | $ | 345 | |||||||||||
| 0.97 | %4 | 4.30 | %4 | 0.59 | %4 | 2.40 | % | 31 | % | $ | 290 | |||||||||||
| 1.03 | % | 4.22 | %6 | 0.53 | %6 | 12.12 | % | 36 | % | $ | 261 | |||||||||||
| 0.92 | % | 4.80 | %6 | 0.55 | %6 | 15.57 | % | 30 | % | $ | 127 | |||||||||||
| 1.22 | % | 5.24 | %6 | 0.55 | %6 | (0.58 | )% | 14 | % | $ | 101 | |||||||||||
| 0.99 | %4 | 4.22 | %4 | 1.42 | %4 | 0.16 | % | 36 | % | $ | 99 | |||||||||||
| 0.20 | %4 | 5.04 | %4 | 1.35 | %4 | 1.89 | % | 31 | % | $ | 100 | |||||||||||
| 0.15 | % | 4.99 | %6 | 1.29 | %6 | 11.28 | % | 36 | % | $ | 121 | |||||||||||
| 0.17 | % | 5.55 | %6 | 1.30 | %6 | 14.69 | % | 30 | % | $ | 113 | |||||||||||
| 0.48 | % | 5.99 | %6 | 1.30 | %6 | (0.94 | )% | 14 | % | $ | 99 | |||||||||||
| 2.05 | %4 | 3.37 | %4 | 0.36 | %4 | 1.34 | % | 36 | % | $ | 101 | |||||||||||
| 1.25 | %4 | 4.01 | %4 | 0.30 | %4 | 2.60 | % | 31 | % | $ | 102 | |||||||||||
| 1.19 | % | 3.96 | %6 | 0.25 | %6 | 12.46 | % | 36 | % | $ | 123 | |||||||||||
| 1.23 | % | 4.52 | %6 | 0.24 | %6 | 15.94 | % | 30 | % | $ | 115 | |||||||||||
| 1.53 | % | 4.96 | %6 | 0.24 | %6 | (0.45 | )% | 14 | % | $ | 100 | |||||||||||
| 2.20 | %4 | 3.23 | %4 | 0.21 | %4 | 1.48 | % | 36 | % | $ | 4,685 | |||||||||||
| 1.40 | %4 | 3.87 | %4 | 0.15 | %4 | 2.78 | % | 31 | % | $ | 4,706 | |||||||||||
| 1.35 | % | 3.81 | %6 | 0.10 | %6 | 12.60 | % | 36 | % | $ | 5,692 | |||||||||||
| 1.39 | % | 4.37 | %6 | 0.09 | %6 | 16.09 | % | 30 | % | $ | 5,312 | |||||||||||
| 1.69 | % | 4.81 | %6 | 0.09 | %6 | (0.33 | )% | 14 | % | $ | 4,584 | |||||||||||
The accompanying notes are an integral part of these financial statements.
Target Date Retirement Funds | 107
Table of Contents
1. ORGANIZATION
Wells Fargo Funds Trust (the “Trust”), a Delaware statutory trust organized on March 10, 1999, is anopen-end management investment company registered under the Investment Company Act of 1940, as amended (the “1940 Act”). As an investment company, the Trust follows the accounting and reporting guidance in Financial Accounting Standards Board Accounting Standards Codification Topic 946, Financial Services – Investment Companies. These financial statements report on the following funds: Wells Fargo Dynamic Target Today Fund (“Dynamic Target Today Fund”), Wells Fargo Dynamic Target 2015 Fund (“Dynamic Target 2015 Fund”), Wells Fargo Dynamic Target 2020 Fund (“Dynamic Target 2020 Fund”), Wells Fargo Dynamic Target 2025 Fund (“Dynamic Target 2025 Fund”), Wells Fargo Dynamic Target 2030 Fund (“Dynamic Target 2030 Fund”), Wells Fargo Dynamic Target 2035 Fund (“Dynamic Target 2035 Fund”), Wells Fargo Dynamic Target 2040 Fund (“Dynamic Target 2040 Fund”), Wells Fargo Dynamic Target 2045 Fund (“Dynamic Target 2045 Fund”), Wells Fargo Dynamic Target 2050 Fund (“Dynamic Target 2050 Fund”), Wells Fargo Dynamic Target 2055 Fund (“Dynamic Target 2055 Fund”), and Wells Fargo Dynamic Target 2060 Fund (“Dynamic Target 2060 Fund”) (each, a “Fund”, collectively, the “Funds”). Each Fund is a diversified series of the Trust.
Effective at the close of business on November 13, 2017, Class R shares were liquidated and the class was subsequently closed. Class R shares are no longer offered by the Funds. Information for Class R shares reflected in the financial statements represents activity through November 13, 2017.
Each Fund is afund-of-funds which seeks to achieve its investment objective by investing in multiple diversified portfolios (collectively, the “affiliated Master Portfolios”) of Wells Fargo Master Trust, a registeredopen-end management investment company. Each affiliated Master Portfolio directly acquires portfolio securities, and a Fund investing in an affiliated Master Portfolio acquires an indirect interest in those securities. Each Fund accounts for its investment in the affiliated Master Portfolios as partnership investments and records on a daily basis its share of each affiliated Master Portfolio’s income, expense and realized and unrealized gains and losses. The financial statements of the affiliated Master Portfolios are presented in separate financial statements and may be obtained free of charge by contacting Investor Services or by visiting the SEC website at sec.gov. The financial statements of the affiliated Master Portfolios are filed with the SEC under Wells Fargo Master Trust.
Prior to September 21, 2018, each Fund invested in various affiliated mutual funds, unaffiliated mutual funds and exchange-traded funds (collectively, the “Underlying Funds”) to pursue its investment objective. Subsequent to September 21, 2018, each Fund invests solely in affiliated Master Portfolios.
2. SIGNIFICANT ACCOUNTING POLICIES
The following significant accounting policies, which are consistently followed in the preparation of the financial statements of each Fund, are in conformity with U.S. generally accepted accounting principles which require management to make estimates and assumptions that affect the reported amounts of assets and liabilities, disclosure of contingent assets and liabilities at the date of the financial statements, and the reported amounts of revenues and expenses during the reporting period. Actual results could differ from those estimates.
Securities valuation
All investments are valued each business day as of the close of regular trading on the New York Stock Exchange (generally 4 p.m. Eastern Time), although the Funds may deviate from this calculation time under unusual or unexpected circumstances.
Investments in the affiliated Master Portfolios are valued daily based on each Fund’s proportionate share of each affiliated Master Portfolio’s net assets, which are also valued daily.
Investments in underlying mutual funds were valued at net asset per share as reported by the Underlying Funds as of the close of the regular trading on New York Stock Exchange on each day the exchange was open for trading.
Equity securities and futures contracts that are listed on a foreign or domestic exchange or market are valued at the official closing price or, if none, the last sales price. If no sale occurs on the principal exchange or market that day, a fair value price will be determined in accordance with the Funds’ Valuation Procedures.
Debt securities are valued at the evaluated bid price provided by an independent pricing service (e.g. taking into account various factors, including yields, maturities, or credit ratings) or, if a reliable price is not available, the quoted bid price from an independent broker-dealer.
Investments which are not valued using the methods discussed above are valued at their fair value, as determined in good faith by the Board of Trustees of the Funds. The Board of Trustees has established a Valuation Committee comprised of the Trustees and has delegated to it the authority to take any actions regarding the valuation of portfolio securities that the Valuation Committee deems necessary or appropriate, including determining the fair value of portfolio securities, unless the determination has been
108 | Target Date Retirement Funds
Table of Contents
Notes to financial statements
delegated to the Wells Fargo Asset Management Pricing Committee at Wells Fargo Funds Management, LLC (“Funds Management”). The Board of Trustees retains the authority to make or ratify any valuation decisions or approve any changes to the Valuation Procedures as it deems appropriate. On a quarterly basis, the Board of Trustees receives reports on any valuation actions taken by the Valuation Committee or the Wells Fargo Asset Management Pricing Committee which may include items for ratification.
Futures contracts
Futures contracts are agreements between each Fund and a counterparty to buy or sell a specific amount of a commodity, financial instrument or currency at a specified price and on a specified date. A Fund may buy and sell futures contracts in order to gain exposure to, or protect against, changes in interest rates, security values, and foreign exchange rates and is subject to interest rate risk, equity price risk, and foreign currency risk. The primary risks associated with the use of futures contracts are the imperfect correlation between changes in market values of securities held by the Fund and the prices of futures contracts, and the possibility of an illiquid market. Futures contracts are generally entered into on a regulated futures exchange and cleared through a clearinghouse associated with the exchange. With futures contracts, there is minimal counterparty risk to the Fund since futures contracts are exchange traded and the exchange’s clearinghouse, as the counterparty to all exchange traded futures, guarantees the futures contracts against default.
Upon entering into a futures contracts, the Fund is required to deposit either cash or securities (initial margin) with the broker in an amount equal to a certain percentage of the contract value. Subsequent payments (variation margin) are paid to or from the broker each day equal to the daily changes in the contract value. Such payments are recorded as unrealized gains or losses and, if any, shown as variation margin receivable (payable) in the Statements of Assets and Liabilities. Should the Fund fail to make requested variation margin payments, the broker can gain access to the initial margin to satisfy the Fund’s payment obligations. When the contracts are closed, a realized gain or loss is recorded in the Statements of Operations.
Security transactions and income recognition
Securities transactions are recorded on a trade date basis. Realized gains or losses are recorded on the basis of identified cost.
Each Fund records on a daily basis its proportionate share of each affiliated Master Portfolio’s interest and dividend income, in addition to expenses and realized and unrealized gains and losses. Income from foreign securities in each affiliated Master Portfolio is recorded net of foreign taxes withheld where recovery of such taxes is not assured.
Interest income is accrued daily and bond discounts are accreted and premiums are amortized daily. To the extent debt obligations are placed onnon-accrual status, any related interest income may be reduced by writing off interest receivables when the collection of all or a portion of interest has been determined to be doubtful based on consistently applied procedures and the fair value has decreased. If the issuer subsequently resumes interest payments or when the collectability of interest is reasonably assured, the debt obligation is removed fromnon-accrual status.
Distributions to shareholders
Distributions to shareholders from net investment income and any net realized gains are recorded on theex-dividend date and paid at least annually. Such distributions are determined in accordance with income tax regulations and may differ from U.S. generally accepted accounting principles. Dividend sources are estimated at the time of declaration. The tax character of distributions is determined as of each Fund’s fiscal year end. Therefore, a portion of each Fund’s distributions made prior to the Fund’s fiscal year end may be categorized as a tax return of capital at year end.
Federal and other taxes
Each Fund is treated as a separate entity for federal income tax purposes. Each Fund intends to continue to qualify as a regulated investment company by distributing substantially all of its investment company taxable income and any net realized capital gains (after reduction for capital loss carryforwards) sufficient to relieve it from all, or substantially all, federal income taxes. Accordingly, no provision for federal income taxes was required.
Each Fund’s income and federal excise tax returns and all financial records supporting those returns for the prior three fiscal years are subject to examination by the federal and Delaware revenue authorities. Management has analyzed each Fund’s tax positions taken on federal, state, and foreign tax returns for all open tax years and does not believe that there are any uncertain tax positions that require recognition of a tax liability.
Target Date Retirement Funds | 109
Table of Contents
Notes to financial statements
As of February 29, 2020, the aggregate cost of all investments for federal income tax purposes and the unrealized gains (losses) were as follows:
| Tax cost | Gross unrealized gains | Gross unrealized losses | Net unrealized gains | |||||||||||||
Dynamic Target Today Fund | $ | 6,585,185 | $ | 309,196 | $ | 0 | $ | 309,196 | ||||||||
Dynamic Target 2015 Fund | 5,393,091 | 314,231 | 0 | 314,231 | ||||||||||||
Dynamic Target 2020 Fund | 6,548,187 | 297,211 | 0 | 297,211 | ||||||||||||
Dynamic Target 2025 Fund | 9,568,473 | 338,082 | 0 | 338,082 | ||||||||||||
Dynamic Target 2030 Fund | 7,842,361 | 319,808 | 0 | 319,808 | ||||||||||||
Dynamic Target 2035 Fund | 7,632,143 | 271,702 | 0 | 271,702 | ||||||||||||
Dynamic Target 2040 Fund | 6,854,110 | 239,417 | 0 | 239,417 | ||||||||||||
Dynamic Target 2045 Fund | 5,912,765 | 260,698 | 0 | 260,698 | ||||||||||||
Dynamic Target 2050 Fund | 5,191,985 | 253,666 | 0 | 253,666 | ||||||||||||
Dynamic Target 2055 Fund | 5,317,078 | 246,660 | 0 | 246,660 | ||||||||||||
Dynamic Target 2060 Fund | 5,065,128 | 264,456 | 0 | 264,456 | ||||||||||||
Reclassifications are made to each Fund’s capital accounts for permanent tax differences to reflect income and gains available for distribution (or available capital loss carryforwards) under federal income tax regulations. U.S. generally accepted accounting principles require that certain components of net assets be adjusted to reflect permanent differences between financial and tax reporting. These reclassifications have no effect on net assets or net asset values per share. At February 29, 2020, as a result of permanentbook-to-tax differences, the following reclassification adjustments were made on the Statements of Assets and Liabilities:
| Paid-in capital | Total distributable earnings (loss) | |||||||
Dynamic Target Today Fund | $ | 686 | $ | (686 | ) | |||
Dynamic Target 2015 Fund | 692 | (692 | ) | |||||
Dynamic Target 2020 Fund | 591 | (591 | ) | |||||
Dynamic Target 2025 Fund | 1,140 | (1,140 | ) | |||||
Dynamic Target 2030 Fund | 576 | (576 | ) | |||||
Dynamic Target 2035 Fund | 468 | (468 | ) | |||||
Dynamic Target 2040 Fund | 334 | (334 | ) | |||||
Dynamic Target 2045 Fund | 160 | (160 | ) | |||||
Dynamic Target 2050 Fund | 63 | (63 | ) | |||||
Dynamic Target 2055 Fund | 233 | (233 | ) | |||||
Dynamic Target 2060 Fund | 213 | (213 | ) | |||||
110 | Target Date Retirement Funds
Table of Contents
Notes to financial statements
As of February 29, 2020, capital loss carryforwards available to offset future net realized capital gains were as follows for the following Funds:
| No expiration | ||||||||
| Short-term | Long-term | |||||||
Dynamic Target 2015 Fund | $ | 12,393 | $ | 4,477 | ||||
Dynamic Target 2020 Fund | 26,761 | 6,147 | ||||||
Dynamic Target 2025 Fund | 67,479 | 42,970 | ||||||
Dynamic Target 2030 Fund | 81,442 | 76,233 | ||||||
Dynamic Target 2035 Fund | 91,331 | 86,512 | ||||||
Dynamic Target 2040 Fund | 103,861 | 104,885 | ||||||
Dynamic Target 2045 Fund | 121,634 | 122,217 | ||||||
Dynamic Target 2050 Fund | 131,673 | 137,647 | ||||||
Dynamic Target 2055 Fund | 130,423 | 135,536 | ||||||
Dynamic Target 2060 Fund | 133,023 | 138,979 | ||||||
Class allocations
The separate classes of shares offered by each Fund differ principally in applicable sales charges, distribution, shareholder servicing, and administration fees. Class specific expenses are charged directly to that share class. Investment income, common fund-level expenses, and realized and unrealized gains (losses) on investments are allocated daily to each class of shares based on the relative proportion of net assets of each class.
3. FAIR VALUATION MEASUREMENTS
Fair value measurements of investments are determined within a framework that has established a fair value hierarchy based
upon the various data inputs utilized in determining the value of each Fund’s investments. The three-level hierarchy gives the
highest priority to unadjusted quoted prices in active markets for identical assets or liabilities (Level 1) and the lowest priority to unobservable inputs (Level 3). Each Fund’s investments are classified within the fair value hierarchy based on the lowest level of input that is significant to the fair value measurement. The inputs are summarized into three broad levels as follows:
| ∎ | Level 1 – quoted prices in active markets for identical securities |
| ∎ | Level 2 – other significant observable inputs (including quoted prices for similar securities, interest rates, prepayment speeds, credit risk, etc.) |
| ∎ | Level 3 – significant unobservable inputs (including the Fund’s own assumptions in determining the fair value of investments) |
The inputs or methodologies used for valuing investments in securities are not necessarily an indication of the risk associated with investing in those securities.
Target Date Retirement Funds | 111
Table of Contents
Notes to financial statements
The following is a summary of the inputs used in valuing each Fund’s assets and liabilities as of February 29, 2020:
| Dynamic Target Today Fund | Quoted prices (Level 1) | Other significant observable inputs (Level 2) | Significant (Level 3) | Total | ||||||||||||
Assets | ||||||||||||||||
Investments in: | ||||||||||||||||
Short-term investments | ||||||||||||||||
U.S. Treasury securities | $ | 15,993 | $ | 0 | $ | 0 | $ | 15,993 | ||||||||
Investments measured at net asset value* | 6,851,530 | |||||||||||||||
| 15,993 | 0 | 0 | 6,867,523 | |||||||||||||
Futures contracts | 26,858 | 0 | 0 | 26,858 | ||||||||||||
Total assets | $ | 42,851 | $ | 0 | $ | 0 | $ | 6,894,381 | ||||||||
| * | Investments that are measured at fair value using the net asset value per share (or its equivalent) as a practical expedient have not been categorized in the fair value hierarchy. The fair value amount presented in the table is intended to permit reconciliation of the fair value hierarchy to the amounts presented in the Statements of Assets and Liabilities. The Fund’s investments in the affiliated Master Portfolios are valued at $6,851,530. Each affiliated Master Portfolio does not have a redemption period notice, can be redeemed daily and does not have any unfunded commitments. |
Dynamic Target 2015 Fund | Quoted prices (Level 1) | Other significant observable inputs (Level 2) | Significant (Level 3) | Total | ||||||||||||
Assets | ||||||||||||||||
Investments in: | ||||||||||||||||
Short-term investments | ||||||||||||||||
U.S. Treasury securities | $ | 15,993 | $ | 0 | $ | 0 | $ | 15,993 | ||||||||
Investments measured at net asset value* | 5,664,471 | |||||||||||||||
| 15,993 | 0 | 0 | 5,680,464 | |||||||||||||
Futures contracts | 26,858 | 0 | 0 | 26,858 | ||||||||||||
Total assets | $ | 42,851 | $ | 0 | $ | 0 | $ | 5,707,322 | ||||||||
| * | Investments that are measured at fair value using the net asset value per share (or its equivalent) as a practical expedient have not been categorized in the fair value hierarchy. The fair value amount presented in the table is intended to permit reconciliation of the fair value hierarchy to the amounts presented in the Statements of Assets and Liabilities. The Fund’s investments in the affiliated Master Portfolios are valued at $5,664,471. Each affiliated Master Portfolio does not have a redemption period notice, can be redeemed daily and does not have any unfunded commitments. |
| Dynamic Target 2020 Fund | Quoted prices (Level 1) | Other significant observable inputs (Level 2) | Significant (Level 3) | Total | ||||||||||||
Assets | ||||||||||||||||
Investments in: | ||||||||||||||||
Short-term investments | ||||||||||||||||
U.S. Treasury securities | $ | 17,992 | $ | 0 | $ | 0 | $ | 17,992 | ||||||||
Investments measured at net asset value* | 6,798,440 | |||||||||||||||
| 17,992 | 0 | 0 | 6,816,432 | |||||||||||||
Futures contracts | 28,966 | 0 | 0 | 28,966 | ||||||||||||
Total assets | $ | 46,958 | $ | 0 | $ | 0 | $ | 6,845,398 | ||||||||
| * | Investments that are measured at fair value using the net asset value per share (or its equivalent) as a practical expedient have not been categorized in the fair value hierarchy. The fair value amount presented in the table is intended to permit reconciliation of the fair value hierarchy to the amounts presented in the Statements of Assets and Liabilities. The Fund’s investments in the affiliated Master Portfolios are valued at $6,798,440. Each affiliated Master Portfolio does not have a redemption period notice, can be redeemed daily and does not have any unfunded commitments. |
112 | Target Date Retirement Funds
Table of Contents
Notes to financial statements
| Dynamic Target 2025 Fund | Quoted prices (Level 1) | Other significant observable inputs (Level 2) | Significant (Level 3) | Total | ||||||||||||
Assets | ||||||||||||||||
Investments in: | ||||||||||||||||
Short-term investments | ||||||||||||||||
U.S. Treasury securities | $ | 32,986 | $ | 0 | $ | 0 | $ | 32,986 | ||||||||
Investments measured at net asset value* | 9,824,649 | |||||||||||||||
| 32,986 | 0 | 0 | 9,857,635 | |||||||||||||
Futures contracts | 48,920 | 0 | 0 | 48,920 | ||||||||||||
Total assets | $ | 81,906 | $ | 0 | $ | 0 | $ | 9,906,555 | ||||||||
| * | Investments that are measured at fair value using the net asset value per share (or its equivalent) as a practical expedient have not been categorized in the fair value hierarchy. The fair value amount presented in the table is intended to permit reconciliation of the fair value hierarchy to the amounts presented in the Statements of Assets and Liabilities. The Fund’s investments in the affiliated Master Portfolios are valued at $9,824,649. Each affiliated Master Portfolio does not have a redemption period notice, can be redeemed daily and does not have any unfunded commitments. |
| Dynamic Target 2030 Fund | Quoted prices (Level 1) | Other significant observable inputs (Level 2) | Significant (Level 3) | Total | ||||||||||||
Assets | ||||||||||||||||
Investments in: | ||||||||||||||||
Short-term investments | ||||||||||||||||
U.S. Treasury securities | $ | 28,988 | $ | 0 | $ | 0 | $ | 28,988 | ||||||||
Investments measured at net asset value* | 8,088,760 | |||||||||||||||
| 28,988 | 0 | 0 | 8,117,748 | |||||||||||||
Futures contracts | 44,421 | 0 | 0 | 44,421 | ||||||||||||
Total assets | $ | 73,409 | $ | 0 | $ | 0 | $ | 8,162,169 | ||||||||
| * | Investments that are measured at fair value using the net asset value per share (or its equivalent) as a practical expedient have not been categorized in the fair value hierarchy. The fair value amount presented in the table is intended to permit reconciliation of the fair value hierarchy to the amounts presented in the Statements of Assets and Liabilities. The Fund’s investments in the affiliated Master Portfolios are valued at $8,088,760. Each affiliated Master Portfolio does not have a redemption period notice, can be redeemed daily and does not have any unfunded commitments. |
| Dynamic Target 2035 Fund | Quoted prices (Level 1) | Other significant observable inputs (Level 2) | Significant (Level 3) | Total | ||||||||||||
Assets | ||||||||||||||||
Investments in: | ||||||||||||||||
Short-term investments | ||||||||||||||||
U.S. Treasury securities | $ | 32,986 | $ | 0 | $ | 0 | $ | 32,986 | ||||||||
Investments measured at net asset value* | 7,828,493 | |||||||||||||||
| 32,986 | 0 | 0 | 7,861,479 | |||||||||||||
Futures contracts | 42,366 | 0 | 0 | 42,366 | ||||||||||||
Total assets | $ | 75,352 | $ | 0 | $ | 0 | $ | 7,903,845 | ||||||||
| * | Investments that are measured at fair value using the net asset value per share (or its equivalent) as a practical expedient have not been categorized in the fair value hierarchy. The fair value amount presented in the table is intended to permit reconciliation of the fair value hierarchy to the amounts presented in the Statements of Assets and Liabilities. The Fund’s investments in the affiliated Master Portfolios are valued at $7,828,493. Each affiliated Master Portfolio does not have a redemption period notice, can be redeemed daily and does not have any unfunded commitments. |
Target Date Retirement Funds | 113
Table of Contents
Notes to financial statements
| Dynamic Target 2040 Fund | Quoted prices (Level 1) | Other significant observable inputs (Level 2) | Significant (Level 3) | Total | ||||||||||||
Assets | ||||||||||||||||
Investments in: | ||||||||||||||||
Short-term investments | ||||||||||||||||
U.S. Treasury securities | $ | 28,988 | $ | 0 | $ | 0 | $ | 28,988 | ||||||||
Investments measured at net asset value* | 7,020,118 | |||||||||||||||
| 28,988 | 0 | 0 | 7,049,106 | |||||||||||||
Futures contracts | 44,421 | 0 | 0 | 44,421 | ||||||||||||
Total assets | $ | 73,409 | $ | 0 | $ | 0 | $ | 7,093,527 | ||||||||
| * | Investments that are measured at fair value using the net asset value per share (or its equivalent) as a practical expedient have not been categorized in the fair value hierarchy. The fair value amount presented in the table is intended to permit reconciliation of the fair value hierarchy to the amounts presented in the Statements of Assets and Liabilities. The Fund’s investments in the affiliated Master Portfolios are valued at $7,020,118. Each affiliated Master Portfolio does not have a redemption period notice, can be redeemed daily and does not have any unfunded commitments. |
| Dynamic Target 2045 Fund | Quoted prices (Level 1) | Other significant observable inputs (Level 2) | Significant (Level 3) | Total | ||||||||||||
Assets | ||||||||||||||||
Investments in: | ||||||||||||||||
Short-term investments | ||||||||||||||||
U.S. Treasury securities | $ | 17,992 | $ | 0 | $ | 0 | $ | 17,992 | ||||||||
Investments measured at net asset value* | 6,128,708 | |||||||||||||||
| 17,992 | 0 | 0 | 6,146,700 | |||||||||||||
Futures contracts | 26,763 | 0 | 0 | 26,763 | ||||||||||||
Total assets | $ | 44,755 | $ | 0 | $ | 0 | $ | 6,173,463 | ||||||||
| * | Investments that are measured at fair value using the net asset value per share (or its equivalent) as a practical expedient have not been categorized in the fair value hierarchy. The fair value amount presented in the table is intended to permit reconciliation of the fair value hierarchy to the amounts presented in the Statements of Assets and Liabilities. The Fund’s investments in the affiliated Master Portfolios are valued at $6,128,708. Each affiliated Master Portfolio does not have a redemption period notice, can be redeemed daily and does not have any unfunded commitments. |
| Dynamic Target 2050 Fund | Quoted prices (Level 1) | Other significant observable inputs (Level 2) | Significant (Level 3) | Total | ||||||||||||
Assets | ||||||||||||||||
Investments in: | ||||||||||||||||
Short-term investments | ||||||||||||||||
U.S. Treasury securities | $ | 11,995 | $ | 0 | $ | 0 | $ | 11,995 | ||||||||
Investments measured at net asset value* | 5,419,530 | |||||||||||||||
| 11,995 | 0 | 0 | 5,431,525 | |||||||||||||
Futures contracts | 14,126 | 0 | 0 | 14,126 | ||||||||||||
Total assets | $ | 26,121 | $ | 0 | $ | 0 | $ | 5,445,651 | ||||||||
| * | Investments that are measured at fair value using the net asset value per share (or its equivalent) as a practical expedient have not been categorized in the fair value hierarchy. The fair value amount presented in the table is intended to permit reconciliation of the fair value hierarchy to the amounts presented in the Statements of Assets and Liabilities. The Fund’s investments in the affiliated Master Portfolios are valued at $5,419,530. Each affiliated Master Portfolio does not have a redemption period notice, can be redeemed daily and does not have any unfunded commitments. |
114 | Target Date Retirement Funds
Table of Contents
Notes to financial statements
| Dynamic Target 2055 Fund | Quoted prices (Level 1) | Other significant observable inputs (Level 2) | Significant (Level 3) | Total | ||||||||||||
Assets | ||||||||||||||||
Investments in: | ||||||||||||||||
Short-term investments | ||||||||||||||||
U.S. Treasury securities | $ | 11,995 | $ | 0 | $ | 0 | $ | 11,995 | ||||||||
Investments measured at net asset value* | 5,537,617 | |||||||||||||||
| 11,995 | 0 | 0 | 5,549,612 | |||||||||||||
Futures contracts | 14,126 | 0 | 0 | 14,126 | ||||||||||||
Total assets | $ | 26,121 | $ | 0 | $ | 0 | $ | 5,563,738 | ||||||||
| * | Investments that are measured at fair value using the net asset value per share (or its equivalent) as a practical expedient have not been categorized in the fair value hierarchy. The fair value amount presented in the table is intended to permit reconciliation of the fair value hierarchy to the amounts presented in the Statements of Assets and Liabilities. The Fund’s investments in the affiliated Master Portfolios are valued at $5,537,617. Each affiliated Master Portfolio does not have a redemption period notice, can be redeemed daily and does not have any unfunded commitments. |
| Dynamic Target 2060 Fund | Quoted prices (Level 1) | Other significant observable inputs (Level 2) | Significant (Level 3) | Total | ||||||||||||
Assets | ||||||||||||||||
Investments in: | ||||||||||||||||
Short-term investments | ||||||||||||||||
U.S. Treasury securities | $ | 11,995 | $ | 0 | $ | 0 | $ | 11,995 | ||||||||
Investments measured at net asset value* | 5,303,463 | |||||||||||||||
| 11,995 | 0 | 0 | 5,315,458 | |||||||||||||
Futures contracts | 14,126 | 0 | 0 | 14,126 | ||||||||||||
Total assets | $ | 26,121 | $ | 0 | $ | 0 | $ | 5,329,584 | ||||||||
| * | Investments that are measured at fair value using the net asset value per share (or its equivalent) as a practical expedient have not been categorized in the fair value hierarchy. The fair value amount presented in the table is intended to permit reconciliation of the fair value hierarchy to the amounts presented in the Statements of Assets and Liabilities. The Fund’s investments in the affiliated Master Portfolios are valued at $5,303,463. Each affiliated Master Portfolio does not have a redemption period notice, can be redeemed daily and does not have any unfunded commitments. |
Futures contracts are reported at their cumulative unrealized gains (losses) at measurement date as reported in the table following each Portfolio of Investments. For futures contracts, the current day’s variation margin is reported on the Statements of Assets and Liabilities. All other assets and liabilities are reported at their market value at measurement date.
For the year ended February 29, 2020, the Funds did not have any transfers into/out of Level 3.
Target Date Retirement Funds | 115
Table of Contents
Notes to financial statements
The investment objective of each affiliated Master Portfolio is as follows:
| Affiliated Master Portfolio | Investment objective | |
Wells Fargo Bloomberg Barclays US Aggregateex-Corporate Portfolio | Seeks to replicate the total return of the Bloomberg Barclays U.S. Aggregateex-Corporate Index, before fees and expenses | |
Wells Fargo Emerging Markets Bond Portfolio | Seeks to replicate the total return of the JP Morgan EMBI Global Diversified Index, before fees and expenses | |
Wells Fargo Factor Enhanced Emerging Markets Portfolio | Seeks to replicate the total return of the Wells Fargo Factor Enhanced Emerging Markets Index (Net), before fees and expenses | |
Wells Fargo Factor Enhanced International Portfolio | Seeks to replicate the total return of the Wells Fargo Factor Enhanced International Index (Net), before fees and expenses | |
Wells Fargo Factor Enhanced Large Cap Portfolio | Seeks to replicate the total return of the Wells Fargo Factor Enhanced Large Cap Index, before fees and expenses | |
Wells Fargo Factor Enhanced Small Cap Portfolio | Seeks to replicate the total return of the Wells Fargo Factor Enhanced Small Cap Index, before fees and expenses | |
Wells Fargo High Yield Corporate Bond Portfolio | Seeks to replicate the total return of the Wells Fargo U.S. High Yield Bond Index, before fees and expenses | |
Wells Fargo Investment Grade Corporate Bond Portfolio | Seeks to replicate the total return of the Wells Fargo U.S. Investment Grade Corporate Bond Index, before fees and expenses | |
Wells Fargo Strategic Retirement Bond Portfolio | Seeks to replicate the total return of a blended index that is weighted 50% to the Bloomberg Barclays U.S. Treasury Inflation-Linked1-10 Year Bond Index and 50% to the Bloomberg Barclays U.S. Intermediate Government Bond Index, before fees and expenses | |
Wells Fargo U.S. REIT Portfolio | Seeks to replicate the total return of the Wells Fargo U.S. REIT Index, before fees and expenses | |
4. TRANSACTIONS WITH AFFILIATES
Management fee
Funds Management, an indirect wholly owned subsidiary of Wells Fargo & Company (“Wells Fargo”), is the manager of each Fund and provides advisory and fund-level administrative services under an investment management agreement. Under the investment management agreement, Funds Management is responsible for, among other services, implementing the investment objectives and strategies of each Fund, supervising the subadviser and providing fund-level administrative services in connection with each Fund’s operations. As compensation for its services under the investment management agreement, Funds Management is entitled to receive a management fee at the following annual rate based on each Fund’s average daily net assets:
| Average daily net assets | Management fee | |||
First $5 billion | 0.15 | % | ||
Next $5 billion | 0.14 | |||
Over $10 billion | 0.13 | |||
For the year ended February 29, 2020, the management fee was equivalent to an annual rate of 0.15% of each Fund’s average daily net assets.
Funds Management has retained the services of a subadviser to provide daily portfolio management to the Funds. The fee for subadvisory services is borne by Funds Management. Wells Capital Management Incorporated, an affiliate of Funds Management and an indirect wholly owned subsidiary of Wells Fargo, is the subadviser to each Fund and is entitled to receive a fee from Funds Management at an annual rate starting at 0.10% and declining to 0.06% as the average daily net assets of each Fund increase.
Funds Management also serves as the adviser to each affiliated Master Portfolio and is entitled to receive a fee from each affiliated Master Portfolio for those services.
116 | Target Date Retirement Funds
Table of Contents
Notes to financial statements
Administration fees
Under a class-level administration agreement, Funds Management provides class-level administrative services to each Fund, which includes paying fees and expenses for services provided by the transfer agent,sub-transfer agents, omnibus account servicers and record-keepers. As compensation for its services under the class-level administration agreement, Funds Management receives an annual fee which is calculated based on the average daily net assets of each class as follows:
| Class-level administration fee | ||||
Class A, Class C | 0.21 | % | ||
Class R4 | 0.08 | |||
Class R6 | 0.03 | |||
Waivers and/or expense reimbursements
Funds Management has contractually waived and/or reimbursed management and administration fees to the extent necessary to maintain certain net operating expense ratios for each Fund. When each class of a Fund has exceeded its expense cap, Funds Management has waived fees and/or reimbursed expenses from fund-level expenses on a proportionate basis and then from class specific expenses. When only certain classes exceed their expense caps, waivers and/or reimbursements are applied against class specific expenses before fund-level expenses. Net expenses from the affiliated Master Portfolios are included in the expense caps. Funds Management has committed through June 30, 2020 to waive fees and/or reimburse expenses to the extent necessary to cap each Fund’s expenses at 0.68% for Class A shares, 1.43% for Class C shares, 0.37% for Class R4 shares, and 0.22% for Class R6 shares. Prior to or after the commitment expiration date, the cap may be increased or the commitment to maintain the cap may be terminated only with the approval of the Board of Trustees.
Distribution fee
The Trust has adopted a Distribution Plan for Class C shares of each Fund pursuant to Rule12b-1 under the 1940 Act. A distribution fee is charged to the Class C shares and paid to Wells Fargo Funds Distributor, LLC (“Funds Distributor”), the principal underwriter of each Fund, at an annual rate of 0.75% of the average daily net assets of Class C shares.
In addition, Funds Distributor is entitled to receive thefront-end sales charge from the purchase of Class A shares and a contingent deferred sales charge on the redemption of certain Class A shares. Funds Distributor is also entitled to receive the contingent deferred sales charges from redemptions of Class C shares. For the year ended February 29, 2020, Funds Distributor receivedfront-end sales charges and contingent deferred sales charges from the Funds as follows:
| Front-end sales charges | Contingent deferred sales charges | |||||||
| Class A | Class C | |||||||
Dynamic Target 2020 Fund | $ | 301 | $ | 0 | ||||
Dynamic Target 2025 Fund | 10 | 0 | ||||||
Dynamic Target 2030 Fund | 13 | 0 | ||||||
Dynamic Target 2035 Fund | 50 | 0 | ||||||
Dynamic Target 2040 Fund | 31 | 0 | ||||||
Dynamic Target 2050 Fund | 12 | 17 | ||||||
Dynamic Target 2055 Fund | 14 | 0 | ||||||
Dynamic Target 2060 Fund | 52 | 0 | ||||||
For the year ended February 29, 2020, the Funds did not received any contingent deferred sales charges on Class A shares.
Shareholder servicing fees
The Trust has entered into contracts with one or more shareholder servicing agents, whereby Class A and Class C of each Fund are charged a fee at an annual rate of 0.25% of the average daily net assets of each respective class. Class R4 is charged a fee at an annual rate of 0.10% of its average daily net assets. A portion of these total shareholder servicing fees were paid to affiliates of Wells Fargo.
Target Date Retirement Funds | 117
Table of Contents
Notes to financial statements
5. INVESTMENT PORTFOLIO TRANSACTIONS
The Funds seek to achieve their investment objectives by investing substantially all of their investable assets in affiliated Master Portfolios. Purchases and sales related to these investments have been calculated by aggregating the results of multiplying each Fund’s ownership percentage in the respective affiliated Master Portfolio by the corresponding affiliated Master Portfolio’s purchases and sales. Purchases and sales of investments, excluding short-term securities, for the year ended February 29, 2020 were as follows:
| Purchases at cost | Sales proceeds | |||||||||||||||
| U.S. government | Non-U.S. government | U.S. government | Non-U.S. government | |||||||||||||
Dynamic Target Today Fund | $ | 1,159,625 | $ | 1,217,434 | $ | 1,019,320 | $ | 1,928,977 | ||||||||
Dynamic Target 2015 Fund | 869,694 | 1,231,205 | 764,382 | 1,976,735 | ||||||||||||
Dynamic Target 2020 Fund | 803,603 | 1,509,701 | 701,979 | 2,390,111 | ||||||||||||
Dynamic Target 2025 Fund | 824,803 | 2,299,814 | 705,441 | 3,585,836 | ||||||||||||
Dynamic Target 2030 Fund | 498,756 | 2,059,555 | 418,594 | 3,165,572 | ||||||||||||
Dynamic Target 2035 Fund | 367,556 | 2,010,237 | 305,950 | 3,097,857 | ||||||||||||
Dynamic Target 2040 Fund | 247,814 | 2,002,898 | 206,277 | 3,034,149 | ||||||||||||
Dynamic Target 2045 Fund | 140,726 | 1,880,475 | 117,139 | 2,846,345 | ||||||||||||
Dynamic Target 2050 Fund | 79,621 | 1,800,822 | 66,275 | 2,697,104 | ||||||||||||
Dynamic Target 2055 Fund | 80,238 | 1,804,732 | 66,789 | 2,713,655 | ||||||||||||
Dynamic Target 2060 Fund | 79,312 | 1,811,351 | 66,019 | 2,700,641 | ||||||||||||
6. DERIVATIVE TRANSACTIONS
During the year ended February 29, 2020, the Funds entered into futures contracts to gain market exposure to certain asset classes consistent with an active asset allocation strategy.
During the year ended February 29, 2020, the Funds had average notional amounts in futures contracts outstanding as follows:
| Average notional balance | ||||||||
| Long futures | Short futures | |||||||
Dynamic Target Today Fund | $ | 326,240 | $ | 233,457 | ||||
Dynamic Target 2015 Fund | 337,580 | 233,902 | ||||||
Dynamic Target 2020 Fund | 414,014 | 235,785 | ||||||
Dynamic Target 2025 Fund | 563,983 | 344,429 | ||||||
Dynamic Target 2030 Fund | 508,876 | 249,779 | ||||||
Dynamic Target 2035 Fund | 485,318 | 250,856 | ||||||
Dynamic Target 2040 Fund | 411,519 | 241,314 | ||||||
Dynamic Target 2045 Fund | 393,497 | 238,231 | ||||||
Dynamic Target 2050 Fund | 355,432 | 235,670 | ||||||
Dynamic Target 2055 Fund | 358,824 | 235,926 | ||||||
Dynamic Target 2060 Fund | 355,154 | 235,679 | ||||||
The cumulative unrealized gains (losses) reported in the table following each Portfolio of Investments represents the fair value of futures contracts at the end of the period. Only the current day’s variation margin as of February 29, 2020 is reported separately on the Statements of Assets and Liabilities.
118 | Target Date Retirement Funds
Table of Contents
Notes to financial statements
The effect of derivative instruments on the Statements of Operations for the year ended February 29, 2020 were as follows for the Funds:
| Amount of realized gains (losses) on derivatives | Change in unrealized gains (losses) on derivatives | |||||||||||||||||||||||||||||||
| Interest rate contracts | Equity contracts | Foreign currency contracts | Total | Interest rate contracts | Equity contracts | Foreign currency contracts | Total | |||||||||||||||||||||||||
Dynamic Target Today Fund | $ | (3,413 | ) | $ | (14,644 | ) | $ | 7,540 | $ | (10,517 | ) | $ | (458 | ) | $ | 27,133 | $ | 0 | $ | 26,675 | ||||||||||||
Dynamic Target 2015 Fund | (4,169 | ) | (10,750 | ) | 6,533 | (8,386 | ) | (458 | ) | 27,133 | 0 | 26,675 | ||||||||||||||||||||
Dynamic Target 2020 Fund | (7,580 | ) | (23,215 | ) | 16,079 | (14,716 | ) | (458 | ) | 28,966 | 275 | 28,783 | ||||||||||||||||||||
Dynamic Target 2025 Fund | (10,766 | ) | (41,791 | ) | 19,430 | (33,127 | ) | (458 | ) | 48,920 | 367 | 48,829 | ||||||||||||||||||||
Dynamic Target 2030 Fund | (8,140 | ) | (33,295 | ) | 15,858 | (25,577 | ) | (458 | ) | 44,421 | 334 | 44,297 | ||||||||||||||||||||
Dynamic Target 2035 Fund | (8,140 | ) | (39,514 | ) | 12,814 | (34,840 | ) | (458 | ) | 42,366 | 286 | 42,194 | ||||||||||||||||||||
Dynamic Target 2040 Fund | (7,581 | ) | (33,174 | ) | 14,073 | (26,682 | ) | (458 | ) | 44,696 | 0 | 44,238 | ||||||||||||||||||||
Dynamic Target 2045 Fund | (7,581 | ) | (31,774 | ) | 14,073 | (25,282 | ) | (458 | ) | 27,038 | 0 | 26,580 | ||||||||||||||||||||
Dynamic Target 2050 Fund | (7,581 | ) | (24,066 | ) | 14,073 | (17,574 | ) | (458 | ) | 14,401 | 0 | 13,943 | ||||||||||||||||||||
Dynamic Target 2055 Fund | (7,581 | ) | (25,173 | ) | 14,072 | (18,682 | ) | (458 | ) | 14,412 | 0 | 13,954 | ||||||||||||||||||||
Dynamic Target 2060 Fund | (4,169 | ) | (19,413 | ) | 6,533 | (17,049 | ) | (458 | ) | 14,401 | 0 | 13,943 | ||||||||||||||||||||
7. BANK BORROWINGS
The Trust (excluding the money market funds), Wells Fargo Master Trust and Wells Fargo Variable Trust are parties to a $280,000,000 revolving credit agreement whereby the Fund is permitted to use bank borrowings for temporary or emergency purposes, such as to fund shareholder redemption requests. Interest under the credit agreement is charged to the Fund based on a borrowing rate equal to the higher of the Federal Funds rate in effect on that day plus 1.25% or the overnight LIBOR rate in effect on that day plus 1.25%. In addition, an annual commitment fee equal to 0.25% of the unused balance is allocated to each participating fund.
For the year ended February 29, 2020, there were no borrowings by the Funds under the agreement.
8. CONCENTRATION RISK
As of February 29, 2020, the Funds were primarily owned by Wells Fargo. Investment by and/or voting activities of Wells Fargo with respect to its holdings in each Fund could have a material impact on the Fund. At February 29, 2020, Wells Fargo’s ownership of each Fund was as follows:
| % of ownership | ||||
Dynamic Target Today Fund | 78.92 | % | ||
Dynamic Target 2015 Fund | 93.69 | |||
Dynamic Target 2020 Fund | 77.57 | |||
Dynamic Target 2025 Fund | 53.23 | |||
Dynamic Target 2030 Fund | 62.79 | |||
Dynamic Target 2035 Fund | 66.08 | |||
Dynamic Target 2040 Fund | 72.42 | |||
Dynamic Target 2045 Fund | 82.66 | |||
Dynamic Target 2050 Fund | 92.64 | |||
Dynamic Target 2055 Fund | 90.50 | |||
Dynamic Target 2060 Fund | 95.13 | |||
Target Date Retirement Funds | 119
Table of Contents
Notes to financial statements
9. DISTRIBUTIONS TO SHAREHOLDERS
The tax character of distributions paid during the year ended February 29, 2020, nine months ended February 28, 2019 and year ended May 31, 2018, were as follows:
| Ordinary income | Long-term capital gain | |||||||||||||||||||||||
| Year ended February 29, 2020 | Nine months ended February 28, 2019 | Year ended May 31, 2018 | Year ended February 29, 2020 | Nine months ended February 28, 2019 | Year ended May 31, 2018 | |||||||||||||||||||
Dynamic Target Today Fund | $ | 150,873 | $ | 103,816 | $ | 124,638 | $ | 0 | $ | 447,635 | $ | 77,742 | ||||||||||||
Dynamic Targert 2015 Fund | 138,511 | 97,930 | 132,289 | 0 | 638,351 | 104,688 | ||||||||||||||||||
Dynamic Targert 2020 Fund | 145,581 | 93,092 | 135,985 | 0 | 742,475 | 119,592 | ||||||||||||||||||
Dynamic Targert 2025 Fund | 186,155 | 85,930 | 141,386 | 0 | 896,790 | 140,619 | ||||||||||||||||||
Dynamic Targert 2030 Fund | 157,771 | 87,398 | 143,677 | 0 | 1,003,881 | 153,250 | ||||||||||||||||||
Dynamic Targert 2035 Fund | 147,304 | 77,170 | 142,730 | 0 | 1,057,377 | 160,698 | ||||||||||||||||||
Dynamic Targert 2040 Fund | 134,970 | 74,543 | 143,182 | 0 | 1,105,850 | 166,696 | ||||||||||||||||||
Dynamic Targert 2045 Fund | 126,318 | 71,516 | 141,095 | 0 | 1,113,785 | 165,198 | ||||||||||||||||||
Dynamic Targert 2050 Fund | 119,972 | 66,824 | 139,471 | 0 | 1,100,500 | 165,838 | ||||||||||||||||||
Dynamic Targert 2055 Fund | 117,684 | 70,308 | 138,999 | 0 | 1,093,534 | 165,868 | ||||||||||||||||||
Dynamic Targert 2060 Fund | 120,288 | 67,610 | 140,602 | 0 | 1,103,305 | 166,454 | ||||||||||||||||||
As of February 29, 2020, the components of distributable earnings on a tax basis were as follows:
| Undistributed ordinary income | Undistributed long-term gain | Unrealized gains | Capital loss carryforward | |||||||||||||
Dynamic Target Today Fund | $ | 34,443 | $ | 17,624 | $ | 309,196 | $ | 0 | ||||||||
Dynamic Target 2015 Fund | 10,514 | 0 | 314,231 | (16,870 | ) | |||||||||||
Dynamic Target 2020 Fund | 12,427 | 0 | 297,211 | (32,908 | ) | |||||||||||
Dynamic Target 2025 Fund | 19,384 | 0 | 338,082 | (110,449 | ) | |||||||||||
Dynamic Target 2030 Fund | 15,826 | 0 | 319,808 | (157,675 | ) | |||||||||||
Dynamic Target 2035 Fund | 17,443 | 0 | 271,702 | (177,843 | ) | |||||||||||
Dynamic Target 2040 Fund | 14,068 | 0 | 239,417 | (208,746 | ) | |||||||||||
Dynamic Target 2045 Fund | 12,317 | 0 | 260,698 | (243,851 | ) | |||||||||||
Dynamic Target 2050 Fund | 10,418 | 0 | 253,666 | (269,320 | ) | |||||||||||
Dynamic Target 2055 Fund | 10,670 | 0 | 246,660 | (265,959 | ) | |||||||||||
Dynamic Target 2060 Fund | 10,224 | 0 | 264,456 | (272,002 | ) | |||||||||||
120 | Target Date Retirement Funds
Table of Contents
Notes to financial statements
Effective for all filings after November 4, 2018, the Securities and Exchange Commission eliminated the requirement to separately state the components of distributions to shareholders under U.S. generally accepted accounting principles. The amounts of distributions to shareholders for the year ended May 31, 2018 were as follows:
| Class A | Class C | Class R4 | Class R6 | |||||||||||||||||||||||||||||
| Net investment income | Net realized gains | Net investment income | Net realized | Net investment income | Net realized gains | Net investment income | Net realized gains | |||||||||||||||||||||||||
Dynamic Target Today Fund | $ | 4,850 | $ | 3,809 | $ | 1,052 | $ | 1,692 | $ | 2,184 | $ | 1,712 | $ | 108,190 | $ | 78,891 | ||||||||||||||||
Dynamic Target 2015 Fund | 8,846 | 8,423 | 1,047 | 2,215 | 2,194 | 2,240 | 108,793 | 103,219 | ||||||||||||||||||||||||
Dynamic Target 2020 Fund | 7,535 | 10,192 | 1,007 | 2,577 | 2,209 | 2,603 | 109,522 | 119,932 | ||||||||||||||||||||||||
Dynamic Target 2025 Fund | 12,080 | 18,652 | 1,171 | 3,175 | 2,210 | 2,869 | 109,652 | 132,196 | ||||||||||||||||||||||||
Dynamic Target 2030 Fund | 13,281 | 20,188 | 1,009 | 3,138 | 2,182 | 3,160 | 108,392 | 145,577 | ||||||||||||||||||||||||
Dynamic Target 2035 Fund | 7,626 | 12,632 | 1,038 | 3,498 | 2,221 | 3,530 | 110,280 | 162,603 | ||||||||||||||||||||||||
Dynamic Target 2040 Fund | 8,615 | 14,831 | 1,011 | 3,578 | 2,202 | 3,616 | 109,428 | 166,597 | ||||||||||||||||||||||||
Dynamic Target 2045 Fund | 4,463 | 8,250 | 1,054 | 3,691 | 2,245 | 3,721 | 111,422 | 171,447 | ||||||||||||||||||||||||
Dynamic Target 2050 Fund | 3,240 | 5,371 | 1,049 | 3,748 | 2,244 | 3,787 | 111,382 | 174,488 | ||||||||||||||||||||||||
Dynamic Target 2055 Fund | 2,435 | 4,719 | 1,052 | 3,765 | 2,247 | 3,805 | 111,534 | 175,310 | ||||||||||||||||||||||||
Dynamic Target 2060 Fund | 4,687 | 8,009 | 1,040 | 3,706 | 2,237 | 3,745 | 111,089 | 172,543 | ||||||||||||||||||||||||
10. INDEMNIFICATION
Under the Trust’s organizational documents, the officers and Trustees have been granted certain indemnification rights against certain liabilities that may arise out of performance of their duties to the Trust. Additionally, in the normal course of business, the Trust may enter into contracts with service providers that contain a variety of indemnification clauses. The Trust’s maximum exposure under these arrangements is dependent on future claims that may be made against the Funds and, therefore, cannot be estimated.
11. NEW ACCOUNTING PRONOUNCEMENT
In August 2018, FASB issued Accounting Standards Update (“ASU”)No. 2018-13, Fair Value Measurement (Topic 820)Disclosure Framework—Changes to the Disclosure Requirements for Fair Value Measurement. ASU2018-13 updates the disclosure requirements for fair value measurements by modifying or removing certain disclosures and adding certain new disclosures. The amendments are effective for fiscal years, and interim periods within those fiscal years, beginning after December 15, 2019. Early adoption is permitted. Management has adopted the removal and modification of disclosures early, as permitted, and will adopt the additional new disclosures at the effective date.
12. SUBSEQUENT EVENT
On March 11, 2020, the World Health Organization announced that it had made the assessment that coronavirus disease 2019(“COVID-19”) is a pandemic. The impacts ofCOVID-19 is adversely affecting the entire global economy, individual companies and investment products, and the market in general. There is significant uncertainty around the extent and duration of business disruptions related toCOVID-19 and the impact may be short term or may last for an extended period of time. The risk of further spreading ofCOVID-19 has led to significant uncertainty and volatility in the financial markets and the value of the Funds and the securities in which the Funds invest have generally been adversely affected by impacts caused byCOVID-19.
Target Date Retirement Funds | 121
Table of Contents
Report of independent registered public accounting firm
To the Shareholders of the Funds and Board of Trustees Wells Fargo Funds Trust:
Opinion on the Financial Statements
We have audited the accompanying statements of assets and liabilities of Wells Fargo Dynamic Target Today Fund, Wells Fargo Dynamic Target 2015 Fund, Wells Fargo Dynamic Target 2020 Fund, Wells Fargo Dynamic Target 2025 Fund, Wells Fargo Dynamic Target 2030 Fund, Wells Fargo Dynamic Target 2035 Fund, Wells Fargo Dynamic Target 2040 Fund, Wells Fargo Dynamic Target 2045 Fund, Wells Fargo Dynamic Target 2050 Fund, Wells Fargo Dynamic Target 2055 Fund, and Wells Fargo Dynamic Target 2060 Fund (collectively, the Funds), eleven of the funds constituting Wells Fargo Funds Trust, including the portfolios of investments, as of February 29, 2020, the related statements of operations for the year then ended, the statements of changes in net assets for the year then ended, for the period from June 1, 2018 to February 28, 2019, and for the year ended May 31, 2018, and the related notes (collectively, the financial statements) and the financial highlights for each of the years or periods in the period from November 30, 2015 (commencement of operations) to February 29, 2020. In our opinion, the financial statements and financial highlights present fairly, in all material respects, the financial position of the Funds as of February 29, 2020, the results of their operations for the year then ended, the changes in their net assets for each of the years or periods in the period from June 1, 2017 to February 29, 2020, and the financial highlights for each of the years or periods in the period from the commencement of operations to February 29, 2020, in conformity with U.S. generally accepted accounting principles.
Basis for Opinion
These financial statements and financial highlights are the responsibility of the Funds’ management. Our responsibility is to express an opinion on these financial statements and financial highlights based on our audits. We are a public accounting firm registered with the Public Company Accounting Oversight Board (United States) (PCAOB) and are required to be independent with respect to the Funds in accordance with the U.S. federal securities laws and the applicable rules and regulations of the Securities and Exchange Commission and the PCAOB.
We conducted our audits in accordance with the standards of the PCAOB. Those standards require that we plan and perform the audit to obtain reasonable assurance about whether the financial statements and financial highlights are free of material misstatement, whether due to error or fraud. Our audits included performing procedures to assess the risks of material misstatement of the financial statements and financial highlights, whether due to error or fraud, and performing procedures that respond to those risks. Such procedures included examining, on a test basis, evidence regarding the amounts and disclosures in the financial statements and financial highlights. Such procedures also included confirmation of securities owned as of February 29, 2020, by correspondence with the custodian, transfer agent, and brokers. Our audits also included evaluating the accounting principles used and significant estimates made by management, as well as evaluating the overall presentation of the financial statements and financial highlights. We believe that our audits provide a reasonable basis for our opinion.

We have not been able to determine the specific year that we began serving as the auditor of one or more Wells Fargo Funds investment companies; however we are aware that we have served as the auditor of one or more Wells Fargo Funds investment companies since at least 1955.
Boston, Massachusetts
April 28, 2020
122 | Target Date Retirement Funds
Table of Contents
TAX INFORMATION
For corporate shareholders, pursuant to Section 854 of the Internal Revenue Code, the percentage of ordinary income dividends qualifying for the corporate dividends-received deduction was as follows for the fiscal year ended February 29, 2020:
Dividends-received deduction | ||||
Dynamic Target Today Fund | 15.08 | % | ||
Dynamic Target 2015 Fund | 21.67 | % | ||
Dynamic Target 2020 Fund | 26.56 | % | ||
Dynamic Target 2025 Fund | 33.56 | % | ||
Dynamic Target 2030 Fund | 38.01 | % | ||
Dynamic Target 2035 Fund | 40.27 | % | ||
Dynamic Target 2040 Fund | 43.35 | % | ||
Dynamic Target 2045 Fund | 45.15 | % | ||
Dynamic Target 2050 Fund | 46.22 | % | ||
Dynamic Target 2055 Fund | 46.37 | % | ||
Dynamic Target 2060 Fund | 46.28 | % | ||
Pursuant to Section 854 of the Internal Revenue Code, the following amounts of income dividends paid during the fiscal year ended February 29, 2020 have been designated as qualified dividend income (QDI):
| QDI | ||||
Dynamic Target Today Fund | $ | 40,618 | ||
Dynamic Target 2015 Fund | 54,204 | |||
Dynamic Target 2020 Fund | 69,916 | |||
Dynamic Target 2025 Fund | 114,044 | |||
Dynamic Target 2030 Fund | 112,080 | |||
Dynamic Target 2035 Fund | 111,504 | |||
Dynamic Target 2040 Fund | 113,135 | |||
Dynamic Target 2045 Fund | 111,464 | |||
Dynamic Target 2050 Fund | 109,724 | |||
Dynamic Target 2055 Fund | 107,968 | |||
Dynamic Target 2060 Fund | 110,362 | |||
For the fiscal year ended February 29, 2020, the following amounts have been designated as interest-related dividends for nonresident alien shareholders pursuant to Section 871 of the Internal Revenue Code:
Interest-related dividends | ||||
Dynamic Target Today Fund | $ | 82,877 | ||
Dynamic Target 2015 Fund | 64,304 | |||
Dynamic Target 2020 Fund | 58,168 | |||
Dynamic Target 2025 Fund | 59,319 | |||
Dynamic Target 2030 Fund | 39,352 | |||
Dynamic Target 2035 Fund | 30,233 | |||
Dynamic Target 2040 Fund | 21,272 | |||
Target Date Retirement Funds | 123
Table of Contents
Other information (unaudited)
Interest-related dividends | ||||
Dynamic Target 2045 Fund | $ | 13,816 | ||
Dynamic Target 2050 Fund | 9,574 | |||
Dynamic Target 2055 Fund | 9,366 | |||
Dynamic Target 2060 Fund | 9,593 | |||
For the fiscal year ended February 29, 2020, the percentage of ordinary income distributed which was derived from interest on U.S. government securities was as follows:
% of U.S. income | ||||
Dynamic Target Today Fund | 16.90 | % | ||
Dynamic Target 2015 Fund | 14.30 | % | ||
Dynamic Target 2020 Fund | 11.90 | % | ||
Dynamic Target 2025 Fund | 8.79 | % | ||
Dynamic Target 2030 Fund | 6.36 | % | ||
Dynamic Target 2035 Fund | 4.99 | % | ||
Dynamic Target 2040 Fund | 3.64 | % | ||
Dynamic Target 2045 Fund | 2.27 | % | ||
Dynamic Target 2050 Fund | 1.41 | % | ||
Dynamic Target 2055 Fund | 1.41 | % | ||
Dynamic Target 2060 Fund | 1.40 | % | ||
PROXY VOTING INFORMATION
A description of the policies and procedures used to determine how to vote proxies relating to portfolio securities is available without charge, upon request, by calling1-800-222-8222, visiting our website atwfam.com, or visiting the SEC website at sec.gov. Information regarding how the proxies related to portfolio securities were voted during the most recent12-month period ended June 30 is available on the website atwfam.comor by visiting the SEC website at sec.gov.
QUARTERLY PORTFOLIO HOLDINGS INFORMATION
The Funds file their complete schedule of portfolio holdings with the SEC for the first and third quarters of each fiscal year as an exhibit to their reports on FormN-PORT. Shareholders may view the filed FormN-PORT by visiting the SEC website at sec.gov.
124 | Target Date Retirement Funds
Table of Contents
Other information (unaudited)
BOARD OF TRUSTEES AND OFFICERS
Each of the Trustees and Officers1 listed in the table below acts in identical capacities for each fund in the Wells Fargo family of funds, which consists of 146 mutual funds comprising the Wells Fargo Funds Trust, Wells Fargo Variable Trust, Wells Fargo Master Trust and fourclosed-end funds (collectively the “Fund Complex”). This table should be read in conjunction with the Prospectus and the Statement of Additional Information2. The mailing address of each Trustee and Officer is 525 Market Street, 12th Floor, San Francisco, CA 94105. Each Trustee and Officer serves an indefinite term, however, each Trustee serves such term until reaching the mandatory retirement age established by the Trustees.
Independent Trustees
Name and year of birth | Position held and length of service* | Principal occupations during past five years or longer | Current other public company or investment company directorships | |||
William R. Ebsworth (Born 1957) | Trustee, since 2015 | Retired. From 1984 to 2013, equities analyst, portfolio manager, research director and chief investment officer at Fidelity Management and Research Company in Boston, Tokyo, and Hong Kong, and retired in 2013 as Chief Investment Officer of Fidelity Strategic Advisers, Inc. where he led a team of investment professionals managing client assets. Prior thereto, Board member of Hong Kong Securities Clearing Co., Hong Kong Options Clearing Corp., the Thailand International Fund, Ltd., Fidelity Investments Life Insurance Company, and Empire Fidelity Investments Life Insurance Company. Audit Committee Chair and Investment Committee Chair of the Vincent Memorial Hospital Endowment(non-profit organization). Mr. Ebsworth is a CFA® charterholder. | N/A | |||
Jane A. Freeman (Born 1953) | Trustee, since 2015; Chair Liaison, since 2018 | Retired. From 2012 to 2014 and 1999 to 2008, Chief Financial Officer of Scientific Learning Corporation. From 2008 to 2012, Ms. Freeman provided consulting services related to strategic business projects. Prior to 1999, Portfolio Manager at Rockefeller & Co. and Scudder, Stevens & Clark. Board member of the Harding Loevner Funds from 1996 to 2014, serving as both Lead Independent Director and chair of the Audit Committee. Board member of the Russell Exchange Traded Funds Trust from 2011 to 2012 and the chair of the Audit Committee. Ms. Freeman is a Board Member of The Ruth Bancroft Garden(non-profit organization). She is also an inactive Chartered Financial Analyst. | N/A | |||
Isaiah Harris, Jr. (Born 1952) | Trustee, since 2009; Audit Committee Chairman, since 2019 | Retired. Chairman of the Board of CIGNA Corporation since 2009, and Director since 2005. From 2003 to 2011, Director of Deluxe Corporation. Prior thereto, President and CEO of BellSouth Advertising and Publishing Corp. from 2005 to 2007, President and CEO of BellSouth Enterprises from 2004 to 2005 and President of BellSouth Consumer Services from 2000 to 2003. Emeritus member of the Iowa State University Foundation Board of Governors. Emeritus Member of the Advisory Board of Iowa State University School of Business. Advisory Board Member, Palm Harbor Academy (private school). Advisory Board Member, Child Evangelism Fellowship(non-profit). Mr. Harris is a certified public accountant (inactive status). | CIGNA Corporation | |||
Judith M. Johnson (Born 1949) | Trustee, since 2008; Audit Committee Chairman, from 2009 to 2018 | Retired. Prior thereto, Chief Executive Officer and Chief Investment Officer of Minneapolis Employees Retirement Fund from 1996 to 2008. Ms. Johnson is an attorney, certified public accountant and a certified managerial accountant. | N/A | |||
Target Date Retirement Funds | 125
Table of Contents
Other information (unaudited)
Name and year of birth | Position held and length of service* | Principal occupations during past five years or longer | Current other public company or investment company directorships | |||
David F. Larcker (Born 1950) | Trustee, since 2009 | James Irvin Miller Professor of Accounting at the Graduate School of Business, Stanford University, Director of the Corporate Governance Research Initiative and Senior Faculty of The Rock Center for Corporate Governance since 2006. From 2005 to 2008, Professor of Accounting at the Graduate School of Business, Stanford University. Prior thereto, Ernst & Young Professor of Accounting at The Wharton School, University of Pennsylvania from 1985 to 2005. | N/A | |||
Olivia S. Mitchell (Born 1953) | Trustee, since 2006; Nominating and Governance Committee Chair, since 2018 | International Foundation of Employee Benefit Plans Professor, Wharton School of the University of Pennsylvania since 1993. Director of Wharton’s Pension Research Council and Boettner Center on Pensions & Retirement Research, and Research Associate at the National Bureau of Economic Research. Previously, Cornell University Professor from 1978 to 1993. | N/A | |||
Timothy J. Penny (Born 1951) | Trustee, since 1996; Chairman, since 2018 | President and Chief Executive Officer of Southern Minnesota Initiative Foundation, anon-profit organization, since 2007. Member of the Board of Trustees of NorthStar Education Finance, Inc., anon-profit organization, since 2007. | N/A | |||
James G. Polisson (Born 1959) | Trustee, since 2018 | Retired. Chief Marketing Officer, Source (ETF) UK Services, Ltd, from 2015 to 2017. From 2012 to 2015, Principal of The Polisson Group, LLC, a management consulting, corporate advisory and principal investing company. Chief Executive Officer and Managing Director at Russell Investments, Global Exchange Traded Funds from 2010 to 2012. Managing Director of Barclays Global Investors from 1998 to 2010 and Global Chief Marketing Officer for iShares and Barclays Global Investors from 2000 to 2010. Trustee of the San Francisco Mechanics’ Institute, anon-profit organization, from 2013 to 2015. Board member of the Russell Exchange Traded Fund Trust from 2011 to 2012. Director of Barclays Global Investors Holdings Deutschland GmbH from 2006 to 2009. Mr. Polisson is an attorney and has a retired status with the Massachusetts and District of Columbia Bar Associations. | N/A | |||
Pamela Wheelock3 (Born 1959) | Trustee, since January 2020; previously Trustee from January 2018 to July 2019 | Board member of the Destination Medical Center Economic Development Agency, Rochester, Minnesota since 2019. Acting Commissioner, Minnesota Department of Human Services, July 2019 through September 2019. Human Services Manager (part-time), Minnesota Department of Human Services, October 2019 through December 2019. Chief Operating Officer, Twin Cities Habitat for Humanity from 2017 to 2019. Vice President of University Services, University of Minnesota from 2012 to 2016. Prior thereto, on the Board of Directors, Governance Committee and Finance Committee for the Minnesota Philanthropy Partners (Saint Paul Foundation) from 2012 to 2018, Interim Chief Executive Officer of Blue Cross Blue Shield of Minnesota from 2011 to 2012, Chairman of the Board from 2009 to 2012 and Board Director from 2003 to 2015. Vice President, Leadership and Community Engagement, Bush Foundation, Saint Paul, Minnesota (a private foundation) from 2009 to 2011. Executive Vice President and Chief Financial Officer, Minnesota Sports and Entertainment from 2004 to 2009 and Senior Vice President from 2002 to 2004. Executive Vice President of the Minnesota Wild Foundation from 2004 to 2008. Commissioner of Finance, State of Minnesota, from 1999 to 2002. Currently Board Chair of the Minnesota Wild Foundation since 2010. | N/A | |||
| * | Length of service dates reflect the Trustee’s commencement of service with the Trust’s predecessor entities, where applicable. |
126 | Target Date Retirement Funds
Table of Contents
Other information (unaudited)
Officers
Name and year of birth | Position held and length of service | Principal occupations during past five years or longer | ||
Andrew Owen (Born 1960) | President, since 2017 | Executive Vice President of Wells Fargo & Company and Head of Affiliated Managers, Wells Fargo Asset Management, since 2014. In addition, Mr. Owen is currently President, Chief Executive Officer and Director of Wells Fargo Funds Management, LLC since 2017. Prior thereto, Executive Vice President responsible for marketing, investments and product development for Wells Fargo Funds Management, LLC, from 2009 to 2014. | ||
Jeremy DePalma1 (Born 1974) | Treasurer, since 2012 | Senior Vice President of Wells Fargo Funds Management, LLC since 2009. Senior Vice President of Evergreen Investment Management Company, LLC from 2008 to 2010 and head of the Fund Reporting and Control Team within Fund Administration from 2005 to 2010. | ||
Michelle Rhee (Born 1966) | Chief Legal Officer, since 2019 | Secretary of Wells Fargo Funds Management, LLC, Chief Legal Counsel of Wells Fargo Asset Management and Assistant General Counsel of Wells Fargo Bank, N.A. since 2018. Associate General Counsel and Managing Director of Bank of America Corporation from 2004 to 2018. | ||
Catherine Kennedy (Born 1969) | Secretary, since 2019 | Vice President of Wells Fargo Funds Management, LLC and Senior Counsel of the Wells Fargo Legal Department since 2010. Vice President and Senior Counsel of Evergreen Investment Management Company, LLC from 1998 to 2010. | ||
Michael H. Whitaker (Born 1967) | Chief Compliance Officer, since 2016 | Chief Compliance Officer of Wells Fargo Asset Management since 2016. Senior Vice President and Chief Compliance Officer for Fidelity Investments from 2007 to 2016. | ||
David Berardi (Born 1975) | Assistant Treasurer, since 2009 | Vice President of Wells Fargo Funds Management, LLC since 2009. Vice President of Evergreen Investment Management Company, LLC from 2008 to 2010. Manager of Fund Reporting and Control for Evergreen Investment Management Company, LLC from 2004 to 2010. | ||
| 1 | Jeremy DePalma acts as Treasurer of 82 funds and Assistant Treasurer of 64 funds in the Fund Complex. |
| 2 | The Statement of Additional Information includes additional information about the Trustees and is available, without charge, upon request, by calling1-800-222-8222 or by visiting the website atwfam.com. |
| 3 | Pamela Wheelock wasre-appointed to the Board effective January 1, 2020. |
Target Date Retirement Funds | 127
Table of Contents
On February 29, 2020, the Wells Fargo Dynamic Target Blended Indexes were composed of the following indexes:
| Wells Fargo Dynamic Target Today Blended Index | Wells Fargo Dynamic Target 2015 Blended Index | Wells Fargo Dynamic Target 2020 Blended Index | ||||||||||
Bloomberg Barclays U.S. Aggregateex-Corporate Index | 29.57 | % | 25.14 | % | 21.49 | % | ||||||
Bloomberg Barclays U.S. Government Intermediate Bond Index | 5.00 | % | 4.25 | % | 3.34 | % | ||||||
Bloomberg Barclays U.S. Treasury Inflation Notes:1-10 Year Index | 5.00 | % | 4.25 | % | 3.34 | % | ||||||
JP Morgan EMBI Global Diversified Index | 2.52 | % | 2.14 | % | 1.83 | % | ||||||
Wells Fargo Factor Enhanced Emerging Markets Index (Net) | 2.96 | % | 3.62 | % | 4.28 | % | ||||||
Wells Fargo Factor Enhanced International Index (Net) | 9.88 | % | 12.10 | % | 14.29 | % | ||||||
Wells Fargo Factor Enhanced Large Cap Index | 19.07 | % | 23.37 | % | 27.30 | % | ||||||
Wells Fargo Factor Enhanced Small Cap Index | 4.76 | % | 5.83 | % | 6.82 | % | ||||||
Wells Fargo U.S. High Yield Bond Index | 2.52 | % | 2.14 | % | 1.83 | % | ||||||
Wells Fargo U.S. Investment Grade Corporate Bond Index | 15.39 | % | 13.08 | % | 11.18 | % | ||||||
Wells Fargo U.S. REIT Index | 3.33 | % | 4.08 | % | 4.30 | % | ||||||
Average annual total returns (%) as of February 29, 2020
| 1 year | 5 year | 10 year | ||||||||||
Bloomberg Barclays U.S. Aggregateex-Corporate Index1* | 10.34 | – | – | |||||||||
Bloomberg Barclays U.S. Government Intermediate Bond Index2 | 8.05 | 2.46 | 2.52 | |||||||||
Bloomberg Barclays U.S. Treasury Inflation Notes:1-10 Year Index3 | 7.86 | 2.48 | 2.70 | |||||||||
JP Morgan EMBI Global Diversified Index4 | 9.68 | 5.98 | 6.78 | |||||||||
Wells Fargo Factor Enhanced Emerging Markets Index (Net)5** | (6.74 | ) | – | – | ||||||||
Wells Fargo Factor Enhanced International Index (Net)6** | 0.57 | – | – | |||||||||
Wells Fargo Factor Enhanced Large Cap Index7** | 3.85 | – | – | |||||||||
Wells Fargo Factor Enhanced Small Cap Index8** | (5.66 | ) | – | – | ||||||||
Wells Fargo U.S. High Yield Bond Index9** | 5.02 | – | – | |||||||||
Wells Fargo U.S. Investment Grade Corporate Bond Index10** | 15.67 | – | – | |||||||||
Wells Fargo U.S. REIT Index11*** | 2.85 | – | – | |||||||||
| * | The inception date of the index is December 2015. |
| ** | The inception date of the index is April 2017. |
| ** | The inception date is March 2017 |
| 1 | The Bloomberg Barclays U.S. Aggregateex-Corporate Index is a broad-based benchmark that includes Treasuries, government-related securities, mortgage-backed securities (agency fixed-rate and hybrid adjustable-rate mortgage pass-throughs), asset-backed securities and commercial mortgage-backed securities (agency andnon-agency). You cannot invest directly in an index. |
| 2 | The Bloomberg Barclays U.S. Government Intermediate Bond Index is an unmanaged index composed of U.S. government securities with maturities in the1- to10-year range, including securities issued by the U.S. Treasury and U.S. government agencies. You cannot invest directly in an index. |
| 3 | Bloomberg Barclays U.S. Treasury Inflation Notes:1-10 Year Index measures the performance of the U.S. Treasury Inflation Protected Securities (TIPS) market with maturities more than 1 year and less than 10 years. Federal Reserve holdings of U.S. TIPS are not index eligible and are excluded from the face amount outstanding of each bond in the index. You cannot invest directly in an index. |
| 4 | The J.P. Morgan Emerging Markets Bond Index (“EMBI”) Global Diversified Index is a composite index representing an unleveraged investment in emerging market bonds that is broadly based across the spectrum of emerging market bonds and includes reinvestment of income (to represent real assets). You cannot invest directly in an index. |
128 | Target Date Retirement Funds
Table of Contents
Appendix I (unaudited)
| Wells Fargo Dynamic Target 2025 Blended Index | Wells Fargo Dynamic Target 2030 Blended Index | Wells Fargo Dynamic Target 2035 Blended Index | Wells Fargo Dynamic Target 2040 Blended Index | Wells Fargo Dynamic Target 2045 Blended Index | Wells Fargo Dynamic Target 2050 Blended Index | Wells Fargo Dynamic Target 2055 Blended Index | Wells Fargo Dynamic Target 2060 Blended Index | |||||||||||||||||||||||||||||||
| 17.81% | 13.81 | % | 11.25 | % | 8.29 | % | 5.33 | % | 2.96 | % | 2.96 | % | 2.96 | % | ||||||||||||||||||||||||
| 1.47% | 0.34 | % | 0.00 | % | 0.00 | % | 0.00 | % | 0.00 | % | 0.00 | % | 0.00 | % | ||||||||||||||||||||||||
| 1.47% | 0.34 | % | 0.00 | % | 0.00 | % | 0.00 | % | 0.00 | % | 0.00 | % | 0.00 | % | ||||||||||||||||||||||||
| 1.50% | 1.16 | % | 0.95 | % | 0.70 | % | 0.45 | % | 0.25 | % | 0.25 | % | 0.25 | % | ||||||||||||||||||||||||
| 5.37% | 6.43 | % | 7.10 | % | 7.76 | % | 8.30 | % | 8.74 | % | 8.74 | % | 8.74 | % | ||||||||||||||||||||||||
| 17.88% | 21.50 | % | 23.86 | % | 25.87 | % | 27.74 | % | 29.26 | % | 29.26 | % | 29.26 | % | ||||||||||||||||||||||||
| 32.71% | 37.67 | % | 40.03 | % | 41.90 | % | 43.97 | % | 45.60 | % | 45.60 | % | 45.60 | % | ||||||||||||||||||||||||
| 8.20% | 9.42 | % | 10.01 | % | 10.47 | % | 10.99 | % | 11.40 | % | 11.40 | % | 11.40 | % | ||||||||||||||||||||||||
| 1.50% | 1.16 | % | 0.95 | % | 0.70 | % | 0.45 | % | 0.25 | % | 0.25 | % | 0.25 | % | ||||||||||||||||||||||||
| 9.26% | 7.19 | % | 5.85 | % | 4.31 | % | 2.77 | % | 1.54 | % | 1.54 | % | 1.54 | % | ||||||||||||||||||||||||
| 2.83% | 0.98 | % | 0.00 | % | 0.00 | % | 0.00 | % | 0.00 | % | 0.00 | % | 0.00 | % | ||||||||||||||||||||||||
| 5 | The Wells Fargo Factor Enhanced Emerging Markets Index (Net) is an index of equity securities that is derived from a universe of companies domiciled in various emerging markets countries and that possess, in aggregate, diversified exposure to investment factors (or characteristics) that are commonly tied to a stock’s potential for enhanced risk-adjusted returns relative to the market. You cannot invest directly in an index. |
| 6 | The Wells Fargo Factor Enhanced International Index (Net) is an index of equity securities that is derived from a universe of companies domiciled in various developed markets outside the U.S. and that possess, in aggregate, diversified exposure to investment factors (or characteristics) that are commonly tied to a stock’s potential for enhanced risk-adjusted returns relative to the market. You cannot invest directly in an index. |
| 7 | The Wells Fargo Factor Enhanced Large Cap Index is an index of equity securities that is derived from a universe of the largest 1,000 companies in the U.S. market and that possess, in aggregate, diversified exposure to investment factors (or characteristics) that are commonly tied to a stock’s potential for enhanced risk-adjusted returns relative to the market. You cannot invest directly in an index. |
| 8 | The Wells Fargo Factor Enhanced Small Cap Index is an index of equity securities that is derived from a universe of the smallest 2,000 companies in the U.S. market and that possess, in aggregate, diversified exposure to investment factors (or characteristics) that are commonly tied to a stock’s potential for enhanced risk-adjusted returns relative to the market. You cannot invest directly in an index. |
| 9 | The Wells Fargo U.S. High Yield Bond Index is a rules-based index designed to measure the performance of U.S. dollar denominated below investment-grade corporate debt issued by U.S. or foreign issuers that have a remaining maturity of at least one year, regardless of optionality; it is constructed to provide increased diversification and liquidity versus traditional passive high yield bond indexes. You cannot invest directly in an index. |
| 10 | The Wells Fargo U.S. Investment Grade Corporate Bond Index is a rules-based index designed to measure the performance of publicly issued U.S. dollar denominated investment grade, fixed rate corporate bonds issued by U.S. or foreign issuers that have a remaining maturity of at least one year, regardless of optionality; it is constructed to provide increased diversification and liquidity versus traditional passive corporate credit indexes. You cannot invest directly in an index. |
| 11 | The Wells Fargo U.S. REIT Index is a float-adjusted, capitalization-weighted index of all applicable NYSE MKT or NASDAQ-listed classes of REIT stock that satisfy specified market capitalization and other eligibility requirements. You cannot invest directly in an index. |
Target Date Retirement Funds | 129
Table of Contents
Effective on or about May 1, 2020, if you purchase Fund shares through a Janney Montgomery Scott LLC (“Janney”) brokerage account, you will be eligible for the following load waivers(front-end sales charge waivers and contingent deferred sales charge (“CDSC”), orback-end sales charge, waivers) and discounts, which may differ from those disclosed elsewhere in the Fund’s Prospectus or SAI.
| Front-end sales charge* waivers on Class A shares available at Janney |
| Shares purchased through reinvestment of capital gains distributions and dividend reinvestment when purchasing shares of the same fund (but not any other fund within the fund family). |
| Shares purchased by employees and registered representatives of Janney or its affiliates and their family members as designated by Janney. |
| Shares purchased from the proceeds of redemptions within the same fund family, provided (1) the repurchase occurs within ninety (90) days following the redemption, (2) the redemption and purchase occur in the same account, and (3) redeemed shares were subject to afront-end or deferred sales load (i.e., right of reinstatement). |
| Employer-sponsored retirement plans (e.g., 401(k) plans, 457 plans, employer-sponsored 403(b) plans, profit sharing and money purchase pension plans and defined benefit plans). For purposes of this provision, employer-sponsored retirement plans do not include SEP IRAs, Simple IRAs,SAR-SEPs or Keogh plans. |
| Shares acquired through a right of reinstatement. |
| Class C shares that are no longer subject to a contingent deferred sales charge and are converted to Class A shares of the same fund pursuant to Janney’s policies and procedures. |
| CDSC waivers on Class A and Class C shares available at Janney |
| Shares sold upon the death or disability of the shareholder. |
| Shares sold as part of a systematic withdrawal plan as described in the Fund’s Prospectus. |
| Shares purchased in connection with a return of excess contributions from an IRA account. |
| Shares sold as part of a required minimum distribution for IRA and retirement accounts if the redemption is taken in or after the year the shareholder reaches qualified age based on applicable IRS regulations. |
| Shares sold to pay Janney fees but only if the transaction is initiated by Janney. |
| Shares acquired through a right of reinstatement. |
| Shares exchanged into the same share class of a different fund. |
| Front-end sales charge* discounts available at Janney; breakpoints, rights of accumulation and/or letters of intent |
| Breakpoints as described in the Fund’s Prospectus. |
| Rights of accumulation (“ROA”), which entitle shareholders to breakpoint discounts, will be automatically calculated based on the aggregated holding of fund family assets held by accounts within the purchaser’s household at Janney. Eligible fund family assets not held at Janney may be included in the ROA calculation only if the shareholder notifies his or her financial advisor about such assets. |
| Letters of intent which allow for breakpoint discounts based on anticipated purchases within a fund family, over a13-month time period. Eligible fund family assets not held at Janney Montgomery Scott may be included in the calculation of letters of intent only if the shareholder notifies his or her financial advisor about such assets. |
| * | Also referred to as an “initial sales charge.” |
130 | Target Date Retirement Funds
Table of Contents
Effective on or after May 1, 2020, clients of Edward Jones (also referred to as “shareholders”) purchasing Fund shares on the Edward Jones commission andfee-based platforms are eligible only for the following sales charge discounts (also referred to as “breakpoints”) and waivers, which can differ from breakpoints and waivers described elsewhere in this Prospectus or SAI or through another broker-dealer. In all instances, it is the shareholder’s responsibility to inform Edward Jones at the time of purchase of any relationship, holdings of Wells Fargo Funds or other facts qualifying the purchaser for breakpoints or waivers. Edward Jones can ask for documentation of such circumstance.
| Breakpoints available at Edward Jones |
| Rights of Accumulation (ROA) |
The applicable sales charge on a purchase of Class A shares is determined by taking into account all share classes (except any money market funds and retirement plan share classes) of Wells Fargo Funds held by the shareholder or in an account grouped by Edward Jones with other accounts for the purpose of providing certain pricing considerations (“pricing groups”). This includes all share classes held on the Edward Jones platform and/or held on another platform. The inclusion of eligible fund family assets in the rights of accumulation calculation is dependent on the shareholder notifying his or her financial advisor of such assets at the time of calculation. |
ROA is determined by calculating the higher of cost or market value (current shares x NAV). |
| Letter of Intent (LOI) |
Through a LOI, shareholders can receive the sales charge and breakpoint discounts for purchases shareholders intend to makeover a13-month period from the date Edward Jones receives the LOI. The LOI is determined by calculating the higher of cost or market value of qualifying holdings at LOI initiation in combination with the value that the shareholder intends to buy over a13-month period to calculate thefront-end sales charge and any breakpoint discounts. Each purchase the shareholder makes during that13-month period will receive the sales charge and breakpoint discount that applies to the total amount. The inclusion of eligible fund family assets in the LOI calculation is dependent on the shareholder notifying his or her financial advisor of such assets at the time of calculation. Purchases made before the LOI is received by Edward Jones are not covered under the LOI and will not reduce the sales charge previously paid. Sales charges will be adjusted if LOI is not met. |
| Sales charges are waived for the following shareholders and in the following situations at Edward Jones: |
● Associates of Edward Jones and its affiliates and their family members who are in the same pricing group (as determined by Edward Jones under its policies and procedures) as the associate. This waiver will continue for the remainder of the associate’s life if the associate retires from Edward Jones in good-standing. |
● Shares exchanged in an Edward Jonesfee-based program. |
● Shares purchased through reinvestment of capital gains distributions and dividend reinvestment. |
● Shares purchased from the proceeds of redeemed shares of the same fund family so long as the following conditions are met: 1) the proceeds are from the sale of shares within 60 days of the purchase, and 2) the sale and purchase are made in the same share class and the same account or the purchase is made in an individual retirement account with proceeds from liquidations in anon-retirement account. |
● Shares exchanged into Class A shares from another share class so long as the exchange is into the same fund and was initiated at the discretion of Edward Jones. Edward Jones is responsible for any remaining CDSC due to the fund company, if applicable. Any future purchases are subject to the applicable sales charge as disclosed in the prospectus. |
● Exchanges from Class C shares to Class A shares of the same fund, generally, in the 84th month following the anniversary of the purchase date or earlier at the discretion of Edward Jones. |
| If the shareholder purchases shares that are subject to a CDSC and those shares are redeemed before the CDSC is expired, the shareholder is responsible to pay the CDSC except in the following conditions available at Edward Jones: |
● The death or disability of the shareholder. |
● Systematic withdrawals with up to 10% per year of the account value. |
● Return of excess contributions from an Individual Retirement Account (IRA). |
● Shares sold as part of a required minimum distribution for IRA and retirement accounts if the redemption is taken in or after the year the shareholder reaches qualified age based on applicable IRS regulation. |
● Shares sold to pay Edward Jones fees or costs in such cases where the transaction is initiated by Edward Jones. |
● Shares exchanged in an Edward Jonesfee-based program. |
● Shares acquired through NAV reinstatement. |
Target Date Retirement Funds | 131
Table of Contents
Appendix III (unaudited)
| Other Important Information for accounts at Edward Jones: |
Minimum Purchase Amounts ● $250 initial purchase minimum ● $50 subsequent purchase minimum |
Minimum Balances Edward Jones has the right to redeem at its discretion fund holdings with a balance of $250 or less. The following are examples of accounts that are not included in this policy: ● Afee-based account held on an Edward Jones platform ● A 529 account held on an Edward Jones platform ● An account with an active systematic investment plan or letter of intent (LOI) |
Changing Share Classes At any time it deems necessary, Edward Jones has the authority to exchange at NAV a shareholder’s holdings in a fund to Class A shares. |
132 | Target Date Retirement Funds
Table of Contents
For more information
More information about Wells Fargo Funds is available free upon request. To obtain literature, please write, visit the Funds’ website, or call:
Wells Fargo Funds
P.O. Box 219967
Kansas City, MO 64121-9967
Website:wfam.com
Individual investors:1-800-222-8222
Retail investment professionals:1-888-877-9275
Institutional investment professionals:1-866-765-0778

This report and the financial statements contained herein are submitted for the general information of the shareholders of Wells Fargo Funds. If this report is used for promotional purposes, distribution of the report must be accompanied or preceded by a current prospectus. Before investing, please consider the investment objectives, risks, charges, and expenses of the investment. For a current prospectus and, if available, a summary prospectus, containing this information, call1-800-222-8222 or visit the Funds’ website atwfam.com. Read the prospectus carefully before you invest or send money.
Wells Fargo Asset Management (WFAM) is the trade name for certain investment advisory/management firms owned by Wells Fargo & Company. These firms include but are not limited to Wells Capital Management Incorporated and Wells Fargo Funds Management, LLC. Certain products managed by WFAM entities are distributed by Wells Fargo Funds Distributor, LLC (a broker-dealer and Member FINRA).
This material is for general informational and educational purposes only and is NOT intended to provide investment advice or a recommendation of any kind—including a recommendation for any specific investment, strategy, or plan.
INVESTMENT PRODUCTS: NOT FDIC INSURED ◾ NO BANK GUARANTEE ◾ MAY LOSE VALUE
© 2020 Wells Fargo & Company. All rights reserved
PAR-0220-04676 04-20
ADTD/AR104 02-20
Table of Contents

Annual Report
February 29, 2020
| ∎ | Wells Fargo Emerging Markets Bond Fund |
| ∎ | Wells Fargo High Yield Corporate Bond Fund |
| ∎ | Wells Fargo International Government Bond Fund |
| ∎ | Wells Fargo U.S. Core Bond Fund |
Beginning on January 1, 2021, as permitted by new regulations adopted by the Securities and Exchange Commission, paper copies of the Wells Fargo Funds’ annual and semi-annual shareholder reports issued after this date will no longer be sent by mail, unless you specifically request paper copies of the reports. Instead, the reports will be made available on the Funds’ website, and you will be notified by mail each time a report is posted and provided with a website address to access the report.
If you already elected to receive shareholder reports electronically, you will not be affected by this change and you need not take any action. You may elect to receive shareholder reports and other communications from the Fund electronically at any time by contacting your financial intermediary (such as a broker-dealer or bank) or, if you are a direct investor, by calling1-800-222-8222 or by enrolling at wellsfargo.com/advantagedelivery.
You may elect to receive all future reports in paper free of charge. If you invest through a financial intermediary, you can contact your financial intermediary to request that you continue to receive paper copies of your shareholder reports; if you invest directly with the Fund, you can call 1-800-222-8222. Your election to receive reports in paper will apply to all Wells Fargo Funds held in your account with your financial intermediary or, if you are a direct investor, to all Wells Fargo Funds that you hold.
Table of Contents
|
Reduce clutter. Save trees. |
Sign up for electronic delivery of prospectuses and shareholder reports atwellsfargo.com/advantagedelivery |
The views expressed and any forward-looking statements are as of February 29, 2020, unless otherwise noted, and are those of the Fund managers and/or Wells Fargo Asset Management. Discussions of individual securities, or the markets generally, or any Wells Fargo Fund are not intended as individual recommendations. Future events or results may vary significantly from those expressed in any forward-looking statements. The views expressed are subject to change at any time in response to changing circumstances in the market. Wells Fargo Asset Management and the Fund disclaim any obligation to publicly update or revise any views expressed or forward-looking statements.
INVESTMENT PRODUCTS: NOT FDIC INSURED ◾ NO BANK GUARANTEE ◾ MAY LOSE VALUE
Wells Fargo Funds | 1
Table of Contents
Performance highlights (unaudited)
Wells Fargo Emerging Markets Bond Fund1
Investment objective
The Fund seeks to replicate the total return of the JP Morgan EMBI Global Diversified Index, before fees and expenses.
Manager
Wells Fargo Funds Management, LLC
Subadviser for the affiliated master portfolio
Wells Fargo Asset Management (International) Limited
Portfolio managers
Michael Lee
Alex Perrin
Average annual total returns (%) as of February 29, 2020
| Since | Expense ratios2 (%) | |||||||||||||||||
| Inception date | 1 year | inception | Gross | Net3 | ||||||||||||||
| Wells Fargo Emerging Markets Bond Fund (WBEMX) | 8-3-2017 | 9.10 | 4.81 | 11.56 | 0.00 | |||||||||||||
| JP Morgan EMBI Global Diversified Index4 | – | 9.68 | 5.00 | * | – | – | ||||||||||||
| JP Morgan EMBI Global Index5 | – | 9.89 | 4.50 | * | – | – | ||||||||||||
| * | Based on the inception date of the Fund. |
Figures quoted represent past performance, which is no guarantee of future results, and do not reflect taxes that a shareholder may pay on an investment in a fund. Investment return and principal value of an investment will fluctuate so that an investor’s shares, when redeemed, may be worth more or less than their original cost. Current performance may be lower or higher than the performance data quoted, which assumes the reinvestment of dividends and capital gains.
Index returns do not include transaction costs associated with buying and selling securities, any mutual fund fees or expenses, or any taxes. It is not possible to invest directly in an index.
Shares are sold without afront-end sales charge or contingent deferred sales charge.
Bond values fluctuate in response to the financial condition of individual issuers, general market and economic conditions, and changes in interest rates. Changes in market conditions and government policies may lead to periods of heightened volatility in the bond market and reduced liquidity for certain bonds held by the Fund. In general, when interest rates rise, bond values fall and investors may lose principal value. Interest rate changes and their impact on the Fund and its share price can be sudden and unpredictable. The use of derivatives may reduce returns and/or increase volatility. Certain investment strategies tend to increase the total risk of an investment (relative to the broader market). High-yield securities have a greater risk of default and tend to be more volatile than higher-rated debt securities. The Fund is exposed to foreign investment risk and focused portfolio risk. Consult the Fund’s prospectus for additional information on these and other risks.
Please see footnotes on page 3.
2 | Wells Fargo Funds
Table of Contents
Performance highlights (unaudited)
Wells Fargo Emerging Markets Bond Fund (continued)
| Growth of $10,000 investment as of February 29, 20206 |
|
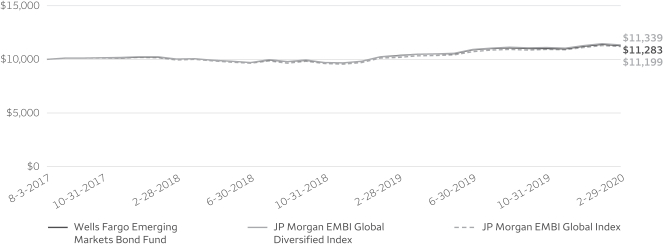
| 1 | The Fund is a feeder fund that invests substantially all of its assets in a single affiliated master portfolio of the Wells Fargo Master Trust with an identical investment objective. References to the investment activities of the Fund are intended to refer to the investment activities of the affiliated master portfolio in which it invests. |
| 2 | Reflects the expense ratios as stated in the most recent prospectus. The expense ratios shown are subject to change and may differ from the annualized expense ratios shown in the financial highlights of this report. |
| 3 | The manager has contractually committed through June 30, 2020, to waive fees and/or reimburse expenses to the extent necessary to cap total annual fund operating expenses after fee waivers at 0.00%. Brokerage commissions, stamp duty fees, interest, taxes, acquired fund fees and expenses from unaffiliated funds in which the affiliated master portfolio invests and extraordinary expenses are excluded from the expense cap. All other acquired fund fees and expenses from the affiliated master portfolio are included in the expense cap. Prior to or after the commitment expiration date, the cap may be increased or the commitment to maintain the cap may be terminated only with the approval of the Board of Trustees. Without this cap, the Fund’s returns would have been lower. The expense ratio paid by an investor is the net expense ratio (the total annual fund operating expenses after fee waivers) as stated in the prospectus. |
| 4 | The JP Morgan Emerging Markets Bond Index (EMBI) Global Diversified Index is a composite index representing an unleveraged investment in emerging market bonds that is broadly based across the spectrum of emerging market bonds and includes reinvestment of income (to represent real assets). You cannot invest directly in an index. |
| 5 | The JP Morgan EMBI Global Index tracks total returns for traded external debt instruments in the emerging markets. The index includes US dollar denominated Brady bonds, loans, and Eurobonds with an outstanding face value of at least $500 million. You cannot invest directly in an index. |
| 6 | The chart compares the performance of the Fund since inception with the JP Morgan EMBI Global Diversified Index and the JP Morgan EMBI Global Index. The chart assumes a hypothetical investment of $10,000 in the Fund and reflects all operating expenses of the Fund. |
| 7 | The ten largest holdings, excluding cash, cash equivalents and any money market funds, are calculated based on the value of the securities of the affiliated master portfolio allocable to the Fund divided by the total net assets of the Fund. Holdings are subject to change and may have changed since the date specified. |
| 8 | Amounts represent the portfolio allocation of the affiliated master portfolio and are calculated based on the total long-term investments of the affiliated master portfolio. These amounts are subject to change and may have changed since the date specified. |
Wells Fargo Funds | 3
Table of Contents
Performance highlights (unaudited)
Wells Fargo Emerging Markets Bond Fund (continued)
MANAGER’S DISCUSSION
Fund highlights
| ∎ | The Fund underperformed its benchmark, the JP Morgan EMBI Global Diversified Index, for the12-month period that ended February 29, 2020. The Fund also underperformed the JP Morgan EMBI Global Index for the same period. |
| ∎ | At the country level, Ukraine, Uruguay, and Mozambique performed particularly well over the reporting period. The worst country returns were seen in Lebanon, Venezuela, and Argentina. |
| ∎ | The strong absolute performance of the asset class over the reporting period was supported by increased accommodation from core market central banks that kept risk appetite engaged. |
| ∎ | Investment-grade bond issuers tended to outperform their lower-rated peers, while regionally Asia and Europe outperformed and the Middle East lagged. |
Market commentary
Absolute returns for the Fund and its benchmark were robustly positive over the reporting period, with particularly strong performance in the second and fourth quarters of 2019. Global growth trended lower gently but consistently, with weakness in manufacturing driven by trade disagreements between China and the United States. A series of U.S. interest rate cuts, along with increased support from several other major central banks, was supportive for the asset class. Some index constituents, such as Lebanon, faced fierce domestic upheaval and questions around debt sustainability but there was limited spillover into other emerging markets. The U.S. dollar traded largely sideways versus other developed market currencies over the reporting period.
Volatility picked up into the latter months of the reporting period. The emergence of the coronavirus(COVID-19) in China—and its rapid spread—is raising serious questions about the prospects for the global economy. Risk assets thus ended the reporting period under pressure and equity markets and higher-yielding currencies continue to look vulnerable. Bond markets are performing well, with sharp falls in yields across both emerging and developed markets, as investors rush to price more central bank support into the market. In the short term, it appears that volatility is set to remain elevated. Longer-term dynamics depend on how quickly the novelCOVID-19 peaks and dissipates. The disease will undoubtedly take a material toll on 2020 growth numbers, but there are still hopes of a rapid rebound once the disease is contained. Current dynamics suggest that central banks will remain accommodative for the foreseeable future. This could be supportive for sovereign fixed income although the size and speed of recent falls in bond yields suggest much of this central bank action could already be priced in.
Investment approach
The investment objective of the Fund seeks to replicate, rather than precisely duplicate, the total return of the JP Morgan EMBI Global Diversified Index before fees and expenses through a sample replication process. The index is a composite index representing an unleveraged investment in emerging market bonds that is broadly based across the spectrum of emerging market bonds and includes reinvestment of income. One cannot invest directly in the index, and timing of cash flows and other practical issues may alter the Fund’s tracking error, which is a measure of how closely a portfolio tracks the index to which it is benchmarked.
Rather than purchase every security in the index, the underlying portfolio uses an optimization process that seeks to balance the replication of index performance with the minimization of security transaction costs. Using a stratified sampling technique, securities are selected and purchased in an effort to construct a portfolio that exhibits risk factors and other characteristics and performance of the index without incurring the level of transaction costs that would be associated with purchasing every security in the index.
Under normal circumstances, the Fund is expected to concentrate its investments in quality-rating segments and countries to approximately the same extent that the index is concentrated in such quality-rating segments or countries. The components of the index may change over time, and the index may or may not be concentrated in certain quality-rating segments or countries at any particular time. We continually monitor the performance and composition of the index and adjust the Fund’s portfolio as necessary to reflect changes to the index.
4 | Wells Fargo Funds
Table of Contents
Performance highlights (unaudited)
Wells Fargo Emerging Markets Bond Fund (continued)
| Ten largest holdings (%) as of February 29, 20207 | ||||
Dominican Republic, 5.95%, 1-25-2027 | 2.04 | |||
Federative Republic of Brazil, 4.63%, 1-13-2028 | 1.55 | |||
Republic of Panama, 4.00%, 9-22-2024 | 1.42 | |||
Republic of South Africa, 4.85%, 9-30-2029 | 1.41 | |||
Republic of Colombia, 3.88%, 4-25-2027 | 1.36 | |||
Oriental Republic of Uruguay, 5.10%, 6-18-2050 | 1.32 | |||
Republic of Turkey, 6.63%, 2-17-2025 | 1.32 | |||
Qatar Government, 4.63%, 6-2-2046 | 1.31 | |||
Perusahaan Penerbit SBSN Indonesia III,4.55%, 3-29-2026 | 1.30 | |||
Republic of Peru, 6.55%, 3-14-2037 | 1.30 | |||
| Portfolio allocation as of February 29, 20208 |
|
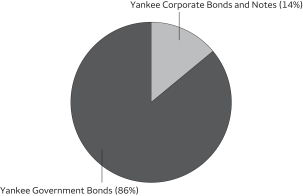
Please see footnotes on page 3.
Wells Fargo Funds | 5
Table of Contents
Performance highlights (unaudited)
Wells Fargo High Yield Corporate Bond Fund1
Investment objective
The Fund seeks to replicate the total return of the Wells Fargo U.S. High Yield Bond Index, before fees and expenses.
Manager
Wells Fargo Funds Management, LLC
Subadviser for the affiliated master portfolio
Wells Capital Management Incorporated
Portfolio managers
Janet S. Rilling, CFA®‡, CPA
Michael J. Schueller, CFA®‡
Average annual total returns (%) as of February 29, 2020
| Since | Expense ratios2 (%) | |||||||||||||||||
| Inception date | 1 year | inception | Gross | Net3 | ||||||||||||||
| Wells Fargo High Yield Corporate Bond Fund (WYCBX) | 8-3-2017 | 4.29 | 3.38 | 11.68 | 0.00 | |||||||||||||
| Wells Fargo U.S. High Yield Bond Index4 | – | 5.02 | 3.92 | * | – | – | ||||||||||||
| Bloomberg Barclays U.S. Corporate High Yield 2% Issuer Capped Index5 | – | 6.10 | 4.43 | * | – | – | ||||||||||||
| * | Based on the inception date of the Fund. |
Figures quoted represent past performance, which is no guarantee of future results, and do not reflect taxes that a shareholder may pay on an investment in a fund. Investment return and principal value of an investment will fluctuate so that an investor’s shares, when redeemed, may be worth more or less than their original cost. Current performance may be lower or higher than the performance data quoted, which assumes the reinvestment of dividends and capital gains.
Index returns do not include transaction costs associated with buying and selling securities, any mutual fund fees or expenses, or any taxes. It is not possible to invest directly in an index.
Shares are sold without afront-end sales charge or contingent deferred sales charge.
Bond values fluctuate in response to the financial condition of individual issuers, general market and economic conditions, and changes in interest rates. Changes in market conditions and government policies may lead to periods of heightened volatility in the bond market and reduced liquidity for certain bonds held by the Fund. In general, when interest rates rise, bond values fall and investors may lose principal value. Interest rate changes and their impact on the Fund and its share price can be sudden and unpredictable. The use of derivatives may reduce returns and/or increase volatility. High-yield securities have a greater risk of default and tend to be more volatile than higher-rated debt securities. The Fund is exposed to focus portfolio risk, index tracking risk, and foreign investment risk. Consult the Fund’s prospectus for additional information on these and other risks.
Please see footnotes on page 7.
6 | Wells Fargo Funds
Table of Contents
Performance highlights (unaudited)
Wells Fargo High Yield Corporate Bond Fund (continued)
| Growth of $10,000 investment as of February 29, 20206 |
|

| ‡ | CFA® and Chartered Financial Analyst® are trademarks owned by CFA Institute. |
| 1 | The Fund is a feeder fund that invests substantially all of its assets in a single affiliated master portfolio of the Wells Fargo Master Trust with an identical investment objective. References to the investment activities of the Fund are intended to refer to the investment activities of the affiliated master portfolio in which it invests. |
| 2 | Reflects the expense ratios as stated in the most recent prospectus. The expense ratios shown are subject to change and may differ from the annualized expense ratios shown in the financial highlights of this report. |
| 3 | The manager has contractually committed through June 30, 2020, to waive fees and/or reimburse expenses to the extent necessary to cap total annual fund operating expenses after fee waivers at 0.00%. Brokerage commissions, stamp duty fees, interest, taxes, acquired fund fees and expenses from unaffiliated funds in which the affiliated master portfolio invests and extraordinary expenses are excluded from the expense cap. All other acquired fund fees and expenses from the affiliated master portfolio are included in the expense cap. Prior to or after the commitment expiration date, the cap may be increased or the commitment to maintain the cap may be terminated only with the approval of the Board of Trustees. Without this cap, the Fund’s returns would have been lower. The expense ratio paid by an investor is the net expense ratio (the total annual fund operating expenses after fee waivers) as stated in the prospectus. |
| 4 | The Wells Fargo U.S. High Yield Bond Index is a rules-based index designed to measure the performance of U.S. dollar denominated below investment-grade corporate debt issued by U.S. or foreign issuers that have a remaining maturity of at least one year, regardless of optionality; it is constructed to provide increased diversification and liquidity versus traditional passive high yield bond indices. You cannot invest directly in an index. |
| 5 | The Bloomberg Barclays U.S. Corporate High Yield 2% Issuer Capped Index is an unmanaged, U.S. dollar-denominated, nonconvertible, noninvestment-grade debt index and limits the exposure of each issuer to 2% of the total market value. The index consists of domestic corporate bonds rated Ba and below with a minimum outstanding amount of $150 million. You cannot invest directly in an index. |
| 6 | The chart compares the performance of the Fund since inception with the Wells Fargo U.S. High Yield Bond Index and the Bloomberg Barclays U.S. Corporate High Yield 2% Issuer Capped Index. The chart assumes a hypothetical investment of $10,000 in the Fund and reflects all operating expenses of the Fund. |
| 7 | The ten largest holdings, excluding cash, cash equivalents and any money market funds, are calculated based on the value of the securities of the affiliated master portfolio allocable to the Fund divided by the total net assets of the Fund. Holdings are subject to change and may have changed since the date specified. |
| 8 | The credit quality distribution of portfolio holdings reflected in the chart is based on ratings from Standard & Poor’s, Moody’s Investors Service, and/or Fitch Ratings Ltd. Credit quality ratings apply to the underlying holdings of the affiliated master portfolio and not to the Fund itself. The percentages of the Fund’s portfolio with the ratings depicted in the chart are calculated based on the total market value of fixed income securities held by the affiliated master portfolio. If a security was rated by all three rating agencies, the middle rating was utilized. If rated by two of three rating agencies, the lower rating was utilized, and if rated by one of the rating agencies, that rating was utilized. Standard & Poor’s rates the creditworthiness of bonds, ranging from AAA (highest) to D (lowest). Ratings from A to CCC may be modified by the addition of a plus (+) or minus (-) sign to show relative standing within the rating categories. Standard & Poor’s rates the creditworthiness of short-term notes fromSP-1 (highest) toSP-3 (lowest). Moody’s rates the creditworthiness of bonds, ranging from Aaa (highest) to C (lowest). Ratings Aa to B may be modified by the addition of a number 1 (highest) to 3 (lowest) to show relative standing within the ratings categories. Moody’s rates the creditworthiness of short-term U.S.tax-exempt municipal securities from MIG 1/VMIG 1 (highest) to SG (lowest). Fitch rates the creditworthiness of bonds, ranging from AAA (highest) to D (lowest). Credit quality distribution is subject to change and may have changed since the date specified. |
Wells Fargo Funds | 7
Table of Contents
Performance highlights (unaudited)
Wells Fargo High Yield Corporate Bond Fund (continued)
MANAGER’S DISCUSSION
Fund highlights
| ∎ | The Fund underperformed its benchmark, the Wells Fargo U.S. High Yield Bond Index, along with the Bloomberg Barclays U.S. Corporate High Yield 2% Issuer Capped Index for the12-month period that ended February 29, 2020. |
| ∎ | CCC-rated bonds underperformed relative to other quality-rating sectors.BB-rated bonds were the best-performing rating category, followed closely byB-rated bonds.BB-rated bonds were helped by crossover buyers from the investment-grade universe, where yields hitall-time lows during the period, in addition to being longer duration and benefiting more from lower rates across the curve. |
| ∎ | From a sector perspective, certain smaller financial sectors led performance, including banking and insurance. These were followed closely by certain industrial sectors, such as consumer cyclicals, transportation, and communications. Energy-related sectors underperformed the index meaningfully, posting negative returns. |
Market commentary
Market participants were fixated on trade wars between the U.S. and other countries, particularly China, which drove sentiment throughout the period. Broad-based U.S. equity markets hitall-time highs during the period, while interest rates were materially lower across the curve. The first half of the period was characterized by volatile markets and falling rates, leading to an inverted yield curve, which sparked concerns from market participants. During the second half of the period, the U.S. Federal Open Market Committee (FOMC) lowered the federal funds target rate three times, with the range ending the period at 1.50% to 1.75%. Overnight funding issues in September also led the FOMC to put in additional liquidity measures by purchasing Treasury bills and easing liquidity for market participants.
Lastly, as the period ended, the world began to interpret how the spreading of the novel coronavirus(COVID-19) would affect economies around the globe. While the U.S. administration said it was working closely with the Chinese government to assist and understand the impacts, Federal Reserve Chairman Jerome Powell said it would take time to assess the impact of theCOVID-19 outbreak on the U.S. economy.
While the U.S. Treasury curve steepened, the decline in rates dominated news. Yields on30-year U.S. Treasuries moved from 3.09% to 1.65% during the period. Similarly, the10-year U.S. Treasury yield fell 1.60%, ending at 1.13%, while the short end was also lower. The difference between the2-year and30-year U.S. Treasury yield ended the period at 79 basis points (bps; 100 bps equal 1.00%) from 57 bps to start the period, while the difference between the10-year and30-year U.S. Treasury yield ended the fiscal year at 52 bps from 36 bps at the outset of the period. Lower rates across the curve resulted in higher absolute returns in the long end of the curve, where duration impacts dominated price movements.
Higher-quality components within high yield meaningfully outperformed, withBB-rated debt posting the highest absolute total returns, followed byB-rated and thenCCC-rated debt, which broadly posted negative returns for the period. Almost all sectors reported positive absolute returns, with certain financial subsectors posting the best returns. Energy was the worst-performing sector, posting negative returns for the period. Financials were followed closely in returns by certain industrial sectors, including transportation, capital goods, communications, and consumer cyclicals. Higher-qualityBB-rated debt outperformance can also be attributed to cross-over buyers from the investment-grade space as yields there hit near record lows, as well asBB-rated debt tending to be longer duration, supported by lower rates across the Treasury curve.
Investment approach
The investment objective of the Fund seeks to replicate rather than precisely duplicate the total return of the Wells Fargo U.S. High Yield Bond Index, before fees and expenses. The index is a rules-based index designed to measure the performance of U.S.-dollar-denominated below-investment-grade corporate debt issued by U.S. or foreign issuers that have a remaining maturity of at least one year, regardless of optionality. It is constructed to provide increased diversification and liquidity versus traditional passive high-yield bond indices. One cannot invest directly in the index. The timing of cash flows and other practical issues may alter the Fund’s tracking error, which is a measure of how closely a portfolio tracks the index to which it is benchmarked.
8 | Wells Fargo Funds
Table of Contents
Performance highlights (unaudited)
Wells Fargo High Yield Corporate Bond Fund (continued)
Rather than purchase every security in the index, the underlying portfolio uses an optimization process that seeks to balance the replication of index performance with the minimization of security transaction costs. Using a stratified sampling technique, securities are selected and purchased in an effort to construct a portfolio that exhibits risk factors and other characteristics and performance of the index without incurring the level of transaction costs that would be associated with purchasing every security in the index.
| Ten largest holdings (%) as of February 29, 20207 | ||||
Springleaf Finance Corporation, 7.13%,3-15-2026 | 0.76 | |||
DISH DBS Corporation, 5.88%,11-15-2024 | 0.76 | |||
iHeartCommunications Incorporated, 6.38%,5-1-2026 | 0.68 | |||
CenturyLink Incorporated Series W, 6.75%,12-1-2023 | 0.67 | |||
Diamond Sports Group LLC, 5.38%,8-15-2026 | 0.65 | |||
Altice Finco SA, 7.63%,2-15-2025 | 0.62 | |||
Refinitiv U.S. Holdings Company, 8.25%,11-15-2026 | 0.61 | |||
Bausch Health Companies Incorporated, 8.50%,1-31-2027 | 0.61 | |||
Lennar Corporation, 4.50%,4-30-2024 | 0.59 | |||
Hughes Satellite Systems Company, 7.63%,6-15-2021 | 0.58 | |||
| Credit quality as of February 29, 20208 |
|
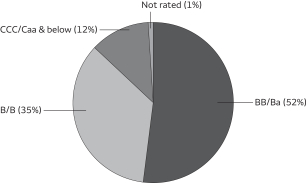
Please see footnotes on page 7.
Wells Fargo Funds | 9
Table of Contents
Performance highlights (unaudited)
Wells Fargo International Government Bond Fund1
Investment objective
The Fund seeks to replicate the total return of the Wells Fargo International Government Bond Index, before fees and expenses.
Manager
Wells Fargo Funds Management, LLC
Subadviser for the affiliated master portfolio
Wells Fargo Asset Management (International), Limited
Portfolio managers
Michael Lee
Alex Perrin
Average annual total returns (%) as of February 29, 2020
| Since | Expense ratios2 (%) | |||||||||||||||||
| Inception date | 1 year | inception | Gross | Net3 | ||||||||||||||
| Wells Fargo International Government Bond Fund (WIGBX) | 10-31-2017 | 6.33 | * | 3.01 | 11.96 | 0.00 | ||||||||||||
| Wells Fargo International Government Bond Index4 | – | 6.18 | 3.04 | ** | – | – | ||||||||||||
| Bloomberg Barclays Global Treasuryex-US Total Return Index5 | – | 5.45 | 3.01 | ** | – | – | ||||||||||||
| * | Total return differs from the return in the Financial Highlights in this report. The total return presented is calculated based on the NAV at which the shareholder transactions were processed. The NAV and total return presented in the Financial Highlights reflects certain adjustments made to the net assets of the Fund that are necessary under U.S. generally accepted accounting principles. |
| ** | Based on the inception date of the Fund. |
Figures quoted represent past performance, which is no guarantee of future results, and do not reflect taxes that a shareholder may pay on an investment in a fund. Investment return and principal value of an investment will fluctuate so that an investor’s shares, when redeemed, may be worth more or less than their original cost. Current performance may be lower or higher than the performance data quoted, which assumes the reinvestment of dividends and capital gains.
Index returns do not include transaction costs associated with buying and selling securities, any mutual fund fees or expenses, or any taxes. It is not possible to invest directly in an index.
Shares are sold without afront-end sales charge or contingent deferred sales charge.
Bond values fluctuate in response to the financial condition of individual issuers, general market and economic conditions, and changes in interest rates. Changes in market conditions and government policies may lead to periods of heightened volatility in the bond market and reduced liquidity for certain bonds held by the Fund. In general, when interest rates rise, bond values fall and investors may lose principal value. Interest rate changes and their impact on the Fund and its share price can be sudden and unpredictable. The use of derivatives may reduce returns and/or increase volatility. Certain investment strategies tend to increase the total risk of an investment (relative to the broader market). High-yield securities have a greater risk of default and tend to be more volatile than higher-rated debt securities. The Fund is exposed to foreign investment risk and focused portfolio risk. Consult the Fund’s prospectus for additional information on these and other risks.
Please see footnotes on page 11.
10 | Wells Fargo Funds
Table of Contents
Performance highlights (unaudited)
Wells Fargo International Government Bond Fund (continued)
| Growth of $10,000 investment as of February 29, 20206 |
|
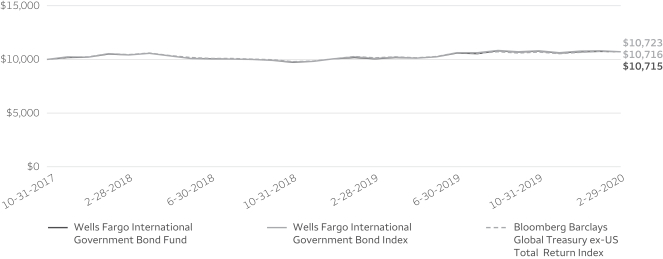
| 1 | The Fund is a feeder fund that invests substantially all of its assets in a single affiliated master portfolio of the Wells Fargo Master Trust with an identical investment objective. References to the investment activities of the Fund are intended to refer to the investment activities of the affiliated master portfolio in which it invests. |
| 2 | Reflects the expense ratios as stated in the most recent prospectus. The expense ratios shown are subject to change and may differ from the annualized expense ratios shown in the financial highlights of this report. |
| 3 | The manager has contractually committed through June 30, 2020, to waive fees and/or reimburse expenses to the extent necessary to cap total annual fund operating expenses after fee waivers at 0.00%. Brokerage commissions, stamp duty fees, interest, taxes, acquired fund fees and expenses from unaffiliated funds in which the affiliated master portfolio invests and extraordinary expenses are excluded from the expense cap. All other acquired fund fees and expenses from the affiliated master portfolio are included in the expense cap. Prior to or after the commitment expiration date, the cap may be increased or the commitment to maintain the cap may be terminated only with the approval of the Board of Trustees. Without this cap, the Fund’s returns would have been lower. The expense ratio paid by an investor is the net expense ratio (the total annual fund operating expenses after fee waivers) as stated in the prospectus. |
| 4 | The Wells Fargo International Government Bond Index is a rules-based index designed to track the performance of local currency government debt of both developed and emerging market countries excluding the United States. The index is composed of fixed rate government bonds, issued by countries other than the U.S., having an investment grade rating or classified as investment grade by Bloomberg Index Services Limited. You cannot invest directly in an index. |
| 5 | The Bloomberg Barclays Global Treasuryex-US Total Return Index is a subset of the flagship Global Treasury Index that does not have any exposure to U.S. debt. This multi-currency benchmark includes investment grade, fixed-rate bonds issued by governments in their native currencies. You cannot invest directly in an index. |
| 6 | The chart compares the performance of the Fund since inception with the Wells Fargo International Government Bond Index and the Bloomberg Barclays Global Treasuryex-US Total Return Index. The chart assumes a hypothetical investment of $10,000 in the Fund and reflects all operating expenses of the Fund. |
| 7 | The ten largest holdings, excluding cash, cash equivalents and any money market funds, are calculated based on the value of the securities of the affiliated master portfolio allocable to the Fund divided by the total net assets of the Fund. Holdings are subject to change and may have changed since the date specified. |
| 8 | Amounts represent the composition of the affiliated master portfolio and are calculated based on the total long-term investments of the affiliated master portfolio. These amounts are subject to change and may have changed since the date specified. |
Wells Fargo Funds | 11
Table of Contents
Performance highlights (unaudited)
Wells Fargo International Government Bond Fund (continued)
MANAGER’S DISCUSSION
Fund highlights
| ∎ | The Fund outperformed its benchmark, the Wells Fargo International Government Bond Index, as well as the Bloomberg Barclays Global Treasuryex-U.S. Total Return Index for the12-month period that ended February 29, 2020. |
| ∎ | Absolute returns for both the Fund and the index were positive over the reporting period, as increased accommodation from central banks drove bond yields lower. |
| ∎ | The bond markets of Italy, Australia, and the United States led the way over the reporting period. At the other end of the spectrum were the bond markets of Norway, Japan, and Chile. |
| ∎ | The Swiss franc and the Japanese yen were thetop-performing currencies, followed by the U.S. dollar. The weakest currencies were the Norwegian krone, New Zealand dollar, and Australian dollar. |
Market commentary
Absolute returns for the Fund and its benchmark were positive over the reporting period, with particularly strong performance in the second and fourth quarters of 2019. Global growth trended lower gently but consistently, with weakness in manufacturing driven by trade disagreements between China and the United States. A series of U.S. interest rate cuts, along with increased support from several other major central banks, was supportive for the asset class. Some index constituents, such as Lebanon, faced fierce domestic upheaval and questions around debt sustainability but there was limited spillover into other emerging markets. The U.S. dollar traded largely sideways versus other developed market currencies over the reporting period.
Volatility picked up into the latter months of the reporting period. The emergence of the coronavirus in China—and its rapid spread—is raising serious questions about the prospects for the global economy. Risk assets thus ended the reporting period under pressure and equity markets and higher-yielding currencies continue to look vulnerable. Bond markets are performing well, with sharp falls in yields across both emerging and developed markets, as investors rush to price more central bank support into the market. In the short term, it appears that volatility is set to remain elevated. Longer-term dynamics depend on how quickly the novel coronavirus(COVID-19) peaks and dissipates. The disease will undoubtedly take a material toll on 2020 growth numbers, but there are still hopes of a rapid rebound once the disease is contained. Current dynamics suggest that central banks will remain accommodative for the foreseeable future. This could be supportive for sovereign fixed income although the size and speed of recent falls in bond yields suggest much of this central bank action could already be priced in.
Investment approach
The investment objective of the Fund seeks to replicate rather than precisely duplicate the total return performance of the Wells Fargo International Government Bond Index before fees and expenses. The index is designed to track the performance of local currency government debt of both developed and emerging market countries excluding the U.S. and is composed of fixed-rate,non-U.S.-dollar-denominated bonds having a remaining maturity of at least one year, regardless of optionality, and an investment-grade rating or classification as investment grade by Bloomberg Index Services Limited.
The index selects and weights securities by evaluating them on a country, currency, and individual basis. The evaluation is intended to create a subset of the Wells Fargo International Government Bond Index by screening securities based on current and consensus expected trends in market conditions, valuations, and currencies to arrive at projections for yield curves (and hence bond returns) and currency returns. The screening process combined with return, volatility, correlation, and constraint analysis determines the final index constituency based on projected value, to be replicated via a sampling process.
Rather than purchase every security in the index, the underlying portfolio uses an optimization process that seeks to balance the replication of index performance with the minimization of security transaction costs. Using a stratified sampling technique, securities are selected and purchased in an effort to construct a portfolio that exhibits risk factors and other characteristics of the index and seeks to match the performance of the index without incurring the level of transaction costs that would be associated with purchasing every security in the index. One cannot invest directly in the index, and the timing of cash flows and other practical issues may alter the Fund’s tracking error, which is a measure of how closely a portfolio tracks the index to which it is benchmarked.
12 | Wells Fargo Funds
Table of Contents
Performance highlights (unaudited)
Wells Fargo International Government Bond Fund (continued)
Under normal circumstances, the Fund is expected to invest approximately the same percentage in quality-rating segments and countries as the index. The components of the index may change over time, and the index may or may not be concentrated in certain quality-rating segments or countries at any particular time. We continually monitor the performance and composition of the index and adjust the Fund’s portfolio as necessary to reflect changes to the index.
| Ten largest holdings (%) as of February 29, 20207 | ||||
Japan, 0.10%,6-20-2021 | 16.02 | |||
United Kingdom Gilt, 0.75%,7-22-2023 | 7.77 | |||
Italy Buoni Poliennali del Tesoro, 3.85%,9-1-2049 | 4.38 | |||
France Government Bond, 1.25%,5-25-2036 | 4.29 | |||
Republic of Austria, 0.50%,2-20-2029 | 4.08 | |||
Japan Government 5 Year Bond Series 136,0.10%, 6-20-2023 | 4.04 | |||
Spain Government Bond, 1.40%,7-30-2028 | 3.95 | |||
Belgium Government Bond Series 71,3.75%, 6-22-2045 | 3.90 | |||
Finland Government Bond, 0.01%,9-15-2023 | 3.87 | |||
Netherlands Government Bond, 0.25%,7-15-2029 | 3.84 | |||
| Country allocation as of February 29, 20208 |
|
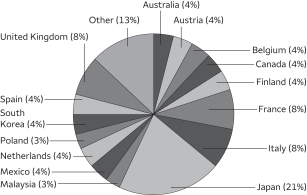
Please see footnotes on page 11.
Wells Fargo Funds | 13
Table of Contents
Performance highlights (unaudited)
Wells Fargo U.S. Core Bond Fund1
Investment objective
The Fund seeks to replicate the total return of the Wells Fargo U.S. Core Bond Index, before fees and expenses.
Manager
Wells Fargo Funds Management, LLC
Subadviser
Wells Capital Management Incorporated
Portfolio managers
Mark Clegg, CFA®‡
Christopher Y. Kauffman, CFA®‡
Janet S. Rilling, CFA®‡, CPA
Michael J. Schueller, CFA®‡
Michael Stanczyk
Noah M. Wise, CFA®‡
Average annual total returns (%) as of February 29, 2020
| Since | Expense ratios2 (%) | |||||||||||||||||
| Inception date | 1 year | inception | Gross | Net3 | ||||||||||||||
| Wells Fargo U.S. Core Bond Fund (WUSBX) | 8-3-2017 | 11.80 | 4.94 | 11.25 | 0.00 | |||||||||||||
| Wells Fargo U.S. Core Bond Index4 | – | 11.65 | 4.94 | * | – | – | ||||||||||||
| Bloomberg Barclays U.S. Aggregate Bond Index5 | – | 11.68 | 4.98 | * | – | – | ||||||||||||
| * | Based on the inception date of the Fund. |
Figures quoted represent past performance, which is no guarantee of future results, and do not reflect taxes that a shareholder may pay on an investment in a fund. Investment return and principal value of an investment will fluctuate so that an investor’s shares, when redeemed, may be worth more or less than their original cost. Current performance may be lower or higher than the performance data quoted, which assumes the reinvestment of dividends and capital gains.
Index returns do not include transaction costs associated with buying and selling securities, any mutual fund fees or expenses, or any taxes. It is not possible to invest directly in an index.
Shares are sold without afront-end sales charge or contingent deferred sales charge.
Bond values fluctuate in response to the financial condition of individual issuers, general market and economic conditions, and changes in interest rates. Changes in market conditions and government policies may lead to periods of heightened volatility in the bond market and reduced liquidity for certain bonds held by the Fund. In general, when interest rates rise, bond values fall and investors may lose principal value. Interest rate changes and their impact on the Fund and its share price can be sudden and unpredictable. The use of derivatives may reduce returns and/or increase volatility. The Fund is exposed to focused portfolio risk, index tracking risk, and mortgage- and asset-backed securities risk. Consult the Fund’s prospectus for additional information on these and other risks.
Please see footnotes on page 15.
14 | Wells Fargo Funds
Table of Contents
Performance highlights (unaudited)
Wells Fargo U.S. Core Bond Fund (continued)
| Growth of $10,000 investment as of February 29, 20206 |
|
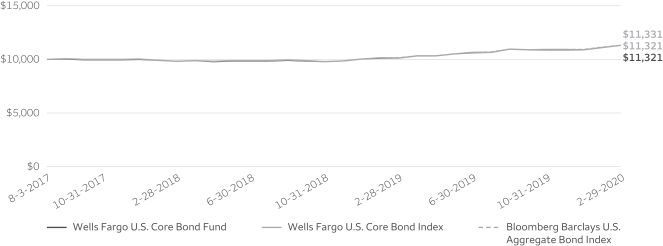
| ‡ | CFA® and Chartered Financial Analyst®are trademarks owned by CFA Institute. |
| 1 | The Fund is afund-of-funds that invests substantially all of its assets in two affiliated master portfolios of the Wells Fargo Master Trust in varying proportions. References to the investment activities of the Fund are intended to refer to the investment activities of the affiliated master portfolios in which it invests. |
| 2 | Reflects the expense ratios as stated in the most recent prospectus, which include the impact of 0.09% of acquired fund fees and expenses representing the net expenses from affiliated master portfolios. The expense ratios shown are subject to change and may differ from the annualized expense ratios shown in the financial highlights of this report. |
| 3 | The manager has contractually committed through June 30, 2020, to waive fees and/or reimburse expenses to the extent necessary to cap total annual fund operating expenses after fee waivers at 0.00%. Brokerage commissions, stamp duty fees, interest, taxes, acquired fund fees and expenses from unaffiliated funds in which the affiliated master portfolios invest and extraordinary expenses are excluded from the expense cap. All other acquired fund fees and expenses from the affiliated master portfolios are included in the expense cap. Prior to or after the commitment expiration date, the cap may be increased or the commitment to maintain the cap may be terminated only with the approval of the Board of Trustees. Without this cap, the Fund’s returns would have been lower. The expense ratio paid by an investor is the net expense ratio (the total annual fund operating expenses after fee waivers) as stated in the prospectus. |
| 4 | The Wells Fargo U.S. Core Bond Index is a rules-based index designed to track the performance of fixed-rate, taxable, U.S. dollar denominated bonds, with an investment grade rating or classified as investment grade. The corporate bond component of the index is constructed to provide increased diversification and liquidity versus traditional passive corporate credit indexes. You cannot invest directly in an index. |
| 5 | The Bloomberg Barclays U.S. Aggregate Bond Index is a broad-based benchmark that measures the investment-grade, U.S.-dollar denominated, fixed-rate taxable bond market, including Treasuries, government-related and corporate securities, mortgage-backed securities (agency fixed-rate and hybrid adjustable-rate mortgage pass-throughs), asset-backed securities, and commercial mortgage-backed securities. You cannot invest directly in an index. |
| 6 | The chart compares the performance of the Fund since inception with the Wells Fargo U.S. Core Bond Index and the Bloomberg Barclays U.S. Aggregate Bond Index. The chart assumes a hypothetical investment of $10,000 in the Fund and reflects all operating expenses of the Fund. |
| 7 | The holdings, excluding cash, cash equivalents and any money market funds, are calculated based on the value of the investments divided by total net assets of the Fund. Holdings are subject to change and may have changed since the date specified. |
| 8 | The credit quality distribution of portfolio holdings reflected in the chart is based on ratings from Standard & Poor’s, Moody’s Investors Service, and/or Fitch Ratings Ltd. Credit quality ratings apply to the underlying holdings of the affiliated master portfolios and not to the Fund itself. The percentages of the Fund’s portfolio with the ratings depicted in the chart are calculated based on the total market value of fixed income securities held by the affiliated master portfolios. If a security was rated by all three rating agencies, the middle rating was utilized. If rated by two of three rating agencies, the lower rating was utilized, and if rated by one of the rating agencies, that rating was utilized. Standard & Poor’s rates the creditworthiness of bonds, ranging from AAA (highest) to D (lowest). Ratings from A to CCC may be modified by the addition of a plus (+) or minus (-) sign to show relative standing within the rating categories. Standard & Poor’s rates the creditworthiness of short-term notes fromSP-1 (highest) toSP-3 (lowest). Moody’s rates the creditworthiness of bonds, ranging from Aaa (highest) to C (lowest). Ratings Aa to B may be modified by the addition of a number 1 (highest) to 3 (lowest) to show relative standing within the ratings categories. Moody’s rates the creditworthiness of short-term U.S.tax-exempt municipal securities from MIG 1/VMIG 1 (highest) to SG (lowest). Fitch rates the creditworthiness of bonds, ranging from AAA (highest) to D (lowest). Credit quality distribution is subject to change and may have changed since the date specified. |
Wells Fargo Funds | 15
Table of Contents
Performance highlights (unaudited)
Wells Fargo U.S. Core Bond Fund (continued)
MANAGER’S DISCUSSION
Fund highlights
| ∎ | The Fund outperformed its benchmark, the Wells Fargo U.S. Core Bond Index, as well as the Bloomberg Barclays U.S. Aggregate Bond Index for the12-month period that ended February 29, 2020. |
| ∎ | Absolute returns were positive for the period for the Fund and the index, with corporate bonds outperforming thenon-corporate sectors. |
| ∎ | The long end of the yield curve performed best as rates fell across the curve during the period. |
| ∎ | Within the corporate sector, utilities outperformed financials and industrials, and lower-quality bonds outperformed. Within the securitized sector, commercial mortgage-backed securities (CMBS) outperformed mortgage pass-throughs and asset-backed securities (ABS). |
Market commentary
Market participants were fixated on trade wars between the U.S. and other countries, particularly China, which drove sentiment throughout the period. Broad-based U.S. equity markets hitall-time highs during the period, while interest rates were materially lower across the curve. The first half of the period was characterized by volatile markets and falling rates, leading to an inverted yield curve, which sparked concerns from market participants. During the second half of the period, the U.S. Federal Open Market Committee (FOMC) lowered the federal funds target rate three times, with the range ending the period at 1.50% to 1.75%. Overnight funding issues in September also led the FOMC to put in additional liquidity measures by purchasing Treasury bills and easing liquidity for market participants.
Lastly, as the period ended, the world began to interpret how the spreading of the novel coronavirus(COVID-19) would affect economies around the globe. While the U.S. administration said it was working closely with the Chinese government to assist and understand the impacts, Federal Reserve Chairman Jerome Powell said it would take time to assess the impact of theCOVID-19 outbreak on the U.S. economy.
While the U.S. Treasury curve steepened, the decline in rates dominated news. Yields on30-year U.S. Treasuries moved from 3.09% to 1.65% during the period. Similarly, the10-year U.S. Treasury yield fell 1.60%, ending at 1.13%, while the short end was also lower. The difference between the2-year and30-year U.S. Treasury yield ended the period at 79 basis points (bps; 100 bps equal 1.00%) from 57 bps to start the period, while the difference between the10-year and30-year U.S. Treasury yield ended the fiscal year at 52 bps from 36 bps at the outset of the period. Lower rates across the curve resulted in higher absolute returns in the long end of the curve, where duration impacts dominated price movements.
U.S. Treasuries and government-related local authorities outperformed other government-related sectors. Within corporates,BBB-rated issues tended to outperform. Utilities outperformed financials and industrials, and lower quality outperformed. Within the securitized sector, CMBS outpaced mortgage pass-throughs and ABS.
Investment approach
The investment objective of the Fund seeks to replicate but not precisely duplicate the total return of the Wells Fargo U.S. Core Bond Index before fees and expenses through a sample replication process. The index is a rules-based index designed to track the performance of fixed-rate, taxable, U.S.-dollar-denominated bonds with an investment-grade rating or classified as investment grade. The corporate bond component of the index is constructed to provide increased diversification and liquidity versus traditional passive corporate credit indices.
One cannot invest directly in the index, and the timing of cash flows and other practical issues may alter the Fund’s tracking error, which is a measure of how closely a portfolio tracks the index to which it is benchmarked.
The Fund invests substantially all of its assets in two underlying portfolios: the Wells Fargo Bloomberg Barclays U.S. Aggregateex-Corporate Portfolio and the Wells Fargo Investment Grade Corporate Bond Portfolio. The Fund’s allocation to the two underlying portfolios will mirror the percentage weighting of the noncorporate and corporate sectors of the index and, in combination, the Fund will attempt to track the performance, liquidity, and diversification characteristics of the index.
16 | Wells Fargo Funds
Table of Contents
Performance highlights (unaudited)
Wells Fargo U.S. Core Bond Fund (continued)
Rather than purchase every security in the indices that they seek to track, the underlying portfolios use an optimization process that seeks to balance the replication of the indices’ performance with the minimization of security transaction costs. Using a stratified sampling technique, securities are selected and purchased in an effort to construct a portfolio that exhibits risk factors and other characteristics of the indices and seeks to match the performance of the indices without incurring the level of transaction costs that would be associated with purchasing every security in the indices.
Under normal circumstances, the Fund is expected to invest approximately the same percentage in each industry as the indices do. The components of an index may change over time, and the index may or may not be concentrated in an industry at any particular time. We continually monitor the performance and composition of the indices and adjust the Fund’s portfolio as necessary to reflect any changes to the indices.
| Holdings (%) as of February 29, 20207 | ||||
Wells Fargo Bloomberg Barclays US Aggregateex-Corporate Portfolio | 75.05 | |||
Wells Fargo Investment Grade Corporate Bond Portfolio | 24.95 | |||
| Credit quality as of February 29, 20208 |
|
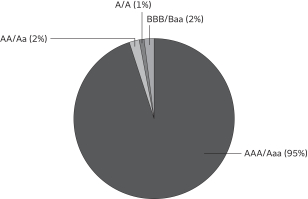
Please see footnotes on page 15.
Wells Fargo Funds | 17
Table of Contents
As a shareholder of the Fund, you incur ongoing costs, including other Fund expenses. This example is intended to help you understand your ongoing costs (in dollars) of investing in the Fund and to compare these costs with the ongoing costs of investing in other mutual funds.
The example is based on an investment of $1,000 invested at the beginning of thesix-month period and held for the entire period from September 1, 2019 to February 29, 2020.
Actual expenses
The “Actual” line of the table below provides information about actual account values and actual expenses. You may use the information in this line, together with the amount you invested, to estimate the expenses that you paid over the period. Simply divide your account value by $1,000 (for example, an $8,600 account value divided by $1,000 = 8.6), then multiply the result by the number in the “Actual” line under the heading entitled “Expenses paid during period” for your applicable class of shares to estimate the expenses you paid on your account during this period.
Hypothetical example for comparison purposes
The “Hypothetical” line of the table below provides information about hypothetical account values and hypothetical expenses based on the Fund’s actual expense ratio and an assumed rate of return of 5% per year before expenses, which is not the Fund’s actual return. The hypothetical account values and expenses may not be used to estimate the actual ending account balance or expenses you paid for the period. You may use this information to compare the ongoing costs of investing in the Fund and other funds. To do so, compare this 5% hypothetical example with the 5% hypothetical examples that appear in the shareholder reports of the other funds.
Please note that the expenses shown in the table are meant to highlight your ongoing costs only. Therefore, the “Hypothetical” line of the table is useful in comparing ongoing costs only and will not help you determine the relative total costs of owning different funds.
| Beginning account value 9-1-2019 | Ending account value 2-29-2020 | Expenses paid during the period¹ | Annualized net expense ratio2 | |||||||||||||
Emerging Markets Bond Fund | ||||||||||||||||
Actual | $ | 1,000.00 | $ | 1,019.38 | $ | 0.00 | 0.00 | % | ||||||||
Hypothetical (5% return before expenses) | $ | 1,000.00 | $ | 1,024.86 | $ | 0.00 | 0.00 | % | ||||||||
High Yield Corporate Bond Fund | ||||||||||||||||
Actual | $ | 1,000.00 | $ | 1,002.51 | $ | 0.00 | 0.00 | % | ||||||||
Hypothetical (5% return before expenses) | $ | 1,000.00 | $ | 1,024.86 | $ | 0.00 | 0.00 | % | ||||||||
International Government Bond Fund | ||||||||||||||||
Actual | $ | 1,000.00 | $ | 990.53 | $ | 0.00 | 0.00 | % | ||||||||
Hypothetical (5% return before expenses) | $ | 1,000.00 | $ | 1,024.86 | $ | 0.00 | 0.00 | % | ||||||||
U.S. Core Bond Fund | ||||||||||||||||
Actual | $ | 1,000.00 | $ | 1,033.70 | $ | 0.00 | 0.00 | % | ||||||||
Hypothetical (5% return before expenses) | $ | 1,000.00 | $ | 1,024.86 | $ | 0.00 | 0.00 | % | ||||||||
| 1 | Expenses paid is equal to the annualized net expense ratio multiplied by the average account value over the period, multiplied by the number of days in the most recent fiscal half-year divided by the number of days in the fiscal year (to reflect theone-half-year period). |
| 2 | Amounts reflect net expenses allocated from the affiliated Master Portfolio(s) in which the Fund invests. |
18 | Wells Fargo Funds
Table of Contents
Portfolio of investments—February 29, 2020
| Value | ||||||||||||||||
| Investment Companies: 99.35% | ||||||||||||||||
| Affiliated Master Portfolio: 99.35% | ||||||||||||||||
Wells Fargo Emerging Markets Bond Portfolio | $ | 1,020,427 | ||||||||||||||
|
| |||||||||||||||
Total Investment Companies (Cost $1,024,257) |
| 1,020,427 | ||||||||||||||
|
| |||||||||||||||
| Total investments in securities (Cost $1,024,257) | 99.35 | % | 1,020,427 | |||||
Other assets and liabilities, net | 0.65 | 6,655 | ||||||
|
|
|
| |||||
| Total net assets | 100.00 | % | $ | 1,027,082 | ||||
|
|
|
| |||||
Transactions with the affiliated Master Portfolio were as follows:
| % of ownership, beginning of period | % of ownership, end of period | Net realized gains (losses) on securities transactions allocated from affiliated Master Portfolio | Net change in unrealized gains (losses) on securities transactions allocated from affiliated Master Portfolio | Interest allocated from affiliated Master Portfolio | Affiliated income allocated from affiliated Master Portfolio | Value, end of period | % of net assets | |||||||||||||||||||||||||
| Affiliated Master Portfolio | ||||||||||||||||||||||||||||||||
Wells Fargo Emerging Markets Bond Portfolio | 2.37 | % | 2.40 | % | $ | 66,045 | $ | (32,119 | ) | $ | 57,183 | $ | 183 | $ | 1,020,427 | 99.35 | % | |||||||||||||||
The accompanying notes are an integral part of these financial statements.
Wells Fargo Funds | 19
Table of Contents
Portfolio of investments—February 29, 2020
HIGH YIELD CORPORATE BOND FUND
| Value | ||||||||||||||||
| Investment Companies: 99.92% | ||||||||||||||||
| Affiliated Master Portfolio: 99.92% | ||||||||||||||||
Wells Fargo High Yield Corporate Bond Portfolio | $ | 984,733 | ||||||||||||||
|
| |||||||||||||||
Total Investment Companies (Cost $1,013,311) |
| 984,733 | ||||||||||||||
|
| |||||||||||||||
| Total investments in securities (Cost $1,013,311) | 99.92 | % | 984,733 | |||||
Other assets and liabilities, net | 0.08 | 825 | ||||||
|
|
|
| |||||
| Total net assets | 100.00 | % | $ | 985,558 | ||||
|
|
|
| |||||
Transactions with the affiliated Master Portfolio were as follows:
% of of period | % of ownership, end of period | Net realized gains (losses) on securities transactions allocated from affiliated Master Portfolio | Net change in unrealized gains (losses) on securities transactions allocated from affiliated Master Portfolio | Interest allocated from affiliated Master Portfolio | Income from affiliated securities allocated from affiliated Master Portfolio | Value, end of period | % of net assets | |||||||||||||||||||||||||
| Affiliated Master Portfolio | ||||||||||||||||||||||||||||||||
Wells Fargo High Yield Corporate Bond Portfolio | 1.15 | % | 1.82 | % | $ | 8,279 | $ | (21,009 | ) | $ | 54,136 | $ | 272 | $ | 984,733 | 99.92 | % | |||||||||||||||
The accompanying notes are an integral part of these financial statements.
20 | Wells Fargo Funds
Table of Contents
Portfolio of investments—February 29, 2020
INTERNATIONAL GOVERNMENT BOND FUND
| Value | ||||||||||||||||
| Investment Companies: 98.47% | ||||||||||||||||
| Affiliated Master Portfolio: 98.47% | ||||||||||||||||
Wells Fargo International Government Bond Portfolio | $ | 1,013,582 | ||||||||||||||
|
| |||||||||||||||
Total Investment Companies (Cost $991,627) |
| 1,013,582 | ||||||||||||||
|
| |||||||||||||||
| Total investments in securities (Cost $991,627) | 98.47 | % | 1,013,582 | |||||
Other assets and liabilities, net | 1.53 | 15,783 | ||||||
|
|
|
| |||||
| Total net assets | 100.00 | % | $ | 1,029,365 | ||||
|
|
|
| |||||
Transactions with the affiliated Master Portfolio were as follows:
| % of ownership, beginning of period | % of ownership, end of period | Net realized gains (losses) on securities transactions allocated from affiliated Master Portfolio | Net change in unrealized gains (losses) on securities transactions allocated from affiliated Master Portfolio | Interest allocated from affiliated Master Portfolio | Income from affiliated securities allocated from affiliated Master Portfolio | Value, end of period | % of net assets | |||||||||||||||||||||||||
| Affiliated Master Portfolio | ||||||||||||||||||||||||||||||||
Wells Fargo International Government Bond Portfolio | 9.43 | % | 9.04 | % | $ | 59,409 | $ | (7,629 | ) | $ | 11,325 | $ | 198 | $ | 1,013,582 | 98.47 | % | |||||||||||||||
The accompanying notes are an integral part of these financial statements.
Wells Fargo Funds | 21
Table of Contents
Portfolio of investments—February 29, 2020
| Value | ||||||||||||||||
| Investment Companies: 100.02% | ||||||||||||||||
| Affiliated Master Portfolios: 100.02% | ||||||||||||||||
Wells Fargo Bloomberg Barclays US Aggregateex-Corporate Portfolio | $ | 818,034 | ||||||||||||||
Wells Fargo Investment Grade Corporate Bond Portfolio | 272,214 | |||||||||||||||
Total Investment Companies (Cost $1,012,884) |
| 1,090,248 | ||||||||||||||
|
| |||||||||||||||
| Total investments in securities (Cost $1,012,884) | 100.02 | % | 1,090,248 | |||||
Other assets and liabilities, net | (0.02 | ) | (208 | ) | ||||
|
|
|
| |||||
| Total net assets | 100.00 | % | $ | 1,090,040 | ||||
|
|
|
| |||||
Transactions with the affiliated Master Portfolios were as follows:
| % of ownership, beginning of period | % of ownership, end of period | Net realized gains (losses) on securities transactions allocated from affiliated Master Portfolios | Net change in unrealized gains (losses) on securities transactions allocated from affiliated Master Portfolios | Interest allocated from affiliated Master Portfolios | Affiliated income allocated from affiliated Master Portfolios | Value, end of period | % of net assets | |||||||||||||||||||||||||
| Affiliated Master Portfolios | ||||||||||||||||||||||||||||||||
Wells Fargo Bloomberg Barclays US Aggregateex-Corporate Portfolio | 0.12 | % | 0.12 | % | $ | 5,026 | $ | 54,580 | $ | 18,747 | $ | 231 | $ | 818,034 | ||||||||||||||||||
Wells Fargo Investment Grade Corporate Bond Portfolio | 0.10 | % | 0.10 | % | 4,689 | 24,276 | 9,629 | 28 | 272,214 | |||||||||||||||||||||||
|
|
|
|
|
|
|
|
|
|
|
| |||||||||||||||||||||
| $ | 9,715 | $ | 78,856 | $ | 28,376 | $ | 259 | $ | 1,090,248 | 100.02 | % | |||||||||||||||||||||
|
|
|
|
|
|
|
|
|
|
|
| |||||||||||||||||||||
The accompanying notes are an integral part of these financial statements.
22 | Wells Fargo Funds
Table of Contents
Statements of assets and liabilities—February 29, 2020
| Emerging Markets Bond Fund | High Yield Corporate Bond Fund | International Government Bond Fund | U.S. Core Bond Fund | |||||||||||||
Assets |
| |||||||||||||||
Investments in affiliated Master Portfolio(s), at value (see cost below) | $ | 1,020,427 | $ | 984,733 | $ | 1,013,582 | $ | 1,090,248 | ||||||||
Cash | 1,155 | 0 | 9,887 | 0 | ||||||||||||
Receivable from manager | 13,136 | 13,085 | 14,513 | 13,796 | ||||||||||||
Prepaid expenses and other assets | 1,577 | 1,578 | 5,191 | 2,055 | ||||||||||||
|
|
|
|
|
| |||||||||||
Total assets | 1,036,295 | 999,396 | 1,043,173 | 1,106,099 | ||||||||||||
|
|
|
|
|
| |||||||||||
Liabilities |
| |||||||||||||||
Overdraft due to custodian bank | 0 | 205 | 0 | 4,674 | ||||||||||||
Dividends payable | 0 | 4,618 | 0 | 2,171 | ||||||||||||
Professional fees payable | 6,183 | 5,983 | 10,506 | 6,183 | ||||||||||||
Trustees’ fees and expenses payable | 2,761 | 2,761 | 3,034 | 2,761 | ||||||||||||
Accrued expenses and other liabilities | 269 | 271 | 268 | 270 | ||||||||||||
|
|
|
|
|
| |||||||||||
Total liabilities | 9,213 | 13,838 | 13,808 | 16,059 | ||||||||||||
|
|
|
|
|
| |||||||||||
Total net assets | $ | 1,027,082 | $ | 985,558 | $ | 1,029,365 | $ | 1,090,040 | ||||||||
|
|
|
|
|
| |||||||||||
Net assets consist of |
| |||||||||||||||
Paid-in capital | $ | 1,009,999 | $ | 1,009,986 | $ | 991,116 | $ | 1,010,256 | ||||||||
Total distributable earnings (loss) | 17,083 | (24,428 | ) | 38,249 | 79,784 | |||||||||||
|
|
|
|
|
| |||||||||||
Total net assets | $ | 1,027,082 | $ | 985,558 | $ | 1,029,365 | $ | 1,090,040 | ||||||||
|
|
|
|
|
| |||||||||||
Computation of net asset value |
| |||||||||||||||
Net assets | $ | 1,027,082 | $ | 985,558 | $ | 1,029,365 | $ | 1,090,040 | ||||||||
Shares outstanding1 | 107,610 | 106,042 | 102,112 | 105,058 | ||||||||||||
Net asset value per share | $9.54 | $9.29 | $10.08 | $10.38 | ||||||||||||
Investments in affiliated Master Portfolio(s), at cost | $ | 1,024,257 | $ | 1,013,311 | $ | 991,627 | $ | 1,012,884 | ||||||||
|
|
|
|
|
| |||||||||||
| 1 | Each Fund has an unlimited number of authorized shares. |
The accompanying notes are an integral part of these financial statements.
Wells Fargo Funds | 23
Table of Contents
Statements of operations—year ended February 29, 2020
| Emerging Markets Bond Fund | High Yield Corporate Bond Fund | International Government Bond Fund | U.S. Core Bond Fund | |||||||||||||
Investment income | ||||||||||||||||
Interest allocated from affiliated Master Portfolio(s)* | $ | 57,183 | $ | 54,136 | $ | 11,325 | $ | 28,376 | ||||||||
Affiliated income allocated from affiliated Master Portfolio(s) | 183 | 272 | 198 | 259 | ||||||||||||
Expenses allocated from affiliated Master Portfolio(s) | (5,556 | ) | (4,315 | ) | (11,286 | ) | (860 | ) | ||||||||
Waivers allocated from affiliated Master Portfolio(s) | 1,759 | 1,343 | 0 | 178 | ||||||||||||
|
|
|
|
|
| |||||||||||
Total investment income | 53,569 | 51,436 | 237 | 27,953 | ||||||||||||
|
|
|
|
|
| |||||||||||
Expenses | ||||||||||||||||
Custody and accounting fees | 1,532 | 1,532 | 1,774 | 1,532 | ||||||||||||
Professional fees | 29,255 | 29,255 | 29,255 | 29,255 | ||||||||||||
Registration fees | 146 | 146 | 146 | 146 | ||||||||||||
Shareholder report expenses | 11,734 | 11,734 | 11,926 | 12,635 | ||||||||||||
Trustees’ fees and expenses | 20,625 | 20,625 | 20,625 | 20,625 | ||||||||||||
Other fees and expenses | 6,333 | 6,333 | 6,333 | 6,333 | ||||||||||||
|
|
|
|
|
| |||||||||||
Total expenses | 69,625 | 69,625 | 70,059 | 70,526 | ||||||||||||
Less: Fee waivers and/or expense reimbursements | (75,181 | ) | (73,940 | ) | (81,345 | ) | (71,386 | ) | ||||||||
|
|
|
|
|
| |||||||||||
Net expenses | (5,556 | ) | (4,315 | ) | (11,286 | ) | (860 | ) | ||||||||
|
|
|
|
|
| |||||||||||
Net investment income | 59,125 | 55,751 | 11,523 | 28,813 | ||||||||||||
|
|
|
|
|
| |||||||||||
Realized and unrealized gains (losses) on investments | ||||||||||||||||
Net realized gains (losses) on securities transactions allocated from affiliated Master Portfolio(s) | 66,045 | 8,279 | 59,409 | 9,715 | ||||||||||||
Net change in unrealized gains (losses) on securities transactions allocated from affiliated Master Portfolio(s) | (32,119 | ) | (21,009 | ) |
| (7,629 | ) |
| 78,856 |
| ||||||
|
|
|
|
|
| |||||||||||
Net realized and unrealized gains (losses) on investments | 33,926 | (12,730 | ) | 51,780 | 88,571 | |||||||||||
|
|
|
|
|
| |||||||||||
Net increase in net assets resulting from operations | $ | 93,051 | $ | 43,021 | $ | 63,303 | $ | 117,384 | ||||||||
|
|
|
|
|
| |||||||||||
* Net of foreign interest withholding taxes allocated from affiliated Master Portfolio(s) in the amount of | $0 | $6 | $481 | $0 | ||||||||||||
The accompanying notes are an integral part of these financial statements.
24 | Wells Fargo Funds
Table of Contents
Statements of changes in net assets
| Emerging Markets Bond Fund | ||||||||||||||||
| Year ended February 29, 2020 | Year ended February 28, 2019 | |||||||||||||||
Operations |
| |||||||||||||||
Net investment income | $ | 59,125 | $ | 28,281 | ||||||||||||
Net realized gains (losses) on investments | 66,045 | (1,056 | ) | |||||||||||||
Net change in unrealized gains (losses) on investments | (32,119 | ) | 28,494 | |||||||||||||
|
| |||||||||||||||
Net increase in net assets resulting from operations | 93,051 | 55,719 | ||||||||||||||
|
| |||||||||||||||
Distributions to shareholders from net investment income and net realized gains | (112,453 | ) | (19,031 | ) | ||||||||||||
|
| |||||||||||||||
Capital share transactions | Shares | Shares | ||||||||||||||
Proceeds from shares sold | 0 | 0 | 106,610 | 1,000,000 | ||||||||||||
|
| |||||||||||||||
Net increase in net assets resulting from capital share transactions | 0 | 1,000,000 | ||||||||||||||
|
| |||||||||||||||
Total increase (decrease) in net assets | (19,402 | ) | 1,036,688 | |||||||||||||
|
| |||||||||||||||
Net assets | ||||||||||||||||
Beginning of period | 1,046,484 | 9,796 | ||||||||||||||
|
| |||||||||||||||
End of period | $ | 1,027,082 | $ | 1,046,484 | ||||||||||||
|
| |||||||||||||||
The accompanying notes are an integral part of these financial statements.
Wells Fargo Funds | 25
Table of Contents
Statements of changes in net assets
| High Yield Corporate Bond Fund | ||||||||||||||||
| Year ended February 29, 2020 | Year ended February 28, 2019 | |||||||||||||||
Operations |
| |||||||||||||||
Net investment income | $ | 55,751 | $ | 35,224 | ||||||||||||
Net realized gains (losses) on investments | 8,279 | (7,401 | ) | |||||||||||||
Net change in unrealized gains (losses) on investments | (21,009 | ) | (7,366 | ) | ||||||||||||
|
| |||||||||||||||
Net increase in net assets resulting from operations | 43,021 | 20,457 | ||||||||||||||
|
| |||||||||||||||
Distributions to shareholders from net investment income and net realized gains | (59,897 | ) | (27,681 | ) | ||||||||||||
|
| |||||||||||||||
Capital share transactions | Shares | Shares | ||||||||||||||
Proceeds from shares sold | 0 | 0 | 105,042 | 1,000,000 | ||||||||||||
|
| |||||||||||||||
Net increase in net assets resulting from capital share transactions | 0 | 1,000,000 | ||||||||||||||
|
| |||||||||||||||
Total increase (decrease) in net assets | (16,876 | ) | 992,776 | |||||||||||||
|
| |||||||||||||||
Net assets | ||||||||||||||||
Beginning of period | 1,002,434 | 9,658 | ||||||||||||||
|
| |||||||||||||||
End of period | $ | 985,558 | $ | 1,002,434 | ||||||||||||
|
| |||||||||||||||
The accompanying notes are an integral part of these financial statements.
26 | Wells Fargo Funds
Table of Contents
Statements of changes in net assets
| International Government Bond Fund | ||||||||||||||||
| Year ended February 29, 2020 | Year ended February 28, 2019 | |||||||||||||||
Operations |
| |||||||||||||||
Net investment income | $ | 11,523 | $ | 7,498 | ||||||||||||
Net realized gains (losses) on investments | 59,409 | (32,227 | ) | |||||||||||||
Net change in unrealized gains (losses) on investments | (7,629 | ) | 29,170 | |||||||||||||
|
| |||||||||||||||
Net increase in net assets resulting from operations | 63,303 | 4,441 | ||||||||||||||
|
| |||||||||||||||
Distributions to shareholders from | ||||||||||||||||
Net investment income and net realized gains | (48,682 | ) | (8 | ) | ||||||||||||
Tax basis return of capital | 0 | (95 | ) | |||||||||||||
|
| |||||||||||||||
Total distributions to shareholders | (48,682 | ) | (103 | ) | ||||||||||||
|
| |||||||||||||||
Capital share transactions | Shares | Shares | ||||||||||||||
Proceeds from shares sold | 0 | 0 | 101,112 | 1,000,000 | ||||||||||||
|
| |||||||||||||||
Net increase in net assets resulting from capital share transactions | 0 | 1,000,000 | ||||||||||||||
|
| |||||||||||||||
Total increase in net assets | 14,621 | 1,004,338 | ||||||||||||||
|
| |||||||||||||||
Net assets | ||||||||||||||||
Beginning of period | 1,014,744 | 10,406 | ||||||||||||||
|
| |||||||||||||||
End of period | $ | 1,029,365 | $ | 1,014,744 | ||||||||||||
|
| |||||||||||||||
The accompanying notes are an integral part of these financial statements.
Wells Fargo Funds | 27
Table of Contents
Statements of changes in net assets
| U.S. Core Bond Fund | ||||||||||||||||
| Year ended February 29, 2020 | Year ended February 28, 2019 | |||||||||||||||
Operations |
| |||||||||||||||
Net investment income | $ | 28,813 | $ | 14,748 | ||||||||||||
Net realized gains on investments | 9,715 | 6,265 | ||||||||||||||
Net change in unrealized gains (losses) on investments | 78,856 | (1,205 | ) | |||||||||||||
|
| |||||||||||||||
Net increase in net assets resulting from operations | 117,384 | 19,808 | ||||||||||||||
|
| |||||||||||||||
Distributions to shareholders from net investment income and net realized gains | (42,182 | ) | (14,606 | ) | ||||||||||||
|
| |||||||||||||||
Capital share transactions | Shares | Shares | ||||||||||||||
Proceeds from shares sold | 0 | 0 | 104,058 | 1,000,000 | ||||||||||||
|
| |||||||||||||||
Net increase in net assets resulting from capital share transactions | 0 | 1,000,000 | ||||||||||||||
|
| |||||||||||||||
Total increase in net assets | 75,202 | 1,005,202 | ||||||||||||||
|
| |||||||||||||||
Net assets | ||||||||||||||||
Beginning of period | 1,014,838 | 9,636 | ||||||||||||||
|
| |||||||||||||||
End of period | $ | 1,090,040 | $ | 1,014,838 | ||||||||||||
|
| |||||||||||||||
The accompanying notes are an integral part of these financial statements.
28 | Wells Fargo Funds
Table of Contents
This page is intentionally left blank.
Table of Contents
| Beginning net asset value per share | Net investment income | Net realized and unrealized gains (losses) on investments | Distributions from net investment income | |||||||||||||||||||||
| Distributions from net realized gains | Tax basis return of capital | |||||||||||||||||||||||
Emerging Markets Bond Fund | ||||||||||||||||||||||||
Year ended February 29, 2020 | $ | 9.72 | 0.54 | 0.32 | (0.54 | ) | (0.50 | ) | 0.00 | |||||||||||||||
Year ended February 28, 2019 | $ | 9.80 | 0.39 | (0.11 | ) | (0.36 | ) | 0.00 | 0.00 | |||||||||||||||
Year ended February 28, 20185 | $ | 10.00 | 0.26 | (0.23 | ) | (0.23 | ) | 0.00 | 0.00 | |||||||||||||||
High Yield Corporate Bond Fund | ||||||||||||||||||||||||
Year ended February 29, 2020 | $ | 9.45 | 0.52 | (0.12 | ) | (0.56 | ) | (0.00 | )6 | 0.00 | ||||||||||||||
Year ended February 28, 2019 | $ | 9.66 | 0.54 | (0.18 | ) | (0.57 | ) | 0.00 | 0.00 | |||||||||||||||
Year ended February 28, 20185 | $ | 10.00 | 0.33 | (0.28 | ) | (0.38 | ) | 0.00 | (0.01 | ) | ||||||||||||||
International Government Bond Fund | ||||||||||||||||||||||||
Year ended February 29, 2020 | $ | 9.94 | 0.12 | 0.50 | (0.13 | ) | (0.35 | ) | 0.00 | |||||||||||||||
Year ended February 28, 2019 | $ | 10.41 | 0.18 | (0.55 | ) | (0.09 | ) | 0.00 | (0.01 | ) | ||||||||||||||
Year ended February 28, 20187 | $ | 10.00 | 0.05 | 0.40 | (0.04 | ) | 0.00 | 0.00 | ||||||||||||||||
U.S. Core Bond Fund | ||||||||||||||||||||||||
Year ended February 29, 2020 | $ | 9.66 | 0.28 | 0.84 | (0.27 | ) | (0.13 | ) | 0.00 | |||||||||||||||
Year ended February 28, 2019 | $ | 9.64 | 0.27 | 0.02 | (0.27 | ) | 0.00 | 0.00 | ||||||||||||||||
Year ended February 28, 20185 | $ | 10.00 | 0.14 | (0.31 | ) | (0.17 | ) | 0.00 | (0.02 | ) | ||||||||||||||
| 1 | Ratios include net expenses allocated from the affiliated Master Portfolio(s), which were waived by the manager. These amounts were as follows: |
| Year ended February 29, 2020 | Year ended February 28 | |||||||||||
| 2019 | 2018 | |||||||||||
Emerging Markets Bond Fund | 0.52 | % | 0.49 | % | 0.39 | %5 | ||||||
High Yield Corporate Bond Fund | 0.43 | 0.36 | 0.33 | 5 | ||||||||
International Government Bond Fund | 1.07 | 0.70 | 1.76 | 7 | ||||||||
U.S. Core Bond Fund | 0.08 | 0.09 | 0.06 | 5 | ||||||||
| 2 | The Funds incurred expenses typical of funds with similar structures and strategies. Since the Funds were not open to public investment during the period since each Fund’s commencement of operations and the only investment has been the initial seed capital investment, the gross expenses are higher than the typical operation of the Funds. These expenses were waived by the manager. |
| 3 | Returns for periods of less than one year are not annualized. |
| 4 | Portfolio turnover rate is calculated by aggregating the results of multiplying the Fund’s investment percentage in the respective affiliated Master Portfolio(s) by the corresponding affiliated Master Portfolio’s portfolio turnover rate. |
| 5 | For the period from August 3, 2017 (commencement of operations) to February 28, 2018 |
| 6 | Amount is less than $0.005. |
| 7 | For the period from October 31, 2017 (commencement of operations) to February 28, 2018 |
The accompanying notes are an integral part of these financial statements.
30 | Wells Fargo Funds
Table of Contents
Financial highlights
Ending net asset share | Ratio to average net assets (annualized) | Total | Portfolio turnover rate4 | Net assets at end of period (000s omitted) | ||||||||||||||||||||||
| Net investment income1 | Gross expenses1,2 | Net expenses1 | ||||||||||||||||||||||||
| $ | 9.54 | 5.52 | % | 7.02 | % | 0.00 | % | 9.10 | % | 36 | % | $ | 1,027 | |||||||||||||
| $ | 9.72 | 5.46 | % | 11.56 | % | 0.00 | % | 3.13 | % | 38 | % | $ | 1,046 | |||||||||||||
| $ | 9.80 | 4.55 | % | 752.83 | % | 0.00 | % | 0.29 | % | 18 | % | $ | 10 | |||||||||||||
| $ | 9.29 | 5.50 | % | 7.29 | % | 0.00 | % | 4.29 | % | 52 | % | $ | 986 | |||||||||||||
| $ | 9.45 | 7.11 | % | 11.68 | % | 0.00 | % | 3.92 | % | 47 | % | $ | 1,002 | |||||||||||||
| $ | 9.66 | 5.73 | % | 761.12 | % | 0.00 | % | 0.52 | % | 51 | % | $ | 10 | |||||||||||||
| $ | 10.08 | 1.09 | % | 7.73 | % | 0.00 | % | 6.22 | % | 291 | % | $ | 1,029 | |||||||||||||
| $ | 9.94 | 1.49 | % | 11.96 | % | 0.00 | % | (3.53 | %) | 276 | % | $ | 1,015 | |||||||||||||
| $ | 10.41 | 1.62 | % | 1,007.15 | % | 0.00 | % | 4.46 | % | 127 | % | $ | 10 | |||||||||||||
| $ | 10.38 | 2.72 | % | 6.74 | % | 0.00 | % | 11.80 | % | 39 | % | $ | 1,090 | |||||||||||||
| $ | 9.66 | 2.92 | % | 11.25 | % | 0.00 | % | 3.06 | % | 60 | % | $ | 1,015 | |||||||||||||
| $ | 9.64 | 2.43 | % | 762.71 | % | 0.00 | % | (1.74 | )% | 62 | % | $ | 10 | |||||||||||||
The accompanying notes are an integral part of these financial statements.
Wells Fargo Funds | 31
Table of Contents
1. ORGANIZATION
Wells Fargo Funds Trust (the “Trust”), a Delaware statutory trust organized on March 10, 1999, is anopen-end management investment company registered under the Investment Company Act of 1940, as amended (the “1940 Act”). As an investment company, the Trust follows the accounting and reporting guidance in Financial Accounting Standards Board (“FASB”)Accounting Standards Codification Topic 946, Financial Services – Investment Companies. These financial statements report on the following funds: Wells Fargo Emerging Markets Bond Fund (“Emerging Markets Bond Fund”), Wells Fargo High Yield Corporate Bond Fund (“High Yield Corporate Bond Fund”), Wells Fargo International Government Bond Fund (“International Government Bond Fund”) and Wells Fargo U.S. Core Bond Fund (“U.S. Core Bond Fund”) (each, a “Fund”, collectively, the “Funds”). Each Fund, except for International Government Bond Fund, is a diversified series of the Trust. International Government Bond Fund is anon-diversified series of the Trust.
Each Fund seeks to achieve its investment objective by investing all investable assets in separate diversified portfolios (collectively, the “affiliated Master Portfolios”) of Wells Fargo Master Trust, a registeredopen-end management investment company. Each Fund, except U.S. Core Bond Fund, is a feeder fund in a master-feeder structure that invests substantially all of its assets in a single affiliated master portfolio with a substantially identical investment objective and substantially similar investment strategies. U. S. Core Bond Fund is afund-of-funds that invests substantially all of its assets in two affiliated Master Portfolios. Each affiliated Master Portfolio directly acquires portfolio securities, and a Fund investing in an affiliated Master Portfolio acquires an indirect interest in those securities. Each Fund accounts for its investment in the affiliated Master Portfolios as a partnership investment and records on a daily basis its share of each affiliated Master Portfolio’s income, expense and realized and unrealized gains and losses. The financial statements of the affiliated Master Portfolios for the year ended February 29, 2020 are included in this report and should be read in conjunction with each Fund’s financial statements. As of February 29, 2020, each Fund in a master-feeder structure owns the following percentages of the respective affiliated Master Portfolio:
Emerging Markets Bond Fund | High Yield Corporate Bond Fund | International Bond Fund | ||||||||||
Wells Fargo Emerging Markets Bond Portfolio | 2.40 | % | N/A | N/A | ||||||||
Wells Fargo High Yield Corporate Bond Portfolio | N/A | 1.82 | % | N/A | ||||||||
Wells Fargo International Government Bond Portfolio | N/A | N/A | 9.04 | % | ||||||||
2. SIGNIFICANT ACCOUNTING POLICIES
The following significant accounting policies, which are consistently followed in the preparation of the financial statements of each Fund, are in conformity with U.S. generally accepted accounting principles which require management to make estimates and assumptions that affect the reported amounts of assets and liabilities, disclosure of contingent assets and liabilities at the date of the financial statements, and the reported amounts of revenues and expenses during the reporting period. Actual results could differ from those estimates.
Securities valuation
All investments are valued each business day as of the close of regular trading on the New York Stock Exchange (generally 4 p.m. Eastern Time), although the Funds may deviate from this calculation time under unusual or unexpected circumstances.
Investments in the affiliated Master Portfolios are valued daily based on each Fund’s proportionate share of each affiliated Master Portfolio’s net assets, which are also valued daily.
Investment transactions, income and expenses
Investments in affiliated Master Portfolios are recorded on a trade date basis.
Each Fund records daily its proportionate share of each affiliated Master Portfolio’s income, expenses and realized and unrealized gains or losses. Each Fund also accrues its own expenses.
Distributions to shareholders
Distributions to shareholders from net investment income and any net realized gains are recorded on theex-dividend date for each Fund as follows:
| Net investment income | Net realized gains | |||
Emerging Markets Bond Fund | Semi-annually | Annually | ||
High Yield Corporate Bond Fund | Monthly | Annually | ||
International Government Bond Fund | Semi-annually | Annually | ||
U.S. Core Bond Fund | Monthly | Annually | ||
32 | Wells Fargo Funds
Table of Contents
Notes to financial statements
Federal and other taxes
Each Fund is treated as a separate entity for federal income tax purposes. Each Fund intends to continue to qualify as a regulated investment company by distributing substantially all of its investment company taxable income and any net realized capital gains (after reduction for capital loss carryforwards) sufficient to relieve it from all, or substantially all, federal income taxes. Accordingly, no provision for federal income taxes was required.
Each Fund’s income and federal excise tax returns and all financial records supporting those returns for the prior three fiscal years are subject to examination by the federal and Delaware revenue authorities. Management has analyzed each Fund’s tax positions taken on federal, state, and foreign tax returns for all open tax years and does not believe that there are any uncertain tax positions that require recognition of a tax liability.
As of February 29, 2020, the aggregate cost of all investments for federal income tax purposes and the unrealized gains (losses) were as follows:
| Tax cost | Gross unrealized gains | Gross unrealized losses | Net unrealized gains (losses) | |||||||||||||
Emerging Markets Bond Fund | $ | 1,024,190 | $ | 0 | $ | (3,763 | ) | $ | (3,763 | ) | ||||||
High Yield Corporate Bond Fund | 1,008,905 | 0 | (24,172 | ) | (24,172 | ) | ||||||||||
International Government Bond Fund | 991,712 | 21,870 | 0 | 21,870 | ||||||||||||
U.S. Core Bond Fund | 1,012,802 | 77,446 | 0 | 77,446 | ||||||||||||
Reclassifications are made to each Fund’s capital accounts for permanent tax differences to reflect income and gains available for distribution (or available capital loss carryforwards) under federal income tax regulations. U.S. generally accepted accounting principles require that certain components of net assets be adjusted to reflect permanent differences between financial and tax reporting. These reclassifications have no effect on net assets or net asset values per share. At February 29, 2020, as a result of permanentbook-to-tax differences, the following reclassification adjustments were made on the Statements of Assets and Liabilities:
| Paid-in capital | Total distributable earnings (loss) | |||||||
International Government Bond Fund | $ | 1,050 | $ | (1,050 | ) | |||
U.S. Core Bond Fund | 176 | (176 | ) | |||||
As of February 29, 2020, the High Yield Corporate Bond Fund had current year net deferred post-October capital losses consisting of $256 in long-term losses which will be recognized on the first day of the following fiscal year.
At February 29, 2020, the International Government Bond Fund had a qualified late-year ordinary loss of $6,095 which will be recognized on the first day of the following fiscal year.
3. FAIR VALUATION MEASUREMENTS
At February 29, 2020, each Fund’s investment in an affiliated Master Portfolio was measured at fair value using the net asset value per share (or its equivalent) as a practical expedient. The aggregate fair value of affiliated Master Portfolios held in each Fund was as follows:
| Aggregate fair value of affiliated Master Portfolio(s) | ||||
Emerging Markets Bond Fund | $ | 1,020,427 | ||
High Yield Corporate Bond Fund | 984,733 | |||
International Government Bond Fund | 1,013,582 | |||
U.S. Core Bond Fund | 1,090,248 | |||
Wells Fargo Funds | 33
Table of Contents
Notes to financial statements
Each Fund’s ownership in each affiliated Master Portfolio is disclosed in the table following the Portfolio of Investments. The leveling of inputs for fair value measurements of each affiliated Master Portfolio are disclosed in the financial statements of the affiliated Master Portfolios.
The investment objective of each affiliated Master Portfolio is as follows:
| Affiliated Master Portfolio | Investment objective | |
Wells Fargo Bloomberg Barclays US Aggregateex-Corporate Portfolio | Seeks to replicate the total return of the Bloomberg Barclays U.S.ex-Corporate Index, before fees and expenses | |
Wells Fargo Emerging Markets Bond Portfolio | Seeks to replicate the total return of the JP Morgan EMBI Global Dividend Index, before fees and expenses | |
Wells Fargo High Yield Corporate Bond Portfolio | Seeks to replicate the total return of the Wells Fargo U.S. High Yield Bond Index, before fees and expenses | |
Wells Fargo International Government Bond Portfolio | Seeks to replicate the total return of the Wells Fargo International Government Bond Index, before fees and expenses | |
Wells Fargo Investment Grade Corporate Bond Portfolio | Seeks to replicate the total return of the Wells Fargo U.S. Investment Grade Corporate Bond Index, before fees and expenses | |
Each affiliated Master Portfolio does not have a redemption period notice, can be redeemed daily and does not have any unfunded commitments.
4. TRANSACTIONS WITH AFFILIATES
Management fee
Wells Fargo Funds Management, LLC (“Funds Management”), an indirect wholly owned subsidiary of Wells Fargo & Company (“Wells Fargo”), is the manager of each Fund and provides advisory and administrative services under an investment management agreement. Under the investment management agreement, Funds Management is responsible for, among other services, implementing the investment objectives and strategies of each Fund, supervising the subadviser (for U.S. Core Bond Fund) and providing administrative services in connection with each Fund’s operations. Funds Management does not receive an investment management or administration fee from each Fund. However, Funds Management also serves as the adviser to each affiliated Master Portfolio and is entitled to receive a fee from each affiliated Master Portfolio for those services.
Funds Management has retained the services of a subadviser to provide daily portfolio management to U.S. Core Bond Fund. Funds Management has engaged Wells Capital Management Incorporated (“WellsCap”), an affiliate of Funds Management and an indirect wholly owned subsidiary of Wells Fargo, as subadviser. WellsCap does not receive an annual fee for its services.
Waivers and/or expense reimbursements
Funds Management has committed through June 30, 2020 to waive fees and/or reimburse expenses to the extent necessary to cap each Fund’s expenses at 0.00%. Net expenses from affiliated Master Portfolios are included in the expense caps. Prior to or after the commitment expiration date, each expense cap may be increased or the commitment to maintain the cap may be terminated only with the approval of the Board of Trustees.
5. INVESTMENT PORTFOLIO TRANSACTIONS
The Funds seek to achieve their investment objectives by investing substantially all of their investable assets in affiliated Master Portfolio(s). Purchases and sales related to these investments have been calculated by aggregating the results of multiplying each Fund’s ownership percentage in the respective affiliated Master Portfolio by the corresponding affiliated Master Portfolio’s purchases and sales.
34 | Wells Fargo Funds
Table of Contents
Notes to financial statements
Purchases and sales of investments, excluding short-term securities, for the year ended February 29, 2020 were as follows:
| Purchases at cost | Sales proceeds | |||||||||||||||
| U.S. government | Non-U.S. government | U.S. government | Non-U.S. government | |||||||||||||
Emerging Markets Bond Fund | $ | 0 | $ | 364,766 | $ | 0 | $ | 427,146 | ||||||||
High Yield Corporate Bond Fund | 0 | 577,897 | 0 | 1,147,422 | ||||||||||||
International Government Bond Fund | 0 | 2,887,396 | 0 | 2,893,086 | ||||||||||||
U.S. Core Bond Fund | 379,098 | 82,987 | 315,504 | 112,780 | ||||||||||||
6. BANK BORROWINGS
The Trust (excluding the money market funds), Wells Fargo Master Trust and Wells Fargo Variable Trust are parties to a $280,000,000 revolving credit agreement whereby the Fund is permitted to use bank borrowings for temporary or emergency purposes, such as to fund shareholder redemption requests. Interest under the credit agreement is charged to the Fund based on a borrowing rate equal to the higher of the Federal Funds rate in effect on that day plus 1.25% or the overnight LIBOR rate in effect on that day plus 1.25%. In addition, an annual commitment fee equal to 0.25% of the unused balance is allocated to each participating fund.
For the year ended February 29, 2020, there were no borrowings by the Funds under the agreement.
7. DISTRIBUTIONS TO SHAREHOLDERS
The tax character of distributions paid during the years ended February 29, 2020, and February 28, 2019, were as follows:
| Ordinary income | Long-term capital gain | Tax basis return of capital | ||||||||||||||||||||||
| 2020 | 2019 | 2020 | 2019 | 2020 | 2019 | |||||||||||||||||||
Emerging Markets Bond Fund | $ | 112,453 | $ | 19,031 | $ | 0 | $ | 0 | $ | 0 | $ | 0 | ||||||||||||
High Yield Corporate Bond Fund | 59,897 | 27,681 | 0 | 0 | 0 | 0 | ||||||||||||||||||
International Government Bond Fund | 48,682 | 8 | 0 | 0 | 0 | 95 | ||||||||||||||||||
U.S. Core Bond Fund | 38,396 | 14,606 | 3,786 | 0 | 0 | 0 | ||||||||||||||||||
As of February 29, 2020, the components of distributable earnings on a tax basis were as follows:
| Undistributed ordinary income | Undistributed long-term gain | Unrealized gains (losses) | Late-year ordinary losses deferred | Post-October capital losses deferred | ||||||||||||||||
Emerging Markets Bond Fund | $ | 20,846 | $ | 0 | $ | (3,763 | ) | $ | 0 | $ | 0 | |||||||||
High Yield Corporate Bond Fund | 0 | 0 | (24,172 | ) | 0 | (256 | ) | |||||||||||||
International Government Bond Fund | 22,474 | 0 | 21,870 | (6,095 | ) | 0 | ||||||||||||||
U.S. Core Bond Fund | 553 | 1,785 | 77,446 | 0 | 0 | |||||||||||||||
8. CONCENTRATION OF OWNERSHIP
At February 29, 2020, Wells Fargo owned 100% of each Fund. Investment and/or voting activities of Wells Fargo with respect to their holdings in each Fund could have a material impact on each Fund.
9. INDEMNIFICATION
Under the Trust’s organizational documents, the officers and Trustees have been granted certain indemnification rights against certain liabilities that may arise out of performance of their duties to the Trust. Additionally, in the normal course of business, the Trust may enter into contracts with service providers that contain a variety of indemnification clauses. The Trust’s maximum exposure under these arrangements is dependent on future claims that may be made against the Funds and, therefore, cannot be estimated.
Wells Fargo Funds | 35
Table of Contents
Notes to financial statements
10. NEW ACCOUNTING PRONOUNCEMENT
In August 2018, FASB issued Accounting Standards Update (“ASU”)No. 2018-13, Fair Value Measurement (Topic 820)Disclosure Framework—Changes to the Disclosure Requirements for Fair Value Measurement.ASU2018-13 updates the disclosure requirements for fair value measurements by modifying or removing certain disclosures and adding certain new disclosures. The amendments are effective for fiscal years, and interim periods within those fiscal years, beginning after December 15, 2019. Early adoption is permitted. Management has adopted the removal and modification of disclosures early, as permitted, and will adopt the additional new disclosures at the effective date.
11. SUBSEQUENT EVENT
On March 11, 2020, the World Health Organization announced that it had made the assessment that coronavirus disease 2019(“COVID-19”) is a pandemic. The impacts ofCOVID-19 is adversely affecting the entire global economy, individual companies and investment products, and the market in general. There is significant uncertainty around the extent and duration of business disruptions related toCOVID-19 and the impact may be short term or may last for an extended period of time. The risk of further spreading ofCOVID-19 has led to significant uncertainty and volatility in the financial markets and the value of the Funds and the securities in which the Funds invest have generally been adversely affected by impacts caused byCOVID-19.
36 | Wells Fargo Funds
Table of Contents
Report of independent registered public accounting firm
To the Shareholders of the Funds and Board of Trustees
Wells Fargo Funds Trust:
Opinion on the Financial Statements
We have audited the accompanying statements of assets and liabilities of Wells Fargo Emerging Markets Bond Fund, Wells Fargo High Yield Corporate Bond Fund, Wells Fargo International Government Bond Fund, and Wells Fargo U.S. Core Bond Fund (collectively, the Funds), four of the funds constituting Wells Fargo Funds Trust, including the portfolios of investments, as of February 29, 2020, the related statements of operations for the year then ended, the statements of changes in net assets for each of the years in the two-year period then ended, and the related notes (collectively, the financial statements) and the financial highlights for each of the years or periods in the period from August 3, 2017 (commencement of operations) to February 29, 2020, except for Wells Fargo International Government Bond Fund, which is for each of the years or periods in the period from October 31, 2017 (commencement of operations) to February 29, 2020. In our opinion, the financial statements and financial highlights present fairly, in all material respects, the financial position of the Funds as of February 29, 2020, the results of their operations for the year then ended, the changes in their net assets for each of the years in the two-year period then ended, and the financial highlights for each of the years or periods in the period from the commencement of operations to February 29, 2020, in conformity with U.S. generally accepted accounting principles.
Basis for Opinion
These financial statements and financial highlights are the responsibility of the Funds’ management. Our responsibility is to express an opinion on these financial statements and financial highlights based on our audits. We are a public accounting firm registered with the Public Company Accounting Oversight Board (United States) (PCAOB) and are required to be independent with respect to the Funds in accordance with the U.S. federal securities laws and the applicable rules and regulations of the Securities and Exchange Commission and the PCAOB.
We conducted our audits in accordance with the standards of the PCAOB. Those standards require that we plan and perform the audit to obtain reasonable assurance about whether the financial statements and financial highlights are free of material misstatement, whether due to error or fraud. Our audits included performing procedures to assess the risks of material misstatement of the financial statements and financial highlights, whether due to error or fraud, and performing procedures that respond to those risks. Such procedures included examining, on a test basis, evidence regarding the amounts and disclosures in the financial statements and financial highlights. Such procedures also included confirmation of securities owned as of February 29, 2020, by correspondence with the transfer agent. Our audits also included evaluating the accounting principles used and significant estimates made by management, as well as evaluating the overall presentation of the financial statements and financial highlights. We believe that our audits provide a reasonable basis for our opinion.

We have not been able to determine the specific year that we began serving as the auditor of one or more Wells Fargo Funds investment companies; however we are aware that we have served as the auditor of one or more Wells Fargo Funds investment companies since at least 1955.
Boston, Massachusetts
April 28, 2020
Wells Fargo Funds | 37
Table of Contents
Portfolio of investments—February 29, 2020
BLOOMBERG BARCLAYS US AGGREGATEEX-CORPORATE PORTFOLIO
| Interest rate | Maturity date | Principal | Value | |||||||||||||
| Agency Securities: 37.85% | ||||||||||||||||
FFCB | 1.61 | % | 5-5-2022 | $ | 960,000 | $ | 960,246 | |||||||||
FFCB | 1.84 | 9-9-2022 | 10,000 | 10,034 | ||||||||||||
FFCB | 1.85 | 3-3-2022 | 70,000 | 70,173 | ||||||||||||
FFCB | 1.90 | 6-24-2021 | 70,000 | 70,773 | ||||||||||||
FFCB | 2.54 | 4-5-2021 | 350,000 | 355,967 | ||||||||||||
FHLB | 1.13 | 7-14-2021 | 120,000 | 120,204 | ||||||||||||
FHLB | 1.75 | 3-12-2021 | 90,000 | 90,573 | ||||||||||||
FHLB | 2.13 | 6-9-2023 | 520,000 | 539,583 | ||||||||||||
FHLB | 2.13 | 9-14-2029 | 80,000 | 84,643 | ||||||||||||
FHLB | 2.38 | 9-8-2023 | 30,000 | 31,436 | ||||||||||||
FHLB | 2.50 | 3-11-2022 | 770,000 | 793,643 | ||||||||||||
FHLB | 2.75 | 12-13-2024 | 180,000 | 194,443 | ||||||||||||
FHLB | 3.00 | 10-12-2021 | 70,000 | 72,279 | ||||||||||||
FHLB | 3.00 | 3-10-2028 | 560,000 | 629,489 | ||||||||||||
FHLB | 3.38 | 9-8-2023 | 30,000 | 32,454 | ||||||||||||
FHLB | 3.38 | 12-8-2023 | 280,000 | 304,463 | ||||||||||||
FHLB | 5.63 | 6-11-2021 | 10,000 | 10,575 | ||||||||||||
FHLB | 5.63 | 3-14-2036 | 60,000 | 90,778 | ||||||||||||
FHLMC | 2.00 | 5-28-2024 | 1,110,000 | 1,112,070 | ||||||||||||
FHLMC | 2.38 | 1-13-2022 | 20,000 | 20,509 | ||||||||||||
FHLMC | 2.50 | 3-1-2032 | 5,387,955 | 5,556,441 | ||||||||||||
FHLMC | 2.50 | 2-1-2035 | 1,737,364 | 1,783,773 | ||||||||||||
FHLMC | 2.75 | 6-19-2023 | 1,020,000 | 1,079,522 | ||||||||||||
FHLMC | 3.00 | 2-1-2047 | 15,790,249 | 16,491,579 | ||||||||||||
FHLMC | 3.00 | 3-1-2048 | 172,118 | 178,850 | ||||||||||||
FHLMC | 3.50 | 2-1-2044 | 12,633,931 | 13,446,266 | ||||||||||||
FHLMC | 3.50 | 4-1-2045 | 518,569 | 553,932 | ||||||||||||
FHLMC | 3.50 | 8-1-2047 | 8,090,377 | 8,526,421 | ||||||||||||
FHLMC | 6.00 | 7-1-2040 | 2,237,907 | 2,625,582 | ||||||||||||
FHLMC Series K015 Class A2 | 3.23 | 7-25-2021 | 57,296 | 58,385 | ||||||||||||
FHLMC Series K028 Class A1 | 2.18 | 11-25-2022 | 101,207 | 102,058 | ||||||||||||
FHLMC Series K029 Class A2 | 3.32 | 2-25-2023 | 545,000 | 573,375 | ||||||||||||
FHLMC Series K030 Class A2±± | 3.25 | 4-25-2023 | 305,000 | 320,892 | ||||||||||||
FHLMC Series K032 Class A2±± | 3.31 | 5-25-2023 | 50,000 | 53,023 | ||||||||||||
FHLMC Series K034 Class A2±± | 3.53 | 7-25-2023 | 60,000 | 64,184 | ||||||||||||
FHLMC Series K035 Class A2±± | 3.46 | 8-25-2023 | 55,000 | 58,706 | ||||||||||||
FHLMC Series K048 Class A2±± | 3.28 | 6-25-2025 | 215,000 | 234,426 | ||||||||||||
FHLMC Series K062 Class A2 | 3.41 | 12-25-2026 | 750,000 | 836,376 | ||||||||||||
FHLMC Series K063 Class A2±± | 3.43 | 1-25-2027 | 45,000 | 50,190 | ||||||||||||
FHLMC Series K070 Class A2±± | 3.30 | 11-25-2027 | 425,000 | 472,764 | ||||||||||||
FHLMC Series K152 Class A1 | 2.83 | 5-25-2030 | 318,707 | 344,395 | ||||||||||||
FHLMC Series K152 Class A2 | 3.08 | 1-25-2031 | 125,000 | 139,676 | ||||||||||||
FHLMC Series K153 Class A3±± | 3.12 | 10-25-2031 | 70,000 | 78,907 | ||||||||||||
FHLMC Series K155 Class A3 | 3.75 | 4-25-2033 | 40,000 | 47,654 | ||||||||||||
FHLMC Series K717 Class A2 | 2.99 | 9-25-2021 | 661,932 | 674,032 | ||||||||||||
FNMA | 1.38 | 2-26-2021 | 120,000 | 120,247 | ||||||||||||
FNMA | 2.13 | 4-24-2026 | 910,000 | 962,588 | ||||||||||||
FNMA | 2.50 | 12-1-2027 | 665,467 | 685,950 | ||||||||||||
FNMA | 2.50 | 9-1-2031 | 2,283,779 | 2,356,384 | ||||||||||||
FNMA | 3.00 | 12-1-2026 | 2,832,693 | 2,938,358 | ||||||||||||
FNMA | 3.00 | 12-1-2030 | 477,193 | 499,296 | ||||||||||||
FNMA | 3.00 | 7-1-2032 | 3,534,284 | 3,674,399 | ||||||||||||
FNMA | 3.00 | 1-1-2034 | 558,895 | 579,043 | ||||||||||||
FNMA | 3.00 | 8-1-2036 | 223,421 | 232,857 | ||||||||||||
The accompanying notes are an integral part of these financial statements.
38 | Wells Fargo Funds
Table of Contents
Portfolio of investments—February 29, 2020
BLOOMBERG BARCLAYS US AGGREGATEEX-CORPORATE PORTFOLIO
| Interest rate | Maturity date | Principal | Value | |||||||||||||
| Agency Securities (continued) | ||||||||||||||||
FNMA | 3.00 | % | 2-1-2037 | $ | 3,985,564 | $ | 4,154,191 | |||||||||
FNMA | 3.00 | 8-1-2043 | 2,647,584 | 2,769,689 | ||||||||||||
FNMA | 3.00 | 11-1-2046 | 2,688,293 | 2,811,779 | ||||||||||||
FNMA | 3.00 | 12-1-2047 | 2,086,774 | 2,163,723 | ||||||||||||
FNMA | 3.00 | 12-1-2049 | 6,123,266 | 6,310,629 | ||||||||||||
FNMA | 3.00 | 2-1-2050 | 4,651,115 | 4,796,615 | ||||||||||||
FNMA %% | 3.00 | 3-12-2050 | 4,040,000 | 4,160,727 | ||||||||||||
FNMA | 3.50 | 4-1-2034 | 4,030,256 | 4,221,772 | ||||||||||||
FNMA | 3.50 | 1-1-2035 | 177,847 | 187,830 | ||||||||||||
FNMA | 3.50 | 3-1-2036 | 2,306,040 | 2,421,793 | ||||||||||||
FNMA | 3.50 | 4-1-2037 | 1,131,182 | 1,191,274 | ||||||||||||
FNMA | 3.50 | 6-1-2042 | 511,329 | 544,040 | ||||||||||||
FNMA | 3.50 | 7-1-2042 | 1,009,834 | 1,075,535 | ||||||||||||
FNMA | 3.50 | 10-1-2042 | 4,431,374 | 4,713,359 | ||||||||||||
FNMA | 3.50 | 9-1-2043 | 1,990,345 | 2,116,020 | ||||||||||||
FNMA | 3.50 | 3-1-2048 | 978,292 | 1,027,470 | ||||||||||||
FNMA | 3.50 | 8-1-2049 | 5,089,263 | 5,283,263 | ||||||||||||
FNMA | 3.50 | 10-1-2049 | 5,685,878 | 5,910,608 | ||||||||||||
FNMA | 4.00 | 6-1-2042 | 907,749 | 983,128 | ||||||||||||
FNMA | 4.00 | 6-1-2042 | 9,501,462 | 10,291,134 | ||||||||||||
FNMA | 4.00 | 8-1-2043 | 6,235,190 | 6,759,969 | ||||||||||||
FNMA | 4.00 | 12-1-2047 | 4,188,879 | 4,468,114 | ||||||||||||
FNMA | 4.00 | 2-1-2048 | 6,206,001 | 6,897,573 | ||||||||||||
FNMA | 4.00 | 6-1-2048 | 1,411,411 | 1,497,689 | ||||||||||||
FNMA | 4.00 | 8-1-2048 | 925,495 | 979,197 | ||||||||||||
FNMA %% | 4.00 | 3-12-2050 | 2,055,000 | 2,164,726 | ||||||||||||
FNMA | 4.50 | 5-1-2040 | 389,332 | 429,399 | ||||||||||||
FNMA | 4.50 | 9-1-2040 | 9,162,283 | 10,079,232 | ||||||||||||
FNMA | 4.50 | 2-1-2047 | 2,844,116 | 3,100,769 | ||||||||||||
FNMA | 4.50 | 4-1-2048 | 2,247,517 | 2,436,010 | ||||||||||||
FNMA | 4.50 | 8-1-2048 | 91,798 | 98,371 | ||||||||||||
FNMA | 4.50 | 11-1-2048 | 4,368,502 | 4,673,903 | ||||||||||||
FNMA | 5.00 | 1-1-2042 | 322,351 | 362,191 | ||||||||||||
FNMA | 5.00 | 6-1-2045 | 1,245,962 | 1,399,994 | ||||||||||||
FNMA | 5.00 | 7-1-2045 | 4,188,506 | 4,706,461 | ||||||||||||
FNMA | 5.50 | 9-1-2040 | 2,368,708 | 2,726,762 | ||||||||||||
FNMA | 6.00 | 5-1-2041 | 125,485 | 146,841 | ||||||||||||
FNMA | 6.21 | 8-6-2038 | 60,000 | 101,144 | ||||||||||||
FNMA | 6.25 | 5-15-2029 | 100,000 | 142,490 | ||||||||||||
FNMA | 7.13 | 1-15-2030 | 810,000 | 1,237,759 | ||||||||||||
FNMA | 7.25 | 5-15-2030 | 80,000 | 124,282 | ||||||||||||
FNMA Series2012-M14 Class AI±± | 2.89 | 9-25-2027 | 165,625 | 178,796 | ||||||||||||
FNMA Series2016-M5 Class A2 | 2.47 | 4-25-2026 | 220,000 | 229,840 | ||||||||||||
FNMA Series2016-M7 Class A2 | 2.50 | 9-25-2026 | 175,000 | 184,116 | ||||||||||||
FNMA Series2017-M1 Class A2±± | 2.42 | 10-25-2026 | 275,000 | 290,733 | ||||||||||||
FNMA Series2017-M11 Class A2 | 2.98 | 8-25-2029 | 1,370,000 | 1,519,165 | ||||||||||||
FNMA Series2017-M3 Class A2±± | 2.48 | 12-25-2026 | 995,000 | 1,059,078 | ||||||||||||
FNMA Series2017-M5 Class A2±± | 3.18 | 4-25-2029 | 70,000 | 78,243 | ||||||||||||
FNMA Series2018-M13 Class A2±± | 3.70 | 9-25-2030 | 90,000 | 105,572 | ||||||||||||
FNMA Series2019-M7 Class A2 | 3.14 | 4-25-2029 | 225,000 | 251,872 | ||||||||||||
GNMA | 3.00 | 4-20-2045 | 7,001,167 | 7,321,074 | ||||||||||||
GNMA | 3.00 | 11-20-2045 | 521,879 | 544,661 | ||||||||||||
GNMA | 3.00 | 3-20-2046 | 4,900,423 | 5,113,200 | ||||||||||||
GNMA | 3.00 | 12-20-2049 | 2,687,924 | 2,779,001 | ||||||||||||
The accompanying notes are an integral part of these financial statements.
Wells Fargo Funds | 39
Table of Contents
Portfolio of investments—February 29, 2020
BLOOMBERG BARCLAYS US AGGREGATEEX-CORPORATE PORTFOLIO
| Interest rate | Maturity date | Principal | Value | |||||||||||||
| Agency Securities (continued) | ||||||||||||||||
GNMA | 3.50 | % | 2-20-2045 | $ | 13,293,937 | $ | 14,003,543 | |||||||||
GNMA | 3.50 | 6-20-2045 | 2,138,119 | 2,252,630 | ||||||||||||
GNMA | 3.50 | 11-20-2045 | 2,491,327 | 2,624,762 | ||||||||||||
GNMA | 3.50 | 7-20-2047 | 685,621 | 718,755 | ||||||||||||
GNMA | 3.50 | 5-20-2048 | 201,149 | 209,792 | ||||||||||||
GNMA | 3.50 | 9-20-2049 | 3,442,817 | 3,571,068 | ||||||||||||
GNMA | 4.00 | 7-20-2044 | 2,375,488 | 2,546,431 | ||||||||||||
GNMA | 4.00 | 8-20-2044 | 1,170,755 | 1,255,091 | ||||||||||||
GNMA | 4.00 | 9-20-2044 | 2,378,878 | 2,550,280 | ||||||||||||
GNMA | 4.00 | 12-20-2047 | 4,281,752 | 4,530,734 | ||||||||||||
GNMA | 4.00 | 9-20-2049 | 3,281,661 | 3,426,451 | ||||||||||||
TVA | 2.88 | 2-1-2027 | 35,000 | 38,836 | ||||||||||||
TVA | 3.88 | 2-15-2021 | 360,000 | 369,243 | ||||||||||||
TVA | 4.63 | 9-15-2060 | 35,000 | 56,078 | ||||||||||||
TVA | 5.38 | 4-1-2056 | 10,000 | 17,632 | ||||||||||||
TVA | 5.50 | 6-15-2038 | 140,000 | 212,697 | ||||||||||||
TVA | 6.75 | 11-1-2025 | 120,000 | 157,014 | ||||||||||||
Total Agency Securities (Cost $245,478,865) |
| 251,858,709 | ||||||||||||||
|
| |||||||||||||||
| Asset-Backed Securities: 0.60% | ||||||||||||||||
Bank of America Credit Card Trust Series2018-A1 Class A1 | 2.70 | 7-17-2023 | 40,000 | 40,531 | ||||||||||||
Capital One Multi Asset Execution Trust Series2017-A3 Class A3 | 2.43 | 1-15-2025 | 110,000 | 112,712 | ||||||||||||
CarMax Auto Owner Trust Series2016-3 Class A4 | 1.60 | 1-18-2022 | 17,000 | 16,999 | ||||||||||||
CarMax Auto Owner Trust Series2017-2 Class A4 | 2.25 | 9-15-2022 | 195,000 | 196,654 | ||||||||||||
CarMax Auto Owner Trust Series2017-3 Class A4 | 2.22 | 11-15-2022 | 89,000 | 89,960 | ||||||||||||
CarMax Auto Owner Trust Series2018-3 Class D | 3.91 | 1-15-2025 | 80,000 | 83,845 | ||||||||||||
Chase Issuance Trust Series2012-A7 Class A7 | 2.16 | 9-15-2024 | 205,000 | 209,971 | ||||||||||||
Citibank Credit Card Issuance Trust Series2014-A5 Class A5 | 2.68 | 6-7-2023 | 110,000 | 112,010 | ||||||||||||
Citibank Credit Card Issuance Trust Series2018-A3 Class A3 | 3.29 | 5-23-2025 | 180,000 | 192,068 | ||||||||||||
Citibank Credit Card Issuance Trust Series2018-A7 Class A7 | 3.96 | 10-13-2030 | 130,000 | 151,708 | ||||||||||||
Discover Card Execution Note Trust Series2017-A2 Class A2 | 2.39 | 7-15-2024 | 335,000 | 342,001 | ||||||||||||
Ford Credit Floorplan Master Owner Trust Series2017-3 Class A | 2.48 | 9-15-2024 | 50,000 | 51,525 | ||||||||||||
Ford Credit Floorplan Master Owner Trust Series2018-2 Class A | 3.17 | 3-15-2025 | 100,000 | 105,014 | ||||||||||||
Ford Credit Floorplan Master Owner Trust Series2018-3 Class A1 | 3.52 | 10-15-2023 | 105,000 | 108,950 | ||||||||||||
Ford Credit Floorplan Master Owner Trust Series2019-2 Class A | 3.06 | 4-15-2026 | 65,000 | 68,773 | ||||||||||||
Nissan Auto Receivables Owner Trust Series2017-A Class A4 | 2.11 | 5-15-2023 | 15,000 | 15,094 | ||||||||||||
Nissan Auto Receivables Owner Trust Series2017-C Class A4 | 2.28 | 2-15-2024 | 95,000 | 96,117 | ||||||||||||
Nissan Auto Receivables Owner Trust Series2018-B Class A4 | 3.16 | 12-16-2024 | 195,000 | 202,958 | ||||||||||||
Nissan Auto Receivables Owner Trust Series2018-C Class A4 | 3.27 | 6-16-2025 | 155,000 | 162,640 | ||||||||||||
Santander Drive Auto Receivables Trust Series2019-1 Class C | 3.42 | 4-15-2025 | 140,000 | 142,722 | ||||||||||||
Synchrony Credit Card Master Note Trust Series2016-2 Class A | 2.21 | 5-15-2024 | 175,000 | 176,733 | ||||||||||||
Synchrony Credit Card Master Note Trust Series2018-2 Class A | 3.47 | 5-15-2026 | 105,000 | 111,969 | ||||||||||||
Toyota Auto Receivables Owner Trust Series2017-D Class A4 | 2.12 | 2-15-2023 | 155,000 | 156,676 | ||||||||||||
World Financial Network Credit Card Master Trust Series2016-A Class A | 2.03 | 4-15-2025 | 237,000 | 238,727 | ||||||||||||
World Omni Auto Receivables Trust Series2016-B Class A4 | 1.48 | 11-15-2022 | 192,000 | 192,140 | ||||||||||||
World Omni Auto Receivables Trust Series2017-A Class A4 | 2.24 | 6-15-2023 | 210,000 | 212,166 | ||||||||||||
World Omni Auto Receivables Trust Series2017-B Class A4 | 2.25 | 10-16-2023 | 205,000 | 208,638 | ||||||||||||
World Omni Auto Receivables Trust Series2018-D Class A4 | 3.44 | 12-16-2024 | 28,000 | 29,574 | ||||||||||||
World Omni Auto Receivables Trust Series2019-A Class A3 | 2.94 | 5-16-2022 | 185,000 | 188,804 | ||||||||||||
Total Asset-Backed Securities (Cost $3,936,372) |
| 4,017,679 | ||||||||||||||
|
| |||||||||||||||
The accompanying notes are an integral part of these financial statements.
40 | Wells Fargo Funds
Table of Contents
Portfolio of investments—February 29, 2020
BLOOMBERG BARCLAYS US AGGREGATEEX-CORPORATE PORTFOLIO
| Interest rate | Maturity date | Principal | Value | |||||||||||||
| Municipal Obligations: 0.88% |
| |||||||||||||||
| California: 0.31% | ||||||||||||||||
| Education Revenue: 0.07% | ||||||||||||||||
California Series B | 3.90 | % | 11-1-2047 | $ | 15,000 | $ | 18,790 | |||||||||
University of California Series AD | 4.86 | 5-15-2112 | 70,000 | 107,083 | ||||||||||||
University of California Series BD | 3.35 | 7-1-2029 | 310,000 | 352,631 | ||||||||||||
| 478,504 | ||||||||||||||||
|
| |||||||||||||||
| GO Revenue: 0.12% | ||||||||||||||||
California Build America Bonds | 5.70 | 11-1-2021 | 90,000 | 95,936 | ||||||||||||
California Build America Bonds | 7.55 | 4-1-2039 | 110,000 | 188,899 | ||||||||||||
California Build America Bonds | 7.60 | 11-1-2040 | 15,000 | 26,511 | ||||||||||||
California Build America Bonds Taxable Various Purpose | 7.50 | 4-1-2034 | 100,000 | 165,759 | ||||||||||||
Los Angeles CA Community College District Build America Bonds | 6.75 | 8-1-2049 | 5,000 | 9,072 | ||||||||||||
Los Angeles CA Unified School District Build America Bonds | 5.75 | 7-1-2034 | 15,000 | 20,534 | ||||||||||||
Los Angeles CA Unified School District Build America Bonds | 5.76 | 7-1-2029 | 60,000 | 77,194 | ||||||||||||
Los Angeles CA Unified School District Build America Bonds | 6.76 | 7-1-2034 | 160,000 | 235,294 | ||||||||||||
| 819,199 | ||||||||||||||||
|
| |||||||||||||||
| Transportation Revenue: 0.07% | ||||||||||||||||
Bay Area CA Toll Authority Series 1 | 6.26 | 4-1-2049 | 100,000 | 172,003 | ||||||||||||
Bay Area CA Toll Authority Series 1 | 6.92 | 4-1-2040 | 15,000 | 23,741 | ||||||||||||
Bay Area CA Toll Authority Series 1 | 7.04 | 4-1-2050 | 140,000 | 258,320 | ||||||||||||
| 454,064 | ||||||||||||||||
|
| |||||||||||||||
| Utilities Revenue: 0.05% | ||||||||||||||||
California Department of Water Resources Series P | 2.00 | 5-1-2022 | 55,000 | 55,963 | ||||||||||||
Los Angeles CA Department of Water & Power Build America Bonds Series A | 5.72 | 7-1-2039 | 100,000 | 147,396 | ||||||||||||
Los Angeles CA Department of Water & Power Build America Bonds Series D | 6.57 | 7-1-2045 | 55,000 | 94,802 | ||||||||||||
| 298,161 | ||||||||||||||||
|
| |||||||||||||||
| 2,049,928 | ||||||||||||||||
|
| |||||||||||||||
| Florida: 0.02% | ||||||||||||||||
| Miscellaneous Revenue: 0.02% | ||||||||||||||||
Florida Board of Administrative Finance Series A | 2.64 | 7-1-2021 | 150,000 | 152,781 | ||||||||||||
|
| |||||||||||||||
| Georgia: 0.00% | ||||||||||||||||
| Utilities Revenue: 0.00% | �� | |||||||||||||||
Municipal Electric Authority of Georgia Build America Bonds | 7.06 | 4-1-2057 | 10,000 | 15,147 | ||||||||||||
|
| |||||||||||||||
| Illinois: 0.11% | ||||||||||||||||
| GO Revenue: 0.05% | ||||||||||||||||
Chicago IL Series B | 6.31 | 1-1-2044 | 50,000 | 65,737 | ||||||||||||
Illinois Taxable Pension | 5.10 | 6-1-2033 | 230,000 | 269,100 | ||||||||||||
| 334,837 | ||||||||||||||||
|
| |||||||||||||||
| Miscellaneous Revenue: 0.01% | ||||||||||||||||
Illinois Build America Bonds Series 3 | 6.73 | 4-1-2035 | 45,000 | 56,404 | ||||||||||||
|
| |||||||||||||||
The accompanying notes are an integral part of these financial statements.
Wells Fargo Funds | 41
Table of Contents
Portfolio of investments—February 29, 2020
BLOOMBERG BARCLAYS US AGGREGATEEX-CORPORATE PORTFOLIO
| Interest rate | Maturity date | Principal | Value | |||||||||||||
| Tax Revenue: 0.05% | ||||||||||||||||
Chicago IL Transit Authority Series B | 6.90 | % | 12-1-2040 | $ | 210,000 | $ | 307,127 | |||||||||
|
| |||||||||||||||
| 698,368 | ||||||||||||||||
|
| |||||||||||||||
| Kansas: 0.00% | ||||||||||||||||
| Miscellaneous Revenue: 0.00% | ||||||||||||||||
Kansas Development Finance Authority Series H | 4.93 | 4-15-2045 | 5,000 | 6,970 | ||||||||||||
|
| |||||||||||||||
| Massachusetts: 0.03% | ||||||||||||||||
| GO Revenue: 0.03% | ||||||||||||||||
Massachusetts Build America Bonds Series A | 4.91 | 5-1-2029 | 130,000 | 163,755 | ||||||||||||
Massachusetts Build America Bonds Series D | 4.50 | 8-1-2031 | 5,000 | 6,287 | ||||||||||||
| 170,042 | ||||||||||||||||
|
| |||||||||||||||
| New Jersey: 0.04% | ||||||||||||||||
| Miscellaneous Revenue: 0.02% | ||||||||||||||||
New Jersey EDA Series A (National Insured) | 7.43 | 2-15-2029 | 95,000 | 124,043 | ||||||||||||
|
| |||||||||||||||
| Transportation Revenue: 0.02% | ||||||||||||||||
New Jersey Turnpike Authority Build America Bonds Series A | 7.10 | 1-1-2041 | 70,000 | 118,231 | ||||||||||||
|
| |||||||||||||||
| 242,274 | ||||||||||||||||
|
| |||||||||||||||
| New York: 0.19% | ||||||||||||||||
| Airport Revenue: 0.07% | ||||||||||||||||
Port Authority of New York & New Jersey Consolidated Bonds Series 174 | 4.46 | 10-1-2062 | 190,000 | 259,654 | ||||||||||||
Port Authority of New York & New Jersey Consolidated Bonds Series 201 | 4.23 | 10-15-2057 | 100,000 | 137,940 | ||||||||||||
Port Authority of New York & New Jersey Consolidated Bonds Series 210 | 4.03 | 9-1-2048 | 50,000 | 66,611 | ||||||||||||
| 464,205 | ||||||||||||||||
|
| |||||||||||||||
| Tax Revenue: 0.07% | ||||||||||||||||
New York Metropolitan Transportation Authority Dedicated Tax Fund Build America Bonds | 7.34 | 11-15-2039 | 220,000 | 376,352 | ||||||||||||
New York NY Transitional Finance Authority Build America Bonds SubseriesC-2 | 5.77 | 8-1-2036 | 100,000 | 132,551 | ||||||||||||
| 508,903 | ||||||||||||||||
|
| |||||||||||||||
| Water & Sewer Revenue: 0.05% | ||||||||||||||||
New York NY Municipal Water Finance Authority Series AA | 5.44 | 6-15-2043 | 10,000 | 15,614 | ||||||||||||
New York NY Municipal Water Finance Authority Series CC | 5.88 | 6-15-2044 | 190,000 | 296,981 | ||||||||||||
| 312,595 | ||||||||||||||||
|
| |||||||||||||||
| 1,285,703 | ||||||||||||||||
|
| |||||||||||||||
| Ohio: 0.04% | ||||||||||||||||
| Education Revenue: 0.00% | ||||||||||||||||
Ohio State University Build America Bonds | 4.91 | 6-1-2040 | 5,000 | 7,029 | ||||||||||||
|
| |||||||||||||||
| Utilities Revenue: 0.04% | ||||||||||||||||
American Municipal Power Ohio Incorporated Build America Bonds | 5.94 | 2-15-2047 | 150,000 | 235,433 | ||||||||||||
American Municipal Power Ohio Incorporated Build America Bonds Series E | 6.27 | 2-15-2050 | 10,000 | 14,788 | ||||||||||||
| 250,221 | ||||||||||||||||
|
| |||||||||||||||
| 257,250 | ||||||||||||||||
|
| |||||||||||||||
The accompanying notes are an integral part of these financial statements.
42 | Wells Fargo Funds
Table of Contents
Portfolio of investments—February 29, 2020
BLOOMBERG BARCLAYS US AGGREGATEEX-CORPORATE PORTFOLIO
| Interest rate | Maturity date | Principal | Value | |||||||||||||
| Oregon: 0.03% | ||||||||||||||||
| Tax Revenue: 0.03% | ||||||||||||||||
Oregon | 5.76 | % | 6-1-2023 | $ | 135,237 | $ | 146,151 | |||||||||
Oregon Department of Transportation Build America Bonds Series A | 5.83 | 11-15-2034 | 50,000 | 72,163 | ||||||||||||
| 218,314 | ||||||||||||||||
|
| |||||||||||||||
| Pennsylvania: 0.00% | ||||||||||||||||
| Transportation Revenue: 0.00% | ||||||||||||||||
Pennsylvania Turnpike Comission Series B | 5.51 | 12-1-2045 | 5,000 | 7,720 | ||||||||||||
|
| |||||||||||||||
| Texas: 0.10% | ||||||||||||||||
| Miscellaneous Revenue: 0.06% | ||||||||||||||||
Texas Build America Bonds | 5.52 | 4-1-2039 | 290,000 | 437,169 | ||||||||||||
|
| |||||||||||||||
| Transportation Revenue: 0.01% | ||||||||||||||||
Texas Private Activity Bond North Tarrant Express Managed Lanes Project Series B | 3.92 | 12-31-2049 | 50,000 | 57,781 | ||||||||||||
|
| |||||||||||||||
| Utilities Revenue: 0.03% | ||||||||||||||||
San Antonio TX | 4.43 | 2-1-2042 | 140,000 | 177,939 | ||||||||||||
|
| |||||||||||||||
| 672,889 | ||||||||||||||||
|
| |||||||||||||||
| Wisconsin: 0.01% | ||||||||||||||||
| Tax Revenue: 0.01% | ||||||||||||||||
Wisconsin General Fund Annual Appropriations Series C | 3.15 | 5-1-2027 | 80,000 | 87,824 | ||||||||||||
|
| |||||||||||||||
Total Municipal Obligations (Cost $5,112,061) |
| 5,865,210 | ||||||||||||||
|
| |||||||||||||||
| Non-Agency Mortgage-Backed Securities: 1.53% | ||||||||||||||||
Benchmark Mortgage Trust Series2018-B1 Class A2 | 3.57 | 1-15-2051 | 480,000 | 504,196 | ||||||||||||
Benchmark Mortgage Trust Series2018-B1 Class A4 | 3.40 | 1-15-2051 | 25,000 | 27,641 | ||||||||||||
Benchmark Mortgage Trust Series2018-B6 Class A4 | 4.26 | 10-10-2051 | 135,000 | 158,394 | ||||||||||||
CenterPoint Energy Transition Restoration Bond Company LLC | 4.24 | 8-15-2023 | 75,620 | 78,323 | ||||||||||||
CFCRE Commercial Mortgage Trust Series2016-C7 Class A3 | 3.84 | 12-10-2054 | 20,000 | 22,361 | ||||||||||||
Citigroup Commercial Mortgage Trust Series 2015-GC27 Class A5 | 3.14 | 2-10-2048 | 55,000 | 58,614 | ||||||||||||
Citigroup Commercial Mortgage Trust Series 2016 GC37 Class B | 4.23 | 4-10-2049 | 535,000 | 588,563 | ||||||||||||
Citigroup Commercial Mortgage Trust Series 2016-GC36 Class A5 | 3.62 | 2-10-2049 | 680,000 | 750,062 | ||||||||||||
Citigroup Commercial Mortgage Trust Series 2016-GC36 Class B±± | 4.76 | 2-10-2049 | 40,000 | 44,952 | ||||||||||||
Citigroup Commercial Mortgage Trust Series 2016-GC36 Class C±± | 4.76 | 2-10-2049 | 95,000 | 103,913 | ||||||||||||
Citigroup Commercial Mortgage Trust Series2016-P4 Class A4 | 2.90 | 7-10-2049 | 135,000 | 143,999 | ||||||||||||
Citigroup Commercial Mortgage Trust Series2016-P5 Class A2 | 2.40 | 10-10-2049 | 141,000 | 142,648 | ||||||||||||
Citigroup Commercial Mortgage Trust Series2018-C6 Class A4 | 4.41 | 11-10-2051 | 520,000 | 618,716 | ||||||||||||
Commercial Mortgage Trust Pass-Through Certificate Series2012-CR3 Class A3 | 2.82 | 10-15-2045 | 53,783 | 55,237 | ||||||||||||
Commercial Mortgage Trust Pass-Through Certificate Series2012-CR2 Class ASB | 2.75 | 8-15-2045 | 29,103 | 29,257 | ||||||||||||
Commercial Mortgage Trust Series2012-LC4 Class A4 | 3.29 | 12-10-2044 | 161,382 | 165,590 | ||||||||||||
Commercial Mortgage Trust Series2013-CR6 Class A4 | 3.10 | 3-10-2046 | 60,000 | 62,570 | ||||||||||||
Commercial Mortgage Trust Series 2014 UBS5 Class C±± | 4.61 | 9-10-2047 | 195,000 | 207,174 | ||||||||||||
Commercial Mortgage Trust Series 2014-UBS6 Class C±± | 4.45 | 12-10-2047 | 60,000 | 63,051 | ||||||||||||
Commercial Mortgage Trust Series 2015-CR23 Class A3 | 3.23 | 5-10-2048 | 60,000 | 64,433 | ||||||||||||
Commercial Mortgage Trust Series 2016-COR1 Class C±± | 4.38 | 10-10-2049 | 65,000 | 70,092 | ||||||||||||
Commercial Mortgage Trust Series 2016-CR28 Class A4 | 3.76 | 2-10-2049 | 215,000 | 238,043 | ||||||||||||
Goldman Sachs Mortgage Securities Trust Series2012-GC6 Class A3 | 3.48 | 1-10-2045 | 722,272 | 739,818 | ||||||||||||
The accompanying notes are an integral part of these financial statements.
Wells Fargo Funds | 43
Table of Contents
Portfolio of investments—February 29, 2020
BLOOMBERG BARCLAYS US AGGREGATEEX-CORPORATE PORTFOLIO
| Interest rate | Maturity date | Principal | Value | |||||||||||||
| Non-Agency Mortgage-Backed Securities (continued) | ||||||||||||||||
Goldman Sachs Mortgage Securities Trust Series 2012-GCJ9 Class AS | 3.12 | % | 11-10-2045 | $ | 40,000 | $ | 41,433 | |||||||||
Goldman Sachs Mortgage Securities Trust Series 2013-GC14 Class A5 | 4.24 | 8-10-2046 | 265,000 | 287,115 | ||||||||||||
Goldman Sachs Mortgage Securities Trust Series 2014-GC18 Class B±± | 4.89 | 1-10-2047 | 80,000 | 84,250 | ||||||||||||
Goldman Sachs Mortgage Securities Trust Series2017-GS5 Class A3 | 3.41 | 3-10-2050 | 600,000 | 660,376 | ||||||||||||
Goldman Sachs Mortgage Securities Trust Series 2018-GS10 Class AAB±± | 4.11 | 7-10-2051 | 180,000 | 202,583 | ||||||||||||
Goldman Sachs Mortgage Securities Trust Series2018-GS9 Class A4±± | 3.99 | 3-10-2051 | 140,000 | 160,035 | ||||||||||||
JPMorgan Chase Commercial Mortgage Securities Corporation Series2013-C15 Class A4 | 4.10 | 11-15-2045 | 16,442 | 17,627 | ||||||||||||
JPMorgan Chase Commercial Mortgage Securities Corporation Series2015-C29 Class A4 | 3.61 | 5-15-2048 | 200,000 | 218,386 | ||||||||||||
JPMorgan Chase Commercial Mortgage Securities Corporation Series2015-C30 Class A5 | 3.82 | 7-15-2048 | 1,450,000 | 1,602,978 | ||||||||||||
JPMorgan Chase Commercial Mortgage Securities Corporation Series2015-C31 Class A3 | 3.80 | 8-15-2048 | 195,000 | 215,476 | ||||||||||||
JPMorgan Chase Commercial Mortgage Securities Trust Series2015-C28 Class A2 | 2.77 | 10-15-2048 | 7,681 | 7,679 | ||||||||||||
Morgan Stanley Bank of America Merrill Lynch Trust Series2012-C5 Class A4 | 3.18 | 8-15-2045 | 60,000 | 62,020 | ||||||||||||
Morgan Stanley Bank of America Merrill Lynch Trust Series2013-C11 Class AS ±± | 4.35 | 8-15-2046 | 360,000 | 389,227 | ||||||||||||
Morgan Stanley Bank of America Merrill Lynch Trust Series2013-C8 Class A4 | 3.13 | 12-15-2048 | 50,000 | 52,051 | ||||||||||||
Morgan Stanley Bank of America Merrill Lynch Trust Series2015-C22 Class A4 | 3.31 | 4-15-2048 | 60,000 | 64,677 | ||||||||||||
Morgan Stanley Bank of America Merrill Lynch Trust Series2015-C22 Class B±± | 3.88 | 4-15-2048 | 285,000 | 305,443 | ||||||||||||
Morgan Stanley Bank of America Merrill Lynch Trust Series2015-C24 Class A4 | 3.73 | 5-15-2048 | 400,000 | 439,631 | ||||||||||||
Morgan Stanley Bank of America Merrill Lynch Trust Series2016-C30 Class B±± | 3.31 | 9-15-2049 | 425,000 | 445,899 | ||||||||||||
TotalNon-Agency Mortgage-Backed Securities (Cost $9,661,012) |
| 10,194,533 | ||||||||||||||
|
| |||||||||||||||
| U.S. Treasury Securities: 52.93% | ||||||||||||||||
U.S. Treasury Bond | 1.50 | 1-31-2027 | 1,350,000 | 1,390,816 | ||||||||||||
U.S. Treasury Bond | 2.00 | 2-15-2050 | 695,000 | 751,116 | ||||||||||||
U.S. Treasury Bond | 2.13 | 9-30-2024 | 3,270,000 | 3,445,379 | ||||||||||||
U.S. Treasury Bond | 2.13 | 11-30-2024 | 2,565,000 | 2,707,077 | ||||||||||||
U.S. Treasury Bond | 2.25 | 8-15-2049 | 370,000 | 420,571 | ||||||||||||
U.S. Treasury Bond | 2.38 | 11-15-2049 | 1,660,000 | 1,937,726 | ||||||||||||
U.S. Treasury Bond | 2.50 | 2-15-2046 | 100,000 | 117,273 | ||||||||||||
U.S. Treasury Bond | 2.50 | 5-15-2046 | 1,415,000 | 1,661,685 | ||||||||||||
U.S. Treasury Bond | 2.75 | 8-15-2042 | 6,035,000 | 7,331,346 | ||||||||||||
U.S. Treasury Bond | 2.75 | 11-15-2042 | 2,090,000 | 2,539,268 | ||||||||||||
U.S. Treasury Bond | 2.75 | 8-15-2047 | 2,990,000 | 3,699,658 | ||||||||||||
U.S. Treasury Bond | 2.75 | 11-15-2047 | 1,110,000 | 1,375,446 | ||||||||||||
U.S. Treasury Bond | 2.88 | 5-15-2028 | 2,295,000 | 2,617,017 | ||||||||||||
U.S. Treasury Bond | 2.88 | 5-15-2043 | 4,640,000 | 5,754,325 | ||||||||||||
U.S. Treasury Bond | 3.00 | 5-15-2042 | 2,265,000 | 2,860,890 | ||||||||||||
U.S. Treasury Bond | 3.00 | 11-15-2044 | 585,000 | 743,087 | ||||||||||||
U.S. Treasury Bond | 3.00 | 5-15-2045 | 105,000 | 133,731 | ||||||||||||
U.S. Treasury Bond | 3.00 | 11-15-2045 | 35,000 | 44,706 | ||||||||||||
U.S. Treasury Bond | 3.00 | 2-15-2047 | 70,000 | 90,322 | ||||||||||||
U.S. Treasury Bond | 3.00 | 5-15-2047 | 20,761,000 | 26,803,580 | ||||||||||||
U.S. Treasury Bond | 3.00 | 2-15-2048 | 435,000 | 564,379 | ||||||||||||
U.S. Treasury Bond | 3.00 | 8-15-2048 | 1,645,000 | 2,142,998 | ||||||||||||
U.S. Treasury Bond | 3.13 | 11-15-2041 | 1,105,000 | 1,420,270 | ||||||||||||
U.S. Treasury Bond | 3.13 | 2-15-2042 | 370,000 | 476,245 | ||||||||||||
U.S. Treasury Bond | 3.13 | 2-15-2043 | 2,010,000 | 2,588,739 | ||||||||||||
U.S. Treasury Bond | 3.13 | 5-15-2048 | 1,475,000 | 1,959,388 | ||||||||||||
U.S. Treasury Bond | 3.38 | 5-15-2044 | 20,000 | 26,888 | ||||||||||||
The accompanying notes are an integral part of these financial statements.
44 | Wells Fargo Funds
Table of Contents
Portfolio of investments—February 29, 2020
BLOOMBERG BARCLAYS US AGGREGATEEX-CORPORATE PORTFOLIO
| Interest rate | Maturity date | Principal | Value | |||||||||||||
| U.S. Treasury Securities (continued) | ||||||||||||||||
U.S. Treasury Bond | 3.50 | % | 2-15-2039 | $ | 15,000 | $ | 20,133 | |||||||||
U.S. Treasury Bond | 3.63 | 8-15-2043 | 110,000 | 152,909 | ||||||||||||
U.S. Treasury Bond | 3.63 | 2-15-2044 | 35,000 | 48,781 | ||||||||||||
U.S. Treasury Bond | 3.75 | 8-15-2041 | 780,000 | 1,091,330 | ||||||||||||
U.S. Treasury Bond | 3.75 | 11-15-2043 | 350,000 | 496,016 | ||||||||||||
U.S. Treasury Bond | 4.25 | 11-15-2040 | 480,000 | 712,819 | ||||||||||||
U.S. Treasury Bond | 4.75 | 2-15-2041 | 120,000 | 189,605 | ||||||||||||
U.S. Treasury Bond | 5.00 | 5-15-2037 | 1,574,000 | 2,455,071 | ||||||||||||
U.S. Treasury Bond | 5.25 | 11-15-2028 | 2,440,000 | 3,281,800 | ||||||||||||
U.S. Treasury Bond | 5.25 | 2-15-2029 | 760,000 | 1,028,494 | ||||||||||||
U.S. Treasury Bond | 5.38 | 2-15-2031 | 2,472,000 | 3,541,237 | ||||||||||||
U.S. Treasury Bond | 5.50 | 8-15-2028 | 430,000 | 583,507 | ||||||||||||
U.S. Treasury Bond | 6.13 | 11-15-2027 | 1,070,000 | 1,473,967 | ||||||||||||
U.S. Treasury Bond | 6.13 | 8-15-2029 | 1,280,000 | 1,855,550 | ||||||||||||
U.S. Treasury Bond | 6.25 | 5-15-2030 | 905,000 | 1,350,571 | ||||||||||||
U.S. Treasury Bond | 6.38 | 8-15-2027 | 130,000 | 179,948 | ||||||||||||
U.S. Treasury Bond | 6.88 | 8-15-2025 | 335,000 | 440,590 | ||||||||||||
U.S. Treasury Note | 1.13 | 6-30-2021 | 2,555,000 | 2,558,693 | ||||||||||||
U.S. Treasury Note | 1.13 | 8-31-2021 | 3,585,000 | 3,592,142 | ||||||||||||
U.S. Treasury Note | 1.13 | 9-30-2021 | 1,610,000 | 1,613,836 | ||||||||||||
U.S. Treasury Note %% | 1.13 | 2-28-2022 | 2,515,000 | 2,526,887 | ||||||||||||
U.S. Treasury Note | 1.25 | 3-31-2021 | 885,000 | 886,763 | ||||||||||||
U.S. Treasury Note | 1.25 | 10-31-2021 | 2,820,000 | 2,833,659 | ||||||||||||
U.S. Treasury Note | 1.25 | 7-31-2023 | 3,255,000 | 3,293,907 | ||||||||||||
U.S. Treasury Note | 1.25 | 8-31-2024 | 2,690,000 | 2,729,194 | ||||||||||||
U.S. Treasury Note %% | 1.25 | 2-28-2025 | 1,855,000 | 1,873,985 | ||||||||||||
U.S. Treasury Note | 1.38 | 4-30-2021 | 1,560,000 | 1,565,363 | ||||||||||||
U.S. Treasury Note | 1.38 | 5-31-2021 | 3,425,000 | 3,440,252 | ||||||||||||
U.S. Treasury Note | 1.38 | 6-30-2023 | 4,245,000 | 4,311,494 | ||||||||||||
U.S. Treasury Note | 1.38 | 8-31-2023 | 435,000 | 442,120 | ||||||||||||
U.S. Treasury Note | 1.38 | 9-30-2023 | 6,135,000 | 6,237,330 | ||||||||||||
U.S. Treasury Note | 1.38 | 8-31-2026 | 3,520,000 | 3,596,450 | ||||||||||||
U.S. Treasury Note | 1.50 | 1-31-2022 | 3,290,000 | 3,325,856 | ||||||||||||
U.S. Treasury Note | 1.50 | 8-15-2022 | 2,480,000 | 2,517,103 | ||||||||||||
U.S. Treasury Note | 1.50 | 2-28-2023 | 3,560,000 | 3,624,386 | ||||||||||||
U.S. Treasury Note | 1.50 | 3-31-2023 | 6,085,000 | 6,198,856 | ||||||||||||
U.S. Treasury Note | 1.50 | 9-30-2024 | 3,215,000 | 3,298,263 | ||||||||||||
U.S. Treasury Note | 1.50 | 10-31-2024 | 3,475,000 | 3,566,354 | ||||||||||||
U.S. Treasury Note | 1.50 | 8-15-2026 | 3,560,000 | 3,664,436 | ||||||||||||
U.S. Treasury Note | 1.63 | 8-15-2022 | 175,000 | 178,165 | ||||||||||||
U.S. Treasury Note | 1.63 | 11-15-2022 | 5,455,000 | 5,561,969 | ||||||||||||
U.S. Treasury Note | 1.63 | 4-30-2023 | 280,000 | 286,409 | ||||||||||||
U.S. Treasury Note | 1.63 | 5-31-2023 | 3,090,000 | 3,161,939 | ||||||||||||
U.S. Treasury Note | 1.63 | 10-31-2023 | 6,080,000 | 6,238,650 | ||||||||||||
U.S. Treasury Note | 1.63 | 2-15-2026 | 6,240,000 | 6,464,250 | ||||||||||||
U.S. Treasury Note | 1.63 | 5-15-2026 | 625,000 | 647,827 | ||||||||||||
U.S. Treasury Note | 1.63 | 10-31-2026 | 915,000 | 949,527 | ||||||||||||
U.S. Treasury Note | 1.63 | 8-15-2029 | 2,600,000 | 2,714,461 | ||||||||||||
U.S. Treasury Note | 1.75 | 11-30-2021 | 1,975,000 | 2,002,696 | ||||||||||||
U.S. Treasury Note | 1.75 | 2-28-2022 | 1,030,000 | 1,047,059 | ||||||||||||
U.S. Treasury Note | 1.75 | 3-31-2022 | 2,585,000 | 2,629,935 | ||||||||||||
U.S. Treasury Note | 1.75 | 4-30-2022 | 2,465,000 | 2,509,389 | ||||||||||||
U.S. Treasury Note | 1.75 | 5-15-2022 | 3,030,000 | 3,086,694 | ||||||||||||
U.S. Treasury Note | 1.75 | 5-31-2022 | 3,425,000 | 3,489,620 | ||||||||||||
The accompanying notes are an integral part of these financial statements.
Wells Fargo Funds | 45
Table of Contents
Portfolio of investments—February 29, 2020
BLOOMBERG BARCLAYS US AGGREGATEEX-CORPORATE PORTFOLIO
| Interest rate | Maturity date | Principal | Value | |||||||||||||
| U.S. Treasury Securities (continued) | ||||||||||||||||
U.S. Treasury Note | 1.75 | % | 6-15-2022 | $ | 3,520,000 | $ | 3,588,750 | |||||||||
U.S. Treasury Note | 1.75 | 6-30-2022 | 12,505,000 | 12,752,169 | ||||||||||||
U.S. Treasury Note | 1.75 | 9-30-2022 | 10,000 | 10,221 | ||||||||||||
U.S. Treasury Note | 1.75 | 5-15-2023 | 410,000 | 421,099 | ||||||||||||
U.S. Treasury Note | 1.75 | 6-30-2024 | 3,510,000 | 3,633,398 | ||||||||||||
U.S. Treasury Note | 1.75 | 12-31-2026 | 2,720,000 | 2,846,756 | ||||||||||||
U.S. Treasury Note | 1.75 | 11-15-2029 | 830,000 | 876,363 | ||||||||||||
U.S. Treasury Note | 1.88 | 11-30-2021 | 3,550,000 | 3,607,826 | ||||||||||||
U.S. Treasury Note | 1.88 | 1-31-2022 | 2,805,000 | 2,855,622 | ||||||||||||
U.S. Treasury Note | 1.88 | 2-28-2022 | 345,000 | 351,496 | ||||||||||||
U.S. Treasury Note | 1.88 | 7-31-2022 | 1,865,000 | 1,908,565 | ||||||||||||
U.S. Treasury Note | 1.88 | 8-31-2024 | 3,290,000 | 3,427,640 | ||||||||||||
U.S. Treasury Note | 2.00 | 5-31-2021 | 5,890,000 | 5,959,484 | ||||||||||||
U.S. Treasury Note | 2.00 | 8-31-2021 | 425,000 | 431,425 | ||||||||||||
U.S. Treasury Note | 2.00 | 10-31-2021 | 1,160,000 | 1,179,938 | ||||||||||||
U.S. Treasury Note | 2.00 | 10-31-2022 | 1,990,000 | 2,048,223 | ||||||||||||
U.S. Treasury Note | 2.00 | 2-15-2023 | 30,000 | 30,977 | ||||||||||||
U.S. Treasury Note | 2.00 | 6-30-2024 | 9,501,000 | 9,936,339 | ||||||||||||
U.S. Treasury Note | 2.00 | 2-15-2025 | 340,000 | 357,518 | ||||||||||||
U.S. Treasury Note | 2.00 | 8-15-2025 | 1,200,000 | 1,265,625 | ||||||||||||
U.S. Treasury Note | 2.13 | 9-30-2021 | 3,355,000 | 3,415,678 | ||||||||||||
U.S. Treasury Note | 2.13 | 12-31-2022 | 1,700,000 | 1,758,836 | ||||||||||||
U.S. Treasury Note | 2.13 | 11-30-2023 | 750,000 | 783,633 | ||||||||||||
U.S. Treasury Note | 2.13 | 7-31-2024 | 10,000 | 10,520 | ||||||||||||
U.S. Treasury Note | 2.13 | 5-15-2025 | 3,205,000 | 3,396,048 | ||||||||||||
U.S. Treasury Note | 2.25 | 4-30-2021 | 3,060,000 | 3,102,075 | ||||||||||||
U.S. Treasury Note | 2.25 | 7-31-2021 | 5,580,000 | 5,678,522 | ||||||||||||
U.S. Treasury Note | 2.25 | 12-31-2023 | 3,340,000 | 3,508,957 | ||||||||||||
U.S. Treasury Note | 2.25 | 10-31-2024 | 2,035,000 | 2,157,497 | ||||||||||||
U.S. Treasury Note | 2.25 | 11-15-2024 | 4,275,000 | 4,534,172 | ||||||||||||
U.S. Treasury Note | 2.25 | 12-31-2024 | 1,485,000 | 1,577,232 | ||||||||||||
U.S. Treasury Note | 2.25 | 11-15-2025 | 1,805,000 | 1,931,562 | ||||||||||||
U.S. Treasury Note | 2.25 | 3-31-2026 | 3,200,000 | 3,435,000 | ||||||||||||
U.S. Treasury Note | 2.25 | 2-15-2027 | 400,000 | 432,344 | ||||||||||||
U.S. Treasury Note | 2.25 | 11-15-2027 | 20,000 | 21,749 | ||||||||||||
U.S. Treasury Note | 2.38 | 4-15-2021 | 30,000 | 30,436 | ||||||||||||
U.S. Treasury Note | 2.38 | 8-15-2024 | 490,000 | 521,008 | ||||||||||||
U.S. Treasury Note | 2.38 | 5-15-2027 | 7,413,000 | 8,093,780 | ||||||||||||
U.S. Treasury Note | 2.38 | 5-15-2029 | 690,000 | 765,280 | ||||||||||||
U.S. Treasury Note | 2.50 | 1-15-2022 | 3,175,000 | 3,267,149 | ||||||||||||
U.S. Treasury Note | 2.50 | 8-15-2023 | 5,540,000 | 5,841,887 | ||||||||||||
U.S. Treasury Note | 2.50 | 1-31-2025 | 1,670,000 | 1,795,968 | ||||||||||||
U.S. Treasury Note | 2.50 | 2-28-2026 | 800,000 | 869,719 | ||||||||||||
U.S. Treasury Note | 2.63 | 6-15-2021 | 1,220,000 | 1,244,734 | ||||||||||||
U.S. Treasury Note | 2.63 | 1-31-2026 | 2,230,000 | 2,438,714 | ||||||||||||
U.S. Treasury Note | 2.63 | 2-15-2029 | 3,060,000 | 3,452,899 | ||||||||||||
U.S. Treasury Note | 2.75 | 11-15-2023 | 2,040,000 | 2,176,823 | ||||||||||||
U.S. Treasury Note | 2.75 | 2-28-2025 | 1,410,000 | 1,534,752 | ||||||||||||
U.S. Treasury Note | 2.75 | 6-30-2025 | 1,270,000 | 1,388,219 | ||||||||||||
U.S. Treasury Note | 2.75 | 2-15-2028 | 2,685,000 | 3,028,072 | ||||||||||||
U.S. Treasury Note | 2.88 | 11-30-2025 | 3,225,000 | 3,565,263 | ||||||||||||
U.S. Treasury Note | 2.88 | 8-15-2028 | 3,080,000 | 3,521,788 | ||||||||||||
U.S. Treasury Note | 3.13 | 5-15-2021 | 2,430,000 | 2,490,180 | ||||||||||||
U.S. Treasury Note | 3.13 | 11-15-2028 | 1,855,000 | 2,165,640 | ||||||||||||
The accompanying notes are an integral part of these financial statements.
46 | Wells Fargo Funds
Table of Contents
Portfolio of investments—February 29, 2020
BLOOMBERG BARCLAYS US AGGREGATEEX-CORPORATE PORTFOLIO
| Interest rate | Maturity date | Principal | Value | |||||||||||||
| U.S. Treasury Securities (continued) | ||||||||||||||||
U.S. Treasury Note | 6.00 | % | 2-15-2026 | $ | 450,000 | $ | 581,063 | |||||||||
U.S. Treasury Note | 6.50 | 11-15-2026 | 1,995,000 | 2,706,498 | ||||||||||||
U.S. Treasury Note | 7.25 | 8-15-2022 | 1,740,000 | 2,007,457 | ||||||||||||
U.S. Treasury Note | 7.50 | 11-15-2024 | 695,000 | 904,722 | ||||||||||||
U.S. Treasury Note | 8.00 | 11-15-2021 | 760,000 | 850,013 | ||||||||||||
U.S. Treasury Note | 8.13 | 5-15-2021 | 530,000 | 574,677 | ||||||||||||
Total U.S. Treasury Securities (Cost $327,577,390) |
| 352,222,173 | ||||||||||||||
|
| |||||||||||||||
| Yankee Corporate Bonds and Notes: 3.07% | ||||||||||||||||
| Energy: 0.50% | ||||||||||||||||
| Oil, Gas & Consumable Fuels: 0.50% | ||||||||||||||||
CNOOC Petroleum North America ULC | 7.50 | 7-30-2039 | 60,000 | 100,713 | ||||||||||||
Ecopetrol SA | 5.88 | 9-18-2023 | 430,000 | 476,483 | ||||||||||||
Equinor ASA | 3.95 | 5-15-2043 | 100,000 | 116,006 | ||||||||||||
Equinor ASA | 4.80 | 11-8-2043 | 200,000 | 263,117 | ||||||||||||
Petroleos Mexicanos Company | 4.50 | 1-23-2026 | 140,000 | 137,690 | ||||||||||||
Petroleos Mexicanos Company | 5.50 | 6-27-2044 | 1,070,000 | 940,958 | ||||||||||||
Petroleos Mexicanos Company | 6.38 | 2-4-2021 | 430,000 | 442,470 | ||||||||||||
Petroleos Mexicanos Company | 6.50 | 3-13-2027 | 250,000 | 261,563 | ||||||||||||
Petroleos Mexicanos Company | 6.50 | 1-23-2029 | 90,000 | 92,565 | ||||||||||||
Petroleos Mexicanos Company | 6.50 | 6-2-2041 | 110,000 | 106,425 | ||||||||||||
Petroleos Mexicanos Company | 6.63 | 6-15-2038 | 120,000 | 117,240 | ||||||||||||
Petroleos Mexicanos Company 144A | 7.69 | 1-23-2050 | 250,000 | 260,250 | ||||||||||||
| 3,315,480 | ||||||||||||||||
|
| |||||||||||||||
| Financials: 2.57% | ||||||||||||||||
| Banks: 2.57% | ||||||||||||||||
African Development Bank | 2.63 | 3-22-2021 | 380,000 | 385,658 | ||||||||||||
Asian Development Bank | 1.75 | 9-19-2029 | 160,000 | 167,349 | ||||||||||||
Asian Development Bank | 1.88 | 1-24-2030 | 110,000 | 116,386 | ||||||||||||
Asian Development Bank | 2.00 | 2-16-2022 | 760,000 | 774,745 | ||||||||||||
Asian Development Bank | 2.00 | 4-24-2026 | 60,000 | 63,145 | ||||||||||||
Asian Development Bank | 2.63 | 1-12-2027 | 630,000 | 692,647 | ||||||||||||
Asian Development Bank | 5.82 | 6-16-2028 | 10,000 | 13,415 | ||||||||||||
Asian Development Bank | 6.22 | 8-15-2027 | 80,000 | 105,525 | ||||||||||||
Corporación Andina de Fomento | 2.13 | 9-27-2021 | 10,000 | 10,074 | ||||||||||||
Corporación Andina de Fomento | 3.75 | 11-23-2023 | 130,000 | 139,250 | ||||||||||||
Corporación Andina de Fomento | 4.38 | 6-15-2022 | 120,000 | 127,494 | ||||||||||||
European Bank for Reconstruction & Development | 2.13 | 3-7-2022 | 370,000 | 378,050 | ||||||||||||
European Investment Bank | 1.88 | 2-10-2025 | 110,000 | 114,508 | ||||||||||||
European Investment Bank | 2.00 | 3-15-2021 | 220,000 | 221,963 | ||||||||||||
European Investment Bank | 2.00 | 12-15-2022 | 390,000 | 400,810 | ||||||||||||
European Investment Bank | 2.13 | 10-15-2021 | 420,000 | 427,412 | ||||||||||||
European Investment Bank | 2.25 | 6-24-2024 | 640,000 | 673,714 | ||||||||||||
European Investment Bank | 2.50 | 3-15-2023 | 200,000 | 208,967 | ||||||||||||
European Investment Bank | 2.88 | 8-15-2023 | 660,000 | 702,658 | ||||||||||||
European Investment Bank | 3.25 | 1-29-2024 | 270,000 | 293,397 | ||||||||||||
FMS Wertmanagement | 2.00 | 8-1-2022 | 260,000 | 266,125 | ||||||||||||
Inter-American Development Bank | 1.75 | 4-14-2022 | 580,000 | 589,519 | ||||||||||||
Inter-American Development Bank | 1.75 | 9-14-2022 | 250,000 | 255,037 | ||||||||||||
Inter-American Development Bank | 1.88 | 7-23-2021 | 300,000 | 303,503 | ||||||||||||
Inter-American Development Bank | 2.00 | 6-2-2026 | 260,000 | 273,994 | ||||||||||||
The accompanying notes are an integral part of these financial statements.
Wells Fargo Funds | 47
Table of Contents
Portfolio of investments—February 29, 2020
BLOOMBERG BARCLAYS US AGGREGATEEX-CORPORATE PORTFOLIO
| Interest rate | Maturity date | Principal | Value | |||||||||||||
| Banks (continued) | ||||||||||||||||
Inter-American Development Bank | 2.13 | % | 1-18-2022 | $ | 60,000 | $ | 61,259 | |||||||||
Inter-American Development Bank | 2.13 | 1-15-2025 | 150,000 | 157,725 | ||||||||||||
Inter-American Development Bank | 2.25 | 6-18-2029 | 110,000 | 119,767 | ||||||||||||
Inter-American Development Bank | 2.38 | 7-7-2027 | 220,000 | 239,108 | ||||||||||||
International Bank for Reconstruction & Development | 1.38 | 5-24-2021 | 890,000 | 893,302 | ||||||||||||
International Bank for Reconstruction & Development | 1.50 | 8-28-2024 | 400,000 | 408,923 | ||||||||||||
International Bank for Reconstruction & Development | 1.88 | 10-7-2022 | 540,000 | 552,323 | ||||||||||||
International Bank for Reconstruction & Development | 1.88 | 6-19-2023 | 470,000 | 483,869 | ||||||||||||
International Bank for Reconstruction & Development | 2.00 | 1-26-2022 | 240,000 | 244,502 | ||||||||||||
International Bank for Reconstruction & Development | 2.50 | 3-19-2024 | 480,000 | 509,333 | ||||||||||||
International Bank for Reconstruction & Development | 2.50 | 7-29-2025 | 20,000 | 21,516 | ||||||||||||
International Finance Corporation | 1.38 | 10-16-2024 | 350,000 | 355,203 | ||||||||||||
International Finance Corporation | 2.13 | 4-7-2026 | 100,000 | 106,156 | ||||||||||||
KfW ¤ | 0.00 | 4-18-2036 | 340,000 | 262,428 | ||||||||||||
KfW ¤ | 0.00 | 6-29-2037 | 50,000 | 37,386 | ||||||||||||
KfW | 1.50 | 6-15-2021 | 390,000 | 392,230 | ||||||||||||
KfW | 2.00 | 11-30-2021 | 250,000 | 254,303 | ||||||||||||
KfW | 2.00 | 5-2-2025 | 40,000 | 41,895 | ||||||||||||
KfW | 2.13 | 3-7-2022 | 980,000 | 1,003,011 | ||||||||||||
KfW | 2.13 | 6-15-2022 | 110,000 | 112,761 | ||||||||||||
KfW | 2.13 | 1-17-2023 | 870,000 | 897,373 | ||||||||||||
KfW | 2.38 | 3-24-2021 | 170,000 | 172,249 | ||||||||||||
KfW | 2.88 | 4-3-2028 | 180,000 | 203,844 | ||||||||||||
Landwirtschaftliche Rentenbank | 1.75 | 7-27-2026 | 10,000 | 10,393 | ||||||||||||
Landwirtschaftliche Rentenbank | 2.25 | 10-1-2021 | 520,000 | 530,014 | ||||||||||||
Nordic Investment Bank | 1.25 | 8-2-2021 | 400,000 | 401,113 | ||||||||||||
Oesterreichische Kontrollbank AG | 2.88 | 3-13-2023 | 260,000 | 274,077 | ||||||||||||
Swedish Export Credit ¤ | 0.00 | 5-11-2037 | 65,000 | 41,797 | ||||||||||||
Swedish Export Credit | 1.63 | 9-12-2021 | 320,000 | 322,639 | ||||||||||||
Swedish Export Credit | 3.13 | 11-8-2021 | 260,000 | 268,740 | ||||||||||||
| 17,084,584 | ||||||||||||||||
|
| |||||||||||||||
Total Yankee Corporate Bonds and Notes (Cost $19,795,717) |
| 20,400,064 | ||||||||||||||
|
| |||||||||||||||
| Yankee Government Bonds: 2.18% | ||||||||||||||||
Canada Government | 2.00 | 11-15-2022 | 60,000 | 61,719 | ||||||||||||
Export Development Canada | 2.63 | 2-21-2024 | 430,000 | 456,726 | ||||||||||||
Export-Import Bank of Korea | 2.88 | 1-21-2025 | 400,000 | 425,826 | ||||||||||||
Hydro-Quebec | 9.40 | 2-1-2021 | 535,000 | 574,374 | ||||||||||||
Japan Bank for International Cooperation | 1.88 | 4-20-2021 | 910,000 | 917,265 | ||||||||||||
Japan Bank for International Cooperation | 2.75 | 11-16-2027 | 360,000 | 396,121 | ||||||||||||
Japan Bank for International Cooperation | 3.38 | 10-31-2023 | 270,000 | 291,149 | ||||||||||||
Korea Development Bank | 3.38 | 9-16-2025 | 460,000 | 506,180 | ||||||||||||
Oriental Republic of Uruguay | 4.98 | 4-20-2055 | 100,000 | 123,751 | ||||||||||||
Oriental Republic of Uruguay | 5.10 | 6-18-2050 | 385,000 | 483,660 | ||||||||||||
Province of Alberta | 2.20 | 7-26-2022 | 250,000 | 256,478 | ||||||||||||
Province of British Columbia | 2.00 | 10-23-2022 | 15,000 | 15,395 | ||||||||||||
Province of British Columbia | 7.25 | 9-1-2036 | 100,000 | 172,169 | ||||||||||||
Province of Manitoba | 2.10 | 9-6-2022 | 120,000 | 122,818 | ||||||||||||
Province of Ontario | 2.00 | 10-2-2029 | 90,000 | 94,728 | ||||||||||||
Province of Ontario | 2.20 | 10-3-2022 | 120,000 | 123,502 | ||||||||||||
Province of Ontario | 2.30 | 6-15-2026 | 70,000 | 74,365 | ||||||||||||
Province of Ontario | 2.50 | 4-27-2026 | 150,000 | 161,196 | ||||||||||||
The accompanying notes are an integral part of these financial statements.
48 | Wells Fargo Funds
Table of Contents
Portfolio of investments—February 29, 2020
BLOOMBERG BARCLAYS US AGGREGATEEX-CORPORATE PORTFOLIO
| Interest rate | Maturity date | Principal | Value | |||||||||||||
| Yankee Government Bonds (continued) | ||||||||||||||||
Province of Ontario | 3.20 | % | 5-16-2024 | $ | 5,000 | $ | 5,421 | |||||||||
Province of Ontario | 3.40 | 10-17-2023 | 380,000 | 411,265 | ||||||||||||
Province of Quebec | 2.50 | 4-20-2026 | 75,000 | 80,427 | ||||||||||||
Province of Quebec | 2.63 | 2-13-2023 | 60,000 | 62,770 | ||||||||||||
Province of Quebec | 7.13 | 2-9-2024 | 110,000 | 134,581 | ||||||||||||
Province of Quebec | 7.50 | 7-15-2023 | 80,000 | 96,608 | ||||||||||||
Republic of Chile | 3.50 | 1-25-2050 | 305,000 | 334,585 | ||||||||||||
Republic of Colombia | 3.88 | 4-25-2027 | 460,000 | 494,960 | ||||||||||||
Republic of Colombia | 6.13 | 1-18-2041 | 225,000 | 304,002 | ||||||||||||
Republic of Colombia | 7.38 | 9-18-2037 | 140,000 | 206,850 | ||||||||||||
Republic of Colombia | 8.13 | 5-21-2024 | 80,000 | 98,789 | ||||||||||||
Republic of Hungary | 5.38 | 3-25-2024 | 215,000 | 243,703 | ||||||||||||
Republic of Hungary | 6.38 | 3-29-2021 | 30,000 | 31,410 | ||||||||||||
Republic of Hungary | 7.63 | 3-29-2041 | 112,000 | 191,510 | ||||||||||||
Republic of Indonesia | 2.95 | 1-11-2023 | 200,000 | 204,951 | ||||||||||||
Republic of Indonesia | 4.35 | 1-11-2048 | 205,000 | 231,005 | ||||||||||||
Republic of Italy | 2.88 | 10-17-2029 | 215,000 | 214,595 | ||||||||||||
Republic of Italy | 5.38 | 6-15-2033 | 145,000 | 179,839 | ||||||||||||
Republic of Italy | 6.88 | 9-27-2023 | 100,000 | 116,639 | ||||||||||||
Republic of Korea | 3.88 | 9-11-2023 | 210,000 | 228,355 | ||||||||||||
Republic of Panama | 8.88 | 9-30-2027 | 135,000 | 194,570 | ||||||||||||
Republic of Panama | 9.38 | 4-1-2029 | 360,000 | 554,854 | ||||||||||||
Republic of Peru | 5.63 | 11-18-2050 | 365,000 | 563,925 | ||||||||||||
Republic of Philippines | 5.50 | 3-30-2026 | 705,000 | 841,809 | ||||||||||||
Republic of Philippines | 6.38 | 10-23-2034 | 185,000 | 273,097 | ||||||||||||
Republic of Poland | 3.00 | 3-17-2023 | 215,000 | 223,600 | ||||||||||||
Republic of Poland | 3.25 | 4-6-2026 | 10,000 | 10,809 | ||||||||||||
Republic of Poland | 5.13 | 4-21-2021 | 10,000 | 10,385 | ||||||||||||
State of Israel | 4.00 | 6-30-2022 | 365,000 | 383,184 | ||||||||||||
State of Israel | 5.50 | 12-4-2023 | 240,000 | 279,452 | ||||||||||||
State of Israel | 5.50 | 9-18-2033 | 6,000 | 8,838 | ||||||||||||
United Mexican States | 4.00 | 10-2-2023 | 10,000 | 10,650 | ||||||||||||
United Mexican States | 4.13 | 1-21-2026 | 150,000 | 164,064 | ||||||||||||
United Mexican States | 4.15 | 3-28-2027 | 205,000 | 225,246 | ||||||||||||
United Mexican States | 4.35 | 1-15-2047 | 225,000 | 247,725 | ||||||||||||
United Mexican States | 4.75 | 3-8-2044 | 184,000 | 212,888 | ||||||||||||
United Mexican States | 5.55 | 1-21-2045 | 180,000 | 231,302 | ||||||||||||
United Mexican States | 5.75 | 10-12-2099 | 21,000 | 26,434 | ||||||||||||
United Mexican States | 6.05 | 1-11-2040 | 40,000 | 53,650 | ||||||||||||
United Mexican States | 7.50 | 4-8-2033 | 510,000 | 754,168 | ||||||||||||
United Mexican States | 8.30 | 8-15-2031 | 60,000 | 93,840 | ||||||||||||
Total Yankee Government Bonds (Cost $13,475,965) |
| 14,494,177 | ||||||||||||||
|
| |||||||||||||||
| Yield | Shares | |||||||||||||||
| Short-Term Investments: 1.71% |
| |||||||||||||||
| Investment Companies: 1.71% | ||||||||||||||||
Wells Fargo Government Money Market Fund Select Class (l)(u)## | 1.52 | 11,379,432 | 11,379,432 | |||||||||||||
|
| |||||||||||||||
Total Short-Term Investments (Cost $11,379,432) |
| 11,379,432 | ||||||||||||||
|
| |||||||||||||||
| Total investments in securities (Cost $636,416,814) | 100.75 | % | 670,431,977 | |||||
Other assets and liabilities, net | (0.75 | ) | (4,996,641 | ) | ||||
|
|
|
| |||||
| Total net assets | 100.00 | % | $ | 665,435,336 | ||||
|
|
|
| |||||
The accompanying notes are an integral part of these financial statements.
Wells Fargo Funds | 49
Table of Contents
Portfolio of investments—February 29, 2020
BLOOMBERG BARCLAYS US AGGREGATEEX-CORPORATE PORTFOLIO
| ±± | The coupon of the security is adjusted based on the principal and interest payments received from the underlying pool of mortgages as well as the credit quality and the actual prepayment speed of the underlying mortgages. |
| %% | The security is purchased on a when-issued basis. |
| 144A | The security may be resold in transactions exempt from registration, normally to qualified institutional buyers, pursuant to Rule 144A under the Securities Act of 1933. |
| ¤ | The security is issued in zero coupon form with no periodic interest payments. |
| (l) | The issuer of the security is an affiliated person of the Portfolio as defined in the Investment Company Act of 1940. |
| (u) | The rate represents the7-day annualized yield at period end. |
| ## | All or a portion of this security is segregated for when-issued securities. |
Abbreviations:
| EDA | Economic Development Authority |
| FFCB | Federal Farm Credit Banks |
| FHLB | Federal Home Loan Bank |
| FHLMC | Federal Home Loan Mortgage Corporation |
| FNMA | Federal National Mortgage Association |
| GNMA | Government National Mortgage Association |
| GO | General obligation |
| National | National Public Finance Guarantee Corporation |
| TVA | Tennessee Valley Authority |
Investments in Affiliates
An affiliated investment is an investment in which the Portfolio owns at least 5% of the outstanding voting shares of the issuer or as a result of other relationships, such as the Portfolio and the issuer having the same adviser or investment manager. Transactions with issuers that were either affiliated persons of the Portfolio at the beginning of the period or the end of the period were as follows:
| Shares, beginning of period | Shares purchased | Shares sold | Shares, end of period | Net realized gains (losses) | Net change in unrealized gains (losses) | Income from affiliated securities | Value, end of period | % of net assets | ||||||||||||||||||||||||||||
Short-Term Investments | ||||||||||||||||||||||||||||||||||||
Investment Companies | ||||||||||||||||||||||||||||||||||||
Wells Fargo Government Money Market Fund Select Class | 6,855,231 | 212,862,313 | (208,338,112 | ) | 11,379,432 | $ | 0 | $ | 0 | $ | 185,121 | $ | 11,379,432 | 1.71 | % | |||||||||||||||||||||
The accompanying notes are an integral part of these financial statements.
50 | Wells Fargo Funds
Table of Contents
Portfolio of investments—February 29, 2020
EMERGING MARKETS BOND PORTFOLIO
| Interest rate | Maturity date | Principal | Value | |||||||||||||
| Yankee Corporate Bonds and Notes: 13.93% |
| |||||||||||||||
| Azerbaijan: 0.50% | ||||||||||||||||
State Oil Company of the Azerbaijan Republic (Energy, Oil, Gas & Consumable Fuels) | 4.75 | % | 3-13-2023 | $ | 200,000 | $ | 210,074 | |||||||||
|
| |||||||||||||||
| Bahrain: 1.04% | ||||||||||||||||
CBB International Sukuk Company 6 SPC (Financials, Diversified Financial Services) | 5.25 | 3-20-2025 | 200,000 | 214,134 | ||||||||||||
Oil & Gas Holding Company (Energy, Oil, Gas & Consumable Fuels) | 7.63 | 11-7-2024 | 200,000 | 229,666 | ||||||||||||
| 443,800 | ||||||||||||||||
|
| |||||||||||||||
| Chile: 1.83% | ||||||||||||||||
Codelco Incorporated (Materials, Metals & Mining) | 4.25 | 7-17-2042 | 250,000 | 272,863 | ||||||||||||
Codelco Incorporated (Materials, Metals & Mining) | 4.88 | 11-4-2044 | 250,000 | 298,688 | ||||||||||||
Empresa Nacional del Petroleo (Energy, Oil, Gas & Consumable Fuels) | 3.75 | 8-5-2026 | 200,000 | 207,907 | ||||||||||||
| 779,458 | ||||||||||||||||
|
| |||||||||||||||
| China: 1.48% | ||||||||||||||||
Sinopec Group Overseas Development (2015) Limited (Energy, Oil, Gas & Consumable Fuels) | 3.00 | 4-12-2022 | 200,000 | 205,234 | ||||||||||||
Sinopec Group Overseas Development (2015) Limited (Energy, Oil, Gas & Consumable Fuels) | 3.25 | 4-28-2025 | 200,000 | 213,264 | ||||||||||||
State Grid Overseas Investment (2016) Limited (Utilities, Electric Utilities) | 2.88 | 5-18-2026 | 200,000 | 210,933 | ||||||||||||
| 629,431 | ||||||||||||||||
|
| |||||||||||||||
| Hong Kong: 0.50% | ||||||||||||||||
CNAC Hong Kong Finbridge Company Limited (Materials, Chemicals) | 4.63 | 3-14-2023 | 200,000 | 213,482 | ||||||||||||
|
| |||||||||||||||
| Indonesia: 0.57% | ||||||||||||||||
PT Pertamina Persero Tbk (Energy, Oil, Gas & Consumable Fuels) | 5.63 | 5-20-2043 | 200,000 | 241,294 | ||||||||||||
|
| |||||||||||||||
| Kazakhstan: 1.08% | ||||||||||||||||
KazMunayGas National Company JSC (Energy, Oil, Gas & Consumable Fuels) | 5.75 | 4-19-2047 | 200,000 | 245,000 | ||||||||||||
KaztransGas Company JSC (Energy, Oil, Gas & Consumable Fuels) | 4.38 | 9-26-2027 | 200,000 | 213,323 | ||||||||||||
| 458,323 | ||||||||||||||||
|
| |||||||||||||||
| Malaysia: 0.92% | ||||||||||||||||
Petronas Capital Limited (Energy, Oil, Gas & Consumable Fuels) | 4.50 | 3-18-2045 | 300,000 | 392,891 | ||||||||||||
|
| |||||||||||||||
| Mexico: 2.59% | ||||||||||||||||
Comision Federal de Electricidad (Utilities, Electric Utilities) | 5.75 | 2-14-2042 | 200,000 | 234,502 | ||||||||||||
Petroleos Mexicanos Company (Energy, Oil, Gas & Consumable Fuels) | 5.63 | 1-23-2046 | 250,000 | 219,000 | ||||||||||||
Petroleos Mexicanos Company (Energy, Oil, Gas & Consumable Fuels) 144A | 5.95 | 1-28-2031 | 470,000 | 458,250 | ||||||||||||
Petroleos Mexicanos Company (Energy, Oil, Gas & Consumable Fuels) | 6.75 | 9-21-2047 | 200,000 | 190,856 | ||||||||||||
| 1,102,608 | ||||||||||||||||
|
| |||||||||||||||
| Netherlands: 0.65% | ||||||||||||||||
MDC-GMTN BV (Financials, Diversified Financial Services) | 3.75 | 4-19-2029 | 250,000 | 275,879 | ||||||||||||
|
| |||||||||||||||
| Peru: 0.52% | ||||||||||||||||
Corporacion Financiera de Desarollo SA (Financials, Diversified Financial Services) | 4.75 | 7-15-2025 | 200,000 | 219,502 | ||||||||||||
|
| |||||||||||||||
| Saudi Arabia: 0.96% | ||||||||||||||||
KSA Sukuk Limited (Financials, Diversified Financial Services) | 2.89 | 4-20-2022 | 200,000 | 204,086 | ||||||||||||
KSA Sukuk Limited (Financials, Diversified Financial Services) | 2.97 | 10-29-2029 | 200,000 | 204,538 | ||||||||||||
| 408,624 | ||||||||||||||||
|
| |||||||||||||||
The accompanying notes are an integral part of these financial statements.
Wells Fargo Funds | 51
Table of Contents
Portfolio of investments—February 29, 2020
EMERGING MARKETS BOND PORTFOLIO
| Interest rate | Maturity date | Principal | Value | |||||||||||||
| South Africa: 0.47% |
| |||||||||||||||
Eskom Holdings SOC Limited (Utilities, Electric Utilities) | 6.75 | % | 8-6-2023 | $ | 200,000 | $ | 199,700 | |||||||||
|
| |||||||||||||||
| United Arab Emirates: 0.55% | ||||||||||||||||
Abu Dhabi Crude Oil Pipeline LLC (Energy, Oil, Gas & Consumable Fuels) | 4.60 | 11-2-2047 | 200,000 | 235,020 | ||||||||||||
|
| |||||||||||||||
| Venezuela: 0.27% | ||||||||||||||||
Petroleos de Venezuela SA (Energy, Oil, Gas & Consumable Fuels) † | 5.38 | 4-12-2027 | 200,000 | 20,000 | ||||||||||||
Petroleos de Venezuela SA (Energy, Oil, Gas & Consumable Fuels) † | 5.38 | 4-12-2027 | 350,000 | 35,000 | ||||||||||||
Petroleos de Venezuela SA (Energy, Oil, Gas & Consumable Fuels) † | 5.50 | 4-12-2037 | 200,000 | 20,000 | ||||||||||||
Petroleos de Venezuela SA (Energy, Oil, Gas & Consumable Fuels) † | 9.00 | 11-17-2021 | 400,000 | 40,000 | ||||||||||||
| 115,000 | ||||||||||||||||
|
| |||||||||||||||
Total Yankee Corporate Bonds and Notes (Cost $5,907,958) |
| 5,925,086 | ||||||||||||||
|
| |||||||||||||||
| Yankee Government Bonds: 83.87% | ||||||||||||||||
Abu Dhabi Government | 2.50 | 10-11-2022 | 400,000 | 406,857 | ||||||||||||
Abu Dhabi Government | 3.13 | 10-11-2027 | 200,000 | 214,186 | ||||||||||||
Abu Dhabi Government | 3.13 | 9-30-2049 | 200,000 | 203,200 | ||||||||||||
Arab Republic of Egypt | 5.58 | 2-21-2023 | 200,000 | 206,960 | ||||||||||||
Arab Republic of Egypt | 6.13 | 1-31-2022 | 200,000 | 206,601 | ||||||||||||
Arab Republic of Egypt | 8.50 | 1-31-2047 | 250,000 | 267,530 | ||||||||||||
Arab Republic of Egypt | 8.70 | 3-1-2049 | 200,000 | 215,215 | ||||||||||||
Bolivia Government | 4.88 | 10-29-2022 | 200,000 | 207,002 | ||||||||||||
China Development Bank | 4.00 | 1-24-2037 | 350,000 | 417,467 | ||||||||||||
Dominican Republic | 5.95 | 1-25-2027 | 800,000 | 875,008 | ||||||||||||
Dominican Republic | 6.00 | 7-19-2028 | 200,000 | 221,002 | ||||||||||||
Export Credit Bank of Turkey | 5.00 | 9-23-2021 | 200,000 | 200,757 | ||||||||||||
Export-Import Bank of China | 2.00 | 4-26-2021 | 450,000 | 451,994 | ||||||||||||
Export-Import Bank of India | 3.25 | 1-15-2030 | 200,000 | 202,101 | ||||||||||||
Export-Import Bank of India | 4.00 | 1-14-2023 | 250,000 | 262,806 | ||||||||||||
Federation of Malaysia | 3.18 | 4-27-2026 | 400,000 | 435,804 | ||||||||||||
Federative Republic of Brazil | 4.63 | 1-13-2028 | 600,000 | 662,396 | ||||||||||||
Federative Republic of Brazil | 5.63 | 1-7-2041 | 450,000 | 529,317 | ||||||||||||
Government of Jamaica | 7.88 | 7-28-2045 | 300,000 | 406,503 | ||||||||||||
Islamic Republic of Pakistan | 8.25 | 4-15-2024 | 350,000 | 393,160 | ||||||||||||
Kingdom of Bahrain | 6.75 | 9-20-2029 | 200,000 | 227,294 | ||||||||||||
Kingdom of Bahrain | 7.00 | 10-12-2028 | 400,000 | 462,520 | ||||||||||||
Kingdom of Jordan | 5.75 | 1-31-2027 | 300,000 | 316,563 | ||||||||||||
Kingdom of Morocco | 4.25 | 12-11-2022 | 200,000 | 209,964 | ||||||||||||
Kuwait Government | 3.50 | 3-20-2027 | 200,000 | 218,562 | ||||||||||||
Lebanese Republic | 6.60 | 11-27-2026 | 300,000 | 76,125 | ||||||||||||
Lebanese Republic | 7.05 | 11-2-2035 | 200,000 | 50,000 | ||||||||||||
Lebanese Republic | 8.25 | 4-12-2021 | 350,000 | 95,928 | ||||||||||||
Mongolia Government | 5.63 | 5-1-2023 | 250,000 | 251,067 | ||||||||||||
Oman Government | 3.88 | 3-8-2022 | 300,000 | 301,152 | ||||||||||||
Oman Government | 4.40 | 6-1-2024 | 250,000 | 253,675 | ||||||||||||
Oman Government | 6.50 | 3-8-2047 | 400,000 | 373,808 | ||||||||||||
Oriental Republic of Uruguay | 4.50 | 8-14-2024 | 250,000 | 272,503 | ||||||||||||
Oriental Republic of Uruguay | 5.10 | 6-18-2050 | 450,000 | 565,317 | ||||||||||||
Oriental Republic of Uruguay | 7.88 | 1-15-2033 | 125,000 | 191,720 | ||||||||||||
Perusahaan Penerbit SBSN Indonesia III | 4.55 | 3-29-2026 | 500,000 | 557,580 | ||||||||||||
Qatar Government | 3.25 | 6-2-2026 | 200,000 | 212,500 | ||||||||||||
Qatar Government | 4.00 | 3-14-2029 | 400,000 | 452,149 | ||||||||||||
Qatar Government | 4.63 | 6-2-2046 | 450,000 | 560,374 | ||||||||||||
Republic of Angola | 8.25 | 5-9-2028 | 400,000 | 410,411 | ||||||||||||
The accompanying notes are an integral part of these financial statements.
52 | Wells Fargo Funds
Table of Contents
Portfolio of investments—February 29, 2020
EMERGING MARKETS BOND PORTFOLIO
| Interest rate | Maturity date | Principal | Value | |||||||||||||
| Yankee Government Bonds (continued) | ||||||||||||||||
Republic of Angola | 9.50 | % | 11-12-2025 | $ | 200,000 | $ | 222,786 | |||||||||
Republic of Argentina | 4.63 | 1-11-2023 | 100,000 | 43,001 | ||||||||||||
Republic of Argentina | 5.63 | 1-26-2022 | 350,000 | 162,750 | ||||||||||||
Republic of Argentina | 7.50 | 4-22-2026 | 600,000 | 259,506 | ||||||||||||
Republic of Argentina | 7.63 | 4-22-2046 | 250,000 | 100,378 | ||||||||||||
Republic of Azerbaijan | 3.50 | 9-1-2032 | 200,000 | 199,750 | ||||||||||||
Republic of Belarus | 7.63 | 6-29-2027 | 200,000 | 228,417 | ||||||||||||
Republic of Chile | 3.24 | 2-6-2028 | 200,000 | 215,002 | ||||||||||||
Republic of Chile | 3.86 | 6-21-2047 | 150,000 | 173,423 | ||||||||||||
Republic of Colombia | 3.88 | 4-25-2027 | 543,000 | 584,268 | ||||||||||||
Republic of Colombia | 5.00 | 6-15-2045 | 286,000 | 345,345 | ||||||||||||
Republic of Colombia | 7.38 | 9-18-2037 | 250,000 | 369,375 | ||||||||||||
Republic of Costa Rica | 7.00 | 4-4-2044 | 350,000 | 357,879 | ||||||||||||
Republic of Cote d’Ivoire | 6.13 | 6-15-2033 | 200,000 | 204,388 | ||||||||||||
Republic of Croatia | 6.00 | 1-26-2024 | 200,000 | 228,470 | ||||||||||||
Republic of Ecuador | 7.95 | 6-20-2024 | 350,000 | 259,441 | ||||||||||||
Republic of Ecuador | 7.95 | 6-20-2024 | 200,000 | 148,252 | ||||||||||||
Republic of Ecuador | 9.63 | 6-2-2027 | 300,000 | 222,378 | ||||||||||||
Republic of El Salvador | 7.65 | 6-15-2035 | 347,000 | 386,041 | ||||||||||||
Republic of Gabon | 6.38 | 12-12-2024 | 150,000 | 156,470 | ||||||||||||
Republic of Ghana | 7.63 | 5-16-2029 | 300,000 | 303,000 | ||||||||||||
Republic of Ghana | 8.63 | 6-16-2049 | 200,000 | 198,000 | ||||||||||||
Republic of Guatemala | 4.38 | 6-5-2027 | 200,000 | 209,750 | ||||||||||||
Republic of Honduras | 6.25 | 1-19-2027 | 150,000 | 167,064 | ||||||||||||
Republic of Hungary | 5.38 | 2-21-2023 | 270,000 | 296,054 | ||||||||||||
Republic of Hungary | 5.38 | 3-25-2024 | 200,000 | 226,700 | ||||||||||||
Republic of Indonesia | 4.10 | 4-24-2028 | 300,000 | 328,871 | ||||||||||||
Republic of Indonesia | 4.63 | 4-15-2043 | 200,000 | 233,757 | ||||||||||||
Republic of Indonesia | 4.88 | 5-5-2021 | 200,000 | 206,700 | ||||||||||||
Republic of Indonesia | 5.13 | 1-15-2045 | 200,000 | 248,405 | ||||||||||||
Republic of Indonesia | 7.75 | 1-17-2038 | 25,000 | 38,717 | ||||||||||||
Republic of Iraq | 5.80 | 1-15-2028 | 250,000 | 236,740 | ||||||||||||
Republic of Kazakhstan | 4.88 | 10-14-2044 | 300,000 | 385,099 | ||||||||||||
Republic of Kazakhstan | 5.13 | 7-21-2025 | 200,000 | 229,250 | ||||||||||||
Republic of Kenya | 6.88 | 6-24-2024 | 200,000 | 213,497 | ||||||||||||
Republic of Kenya | 8.25 | 2-28-2048 | 200,000 | 213,630 | ||||||||||||
Republic of Nigeria | 7.63 | 11-21-2025 | 200,000 | 218,733 | ||||||||||||
Republic of Nigeria | 7.63 | 11-28-2047 | 200,000 | 186,224 | ||||||||||||
Republic of Nigeria | 7.88 | 2-16-2032 | 300,000 | 301,423 | ||||||||||||
Republic of Panama | 4.00 | 9-22-2024 | 563,000 | 608,609 | ||||||||||||
Republic of Panama | 4.50 | 5-15-2047 | 350,000 | 436,191 | ||||||||||||
Republic of Paraguay | 5.00 | 4-15-2026 | 250,000 | 280,003 | ||||||||||||
Republic of Peru | 4.13 | 8-25-2027 | 100,000 | 114,251 | ||||||||||||
Republic of Peru | 6.55 | 3-14-2037 | 365,000 | 554,800 | ||||||||||||
Republic of Peru | 7.35 | 7-21-2025 | 100,000 | 127,500 | ||||||||||||
Republic of Peru | 8.75 | 11-21-2033 | 25,000 | 42,344 | ||||||||||||
Republic of Philippines | 3.70 | 2-2-2042 | 200,000 | 237,790 | ||||||||||||
Republic of Philippines | 4.20 | 1-21-2024 | 200,000 | 216,586 | ||||||||||||
Republic of Philippines | 5.50 | 3-30-2026 | 379,000 | 452,547 | ||||||||||||
Republic of Philippines | 6.38 | 1-15-2032 | 300,000 | 420,595 | ||||||||||||
Republic of Poland | 3.25 | 4-6-2026 | 400,000 | 432,348 | ||||||||||||
Republic of Poland | 5.13 | 4-21-2021 | 225,000 | 233,667 | ||||||||||||
Republic of Senegal | 6.25 | 5-23-2033 | 250,000 | 262,100 | ||||||||||||
Republic of Serbia | 7.25 | 9-28-2021 | 200,000 | 216,240 | ||||||||||||
Republic of Slovak | 4.38 | 5-21-2022 | 200,000 | 211,132 | ||||||||||||
The accompanying notes are an integral part of these financial statements.
Wells Fargo Funds | 53
Table of Contents
Portfolio of investments—February 29, 2020
EMERGING MARKETS BOND PORTFOLIO
| Interest rate | Maturity date | Principal | Value | |||||||||||||
| Yankee Government Bonds (continued) | ||||||||||||||||
Republic of South Africa | 4.85 | % | 9-30-2029 | $ | 600,000 | $ | 602,026 | |||||||||
Republic of South Africa | 6.25 | 3-8-2041 | 200,000 | 214,000 | ||||||||||||
Republic of Sri Lanka | 5.75 | 1-18-2022 | 250,000 | 251,266 | ||||||||||||
Republic of Sri Lanka | 6.35 | 6-28-2024 | 400,000 | 396,030 | ||||||||||||
Republic of Sri Lanka | 6.75 | 4-18-2028 | 300,000 | 273,825 | ||||||||||||
Republic of Turkey | 5.60 | 11-14-2024 | 200,000 | 199,250 | ||||||||||||
Republic of Turkey | 6.63 | 2-17-2045 | 600,000 | 563,538 | ||||||||||||
Republic of Turkey | 7.63 | 4-26-2029 | 200,000 | 213,728 | ||||||||||||
Republic of Turkey | 8.00 | 2-14-2034 | 200,000 | 220,440 | ||||||||||||
Republic of Uzbekistan | 4.75 | 2-20-2024 | 200,000 | 210,491 | ||||||||||||
Republic of Venezuela † | 6.00 | 12-9-2020 | 225,000 | 33,750 | ||||||||||||
Republic of Venezuela † | 7.00 | 3-31-2038 | 200,000 | 30,000 | ||||||||||||
Republic of Venezuela † | 9.00 | 5-7-2023 | 1,010,000 | 151,500 | ||||||||||||
Republic of Zambia | 8.50 | 4-14-2024 | 200,000 | 131,035 | ||||||||||||
Romania Government | 4.38 | 8-22-2023 | 200,000 | 214,000 | ||||||||||||
Romania Government | 4.88 | 1-22-2024 | 250,000 | 274,438 | ||||||||||||
Russian Federation | 4.50 | 4-4-2022 | 200,000 | 210,000 | ||||||||||||
Russian Federation | 4.88 | 9-16-2023 | 200,000 | 218,682 | ||||||||||||
Russian Federation | 5.10 | 3-28-2035 | 200,000 | 240,498 | ||||||||||||
Russian Federation | 5.25 | 6-23-2047 | 200,000 | 258,550 | ||||||||||||
Russian Federation | 12.75 | 6-24-2028 | 250,000 | 430,000 | ||||||||||||
Saudi Government | 2.88 | 3-4-2023 | 200,000 | 205,000 | ||||||||||||
Saudi Government | 3.63 | 3-4-2028 | 200,000 | 214,302 | ||||||||||||
Saudi Government | 4.50 | 4-17-2030 | 200,000 | 231,803 | ||||||||||||
Saudi Government | 4.50 | 10-26-2046 | 200,000 | 229,212 | ||||||||||||
Saudi Government | 4.63 | 10-4-2047 | 200,000 | 233,440 | ||||||||||||
Trinidad & Tobago Government | 4.50 | 8-4-2026 | 200,000 | 209,002 | ||||||||||||
Ukraine Government | 7.38 | 9-25-2032 | 200,000 | 214,130 | ||||||||||||
Ukraine Government | 7.75 | 9-1-2023 | 200,000 | 216,500 | ||||||||||||
Ukraine Government | 7.75 | 9-1-2025 | 400,000 | 435,408 | ||||||||||||
Ukraine Government | 7.75 | 9-1-2027 | 100,000 | 109,226 | ||||||||||||
United Mexican States | 4.00 | 10-2-2023 | 200,000 | 213,002 | ||||||||||||
United Mexican States | 4.60 | 2-10-2048 | 200,000 | 228,252 | ||||||||||||
United Mexican States | 5.55 | 1-21-2045 | 150,000 | 192,752 | ||||||||||||
United Mexican States | 6.75 | 9-27-2034 | 150,000 | 217,127 | ||||||||||||
Total Yankee Government Bonds (Cost $35,937,967) |
| 35,686,918 | ||||||||||||||
|
| |||||||||||||||
| Yield | Shares | |||||||||||||||
| Short-Term Investments: 2.17% |
| |||||||||||||||
| Investment Companies: 2.17% | ||||||||||||||||
Wells Fargo Government Money Market Fund Select Class (l)(u) | 1.52 | 922,295 | 922,295 | |||||||||||||
|
| |||||||||||||||
Total Short-Term Investments (Cost $922,295) |
| 922,295 | ||||||||||||||
|
| |||||||||||||||
| Total investments in securities (Cost $42,768,220) | 99.97 | % | 42,534,299 | |||||
Other assets and liabilities, net | 0.03 | 13,389 | ||||||
|
|
|
| |||||
| Total net assets | 100.00 | % | $ | 42,547,688 | ||||
|
|
|
| |||||
| 144A | The security may be resold in transactions exempt from registration, normally to qualified institutional buyers, pursuant to Rule 144A under the Securities Act of 1933. |
| † | Non-income-earning security |
| (l) | The issuer of the security is an affiliated person of the Portfolio as defined in the Investment Company Act of 1940. |
| (u) | The rate represents the7-day annualized yield at period end. |
The accompanying notes are an integral part of these financial statements.
54 | Wells Fargo Funds
Table of Contents
Portfolio of investments—February 29, 2020
EMERGING MARKETS BOND PORTFOLIO
Investments in Affiliates
An affiliated investment is an investment in which the Portfolio owns at least 5% of the outstanding voting shares of the issuer or as a result of other relationships, such as the Portfolio and the issuer having the same adviser or investment manager. Transactions with issuers that were either affiliated persons of the Portfolio at the beginning of the period or the end of the period were as follows:
| Shares, beginning of period | Shares purchased | Shares sold | Shares, end of period | Net realized gains (losses) | Net change in unrealized gains (losses) | Income from affiliated securities | Value, end of period | % of net assets | ||||||||||||||||||||||||||||
| Short-Term Investments | ||||||||||||||||||||||||||||||||||||
Investment Companies | ||||||||||||||||||||||||||||||||||||
Wells Fargo Government Money Market Fund Select Class | 2,749,145 | 8,756,029 | (10,582,879 | ) | 922,295 | $ | 0 | $ | 0 | $ | 7,448 | $ | 922,295 | 2.17 | % | |||||||||||||||||||||
The accompanying notes are an integral part of these financial statements.
Wells Fargo Funds | 55
Table of Contents
Portfolio of investments—February 29, 2020
FACTOR ENHANCED EMERGING MARKETS PORTFOLIO
| Shares | Value | |||||||||||||||
| Common Stocks: 92.40% |
| |||||||||||||||
| Belgium: 0.01% | ||||||||||||||||
Titan Cement International SA (Materials, Construction Materials) † | 1,923 | $ | 27,131 | |||||||||||||
|
| |||||||||||||||
| Brazil: 5.47% | ||||||||||||||||
Aliansce Sonae Shopping Centers SA (Real Estate, Real Estate Management & Development) | 7,000 | 71,489 | ||||||||||||||
Ambev SA (Consumer Staples, Beverages) | 230,400 | 749,126 | ||||||||||||||
Arezzo Industria e Comercio SA (Consumer Discretionary, Textiles, Apparel & Luxury Goods) | 2,800 | 37,631 | ||||||||||||||
Atacadao Distribuicao Comercio e Industria Limitada (Consumer Staples, Food & Staples Retailing) | 20,300 | 93,921 | ||||||||||||||
B2W Companhia Digital (Consumer Discretionary, Internet & Direct Marketing Retail) † | 10,535 | 146,414 | ||||||||||||||
B3 Brasil Bolsa Balcao SA (Financials, Capital Markets) | 103,700 | 1,113,084 | ||||||||||||||
Banco BTG Pactual SA (Financials, Capital Markets) | 1,600 | 11,982 | ||||||||||||||
Banco de Brasil SA (Financials, Banks) | 76,200 | 798,482 | ||||||||||||||
BB Seguridade Participacoes SA (Financials, Insurance) | 33,800 | 240,732 | ||||||||||||||
BK Brasil Operacao e Assessoria a Restaurantes SA (Consumer Discretionary, Hotels, Restaurants & Leisure) | 8,900 | 29,157 | ||||||||||||||
BR Malls Participacoes SA (Real Estate, Real Estate Management & Development) | 47,200 | 172,465 | ||||||||||||||
BRF SA (Consumer Staples, Food Products) † | 32,300 | 195,307 | ||||||||||||||
CCR SA (Industrials, Transportation Infrastructure) | 69,182 | 252,631 | ||||||||||||||
Centrais Electricas Brasileiras SA (Utilities, Electric Utilities) | 18,900 | 145,937 | ||||||||||||||
Cia de Locacao das Americas (Industrials, Road & Rail) | 14,300 | 67,664 | ||||||||||||||
Cia Siderurgica Nacional SA (Materials, Metals & Mining) | 38,200 | 95,502 | ||||||||||||||
Cielo SA (Information Technology, IT Services) | 70,500 | 107,991 | ||||||||||||||
Cogna Educacao (Consumer Discretionary, Diversified Consumer Services) | 80,569 | 181,789 | ||||||||||||||
Companhia de Saneamento Basico do Estado de Sao Paulo SA (Utilities, Water Utilities) | 19,041 | 250,153 | ||||||||||||||
Companhia de Saneamento de Minas Gerais SA (Utilities, Water Utilities) | 3,059 | 41,255 | ||||||||||||||
Companhia Hering SA (Consumer Discretionary, Textiles, Apparel & Luxury Goods) | 8,410 | 42,389 | ||||||||||||||
Cosan SA Industria e Comercio (Energy, Oil, Gas & Consumable Fuels) | 8,400 | 137,442 | ||||||||||||||
CPFL Energia SA (Utilities, Electric Utilities) | 8,600 | 68,328 | ||||||||||||||
CPFL Energias Renovaveis SA (Utilities, Independent Power & Renewable Electricity Producers) † | 3,347 | 12,806 | ||||||||||||||
CVC Brasil Operadora e Agencia de Viagens SA (Consumer Discretionary, Hotels, Restaurants & Leisure) | 7,164 | 41,220 | ||||||||||||||
Cyrela Brazil Realty SA Empreendimentos e Participacoes (Consumer Discretionary, Household Durables) | 15,600 | 104,060 | ||||||||||||||
Duratex SA (Materials, Paper & Forest Products) | 17,000 | 66,108 | ||||||||||||||
Ecorodovias Infraestrutura Logistica SA (Industrials, Transportation Infrastructure) † | 9,600 | 33,876 | ||||||||||||||
EDP Energias do Brasil SA (Utilities, Electric Utilities) | 13,747 | 62,804 | ||||||||||||||
Embraer SA (Industrials, Aerospace & Defense) † | 36,530 | 138,543 | ||||||||||||||
Eneva SA (Utilities, Independent Power & Renewable Electricity Producers) † | 8,100 | 77,434 | ||||||||||||||
Engie Brasil Energia SA (Utilities, Independent Power & Renewable Electricity Producers) | 8,500 | 90,343 | ||||||||||||||
Equatorial Energia SA (Utilities, Electric Utilities) | 49,870 | 275,005 | ||||||||||||||
EZTEC Empreendimentos e Participacoes SA (Consumer Discretionary, Household Durables) | 1 | 10 | ||||||||||||||
Fleury SA (Health Care, Health Care Providers & Services) | 13,205 | 87,878 | ||||||||||||||
Grendene SA (Consumer Discretionary, Textiles, Apparel & Luxury Goods) | 16,620 | 36,050 | ||||||||||||||
Guararapes Confeccoes SA (Consumer Discretionary, Textiles, Apparel & Luxury Goods) | 4,700 | 28,903 | ||||||||||||||
Hapvida Participacoes e Investimentos SA (Health Care, Health Care Providers & Services) 144A | 12,000 | 148,125 | ||||||||||||||
Hypermarcas SA (Health Care, Pharmaceuticals) | 21,036 | 161,349 | ||||||||||||||
Iguatemi Empresa de Shopping Centers SA (Real Estate, Real Estate Management & Development) | 5,280 | 58,835 | ||||||||||||||
Iochpe Maxion SA (Industrials, Machinery) | 6,800 | 29,561 | ||||||||||||||
IRB-Brasil Resseguros SA (Financials, Insurance) | 42,800 | 318,232 | ||||||||||||||
JBS SA (Consumer Staples, Food Products) | 57,829 | 293,548 | ||||||||||||||
Light SA (Utilities, Electric Utilities) | 10,200 | 49,473 | ||||||||||||||
Linx SA (Information Technology, Software) | 8,900 | 62,453 | ||||||||||||||
Localiza Rent A Car SA (Industrials, Road & Rail) | 30,977 | 343,165 | ||||||||||||||
Lojas Renner SA (Consumer Discretionary, Multiline Retail) | 42,256 | 503,644 | ||||||||||||||
M. Dias Branco SA (Consumer Staples, Food Products) | 6,955 | 63,766 | ||||||||||||||
The accompanying notes are an integral part of these financial statements.
56 | Wells Fargo Funds
Table of Contents
Portfolio of investments—February 29, 2020
FACTOR ENHANCED EMERGING MARKETS PORTFOLIO
| Shares | Value | |||||||||||||||
| Brazil (continued) | ||||||||||||||||
Magazine Luiza SA (Consumer Discretionary, Multiline Retail) | 35,400 | $ | 399,921 | |||||||||||||
Marfrig Global Foods SA (Consumer Staples, Food Products) † | 9,600 | 25,911 | ||||||||||||||
MRV Engenharia e Participacoes SA (Consumer Discretionary, Household Durables) | 16,800 | 73,220 | ||||||||||||||
Multiplan Empreendimentos Imobiliarios SA (Real Estate, Real Estate Management & Development) | 17,700 | 120,800 | ||||||||||||||
Natura & Company Holding SA (Consumer Staples, Personal Products) | 17,952 | 182,695 | ||||||||||||||
Notre Dame Intermedica Participacoes SA (Health Care, Health Care Providers & Services) | 21,300 | 301,169 | ||||||||||||||
Odontoprev SA (Health Care, Health Care Providers & Services) | 13,562 | 50,009 | ||||||||||||||
Oi SA ADR (Communication Services, Diversified Telecommunication Services) † | 280,500 | 62,725 | ||||||||||||||
Petrobras Distribuidora SA (Consumer Discretionary, Specialty Retail) | 42,200 | 246,298 | ||||||||||||||
Porto Seguro SA (Financials, Insurance) | 4,868 | 66,381 | ||||||||||||||
Qualicorp SA (Health Care, Health Care Providers & Services) | 11,301 | 86,554 | ||||||||||||||
Raia Drogasil SA (Consumer Staples, Food & Staples Retailing) | 11,033 | 295,815 | ||||||||||||||
Rumo SA (Industrials, Road & Rail) † | 61,100 | 288,565 | ||||||||||||||
Sao Martinho SA (Consumer Staples, Food Products) | 8,911 | 52,786 | ||||||||||||||
Smiles Fidelidade SA (Communication Services, Media) | 3,200 | 23,457 | ||||||||||||||
Suzano Papel e Celulose SA (Materials, Paper & Forest Products) | 28,756 | 245,255 | ||||||||||||||
Tim Participacoes SA (Communication Services, Wireless Telecommunication Services) | 42,200 | 152,214 | ||||||||||||||
Totvs SA (Information Technology, Software) | 8,300 | 131,797 | ||||||||||||||
Ultrapar Participacoes SA (Energy, Oil, Gas & Consumable Fuels) | 44,396 | 189,422 | ||||||||||||||
Via Varejo SA (Consumer Discretionary, Specialty Retail) † | 47,600 | 146,997 | ||||||||||||||
WEG SA (Industrials, Electrical Equipment) | 42,033 | 405,582 | ||||||||||||||
YDUQS Part (Consumer Discretionary, Diversified Consumer Services) | 16,533 | 191,842 | ||||||||||||||
| 11,877,477 | ||||||||||||||||
|
| |||||||||||||||
| Chile: 1.07% | ||||||||||||||||
Aguas Andinas SA Class A (Utilities, Water Utilities) | 117,904 | 40,365 | ||||||||||||||
Antarchile SA (Industrials, Industrial Conglomerates) | 6,822 | 55,813 | ||||||||||||||
Banco de Chile (Financials, Banks) | 1,707,043 | 150,376 | ||||||||||||||
Banco de Credito e Inversiones (Financials, Banks) | 3,083 | 114,967 | ||||||||||||||
Banco Santander Chile SA (Financials, Banks) | 1,839,876 | 82,085 | ||||||||||||||
CAP SA (Materials, Metals & Mining) | 4,141 | 23,631 | ||||||||||||||
Cencosud SA (Consumer Staples, Food & Staples Retailing) | 71,798 | 84,863 | ||||||||||||||
Cencosud Shopping SA (Real Estate, Real Estate Management & Development) † | 74,801 | 141,728 | ||||||||||||||
Colbun SA (Utilities, Independent Power & Renewable Electricity Producers) | 308,126 | 38,690 | ||||||||||||||
Compania Cervecerias Unidas SA (Consumer Staples, Beverages) | 8,014 | 60,201 | ||||||||||||||
Empresa Nacional de Telecomunicaciones SA (Communication Services, Wireless Telecommunication Services) † | 6,409 | 34,158 | ||||||||||||||
Empresas CMPC SA (Materials, Paper & Forest Products) | 65,164 | 132,948 | ||||||||||||||
Empresas Copec SA (Energy, Oil, Gas & Consumable Fuels) | 25,942 | 202,742 | ||||||||||||||
Enel Americas SA (Utilities, Electric Utilities) | 1,058,686 | 178,894 | ||||||||||||||
Enel Chile SA (Utilities, Electric Utilities) | 1,165,717 | 104,701 | ||||||||||||||
Engie Energia Chile SA (Utilities, Electric Utilities) | 17,318 | 22,559 | ||||||||||||||
Gener SA (Utilities, Independent Power & Renewable Electricity Producers) | 97,049 | 14,291 | ||||||||||||||
Grupo Security SA (Financials, Banks) | 157,467 | 31,376 | ||||||||||||||
Hortifrut SA (Consumer Staples, Food Products) | 17,052 | 22,931 | ||||||||||||||
Inversiones Aguas Metropolitanas SA (Utilities, Water Utilities) | 10,015 | 8,752 | ||||||||||||||
Inversiones La Construccion SA (Financials, Diversified Financial Services) | 2,201 | 16,550 | ||||||||||||||
Itau CorpBanca SA (Financials, Banks) | 9,840,605 | 36,107 | ||||||||||||||
LATAM Airlines Group SA (Industrials, Airlines) | 25,300 | 169,857 | ||||||||||||||
Parque Arauco SA (Real Estate, Real Estate Management & Development) | 37,061 | 76,125 | ||||||||||||||
Plaza SA (Real Estate, Real Estate Management & Development) | 20,268 | 33,949 | ||||||||||||||
Quinenco SA (Industrials, Industrial Conglomerates) | 22,566 | 39,368 | ||||||||||||||
Ripley Corporation SA (Consumer Discretionary, Multiline Retail) | 61,988 | 24,485 | ||||||||||||||
SACI Falabella (Consumer Discretionary, Multiline Retail) | 65,173 | 218,203 | ||||||||||||||
Sigdo Koppers SA (Industrials, Industrial Conglomerates) | 25,842 | 27,804 | ||||||||||||||
The accompanying notes are an integral part of these financial statements.
Wells Fargo Funds | 57
Table of Contents
Portfolio of investments—February 29, 2020
FACTOR ENHANCED EMERGING MARKETS PORTFOLIO
| Shares | Value | |||||||||||||||
| Chile (continued) | ||||||||||||||||
SMU SA (Consumer Staples, Food & Staples Retailing) | 182,790 | $ | 27,712 | |||||||||||||
Sociedad Matriz SAAM SA (Industrials, Transportation Infrastructure) | 241,915 | 16,563 | ||||||||||||||
Sonda SA (Information Technology, IT Services) | 33,009 | 23,868 | ||||||||||||||
Vina Concha y Toro SA (Consumer Staples, Beverages) | 36,794 | 61,208 | ||||||||||||||
| 2,317,870 | ||||||||||||||||
|
| |||||||||||||||
| China: 17.30% | ||||||||||||||||
3SBio Incorporated (Health Care, Biotechnology) 144A† | 63,500 | 67,487 | ||||||||||||||
58.com Incorporated ADR (Communication Services, Interactive Media & Services) † | 6,063 | 334,496 | ||||||||||||||
A Living Services Company Limited H Shares (Industrials, Commercial Services & Supplies) 144A | 15,750 | 72,286 | ||||||||||||||
Agile Property Holdings Limited (Real Estate, Real Estate Management & Development) | 74,000 | 105,802 | ||||||||||||||
Agricultural Bank of China Limited H Shares (Financials, Banks) | 1,511,000 | 613,144 | ||||||||||||||
Air China Limited H Shares (Industrials, Airlines) | 110,000 | 90,882 | ||||||||||||||
Aluminum Corporation of China Limited H Shares (Materials, Metals & Mining) † | 200,000 | 54,223 | ||||||||||||||
Anhui Conch Cement Company Limited H Shares (Materials, Construction Materials) | 57,000 | 426,884 | ||||||||||||||
Anhui Gujing Distillery Company Class B (Consumer Staples, Beverages) | 4,900 | 45,617 | ||||||||||||||
ANTA Sports Products Limited (Consumer Discretionary, Textiles, Apparel & Luxury Goods) | 49,000 | 399,873 | ||||||||||||||
BAIC Motor Corporation Limited H Shares (Consumer Discretionary, Automobiles) 144A | 81,500 | 40,542 | ||||||||||||||
Baidu Incorporated ADR (Communication Services, Interactive Media & Services) † | 12,650 | 1,517,747 | ||||||||||||||
Bank of China Limited H Shares (Financials, Banks) | 4,017,000 | 1,605,353 | ||||||||||||||
Bank of Communications Limited H Shares (Financials, Banks) | 390,000 | 253,770 | ||||||||||||||
Baozun Incorporated ADR (Consumer Discretionary, Internet & Direct Marketing Retail) † | 2,989 | 94,811 | ||||||||||||||
BBMG Corporation H Shares (Materials, Construction Materials) | 111,000 | 31,766 | ||||||||||||||
Beijing Capital International Airport Company Limited H Shares (Industrials, Transportation Infrastructure) | 98,000 | 77,168 | ||||||||||||||
Beijing Enterprises Water Group Limited (Utilities, Water Utilities) | 280,000 | 131,874 | ||||||||||||||
Bosideng International Holdings Limited (Consumer Discretionary, Textiles, Apparel & Luxury Goods) | 160,000 | 47,223 | ||||||||||||||
BYD Company Limited H Shares (Consumer Discretionary, Automobiles) | 34,500 | 214,786 | ||||||||||||||
CGN Power Company Limited H Shares (Utilities, Independent Power & Renewable Electricity Producers) 144A | 426,000 | 104,781 | ||||||||||||||
China Aoyuan Group Limited (Real Estate, Real Estate Management & Development) | 65,000 | 96,027 | ||||||||||||||
China Cinda Asset Management Company Limited H Shares (Financials, Capital Markets) | 416,000 | 88,215 | ||||||||||||||
China CITIC Bank H Shares (Financials, Banks) | 498,351 | 261,094 | ||||||||||||||
China Coal Energy Company Limited H Shares (Energy, Oil, Gas & Consumable Fuels) | 160,000 | 52,123 | ||||||||||||||
China Communications Construction Company Limited H Shares (Industrials, Construction & Engineering) | 230,000 | 173,688 | ||||||||||||||
China Communications Services Corporation Limited H Shares (Industrials, Construction & Engineering) | 120,000 | 94,288 | ||||||||||||||
China Conch Venture Holdings Limited (Industrials, Machinery) | 80,500 | 393,836 | ||||||||||||||
China Eastern Airlines Company H Shares (Industrials, Airlines) † | 102,000 | 44,946 | ||||||||||||||
China Energy Engineering Corporation Limited H Shares (Industrials, Construction & Engineering) | 348,000 | 38,840 | ||||||||||||||
China Everbright Bank Company Limited H Shares (Financials, Banks) | 178,000 | 71,921 | ||||||||||||||
China Galaxy Securities Company Limited H Shares (Financials, Capital Markets) | 180,500 | 102,134 | ||||||||||||||
China Huarong Asset Management Company Limited H Shares (Financials, Capital Markets) 144A | 465,000 | 64,230 | ||||||||||||||
China Life Insurance Company H Shares (Financials, Insurance) | 369,000 | 891,655 | ||||||||||||||
China Longyuan Power Group Corporation H Shares (Utilities, Independent Power & Renewable Electricity Producers) | 150,000 | 78,817 | ||||||||||||||
China Medical System Holding Limited (Health Care, Pharmaceuticals) | 74,000 | 93,574 | ||||||||||||||
China Mengniu Dairy Company Limited (Consumer Staples, Food Products) | 137,000 | 500,692 | ||||||||||||||
China Merchants Bank Company Limited H Shares (Financials, Banks) | 193,500 | 930,909 | ||||||||||||||
China Merchants Securities H Shares (Financials, Capital Markets) | 22,800 | 27,875 | ||||||||||||||
China Minsheng Banking Corporation Limited H Shares (Financials, Banks) | 355,200 | 243,082 | ||||||||||||||
China Molybdenum Company Limited H Shares (Materials, Metals & Mining) | 153,000 | 58,469 | ||||||||||||||
China National Building Material Company Limited H Shares (Materials, Construction Materials) | 178,000 | 211,558 | ||||||||||||||
China Oilfield Services Limited H Shares (Energy, Energy Equipment & Services) | 76,000 | 99,329 | ||||||||||||||
The accompanying notes are an integral part of these financial statements.
58 | Wells Fargo Funds
Table of Contents
Portfolio of investments—February 29, 2020
FACTOR ENHANCED EMERGING MARKETS PORTFOLIO
| Shares | Value | |||||||||||||||
| China (continued) | ||||||||||||||||
China Overseas Property Holding Limited (Real Estate, Real Estate Management & Development) | 65,000 | $ | 53,512 | |||||||||||||
China Pacific Insurance H Shares (Financials, Insurance) | 123,000 | 412,621 | ||||||||||||||
China Petroleum & Chemical Corporation H Shares (Energy, Oil, Gas & Consumable Fuels) | 1,240,000 | 641,770 | ||||||||||||||
China Railway Construction Corporation Limited H Shares (Industrials, Construction & Engineering) | 89,500 | 103,546 | ||||||||||||||
China Railway Group Limited H Shares (Industrials, Construction & Engineering) | 198,000 | 113,747 | ||||||||||||||
China Railway Signal & Communication Corporation Limited H Shares (Information Technology, Electronic Equipment, Instruments & Components) 144A | 77,000 | 40,187 | ||||||||||||||
China Reinsurance Group Corporation H Shares (Financials, Insurance) | 316,000 | 43,429 | ||||||||||||||
China Resources Cement Holdings Limited (Materials, Construction Materials) | 106,000 | 136,192 | ||||||||||||||
China Resources Gas Group Limited (Utilities, Gas Utilities) | 40,000 | 201,598 | ||||||||||||||
China Resources Phoenix Healthcare Holdings Company Limited (Health Care, Health Care Providers & Services) | 45,500 | 23,850 | ||||||||||||||
China Shenhua Energy Company Limited H Shares (Energy, Oil, Gas & Consumable Fuels) | 180,500 | 317,371 | ||||||||||||||
China Southern Airlines Company H Shares (Industrials, Airlines) | 94,000 | 50,590 | ||||||||||||||
China State Construction International Holdings (Industrials, Construction & Engineering) | 78,000 | 64,127 | ||||||||||||||
China Telecom Corporation Limited H Shares (Communication Services, Diversified Telecommunication Services) | 694,000 | 262,337 | ||||||||||||||
China Tower Corporation Limited H Shares (Communication Services, Diversified Telecommunication Services) 144A | 2,264,000 | 559,166 | ||||||||||||||
China Vanke Company Limited H Shares (Real Estate, Real Estate Management & Development) | 71,000 | 278,043 | ||||||||||||||
Chongqing Rural Commercial Bank H Shares (Financials, Banks) | 151,000 | 68,996 | ||||||||||||||
CIFI Holdings Group Company Limited (Real Estate, Real Estate Management & Development) | 190,000 | 149,380 | ||||||||||||||
Cimc Enric Holdings Limited (Industrials, Machinery) | 38,000 | 20,081 | ||||||||||||||
CITIC Securities Company Limited H Shares (Financials, Capital Markets) | 110,500 | 243,060 | ||||||||||||||
Cofco Meat Holdings Limited (Consumer Staples, Food Products) † | 83,000 | 21,059 | ||||||||||||||
COSCO Shipping Development Company Limited H Shares (Industrials, Marine) | 182,000 | 22,893 | ||||||||||||||
COSCO Shipping Holdings Company Limited H Shares (Industrials, Marine) † | 123,000 | 41,667 | ||||||||||||||
COSCO Shipping Ports Limited (Industrials, Transportation Infrastructure) | 92,000 | 61,817 | ||||||||||||||
Country Garden Holdings Company Limited (Real Estate, Real Estate Management & Development) | 368,000 | 499,949 | ||||||||||||||
CRRC Corporation Limited H Shares (Industrials, Machinery) | 224,000 | 145,885 | ||||||||||||||
CSC Financial Company Limited H Shares (Financials, Capital Markets) | 45,000 | 40,771 | ||||||||||||||
Dali Foods Group Company Limited (Consumer Staples, Food Products) 144A | 117,000 | 77,799 | ||||||||||||||
Datang International Power Generation Company Limited H Shares (Utilities, Independent Power & Renewable Electricity Producers) | 74,000 | 11,730 | ||||||||||||||
Dongfeng Motor Group Company Limited H Shares (Consumer Discretionary, Automobiles) | 136,000 | 109,145 | ||||||||||||||
ENN Energy Holdings Limited (Utilities, Gas Utilities) | 37,500 | 423,015 | ||||||||||||||
Fuyao Glass Industry Group Company Limited H Shares (Consumer Discretionary, Auto Components) | 25,200 | 73,032 | ||||||||||||||
GF Securities Company Limited H Shares (Financials, Capital Markets) | 65,600 | 79,989 | ||||||||||||||
Great Wall Motor Company Limited H Shares (Consumer Discretionary, Automobiles) | 161,500 | 119,484 | ||||||||||||||
Greentown Service Group Company Limited (Industrials, Commercial Services & Supplies) | 56,000 | 71,084 | ||||||||||||||
Guangzhou Automobile Group Company Limited H Shares (Consumer Discretionary, Automobiles) | 140,400 | 159,303 | ||||||||||||||
Guangzhou R&F Properties Company Limited H Shares (Real Estate, Real Estate Management & Development) | 50,400 | 79,464 | ||||||||||||||
Guotai Junan Securities Company Limited H Shares (Financials, Capital Markets) | 39,200 | 66,684 | ||||||||||||||
Haidilao International Holding Limited (Consumer Discretionary, Hotels, Restaurants & Leisure) 144A | 37,455 | 155,740 | ||||||||||||||
Haitian International Holdings Limited (Industrials, Machinery) | 32,000 | 63,797 | ||||||||||||||
Haitong Securities Company Limited H Shares (Financials, Capital Markets) | 140,800 | 155,219 | ||||||||||||||
Hengan International Group Company Limited (Consumer Staples, Personal Products) | 32,000 | 241,203 | ||||||||||||||
Huaneng Power International Incorporated H Shares (Utilities, Independent Power & Renewable Electricity Producers) | 192,000 | 78,170 | ||||||||||||||
Huatai Securities Company Limited H Shares (Financials, Capital Markets) 144A | 81,200 | 143,612 | ||||||||||||||
Huaxin Cement Company Limited Class B (Materials, Construction Materials) | 17,600 | 30,397 | ||||||||||||||
Industrial & Commercial Bank of China Limited H Shares (Financials, Banks) | 3,663,000 | 2,523,438 | ||||||||||||||
Inner Mongolia Yitai Coal Company Limited Class B (Energy, Oil, Gas & Consumable Fuels) | 72,900 | 50,167 | ||||||||||||||
JD.com Incorporated ADR (Consumer Discretionary, Internet & Direct Marketing Retail) † | 53,877 | 2,074,803 | ||||||||||||||
Jiangsu Express Company Limited H Shares (Industrials, Transportation Infrastructure) | 66,000 | 76,872 | ||||||||||||||
The accompanying notes are an integral part of these financial statements.
Wells Fargo Funds | 59
Table of Contents
Portfolio of investments—February 29, 2020
FACTOR ENHANCED EMERGING MARKETS PORTFOLIO
| Shares | Value | |||||||||||||||
| China (continued) | ||||||||||||||||
Jiangxi Copper Company Limited H Shares (Materials, Metals & Mining) | 60,000 | $ | 71,561 | |||||||||||||
Joy City Property Limited (Real Estate, Real Estate Management & Development) | 240,000 | 23,172 | ||||||||||||||
JOYY Incorporated ADR (Communication Services, Interactive Media & Services) † | 2,305 | 124,401 | ||||||||||||||
Kingboard Chemicals Holdings Limited (Information Technology, Electronic Equipment, Instruments & Components) | 35,500 | 95,140 | ||||||||||||||
Kunlun Energy Company Limited (Utilities, Gas Utilities) | 194,000 | 137,242 | ||||||||||||||
KWG Property Holding Limited (Real Estate, Real Estate Management & Development) | 68,500 | 102,855 | ||||||||||||||
Lao Feng Xiang Company Limited Class B (Consumer Discretionary, Textiles, Apparel & Luxury Goods) | 15,512 | 48,459 | ||||||||||||||
Legend Holdings Corporation H Shares (Information Technology, Technology Hardware, Storage & Peripherals) 144A | 31,400 | 54,382 | ||||||||||||||
Lenovo Group Limited (Information Technology, Technology Hardware, Storage & Peripherals) | 342,000 | 215,231 | ||||||||||||||
Li Ning Company Limited (Consumer Discretionary, Textiles, Apparel & Luxury Goods) | 98,000 | 263,995 | ||||||||||||||
Logan Property Holdings Company Limited (Real Estate, Real Estate Management & Development) | 66,000 | 115,285 | ||||||||||||||
Longfor Properties Company Limited (Real Estate, Real Estate Management & Development) | 78,000 | 368,917 | ||||||||||||||
Luye Pharma Group Limited (Health Care, Pharmaceuticals) 144A | 94,500 | 58,721 | ||||||||||||||
Metallurgical Corporation of China Limited H Shares (Industrials, Construction & Engineering) | 190,000 | 37,210 | ||||||||||||||
Midea Group Company Limited Class A (Consumer Discretionary, Household Durables) | 7,101 | 54,986 | ||||||||||||||
Momo Incorporated ADR (Communication Services, Interactive Media & Services) | 7,708 | 216,749 | ||||||||||||||
NetEase Incorporated ADR (Communication Services, Entertainment) | 5,751 | 1,832,901 | ||||||||||||||
New China Life Insurance Company Limited H Shares (Financials, Insurance) | 48,500 | 189,593 | ||||||||||||||
New Oriental Education & Technology Group Incorporated ADR (Consumer Discretionary, Diversified Consumer Services) † | 7,236 | 925,412 | ||||||||||||||
Nexteer Automotive Group Limited (Consumer Discretionary, Auto Components) | 45,000 | 33,611 | ||||||||||||||
Orient Securities Company Limited of China H Shares (Financials, Diversified Financial Services) | 46,400 | 27,379 | ||||||||||||||
People’s Insurance Company Group of China Limited H Shares (Financials, Insurance) | 418,000 | 150,310 | ||||||||||||||
PetroChina Company Limited H Shares (Energy, Oil, Gas & Consumable Fuels) | 1,078,692 | 421,383 | ||||||||||||||
PICC Property & Casualty Company Limited H Shares (Financials, Insurance) | 348,000 | 368,002 | ||||||||||||||
Ping An Insurance Group Company H Shares (Financials, Insurance) | 284,000 | 3,235,423 | ||||||||||||||
Postal Savings Bank of China Company Limited H Shares (Financials, Banks) | 609,000 | 388,535 | ||||||||||||||
Seazen Group Limited (Real Estate, Real Estate Management & Development) | 86,000 | 90,389 | ||||||||||||||
Semiconductor Manufacturing International Corporation (Information Technology, Semiconductors & Semiconductor Equipment) † | 145,500 | 287,560 | ||||||||||||||
Shandong Weigao Group Medical Polymer Company Limited H Shares (Health Care, Health Care Equipment & Supplies) | 120,000 | 156,585 | ||||||||||||||
Shanghai Baosight Software Company Limited Class B (Information Technology, Software) | 20,600 | 46,099 | ||||||||||||||
Shanghai Electric Group Company Limited H Shares (Industrials, Electrical Equipment) | 170,000 | 48,469 | ||||||||||||||
Shanghai Fosun Pharmaceutical Company Limited H Shares (Health Care, Pharmaceuticals) | 30,500 | 87,462 | ||||||||||||||
Shanghai Lujiazui Finance & Trade Zone Development Company Limited (Real Estate, Real Estate Management & Development) | 74,440 | 59,417 | ||||||||||||||
Shanghai Pharmaceuticals Holding Company Limited H Shares (Health Care, Health Care Providers & Services) | 44,800 | 82,748 | ||||||||||||||
Shenzhen International Holdings Limited H Shares (Industrials, Transportation Infrastructure) | 54,500 | 105,398 | ||||||||||||||
Shimao Property Holding Limited (Real Estate, Real Estate Management & Development) | 50,500 | 185,098 | ||||||||||||||
Silergy Corporation (Information Technology, Semiconductors & Semiconductor Equipment) | 4,000 | 132,812 | ||||||||||||||
Sino Biopharmaceutical Limited Sino Biopharmaceutical(Health Care, Pharmaceuticals) | 356,000 | 527,639 | ||||||||||||||
Sinopec Engineering Group H Shares (Industrials, Construction & Engineering) | 83,000 | 41,319 | ||||||||||||||
Sinopec Shanghai Petrochemical Company Limited H Shares (Materials, Chemicals) | 164,000 | 42,519 | ||||||||||||||
Sinopharm Group Company Limited H Shares (Health Care, Health Care Providers & Services) | 61,200 | 192,264 | ||||||||||||||
Sinotrans Limited H Shares (Industrials, Air Freight & Logistics) | 104,000 | 29,896 | ||||||||||||||
Tal Education Group ADR (Consumer Discretionary, Diversified Consumer Services) † | 15,936 | 866,759 | ||||||||||||||
Tencent Music Entertainment ADR (Communication Services, Entertainment) † | 9,467 | 114,835 | ||||||||||||||
Tingyi Holding Corporation (Consumer Staples, Food Products) | 88,000 | 161,578 | ||||||||||||||
Tong Ren Tang Technologies Company Limited H Shares (Health Care, Pharmaceuticals) | 38,000 | 35,099 | ||||||||||||||
Travelsky Technology Limited H Shares (Information Technology, IT Services) | 51,000 | 100,970 | ||||||||||||||
Tsingtao Brewery Company Limited H Shares (Consumer Staples, Beverages) | 34,000 | 179,598 | ||||||||||||||
Uni-President China Holdings Limited (Consumer Staples, Food Products) | 70,000 | 72,707 | ||||||||||||||
The accompanying notes are an integral part of these financial statements.
60 | Wells Fargo Funds
Table of Contents
Portfolio of investments—February 29, 2020
FACTOR ENHANCED EMERGING MARKETS PORTFOLIO
| Shares | Value | |||||||||||||||
| China (continued) | ||||||||||||||||
Vipshop Holdings Limited ADR (Consumer Discretionary, Internet & Direct Marketing Retail) † | 28,156 | $ | 361,241 | |||||||||||||
Want Want China Holdings Limited (Consumer Staples, Food Products) | 334,000 | 262,164 | ||||||||||||||
Weibo Corporation ADR (Communication Services, Interactive Media & Services) † | 5,606 | 236,237 | ||||||||||||||
Weichai Power Company Limited H Shares (Industrials, Machinery) | 101,000 | 202,643 | ||||||||||||||
WuXi AppTec Company Limited (Health Care, Life Sciences Tools & Services) 144A | 7,400 | 111,010 | ||||||||||||||
Yantai Changyu Pioneer Wine Company Limited Class B (Consumer Staples, Beverages) | 21,800 | 38,959 | ||||||||||||||
Yanzhou Coal Mining Company Limited H Shares (Energy, Oil, Gas & Consumable Fuels) | 84,000 | 64,550 | ||||||||||||||
Yuexiu Transport Infrastructure Limited (Industrials, Transportation Infrastructure) | 54,000 | 42,103 | ||||||||||||||
Zhaojin Mining Industry Company Limited H Shares (Materials, Metals & Mining) | 48,000 | 56,944 | ||||||||||||||
Zhejiang Expressway Company Limited H Shares (Industrials, Transportation Infrastructure) | 76,000 | 57,907 | ||||||||||||||
Zhongsheng Group Holdings Limited (Consumer Discretionary, Specialty Retail) | 27,000 | 103,967 | ||||||||||||||
Zhuzhou CSR Times Electric Company Limited H Shares (Industrials, Electrical Equipment) | 28,700 | 101,933 | ||||||||||||||
Zijin Mining Group Company Limited H Shares (Materials, Metals & Mining) | 262,000 | 118,237 | ||||||||||||||
ZTE Corporation H Shares (Information Technology, Communications Equipment) † | 33,600 | 142,901 | ||||||||||||||
| 37,538,479 | ||||||||||||||||
|
| |||||||||||||||
| Colombia: 0.32% | ||||||||||||||||
Almacenes Exito SA (Consumer Staples, Food & Staples Retailing) | 6,432 | 28,804 | ||||||||||||||
Banco de Bogota SA (Financials, Banks) | 2,561 | 62,613 | ||||||||||||||
Cementos Argos SA (Materials, Construction Materials) | 28,691 | 43,209 | ||||||||||||||
Corporacion Financiera Colombiana SA (Financials, Diversified Financial Services) | 6,649 | 60,837 | ||||||||||||||
Grupo Argos SA (Materials, Construction Materials) | 17,276 | 73,636 | ||||||||||||||
Grupo de Inversiones Suramericana SA (Financials, Diversified Financial Services) | 14,394 | 124,749 | ||||||||||||||
Grupo Energia Bogota SA (Utilities, Gas Utilities) | 140,775 | 96,405 | ||||||||||||||
Grupo Nutresa SA (Consumer Staples, Food Products) | 14,923 | 99,311 | ||||||||||||||
Interconexion Electrica SA (Utilities, Electric Utilities) | 19,668 | 103,951 | ||||||||||||||
| 693,515 | ||||||||||||||||
|
| |||||||||||||||
| Czech Republic: 0.28% | ||||||||||||||||
Central European Media Enterprises Limited Class A (Communication Services, Media) † | 9,285 | 40,742 | ||||||||||||||
CEZ AS (Utilities, Electric Utilities) | 9,931 | 190,209 | ||||||||||||||
Komercni Banka AS (Financials, Banks) | 5,758 | 178,444 | ||||||||||||||
Moneta Money Bank (Financials, Banks) 144A | 39,294 | 131,034 | ||||||||||||||
O2 Czech Republic AS (Communication Services, Diversified Telecommunication Services) | 6,461 | 59,435 | ||||||||||||||
| 599,864 | ||||||||||||||||
|
| |||||||||||||||
| Egypt: 0.23% | ||||||||||||||||
Commercial International Bank ADR (Financials, Banks) | 100,744 | 505,936 | ||||||||||||||
|
| |||||||||||||||
| Greece: 0.41% | ||||||||||||||||
Alpha Bank AE (Financials, Banks) † | 77,060 | 112,503 | ||||||||||||||
Eurobank Ergasias SA (Financials, Banks) † | 195,646 | 124,663 | ||||||||||||||
FF Group (Consumer Discretionary, Specialty Retail) †(a) | 3,820 | 0 | ||||||||||||||
GEK Terna Holding Real Estate Construction SA (Industrials, Construction & Engineering) † | 2,960 | 19,737 | ||||||||||||||
Hellenic Petroleum SA (Energy, Oil, Gas & Consumable Fuels) | 4,667 | 32,665 | ||||||||||||||
Hellenic Telecommunications Organization SA (Communication Services, Diversified Telecommunication Services) | 13,080 | 186,097 | ||||||||||||||
Jumbo SA (Consumer Discretionary, Specialty Retail) | 5,706 | 90,142 | ||||||||||||||
LAMDA Development SA (Real Estate, Real Estate Management & Development) † | 3,914 | 30,548 | ||||||||||||||
Motor Oil (Hellas) Corinth Refineries SA (Energy, Oil, Gas & Consumable Fuels) | 3,332 | 54,440 | ||||||||||||||
Mytilineos Holdings SA (Industrials, Industrial Conglomerates) | 5,030 | 38,286 | ||||||||||||||
National Bank of Greece SA (Financials, Banks) † | 31,541 | 71,709 | ||||||||||||||
OPAP SA (Consumer Discretionary, Hotels, Restaurants & Leisure) | 7,804 | 85,119 | ||||||||||||||
Piraeus Bank SA (Financials, Banks) † | 16,418 | 36,993 | ||||||||||||||
| 882,902 | ||||||||||||||||
|
| |||||||||||||||
The accompanying notes are an integral part of these financial statements.
Wells Fargo Funds | 61
Table of Contents
Portfolio of investments—February 29, 2020
FACTOR ENHANCED EMERGING MARKETS PORTFOLIO
| Shares | Value | |||||||||||||||
| Hong Kong: 1.61% |
| |||||||||||||||
Beijing Enterprises Holdings Limited (Utilities, Gas Utilities) | 23,000 | $ | 97,906 | |||||||||||||
China Agri-Industries Holdings Limited (Consumer Staples, Food Products) | 119,000 | 65,471 | ||||||||||||||
China Everbright International Limited (Industrials, Commercial Services & Supplies) | 166,000 | 112,375 | ||||||||||||||
China Jinmao Holdings Group Limited (Real Estate, Real Estate Management & Development) | 288,000 | 214,823 | ||||||||||||||
China Merchants Port Holdings Company Limited (Industrials, Transportation Infrastructure) | 68,000 | 101,055 | ||||||||||||||
China Overseas Grand Oceans Group Limited (Real Estate, Real Estate Management & Development) | 90,000 | 62,914 | ||||||||||||||
China Power International Development Limited (Utilities, Independent Power & Renewable Electricity Producers) | 181,000 | 33,995 | ||||||||||||||
China Resources Beer Holdings Company Limited (Consumer Staples, Beverages) | 82,000 | 386,969 | ||||||||||||||
China Resources Pharmaceutical Group Limited (Health Care, Pharmaceuticals) | 97,000 | 85,559 | ||||||||||||||
China Resources Power Holdings Company (Utilities, Independent Power & Renewable Electricity Producers) | 88,000 | 105,738 | ||||||||||||||
China Traditional Chinese Medicine Holdings Company Limited (Health Care, Pharmaceuticals) | 126,000 | 67,154 | ||||||||||||||
China Travel International Investment Hong Kong Limited (Consumer Discretionary, Hotels, Restaurants & Leisure) | 126,000 | 20,131 | ||||||||||||||
China Unicom Hong Kong Limited (Communication Services, Diversified Telecommunication Services) | 316,000 | 253,927 | ||||||||||||||
CSPC Pharmaceutical Group Limited (Health Care, Pharmaceuticals) | 230,000 | 536,143 | ||||||||||||||
Far East Horizon Limited (Financials, Diversified Financial Services) | 107,000 | 94,889 | ||||||||||||||
Guangdong Investment Limited (Utilities, Water Utilities) | 146,000 | 277,264 | ||||||||||||||
Haier Electronics Group Company (Consumer Discretionary, Household Durables) | 62,000 | 180,793 | ||||||||||||||
Nine Dragons Paper Holdings Limited (Materials, Paper & Forest Products) | 93,000 | 111,719 | ||||||||||||||
Poly Property Group Company Limited (Real Estate, Real Estate Management & Development) | 113,000 | 42,997 | ||||||||||||||
Shanghai Industrial Holdings Limited (Industrials, Industrial Conglomerates) | 25,000 | 44,500 | ||||||||||||||
Shenzhen Investment Limited (Real Estate, Real Estate Management & Development) | 162,000 | 54,755 | ||||||||||||||
Shougang Fushan Resources Group Limited (Materials, Metals & Mining) | 140,000 | 27,219 | ||||||||||||||
Sinotruk Hong Kong Limited (Industrials, Machinery) | 35,000 | 68,039 | ||||||||||||||
Sun Art Retail Group Limited (Consumer Staples, Food & Staples Retailing) | 111,000 | 143,461 | ||||||||||||||
Universal Medical Financial & Technical Advisory Services Company Limited (Health Care, Health Care Providers & Services) 144A | 50,000 | 35,040 | ||||||||||||||
Wharf Holdings Limited (Real Estate, Real Estate Management & Development) | 54,000 | 115,575 | ||||||||||||||
Yuexiu Property Company Limited (Real Estate, Real Estate Management & Development) | 368,000 | 76,206 | ||||||||||||||
Yuexiu Real Estate Investment Trust (Real Estate, Equity REITs) | 133,505 | 85,952 | ||||||||||||||
| 3,502,569 | ||||||||||||||||
|
| |||||||||||||||
| Hungary: 0.46% | ||||||||||||||||
Magyar Telekom Telecommunications plc (Communication Services, Diversified Telecommunication Services) | 34,879 | 45,319 | ||||||||||||||
MOL Hungarian Oil & Gas plc (Energy, Oil, Gas & Consumable Fuels) | 30,098 | 232,284 | ||||||||||||||
OTP Bank plc (Financials, Banks) | 12,942 | 568,065 | ||||||||||||||
Richter Gedeon (Health Care, Pharmaceuticals) | 7,936 | 161,019 | ||||||||||||||
| 1,006,687 | ||||||||||||||||
|
| |||||||||||||||
| India: 17.12% | ||||||||||||||||
3M India Limited (Industrials, Industrial Conglomerates) † | 200 | 57,271 | ||||||||||||||
Aarti Industries Limited (Materials, Chemicals) | 11,446 | 154,805 | ||||||||||||||
Aavas Financiers Limited (Financials, Thrifts & Mortgage Finance) † | 1,392 | 36,240 | ||||||||||||||
ABB Limited India (Industrials, Electrical Equipment) | 3,591 | 59,331 | ||||||||||||||
ABB Power Products & Systems India Limited (Industrials, Commercial Services & Supplies) †(a)‡ | 718 | 7,313 | ||||||||||||||
ACC Limited (Materials, Construction Materials) | 4,508 | 83,122 | ||||||||||||||
Adani Enterprises Limited (Industrials, Trading Companies & Distributors) | 24,465 | 75,038 | ||||||||||||||
Adani Gas Limited (Utilities, Gas Utilities) | 22,600 | 42,475 | ||||||||||||||
Adani Green Energy Limited (Utilities, Independent Power & Renewable Electricity Producers) † | 14,554 | 31,661 | ||||||||||||||
Adani Ports & Special Economic Zone Limited (Industrials, Transportation Infrastructure) | 44,394 | 212,312 | ||||||||||||||
Adani Power Limited (Utilities, Independent Power & Renewable Electricity Producers) † | 62,441 | 41,268 | ||||||||||||||
The accompanying notes are an integral part of these financial statements.
62 | Wells Fargo Funds
Table of Contents
Portfolio of investments—February 29, 2020
FACTOR ENHANCED EMERGING MARKETS PORTFOLIO
| Shares | Value | |||||||||||||||
| India (continued) | ||||||||||||||||
Adani Transmissions Limited (Utilities, Electric Utilities) † | 20,824 | $ | 73,122 | |||||||||||||
Aditya Birla Capital Limited (Financials, Diversified Financial Services) † | 49,296 | 53,606 | ||||||||||||||
Aditya Birla Fashion & Retail Limited (Consumer Discretionary, Textiles, Apparel & Luxury Goods) † | 29,106 | 102,092 | ||||||||||||||
Aia Engineering Limited (Industrials, Machinery) | 2,142 | 53,089 | ||||||||||||||
Ajanta Pharma Limited (Health Care, Pharmaceuticals) | 2,475 | 47,775 | ||||||||||||||
Alembic Pharmaceuticals Limited (Health Care, Pharmaceuticals) | 4,501 | 39,289 | ||||||||||||||
Alkem Laboratories Limited (Health Care, Pharmaceuticals) | 4,331 | 158,797 | ||||||||||||||
Amara Raja Batteries Limited (Industrials, Electrical Equipment) | 4,742 | 42,082 | ||||||||||||||
Ambuja Cements Limited (Materials, Construction Materials) | 37,464 | 107,149 | ||||||||||||||
Apollo Hospitals Enterprise Limited (Health Care, Health Care Providers & Services) | 5,436 | 131,128 | ||||||||||||||
Apollo Tyres Limited (Consumer Discretionary, Auto Components) | 26,148 | 52,117 | ||||||||||||||
Arti Surfactants Limited (Materials, Chemicals) †(a) | 541 | 0 | ||||||||||||||
Asahi India Glass Limited (Consumer Discretionary, Auto Components) | 10,910 | 37,673 | ||||||||||||||
Ashok Leyland Limited (Industrials, Machinery) | 94,359 | 92,614 | ||||||||||||||
Asian Paints Limited (Materials, Chemicals) | 40,457 | 1,012,064 | ||||||||||||||
Astral Poly Technik Limited (Industrials, Building Products) | 3,857 | 61,163 | ||||||||||||||
Atul Limited (Materials, Chemicals) | 1,021 | 72,771 | ||||||||||||||
AU Small Finance Bank Limited (Financials, Banks) 144A | 10,106 | 163,385 | ||||||||||||||
Aurobindo Pharma Limited (Health Care, Pharmaceuticals) | 20,494 | 143,551 | ||||||||||||||
Axis Bank Limited (Financials, Banks) | 129,631 | 1,262,786 | ||||||||||||||
Bajaj Auto Limited (Consumer Discretionary, Automobiles) | 6,772 | 272,629 | ||||||||||||||
Bajaj Finance Limited (Financials, Consumer Finance) | 12,219 | 763,932 | ||||||||||||||
Bajaj Finserv Limited (Financials, Insurance) | 3,625 | 459,259 | ||||||||||||||
Bajaj Holdings & Investment Limited (Financials, Diversified Financial Services) | 2,688 | 126,826 | ||||||||||||||
Balkrishna Industries Limited (Consumer Discretionary, Auto Components) | 4,558 | 69,768 | ||||||||||||||
Bank of Baroda (Financials, Banks) † | 68,251 | 73,408 | ||||||||||||||
Bata India Limited (Consumer Discretionary, Textiles, Apparel & Luxury Goods) | 3,325 | 76,463 | ||||||||||||||
Bayer CropScience Limited (Materials, Chemicals) | 779 | 47,301 | ||||||||||||||
Berger Paints India Limited (Materials, Chemicals) | 18,170 | 143,208 | ||||||||||||||
Bharat Electronics Limited (Industrials, Aerospace & Defense) | 61,010 | 62,939 | ||||||||||||||
Bharat Forge Limited (Consumer Discretionary, Auto Components) | 14,283 | 86,839 | ||||||||||||||
Bharat Heavy Electricals Limited (Industrials, Electrical Equipment) | 57,745 | 24,765 | ||||||||||||||
Bharat Petroleum Corporation Limited (Energy, Oil, Gas & Consumable Fuels) | 48,207 | 285,868 | ||||||||||||||
Bharti Airtel Limited (Communication Services, Wireless Telecommunication Services) † | 97,154 | 704,751 | ||||||||||||||
Bharti Infratel Limited (Communication Services, Diversified Telecommunication Services) | 54,422 | 162,650 | ||||||||||||||
Biocon Limited (Health Care, Biotechnology) | 24,225 | 97,113 | ||||||||||||||
Blue Star Limited (Industrials, Building Products) | 4,533 | 50,733 | ||||||||||||||
Britannia Industries Limited (Consumer Staples, Food Products) | 6,468 | 267,430 | ||||||||||||||
Cadila Healthcare Limited (Health Care, Pharmaceuticals) | 17,118 | 61,991 | ||||||||||||||
Canara Bank (Financials, Banks) † | 9,011 | 18,181 | ||||||||||||||
Carborundum Universal Limited (Industrials, Machinery) | 8,485 | 38,241 | ||||||||||||||
Castrol India Limited (Materials, Chemicals) | 25,364 | 51,866 | ||||||||||||||
Century Textiles & Industries Limited (Materials, Paper & Forest Products) | 3,727 | 26,401 | ||||||||||||||
CESC Limited (Utilities, Electric Utilities) | 3,786 | 34,117 | ||||||||||||||
Chambal Fertilisers and Chemicals Limited (Materials, Chemicals) | 15,076 | 29,608 | ||||||||||||||
Cholamandalam Financial Holdings Limited (Financials, Consumer Finance) | 6,996 | 49,731 | ||||||||||||||
Cholamandalam Investment & Finance Company Limited (Financials, Consumer Finance) | 34,685 | 148,142 | ||||||||||||||
Cipla Limited India (Health Care, Pharmaceuticals) | 31,287 | 175,326 | ||||||||||||||
City Union Bank Limited (Financials, Banks) | 43,807 | 131,348 | ||||||||||||||
Colgate-Palmolive Company India Limited (Consumer Staples, Personal Products) | 6,691 | 119,630 | ||||||||||||||
Container Corporation of India Limited (Industrials, Transportation Infrastructure) | 14,091 | 100,104 | ||||||||||||||
Coromandel International Limited (Materials, Chemicals) | 5,620 | 48,118 | ||||||||||||||
CRISIL Limited (Financials, Capital Markets) | 1,275 | 26,924 | ||||||||||||||
Crompton Greaves Consumer Electricals Limited (Consumer Discretionary, Household Durables) | 27,424 | 106,772 | ||||||||||||||
Cummins India Limited (Industrials, Machinery) | 8,510 | 60,251 | ||||||||||||||
Cyient Limited (Information Technology, Software) | 5,754 | 34,023 | ||||||||||||||
The accompanying notes are an integral part of these financial statements.
Wells Fargo Funds | 63
Table of Contents
Portfolio of investments—February 29, 2020
FACTOR ENHANCED EMERGING MARKETS PORTFOLIO
| Shares | Value | |||||||||||||||
| India (continued) | ||||||||||||||||
Dabur India Limited (Consumer Staples, Personal Products) | 33,825 | $ | 233,533 | |||||||||||||
Dalmia Bharat Limited (Materials, Construction Materials) | 5,886 | 63,788 | ||||||||||||||
DCB Bank Limited (Financials, Banks) | 17,024 | 38,570 | ||||||||||||||
Delta Corp Limited (Consumer Discretionary, Hotels, Restaurants & Leisure) | 11,984 | 22,327 | ||||||||||||||
Divi’s Laboratories Limited (Health Care, Life Sciences Tools & Services) | 7,281 | 213,300 | ||||||||||||||
Dr. Lal Pathlabs Limited (Health Care, Health Care Providers & Services) 144A | 2,028 | 45,981 | ||||||||||||||
Dr. Reddy’s Laboratories Limited (Health Care, Pharmaceuticals) | 2,623 | 106,636 | ||||||||||||||
Dr. Reddy’s Laboratories Limited ADR (Health Care, Pharmaceuticals) | 3,833 | 153,933 | ||||||||||||||
Edelweiss Financial Services Limited (Financials, Capital Markets) | 41,713 | 51,699 | ||||||||||||||
EIH Limited (Consumer Discretionary, Hotels, Restaurants & Leisure) | 13,482 | 24,715 | ||||||||||||||
Emami Limited (Consumer Staples, Personal Products) | 12,816 | 45,560 | ||||||||||||||
Endurance Technologies Limited (Consumer Discretionary, Auto Components) 144A | 6,416 | 87,260 | ||||||||||||||
Engineers India Limited (Industrials, Construction & Engineering) | 19,319 | 18,910 | ||||||||||||||
Equitas Holdings Limited (Financials, Consumer Finance) † | 19,383 | 29,351 | ||||||||||||||
Escorts Limited (Industrials, Machinery) | 3,979 | 43,427 | ||||||||||||||
Exide Industries Limited (Consumer Discretionary, Auto Components) | 29,362 | 67,151 | ||||||||||||||
Federal Bank Limited (Financials, Banks) | 102,208 | 122,445 | ||||||||||||||
Finolex Cables Limited (Industrials, Electrical Equipment) | 6,867 | 30,906 | ||||||||||||||
Finolex Industries Limited (Materials, Chemicals) | 4,167 | 31,537 | ||||||||||||||
Fortis Healthcare Limited (Health Care, Health Care Providers & Services) † | 33,187 | 71,249 | ||||||||||||||
Future Consumer Limited (Consumer Staples, Food Products) † | 55,810 | 9,565 | ||||||||||||||
Future Retail Limited (Consumer Discretionary, Multiline Retail) † | 13,294 | 56,385 | ||||||||||||||
Futures Lifestyle Fashions Limited (Consumer Discretionary, Specialty Retail) | 5,682 | 27,544 | ||||||||||||||
Gail India Limited (Utilities, Gas Utilities) | 92,612 | 134,360 | ||||||||||||||
Gillette India Limited (Consumer Staples, Personal Products) | 590 | 47,554 | ||||||||||||||
GlaxoSmithKline Consumer Healthcare Limited (Consumer Staples, Food Products) | 794 | 104,105 | ||||||||||||||
GlaxoSmithKline Pharmaceuticals Limited (Health Care, Pharmaceuticals) | 2,768 | 50,200 | ||||||||||||||
Glenmark Pharmaceuticals Limited (Health Care, Pharmaceuticals) | 10,509 | 40,535 | ||||||||||||||
GMR Infrastructure Limited (Industrials, Transportation Infrastructure) † | 106,049 | 29,730 | ||||||||||||||
Godrej Consumer Products Limited (Consumer Staples, Personal Products) | 20,905 | 163,302 | ||||||||||||||
Godrej Industries Limited (Industrials, Industrial Conglomerates) | 15,852 | 86,670 | ||||||||||||||
Godrej Properties Limited (Real Estate, Real Estate Management & Development) † | 5,201 | 72,548 | ||||||||||||||
Grasim Industries Limited (Materials, Construction Materials) | 18,362 | 176,616 | ||||||||||||||
Gujarat Gas Limited (Utilities, Gas Utilities) | 14,101 | 54,298 | ||||||||||||||
Gujarat State Petronet Limited (Utilities, Gas Utilities) | 18,155 | 56,582 | ||||||||||||||
Hatsun Agro Products Limited (Consumer Staples, Food Products) | 3,866 | 36,966 | ||||||||||||||
Havells India Limited (Industrials, Electrical Equipment) | 13,476 | 114,962 | ||||||||||||||
HCL Technologies Limited (Information Technology, IT Services) | 55,575 | 413,329 | ||||||||||||||
HDFC Asset Management Company Limited (Financials, Capital Markets) 144A | 1,829 | 80,434 | ||||||||||||||
HDFC Life Insurance Company Limited (Financials, Insurance) | 48,997 | �� | 371,837 | |||||||||||||
Hemisphere Properties India Limited (Real Estate, Real Estate Management & Development) †(a)‡ | 5,373 | 12,419 | ||||||||||||||
Hero Honda Motors Limited (Consumer Discretionary, Automobiles) | 6,567 | 187,929 | ||||||||||||||
Hexaware Technologies Limited (Information Technology, IT Services) | 7,103 | 35,526 | ||||||||||||||
Hindustan Petroleum Corporation Limited (Energy, Oil, Gas & Consumable Fuels) | 38,135 | 104,866 | ||||||||||||||
Hindustan Unilever Limited (Consumer Staples, Household Products) | 35,630 | 1,076,545 | ||||||||||||||
Honeywell Automation India Limited (Information Technology, Electronic Equipment, Instruments & Components) | 155 | 71,294 | ||||||||||||||
Housing Development Finance Corporation Limited (Financials, Thrifts & Mortgage Finance) | 86,541 | 2,625,849 | ||||||||||||||
ICICI Bank Limited (Financials, Banks) | 299,587 | 2,080,094 | ||||||||||||||
ICICI Lombard General Insurance Company Limited (Financials, Insurance) 144A | 8,117 | 139,092 | ||||||||||||||
ICICI Prudential Life Insurance Company Limited (Financials, Insurance) 144A | 18,221 | 119,527 | ||||||||||||||
IDFC Bank Limited (Financials, Banks) † | 111,253 | 57,307 | ||||||||||||||
IDFC Limited (Financials, Diversified Financial Services) | 69,070 | 30,862 | ||||||||||||||
Indiabulls Housing Finance Limited (Financials, Thrifts & Mortgage Finance) | 17,813 | 70,476 | ||||||||||||||
Indiabulls Ventures Limited (Financials, Capital Markets) | 14,696 | 34,608 | ||||||||||||||
Indian Energy Exchange Limited (Financials, Capital Markets) 144A† | 9,333 | 23,016 | ||||||||||||||
The accompanying notes are an integral part of these financial statements.
64 | Wells Fargo Funds
Table of Contents
Portfolio of investments—February 29, 2020
FACTOR ENHANCED EMERGING MARKETS PORTFOLIO
| Shares | Value | |||||||||||||||
| India (continued) | ||||||||||||||||
Indian Hotels Company Limited (Consumer Discretionary, Hotels, Restaurants & Leisure) | 39,027 | $ | 73,288 | |||||||||||||
Indian Oil Corporation Limited (Energy, Oil, Gas & Consumable Fuels) | 106,675 | 157,148 | ||||||||||||||
Indraprastha Gas Limited (Utilities, Gas Utilities) | 13,757 | 84,721 | ||||||||||||||
Info Edge India Limited (Communication Services, Interactive Media & Services) | 3,881 | 139,464 | ||||||||||||||
Infosys Limited (Information Technology, IT Services) | 107,119 | 1,086,766 | ||||||||||||||
Infosys Limited ADR (Information Technology, IT Services) | 95,625 | 962,944 | ||||||||||||||
Interglobe Aviation Limited (Industrials, Airlines) | 5,026 | 91,376 | ||||||||||||||
Ipca Laboratories Limited (Health Care, Pharmaceuticals) | 5,512 | 104,626 | ||||||||||||||
ITC Limited (Consumer Staples, Tobacco) | 379,081 | 1,042,671 | ||||||||||||||
Jindal Steel & Power Limited (Materials, Metals & Mining) † | 26,552 | 57,947 | ||||||||||||||
JK Cement Limited (Materials, Construction Materials) | 2,403 | 46,382 | ||||||||||||||
JM Financial Limited (Financials, Capital Markets) | 16,114 | 23,817 | ||||||||||||||
JSW Energy Limited (Utilities, Independent Power & Renewable Electricity Producers) | 23,627 | 18,916 | ||||||||||||||
JSW Steel Limited (Materials, Metals & Mining) | 66,284 | 219,852 | ||||||||||||||
Jubilant Foodworks Limited (Consumer Discretionary, Hotels, Restaurants & Leisure) | 3,787 | 93,004 | ||||||||||||||
Jubilant Organosys Limited (Health Care, Pharmaceuticals) | 6,482 | 45,475 | ||||||||||||||
Jyothy Laboratories Limited (Consumer Staples, Household Products) | 12,520 | 21,541 | ||||||||||||||
Kajaria Ceramics Limited (Industrials, Building Products) | 6,128 | 44,743 | ||||||||||||||
Kalpataru Power Transmission Limited (Industrials, Construction & Engineering) | 4,121 | 19,135 | ||||||||||||||
Kansai Nerolac Paints Limited (Materials, Chemicals) | 8,602 | 59,776 | ||||||||||||||
Karur Vysya Bank Limited (Financials, Banks) | 54,171 | 31,537 | ||||||||||||||
KEC International Limited (Industrials, Construction & Engineering) | 8,581 | 37,050 | ||||||||||||||
Kotak Mahindra Bank Limited (Financials, Banks) | 63,287 | 1,432,249 | ||||||||||||||
KPR Mill Limited (Consumer Discretionary, Textiles, Apparel & Luxury Goods) | 1,659 | 13,598 | ||||||||||||||
L&T Finance Holdings Limited (Financials, Diversified Financial Services) | 38,621 | 54,100 | ||||||||||||||
L&T Technology Services Limited (Industrials, Professional Services) 144A | 1,466 | 33,105 | ||||||||||||||
Larsen & Toubro Infotech Limited (Information Technology, IT Services) 144A | 2,288 | 60,559 | ||||||||||||||
LIC Housing Finance Limited (Financials, Thrifts & Mortgage Finance) | 15,373 | 68,876 | ||||||||||||||
Lupin Limited (Health Care, Pharmaceuticals) | 13,074 | 116,421 | ||||||||||||||
Mahanagar Gas Limited (Utilities, Gas Utilities) | 3,064 | 42,943 | ||||||||||||||
Mahindra & Mahindra Financial Services Limited (Financials, Consumer Finance) | 14,571 | 70,092 | ||||||||||||||
Mahindra & Mahindra Limited (Consumer Discretionary, Automobiles) | 47,609 | 303,812 | ||||||||||||||
Manappuram Finance Limited (Financials, Consumer Finance) | 22,556 | 51,553 | ||||||||||||||
Marico Limited (Consumer Staples, Personal Products) | 34,314 | 142,438 | ||||||||||||||
Max Financial Services Limited (Financials, Insurance) † | 9,512 | 76,527 | ||||||||||||||
Minda Industries Limited (Consumer Discretionary, Auto Components) | 5,964 | 30,833 | ||||||||||||||
Mindtree Limited (Information Technology, IT Services) | 3,118 | 41,006 | ||||||||||||||
Motherson Sumi Systems Limited (Consumer Discretionary, Auto Components) | 64,592 | 94,103 | ||||||||||||||
Motilal Oswal Financial Services Limited (Financials, Capital Markets) | 2,693 | 28,042 | ||||||||||||||
Mphasis Limited (Information Technology, IT Services) | 5,832 | 70,677 | ||||||||||||||
MRF Limited (Consumer Discretionary, Auto Components) | 167 | 154,217 | ||||||||||||||
Multi Commodity Exchange of India Limited (Financials, Capital Markets) | 2,750 | 49,027 | ||||||||||||||
Muthoot Finance Limited (Financials, Consumer Finance) | 8,611 | 106,114 | ||||||||||||||
Nagarjuna Construction Company Limited (Industrials, Construction & Engineering) | 34,248 | 17,050 | ||||||||||||||
Natco Pharma Limited (Health Care, Pharmaceuticals) | 5,631 | 47,193 | ||||||||||||||
National Aluminum Company Limited (Materials, Metals & Mining) | 60,663 | 28,374 | ||||||||||||||
Navin Fluorine International Limited (Materials, Chemicals) | 1,924 | 38,346 | ||||||||||||||
Nestle India Limited (Consumer Staples, Food Products) | 1,851 | 404,706 | ||||||||||||||
NHPC Limited (Utilities, Independent Power & Renewable Electricity Producers) | 98,340 | 28,071 | ||||||||||||||
NIIT Technologies Limited (Information Technology, IT Services) | 1,396 | 32,686 | ||||||||||||||
NMDC Limited (Materials, Metals & Mining) | 26,161 | 33,471 | ||||||||||||||
NTPC Limited (Utilities, Independent Power & Renewable Electricity Producers) | 217,872 | 322,382 | ||||||||||||||
Oberoi Realty Limited (Real Estate, Real Estate Management & Development) | 7,774 | 55,211 | ||||||||||||||
Oil & Natural Gas Corporation Limited (Energy, Oil, Gas & Consumable Fuels) | 127,245 | 163,148 | ||||||||||||||
Oil India Limited (Energy, Oil, Gas & Consumable Fuels) | 32,454 | 48,900 | ||||||||||||||
Oracle Financials Services Limited (Information Technology, Software) † | 1,371 | 50,499 | ||||||||||||||
The accompanying notes are an integral part of these financial statements.
Wells Fargo Funds | 65
Table of Contents
Portfolio of investments—February 29, 2020
FACTOR ENHANCED EMERGING MARKETS PORTFOLIO
| Shares | Value | |||||||||||||||
| India (continued) | ||||||||||||||||
Page Industries Limited (Consumer Discretionary, Textiles, Apparel & Luxury Goods) | 252 | $ | 78,015 | |||||||||||||
Persistent Systems Limited (Information Technology, IT Services) | 3,263 | 31,671 | ||||||||||||||
Petronet LNG Limited (Energy, Oil, Gas & Consumable Fuels) | 45,640 | 156,174 | ||||||||||||||
Pfizer Limited (Health Care, Pharmaceuticals) | 1,216 | 70,916 | ||||||||||||||
Phoenix Mills Limited (Real Estate, Real Estate Management & Development) | 4,281 | 50,805 | ||||||||||||||
PI Industries Limited (Materials, Chemicals) | 4,075 | 86,463 | ||||||||||||||
Pidilite Industries Limited (Materials, Chemicals) | 14,384 | 302,703 | ||||||||||||||
Piramal Enterprises Limited (Health Care, Pharmaceuticals) | 5,621 | 102,654 | ||||||||||||||
Polycab India Limited (Industrials, Electrical Equipment) | 2,097 | 30,879 | ||||||||||||||
Power Finance Corporation Limited (Financials, Diversified Financial Services) | 56,063 | 85,506 | ||||||||||||||
Power Grid Corporation of India Limited (Utilities, Electric Utilities) | 110,561 | 278,059 | ||||||||||||||
Prestige Estates Projects Limited (Real Estate, Real Estate Management & Development) | 9,170 | 37,154 | ||||||||||||||
Procter & Gamble Health Limited (Health Care, Pharmaceuticals) | 499 | 28,913 | ||||||||||||||
Procter & Gamble Hygiene & Healthcare Limited (Consumer Staples, Personal Products) | 517 | 79,990 | ||||||||||||||
Punjab National Bank (Financials, Banks) † | 49,649 | 31,510 | ||||||||||||||
PVR Limited (Communication Services, Entertainment) | 1,686 | 44,938 | ||||||||||||||
Rajesh Exports Limited (Consumer Discretionary, Textiles, Apparel & Luxury Goods) | 6,704 | 61,143 | ||||||||||||||
RBL Bank Limited (Financials, Banks) 144A | 24,190 | 98,566 | ||||||||||||||
REC Limited (Financials, Diversified Financial Services) | 44,650 | 73,549 | ||||||||||||||
Relaxo Footwears Limited (Consumer Discretionary, Textiles, Apparel & Luxury Goods) | 7,594 | 73,740 | ||||||||||||||
Reliance Nippon Life Asset Management Limited (Financials, Diversified Financial Services) | 9,134 | 49,819 | ||||||||||||||
Sanofi India Limited (Health Care, Pharmaceuticals) | 686 | 69,326 | ||||||||||||||
SBI Life Insurance Company Limited (Financials, Insurance) 144A | 14,413 | 179,145 | ||||||||||||||
Schaeffler India Limited (Industrials, Machinery) | 651 | 39,382 | ||||||||||||||
Shree Cement Limited (Materials, Construction Materials) | 726 | 229,416 | ||||||||||||||
Shriram City Union Finance Limited (Financials, Consumer Finance) | 1,653 | 32,966 | ||||||||||||||
Shriram Transport Finance Company Limited (Financials, Consumer Finance) | 8,933 | 149,443 | ||||||||||||||
Siemens India Limited (Industrials, Industrial Conglomerates) | 4,609 | 83,796 | ||||||||||||||
SKF India Limited (Industrials, Machinery) | 1,846 | 48,057 | ||||||||||||||
Solar Industries India Limited (Materials, Chemicals) | 1,850 | 29,685 | ||||||||||||||
Spicejet Limited (Industrials, Airlines) † | 16,524 | 19,360 | ||||||||||||||
SRF Limited (Materials, Chemicals) | 1,543 | 83,253 | ||||||||||||||
State Bank of India (Financials, Banks) † | 156,387 | 666,601 | ||||||||||||||
Strides Shasun Limited (Health Care, Pharmaceuticals) | 5,620 | 36,866 | ||||||||||||||
Sun Pharmaceutical Industries Limited (Health Care, Pharmaceuticals) | 54,005 | 280,389 | ||||||||||||||
Sun TV Network Limited (Communication Services, Media) | 7,632 | 44,244 | ||||||||||||||
Sundaram Finance Limited (Financials, Consumer Finance) | 3,594 | 78,628 | ||||||||||||||
Sundram Fasteners Limited (Consumer Discretionary, Auto Components) | 5,933 | 34,138 | ||||||||||||||
Sunteck Realty Limited (Real Estate, Real Estate Management & Development) | 4,671 | 22,715 | ||||||||||||||
Supreme Industries Limited (Materials, Chemicals) | 3,237 | 59,520 | ||||||||||||||
Tata Chemicals Limited (Materials, Chemicals) | 7,840 | 78,122 | ||||||||||||||
Tata Communications Limited (Communication Services, Diversified Telecommunication Services) | 5,373 | 27,135 | ||||||||||||||
Tata Consultancy Services Limited (Information Technology, IT Services) | 51,038 | 1,414,538 | ||||||||||||||
Tata Motors Limited (Consumer Discretionary, Automobiles) † | 83,937 | 152,709 | ||||||||||||||
Tata Power Company Limited (Utilities, Electric Utilities) | 84,043 | 54,896 | ||||||||||||||
Tata Steel Limited (Materials, Metals & Mining) | 33,619 | 181,192 | ||||||||||||||
Tata Tea Limited (Consumer Staples, Food Products) | 21,059 | 101,404 | ||||||||||||||
TeamLease Services Limited (Industrials, Professional Services) † | 771 | 24,972 | ||||||||||||||
Tech Mahindra Limited (Information Technology, IT Services) | 36,160 | 374,076 | ||||||||||||||
The Great Eastern Shipping Company Limited (Energy, Oil, Gas & Consumable Fuels) | 6,253 | 21,051 | ||||||||||||||
The Ramco Cements Limited (Materials, Construction Materials) | 9,038 | 96,828 | ||||||||||||||
Thermax India Limited (Industrials, Machinery) | 2,489 | 31,989 | ||||||||||||||
Titan Industries Limited (Consumer Discretionary, Textiles, Apparel & Luxury Goods) | 18,641 | 326,277 | ||||||||||||||
Torrent Pharmaceuticals Limited (Health Care, Pharmaceuticals) | 3,241 | 96,971 | ||||||||||||||
Torrent Power Limited (Utilities, Electric Utilities) | 8,145 | 34,192 | ||||||||||||||
Trent Limited (Consumer Discretionary, Multiline Retail) | 9,580 | 98,293 | ||||||||||||||
The accompanying notes are an integral part of these financial statements.
66 | Wells Fargo Funds
Table of Contents
Portfolio of investments—February 29, 2020
FACTOR ENHANCED EMERGING MARKETS PORTFOLIO
| Shares | Value | |||||||||||||||
| India (continued) | ||||||||||||||||
TTK Prestige Limited (Consumer Discretionary, Household Durables) | 430 | $ | 33,943 | |||||||||||||
Tube Investments of India Limited (Consumer Discretionary, Auto Components) | 7,853 | 57,455 | ||||||||||||||
Ujjivan Financial Services Limited (Financials, Consumer Finance) | 5,669 | 26,744 | ||||||||||||||
United Breweries Limited (Consumer Staples, Beverages) | 4,893 | 84,330 | ||||||||||||||
UPL Limited (Materials, Chemicals) | 24,092 | 174,221 | ||||||||||||||
V-Guard Industries Limited (Industrials, Electrical Equipment) | 11,366 | 32,166 | ||||||||||||||
Varun Beverages Limited (Consumer Staples, Beverages) | 11,327 | 128,423 | ||||||||||||||
Vinati Organics Limited (Materials, Chemicals) | 1,776 | 23,254 | ||||||||||||||
VIP Industries Limited (Consumer Discretionary, Textiles, Apparel & Luxury Goods) | 7,488 | 42,871 | ||||||||||||||
Voltas Limited (Industrials, Construction & Engineering) | 11,225 | 106,337 | ||||||||||||||
Wabco India Limited (Consumer Discretionary, Auto Components) | 410 | 38,469 | ||||||||||||||
Whirlpool of India Limited (Consumer Discretionary, Household Durables) | 2,139 | 64,944 | ||||||||||||||
Wipro Limited (Information Technology, IT Services) | 113,766 | 350,852 | ||||||||||||||
Yes Bank Limited (Financials, Banks) | 132,139 | 63,353 | ||||||||||||||
Zee Entertainment Enterprises Limited (Communication Services, Media) | 47,367 | 158,138 | ||||||||||||||
| 37,155,705 | ||||||||||||||||
|
| |||||||||||||||
| Indonesia: 2.02% | ||||||||||||||||
PT Ace Hardware Incorporated Indonesia Tbk (Consumer Discretionary, Specialty Retail) | 342,600 | 36,337 | ||||||||||||||
PT Adaro Energy Tbk (Energy, Oil, Gas & Consumable Fuels) | 786,000 | 64,413 | ||||||||||||||
PT AKR Corporindo Tbk (Industrials, Trading Companies & Distributors) | 97,100 | 18,185 | ||||||||||||||
PT Aneka Tambang Tbk (Materials, Metals & Mining) | 316,100 | 12,900 | ||||||||||||||
PT Bank Central Asia Tbk (Financials, Banks) | 546,100 | 1,206,285 | ||||||||||||||
PT Bank Negara Indonesia Persero Tbk (Financials, Banks) | 372,700 | 186,690 | ||||||||||||||
PT Bank Pembangunan Daerah Jawa Barat dan Banten Tbk (Financials, Banks) | 292,500 | 18,184 | ||||||||||||||
PT Bank Rakyat Indonesia Tbk (Financials, Banks) | 2,654,200 | 793,146 | ||||||||||||||
PT Bank Tabungan Negara Persero Tbk (Financials, Banks) | 239,300 | 28,938 | ||||||||||||||
PT Bank Tabungan Pensiunan Nasional Syariah Tbk (Financials, Banks) † | 134,100 | 35,482 | ||||||||||||||
PT Bank Tabungan Pensiunan Nasional Tbk (Financials, Banks) † | 497,277 | 93,927 | ||||||||||||||
PT Bayan Resources Group Tbk (Energy, Oil, Gas & Consumable Fuels) | 10,952 | 11,603 | ||||||||||||||
PT Bumi Serpong Damai Tbk (Real Estate, Real Estate Management & Development) † | 429,300 | 30,568 | ||||||||||||||
PT Charoen Pokphand Indonesia Tbk (Consumer Staples, Food Products) | 338,300 | 136,810 | ||||||||||||||
PT Ciputra Development Tbk (Real Estate, Real Estate Management & Development) | 551,800 | 37,221 | ||||||||||||||
PT Gudang Garam Tbk (Consumer Staples, Tobacco) | 23,100 | 82,778 | ||||||||||||||
PT Hanjaya Mandala Sampoerna Tbk (Consumer Staples, Tobacco) | 421,200 | 50,896 | ||||||||||||||
PT Hanson International Tbk (Real Estate, Real Estate Management & Development) †(a) | 10,045,000 | 35,006 | ||||||||||||||
PT Indofood CBP Sukses Makmur Tbk (Consumer Staples, Food Products) | 116,100 | 83,411 | ||||||||||||||
PT Indofood Sukses Makmur Tbk (Consumer Staples, Food Products) | 215,400 | 99,344 | ||||||||||||||
PT Jasa Marga (Persero) Tbk (Industrials, Transportation Infrastructure) | 90,800 | 30,107 | ||||||||||||||
PT Kalbe Farma Tbk (Health Care, Pharmaceuticals) | 1,026,100 | 88,714 | ||||||||||||||
PT Mayora Indah Tbk (Consumer Staples, Food Products) | 184,987 | 23,343 | ||||||||||||||
PT Media Nusantara Citra Tbk (Communication Services, Media) | 294,100 | 26,655 | ||||||||||||||
PT Merdeka Copper Gold Tbk (Materials, Metals & Mining) † | 273,900 | 24,913 | ||||||||||||||
PT Mitra Adiperkasa Tbk (Consumer Discretionary, Multiline Retail) | 377,300 | 21,203 | ||||||||||||||
PT Mitra Keluarga Karyasehat Tbk (Health Care, Health Care Providers & Services) | 254,400 | 44,317 | ||||||||||||||
PT Perusahaan Gas Negara Persero Tbk (Utilities, Gas Utilities) | 463,300 | 42,182 | ||||||||||||||
PT Samudra Tbk (Energy, Energy Equipment & Services) † | 1,288,600 | 8,532 | ||||||||||||||
PT Sumber Alfaria Trijaya Tbk (Consumer Staples, Food & Staples Retailing) | 1,194,600 | 64,528 | ||||||||||||||
PT Summarecon Agung Tbk (Real Estate, Real Estate Management & Development) | 442,200 | 26,236 | ||||||||||||||
PT Surya Citra Media Tbk (Communication Services, Media) | 279,800 | 22,287 | ||||||||||||||
PT Telekomunikasi Indonesia Persero Tbk (Communication Services, Diversified Telecommunication Services) | 2,329,000 | 567,868 | ||||||||||||||
PT Tower Bersama Infrastructure Tbk (Communication Services, Diversified Telecommunication Services) | 482,000 | 37,360 | ||||||||||||||
PT Unilever Indonesia Tbk (Consumer Staples, Household Products) | 269,300 | 129,366 | ||||||||||||||
PT United Tractors Tbk (Energy, Oil, Gas & Consumable Fuels) | 77,100 | 90,492 | ||||||||||||||
The accompanying notes are an integral part of these financial statements.
Wells Fargo Funds | 67
Table of Contents
Portfolio of investments—February 29, 2020
FACTOR ENHANCED EMERGING MARKETS PORTFOLIO
| Shares | Value | |||||||||||||||
| Indonesia (continued) | ||||||||||||||||
PT Waskita Karya Persero Tbk (Industrials, Construction & Engineering) | 241,900 | $ | 16,868 | |||||||||||||
PT Wijaya Karya Persero Tbk (Industrials, Construction & Engineering) | 179,400 | 24,155 | ||||||||||||||
PT XL Axiata Tbk (Communication Services, Wireless Telecommunication Services) † | 167,900 | 30,881 | ||||||||||||||
| 4,382,131 | ||||||||||||||||
|
| |||||||||||||||
| Malaysia: 2.38% | ||||||||||||||||
AFFIN Bank Bhd (Financials, Banks) † | 96,000 | 40,541 | ||||||||||||||
AirAsia Bhd (Industrials, Airlines) | 109,700 | 26,276 | ||||||||||||||
Alliance Financial Group Bhd (Financials, Banks) | 67,500 | 37,259 | ||||||||||||||
AMMB Holdings Bhd (Financials, Banks) | 79,700 | 70,272 | ||||||||||||||
Asiatic Development Bhd (Consumer Staples, Food Products) | 26,900 | 65,580 | ||||||||||||||
Astro Malaysia Holdings Bhd (Communication Services, Media) | 105,400 | 29,919 | ||||||||||||||
Axiata Group Bhd (Communication Services, Wireless Telecommunication Services) | 136,300 | 136,333 | ||||||||||||||
Batu Kawan Bhd (Materials, Chemicals) | 12,900 | 47,499 | ||||||||||||||
Berjaya Sports Toto Bhd (Consumer Discretionary, Hotels, Restaurants & Leisure) | 33,400 | 19,911 | ||||||||||||||
Boustead Holdings Bhd (Industrials, Industrial Conglomerates) † | 124,000 | 23,976 | ||||||||||||||
British American Tobacco Malaysia Bhd (Consumer Staples, Tobacco) | 9,000 | 26,686 | ||||||||||||||
Bursa Malaysia Bhd (Financials, Capital Markets) | 39,200 | 51,471 | ||||||||||||||
Carlsberg Brewery Malaysia Bhd (Consumer Staples, Beverages) | 9,700 | 73,709 | ||||||||||||||
CIMB Group Holdings Bhd (Financials, Banks) | 273,500 | 313,972 | ||||||||||||||
Dialog Group Bhd (Energy, Energy Equipment & Services) | 218,500 | 175,216 | ||||||||||||||
Digi.com Bhd (Communication Services, Wireless Telecommunication Services) | 108,700 | 108,383 | ||||||||||||||
Felda Global Ventures Holdings Bhd (Consumer Staples, Food Products) † | 90,100 | 24,603 | ||||||||||||||
Fraser & Neave Holdings Bhd (Consumer Staples, Beverages) | 8,200 | 60,544 | ||||||||||||||
Gamuda Bhd (Industrials, Construction & Engineering) | 90,200 | 71,310 | ||||||||||||||
Genting Bhd (Consumer Discretionary, Hotels, Restaurants & Leisure) | 113,400 | 133,692 | ||||||||||||||
Genting Malaysia Bhd (Consumer Discretionary, Hotels, Restaurants & Leisure) | 156,900 | 108,156 | ||||||||||||||
HAP Seng Consolidated Bhd (Industrials, Industrial Conglomerates) | 36,200 | 76,952 | ||||||||||||||
Hartalega Holdings Bhd (Health Care, Health Care Equipment & Supplies) | 83,000 | 122,088 | ||||||||||||||
Heineken Malaysia Bhd (Consumer Staples, Beverages) | 9,800 | 59,288 | ||||||||||||||
Hong Leong Financial Group Bhd (Financials, Banks) | 19,500 | 70,783 | ||||||||||||||
IGB REIT Bhd (Real Estate, Equity REITs) | 114,400 | 53,197 | ||||||||||||||
IHH Healthcare Bhd (Health Care, Health Care Providers & Services) | 129,500 | 177,700 | ||||||||||||||
IJM Corporation Bhd (Industrials, Construction & Engineering) | 117,000 | 54,569 | ||||||||||||||
Inari Amertron Bhd (Information Technology, Electronic Equipment, Instruments & Components) | 130,400 | 44,633 | ||||||||||||||
IOI Corporation Bhd (Consumer Staples, Food Products) | 117,400 | 116,943 | ||||||||||||||
IOI Properties Group Bhd (Real Estate, Real Estate Management & Development) | 93,500 | 22,595 | ||||||||||||||
Kossan Rubber Industries Bhd (Health Care, Health Care Equipment & Supplies) | 31,900 | 36,479 | ||||||||||||||
Kuala Lumpur Kepong Bhd (Consumer Staples, Food Products) | 21,000 | 109,969 | ||||||||||||||
LPI Capital Bhd (Financials, Insurance) | 14,100 | 48,523 | ||||||||||||||
Magnum Bhd (Consumer Discretionary, Hotels, Restaurants & Leisure) | 53,000 | 30,304 | ||||||||||||||
Malaysia Airports Holdings Bhd (Industrials, Transportation Infrastructure) | 52,100 | 81,963 | ||||||||||||||
Malaysia Building Society Bhd (Financials, Thrifts & Mortgage Finance) | 172,700 | 31,620 | ||||||||||||||
Malaysian Resources Corporation Bhd (Industrials, Construction & Engineering) | 114,800 | 15,629 | ||||||||||||||
Maxis Bhd (Communication Services, Wireless Telecommunication Services) | 58,900 | 76,772 | ||||||||||||||
MISC Bhd (Industrials, Marine) | 56,200 | 102,321 | ||||||||||||||
MyEG Services Bhd (Information Technology, IT Services) | 141,600 | 38,011 | ||||||||||||||
Nestle Malaysia Bhd (Consumer Staples, Food Products) | 3,600 | 123,011 | ||||||||||||||
Oriental Holdings Bhd (Consumer Discretionary, Automobiles) | 29,100 | 43,469 | ||||||||||||||
Petronas Chemicals Group Bhd (Materials, Chemicals) | 115,600 | 149,150 | ||||||||||||||
Petronas Dagangan Bhd (Energy, Oil, Gas & Consumable Fuels) | 14,200 | 77,278 | ||||||||||||||
PPB Group Bhd (Consumer Staples, Food Products) | 33,700 | 146,611 | ||||||||||||||
Press Metal Bhd (Materials, Metals & Mining) | 113,200 | 126,939 | ||||||||||||||
Ql Resources Bhd (Consumer Staples, Food Products) | 45,560 | 88,202 | ||||||||||||||
RHB Capital Bhd (Financials, Banks) | 89,400 | 117,715 | ||||||||||||||
The accompanying notes are an integral part of these financial statements.
68 | Wells Fargo Funds
Table of Contents
Portfolio of investments—February 29, 2020
FACTOR ENHANCED EMERGING MARKETS PORTFOLIO
| Shares | Value | |||||||||||||||
| Malaysia (continued) | ||||||||||||||||
Sapurakencana Petroleum Bhd (Energy, Energy Equipment & Services) | 370,900 | $ | 16,635 | |||||||||||||
Scientex Bhd (Materials, Chemicals) | 21,000 | 44,840 | ||||||||||||||
Serba Dinamik Holdings Bhd (Energy, Energy Equipment & Services) | 37,650 | 19,865 | ||||||||||||||
Sime Darby Bhd (Industrials, Industrial Conglomerates) | 169,600 | 81,097 | ||||||||||||||
Sime Darby Plantation Bhd (Consumer Staples, Food Products) | 113,600 | 134,850 | ||||||||||||||
Sime Darby Property Bhd (Real Estate, Real Estate Management & Development) | 167,100 | 31,015 | ||||||||||||||
SP Setia Bhd (Real Estate, Real Estate Management & Development) | 85,500 | 25,937 | ||||||||||||||
Sunway Bhd (Real Estate, Real Estate Management & Development) | 138,650 | 58,390 | ||||||||||||||
Sunway REIT Bhd (Real Estate, Equity REITs) | 88,800 | 40,116 | ||||||||||||||
Telecom Malaysia Bhd (Communication Services, Diversified Telecommunication Services) | 67,600 | 59,697 | ||||||||||||||
Tenaga Nasional Bhd (Utilities, Electric Utilities) | 120,100 | 346,877 | ||||||||||||||
TIME dotCom Bhd (Communication Services, Diversified Telecommunication Services) | 21,100 | 46,779 | ||||||||||||||
Top Glove Corporation Bhd (Health Care, Health Care Equipment & Supplies) | 77,900 | 104,518 | ||||||||||||||
UMW Holdings Bhd (Consumer Discretionary, Automobiles) | 25,000 | 19,014 | ||||||||||||||
United Plantations Bhd (Consumer Staples, Food Products) | 8,400 | 52,293 | ||||||||||||||
VS Industry Bhd (Information Technology, Electronic Equipment, Instruments & Components) | 78,275 | 24,193 | ||||||||||||||
Westports Holdings Bhd (Industrials, Transportation Infrastructure) | 48,900 | 40,358 | ||||||||||||||
Yinson Holdings Bhd (Energy, Energy Equipment & Services) | 34,300 | 58,082 | ||||||||||||||
YTL Corporation Bhd (Utilities, Multi-Utilities) | 244,462 | 49,111 | ||||||||||||||
YTL Power International Bhd (Utilities, Multi-Utilities) | 143,200 | 23,192 | ||||||||||||||
| 5,164,881 | ||||||||||||||||
|
| |||||||||||||||
| Mexico: 3.38% | ||||||||||||||||
Alpek SAB de CV (Materials, Chemicals) | 14,000 | 9,503 | ||||||||||||||
Alsea SAB de CV (Consumer Discretionary, Hotels, Restaurants & Leisure) † | 25,774 | 52,417 | ||||||||||||||
America Movil SAB de CV Series L (Communication Services, Wireless Telecommunication Services) | 1,302,223 | 1,030,108 | ||||||||||||||
Arca Continental SAB de CV (Consumer Staples, Beverages) | 24,267 | 133,769 | ||||||||||||||
Banco del Bajio SA (Financials, Banks) 144A | 49,200 | 77,038 | ||||||||||||||
Banco Santander Mexico SA (Financials, Banks) | 82,778 | 106,232 | ||||||||||||||
Becle SAB de CV ADR (Consumer Staples, Beverages) | 29,500 | 44,648 | ||||||||||||||
Cemex SAB de CV ADR (Materials, Construction Materials) | 76,722 | 251,648 | ||||||||||||||
CFE Capital S de RL de CV (Utilities, Electric Utilities) | 39,547 | 50,330 | ||||||||||||||
Coca-Cola Femsa SAB de CV (Consumer Staples, Beverages) | 27,528 | 154,066 | ||||||||||||||
Controladora Vuela Compania de Aviacion SAB de CV Class A (Industrials, Airlines) † | 41,700 | 42,901 | ||||||||||||||
Corporacion Inmobiliaria Vesta SAB de CV (Real Estate, Real Estate Management & Development) | 31,200 | 49,599 | ||||||||||||||
El Puerto de Liverpool SAB de CV (Consumer Discretionary, Multiline Retail) | 10,533 | 49,767 | ||||||||||||||
Fibra Uno Administracion SAB de CV (Real Estate, Equity REITs) | 196,953 | 298,286 | ||||||||||||||
Fomento Economico Mexicano SAB de CV (Consumer Staples, Beverages) | 107,428 | 875,994 | ||||||||||||||
Genomma Lab Internacional SAB de CV Class B (Health Care, Pharmaceuticals) † | 58,493 | 60,029 | ||||||||||||||
Gentera SAB de CV (Financials, Consumer Finance) | 56,248 | 54,125 | ||||||||||||||
GMexico Transportes SAB de CV (Industrials, Road & Rail) 144A | 27,600 | 37,776 | ||||||||||||||
Gruma SAB de CV Class B (Consumer Staples, Food Products) | 11,295 | 109,013 | ||||||||||||||
Grupo Aeroportuario del Centro Norte SAB de CV (Industrials, Transportation Infrastructure) | 17,510 | 114,625 | ||||||||||||||
Grupo Aeroportuario del Pacifico SAB de CV Class B (Industrials, Transportation Infrastructure) | 19,615 | 212,264 | ||||||||||||||
Grupo Aeroportuario del Sureste SAB de CV Class B (Industrials, Transportation Infrastructure) | 8,665 | 144,285 | ||||||||||||||
Grupo Carso SAB de CV (Industrials, Industrial Conglomerates) | 21,701 | 60,485 | ||||||||||||||
Grupo Cementos de Chihuahua SAB de CV (Materials, Construction Materials) | 8,800 | 43,667 | ||||||||||||||
Grupo Comercial Chedraui SAB de CV (Consumer Staples, Food & Staples Retailing) | 15,044 | 20,636 | ||||||||||||||
Grupo Elektra SAB de CV (Financials, Banks) | 3,199 | 216,160 | ||||||||||||||
Grupo Financiero Banorte SAB de CV (Financials, Banks) | 140,400 | 767,660 | ||||||||||||||
Grupo Financiero Inbursa SAB de CV (Financials, Banks) | 103,300 | 112,049 | ||||||||||||||
Grupo Lala SAB de CV (Consumer Staples, Food Products) | 31,267 | 23,224 | ||||||||||||||
Grupo Mexico SAB de CV Series B (Materials, Metals & Mining) | 152,500 | 360,350 | ||||||||||||||
Grupo Televisa SAB ADR (Communication Services, Media) | 26,679 | 250,783 | ||||||||||||||
Industrias Bachoco SAB de CV Series B (Consumer Staples, Food Products) | 9,555 | 34,501 | ||||||||||||||
The accompanying notes are an integral part of these financial statements.
Wells Fargo Funds | 69
Table of Contents
Portfolio of investments—February 29, 2020
FACTOR ENHANCED EMERGING MARKETS PORTFOLIO
| Shares | Value | |||||||||||||||
| Mexico (continued) | ||||||||||||||||
Industrias CH SAB de CV Series B (Materials, Metals & Mining) † | 7,200 | $ | 30,734 | |||||||||||||
Industrias Penoles SAB de CV (Materials, Metals & Mining) | 5,493 | 49,407 | ||||||||||||||
Infraestructura Energetica Nova SAB de CV (Utilities, Gas Utilities) | 24,500 | 107,545 | ||||||||||||||
Macquarie Mexico Real Estate Management SA de CV (Real Estate, Equity REITs) 144A | 39,805 | 52,256 | ||||||||||||||
Nemak SAB de CV (Consumer Discretionary, Auto Components) | 151,800 | 50,130 | ||||||||||||||
Orbia Advance Corporation SAB de CV (Materials, Chemicals) | 46,524 | 91,592 | ||||||||||||||
PLA Administradora Industrial S de RL de CV (Real Estate, Equity REITs) | 40,504 | 61,714 | ||||||||||||||
Prologis Property Mexico SA de CV (Real Estate, Equity REITs) | 19,094 | 40,278 | ||||||||||||||
Promotora y Operadora de Infraestructura SAB de CV (Industrials, Transportation Infrastructure) | 10,884 | 106,634 | ||||||||||||||
Regional SAB de CV (Financials, Banks) | 11,900 | 66,202 | ||||||||||||||
Telesites SAB de CV (Communication Services, Diversified Telecommunication Services) † | 168,200 | 127,925 | ||||||||||||||
Walmart de Mexico SAB de CV (Consumer Staples, Food & Staples Retailing) | 248,939 | 700,793 | ||||||||||||||
| 7,333,148 | ||||||||||||||||
|
| |||||||||||||||
| Netherlands: 0.08% | ||||||||||||||||
X5 Retail Group NV GDR (Consumer Staples, Food & Staples Retailing) | 5,665 | 177,437 | ||||||||||||||
|
| |||||||||||||||
| Philippines: 1.93% | ||||||||||||||||
Aboitiz Equity Ventures Incorporated (Industrials, Industrial Conglomerates) | 126,400 | 106,325 | ||||||||||||||
Aboitiz Power Corporation (Utilities, Independent Power & Renewable Electricity Producers) | 77,000 | 41,540 | ||||||||||||||
Alliance Global Group Incorporated (Industrials, Industrial Conglomerates) † | 308,400 | 60,742 | ||||||||||||||
Altus San Nicolas Corporation (Consumer Discretionary, Hotels, Restaurants & Leisure) (a)†‡ | 1,637 | 167 | ||||||||||||||
Ayala Corporation (Industrials, Industrial Conglomerates) | 15,220 | 198,413 | ||||||||||||||
Ayala Land Incorporated (Real Estate, Real Estate Management & Development) | 415,910 | 320,309 | ||||||||||||||
Bank of the Philippine Islands (Financials, Banks) | 100,950 | 146,746 | ||||||||||||||
BDO Unibank Incorporated (Financials, Banks) | 118,830 | 324,938 | ||||||||||||||
Bloomberry Resorts Corporation (Consumer Discretionary, Hotels, Restaurants & Leisure) | 210,100 | 33,662 | ||||||||||||||
China Banking Corporation (Financials, Banks) | 149,603 | 72,826 | ||||||||||||||
Cosco Capital Incorporated (Consumer Staples, Food & Staples Retailing) | 261,087 | 31,960 | ||||||||||||||
D&L Industries Incorporated (Materials, Chemicals) | 149,400 | 21,161 | ||||||||||||||
DMCI Holdings Incorporated (Industrials, Industrial Conglomerates) | 219,300 | 22,801 | ||||||||||||||
Energy Development Corporation (Utilities, Independent Power & Renewable Electricity Producers) †(a)‡ | 231,800 | 31,240 | ||||||||||||||
First Gen Corporation (Utilities, Independent Power & Renewable Electricity Producers) | 60,100 | 21,717 | ||||||||||||||
Globe Telecom Incorporated (Communication Services, Wireless Telecommunication Services) | 1,475 | 51,477 | ||||||||||||||
Golden Bria Holdings Incorporated (Consumer Discretionary, Diversified Consumer Services) † | 4,490 | 36,114 | ||||||||||||||
GT Capital Holdings Incorporated (Industrials, Industrial Conglomerates) | 4,993 | 69,885 | ||||||||||||||
International Container Term Services Incorporated (Industrials, Transportation Infrastructure) | 87,300 | 183,500 | ||||||||||||||
JG Summit Holdings (Industrials, Industrial Conglomerates) | 255,660 | 339,874 | ||||||||||||||
Jollibee Foods Corporation (Consumer Discretionary, Hotels, Restaurants & Leisure) | 37,080 | 123,989 | ||||||||||||||
MacroAsia Corporation (Industrials, Transportation Infrastructure) | 96,200 | 15,979 | ||||||||||||||
Manila Electric Company (Utilities, Electric Utilities) | 15,390 | 81,456 | ||||||||||||||
Manila Water Company (Utilities, Water Utilities) | 66,600 | 15,365 | ||||||||||||||
Megaworld Corporation (Real Estate, Real Estate Management & Development) | 725,400 | 48,578 | ||||||||||||||
Metro Pacific Investments Corporation (Financials, Diversified Financial Services) | 668,100 | 40,237 | ||||||||||||||
Metropolitan Bank & Trust Company (Financials, Banks) | 134,177 | 147,977 | ||||||||||||||
Philippine National Bank (Financials, Banks) † | 81,720 | 46,892 | ||||||||||||||
Philippine Seven Corporation (Consumer Staples, Food & Staples Retailing) | 17,993 | 53,653 | ||||||||||||||
Pilipinas Shell Petroleum Corporation (Energy, Oil, Gas & Consumable Fuels) | 3,130 | 1,600 | ||||||||||||||
PLDT Incorporated (Communication Services, Wireless Telecommunication Services) | 5,750 | 111,802 | ||||||||||||||
Puregold Price Club Incorporated (Consumer Staples, Food & Staples Retailing) | 63,510 | 46,132 | ||||||||||||||
Rizal Commercial Banking (Financials, Banks) | 82,600 | 32,031 | ||||||||||||||
Robinsons Land Company (Real Estate, Real Estate Management & Development) | 109,400 | 45,713 | ||||||||||||||
Robinsons Retail Holdings Incorporated (Consumer Staples, Food & Staples Retailing) | 33,000 | 43,357 | ||||||||||||||
San Miguel Corporation (Industrials, Industrial Conglomerates) | 23,750 | 58,729 | ||||||||||||||
The accompanying notes are an integral part of these financial statements.
70 | Wells Fargo Funds
Table of Contents
Portfolio of investments—February 29, 2020
FACTOR ENHANCED EMERGING MARKETS PORTFOLIO
| Shares | Value | |||||||||||||||
| Philippines (continued) | ||||||||||||||||
San Miguel Food & Beverage Incorporated (Consumer Staples, Food Products) | 111,620 | $ | 159,848 | |||||||||||||
Security Bank Corporation (Financials, Banks) | 31,550 | 95,910 | ||||||||||||||
Semirara Mining & Power Corporation (Energy, Oil, Gas & Consumable Fuels) | 86,500 | 32,917 | ||||||||||||||
SM Investments Corporation (Industrials, Industrial Conglomerates) | 34,075 | 652,936 | ||||||||||||||
Universal Robina Corporation (Consumer Staples, Food Products) | 53,590 | 148,549 | ||||||||||||||
Vista Land & Lifescapes Incorporated (Real Estate, Real Estate Management & Development) | 326,200 | 40,347 | ||||||||||||||
Wilcon Depot Incorporated (Consumer Discretionary, Specialty Retail) | 102,200 | 36,289 | ||||||||||||||
| 4,195,683 | ||||||||||||||||
|
| |||||||||||||||
| Romania: 0.06% | ||||||||||||||||
NEPI Rockcastle plc (Real Estate, Real Estate Management & Development) | 17,760 | 131,464 | ||||||||||||||
|
| |||||||||||||||
| Russia: 6.45% | ||||||||||||||||
Aeroflot PJSC (Industrials, Airlines) | 27,218 | 38,635 | ||||||||||||||
Alrosa PJSC (Materials, Metals & Mining) | 155,200 | 165,513 | ||||||||||||||
Credit Bank of Moscow PJSC (Financials, Banks) | 575,700 | 47,935 | ||||||||||||||
Federal Grid Company Unified Energy System PJSC (Utilities, Electric Utilities) | 15,060,000 | 45,454 | ||||||||||||||
Gazprom Neft PJSC (Energy, Oil, Gas & Consumable Fuels) | 20,435 | 123,699 | ||||||||||||||
Gazprom PJSC (Energy, Oil, Gas & Consumable Fuels) | 628,070 | 1,917,214 | ||||||||||||||
Inter Rao Ues PJSC (Utilities, Electric Utilities) | 1,703,002 | 134,273 | ||||||||||||||
LSR Group PJSC (Real Estate, Real Estate Management & Development) | 844 | 10,539 | ||||||||||||||
Lukoil PJSC (Energy, Oil, Gas & Consumable Fuels) | 31,117 | 2,667,768 | ||||||||||||||
Magnit PJSC (Consumer Staples, Food & Staples Retailing) | 5,117 | 245,607 | ||||||||||||||
Magnitogorsk Iron & Steel Works PJSC (Materials, Metals & Mining) | 105,900 | 64,473 | ||||||||||||||
MMC Norilsk Nickel PJSC (Materials, Metals & Mining) | 3,217 | 983,886 | ||||||||||||||
Mobile TeleSystems PJSC (Communication Services, Wireless Telecommunication Services) | 46,104 | 224,731 | ||||||||||||||
Moscow ExchangeMICEX-RTS PJSC (Financials, Capital Markets) | 84,290 | 126,792 | ||||||||||||||
Nizhnekamskneftekhim PJSC (Materials, Chemicals) | 43,582 | 63,390 | ||||||||||||||
Novatek PJSC (Energy, Oil, Gas & Consumable Fuels) | 91,416 | 1,339,109 | ||||||||||||||
Novolipetsk Steel PJSC (Materials, Metals & Mining) | 66,600 | 124,867 | ||||||||||||||
Novorossiysk Commercial Sea Port PJSC (Industrials, Transportation Infrastructure) | 219,900 | 28,697 | ||||||||||||||
PhosAgro PJSC (Materials, Chemicals) | 2,733 | 93,705 | ||||||||||||||
PIK Group PJSC (Real Estate, Real Estate Management & Development) | 15,859 | 93,142 | ||||||||||||||
Polyus PJSC (Materials, Metals & Mining) | 1,337 | 166,385 | ||||||||||||||
Rosgosstrakh PJSC (Financials, Insurance) † | 11,193,000 | 29,459 | ||||||||||||||
Rosneft Oil Company PJSC (Energy, Oil, Gas & Consumable Fuels) | 171,760 | 1,048,455 | ||||||||||||||
Rostelecom PJSC (Communication Services, Diversified Telecommunication Services) | 43,760 | 57,414 | ||||||||||||||
Rushydro PJSC (Utilities, Electric Utilities) | 8,440,000 | 81,771 | ||||||||||||||
RussNeft PJSC (Energy, Oil, Gas & Consumable Fuels) † | 6,600 | 52,191 | ||||||||||||||
Safmar Financial Investment PJSC (Financials, Consumer Finance) | 3,840 | 29,608 | ||||||||||||||
Sberbank of Russia PJSC (Financials, Banks) | 516,830 | 1,825,641 | ||||||||||||||
Severstal PJSC (Materials, Metals & Mining) | 11,369 | 140,907 | ||||||||||||||
Sistema PJSFC (Communication Services, Wireless Telecommunication Services) | 206,100 | 50,264 | ||||||||||||||
Surgutneftegas PJSC (Energy, Oil, Gas & Consumable Fuels) | 1,725,000 | 1,001,498 | ||||||||||||||
Tatneft PJSC (Energy, Oil, Gas & Consumable Fuels) | 77,597 | 784,051 | ||||||||||||||
United Wagon PJSC (Industrials, Road & Rail) † | 4,134 | 17,946 | ||||||||||||||
VTB Bank PJSC (Financials, Banks) | 254,050,000 | 164,910 | ||||||||||||||
| 13,989,929 | ||||||||||||||||
|
| |||||||||||||||
| South Africa: 3.20% | ||||||||||||||||
Absa Group Limited (Financials, Banks) | 35,606 | 306,412 | ||||||||||||||
ADvTECH Limited (Consumer Discretionary, Diversified Consumer Services) | 18,783 | 11,149 | ||||||||||||||
AECI Limited (Materials, Chemicals) | 4,756 | 31,771 | ||||||||||||||
African Rainbow Minerals Limited (Materials, Metals & Mining) | 4,566 | 41,145 | ||||||||||||||
Anglo American Platinum Limited (Materials, Metals & Mining) | 2,995 | 201,076 | ||||||||||||||
The accompanying notes are an integral part of these financial statements.
Wells Fargo Funds | 71
Table of Contents
Portfolio of investments—February 29, 2020
FACTOR ENHANCED EMERGING MARKETS PORTFOLIO
| Shares | Value | |||||||||||||||
| South Africa (continued) | ||||||||||||||||
Anglogold Ashanti Limited (Materials, Metals & Mining) | 19,844 | $ | 353,387 | |||||||||||||
Aspen Pharmacare Holdings Limited (Health Care, Pharmaceuticals) † | 18,195 | 117,076 | ||||||||||||||
Assore Limited (Materials, Metals & Mining) | 1,572 | 17,854 | ||||||||||||||
Astral Foods Limited (Consumer Staples, Food Products) | 1,994 | 23,992 | ||||||||||||||
Attacq Limited (Real Estate, Equity REITs) | 37,062 | 21,976 | ||||||||||||||
Avi Limited (Consumer Staples, Food Products) | 14,840 | 69,444 | ||||||||||||||
Barloworld Limited (Industrials, Trading Companies & Distributors) | 10,049 | 52,274 | ||||||||||||||
Bid Corporation Limited (Consumer Staples, Food & Staples Retailing) | 14,751 | 266,913 | ||||||||||||||
Capitec Bank Holdings Limited (Financials, Banks) | 3,863 | 326,983 | ||||||||||||||
Clicks Group Limited (Consumer Staples, Food & Staples Retailing) | 11,760 | 177,829 | ||||||||||||||
Coronation Fund Managers Limited (Financials, Capital Markets) | 9,213 | 23,597 | ||||||||||||||
Dis-Chem Pharmacies Limited (Consumer Staples, Food & Staples Retailing) | 16,643 | 23,065 | ||||||||||||||
Distell Group Holdings Limited (Consumer Staples, Beverages) | 8,686 | 55,401 | ||||||||||||||
Equites Property Fund Limited (Real Estate, Equity REITs) | 27,894 | 30,880 | ||||||||||||||
Exxaro Resources Limited (Energy, Oil, Gas & Consumable Fuels) | 11,423 | 82,755 | ||||||||||||||
Fortress REIT Limited (Real Estate, Equity REITs) | 61,659 | 63,833 | ||||||||||||||
Foschini Limited (Consumer Discretionary, Specialty Retail) | 10,673 | 85,336 | ||||||||||||||
Gold Fields Limited (Materials, Metals & Mining) | 39,642 | 241,094 | ||||||||||||||
Growthpoint Properties Limited (Real Estate, Equity REITs) | 136,725 | 156,653 | ||||||||||||||
Harmony Gold Mining Company Limited (Materials, Metals & Mining) † | 21,327 | 75,088 | ||||||||||||||
Hyprop Investments Limited (Real Estate, Equity REITs) | 11,646 | 33,781 | ||||||||||||||
Impala Platinum Holdings Limited (Materials, Metals & Mining) † | 33,384 | 271,351 | ||||||||||||||
Imperial Holdings Limited (Consumer Discretionary, Distributors) | 8,006 | 23,751 | ||||||||||||||
Investec Limited (Financials, Capital Markets) | 13,328 | 69,523 | ||||||||||||||
Italtile Limited (Consumer Discretionary, Specialty Retail) | 34,836 | 26,417 | ||||||||||||||
JSE Limited (Financials, Capital Markets) | 4,004 | 25,667 | ||||||||||||||
KAP Industrial Holdings Limited (Industrials, Industrial Conglomerates) | 117,965 | 22,081 | ||||||||||||||
Kumba Iron Ore Limited (Materials, Metals & Mining) | 2,823 | 52,023 | ||||||||||||||
Liberty Holdings Limited (Financials, Insurance) | 5,465 | 32,829 | ||||||||||||||
Life Healthcare Group Holdings Limited (Health Care, Health Care Providers & Services) | 61,169 | 87,440 | ||||||||||||||
Momentum Metropolitan Holdings Limited (Financials, Insurance) | 40,844 | 46,604 | ||||||||||||||
Motus Holdings Limited (Consumer Discretionary, Specialty Retail) | 8,494 | 39,796 | ||||||||||||||
Mr Price Group Limited (Consumer Discretionary, Specialty Retail) | 11,791 | 115,809 | ||||||||||||||
MTN Group Limited (Communication Services, Wireless Telecommunication Services) | 64,301 | 306,554 | ||||||||||||||
MultiChoice Group Limited (Communication Services, Media) † | 20,596 | 119,378 | ||||||||||||||
Nedbank Group Limited (Financials, Banks) | 17,498 | 200,041 | ||||||||||||||
Netcare Limited (Health Care, Health Care Providers & Services) | 58,519 | 68,647 | ||||||||||||||
Northam Platinum Limited (Materials, Metals & Mining) † | 21,552 | 153,641 | ||||||||||||||
Pick’n Pay Stores Limited (Consumer Staples, Food & Staples Retailing) | 16,137 | 58,347 | ||||||||||||||
Pioneer Foods Group Limited (Consumer Staples, Food Products) | 7,421 | 51,838 | ||||||||||||||
PSG Group Limited (Financials, Diversified Financial Services) | 8,772 | 106,543 | ||||||||||||||
Redefine Properties Limited (Real Estate, Equity REITs) | 264,246 | 91,978 | ||||||||||||||
Remgro Limited (Financials, Diversified Financial Services) | 23,996 | 249,596 | ||||||||||||||
Resilient REIT Limited (Real Estate, Equity REITs) | 15,911 | 59,821 | ||||||||||||||
Reunert Limited (Industrials, Industrial Conglomerates) | 7,828 | 28,461 | ||||||||||||||
RMB Holdings Limited (Financials, Diversified Financial Services) | 34,674 | 158,733 | ||||||||||||||
SA Corporate Real Estate Limited REIT (Real Estate, Equity REITs) | 106,842 | 14,246 | ||||||||||||||
Santam Limited (Financials, Insurance) | 1,864 | 30,480 | ||||||||||||||
Sappi Limited (Materials, Paper & Forest Products) † | 25,770 | 48,203 | ||||||||||||||
Shoprite Holdings Limited (Consumer Staples, Food & Staples Retailing) | 25,029 | 182,309 | ||||||||||||||
SPAR Group Limited (Consumer Staples, Food & Staples Retailing) | 8,091 | 86,911 | ||||||||||||||
Standard Bank Group Limited (Financials, Banks) | 58,663 | 563,883 | ||||||||||||||
Super Group Limited (Consumer Staples, Food & Staples Retailing) † | 18,694 | 25,536 | ||||||||||||||
Telkom SA SOC Limited (Communication Services, Diversified Telecommunication Services) | 14,851 | 25,264 | ||||||||||||||
The Bidvest Group Limited (Industrials, Industrial Conglomerates) | 14,326 | 166,991 | ||||||||||||||
The accompanying notes are an integral part of these financial statements.
72 | Wells Fargo Funds
Table of Contents
Portfolio of investments—February 29, 2020
FACTOR ENHANCED EMERGING MARKETS PORTFOLIO
| Shares | Value | |||||||||||||||
| South Africa (continued) | ||||||||||||||||
Tiger Brands Limited (Consumer Staples, Food Products) | 8,859 | $ | 85,983 | |||||||||||||
Tsogo Sun Gaming Limited (Consumer Discretionary, Hotels, Restaurants & Leisure) | 19,872 | 12,125 | ||||||||||||||
Vodacom Group Limited (Communication Services, Wireless Telecommunication Services) | 23,792 | 170,119 | ||||||||||||||
Vukile Property Fund Limited REIT (Real Estate, Equity REITs) | 46,355 | 43,562 | ||||||||||||||
Wilson Bayly Holmes Ovcon Limited (Industrials, Construction & Engineering) | 2,739 | 17,343 | ||||||||||||||
Woolworths Holdings Limited (Consumer Discretionary, Multiline Retail) | 48,352 | 113,838 | ||||||||||||||
| 6,944,426 | ||||||||||||||||
|
| |||||||||||||||
| South Korea: 11.23% | ||||||||||||||||
AfreecaTV Company Limited (Communication Services, Interactive Media & Services) | 510 | 23,230 | ||||||||||||||
Alteogen Incorporated (Health Care, Biotechnology) † | 554 | 40,126 | ||||||||||||||
Amorepacific Corporation (Consumer Staples, Personal Products) | 1,515 | 200,677 | ||||||||||||||
Amorepacific Group (Consumer Staples, Personal Products) | 1,958 | 100,250 | ||||||||||||||
Ananti Incorporated (Consumer Discretionary, Hotels, Restaurants & Leisure) † | 2,914 | 16,632 | ||||||||||||||
Asiana Airlines (Industrials, Airlines) † | 6,615 | 22,806 | ||||||||||||||
BGF Retail Company Limited (Consumer Staples, Food & Staples Retailing) | 504 | 62,870 | ||||||||||||||
BH Company Limited (Information Technology, Electronic Equipment, Instruments & Components) † | 1,133 | 16,929 | ||||||||||||||
BNK Financial Group Incorporated (Financials, Banks) | 16,042 | 81,359 | ||||||||||||||
Bukwang Pharmaceutical Company (Health Care, Pharmaceuticals) | 2,857 | 29,931 | ||||||||||||||
Celltrion Incorporated (Health Care, Pharmaceuticals) † | 4,931 | 703,461 | ||||||||||||||
Chabiotech Company Limited (Health Care, Health Care Providers & Services) † | 2,572 | 26,463 | ||||||||||||||
Cheil Worldwide Incorporated (Communication Services, Media) | 4,765 | 75,821 | ||||||||||||||
Chong Kun Dang Pharmaceutical Corporation (Health Care, Pharmaceuticals) | 469 | 33,522 | ||||||||||||||
CJ CGV Company Limited (Communication Services, Entertainment) | 768 | 15,217 | ||||||||||||||
CJ Cheiljedang Corporation (Consumer Staples, Food Products) | 483 | 97,039 | ||||||||||||||
CJ Corporation (Industrials, Industrial Conglomerates) | 922 | 61,410 | ||||||||||||||
CJ ENM Company Limited (Consumer Discretionary, Internet & Direct Marketing Retail) | 689 | 72,021 | ||||||||||||||
CJ Korea Express Corporation (Industrials, Road & Rail) † | 768 | 85,080 | ||||||||||||||
Com2us Corporation (Communication Services, Entertainment) | 540 | 43,976 | ||||||||||||||
Cosmax Incorporated (Consumer Staples, Personal Products) | 375 | 23,273 | ||||||||||||||
Coway Company Limited (Consumer Discretionary, Household Durables) | 2,549 | 145,292 | ||||||||||||||
CrystalGenomics Incorporated (Health Care, Biotechnology) † | 2,307 | 20,761 | ||||||||||||||
Daeduck Electronics Company Limited (Information Technology, Electronic Equipment, Instruments & Components) | 3,363 | 26,251 | ||||||||||||||
Daelim Industrial Company Limited (Industrials, Construction & Engineering) | 1,562 | 94,080 | ||||||||||||||
Daesang Corporation (Consumer Staples, Food Products) | 1,399 | 22,808 | ||||||||||||||
Daewoo Engineering & Construction Company Limited (Industrials, Construction & Engineering) † | 10,976 | 37,137 | ||||||||||||||
Daewoo Shipbuilding & Marine Engineering Company Limited (Industrials, Machinery) † | 1,877 | 34,658 | ||||||||||||||
Daewoong Company Limited (Health Care, Pharmaceuticals) | 2,387 | 20,101 | ||||||||||||||
Daewoong Pharmaceutical Company (Health Care, Pharmaceuticals) | 323 | 28,133 | ||||||||||||||
Daishin Securities Company Limited (Financials, Capital Markets) | 2,094 | 16,389 | ||||||||||||||
Daou Technology Incorporated (Financials, Capital Markets) | 1,774 | 23,571 | ||||||||||||||
DB HiTek Company Limited (Information Technology, Semiconductors & Semiconductor Equipment) | 1,984 | 40,185 | ||||||||||||||
Dentium Company Limited (Health Care, Health Care Equipment & Supplies) | 578 | 20,282 | ||||||||||||||
DGB Financial Group Incorporated (Financials, Banks) | 8,636 | 40,117 | ||||||||||||||
Dong-A ST Company Limited (Health Care, Pharmaceuticals) | 363 | 26,594 | ||||||||||||||
Dongbu Insurance Company Limited (Financials, Insurance) | 3,144 | 112,257 | ||||||||||||||
Dongsuh Company Incorporated (Consumer Staples, Food & Staples Retailing) | 2,507 | 32,189 | ||||||||||||||
Doosan Bobcat Incorporated (Industrials, Machinery) | 2,763 | 64,701 | ||||||||||||||
Doosan Corporation (Industrials, Industrial Conglomerates) | 1 | 46 | ||||||||||||||
Doosan Heavy Industries & Construction Company Limited (Industrials, Electrical Equipment) † | 5,565 | 23,240 | ||||||||||||||
Doosan Infracore Company Limited (Industrials, Machinery) † | 6,830 | 23,875 | ||||||||||||||
DoubleUGames Company Limited (Consumer Discretionary, Hotels, Restaurants & Leisure) | 499 | 16,953 | ||||||||||||||
Douzone Bizon Company Limited (Information Technology, Software) | 884 | 63,646 | ||||||||||||||
E-MART Incorporated (Consumer Staples, Food & Staples Retailing) | 993 | 86,728 | ||||||||||||||
The accompanying notes are an integral part of these financial statements.
Wells Fargo Funds | 73
Table of Contents
Portfolio of investments—February 29, 2020
FACTOR ENHANCED EMERGING MARKETS PORTFOLIO
| Shares | Value | |||||||||||||||
| South Korea (continued) | ||||||||||||||||
EO Technics Company Limited (Information Technology, Semiconductors & Semiconductor Equipment) | 447 | $ | 33,087 | |||||||||||||
F&F Company Limited (Consumer Discretionary, Textiles, Apparel & Luxury Goods) | 425 | 33,174 | ||||||||||||||
Fila Korea Limited (Consumer Discretionary, Textiles, Apparel & Luxury Goods) | 2,701 | 85,922 | ||||||||||||||
G-treeBNT Company Limited (Health Care, Biotechnology) † | 1,174 | 23,363 | ||||||||||||||
Grand Korea Leisure Company Limited (Consumer Discretionary, Hotels, Restaurants & Leisure) | 1,340 | 18,520 | ||||||||||||||
Green Cross Corporation (Health Care, Biotechnology) | 387 | 36,036 | ||||||||||||||
Green Cross Holdings Corporation (Health Care, Biotechnology) | 2,316 | 33,532 | ||||||||||||||
GS Engineering & Construction Corporation (Industrials, Construction & Engineering) | 4,119 | 90,085 | ||||||||||||||
GS Holdings Corporation (Energy, Oil, Gas & Consumable Fuels) | 5,287 | 181,406 | ||||||||||||||
GS Home Shopping Incorporated (Consumer Discretionary, Internet & Direct Marketing Retail) | 310 | 31,825 | ||||||||||||||
GS Retail Company Limited (Consumer Staples, Food & Staples Retailing) | 1,383 | 40,201 | ||||||||||||||
Hana Financial Group Incorporated (Financials, Banks) | 16,458 | 426,206 | ||||||||||||||
Hana Tour Service Incorporated (Consumer Discretionary, Hotels, Restaurants & Leisure) | 532 | 18,223 | ||||||||||||||
Handsome Company Limited (Consumer Discretionary, Textiles, Apparel & Luxury Goods) | 1,011 | 20,609 | ||||||||||||||
Hankook Tire Company Limited (Consumer Discretionary, Auto Components) | 4,564 | 96,050 | ||||||||||||||
Hanon Systems (Consumer Discretionary, Auto Components) | 8,352 | 72,634 | ||||||||||||||
Hansol Chemical Company Limited (Materials, Chemicals) | 475 | 36,743 | ||||||||||||||
Hanssem Company Limited (Consumer Discretionary, Household Durables) | 826 | 43,364 | ||||||||||||||
Hanwha Chem Corporation (Materials, Chemicals) | 5,235 | 78,279 | ||||||||||||||
Hanwha Corporation (Industrials, Industrial Conglomerates) | 3,194 | 53,306 | ||||||||||||||
Hanwha Life Insurance Company Limited (Financials, Insurance) | 18,931 | 25,890 | ||||||||||||||
Hanwha Techwin Company Limited (Industrials, Aerospace & Defense) † | 1,848 | 42,095 | ||||||||||||||
Harim Holdings Company Limited (Consumer Staples, Food Products) | 3,162 | 18,498 | ||||||||||||||
HDC Holdings Company Limited (Industrials, Construction & Engineering) | 2,595 | 19,680 | ||||||||||||||
HDC Hyundai DevelopmentCo-Engineering & Construction (Industrials, Construction & Engineering) | 1,942 | 29,028 | ||||||||||||||
Hite Jinro Company Limited (Consumer Staples, Beverages) | 1,843 | 40,562 | ||||||||||||||
Hotel Shilla Company Limited (Consumer Discretionary, Specialty Retail) | 1,697 | 111,536 | ||||||||||||||
Hugel Incorporated (Health Care, Biotechnology) † | 175 | 54,780 | ||||||||||||||
Hyosung Corporation (Materials, Chemicals) | 607 | 35,351 | ||||||||||||||
Hyundai Department Store Company Limited (Consumer Discretionary, Multiline Retail) | 927 | 53,663 | ||||||||||||||
Hyundai Elevator Company (Industrials, Machinery) | 879 | 39,414 | ||||||||||||||
Hyundai Engineering & Construction Company Limited (Industrials, Construction & Engineering) | 4,143 | 119,791 | ||||||||||||||
Hyundai Glovis Company Limited (Industrials, Air Freight & Logistics) | 1,205 | 122,922 | ||||||||||||||
Hyundai Greenfood Company Limited (Consumer Staples, Food & Staples Retailing) | 3,882 | 27,718 | ||||||||||||||
Hyundai Heavy Industries Company Limited (Industrials, Machinery) | 578 | 128,882 | ||||||||||||||
Hyundai Home Shopping Network Corporation (Consumer Discretionary, Internet & Direct Marketing Retail) | 553 | 33,689 | ||||||||||||||
Hyundai Marine & Fire Insurance Company Limited (Financials, Insurance) | 3,895 | 72,614 | ||||||||||||||
Hyundai Merchant Marine Company Limited (Industrials, Marine) † | 12,150 | 32,779 | ||||||||||||||
Hyundai Mipo Dockyard Company Limited (Industrials, Machinery) | 1,224 | 37,189 | ||||||||||||||
Hyundai Mobis Company (Consumer Discretionary, Auto Components) | 3,645 | 637,105 | ||||||||||||||
Hyundai Motor Company (Consumer Discretionary, Automobiles) | 8,760 | 836,801 | ||||||||||||||
Hyundai Steel Company (Materials, Metals & Mining) | 4,706 | 93,496 | ||||||||||||||
Hyundai Wia Corporation (Consumer Discretionary, Auto Components) | 833 | 26,509 | ||||||||||||||
Industrial Bank of Korea (Financials, Banks) | 14,863 | 117,215 | ||||||||||||||
Innocean Worldwide Incorporated (Communication Services, Media) | 577 | 31,956 | ||||||||||||||
JB Financial Group Company Limited (Financials, Banks) | 7,984 | 33,071 | ||||||||||||||
JYP Entertainment Corporation (Communication Services, Entertainment) | 1,808 | 31,459 | ||||||||||||||
Kakao Corporation (Communication Services, Interactive Media & Services) | 2,727 | 391,165 | ||||||||||||||
Kangwon Land Incorporated (Consumer Discretionary, Hotels, Restaurants & Leisure) | 5,703 | 107,558 | ||||||||||||||
KB Financial Group Incorporated (Financials, Banks) | 22,813 | 721,193 | ||||||||||||||
KCC Corporation (Materials, Chemicals) | 338 | 46,174 | ||||||||||||||
KEPCO Plant Service & Engineering Company Limited (Industrials, Commercial Services & Supplies) | 981 | 26,950 | ||||||||||||||
Kia Motors Corporation (Consumer Discretionary, Automobiles) | 15,152 | 457,209 | ||||||||||||||
The accompanying notes are an integral part of these financial statements.
74 | Wells Fargo Funds
Table of Contents
Portfolio of investments—February 29, 2020
FACTOR ENHANCED EMERGING MARKETS PORTFOLIO
| Shares | Value | |||||||||||||||
| South Korea (continued) | ||||||||||||||||
Kiwoom Securities Company (Financials, Capital Markets) | 558 | $ | 30,603 | |||||||||||||
KMW Company Limited (Information Technology, Communications Equipment) † | 1,342 | 55,820 | ||||||||||||||
Koh Young Technology Incorporated (Information Technology, Semiconductors & Semiconductor Equipment) | 563 | 44,841 | ||||||||||||||
Kolmar Korea Company Limited (Consumer Staples, Personal Products) | 636 | 21,383 | ||||||||||||||
Kolon Industries Incorporated (Materials, Chemicals) | 900 | 25,069 | ||||||||||||||
Korea Aerospace Industries Limited (Industrials, Aerospace & Defense) | 5,051 | 107,999 | ||||||||||||||
Korea Electric Power Corporation (Utilities, Electric Utilities) † | 16,434 | 287,570 | ||||||||||||||
Korea Gas Corporation (Utilities, Gas Utilities) | 2,107 | 48,812 | ||||||||||||||
Korea Investment Holdings Company Limited (Financials, Capital Markets) | 2,236 | 116,611 | ||||||||||||||
Korea Petrochemical Industrial Company Limited (Materials, Chemicals) | 244 | 17,367 | ||||||||||||||
Korea Reinsurance Company (Financials, Insurance) | 5,574 | 37,627 | ||||||||||||||
Korea Shipbuilding & Offshore Engineering Company Limited (Industrials, Machinery) † | 2,285 | 196,447 | ||||||||||||||
Korea Zinc Company Limited (Materials, Metals & Mining) | 662 | 226,494 | ||||||||||||||
Korean Air Lines Company Limited (Industrials, Airlines) | 3,940 | 71,215 | ||||||||||||||
KT Corporation (Communication Services, Diversified Telecommunication Services) | 13,191 | 259,844 | ||||||||||||||
KT&G Corporation (Consumer Staples, Tobacco) | 7,239 | 503,656 | ||||||||||||||
Kuk-il Paper Manufacturing Company Limited (Materials, Paper & Forest Products) † | 4,010 | 16,548 | ||||||||||||||
Kumho Petrochemical Company Limited (Materials, Chemicals) | 1,158 | 57,280 | ||||||||||||||
Kumho Tire Company Incorporated (Consumer Discretionary, Auto Components) † | 9,038 | 27,472 | ||||||||||||||
L&F Company Limited (Information Technology, Electronic Equipment, Instruments & Components) | 1,191 | 21,668 | ||||||||||||||
LEENO Industrial Incorporated (Information Technology, Semiconductors & Semiconductor Equipment) | 489 | 32,915 | ||||||||||||||
LG Chem Limited (Materials, Chemicals) | 2,445 | 740,764 | ||||||||||||||
LG Corporation (Industrials, Industrial Conglomerates) | 7,120 | 395,761 | ||||||||||||||
LG Display Company Limited (Information Technology, Electronic Equipment, Instruments & Components) † | 11,914 | 135,469 | ||||||||||||||
LG Electronics Incorporated (Consumer Discretionary, Household Durables) | 6,050 | 304,315 | ||||||||||||||
LG Household & Health Care Limited (Consumer Staples, Personal Products) | 497 | 501,722 | ||||||||||||||
LG Innotek Company Limited (Information Technology, Electronic Equipment, Instruments & Components) | 711 | 76,924 | ||||||||||||||
LG International Corporation (Industrials, Trading Companies & Distributors) | 1,745 | 16,307 | ||||||||||||||
LG Uplus Corporation (Communication Services, Diversified Telecommunication Services) | 14,190 | 154,291 | ||||||||||||||
Lotte Chemical Corporation (Materials, Chemicals) | 895 | 139,956 | ||||||||||||||
Lotte Corporation (Industrials, Industrial Conglomerates) | 2,456 | 59,210 | ||||||||||||||
LOTTE Fine Chemical Company Limited (Materials, Chemicals) | 839 | 23,149 | ||||||||||||||
Lotte Shopping Company Limited (Consumer Discretionary, Multiline Retail) | 592 | 46,891 | ||||||||||||||
LS Corporation (Industrials, Electrical Equipment) | 1,835 | 54,781 | ||||||||||||||
LS Industrial Systems Company Limited (Industrials, Electrical Equipment) | 980 | 35,373 | ||||||||||||||
Mando Corporation (Consumer Discretionary, Auto Components) | 1,862 | 46,239 | ||||||||||||||
Medy-Tox Incorporated (Health Care, Biotechnology) | 225 | 55,856 | ||||||||||||||
Meritz Financial Group Incorporated (Financials, Diversified Financial Services) | 2,067 | 17,370 | ||||||||||||||
Meritz Fire & Marine Insurance Company Limited (Financials, Insurance) | 2,602 | 31,810 | ||||||||||||||
Meritz Securities Company Limited (Financials, Capital Markets) | 18,762 | 54,182 | ||||||||||||||
Mirae Asset Daewoo Company Limited (Financials, Capital Markets) | 24,745 | 130,565 | ||||||||||||||
Mirae Asset Life Insurance Company Limited (Financials, Insurance) | 5,673 | 18,716 | ||||||||||||||
Naver Corporation (Communication Services, Interactive Media & Services) | 8,343 | 1,197,561 | ||||||||||||||
NCsoft Corporation (Communication Services, Entertainment) | 821 | 438,865 | ||||||||||||||
NEPES Corporation (Information Technology, Semiconductors & Semiconductor Equipment) | 1,101 | 26,852 | ||||||||||||||
NH Investment & Securities Company Limited (Financials, Capital Markets) | 7,583 | 63,138 | ||||||||||||||
NHN Entertainment Corporation (Communication Services, Entertainment) † | 711 | 40,806 | ||||||||||||||
NongShim Company Limited (Consumer Staples, Food Products) | 240 | 51,775 | ||||||||||||||
OIC Company Limited (Materials, Chemicals) | 1,114 | 45,722 | ||||||||||||||
Orion Corporation of Republic of Korea (Consumer Staples, Food Products) | 1,322 | 104,400 | ||||||||||||||
Osstem Implant Company Limited (Health Care, Health Care Equipment & Supplies) † | 582 | 15,941 | ||||||||||||||
The accompanying notes are an integral part of these financial statements.
Wells Fargo Funds | 75
Table of Contents
Portfolio of investments—February 29, 2020
FACTOR ENHANCED EMERGING MARKETS PORTFOLIO
| Shares | Value | |||||||||||||||
| South Korea (continued) | ||||||||||||||||
Ottogi Corporation (Consumer Staples, Food Products) | 146 | $ | 60,076 | |||||||||||||
Pan Ocean Company Limited (Industrials, Marine) † | 12,317 | 38,295 | ||||||||||||||
Paradise Company Limited (Consumer Discretionary, Hotels, Restaurants & Leisure) | 2,484 | 34,036 | ||||||||||||||
Partron Company Limited (Information Technology, Electronic Equipment, Instruments & Components) | 2,555 | 19,168 | ||||||||||||||
Pearl Abyss Corporation (Communication Services, Entertainment) † | 385 | 56,907 | ||||||||||||||
Pharmicell Company Limited (Health Care, Biotechnology) † | 2,881 | 18,525 | ||||||||||||||
POSCO (Materials, Metals & Mining) | 4,520 | 726,007 | ||||||||||||||
POSCO Chemtech Company Limited (Materials, Construction Materials) | 1,158 | 53,078 | ||||||||||||||
Posco International Corporation (Industrials, Trading Companies & Distributors) | 2,533 | 31,421 | ||||||||||||||
S1 Corporation Incorporated (Industrials, Commercial Services & Supplies) | 1,115 | 75,466 | ||||||||||||||
Sam Chun Dang Pharmaceutical Company Limited (Health Care, Pharmaceuticals) | 953 | 31,820 | ||||||||||||||
Samsung C&T Corporation (Industrials, Industrial Conglomerates) | 6,181 | 541,849 | ||||||||||||||
Samsung Card Company Limited (Financials, Consumer Finance) | 1,504 | 41,733 | ||||||||||||||
Samsung Electro-Mechanics Company Limited (Information Technology, Electronic Equipment, Instruments & Components) | 2,781 | 293,781 | ||||||||||||||
Samsung Engineering Company Limited (Industrials, Construction & Engineering) † | 8,303 | 96,780 | ||||||||||||||
Samsung Fire & Marine Insurance (Financials, Insurance) | 2,142 | 348,894 | ||||||||||||||
Samsung Life Insurance Company Limited (Financials, Insurance) | 5,659 | 271,824 | ||||||||||||||
Samsung SDS Company Limited (Information Technology, Technology Hardware, Storage & Peripherals) | 2,124 | 293,906 | ||||||||||||||
Samsung Securities Company Limited (Financials, Capital Markets) | 3,425 | 93,756 | ||||||||||||||
Samyang Holdings Corporation (Consumer Staples, Food Products) | 582 | 23,549 | ||||||||||||||
Seegene Incorporated (Health Care, Biotechnology) † | 1,137 | 34,852 | ||||||||||||||
Seoul Semiconductor Company Limited (Information Technology, Semiconductors & Semiconductor Equipment) | 2,537 | 31,736 | ||||||||||||||
SFA Engineering Corporation (Information Technology, Electronic Equipment, Instruments & Components) | 930 | 28,764 | ||||||||||||||
Shinhan Financial Group Company Limited (Financials, Banks) | 25,725 | 688,003 | ||||||||||||||
Shinsegae Company Limited (Consumer Discretionary, Multiline Retail) | 346 | 66,318 | ||||||||||||||
Shinsegae International Company Limited (Consumer Discretionary, Specialty Retail) | 150 | 22,662 | ||||||||||||||
SK Chemicals Company Limited (Materials, Chemicals) | 359 | 16,935 | ||||||||||||||
SK Company Limited (Industrials, Industrial Conglomerates) | 2,926 | 464,721 | ||||||||||||||
SK Hynix Incorporated (Information Technology, Semiconductors & Semiconductor Equipment) | 28,692 | 2,120,068 | ||||||||||||||
SK Innovation Company Limited (Energy, Oil, Gas & Consumable Fuels) | 3,467 | 328,258 | ||||||||||||||
SK Materials Company Limited (Materials, Chemicals) | 261 | 32,182 | ||||||||||||||
SK Networks Company Limited (Industrials, Trading Companies & Distributors) | 7,633 | 27,388 | ||||||||||||||
SK Telecom Company Limited (Communication Services, Wireless Telecommunication Services) | 3,141 | 549,935 | ||||||||||||||
SKC Company Limited (Materials, Chemicals) | 1,175 | 49,885 | ||||||||||||||
SM Entertainment Company (Communication Services, Entertainment) † | 1,235 | 29,174 | ||||||||||||||
Soulbrain Company Limited (Materials, Chemicals) | 603 | 44,167 | ||||||||||||||
Ssangyong Cement Industrial Company Limited (Materials, Construction Materials) | 5,271 | 21,435 | ||||||||||||||
Studio Dragon Corporation (Communication Services, Entertainment) † | 459 | 28,134 | ||||||||||||||
Taekwang Industrial Company Limited (Materials, Chemicals) | 35 | 23,245 | ||||||||||||||
Taeyoung Engineering & Construction Company Limited (Industrials, Construction & Engineering) | 2,857 | 30,896 | ||||||||||||||
Wonik IPS Company Limited (Information Technology, Semiconductors & Semiconductor Equipment) | 1,713 | 45,577 | ||||||||||||||
Woori Financial Group Incorporated (Financials, Banks) | 29,010 | 230,449 | ||||||||||||||
Young Poong Corporation (Materials, Metals & Mining) | 43 | 21,031 | ||||||||||||||
Youngone Corporation (Consumer Discretionary, Textiles, Apparel & Luxury Goods) | 1,286 | 33,754 | ||||||||||||||
Yuhan Corporation (Health Care, Pharmaceuticals) | 566 | 100,170 | ||||||||||||||
Yungjin Pharmaceutical Company (Health Care, Pharmaceuticals) † | 4,865 | 20,259 | ||||||||||||||
| 24,381,415 | ||||||||||||||||
|
| |||||||||||||||
The accompanying notes are an integral part of these financial statements.
76 | Wells Fargo Funds
Table of Contents
Portfolio of investments—February 29, 2020
FACTOR ENHANCED EMERGING MARKETS PORTFOLIO
| Shares | Value | |||||||||||||||
| Taiwan: 11.93% |
| |||||||||||||||
Accton Technology Corporation (Information Technology, Communications Equipment) | 25,000 | $ | 131,890 | |||||||||||||
Acer Incorporated (Information Technology, Technology Hardware, Storage & Peripherals) | 153,000 | 80,936 | ||||||||||||||
Advantech Company Limited (Information Technology, Technology Hardware, Storage & Peripherals) | 21,000 | 200,923 | ||||||||||||||
Aerospace industrial Development Corporation (Industrials, Aerospace & Defense) | 38,000 | 39,136 | ||||||||||||||
Airtac International Group (Industrials, Machinery) | 7,000 | 108,668 | ||||||||||||||
Arcadyan Technology Corporation (Information Technology, Communications Equipment) | 9,000 | 22,907 | ||||||||||||||
ASE Technology Holding Company Limited (Information Technology, Semiconductors & Semiconductor Equipment) | 185,000 | 428,998 | ||||||||||||||
Asia Cement Corporation (Materials, Construction Materials) | 121,000 | 176,040 | ||||||||||||||
Asia Optical Company Incorporated (Information Technology, Electronic Equipment, Instruments & Components) | 14,000 | 37,796 | ||||||||||||||
ASMedia Technology Incorporated (Information Technology, Semiconductors & Semiconductor Equipment) | 2,000 | 49,311 | ||||||||||||||
Asustek Computer Incorporated (Information Technology, Technology Hardware, Storage & Peripherals) | 37,000 | 247,524 | ||||||||||||||
AU Optronics Corporation (Information Technology, Electronic Equipment, Instruments & Components) | 438,000 | 135,546 | ||||||||||||||
BizLink Holding Incorporated (Industrials, Electrical Equipment) | 6,000 | 36,666 | ||||||||||||||
Capital Securities Corporation (Financials, Capital Markets) | 157,700 | 51,066 | ||||||||||||||
Career Technology Company Limited (Information Technology, Electronic Equipment, Instruments & Components) | 18,840 | 19,377 | ||||||||||||||
Cathay No.1 REIT (Real Estate, Equity REITs) | 104,500 | 61,293 | ||||||||||||||
Cathay Real Estate Development Company Limited (Real Estate, Real Estate Management & Development) | 30,000 | 20,703 | ||||||||||||||
Chailease Holding Company Limited (Financials, Diversified Financial Services) | 70,211 | 261,275 | ||||||||||||||
Chang Hwa Commercial Bank (Financials, Banks) | 345,105 | 263,693 | ||||||||||||||
Cheng Loong Corporation (Materials, Containers & Packaging) | 48,000 | 37,199 | ||||||||||||||
Cheng Shin Rubber Industry Company Limited (Consumer Discretionary, Auto Components) | 120,000 | 154,913 | ||||||||||||||
Cheng Uei Precision Industry Company Limited (Information Technology, Electronic Equipment, Instruments & Components) | 16,000 | 18,990 | ||||||||||||||
Chicony Electronics Company Limited (Information Technology, Technology Hardware, Storage & Peripherals) | 31,335 | 84,906 | ||||||||||||||
Chilisin Electronics Corporation (Information Technology, Electronic Equipment, Instruments & Components) | 10,225 | 35,016 | ||||||||||||||
Chin Poon Industrial Company Limited (Information Technology, Electronic Equipment, Instruments & Components) | 24,000 | 23,296 | ||||||||||||||
China Airlines (Industrials, Airlines) | 238,000 | 63,743 | ||||||||||||||
China Bills Finance Corporation (Financials, Capital Markets) | 102,535 | 51,401 | ||||||||||||||
China Development Financial Holding Corporation (Financials, Insurance) | 762,000 | 228,843 | ||||||||||||||
China Life Insurance Company - Taiwan Exchange (Financials, Insurance) † | 156,000 | 122,445 | ||||||||||||||
China Petrochemical Development Corporation (Materials, Chemicals) | 169,350 | 44,791 | ||||||||||||||
China Steel Chemical Corporation (Materials, Chemicals) | 8,000 | 30,869 | ||||||||||||||
China Steel Corporation (Materials, Metals & Mining) | 625,000 | 473,865 | ||||||||||||||
ChipMOS Technologies Incorporated (Information Technology, Semiconductors & Semiconductor Equipment) | 25,000 | 23,873 | ||||||||||||||
Chong Hong Construction Company Limited (Real Estate, Real Estate Management & Development) | 16,000 | 43,014 | ||||||||||||||
Chroma ATE Incorporated (Information Technology, Electronic Equipment, Instruments & Components) | 21,000 | 96,834 | ||||||||||||||
Chunghwa Telecom Company Limited (Communication Services, Diversified Telecommunication Services) | 226,000 | 800,961 | ||||||||||||||
Cleanaway Company Limited (Industrials, Commercial Services & Supplies) | 4,000 | 20,942 | ||||||||||||||
Clevo Company (Information Technology, Technology Hardware, Storage & Peripherals) | 35,000 | 35,146 | ||||||||||||||
Compal Electronic Incorporated (Information Technology, Technology Hardware, Storage & Peripherals) | 213,000 | 128,417 | ||||||||||||||
Compeq Manufacturing Company Limited (Information Technology, Electronic Equipment, Instruments & Components) | 62,000 | 77,862 | ||||||||||||||
The accompanying notes are an integral part of these financial statements.
Wells Fargo Funds | 77
Table of Contents
Portfolio of investments—February 29, 2020
FACTOR ENHANCED EMERGING MARKETS PORTFOLIO
| Shares | Value | |||||||||||||||
| Taiwan (continued) | ||||||||||||||||
CTBC Financial Holding Company Limited (Financials, Banks) | 999,000 | $ | 741,422 | |||||||||||||
CTCI Corporation (Industrials, Construction & Engineering) | 43,000 | 52,177 | ||||||||||||||
Cub Elecparts Incorporated (Consumer Discretionary, Auto Components) | 3,011 | 19,679 | ||||||||||||||
Delta Electronics Incorporated (Information Technology, Electronic Equipment, Instruments & Components) | 109,000 | 494,159 | ||||||||||||||
E.SUN Financial Holding Company Limited (Financials, Banks) | 605,764 | 577,564 | ||||||||||||||
Eclat Textile Company Limited (Consumer Discretionary, Textiles, Apparel & Luxury Goods) | 13,000 | 151,476 | ||||||||||||||
Elan Microelectronics Corporation (Information Technology, Semiconductors & Semiconductor Equipment) | 18,100 | 48,544 | ||||||||||||||
Elite Material Company Limited (Information Technology, Electronic Equipment, Instruments & Components) | 14,000 | 54,721 | ||||||||||||||
Ennoconn Corporation (Information Technology, Technology Hardware, Storage & Peripherals) | 3,000 | 21,079 | ||||||||||||||
Epistar Corporation (Information Technology, Semiconductors & Semiconductor Equipment) | 54,000 | 49,828 | ||||||||||||||
Eternal Chemical Company Limited (Materials, Chemicals) | 45,453 | 40,311 | ||||||||||||||
Eva Airways Corporation (Industrials, Airlines) | 190,869 | 75,173 | ||||||||||||||
Evergreen Marine Corporation (Taiwan) Limited (Industrials, Marine) † | 177,850 | 66,711 | ||||||||||||||
Everlight Electronics Company Limited (Information Technology, Semiconductors & Semiconductor Equipment) | 25,000 | 25,750 | ||||||||||||||
Far Eastern Department Stores Company Limited (Consumer Discretionary, Multiline Retail) | 56,000 | 44,509 | ||||||||||||||
Far Eastern International Bank (Financials, Banks) | 222,259 | 85,795 | ||||||||||||||
Far Eastern New Century Corporation (Industrials, Industrial Conglomerates) | 203,000 | 187,118 | ||||||||||||||
Far EasTone Telecommunications Company Limited (Communication Services, Wireless Telecommunication Services) | 94,000 | 203,964 | ||||||||||||||
Feng Hsin Iron & Steel Company (Materials, Metals & Mining) | 32,506 | 58,184 | ||||||||||||||
Feng Tay Enterprise Company Limited (Consumer Discretionary, Textiles, Apparel & Luxury Goods) | 28,400 | 156,341 | ||||||||||||||
First Financial Holding Company Limited (Financials, Banks) | 524,503 | 408,183 | ||||||||||||||
Flexium Interconnect Incorporated (Information Technology, Electronic Equipment, Instruments & Components) | 15,000 | 54,632 | ||||||||||||||
Formosa Chemicals & Fibre Corporation (Materials, Chemicals) | 221,000 | 593,371 | ||||||||||||||
Formosa Plastics Corporation (Materials, Chemicals) | 243,000 | 725,412 | ||||||||||||||
Formosa Taffeta Company Limited (Consumer Discretionary, Textiles, Apparel & Luxury Goods) | 58,000 | 63,225 | ||||||||||||||
Foxconn Technology Company Limited (Information Technology, Electronic Equipment, Instruments & Components) | 48,000 | 93,181 | ||||||||||||||
Fulgent Sun International Holding Company Limited (Consumer Discretionary, Textiles, Apparel & Luxury Goods) | 7,000 | 24,436 | ||||||||||||||
Fusheng Precision Company Limited (Consumer Discretionary, Leisure Products) | 8,000 | 49,974 | ||||||||||||||
General Interface Solution Holding Limited (Information Technology, Electronic Equipment, Instruments & Components) | 11,000 | 34,910 | ||||||||||||||
Getac Technology Corporation (Information Technology, Technology Hardware, Storage & Peripherals) | 19,000 | 30,250 | ||||||||||||||
Giant Manufacturing Company Limited (Consumer Discretionary, Leisure Products) | 20,000 | 107,171 | ||||||||||||||
Gigabyte Technology Company Limited (Information Technology, Technology Hardware, Storage & Peripherals) | 29,000 | 48,870 | ||||||||||||||
Global Unichip Corporation (Information Technology, Semiconductors & Semiconductor Equipment) | 4,000 | 28,714 | ||||||||||||||
Goldsun Development & Construction Company Limited (Materials, Construction Materials) | 61,000 | 25,850 | ||||||||||||||
Gourmet Master Company Limited (Consumer Discretionary, Hotels, Restaurants & Leisure) | 5,936 | 18,186 | ||||||||||||||
Grand Pacific Petrochemical Corporation (Materials, Chemicals) † | 53,000 | 28,428 | ||||||||||||||
Grape King Bio Limited (Consumer Staples, Personal Products) | 7,000 | 50,057 | ||||||||||||||
Great Wall Enterprises Company Limited (Consumer Staples, Food Products) | 45,377 | 59,853 | ||||||||||||||
Greatek Electronic Incorporated (Information Technology, Semiconductors & Semiconductor Equipment) | 23,000 | 35,439 | ||||||||||||||
Hannstar Board Corporation (Information Technology, Electronic Equipment, Instruments & Components) | 15,000 | 17,365 | ||||||||||||||
Hannstar Display Corporation (Information Technology, Electronic Equipment, Instruments & Components) | 154,000 | 33,142 | ||||||||||||||
Highwealth Construction Corporation (Real Estate, Real Estate Management & Development) | 52,000 | 76,648 | ||||||||||||||
The accompanying notes are an integral part of these financial statements.
78 | Wells Fargo Funds
Table of Contents
Portfolio of investments—February 29, 2020
FACTOR ENHANCED EMERGING MARKETS PORTFOLIO
| Shares | Value | |||||||||||||||
| Taiwan (continued) | ||||||||||||||||
Hiwin Technologies Corporation (Industrials, Machinery) | 15,376 | $ | 149,241 | |||||||||||||
Holtek Semiconductor Incorporated (Information Technology, Semiconductors & Semiconductor Equipment) | 16,000 | 34,083 | ||||||||||||||
Holy Stone Enterprise Company Limited (Information Technology, Electronic Equipment, Instruments & Components) | 10,000 | 32,141 | ||||||||||||||
Hon Hai Precision Industry Company Limited (Information Technology, Electronic Equipment, Instruments & Components) | 645,400 | 1,684,145 | ||||||||||||||
Hota Industrial Manufacturing Company Limited (Consumer Discretionary, Auto Components) | 12,000 | 44,667 | ||||||||||||||
Hotai Motor Company Limited (Consumer Discretionary, Specialty Retail) | 20,000 | 405,178 | ||||||||||||||
Hua Nan Financial Holdings Company Limited Class C (Financials, Banks) | 502,574 | 355,610 | ||||||||||||||
Huaku Development Company Limited (Real Estate, Real Estate Management & Development) | 16,000 | 45,374 | ||||||||||||||
Hung Sheng Construction Company Limited (Real Estate, Real Estate Management & Development) | 32,960 | 22,276 | ||||||||||||||
IBF Financial Holdings Company Limited (Financials, Capital Markets) | 155,762 | 58,214 | ||||||||||||||
Innolux Display Corporation (Information Technology, Electronic Equipment, Instruments & Components) | 454,000 | 117,043 | ||||||||||||||
International CSRC Investment Holdings Company Limited (Materials, Chemicals) | 40,206 | 35,397 | ||||||||||||||
Inventec Company Limited (Information Technology, Technology Hardware, Storage & Peripherals) | 163,000 | 122,133 | ||||||||||||||
ITEQ Corporation (Information Technology, Electronic Equipment, Instruments & Components) | 10,000 | 46,263 | ||||||||||||||
Kenda Rubber Industrial Company Limited (Consumer Discretionary, Auto Components) | 51,875 | 47,952 | ||||||||||||||
King Slide Works Company Limited (Information Technology, Technology Hardware, Storage & Peripherals) | 4,000 | 45,547 | ||||||||||||||
King Yuan Electronics Company Limited (Information Technology, Semiconductors & Semiconductor Equipment) | 59,000 | 62,380 | ||||||||||||||
King’s Town Bank Company Limited (Financials, Banks) | 54,000 | 65,058 | ||||||||||||||
Kinpo Electronics Incorporated (Consumer Discretionary, Household Durables) | 72,000 | 31,469 | ||||||||||||||
Kinsus Interconnect Technology Corporation (Information Technology, Semiconductors & Semiconductor Equipment) | 15,000 | 25,203 | ||||||||||||||
Lien Hwa Industrial Corporation (Consumer Staples, Food Products) | 55,100 | 68,492 | ||||||||||||||
Lite-On Technology Corporation (Information Technology, Technology Hardware, Storage & Peripherals) | 116,000 | 165,148 | ||||||||||||||
LOTES Company Limited (Information Technology, Electronic Equipment, Instruments & Components) | 4,000 | 38,198 | ||||||||||||||
Machvision Incorporated (Information Technology, Semiconductors & Semiconductor Equipment) | 2,000 | 23,356 | ||||||||||||||
Macronix International Company Limited (Information Technology, Semiconductors & Semiconductor Equipment) | 99,536 | 104,640 | ||||||||||||||
Makalot Industrial Company Limited (Consumer Discretionary, Textiles, Apparel & Luxury Goods) | 12,800 | 62,376 | ||||||||||||||
Mediatek Incorporated (Information Technology, Semiconductors & Semiconductor Equipment) | 78,000 | 906,776 | ||||||||||||||
Mega Financial Holding Company Limited (Financials, Banks) | 594,000 | 628,984 | ||||||||||||||
Mercuries Life Insurance Company (Financials, Insurance) † | 60,302 | 23,145 | ||||||||||||||
Merida Industry Company Limited (Consumer Discretionary, Leisure Products) | 13,000 | 62,470 | ||||||||||||||
Merry Electronics Company Limited (Information Technology, Electronic Equipment, Instruments & Components) | 10,000 | 45,334 | ||||||||||||||
Micro-Star International Company Limited (Information Technology, Technology Hardware, Storage & Peripherals) | 39,000 | 114,157 | ||||||||||||||
Mitac Holdings Corporation (Information Technology, Technology Hardware, Storage & Peripherals) | 52,754 | 58,228 | ||||||||||||||
Nan Kang Rubber Tire Company Limited (Consumer Discretionary, Auto Components) | 28,000 | 39,362 | ||||||||||||||
Nan Ya Plastics Corporation (Materials, Chemicals) | 293,000 | 654,611 | ||||||||||||||
Nanya Technology Corporation (Information Technology, Semiconductors & Semiconductor Equipment) | 58,000 | 144,372 | ||||||||||||||
Nien Made Enterprise Company Limited (Consumer Discretionary, Household Durables) | 8,000 | 63,110 | ||||||||||||||
Novatek Microelectronics Corporation Limited (Information Technology, Semiconductors & Semiconductor Equipment) | 32,000 | 201,387 | ||||||||||||||
Oriental Union Chemical Corporation (Materials, Chemicals) | 30,000 | 19,434 | ||||||||||||||
Pegatron Corporation (Information Technology, Technology Hardware, Storage & Peripherals) | 113,000 | 229,920 | ||||||||||||||
Pharmally International Holding Company Limited (Health Care, Pharmaceuticals) | 5,128 | 34,720 | ||||||||||||||
Pou Chen Corporation (Consumer Discretionary, Textiles, Apparel & Luxury Goods) | 135,000 | 149,887 | ||||||||||||||
The accompanying notes are an integral part of these financial statements.
Wells Fargo Funds | 79
Table of Contents
Portfolio of investments—February 29, 2020
FACTOR ENHANCED EMERGING MARKETS PORTFOLIO
| Shares | Value | |||||||||||||||
| Taiwan (continued) | ||||||||||||||||
Powertech Technology Incorporated (Information Technology, Semiconductors & Semiconductor Equipment) | 41,000 | $ | 134,111 | |||||||||||||
President Chain Store Corporation (Consumer Staples, Food & Staples Retailing) | 28,000 | 273,332 | ||||||||||||||
President Securities Corporation (Financials, Capital Markets) | 68,000 | 30,675 | ||||||||||||||
Primax Electronics Limited (Information Technology, Technology Hardware, Storage & Peripherals) | 22,000 | 34,631 | ||||||||||||||
Prince Housing & Development Corporation (Real Estate, Real Estate Management & Development) | 103,800 | 36,600 | ||||||||||||||
Qisda Corporation (Information Technology, Technology Hardware, Storage & Peripherals) | 80,000 | 48,922 | ||||||||||||||
Quanta Computer Incorporated (Information Technology, Technology Hardware, Storage & Peripherals) | 144,000 | 290,463 | ||||||||||||||
Radiant Opto-Electronics Corporation (Information Technology, Semiconductors & Semiconductor Equipment) | 25,000 | 79,194 | ||||||||||||||
Realtek Semiconductor Corporation (Information Technology, Semiconductors & Semiconductor Equipment) | 26,000 | 188,135 | ||||||||||||||
Ruentex Development Company Limited (Real Estate, Real Estate Management & Development) | 43,880 | 59,090 | ||||||||||||||
Sanyang Industry Company Limited (Consumer Discretionary, Automobiles) | 53,000 | 35,845 | ||||||||||||||
Sercomm Corporation (Information Technology, Communications Equipment) | 14,000 | 33,581 | ||||||||||||||
Shihlin Electric & Engineering Corporation (Industrials, Electrical Equipment) | 23,700 | 34,256 | ||||||||||||||
Shin Kong Financial Holding Company Limited (Financials, Insurance) | 632,000 | 188,434 | ||||||||||||||
Shin Kong No.1 REIT (Real Estate, Equity REITs) | 91,000 | 55,749 | ||||||||||||||
Shin Zu Shing Company Limited (Industrials, Machinery) | 9,000 | 40,103 | ||||||||||||||
Shinkong Synthetic Fibers Corporation (Materials, Chemicals) | 70,000 | 27,791 | ||||||||||||||
Sinbon Electronics Company Limited (Information Technology, Electronic Equipment, Instruments & Components) | 12,000 | 50,932 | ||||||||||||||
Sinopac Financial Holdings Company Limited (Financials, Banks) | 593,400 | 251,111 | ||||||||||||||
Sitronix Technology Corporation (Information Technology, Semiconductors & Semiconductor Equipment) | 7,000 | 32,444 | ||||||||||||||
Standard Foods Corporation (Consumer Staples, Food Products) | 29,000 | 64,732 | ||||||||||||||
Synnex Technology International Corporation (Information Technology, Electronic Equipment, Instruments & Components) | 71,000 | 87,322 | ||||||||||||||
Systex Corporation (Information Technology, IT Services) | 17,000 | 44,167 | ||||||||||||||
Ta Chen Stainless Pipe Company (Materials, Metals & Mining) | 40,840 | 41,316 | ||||||||||||||
Taichung Commercial Bank (Financials, Banks) | 168,685 | 68,142 | ||||||||||||||
Tainan Spinning Company Limited (Consumer Discretionary, Textiles, Apparel & Luxury Goods) | 152,000 | 50,056 | ||||||||||||||
Taishin Financial Holdings Company Limited (Financials, Banks) | 535,481 | 248,752 | ||||||||||||||
Taiwan Business Bank (Financials, Banks) | 277,171 | 108,534 | ||||||||||||||
Taiwan Cement Corporation (Materials, Construction Materials) | 276,896 | 382,399 | ||||||||||||||
Taiwan Cooperative Financial Holdings Company Limited (Financials, Banks) | 510,315 | 350,604 | ||||||||||||||
Taiwan Fertilizer Company Limited (Materials, Chemicals) | 37,000 | 58,267 | ||||||||||||||
Taiwan Glass Industrial Corporation (Industrials, Building Products) | 92,000 | 30,425 | ||||||||||||||
Taiwan High Speed Rail Corporation (Industrials, Transportation Infrastructure) | 158,000 | 178,219 | ||||||||||||||
Taiwan Hon Chuan Enterprise Company Limited (Materials, Containers & Packaging) | 17,000 | 32,946 | ||||||||||||||
Taiwan Mobile Company Limited (Communication Services, Wireless Telecommunication Services) | 120,000 | 413,913 | ||||||||||||||
Taiwan Paiho Limited (Consumer Discretionary, Textiles, Apparel & Luxury Goods) | 17,000 | 38,300 | ||||||||||||||
Taiwan Secom Company Limited (Industrials, Commercial Services & Supplies) | 13,000 | 37,910 | ||||||||||||||
Taiwan Surface Mounting Technology Corporation (Information Technology, Semiconductors & Semiconductor Equipment) | 14,000 | 41,777 | ||||||||||||||
TECO Electric & Machinery Company Limited (Industrials, Electrical Equipment) | 105,000 | 91,750 | ||||||||||||||
The Shanghai Commercial & Savings Bank Limited (Financials, Banks) | 202,000 | 332,589 | ||||||||||||||
Tong Hsing Electronic Industries Limited (Information Technology, Electronic Equipment, Instruments & Components) | 5,000 | 24,386 | ||||||||||||||
Tong Yang Industry Company Limited (Consumer Discretionary, Auto Components) | 24,000 | 30,553 | ||||||||||||||
Topco Scientific Company Limited (Information Technology, Semiconductors & Semiconductor Equipment) | 12,000 | 40,659 | ||||||||||||||
TPK Holding Company Limited (Information Technology, Electronic Equipment, Instruments & Components) † | 19,000 | 27,605 | ||||||||||||||
Transcend Information Incorporated (Information Technology, Technology Hardware, Storage & Peripherals) | 13,000 | 33,250 | ||||||||||||||
The accompanying notes are an integral part of these financial statements.
80 | Wells Fargo Funds
Table of Contents
Portfolio of investments—February 29, 2020
FACTOR ENHANCED EMERGING MARKETS PORTFOLIO
| Shares | Value | |||||||||||||||
| Taiwan (continued) | ||||||||||||||||
Tripod Technology Corporation (Information Technology, Electronic Equipment, Instruments & Components) | 23,000 | $ | 82,556 | |||||||||||||
TSRC Corporation (Materials, Chemicals) | 34,000 | 23,890 | ||||||||||||||
Tung Ho Steel Enterprise Corporation (Materials, Metals & Mining) | 44,000 | 32,451 | ||||||||||||||
U-Ming Marine Transport Corporation (Industrials, Marine) | 33,000 | 31,483 | ||||||||||||||
Uni-President Enterprises Corporation (Consumer Staples, Food Products) | 289,000 | 691,697 | ||||||||||||||
Unimicron Technology Corporation (Information Technology, Electronic Equipment, Instruments & Components) | 65,000 | 83,268 | ||||||||||||||
Union Bank of Taiwan (Financials, Banks) † | 178,382 | 64,407 | ||||||||||||||
Unitech Printed Circuit Board Corporation (Information Technology, Technology Hardware, Storage & Peripherals) | 31,000 | 27,382 | ||||||||||||||
United Integrated Services Company Limited (Industrials, Construction & Engineering) | 10,000 | 59,464 | ||||||||||||||
United Microelectronics Corporation (Information Technology, Semiconductors & Semiconductor Equipment) | 558,000 | 278,408 | ||||||||||||||
United Renewable Energy Company Limited (Information Technology, Semiconductors & Semiconductor Equipment) † | 142,000 | 32,209 | ||||||||||||||
Visual Photonics Epitaxy Company Limited (Information Technology, Semiconductors & Semiconductor Equipment) | 9,000 | 28,463 | ||||||||||||||
Voltronic Power Technology Corporation (Industrials, Electrical Equipment) | 3,200 | 73,381 | ||||||||||||||
Walsin Lihwa Corporation (Industrials, Electrical Equipment) | 150,000 | 68,154 | ||||||||||||||
Walsin Technology Corporation (Information Technology, Electronic Equipment, Instruments & Components) | 19,000 | 130,012 | ||||||||||||||
Wan Hai Lines Limited (Industrials, Marine) | 87,000 | 49,393 | ||||||||||||||
Windbond Electronics Corporation (Information Technology, Semiconductors & Semiconductor Equipment) | 160,000 | 81,593 | ||||||||||||||
Wistron Corporation (Information Technology, Technology Hardware, Storage & Peripherals) | 137,607 | 120,744 | ||||||||||||||
Wistron Neweb Corporation (Information Technology, Communications Equipment) | 17,599 | 39,698 | ||||||||||||||
Wiwynn Corporation (Information Technology, Technology Hardware, Storage & Peripherals) | 5,000 | 116,769 | ||||||||||||||
WPG Holdings Company Limited (Information Technology, Electronic Equipment, Instruments & Components) | 71,440 | 90,750 | ||||||||||||||
WT Microelectronics Company Limited (Information Technology, Electronic Equipment, Instruments & Components) | 32,000 | 40,567 | ||||||||||||||
Yageo Corporation (Information Technology, Electronic Equipment, Instruments & Components) | 16,566 | 213,950 | ||||||||||||||
YFY Incorporated (Materials, Paper & Forest Products) | 77,000 | 35,041 | ||||||||||||||
Yieh Phui Enterprise Company Limited (Materials, Metals & Mining) | 78,013 | 23,214 | ||||||||||||||
Yuanta Financial Holding Company Limited (Financials, Diversified Financial Services) | 582,000 | 363,854 | ||||||||||||||
Yulon Finance Corporation (Financials, Consumer Finance) | 8,100 | 27,921 | ||||||||||||||
Yulon Motor Company Limited (Consumer Discretionary, Automobiles) | 52,000 | 34,609 | ||||||||||||||
Yungtay Engineering Company Limited (Industrials, Machinery) | 18,000 | 35,165 | ||||||||||||||
Zhen Ding Technology Holding (Information Technology, Electronic Equipment, Instruments & Components) | 31,000 | 116,619 | ||||||||||||||
| 25,881,441 | ||||||||||||||||
|
| |||||||||||||||
| Thailand: 4.57% | ||||||||||||||||
Advanced Info Service PCL (Communication Services, Wireless Telecommunication Services) | 55,500 | 356,180 | ||||||||||||||
Aeon Thana Sinsap PCL (Financials, Consumer Finance) | 4,300 | 19,170 | ||||||||||||||
Airports of Thailand PCL (Industrials, Transportation Infrastructure) | 228,100 | 439,168 | ||||||||||||||
Amata Corporation PCL (Real Estate, Real Estate Management & Development) | 63,200 | 29,558 | ||||||||||||||
AP Thailand PCL (Real Estate, Real Estate Management & Development) | 149,100 | 29,226 | ||||||||||||||
B.Grimm PCL (Utilities, Independent Power & Renewable Electricity Producers) | 40,900 | 59,439 | ||||||||||||||
Bangchak Corporation PCL (Energy, Oil, Gas & Consumable Fuels) | 65,100 | 50,350 | ||||||||||||||
Bangkok Bank PCL (Financials, Banks) | 71,100 | 298,194 | ||||||||||||||
Bangkok Chain Hospital PCL (Health Care, Health Care Providers & Services) | 79,000 | 33,190 | ||||||||||||||
Bangkok Dusit Medical Services PCL (Health Care, Health Care Providers & Services) | 603,600 | 429,366 | ||||||||||||||
Bangkok Expressway and Metro PCL (Industrials, Transportation Infrastructure) | 428,500 | 127,383 | ||||||||||||||
Bangkok Insurance PCL (Financials, Insurance) | 6,900 | 54,010 | ||||||||||||||
The accompanying notes are an integral part of these financial statements.
Wells Fargo Funds | 81
Table of Contents
Portfolio of investments—February 29, 2020
FACTOR ENHANCED EMERGING MARKETS PORTFOLIO
| Shares | Value | |||||||||||||||
| Thailand (continued) | ||||||||||||||||
Bangkok Life Assurance PCL (Financials, Insurance) | 76,800 | $ | 38,097 | |||||||||||||
Bangkokland PCL (Real Estate, Real Estate Management & Development) | 967,600 | 31,834 | ||||||||||||||
Bank of Ayudhya PCL (Financials, Banks) | 103,700 | 81,104 | ||||||||||||||
Banpu PCL (Energy, Oil, Gas & Consumable Fuels) | 275,500 | 63,159 | ||||||||||||||
Berli Jucker PCL (Consumer Staples, Food & Staples Retailing) | 67,800 | 79,400 | ||||||||||||||
BTS Group Holdings PCL (Industrials, Road & Rail) | 485,200 | 170,431 | ||||||||||||||
Bumrungrad Hospital PCL (Health Care, Health Care Providers & Services) | 23,800 | 98,559 | ||||||||||||||
Carabao Group PCL (Consumer Staples, Beverages) | 26,400 | 60,633 | ||||||||||||||
Central Plaza Hotel PCL (Consumer Discretionary, Hotels, Restaurants & Leisure) | 65,300 | 37,958 | ||||||||||||||
Central Retail Corporation PCL (Consumer Discretionary, Multiline Retail) † | 49,083 | 48,997 | ||||||||||||||
CH Karnchang PCL (Industrials, Construction & Engineering) | 68,600 | 41,446 | ||||||||||||||
Charoen Pokphand Foods PCL (Consumer Staples, Food Products) | 279,600 | 240,566 | ||||||||||||||
Chularat Hospital PCL (Health Care, Health Care Providers & Services) | 327,800 | 26,352 | ||||||||||||||
Cimb Thai Bank PCL (Financials, Banks) † | 2,548,000 | 39,971 | ||||||||||||||
Com7 PCL (Consumer Discretionary, Specialty Retail) | 40,100 | 28,708 | ||||||||||||||
CP All PCL (Consumer Staples, Food & Staples Retailing) | 311,600 | 656,683 | ||||||||||||||
Delta Electronics Thailand PCL (Information Technology, Electronic Equipment, Instruments & Components) | 34,500 | 55,189 | ||||||||||||||
Electricity Genera PCL (Utilities, Independent Power & Renewable Electricity Producers) | 13,200 | 115,172 | ||||||||||||||
GFPT PCL (Consumer Staples, Food Products) | 75,000 | 25,611 | ||||||||||||||
Global Power Synergy PCL (Utilities, Independent Power & Renewable Electricity Producers) | 86,500 | 175,189 | ||||||||||||||
Gulf Energy Development PCL (Utilities, Independent Power & Renewable Electricity Producers) | 47,700 | 255,045 | ||||||||||||||
Gunkul Engineering PCL (Industrials, Electrical Equipment) | 296,300 | 23,339 | ||||||||||||||
Hana Microelectronics PCL (Information Technology, Electronic Equipment, Instruments & Components) | 27,700 | 29,979 | ||||||||||||||
Home Product Center PCL (Consumer Discretionary, Specialty Retail) | 356,400 | 145,818 | ||||||||||||||
Impact Growth REIT (Real Estate, Equity REITs) | 37,700 | 24,134 | ||||||||||||||
Indorama Ventures PCL (Materials, Chemicals) | 117,400 | 99,702 | ||||||||||||||
Intouch Holdings PCL (Communication Services, Wireless Telecommunication Services) | 114,800 | 198,900 | ||||||||||||||
Jasmine International PCL (Communication Services, Diversified Telecommunication Services) | 168,800 | 26,129 | ||||||||||||||
Kasikornbank PCL -Non-voting (Financials, Banks) | 106,500 | 405,769 | ||||||||||||||
KCE Electronics PCL (Information Technology, Electronic Equipment, Instruments & Components) | 45,800 | 32,803 | ||||||||||||||
Kiatnakin Bank PCL (Financials, Banks) | 49,600 | 98,580 | ||||||||||||||
Krung Thai Bank PCL (Financials, Banks) | 765,900 | 342,644 | ||||||||||||||
Krungthai Card PCL (Financials, Consumer Finance) | 50,600 | 63,196 | ||||||||||||||
Land & Houses PCL (Real Estate, Real Estate Management & Development) | 442,100 | 119,319 | ||||||||||||||
Major Cineplex Group PCL (Communication Services, Entertainment) | 40,800 | 24,653 | ||||||||||||||
MBK PCL (Real Estate, Real Estate Management & Development) | 69,600 | 39,807 | ||||||||||||||
Minor International PCL (Consumer Discretionary, Hotels, Restaurants & Leisure) | 181,800 | 160,699 | ||||||||||||||
MK Restaurants Group PCL (Consumer Discretionary, Hotels, Restaurants & Leisure) | 13,800 | 26,445 | ||||||||||||||
Muangthai Leasing PCL (Financials, Consumer Finance) | 37,700 | 69,956 | ||||||||||||||
Osotspa PCL (Consumer Staples, Beverages) | 89,200 | 119,879 | ||||||||||||||
Plan B Media PCL (Communication Services, Media) | 128,800 | 21,253 | ||||||||||||||
Pruksa Holding PCL (Real Estate, Real Estate Management & Development) | 54,500 | 24,900 | ||||||||||||||
PTG Energy PCL (Consumer Discretionary, Specialty Retail) | 53,300 | 24,218 | ||||||||||||||
PTT Global Chemical PCL (Materials, Chemicals) | 116,500 | 155,004 | ||||||||||||||
PTT PCL (Energy, Oil, Gas & Consumable Fuels) | 693,300 | 869,156 | ||||||||||||||
Quality Houses PCL (Real Estate, Real Estate Management & Development) | 554,900 | 40,034 | ||||||||||||||
Ramkamhaeng Hospital PCL (Health Care, Health Care Providers & Services) | 7,100 | 31,852 | ||||||||||||||
Ratchaburi Electricity Generating Holding PCL (Utilities, Independent Power & Renewable Electricity Producers) | 37,700 | 71,073 | ||||||||||||||
Sansiri PCL (Real Estate, Real Estate Management & Development) | 989,300 | 22,531 | ||||||||||||||
Siam City Cement PCL (Materials, Construction Materials) | 5,100 | 25,417 | ||||||||||||||
Siam Commercial Bank PCL (Financials, Banks) | 146,600 | 411,537 | ||||||||||||||
Siam Global House PCL (Consumer Discretionary, Specialty Retail) | 127,900 | 57,001 | ||||||||||||||
The accompanying notes are an integral part of these financial statements.
82 | Wells Fargo Funds
Table of Contents
Portfolio of investments—February 29, 2020
FACTOR ENHANCED EMERGING MARKETS PORTFOLIO
| Shares | Value | |||||||||||||||
| Thailand (continued) | ||||||||||||||||
Sino Thai Engineering & Construction PCL (Industrials, Construction & Engineering) | 68,100 | $ | 32,695 | |||||||||||||
Sri Trang Agro-Industry PCL (Consumer Discretionary, Auto Components) | 52,000 | 19,718 | ||||||||||||||
Srisawad Power 1979 PCL (Financials, Diversified Financial Services) | 48,140 | 104,609 | ||||||||||||||
Star Petroleum Refining PCL (Energy, Oil, Gas & Consumable Fuels) | 113,300 | 29,011 | ||||||||||||||
STARK Corporation PCL (Communication Services, Media) † | 373,300 | 23,897 | ||||||||||||||
Supalai PCL (Real Estate, Real Estate Management & Development) | 81,600 | 42,453 | ||||||||||||||
Thai Oil PCL (Energy, Oil, Gas & Consumable Fuels) | 62,800 | 88,397 | ||||||||||||||
Thai President Foods PCL (Consumer Staples, Food Products) | 7,900 | 45,813 | ||||||||||||||
Thai Union Group PCL (Consumer Staples, Food Products) | 242,600 | 119,352 | ||||||||||||||
Thai Vegetable Oil PCL (Consumer Staples, Food Products) | 48,500 | 42,575 | ||||||||||||||
Thaifoods Group PCL (Consumer Staples, Food Products) | 132,200 | 14,312 | ||||||||||||||
Thanachart Capital PCL (Financials, Banks) | 56,600 | 95,701 | ||||||||||||||
The Siam Cement PCL (Materials, Construction Materials) | 43,800 | 436,249 | ||||||||||||||
Thonburi Healthcare Group PCL (Health Care, Health Care Providers & Services) | 33,200 | 23,868 | ||||||||||||||
Tipco Asphalt PCL (Materials, Construction Materials) | 70,300 | 42,427 | ||||||||||||||
Tisco Financial Group PCL (Financials, Banks) | 38,200 | 120,217 | ||||||||||||||
TMB Bank PCL (Financials, Banks) | 2,895,900 | 101,147 | ||||||||||||||
TOA Paint Thailand PCL (Materials, Chemicals) | 36,100 | 36,011 | ||||||||||||||
Total Access Communication PCL (Communication Services, Wireless Telecommunication Services) | 35,200 | 41,332 | ||||||||||||||
TPI Polene PCL (Materials, Construction Materials) | 488,900 | 19,515 | ||||||||||||||
TPI Polene Power PCL (Utilities, Independent Power & Renewable Electricity Producers) | 105,600 | 13,371 | ||||||||||||||
True Corporation PCL (Communication Services, Diversified Telecommunication Services) | 1,220,500 | 131,617 | ||||||||||||||
TTW PCL (Utilities, Water Utilities) | 62,000 | 27,366 | ||||||||||||||
VGI Global Media PCL (Communication Services, Media) | 178,700 | 38,252 | ||||||||||||||
Vibhavadi Medical Center PCL (Health Care, Health Care Providers & Services) | 400,200 | 18,770 | ||||||||||||||
WHA Corporation PCL (Real Estate, Real Estate Management & Development) | 560,200 | 49,406 | ||||||||||||||
WHA Premium Growth Freehold & Leasehold REIT (Real Estate, Equity REITs) | 94,600 | 48,866 | ||||||||||||||
| 9,908,012 | ||||||||||||||||
|
| |||||||||||||||
| Turkey: 0.89% | ||||||||||||||||
Akbank TAS (Financials, Banks) † | 154,949 | 167,992 | ||||||||||||||
Anadolu Efes Biracilik ve Malt Sanayii AS (Consumer Staples, Beverages) | 12,023 | 42,811 | ||||||||||||||
Arcelik AS (Consumer Discretionary, Household Durables) † | 14,706 | 44,058 | ||||||||||||||
Aselsan Elektronik Sanayi ve Ticaret AS (Industrials, Aerospace & Defense) | 15,497 | 68,628 | ||||||||||||||
Bim Birlesik Magazalar AS (Consumer Staples, Food & Staples Retailing) | 22,592 | 174,638 | ||||||||||||||
Coca-Cola Icecek Uretim AS (Consumer Staples, Beverages) | 4,724 | 34,076 | ||||||||||||||
Emlak Konut Gayrimenkul Yati AS (Real Estate, Equity REITs) | 130,953 | 29,342 | ||||||||||||||
Enka Insaat ve Sanayi AS (Industrials, Industrial Conglomerates) | 75,303 | 77,711 | ||||||||||||||
Eregli Demir ve Celik Fabrikalari TAS (Materials, Metals & Mining) | 63,750 | 85,056 | ||||||||||||||
Ford Otomotiv Sanayi AS (Consumer Discretionary, Automobiles) | 4,283 | 54,059 | ||||||||||||||
Haci Omer Sabanci Holding AS (Financials, Diversified Financial Services) | 63,131 | 86,923 | ||||||||||||||
Koc Holding AS (Industrials, Industrial Conglomerates) | 48,775 | 135,920 | ||||||||||||||
Koza Altin Isletmeleri AS (Materials, Metals & Mining) † | 2,215 | 25,969 | ||||||||||||||
Pegasus Hava Tasimaciligi AS (Industrials, Airlines) † | 2,587 | 22,463 | ||||||||||||||
Petkim Petrokimya Holding AS (Materials, Chemicals) † | 48,167 | 28,145 | ||||||||||||||
Soda Sanayii AS (Materials, Chemicals) | 25,951 | 24,060 | ||||||||||||||
Sok Marketler Ticaret AS (Consumer Staples, Food & Staples Retailing) † | 16,275 | 22,200 | ||||||||||||||
TAV Havalimanlari Holding AS (Industrials, Transportation Infrastructure) | 8,914 | 29,201 | ||||||||||||||
Tekfen Holding AS (Industrials, Construction & Engineering) | 13,290 | 31,768 | ||||||||||||||
Tofas Turk Otomobil Fabrikasi AS (Consumer Discretionary, Automobiles) | 6,678 | 28,479 | ||||||||||||||
Tupras Turkiye Petrol Rafinerileri AS (Energy, Oil, Gas & Consumable Fuels) | 6,802 | 110,972 | ||||||||||||||
Turk Hava Yollari Anonim Ortakligi AS (Industrials, Airlines) † | 39,884 | 75,389 | ||||||||||||||
Turk Sise ve Cam Fabrikalari AS (Industrials, Industrial Conglomerates) | 36,061 | 28,118 | ||||||||||||||
Turk Telekomunikasyon AS (Communication Services, Diversified Telecommunication Services) † | 25,733 | 31,140 | ||||||||||||||
Turkcell Iletisim Hizmetleri AS (Communication Services, Wireless Telecommunication Services) | 51,974 | 115,638 | ||||||||||||||
The accompanying notes are an integral part of these financial statements.
Wells Fargo Funds | 83
Table of Contents
Portfolio of investments—February 29, 2020
FACTOR ENHANCED EMERGING MARKETS PORTFOLIO
| Shares | Value | |||||||||||||||
| Turkey (continued) | ||||||||||||||||
Turkiye Garanti Bankasi AS (Financials, Banks) † | 106,509 | $ | 163,053 | |||||||||||||
Turkiye Halk Bankasi AS (Financials, Banks) † | 33,253 | 31,861 | ||||||||||||||
Turkiye Is Bankasi Class C AS (Financials, Banks) † | 76,705 | 70,635 | ||||||||||||||
Turkiye Vakiflar Bankasi TAO AS (Financials, Banks) † | 48,459 | 41,225 | ||||||||||||||
Ulker Biskuvi Sanayi AS (Consumer Staples, Food Products) † | 8,792 | 29,147 | ||||||||||||||
Yapi Ve Kredi Bankasi AS (Financials, Banks) † | 74,075 | 27,248 | ||||||||||||||
| 1,937,925 | ||||||||||||||||
|
| |||||||||||||||
Total Common Stocks (Cost $209,342,854) |
| 200,536,027 | ||||||||||||||
|
| |||||||||||||||
| Interest rate | Maturity date | Principal | ||||||||||||||
| Foreign Corporate Bonds and Notes: 0.00% | ||||||||||||||||
| India: 0.00% | ||||||||||||||||
Britannia Industries Limited (Consumer Staples, Food Products) | 8.00 | % | 8-28-2022 | INR | 229,650 | 3,269 | ||||||||||
|
| |||||||||||||||
Total Foreign Corporate Bonds and Notes (Cost $3,268) | 3,269 | |||||||||||||||
|
| |||||||||||||||
| Dividend yield | Shares | |||||||||||||||
Preferred Stocks: 3.10% | ||||||||||||||||
| Brazil: 2.82% | ||||||||||||||||
Alpargatas SA (Consumer Staples, Personal Products) | 0.18 | 10,040 | 70,811 | |||||||||||||
Azul SA (Industrials, Transportation Infrastructure) † | 0.00 | 16,300 | 161,983 | |||||||||||||
Banco Bradesco SA (Financials, Banks) | 6.92 | 210,233 | 1,435,277 | |||||||||||||
Banco do Estado do Rio Grande do Sul SA Class B (Financials, Banks) | 6.62 | 11,400 | 46,269 | |||||||||||||
Banco Inter SA (Financials, Banks) | 0.49 | 11,600 | 39,714 | |||||||||||||
Banco Santander Brasil SA (Financials, Banks) | 8.15 | 22,600 | 98,751 | |||||||||||||
Bradespar SA (Materials, Metals & Mining) | 4.04 | 11,800 | 88,106 | |||||||||||||
Braskem SA Class A (Materials, Chemicals) | 3.43 | 6,210 | 37,341 | |||||||||||||
Companhia Brasileira de Distribuicao (Consumer Staples, Food & Staples Retailing) | 1.21 | 8,273 | 133,403 | |||||||||||||
Companhia de Saneamento do Parana (Utilities, Water Utilities) | 4.45 | 18,240 | 80,760 | |||||||||||||
Companhia de Transmissao de Energia Electrica Paulista (Utilities, Electric Utilities) | 6.74 | 8,720 | 42,977 | |||||||||||||
Companhia Energetica de Minas Gerais SA (Utilities, Electric Utilities) | 5.46 | 44,669 | 139,444 | |||||||||||||
Companhia Energetica de Sao Paulo Class B (Utilities, Independent Power & Renewable Electricity Producers) | 3.09 | 8,900 | 64,881 | |||||||||||||
Companhia Paranaense de Energia-Copel Class B (Utilities, Electric Utilities) | 3.82 | 4,700 | 75,368 | |||||||||||||
Energisa SA (Utilities, Electric Utilities) | 1.59 | 8,270 | 18,678 | |||||||||||||
Gerdau SA (Materials, Metals & Mining) | 1.84 | 56,000 | 212,008 | |||||||||||||
Gol Linhas Aereas Inteligentes SA (Industrials, Airlines) † | 0.00 | 7,200 | 41,217 | |||||||||||||
Itau Unibanco Holding SA (Financials, Banks) | 6.45 | 258,070 | 1,846,696 | |||||||||||||
Itaúsa Investimentos Itaú SA (Financials, Banks) | 7.45 | 243,061 | 652,779 | |||||||||||||
Klabin SA (Materials, Containers & Packaging) | 4.67 | 143,800 | 125,410 | |||||||||||||
Lojas Americanas SA (Consumer Discretionary, Multiline Retail) | 0.63 | 44,400 | 264,103 | |||||||||||||
Marcopolo SA (Industrials, Machinery) | 1.25 | 37,300 | 40,871 | |||||||||||||
Metalurgica Gerdau SA (Materials, Metals & Mining) | 2.10 | 35,300 | 62,755 | |||||||||||||
Telefonica Brasil SA (Communication Services, Diversified Telecommunication Services) | 6.61 | 24,509 | 292,558 | |||||||||||||
Usinas Siderurgicas de Minas Gerais SA Class A (Materials, Metals & Mining) | 1.08 | 24,200 | 44,213 | |||||||||||||
| 6,116,373 | ||||||||||||||||
|
| |||||||||||||||
| Chile: 0.08% | ||||||||||||||||
Coca-Cola Embonor SA Class B (Consumer Staples, Food Products) | 8.97 | 17,918 | 24,693 | |||||||||||||
Embotelladora Andina SA Class B (Consumer Staples, Food & Staples Retailing) | 5.45 | 21,170 | 51,120 | |||||||||||||
Sociedad Quimica y Minera de Chile SA Class B (Materials, Chemicals) | 4.59 | 3,621 | 95,893 | |||||||||||||
| 171,706 | ||||||||||||||||
|
| |||||||||||||||
The accompanying notes are an integral part of these financial statements.
84 | Wells Fargo Funds
Table of Contents
Portfolio of investments—February 29, 2020
FACTOR ENHANCED EMERGING MARKETS PORTFOLIO
| Dividend yield | Shares | Value | ||||||||||||||
| Colombia: 0.11% | ||||||||||||||||
Banco Davivienda SA (Financials, Banks) | 2.15 | % | 5,681 | $ | 67,800 | |||||||||||
Bancolombia SA (Financials, Banks) | 2.79 | 14,271 | 170,642 | |||||||||||||
| 238,442 | ||||||||||||||||
|
| |||||||||||||||
| Russia: 0.09% | ||||||||||||||||
Bashneft PAO (Energy, Oil, Gas & Consumable Fuels) | 10.01 | 1,104 | 27,701 | |||||||||||||
Transneft PJSC (Energy, Oil, Gas & Consumable Fuels) | 7.74 | 78 | 171,400 | |||||||||||||
| 199,101 | ||||||||||||||||
|
| |||||||||||||||
Total Preferred Stocks (Cost $7,102,946) | 6,725,622 | |||||||||||||||
|
| |||||||||||||||
| Expiration date | ||||||||||||||||
Rights: 0.00% | ||||||||||||||||
| Hong Kong: 0.00% | �� | |||||||||||||||
Legend Holdings Corporation H Shares (Financials, Diversified Financial Services) †(a) | 5-9-2029 | 3,061 | 0 | |||||||||||||
|
| |||||||||||||||
| South Korea: 0.00% | ||||||||||||||||
HDC Hyundai DevelopmentCo-Engineering & Construction (Industrials, Construction & Engineering) †(a) | 3-6-2020 | 892 | 241 | |||||||||||||
|
| |||||||||||||||
Total Rights (Cost $0) | 241 | |||||||||||||||
|
| |||||||||||||||
Warrants: 0.01% | ||||||||||||||||
| Malaysia: 0.01% | ||||||||||||||||
Serba Dinamik Holdings Bhd (Energy, Energy Equipment & Services) † | 15,300 | 1,234 | ||||||||||||||
Sunway Bhd (Real Estate, Real Estate Management & Development) † | 122,430 | 10,311 | ||||||||||||||
| 11,545 | ||||||||||||||||
|
| |||||||||||||||
| Thailand: 0.00% | ||||||||||||||||
BTS Group Holdings PCL (Industrials, Road & Rail) † | 51,660 | 1,408 | ||||||||||||||
Minor International PCL (Consumer Discretionary, Hotels, Restaurants & Leisure) † | 12,585 | 689 | ||||||||||||||
| 2,097 | ||||||||||||||||
|
| |||||||||||||||
Total Warrants (Cost $0) | 13,642 | |||||||||||||||
|
| |||||||||||||||
| Yield | ||||||||||||||||
| Short-Term Investments: 3.10% | ||||||||||||||||
| Investment Companies: 3.10% | ||||||||||||||||
Wells Fargo Government Money Market Fund Select Class (l)(u) | 1.52 | 6,720,374 | 6,720,374 | |||||||||||||
|
| |||||||||||||||
Total Short-Term Investments (Cost $6,720,374) | 6,720,374 | |||||||||||||||
|
| |||||||||||||||
| Total investments in securities (Cost $223,169,442) | 98.61 | % | 213,999,175 | |||||
Other assets and liabilities, net | 1.39 | 3,022,184 | ||||||
|
|
|
| |||||
| Total net assets | 100.00 | % | $ | 217,021,359 | ||||
|
|
|
| |||||
The accompanying notes are an integral part of these financial statements.
Wells Fargo Funds | 85
Table of Contents
Portfolio of investments—February 29, 2020
FACTOR ENHANCED EMERGING MARKETS PORTFOLIO
| † | Non-income-earning security |
| 144A | The security may be resold in transactions exempt from registration, normally to qualified institutional buyers, pursuant to Rule 144A under the Securities Act of 1933. |
| (a) | The security is fair valued in accordance with procedures approved by the Board of Trustees. |
| ‡ | Security is valued using significant unobservable inputs. |
| (l) | The issuer of the security is an affiliated person of the Portfolio as defined in the Investment Company Act of 1940. |
| (u) | The rate represents the7-day annualized yield at period end. |
Abbreviations:
| ADR | American depositary receipt |
| GDR | Global depositary receipt |
| INR | Indian Rupee |
| REIT | Real estate investment trust |
Futures Contracts
| Description | Number of contracts | Expiration date | Notional cost | Notional value | Unrealized gains | Unrealized losses | ||||||||||||||||||
Long | ||||||||||||||||||||||||
MSCI Emerging Markets Index | 192 | 3-20-2020 | $ | 10,167,740 | $ | 9,684,480 | $ | 0 | $ | (483,260 | ) | |||||||||||||
Investments in Affiliates
An affiliated investment is an investment in which the Portfolio owns at least 5% of the outstanding voting shares of the issuer or as a result of other relationships, such as the Portfolio and the issuer having the same adviser or investment manager. Transactions with issuers that were either affiliated persons of the Portfolio at the beginning of the period or the end of the period were as follows:
| Shares, beginning of period | Shares purchased | Shares sold | Shares, end of period | Net realized gains (losses) | Net change in unrealized gains (losses) | Income from affiliated securities | Value, end of period | % of net assets | ||||||||||||||||||||||||||||
| Short-Term Investments | ||||||||||||||||||||||||||||||||||||
Investment Companies | ||||||||||||||||||||||||||||||||||||
Wells Fargo Government Money Market Fund Select Class | 7,871,946 | 69,105,943 | (70,257,515 | ) | 6,720,374 | $ | 0 | $ | 0 | $ | 136,960 | $ | 6,720,374 | 3.10 | % | |||||||||||||||||||||
The accompanying notes are an integral part of these financial statements.
86 | Wells Fargo Funds
Table of Contents
Portfolio of investments—February 29, 2020
FACTOR ENHANCED INTERNATIONAL PORTFOLIO
| Shares | Value | |||||||||||||||
Common Stocks: 94.59% |
| |||||||||||||||
| Australia: 8.62% | ||||||||||||||||
Afterpay Touch Group Limited (Information Technology, IT Services) † | 10,672 | $ | 237,310 | |||||||||||||
AGL Energy Limited (Utilities, Multi-Utilities) | 34,653 | 433,949 | ||||||||||||||
ALS Limited (Industrials, Professional Services) | 24,980 | 138,122 | ||||||||||||||
Altium Limited (Information Technology, Software) | 6,209 | 127,375 | ||||||||||||||
Alumina Limited (Materials, Metals & Mining) | 139,520 | 178,599 | ||||||||||||||
Ansell Limited (Health Care, Health Care Equipment & Supplies) | 6,626 | 129,622 | ||||||||||||||
APA Group (Utilities, Gas Utilities) | 49,430 | 348,364 | ||||||||||||||
Aristocrat Leisure Limited (Consumer Discretionary, Hotels, Restaurants & Leisure) | 32,571 | 714,411 | ||||||||||||||
ASX Limited (Financials, Capital Markets) | 9,670 | 472,394 | ||||||||||||||
Atlas Arteria Stapled Securities (Industrials, Transportation Infrastructure) | 44,427 | 234,133 | ||||||||||||||
Aurizon Holdings Limited (Industrials, Road & Rail) | 97,201 | 309,446 | ||||||||||||||
AusNet Services (Utilities, Electric Utilities) | 94,217 | 104,464 | ||||||||||||||
Australia & New Zealand Banking Group Limited (Financials, Banks) | 147,702 | 2,381,980 | ||||||||||||||
Bank of Queensland Limited (Financials, Banks) | 21,836 | 107,401 | ||||||||||||||
Beach Petroleum Limited (Energy, Oil, Gas & Consumable Fuels) | 83,120 | 98,254 | ||||||||||||||
Bendigo Bank Limited (Financials, Banks) | 25,741 | 155,426 | ||||||||||||||
BHP Billiton Limited (Materials, Metals & Mining) | 153,931 | 3,345,754 | ||||||||||||||
BlueScope Steel Limited (Materials, Metals & Mining) | 25,105 | 196,330 | ||||||||||||||
Boral Limited (Materials, Construction Materials) | 65,662 | 196,007 | ||||||||||||||
Brambles Limited (Industrials, Commercial Services & Supplies) | 79,311 | 624,234 | ||||||||||||||
Caltex Australia Limited (Energy, Oil, Gas & Consumable Fuels) | 12,886 | 277,121 | ||||||||||||||
Carsales.com Limited (Communication Services, Interactive Media & Services) | 12,108 | 129,510 | ||||||||||||||
Challenger Financial Services Group Limited (Financials, Diversified Financial Services) | 21,924 | 131,945 | ||||||||||||||
Charter Hall Group (Real Estate, Equity REITs) | 22,997 | 188,185 | ||||||||||||||
CIMIC Group Limited (Industrials, Construction & Engineering) | 4,852 | 76,402 | ||||||||||||||
Cleanaway Waste Management Limited (Industrials, Commercial Services & Supplies) | 100,904 | 150,939 | ||||||||||||||
Coca-Cola Amatil Limited (Consumer Staples, Beverages) | 25,232 | 190,025 | ||||||||||||||
Cochlear Limited (Health Care, Health Care Equipment & Supplies) | 2,925 | 400,643 | ||||||||||||||
Coles Group Liimited (Consumer Staples, Food & Staples Retailing) | 56,192 | 526,543 | ||||||||||||||
Commonwealth Bank of Australia (Financials, Banks) | 90,626 | 4,865,089 | ||||||||||||||
Computershare Limited (Information Technology, IT Services) | 26,278 | 266,326 | ||||||||||||||
Crown Limited (Consumer Discretionary, Hotels, Restaurants & Leisure) | 15,045 | 100,403 | ||||||||||||||
CSL Limited (Health Care, Biotechnology) | 22,316 | 4,558,526 | ||||||||||||||
Dexus Property Group (Real Estate, Equity REITs) | 55,745 | 444,076 | ||||||||||||||
Domino’s Pizza Enterprises Limited (Consumer Discretionary, Hotels, Restaurants & Leisure) | 3,012 | 110,245 | ||||||||||||||
Downer EDI Limited (Industrials, Commercial Services & Supplies) | 28,828 | 108,883 | ||||||||||||||
Evolution Mining Limited (Materials, Metals & Mining) | 74,159 | 193,866 | ||||||||||||||
Fortescue Metals Group Limited (Materials, Metals & Mining) | 88,773 | 592,948 | ||||||||||||||
Goodman Group (Real Estate, Equity REITs) | 83,670 | 821,494 | ||||||||||||||
Harvey Norman Holdings Limited (Consumer Discretionary, Multiline Retail) | 31,679 | 77,424 | ||||||||||||||
Iluka Resources Limited (Materials, Metals & Mining) | 22,622 | 124,381 | ||||||||||||||
Incitec Pivot Limited (Materials, Chemicals) | 82,361 | 148,328 | ||||||||||||||
Insurance Australia Group Limited (Financials, Insurance) | 124,790 | 525,146 | ||||||||||||||
JBHi-Fi Limited (Consumer Discretionary, Specialty Retail) | 4,972 | 120,234 | ||||||||||||||
Lendlease Corporation Limited (Real Estate, Real Estate Management & Development) | 29,493 | 343,079 | ||||||||||||||
Link Administration Holdings Limited (Information Technology, IT Services) | 26,880 | 83,354 | ||||||||||||||
Macquarie Group Limited (Financials, Capital Markets) | 18,450 | 1,640,453 | ||||||||||||||
Magellan Financial Group Limited (Financials, Capital Markets) | 6,774 | 250,601 | ||||||||||||||
Medibank Private Limited (Financials, Insurance) | 139,173 | 259,985 | ||||||||||||||
Metcash Limited (Consumer Staples, Food & Staples Retailing) | 47,559 | 77,369 | ||||||||||||||
Mirvac Group (Real Estate, Equity REITs) | 206,335 | 410,428 | ||||||||||||||
National Australia Bank Limited (Financials, Banks) | 150,569 | 2,477,775 | ||||||||||||||
Newcrest Mining Limited (Materials, Metals & Mining) | 38,037 | 623,958 | ||||||||||||||
The accompanying notes are an integral part of these financial statements.
Wells Fargo Funds | 87
Table of Contents
Portfolio of investments—February 29, 2020
FACTOR ENHANCED INTERNATIONAL PORTFOLIO
| Shares | Value | |||||||||||||||
| Australia (continued) | ||||||||||||||||
NIB Holdings Limited (Financials, Insurance) | 22,684 | $ | 69,310 | |||||||||||||
Northern Star Resources Limited (Materials, Metals & Mining) | 31,064 | 271,317 | ||||||||||||||
Orica Limited (Materials, Chemicals) | 19,439 | 254,103 | ||||||||||||||
Origin Energy Limited (Energy, Oil, Gas & Consumable Fuels) | 92,474 | 427,623 | ||||||||||||||
Orora Limited (Materials, Containers & Packaging) | 62,037 | 111,477 | ||||||||||||||
OZ Minerals Limited (Materials, Metals & Mining) | 16,691 | 98,940 | ||||||||||||||
Qantas Airways Limited (Industrials, Airlines) | 89,211 | 326,290 | ||||||||||||||
QBE Insurance Group Limited (Financials, Insurance) | 67,743 | 602,116 | ||||||||||||||
Qube Holdings Limited (Industrials, Transportation Infrastructure) | 73,957 | 142,184 | ||||||||||||||
Ramsay Health Care Limited (Health Care, Health Care Providers & Services) | 7,974 | 356,736 | ||||||||||||||
REA Group Limited (Communication Services, Interactive Media & Services) | 2,471 | 160,406 | ||||||||||||||
Reece Limited (Industrials, Trading Companies & Distributors) | 17,236 | 129,127 | ||||||||||||||
Reliance Worldwide Corporation Limited (Industrials, Building Products) | 39,000 | 87,247 | ||||||||||||||
Rio Tinto Limited (Materials, Metals & Mining) | 19,185 | 1,102,462 | ||||||||||||||
Santos Limited (Energy, Oil, Gas & Consumable Fuels) | 90,908 | 414,735 | ||||||||||||||
Scentre Group (Real Estate, Equity REITs) | 273,856 | 620,504 | ||||||||||||||
SEEK Limited (Industrials, Professional Services) | 17,623 | 241,379 | ||||||||||||||
Sonic Healthcare Limited (Health Care, Health Care Providers & Services) | 23,402 | 444,222 | ||||||||||||||
Spark Infrastructure Group (Utilities, Electric Utilities) | 86,977 | 120,178 | ||||||||||||||
Stockland Corporation Limited (Real Estate, Equity REITs) | 122,254 | 377,919 | ||||||||||||||
Suncorp Group Limited (Financials, Insurance) | 66,461 | 496,517 | ||||||||||||||
Sydney Airport Holdings Limited (Industrials, Transportation Infrastructure) | 118,348 | 604,808 | ||||||||||||||
Tabcorp Holdings Limited (Consumer Discretionary, Hotels, Restaurants & Leisure) | 103,589 | 258,055 | ||||||||||||||
Telstra Corporation Limited (Communication Services, Diversified Telecommunication Services) | 579,370 | 1,306,643 | ||||||||||||||
The GPT Group (Real Estate, Equity REITs) | 86,333 | 326,298 | ||||||||||||||
The Star Entertainment Group Limited (Consumer Discretionary, Hotels, Restaurants & Leisure) | 48,822 | 117,511 | ||||||||||||||
TPG Telecom Limited (Communication Services, Diversified Telecommunication Services) | 18,755 | 92,758 | ||||||||||||||
Transurban Group (Industrials, Transportation Infrastructure) | 138,329 | 1,348,860 | ||||||||||||||
Treasury Wine Estates Limited (Consumer Staples, Beverages) | 37,345 | 272,625 | ||||||||||||||
Vicinity Centres (Real Estate, Equity REITs) | 167,555 | 237,305 | ||||||||||||||
Washington H. Soul Pattinson & Company Limited (Energy, Oil, Gas & Consumable Fuels) | 7,427 | 95,418 | ||||||||||||||
Wesfarmers Limited (Consumer Discretionary, Multiline Retail) | 55,924 | 1,496,799 | ||||||||||||||
Westpac Banking Corporation (Financials, Banks) | 186,434 | 2,854,722 | ||||||||||||||
Whitehaven Coal Limited (Energy, Oil, Gas & Consumable Fuels) | 48,757 | 64,269 | ||||||||||||||
Wisetech Global Limited (Information Technology, Software) | 7,875 | 79,402 | ||||||||||||||
Woodside Petroleum Limited (Energy, Oil, Gas & Consumable Fuels) | 48,489 | 902,804 | ||||||||||||||
Woolworths Group Limited (Consumer Staples, Food & Staples Retailing) | 63,153 | 1,615,373 | ||||||||||||||
WorleyParsons Limited (Energy, Energy Equipment & Services) | 15,969 | 134,199 | ||||||||||||||
| 50,491,900 | ||||||||||||||||
|
| |||||||||||||||
| Austria: 0.26% | ||||||||||||||||
Andritz AG (Industrials, Machinery) | 3,774 | 133,553 | ||||||||||||||
Erste Bank Der Oesterreichischen Sparkassen AG (Financials, Banks) | 15,067 | 515,795 | ||||||||||||||
Immofinanz AG (Real Estate, Real Estate Management & Development) | 5,113 | 131,709 | ||||||||||||||
OMV AG (Energy, Oil, Gas & Consumable Fuels) | 7,292 | 305,404 | ||||||||||||||
Verbund AG (Utilities, Electric Utilities) | 3,404 | 162,139 | ||||||||||||||
Voestalpine AG (Materials, Metals & Mining) | 6,098 | 132,782 | ||||||||||||||
Wienerberger AG (Materials, Construction Materials) | 5,912 | 151,352 | ||||||||||||||
| 1,532,734 | ||||||||||||||||
|
| |||||||||||||||
| Belgium: 0.64% | ||||||||||||||||
Ackermans & Van Haaren NV (Financials, Diversified Financial Services) | 1,094 | 156,999 | ||||||||||||||
Aedifica SA (Real Estate, Equity REITs) | 1,319 | 170,947 | ||||||||||||||
Ageas NV (Financials, Insurance) | 9,871 | 459,286 | ||||||||||||||
The accompanying notes are an integral part of these financial statements.
88 | Wells Fargo Funds
Table of Contents
Portfolio of investments—February 29, 2020
FACTOR ENHANCED INTERNATIONAL PORTFOLIO
| Shares | Value | |||||||||||||||
| Belgium (continued) | ||||||||||||||||
Cofinimmo SA (Real Estate, Equity REITs) | 1,351 | $ | 215,065 | |||||||||||||
Colruyt SA (Consumer Staples, Food & Staples Retailing) | 3,087 | 143,187 | ||||||||||||||
Elia System Operator NV (Utilities, Electric Utilities) | 1,698 | 168,893 | ||||||||||||||
Groupe Bruxelles Lambert SA (Financials, Diversified Financial Services) | 4,233 | 384,800 | ||||||||||||||
Proximus SA (Communication Services, Diversified Telecommunication Services) | 8,041 | 199,698 | ||||||||||||||
Sofina SA (Financials, Diversified Financial Services) | 767 | 165,806 | ||||||||||||||
Solvay SA (Materials, Chemicals) | 3,874 | 353,535 | ||||||||||||||
Telenet Group Holding NV (Communication Services, Media) | 2,462 | 94,698 | ||||||||||||||
UCB SA (Health Care, Pharmaceuticals) | 6,073 | 562,274 | ||||||||||||||
Umicore SA (Materials, Chemicals) | 11,653 | 490,715 | ||||||||||||||
Warehouses De Pauw SCA (Real Estate, Equity REITs) | 6,809 | 182,464 | ||||||||||||||
| 3,748,367 | ||||||||||||||||
|
| |||||||||||||||
| Canada: 10.40% | ||||||||||||||||
Agnico-Eagle MinesLimited-U.S. Exchange Traded Shares (Materials, Metals & Mining) | 12,995 | 616,615 | ||||||||||||||
Air Canada (Industrials, Airlines) † | 14,100 | 359,788 | ||||||||||||||
Alimentation Couche-Tard Incorporated Class B (Consumer Staples, Food & Staples Retailing) | 41,970 | 1,274,500 | ||||||||||||||
Bank of Montreal (Financials, Banks) | 32,391 | 2,201,068 | ||||||||||||||
Barrick Gold Corporation (Materials, Metals & Mining) | 96,171 | 1,834,217 | ||||||||||||||
BCE Incorporated (Communication Services, Diversified Telecommunication Services) | 46,015 | 2,020,923 | ||||||||||||||
Brookfield Asset Management Incorporated Class A (Financials, Capital Markets) | 53,319 | 3,188,613 | ||||||||||||||
Canadian Imperial Bank of Commerce (Financials, Banks) | 22,874 | 1,740,963 | ||||||||||||||
Canadian National Railway Company (Industrials, Road & Rail) | 36,637 | 3,105,922 | ||||||||||||||
Canadian Natural Resources Limited (Energy, Oil, Gas & Consumable Fuels) | 61,200 | 1,575,310 | ||||||||||||||
Canadian Pacific Railway Limited (Industrials, Road & Rail) | 6,982 | 1,730,454 | ||||||||||||||
CGI Incorporated (Information Technology, IT Services) † | 11,965 | 840,692 | ||||||||||||||
Constellation Software Incorporated (Information Technology, Software) | 1,028 | 1,047,285 | ||||||||||||||
Dollarama Incorporated (Consumer Discretionary, Multiline Retail) | 15,832 | 465,435 | ||||||||||||||
Emera Incorporated (Utilities, Electric Utilities) | 12,100 | 509,872 | ||||||||||||||
Enbridge Incorporated (Energy, Oil, Gas & Consumable Fuels) | 102,200 | 3,803,995 | ||||||||||||||
Fairfax Financial Holdings Limited (Financials, Insurance) | 1,300 | 560,010 | ||||||||||||||
Fortis Incorporated (Utilities, Electric Utilities) | 22,144 | 896,154 | ||||||||||||||
Franco-Nevada Corporation (Materials, Metals & Mining) | 9,808 | 1,052,958 | ||||||||||||||
Intact Financial Corporation (Financials, Insurance) | 6,875 | 745,199 | ||||||||||||||
Kirkland Lake Gold Limited (Materials, Metals & Mining) | 10,300 | 332,194 | ||||||||||||||
Loblaw Companies Limited (Consumer Staples, Food & Staples Retailing) | 9,154 | 453,523 | ||||||||||||||
Magna International Incorporated (Consumer Discretionary, Auto Components) | 16,227 | 738,542 | ||||||||||||||
Manulife Financial Corporation (Financials, Insurance) | 96,600 | 1,623,614 | ||||||||||||||
Metro Incorporated (Consumer Staples, Food & Staples Retailing) | 12,730 | 495,827 | ||||||||||||||
National Bank of Canada (Financials, Banks) | 17,108 | 889,272 | ||||||||||||||
Open Text Corporation (Information Technology, Software) | 13,335 | 559,003 | ||||||||||||||
Pembina Pipeline Corporation (Energy, Oil, Gas & Consumable Fuels) | 24,952 | 898,811 | ||||||||||||||
Power Corporation of Canada (Financials, Insurance) | 16,896 | 373,481 | ||||||||||||||
Restaurant Brands International Incorporated (Consumer Discretionary, Hotels, Restaurants & Leisure) | 15,203 | 896,040 | ||||||||||||||
Rogers Communications Incorporated Class B (Communication Services, Wireless Telecommunication Services) | 18,322 | 839,625 | ||||||||||||||
Royal Bank of Canada (Financials, Banks) | 72,331 | 5,379,088 | ||||||||||||||
Shaw Communications Incorporated Class B (Communication Services, Media) | 24,926 | 431,388 | ||||||||||||||
Sun Life Financial Incorporated (Financials, Insurance) | 28,158 | 1,216,526 | ||||||||||||||
Suncor Energy Incorporated (Energy, Oil, Gas & Consumable Fuels) | 76,962 | 2,120,935 | ||||||||||||||
TC Energy Corporation (Energy, Oil, Gas & Consumable Fuels) | 47,600 | 2,480,980 | ||||||||||||||
Telus Corporation (Communication Services, Diversified Telecommunication Services) | 28,894 | 1,042,746 | ||||||||||||||
The Bank of Nova Scotia (Financials, Banks) | 62,808 | 3,285,809 | ||||||||||||||
The Toronto-Dominion Bank (Financials, Banks) | 92,028 | 4,733,554 | ||||||||||||||
Thomson Reuters Corporation (Industrials, Professional Services) | 8,353 | 620,509 | ||||||||||||||
The accompanying notes are an integral part of these financial statements.
Wells Fargo Funds | 89
Table of Contents
Portfolio of investments—February 29, 2020
FACTOR ENHANCED INTERNATIONAL PORTFOLIO
| Shares | Value | |||||||||||||||
| Canada (continued) | ||||||||||||||||
Waste Connections Incorporated - Toronto Exchange (Industrials, Commercial Services & Supplies) | 13,000 | $ | 1,251,719 | |||||||||||||
Wheaton Precious Metals Corporation (Materials, Metals & Mining) | 24,676 | 701,719 | ||||||||||||||
| 60,934,878 | ||||||||||||||||
|
| |||||||||||||||
| China: 0.30% | ||||||||||||||||
AAC Technologies Holdings Incorporated (Information Technology, Electronic Equipment, Instruments & Components) | 33,000 | 220,344 | ||||||||||||||
Beigene Limited (Health Care, Biotechnology) † | 40,167 | 482,708 | ||||||||||||||
Sands China Limited (Consumer Discretionary, Hotels, Restaurants & Leisure) | 120,800 | 579,052 | ||||||||||||||
Shenzhou International Group Holdings Limited (Consumer Discretionary, Textiles, Apparel & Luxury Goods) | 38,900 | 492,310 | ||||||||||||||
| 1,774,414 | ||||||||||||||||
|
| |||||||||||||||
| Denmark: 2.29% | ||||||||||||||||
Ambu AS Class B (Health Care, Health Care Equipment & Supplies) | 9,197 | 209,455 | ||||||||||||||
Carlsberg AS Class B (Consumer Staples, Beverages) | 5,397 | 713,795 | ||||||||||||||
Christian Hansen Holding AS (Materials, Chemicals) | 5,339 | 384,908 | ||||||||||||||
Coloplast AS Class B (Health Care, Health Care Equipment & Supplies) | 6,068 | 814,601 | ||||||||||||||
DSV AS (Industrials, Air Freight & Logistics) | 11,044 | 1,112,337 | ||||||||||||||
Genmab AS (Health Care, Biotechnology) † | 3,251 | 735,160 | ||||||||||||||
GN Store Nord AS (Health Care, Health Care Equipment & Supplies) | 6,527 | 364,220 | ||||||||||||||
H. Lundbeck AS (Health Care, Pharmaceuticals) | 3,254 | 113,445 | ||||||||||||||
ISS AS (Industrials, Commercial Services & Supplies) | 7,771 | 138,904 | ||||||||||||||
Novo Nordisk AS Class B (Health Care, Pharmaceuticals) | 89,510 | 5,244,296 | ||||||||||||||
Novozymes AS Class B (Materials, Chemicals) | 11,432 | 586,068 | ||||||||||||||
Orsted AS (Utilities, Electric Utilities) 144A | 9,162 | 945,874 | ||||||||||||||
Pandora AS (Consumer Discretionary, Textiles, Apparel & Luxury Goods) | 4,143 | 186,694 | ||||||||||||||
Royal Unibrew AS (Consumer Staples, Beverages) | 2,189 | 189,383 | ||||||||||||||
SimCorp AS (Information Technology, Software) | 2,071 | 199,989 | ||||||||||||||
Topdanmark AS (Financials, Insurance) | 2,415 | 105,484 | ||||||||||||||
Tryg AS (Financials, Insurance) | 6,128 | 171,942 | ||||||||||||||
Vestas Wind Systems AS (Industrials, Electrical Equipment) | 10,806 | 1,042,566 | ||||||||||||||
William Demant Holding (Health Care, Health Care Equipment & Supplies) † | 4,707 | 143,588 | ||||||||||||||
| 13,402,709 | ||||||||||||||||
|
| |||||||||||||||
| Finland: 1.14% | ||||||||||||||||
Elisa Oyj (Communication Services, Diversified Telecommunication Services) | 7,593 | 437,367 | ||||||||||||||
Fortum Oyj (Utilities, Electric Utilities) | 22,928 | 489,648 | ||||||||||||||
Huhtamaki Oyj (Materials, Containers & Packaging) | 4,840 | 198,740 | ||||||||||||||
Kesko Oyj Class B (Consumer Staples, Food & Staples Retailing) | 3,410 | 232,376 | ||||||||||||||
Kojamo Oyj (Real Estate, REITs) | 8,971 | 167,964 | ||||||||||||||
Kone Oyj Class B (Industrials, Machinery) | 20,812 | 1,178,840 | ||||||||||||||
Metso Oyj (Industrials, Machinery) | 7,262 | 236,321 | ||||||||||||||
Neste Oil Oyj (Energy, Oil, Gas & Consumable Fuels) | 20,440 | 816,908 | ||||||||||||||
Nokian Renkaat Oyj (Consumer Discretionary, Auto Components) | 6,982 | 181,749 | ||||||||||||||
Orion Oyj Class B (Health Care, Pharmaceuticals) | 5,461 | 217,951 | ||||||||||||||
Sampo Oyj Class A (Financials, Insurance) | 25,902 | 1,058,406 | ||||||||||||||
Stora Enso Oyj (Materials, Paper & Forest Products) | 34,584 | 409,853 | ||||||||||||||
UPM-Kymmene Oyj (Materials, Paper & Forest Products) | 29,308 | 901,872 | ||||||||||||||
Valmet Oyj Corporation (Industrials, Machinery) | 7,149 | 170,692 | ||||||||||||||
| 6,698,687 | ||||||||||||||||
|
| |||||||||||||||
The accompanying notes are an integral part of these financial statements.
90 | Wells Fargo Funds
Table of Contents
Portfolio of investments—February 29, 2020
FACTOR ENHANCED INTERNATIONAL PORTFOLIO
| Shares | Value | |||||||||||||||
| France: 5.53% | ||||||||||||||||
Aeroports de Paris SA (Industrials, Transportation Infrastructure) | 1,512 | $ | 224,760 | |||||||||||||
AirFrance-KLM SA (Industrials, Airlines) † | 14,044 | 107,101 | ||||||||||||||
Air Liquide SA (Materials, Chemicals) | 24,671 | 3,360,515 | ||||||||||||||
Alstom SA (Industrials, Machinery) | 9,785 | 483,097 | ||||||||||||||
Alten SA (Information Technology, IT Services) | 1,555 | 174,150 | ||||||||||||||
Altran Technologies SA (Information Technology, IT Services) | 11,772 | 189,518 | ||||||||||||||
Amundi SA (Financials, Capital Markets) 144A | 3,279 | 235,617 | ||||||||||||||
Arkema SA (Materials, Chemicals) | 4,072 | 385,209 | ||||||||||||||
Atos Origin SA (Information Technology, IT Services) | 4,877 | 366,933 | ||||||||||||||
bioMerieux (Health Care, Health Care Equipment & Supplies) | 2,067 | 191,715 | ||||||||||||||
Bouygues SA (Industrials, Construction & Engineering) | 15,151 | 599,351 | ||||||||||||||
Bureau Veritas SA (Industrials, Professional Services) | 15,213 | 374,455 | ||||||||||||||
Christian Dior SA (Consumer Discretionary, Textiles, Apparel & Luxury Goods) | 273 | 116,625 | ||||||||||||||
CNP Assurances SA (Financials, Insurance) | 9,111 | 143,191 | ||||||||||||||
Compagnie Generale des Etablissements Michelin SCA (Consumer Discretionary, Auto Components) | 9,202 | 986,148 | ||||||||||||||
Covivio (Real Estate, Equity REITs) | 3,154 | 335,677 | ||||||||||||||
Dassault Aviation SA (Industrials, Aerospace & Defense) | 129 | 135,100 | ||||||||||||||
Dassault Systemes SA (Information Technology, Software) | 7,188 | 1,140,472 | ||||||||||||||
Danone SA (Consumer Staples, Food Products) | 34,280 | 2,419,431 | ||||||||||||||
Eiffage SA (Industrials, Construction & Engineering) | 5,061 | 541,374 | ||||||||||||||
Elis SA (Industrials, Commercial Services & Supplies) | 11,424 | 199,494 | ||||||||||||||
Engie SA (Utilities, Multi-Utilities) | 94,562 | 1,579,092 | ||||||||||||||
Eurazeo SA (Financials, Diversified Financial Services) | 2,773 | 186,406 | ||||||||||||||
Eutelsat Communications SA (Communication Services, Media) | 9,011 | 121,760 | ||||||||||||||
Gecina SA (Real Estate, Equity REITs) | 2,568 | 455,576 | ||||||||||||||
Groupe Eurotunnel SE (Industrials, Transportation Infrastructure) | 23,707 | 383,852 | ||||||||||||||
Hermes International SA (Consumer Discretionary, Textiles, Apparel & Luxury Goods) | 1,775 | 1,252,079 | ||||||||||||||
ICADE (Real Estate, Equity REITs) | 1,759 | 175,252 | ||||||||||||||
Ingenico SA (Information Technology, Electronic Equipment, Instruments & Components) | 3,043 | 433,717 | ||||||||||||||
Ipsen SA (Health Care, Pharmaceuticals) | 1,911 | 124,922 | ||||||||||||||
JCDecaux SA (Communication Services, Media) | 4,377 | 101,148 | ||||||||||||||
Klepierre SA (Real Estate, Equity REITs) | 13,861 | 416,249 | ||||||||||||||
Lagardere SCA (Communication Services, Media) | 6,086 | 105,921 | ||||||||||||||
Legrand SA (Industrials, Electrical Equipment) | 13,868 | 1,064,396 | ||||||||||||||
Orange SA (Communication Services, Diversified Telecommunication Services) | 106,226 | 1,429,627 | ||||||||||||||
Orpea SA (Health Care, Health Care Providers & Services) | 2,445 | 317,248 | ||||||||||||||
Pernod-Ricard SA (Consumer Staples, Beverages) | 10,507 | 1,713,418 | ||||||||||||||
Publicis Groupe SA (Communication Services, Media) | 11,206 | 435,793 | ||||||||||||||
Remy Cointreau SA (Consumer Staples, Beverages) | 1,187 | 120,918 | ||||||||||||||
Rubis SCA (Utilities, Gas Utilities) | 5,073 | 275,107 | ||||||||||||||
Safran SA (Industrials, Aerospace & Defense) | 18,048 | 2,498,354 | ||||||||||||||
Sartorius Stedim Biotech SA (Health Care, Life Sciences Tools & Services) | 1,209 | 231,589 | ||||||||||||||
SEB SA (Consumer Discretionary, Household Durables) | 1,257 | 166,842 | ||||||||||||||
Sodexho Alliance SA (Consumer Discretionary, Hotels, Restaurants & Leisure) | 4,682 | 452,515 | ||||||||||||||
Sopra Steria Group (Information Technology, IT Services) | 896 | 145,073 | ||||||||||||||
Spie SA (Industrials, Commercial Services & Supplies) | 7,135 | 137,743 | ||||||||||||||
Suez Environnement Company SA (Utilities, Multi-Utilities) | 21,022 | 333,804 | ||||||||||||||
Teleperformance SE (Industrials, Professional Services) | 2,967 | 723,803 | ||||||||||||||
Thales SA (Industrials, Aerospace & Defense) | 5,229 | 528,143 | ||||||||||||||
Veolia Environnement SA (Utilities, Multi-Utilities) | 29,763 | 857,500 | ||||||||||||||
Vinci SA (Industrials, Construction & Engineering) | 28,898 | 2,920,078 | ||||||||||||||
| 32,397,858 | ||||||||||||||||
|
| |||||||||||||||
The accompanying notes are an integral part of these financial statements.
Wells Fargo Funds | 91
Table of Contents
Portfolio of investments—February 29, 2020
FACTOR ENHANCED INTERNATIONAL PORTFOLIO
| Shares | Value | |||||||||||||||
| Germany: 4.55% | ||||||||||||||||
Adidas AG (Consumer Discretionary, Textiles, Apparel & Luxury Goods) | 8,857 | $ | 2,493,673 | |||||||||||||
Allianz AG (Financials, Insurance) | 21,191 | 4,616,456 | ||||||||||||||
Alstria Office REIT AG (Real Estate, Equity REITs) | 8,654 | 163,844 | ||||||||||||||
Bechtle AG (Information Technology, IT Services) | 1,333 | 177,404 | ||||||||||||||
Beiersdorf AG (Consumer Staples, Personal Products) | 5,035 | 531,686 | ||||||||||||||
Brenntag AG (Industrials, Trading Companies & Distributors) | 7,821 | 354,862 | ||||||||||||||
Carl Zeiss Meditec AG (Health Care, Health Care Equipment & Supplies) | 1,810 | 192,555 | ||||||||||||||
Covestro AG (Materials, Chemicals) 144A | 8,383 | 324,821 | ||||||||||||||
CTS Eventim AG & Company KGaA (Communication Services, Entertainment) | 2,563 | 137,351 | ||||||||||||||
Deutsche Boerse AG (Financials, Capital Markets) | 9,429 | 1,483,688 | ||||||||||||||
Deutsche Lufthansa AG (Industrials, Airlines) | 14,281 | 188,865 | ||||||||||||||
Deutsche Post AG (Industrials, Air Freight & Logistics) | 50,061 | 1,506,732 | ||||||||||||||
Deutsche Wohnen AG (Real Estate, Real Estate Management & Development) | 17,576 | 717,500 | ||||||||||||||
E.ON SE (Utilities, Multi-Utilities) | 117,260 | 1,362,123 | ||||||||||||||
Evonik Industries AG (Materials, Chemicals) | 9,046 | 226,417 | ||||||||||||||
Evotec AG (Health Care, Life Sciences Tools & Services) † | 6,129 | 149,222 | ||||||||||||||
Fraport AG (Industrials, Transportation Infrastructure) | 2,029 | 129,644 | ||||||||||||||
Freenet AG (Communication Services, Wireless Telecommunication Services) | 6,465 | 127,261 | ||||||||||||||
Fresenius Medical Care AG & Company KGaA (Health Care, Health Care Providers & Services) | 10,820 | 834,512 | ||||||||||||||
Fresenius SE & Company KGaA (Health Care, Health Care Providers & Services) | 21,227 | 1,006,692 | ||||||||||||||
Grenke AG (Financials, Diversified Financial Services) | 1,389 | 130,087 | ||||||||||||||
Hannover Rueck SE (Financials, Insurance) | 2,993 | 541,935 | ||||||||||||||
HELLA GmbH & Company KGaA (Consumer Discretionary, Auto Components) | 2,343 | 98,381 | ||||||||||||||
Hellofresh SE (Consumer Discretionary, Internet & Direct Marketing Retail) † | 6,613 | 161,252 | ||||||||||||||
Hochtief AG (Industrials, Construction & Engineering) | 1,139 | 113,640 | ||||||||||||||
Hugo Boss AG (Consumer Discretionary, Textiles, Apparel & Luxury Goods) | 3,334 | 148,608 | ||||||||||||||
Kion Group AG (Industrials, Machinery) | 3,389 | 183,289 | ||||||||||||||
Knorr Bremse AG (Industrials, Machinery) | 2,461 | 249,920 | ||||||||||||||
LANXESS AG (Materials, Chemicals) | 4,226 | 224,990 | ||||||||||||||
LEG Immobilien AG (Real Estate, Real Estate Management & Development) | 3,432 | 412,130 | ||||||||||||||
Merck KGaA (Health Care, Pharmaceuticals) | 6,254 | 761,013 | ||||||||||||||
Metro AG (Consumer Staples, Food & Staples Retailing) | 9,408 | 109,893 | ||||||||||||||
MTU Aero Engines AG (Industrials, Aerospace & Defense) | 2,487 | 615,340 | ||||||||||||||
Muenchener Rueckversicherungs Gesellschaft AG (Financials, Insurance) | 7,211 | 1,868,497 | ||||||||||||||
Nemetschek SE (Information Technology, Software) | 2,665 | 169,628 | ||||||||||||||
ProSiebenSat.1 Media AG (Communication Services, Media) | 11,484 | 139,075 | ||||||||||||||
Puma AG Rudolf Dassler Sport (Consumer Discretionary, Textiles, Apparel & Luxury Goods) | 4,088 | 316,952 | ||||||||||||||
Rheinmetall AG (Industrials, Industrial Conglomerates) | 2,248 | 208,697 | ||||||||||||||
Scout24 AG (Communication Services, Interactive Media & Services) 144A | 5,387 | 352,061 | ||||||||||||||
Siemens Healthineers AG (Health Care, Health Care Equipment & Supplies) 144A | 7,629 | 308,710 | ||||||||||||||
Symrise AG (Materials, Chemicals) | 6,624 | 649,099 | ||||||||||||||
TAG Immobilien AG (Real Estate, Real Estate Management & Development) | 7,632 | 187,542 | ||||||||||||||
Uniper SE (Utilities, Independent Power & Renewable Electricity Producers) | 8,006 | 237,973 | ||||||||||||||
Vonovia SE (Real Estate, Real Estate Management & Development) | 25,496 | 1,379,538 | ||||||||||||||
Zalando SE (Consumer Discretionary, Internet & Direct Marketing Retail) 144A† | 8,028 | 358,746 | ||||||||||||||
| 26,652,304 | ||||||||||||||||
|
| |||||||||||||||
| Hong Kong: 2.68% | ||||||||||||||||
ASM Pacific Technology (Information Technology, Semiconductors & Semiconductor Equipment) | 15,144 | 183,142 | ||||||||||||||
CK Asset Holdings Limited (Real Estate, Real Estate Management & Development) | 136,690 | 872,488 | ||||||||||||||
CK Hutchison Holdings Limited (Industrials, Industrial Conglomerates) | 141,570 | 1,251,488 | ||||||||||||||
CK Infrastructure Holdings Limited (Utilities, Electric Utilities) | 36,500 | 251,157 | ||||||||||||||
Fosun International (Industrials, Industrial Conglomerates) | 121,500 | 158,182 | ||||||||||||||
Hang Lung Group Limited (Real Estate, Real Estate Management & Development) | 44,705 | 113,550 | ||||||||||||||
Hang Lung Properties Limited (Real Estate, Real Estate Management & Development) | 91,332 | 202,732 | ||||||||||||||
The accompanying notes are an integral part of these financial statements.
92 | Wells Fargo Funds
Table of Contents
Portfolio of investments—February 29, 2020
FACTOR ENHANCED INTERNATIONAL PORTFOLIO
| Shares | Value | |||||||||||||||
| Hong Kong (continued) | ||||||||||||||||
Hang Seng Bank Limited (Financials, Banks) | 35,055 | $ | 739,328 | |||||||||||||
Henderson Land Development Company Limited (Real Estate, Real Estate Management & Development) | 69,198 | 323,025 | ||||||||||||||
HK Electric Investments Limited (Utilities, Electric Utilities) 144A | 100,500 | 101,080 | ||||||||||||||
Hong Kong & China Gas Company Limited (Utilities, Gas Utilities) | 492,595 | 956,084 | ||||||||||||||
Hong Kong Exchanges & Clearing Limited (Financials, Capital Markets) | 55,600 | 1,860,154 | ||||||||||||||
Hong Kong Land Holdings Limited (Real Estate, Real Estate Management & Development) | 61,525 | 305,093 | ||||||||||||||
Hong Kong Telecommunications Trust & Hong Kong Trust Limited (Communication Services, Diversified Telecommunication Services) | 171,574 | 258,329 | ||||||||||||||
Hysan Development Company Limited (Real Estate, Real Estate Management & Development) | 34,574 | 126,377 | ||||||||||||||
Jardine Matheson Holdings Limited (Industrials, Industrial Conglomerates) | 13,328 | 729,209 | ||||||||||||||
Jardine Strategic Holdings Limited (Industrials, Industrial Conglomerates) | 8,317 | 241,248 | ||||||||||||||
Kerry Properties Limited (Real Estate, Real Estate Management & Development) | 35,000 | 100,817 | ||||||||||||||
Link REIT (Real Estate, Equity REITs) | 110,007 | 1,026,914 | ||||||||||||||
MTR Corporation Limited (Industrials, Road & Rail) | 74,569 | 426,037 | ||||||||||||||
NagaCorp Limited (Consumer Discretionary, Hotels, Restaurants & Leisure) | 78,000 | 108,392 | ||||||||||||||
New World Development Limited (Real Estate, Real Estate Management & Development) | 293,961 | 385,141 | ||||||||||||||
NWS Holdings Limited (Industrials, Industrial Conglomerates) | 73,429 | 90,748 | ||||||||||||||
PCCW Limited (Communication Services, Diversified Telecommunication Services) | 182,000 | 109,983 | ||||||||||||||
Power Assets Holdings Limited (Utilities, Electric Utilities) | 67,000 | 480,618 | ||||||||||||||
Sino Land Company (Real Estate, Real Estate Management & Development) | 163,899 | 226,116 | ||||||||||||||
SJM Holdings Limited (Consumer Discretionary, Hotels, Restaurants & Leisure) | 99,000 | 114,628 | ||||||||||||||
Sun Hung Kai Properties Limited (Real Estate, Real Estate Management & Development) | 80,500 | 1,163,498 | ||||||||||||||
Swire Pacific Limited Class A (Real Estate, Real Estate Management & Development) | 25,978 | 236,861 | ||||||||||||||
Swire Properties Limited (Real Estate, Real Estate Management & Development) | 55,553 | 167,201 | ||||||||||||||
Techtronic Industries Company Limited (Industrials, Machinery) | 77,743 | 644,998 | ||||||||||||||
Vitasoy International Holdings Limited (Consumer Staples, Food Products) | 43,005 | 155,978 | ||||||||||||||
WH Group Limited (Consumer Staples, Food Products) 144A | 475,500 | 498,995 | ||||||||||||||
Wharf Real Estate Investment Company Limited (Real Estate, Real Estate Management & Development) | 61,000 | 280,993 | ||||||||||||||
Wheelock & Company Limited (Real Estate, Real Estate Management & Development) | 38,945 | 299,239 | ||||||||||||||
Wynn Macau Limited (Consumer Discretionary, Hotels, Restaurants & Leisure) | 73,134 | 151,891 | ||||||||||||||
Xinyi Glass Holdings Limited (Consumer Discretionary, Auto Components) | 108,000 | 135,221 | ||||||||||||||
Yihai International Holding (Consumer Staples, Food Products) | 20,000 | 135,457 | ||||||||||||||
Yue Yuen Industrial Holdings Limited (Consumer Discretionary, Textiles, Apparel & Luxury Goods) | 38,222 | 92,753 | ||||||||||||||
| 15,705,145 | ||||||||||||||||
|
| |||||||||||||||
| Ireland: 1.43% | ||||||||||||||||
AIB Group plc (Financials, Banks) | 50,732 | 118,378 | ||||||||||||||
DCC plc (Industrials, Industrial Conglomerates) | 5,201 | 372,511 | ||||||||||||||
Glanbia plc (Consumer Staples, Food Products) | 12,333 | 143,638 | ||||||||||||||
Kerry Group plc Class A (Consumer Staples, Food Products) | 8,518 | 1,081,396 | ||||||||||||||
Kingspan Group plc (Industrials, Building Products) | 8,684 | 546,921 | ||||||||||||||
Linde plc (Materials, Chemicals) | 28,763 | 5,543,346 | ||||||||||||||
Flutter Entertainment plc (Consumer Discretionary, Hotels, Restaurants & Leisure) | 4,327 | 460,135 | ||||||||||||||
UDG Healthcare plc (Health Care, Health Care Providers & Services) | 13,129 | 119,778 | ||||||||||||||
| 8,386,103 | ||||||||||||||||
|
| |||||||||||||||
| Italy: 1.46% | ||||||||||||||||
A2A SpA (Utilities, Multi-Utilities) | 80,248 | 139,914 | ||||||||||||||
Amplifon SpA (Health Care, Health Care Providers & Services) | 6,158 | 176,664 | ||||||||||||||
Assicurazioni Generali SpA (Financials, Insurance) | 66,041 | 1,192,129 | ||||||||||||||
Atlantia SpA (Industrials, Transportation Infrastructure) | 23,393 | 505,962 | ||||||||||||||
Banco BPM SpA (Financials, Banks) † | 74,490 | 164,163 | ||||||||||||||
The accompanying notes are an integral part of these financial statements.
Wells Fargo Funds | 93
Table of Contents
Portfolio of investments—February 29, 2020
FACTOR ENHANCED INTERNATIONAL PORTFOLIO
| Shares | Value | |||||||||||||||
| Italy (continued) | ||||||||||||||||
Davide Campari-Milano SpA (Consumer Staples, Beverages) | 24,184 | $ | 202,197 | |||||||||||||
DiaSorin SpA (Health Care, Health Care Equipment & Supplies) | 1,286 | 147,343 | ||||||||||||||
Enel SpA (Utilities, Electric Utilities) | 384,902 | 3,230,553 | ||||||||||||||
Hera SpA (Utilities, Multi-Utilities) | 39,392 | 169,078 | ||||||||||||||
Interpump Group SpA (Industrials, Machinery) | 4,356 | 131,877 | ||||||||||||||
Italgas SpA (Utilities, Gas Utilities) | 24,233 | 148,090 | ||||||||||||||
Leonardo SpA (Industrials, Aerospace & Defense) | 18,526 | 189,994 | ||||||||||||||
Mediobanca SpA (Financials, Banks) | 31,559 | 286,979 | ||||||||||||||
Moncler SpA (Consumer Discretionary, Textiles, Apparel & Luxury Goods) | 10,225 | 402,364 | ||||||||||||||
Poste Italiane SpA (Financials, Insurance) | 23,592 | 252,731 | ||||||||||||||
Recordati SpA (Health Care, Pharmaceuticals) | 5,046 | 215,805 | ||||||||||||||
Snam SpA (Utilities, Gas Utilities) | 107,272 | 531,895 | ||||||||||||||
Terna SpA (Utilities, Electric Utilities) | 72,492 | 479,225 | ||||||||||||||
| 8,566,963 | ||||||||||||||||
|
| |||||||||||||||
| Japan: 20.93% | ||||||||||||||||
Acom Company Limited (Financials, Consumer Finance) | 24,700 | 101,534 | ||||||||||||||
Activia Properties Incorporated (Real Estate, Equity REITs) | 37 | 176,127 | ||||||||||||||
Advance Residence Investment Corporation (Real Estate, Equity REITs) | 71 | 211,474 | ||||||||||||||
Advantest Corporation (Information Technology, Semiconductors & Semiconductor Equipment) | 10,300 | 473,907 | ||||||||||||||
Aeon Financial Service Company Limited (Financials, Consumer Finance) | 6,000 | 87,029 | ||||||||||||||
Aica Kogyo Company Limited (Industrials, Building Products) | 3,300 | 96,970 | ||||||||||||||
Air Water Incorporated (Materials, Chemicals) | 9,700 | 128,681 | ||||||||||||||
Aisin Seiki Company Limited (Consumer Discretionary, Auto Components) | 9,900 | 318,431 | ||||||||||||||
Alfresa Holdings Corporation (Health Care, Health Care Providers & Services) | 11,300 | 197,040 | ||||||||||||||
All Nippon Airways Company Limited (Industrials, Airlines) | 20,600 | 554,626 | ||||||||||||||
Amada Holdings Company Limited (Industrials, Machinery) | 20,400 | 190,207 | ||||||||||||||
Anritsu Corporation (Information Technology, Electronic Equipment, Instruments & Components) | 7,000 | 115,702 | ||||||||||||||
Aozora Bank Limited (Financials, Banks) | 6,000 | 148,900 | ||||||||||||||
Asahi Breweries Limited (Consumer Staples, Beverages) | 23,000 | 880,386 | ||||||||||||||
Asahi Glass Company Limited (Industrials, Building Products) | 12,400 | 354,623 | ||||||||||||||
Asahi Intecc Company Limited (Health Care, Health Care Equipment & Supplies) | 13,100 | 316,662 | ||||||||||||||
Asahi Kasei Corporation (Materials, Chemicals) | 82,300 | 674,034 | ||||||||||||||
Astellas Pharma Incorporated (Health Care, Pharmaceuticals) | 96,300 | 1,509,330 | ||||||||||||||
Azbil Corporation (Information Technology, Electronic Equipment, Instruments & Components) | 7,300 | 180,529 | ||||||||||||||
Bandai Namco Holdings Incorporated (Consumer Discretionary, Leisure Products) | 12,900 | 646,042 | ||||||||||||||
Benesse Corporation (Consumer Discretionary, Diversified Consumer Services) | 3,900 | 100,173 | ||||||||||||||
Bridgestone Corporation (Consumer Discretionary, Auto Components) | 32,500 | 1,077,071 | ||||||||||||||
Brother Industries Limited (Information Technology, Technology Hardware, Storage & Peripherals) | 13,700 | 242,669 | ||||||||||||||
Calbee Incorporated (Consumer Staples, Food Products) | 4,300 | 109,571 | ||||||||||||||
Canon Incorporated (Information Technology, Technology Hardware, Storage & Peripherals) | 53,600 | 1,348,966 | ||||||||||||||
Capcom Company Limited (Communication Services, Entertainment) | 4,900 | 133,239 | ||||||||||||||
Casio Computer Company Limited (Consumer Discretionary, Household Durables) | 12,200 | 207,839 | ||||||||||||||
Chiba Bank Limited (Financials, Banks) | 38,900 | 188,472 | ||||||||||||||
Chubu Electric Power Company Incorporated (Utilities, Electric Utilities) | 37,800 | 492,437 | ||||||||||||||
Chugai Pharmaceutical Company Limited (Health Care, Pharmaceuticals) | 10,700 | 1,150,999 | ||||||||||||||
Comsys Holdings Corporation (Industrials, Construction & Engineering) | 6,500 | 159,923 | ||||||||||||||
Cosmos Pharmaceutical Corporation (Consumer Staples, Food & Staples Retailing) | 600 | 130,793 | ||||||||||||||
Credit Saison Company Limited (Financials, Consumer Finance) | 8,100 | 116,801 | ||||||||||||||
Dai-ichi Life Holdings Incorporated (Financials, Insurance) | 62,600 | 849,002 | ||||||||||||||
Daicel Corporation (Materials, Chemicals) | 17,900 | 153,761 | ||||||||||||||
Daifuku Company Limited (Industrials, Machinery) | 5,900 | 346,815 | ||||||||||||||
Daiichi Sankyo Company Limited (Health Care, Pharmaceuticals) | 31,700 | 1,929,767 | ||||||||||||||
Daiichikosho Company Limited (Communication Services, Entertainment) | 2,300 | 94,030 | ||||||||||||||
Daikin Industries Limited (Industrials, Building Products) | 15,000 | 2,020,861 | ||||||||||||||
The accompanying notes are an integral part of these financial statements.
94 | Wells Fargo Funds
Table of Contents
Portfolio of investments—February 29, 2020
FACTOR ENHANCED INTERNATIONAL PORTFOLIO
| Shares | Value | |||||||||||||||
| Japan (continued) | ||||||||||||||||
Daito Trust Construction Company Limited (Real Estate, Real Estate Management & Development) | 3,600 | $ | 366,149 | |||||||||||||
Daiwa House Industry Company Limited (Real Estate, Real Estate Management & Development) | 34,500 | 952,077 | ||||||||||||||
Daiwa House Residential Investment Corporation (Real Estate, Equity REITs) | 100 | 250,069 | ||||||||||||||
Daiwa Office Investment Corporation (Real Estate, Equity REITs) | 16 | 123,350 | ||||||||||||||
DeNA Company Limited (Communication Services, Entertainment) | 6,000 | 77,465 | ||||||||||||||
Denka Company Limited (Materials, Chemicals) | 4,700 | 117,308 | ||||||||||||||
DIC Incorporated (Materials, Chemicals) | 4,300 | 101,599 | ||||||||||||||
East Japan Railway Company (Industrials, Road & Rail) | 19,600 | 1,497,104 | ||||||||||||||
Ebara Corporation (Industrials, Machinery) | 4,900 | 115,384 | ||||||||||||||
Electric Power Development Company Limited (Utilities, Independent Power & Renewable Electricity Producers) | 9,700 | 208,011 | ||||||||||||||
Ezaki Glico Company Limited (Consumer Staples, Food Products) | 3,100 | 127,348 | ||||||||||||||
FANCL Corporation (Consumer Staples, Personal Products) | 4,600 | 114,735 | ||||||||||||||
Fuji Electric Holdings Company Limited (Industrials, Electrical Equipment) | 7,700 | 211,184 | ||||||||||||||
Fuji Television Network Incorporated (Communication Services, Media) | 11,000 | 129,243 | ||||||||||||||
FUJIFILM Holdings Corporation (Information Technology, Technology Hardware, Storage & Peripherals) | 19,800 | 961,534 | ||||||||||||||
Fujitsu Limited (Information Technology, IT Services) | 9,800 | 1,021,907 | ||||||||||||||
Fukuoka Financial Group Incorporated (Financials, Banks) | 10,200 | 152,645 | ||||||||||||||
GLP J REIT (Real Estate, Equity REITs) | 197 | 249,328 | ||||||||||||||
GMO Payment Gateway Incorporated (Information Technology, IT Services) | 2,200 | 136,505 | ||||||||||||||
Goldwin Incorporated (Consumer Discretionary, Textiles, Apparel & Luxury Goods) | 1,700 | 103,405 | ||||||||||||||
Hakuhodo DY Holdings Incorporated (Communication Services, Media) | 16,200 | 187,215 | ||||||||||||||
Hamamatsu Photonics (Information Technology, Electronic Equipment, Instruments & Components) | 7,200 | 280,857 | ||||||||||||||
Hankyu Hanshin Holdings Incorporated (Industrials, Road & Rail) | 13,100 | 430,677 | ||||||||||||||
Haseko Corporation (Consumer Discretionary, Household Durables) | 14,800 | 190,741 | ||||||||||||||
Hikari Tsushin Incorporated (Consumer Discretionary, Specialty Retail) | 1,200 | 228,042 | ||||||||||||||
Hino Motors Limited (Industrials, Machinery) | 14,600 | 119,461 | ||||||||||||||
Hirose Electric Company Limited (Information Technology, Electronic Equipment, Instruments & Components) | 1,700 | 180,088 | ||||||||||||||
Hitachi Chemical Company Limited (Materials, Chemicals) | 5,100 | 215,977 | ||||||||||||||
Hitachi Construction Machinery Company Limited (Industrials, Machinery) | 5,600 | 136,388 | ||||||||||||||
Hitachi High-Technologies Corporation (Information Technology, Electronic Equipment, Instruments & Components) | 3,300 | 245,108 | ||||||||||||||
Hitachi Limited (Information Technology, Electronic Equipment, Instruments & Components) | 48,700 | 1,626,383 | ||||||||||||||
Hitachi Metals Limited (Materials, Metals & Mining) | 10,200 | 146,925 | ||||||||||||||
Horiba Limited (Information Technology, Electronic Equipment, Instruments & Components) | 2,200 | 120,272 | ||||||||||||||
Hoshizaki Electric Company Limited (Industrials, Machinery) | 3,000 | 254,213 | ||||||||||||||
House Foods Group Incorporated (Consumer Staples, Food Products) | 4,000 | 117,695 | ||||||||||||||
Hoya Corporation (Health Care, Health Care Equipment & Supplies) | 19,500 | 1,729,038 | ||||||||||||||
Hulic Company Limited (Real Estate, Real Estate Management & Development) | 27,700 | 308,549 | ||||||||||||||
Ibiden Company Limited (Information Technology, Electronic Equipment, Instruments & Components) | 6,700 | 147,682 | ||||||||||||||
Idemitsu Kosan Company Limited (Energy, Oil, Gas & Consumable Fuels) | 14,317 | 358,280 | ||||||||||||||
IHI Corporation (Industrials, Machinery) | 7,300 | 151,780 | ||||||||||||||
Iida Group Holdings Company Limited (Consumer Discretionary, Household Durables) | 9,900 | 133,789 | ||||||||||||||
Industrial & Infrastructure Fund Investment Corporation (Real Estate, Equity REITs) | 95 | 148,362 | ||||||||||||||
Invincible Investment Corporation (Real Estate, Equity REITs) | 335 | 135,563 | ||||||||||||||
ITO EN Limited (Consumer Staples, Beverages) | 3,200 | 140,808 | ||||||||||||||
Itochu Corporation (Industrials, Trading Companies & Distributors) | 75,000 | 1,699,604 | ||||||||||||||
Itochu Techno-Solutions Corporation (Information Technology, IT Services) | 4,900 | 137,246 | ||||||||||||||
Izumi Company Limited (Consumer Discretionary, Multiline Retail) | 2,200 | 60,690 | ||||||||||||||
J.Front Retailing Company Limited (Consumer Discretionary, Multiline Retail) | 13,400 | 142,382 | ||||||||||||||
Japan Airlines Company Limited (Industrials, Airlines) | 20,300 | 499,582 | ||||||||||||||
Japan Airport Terminal Company Limited (Industrials, Transportation Infrastructure) | 4,100 | 159,379 | ||||||||||||||
Japan Hotel REIT Investment Corporation (Real Estate, Equity REITs) | 251 | 140,193 | ||||||||||||||
The accompanying notes are an integral part of these financial statements.
Wells Fargo Funds | 95
Table of Contents
Portfolio of investments—February 29, 2020
FACTOR ENHANCED INTERNATIONAL PORTFOLIO
| Shares | Value | |||||||||||||||
| Japan (continued) | ||||||||||||||||
Japan Logistics Fund Incorporated (Real Estate, Equity REITs) | 47 | $ | 116,652 | |||||||||||||
Japan Post Hoding Company Limited (Financials, Insurance) | 10,000 | 152,576 | ||||||||||||||
Japan Prime Realty Investment Corporation (Real Estate, Equity REITs) | 49 | 216,091 | ||||||||||||||
Japan Real Estate Investment Corporation (Real Estate, Equity REITs) | 71 | 485,508 | ||||||||||||||
Japan Retail Fund Investment Corporation (Real Estate, Equity REITs) | 139 | 263,504 | ||||||||||||||
Japan Tobacco Incorporated (Consumer Staples, Tobacco) | 57,800 | 1,142,708 | ||||||||||||||
JFE Holdings Incorporated (Materials, Metals & Mining) | 29,800 | 273,026 | ||||||||||||||
JSR Corporation (Materials, Chemicals) | 9,800 | 170,374 | ||||||||||||||
JXTG Holdings Incorporated (Energy, Oil, Gas & Consumable Fuels) | 168,500 | 682,616 | ||||||||||||||
K’s Holdings Corporation (Consumer Discretionary, Specialty Retail) | 11,300 | 123,432 | ||||||||||||||
Kagome Company Limited (Consumer Staples, Food Products) | 4,400 | 94,757 | ||||||||||||||
Kajima Corporation (Industrials, Construction & Engineering) | 28,100 | 301,161 | ||||||||||||||
Kakaku.com Incorporated (Communication Services, Interactive Media & Services) | 6,200 | 132,402 | ||||||||||||||
Kaken Pharmaceutical Company Limited (Health Care, Pharmaceuticals) | 1,800 | 86,848 | ||||||||||||||
Kamigumi Company Limited (Industrials, Transportation Infrastructure) | 5,900 | 113,849 | ||||||||||||||
Kaneka Corporation (Materials, Chemicals) | 3,600 | 96,463 | ||||||||||||||
Kansai Paint Company Limited (Materials, Chemicals) | 13,100 | 284,246 | ||||||||||||||
Kawasaki Heavy Industries Limited (Industrials, Machinery) | 8,900 | 159,506 | ||||||||||||||
KDDI Corporation (Communication Services, Wireless Telecommunication Services) | 85,300 | 2,410,028 | ||||||||||||||
Keihan Electric Railway Company Limited (Industrials, Industrial Conglomerates) | 5,300 | 214,420 | ||||||||||||||
Keikyu Corporation (Industrials, Road & Rail) | 14,200 | 214,218 | ||||||||||||||
Keio Corporation (Industrials, Road & Rail) | 6,300 | 302,106 | ||||||||||||||
Keisei Electric Railway Company Limited (Industrials, Road & Rail) | 8,700 | 276,307 | ||||||||||||||
Kenedix Realty Investment Corporation (Real Estate, Equity REITs) | 23 | 171,632 | ||||||||||||||
Kewpie Corporation (Consumer Staples, Food Products) | 6,000 | 109,912 | ||||||||||||||
Kintetsu Group Holdings Company Limited (Industrials, Road & Rail) | 9,800 | 422,705 | ||||||||||||||
Kobe Bussan Company Limited (Consumer Staples, Food & Staples Retailing) | 3,500 | 128,315 | ||||||||||||||
Kobe Steel Limited (Materials, Metals & Mining) | 19,600 | 72,138 | ||||||||||||||
Komatsu Limited (Industrials, Machinery) | 52,300 | 1,044,994 | ||||||||||||||
Konami Holdings Corporation (Communication Services, Entertainment) | 5,200 | 187,322 | ||||||||||||||
Konica Minolta Holdings Incorporated (Information Technology, Technology Hardware, Storage & Peripherals) | 26,200 | 143,368 | ||||||||||||||
Kuraray Company Limited (Materials, Chemicals) | 18,700 | 194,447 | ||||||||||||||
Kurita Water Industries Limited (Industrials, Machinery) | 5,600 | 144,433 | ||||||||||||||
Kyowa Exeo Corporation (Industrials, Construction & Engineering) | 5,500 | 120,397 | ||||||||||||||
Kyushu Electric Power Company Incorporated (Utilities, Electric Utilities) | 25,700 | 186,049 | ||||||||||||||
Kyushu Financial Group Incorporated (Financials, Banks) | 24,500 | 82,614 | ||||||||||||||
Kyushu Railway Company (Industrials, Road & Rail) | 8,100 | 245,082 | ||||||||||||||
Lasertec Corporation (Information Technology, Semiconductors & Semiconductor Equipment) | 4,600 | 211,081 | ||||||||||||||
Lawson Incorporated (Consumer Staples, Food & Staples Retailing) | 2,500 | 133,535 | ||||||||||||||
Lion Corporation (Consumer Staples, Household Products) | 15,600 | 259,982 | ||||||||||||||
M3 Incorporated (Health Care, Health Care Technology) | 22,500 | 580,863 | ||||||||||||||
Mabuchi Motor Company Limited (Industrials, Electrical Equipment) | 3,100 | 106,907 | ||||||||||||||
Marubeni Corporation (Industrials, Trading Companies & Distributors) | 89,600 | 593,429 | ||||||||||||||
Marui Group Company Limited (Consumer Discretionary, Multiline Retail) | 11,700 | 228,327 | ||||||||||||||
Maruichi Steel Tube Limited (Materials, Metals & Mining) | 4,000 | 96,610 | ||||||||||||||
Matsumotokiyoshi Holdings Company Limited (Consumer Staples, Food & Staples Retailing) | 5,000 | 164,165 | ||||||||||||||
Mebuki Financial Group Incorporated (Financials, Banks) | 59,400 | 114,497 | ||||||||||||||
MediPal Holdings Corporation (Health Care, Health Care Providers & Services) | 10,600 | 192,849 | ||||||||||||||
Minebea Company Limited (Industrials, Machinery) | 22,200 | 388,561 | ||||||||||||||
Misumi Group Incorporated (Industrials, Machinery) | 14,100 | 296,988 | ||||||||||||||
Mitsubishi Chemical Holdings Corporation (Materials, Chemicals) | 74,500 | 498,060 | ||||||||||||||
Mitsubishi Electric Corporation (Industrials, Electrical Equipment) | 110,100 | 1,384,204 | ||||||||||||||
Mitsubishi Gas Chemical Company Incorporated (Materials, Chemicals) | 11,300 | 169,074 | ||||||||||||||
Mitsubishi Heavy Industries Limited (Industrials, Machinery) | 17,500 | 552,956 | ||||||||||||||
The accompanying notes are an integral part of these financial statements.
96 | Wells Fargo Funds
Table of Contents
Portfolio of investments—February 29, 2020
FACTOR ENHANCED INTERNATIONAL PORTFOLIO
| Shares | Value | |||||||||||||||
| Japan (continued) | ||||||||||||||||
Mitsubishi Logistics Corporation (Industrials, Transportation Infrastructure) | 4,200 | $ | 96,006 | |||||||||||||
Mitsubishi Materials Corporation (Materials, Metals & Mining) | 6,800 | 154,265 | ||||||||||||||
Mitsubishi Motors Corporation (Consumer Discretionary, Automobiles) | 36,100 | 118,620 | ||||||||||||||
Mitsubishi UFJ Lease & Finance Company Limited (Financials, Diversified Financial Services) | 28,100 | 160,718 | ||||||||||||||
Mitsui & Company Limited (Industrials, Trading Companies & Distributors) | 88,700 | 1,465,027 | ||||||||||||||
Mitsui Chemicals Incorporated (Materials, Chemicals) | 11,300 | 243,261 | ||||||||||||||
Mitsui OSK Lines Limited (Industrials, Marine) | 6,800 | 140,069 | ||||||||||||||
Miura Company Limited (Industrials, Machinery) | 5,600 | 182,082 | ||||||||||||||
Mori Hills REIT Corporation (Real Estate, Equity REITs) | 86 | 135,345 | ||||||||||||||
Morinaga & Company Limited (Consumer Staples, Food Products) | 2,200 | 87,332 | ||||||||||||||
MS&AD Insurance Group Holdings Incorporated (Financials, Insurance) | 25,300 | 815,525 | ||||||||||||||
Nabtesco Corporation (Industrials, Machinery) | 5,900 | 156,674 | ||||||||||||||
Nagase & Company Limited (Industrials, Trading Companies & Distributors) | 6,600 | 78,833 | ||||||||||||||
Nagoya Railroad Company Limited (Industrials, Road & Rail) | 10,200 | 266,321 | ||||||||||||||
Nankai Electric Railway Company Limited (Industrials, Road & Rail) | 5,700 | 125,551 | ||||||||||||||
NEC Corporation (Information Technology, Technology Hardware, IT Services) | 12,000 | 450,512 | ||||||||||||||
Net One Systems Company Limited (Information Technology, IT Services) | 4,200 | 87,807 | ||||||||||||||
Nexon Company Limited (Communication Services, Entertainment) | 22,700 | 358,976 | ||||||||||||||
NGK Insulators Limited (Industrials, Machinery) | 16,300 | 255,981 | ||||||||||||||
NGK Spark Plug Company Limited (Consumer Discretionary, Auto Components) | 10,800 | 175,351 | ||||||||||||||
NH Foods Limited (Consumer Staples, Food Products) | 5,100 | 192,143 | ||||||||||||||
Nichirei Corporation (Consumer Staples, Food Products) | 6,800 | 171,705 | ||||||||||||||
Nifco Incorporated (Consumer Discretionary, Auto Components) | 4,700 | 113,213 | ||||||||||||||
Nihon Kohden Corporation (Health Care, Health Care Equipment & Supplies) | 4,300 | 128,025 | ||||||||||||||
Nihon M&A Center Incorporated (Industrials, Professional Services) | 7,100 | 218,719 | ||||||||||||||
Nihon Unisys Limited (Information Technology, IT Services) | 3,900 | 118,555 | ||||||||||||||
Nikon Corporation (Consumer Discretionary, Household Durables) | 21,700 | 221,660 | ||||||||||||||
Nintendo Company Limited (Communication Services, Entertainment) | 6,200 | 2,078,452 | ||||||||||||||
Nippon Accommodations Fund Incorporated (Real Estate, Equity REITs) | 25 | 153,208 | ||||||||||||||
Nippon Building Fund Incorporated (Real Estate, Equity REITs) | 72 | 538,291 | ||||||||||||||
Nippon Electric Glass Company Limited (Information Technology, Electronic Equipment, Instruments & Components) | 5,100 | 85,296 | ||||||||||||||
Nippon Express Company Limited (Industrials, Road & Rail) | 5,100 | 244,594 | ||||||||||||||
Nippon Kayaku Company Limited (Materials, Chemicals) | 8,900 | 97,790 | ||||||||||||||
Nippon Paper Industries Company Limited (Materials, Paper & Forest Products) | 6,200 | 89,654 | ||||||||||||||
Nippon Prologis REIT Incorporated (Real Estate, Equity REITs) | 102 | 276,245 | ||||||||||||||
Nippon Shinyaku Company Limited (Health Care, Pharmaceuticals) | 3,100 | 232,249 | ||||||||||||||
Nippon Shokubai Company Limited (Materials, Chemicals) | 1,900 | 96,199 | ||||||||||||||
Nippon Steel Corporation (Materials, Metals & Mining) | 49,200 | 550,727 | ||||||||||||||
Nippon Suisan Kaisha Limited (Consumer Staples, Food Products) | 16,200 | 76,619 | ||||||||||||||
Nippon Telegraph & Telephone Corporation (Communication Services, Diversified Telecommunication Services) | 119,200 | 2,780,909 | ||||||||||||||
Nippon Television Network Corporation (Communication Services, Media) | 9,400 | 112,997 | ||||||||||||||
Nippon Yusen Kabushiki Kaisha (Industrials, Marine) | 9,400 | 133,699 | ||||||||||||||
Nishi-Nippon Railroad Company Limited (Industrials, Road & Rail) | 3,900 | 85,401 | ||||||||||||||
Nissin Food Products Company Limited (Consumer Staples, Food Products) | 4,200 | 330,594 | ||||||||||||||
Nitori Holdings Company Limited (Consumer Discretionary, Specialty Retail) | 4,700 | 652,995 | ||||||||||||||
NOF Corporation (Materials, Chemicals) | 4,100 | 130,364 | ||||||||||||||
Nomura Real Estate Holding Incorporated (Real Estate, Real Estate Management & Development) | 6,300 | 135,927 | ||||||||||||||
Nomura Real Estate Master Fund Incorporated (Real Estate, Equity REITs) | 237 | 376,041 | ||||||||||||||
Nomura Research Institute Limited (Information Technology, IT Services) | 21,500 | 472,019 | ||||||||||||||
NSK Limited (Industrials, Machinery) | 27,900 | 211,119 | ||||||||||||||
NTT Data Corporation (Information Technology, IT Services) | 31,000 | 369,716 | ||||||||||||||
NTT DOCOMO Incorporated (Communication Services, Wireless Telecommunication Services) | 60,000 | 1,624,132 | ||||||||||||||
Obayashi Corporation (Industrials, Construction & Engineering) | 36,500 | 368,214 | ||||||||||||||
The accompanying notes are an integral part of these financial statements.
Wells Fargo Funds | 97
Table of Contents
Portfolio of investments—February 29, 2020
FACTOR ENHANCED INTERNATIONAL PORTFOLIO
| Shares | Value | |||||||||||||||
| Japan (continued) | ||||||||||||||||
OBIC Company Limited (Information Technology, IT Services) | 3,500 | $ | 432,131 | |||||||||||||
Odakyu Electric Railway Company Limited (Industrials, Road & Rail) | 17,900 | 344,002 | ||||||||||||||
Oji Holdings Corporation (Materials, Paper & Forest Products) | 51,500 | 243,919 | ||||||||||||||
Omron Corporation (Information Technology, Electronic Equipment, Instruments & Components) | 11,100 | 594,330 | ||||||||||||||
Ono Pharmaceutical Company Limited (Health Care, Pharmaceuticals) | 25,400 | 514,825 | ||||||||||||||
Oracle Corporation (Japan) (Information Technology, Software) | 1,600 | 124,715 | ||||||||||||||
Oriental Land Company Limited (Consumer Discretionary, Hotels, Restaurants & Leisure) | 11,000 | 1,252,404 | ||||||||||||||
ORIX Corporation (Financials, Diversified Financial Services) | 66,700 | 1,081,080 | ||||||||||||||
ORIX JREIT Incorporated (Real Estate, Equity REITs) | 144 | 272,429 | ||||||||||||||
Osaka Gas Company Limited (Utilities, Gas Utilities) | 21,600 | 345,761 | ||||||||||||||
OSG Corporation (Industrials, Machinery) | 4,800 | 71,952 | ||||||||||||||
Otsuka Corporation (Information Technology, IT Services) | 6,700 | 289,399 | ||||||||||||||
Pan Pacific International Holdings (Consumer Discretionary, Multiline Retail) | 28,400 | 469,521 | ||||||||||||||
Park24 Company Limited (Industrials, Commercial Services & Supplies) | 6,500 | 128,070 | ||||||||||||||
Persol Holdings Company Limited (Industrials, Professional Services) | 9,600 | 129,151 | ||||||||||||||
Pigeon Corporation (Consumer Staples, Household Products) | 6,000 | 202,739 | ||||||||||||||
Rakuten Incorporated (Consumer Discretionary, Internet & Direct Marketing Retail) | 42,300 | 356,415 | ||||||||||||||
Recruit Holdings Company Limited (Industrials, Professional Services) | 84,700 | 2,962,194 | ||||||||||||||
Relo Holdings Incorporated (Real Estate, Real Estate Management & Development) | 6,500 | 140,340 | ||||||||||||||
Rengo Company Limited (Materials, Containers & Packaging) | 12,800 | 87,356 | ||||||||||||||
Resona Holdings Incorporated (Financials, Banks) | 120,700 | 449,304 | ||||||||||||||
Ricoh Company Limited (Information Technology, Technology Hardware, Storage & Peripherals) | 38,600 | 360,466 | ||||||||||||||
Rinnai Corporation (Consumer Discretionary, Household Durables) | 2,100 | 142,881 | ||||||||||||||
Rohto Pharmaceutical Company Limited (Consumer Staples, Personal Products) | 6,100 | 173,732 | ||||||||||||||
Ryohin Keikaku Company Limited (Consumer Discretionary, Multiline Retail) | 13,100 | 177,451 | ||||||||||||||
Sankyu Incorporated (Industrials, Road & Rail) | 3,000 | 127,070 | ||||||||||||||
Santen Pharmaceutical Company Limited (Health Care, Pharmaceuticals) | 20,200 | 323,786 | ||||||||||||||
Sanwa Holdings Corporation (Industrials, Building Products) | 11,200 | 102,619 | ||||||||||||||
Sawai Pharmaceutical Company Limited (Health Care, Pharmaceuticals) | 2,200 | 125,029 | ||||||||||||||
SBI Holdings Incorporated (Financials, Capital Markets) | 11,700 | 236,004 | ||||||||||||||
SCREEN Holdings Company Limited (Information Technology, Semiconductors & Semiconductor Equipment) | 2,400 | 122,701 | ||||||||||||||
SCSK Corporation (Information Technology, IT Services) | 2,400 | 124,840 | ||||||||||||||
Secom Company Limited (Industrials, Commercial Services & Supplies) | 11,000 | 872,364 | ||||||||||||||
Seibu Holdings Incorporated (Industrials, Road & Rail) | 12,700 | 180,109 | ||||||||||||||
Seiko Epson Corporation (Information Technology, Technology Hardware, Storage & Peripherals) | 17,500 | 245,344 | ||||||||||||||
SEINO Holdings Company Limited (Industrials, Road & Rail) | 9,500 | 102,959 | ||||||||||||||
Sekisui Chemical Company Limited (Consumer Discretionary, Household Durables) | 24,100 | 360,462 | ||||||||||||||
Sekisui House Limited (Consumer Discretionary, Household Durables) | 32,600 | 639,463 | ||||||||||||||
Sekisui House REIT Incorporated (Real Estate, Equity REITs) | 229 | 180,206 | ||||||||||||||
Seven Bank Limited (Financials, Banks) | 36,700 | 96,523 | ||||||||||||||
SG Holdings Company Limited (Industrials, Air Freight & Logistics) | 13,000 | 256,657 | ||||||||||||||
Sharp Corporation (Consumer Discretionary, Household Durables) | 10,600 | 122,831 | ||||||||||||||
Shikoku Electric Power Company Incorporated (Utilities, Electric Utilities) | 11,000 | 83,352 | ||||||||||||||
Shimadzu Corporation (Information Technology, Electronic Equipment, Instruments & Components) | 15,100 | 365,328 | ||||||||||||||
Shimamura Company Limited (Consumer Discretionary, Specialty Retail) | 1,200 | 79,582 | ||||||||||||||
Shimano Incorporated (Consumer Discretionary, Leisure Products) | 4,400 | 611,288 | ||||||||||||||
Shimizu Corporation (Industrials, Construction & Engineering) | 36,000 | 327,325 | ||||||||||||||
Shin-Etsu Chemical Company Limited (Materials, Chemicals) | 20,700 | 2,290,390 | ||||||||||||||
Shinsei Bank Limited (Financials, Banks) | 10,100 | 132,298 | ||||||||||||||
Shionogi & Company Limited (Health Care, Pharmaceuticals) | 14,800 | 796,684 | ||||||||||||||
Shizuoka Bank Limited (Financials, Banks) | 29,500 | 183,056 | ||||||||||||||
Showa Denko KK (Materials, Chemicals) | 8,100 | 174,087 | ||||||||||||||
Skylark Holdings Company Limited (Consumer Discretionary, Hotels, Restaurants & Leisure) | 9,900 | 148,139 | ||||||||||||||
Softbank Corporation (Communication Services, Wireless Telecommunication Services) | 81,500 | 1,070,709 | ||||||||||||||
The accompanying notes are an integral part of these financial statements.
98 | Wells Fargo Funds
Table of Contents
Portfolio of investments—February 29, 2020
FACTOR ENHANCED INTERNATIONAL PORTFOLIO
| Shares | Value | |||||||||||||||
| Japan (continued) | ||||||||||||||||
SoftBank Group Corporation (Communication Services, Wireless Telecommunication Services) | 75,300 | $ | 3,498,308 | |||||||||||||
Sohgo Security Services Company Limited (Industrials, Commercial Services & Supplies) | 4,400 | 205,296 | ||||||||||||||
Sojitz Corporation (Industrials, Trading Companies & Distributors) | 65,700 | 190,416 | ||||||||||||||
Sompo Holdings Incorporated NKSJ Holdings Inc(Financials, Insurance) | 19,400 | 716,996 | ||||||||||||||
Sony Financial Holdings Incorporated (Financials, Insurance) | 7,600 | 151,597 | ||||||||||||||
Sotetsu Holdings Incorporated (Industrials, Road & Rail) | 4,400 | 99,654 | ||||||||||||||
Square Enix Company Limited (Communication Services, Entertainment) | 4,600 | 186,239 | ||||||||||||||
Stanley Electric Company Limited (Consumer Discretionary, Auto Components) | 8,000 | 192,713 | ||||||||||||||
Sugi Pharmacy Company Limited (Consumer Staples, Food & Staples Retailing) | 2,100 | 98,986 | ||||||||||||||
Sumitomo Chemical Company Limited (Materials, Chemicals) | 88,500 | 322,493 | ||||||||||||||
Sumitomo Corporation (Industrials, Trading Companies & Distributors) | 64,000 | 918,889 | ||||||||||||||
Sumitomo Electric Industries Limited (Industrials, Electrical Equipment) | 42,300 | 499,295 | ||||||||||||||
Sumitomo Foresting Company Limited (Consumer Discretionary, Household Durables) | 8,900 | 131,997 | ||||||||||||||
Sumitomo Heavy Industries Limited (Industrials, Machinery) | 6,400 | 138,080 | ||||||||||||||
Sumitomo Mitsui Financial Group Incorporated (Financials, Banks) | 71,900 | 2,281,372 | ||||||||||||||
Sumitomo Rubber Industries Limited (Consumer Discretionary, Auto Components) | 10,200 | 105,851 | ||||||||||||||
Sundrug Company Limited (Consumer Staples, Food & Staples Retailing) | 3,700 | 115,365 | ||||||||||||||
Suntory Beverage & Food Limited (Consumer Staples, Beverages) | 6,400 | 244,328 | ||||||||||||||
Suzuken Company Limited (Health Care, Health Care Providers & Services) | 4,700 | 155,158 | ||||||||||||||
Sysmex Corporation (Health Care, Health Care Equipment & Supplies) | 9,200 | 588,324 | ||||||||||||||
Taiheiyo Cement Corporation (Materials, Construction Materials) | 6,600 | 162,868 | ||||||||||||||
Taisei Corporation (Industrials, Construction & Engineering) | 11,200 | 379,751 | ||||||||||||||
Taiyo Nippon Sanso Corporation (Materials, Chemicals) | 10,800 | 192,668 | ||||||||||||||
Taiyo Yuden Company Limited (Information Technology, Electronic Equipment, Instruments & Components) | 6,600 | 185,601 | ||||||||||||||
Takara Holdings Incorporated (Consumer Staples, Beverages) | 9,700 | 74,516 | ||||||||||||||
Takashimaya Company Limited (Consumer Discretionary, Multiline Retail) | 8,400 | 78,226 | ||||||||||||||
TechnoPro Holdings Incorporated (Industrials, Professional Services) | 1,800 | 107,186 | ||||||||||||||
Teijin Limited (Materials, Chemicals) | 10,400 | 170,536 | ||||||||||||||
Terumo Corporation (Health Care, Health Care Equipment & Supplies) | 37,800 | 1,213,712 | ||||||||||||||
The Chugoku Electric Power Company Incorporated (Utilities, Electric Utilities) | 16,100 | 213,733 | ||||||||||||||
The Hachijuni Bank Limited (Financials, Banks) | 28,500 | 95,787 | ||||||||||||||
The Yokohama Rubber Company Limited (Consumer Discretionary, Auto Components) | 7,700 | 125,164 | ||||||||||||||
THK Company Limited (Industrials, Machinery) | 6,600 | 149,281 | ||||||||||||||
TIS Incorporated (Information Technology, IT Services) | 4,100 | 244,991 | ||||||||||||||
Tobu Railway Company Limited (Industrials, Road & Rail) | 10,900 | 324,920 | ||||||||||||||
Toho Company Limited Tokyo (Communication Services, Entertainment) | 6,800 | 209,909 | ||||||||||||||
Toho Gas Company Limited (Utilities, Gas Utilities) | 5,500 | 186,879 | ||||||||||||||
Tohoku Electric Power Company Incorporated (Utilities, Electric Utilities) | 26,800 | 235,223 | ||||||||||||||
Tokai Carbon Company Limited (Materials, Chemicals) | 11,400 | 102,426 | ||||||||||||||
Tokio Marine Holdings Incorporated (Financials, Insurance) | 36,700 | 1,961,174 | ||||||||||||||
Tokyo Broadcasting System Incorporated (Communication Services, Media) | 7,900 | 122,925 | ||||||||||||||
Tokyo Century Corporation (Financials, Diversified Financial Services) | 2,800 | 115,621 | ||||||||||||||
Tokyo Electric Power Company Holdings Incorporated (Utilities, Electric Utilities) † | 87,600 | 332,408 | ||||||||||||||
Tokyo Electron Limited (Information Technology, Semiconductors & Semiconductor Equipment) | 8,300 | 1,733,966 | ||||||||||||||
Tokyo Gas Company Limited (Utilities, Gas Utilities) | 19,500 | 391,324 | ||||||||||||||
Tokyo Tatemono Company Limited (Real Estate, Real Estate Management & Development) | 11,400 | 154,936 | ||||||||||||||
Tokyu Corporation (Industrials, Road & Rail) | 30,900 | 473,511 | ||||||||||||||
Tokyu Fudosan Holdings Corporation (Real Estate, Real Estate Management & Development) | 33,100 | 209,107 | ||||||||||||||
Toppan Printing Company Limited (Industrials, Commercial Services & Supplies) | 18,300 | 320,011 | ||||||||||||||
Toray Industries Incorporated (Materials, Chemicals) | 85,000 | 488,324 | ||||||||||||||
Toshiba Corporation (Industrials, Industrial Conglomerates) | 21,900 | 592,740 | ||||||||||||||
Tosoh Corporation (Materials, Chemicals) | 17,400 | 235,477 | ||||||||||||||
TOTO Limited (Industrials, Building Products) | 8,400 | 315,015 | ||||||||||||||
Toyo Seikan Kaisha Limited (Materials, Containers & Packaging) | 8,800 | 140,326 | ||||||||||||||
The accompanying notes are an integral part of these financial statements.
Wells Fargo Funds | 99
Table of Contents
Portfolio of investments—February 29, 2020
FACTOR ENHANCED INTERNATIONAL PORTFOLIO
| Shares | Value | |||||||||||||||
| Japan (continued) | ||||||||||||||||
Toyo Suisan Kaisha Limited (Consumer Staples, Food Products) | 5,100 | $ | 202,761 | |||||||||||||
Toyota Tsusho Corporation (Industrials, Trading Companies & Distributors) | 12,400 | 372,622 | ||||||||||||||
Trend Micro Incorporated (Information Technology, Software) | 6,400 | 317,614 | ||||||||||||||
Tsumura & Company (Health Care, Pharmaceuticals) | 4,000 | 92,033 | ||||||||||||||
Tsuruha Holdings Incorporated (Consumer Staples, Food & Staples Retailing) | 2,200 | 255,437 | ||||||||||||||
UBE Industries Limited (Materials, Chemicals) | 5,700 | 103,725 | ||||||||||||||
Unicharm Corporation (Consumer Staples, Household Products) | 22,800 | 738,587 | ||||||||||||||
United Urban Investment Corporation (Real Estate, Equity REITs) | 160 | 256,117 | ||||||||||||||
USS Company Limited (Consumer Discretionary, Specialty Retail) | 12,200 | 193,320 | ||||||||||||||
Welcia Holdings Company Limiited (Consumer Staples, Food & Staples Retailing) | 2,600 | 155,239 | ||||||||||||||
West Japan Railway Company (Industrials, Road & Rail) | 9,900 | 699,317 | ||||||||||||||
Yahoo! Japan Corporation (Communication Services, Interactive Media & Services) | 133,800 | 485,733 | ||||||||||||||
Yamada Denki Company Limited (Consumer Discretionary, Specialty Retail) | 36,400 | 175,080 | ||||||||||||||
Yamaguchi Financial Group (Financials, Banks) | 14,500 | 75,605 | ||||||||||||||
Yamaha Corporation (Consumer Discretionary, Leisure Products) | 8,500 | 416,086 | ||||||||||||||
Yamaha Motor Company Limited (Consumer Discretionary, Automobiles) | 17,000 | 268,351 | ||||||||||||||
Yamazaki Baking Company Limited (Consumer Staples, Food Products) | 9,000 | 152,387 | ||||||||||||||
Yokogawa Electric Corporation (Information Technology, Electronic Equipment, Instruments & Components) | 13,100 | 212,764 | ||||||||||||||
Zenkoku Hosho Company Limited (Financials, Diversified Financial Services) | 2,500 | 93,281 | ||||||||||||||
Zensho Holdings Company Limited (Consumer Discretionary, Hotels, Restaurants & Leisure) | 4,800 | 87,803 | ||||||||||||||
Zeon Corporation (Materials, Chemicals) | 10,200 | 97,026 | ||||||||||||||
ZOZO Incorporated (Consumer Discretionary, Internet & Direct Marketing Retail) | 5,400 | 76,068 | ||||||||||||||
| 122,601,090 | ||||||||||||||||
|
| |||||||||||||||
| Luxembourg: 0.27% | ||||||||||||||||
Aroundtown SA (Real Estate, Real Estate Management & Development) | 46,820 | 406,769 | ||||||||||||||
B&M European Value Retail SA (Consumer Discretionary, Multiline Retail) | 43,811 | 189,780 | ||||||||||||||
Eurofins Scientific SE (Health Care, Life Sciences Tools & Services) | 602 | 302,250 | ||||||||||||||
Grand City Properties SA (Real Estate, Real Estate Management & Development) | 5,538 | 130,655 | ||||||||||||||
SES SA (Communication Services, Media) | 21,246 | 243,615 | ||||||||||||||
Subsea 7 SA (Energy, Energy Equipment & Services) | 11,846 | 107,640 | ||||||||||||||
Tenaris SA (Energy, Energy Equipment & Services) | 23,484 | 214,497 | ||||||||||||||
| 1,595,206 | ||||||||||||||||
|
| |||||||||||||||
| Netherlands: 3.12% | ||||||||||||||||
Aalberts Industries NV (Industrials, Machinery) | 4,966 | 185,211 | ||||||||||||||
Akzo Nobel NV (Materials, Chemicals) | 10,518 | 841,550 | ||||||||||||||
Altice NV Class A (Communication Services, Media) † | 28,464 | 151,169 | ||||||||||||||
ASM International NV (Information Technology, Semiconductors & Semiconductor Equipment) | 2,385 | 274,079 | ||||||||||||||
ASR Nederland NV (Financials, Insurance) | 6,922 | 232,940 | ||||||||||||||
CNH Industrial NV (Industrials, Machinery) | 53,791 | 501,116 | ||||||||||||||
Euronext NV (Financials, Capital Markets) 144A | 2,680 | 222,634 | ||||||||||||||
Heineken Holding NV (Consumer Staples, Beverages) | 5,043 | 447,806 | ||||||||||||||
Heineken NV (Consumer Staples, Beverages) | 11,985 | 1,194,089 | ||||||||||||||
IMCD Group NV (Industrials, Trading Companies & Distributors) | 2,718 | 221,890 | ||||||||||||||
Koninklijke Ahold Delhaize NV (Consumer Staples, Food & Staples Retailing) | 57,203 | 1,336,391 | ||||||||||||||
Koninklijke DSM NV (Materials, Chemicals) | 9,502 | 1,071,752 | ||||||||||||||
Koninklijke KPN NV (Communication Services, Diversified Telecommunication Services) | 178,594 | 433,156 | ||||||||||||||
Koninklijke Philips NV (Health Care, Health Care Equipment & Supplies) | 45,472 | 1,947,302 | ||||||||||||||
Koninklijke Vopak NV (Energy, Oil, Gas & Consumable Fuels) | 3,274 | 155,858 | ||||||||||||||
NN Group NV (Financials, Insurance) | 17,107 | 584,686 | ||||||||||||||
Philips Lighting NV (Industrials, Electrical Equipment) 144A | 6,518 | 194,213 | ||||||||||||||
Prosus NV (Consumer Discretionary, Internet & Direct Marketing Retail) † | 20,973 | 1,466,640 | ||||||||||||||
The accompanying notes are an integral part of these financial statements.
100 | Wells Fargo Funds
Table of Contents
Portfolio of investments—February 29, 2020
FACTOR ENHANCED INTERNATIONAL PORTFOLIO
| Shares | Value | |||||||||||||||
| Netherlands (continued) | ||||||||||||||||
Qiagen NV (Health Care, Life Sciences Tools & Services) † | 11,756 | $ | 430,871 | |||||||||||||
Randstad Holdings NV (Industrials, Professional Services) | 6,440 | 331,807 | ||||||||||||||
SBM Offshore NV (Energy, Energy Equipment & Services) | 8,955 | 141,752 | ||||||||||||||
STMicroelectronics NV (Information Technology, Semiconductors & Semiconductor Equipment) | 32,618 | 896,067 | ||||||||||||||
Unilever NV (Consumer Staples, Personal Products) | 76,283 | 4,027,536 | ||||||||||||||
Wolters Kluwer NV (Communication Services, Media) | 13,703 | 1,003,251 | ||||||||||||||
| 18,293,766 | ||||||||||||||||
|
| |||||||||||||||
| New Zealand: 0.44% | ||||||||||||||||
A2 Milk Company Limited (Consumer Staples, Food Products) † | 36,745 | 378,734 | ||||||||||||||
Auckland International Airport Limited (Industrials, Transportation Infrastructure) | 47,823 | 236,276 | ||||||||||||||
Contact Energy Limited (Utilities, Electric Utilities) | 37,696 | 158,559 | ||||||||||||||
Fisher & Paykel Healthcare Corporation (Health Care, Health Care Equipment & Supplies) | 30,912 | 500,507 | ||||||||||||||
Fletcher Building Limited (Materials, Construction Materials) | 43,555 | 142,180 | ||||||||||||||
Mainfreight Limited (Industrials, Air Freight & Logistics) | 4,218 | 99,209 | ||||||||||||||
Mercury LTD (Utilities, Electric Utilities) | 32,876 | 98,696 | ||||||||||||||
Meridian Energy Limited (Utilities, Independent Power & Renewable Electricity Producers) | 66,402 | 192,636 | ||||||||||||||
Ryman Healthcare Limited (Health Care, Health Care Providers & Services) | 21,662 | 207,358 | ||||||||||||||
Spark New Zealand Limited (Communication Services, Diversified Telecommunication Services) | 90,189 | 256,570 | ||||||||||||||
Xero Limited (Information Technology, Software) † | 6,036 | 294,878 | ||||||||||||||
| 2,565,603 | ||||||||||||||||
|
| |||||||||||||||
| Norway: 0.73% | ||||||||||||||||
Den Norske Bank ASA (Financials, Banks) | 45,976 | 770,066 | ||||||||||||||
Equinor ASA (Energy, Oil, Gas & Consumable Fuels) | 56,940 | 877,006 | ||||||||||||||
Gjensidige Forsikring ASA (Financials, Insurance) | 9,591 | 194,923 | ||||||||||||||
Mowi ASA (Consumer Staples, Food Products) | 23,894 | 506,193 | ||||||||||||||
Orkla ASA (Consumer Staples, Food Products) | 43,161 | 367,104 | ||||||||||||||
Salmar ASA (Consumer Staples, Food Products) | 2,797 | 126,404 | ||||||||||||||
Schibsted ASA Class A (Communication Services, Media) | 3,818 | 97,306 | ||||||||||||||
Storebrand ASA (Financials, Insurance) | 23,970 | 153,738 | ||||||||||||||
Telenor ASA (Communication Services, Diversified Telecommunication Services) | 33,996 | 550,784 | ||||||||||||||
TGS Nopec Geophysical Company ASA (Energy, Energy Equipment & Services) | 6,523 | 152,207 | ||||||||||||||
Tomra Systems ASA (Industrials, Commercial Services & Supplies) | 5,670 | 182,433 | ||||||||||||||
Yara International ASA (Materials, Chemicals) | 8,687 | 318,938 | ||||||||||||||
| 4,297,102 | ||||||||||||||||
|
| |||||||||||||||
| Pagua New Guinea: 0.04% | ||||||||||||||||
Oil Search Limited (Energy, Oil, Gas & Consumable Fuels) | 64,500 | 235,896 | ||||||||||||||
|
| |||||||||||||||
| Poland: 0.29% | ||||||||||||||||
Bank Pekao SA (Financials, Banks) | 8,076 | 182,751 | ||||||||||||||
Bank Zachodni WBK SA (Financials, Banks) | 1,747 | 112,893 | ||||||||||||||
CD Projekt SA (Communication Services, Entertainment) | 3,399 | 243,881 | ||||||||||||||
KGHM Polska Miedz SA (Materials, Metals & Mining) † | 7,337 | 134,554 | ||||||||||||||
LPP SA (Consumer Discretionary, Textiles, Apparel & Luxury Goods) | 67 | 117,878 | ||||||||||||||
PKO Bank Polski SA (Financials, Banks) | 45,901 | 367,518 | ||||||||||||||
Polski Koncern Naftowy Orlen SA (Energy, Oil, Gas & Consumable Fuels) | 16,070 | 242,755 | ||||||||||||||
Powszechny Zaklad Ubezpieczen SA (Financials, Insurance) | 29,437 | 262,496 | ||||||||||||||
| 1,664,726 | ||||||||||||||||
|
| |||||||||||||||
| Portugal: 0.20% | ||||||||||||||||
Energias de Portugal SA (Utilities, Electric Utilities) | 132,525 | 618,719 | ||||||||||||||
Galp Energia SGPS SA (Energy, Oil, Gas & Consumable Fuels) | 24,504 | 338,013 | ||||||||||||||
Jeronimo Martins SA (Consumer Staples, Food & Staples Retailing) | 12,328 | 217,928 | ||||||||||||||
| 1,174,660 | ||||||||||||||||
|
| |||||||||||||||
The accompanying notes are an integral part of these financial statements.
Wells Fargo Funds | 101
Table of Contents
Portfolio of investments—February 29, 2020
FACTOR ENHANCED INTERNATIONAL PORTFOLIO
| Shares | Value | |||||||||||||||
| Singapore: 1.66% | ||||||||||||||||
Ascendas REIT (Real Estate, Equity REITs) | 147,900 | $ | 326,929 | |||||||||||||
CapitaLand Commercial Trust Limited (Real Estate, Equity REITs) | 137,400 | 184,210 | ||||||||||||||
CapitaLand Limited (Real Estate, Real Estate Management & Development) | 134,863 | 345,502 | ||||||||||||||
CapitaLand Mall Trust (Real Estate, Equity REITs) | 134,500 | 220,642 | ||||||||||||||
City Developments Limited (Real Estate, Real Estate Management & Development) | 24,775 | 177,078 | ||||||||||||||
ComfortDelGro Corporation Limited (Industrials, Road & Rail) | 115,537 | 163,812 | ||||||||||||||
DBS Group Holdings Limited (Financials, Banks) | 93,013 | 1,626,259 | ||||||||||||||
Genting Singapore Limited (Consumer Discretionary, Hotels, Restaurants & Leisure) | 285,324 | 168,191 | ||||||||||||||
Jardine Cycle & Carriage Limited (Consumer Discretionary, Distributors) | 4,677 | 91,892 | ||||||||||||||
Keppel Corporation Limited (Industrials, Industrial Conglomerates) | 69,400 | 320,291 | ||||||||||||||
Mapletree Commercial Trust (Real Estate, Equity REITs) | 123,000 | 186,431 | ||||||||||||||
Mapletree Industrial Trust (Real Estate, Equity REITs) | 77,800 | 150,137 | ||||||||||||||
Mapletree Logistics Trust (Real Estate, Equity REITs) | 140,900 | 187,812 | ||||||||||||||
Oversea-Chinese Banking Corporation Limited (Financials, Banks) | 204,496 | 1,574,212 | ||||||||||||||
Singapore Airlines Limited (Industrials, Airlines) | 38,600 | 223,356 | ||||||||||||||
Singapore Airport Terminal Services Limited (Industrials, Transportation Infrastructure) | 32,500 | 94,886 | ||||||||||||||
Singapore Exchange Limited (Financials, Capital Markets) | 39,974 | 246,842 | ||||||||||||||
Singapore Press Holdings Limited (Communication Services, Media) | 82,700 | 113,800 | ||||||||||||||
Singapore Technologies Engineering Limited (Industrials, Aerospace & Defense) | 68,669 | 208,013 | ||||||||||||||
Singapore Telecommunications Limited (Communication Services, Diversified Telecommunication Services) | 381,415 | 826,494 | ||||||||||||||
Suntec REIT (Real Estate, Equity REITs) | 102,700 | 125,932 | ||||||||||||||
United Overseas Bank Limited (Financials, Banks) | 79,086 | 1,411,569 | ||||||||||||||
UOL Group Limited (Real Estate, Real Estate Management & Development) | 25,873 | 138,751 | ||||||||||||||
Venture Corporation Limited (Information Technology, Electronic Equipment, Instruments & Components) | 13,400 | 161,501 | ||||||||||||||
Wilmar International Limited (Consumer Staples, Food Products) | 127,785 | 368,840 | ||||||||||||||
Yangzijiang Shipbuilding Holdings Limited (Industrials, Machinery) | 144,600 | 100,328 | ||||||||||||||
| 9,743,710 | ||||||||||||||||
|
| |||||||||||||||
| Spain: 2.02% | ||||||||||||||||
Actividades de Construccion y Servicios SA (Industrials, Construction & Engineering) | 14,590 | 435,051 | ||||||||||||||
Aena SA (Industrials, Transportation Infrastructure) 144A | 3,830 | 616,888 | ||||||||||||||
Amadeus IT Holding SA Class A (Information Technology, IT Services) | 22,125 | 1,568,465 | ||||||||||||||
Bankinter SA (Financials, Banks) | 34,042 | 201,150 | ||||||||||||||
Bolsas y Mercados Espanoles (Financials, Capital Markets) | 3,600 | 137,031 | ||||||||||||||
Cellnex Telecom SA (Communication Services, Diversified Telecommunication Services) 144A | 12,144 | 592,072 | ||||||||||||||
Enagás SA (Utilities, Gas Utilities) | 11,515 | 298,787 | ||||||||||||||
Endesa SA (Utilities, Electric Utilities) | 16,686 | 429,364 | ||||||||||||||
Gas Natural SDG SA (Utilities, Gas Utilities) | 17,792 | 414,490 | ||||||||||||||
Grifols SA (Health Care, Biotechnology) | 14,415 | 464,608 | ||||||||||||||
Iberdrola SA (Utilities, Electric Utilities) | 313,863 | 3,593,163 | ||||||||||||||
Industria de Diseno Textil SA (Consumer Discretionary, Specialty Retail) | 56,284 | 1,756,002 | ||||||||||||||
Inmobiliaria Colonial Socimi SA (Real Estate, Equity REITs) | 14,028 | 179,180 | ||||||||||||||
International Consolidated Airlines Group SA (Industrials, Airlines) | 54,086 | 331,279 | ||||||||||||||
Mapfre SA (Financials, Insurance) | 49,675 | 111,735 | ||||||||||||||
Merlin Properties Socimi SA (Real Estate, Equity REITs) | 19,796 | 255,490 | ||||||||||||||
Red Eléctrica de Espana SA (Utilities, Electric Utilities) | 22,710 | 434,062 | ||||||||||||||
| 11,818,817 | ||||||||||||||||
|
| |||||||||||||||
| Sweden: 3.06% | ||||||||||||||||
AAK AB (Consumer Staples, Food Products) | 8,453 | 145,951 | ||||||||||||||
Alfa Laval AB (Industrials, Machinery) | 15,381 | 345,896 | ||||||||||||||
Assa Abloy AB Class B (Industrials, Building Products) | 48,997 | 1,101,900 | ||||||||||||||
The accompanying notes are an integral part of these financial statements.
102 | Wells Fargo Funds
Table of Contents
Portfolio of investments—February 29, 2020
FACTOR ENHANCED INTERNATIONAL PORTFOLIO
| Shares | Value | |||||||||||||||
| Sweden (continued) | ||||||||||||||||
Atlas Copco AB Class A (Industrials, Machinery) | 32,575 | $ | 1,161,459 | |||||||||||||
Boliden AB (Materials, Metals & Mining) | 14,769 | 310,167 | ||||||||||||||
Castellum AB (Real Estate, Real Estate Management & Development) | 12,424 | 286,492 | ||||||||||||||
Dometic Group AB (Consumer Discretionary, Auto Components) 144A | 15,586 | 133,095 | ||||||||||||||
Electrolux AB Class B (Consumer Discretionary, Household Durables) | 11,665 | 236,047 | ||||||||||||||
Elekta AB Class B (Health Care, Health Care Equipment & Supplies) | 20,097 | 213,309 | ||||||||||||||
Epiroc AB Class A (Industrials, Machinery) | 31,977 | 369,370 | ||||||||||||||
EQT AB (Financials, Capital Markets) † | 34,438 | 503,632 | ||||||||||||||
Ericsson LM Class B (Information Technology, Communications Equipment) | 144,925 | 1,162,404 | ||||||||||||||
Essity Aktiebolag AB (Consumer Staples, Household Products) | 32,500 | 979,807 | ||||||||||||||
Evolution Gaming Group (Consumer Discretionary, Hotels, Restaurants & Leisure) 144A | 6,078 | 221,494 | ||||||||||||||
Fabege AB (Real Estate, Real Estate Management & Development) | 13,980 | 229,616 | ||||||||||||||
Fastighets AB Balder B Shares (Real Estate, Real Estate Management & Development) † | 4,926 | 233,140 | ||||||||||||||
Getinge AB Class B (Health Care, Health Care Equipment & Supplies) | 11,072 | 185,679 | ||||||||||||||
Hennes & Mauritz AB Class B (Consumer Discretionary, Specialty Retail) | 40,627 | 737,303 | ||||||||||||||
Hexpol AB (Materials, Chemicals) | 13,413 | 100,869 | ||||||||||||||
Holmen AB Class B (Materials, Paper & Forest Products) | 5,266 | 148,333 | ||||||||||||||
Husqvarna AB Class B (Consumer Discretionary, Household Durables) | 21,658 | 145,783 | ||||||||||||||
ICA Gruppen AB (Consumer Staples, Food & Staples Retailing) | 4,777 | 178,864 | ||||||||||||||
Industrivarden AB Class A (Financials, Diversified Financial Services) | 8,920 | 207,577 | ||||||||||||||
Indutrade AB (Industrials, Trading Companies & Distributors) | 4,235 | 138,265 | ||||||||||||||
Investor AB Class B (Financials, Diversified Financial Services) | 23,186 | 1,161,375 | ||||||||||||||
Loomis AB Class B (Industrials, Commercial Services & Supplies) | 3,964 | 138,431 | ||||||||||||||
Lundbergforetagen AB Class B (Financials, Diversified Financial Services) | 3,648 | 151,324 | ||||||||||||||
Nibe Industrier AB Class B (Industrials, Building Products) | 16,588 | 270,080 | ||||||||||||||
Saab AB Class B (Industrials, Aerospace & Defense) | 4,252 | 116,637 | ||||||||||||||
Securitas AB Class B (Industrials, Commercial Services & Supplies) | 16,515 | 224,278 | ||||||||||||||
Skandinaviska Enskilda Banken AB Class A (Financials, Banks) | 80,194 | 768,656 | ||||||||||||||
Skanska AB Class B (Industrials, Construction & Engineering) | 18,846 | 414,997 | ||||||||||||||
SKF AB Class B (Industrials, Machinery) | 20,462 | 361,790 | ||||||||||||||
Svenska Cellulosa AB Class B (Materials, Paper & Forest Products) | 30,495 | 292,611 | ||||||||||||||
Svenska Handelsbanken AB Class A (Financials, Banks) | 77,497 | 783,624 | ||||||||||||||
Swedbank AB Class A (Financials, Banks) | 48,690 | 739,513 | ||||||||||||||
Swedish Match AB (Consumer Staples, Tobacco) | 7,925 | 464,995 | ||||||||||||||
Swedish Orphan Biovitrum AB (Health Care, Biotechnology) † | 10,024 | 172,580 | ||||||||||||||
Tele2 AB Class B (Communication Services, Wireless Telecommunication Services) | 24,100 | 350,852 | ||||||||||||||
Telia Company AB (Communication Services, Diversified Telecommunication Services) | 133,340 | 528,046 | ||||||||||||||
Trelleborg AB Class B (Industrials, Machinery) | 12,745 | 199,114 | ||||||||||||||
Volvo AB Class B (Industrials, Machinery) | 84,984 | 1,333,964 | ||||||||||||||
| 17,949,319 | ||||||||||||||||
|
| |||||||||||||||
| Switzerland: 8.37% | ||||||||||||||||
Adecco SA (Industrials, Professional Services) | 8,472 | 453,734 | ||||||||||||||
Allreal Holding AG (Real Estate, Real Estate Management & Development) | 790 | 169,207 | ||||||||||||||
Baloise Holding AG (Financials, Insurance) | 2,449 | 396,005 | ||||||||||||||
Barry Callebaut AG (Consumer Staples, Food Products) | 145 | 299,109 | ||||||||||||||
BB Biotech AG (Health Care, Biotechnology) | 48,398 | 2,987,793 | ||||||||||||||
Belimo Holding AG (Industrials, Building Products) | 26 | 169,776 | ||||||||||||||
Cembra Money Bank AG (Financials, Consumer Finance) | 1,397 | 157,239 | ||||||||||||||
Chocoladefabriken Lindt & Sprungli AG (Consumer Staples, Food Products) | 5 | 433,769 | ||||||||||||||
Coca-Cola HBC AG (Consumer Staples, Beverages) | 9,980 | 318,266 | ||||||||||||||
EMS-Chemie Holdings AG (Materials, Chemicals) | 434 | 254,766 | ||||||||||||||
Flughafen Zuerich AG (Industrials, Transportation Infrastructure) | 1,032 | 156,521 | ||||||||||||||
Galenica AG (Health Care, Pharmaceuticals) | 2,462 | 166,475 | ||||||||||||||
Geberit AG (Industrials, Building Products) | 1,878 | 937,124 | ||||||||||||||
The accompanying notes are an integral part of these financial statements.
Wells Fargo Funds | 103
Table of Contents
Portfolio of investments—February 29, 2020
FACTOR ENHANCED INTERNATIONAL PORTFOLIO
| Shares | Value | |||||||||||||||
| Switzerland (continued) | ||||||||||||||||
Georg Fischer AG (Industrials, Machinery) | 210 | $ | 180,486 | |||||||||||||
Givaudan SA (Materials, Chemicals) | 407 | 1,267,978 | ||||||||||||||
Helvetia Holding AG (Financials, Insurance) | 1,602 | 213,422 | ||||||||||||||
Kuehne & Nagel International AG (Industrials, Marine) | 2,860 | 418,651 | ||||||||||||||
Logitech International SA (Information Technology, Technology Hardware, Storage & Peripherals) | 8,761 | 339,799 | ||||||||||||||
Lonza Group AG (Health Care, Life Sciences Tools & Services) | 3,834 | 1,529,910 | ||||||||||||||
Nestle SA (Consumer Staples, Food Products) | 153,972 | 15,844,602 | ||||||||||||||
Pargesa Holding SA (Financials, Diversified Financial Services) | 2,073 | 152,813 | ||||||||||||||
Partners Group Holding AG (Financials, Capital Markets) | 914 | 793,189 | ||||||||||||||
PSP Swiss Property AG (Real Estate, Real Estate Management & Development) | 1,865 | 275,652 | ||||||||||||||
Roche Holding AG (Health Care, Pharmaceuticals) | 35,143 | 11,299,657 | ||||||||||||||
Schindler Holding AG - Participation Certificate (Industrials, Machinery) | 2,095 | 469,790 | ||||||||||||||
SGS SA (Industrials, Professional Services) | 263 | 656,868 | ||||||||||||||
Sig Combibloc Group AG (Materials, Containers & Packaging) | 11,123 | 165,677 | ||||||||||||||
Sika AG (Materials, Chemicals) | 6,788 | 1,215,076 | ||||||||||||||
Sonova Holding AG (Health Care, Health Care Equipment & Supplies) | 2,710 | 647,267 | ||||||||||||||
Straumann Holding AG (Health Care, Health Care Equipment & Supplies) | 541 | 508,267 | ||||||||||||||
Sunrise Communications Group AG (Communication Services, Diversified Telecommunication Services) 144A | 1,615 | 131,361 | ||||||||||||||
Swiss Life Holding AG (Financials, Insurance) | 1,707 | 783,714 | ||||||||||||||
Swiss Prime Site AG (Real Estate, Real Estate Management & Development) | 3,944 | 475,868 | ||||||||||||||
Swisscom AG (Communication Services, Diversified Telecommunication Services) | 1,247 | 665,622 | ||||||||||||||
Tecan Group AG (Health Care, Life Sciences Tools & Services) | 491 | 137,487 | ||||||||||||||
Temenos Group AG (Information Technology, Software) | 3,275 | 468,250 | ||||||||||||||
VAT Group AG (Industrials, Machinery) 144A | 1,439 | 195,609 | ||||||||||||||
Vifor Pharma AG (Health Care, Pharmaceuticals) | 2,160 | 362,847 | ||||||||||||||
Zurich Insurance Group AG (Financials, Insurance) | 7,563 | 2,928,634 | ||||||||||||||
| 49,028,280 | ||||||||||||||||
|
| |||||||||||||||
| Thailand: 0.05% | ||||||||||||||||
Thai Beverage plc (Consumer Staples, Beverages) | 475,800 | 268,370 | ||||||||||||||
|
| |||||||||||||||
| United Kingdom: 14.08% | ||||||||||||||||
3i Group plc (Financials, Capital Markets) | 49,784 | 655,316 | ||||||||||||||
Admiral Group plc (Financials, Insurance) | 11,802 | 323,919 | ||||||||||||||
Aggreko plc (Industrials, Commercial Services & Supplies) | 12,584 | 109,944 | ||||||||||||||
Amcor Limited (Materials, Containers & Packaging) | 58,108 | 552,432 | ||||||||||||||
Ashmore Group plc (Financials, Capital Markets) | 22,880 | 138,210 | ||||||||||||||
Ashtead Group plc (Industrials, Trading Companies & Distributors) | 22,974 | 720,270 | ||||||||||||||
Associated British Foods plc (Consumer Staples, Food Products) | 18,021 | 526,196 | ||||||||||||||
AstraZeneca plc (Health Care, Pharmaceuticals) | 67,153 | 5,893,673 | ||||||||||||||
Auto Trader Group plc (Communication Services, Interactive Media & Services) 144A | 50,965 | 343,175 | ||||||||||||||
Avast plc (Information Technology, Software) 144A | 29,655 | 151,177 | ||||||||||||||
AVEVA Group plc (Information Technology, Software) | 3,139 | 178,567 | ||||||||||||||
Aviva plc (Financials, Insurance) | 202,555 | 927,805 | ||||||||||||||
BAE Systems plc (Industrials, Aerospace & Defense) | 142,912 | 1,130,445 | ||||||||||||||
Barratt Developments plc (Consumer Discretionary, Household Durables) | 51,816 | 511,506 | ||||||||||||||
Beazley plc (Financials, Insurance) | 25,837 | 179,105 | ||||||||||||||
Bellway plc (Consumer Discretionary, Household Durables) | 6,180 | 299,090 | ||||||||||||||
British American Tobacco plc (Consumer Staples, Tobacco) | 111,223 | 4,397,674 | ||||||||||||||
Britvic plc (Consumer Staples, Beverages) | 13,693 | 151,633 | ||||||||||||||
BT Group plc (Communication Services, Diversified Telecommunication Services) | 455,631 | 835,863 | ||||||||||||||
Bunzl plc (Industrials, Trading Companies & Distributors) | 17,392 | 417,620 | ||||||||||||||
Burberry Group plc (Consumer Discretionary, Textiles, Apparel & Luxury Goods) | 20,985 | 452,222 | ||||||||||||||
Capita plc (Industrials, Professional Services) † | 86,555 | 143,614 | ||||||||||||||
The accompanying notes are an integral part of these financial statements.
104 | Wells Fargo Funds
Table of Contents
Portfolio of investments—February 29, 2020
FACTOR ENHANCED INTERNATIONAL PORTFOLIO
| Shares | Value | |||||||||||||||
| United Kingdom (continued) | ||||||||||||||||
Carnival plc (Consumer Discretionary, Hotels, Restaurants & Leisure) | 8,647 | $ | 273,512 | |||||||||||||
Cineworld Group plc (Communication Services, Entertainment) | 56,259 | 114,260 | ||||||||||||||
Close Brothers Group plc (Financials, Capital Markets) | 7,534 | 125,392 | ||||||||||||||
Compass Group plc (Consumer Discretionary, Hotels, Restaurants & Leisure) | 80,825 | 1,780,771 | ||||||||||||||
ConvaTec Limited (Health Care, Health Care Equipment & Supplies) 144A | 69,575 | 185,409 | ||||||||||||||
Croda International plc (Materials, Chemicals) | 6,741 | 398,456 | ||||||||||||||
Dechra Pharmaceuticals plc (Health Care, Pharmaceuticals) | 4,782 | 164,201 | ||||||||||||||
Derwent Valley Holdings plc (Real Estate, Equity REITs) | 5,595 | 281,206 | ||||||||||||||
Diageo plc (Consumer Staples, Beverages) | 120,066 | 4,283,904 | ||||||||||||||
Dialog Semiconductor plc (Information Technology, Semiconductors & Semiconductor Equipment) † | 3,428 | 118,259 | ||||||||||||||
Direct Line Insurance Group plc (Financials, Insurance) | 68,786 | 274,194 | ||||||||||||||
DS Smith plc (Materials, Containers & Packaging) | 69,234 | 282,933 | ||||||||||||||
easyJet plc (Industrials, Airlines) | 10,877 | 157,013 | ||||||||||||||
Electrocomponents plc (Information Technology, Electronic Equipment, Instruments & Components) | 22,979 | 180,331 | ||||||||||||||
EVRAZ plc (Materials, Metals & Mining) | 31,846 | 135,994 | ||||||||||||||
Experian Group Limited plc (Industrials, Professional Services) | 46,010 | 1,531,392 | ||||||||||||||
Ferguson plc (Industrials, Trading Companies & Distributors) | 11,201 | 975,939 | ||||||||||||||
G4S plc (Industrials, Commercial Services & Supplies) | 86,384 | 191,271 | ||||||||||||||
GlaxoSmithKline plc (Health Care, Pharmaceuticals) | 253,520 | 5,115,873 | ||||||||||||||
Great Portland Estates plc (Real Estate, Equity REITs) | 11,916 | 128,626 | ||||||||||||||
Greggs plc (Consumer Discretionary, Hotels, Restaurants & Leisure) | 4,825 | 129,295 | ||||||||||||||
GVC Holdings plc (Consumer Discretionary, Hotels, Restaurants & Leisure) | 28,592 | 293,959 | ||||||||||||||
Halma plc (Information Technology, Electronic Equipment, Instruments & Components) | 19,577 | 491,987 | ||||||||||||||
Hays plc (Industrials, Professional Services) | 80,526 | 143,798 | ||||||||||||||
Hikma Pharmaceuticals plc (Health Care, Pharmaceuticals) | 7,579 | 176,440 | ||||||||||||||
HomeServe plc (Industrials, Commercial Services & Supplies) | 13,965 | 212,743 | ||||||||||||||
Howden Joinery Group plc (Industrials, Trading Companies & Distributors) | 30,738 | 254,224 | ||||||||||||||
IG Group Holdings plc (Financials, Capital Markets) | 18,729 | 163,390 | ||||||||||||||
IMI plc (Industrials, Machinery) | 14,866 | 192,441 | ||||||||||||||
Imperial Tobacco Group plc (Consumer Staples, Tobacco) | 42,996 | 868,605 | ||||||||||||||
Inchcape plc (Consumer Discretionary, Distributors) | 20,115 | 150,358 | ||||||||||||||
Informa plc (Communication Services, Media) | 66,578 | 589,244 | ||||||||||||||
Intercontinental Hotels Group plc (Consumer Discretionary, Hotels, Restaurants & Leisure) | 10,160 | 562,941 | ||||||||||||||
Intermediate Capital Group (Financials, Capital Markets) | 14,607 | 302,089 | ||||||||||||||
Intertek Group plc (Industrials, Professional Services) | 8,438 | 575,899 | ||||||||||||||
Investec plc (Financials, Capital Markets) | 33,511 | 171,678 | ||||||||||||||
ITV plc (Communication Services, Media) | 215,300 | 327,184 | ||||||||||||||
IWG plc (Real Estate, Real Estate Management & Development) | 34,064 | 154,550 | ||||||||||||||
J Sainsbury plc (Consumer Staples, Food & Staples Retailing) | 92,548 | 234,465 | ||||||||||||||
JD Sports Fashion plc (Consumer Discretionary, Specialty Retail) | 21,649 | 207,098 | ||||||||||||||
John Wood Group plc (Energy, Energy Equipment & Services) | 37,662 | 180,599 | ||||||||||||||
Johnson Matthey plc (Materials, Chemicals) | 10,563 | 346,223 | ||||||||||||||
Jupiter Fund Management plc (Financials, Capital Markets) | 23,065 | 90,207 | ||||||||||||||
Just Eat plc (Consumer Discretionary, Internet & Direct Marketing Retail) †(a) | 30,708 | 323,835 | ||||||||||||||
Kingfisher plc (Consumer Discretionary, Specialty Retail) | 108,224 | 265,517 | ||||||||||||||
Legal & General Group plc (Financials, Insurance) | 302,828 | 1,025,943 | ||||||||||||||
Lloyds Banking Group plc (Financials, Banks) | 3,640,426 | 2,362,986 | ||||||||||||||
London Stock Exchange Group plc (Financials, Capital Markets) | 16,024 | 1,573,941 | ||||||||||||||
M&G plc (Financials, Diversified Financial Services) † | 129,108 | 337,140 | ||||||||||||||
Man Group plc (Financials, Capital Markets) | 78,293 | 148,672 | ||||||||||||||
Marks & Spencer Group plc (Consumer Discretionary, Multiline Retail) | 110,787 | 228,309 | ||||||||||||||
Meggitt plc (Industrials, Aerospace & Defense) | 37,945 | 267,212 | ||||||||||||||
Micro Focus International plc (Information Technology, Software) | 16,676 | 158,817 | ||||||||||||||
Mondi plc (Materials, Paper & Forest Products) | 23,969 | 486,801 | ||||||||||||||
The accompanying notes are an integral part of these financial statements.
Wells Fargo Funds | 105
Table of Contents
Portfolio of investments—February 29, 2020
FACTOR ENHANCED INTERNATIONAL PORTFOLIO
| Shares | Value | |||||||||||||||
| United Kingdom (continued) | ||||||||||||||||
Moneysupermarket.com Group plc (Consumer Discretionary, Internet & Direct Marketing Retail) | 25,558 | $ | 102,816 | |||||||||||||
National Grid plc (Utilities, Multi-Utilities) | 180,880 | 2,280,125 | ||||||||||||||
Network International Holding (Financials, Diversified Financial Services) † | 21,633 | 148,946 | ||||||||||||||
Next plc (Consumer Discretionary, Multiline Retail) | 7,042 | 555,023 | ||||||||||||||
NMC Health plc (Health Care, Health Care Providers & Services) | 7,509 | 90,346 | ||||||||||||||
Pearson plc (Communication Services, Media) | 40,627 | 294,717 | ||||||||||||||
Pennon Group plc (Utilities, Water Utilities) | 21,891 | 306,178 | ||||||||||||||
Persimmon plc (Consumer Discretionary, Household Durables) | 16,201 | 598,981 | ||||||||||||||
Phoenix Group Holdings plc (Financials, Insurance) | 37,429 | 336,095 | ||||||||||||||
Polymetal International plc (Materials, Metals & Mining) | 13,746 | 211,281 | ||||||||||||||
Quilter plc (Financials, Capital Markets) | 83,208 | 158,149 | ||||||||||||||
Reckitt Benckiser Group plc (Consumer Staples, Household Products) | 38,065 | 2,812,731 | ||||||||||||||
RELX plc (Industrials, Professional Services) | 102,220 | 2,473,195 | ||||||||||||||
Rentokil Initial plc (Industrials, Commercial Services & Supplies) | 94,335 | 590,240 | ||||||||||||||
Rightmove plc (Communication Services, Interactive Media & Services) | 44,326 | 355,443 | ||||||||||||||
Rio Tinto plc (Materials, Metals & Mining) | 57,352 | 2,700,109 | ||||||||||||||
Rotork plc (Industrials, Machinery) | 47,139 | 172,366 | ||||||||||||||
Royal Dutch Shell plc Class A (Energy, Oil, Gas & Consumable Fuels) | 212,178 | 4,624,016 | ||||||||||||||
Royal Mail plc (Industrials, Air Freight & Logistics) | 53,448 | 112,088 | ||||||||||||||
RSA Insurance Group plc (Financials, Insurance) | 51,700 | 345,799 | ||||||||||||||
Segro plc (Real Estate, Equity REITs) | 58,821 | 623,591 | ||||||||||||||
Severn Trent plc (Utilities, Water Utilities) | 12,531 | 397,780 | ||||||||||||||
Signature Aviation PLC (Industrials, Transportation Infrastructure) | 36,683 | 132,714 | ||||||||||||||
Smith & Nephew plc (Health Care, Health Care Equipment & Supplies) | 45,340 | 1,017,223 | ||||||||||||||
Smiths Group plc (Industrials, Industrial Conglomerates) | 19,448 | 387,542 | ||||||||||||||
Spirax-Sarco Engineering plc (Industrials, Machinery) | 3,755 | 411,411 | ||||||||||||||
SSE plc (Utilities, Electric Utilities) | 54,273 | 1,067,025 | ||||||||||||||
SSP Group plc (Consumer Discretionary, Hotels, Restaurants & Leisure) | 22,262 | 147,222 | ||||||||||||||
Tate & Lyle plc (Consumer Staples, Food Products) | 22,642 | 206,461 | ||||||||||||||
Taylor Wimpey plc (Consumer Discretionary, Household Durables) | 166,520 | 439,709 | ||||||||||||||
TechnipFMC plc - BATS Exchange (Energy, Energy Equipment & Services) | 24,193 | 369,052 | ||||||||||||||
Tesco plc (Consumer Staples, Food & Staples Retailing) | 505,118 | 1,505,015 | ||||||||||||||
The Berkeley Group Holdings plc (Consumer Discretionary, Household Durables) | 6,525 | 402,403 | ||||||||||||||
The Sage Group plc (Information Technology, Software) | 57,431 | 508,791 | ||||||||||||||
The Unite Group plc (Real Estate, Equity REITs) | 18,914 | 275,155 | ||||||||||||||
TP Icap plc (Financials, Capital Markets) | 28,255 | 133,311 | ||||||||||||||
Tritax Big Box REIT plc (Real Estate, Equity REITs) | 94,892 | 159,148 | ||||||||||||||
Tullow Oil plc (Energy, Oil, Gas & Consumable Fuels) | 91,723 | 40,186 | ||||||||||||||
Unilever plc (Consumer Staples, Personal Products) | 60,876 | 3,272,686 | ||||||||||||||
United Utilities Group plc (Utilities, Water Utilities) | 35,125 | 425,225 | ||||||||||||||
Victrex plc (Materials, Chemicals) | 4,397 | 119,898 | ||||||||||||||
WH Smith plc (Consumer Discretionary, Specialty Retail) | 5,888 | 147,520 | ||||||||||||||
Whitbread plc (Consumer Discretionary, Hotels, Restaurants & Leisure) | 6,964 | 351,229 | ||||||||||||||
William Morrison Supermarkets plc (Consumer Staples, Food & Staples Retailing) | 127,504 | 285,377 | ||||||||||||||
WPP plc (Communication Services, Media) | 65,566 | 629,962 | ||||||||||||||
| 82,461,262 | ||||||||||||||||
|
| |||||||||||||||
| United States: 0.03% | ||||||||||||||||
Ovintiv Incorporated (Energy, Oil, Gas & Consumable Fuels) |
| 13,980 | 161,542 | |||||||||||||
|
| |||||||||||||||
Total Common Stocks (Cost $539,744,943) |
| 554,151,411 | ||||||||||||||
|
| |||||||||||||||
The accompanying notes are an integral part of these financial statements.
106 | Wells Fargo Funds
Table of Contents
Portfolio of investments—February 29, 2020
FACTOR ENHANCED INTERNATIONAL PORTFOLIO
| Dividend yield | Shares | Value | ||||||||||||||
| Preferred Stocks: 0.24% | ||||||||||||||||
| Germany: 0.24% | ||||||||||||||||
Fuchs Petrolub SE (Materials, Chemicals) | 2.99 | % | 3,549 | $ | 135,857 | |||||||||||
Henkel AG & Company KGaA (Consumer Staples, Household Products) | 2.45 | 9,287 | 865,242 | |||||||||||||
Sartorius AG Vorzug (Health Care, Health Care Equipment & Supplies) | 0.31 | 1,710 | 399,747 | |||||||||||||
Total Preferred Stocks (Cost $1,570,563) |
| 1,400,846 | ||||||||||||||
|
| |||||||||||||||
| Expiration date | ||||||||||||||||
| Rights: 0.00% | ||||||||||||||||
| Spain: 0.00% | ||||||||||||||||
Acs Actividades De Construccio (Industrials, Construction & Engineering) † | 4-3-2020 | 14,590 | 6,415 | |||||||||||||
|
| |||||||||||||||
Total Rights (Cost $7,097) |
| 6,415 | ||||||||||||||
|
| |||||||||||||||
| Yield | ||||||||||||||||
| Short-Term Investments: 4.15% | ||||||||||||||||
| Investment Companies: 4.15% | ||||||||||||||||
Wells Fargo Government Money Market Fund Select | 1.52 | 24,301,039 | 24,301,039 | |||||||||||||
|
| |||||||||||||||
Total Short-Term Investments (Cost $24,301,039) |
| 24,301,039 | ||||||||||||||
|
| |||||||||||||||
| Total investments in securities (Cost $565,623,642) | 98.98 | % | 579,859,711 | |||||
Other assets and liabilities, net | 1.02 | 5,985,575 | ||||||
|
|
|
| |||||
| Total net assets | 100.00 | % | $ | 585,845,286 | ||||
|
|
|
| |||||
| † | Non-income-earning security |
| 144A | The security may be resold in transactions exempt from registration, normally to qualified institutional buyers, pursuant to Rule 144A under the Securities Act of 1933. |
| (a) | The security is fair valued in accordance with procedures approved by the Board of Trustees. |
| (l) | The issuer of the security is an affiliated person of the Portfolio as defined in the Investment Company Act of 1940. |
| (u) | The rate represents the7-day annualized yield at period end. |
Abbreviations:
| REIT | Real estate investment trust |
Futures Contracts
| Description | Number of contracts | Expiration date | Notional cost | Notional value | Unrealized gains | Unrealized losses | ||||||||||||||||||
Long | ||||||||||||||||||||||||
MSCI EAFE Index | 320 | 3-20-2020 | $ | 32,002,274 | $ | 29,056,000 | $ | 0 | $ | (2,946,274 | ) | |||||||||||||
The accompanying notes are an integral part of these financial statements.
Wells Fargo Funds | 107
Table of Contents
Portfolio of investments—February 29, 2020
FACTOR ENHANCED INTERNATIONAL PORTFOLIO
Investments in Affiliates
An affiliated investment is an investment in which the Portfolio owns at least 5% of the outstanding voting shares of the issuer or as a result of other relationships, such as the Portfolio and the issuer having the same adviser or investment manager. Transactions with issuers that were either affiliated persons of the Portfolio at the beginning of the period or the end of the period were as follows:
| Shares, beginning of period | Shares purchased | Shares sold | Shares, end of period | Net realized gains (losses) | Net change in unrealized gains (losses) | Income from affiliated securities | Value, end of period | % of net assets | ||||||||||||||||||||||||||||
| Short-Term Investments | ||||||||||||||||||||||||||||||||||||
Investment Companies | ||||||||||||||||||||||||||||||||||||
Wells Fargo Government Money Market Fund Select Class | 25,160,866 | 163,227,225 | (164,087,052 | ) | 24,301,039 | $ | 0 | $ | 0 | $ | 355,656 | $ | 24,301,039 | 4.15 | % | |||||||||||||||||||||
The accompanying notes are an integral part of these financial statements.
108 | Wells Fargo Funds
Table of Contents
Portfolio of investments—February 29, 2020
FACTOR ENHANCED LARGE CAP PORTFOLIO
| Shares | Value | |||||||||||||||
| Common Stocks: 95.24% |
| |||||||||||||||
Communication Services: 8.69% |
| |||||||||||||||
| Diversified Telecommunication Services: 2.67% | ||||||||||||||||
AT&T Incorporated | 373,891 | $ | 13,168,441 | |||||||||||||
GCI Liberty Incorporated Class A † | 4,653 | 321,569 | ||||||||||||||
Verizon Communications Incorporated | 216,381 | 11,719,195 | ||||||||||||||
Zayo Group Holdings Incorporated † | 11,803 | 412,987 | ||||||||||||||
| 25,622,192 | ||||||||||||||||
|
| |||||||||||||||
| Entertainment: 1.73% | ||||||||||||||||
Activision Blizzard Incorporated | 37,037 | 2,152,961 | ||||||||||||||
Cinemark Holdings Incorporated | 4,757 | 123,492 | ||||||||||||||
Electronic Arts Incorporated † | 14,709 | 1,491,051 | ||||||||||||||
Live Nation Entertainment Incorporated † | 7,113 | 432,257 | ||||||||||||||
Take-Two Interactive Software Incorporated † | 5,677 | 610,164 | ||||||||||||||
The Madison Square Garden Company Class A † | 867 | 232,200 | ||||||||||||||
The Walt Disney Company | 95,194 | 11,199,574 | ||||||||||||||
World Wrestling Entertainment Incorporated Class A | 2,311 | 108,085 | ||||||||||||||
Zynga Incorporated Class A † | 42,682 | 286,396 | ||||||||||||||
| 16,636,180 | ||||||||||||||||
|
| |||||||||||||||
| Interactive Media & Services: 2.22% | ||||||||||||||||
Alphabet Incorporated Class A † | 14,981 | 20,063,296 | ||||||||||||||
IAC Corporation † | 4,118 | 839,825 | ||||||||||||||
Match Group Incorporated † | 2,998 | 194,870 | ||||||||||||||
Pinterest Incorporated Class A † | 8,910 | 173,745 | ||||||||||||||
TripAdvisor Incorporated | 4,466 | 104,728 | ||||||||||||||
| 21,376,464 | ||||||||||||||||
|
| |||||||||||||||
| Media: 1.91% | ||||||||||||||||
Altice USA Incorporated † | 17,687 | 457,386 | ||||||||||||||
Cable One Incorporated | 251 | 394,828 | ||||||||||||||
Charter Communications Incorporated Class A † | 8,392 | 4,138,683 | ||||||||||||||
Comcast Corporation Class A | 243,544 | 9,846,484 | ||||||||||||||
Discovery Communications Incorporated Class A † | 7,943 | 204,135 | ||||||||||||||
DISH Network Corporation Class A † | 13,129 | 440,084 | ||||||||||||||
Fox Corporation Class A | 18,173 | 558,638 | ||||||||||||||
Interpublic Group of Companies Incorporated | 18,292 | 390,717 | ||||||||||||||
News Corporation Class A | 16,937 | 204,514 | ||||||||||||||
Nexstar Media Group Incorporated Class A | 2,024 | 232,720 | ||||||||||||||
Omnicom Group Incorporated | 10,702 | 741,435 | ||||||||||||||
Sirius XM Holdings Incorporated | 62,825 | 398,311 | ||||||||||||||
Tegna Incorporated | 9,179 | 131,443 | ||||||||||||||
The New York Times Company Class A | 6,756 | 253,080 | ||||||||||||||
| 18,392,458 | ||||||||||||||||
|
| |||||||||||||||
| Wireless Telecommunication Services: 0.16% | ||||||||||||||||
T-Mobile US Incorporated † | 16,768 | 1,511,803 | ||||||||||||||
|
| |||||||||||||||
Consumer Discretionary: 8.97% |
| |||||||||||||||
| Auto Components: 0.11% | ||||||||||||||||
BorgWarner Incorporated | 9,225 | 291,510 | ||||||||||||||
Gentex Corporation | 12,003 | 320,480 | ||||||||||||||
The accompanying notes are an integral part of these financial statements.
Wells Fargo Funds | 109
Table of Contents
Portfolio of investments—February 29, 2020
FACTOR ENHANCED LARGE CAP PORTFOLIO
| Shares | Value | |||||||||||||||
| Auto Components (continued) | ||||||||||||||||
Lear Corporation | 2,697 | $ | 299,906 | |||||||||||||
The Goodyear Tire & Rubber Company | 12,283 | 118,961 | ||||||||||||||
| 1,030,857 | ||||||||||||||||
|
| |||||||||||||||
| Automobiles: 0.40% | ||||||||||||||||
Ford Motor Company | 203,633 | 1,417,286 | ||||||||||||||
General Motors Company | 65,743 | 2,005,162 | ||||||||||||||
Harley-Davidson Incorporated | 8,191 | 249,580 | ||||||||||||||
Thor Industries Incorporated | 2,294 | 172,991 | ||||||||||||||
| 3,845,019 | ||||||||||||||||
|
| |||||||||||||||
| Distributors: 0.15% | ||||||||||||||||
Genuine Parts Company | 6,887 | 600,822 | ||||||||||||||
LKQ Corporation † | 13,482 | 398,798 | ||||||||||||||
Pool Corporation | 1,955 | 412,427 | ||||||||||||||
| 1,412,047 | ||||||||||||||||
|
| |||||||||||||||
| Diversified Consumer Services: 0.18% | ||||||||||||||||
Bright Horizons Family Solutions Incorporated † | 2,865 | 450,235 | ||||||||||||||
Frontdoor Incorporated † | 4,342 | 184,101 | ||||||||||||||
Grand Canyon Education Incorporated † | 2,119 | 170,961 | ||||||||||||||
H&R Block Incorporated | 10,198 | 210,793 | ||||||||||||||
Service Corporation International | 8,638 | 412,810 | ||||||||||||||
ServiceMaster Global Holdings Incorporated † | 7,637 | 273,175 | ||||||||||||||
| 1,702,075 | ||||||||||||||||
|
| |||||||||||||||
| Hotels, Restaurants & Leisure: 2.45% | ||||||||||||||||
Aramark | 12,648 | 439,392 | ||||||||||||||
Caesars Entertainment Corporation † | 30,910 | 392,866 | ||||||||||||||
Carnival Corporation | 19,966 | 668,062 | ||||||||||||||
Chipotle Mexican Grill Incorporated † | 1,400 | 1,083,012 | ||||||||||||||
Churchill Downs Incorporated | 1,672 | 210,070 | ||||||||||||||
Cracker Barrel Old Country Store Incorporated | 845 | 121,114 | ||||||||||||||
Darden Restaurants Incorporated | 6,384 | 622,440 | ||||||||||||||
Domino’s Pizza Incorporated | 2,138 | 725,765 | ||||||||||||||
Dunkin Brands Group Incorporated | 4,050 | 269,406 | ||||||||||||||
Hilton Worldwide Holdings Incorporated | 14,594 | 1,418,537 | ||||||||||||||
Marriott International Incorporated Class A | 13,293 | 1,648,332 | ||||||||||||||
Marriott Vacations Worldwide Corporation | 1,366 | 132,201 | ||||||||||||||
McDonald’s Corporation | 40,359 | 7,836,507 | ||||||||||||||
Norwegian Cruise Line Holdings Limited † | 10,515 | 391,789 | ||||||||||||||
Planet Fitness Incorporated Class A † | 4,498 | 303,570 | ||||||||||||||
Six Flags Entertainment Corporation | 3,954 | 99,957 | ||||||||||||||
Starbucks Corporation | 57,963 | 4,546,038 | ||||||||||||||
Texas Roadhouse Incorporated | 2,678 | 150,557 | ||||||||||||||
The Wendy’s Company | 9,794 | 184,911 | ||||||||||||||
Vail Resorts Incorporated | 2,079 | 442,016 | ||||||||||||||
Wyndham Hotels & Resorts Incorporated | 4,290 | 218,576 | ||||||||||||||
Wyndham Worldwide Corporation | 3,684 | 146,992 | ||||||||||||||
Yum! Brands Incorporated | 16,421 | 1,465,574 | ||||||||||||||
| 23,517,684 | ||||||||||||||||
|
| |||||||||||||||
| Household Durables: 0.56% | ||||||||||||||||
D.R. Horton Incorporated | 18,558 | 988,585 | ||||||||||||||
Helen of Troy Limited † | 1,072 | 176,451 | ||||||||||||||
The accompanying notes are an integral part of these financial statements.
110 | Wells Fargo Funds
Table of Contents
Portfolio of investments—February 29, 2020
FACTOR ENHANCED LARGE CAP PORTFOLIO
| Shares | Value | |||||||||||||||
| Household Durables (continued) | ||||||||||||||||
Leggett & Platt Incorporated | 5,838 | $ | 231,535 | |||||||||||||
Lennar Corporation Class A | 15,916 | 960,371 | ||||||||||||||
Mohawk Industries Incorporated † | 3,004 | 363,935 | ||||||||||||||
NVR Incorporated † | 184 | 674,761 | ||||||||||||||
Pulte Group Incorporated | 13,379 | 537,836 | ||||||||||||||
Roku Incorporated † | 4,821 | 548,003 | ||||||||||||||
Tempur-Pedic International Incorporated † | 2,067 | 154,508 | ||||||||||||||
Toll Brothers Incorporated | 6,860 | 254,026 | ||||||||||||||
TopBuild Corporation † | 1,742 | 175,942 | ||||||||||||||
Whirlpool Corporation | 2,759 | 352,766 | ||||||||||||||
| 5,418,719 | ||||||||||||||||
|
| |||||||||||||||
| Internet & Direct Marketing Retail: 0.26% | ||||||||||||||||
eBay Incorporated | 42,771 | 1,481,587 | ||||||||||||||
Expedia Group Incorporated | 6,490 | 640,044 | ||||||||||||||
Qurate Retail Incorporated † | 21,837 | 148,928 | ||||||||||||||
Wayfair Incorporated Class A † | 3,052 | 192,917 | ||||||||||||||
| 2,463,476 | ||||||||||||||||
|
| |||||||||||||||
| Leisure Products: 0.12% | ||||||||||||||||
Hasbro Incorporated | 6,291 | 485,980 | ||||||||||||||
Mattel Incorporated † | 17,030 | 200,784 | ||||||||||||||
Polaris Industries Incorporated | 2,791 | 230,341 | ||||||||||||||
The Brunswick Corporation | 3,987 | 212,108 | ||||||||||||||
| 1,129,213 | ||||||||||||||||
|
| |||||||||||||||
| Multiline Retail: 0.66% | ||||||||||||||||
Dollar General Corporation | 13,532 | 2,033,860 | ||||||||||||||
Dollar Tree Incorporated † | 12,199 | 1,012,883 | ||||||||||||||
Kohl’s Corporation | 7,386 | 289,162 | ||||||||||||||
Macy’s Incorporated | 13,946 | 184,506 | ||||||||||||||
Nordstrom Incorporated | 4,768 | 165,450 | ||||||||||||||
Target Corporation | 26,318 | 2,710,754 | ||||||||||||||
| 6,396,615 | ||||||||||||||||
|
| |||||||||||||||
| Specialty Retail: 3.18% | ||||||||||||||||
Aaron’s Incorporated | 3,078 | 121,058 | ||||||||||||||
Advance Auto Parts Incorporated | 3,567 | 474,340 | ||||||||||||||
AutoNation Incorporated † | 3,192 | 136,394 | ||||||||||||||
AutoZone Incorporated † | 1,199 | 1,237,979 | ||||||||||||||
Best Buy Company Incorporated | 10,625 | 803,781 | ||||||||||||||
Burlington Stores Incorporated † | 3,411 | 737,663 | ||||||||||||||
CarMax Incorporated † | 8,044 | 702,322 | ||||||||||||||
Five Below Incorporated † | 2,644 | 256,336 | ||||||||||||||
Foot Locker Incorporated | 5,255 | 190,494 | ||||||||||||||
L Brands Incorporated | 11,543 | 250,021 | ||||||||||||||
Lithia Motors Incorporated Class A | 950 | 113,202 | ||||||||||||||
Lowe’s Companies Incorporated | 39,557 | 4,215,589 | ||||||||||||||
O’Reilly Automotive Incorporated † | 3,915 | 1,443,539 | ||||||||||||||
Ross Stores Incorporated | 18,037 | 1,962,065 | ||||||||||||||
The Gap Incorporated | 11,430 | 163,792 | ||||||||||||||
The Home Depot Incorporated | 59,517 | 12,965,183 | ||||||||||||||
The TJX Companies Incorporated | 57,988 | 3,467,682 | ||||||||||||||
Tractor Supply Company | 5,601 | 495,745 | ||||||||||||||
The accompanying notes are an integral part of these financial statements.
Wells Fargo Funds | 111
Table of Contents
Portfolio of investments—February 29, 2020
FACTOR ENHANCED LARGE CAP PORTFOLIO
| Shares | Value | |||||||||||||||
| Specialty Retail (continued) | ||||||||||||||||
Ulta Beauty Incorporated † | 2,571 | $ | 660,978 | |||||||||||||
Williams-Sonoma Incorporated | 3,572 | 222,857 | ||||||||||||||
| 30,621,020 | ||||||||||||||||
|
| |||||||||||||||
| Textiles, Apparel & Luxury Goods: 0.90% | ||||||||||||||||
Capri Holdings Limited † | 2,910 | 75,136 | ||||||||||||||
Carter’s Incorporated | 2,200 | 201,234 | ||||||||||||||
Deckers Outdoor Corporation † | 1,497 | 260,179 | ||||||||||||||
HanesBrands Incorporated | 18,899 | 250,223 | ||||||||||||||
Nike Incorporated Class B | 62,542 | 5,590,004 | ||||||||||||||
PVH Corporation | 2,936 | 217,587 | ||||||||||||||
Ralph Lauren Corporation | 2,250 | 237,398 | ||||||||||||||
Skechers USA Incorporated Class A † | 6,505 | 215,185 | ||||||||||||||
Tapestry Incorporated | 10,874 | 254,995 | ||||||||||||||
Under Armour Incorporated Class A † | 9,706 | 137,728 | ||||||||||||||
VF Corporation | 17,024 | 1,225,728 | ||||||||||||||
| 8,665,397 | ||||||||||||||||
|
| |||||||||||||||
Consumer Staples: 9.69% |
| |||||||||||||||
| Beverages: 2.60% | ||||||||||||||||
Brown-Forman Corporation Class B | 16,364 | 1,004,913 | ||||||||||||||
Constellation Brands Incorporated Class A | 8,370 | 1,442,821 | ||||||||||||||
Keurig Dr. Pepper Incorporated | 14,884 | 414,966 | ||||||||||||||
Molson Coors Brewing Company Class B | 9,212 | 457,007 | ||||||||||||||
Monster Beverage Corporation † | 19,335 | 1,206,697 | ||||||||||||||
PepsiCo Incorporated | 73,451 | 9,697,736 | ||||||||||||||
The Coca-Cola Company | 201,860 | 10,797,491 | ||||||||||||||
| 25,021,631 | ||||||||||||||||
|
| |||||||||||||||
| Food & Staples Retailing: 1.91% | ||||||||||||||||
BJ’s Wholesale Club Holdings Incorporated † | 6,535 | 125,864 | ||||||||||||||
Casey’s General Stores Incorporated | 1,993 | 324,899 | ||||||||||||||
Costco Wholesale Corporation | 22,894 | 6,436,419 | ||||||||||||||
Performance Food Group Company † | 4,654 | 197,330 | ||||||||||||||
Sysco Corporation | 25,309 | 1,686,845 | ||||||||||||||
The Kroger Company | 40,663 | 1,143,850 | ||||||||||||||
US Foods Holding Corporation † | 10,403 | 349,957 | ||||||||||||||
Walmart Incorporated | 75,305 | 8,108,842 | ||||||||||||||
| 18,374,006 | ||||||||||||||||
|
| |||||||||||||||
| Food Products: 1.58% | ||||||||||||||||
Archer Daniels Midland Company | 28,581 | 1,076,075 | ||||||||||||||
Bunge Limited | 6,954 | 326,490 | ||||||||||||||
Campbell Soup Company | 10,226 | 461,397 | ||||||||||||||
Conagra Foods Incorporated | 27,241 | 727,062 | ||||||||||||||
Darling Ingredients Incorporated † | 7,170 | 184,269 | ||||||||||||||
Flowers Foods Incorporated | 6,115 | 131,656 | ||||||||||||||
General Mills Incorporated | 34,126 | 1,672,174 | ||||||||||||||
Hormel Foods Corporation | 13,518 | 562,349 | ||||||||||||||
Ingredion Incorporated | 2,832 | 235,906 | ||||||||||||||
Kellogg Company | 13,186 | 797,357 | ||||||||||||||
Lamb Weston Holdings Incorporated | 7,586 | 659,148 | ||||||||||||||
McCormick & Company Incorporated | 6,713 | 981,373 | ||||||||||||||
The accompanying notes are an integral part of these financial statements.
112 | Wells Fargo Funds
Table of Contents
Portfolio of investments—February 29, 2020
FACTOR ENHANCED LARGE CAP PORTFOLIO
| Shares | Value | |||||||||||||||
| Food Products (continued) | ||||||||||||||||
Mondelez International Incorporated Class A | 76,989 | $ | 4,065,019 | |||||||||||||
Post Holdings Incorporated † | 3,561 | 360,587 | ||||||||||||||
The Hershey Company | 7,957 | 1,145,728 | ||||||||||||||
The J.M. Smucker Company | 5,826 | 600,020 | ||||||||||||||
TreeHouse Foods Incorporated † | 2,896 | 110,367 | ||||||||||||||
Tyson Foods Incorporated Class A | 16,197 | 1,098,643 | ||||||||||||||
| 15,195,620 | ||||||||||||||||
|
| |||||||||||||||
| Household Products: 2.27% | ||||||||||||||||
Church & Dwight Company Incorporated | 12,491 | 868,374 | ||||||||||||||
Colgate-Palmolive Company | 46,526 | 3,143,762 | ||||||||||||||
Kimberly-Clark Corporation | 18,131 | 2,378,606 | ||||||||||||||
The Clorox Company | 6,253 | 996,853 | ||||||||||||||
The Procter & Gamble Company | 127,009 | 14,381,229 | ||||||||||||||
| 21,768,824 | ||||||||||||||||
|
| |||||||||||||||
| Personal Products: 0.24% | ||||||||||||||||
Coty Incorporated Class A | 14,759 | 136,226 | ||||||||||||||
Herbalife Nutrition Limited † | 4,769 | 154,325 | ||||||||||||||
The Estee Lauder Companies Incorporated Class A | 11,135 | 2,044,386 | ||||||||||||||
| 2,334,937 | ||||||||||||||||
|
| |||||||||||||||
| Tobacco: 1.09% | ||||||||||||||||
Altria Group Incorporated | 98,641 | 3,982,137 | ||||||||||||||
Philip Morris International Incorporated | 79,705 | 6,525,448 | ||||||||||||||
| 10,507,585 | ||||||||||||||||
|
| |||||||||||||||
Energy: 3.25% |
| |||||||||||||||
| Energy Equipment & Services: 0.35% | ||||||||||||||||
Baker Hughes Incorporated | 30,921 | 497,519 | ||||||||||||||
Halliburton Company | 34,993 | 593,481 | ||||||||||||||
Helmerich & Payne Incorporated | 3,782 | 139,518 | ||||||||||||||
National Oilwell Varco Incorporated | 17,953 | 335,901 | ||||||||||||||
Schlumberger Limited | 64,513 | 1,747,657 | ||||||||||||||
| 3,314,076 | ||||||||||||||||
|
| |||||||||||||||
| Oil, Gas & Consumable Fuels: 2.90% | ||||||||||||||||
Cabot Oil & Gas Corporation | 19,673 | 274,045 | ||||||||||||||
Chevron Corporation | 97,517 | 9,102,237 | ||||||||||||||
Equitrans Midstream Corporation | 9,920 | 70,035 | ||||||||||||||
Exxon Mobil Corporation | 214,289 | 11,023,026 | ||||||||||||||
HollyFrontier Corporation | 7,486 | 252,128 | ||||||||||||||
Marathon Petroleum Corporation | 35,257 | 1,671,887 | ||||||||||||||
ONEOK Incorporated | 21,707 | 1,448,291 | ||||||||||||||
PBF Energy Incorporated Class A | 5,017 | 112,331 | ||||||||||||||
Phillips 66 | 23,886 | 1,788,106 | ||||||||||||||
Plains GP Holdings LP Class A | 9,324 | 128,391 | ||||||||||||||
Tallgrass Energy GP LP | 7,639 | 168,593 | ||||||||||||||
Targa Resources Corporation | 12,110 | 392,364 | ||||||||||||||
Valero Energy Corporation | 22,264 | 1,474,990 | ||||||||||||||
| 27,906,424 | ||||||||||||||||
|
| |||||||||||||||
The accompanying notes are an integral part of these financial statements.
Wells Fargo Funds | 113
Table of Contents
Portfolio of investments—February 29, 2020
FACTOR ENHANCED LARGE CAP PORTFOLIO
| Shares | Value | |||||||||||||||
Financials: 11.66% |
| |||||||||||||||
| Banks: 2.43% | ||||||||||||||||
Associated Banc Corporation | 21,353 | $ | 361,506 | |||||||||||||
Bank of Hawaii Corporation | 4,839 | 360,118 | ||||||||||||||
Bank OZK | 8,967 | 227,672 | ||||||||||||||
BankUnited Incorporated | 12,382 | 367,745 | ||||||||||||||
CIT Group Incorporated | 7,786 | 309,182 | ||||||||||||||
Citizens Financial Group Incorporated | 29,252 | 926,996 | ||||||||||||||
Comerica Incorporated | 9,417 | 495,711 | ||||||||||||||
Commerce Bancshares Incorporated | 9,083 | 554,426 | ||||||||||||||
Community Bank System Incorporated | 5,573 | 338,894 | ||||||||||||||
Fifth Third Bancorp | 43,618 | 1,064,279 | ||||||||||||||
First Financial Bankshares Incorporated | 11,222 | 322,520 | ||||||||||||||
First Hawaiian Incorporated | 14,935 | �� | 357,693 | |||||||||||||
First Horizon National Corporation | 24,434 | 325,705 | ||||||||||||||
FNB Corporation | 36,027 | 363,512 | ||||||||||||||
Glacier Bancorp Incorporated | 9,022 | 336,430 | ||||||||||||||
Hancock Holding Company | 7,923 | 265,421 | ||||||||||||||
Home Bancshares Incorporated | 16,144 | 270,573 | ||||||||||||||
Huntington Bancshares Incorporated | 66,749 | 819,010 | ||||||||||||||
IBERIABANK Corporation | 4,862 | 292,644 | ||||||||||||||
KeyCorp | 54,524 | 891,467 | ||||||||||||||
M&T Bank Corporation | 7,966 | 1,118,267 | ||||||||||||||
PacWest Bancorp | 10,509 | 332,505 | ||||||||||||||
People’s United Financial Incorporated | 42,020 | 587,860 | ||||||||||||||
Pinnacle Financial Partners Incorporated | 6,997 | 368,322 | ||||||||||||||
PNC Financial Services Group Incorporated | 23,851 | 3,014,766 | ||||||||||||||
Regions Financial Corporation | 66,868 | 904,055 | ||||||||||||||
Signature Bank | 3,277 | 409,953 | ||||||||||||||
Sterling Bancorp | 17,589 | 291,626 | ||||||||||||||
Synovus Financial Corporation | 9,093 | 263,879 | ||||||||||||||
TCF Financial Corporation | 10,467 | 381,417 | ||||||||||||||
Texas Capital Bancshares Incorporated † | 4,660 | 219,393 | ||||||||||||||
UMB Financial Corporation | 4,536 | 263,768 | ||||||||||||||
Umpqua Holdings Corporation | 21,136 | 325,283 | ||||||||||||||
United Bankshares Incorporated | 12,567 | 362,935 | ||||||||||||||
US Bancorp | 78,529 | 3,646,887 | ||||||||||||||
Valley National Bancorp | 37,225 | 346,193 | ||||||||||||||
Webster Financial Corporation | 4,872 | 184,990 | ||||||||||||||
Western Alliance Bancorp | 6,828 | 314,361 | ||||||||||||||
Wintrust Financial Corporation | 4,371 | 233,455 | ||||||||||||||
Zions Bancorporation | 13,744 | 549,073 | ||||||||||||||
| 23,370,492 | ||||||||||||||||
|
| |||||||||||||||
| Capital Markets: 2.98% | ||||||||||||||||
Affiliated Managers Group Incorporated | 1,857 | 139,684 | ||||||||||||||
Ameriprise Financial Incorporated | 5,531 | 781,530 | ||||||||||||||
Apollo Global Management Incorporated | 9,743 | 405,893 | ||||||||||||||
Bank of New York Mellon Corporation | 42,690 | 1,703,331 | ||||||||||||||
Cboe Holdings Incorporated | 6,025 | 686,850 | ||||||||||||||
CME Group Incorporated | 19,153 | 3,807,999 | ||||||||||||||
Eaton Vance Corporation | 4,172 | 172,137 | ||||||||||||||
FactSet Research Systems Incorporated | 1,845 | 490,752 | ||||||||||||||
Franklin Resources Incorporated | 13,323 | 289,908 | ||||||||||||||
Interactive Brokers Group Incorporated Class A | 3,978 | 203,276 | ||||||||||||||
The accompanying notes are an integral part of these financial statements.
114 | Wells Fargo Funds
Table of Contents
Portfolio of investments—February 29, 2020
FACTOR ENHANCED LARGE CAP PORTFOLIO
| Shares | Value | |||||||||||||||
| Capital Markets (continued) | ||||||||||||||||
Intercontinental Exchange Incorporated | 31,536 | $ | 2,813,642 | |||||||||||||
Invesco Limited | 22,132 | 318,701 | ||||||||||||||
KKR & Company Incorporated Class A | 27,496 | 786,386 | ||||||||||||||
Lazard Limited Class A | 5,821 | 208,508 | ||||||||||||||
LPL Financial Holdings Incorporated | 3,429 | 272,537 | ||||||||||||||
MarketAxess Holdings Incorporated | 2,107 | 683,363 | ||||||||||||||
Moody’s Corporation | 8,218 | 1,972,567 | ||||||||||||||
Morningstar Incorporated | 815 | 119,724 | ||||||||||||||
MSCI Incorporated | 4,189 | 1,237,598 | ||||||||||||||
Raymond James Financial Incorporated | 5,791 | 484,301 | ||||||||||||||
S&P Global Incorporated | 12,571 | 3,342,755 | ||||||||||||||
SEI Investments Company | 5,672 | 310,315 | ||||||||||||||
Stifel Financial Corporation | 1,903 | 103,599 | ||||||||||||||
T. Rowe Price Group Incorporated | 11,546 | 1,362,543 | ||||||||||||||
The Blackstone Group Incorporated Class A | 33,909 | 1,825,661 | ||||||||||||||
The Goldman Sachs Group Incorporated | 17,207 | 3,454,649 | ||||||||||||||
The NASDAQ OMX Group Incorporated | 6,120 | 627,606 | ||||||||||||||
| 28,605,815 | ||||||||||||||||
|
| |||||||||||||||
| Consumer Finance: 0.91% | ||||||||||||||||
Ally Financial Incorporated | 23,357 | 585,560 | ||||||||||||||
American Express Company | 31,984 | 3,516,001 | ||||||||||||||
Capital One Financial Corporation | 23,228 | 2,050,103 | ||||||||||||||
Credit Acceptance Corporation † | 497 | 200,390 | ||||||||||||||
Discover Financial Services | 15,547 | 1,019,572 | ||||||||||||||
FirstCash Financial Services Incorporated | 1,774 | 136,456 | ||||||||||||||
Navient Corporation | 11,023 | 123,788 | ||||||||||||||
SLM Corporation | 20,410 | 211,652 | ||||||||||||||
Synchrony Financial | 32,492 | 945,517 | ||||||||||||||
| 8,789,039 | ||||||||||||||||
|
| |||||||||||||||
| Diversified Financial Services: 1.56% | ||||||||||||||||
Berkshire Hathaway Incorporated Class B † | 70,062 | 14,456,593 | ||||||||||||||
Jefferies Financial Group Incorporated | 11,293 | 222,585 | ||||||||||||||
Voya Financial Incorporated | 6,390 | 336,370 | ||||||||||||||
| 15,015,548 | ||||||||||||||||
|
| |||||||||||||||
| Insurance: 3.36% | ||||||||||||||||
AFLAC Incorporated | 38,950 | 1,669,008 | ||||||||||||||
Alleghany Corporation | 706 | 474,609 | ||||||||||||||
American Financial Group Incorporated | 2,903 | 268,295 | ||||||||||||||
American International Group Incorporated | 47,797 | 2,015,122 | ||||||||||||||
Aon plc | 12,426 | 2,584,608 | ||||||||||||||
Arch Capital Group Limited † | 20,006 | 808,843 | ||||||||||||||
Arthur J. Gallagher & Company | 10,160 | 990,498 | ||||||||||||||
Assurant Incorporated | 3,198 | 385,647 | ||||||||||||||
Assured Guaranty Limited | 4,006 | 163,485 | ||||||||||||||
Athene Holding Limited Class A † | 6,358 | 262,268 | ||||||||||||||
Axis Capital Holdings Limited | 3,679 | 206,465 | ||||||||||||||
Brown & Brown Incorporated | 12,064 | 518,873 | ||||||||||||||
Chubb Limited | 21,346 | 3,095,810 | ||||||||||||||
Cincinnati Financial Corporation | 8,516 | 794,032 | ||||||||||||||
Erie Indemnity Company Class A | 1,163 | 166,216 | ||||||||||||||
Everest Reinsurance Group Limited | 2,025 | 501,957 | ||||||||||||||
The accompanying notes are an integral part of these financial statements.
Wells Fargo Funds | 115
Table of Contents
Portfolio of investments—February 29, 2020
FACTOR ENHANCED LARGE CAP PORTFOLIO
| Shares | Value | |||||||||||||||
| Insurance (continued) | ||||||||||||||||
Fidelity National Financial Incorporated | 13,293 | $ | 515,237 | |||||||||||||
First American Financial Corporation | 5,343 | 305,085 | ||||||||||||||
Globe Life Incorporated | 4,533 | 420,028 | ||||||||||||||
Kemper Corporation | 2,732 | 188,071 | ||||||||||||||
Loews Corporation | 14,744 | 672,769 | ||||||||||||||
Markel Corporation † | 711 | 840,118 | ||||||||||||||
Marsh & McLennan Companies Incorporated | 26,602 | 2,781,505 | ||||||||||||||
MetLife Incorporated | 37,977 | 1,622,377 | ||||||||||||||
Old Republic International Corporation | 12,677 | 249,990 | ||||||||||||||
Reinsurance Group of America Incorporated | 3,171 | 386,957 | ||||||||||||||
RLI Corporation | 1,843 | 148,140 | ||||||||||||||
Selective Insurance Group Incorporated | 1,985 | 110,723 | ||||||||||||||
The Allstate Corporation | 17,536 | 1,845,664 | ||||||||||||||
The Hanover Insurance Group Incorporated | 1,600 | 189,664 | ||||||||||||||
The Hartford Financial Services Group Incorporated | 20,000 | 999,000 | ||||||||||||||
The Progressive Corporation | 31,847 | 2,329,927 | ||||||||||||||
The Travelers Companies Incorporated | 14,286 | 1,711,606 | ||||||||||||||
Unum Group | 5,391 | 125,664 | ||||||||||||||
W.R. Berkley Corporation | 8,111 | 544,573 | ||||||||||||||
White Mountains Insurance Group Limited | 75 | 74,258 | ||||||||||||||
Willis Towers Watson plc | 6,863 | 1,298,823 | ||||||||||||||
| 32,265,915 | ||||||||||||||||
|
| |||||||||||||||
| Mortgage REITs: 0.29% | ||||||||||||||||
AGNC Investment Corporation | 27,033 | 460,642 | ||||||||||||||
Annaly Capital Management Incorporated | 84,849 | 751,762 | ||||||||||||||
Blackstone Mortgage Trust Incorporated Class A | 9,995 | 360,420 | ||||||||||||||
Chimera Investment Corporation | 12,545 | 246,509 | ||||||||||||||
MFA Financial Incorporated | 11,450 | 82,784 | ||||||||||||||
New Residential Investment Corporation | 20,883 | 324,939 | ||||||||||||||
Starwood Property Trust Incorporated | 17,017 | 377,437 | ||||||||||||||
Two Harbors Investment Corporation | 13,684 | 185,418 | ||||||||||||||
| 2,789,911 | ||||||||||||||||
|
| |||||||||||||||
| Thrifts & Mortgage Finance: 0.13% | ||||||||||||||||
Essent Group Limited | 6,483 | 282,918 | ||||||||||||||
MGIC Investment Corporation | 23,893 | 287,433 | ||||||||||||||
New York Community Bancorp Incorporated | 34,849 | 376,718 | ||||||||||||||
Radian Group Incorporated | 14,022 | 297,827 | ||||||||||||||
| 1,244,896 | ||||||||||||||||
|
| |||||||||||||||
Health Care: 17.56% |
| |||||||||||||||
| Biotechnology: 2.43% | ||||||||||||||||
AbbVie Incorporated | 75,253 | 6,449,935 | ||||||||||||||
Alkermes plc † | 7,259 | 151,278 | ||||||||||||||
Amgen Incorporated | 30,888 | 6,169,260 | ||||||||||||||
Biogen Incorporated † | 9,711 | 2,994,775 | ||||||||||||||
Exelixis Incorporated † | 13,134 | 244,161 | ||||||||||||||
Gilead Sciences Incorporated | 66,103 | 4,584,904 | ||||||||||||||
Incyte Corporation † | 9,248 | 697,392 | ||||||||||||||
Regeneron Pharmaceuticals Incorporated † | 4,220 | 1,876,085 | ||||||||||||||
United Therapeutics Corporation † | 1,718 | 176,885 | ||||||||||||||
| 23,344,675 | ||||||||||||||||
|
| |||||||||||||||
The accompanying notes are an integral part of these financial statements.
116 | Wells Fargo Funds
Table of Contents
Portfolio of investments—February 29, 2020
FACTOR ENHANCED LARGE CAP PORTFOLIO
| Shares | Value | |||||||||||||||
| Health Care Equipment & Supplies: 4.54% | ||||||||||||||||
Abbott Laboratories | 91,168 | $ | 7,022,671 | |||||||||||||
Baxter International Incorporated | 25,806 | 2,154,027 | ||||||||||||||
Becton Dickinson & Company | 13,932 | 3,313,308 | ||||||||||||||
Boston Scientific Corporation † | 69,348 | 2,592,922 | ||||||||||||||
Danaher Corporation | 32,444 | 4,690,754 | ||||||||||||||
Dentsply Sirona Incorporated | 11,372 | 559,957 | ||||||||||||||
Edwards Lifesciences Corporation † | 11,175 | 2,289,087 | ||||||||||||||
Globus Medical Incorporated Class A † | 3,283 | 148,490 | ||||||||||||||
Haemonetics Corporation † | 2,497 | 270,500 | ||||||||||||||
Hill-Rom Holdings Incorporated | 2,967 | 284,980 | ||||||||||||||
Hologic Incorporated † | 13,249 | 624,293 | ||||||||||||||
ICU Medical Incorporated † | 801 | 156,844 | ||||||||||||||
IDEXX Laboratories Incorporated † | 4,410 | 1,122,389 | ||||||||||||||
Insulet Corporation † | 3,310 | 628,801 | ||||||||||||||
Integra LifeSciences Holdings Corporation † | 3,117 | 162,396 | ||||||||||||||
LivaNova plc † | 2,416 | 168,444 | ||||||||||||||
Masimo Corporation † | 2,125 | 347,076 | ||||||||||||||
Medtronic plc | 69,505 | 6,997,068 | ||||||||||||||
Neogen Corporation † | 2,104 | 127,818 | ||||||||||||||
NuVasive Incorporated † | 2,462 | 162,024 | ||||||||||||||
Penumbra Incorporated † | 1,825 | 302,695 | ||||||||||||||
ResMed Incorporated | 7,155 | 1,137,359 | ||||||||||||||
Steris plc | 4,209 | 667,632 | ||||||||||||||
Stryker Corporation | 17,548 | 3,344,473 | ||||||||||||||
Tandem Diabetes Care Incorporated † | 3,456 | 258,025 | ||||||||||||||
Teleflex Incorporated | 2,318 | 776,576 | ||||||||||||||
The Cooper Companies Incorporated | 2,499 | 811,100 | ||||||||||||||
Varian Medical Systems Incorporated † | 4,355 | 535,534 | ||||||||||||||
West Pharmaceutical Services Incorporated | 3,674 | 553,157 | ||||||||||||||
Zimmer Biomet Holdings Incorporated | 10,602 | 1,443,462 | ||||||||||||||
| 43,653,862 | ||||||||||||||||
|
| |||||||||||||||
| Health Care Providers & Services: 3.36% | ||||||||||||||||
Amedisys Incorporated † | 1,453 | 252,837 | ||||||||||||||
AmerisourceBergen Corporation | 7,758 | 654,155 | ||||||||||||||
Anthem Incorporated | 13,429 | 3,452,462 | ||||||||||||||
Cardinal Health Incorporated | 15,360 | 800,563 | ||||||||||||||
Centene Corporation † | 30,056 | 1,593,569 | ||||||||||||||
Chemed Corporation | 638 | 266,442 | ||||||||||||||
CVS Health Corporation | 68,935 | 4,079,573 | ||||||||||||||
DaVita HealthCare Partners Incorporated † | 4,798 | 372,421 | ||||||||||||||
Encompass Health Corporation | 4,653 | 348,231 | ||||||||||||||
HCA Healthcare Incorporated | 13,363 | 1,697,235 | ||||||||||||||
Henry Schein Incorporated | 7,432 | 452,906 | ||||||||||||||
Humana Incorporated | 6,701 | 2,142,176 | ||||||||||||||
Laboratory Corporation of America Holdings † | 5,144 | 903,749 | ||||||||||||||
McKesson Corporation | 9,629 | 1,346,712 | ||||||||||||||
Molina Healthcare Incorporated † | 3,097 | 379,537 | ||||||||||||||
Quest Diagnostics Incorporated | 7,141 | 757,374 | ||||||||||||||
UnitedHealth Group Incorporated | 48,260 | 12,304,370 | ||||||||||||||
Universal Health Services Incorporated Class B | 3,800 | 470,212 | ||||||||||||||
| 32,274,524 | ||||||||||||||||
|
| |||||||||||||||
| Health Care Technology: 0.12% | ||||||||||||||||
Cerner Corporation | 16,082 | 1,114,000 | ||||||||||||||
|
| |||||||||||||||
The accompanying notes are an integral part of these financial statements.
Wells Fargo Funds | 117
Table of Contents
Portfolio of investments—February 29, 2020
FACTOR ENHANCED LARGE CAP PORTFOLIO
| Shares | Value | |||||||||||||||
| Life Sciences Tools & Services: 1.26% | ||||||||||||||||
Agilent Technologies Incorporated | 15,077 | $ | 1,161,984 | |||||||||||||
Avantor Incorporated † | 11,504 | 181,188 | ||||||||||||||
Bio-Rad Laboratories Incorporated Class A † | 1,024 | 360,468 | ||||||||||||||
Bio-Techne Corporation | 1,769 | 334,146 | ||||||||||||||
Bruker Corporation | 4,677 | 203,730 | ||||||||||||||
Charles River Laboratories International Incorporated † | 2,232 | 347,232 | ||||||||||||||
IQVIA Holdings Incorporated † | 9,021 | 1,258,339 | ||||||||||||||
Mettler-Toledo International Incorporated † | 1,112 | 780,290 | ||||||||||||||
PerkinElmer Incorporated | 5,044 | 436,003 | ||||||||||||||
PRA Health Sciences Incorporated † | 3,162 | 297,860 | ||||||||||||||
Syneos Health Incorporated † | 3,785 | 239,780 | ||||||||||||||
Thermo Fisher Scientific Incorporated | 20,386 | 5,928,249 | ||||||||||||||
Waters Corporation † | 3,201 | 623,843 | ||||||||||||||
| 12,153,112 | ||||||||||||||||
|
| |||||||||||||||
| Pharmaceuticals: 5.85% | ||||||||||||||||
Allergan plc | 16,285 | 3,105,061 | ||||||||||||||
Bristol-Myers Squibb Company | 76,036 | 4,490,686 | ||||||||||||||
Catalent Incorporated † | 6,757 | 348,188 | ||||||||||||||
Elanco Animal Health Incorporated † | 19,240 | 527,176 | ||||||||||||||
Eli Lilly & Company | 42,763 | 5,393,697 | ||||||||||||||
Horizon Therapeutics plc † | 8,569 | 293,231 | ||||||||||||||
Jazz Pharmaceuticals plc † | 2,462 | 282,096 | ||||||||||||||
Johnson & Johnson | 135,008 | 18,155,876 | ||||||||||||||
Merck & Company Incorporated | 131,750 | 10,086,780 | ||||||||||||||
Mylan NV † | 23,014 | 395,611 | ||||||||||||||
Perrigo Company plc | 6,213 | 314,937 | ||||||||||||||
Pfizer Incorporated | 290,397 | 9,705,068 | ||||||||||||||
Zoetis Incorporated | 23,827 | 3,174,471 | ||||||||||||||
| 56,272,878 | ||||||||||||||||
|
| |||||||||||||||
Industrials: 11.52% |
| |||||||||||||||
| Aerospace & Defense: 2.64% | ||||||||||||||||
Arconic Incorporated | 19,305 | 566,602 | ||||||||||||||
BWX Technologies Incorporated | 3,733 | 204,718 | ||||||||||||||
Curtiss-Wright Corporation | 1,454 | 174,393 | ||||||||||||||
General Dynamics Corporation | 13,426 | 2,143,998 | ||||||||||||||
HEICO Corporation | 2,119 | 228,534 | ||||||||||||||
Hexcel Corporation | 3,920 | 253,350 | ||||||||||||||
Huntington Ingalls Industries Incorporated | 1,860 | 382,286 | ||||||||||||||
L3Harris Technologies | 12,084 | 2,389,369 | ||||||||||||||
Lockheed Martin Corporation | 12,839 | 4,748,761 | ||||||||||||||
Mercury Computer Systems Incorporated † | 2,633 | 193,420 | ||||||||||||||
Northrop Grumman Corporation | 8,203 | 2,697,475 | ||||||||||||||
Raytheon Company | 14,444 | 2,723,561 | ||||||||||||||
Spirit AeroSystems Holdings Incorporated Class A | 5,473 | 289,193 | ||||||||||||||
Teledyne Technologies Incorporated † | 1,814 | 611,898 | ||||||||||||||
Textron Incorporated | 11,714 | 475,588 | ||||||||||||||
TransDigm Group Incorporated | 2,570 | 1,433,572 | ||||||||||||||
United Technologies Corporation | 44,971 | 5,872,763 | ||||||||||||||
| 25,389,481 | ||||||||||||||||
|
| |||||||||||||||
| Air Freight & Logistics: 0.66% | ||||||||||||||||
C.H. Robinson Worldwide Incorporated | 6,541 | 450,675 | ||||||||||||||
Expeditors International of Washington Incorporated | 7,294 | 513,643 | ||||||||||||||
The accompanying notes are an integral part of these financial statements.
118 | Wells Fargo Funds
Table of Contents
Portfolio of investments—February 29, 2020
FACTOR ENHANCED LARGE CAP PORTFOLIO
| Shares | Value | |||||||||||||||
| Air Freight & Logistics (continued) | ||||||||||||||||
FedEx Corporation | 11,722 | $ | 1,654,795 | |||||||||||||
United Parcel Service Incorporated Class B | 37,568 | 3,399,528 | ||||||||||||||
XPO Logistics Incorporated † | 4,067 | 300,836 | ||||||||||||||
| 6,319,477 | ||||||||||||||||
|
| |||||||||||||||
| Airlines: 0.45% | ||||||||||||||||
Alaska Air Group Incorporated | 6,196 | 312,650 | ||||||||||||||
American Airlines Group Incorporated | 16,099 | 306,686 | ||||||||||||||
Delta Air Lines Incorporated | 31,736 | 1,463,982 | ||||||||||||||
JetBlue Airways Corporation † | 14,451 | 228,037 | ||||||||||||||
Southwest Airlines Company | 27,285 | 1,260,294 | ||||||||||||||
United Airlines Holdings Incorporated † | 12,312 | 758,296 | ||||||||||||||
| 4,329,945 | ||||||||||||||||
|
| |||||||||||||||
| Building Products: 0.48% | ||||||||||||||||
A.O. Smith Corporation | 6,953 | 274,991 | ||||||||||||||
Allegion plc | 4,706 | 541,143 | ||||||||||||||
Armstrong World Industries Incorporated | 2,332 | 233,550 | ||||||||||||||
Fortune Brands Home & Security Incorporated | 6,679 | 412,428 | ||||||||||||||
Johnson Controls International plc | 43,332 | 1,584,651 | ||||||||||||||
Lennox International Incorporated | 1,962 | 447,591 | ||||||||||||||
Masco Corporation | 14,544 | 600,958 | ||||||||||||||
Owens Corning Incorporated | 5,158 | 291,375 | ||||||||||||||
Trex Company Incorporated † | 2,796 | 267,437 | ||||||||||||||
| 4,654,124 | ||||||||||||||||
|
| |||||||||||||||
| Commercial Services & Supplies: 0.78% | ||||||||||||||||
Cintas Corporation | 4,552 | 1,214,200 | ||||||||||||||
Clean Harbors Incorporated † | 2,536 | 176,303 | ||||||||||||||
Copart Incorporated † | 10,403 | 878,845 | ||||||||||||||
IAA Incorporated † | 6,645 | 283,874 | ||||||||||||||
KAR Auction Services Incorporated | 6,909 | 132,998 | ||||||||||||||
MSA Safety Incorporated | 1,261 | 153,426 | ||||||||||||||
Republic Services Incorporated | 11,865 | 1,070,935 | ||||||||||||||
Rollins Incorporated | 7,439 | 278,516 | ||||||||||||||
Stericycle Incorporated † | 4,497 | 258,263 | ||||||||||||||
Tetra Tech Incorporated | 2,430 | 196,514 | ||||||||||||||
The Brink’s Company | 2,410 | 188,679 | ||||||||||||||
Waste Management Incorporated | 24,009 | 2,660,437 | ||||||||||||||
| 7,492,990 | ||||||||||||||||
|
| |||||||||||||||
| Construction & Engineering: 0.17% | ||||||||||||||||
AECOM Technology Corporation † | 7,950 | 357,273 | ||||||||||||||
EMCOR Group Incorporated | 1,923 | 147,917 | ||||||||||||||
Jacobs Engineering Group Incorporated | 7,024 | 648,596 | ||||||||||||||
MasTec Incorporated † | 3,616 | 177,473 | ||||||||||||||
Quanta Services Incorporated | 7,437 | 283,573 | ||||||||||||||
| 1,614,832 | ||||||||||||||||
|
| |||||||||||||||
| Electrical Equipment: 0.79% | ||||||||||||||||
Acuity Brands Incorporated | 1,843 | 189,571 | ||||||||||||||
AMETEK Incorporated | 12,240 | 1,052,640 | ||||||||||||||
Eaton Corporation plc | 21,698 | 1,968,443 | ||||||||||||||
The accompanying notes are an integral part of these financial statements.
Wells Fargo Funds | 119
Table of Contents
Portfolio of investments—February 29, 2020
FACTOR ENHANCED LARGE CAP PORTFOLIO
| Shares | Value | |||||||||||||||
| Electrical Equipment (continued) | ||||||||||||||||
Emerson Electric Company | 31,104 | $ | 1,994,077 | |||||||||||||
Generac Holdings Incorporated † | 3,046 | 313,708 | ||||||||||||||
Hubbell Incorporated | 2,651 | 353,219 | ||||||||||||||
nVent Electric plc | 6,846 | 164,372 | ||||||||||||||
Regal-Beloit Corporation | 1,393 | 108,153 | ||||||||||||||
Rockwell Automation Incorporated | 5,977 | 1,096,780 | ||||||||||||||
Sensata Technologies Holding plc † | 7,954 | 324,523 | ||||||||||||||
| 7,565,486 | ||||||||||||||||
|
| |||||||||||||||
| Industrial Conglomerates: 1.65% | ||||||||||||||||
3M Company | 30,595 | 4,565,998 | ||||||||||||||
Carlisle Companies Incorporated | 2,648 | 384,728 | ||||||||||||||
General Electric Company | 443,203 | 4,822,049 | ||||||||||||||
Honeywell International Incorporated | 37,847 | 6,137,648 | ||||||||||||||
| 15,910,423 | ||||||||||||||||
|
| |||||||||||||||
| Machinery: 1.82% | ||||||||||||||||
AGCO Corporation | 2,726 | 164,732 | ||||||||||||||
Allison Transmission Holdings Incorporated | 5,686 | 230,852 | ||||||||||||||
Crane Company | 1,707 | 115,991 | ||||||||||||||
Cummins Incorporated | 8,014 | 1,212,438 | ||||||||||||||
Deere & Company | 16,319 | 2,553,597 | ||||||||||||||
Donaldson Company Incorporated | 5,528 | 249,202 | ||||||||||||||
Dover Corporation | 7,331 | 753,187 | ||||||||||||||
Flowserve Corporation | 4,116 | 165,422 | ||||||||||||||
Gardner Denver Holdings Incorporated † | 6,741 | 221,037 | ||||||||||||||
Graco Incorporated | 7,183 | 354,266 | ||||||||||||||
IDEX Corporation | 3,917 | 579,716 | ||||||||||||||
Illinois Tool Works Incorporated | 14,828 | 2,487,842 | ||||||||||||||
ITT Incorporated | 2,922 | 175,758 | ||||||||||||||
John Bean Technologies Corporation | 1,065 | 103,156 | ||||||||||||||
Lincoln Electric Holdings Incorporated | 2,382 | 195,062 | ||||||||||||||
Nordson Corporation | 2,666 | 387,370 | ||||||||||||||
Oshkosh Corporation | 3,038 | 219,192 | ||||||||||||||
PACCAR Incorporated | 17,552 | 1,174,229 | ||||||||||||||
Parker-Hannifin Corporation | 5,415 | 1,000,530 | ||||||||||||||
RBC Bearings Incorporated † | 985 | 168,622 | ||||||||||||||
Snap-on Incorporated | 2,541 | 367,810 | ||||||||||||||
Stanley Black & Decker Incorporated | 6,624 | 951,869 | ||||||||||||||
The Middleby Corporation † | 2,997 | 335,095 | ||||||||||||||
The Toro Company | 4,981 | 355,793 | ||||||||||||||
Trane Technologies plc | 12,402 | 1,600,354 | ||||||||||||||
WABCO Holdings Incorporated † | 2,545 | 343,830 | ||||||||||||||
Woodward Governor Company | 2,429 | 250,673 | ||||||||||||||
Xylem Incorporated | 9,514 | 735,813 | ||||||||||||||
| 17,453,438 | ||||||||||||||||
|
| |||||||||||||||
| Marine: 0.01% | ||||||||||||||||
Kirby Corporation † | 2,184 | 139,230 | ||||||||||||||
|
| |||||||||||||||
| Professional Services: 0.60% | ||||||||||||||||
ASGN Incorporated † | 1,940 | 98,377 | ||||||||||||||
Equifax Incorporated | 6,308 | 895,988 | ||||||||||||||
Exponent Incorporated | 1,781 | 131,171 | ||||||||||||||
The accompanying notes are an integral part of these financial statements.
120 | Wells Fargo Funds
Table of Contents
Portfolio of investments—February 29, 2020
FACTOR ENHANCED LARGE CAP PORTFOLIO
| Shares | Value | |||||||||||||||
| Professional Services (continued) | ||||||||||||||||
FTI Consulting Incorporated † | 1,752 | $ | 197,258 | |||||||||||||
IHS Markit Limited | 19,138 | 1,363,391 | ||||||||||||||
Insperity Incorporated | 1,567 | 105,412 | ||||||||||||||
Manpower Incorporated | 2,357 | 178,991 | ||||||||||||||
Nielsen Holdings plc | 19,266 | 350,834 | ||||||||||||||
Robert Half International Incorporated | 4,509 | 227,299 | ||||||||||||||
TransUnion | 9,866 | 877,285 | ||||||||||||||
Verisk Analytics Incorporated | 8,723 | 1,353,025 | ||||||||||||||
| 5,779,031 | ||||||||||||||||
|
| |||||||||||||||
| Road & Rail: 1.21% | ||||||||||||||||
AMERCO | 363 | 117,071 | ||||||||||||||
J.B. Hunt Transport Services Incorporated | 4,275 | 412,281 | ||||||||||||||
Kansas City Southern | 5,108 | 769,673 | ||||||||||||||
Knight-Swift Transportation Holdings Incorporated | 5,655 | 180,621 | ||||||||||||||
Landstar System Incorporated | 962 | 97,133 | ||||||||||||||
Lyft Incorporated Class A † | 10,801 | 411,734 | ||||||||||||||
Norfolk Southern Corporation | 14,152 | 2,580,617 | ||||||||||||||
Old Dominion Freight Line Incorporated | 3,674 | 712,021 | ||||||||||||||
Ryder System Incorporated | 2,128 | 80,949 | ||||||||||||||
Uber Technologies Incorporated † | 11,465 | 388,320 | ||||||||||||||
Union Pacific Corporation | 36,697 | 5,864,548 | ||||||||||||||
| 11,614,968 | ||||||||||||||||
|
| |||||||||||||||
| Trading Companies & Distributors: 0.25% | ||||||||||||||||
Fastenal Company | 28,113 | 962,027 | ||||||||||||||
HD Supply Holdings Incorporated † | 8,493 | 322,904 | ||||||||||||||
MSC Industrial Direct Company Class A | 1,684 | 104,105 | ||||||||||||||
Univar Incorporated † | 7,509 | 127,578 | ||||||||||||||
W.W. Grainger Incorporated | 2,297 | 637,509 | ||||||||||||||
Watsco Incorporated | 1,556 | 244,261 | ||||||||||||||
| 2,398,384 | ||||||||||||||||
|
| |||||||||||||||
| Transportation Infrastructure: 0.01% | ||||||||||||||||
Macquarie Infrastructure Company LLC | 3,616 | 141,928 | ||||||||||||||
|
| |||||||||||||||
Information Technology: 10.45% |
| |||||||||||||||
| Communications Equipment: 0.32% | ||||||||||||||||
Ciena Corporation † | 6,978 | 268,304 | ||||||||||||||
F5 Networks Incorporated † | 2,856 | 342,577 | ||||||||||||||
Juniper Networks Incorporated | 17,647 | 374,469 | ||||||||||||||
Lumentum Holdings Incorporated † | 2,962 | 230,503 | ||||||||||||||
Motorola Solutions Incorporated | 9,477 | 1,570,149 | ||||||||||||||
Viasat Incorporated † | 2,997 | 172,328 | ||||||||||||||
Viavi Solutions Incorporated † | 10,299 | 135,844 | ||||||||||||||
| 3,094,174 | ||||||||||||||||
|
| |||||||||||||||
| Electronic Equipment, Instruments & Components: 0.69% | ||||||||||||||||
Amphenol Corporation Class A | 15,618 | 1,431,858 | ||||||||||||||
Arrow Electronics Incorporated † | 3,879 | 260,126 | ||||||||||||||
Avnet Incorporated | 4,685 | 143,736 | ||||||||||||||
CDW Corporation of Delaware | 7,861 | 897,883 | ||||||||||||||
Coherent Incorporated † | 342 | 44,019 | ||||||||||||||
The accompanying notes are an integral part of these financial statements.
Wells Fargo Funds | 121
Table of Contents
Portfolio of investments—February 29, 2020
FACTOR ENHANCED LARGE CAP PORTFOLIO
| Shares | Value | |||||||||||||||
| Electronic Equipment, Instruments & Components (continued) | ||||||||||||||||
Dolby Laboratories Incorporated Class A | 2,748 | $ | 180,544 | |||||||||||||
FLIR Systems Incorporated | 6,078 | 258,133 | ||||||||||||||
Jabil Circuit Incorporated | 6,767 | 216,882 | ||||||||||||||
Keysight Technologies Incorporated † | 8,952 | 848,292 | ||||||||||||||
Littelfuse Incorporated | 1,042 | 166,387 | ||||||||||||||
National Instruments Corporation | 5,303 | 213,605 | ||||||||||||||
SYNNEX Corporation | 1,884 | 235,557 | ||||||||||||||
TE Connectivity Limited | 17,585 | 1,457,269 | ||||||||||||||
Tech Data Corporation † | 1,842 | 262,282 | ||||||||||||||
| 6,616,573 | ||||||||||||||||
|
| |||||||||||||||
| IT Services: 3.85% | ||||||||||||||||
Accenture plc Class A | 32,741 | 5,912,697 | ||||||||||||||
Akamai Technologies Incorporated † | 8,327 | 720,369 | ||||||||||||||
Alliance Data Systems Corporation | 2,370 | 203,536 | ||||||||||||||
Amdocs Limited | 5,853 | 373,129 | ||||||||||||||
Automatic Data Processing Incorporated | 21,794 | 3,372,404 | ||||||||||||||
Black Knight Incorporated † | 7,381 | 492,387 | ||||||||||||||
Booz Allen Hamilton Holding Corporation | 7,241 | 516,283 | ||||||||||||||
Broadridge Financial Solutions Incorporated | 5,987 | 624,803 | ||||||||||||||
CACI International Incorporated Class A † | 1,010 | 247,470 | ||||||||||||||
Cognizant Technology Solutions Corporation Class A | 29,906 | 1,822,173 | ||||||||||||||
CoreLogic Incorporated | 3,554 | 161,245 | ||||||||||||||
DXC Technology Company | 10,199 | 245,898 | ||||||||||||||
EPAM Systems Incorporated † | 2,485 | 554,652 | ||||||||||||||
Euronet Worldwide Incorporated † | 2,574 | 319,279 | ||||||||||||||
Fidelity National Information Services Incorporated | 32,342 | 4,518,824 | ||||||||||||||
Fiserv Incorporated † | 29,547 | 3,231,260 | ||||||||||||||
FleetCor Technologies Incorporated † | 4,497 | 1,195,258 | ||||||||||||||
Gartner Incorporated † | 4,564 | 590,536 | ||||||||||||||
Genpact Limited | 7,625 | 293,258 | ||||||||||||||
GoDaddy Incorporated Class A † | 9,241 | 646,685 | ||||||||||||||
International Business Machines Corporation | 46,414 | 6,040,782 | ||||||||||||||
Jack Henry & Associates Incorporated | 3,739 | 567,356 | ||||||||||||||
KBR Incorporated | 5,831 | 151,373 | ||||||||||||||
Leidos Holdings Incorporated | 7,375 | 757,044 | ||||||||||||||
MAXIMUS Incorporated | 2,095 | 132,027 | ||||||||||||||
Paychex Incorporated | 16,438 | 1,273,616 | ||||||||||||||
Perspecta Incorporated | 7,171 | 179,060 | ||||||||||||||
Sabre Corporation | 14,209 | 193,456 | ||||||||||||||
Science Applications International Corporation | 2,724 | 218,274 | ||||||||||||||
The Western Union Company | 19,943 | 446,524 | ||||||||||||||
VeriSign Incorporated † | 5,335 | 1,012,316 | ||||||||||||||
| 37,013,974 | ||||||||||||||||
|
| |||||||||||||||
| Semiconductors & Semiconductor Equipment: 2.88% | ||||||||||||||||
Applied Materials Incorporated | 45,484 | 2,643,530 | ||||||||||||||
Cabot Microelectronics Corporation | 1,248 | 173,821 | ||||||||||||||
Cree Incorporated † | 4,797 | 214,570 | ||||||||||||||
Cypress Semiconductor Corporation | 18,901 | 436,424 | ||||||||||||||
Entegris Incorporated | 6,094 | 324,932 | ||||||||||||||
First Solar Incorporated † | 3,698 | 169,257 | ||||||||||||||
Intel Corporation | 231,919 | 12,876,143 | ||||||||||||||
KLA-Tencor Corporation | 7,850 | 1,206,624 | ||||||||||||||
Lam Research Corporation | 6,743 | 1,978,598 | ||||||||||||||
The accompanying notes are an integral part of these financial statements.
122 | Wells Fargo Funds
Table of Contents
Portfolio of investments—February 29, 2020
FACTOR ENHANCED LARGE CAP PORTFOLIO
| Shares | Value | |||||||||||||||
| Semiconductors & Semiconductor Equipment (continued) | ||||||||||||||||
Marvell Technology Group Limited | 30,966 | $ | 659,576 | |||||||||||||
Maxim Integrated Products Incorporated | 12,867 | 715,663 | ||||||||||||||
MKS Instruments Incorporated | 1,670 | 167,317 | ||||||||||||||
ON Semiconductor Corporation † | 14,865 | 277,381 | ||||||||||||||
Semtech Corporation † | 1,143 | 45,137 | ||||||||||||||
Silicon Laboratories Incorporated † | 27 | 2,394 | ||||||||||||||
Teradyne Incorporated | 7,755 | 455,684 | ||||||||||||||
Texas Instruments Incorporated | 46,865 | 5,349,171 | ||||||||||||||
| 27,696,222 | ||||||||||||||||
|
| |||||||||||||||
| Software: 2.27% | ||||||||||||||||
ACI Worldwide Incorporated † | 5,349 | 149,077 | ||||||||||||||
ANSYS Incorporated † | 4,311 | 1,044,081 | ||||||||||||||
Aspen Technology Incorporated † | 3,470 | 369,590 | ||||||||||||||
Avalara Incorporated † | 3,403 | 288,404 | ||||||||||||||
Blackbaud Incorporated | 2,387 | 161,839 | ||||||||||||||
Cadence Design Systems Incorporated † | 14,312 | 946,596 | ||||||||||||||
CDK Global Incorporated | 6,123 | 281,780 | ||||||||||||||
Ceridian HCM Holding Incorporated † | 4,494 | 317,861 | ||||||||||||||
Citrix Systems Incorporated | 6,788 | 701,811 | ||||||||||||||
Dropbox Incorporated Class A † | 11,887 | 232,510 | ||||||||||||||
Fair Isaac Corporation † | 1,520 | 571,566 | ||||||||||||||
Fortinet Incorporated † | 7,572 | 772,798 | ||||||||||||||
Intuit Incorporated | 13,629 | 3,623,270 | ||||||||||||||
J2 Global Incorporated | 1,983 | 173,175 | ||||||||||||||
Manhattan Associates Incorporated † | 3,198 | 215,417 | ||||||||||||||
NortonLifeLock Incorporated | 28,298 | 538,511 | ||||||||||||||
Nuance Communications Incorporated | 14,167 | 306,291 | ||||||||||||||
Oracle Corporation | 112,800 | 5,579,088 | ||||||||||||||
Palo Alto Networks Incorporated † | 5,083 | 938,423 | ||||||||||||||
RealPage Incorporated † | 3,648 | 233,837 | ||||||||||||||
RingCentral Incorporated Class A † | 3,947 | 930,505 | ||||||||||||||
Slack Technologies Incorporated Class A † | 13,454 | 363,527 | ||||||||||||||
SS&C Technologies Holdings Incorporated | 11,384 | 631,812 | ||||||||||||||
Synopsys Incorporated † | 7,823 | 1,079,026 | ||||||||||||||
Teradata Corporation † | 4,963 | 98,962 | ||||||||||||||
Tyler Technologies Incorporated † | 2,015 | 631,400 | ||||||||||||||
Verint Systems Incorporated † | 2,832 | 155,420 | ||||||||||||||
VMware Incorporated Class A † | 4,186 | 504,497 | ||||||||||||||
| 21,841,074 | ||||||||||||||||
|
| |||||||||||||||
| Technology Hardware, Storage & Peripherals: 0.44% | ||||||||||||||||
Dell Technologies Incorporated † | 11,453 | 463,388 | ||||||||||||||
Hewlett Packard Enterprise Company | 64,874 | 829,738 | ||||||||||||||
HP Incorporated | 78,170 | 1,625,154 | ||||||||||||||
NCR Corporation † | 5,785 | 145,782 | ||||||||||||||
Pure Storage Incorporated Class A † | 11,748 | 179,274 | ||||||||||||||
Seagate Technology plc | 12,782 | 612,897 | ||||||||||||||
Xerox Holdings Corporation | 10,625 | 342,125 | ||||||||||||||
| 4,198,358 | ||||||||||||||||
|
| |||||||||||||||
Materials: 2.77% |
| |||||||||||||||
| Chemicals: 1.70% | ||||||||||||||||
Air Products & Chemicals Incorporated | 12,106 | 2,658,599 | ||||||||||||||
Ashland Global Holdings Incorporated | 2,567 | 183,643 | ||||||||||||||
The accompanying notes are an integral part of these financial statements.
Wells Fargo Funds | 123
Table of Contents
Portfolio of investments—February 29, 2020
FACTOR ENHANCED LARGE CAP PORTFOLIO
| Shares | Value | |||||||||||||||
| Chemicals (continued) | ||||||||||||||||
Axalta Coating Systems Limited † | 10,537 | $ | 262,582 | |||||||||||||
Celanese Corporation Series A | 5,427 | 508,727 | ||||||||||||||
CF Industries Holdings Incorporated | 11,830 | 436,054 | ||||||||||||||
Corteva Incorporated | 37,035 | 1,007,352 | ||||||||||||||
Dow Incorporated | 37,915 | 1,532,145 | ||||||||||||||
Eastman Chemical Company | 6,447 | 396,555 | ||||||||||||||
Ecolab Incorporated | 13,646 | 2,462,421 | ||||||||||||||
FMC Corporation | 6,486 | 603,847 | ||||||||||||||
Huntsman Corporation | 1,214 | 22,993 | ||||||||||||||
Ingevity Corporation † | 1,918 | 86,387 | ||||||||||||||
International Flavors & Fragrances Incorporated | 5,796 | 694,245 | ||||||||||||||
LyondellBasell Industries NV Class A | 12,296 | 878,672 | ||||||||||||||
NewMarket Corporation | 400 | 155,436 | ||||||||||||||
Olin Corporation | 6,939 | 112,342 | ||||||||||||||
PPG Industries Incorporated | 11,779 | 1,230,317 | ||||||||||||||
RPM International Incorporated | 5,698 | 365,299 | ||||||||||||||
ScottsMiracle-Gro Company Class A | 1,933 | 204,879 | ||||||||||||||
The Sherwin-Williams Company | 4,335 | 2,240,111 | ||||||||||||||
Valvoline Incorporated | 8,894 | 173,433 | ||||||||||||||
W.R. Grace & Company | 3,205 | 181,275 | ||||||||||||||
| 16,397,314 | ||||||||||||||||
|
| |||||||||||||||
| Construction Materials: 0.18% | ||||||||||||||||
Eagle Materials Incorporated | 1,898 | 149,809 | ||||||||||||||
Martin Marietta Materials Incorporated | 3,222 | 733,102 | ||||||||||||||
Vulcan Materials Company | 7,323 | 880,664 | ||||||||||||||
| 1,763,575 | ||||||||||||||||
|
| |||||||||||||||
| Containers & Packaging: 0.51% | ||||||||||||||||
AptarGroup Incorporated | 2,990 | 302,199 | ||||||||||||||
Avery Dennison Corporation | 4,358 | 498,947 | ||||||||||||||
Ball Corporation | 18,879 | 1,330,214 | ||||||||||||||
Berry Global Group Incorporated † | 7,138 | 270,958 | ||||||||||||||
Crown Holdings Incorporated † | 7,846 | 553,143 | ||||||||||||||
Graphic Packaging Holding Company | 15,792 | 213,508 | ||||||||||||||
International Paper Company | 21,896 | 809,276 | ||||||||||||||
Packaging Corporation of America | 5,021 | 455,003 | ||||||||||||||
Sealed Air Corporation | 8,148 | 246,966 | ||||||||||||||
Sonoco Products Company | 4,081 | 196,745 | ||||||||||||||
| 4,876,959 | ||||||||||||||||
|
| |||||||||||||||
| Metals & Mining: 0.36% | ||||||||||||||||
Alcoa Corporation † | 8,524 | 118,228 | ||||||||||||||
Newmont Goldcorp Corporation | 41,575 | 1,855,492 | ||||||||||||||
Nucor Corporation | 15,325 | 633,689 | ||||||||||||||
Reliance Steel & Aluminum Company | 2,893 | 295,925 | ||||||||||||||
Royal Gold Incorporated | 3,139 | 302,819 | ||||||||||||||
Steel Dynamics Incorporated | 10,148 | 270,241 | ||||||||||||||
| 3,476,394 | ||||||||||||||||
|
| |||||||||||||||
| Paper & Forest Products: 0.02% | ||||||||||||||||
Louisiana-Pacific Corporation | 5,777 | 164,356 | ||||||||||||||
|
| |||||||||||||||
The accompanying notes are an integral part of these financial statements.
124 | Wells Fargo Funds
Table of Contents
Portfolio of investments—February 29, 2020
FACTOR ENHANCED LARGE CAP PORTFOLIO
| Shares | Value | |||||||||||||||
Real Estate: 6.14% |
| |||||||||||||||
| Equity REITs: 6.01% | ||||||||||||||||
Alexandria Real Estate Equities Incorporated | 6,888 | $ | 1,046,149 | |||||||||||||
American Campus Communities Incorporated | 7,114 | 309,032 | ||||||||||||||
American Homes 4 Rent Class A | 13,889 | 359,586 | ||||||||||||||
American Tower Corporation | 25,285 | 5,734,638 | ||||||||||||||
Americold Realty Trust | 11,391 | 349,362 | ||||||||||||||
Apartment Investment & Management Company Class A | 9,062 | 433,526 | ||||||||||||||
Apple Hospitality REIT Incorporated | 6,857 | 89,621 | ||||||||||||||
AvalonBay Communities Incorporated | 8,222 | 1,649,251 | ||||||||||||||
Boston Properties Incorporated | 9,248 | 1,192,437 | ||||||||||||||
Brixmor Property Group Incorporated | 18,829 | 342,876 | ||||||||||||||
Camden Property Trust | 4,841 | 513,049 | ||||||||||||||
CoreSite Realty Corporation | 1,941 | 201,340 | ||||||||||||||
Corporate Office Properties Trust | 5,296 | 134,201 | ||||||||||||||
Cousins Properties Incorporated | 7,298 | 260,466 | ||||||||||||||
Crown Castle International Corporation | 23,420 | 3,355,852 | ||||||||||||||
CubeSmart | 8,893 | 269,191 | ||||||||||||||
CyrusOne Incorporated | 6,341 | 384,138 | ||||||||||||||
Digital Realty Trust Incorporated | 12,387 | 1,487,803 | ||||||||||||||
Douglas Emmett Incorporated | 9,446 | 360,648 | ||||||||||||||
Duke Realty Corporation | 19,706 | 639,854 | ||||||||||||||
EastGroup Properties Incorporated | 1,461 | 183,692 | ||||||||||||||
EPR Properties | 3,985 | 236,071 | ||||||||||||||
Equinix Incorporated | 4,757 | 2,724,810 | ||||||||||||||
Equity Commonwealth | 634 | 19,946 | ||||||||||||||
Equity Lifestyle Properties Incorporated | 9,287 | 634,581 | ||||||||||||||
Equity Residential | 22,030 | 1,654,453 | ||||||||||||||
Essex Property Trust Incorporated | 3,843 | 1,088,952 | ||||||||||||||
Extra Space Storage Incorporated | 6,998 | 702,319 | ||||||||||||||
Federal Realty Investment Trust | 3,959 | 460,590 | ||||||||||||||
First Industrial Realty Trust Incorporated | 5,113 | 196,851 | ||||||||||||||
Gaming and Leisure Properties Incorporated | 11,565 | 516,609 | ||||||||||||||
Healthcare Realty Trust Incorporated | 5,021 | 172,220 | ||||||||||||||
Healthcare Trust of America Incorporated Class A | 10,503 | 327,063 | ||||||||||||||
Healthpeak Properties Incorporated | 29,305 | 927,210 | ||||||||||||||
Highwoods Properties Incorporated | 5,234 | 234,902 | ||||||||||||||
Host Hotels & Resorts Incorporated | 38,151 | 552,426 | ||||||||||||||
Hudson Pacific Properties Incorporated | 7,983 | 257,691 | ||||||||||||||
Invitation Homes Incorporated | 31,490 | 903,448 | ||||||||||||||
Iron Mountain Incorporated | 16,312 | 496,048 | ||||||||||||||
JBG Smith Properties | 5,977 | 219,236 | ||||||||||||||
Kimco Realty Corporation | 24,692 | 428,406 | ||||||||||||||
Lamar Advertising Company Class A | 4,223 | 353,634 | ||||||||||||||
Life Storage Incorporated | 1,949 | 210,317 | ||||||||||||||
Medical Properties Trust Incorporated | 25,536 | 539,576 | ||||||||||||||
Mid-America Apartment Communities Incorporated | 6,552 | 846,912 | ||||||||||||||
National Health Investors Incorporated | 851 | 69,552 | ||||||||||||||
National Retail Properties Incorporated | 8,736 | 444,226 | ||||||||||||||
Omega Healthcare Investors Incorporated | 12,678 | 502,049 | ||||||||||||||
Outfront Media Incorporated | 7,125 | 187,673 | ||||||||||||||
Park Hotels & Resorts Incorporated | 12,092 | 220,800 | ||||||||||||||
Pebblebrook Hotel Trust | 7,514 | 151,858 | ||||||||||||||
Physicians Realty Trust | 8,418 | 158,763 | ||||||||||||||
Prologis Incorporated | 41,531 | 3,500,233 | ||||||||||||||
PS Business Parks Incorporated | 528 | 78,434 | ||||||||||||||
The accompanying notes are an integral part of these financial statements.
Wells Fargo Funds | 125
Table of Contents
Portfolio of investments—February 29, 2020
FACTOR ENHANCED LARGE CAP PORTFOLIO
| Shares | Value | |||||||||||||||
| Equity REITs (continued) | ||||||||||||||||
Public Storage Incorporated | 8,350 | $ | 1,746,152 | |||||||||||||
Rayonier Incorporated | 5,484 | 145,491 | ||||||||||||||
Realty Income Corporation | 18,715 | 1,354,779 | ||||||||||||||
Regency Centers Corporation | 9,417 | 540,912 | ||||||||||||||
Rexford Industrial Realty Incorporated | 4,856 | 227,115 | ||||||||||||||
RLJ Lodging Trust | 8,559 | 113,064 | ||||||||||||||
Ryman Hospitality Properties Incorporated | 2,413 | 167,728 | ||||||||||||||
Sabra Health Care REIT Incorporated | 11,628 | 227,327 | ||||||||||||||
SBA Communications Corporation | 6,573 | 1,742,437 | ||||||||||||||
Service Properties Trust | 9,212 | 166,553 | ||||||||||||||
Simon Property Group Incorporated | 17,970 | 2,211,748 | ||||||||||||||
SL Green Realty Corporation | 4,931 | 386,788 | ||||||||||||||
Spirit Realty Capital Incorporated REIT | 4,494 | 204,477 | ||||||||||||||
STAG Industrial Incorporated | 5,975 | 167,181 | ||||||||||||||
STORE Capital Corporation | 11,536 | 379,073 | ||||||||||||||
Sun Communities Incorporated | 5,148 | 787,026 | ||||||||||||||
Sunstone Hotel Investors Incorporated | 9,398 | 102,908 | ||||||||||||||
Terreno Realty Corporation | 1,953 | 107,161 | ||||||||||||||
The Macerich Company | 9,893 | 202,015 | ||||||||||||||
UDR Incorporated | 16,390 | 737,222 | ||||||||||||||
Ventas Incorporated | 21,923 | 1,178,800 | ||||||||||||||
VEREIT Incorporated | 65,748 | 569,378 | ||||||||||||||
VICI Properties Incorporated | 24,975 | 625,874 | ||||||||||||||
Vornado Realty Trust | 10,291 | 551,392 | ||||||||||||||
Weingarten Realty Investors | 5,421 | 145,988 | ||||||||||||||
Welltower Incorporated | 24,551 | 1,836,906 | ||||||||||||||
Weyerhaeuser Company | 40,364 | 1,048,657 | ||||||||||||||
WP Carey Incorporated | 9,715 | 752,038 | ||||||||||||||
| 57,740,761 | ||||||||||||||||
|
| |||||||||||||||
| Real Estate Management & Development: 0.13% | ||||||||||||||||
CBRE Group Incorporated Class A † | 16,063 | 901,777 | ||||||||||||||
Jones Lang LaSalle Incorporated | 2,408 | 355,830 | ||||||||||||||
| 1,257,607 | ||||||||||||||||
|
| |||||||||||||||
Utilities: 4.54% |
| |||||||||||||||
| Electric Utilities: 2.45% | ||||||||||||||||
ALLETE Incorporated | 571 | 39,393 | ||||||||||||||
Alliant Energy Corporation | 10,658 | 555,495 | ||||||||||||||
American Electric Power Company Incorporated | 27,331 | 2,439,565 | ||||||||||||||
Duke Energy Corporation | 41,462 | 3,802,065 | ||||||||||||||
Edison International | 18,459 | 1,240,260 | ||||||||||||||
Entergy Corporation | 11,065 | 1,293,609 | ||||||||||||||
Evergy Incorporated | 11,919 | 778,907 | ||||||||||||||
Eversource Energy | 18,244 | 1,577,376 | ||||||||||||||
Exelon Corporation | 54,418 | 2,345,960 | ||||||||||||||
FirstEnergy Corporation | 30,452 | 1,356,028 | ||||||||||||||
Hawaiian Electric Industries Incorporated | 3,150 | 134,946 | ||||||||||||||
IDACORP Incorporated | 1,024 | 98,959 | ||||||||||||||
OGE Energy Corporation | 7,567 | 288,303 | ||||||||||||||
PG&E Corporation † | 16,866 | 261,423 | ||||||||||||||
Pinnacle West Capital Corporation | 5,113 | 457,562 | ||||||||||||||
PNM Resources Incorporated | 2,663 | 125,374 | ||||||||||||||
Portland General Electric Company | 1,310 | 71,277 | ||||||||||||||
The accompanying notes are an integral part of these financial statements.
126 | Wells Fargo Funds
Table of Contents
Portfolio of investments—February 29, 2020
FACTOR ENHANCED LARGE CAP PORTFOLIO
| Shares | Value | |||||||||||||||
| Electric Utilities (continued) | ||||||||||||||||
PPL Corporation | 41,176 | $ | 1,235,692 | |||||||||||||
The Southern Company | 60,700 | 3,663,852 | ||||||||||||||
Xcel Energy Incorporated | 28,678 | 1,787,213 | ||||||||||||||
| 23,553,259 | ||||||||||||||||
|
| |||||||||||||||
| Gas Utilities: 0.19% | ||||||||||||||||
Atmos Energy Corporation | 6,392 | 659,974 | ||||||||||||||
National Fuel Gas Company | 3,349 | 122,607 | ||||||||||||||
New Jersey Resources Corporation | 3,736 | 131,918 | ||||||||||||||
ONE Gas Incorporated | 1,731 | 142,184 | ||||||||||||||
Southwest Gas Holdings Incorporated | 2,343 | 151,545 | ||||||||||||||
Spire Incorporated | 2,275 | 170,739 | ||||||||||||||
UGI Corporation | 11,538 | 415,830 | ||||||||||||||
| 1,794,797 | ||||||||||||||||
|
| |||||||||||||||
| Independent Power & Renewable Electricity Producers: 0.16% | ||||||||||||||||
AES Corporation | 38,075 | 636,995 | ||||||||||||||
NRG Energy Incorporated | 12,747 | 423,328 | ||||||||||||||
Vistra Energy Corporation | 23,706 | 455,866 | ||||||||||||||
| 1,516,189 | ||||||||||||||||
|
| |||||||||||||||
| Multi-Utilities: 1.57% | ||||||||||||||||
Ameren Corporation |
| 13,075 | 1,032,925 | |||||||||||||
Black Hills Corporation |
| 2,678 | 193,352 | |||||||||||||
CenterPoint Energy Incorporated |
| 27,647 | 636,434 | |||||||||||||
CMS Energy Corporation |
| 15,836 | 956,811 | |||||||||||||
Consolidated Edison Incorporated |
| 18,709 | 1,474,643 | |||||||||||||
Dominion Energy Incorporated |
| 45,717 | 3,574,155 | |||||||||||||
DTE Energy Company |
| 10,255 | 1,145,176 | |||||||||||||
MDU Resources Group Incorporated |
| 8,460 | 234,596 | |||||||||||||
NiSource Incorporated |
| 21,371 | 577,444 | |||||||||||||
Northwestern Corporation |
| 1,187 | 83,494 | |||||||||||||
Public Service Enterprise Group Incorporated |
| 28,208 | 1,447,352 | |||||||||||||
Sempra Energy |
| 15,606 | 2,181,407 | |||||||||||||
WEC Energy Group Incorporated |
| 17,062 | 1,575,334 | |||||||||||||
| 15,113,123 | ||||||||||||||||
|
| |||||||||||||||
| Water Utilities: 0.17% | ||||||||||||||||
American States Water Company |
| 630 | 48,252 | |||||||||||||
American Water Works Company Incorporated |
| 9,653 | 1,193,690 | |||||||||||||
Essential Utilities Incorporated |
| 9,693 | 416,896 | |||||||||||||
| 1,658,838 | ||||||||||||||||
|
| |||||||||||||||
Total Common Stocks (Cost $774,998,578) |
| 915,636,273 | ||||||||||||||
|
| |||||||||||||||
| Expiration date | ||||||||||||||||
| Rights: 0.01% | ||||||||||||||||
Health Care: 0.01% |
| |||||||||||||||
| Pharmaceuticals: 0.01% | ||||||||||||||||
Bristol-Myers Squibb Company † |
| 12-31-2020 | 42,184 | 141,316 | ||||||||||||
|
| |||||||||||||||
Total Rights (Cost $89,852) |
| 141,316 | ||||||||||||||
|
| |||||||||||||||
The accompanying notes are an integral part of these financial statements.
Wells Fargo Funds | 127
Table of Contents
Portfolio of investments—February 29, 2020
FACTOR ENHANCED LARGE CAP PORTFOLIO
| Yield | Shares | Value | ||||||||||||||
| Short-Term Investments: 3.91% | ||||||||||||||||
| Investment Companies: 3.91% | ||||||||||||||||
Wells Fargo Government Money Market Fund Select Class (l)(u) | 1.52 | % | 37,548,710 | $ | 37,548,710 | |||||||||||
|
| |||||||||||||||
Total Short-Term Investments (Cost $37,548,710) |
| 37,548,710 | ||||||||||||||
|
| |||||||||||||||
| Total investments in securities (Cost $812,637,140) | 99.16 | % | 953,326,299 | |||||
Other assets and liabilities, net | 0.84 | 8,103,310 | ||||||
|
|
|
| |||||
| Total net assets | 100.00 | % | $ | 961,429,609 | ||||
|
|
|
| |||||
| † | Non-income-earning security |
| (l) | The issuer of the security is an affiliated person of the Portfolio as defined in the Investment Company Act of 1940. |
| (u) | The rate represents the7-day annualized yield at period end. |
Abbreviations:
| REIT | Real estate investment trust |
Futures Contracts
| Description | Number of contracts | Expiration date | Notional cost | Notional value | Unrealized gains | Unrealized losses | ||||||||||||||||||
Long | ||||||||||||||||||||||||
S&P 500E-Mini Index | 291 | 3-20-2020 | $ | 48,745,908 | $ | 42,938,505 | $ | 0 | $ | (5,807,403 | ) | |||||||||||||
Investments in Affiliates
An affiliated investment is an investment in which the Portfolio owns at least 5% of the outstanding voting shares of the issuer or as a result of other relationships, such as the Portfolio and the issuer having the same adviser or investment manager. Transactions with issuers that were either affiliated persons of the Portfolio at the beginning of the period or the end of the period were as follows:
| Shares, beginning of period | Shares purchased | Shares sold | Shares, end of period | Net realized gains (losses) | Net change in unrealized gains (losses) | Income from affiliated securities | Value, period | % of net assets | ||||||||||||||||||||||||||||
| Short-Term Investments | ||||||||||||||||||||||||||||||||||||
Investment Companies | ||||||||||||||||||||||||||||||||||||
Wells Fargo Government Money Market Fund Select Class | 42,045,039 | 233,855,290 | (238,351,619 | ) | 37,548,710 | $ | 0 | $ | 0 | $ | 609,610 | $ | 37,548,710 | 3.91 | % | |||||||||||||||||||||
The accompanying notes are an integral part of these financial statements.
128 | Wells Fargo Funds
Table of Contents
Portfolio of investments—February 29, 2020
FACTOR ENHANCED SMALL CAP PORTFOLIO
| Shares | Value | |||||||||||||||
| Common Stocks: 96.18% | ||||||||||||||||
| Communication Services: 2.99% | ||||||||||||||||
| Diversified Telecommunication Services: 0.71% | ||||||||||||||||
ATN International Incorporated | 1,851 | $ | 99,769 | |||||||||||||
Bandwidth Incorporated Class A † | 2,911 | 183,073 | ||||||||||||||
Cincinnati Bell Incorporated † | 7,525 | 98,201 | ||||||||||||||
Cogent Communications Group Incorporated | 7,514 | 548,597 | ||||||||||||||
Consolidated Communications Holdings Incorporated | 12,653 | 78,702 | ||||||||||||||
Frontier Communications Corporation † | 17,990 | 9,733 | ||||||||||||||
Globalstar Incorporated † | 105,139 | 42,939 | ||||||||||||||
IDT Corporation Class B † | 3,187 | 24,540 | ||||||||||||||
Intelsat SA † | 13,468 | 51,986 | ||||||||||||||
Ooma Incorporated † | 3,526 | 45,239 | ||||||||||||||
ORBCOMM Incorporated † | 13,163 | 43,570 | ||||||||||||||
Vonage Holdings Corporation † | 45,311 | 405,987 | ||||||||||||||
| 1,632,336 | ||||||||||||||||
|
| |||||||||||||||
| Entertainment: 0.17% | ||||||||||||||||
Akazoo SA Common Stock † | 4,028 | 18,489 | ||||||||||||||
AMC Entertainment Holdings Class A | 9,017 | 56,446 | ||||||||||||||
Gaia Incorporated † | 2,098 | 17,686 | ||||||||||||||
Glu Mobile Incorporated † | 20,489 | 145,882 | ||||||||||||||
Marcus Corporation | 3,787 | 101,189 | ||||||||||||||
Reading International Incorporated Class A † | 2,878 | 23,974 | ||||||||||||||
SciPlay Corporation Class A † | 3,703 | 33,475 | ||||||||||||||
| 397,141 | ||||||||||||||||
|
| |||||||||||||||
| Interactive Media & Services: 0.54% | ||||||||||||||||
Actua Corporation †(a)‡ | 9,483 | 474 | ||||||||||||||
Angi Homeservices Incorporated Class A † | 13,160 | 93,831 | ||||||||||||||
CarGurus Incorporated † | 14,765 | 376,360 | ||||||||||||||
Cars.com Incorporated † | 12,388 | 112,483 | ||||||||||||||
DHI Group Incorporated † | 8,810 | 20,087 | ||||||||||||||
EverQuote Incorporated Class A † | 798 | 32,415 | ||||||||||||||
Liberty TripAdvisor Holdings Incorporated Class A † | 11,952 | 52,051 | ||||||||||||||
QuinStreet Incorporated † | 8,279 | 106,634 | ||||||||||||||
The Meet Group Incorporated † | 12,041 | 61,409 | ||||||||||||||
Yelp Incorporated † | 12,396 | 387,623 | ||||||||||||||
| 1,243,367 | ||||||||||||||||
|
| |||||||||||||||
| Media: 1.14% | ||||||||||||||||
AMC Networks Incorporated Class A † | 7,383 | 228,873 | ||||||||||||||
Cardlytics Incorporated † | 3,269 | 259,526 | ||||||||||||||
Cumulus Media Incorporated Class A † | 2,453 | 29,559 | ||||||||||||||
Daily Journal Corporation † | 180 | 45,000 | ||||||||||||||
Emerald Holding Incorporated | 4,257 | 29,203 | ||||||||||||||
Entravision Communications Corporation Class A | 11,354 | 22,822 | ||||||||||||||
Fluent Incorporated † | 4,867 | 11,340 | ||||||||||||||
Gannett Company Incorporated | 21,444 | 90,065 | ||||||||||||||
Gray Television Incorporated † | 15,008 | 283,951 | ||||||||||||||
Hemisphere Media Group Incorporated † | 3,008 | 37,991 | ||||||||||||||
iHeartMedia Incorporated Class A † | 10,278 | 155,301 | ||||||||||||||
John Wiley & Sons Incorporated Class A | 7,886 | 293,280 | ||||||||||||||
Lee Enterprises Incorporated † | 10,292 | 15,438 | ||||||||||||||
The accompanying notes are an integral part of these financial statements.
Wells Fargo Funds | 129
Table of Contents
Portfolio of investments—February 29, 2020
FACTOR ENHANCED SMALL CAP PORTFOLIO
| Shares | Value | |||||||||||||||
| Media (continued) | ||||||||||||||||
Marchex Incorporated Class B † | 6,726 | $ | 17,420 | |||||||||||||
Meredith Corporation | 6,666 | 175,649 | ||||||||||||||
MSG Networks Incorporated Class A † | 7,719 | 97,568 | ||||||||||||||
National CineMedia Incorporated | 13,004 | 100,001 | ||||||||||||||
Saga Communications Incorporated Class A | 864 | 24,866 | ||||||||||||||
Scholastic Corporation | 3,602 | 115,588 | ||||||||||||||
Sinclair Broadcast Group Incorporated Class A | 12,573 | 291,819 | ||||||||||||||
Techtarget † | 4,273 | 98,834 | ||||||||||||||
The E.W. Scripps Company Class A | 9,438 | 112,312 | ||||||||||||||
Tribune Publishing Company | 2,630 | 30,166 | ||||||||||||||
WideOpenWest Incorporated † | 8,222 | 51,716 | ||||||||||||||
| 2,618,288 | ||||||||||||||||
|
| |||||||||||||||
| Wireless Telecommunication Services: 0.43% | ||||||||||||||||
Boingo Wireless Incorporated † | 7,264 | 92,035 | ||||||||||||||
Gogo Incorporated † | 9,230 | 33,320 | ||||||||||||||
NII Holdings Incorporated †(a)‡ | 14,979 | 32,504 | ||||||||||||||
Shenandoah Telecommunications Company | 8,132 | 361,305 | ||||||||||||||
Spok Holdings Incorporated | 2,712 | 27,012 | ||||||||||||||
Telephone & Data Systems Incorporated | 17,265 | 347,717 | ||||||||||||||
United States Cellular Corporation † | 2,612 | 82,043 | ||||||||||||||
| 975,936 | ||||||||||||||||
|
| |||||||||||||||
| Consumer Discretionary: 11.60% | ||||||||||||||||
| Auto Components: 1.14% | ||||||||||||||||
American Axle & Manufacturing Holdings Incorporated † | 17,103 | 108,262 | ||||||||||||||
Cooper Tire & Rubber Company | 8,579 | 218,679 | ||||||||||||||
Cooper-Standard Holdings Incorporated † | 2,834 | 48,972 | ||||||||||||||
Dana Incorporated | 22,783 | 327,620 | ||||||||||||||
Dorman Products Incorporated † | 4,689 | 284,341 | ||||||||||||||
Fox Factory Holding Corporation † | 6,362 | 403,351 | ||||||||||||||
LCI Industries | 4,354 | 420,379 | ||||||||||||||
Modine Manufacturing Company † | 8,563 | 63,880 | ||||||||||||||
Motorcar Parts of America Incorporated † | 2,965 | 49,634 | ||||||||||||||
Shiloh Industries Incorporated † | 2,544 | 8,802 | ||||||||||||||
Standard Motor Products Incorporated | 3,305 | 145,420 | ||||||||||||||
Stoneridge Incorporated † | 4,458 | 98,522 | ||||||||||||||
Strattec Security Corporation | 636 | 13,299 | ||||||||||||||
Superior Industries International Incorporated | 3,460 | 8,996 | ||||||||||||||
Tenneco Incorporated | 7,603 | 69,720 | ||||||||||||||
Visteon Corporation † | 4,927 | 320,452 | ||||||||||||||
Xpel Incorporated † | 1,540 | 19,881 | ||||||||||||||
| 2,610,210 | ||||||||||||||||
|
| |||||||||||||||
| Automobiles: 0.12% | ||||||||||||||||
Winnebago Industries Incorporated | 5,269 | 273,408 | ||||||||||||||
|
| |||||||||||||||
| Distributors: 0.09% | ||||||||||||||||
Core Mark Holding Company Incorporated | 8,466 | 194,803 | ||||||||||||||
Weyco Group Incorporated | 893 | 19,592 | ||||||||||||||
| 214,395 | ||||||||||||||||
|
| |||||||||||||||
The accompanying notes are an integral part of these financial statements.
130 | Wells Fargo Funds
Table of Contents
Portfolio of investments—February 29, 2020
FACTOR ENHANCED SMALL CAP PORTFOLIO
| Shares | Value | |||||||||||||||
| Diversified Consumer Services: 0.85% | ||||||||||||||||
Adtalem Global Education Incorporated † | 9,085 | $ | 280,454 | |||||||||||||
American Public Education Incorporated † | 2,488 | 55,383 | ||||||||||||||
Aspen Group Incorporated † | 2,455 | 21,555 | ||||||||||||||
Carriage Services Incorporated | 2,487 | 52,600 | ||||||||||||||
Collectors Universe Incorporated | 1,533 | 35,267 | ||||||||||||||
Graham Holdings Company Class B | 730 | 367,102 | ||||||||||||||
Houghton Mifflin Harcourt Company † | 18,798 | 102,825 | ||||||||||||||
K12 Incorporated † | 6,778 | 134,747 | ||||||||||||||
Laureate Education Incorporated Class A † | 18,906 | 353,542 | ||||||||||||||
Perdoceo Education Corporation † | 11,486 | 171,486 | ||||||||||||||
Regis Corporation † | 3,778 | 48,207 | ||||||||||||||
Select Interior Concepts Class A † | 3,334 | 24,905 | ||||||||||||||
Universal Technical Institute Incorporated † | 3,183 | 23,554 | ||||||||||||||
WW International Incorporated † | 8,984 | 269,520 | ||||||||||||||
| 1,941,147 | ||||||||||||||||
|
| |||||||||||||||
| Hotels, Restaurants & Leisure: 2.90% | ||||||||||||||||
BBX Capital Corporation | 10,641 | 37,031 | ||||||||||||||
Biglari Holdings Incorporated Class B † | 169 | 17,823 | ||||||||||||||
BJ’s Restaurants Incorporated | 4,027 | 132,690 | ||||||||||||||
Bloomin’ Brands Incorporated | 16,826 | 302,700 | ||||||||||||||
Bluegreen Vacations Corporation | 1,251 | 9,708 | ||||||||||||||
Brinker International Incorporated | 6,863 | 235,744 | ||||||||||||||
Carrols Restaurant Group Incorporated † | 5,483 | 22,617 | ||||||||||||||
Century Casinos Incorporated † | 4,601 | 32,115 | ||||||||||||||
Choice Hotels International Incorporated | 6,018 | 549,323 | ||||||||||||||
Chuy’s Holding Incorporated † | 3,220 | 69,037 | ||||||||||||||
Dave & Buster’s Entertainment Incorporated | 5,311 | 175,316 | ||||||||||||||
Del Taco Restaurants Incorporated † | 4,844 | �� | 31,002 | |||||||||||||
Denny’s Corporation † | 9,755 | 169,835 | ||||||||||||||
Dine Brands Global Incorporated | 2,830 | 231,636 | ||||||||||||||
Drive Shack Incorporated † | 10,279 | 29,398 | ||||||||||||||
El Pollo Loco Holdings Incorporated † | 3,696 | 47,678 | ||||||||||||||
Everi Holdings Incorporated † | 12,248 | 127,379 | ||||||||||||||
Fiesta Restaurant Group Incorporated † | 4,081 | 39,422 | ||||||||||||||
Golden Entertainment Incorporated † | 3,054 | 49,719 | ||||||||||||||
Hilton Grand Vacations Incorporated † | 15,021 | 400,460 | ||||||||||||||
Hyatt Hotels Corporation Class A | 6,414 | 491,312 | ||||||||||||||
Inspired Entertainment Incorporated † | 2,472 | 12,854 | ||||||||||||||
International Game Technology | 17,441 | 185,572 | ||||||||||||||
J. Alexander’s Holdings Incorporated † | 2,300 | 18,883 | ||||||||||||||
Jack in the Box Incorporated | 4,586 | 315,792 | ||||||||||||||
Lindblad Expeditions Holding † | 5,367 | 63,867 | ||||||||||||||
Monarch Casino & Resort Incorporated † | 2,072 | 97,964 | ||||||||||||||
Nathan S Famous Incorporated | 529 | 31,476 | ||||||||||||||
Noodles & Company † | 6,563 | 53,292 | ||||||||||||||
Papa John’s International Incorporated | 3,994 | 230,094 | ||||||||||||||
Penn National Gaming Incorporated † | 17,764 | 525,281 | ||||||||||||||
Playa Hotels & Resorts NV † | 13,229 | 70,114 | ||||||||||||||
Playags Incorporated † | 4,465 | 43,266 | ||||||||||||||
Potbelly Corporation † | 4,644 | 23,220 | ||||||||||||||
RCI Hospitality Holdings Incorporated | 1,555 | 31,333 | ||||||||||||||
Red Lion Hotels Corporation † | 3,600 | 9,252 | ||||||||||||||
Red Robin Gourmet Burgers Incorporated † | 2,199 | 60,473 | ||||||||||||||
Red Rock Resorts Incorporated Class A | 11,857 | 244,373 | ||||||||||||||
The accompanying notes are an integral part of these financial statements.
Wells Fargo Funds | 131
Table of Contents
Portfolio of investments—February 29, 2020
FACTOR ENHANCED SMALL CAP PORTFOLIO
| Shares | Value | |||||||||||||||
| Hotels, Restaurants & Leisure (continued) | ||||||||||||||||
Ruth’s Chris Steak House Incorporated | 5,123 | $ | 98,003 | |||||||||||||
SeaWorld Entertainment Incorporated † | 7,964 | 216,700 | ||||||||||||||
Shake Shack Incorporated Class A † | 4,676 | 277,941 | ||||||||||||||
Target Hospitality Corporation † | 6,470 | 30,280 | ||||||||||||||
The Cheesecake Factory Incorporated | 7,925 | 282,368 | ||||||||||||||
The Habit Restaurants Incorporated Class A † | 3,463 | 48,343 | ||||||||||||||
Twin River Worldwide Holdings Incorporated | 3,196 | 83,096 | ||||||||||||||
Wingstop Incorporated | 4,646 | 392,355 | ||||||||||||||
| 6,648,137 | ||||||||||||||||
|
| |||||||||||||||
| Household Durables: 1.65% | ||||||||||||||||
Bassett Furniture Industries Incorporated | 1,686 | 16,641 | ||||||||||||||
Century Communities Incorporated † | 4,688 | 156,251 | ||||||||||||||
Ethan Allen Interiors Incorporated | 4,334 | 57,209 | ||||||||||||||
Green Brick Partners Incorporated † | 4,214 | 46,101 | ||||||||||||||
Hamilton Beach Brand Class A | 1,425 | 16,530 | ||||||||||||||
Hooker Furniture Corporation | 1,978 | 37,206 | ||||||||||||||
Hovnanian Enterprises Incorporated Class A † | 579 | 14,330 | ||||||||||||||
Installed Building Products † | 3,961 | 261,624 | ||||||||||||||
KB Home Incorporated | 14,968 | 487,807 | ||||||||||||||
La-Z-Boy Incorporated | 8,194 | 234,758 | ||||||||||||||
Legacy Housing Corporation † | 987 | 14,183 | ||||||||||||||
LGI Homes Incorporated † | 3,289 | 247,826 | ||||||||||||||
Lifetime Brands Incorporated | 2,136 | 13,585 | ||||||||||||||
M/I Homes Incorporated † | 4,734 | 176,247 | ||||||||||||||
MDC Holdings Incorporated | 8,728 | 343,360 | ||||||||||||||
Meritage Corporation † | 6,682 | 424,040 | ||||||||||||||
Sonos Incorporated † | 10,889 | 125,659 | ||||||||||||||
Taylor Morrison Home Corporation Class A † | 23,528 | 529,851 | ||||||||||||||
The Lovesac Company † | 2,128 | 18,492 | ||||||||||||||
TRI Pointe Homes Incorporated † | 24,690 | 378,498 | ||||||||||||||
Tupperware Brands Corporation | 9,407 | 26,810 | ||||||||||||||
Turtle Beach Corporation † | 2,060 | 13,617 | ||||||||||||||
Universal Electronics Incorporated † | 2,388 | 100,821 | ||||||||||||||
Voxx International Corporation † | 3,538 | 13,126 | ||||||||||||||
Zagg Incorporated † | 5,027 | 33,781 | ||||||||||||||
| 3,788,353 | ||||||||||||||||
|
| |||||||||||||||
| Internet & Direct Marketing Retail: 0.64% | ||||||||||||||||
1-800-Flowers.com Incorporated Class A † | 4,360 | 78,654 | ||||||||||||||
Chewy Incorporated Class A † | 6,864 | 203,174 | ||||||||||||||
Duluth Holdings Incorporated Class B † | 3,011 | 20,655 | ||||||||||||||
Groupon Incorporated † | 88,666 | 118,812 | ||||||||||||||
Lands End Incorporated † | 1,353 | 14,261 | ||||||||||||||
Leaf Group Limited † | 3,594 | 9,452 | ||||||||||||||
Liquidity Services Incorporated † | 5,658 | 22,179 | ||||||||||||||
Overstock.com Incorporated † | 6,162 | 39,807 | ||||||||||||||
PetMed Express Incorporated | 3,351 | 88,466 | ||||||||||||||
Revolve Group Incorporated † | 2,259 | 36,822 | ||||||||||||||
Shutterstock Incorporated | 3,244 | 125,024 | ||||||||||||||
Stamps.com Incorporated † | 3,015 | 425,447 | ||||||||||||||
Stitch Fix Incorporated Class A † | 8,397 | 201,780 | ||||||||||||||
The Rubicon Project Incorporated † | 8,479 | 96,237 | ||||||||||||||
| 1,480,770 | ||||||||||||||||
|
| |||||||||||||||
The accompanying notes are an integral part of these financial statements.
132 | Wells Fargo Funds
Table of Contents
Portfolio of investments—February 29, 2020
FACTOR ENHANCED SMALL CAP PORTFOLIO
| Shares | Value | |||||||||||||||
| Leisure Products: 0.58% | ||||||||||||||||
Acushnet Holdings Corporation | 5,762 | $ | 146,643 | |||||||||||||
American Outdoor Brands Corporation † | 8,899 | 88,634 | ||||||||||||||
Callaway Golf Company | 16,144 | 274,125 | ||||||||||||||
Clarus Corporation | 3,872 | 44,760 | ||||||||||||||
Escalade Incorporated | 1,563 | 13,270 | ||||||||||||||
Johnson Outdoors Incorporated Class A | 723 | 45,122 | ||||||||||||||
Malibu Boats Incorporated Class A † | 3,580 | 157,305 | ||||||||||||||
Marine Products Corporation | 1,273 | 16,014 | ||||||||||||||
Mastercraft Boat Holdings Incorporated † | 3,472 | 56,142 | ||||||||||||||
Peloton Interactive Incorporated Class A † | 7,864 | 209,890 | ||||||||||||||
Sturm, Ruger & Company Incorporated | 2,921 | 140,325 | ||||||||||||||
Yeti Holdings Incorporated † | 4,457 | 134,824 | ||||||||||||||
| 1,327,054 | ||||||||||||||||
|
| |||||||||||||||
| Multiline Retail: 0.09% | ||||||||||||||||
Big Lots Stores Incorporated | 5,064 | 80,062 | ||||||||||||||
Dillard’s Incorporated Class A | 1,659 | 93,385 | ||||||||||||||
JCPenny Company Incorporated † | 48,542 | 33,494 | ||||||||||||||
| 206,941 | ||||||||||||||||
|
| |||||||||||||||
| Specialty Retail: 2.44% | ||||||||||||||||
Abercrombie & Fitch Company Class A | 10,011 | 131,444 | ||||||||||||||
America’sCar-Mart Incorporated † | 1,133 | 116,438 | ||||||||||||||
American Eagle Outfitters Incorporated | 27,941 | 359,880 | ||||||||||||||
Asbury Automotive Group Incorporated † | 3,150 | 279,216 | ||||||||||||||
At Home Group Incorporated † | 12,737 | 63,685 | ||||||||||||||
Barnes & Noble Education Incorporated † | 7,391 | 24,464 | ||||||||||||||
Bed Bath & Beyond Incorporated | 19,781 | 213,833 | ||||||||||||||
Boot Barn Holdings Incorporated † | 4,649 | 142,585 | ||||||||||||||
Caleres Incorporated | 6,671 | 76,917 | ||||||||||||||
Camping World Holdings Incorporated Class A | 4,993 | 68,304 | ||||||||||||||
Chico’s FAS Incorporated | 23,894 | 95,815 | ||||||||||||||
Children’s Place Retail Stores Incorporated | 3,210 | 184,896 | ||||||||||||||
Citi Trends Incorporated | 1,851 | 36,594 | ||||||||||||||
Conn’s Incorporated † | 4,496 | 36,642 | ||||||||||||||
Container Store Group Incorporated † | 3,035 | 11,472 | ||||||||||||||
Designer Brands Incorporated | 11,866 | 160,310 | ||||||||||||||
Dick’s Sporting Goods Incorporated | 10,584 | 385,363 | ||||||||||||||
Express Incorporated † | 7,636 | 28,253 | ||||||||||||||
Genesco Incorporated † | 1,909 | 65,689 | ||||||||||||||
GNC Holdings Incorporated Class A † | 14,708 | 24,709 | ||||||||||||||
Group 1 Automotive Incorporated | 2,928 | 249,553 | ||||||||||||||
Haverty Furniture Companies Incorporated | 2,910 | 48,946 | ||||||||||||||
Hibbett Sports Incorporated † | 3,252 | 63,479 | ||||||||||||||
Hudson Limited Class A † | 6,951 | 64,714 | ||||||||||||||
Lumber Liquidators Holdings Incorporated † | 3,928 | 38,494 | ||||||||||||||
MarineMax Incorporated † | 4,702 | 79,605 | ||||||||||||||
Murphy USA Incorporated † | 5,212 | 508,170 | ||||||||||||||
Office Depot Incorporated | 87,628 | 205,926 | ||||||||||||||
Party City Holdco Incorporated † | 9,364 | 18,634 | ||||||||||||||
Penske Auto Group Incorporated | 5,602 | 257,804 | ||||||||||||||
Rent-A-Center Incorporated | 8,040 | 171,172 | ||||||||||||||
Sally Beauty Holdings Incorporated † | 21,332 | 265,370 | ||||||||||||||
Shoe Carnival Incorporated | 1,531 | 45,792 | ||||||||||||||
Sleep Number Corporation † | 4,771 | 210,163 | ||||||||||||||
The accompanying notes are an integral part of these financial statements.
Wells Fargo Funds | 133
Table of Contents
Portfolio of investments—February 29, 2020
FACTOR ENHANCED SMALL CAP PORTFOLIO
| Shares | Value | |||||||||||||||
| Specialty Retail (continued) | ||||||||||||||||
Sonic Automotive Incorporated Class A | 3,694 | $ | 103,432 | |||||||||||||
Sportsman’s Warehouse Holdings Incorporated † | 6,454 | 38,724 | ||||||||||||||
Tailored Brands Incorporated | 10,508 | 34,361 | ||||||||||||||
The Buckle Incorporated | 5,333 | 120,686 | ||||||||||||||
The Cato Corporation Class A | 3,973 | 64,243 | ||||||||||||||
The Michaels Companies Incorporated † | 16,920 | 72,587 | ||||||||||||||
Tilly’s Incorporated Class A | 3,149 | 20,469 | ||||||||||||||
TravelCenters of America Incorporated † | 1,407 | 17,011 | ||||||||||||||
Urban Outfitters Incorporated † | 9,679 | 227,553 | ||||||||||||||
Winmark Corporation | 458 | 91,600 | ||||||||||||||
Zumiez Incorporated † | 3,263 | 86,567 | ||||||||||||||
| 5,611,564 | ||||||||||||||||
|
| |||||||||||||||
| Textiles, Apparel & Luxury Goods: 1.10% | ||||||||||||||||
Columbia Sportswear Company | 4,963 | 403,492 | ||||||||||||||
Crocs Incorporated † | 10,390 | 271,906 | ||||||||||||||
Culp Incorporated | 2,123 | 19,362 | ||||||||||||||
Delta Apparel Incorporated † | 922 | 18,219 | ||||||||||||||
Fossil Group Incorporated † | 7,801 | 35,807 | ||||||||||||||
G-III Apparel Group Limited † | 6,982 | 156,118 | ||||||||||||||
Kontoor Brands Incorporated | 9,055 | 305,516 | ||||||||||||||
Lakeland Industries Incorporated † | 1,325 | 27,971 | ||||||||||||||
Levi Strauss & Company Class A | 7,100 | 120,629 | ||||||||||||||
Movado Group Incorporated | 2,623 | 38,558 | ||||||||||||||
Oxford Industries Incorporated | 2,934 | 177,184 | ||||||||||||||
Rocky Brands Incorporated | 1,142 | 27,808 | ||||||||||||||
Steven Madden Limited | 13,720 | 448,644 | ||||||||||||||
Superior Uniform Group Incorporated | 1,599 | 19,220 | ||||||||||||||
Unifi Incorporated † | 2,324 | 49,664 | ||||||||||||||
Vera Bradley Incorporated † | 4,048 | 33,436 | ||||||||||||||
Wolverine World Wide Incorporated | 14,270 | 375,158 | ||||||||||||||
| 2,528,692 | ||||||||||||||||
|
| |||||||||||||||
| Consumer Staples: 4.16% | ||||||||||||||||
| Beverages: 0.44% | ||||||||||||||||
Boston Beer Company Incorporated Class A † | 1,515 | 561,747 | ||||||||||||||
Celsius Holdings Incorporated † | 4,957 | 29,296 | ||||||||||||||
Coca Cola Bottling Corporation | 825 | 162,014 | ||||||||||||||
MGP Ingredients Incorporated | 2,273 | 65,371 | ||||||||||||||
National Beverage Corporation † | 1,958 | 82,804 | ||||||||||||||
New Age Beverages Corporation † | 13,607 | 27,486 | ||||||||||||||
Primo Water Corporation † | 6,231 | 87,234 | ||||||||||||||
| 1,015,952 | ||||||||||||||||
|
| |||||||||||||||
| Food & Staples Retailing: 0.60% | ||||||||||||||||
HF Foods Group Incorporated † | 1,954 | 34,996 | ||||||||||||||
Ingles Markets Incorporated Class A | 2,366 | 84,632 | ||||||||||||||
Natural Grocers By Vitamin C | 2,173 | 14,994 | ||||||||||||||
Pricesmart Incorporated | 3,593 | 200,094 | ||||||||||||||
Rite Aid Corporation † | 11,659 | 158,796 | ||||||||||||||
SpartanNash Company | 6,799 | 84,512 | ||||||||||||||
Sprouts Farmers Market Incorporated † | 20,913 | 334,190 | ||||||||||||||
The Andersons Incorporated | 5,027 | 92,346 | ||||||||||||||
The Chef’s Warehouse Incorporated † | 4,500 | 137,790 | ||||||||||||||
The accompanying notes are an integral part of these financial statements.
134 | Wells Fargo Funds
Table of Contents
Portfolio of investments—February 29, 2020
FACTOR ENHANCED SMALL CAP PORTFOLIO
| Shares | Value | |||||||||||||||
| Food & Staples Retailing (continued) | ||||||||||||||||
United Natural Foods Incorporated † | 12,291 | $ | 79,523 | |||||||||||||
Village Super Market Class A | 1,806 | 37,113 | ||||||||||||||
Weis Markets Incorporated | 2,907 | 108,286 | ||||||||||||||
| 1,367,272 | ||||||||||||||||
|
| |||||||||||||||
| Food Products: 1.71% | ||||||||||||||||
Alico Incorporated | 633 | 20,617 | ||||||||||||||
B&G Foods Incorporated | 11,308 | 167,358 | ||||||||||||||
Cal-Maine Foods Incorporated | 4,126 | 143,956 | ||||||||||||||
Calavo Growers Incorporated | 2,940 | 213,003 | ||||||||||||||
Dean Foods Company † | 19,866 | 2,702 | ||||||||||||||
Farmer Bros Corporation † | 2,208 | 27,269 | ||||||||||||||
Fresh Del Monte Produce Incorporated | 5,149 | 141,186 | ||||||||||||||
Freshpet Incorporated † | 5,196 | 345,326 | ||||||||||||||
Hain Celestial Group Incorporated † | 13,817 | 327,877 | ||||||||||||||
Hostess Brands Incorporated † | 19,496 | 247,794 | ||||||||||||||
J & J Snack Foods Corporation | 2,638 | 424,243 | ||||||||||||||
John B. Sanfilippo & Son Incorporated | 1,548 | 108,654 | ||||||||||||||
Lancaster Colony Corporation | 3,379 | 488,097 | ||||||||||||||
Landec Corporation † | 4,484 | 46,006 | ||||||||||||||
Pilgrim’s Pride Corporation † | 9,172 | 194,080 | ||||||||||||||
Sanderson Farms Incorporated | 3,464 | 428,012 | ||||||||||||||
Seaboard Corporation | 44 | 150,260 | ||||||||||||||
Seneca Foods Corporation Class A † | 1,186 | 41,178 | ||||||||||||||
Simply Good Foods Company † | 14,559 | 321,172 | ||||||||||||||
Tootsie Roll Industries Incorporated | 2,924 | 93,802 | ||||||||||||||
| 3,932,592 | ||||||||||||||||
|
| |||||||||||||||
| Household Products: 0.67% | ||||||||||||||||
Central Garden & Pet Company Class A † | 6,785 | 171,728 | ||||||||||||||
Energizer Holdings Incorporated | 10,836 | 465,840 | ||||||||||||||
Oil-Dri Corporation of America | 890 | 27,083 | ||||||||||||||
Spectrum Brands Holdings Incorporated | 8,409 | 453,161 | ||||||||||||||
WD-40 Company | 2,399 | 413,804 | ||||||||||||||
| 1,531,616 | ||||||||||||||||
|
| |||||||||||||||
| Personal Products: 0.52% | ||||||||||||||||
Edgewell Personal Care Company † | 9,507 | 288,633 | ||||||||||||||
Elf Beauty Incorporated † | 7,009 | 111,864 | ||||||||||||||
Inter Parfums Incorporated | 3,046 | 182,943 | ||||||||||||||
Lifevantage Corporation † | 2,161 | 25,738 | ||||||||||||||
Medifast Incorporated | 1,905 | 158,325 | ||||||||||||||
NU Skin Enterprises Incorporated Class A | 9,486 | 232,597 | ||||||||||||||
Revlon Incorporated Class A † | 1,264 | 21,880 | ||||||||||||||
USANA Health Sciences Incorporated † | 2,125 | 140,463 | ||||||||||||||
Veru Incorporated † | 7,552 | 31,190 | ||||||||||||||
| 1,193,633 | ||||||||||||||||
|
| |||||||||||||||
| Tobacco: 0.22% | ||||||||||||||||
Pyxus International Incorporated † | 1,839 | 7,080 | ||||||||||||||
Turning Point Brands Incorporated | 1,507 | 39,408 | ||||||||||||||
Universal Corporation | 4,126 | 203,618 | ||||||||||||||
Vector Group Limited | 21,711 | 252,282 | ||||||||||||||
| 502,388 | ||||||||||||||||
|
| |||||||||||||||
The accompanying notes are an integral part of these financial statements.
Wells Fargo Funds | 135
Table of Contents
Portfolio of investments—February 29, 2020
FACTOR ENHANCED SMALL CAP PORTFOLIO
| Shares | Value | |||||||||||||||
| Energy: 2.13% |
| |||||||||||||||
| Energy Equipment & Services: 0.75% | ||||||||||||||||
Apergy Corporation † | 12,227 | $ | 227,422 | |||||||||||||
Archrock Incorporated | 24,349 | 171,660 | ||||||||||||||
Aspen Aerogels Incorporated † | 2,851 | 22,665 | ||||||||||||||
Cactus Incorporated Class A | 7,858 | 214,602 | ||||||||||||||
DMC Global Incorporated | 2,242 | 80,847 | ||||||||||||||
Era Group Incorporated † | 3,582 | 35,104 | ||||||||||||||
Exterran Corporation † | 4,306 | 21,961 | ||||||||||||||
Geospace Technologies Corporation † | 2,035 | 25,092 | ||||||||||||||
Gulf Island Fabrication Incorporated † | 2,407 | 10,711 | ||||||||||||||
Hi-Crush Partners LP † | 16,717 | 10,030 | ||||||||||||||
Ion Geophysical Corporation † | 1,806 | 6,357 | ||||||||||||||
KLX Energy Services † | 3,338 | 8,078 | ||||||||||||||
Liberty Oilfield Services Class A | 8,122 | 54,336 | ||||||||||||||
Matrix Service Company † | 4,638 | 56,027 | ||||||||||||||
McDermott International Incorporated † | 35,100 | 1,334 | ||||||||||||||
National Energy Services Reunited Corporation † | 4,501 | 37,403 | ||||||||||||||
Natural Gas Services Group Incoporated † | 1,989 | 19,651 | ||||||||||||||
Newpark Resources Incorporated † | 16,056 | 56,357 | ||||||||||||||
Nextier Oilfield Solutions Incorporated † | 7,328 | 34,148 | ||||||||||||||
Nine Energy Service Incorporated † | 2,424 | 9,841 | ||||||||||||||
Oceaneering International Incorporated † | 16,280 | 171,591 | ||||||||||||||
Parker Drilling Company † | 1,656 | 20,733 | ||||||||||||||
ProPetro Holding Corporation † | 13,258 | 116,140 | ||||||||||||||
RPC Incorporated | 9,016 | 31,015 | ||||||||||||||
Seacor Holdings Incorporated † | 3,420 | 127,566 | ||||||||||||||
Seacor Marine Holdings Incorporated † | 3,158 | 25,106 | ||||||||||||||
Select Energy Services Incorporated Class A † | 8,199 | 53,294 | ||||||||||||||
Solaris Oilfield Infrastructure Incorporated Class A | 4,506 | 47,764 | ||||||||||||||
Tetra Technologies Incorporated † | 20,772 | 26,173 | ||||||||||||||
| 1,723,008 | ||||||||||||||||
|
| |||||||||||||||
| Oil, Gas & Consumable Fuels: 1.38% | ||||||||||||||||
Adams Resources & Energy Incorporated | 329 | 9,984 | ||||||||||||||
Altus Midstream Company Class A † | 7,651 | 11,170 | ||||||||||||||
Amplify Energy Corporation | 4,215 | 17,619 | ||||||||||||||
Antero Resources Corporation † | 32,946 | 52,714 | ||||||||||||||
Arch Coal Incorporated Class A | 2,393 | 120,488 | ||||||||||||||
Berry Petroleum Corporation | 10,508 | 66,936 | ||||||||||||||
Bonanza Creek Energy Incorporated † | 2,994 | 48,772 | ||||||||||||||
Brigham Minerals Incorporated Class A | 3,097 | 49,397 | ||||||||||||||
Centennial Resource Development Class A † | 26,047 | 61,731 | ||||||||||||||
Chesapeake Energy Corporation † | 174,408 | 47,962 | ||||||||||||||
Consol Energy Incorporated † | 3,692 | 21,007 | ||||||||||||||
Contura Energy Incorporated † | 3,304 | 18,800 | ||||||||||||||
Core Laboratories NV | 7,457 | 200,146 | ||||||||||||||
CVR Energy Incorporated | 5,343 | 151,848 | ||||||||||||||
Delek US Holdings Incorporated | 13,082 | 279,693 | ||||||||||||||
DHT Holdings Incorporated | 16,121 | 89,472 | ||||||||||||||
Earthstone Energy Incorporated Class A † | 2,475 | 9,529 | ||||||||||||||
Evolution Petroleum Corporation | 4,579 | 21,567 | ||||||||||||||
Extraction Oil & Gas Incorporated † | 10,152 | 6,990 | ||||||||||||||
Falcon Minerals Corporation | 6,678 | 26,679 | ||||||||||||||
Goodrich Petroleum Corporation † | 1,958 | 10,436 | ||||||||||||||
The accompanying notes are an integral part of these financial statements.
136 | Wells Fargo Funds
Table of Contents
Portfolio of investments—February 29, 2020
FACTOR ENHANCED SMALL CAP PORTFOLIO
| Shares | Value | |||||||||||||||
| Oil, Gas & Consumable Fuels (continued) | ||||||||||||||||
Green Plains Renewable Energy Incorporated | 6,597 | $ | 79,098 | |||||||||||||
Gulfport Energy Corporation † | 21,274 | 17,436 | ||||||||||||||
Hallador Energy Corporation | 3,973 | 5,125 | ||||||||||||||
International Seaways Incorporated † | 4,232 | 84,174 | ||||||||||||||
Laredo Petroleum Incorporated † | 25,156 | 27,168 | ||||||||||||||
Magnolia Oil & Gas Corporation † | 19,017 | 142,818 | ||||||||||||||
Montage Resources Corporation † | 2,818 | 9,835 | ||||||||||||||
Northern Oil & Gas Incorporated † | 48,982 | 71,024 | ||||||||||||||
Overseas Shipholding Group Class A † | 12,926 | 22,233 | ||||||||||||||
Panhandle Oil And Gas Incorporated Class A | 2,585 | 17,190 | ||||||||||||||
Par Pacific Holdings Incorporated † | 6,843 | 113,525 | ||||||||||||||
PDC Energy Incorporated † | 17,247 | 328,210 | ||||||||||||||
Peabody Energy Corporation | 13,023 | 76,054 | ||||||||||||||
Penn Virginia Corporation † | 2,377 | 37,794 | ||||||||||||||
Renewable Energy Group Incorporated † | 6,736 | 178,167 | ||||||||||||||
Rex American Resources Corporation † | 1,131 | 79,181 | ||||||||||||||
Ring Energy Incorporated † | 8,920 | 12,577 | ||||||||||||||
Sandridge Energy Incorporated † | 5,199 | 10,710 | ||||||||||||||
SilverBow Resources Incorporated † | 1,081 | 3,038 | ||||||||||||||
Southwestern Energy Company † | 82,647 | 117,359 | ||||||||||||||
Talos Energy Incorporated † | 2,913 | 41,365 | ||||||||||||||
Vaalco Energy Incorporated † | 8,346 | 16,692 | ||||||||||||||
W&T Offshore Incorporated † | 15,270 | 39,702 | ||||||||||||||
World Fuel Services Corporation | 11,179 | 316,142 | ||||||||||||||
| 3,169,557 | ||||||||||||||||
|
| |||||||||||||||
| Financials: 19.77% | ||||||||||||||||
| Banks: 10.52% | ||||||||||||||||
1st Constitution Bancorp | 1,253 | 22,955 | ||||||||||||||
1st Source Corporation | 1,360 | 57,188 | ||||||||||||||
ACNB Corporation | 1,175 | �� | 35,814 | |||||||||||||
Allegiance Bancshares Incorporated | 3,320 | 110,124 | ||||||||||||||
Amalgamated Bank of New York Class A | 2,570 | 41,146 | ||||||||||||||
Amerant Bancorp Incorporated Class A † | 3,747 | 69,170 | ||||||||||||||
American National Bankshares Incorporated | 1,850 | 57,147 | ||||||||||||||
Ameris Bancorp | 11,465 | 391,874 | ||||||||||||||
AMES National Corporation | 1,567 | 40,538 | ||||||||||||||
Arrow Financial Corporation | 2,486 | 78,732 | ||||||||||||||
Atlantic Capital Bancshares † | 3,925 | 71,160 | ||||||||||||||
Atlantic Union Bankshares Corporation | 14,167 | 421,327 | ||||||||||||||
Auburn National Bancorporation Incorporation | 377 | 21,018 | ||||||||||||||
Banc of California Incorporated | 7,494 | 114,883 | ||||||||||||||
BancFirst Corporation | 3,227 | 165,545 | ||||||||||||||
Bancorpsouth Bank | 16,301 | 398,885 | ||||||||||||||
Bank First Corporation | 1,180 | 69,856 | ||||||||||||||
Bank of Commerce Holdings | 3,021 | 31,585 | ||||||||||||||
Bank of Marin Bancorp | 2,264 | 86,326 | ||||||||||||||
BankFinancial Corporation | 2,354 | 26,694 | ||||||||||||||
Bankwell Financial Group Incorporated | 1,089 | 31,004 | ||||||||||||||
Banner Corporation | 5,741 | 262,019 | ||||||||||||||
Bar Harbor Bankshares | 2,628 | 53,664 | ||||||||||||||
Baycom Corporation † | 1,990 | 42,407 | ||||||||||||||
BCB Bancorp Incorporated | 2,430 | 27,556 | ||||||||||||||
Berkshire Hills Bancorp Incorporated | 8,023 | 195,841 | ||||||||||||||
The accompanying notes are an integral part of these financial statements.
Wells Fargo Funds | 137
Table of Contents
Portfolio of investments—February 29, 2020
FACTOR ENHANCED SMALL CAP PORTFOLIO
| Shares | Value | |||||||||||||||
| Banks (continued) | ||||||||||||||||
BOK Financial Corporation | 4,945 | $ | 358,018 | |||||||||||||
Boston Private Financial Holdings Incorporated | 14,515 | 141,594 | ||||||||||||||
Bridge Bancorp Incorporated | 3,207 | 88,257 | ||||||||||||||
Brookline Bancorp Incorporated | 13,604 | 188,687 | ||||||||||||||
Bryn Mawr Bank Corporation | 3,461 | 115,044 | ||||||||||||||
Business First Bancshares Incorporated | 2,230 | 53,676 | ||||||||||||||
Byline Bancorp Incorporated | 4,038 | 70,665 | ||||||||||||||
C&F Financial Corporation | 564 | 25,662 | ||||||||||||||
Cadence Bancorp | 21,524 | 303,919 | ||||||||||||||
Cambridge Bancorp | 821 | 56,214 | ||||||||||||||
Camden National Corporation | 2,573 | 105,519 | ||||||||||||||
Capital Bancorp Incorporated † | 1,114 | 15,418 | ||||||||||||||
Capital City Bank Group Incorporated | 1,954 | 52,074 | ||||||||||||||
Capstar Financial Holdings Class I | 2,050 | 27,552 | ||||||||||||||
Carolina Financial Corporation | 4,067 | 131,771 | ||||||||||||||
Carter Bank & Trust | 4,115 | 69,544 | ||||||||||||||
Cathay General Bancorp | 13,066 | 402,171 | ||||||||||||||
CB Financial Services Incorporated | 881 | 25,822 | ||||||||||||||
CBTX Incorporated | 3,221 | 80,364 | ||||||||||||||
CenterState Bank Incorporated | 21,988 | 444,817 | ||||||||||||||
Central Pacific Financial Company | 4,710 | 112,663 | ||||||||||||||
Central Valley Community Bancorp | 2,011 | 34,589 | ||||||||||||||
Century Bancorp Incorporated Class A | 490 | 35,427 | ||||||||||||||
Chemung Financial Corporation | 613 | 22,007 | ||||||||||||||
Citizens & Northern Corporation | 2,299 | 52,164 | ||||||||||||||
Citizens Community Bancorp Incorporated | 1,889 | 21,950 | ||||||||||||||
City Holding Company | 2,759 | 192,909 | ||||||||||||||
Civista Bancshares Incorporated | 2,524 | 48,309 | ||||||||||||||
CNB Financial Corporation | 2,523 | 63,252 | ||||||||||||||
Coastal Financial Corporation † | 1,375 | 22,536 | ||||||||||||||
Codorus Valley Bancorp Incorporated | 1,743 | 35,906 | ||||||||||||||
Colony Bankcorp Incorporated | 1,292 | 19,212 | ||||||||||||||
Columbia Banking System Incorporated | 12,543 | 416,428 | ||||||||||||||
Community Bankers Trust Corporation | 3,866 | 31,585 | ||||||||||||||
Community Financial Corporation | 859 | 27,265 | ||||||||||||||
Community Trust Bancorp | 2,647 | 102,386 | ||||||||||||||
ConnectOne Bancorp Incorporated | 5,401 | 113,475 | ||||||||||||||
County Bancorp Incorporated | 914 | 22,521 | ||||||||||||||
CrossFirst Bankshares Incorporated † | 1,386 | 18,365 | ||||||||||||||
Customers Bancorp Incorporated † | 5,072 | 102,911 | ||||||||||||||
Dime Community Bancshares | 5,419 | 90,931 | ||||||||||||||
Eagle Bancorp Incorporated | 5,275 | 197,391 | ||||||||||||||
Eagle Bancorp Montana Incorporated | 1,025 | 19,885 | ||||||||||||||
Enterprise Bancorp Incorporated | 1,514 | 41,590 | ||||||||||||||
Enterprise Financial Service | 4,119 | 157,634 | ||||||||||||||
Equity Bancshares Incorporated Class A † | 2,545 | 66,628 | ||||||||||||||
Esquire Financial Holdings Class I † | 1,037 | 23,758 | ||||||||||||||
Evans Bancorp Incorporated | 832 | 32,673 | ||||||||||||||
Farmers & Merchants Banco | 1,928 | 51,285 | ||||||||||||||
Farmers National Banc Corporation | 4,350 | 65,381 | ||||||||||||||
FB Financial Corporation | 2,872 | 93,541 | ||||||||||||||
Fidelity D&D Bancorp Incorporated | 466 | 22,974 | ||||||||||||||
Financial Institutions Incorporated | 2,698 | 72,603 | ||||||||||||||
First Bancorp Incorporated | 1,769 | 45,110 | ||||||||||||||
First Bancorp of North Carolina | 4,990 | 160,179 | ||||||||||||||
The accompanying notes are an integral part of these financial statements.
138 | Wells Fargo Funds
Table of Contents
Portfolio of investments—February 29, 2020
FACTOR ENHANCED SMALL CAP PORTFOLIO
| Shares | Value | |||||||||||||||
| Banks (continued) | ||||||||||||||||
First Bancshares Incorporated | 2,891 | $ | 86,267 | |||||||||||||
First Bank | 3,334 | 32,507 | ||||||||||||||
First Busey Corporation | 8,708 | 192,186 | ||||||||||||||
First Business Financial Service | 1,385 | 33,240 | ||||||||||||||
First Capital Incorporated | 615 | 37,823 | ||||||||||||||
First Choice Bancorp | 1,633 | 36,987 | ||||||||||||||
First Citizens BancShares Corporation Class A | 763 | 345,876 | ||||||||||||||
First Commonwealth Financial Corporation | 16,895 | 199,361 | ||||||||||||||
First Community Bancshares | 2,418 | 63,255 | ||||||||||||||
First Community Corporation | 1,201 | 23,420 | ||||||||||||||
First Financial Bancorp | 16,807 | 346,224 | ||||||||||||||
First Financial Corporation | 2,008 | 80,220 | ||||||||||||||
First Financial Northwest | 1,398 | 19,502 | ||||||||||||||
First Foundation Incorporated | 6,674 | 96,606 | ||||||||||||||
First Guaranty Bancshares Incorporated | 900 | 15,372 | ||||||||||||||
First Internet Bancorp | 1,585 | 38,500 | ||||||||||||||
First Interstate BancSystem Class A | 7,467 | 254,326 | ||||||||||||||
First Merchants Corporation | 8,552 | 299,149 | ||||||||||||||
FirstMid-Illinois Bancshares | 2,255 | 63,523 | ||||||||||||||
First Midwest Bancorp Incorporated | 18,374 | 333,488 | ||||||||||||||
First National Community Bancorp Incorporated | 3,044 | 20,121 | ||||||||||||||
First Northwest Bancorp | 1,545 | 24,596 | ||||||||||||||
First of Long Island Corporation | 4,171 | 86,381 | ||||||||||||||
First Savings Financial Group Incorporated | 291 | 18,173 | ||||||||||||||
First United Corporation | 1,139 | 24,637 | ||||||||||||||
First Western Financial Incorporated † | 915 | 17,065 | ||||||||||||||
Flushing Financial Corporation | 4,805 | 87,235 | ||||||||||||||
Franklin Financial Network | 2,341 | 78,400 | ||||||||||||||
Franklin Financial Services Corporation | 733 | 22,738 | ||||||||||||||
Fulton Financial Corporation | 28,522 | 412,143 | ||||||||||||||
FVCBankcorp Incorporated † | 1,984 | 30,613 | ||||||||||||||
German American Bancorp | 4,224 | 126,086 | ||||||||||||||
Great Southern Bancorp Incorporated | 2,074 | 106,417 | ||||||||||||||
Great Western Bancorp Incorporated | 9,900 | 266,013 | ||||||||||||||
Guaranty Bancshares Incorporated | 1,350 | 37,274 | ||||||||||||||
Hanmi Financial Corporation | 5,326 | 83,086 | ||||||||||||||
HarborOne Bancorp Incorporated † | 2,939 | 29,375 | ||||||||||||||
Hawthorn Bancshares Incorporated | 1,011 | 21,979 | ||||||||||||||
Heartland Financial USA Incorporated | 5,953 | 255,086 | ||||||||||||||
Heritage Commerce Corporation | 10,003 | 102,631 | ||||||||||||||
Heritage Financial Corporation | 6,493 | 150,573 | ||||||||||||||
Hilltop Holdings Incorporated | 12,130 | 252,668 | ||||||||||||||
Hometrust Bancshares Incorporated | 2,766 | 65,720 | ||||||||||||||
Hope Bancorp Incorporated | 20,600 | 251,526 | ||||||||||||||
Horizon Bancorp Indiana | 6,692 | 100,514 | ||||||||||||||
Howard Bancorp Incorporated † | 2,334 | 36,761 | ||||||||||||||
Independent Bank Corporation | 5,991 | 404,572 | ||||||||||||||
Independent Bank Corporation | 3,872 | 75,775 | ||||||||||||||
Independent Bank Group Incorporated | 6,030 | 279,129 | ||||||||||||||
International Bancshares Corporation | 10,063 | 343,148 | ||||||||||||||
Investar Holding Corporation | 1,610 | 34,390 | ||||||||||||||
Investors Bancorp Incorporated | 40,297 | 424,730 | ||||||||||||||
Lakeland Bancorp Incorporated | 8,415 | 121,218 | ||||||||||||||
Lakeland Financial Corporation | 4,232 | 172,962 | ||||||||||||||
LCNB Corporation | 2,019 | 31,961 | ||||||||||||||
The accompanying notes are an integral part of these financial statements.
Wells Fargo Funds | 139
Table of Contents
Portfolio of investments—February 29, 2020
FACTOR ENHANCED SMALL CAP PORTFOLIO
| Shares | Value | |||||||||||||||
| Banks (continued) | ||||||||||||||||
Level One Bancorp Incorporated | 884 | $ | 21,437 | |||||||||||||
Live Oak Bancshares Incorporated | 4,291 | 65,953 | ||||||||||||||
Macatawa Bank Corporation | 4,553 | 43,891 | ||||||||||||||
Mackinac Financial Corporation | 1,625 | 22,734 | ||||||||||||||
Mainstreet Bancshares Incorporated † | 1,242 | 25,188 | ||||||||||||||
Malvern Bancorp Incorporated † | 1,320 | 25,238 | ||||||||||||||
Mercantile Bank Corporation | 2,729 | 78,295 | ||||||||||||||
Metropolitan Bank Holding Corporation † | 895 | 38,261 | ||||||||||||||
Mid Penn Bancorp Incorporated | 1,220 | 25,949 | ||||||||||||||
Middlefield Banc Corporation | 1,054 | 25,096 | ||||||||||||||
Midland States Bancorp Incorporated | 3,813 | 90,826 | ||||||||||||||
Midwestone Financial Group Class I | 2,511 | 72,141 | ||||||||||||||
Mutualfirst Financial Incorporated | 1,163 | 38,961 | ||||||||||||||
MVB Financial Corporation | 1,720 | 30,341 | ||||||||||||||
National Bank Holdings Corporation Class A | 4,675 | 143,008 | ||||||||||||||
National Bankshares Incorporated | 1,072 | 37,466 | ||||||||||||||
NBT Bancorp Incorporated | 7,471 | 251,698 | ||||||||||||||
Nicolet Bankshares Incorporated † | 1,379 | 91,635 | ||||||||||||||
Northeast Bank | 1,459 | 25,970 | ||||||||||||||
Northrim BanCorp Incorporated | 1,117 | 39,039 | ||||||||||||||
Norwood Financial Corporation | 1,012 | 31,251 | ||||||||||||||
Oak Valley Bancorp | 1,200 | 20,028 | ||||||||||||||
Ohio Valley Banc Corporation | 643 | 17,875 | ||||||||||||||
Old National Bancorp | 29,320 | 462,083 | ||||||||||||||
Old Point Financial Corporation | 276 | 7,314 | ||||||||||||||
Old Second Bancorp Incorporated | 4,872 | 51,838 | ||||||||||||||
Opus Bank | 4,744 | 112,290 | ||||||||||||||
Origin Bancorp Incorporated | 3,312 | 100,155 | ||||||||||||||
Orrstown Financial Services Incorporated | 1,744 | 31,043 | ||||||||||||||
Pacific Mercantile Bancorp † | 3,400 | 22,202 | ||||||||||||||
Pacific Premier Bancorp Incorporated | 9,774 | 252,462 | ||||||||||||||
Park National Corporation | 2,158 | 188,437 | ||||||||||||||
Parke Bancorp Incorporated | 1,729 | 31,990 | ||||||||||||||
PCB Bancorp | 2,088 | 27,917 | ||||||||||||||
Peapack-Gladstone Financial Corporation | 3,251 | 89,240 | ||||||||||||||
Penns Woods Bancorp Incorporated | 1,156 | 34,865 | ||||||||||||||
People’s Utah Bancorp | 2,872 | 68,842 | ||||||||||||||
Peoples Bancorp Incorporated | 3,285 | 93,787 | ||||||||||||||
Peoples Bancorp of North Carolina Incorporated | 767 | 19,505 | ||||||||||||||
Peoples Financial Services | 1,184 | 52,001 | ||||||||||||||
Preferred Bank (Los Angeles) | 2,416 | 123,530 | ||||||||||||||
Premier Financial Bancorp | 2,087 | 34,749 | ||||||||||||||
QCR Holdings Incorporated | 2,590 | 98,575 | ||||||||||||||
RBB Bancorp | 2,536 | 42,782 | ||||||||||||||
Reliant Bancorp Incorporated | 1,713 | 34,003 | ||||||||||||||
Renasant Corporation | 9,638 | 273,045 | ||||||||||||||
Republic Bancorp Incorporated Class A | 2,075 | 74,161 | ||||||||||||||
Richmond Mutual Bancorporation Incorporated † | 2,286 | 30,747 | ||||||||||||||
Riverview Financial Corporation | 1,544 | 17,880 | ||||||||||||||
S&T Bancorp Incorporated | 5,831 | 191,665 | ||||||||||||||
Sandy Spring Bancorp Incorporated | 6,062 | 186,467 | ||||||||||||||
SB Financial Group Incorporated | 1,022 | 19,152 | ||||||||||||||
SB One Bancorp | 1,429 | 31,324 | ||||||||||||||
Seacoast Banking Corporation † | 8,834 | 219,967 | ||||||||||||||
Select Bancorp Incorporated † | 2,798 | 29,379 | ||||||||||||||
The accompanying notes are an integral part of these financial statements.
140 | Wells Fargo Funds
Table of Contents
Portfolio of investments—February 29, 2020
FACTOR ENHANCED SMALL CAP PORTFOLIO
| Shares | Value | |||||||||||||||
| Banks (continued) | ||||||||||||||||
ServisFirst Bancshares Incorporated | 8,000 | $ | 276,400 | |||||||||||||
Shore Bancshares Incorporated | 2,223 | 34,590 | ||||||||||||||
Sierra Bancorp | 2,325 | 55,382 | ||||||||||||||
Simmons First National Corporation Class A | 16,278 | 348,024 | ||||||||||||||
Smartfinancial Incorporated | 2,157 | 40,961 | ||||||||||||||
South State Corporation | 5,844 | 398,093 | ||||||||||||||
Southern First Bancshares † | 1,199 | 45,706 | ||||||||||||||
Southern National Bancorp of Virginia | 3,951 | 56,065 | ||||||||||||||
Southside Bancshares Incorporated | 5,439 | 175,245 | ||||||||||||||
Spirit of Texas Bancshares Incorporated † | 2,495 | 46,008 | ||||||||||||||
Stock Yards Bancorp Incorporated | 3,574 | 124,876 | ||||||||||||||
Summit Financial Group Incorporated | 1,898 | 41,604 | ||||||||||||||
The Bancorp Incorporated † | 8,057 | 98,054 | ||||||||||||||
The Bank of Princeton | 954 | 26,006 | ||||||||||||||
Tompkins Trust Company Incorporated | 2,224 | 176,764 | ||||||||||||||
Towne Bank | 11,162 | 257,396 | ||||||||||||||
TriCo Bancshares | 4,094 | 138,459 | ||||||||||||||
TriState Capital Holdings Incorporated † | 4,093 | 81,328 | ||||||||||||||
Triumph Bancorp Incorporated † | 3,861 | 130,772 | ||||||||||||||
Trustmark Corporation | 10,333 | 277,958 | ||||||||||||||
Union Bankshares Incorporated | 567 | 16,999 | ||||||||||||||
United Community Bank | 13,947 | 345,467 | ||||||||||||||
United Security Bancshare | 2,535 | 21,953 | ||||||||||||||
Unity Bancorp Incorporated | 1,344 | 23,023 | ||||||||||||||
Univest Corporation of Pennsylvania | 4,862 | 113,771 | ||||||||||||||
Veritex Holdings Incorporated | 8,639 | 207,941 | ||||||||||||||
Washington Trust Bancorp | 2,621 | 112,493 | ||||||||||||||
WesBanco Incorporated | 11,337 | 347,026 | ||||||||||||||
West Bancorporation | 2,564 | 52,434 | ||||||||||||||
Westamerica Bancorporation | 4,501 | 260,248 | ||||||||||||||
| 24,158,921 | ||||||||||||||||
|
| |||||||||||||||
| Capital Markets: 2.09% | ||||||||||||||||
Ares Management Corporation Class A | 13,446 | 465,097 | ||||||||||||||
Artisan Partners Asset Management Incorporated Class A | 8,875 | 253,648 | ||||||||||||||
Ashford Incorporated † | 62 | 1,293 | ||||||||||||||
B. Riley Financial Incorporated | 3,282 | 77,652 | ||||||||||||||
BGC Partners Incorporated Class A | 51,961 | 242,138 | ||||||||||||||
Blucora Incorporated † | 8,057 | 140,192 | ||||||||||||||
BrightSphere Investment Group Incorporated | 10,994 | 102,794 | ||||||||||||||
Cohen & Steers Incorporated | 4,086 | 255,988 | ||||||||||||||
Cowen Incorporated Class A | 4,534 | 67,874 | ||||||||||||||
Diamond Hill Investment Group | 547 | 69,321 | ||||||||||||||
Donnelley Financial Solutions † | 5,126 | 44,596 | ||||||||||||||
Evercore Partners Incorporated Class A | 6,214 | 413,977 | ||||||||||||||
Federated Investors Incorporated Class B | 16,315 | 470,688 | ||||||||||||||
Gain Capital Holdings Incorporated | 4,164 | 24,568 | ||||||||||||||
Gamco Investors Incorporated Class A | 931 | 14,486 | ||||||||||||||
Great Elm Capital Group Incorporated † | 3,471 | 10,934 | ||||||||||||||
Hamilton Lane Incorporated Class A | 4,190 | 260,367 | ||||||||||||||
Houlihan Lokey Incorporated | 7,255 | 371,601 | ||||||||||||||
INTL FC Stone Incorporated † | 2,648 | 120,616 | ||||||||||||||
Moelis Company Class A | 8,886 | 283,997 | ||||||||||||||
Oppenheimer Holdings Class A | 1,578 | 37,446 | ||||||||||||||
Piper Jaffray Companies Incorporated | 2,351 | 164,758 | ||||||||||||||
The accompanying notes are an integral part of these financial statements.
Wells Fargo Funds | 141
Table of Contents
Portfolio of investments—February 29, 2020
FACTOR ENHANCED SMALL CAP PORTFOLIO
| Shares | Value | |||||||||||||||
| Capital Markets (continued) | ||||||||||||||||
PJT Partners Incorporated Class A | 3,493 | $ | 157,010 | |||||||||||||
Pzena Investment Managm Class A | 3,162 | 20,648 | ||||||||||||||
Safeguard Scientifics Incorporated | 3,230 | 28,521 | ||||||||||||||
Sculptor Capital Management Incorporated | 2,597 | 58,900 | ||||||||||||||
Siebert Financial Corporation † | 408 | 3,346 | ||||||||||||||
Silvercrest Asset Management Group Incorporated Class A | 1,386 | 16,022 | ||||||||||||||
Victory Capital Holding Class A | 2,596 | 51,323 | ||||||||||||||
VIRTU Financial Incorporated Class A | 13,429 | 252,599 | ||||||||||||||
Virtus Investment Partners Incorporated | 1,121 | 123,758 | ||||||||||||||
Waddell & Reed Financial Incorporated Class A | 11,963 | 164,611 | ||||||||||||||
Westwood Holdings Group Incorporated | 1,454 | 36,903 | ||||||||||||||
| 4,807,672 | ||||||||||||||||
|
| |||||||||||||||
| Consumer Finance: 0.51% | ||||||||||||||||
Atlanticus Holdings Corporation † | 828 | 10,764 | ||||||||||||||
Curo Group Holdings Corporation | 3,210 | 29,628 | ||||||||||||||
Elevate Credit Incorporated † | 4,697 | 15,500 | ||||||||||||||
Encore Capital Group Incorporated † | 5,321 | 197,728 | ||||||||||||||
Enova International Incorporated † | 5,771 | 110,919 | ||||||||||||||
Ezcorp Incorporated † | 6,816 | 32,717 | ||||||||||||||
Medallion Financial Corporation † | 3,233 | 19,107 | ||||||||||||||
Nelnet Incorporated Class A | 3,428 | 182,027 | ||||||||||||||
Regional Management Corporation † | 1,670 | 42,836 | ||||||||||||||
Santander Consumer USA Holdings Incorporated | 17,609 | 429,660 | ||||||||||||||
World Acceptance Corporation † | 1,243 | 97,078 | ||||||||||||||
| 1,167,964 | ||||||||||||||||
|
| |||||||||||||||
| Diversified Financial Services: 0.38% | ||||||||||||||||
Alerus Financial Corporation | 1,165 | 23,836 | ||||||||||||||
Cannae Holdings Incorporated † | 12,214 | 455,460 | ||||||||||||||
FGL Holdings | 28,017 | 320,514 | ||||||||||||||
Marlin Business Services Incorporated | 1,370 | 26,934 | ||||||||||||||
On Deck Capital Incorporated † | 11,514 | 40,184 | ||||||||||||||
| 866,928 | ||||||||||||||||
|
| |||||||||||||||
| Insurance: 2.34% | ||||||||||||||||
Ambac Financial Group Incorporated † | 7,992 | 153,606 | ||||||||||||||
American National Insurance Company | 1,637 | 161,015 | ||||||||||||||
Amerisafe Incorporated | 3,424 | 223,142 | ||||||||||||||
Argo Group International Holdings Limited | 5,777 | 325,014 | ||||||||||||||
Citizens Incorporated † | 8,073 | 47,146 | ||||||||||||||
CNA Financial Corporation | 5,038 | 209,480 | ||||||||||||||
Crawford & Company Class A | 2,987 | 22,223 | ||||||||||||||
Donegal Group Incorporated Class A | 2,095 | 29,896 | ||||||||||||||
eHealth Incorporated † | 3,742 | 439,124 | ||||||||||||||
Employers Holdings Incorporated | 5,508 | 212,278 | ||||||||||||||
FBL Financial Group Incorporated | 1,653 | 78,947 | ||||||||||||||
FedNat Holding Company | 1,891 | 24,659 | ||||||||||||||
Genworth Financial Incorporated Class A † | 79,229 | 308,993 | ||||||||||||||
Goosehead Insurance Incorporated Class A | 2,345 | 127,193 | ||||||||||||||
Greenlight Capital Limited † | 5,160 | 43,550 | ||||||||||||||
Hallmark Financial Services Incorporated † | 2,419 | 34,301 | ||||||||||||||
HCI Group Incorporated | 1,119 | 47,580 | ||||||||||||||
Health Insurance Innovations Incorporated Class A † | 1,727 | 50,791 | ||||||||||||||
The accompanying notes are an integral part of these financial statements.
142 | Wells Fargo Funds
Table of Contents
Portfolio of investments—February 29, 2020
FACTOR ENHANCED SMALL CAP PORTFOLIO
| Shares | Value | |||||||||||||||
| Insurance (continued) | ||||||||||||||||
Heritage Insurance Holdings Incorporated | 4,676 | $ | 52,184 | |||||||||||||
Horace Mann Educators Corporation | 7,083 | 275,741 | ||||||||||||||
Independence Holding Company | 857 | 31,803 | ||||||||||||||
Investors Title Company | 227 | 37,219 | ||||||||||||||
James River Group Holdings Limited | 4,899 | 197,969 | ||||||||||||||
Kingstone Company Incorporated | 1,604 | 11,268 | ||||||||||||||
Kinsale Capital Group Incorporated | 3,783 | 459,521 | ||||||||||||||
Mercury General Corporation | 4,894 | 211,959 | ||||||||||||||
National General Holdings Corporation | 11,410 | 222,153 | ||||||||||||||
National Western Life Group Class A | 405 | 96,767 | ||||||||||||||
NI Holdings Incorporated † | 1,644 | 23,213 | ||||||||||||||
ProAssurance Corporation | 9,454 | 256,676 | ||||||||||||||
ProSight Global Incorporated † | 1,408 | 18,867 | ||||||||||||||
Protective Insurance Corporation Class B | 1,296 | 18,481 | ||||||||||||||
Safety Insurance Group Incorporated | 2,653 | 208,897 | ||||||||||||||
State Auto Financial Corporation | 3,131 | 78,212 | ||||||||||||||
Stewart Information Services Corporation | 4,268 | 154,416 | ||||||||||||||
Tiptree Incorporated | 4,022 | 26,465 | ||||||||||||||
Trupanion Incorporated † | 4,979 | 153,054 | ||||||||||||||
United Fire Group Incorporated | 3,808 | 145,999 | ||||||||||||||
United Insurance Holdings Company | 3,892 | 36,585 | ||||||||||||||
Universal Insurance Holdings Company | 5,760 | 119,174 | ||||||||||||||
| 5,375,561 | ||||||||||||||||
|
| |||||||||||||||
| Mortgage REITs: 1.60% | ||||||||||||||||
AG Mortgage Investment Trust Incorporated | 5,610 | 83,982 | ||||||||||||||
Anworth Mortgage Asset Corporation | 16,546 | 54,105 | ||||||||||||||
Apollo Commercial Real Estate Finance Incorporated | 26,825 | 434,565 | ||||||||||||||
Arbor Realty Trust Incorporated | 15,820 | 192,055 | ||||||||||||||
Ares Commercial Real Estate | 4,557 | 69,540 | ||||||||||||||
Capstead Mortgage Corporation | 15,694 | 111,427 | ||||||||||||||
Colony Credit Real Estate Incorporated REIT | 14,458 | 184,050 | ||||||||||||||
Dynex Capital Incorporated REIT | 4,222 | 72,196 | ||||||||||||||
Ellington Financial Incorporated | 5,248 | 86,749 | ||||||||||||||
Ellington Residential Mortgage REIT | 1,689 | 18,393 | ||||||||||||||
Exantas Capital Corporation REIT | 5,364 | 61,471 | ||||||||||||||
Granite Point Mortgage Trust Incorporated | 9,443 | 155,054 | ||||||||||||||
Great Ajax Corporation REIT | 3,217 | 45,456 | ||||||||||||||
Invesco Mortgage Capital Incorporated | 25,026 | 402,418 | ||||||||||||||
KKR Real Estate Finance Trust | 4,205 | 82,586 | ||||||||||||||
Ladder Capital Corporation | 17,467 | 266,372 | ||||||||||||||
New York Mortgage Trust Incorporated | 45,160 | 257,412 | ||||||||||||||
Orchid Island Capital Incorporated REIT | 11,064 | 63,397 | ||||||||||||||
PennyMac Mortgage Investment Trust | 15,875 | 328,613 | ||||||||||||||
Ready Capital Corporation | 5,653 | 81,969 | ||||||||||||||
Redwood Trust Incorporated | 18,747 | 320,199 | ||||||||||||||
Sachem Capital Corporation REIT | 3,302 | 12,614 | ||||||||||||||
TPG Real Estate Finance Trust Incorporated | 10,019 | 192,565 | ||||||||||||||
Western Asset Mortgage Capital REIT | 9,059 | 90,771 | ||||||||||||||
| 3,667,959 | ||||||||||||||||
|
| |||||||||||||||
| Thrifts & Mortgage Finance: 2.33% | ||||||||||||||||
Axos Financial Incorporated † | 9,650 | 240,382 | ||||||||||||||
Bridgewater Bancshares Incorporated † | 3,837 | 47,963 | ||||||||||||||
Capitol Federal Financial Incorporated | 23,251 | 283,778 | ||||||||||||||
The accompanying notes are an integral part of these financial statements.
Wells Fargo Funds | 143
Table of Contents
Portfolio of investments—February 29, 2020
FACTOR ENHANCED SMALL CAP PORTFOLIO
| Shares | Value | |||||||||||||||
| Thrifts & Mortgage Finance (continued) | ||||||||||||||||
Columbia Financial Incorporated † | 8,438 | $ | 130,958 | |||||||||||||
Essa Bancorp Incorporated | 1,626 | 26,894 | ||||||||||||||
Federal Agricultural Mortgage Corporation Class C | 1,591 | 119,420 | ||||||||||||||
First Defiance Financial Corporation | 6,405 | 153,176 | ||||||||||||||
Flagstar Bancorp Incorporated | 4,944 | 157,615 | ||||||||||||||
FS Bancorp Incorporated | 662 | 31,637 | ||||||||||||||
Hingham Institution For Savings Corporation | 270 | 49,399 | ||||||||||||||
Home Bancorp Incorporated | 1,313 | 43,421 | ||||||||||||||
Homestreet Incorporated | 4,036 | 109,335 | ||||||||||||||
Impac Mortgage Holdings Incorporated † | 1,563 | 10,081 | ||||||||||||||
Kearny Financial Corporation | 14,083 | 153,646 | ||||||||||||||
Luther Burbank Corporation | 2,555 | 26,649 | ||||||||||||||
Merchants Bancorp Incorporated | 2,815 | 50,726 | ||||||||||||||
Meridian Bancorp Incorporated | 8,408 | 138,816 | ||||||||||||||
Meta Financial Group Incorporated | 6,316 | 207,481 | ||||||||||||||
MMA Capital Management LLC † | 809 | 24,424 | ||||||||||||||
Mr. Cooper Group Incorporated † | 13,336 | 171,101 | ||||||||||||||
NMI Holdings Incorporated Class A † | 11,858 | 276,766 | ||||||||||||||
Northfield Bancorp Incorporated | 7,673 | 108,419 | ||||||||||||||
Northwest Bancshares Incorporated | 17,739 | 246,395 | ||||||||||||||
OceanFirst Financial Corporation | 9,464 | 193,444 | ||||||||||||||
Ocwen Financial Corporation † | 16,889 | 21,111 | ||||||||||||||
OP Bancorp | 2,166 | 19,169 | ||||||||||||||
PB Bancorp Incorporated | 1,039 | 15,782 | ||||||||||||||
PCSB Financial Corporation | 2,763 | 50,729 | ||||||||||||||
PDL Community Bancorp † | 1,344 | 18,883 | ||||||||||||||
PennyMac Financial Services Incorporated | 7,732 | 272,630 | ||||||||||||||
Pioneer Bancorp Incorporated † | 1,923 | 26,191 | ||||||||||||||
Provident Bancorp Incorporated † | 1,362 | 14,968 | ||||||||||||||
Provident Financial Holdings | 991 | 19,572 | ||||||||||||||
Provident Financial Services Incorporated | 10,502 | 209,830 | ||||||||||||||
Prudential Bancorp Incorporated | 1,221 | 20,061 | ||||||||||||||
Riverview Bancorp Incorporated | 3,512 | 22,652 | ||||||||||||||
Severn Bancorp Incorporated | 196 | 1,572 | ||||||||||||||
Southern Missouri Bancorp | 1,063 | 34,888 | ||||||||||||||
Standard AVB Financial Corporation | 784 | 22,266 | ||||||||||||||
Sterling Bancorp Incorporated | 3,569 | 24,983 | ||||||||||||||
Territorial Bancorp Incorporated | 1,402 | 35,639 | ||||||||||||||
TFS Financial Corporation | 9,423 | 192,606 | ||||||||||||||
Timberland Bancorp Incorporated | 1,232 | 28,644 | ||||||||||||||
Trustco Bank Corporation | 17,123 | 117,464 | ||||||||||||||
Walker & Dunlop Incorporated | 4,889 | 317,052 | ||||||||||||||
Washington Federal Incorporated | 13,807 | 414,072 | ||||||||||||||
Waterstone Financial Incorporated | 4,099 | 68,166 | ||||||||||||||
Western New England Bancorp | 4,175 | 36,907 | ||||||||||||||
WSFS Financial Corporation | 9,734 | 335,434 | ||||||||||||||
| 5,343,197 | ||||||||||||||||
|
| |||||||||||||||
| Health Care: 12.61% | ||||||||||||||||
| Biotechnology: 3.74% | ||||||||||||||||
Acorda Therapeutics Incorporated † | 7,364 | 10,604 | ||||||||||||||
Adamas Pharmaceuticals Incorporated † | 3,497 | 15,946 | ||||||||||||||
ADMA Biologics Incorporated † | 9,434 | 27,500 | ||||||||||||||
Aeglea BioTherapeutics Incorporated † | 4,475 | 30,564 | ||||||||||||||
The accompanying notes are an integral part of these financial statements.
144 | Wells Fargo Funds
Table of Contents
Portfolio of investments—February 29, 2020
FACTOR ENHANCED SMALL CAP PORTFOLIO
| Shares | Value | |||||||||||||||
| Biotechnology (continued) | ||||||||||||||||
Agenus Incorporated † | 20,807 | $ | 52,642 | |||||||||||||
Akcea Therapeutics Incorporated † | 2,651 | 45,014 | ||||||||||||||
Akebia Therapeutics Incorporated † | 19,556 | 173,462 | ||||||||||||||
Alector Incorporated † | 4,896 | 134,542 | ||||||||||||||
AMAG Pharmaceuticals Incorporated † | 4,927 | 38,184 | ||||||||||||||
Anavex Life Sciences Corporation † | 9,011 | 34,332 | ||||||||||||||
Anika Therapeutics Incorporated † | 2,559 | 106,864 | ||||||||||||||
Arcturus Therapeutics Holdings Incorporated † | 2,060 | 28,531 | ||||||||||||||
Arena Pharmaceuticals Incorporated † | 8,817 | 393,238 | ||||||||||||||
Athenex Incorporated † | 9,324 | 113,939 | ||||||||||||||
Athersys Incorporated † | 23,982 | 28,778 | ||||||||||||||
Atreca Incorporated Class A † | 1,277 | 30,188 | ||||||||||||||
Aveo Pharmaceuticals Incorporated † | 3,017 | 13,275 | ||||||||||||||
Avid Bioservices Incorporated † | 7,057 | 44,459 | ||||||||||||||
BeyondSpring Incorporated † | 2,963 | 47,052 | ||||||||||||||
Biospecifics Technologies † | 950 | 52,431 | ||||||||||||||
CareDx Incorporated † | �� | 6,649 | 154,988 | |||||||||||||
Catalyst Pharmaceuticals Incorporated † | 17,615 | 74,159 | ||||||||||||||
Cel-Sci Corporation † | 5,960 | 65,381 | ||||||||||||||
Celcuity Incorporated † | 1,029 | 8,736 | ||||||||||||||
Coherus Biosciences Incorporated † | 10,304 | 199,382 | ||||||||||||||
Corbus Pharmaceuticals Holdings † | 9,634 | 45,665 | ||||||||||||||
Cortexyme Incorporated † | 717 | 36,029 | ||||||||||||||
Cue Biopharma Incorporated † | 2,909 | 50,878 | ||||||||||||||
Cyclerion Therapeutics Incorporated † | 4,308 | 18,438 | ||||||||||||||
Cytokinetics Incorporated † | 10,407 | 145,074 | ||||||||||||||
Deciphera Pharmaceuticals Incorporated † | 4,507 | 239,953 | ||||||||||||||
Denali Therapeutics Incorporated † | 10,312 | 203,868 | ||||||||||||||
Dyadic International Incorporated † | 3,315 | 19,525 | ||||||||||||||
Eagle Pharmaceuticals Incorporated † | 1,995 | 91,571 | ||||||||||||||
Eidos Therapeutics Incorporated † | 787 | 39,806 | ||||||||||||||
Emergent BioSolutions Incorporated † | 7,783 | 456,706 | ||||||||||||||
Enanta Pharmaceuticals Incorporated † | 2,989 | 152,080 | ||||||||||||||
Enochian Biosciences Incorporated † | 2,190 | 7,139 | ||||||||||||||
Harpoon Therapeutics Incorporated † | 1,752 | 26,876 | ||||||||||||||
IGM Biosciences Incorporated † | 1,300 | 66,833 | ||||||||||||||
Immunic Incorporated † | 1,425 | 11,058 | ||||||||||||||
Invitae Corporation † | 18,550 | 378,049 | ||||||||||||||
Ironwood Pharmaceuticals Incorporated | 26,205 | 315,508 | ||||||||||||||
Jounce Therapeutics Incorporated † | 1,665 | 7,526 | ||||||||||||||
KalVista Pharmaceuticals Incorporated † | 1,430 | 19,234 | ||||||||||||||
Kodiak Sciences Incorporated † | 1,532 | 98,002 | ||||||||||||||
Krystal Biotech Incorporated † | 1,793 | 95,836 | ||||||||||||||
La Jolla Pharmaceutical Company † | 2,746 | 18,673 | ||||||||||||||
Lexicon Pharmaceuticals Incorporated † | 4,924 | 13,664 | ||||||||||||||
Ligand Pharmaceuticals Incorporated † | 3,496 | 327,226 | ||||||||||||||
Lineage Cell Therapeutics Incorporated † | 24,644 | 24,890 | ||||||||||||||
Mannkind Corporation † | 28,549 | 36,257 | ||||||||||||||
Matinas Biopharma Holdings Class I † | 22,326 | 22,326 | ||||||||||||||
Mei Pharma Incorporated † | 13,315 | 25,698 | ||||||||||||||
MeiraGTx Holdings plc † | 2,493 | 40,387 | ||||||||||||||
Mersana Therapeutics Incorporated † | 6,540 | 56,636 | ||||||||||||||
Molecular Templates Incorporated † | 4,084 | 65,712 | ||||||||||||||
Momenta Pharmaceuticals Incorporated † | 17,076 | 483,080 | ||||||||||||||
Myriad Genetics Incorporated † | 12,985 | 228,796 | ||||||||||||||
The accompanying notes are an integral part of these financial statements.
Wells Fargo Funds | 145
Table of Contents
Portfolio of investments—February 29, 2020
FACTOR ENHANCED SMALL CAP PORTFOLIO
| Shares | Value | |||||||||||||||
| Biotechnology (continued) | ||||||||||||||||
Natera Incorporated † | 11,468 | $ | 434,695 | |||||||||||||
NextCure Incorporated † | 742 | 30,986 | ||||||||||||||
Oncocyte Corporation † | 5,331 | 11,462 | ||||||||||||||
OPKO Health Incorporated † | 66,399 | 99,599 | ||||||||||||||
Palatin Technologies Incorporated † | 38,777 | 19,803 | ||||||||||||||
PDL BioPharma Incorporated † | 17,870 | 60,758 | ||||||||||||||
Pfenex Incorporated † | 5,118 | 59,369 | ||||||||||||||
Pieris Pharmaceuticals Incorporated † | 10,106 | 31,430 | ||||||||||||||
Precision BioSciences Incorporated † | 11,893 | 95,263 | ||||||||||||||
Prevail Therapeutics Incorporated † | 1,116 | 14,262 | ||||||||||||||
Principia Biopharma Incorporated † | 2,842 | 183,480 | ||||||||||||||
Protagonist Therapeutics Incorporated † | 4,021 | 31,364 | ||||||||||||||
Puma Biotechnology Incorporated † | 6,132 | 65,950 | ||||||||||||||
RA Pharmaceuticals Incorporated † | 5,911 | 276,398 | ||||||||||||||
Radius Health Incorporated † | 8,149 | 171,618 | ||||||||||||||
Rigel Pharmaceuticals Incorporated † | 29,151 | 61,800 | ||||||||||||||
Seres Therapeutics Incorporated † | 6,646 | 20,868 | ||||||||||||||
Spero Therapeutics Incorporated † | 2,169 | 20,692 | ||||||||||||||
Stoke Therapeutics Incorporated † | 1,411 | 34,922 | ||||||||||||||
Sutro Biopharma Incorporated † | 1,607 | 15,636 | ||||||||||||||
T2 Biosystems Incorporated † | 6,779 | 4,673 | ||||||||||||||
TCR2 Therapeutics Incorporated † | 1,524 | 18,105 | ||||||||||||||
Trevena Incorporated † | 12,840 | 9,178 | ||||||||||||||
Twist Bioscience Corporation † | 3,319 | 101,628 | ||||||||||||||
Vanda Pharmaceuticals Incorporated † | 9,046 | 99,777 | ||||||||||||||
Veracyte Incorporated † | 8,161 | 201,495 | ||||||||||||||
Vericel Corporation † | 8,205 | 126,685 | ||||||||||||||
Viela Bio Incorporated † | 1,520 | 66,333 | ||||||||||||||
Voyager Therapeutics Incorporated † | 5,204 | 56,724 | ||||||||||||||
X4 Pharmaceuticals Incorporated † | 2,043 | 21,819 | ||||||||||||||
Xencor Incorporated † | 9,456 | 307,225 | ||||||||||||||
XOMA Corporation † | 1,169 | 28,407 | ||||||||||||||
| 8,575,594 | ||||||||||||||||
|
| |||||||||||||||
| Health Care Equipment & Supplies: 3.08% | ||||||||||||||||
Accuray Incorporated † | 17,017 | 50,455 | ||||||||||||||
Alphatec Holdings Incorporated † | 7,065 | 41,330 | ||||||||||||||
AngioDynamics Incorporated † | 6,717 | 77,178 | ||||||||||||||
Antares Pharma Incorporated † | 26,827 | 83,164 | ||||||||||||||
Apyx Medical Corporation † | 5,223 | 31,599 | ||||||||||||||
Atricure Incorporated † | 6,513 | 250,229 | ||||||||||||||
Atrion Corporation | 257 | 158,392 | ||||||||||||||
Avanos Medical Incorporated † | 9,058 | 293,570 | ||||||||||||||
BioLife Solutions Incorporated † | 2,847 | 40,285 | ||||||||||||||
BioSig Technologies Incorporated † | 2,895 | 10,480 | ||||||||||||||
Cantel Medical Corporation | 6,669 | 420,814 | ||||||||||||||
Cardiovascular Systems Incorporated † | 6,177 | 232,379 | ||||||||||||||
Chembio Diagnostics Incorporated † | 2,429 | 10,809 | ||||||||||||||
ConforMIS Incorporated † | 12,843 | 10,007 | ||||||||||||||
CONMED Corporation | 5,095 | 482,191 | ||||||||||||||
CryoLife Incorporated † | 6,036 | 154,703 | ||||||||||||||
Cryoport Incorporated † | 6,727 | 112,341 | ||||||||||||||
Cutera Incorporated † | 2,438 | 60,414 | ||||||||||||||
Endologix Incorporated † | 3,031 | 3,789 | ||||||||||||||
Envista Holdings Corporation † | 5,335 | 135,402 | ||||||||||||||
The accompanying notes are an integral part of these financial statements.
146 | Wells Fargo Funds
Table of Contents
Portfolio of investments—February 29, 2020
FACTOR ENHANCED SMALL CAP PORTFOLIO
| Shares | Value | |||||||||||||||
| Health Care Equipment & Supplies (continued) | ||||||||||||||||
Fonar Corporation † | 1,114 | $ | 22,258 | |||||||||||||
Genmark Diagnostics Incorporated † | 9,296 | 32,443 | ||||||||||||||
Heska Corporation † | 1,310 | 125,066 | ||||||||||||||
Inogen Incorporated † | 3,926 | 179,732 | ||||||||||||||
Integer Holdings Corporation † | 5,401 | 487,008 | ||||||||||||||
Intricon Corporation † | 1,438 | 21,397 | ||||||||||||||
Invacare Corporation | 5,216 | 39,537 | ||||||||||||||
IRadimed Corporation † | 833 | 19,775 | ||||||||||||||
Lantheus Holdings Incorporated † | 6,789 | 105,569 | ||||||||||||||
LeMaitre Vascular Incorporated | 2,888 | 82,308 | ||||||||||||||
Meridian Bioscience Incorporated † | 6,958 | 55,594 | ||||||||||||||
Merit Medical Systems Incorporated † | 8,925 | 321,389 | ||||||||||||||
Mesa Laboratories Incorporated | 664 | 158,889 | ||||||||||||||
Misonix Incorporated † | 2,811 | 38,932 | ||||||||||||||
Natus Medical Incorporated † | 5,901 | 158,619 | ||||||||||||||
Neuronetics Incorporated † | 2,088 | 6,045 | ||||||||||||||
Nevro Corporation † | 5,419 | 705,283 | ||||||||||||||
Nuvectra Corporation † | 3,897 | 351 | ||||||||||||||
OraSure Technologies Incorporated † | 10,821 | 65,251 | ||||||||||||||
Orthofix Medical Incorporated † | 3,277 | 115,809 | ||||||||||||||
Orthopediatrics Corporation † | 1,420 | 65,916 | ||||||||||||||
Oxford Immunotec Global plc † | 4,547 | 59,929 | ||||||||||||||
Quidel Corporation † | 6,197 | 478,656 | ||||||||||||||
Repro Med Systems Incorporated † | 3,460 | 28,026 | ||||||||||||||
Rockwell Medical Incorporated † | 10,373 | 29,148 | ||||||||||||||
RTI Biologics Incorporated † | 9,649 | 35,701 | ||||||||||||||
Seaspine Holdings Corporation † | 3,269 | 46,191 | ||||||||||||||
SI-BONE Incorporated † | 2,585 | 49,916 | ||||||||||||||
SmileDirectClub Incorporated † | 13,063 | 97,711 | ||||||||||||||
STAAR Surgical Company † | 7,535 | 236,448 | ||||||||||||||
Stereotaxis Incorporated † | 6,176 | 22,542 | ||||||||||||||
Surmodics Incorporated † | 2,376 | 82,946 | ||||||||||||||
Tactile Systems Technology Class I † | 3,060 | 154,255 | ||||||||||||||
TransMedics Group Incorporated † | 1,429 | 22,435 | ||||||||||||||
Utah Medical Products Incorporated | 616 | 53,838 | ||||||||||||||
Vapotherm Incorporated † | 2,422 | 20,975 | ||||||||||||||
Varex Imaging Corporation † | 6,422 | 149,119 | ||||||||||||||
Zynex Incorporated † | 3,313 | 43,135 | ||||||||||||||
| 7,077,673 | ||||||||||||||||
|
| |||||||||||||||
| Health Care Providers & Services: 2.70% | ||||||||||||||||
Addus Homecare Corporation † | 2,402 | 183,201 | ||||||||||||||
American Renal Associates Holdings † | 2,133 | 17,171 | ||||||||||||||
AMN Healthcare Services Incorporated † | 8,086 | 595,130 | ||||||||||||||
Apollo Medical Holdings Incorporated † | 1,891 | 33,036 | ||||||||||||||
Brookdale Senior Living Incorporated † | 33,536 | 220,332 | ||||||||||||||
Capital Senior Living Corporation † | 4,203 | 10,760 | ||||||||||||||
Catasys Incorporated † | 1,134 | 17,146 | ||||||||||||||
Community Health Systems Incorporated † | 18,561 | 91,506 | ||||||||||||||
CorVel Corporation † | 1,678 | 115,681 | ||||||||||||||
Covetrus Incorporated † | 17,584 | 195,358 | ||||||||||||||
Cross Country Healthcare Incorporated † | 6,707 | 63,582 | ||||||||||||||
Ensign Group Incorporated | 8,960 | 398,720 | ||||||||||||||
Enzo Biochem Incorporated † | 7,642 | 16,277 | ||||||||||||||
Five Star Senior Living Incorporated † | 2,776 | 13,158 | ||||||||||||||
The accompanying notes are an integral part of these financial statements.
Wells Fargo Funds | 147
Table of Contents
Portfolio of investments—February 29, 2020
FACTOR ENHANCED SMALL CAP PORTFOLIO
| Shares | Value | |||||||||||||||
| Health Care Providers & Services (continued) | ||||||||||||||||
Fulgent Genetics Incorporated † | 1,217 | $ | 18,060 | |||||||||||||
Genesis Healthcare Incorporated † | 11,286 | 18,622 | ||||||||||||||
Hanger Incorporated † | 6,149 | 141,857 | ||||||||||||||
InfuSystem Holdings Incorporated † | 2,461 | 26,087 | ||||||||||||||
LHC Group Incorporated † | 5,144 | 624,790 | ||||||||||||||
Magellan Health Services Incorporated † | 3,861 | 231,699 | ||||||||||||||
MEDNAX Incorporated † | 13,354 | 228,220 | ||||||||||||||
National Healthcare Corporation | 2,090 | 155,099 | ||||||||||||||
National Research Corporation Class A | 2,313 | 127,192 | ||||||||||||||
Option Care Health Incorporated † | 5,156 | 76,051 | ||||||||||||||
Owens & Minor Incorporated | 11,160 | 76,223 | ||||||||||||||
Patterson Companies Incorporated | 12,524 | 297,946 | ||||||||||||||
PetIQ Incorporated † | 3,193 | 99,302 | ||||||||||||||
Premier Incorporated Class A † | 10,126 | 298,008 | ||||||||||||||
Providence Service Corporation † | 2,054 | 126,896 | ||||||||||||||
R1 RCM Incorporated † | 16,626 | 204,167 | ||||||||||||||
RadNet Incorporated † | 7,192 | 146,933 | ||||||||||||||
Select Medical Holdings Corporation † | 18,488 | 442,603 | ||||||||||||||
Tenet Healthcare Corporation † | 15,877 | 417,248 | ||||||||||||||
The Joint Corporation † | 2,652 | 39,329 | ||||||||||||||
The Pennant Group Incorporated † | 3,196 | 86,835 | ||||||||||||||
Tivity Health Incorporated † | 8,765 | 111,053 | ||||||||||||||
U.S. Physical Therapy Incorporated | 2,211 | 230,430 | ||||||||||||||
| 6,195,708 | ||||||||||||||||
|
| |||||||||||||||
| Health Care Technology: 0.98% | ||||||||||||||||
Allscripts Healthcare Solutions Incorporated † | 31,986 | 241,174 | ||||||||||||||
Castlight Health Incorporated Class B † | 18,564 | 16,825 | ||||||||||||||
Computer Programs & Systems Incorporated | 2,092 | 56,024 | ||||||||||||||
Health Catalyst Incorporated † | 1,705 | 51,798 | ||||||||||||||
HealthStream Incorporated † | 4,812 | 117,028 | ||||||||||||||
HMS Holdings Corporation † | 15,745 | 361,663 | ||||||||||||||
iCAD Incorporated † | 2,952 | 39,321 | ||||||||||||||
Inovalon Holdings Incorporated Class A † | 11,852 | 230,877 | ||||||||||||||
Inspire Medical Systems Incorporated † | 3,183 | 273,324 | ||||||||||||||
NextGen Healthcare Incorporated † | 9,684 | 126,667 | ||||||||||||||
Omnicell Incorporated † | 7,228 | 588,865 | ||||||||||||||
OptimizeRx Corporation † | 2,279 | 19,030 | ||||||||||||||
Phreesia Incorporated † | 1,619 | 50,254 | ||||||||||||||
Simulations Plus Incorporated | 2,171 | 70,688 | ||||||||||||||
| 2,243,538 | ||||||||||||||||
|
| |||||||||||||||
| Life Sciences Tools & Services: 0.71% | ||||||||||||||||
10x Genomics Incorporated Class A † | 2,114 | 168,486 | ||||||||||||||
Chromadex Corporation † | 6,510 | 24,022 | ||||||||||||||
Fluidigm Corporation † | 9,890 | 32,835 | ||||||||||||||
Harvard Bioscience Incorporated † | 5,580 | 18,079 | ||||||||||||||
Luminex Corporation | 7,134 | 176,638 | ||||||||||||||
Medpace Holdings Incorporated † | 4,556 | 409,767 | ||||||||||||||
Nanostring Technologies Incorporated † | 6,352 | 226,512 | ||||||||||||||
Neogenomics Incorporated † | 16,831 | 476,822 | ||||||||||||||
Personalis Incorporated † | 1,411 | 12,318 | ||||||||||||||
Quanterix Corporation † | 3,337 | 76,117 | ||||||||||||||
| 1,621,596 | ||||||||||||||||
|
| |||||||||||||||
The accompanying notes are an integral part of these financial statements.
148 | Wells Fargo Funds
Table of Contents
Portfolio of investments—February 29, 2020
FACTOR ENHANCED SMALL CAP PORTFOLIO
| Shares | Value | |||||||||||||||
| Pharmaceuticals: 1.40% | ||||||||||||||||
Akorn Incorporated † | 16,400 | $ | 19,024 | |||||||||||||
Amneal Pharmaceuticals Incorporated † | 15,749 | 60,634 | ||||||||||||||
Amphastar Pharmaceuticals Incorporated † | 6,297 | 96,911 | ||||||||||||||
ANI Pharmaceuticals Incorporated † | 1,657 | 79,553 | ||||||||||||||
Arvinas Incorporated † | 2,108 | 99,350 | ||||||||||||||
Assembly Biosciences Incorporated † | 2,629 | 47,637 | ||||||||||||||
Assertio Therapeutics Incorporated † | 8,194 | 8,850 | ||||||||||||||
Axsome Therapeutics Incorporated † | 3,789 | 295,542 | ||||||||||||||
Baudax Bio Incorporated † | 1,080 | 7,538 | ||||||||||||||
BioDelivery Sciences International Incorporated † | 15,897 | 77,259 | ||||||||||||||
Collegium Pharmaceutical Incorporated † | 5,917 | 140,529 | ||||||||||||||
Corcept Therapeutics Incorporated † | 17,350 | 218,957 | ||||||||||||||
Dova Pharmaceuticals Incorporated †(a) | 2,458 | 0 | ||||||||||||||
Durect Corporation † | 37,389 | 66,179 | ||||||||||||||
Endo International plc † | 37,907 | 209,247 | ||||||||||||||
Eyepoint Pharmaceuticals Incorporated † | 11,348 | 14,639 | ||||||||||||||
Harrow Health Incorporated † | 4,041 | 22,306 | ||||||||||||||
Innoviva Incorporated † | 10,882 | 146,581 | ||||||||||||||
Intersect ENT Incorporated † | 5,519 | 131,683 | ||||||||||||||
Lannett Company Incorporated † | 6,192 | 53,870 | ||||||||||||||
Mallinckrodt plc † | 15,127 | 64,744 | ||||||||||||||
Menlo Therapeutics Incorporated † | 2,192 | 6,466 | ||||||||||||||
Nabriva Therapeutics plc † | 13,361 | 18,037 | ||||||||||||||
Neos Therapeutics Incorporated † | 9,878 | 15,212 | ||||||||||||||
NGM Biopharmaceuticals Incorporated † | 2,740 | 49,430 | ||||||||||||||
Omeros Corporation † | 9,013 | 107,345 | ||||||||||||||
Optinose Incorporated † | 3,485 | 21,084 | ||||||||||||||
Pacira Pharmaceuticals Incorporated † | 7,425 | 322,097 | ||||||||||||||
Phibro Animal Health Corporation Class A | 3,556 | 89,789 | ||||||||||||||
Prestige Consumer Healthcare Incorporated † | 8,629 | 322,379 | ||||||||||||||
Provention Bio Incorporated † | 4,797 | 57,468 | ||||||||||||||
Recro Pharma Incorporated | 3,128 | 44,856 | ||||||||||||||
Relmada Therapeutics Incorporated † | 1,402 | 68,390 | ||||||||||||||
Siga Technologies Incorporated † | 10,036 | 50,130 | ||||||||||||||
Strongbridge Biopharma plc † | 7,079 | 19,609 | ||||||||||||||
Supernus Pharmaceuticals Incorporated † | 9,352 | 168,242 | ||||||||||||||
| 3,221,567 | ||||||||||||||||
|
| |||||||||||||||
| Industrials: 14.22% | ||||||||||||||||
| Aerospace & Defense: 0.91% | ||||||||||||||||
AAR Corporation | 5,856 | 202,325 | ||||||||||||||
Aerojet Rocketdyne Holdings † | 11,978 | 590,276 | ||||||||||||||
Astronics Corporation † | 4,291 | 86,979 | ||||||||||||||
Cubic Corporation | 5,005 | 272,472 | ||||||||||||||
Ducommun Incorporated † | 1,889 | 84,344 | ||||||||||||||
Maxar Technologies Incorporated | 9,325 | 141,833 | ||||||||||||||
Moog Incorporated Class A | 5,485 | 423,003 | ||||||||||||||
Park Aerospace Corporation | 3,289 | 45,750 | ||||||||||||||
Parsons Corporation † | 3,536 | 138,222 | ||||||||||||||
Vectrus Incorporated † | 2,034 | 105,951 | ||||||||||||||
| 2,091,155 | ||||||||||||||||
|
| |||||||||||||||
The accompanying notes are an integral part of these financial statements.
Wells Fargo Funds | 149
Table of Contents
Portfolio of investments—February 29, 2020
FACTOR ENHANCED SMALL CAP PORTFOLIO
| Shares | Value | |||||||||||||||
| Air Freight & Logistics: 0.43% |
| |||||||||||||||
Air Transport Services Group † | 10,984 | $ | 196,614 | |||||||||||||
Atlas Air Worldwide Holdings Incorporated † | 4,237 | 113,213 | ||||||||||||||
Echo Global Logistics Incorporated † | 4,748 | 87,601 | ||||||||||||||
Forward Air Corporation | 4,964 | 292,926 | ||||||||||||||
Hub Group Incorporated Class A † | 5,770 | 266,747 | ||||||||||||||
Radiant Logistics Incorporated † | 5,843 | 25,709 | ||||||||||||||
| 982,810 | ||||||||||||||||
|
| |||||||||||||||
| Airlines: 0.39% | ||||||||||||||||
Allegiant Travel Company | 2,295 | 311,064 | ||||||||||||||
Hawaiian Holdings Incorporated | 8,126 | 169,671 | ||||||||||||||
Mesa Air Group Incorporated † | 4,002 | 23,092 | ||||||||||||||
SkyWest Incorporated | 8,685 | 394,299 | ||||||||||||||
| 898,126 | ||||||||||||||||
|
| |||||||||||||||
| Building Products: 1.47% | ||||||||||||||||
American Woodmark Corporation † | 2,668 | 223,498 | ||||||||||||||
Apogee Enterprises Incorporated | 4,344 | 131,145 | ||||||||||||||
Armstrong Flooring Incorporated † | 3,474 | 9,171 | ||||||||||||||
Builders FirstSource Incorporated † | 19,913 | 452,224 | ||||||||||||||
Cornerstone Building Brands Incorporated † | 8,611 | 63,291 | ||||||||||||||
CSW Industrials Incorporated | 2,523 | 166,114 | ||||||||||||||
Gibraltar Industries Incorporated † | 5,533 | 280,357 | ||||||||||||||
Griffon Corporation | 7,556 | 131,474 | ||||||||||||||
JELD-WEN Holding Incorporated † | 11,272 | 211,914 | ||||||||||||||
Patrick Industries Incorporated | 3,645 | 192,565 | ||||||||||||||
PGT Incorporated † | 9,692 | 147,028 | ||||||||||||||
Quanex Building Products Corporation | 5,817 | 97,726 | ||||||||||||||
Resideo Technologies Incorporated † | 17,867 | 192,070 | ||||||||||||||
Simpson Manufacturing Company Incorporated | 7,260 | 576,662 | ||||||||||||||
Universal Forest Products Incorporated | 10,526 | 493,248 | ||||||||||||||
| 3,368,487 | ||||||||||||||||
|
| |||||||||||||||
| Commercial Services & Supplies: 2.45% | ||||||||||||||||
ABM Industries Incorporated | 11,801 | 388,489 | ||||||||||||||
ACCO Brands Corporation | 16,671 | 133,535 | ||||||||||||||
Advanced Disposal Services Incorporated † | 12,285 | 406,142 | ||||||||||||||
Brady Corporation Class A | 8,448 | 399,928 | ||||||||||||||
BrightView Holdings Incorporated † | 5,361 | 75,054 | ||||||||||||||
Casella Waste Systems Incorporated Class A † | 7,863 | 380,962 | ||||||||||||||
Ceco Environmental Corporation † | 4,871 | 32,879 | ||||||||||||||
Covanta Holding Corporation | 20,503 | 273,920 | ||||||||||||||
Deluxe Corporation | 7,659 | 255,045 | ||||||||||||||
Ennis Incorporated | 4,409 | 88,621 | ||||||||||||||
Healthcare Services Group Incorporated | 12,931 | 356,120 | ||||||||||||||
Heritage Crystal Clean Incorporated † | 2,833 | 74,593 | ||||||||||||||
Herman Miller Incorporated | 10,577 | 362,156 | ||||||||||||||
HNI Corporation | 7,297 | 239,561 | ||||||||||||||
Interface Incorporated | 9,772 | 142,573 | ||||||||||||||
Kimball International Incorporated Class B | 6,435 | 104,118 | ||||||||||||||
Knoll Incorporated | 8,654 | 152,657 | ||||||||||||||
Matthews International Corporation Class A | 5,568 | 164,590 | ||||||||||||||
McGrath RentCorp | 4,198 | 291,551 | ||||||||||||||
Pitney Bowes Incorporated | 33,891 | 115,907 | ||||||||||||||
The accompanying notes are an integral part of these financial statements.
150 | Wells Fargo Funds
Table of Contents
Portfolio of investments—February 29, 2020
FACTOR ENHANCED SMALL CAP PORTFOLIO
| Shares | Value | |||||||||||||||
| Commercial Services & Supplies (continued) | ||||||||||||||||
Quad Graphics Incorporated | 5,386 | $ | 25,853 | |||||||||||||
RR Donnelley & Sons Company | 12,705 | 24,140 | ||||||||||||||
SP Plus Corporation † | 3,990 | 145,675 | ||||||||||||||
Steelcase Incorporated Class A | 14,327 | 232,384 | ||||||||||||||
TEAM Incorporated † | 5,296 | 67,418 | ||||||||||||||
UniFirst Corporation | 2,621 | 487,008 | ||||||||||||||
Viad Corporation | 3,290 | 165,158 | ||||||||||||||
VSE Corporation | 1,629 | 47,974 | ||||||||||||||
| 5,634,011 | ||||||||||||||||
|
| |||||||||||||||
| Construction & Engineering: 0.90% | ||||||||||||||||
Aegion Corporation † | 5,299 | 95,435 | ||||||||||||||
Ameresco Incorporated Class A † | 3,310 | 74,607 | ||||||||||||||
Arcosa Incorporated | 8,264 | 355,021 | ||||||||||||||
Comfort Systems Incorporated | 6,580 | 277,808 | ||||||||||||||
Construction Partners Incorporated Class A † | 3,752 | 63,822 | ||||||||||||||
Great Lakes Dredge & Dock Company † | 10,201 | 98,950 | ||||||||||||||
HC2 Holdings Incorporated † | 6,806 | 25,999 | ||||||||||||||
IES Holdings Incorporated † | 1,254 | 29,231 | ||||||||||||||
MYR Group Incorporated † | 2,950 | 75,255 | ||||||||||||||
Northwest Pipe Company † | 1,685 | 53,162 | ||||||||||||||
Nv5 Global Incorporated † | 1,703 | 91,162 | ||||||||||||||
Orion Marine Group Incorporated † | 4,957 | 19,481 | ||||||||||||||
Primoris Services Corporation | 7,705 | 146,241 | ||||||||||||||
Sterling Construction Company Incorporated † | 4,796 | 65,513 | ||||||||||||||
Valmont Industries Incorporated | 3,659 | 425,249 | ||||||||||||||
WillScot Corporation † | 10,338 | 181,329 | ||||||||||||||
| 2,078,265 | ||||||||||||||||
|
| |||||||||||||||
| Construction Materials: 0.01% | ||||||||||||||||
Alta Equipment Group Incorporated † | 2,594 | 22,853 | ||||||||||||||
|
| |||||||||||||||
| Electrical Equipment: 0.80% | ||||||||||||||||
Allied Motion Technologies | 1,308 | 50,410 | ||||||||||||||
American Superconductor Corporation † | 3,597 | 24,639 | ||||||||||||||
Atkore International Incorporated † | 8,037 | 296,646 | ||||||||||||||
AZZ Incorporated | 3,914 | 144,387 | ||||||||||||||
Babcock & Wilcox Enterprises Incorporated † | 4,450 | 18,468 | ||||||||||||||
Encore Wire Corporation | 3,573 | 174,970 | ||||||||||||||
Enphase Energy Incorporated † | 15,983 | 782,688 | ||||||||||||||
LSI Industries Incorporated | 3,913 | 25,982 | ||||||||||||||
Powell Industries Incorporated | 1,309 | 43,760 | ||||||||||||||
Preformed Line Products Company | 401 | 19,569 | ||||||||||||||
Thermon Group Holdings Incorporated † | 5,629 | 98,902 | ||||||||||||||
TPI Composites Incorporated † | 6,291 | 149,348 | ||||||||||||||
Ultralife Batteries Incorporated † | 1,615 | 11,434 | ||||||||||||||
| 1,841,203 | ||||||||||||||||
|
| |||||||||||||||
| Industrial Conglomerates: 0.08% | ||||||||||||||||
Raven Industries Incorporated | 6,206 | 178,174 | ||||||||||||||
|
| |||||||||||||||
| Machinery: 3.60% | ||||||||||||||||
Alamo Group Incorporated | 2,006 | 222,205 | ||||||||||||||
Albany International Corporation Class A | 5,497 | 352,193 | ||||||||||||||
Altra Industrial Motion Corporation | 10,543 | 317,555 | ||||||||||||||
The accompanying notes are an integral part of these financial statements.
Wells Fargo Funds | 151
Table of Contents
Portfolio of investments—February 29, 2020
FACTOR ENHANCED SMALL CAP PORTFOLIO
| Shares | Value | |||||||||||||||
| Machinery (continued) | ||||||||||||||||
Astec Industries Incorporated | 3,600 | $ | 135,180 | |||||||||||||
Blue Bird Corporation † | 2,637 | 47,150 | ||||||||||||||
Briggs & Stratton Corporation | 7,295 | 23,125 | ||||||||||||||
Columbus McKinnon Corporation | 4,135 | 128,557 | ||||||||||||||
Commercial Vehicle Group Incorporated † | 5,087 | 22,179 | ||||||||||||||
Douglas Dynamics Incorporated | 3,935 | 171,291 | ||||||||||||||
Eastern Company | 950 | 24,197 | ||||||||||||||
EnPro Industries Incorporated | 3,622 | 195,407 | ||||||||||||||
ESCO Technologies Incorporated | 4,367 | 397,048 | ||||||||||||||
Evoqua Water Technologies Company † | 12,025 | 252,164 | ||||||||||||||
Federal Signal Corporation | 10,579 | 306,791 | ||||||||||||||
Foster Company Class A † | 1,478 | 23,293 | ||||||||||||||
Franklin Electric Company Incorporated | 6,871 | 355,162 | ||||||||||||||
Gates Industrial Corporation plc † | 7,110 | 74,371 | ||||||||||||||
Gencor Industries Incorporated † | 1,575 | 15,829 | ||||||||||||||
Gorman Rupp Company | 3,025 | 96,770 | ||||||||||||||
Graham Corporation | 1,622 | 26,893 | ||||||||||||||
Hillenbrand Incorporated | 11,216 | 262,454 | ||||||||||||||
Hurco Companies Incorporated | 1,060 | 29,871 | ||||||||||||||
Hyster Yale Materials Handeling Incorporated | 1,649 | 79,383 | ||||||||||||||
Kadant Incorporated | 1,771 | 160,842 | ||||||||||||||
Lindsay Manufacturing Company | 1,829 | 181,126 | ||||||||||||||
Lydall Incorporated † | 2,650 | 31,562 | ||||||||||||||
Manitex International Incorporated † | 2,527 | 14,000 | ||||||||||||||
Meritor Incorporated † | 14,545 | 330,026 | ||||||||||||||
Miller Industries Incorporated | 1,936 | 57,519 | ||||||||||||||
Mueller Industries Incorporated | 9,471 | 264,999 | ||||||||||||||
Mueller Water Products Incorporated Class A | 26,245 | 287,383 | ||||||||||||||
Navistar International Corporation † | 8,698 | 315,824 | ||||||||||||||
Omega Flex Incorporated | 501 | 39,228 | ||||||||||||||
Park Ohio Holdings Corporation | 1,375 | 33,715 | ||||||||||||||
REV Group Incorporated | 4,491 | 35,165 | ||||||||||||||
Spartan Motors Incorporated | 5,548 | 81,833 | ||||||||||||||
SPX Corporation † | 7,118 | 298,458 | ||||||||||||||
SPX FLOW Incorporated † | 7,193 | 264,559 | ||||||||||||||
Standex International Corporation | 2,081 | 131,998 | ||||||||||||||
Tennant Company | 2,826 | 202,172 | ||||||||||||||
Terex Corporation | 11,115 | 244,641 | ||||||||||||||
The ExOne Company † | 2,035 | 12,414 | ||||||||||||||
The Greenbrier Companies Incorporated | 5,257 | 127,377 | ||||||||||||||
The Timken Company | 11,132 | 499,159 | ||||||||||||||
Titan International Incorporated | 7,786 | 17,285 | ||||||||||||||
Trimas Corporation † | 7,794 | 197,578 | ||||||||||||||
Twin Disc Incorporated † | 2,106 | 16,974 | ||||||||||||||
Wabash National Corporation | 9,280 | 101,894 | ||||||||||||||
Watts Water Technologies Incorporated | 4,752 | 446,260 | ||||||||||||||
Welbilt Incorporated † | 23,734 | 313,763 | ||||||||||||||
| 8,266,822 | ||||||||||||||||
|
| |||||||||||||||
| Marine: 0.13% | ||||||||||||||||
Eagle Bulk Shipping Incorporated † | 9,117 | 30,268 | ||||||||||||||
Genco Shipping & Trading Limited | 2,799 | 21,496 | ||||||||||||||
Matson Incorporated | 7,578 | 251,665 | ||||||||||||||
| 303,429 | ||||||||||||||||
|
| |||||||||||||||
The accompanying notes are an integral part of these financial statements.
152 | Wells Fargo Funds
Table of Contents
Portfolio of investments—February 29, 2020
FACTOR ENHANCED SMALL CAP PORTFOLIO
| Shares | Value | |||||||||||||||
| Professional Services: 0.87% | ||||||||||||||||
Barrett Business Services Incorporated | 1,244 | $ | 74,516 | |||||||||||||
BG Staffing Incorporated | 1,698 | 26,183 | ||||||||||||||
CBIZ Incorporated † | 9,260 | 241,130 | ||||||||||||||
CRA International Incorporated | 1,247 | 57,998 | ||||||||||||||
Forrester Research Incorporated † | 1,776 | 64,043 | ||||||||||||||
Franklin Covey Company † | 1,745 | 54,880 | ||||||||||||||
GP Strategies Corporation † | 2,123 | 23,608 | ||||||||||||||
Heidrick & Struggles International Incorporated | 3,254 | 72,564 | ||||||||||||||
Hill International Incorporated † | 7,067 | 22,261 | ||||||||||||||
Huron Consulting Group Incorporated † | 3,838 | 227,747 | ||||||||||||||
ICF International Incorporated | 3,175 | 241,237 | ||||||||||||||
InnerWorkings Incorporated † | 7,298 | 22,916 | ||||||||||||||
Kelly Services Incorporated Class A | 5,867 | 97,451 | ||||||||||||||
Kforce Incorporated | 3,936 | 119,891 | ||||||||||||||
Mistras Group Incorporated † | 2,947 | 23,134 | ||||||||||||||
Resources Connection Incorporated | 5,236 | 65,607 | ||||||||||||||
TriNet Group Incorporated † | 7,574 | 400,362 | ||||||||||||||
TrueBlue Incorporated † | 6,826 | 101,571 | ||||||||||||||
Willdan Group Incorporated † | 1,793 | 55,135 | ||||||||||||||
| 1,992,234 | ||||||||||||||||
|
| |||||||||||||||
| Road & Rail: 0.58% | ||||||||||||||||
Arcbest Corporation | 4,397 | 87,105 | ||||||||||||||
Covenant Transport Incorporated Class A † | 2,169 | 26,245 | ||||||||||||||
Daseke Incorporated † | 7,014 | 23,146 | ||||||||||||||
Heartland Express Incorporated | 8,177 | 146,450 | ||||||||||||||
Marten Transport Limited | 6,816 | 133,185 | ||||||||||||||
P.A.M. Transportation Services Incorporated † | 263 | 10,417 | ||||||||||||||
Saia Incorporated † | 4,495 | 392,458 | ||||||||||||||
Schneider National Incorporated Class B | 10,163 | 182,019 | ||||||||||||||
Universal Truckload Services | 2,121 | 32,685 | ||||||||||||||
US Xpress Enterprises Incorporated Class A † | 3,629 | 15,641 | ||||||||||||||
USA Truck Incorporated † | 1,353 | 6,785 | ||||||||||||||
Werner Enterprises Incorporated | 7,617 | 255,931 | ||||||||||||||
YRC Worldwide Incorporated † | 7,494 | 15,887 | ||||||||||||||
| 1,327,954 | ||||||||||||||||
|
| |||||||||||||||
| Trading Companies & Distributors: 1.60% | ||||||||||||||||
Aircastle Limited | 9,125 | 290,631 | ||||||||||||||
Applied Industrial Technologies Incorporated | 6,484 | 382,491 | ||||||||||||||
Beacon Roofing Supply Incorporated † | 11,045 | 328,037 | ||||||||||||||
Bluelinx Holdings Incorporated † | 1,419 | 16,673 | ||||||||||||||
BMC Stock Holdings Incorporated † | 11,651 | 285,799 | ||||||||||||||
CAI International Incorporated † | 2,660 | 65,808 | ||||||||||||||
DXP Enterprises Incorporated † | 2,768 | 78,584 | ||||||||||||||
EVI Industries Incorporated † | 654 | 14,434 | ||||||||||||||
Foundation Building Material † | 3,844 | 59,966 | ||||||||||||||
General Finance Corporation † | 2,531 | 19,716 | ||||||||||||||
GMS Incorporated † | 8,063 | 184,240 | ||||||||||||||
H&E Equipment Services Incorporated | 5,605 | 133,175 | ||||||||||||||
Houston Wire & Cable Company † | 2,722 | 8,738 | ||||||||||||||
Kaman Corporation | 4,582 | 254,118 | ||||||||||||||
Lawson Products Incorporated † | 754 | 30,160 | ||||||||||||||
NOW Incorporated † | 18,434 | 162,772 | ||||||||||||||
Rush Enterprises Incorporated | 4,561 | 191,197 | ||||||||||||||
The accompanying notes are an integral part of these financial statements.
Wells Fargo Funds | 153
Table of Contents
Portfolio of investments—February 29, 2020
FACTOR ENHANCED SMALL CAP PORTFOLIO
| Shares | Value | |||||||||||||||
| Trading Companies & Distributors (continued) | ||||||||||||||||
SiteOne Landscape Supply Incorporated † | 7,215 | $ | 716,089 | |||||||||||||
Systemax Incorporated | 2,331 | 48,625 | ||||||||||||||
Titan Machinery Incorporated † | 3,206 | 32,413 | ||||||||||||||
Transcat Incorporated † | 1,205 | 34,812 | ||||||||||||||
Veritiv Corporation † | 2,442 | 29,402 | ||||||||||||||
WESCO International Incorporated † | 6,771 | 274,699 | ||||||||||||||
Willis Lease Finance Corporation † | 450 | 25,515 | ||||||||||||||
| 3,668,094 | ||||||||||||||||
|
| |||||||||||||||
| Information Technology: 12.44% | ||||||||||||||||
| Communications Equipment: 1.28% | ||||||||||||||||
Acacia Communications Incorporated † | 6,374 | 436,683 | ||||||||||||||
ADTRAN Incorporated | 8,281 | 66,621 | ||||||||||||||
Calamp Corporation † | 5,386 | 51,813 | ||||||||||||||
Calix Networks Incorporated † | 7,999 | 71,991 | ||||||||||||||
Casa Systems Incorporated † | 4,784 | 15,692 | ||||||||||||||
Clearfield Incorporated † | 1,960 | 21,011 | ||||||||||||||
CommScope Holdings Incorporated † | 33,355 | 367,239 | ||||||||||||||
Comtech Telecommunications Corporation | 4,508 | 126,314 | ||||||||||||||
Dasan Zhone Solutions Incorporated † | 2,084 | 15,901 | ||||||||||||||
Digi International Incorporated † | 4,998 | 66,174 | ||||||||||||||
Echostar Corporation | 8,931 | 311,871 | ||||||||||||||
Emcore Corporation † | 4,685 | 13,914 | ||||||||||||||
Extreme Networks Incorporated † | 21,641 | 108,854 | ||||||||||||||
Genasys Incorporated † | 5,739 | 17,217 | ||||||||||||||
Harmonic Incorporated † | 14,018 | 86,071 | ||||||||||||||
Infinera Corporation † | 30,646 | 208,393 | ||||||||||||||
Inseego Corporation † | 6,642 | 46,095 | ||||||||||||||
KVH Industries Incorporated † | 2,722 | 28,363 | ||||||||||||||
NETGEAR Incorporated † | 5,326 | 100,502 | ||||||||||||||
NetScout Systems Incorporated † | 13,380 | 343,866 | ||||||||||||||
PCTEL Incorporated | 3,078 | 21,608 | ||||||||||||||
Plantronics Incorporated | 5,878 | 80,705 | ||||||||||||||
Ribbon Communications Incorporated † | 10,206 | 32,965 | ||||||||||||||
Tessco Technologies Incorporated | 1,118 | 6,697 | ||||||||||||||
Ubiquiti Incorporated | 2,179 | 295,603 | ||||||||||||||
| 2,942,163 | ||||||||||||||||
|
| |||||||||||||||
| Electronic Equipment, Instruments & Components: 2.01% | ||||||||||||||||
Airgain Incorporated † | 1,435 | 11,322 | ||||||||||||||
Anixter International Incorporated † | 4,960 | 483,650 | ||||||||||||||
Badger Meter Incorporated | 4,944 | 297,678 | ||||||||||||||
Bel Fuse Incorporated Class B | 1,425 | 16,302 | ||||||||||||||
Benchmark Electronics Incorporated | 6,348 | 172,539 | ||||||||||||||
CTS Corporation | 5,372 | 140,048 | ||||||||||||||
Daktronics Incorporated | 6,516 | 32,059 | ||||||||||||||
ePlus Incorporated † | 2,322 | 175,915 | ||||||||||||||
Insight Enterprises Incorporated † | 6,003 | 330,705 | ||||||||||||||
Iteris Incorporated † | 6,588 | 31,820 | ||||||||||||||
Itron Incorporated † | 6,161 | 467,250 | ||||||||||||||
Kemet Corporation | 9,479 | 247,212 | ||||||||||||||
Kimball Electronics Incorporated † | 4,268 | 57,831 | ||||||||||||||
Luna Innovations Incorporated † | 4,002 | 26,813 | ||||||||||||||
Methode Electronics Incorporated | 5,766 | 176,786 | ||||||||||||||
The accompanying notes are an integral part of these financial statements.
154 | Wells Fargo Funds
Table of Contents
Portfolio of investments—February 29, 2020
FACTOR ENHANCED SMALL CAP PORTFOLIO
| Shares | Value | |||||||||||||||
| Electronic Equipment, Instruments & Components (continued) | ||||||||||||||||
MTS Systems Corporation | 3,206 | $ | 128,689 | |||||||||||||
Napco Security Technologies Incorporated † | 2,110 | 42,917 | ||||||||||||||
OSI Systems Incorporated † | 3,002 | 243,973 | ||||||||||||||
Par Technology Corporation † | 2,083 | 55,179 | ||||||||||||||
PC Connection Incorporated | 1,780 | 72,393 | ||||||||||||||
Plexus Corporation † | 4,871 | 323,191 | ||||||||||||||
Sanmina Corporation † | 11,407 | 299,890 | ||||||||||||||
ScanSource Incorporated † | 4,109 | 116,819 | ||||||||||||||
TTM Technologies Incorporated † | 16,682 | 216,699 | ||||||||||||||
Vishay Intertechnology Incorporated | 21,689 | 405,584 | ||||||||||||||
Vishay Precision Group † | 1,832 | 50,325 | ||||||||||||||
| 4,623,589 | ||||||||||||||||
|
| |||||||||||||||
| IT Services: 1.58% | ||||||||||||||||
Brightcove Incorporated † | 6,724 | 52,313 | ||||||||||||||
Cardtronics Incorporated Class A † | 6,815 | 247,180 | ||||||||||||||
Cass Information Systems Incorporated | 2,359 | 110,755 | ||||||||||||||
CSG Systems International Incorporated | 5,994 | 265,235 | ||||||||||||||
EVO Payments Incorporated Class A † | 6,837 | 172,839 | ||||||||||||||
ExlService Holdings Incorporated † | 5,842 | 436,105 | ||||||||||||||
GreenSky Incorporated Class A † | 9,713 | 77,510 | ||||||||||||||
Hackett Group Incorporated | 4,286 | 66,004 | ||||||||||||||
I3 Verticals Incorporated Class A † | 1,778 | 51,526 | ||||||||||||||
Information Services Group Incorporated † | 6,871 | 21,781 | ||||||||||||||
International Money Express † | 3,823 | 36,013 | ||||||||||||||
ManTech International Corporation Class A | 4,741 | 355,101 | ||||||||||||||
Moneygram International Incorporated † | 6,762 | 14,606 | ||||||||||||||
NIC Incorporated | 11,779 | 215,438 | ||||||||||||||
PaySign Incorporated † | 3,782 | 30,369 | ||||||||||||||
Perficient Incorporated † | 5,378 | 220,337 | ||||||||||||||
PRGX Global Incorporated † | 3,511 | 12,675 | ||||||||||||||
ServiceSource International Incorporated † | 14,120 | 19,909 | ||||||||||||||
StarTek Incorporated † | 2,144 | 13,357 | ||||||||||||||
Switch Incorporated Class A | 12,755 | 182,907 | ||||||||||||||
Sykes Enterprises Incorporated † | 6,711 | 212,604 | ||||||||||||||
TTEC Holdings Incorporated | 3,104 | 116,183 | ||||||||||||||
Unisys Corporation † | 10,478 | 162,723 | ||||||||||||||
Verra Mobility Corporation † | 20,553 | 311,275 | ||||||||||||||
Virtusa Corporation † | 4,840 | 213,492 | ||||||||||||||
| 3,618,237 | ||||||||||||||||
|
| |||||||||||||||
| Semiconductors & Semiconductor Equipment: 1.92% | ||||||||||||||||
Acm Research Incorporated Class A † | 1,463 | 51,132 | ||||||||||||||
Adesto Technologies Corporation † | 4,347 | 53,294 | ||||||||||||||
Advanced Energy Industries Incorporated † | 6,051 | 359,883 | ||||||||||||||
Alpha & Omega Semiconductor † | 3,118 | 33,799 | ||||||||||||||
Amkor Technology Incorporated † | 10,138 | 105,790 | ||||||||||||||
Axcelis Technologies Incorporated † | 4,971 | 119,254 | ||||||||||||||
AXT Incorporated † | 5,645 | 19,645 | ||||||||||||||
Cirrus Logic Incorporated † | 9,463 | 649,540 | ||||||||||||||
Cyberoptics Corporation † | 1,150 | 24,426 | ||||||||||||||
Diodes Incorporated † | 6,399 | 281,620 | ||||||||||||||
DSP Group Incorporated † | 3,221 | 43,838 | ||||||||||||||
Everspin Technologies Incorporated † | 2,261 | 8,366 | ||||||||||||||
FormFactor Incorporated † | 11,956 | 267,456 | ||||||||||||||
The accompanying notes are an integral part of these financial statements.
Wells Fargo Funds | 155
Table of Contents
Portfolio of investments—February 29, 2020
FACTOR ENHANCED SMALL CAP PORTFOLIO
| Shares | Value | |||||||||||||||
| Semiconductors & Semiconductor Equipment (continued) | ||||||||||||||||
GSI Technology Incorporated † | 2,920 | $ | 19,447 | |||||||||||||
Ichor Holdings Limited † | 3,670 | 106,136 | ||||||||||||||
Lattice Semiconductor Corporation † | 21,239 | 381,240 | ||||||||||||||
NVE Corporation | 796 | 50,363 | ||||||||||||||
Onto Innovation Incorporated † | 8,261 | 252,539 | ||||||||||||||
PDF Solutions Incorporated † | 4,659 | 68,208 | ||||||||||||||
Photronics Incorporated † | 8,327 | 103,671 | ||||||||||||||
Pixelworks Incorporated † | 6,056 | 25,799 | ||||||||||||||
Power Integrations Incorporated | 4,789 | 416,882 | ||||||||||||||
Rambus Incorporated † | 18,717 | 261,664 | ||||||||||||||
Smart Global Holdings Incorporated † | 2,195 | 58,914 | ||||||||||||||
Synaptics Incorporated † | 5,517 | 364,398 | ||||||||||||||
Ultra Clean Holdings Incorporated † | 6,108 | 127,718 | ||||||||||||||
Xperi Corporation | 8,414 | 144,637 | ||||||||||||||
| 4,399,659 | ||||||||||||||||
|
| |||||||||||||||
| Software: 5.58% | ||||||||||||||||
A10 Networks Incorporated † | 8,911 | 59,793 | ||||||||||||||
Agilysys Incorporated † | 3,683 | 118,335 | ||||||||||||||
Alarm.com Holdings Incorporated † | 6,566 | 316,810 | ||||||||||||||
Altair Engineering Incorporated Class A † | 6,167 | 214,612 | ||||||||||||||
American Software Incorporated Class A | 5,253 | 86,412 | ||||||||||||||
AppFolio Incorporated Class A † | 2,913 | 358,212 | ||||||||||||||
Appian Corporation † | 6,036 | 266,489 | ||||||||||||||
Asure Software Incorporated † | 2,236 | 18,849 | ||||||||||||||
Avaya Holdings Corporation † | 22,118 | 286,649 | ||||||||||||||
Cerence Incorporated † | 6,696 | 145,370 | ||||||||||||||
ChannelAdvisor Corporation † | 4,657 | 44,335 | ||||||||||||||
Cloudflare Incorporated Class A † | 13,533 | 288,253 | ||||||||||||||
CommVault Systems Incorporated † | 8,090 | 337,353 | ||||||||||||||
Crowdstrike Holdings Incorporated Class A † | 4,472 | 266,710 | ||||||||||||||
Datadog Incorporated Class A † | 5,230 | 236,135 | ||||||||||||||
Digimarc Corporation † | 1,894 | 37,880 | ||||||||||||||
Digital Turbine Incorporated † | 13,859 | 84,956 | ||||||||||||||
Domo Incorporated Class B † | 3,280 | 69,175 | ||||||||||||||
Ebix Incorporated | 4,322 | 114,274 | ||||||||||||||
Egain Corporation † | 3,402 | 27,488 | ||||||||||||||
Envestnet Incorporated † | 8,782 | 662,865 | ||||||||||||||
Five9 Incorporated † | 10,900 | 796,027 | ||||||||||||||
GlobalSCAPE Incorporated | 2,063 | 18,093 | ||||||||||||||
GTY Technology Holdings Incorporated † | 6,056 | 32,581 | ||||||||||||||
Instructure Incorporated † | 6,624 | 322,986 | ||||||||||||||
Intelligent Systems Corporation † | 579 | 21,232 | ||||||||||||||
LivePerson Incorporated † | 11,438 | 302,649 | ||||||||||||||
MicroStrategy Incorporated Class A † | 1,474 | 199,226 | ||||||||||||||
Mitek Systems Incorporated † | 6,607 | 57,547 | ||||||||||||||
MobileIron Incorporated † | 17,249 | 69,858 | ||||||||||||||
Model N Incorporated † | 4,645 | 134,705 | ||||||||||||||
OneSpan Incorporated † | 6,207 | 102,478 | ||||||||||||||
Park City Group Incorporated † | 2,196 | 11,287 | ||||||||||||||
Paylocity Holding Corporation † | 6,243 | 808,593 | ||||||||||||||
Pegasystems Incorporated | 6,996 | 633,138 | ||||||||||||||
Ping Identity Holding Corporation † | 2,698 | 62,432 | ||||||||||||||
Progress Software Corporation | 7,906 | 294,815 | ||||||||||||||
PROS Holdings Incorporated † | 6,688 | 306,244 | ||||||||||||||
The accompanying notes are an integral part of these financial statements.
156 | Wells Fargo Funds
Table of Contents
Portfolio of investments—February 29, 2020
FACTOR ENHANCED SMALL CAP PORTFOLIO
| Shares | Value | |||||||||||||||
| Software (continued) | ||||||||||||||||
Q2 Holdings Incorporated † | 8,331 | $ | 627,907 | |||||||||||||
Qad Incorporated Class A | 2,131 | 104,526 | ||||||||||||||
Qualys Incorporated † | 5,998 | 480,920 | ||||||||||||||
Rosetta Stone Incorporated † | 3,488 | 60,238 | ||||||||||||||
Seachange International Incorporated † | 4,041 | 14,790 | ||||||||||||||
Secureworks Corporation Class A † | 1,043 | 14,487 | ||||||||||||||
SharpSpring Incorporated † | 2,026 | 23,096 | ||||||||||||||
Shotspotter Incorporated † | 1,187 | 42,257 | ||||||||||||||
Smith Micro Software Incorporated † | 5,022 | 26,918 | ||||||||||||||
SPS Commerce Incorporated † | 6,176 | 324,858 | ||||||||||||||
SVMK Incorporated † | 17,935 | 326,955 | ||||||||||||||
Synchronoss Technologies Incorporated † | 7,422 | 36,516 | ||||||||||||||
Telaria Incorporated † | 7,043 | 86,065 | ||||||||||||||
TeleNav Incorporated † | 6,746 | 40,240 | ||||||||||||||
Tivo Corporation | 19,875 | 150,454 | ||||||||||||||
Upland Software Incorporated † | 3,992 | 155,329 | ||||||||||||||
Varonis Systems Incorporated † | 5,361 | 430,059 | ||||||||||||||
Workiva Incorporated † | 5,843 | 249,730 | ||||||||||||||
Yext Incorporated † | 18,988 | 287,858 | ||||||||||||||
Zix Corporation † | 10,666 | 84,048 | ||||||||||||||
Zoom Video Communications Incorporated † | 9,846 | 1,033,799 | ||||||||||||||
| 12,815,896 | ||||||||||||||||
|
| |||||||||||||||
| Technology Hardware, Storage & Peripherals: 0.07% | ||||||||||||||||
Astronova Incorporated | 1,288 | 13,988 | ||||||||||||||
Avid Technology Incorporated † | 6,252 | 46,202 | ||||||||||||||
Diebold Nixdorf Incorporated † | 10,208 | 71,660 | ||||||||||||||
Intevac Incorporated † | 3,586 | 20,082 | ||||||||||||||
Transact Technologies Incorporated | 1,135 | 11,327 | ||||||||||||||
| 163,259 | ||||||||||||||||
|
| |||||||||||||||
| Materials: 3.91% | ||||||||||||||||
| Chemicals: 1.99% | ||||||||||||||||
Advanced Emissions Solutions | 2,812 | 24,999 | ||||||||||||||
Advansix Incorporated † | 4,866 | 70,703 | ||||||||||||||
Agrofresh Solutions Incorporated † | 4,955 | 10,851 | ||||||||||||||
American Vanguard Corporation | 4,426 | 67,497 | ||||||||||||||
Balchem Corporation | 5,491 | 518,680 | ||||||||||||||
Cabot Corporation | 8,849 | 330,776 | ||||||||||||||
Chase Corporation | 1,174 | 104,239 | ||||||||||||||
Flotek Industries Incorporated † | 8,833 | 13,956 | ||||||||||||||
Futurefuel Corporation | 4,414 | 44,890 | ||||||||||||||
GCP Applied Technologies Incorporated † | 10,429 | 203,053 | ||||||||||||||
Hawkins Incorporated | 1,547 | 55,305 | ||||||||||||||
HB Fuller Company | 8,614 | 337,927 | ||||||||||||||
Innospec Incorporated | 4,177 | 361,478 | ||||||||||||||
Intrepid Potash Incorporated Intrepid Potash Inc † | 16,558 | 29,308 | ||||||||||||||
Kooper Holdings Incorporated † | 3,320 | 72,575 | ||||||||||||||
Kraton Performance Polymers Incorporated † | 4,999 | 50,590 | ||||||||||||||
Kronos Worldwide Incorporated | 3,987 | 39,830 | ||||||||||||||
Minerals Technologies Incorporated | 5,871 | 263,432 | ||||||||||||||
Northern Technologies International | 1,197 | 13,718 | ||||||||||||||
Omnova Solutions Incorporated † | 7,715 | 77,999 | ||||||||||||||
PolyOne Corporation | 13,393 | 331,611 | ||||||||||||||
The accompanying notes are an integral part of these financial statements.
Wells Fargo Funds | 157
Table of Contents
Portfolio of investments—February 29, 2020
FACTOR ENHANCED SMALL CAP PORTFOLIO
| Shares | Value | |||||||||||||||
| Chemicals (continued) | ||||||||||||||||
PQ Group Holdings Incorporated † | 6,726 | $ | 89,254 | |||||||||||||
Rayonier Advanced Materials | 11,051 | 27,075 | ||||||||||||||
Sensient Technologies Corporation | 7,398 | 363,834 | ||||||||||||||
Stepan Company | 3,476 | 305,297 | ||||||||||||||
The Chemours Company | 25,808 | 383,507 | ||||||||||||||
Trecora Resources † | 3,718 | 21,007 | ||||||||||||||
Tredegar Corporation | 4,918 | 83,901 | ||||||||||||||
Trinseo SA | 6,856 | 150,009 | ||||||||||||||
Tronox Holdings plc Class A | 15,295 | 112,265 | ||||||||||||||
| 4,559,566 | ||||||||||||||||
|
| |||||||||||||||
| Construction Materials: 0.07% | ||||||||||||||||
Forterra Incorporated † | 3,423 | 46,347 | ||||||||||||||
United States Lime & Mineral | 417 | 33,589 | ||||||||||||||
US Concrete Incorporated † | 2,881 | 77,326 | ||||||||||||||
| 157,262 | ||||||||||||||||
|
| |||||||||||||||
| Containers & Packaging: 0.43% | ||||||||||||||||
Ardagh Group SA | 3,083 | 54,045 | ||||||||||||||
Greif Incorporated Class A | 4,312 | 152,386 | ||||||||||||||
Myers Industries Incorporated | 4,827 | 65,502 | ||||||||||||||
O-I Glass Incorporated | 22,987 | 248,260 | ||||||||||||||
Ranpak Holdings Corporation † | 2,666 | 22,154 | ||||||||||||||
Silgan Holdings Incorporated | 13,781 | 394,550 | ||||||||||||||
UFP Technologies Incorporated † | 1,172 | 57,815 | ||||||||||||||
| 994,712 | ||||||||||||||||
|
| |||||||||||||||
| Metals & Mining: 0.95% | ||||||||||||||||
AK Steel Holding Corporation † | 42,169 | 97,410 | ||||||||||||||
Coeur D’alene Mines Corporation † | 36,536 | 151,990 | ||||||||||||||
Commercial Metals Company | 18,965 | 346,301 | ||||||||||||||
Compass Minerals International Incorporated | 5,639 | 307,607 | ||||||||||||||
Gold Resource Corporation | 9,471 | 38,073 | ||||||||||||||
Haynes International Incorporated | 2,078 | 52,594 | ||||||||||||||
Kaiser Aluminum Corporation | 2,627 | 248,383 | ||||||||||||||
Materion Corporation | 3,426 | 155,335 | ||||||||||||||
Mayville Engineering Company Incorporated † | 1,085 | 7,910 | ||||||||||||||
Olympic Steel Incorporated | 1,479 | 17,822 | ||||||||||||||
Ryerson Holding Corporation † | 2,451 | 20,417 | ||||||||||||||
Schnitzer Steel Industries Incorporated Class A | 4,268 | 70,337 | ||||||||||||||
Suncoke Energy Incorporated | 13,788 | 63,563 | ||||||||||||||
Synalloy Corporation † | 1,514 | 17,335 | ||||||||||||||
United States Steel Corporation | 26,886 | 215,626 | ||||||||||||||
Universal Stainless & Alloy † | 1,510 | 17,290 | ||||||||||||||
Warrior Met Coal Incorporated | 8,925 | 158,151 | ||||||||||||||
Worthington Industries Incorporated | 6,075 | 193,185 | ||||||||||||||
| 2,179,329 | ||||||||||||||||
|
| |||||||||||||||
| Paper & Forest Products: 0.47% | ||||||||||||||||
Boise Cascade Company | 6,770 | 240,200 | ||||||||||||||
Domtar Corporation | 10,486 | 301,682 | ||||||||||||||
Neenah Incorporated | 2,941 | 169,902 | ||||||||||||||
PH Glatfelter Company | 7,334 | 104,583 | ||||||||||||||
The accompanying notes are an integral part of these financial statements.
158 | Wells Fargo Funds
Table of Contents
Portfolio of investments—February 29, 2020
FACTOR ENHANCED SMALL CAP PORTFOLIO
| Shares | Value | |||||||||||||||
| Paper & Forest Products (continued) | ||||||||||||||||
Schweitzer-Mauduit International Incorporated | 5,264 | $ | 177,502 | |||||||||||||
Verso Corporation Class A † | 5,741 | 93,636 | ||||||||||||||
| 1,087,505 | ||||||||||||||||
|
| |||||||||||||||
| Real Estate: 9.34% | ||||||||||||||||
| Equity REITs: 8.41% | ||||||||||||||||
Acadia Realty Trust | 15,963 | 364,595 | ||||||||||||||
Agree Realty Corporation | 7,819 | 561,561 | ||||||||||||||
Alexander & Baldwin Incorporated | 12,431 | 233,703 | ||||||||||||||
Alexander’s Incorporated | 390 | 121,290 | ||||||||||||||
American Assets Trust Incorporated | 8,461 | 350,708 | ||||||||||||||
American Finance Trust Incorporated | 20,253 | 210,631 | ||||||||||||||
Armada Hoffler Properties Incorporated | 9,007 | 150,957 | ||||||||||||||
Ashford Hospitality Trust Incorporated | 17,915 | 38,696 | ||||||||||||||
Bluerock Residential Growth REIT Incorporated | 4,085 | 42,443 | ||||||||||||||
Braemar Hotels & Resorts Incorporated REIT | 5,870 | 43,203 | ||||||||||||||
Brandywine Realty Trust | 32,934 | 447,244 | ||||||||||||||
Brookfield Property REIT Class A | 12,958 | 211,345 | ||||||||||||||
BRT Apartments Corporation REIT | 1,750 | 27,300 | ||||||||||||||
CareTrust REIT Incorporated | 17,341 | 361,907 | ||||||||||||||
CBL & Associates Properties Incorporated | 43,633 | 23,160 | ||||||||||||||
Cedar Shopping Centers Incorporated | 15,577 | 40,344 | ||||||||||||||
Chatham Lodging Trust | 8,276 | 115,367 | ||||||||||||||
CIM Commercial Trust Corporation REIT | 2,014 | 28,277 | ||||||||||||||
Clipper Realty Incorporated | 2,265 | 25,527 | ||||||||||||||
Colony Capital Incorporated | 90,444 | 358,158 | ||||||||||||||
Columbia Property Trust Incorporated | 21,536 | 406,169 | ||||||||||||||
Community Healthcare Trust Incorporated | 3,441 | 163,895 | ||||||||||||||
CoreCivic Incorporated | 20,653 | 305,871 | ||||||||||||||
CorEnergy Infrastructure Trust Incorporated | 2,293 | 80,026 | ||||||||||||||
CorePoint Lodging Incorporated | 6,830 | 54,367 | ||||||||||||||
DiamondRock Hospitality | 34,456 | 314,239 | ||||||||||||||
Diversified Healthcare Trust | 41,205 | 259,179 | ||||||||||||||
Easterly Government Properties Incorporated | 13,098 | 311,339 | ||||||||||||||
Empire State Realty Trust Incorporated Class A | 32,480 | 380,016 | ||||||||||||||
Essential Properties Realty | 14,429 | 330,568 | ||||||||||||||
Farmland Partners REIT Incorporated | 4,918 | 29,065 | ||||||||||||||
Four Corners Property Trust Incorporated | 12,765 | 366,228 | ||||||||||||||
Franklin Street Properties Corporation | 19,624 | 139,919 | ||||||||||||||
Front Yard Residential Corporation REIT | 7,781 | 98,663 | ||||||||||||||
Getty Realty Corporation | 6,175 | 175,000 | ||||||||||||||
Gladstone Commercial Corporation | 5,509 | 103,955 | ||||||||||||||
Gladstone Land REIT Corporation | 3,196 | 42,922 | ||||||||||||||
Global Medical REIT Incorporated | 6,077 | 84,896 | ||||||||||||||
Global Net Lease Incorporated | 15,372 | 283,613 | ||||||||||||||
Hannon Armstrong Sustainable | 10,816 | 367,203 | ||||||||||||||
Hersha Hospitality Trust | 6,786 | 78,243 | ||||||||||||||
Independence Realty Trust Incorporated | 17,186 | 227,886 | ||||||||||||||
Industrial Logistics Properties Trust | 12,214 | 252,341 | ||||||||||||||
Innovative Industrial Properties Incorporated | 2,036 | 187,190 | ||||||||||||||
Investors Real Estate Trust REIT | 2,187 | 154,074 | ||||||||||||||
iStar Financial Incorporated | 9,844 | 148,940 | ||||||||||||||
Jernigan Capital Incorporated | 3,647 | 65,354 | ||||||||||||||
Kite Realty Group Trust | 16,235 | 262,195 | ||||||||||||||
The accompanying notes are an integral part of these financial statements.
Wells Fargo Funds | 159
Table of Contents
Portfolio of investments—February 29, 2020
FACTOR ENHANCED SMALL CAP PORTFOLIO
| Shares | Value | |||||||||||||||
| Equity REITs (continued) | ||||||||||||||||
Lexington Corporate Properties Trust | 45,488 | $ | 471,711 | |||||||||||||
LTC Properties Incorporated | 7,328 | 328,514 | ||||||||||||||
Mack-Cali Realty Corporation | 15,506 | 294,304 | ||||||||||||||
MGM Growth Properties LLC Class A | 17,561 | 504,001 | ||||||||||||||
Monmouth Real Estate Investment Corporation | 16,526 | 234,669 | ||||||||||||||
National Storage Affiliates Trust | 10,774 | 363,515 | ||||||||||||||
New Senior Investment Group Incorporated | 15,070 | 91,475 | ||||||||||||||
New York REIT Liquidating LLC †(a)‡ | 4,209 | 61,417 | ||||||||||||||
NexPoint Residential Trust Incorporated | 2,621 | 116,635 | ||||||||||||||
Office Properties Income Trust | 8,519 | 248,158 | ||||||||||||||
One Liberty Properties Incorporated | 2,717 | 65,480 | ||||||||||||||
Paramount Group Incorporated | 37,346 | 453,754 | ||||||||||||||
Piedmont Office Realty Trust Incorporated Class A | 22,774 | 491,691 | ||||||||||||||
Plymouth Industrial Incorporated | 2,337 | 43,865 | ||||||||||||||
PotlatchDeltic Corporation | 11,650 | 428,021 | ||||||||||||||
Preferred Apartment Communities Incorporated Class A | 8,129 | 77,551 | ||||||||||||||
QTS Realty Trust Incorporated Class A | 10,029 | 563,329 | ||||||||||||||
Retail Opportunity Investment Corporation | 21,067 | 316,005 | ||||||||||||||
Retail Properties of America Incorporated Class A | 40,854 | 427,741 | ||||||||||||||
Retail Value Incorporated | 2,834 | 78,757 | ||||||||||||||
RPT Realty | 14,090 | 182,606 | ||||||||||||||
Safehold Incorporated REIT | 2,066 | 112,845 | ||||||||||||||
Saul Centers Incorporated | 2,431 | 104,557 | ||||||||||||||
Seritage Growth Property Class A | 6,469 | 222,404 | ||||||||||||||
SITE Centers Corporation | 30,131 | 346,808 | ||||||||||||||
Sotherly Hotels Incorporated REIT | 2,175 | 11,158 | ||||||||||||||
Spirit MTA REIT (a) | 6,981 | 0 | ||||||||||||||
Summit Hotel Properties Incorporated | 18,467 | 171,189 | ||||||||||||||
Tanger Factory Outlet Centers Incorporated | 16,242 | 194,579 | ||||||||||||||
Taubman Centers Incorporated | 11,211 | 583,645 | ||||||||||||||
The Geo Group Incorporated | 20,522 | 300,442 | ||||||||||||||
UMH Properties Incorporated | 6,217 | 90,209 | ||||||||||||||
Uniti Group Incorporated | 29,140 | 284,406 | ||||||||||||||
Universal Health Realty Income Trust | 2,346 | 252,711 | ||||||||||||||
Urban Edge Properties | 22,253 | 360,499 | ||||||||||||||
Urstadt Biddle Properties Incorporated | 5,371 | 110,696 | ||||||||||||||
Washington Prime Group Incorporated | 37,498 | 103,120 | ||||||||||||||
Washington REIT | 14,726 | 395,393 | ||||||||||||||
Whitestone REIT | 7,097 | 87,222 | ||||||||||||||
Xenia Hotels & Resorts Incorporated | 20,111 | 300,861 | ||||||||||||||
| 19,305,715 | ||||||||||||||||
|
| |||||||||||||||
| Real Estate Management & Development: 0.93% | ||||||||||||||||
Altisource Portfolio Solutions SA † | 844 | 13,411 | ||||||||||||||
Consolidated-Tomoka Land Company | 841 | 48,366 | ||||||||||||||
Cushman & Wakefield plc † | 14,318 | 260,444 | ||||||||||||||
eXp World Holdings Incorporated † | 3,734 | 35,697 | ||||||||||||||
Forestar Group Incorporated † | 3,056 | 54,672 | ||||||||||||||
FRP Holdings Incorporated † | 1,068 | 48,306 | ||||||||||||||
Kennedy Wilson Holdings Incorporated | 22,198 | 448,622 | ||||||||||||||
Marcus & Millichap Incorporated † | 4,079 | 130,365 | ||||||||||||||
Newmark Group Incorporated Class A | 25,350 | 242,093 | ||||||||||||||
RE/MAX Holdings Incorporated Class A | 2,918 | 85,060 | ||||||||||||||
Realogy Holdings Corporation | 19,377 | 179,625 | ||||||||||||||
Redfin Corporation † | 12,314 | 333,217 | ||||||||||||||
The accompanying notes are an integral part of these financial statements.
160 | Wells Fargo Funds
Table of Contents
Portfolio of investments—February 29, 2020
FACTOR ENHANCED SMALL CAP PORTFOLIO
| Shares | Value | |||||||||||||||
| Real Estate Management & Development (continued) | ||||||||||||||||
Stratus Properties Incorporated † | 1,079 | $ | 30,924 | |||||||||||||
The RMR Group Incorporated Class A | 2,813 | 104,812 | ||||||||||||||
The St. Joe Company † | 6,147 | 120,911 | ||||||||||||||
| 2,136,525 | ||||||||||||||||
|
| |||||||||||||||
| Utilities: 3.01% | ||||||||||||||||
| Electric Utilities: 0.78% | ||||||||||||||||
Avangrid Incorporated | 9,797 | 486,813 | ||||||||||||||
El Paso Electric Company | 7,177 | 487,103 | ||||||||||||||
Genie Energy Limited Class B | 2,672 | 18,490 | ||||||||||||||
MGE Energy Incorporated | 6,171 | 440,239 | ||||||||||||||
Otter Tail Corporation | 6,882 | 334,534 | ||||||||||||||
Spark Energy Incorporated Class A | 2,212 | 18,935 | ||||||||||||||
| 1,786,114 | ||||||||||||||||
|
| |||||||||||||||
| Gas Utilities: 0.49% | ||||||||||||||||
Chesapeake Utilities Corporation | 2,711 | 231,791 | ||||||||||||||
Northwest Natural Holding Company | 5,310 | 349,239 | ||||||||||||||
RGC Resources Incorporated |
| 1,316 | 36,124 | |||||||||||||
South Jersey Industries Incorporated |
| 16,440 | 444,702 | |||||||||||||
Star Group LP |
| 7,747 | 69,568 | |||||||||||||
| 1,131,424 | ||||||||||||||||
|
| |||||||||||||||
| Independent Power & Renewable Electricity Producers: 0.92% | ||||||||||||||||
Clearway Energy Incorporated Class C |
| 13,181 | 277,328 | |||||||||||||
Nextera Energy Partners LP |
| 9,812 | 565,858 | |||||||||||||
Ormat Technologies Incorporated |
| 7,190 | 500,999 | |||||||||||||
Pattern Energy Group Incorporated |
| 17,274 | 467,262 | |||||||||||||
Terraform Power Incorporated Class A |
| 15,841 | 297,652 | |||||||||||||
| 2,109,099 | ||||||||||||||||
|
| |||||||||||||||
| Multi-Utilities: 0.30% | ||||||||||||||||
Avista Corporation |
| 11,561 | 545,101 | |||||||||||||
Unitil Corporation |
| 2,567 | 144,625 | |||||||||||||
| 689,726 | ||||||||||||||||
|
| |||||||||||||||
| Water Utilities: 0.52% | ||||||||||||||||
Aquaventure Holdings Limited † |
| 3,322 | 89,827 | |||||||||||||
Artesian Resources Corporation Class A |
| 1,414 | 48,543 | |||||||||||||
California Water Service Group |
| 8,674 | 416,005 | |||||||||||||
Global Water Resources Incorporated |
| 1,707 | 20,399 | |||||||||||||
Middlesex Water Company |
| 2,824 | 167,943 | |||||||||||||
Pure Cycle Corporation † |
| 3,501 | 43,307 | |||||||||||||
SJW Corporation |
| 5,051 | 309,020 | |||||||||||||
York Water Company |
| 2,233 | 94,434 | |||||||||||||
| 1,189,478 | ||||||||||||||||
|
| |||||||||||||||
Total Common Stocks (Cost $224,512,698) |
| 220,800,510 | ||||||||||||||
|
| |||||||||||||||
The accompanying notes are an integral part of these financial statements.
Wells Fargo Funds | 161
Table of Contents
Portfolio of investments—February 29, 2020
FACTOR ENHANCED SMALL CAP PORTFOLIO
| Expiration date | Shares | Value | ||||||||||||||
| Rights: 0.00% | ||||||||||||||||
| Financials: 0.00% | ||||||||||||||||
| Diversified Financial Services: 0.00% | ||||||||||||||||
Schulman Incorporated Class A †(a)‡ | 8-22-2028 | 6,818 | $ | 0 | ||||||||||||
|
| |||||||||||||||
| Thrifts & Mortgage Finance: 0.00% | ||||||||||||||||
NewStar Financial Incorporated †(a) | 12-26-2027 | 9,129 | 0 | |||||||||||||
|
| |||||||||||||||
| Health Care: 0.00% | ||||||||||||||||
| Pharmaceuticals: 0.00% | ||||||||||||||||
Corium International Incorporated †(a)‡ | 3-31-2020 | 6,709 | 1,208 | |||||||||||||
Elanco Animal Health Incorporated †(a) | 12-31-2021 | 8,956 | 0 | |||||||||||||
Spero Therapeutics Incorporated †(a) | 12-31-2099 | 329 | 178 | |||||||||||||
Total Rights (Cost $6,589) | 1,386 | |||||||||||||||
|
| |||||||||||||||
Warrants: 0.00% | ||||||||||||||||
Energy: 0.00% | ||||||||||||||||
| Energy Equipment & Services: 0.00% | ||||||||||||||||
Parker Drilling Company †(a) | 9-16-2024 | 373 | 0 | |||||||||||||
|
| |||||||||||||||
| Oil, Gas & Consumable Fuels: 0.00% | ||||||||||||||||
Battalion Oil Corporation †(a) | 10-8-2022 | 300 | 0 | |||||||||||||
Battalion Oil Corporation †(a) | 10-8-2022 | 482 | 0 | |||||||||||||
Battalion Oil Corporation †(a) | 10-8-2022 | 375 | 0 | |||||||||||||
Total Warrants (Cost $0) | 0 | |||||||||||||||
|
| |||||||||||||||
| Yield | ||||||||||||||||
| Short-Term Investments: 2.99% | ||||||||||||||||
| Investment Companies: 2.99% | ||||||||||||||||
Wells Fargo Government Money Market Fund Select Class (l)(u) | 1.52 | % | 6,867,519 | 6,867,519 | ||||||||||||
|
| |||||||||||||||
Total Short-Term Investments (Cost $6,867,519) | 6,867,519 | |||||||||||||||
|
| |||||||||||||||
| Total investments in securities (Cost $231,386,806) | 99.17 | % | 227,669,415 | |||||
Other assets and liabilities, net | 0.83 | 1,897,830 | ||||||
|
|
|
| |||||
| Total net assets | 100.00 | % | $ | 229,567,245 | ||||
|
|
|
| |||||
| † | Non-income-earning security |
| (a) | The security is fair valued in accordance with procedures approved by the Board of Trustees. |
| ‡ | Security is valued using significant unobservable inputs. |
| (l) | The issuer of the security is an affiliated person of the Portfolio as defined in the Investment Company Act of 1940. |
| (u) | The rate represents the7-day annualized yield at period end. |
Abbreviations:
| REIT | Real estate investment trust |
Futures Contracts
| Description | Number of contracts | Expiration date | Notional cost | Notional value | Unrealized gains | Unrealized losses | ||||||||||||||||||
Long | ||||||||||||||||||||||||
E-Mini Russell 2000 Index | 119 | 3-20-2020 | $ | 9,805,906 | $ | 8,775,655 | $ | 0 | $ | (1,030,251 | ) | |||||||||||||
The accompanying notes are an integral part of these financial statements.
162 | Wells Fargo Funds
Table of Contents
Portfolio of investments—February 29, 2020
FACTOR ENHANCED SMALL CAP PORTFOLIO
Investments in Affiliates
An affiliated investment is an investment in which the Portfolio owns at least 5% of the outstanding voting shares of the issuer or as a result of other relationships, such as the Portfolio and the issuer having the same adviser or investment manager. Transactions with issuers that were either affiliated persons of the Portfolio at the beginning of the period or the end of the period were as follows:
| Shares, beginning of period | Shares purchased | Shares sold | Shares, end of period | Net realized gains (losses) | Net change in unrealized gains (losses) | Income from affiliated securities | Value, end of period | % of net assets | ||||||||||||||||||||||||||||
Short-Term Investments | ||||||||||||||||||||||||||||||||||||
Investment Companies | ||||||||||||||||||||||||||||||||||||
Wells Fargo Government Money Market Fund Select Class | 10,752,908 | 62,327,762 | (66,213,151 | ) | 6,867,519 | $ | 0 | $ | 0 | $ | 185,648 | $ | 6,867,519 | 2.99 | % | |||||||||||||||||||||
The accompanying notes are an integral part of these financial statements.
Wells Fargo Funds | 163
Table of Contents
Portfolio of investments—February 29, 2020
HIGH YIELD CORPORATE BOND PORTFOLIO
| Interest rate | Maturity date | Principal | Value | |||||||||||||
| Corporate Bonds and Notes: 79.87% |
| |||||||||||||||
Communication Services: 13.57% |
| |||||||||||||||
| Diversified Telecommunication Services: 2.85% | ||||||||||||||||
CenturyLink Incorporated | 5.80 | % | 3-15-2022 | $ | 240,000 | $ | 251,700 | |||||||||
CenturyLink Incorporated | 6.75 | 12-1-2023 | 330,000 | 362,904 | ||||||||||||
Frontier Communications Corporation 144A | 8.50 | 4-1-2026 | 200,000 | 202,500 | ||||||||||||
Hughes Satellite Systems Company | 7.63 | 6-15-2021 | 300,000 | 315,918 | ||||||||||||
Level 3 Financing Incorporated | 5.38 | 1-15-2024 | 200,000 | 199,504 | ||||||||||||
Zayo Group LLC | 6.00 | 4-1-2023 | 200,000 | 204,250 | ||||||||||||
| 1,536,776 | ||||||||||||||||
|
| |||||||||||||||
| Entertainment: 0.87% | ||||||||||||||||
AMC Entertainment Holdings Incorporated | 5.88 | 11-15-2026 | 300,000 | 240,000 | ||||||||||||
Netflix Incorporated | 4.88 | 4-15-2028 | 220,000 | 231,596 | ||||||||||||
| 471,596 | ||||||||||||||||
|
| |||||||||||||||
| Interactive Media & Services: 0.35% | ||||||||||||||||
Rackspace Hosting Company 144A | 8.63 | 11-15-2024 | 200,000 | 191,500 | ||||||||||||
|
| |||||||||||||||
| Media: 8.17% | ||||||||||||||||
AMC Networks Incorporated | 4.75 | 8-1-2025 | 300,000 | 299,010 | ||||||||||||
CCO Holdings LLC 144A | 5.13 | 5-1-2027 | 230,000 | 239,131 | ||||||||||||
CCO Holdings LLC 144A | 5.88 | 5-1-2027 | 300,000 | 313,232 | ||||||||||||
Clear Channel Worldwide Holdings Incorporated 144A | 9.25 | 2-15-2024 | 255,000 | 270,938 | ||||||||||||
CSC Holdings LLC 144A | 5.50 | 4-15-2027 | 200,000 | 210,500 | ||||||||||||
Diamond Sports Group LLC 144A | 5.38 | 8-15-2026 | 380,000 | 350,368 | ||||||||||||
DISH DBS Corporation | 5.88 | 7-15-2022 | 200,000 | 208,690 | ||||||||||||
DISH DBS Corporation | 5.88 | 11-15-2024 | 400,000 | 410,292 | ||||||||||||
Gray Television Incorporated 144A | 5.88 | 7-15-2026 | 200,000 | 205,690 | ||||||||||||
iHeartCommunications Incorporated | 6.38 | 5-1-2026 | 340,000 | 365,398 | ||||||||||||
Lamar Media Corporation | 5.00 | 5-1-2023 | 200,000 | 201,500 | ||||||||||||
Meredith Corporation | 6.88 | 2-1-2026 | 200,000 | 200,540 | ||||||||||||
Neptune Finco Corporation 144A | 10.88 | 10-15-2025 | 200,000 | 219,440 | ||||||||||||
Nexstar Broadcasting Incorporated 144A | 5.63 | 7-15-2027 | 200,000 | 207,010 | ||||||||||||
Outfront Media Capital Corporation 144A | 4.63 | 3-15-2030 | 200,000 | 200,558 | ||||||||||||
Sirius XM Radio Incorporated 144A | 5.00 | 8-1-2027 | 300,000 | 313,875 | ||||||||||||
Univision Communications Incorporated 144A | 5.13 | 5-15-2023 | 200,000 | 193,500 | ||||||||||||
| 4,409,672 | ||||||||||||||||
|
| |||||||||||||||
| Wireless Telecommunication Services: 1.33% | ||||||||||||||||
Connect U.S. Finco LLC 144A | 6.75 | 10-1-2026 | 200,000 | 203,500 | ||||||||||||
Sprint Corporation | 7.25 | 9-15-2021 | 200,000 | 212,270 | ||||||||||||
T-Mobile USA Incorporated | 4.50 | 2-1-2026 | 300,000 | 304,035 | ||||||||||||
| 719,805 | ||||||||||||||||
|
| |||||||||||||||
Consumer Discretionary: 11.90% |
| |||||||||||||||
| Auto Components: 1.20% | ||||||||||||||||
American Axle & Manufacturing Incorporated | 6.25 | 3-15-2026 | 210,000 | 202,020 | ||||||||||||
Goodyear Tire & Rubber Company | 5.13 | 11-15-2023 | 200,000 | 198,440 | ||||||||||||
Panther BF Aggregator 2 LP 144A | 6.25 | 5-15-2026 | 240,000 | 246,528 | ||||||||||||
| 646,988 | ||||||||||||||||
|
| |||||||||||||||
The accompanying notes are an integral part of these financial statements.
164 | Wells Fargo Funds
Table of Contents
Portfolio of investments—February 29, 2020
HIGH YIELD CORPORATE BOND PORTFOLIO
| Interest rate | Maturity date | Principal | Value | |||||||||||||
| Automobiles: 0.37% | ||||||||||||||||
Tesla Incorporated 144A | 5.30 | % | 8-15-2025 | $ | 200,000 | $ | 200,000 | |||||||||
|
| |||||||||||||||
| Diversified Consumer Services: 0.89% | ||||||||||||||||
Prime Security Services Borrower LLC 144A | 5.25 | 4-15-2024 | 260,000 | 269,100 | ||||||||||||
Service Corporation International | 4.63 | 12-15-2027 | 200,000 | 209,500 | ||||||||||||
| 478,600 | ||||||||||||||||
|
| |||||||||||||||
| Hotels, Restaurants & Leisure: 3.70% | ||||||||||||||||
Caesars Resort Collection LLC 144A | 5.25 | 10-15-2025 | 200,000 | 196,404 | ||||||||||||
Eldorado Resorts Incorporated | 6.00 | 4-1-2025 | 200,000 | 209,000 | ||||||||||||
Golden Nugget Incorporated 144A | 6.75 | 10-15-2024 | 300,000 | 294,660 | ||||||||||||
Hilton Worldwide Finance LLC | 4.63 | 4-1-2025 | 200,000 | 200,750 | ||||||||||||
KFC Holding Company 144A | 5.00 | 6-1-2024 | 300,000 | 302,364 | ||||||||||||
MGM Resorts International | 4.63 | 9-1-2026 | 200,000 | 208,000 | ||||||||||||
Scientific Games International Incorporated 144A | 7.25 | 11-15-2029 | 200,000 | 194,760 | ||||||||||||
Six Flags Entertainment Company 144A | 4.88 | 7-31-2024 | 200,000 | 197,400 | ||||||||||||
Wynn Las Vegas LLC 144A | 5.50 | 3-1-2025 | 200,000 | 196,250 | ||||||||||||
| 1,999,588 | ||||||||||||||||
|
| |||||||||||||||
| Household Durables: 2.26% | ||||||||||||||||
Hovnanian Enterprises Incorporated 144A | 10.00 | 7-15-2022 | 200,000 | 174,000 | ||||||||||||
Lennar Corporation | 4.50 | 4-30-2024 | 300,000 | 318,624 | ||||||||||||
Newell Brands Incorporated | 3.85 | 4-1-2023 | 290,000 | 301,500 | ||||||||||||
PulteGroup Incorporated | 5.50 | 3-1-2026 | 200,000 | 220,400 | ||||||||||||
Toll Brothers Finance Corporation | 4.38 | 4-15-2023 | 200,000 | 208,000 | ||||||||||||
| 1,222,524 | ||||||||||||||||
|
| |||||||||||||||
| Leisure Products: 0.39% | ||||||||||||||||
Mattel Incorporated 144A | 6.75 | 12-31-2025 | 200,000 | 210,190 | ||||||||||||
|
| |||||||||||||||
| Multiline Retail: 0.47% | ||||||||||||||||
J.C. Penney Corporation Incorporated 144A | 5.88 | 7-1-2023 | 300,000 | 251,256 | ||||||||||||
|
| |||||||||||||||
| Specialty Retail: 1.87% | ||||||||||||||||
ABC Supply Company Incorporated 144A | 4.00 | 1-15-2028 | 200,000 | 195,250 | ||||||||||||
L Brands Incorporated | 5.63 | 2-15-2022 | 200,000 | 209,520 | ||||||||||||
L Brands Incorporated | 6.75 | 7-1-2036 | 200,000 | 202,500 | ||||||||||||
PetSmart Incorporated 144A | 7.13 | 3-15-2023 | 200,000 | 195,500 | ||||||||||||
Staples Incorporated 144A | 7.50 | 4-15-2026 | 210,000 | 208,625 | ||||||||||||
| 1,011,395 | ||||||||||||||||
|
| |||||||||||||||
| Textiles, Apparel & Luxury Goods: 0.75% | ||||||||||||||||
HanesBrands Incorporated 144A | 4.63 | 5-15-2024 | 200,000 | 209,000 | ||||||||||||
Wolverine Escrow LLC 144A | 8.50 | 11-15-2024 | 200,000 | 195,040 | ||||||||||||
| 404,040 | ||||||||||||||||
|
| |||||||||||||||
Consumer Staples: 4.24% |
| |||||||||||||||
| Food & Staples Retailing: 1.72% | ||||||||||||||||
Albertsons Companies LLC 144A | 7.50 | 3-15-2026 | 200,000 | 222,250 | ||||||||||||
Aramark Services Incorporated | 4.75 | 6-1-2026 | 300,000 | 310,500 | ||||||||||||
Performance Food Group Company 144A | 5.50 | 10-15-2027 | 200,000 | 210,750 | ||||||||||||
Rite Aid Corporation 144A | 6.13 | 4-1-2023 | 200,000 | 183,250 | ||||||||||||
| 926,750 | ||||||||||||||||
|
| |||||||||||||||
The accompanying notes are an integral part of these financial statements.
Wells Fargo Funds | 165
Table of Contents
Portfolio of investments—February 29, 2020
HIGH YIELD CORPORATE BOND PORTFOLIO
| Interest rate | Maturity date | Principal | Value | |||||||||||||
| Food Products: 2.14% | ||||||||||||||||
B&G Foods Incorporated | 5.25 | % | 9-15-2027 | $ | 200,000 | $ | 198,000 | |||||||||
JBS USA Finance Incorporated 144A | 5.75 | 6-15-2025 | 300,000 | 307,125 | ||||||||||||
Lamb Weston Holdings Incorporated 144A | 4.88 | 11-1-2026 | 200,000 | 207,510 | ||||||||||||
Pilgrim’s Pride Corporation 144A | 5.88 | 9-30-2027 | 200,000 | 207,260 | ||||||||||||
Post Holdings Incorporated 144A | 5.50 | 12-15-2029 | 230,000 | 238,625 | ||||||||||||
| 1,158,520 | ||||||||||||||||
|
| |||||||||||||||
| Household Products: 0.38% | ||||||||||||||||
Energizer Holdings Incorporated 144A | 5.50 | 6-15-2025 | 200,000 | 202,960 | ||||||||||||
|
| |||||||||||||||
Energy: 10.65% |
| |||||||||||||||
| Energy Equipment & Services: 1.20% | ||||||||||||||||
Diamond Offshore Drilling Incorporated | 5.70 | 10-15-2039 | 300,000 | 129,939 | ||||||||||||
Hilcorp Energy Company 144A | 5.75 | 10-1-2025 | 200,000 | 160,000 | ||||||||||||
SESI LLC | 7.13 | 12-15-2021 | 200,000 | 162,600 | ||||||||||||
USA Compression Partners LP | 6.88 | 4-1-2026 | 200,000 | 193,520 | ||||||||||||
| 646,059 | ||||||||||||||||
|
| |||||||||||||||
| Oil, Gas & Consumable Fuels: 9.45% | ||||||||||||||||
Antero Midstream Partners LP 144A | 5.75 | 1-15-2028 | 200,000 | 137,290 | ||||||||||||
Antero Resources Corporation | 5.13 | 12-1-2022 | 200,000 | 124,500 | ||||||||||||
Ascent Resources Utica Holdings LLC 144A | 10.00 | 4-1-2022 | 195,000 | 166,183 | ||||||||||||
Buckeye Partners LP | 5.85 | 11-15-2043 | 200,000 | 184,000 | ||||||||||||
California Resources Corporation 144A | 8.00 | 12-15-2022 | 200,000 | 46,000 | ||||||||||||
Cheniere Energy Partners LP | 5.25 | 10-1-2025 | 200,000 | 200,504 | ||||||||||||
Chesapeake Energy Corporation | 7.00 | 10-1-2024 | 300,000 | 105,000 | ||||||||||||
Crestwood Midstream Partners LP | 6.25 | 4-1-2023 | 200,000 | 190,040 | ||||||||||||
CrownRock LP 144A | 5.63 | 10-15-2025 | 200,000 | 192,500 | ||||||||||||
DCP Midstream Operating LP | 3.88 | 3-15-2023 | 200,000 | 199,100 | ||||||||||||
DCP Midstream Operating LP (3 Month LIBOR +3.85%) 144A± | 5.85 | 5-21-2043 | 200,000 | 180,000 | ||||||||||||
Denbury Resources Incorporated 144A | 9.00 | 5-15-2021 | 200,000 | 175,000 | ||||||||||||
EnLink Midstream Partners LP | 5.45 | 6-1-2047 | 350,000 | 253,645 | ||||||||||||
EQT Corporation | 7.00 | 2-1-2030 | 250,000 | 186,250 | ||||||||||||
Extraction Oil & Gas Incorporated 144A | 5.63 | 2-1-2026 | 200,000 | 70,000 | ||||||||||||
Murphy Oil Corporation | 6.88 | 8-15-2024 | 200,000 | 199,480 | ||||||||||||
Nabors Industries Incorporated | 5.75 | 2-1-2025 | 200,000 | 143,500 | ||||||||||||
NGL Enrgy Partners LP | 7.50 | 11-1-2023 | 200,000 | 185,040 | ||||||||||||
Oasis Petroleum Incorporated | 6.88 | 3-15-2022 | 190,000 | 149,150 | ||||||||||||
Peabody Energy Corporation 144A | 6.38 | 3-31-2025 | 200,000 | 137,500 | ||||||||||||
QEP Resources Incorporated | 5.25 | 5-1-2023 | 200,000 | 177,040 | ||||||||||||
Range Resources Corporation | 4.88 | 5-15-2025 | 200,000 | 126,440 | ||||||||||||
SM Energy Company | 6.75 | 9-15-2026 | 200,000 | 158,000 | ||||||||||||
Southwestern Energy Company | 7.75 | 10-1-2027 | 200,000 | 151,500 | ||||||||||||
Sunoco LP | 4.88 | 1-15-2023 | 210,000 | 209,374 | ||||||||||||
Tallgrass Energy Partners LP 144A | 5.50 | 1-15-2028 | 200,000 | 178,040 | ||||||||||||
Targa Resources Partners LP | 4.25 | 11-15-2023 | 200,000 | 198,100 | ||||||||||||
Targa Resources Partners LP | 5.13 | 2-1-2025 | 200,000 | 200,754 | ||||||||||||
Transocean Incorporated | 6.80 | 3-15-2038 | 300,000 | 163,500 | ||||||||||||
Whiting Petroleum Corporation | 5.75 | 3-15-2021 | 200,000 | 115,000 | ||||||||||||
WPX Energy Incorporated | 5.25 | 9-15-2024 | 200,000 | 201,000 | ||||||||||||
| 5,103,430 | ||||||||||||||||
|
| |||||||||||||||
Financials: 7.20% |
| |||||||||||||||
| Banks: 0.39% | ||||||||||||||||
CIT Group Incorporated | 5.00 | 8-1-2023 | 200,000 | 213,500 | ||||||||||||
|
| |||||||||||||||
The accompanying notes are an integral part of these financial statements.
166 | Wells Fargo Funds
Table of Contents
Portfolio of investments—February 29, 2020
HIGH YIELD CORPORATE BOND PORTFOLIO
| Interest rate | Maturity date | Principal | Value | |||||||||||||
| Capital Markets: 0.50% | ||||||||||||||||
MSCI Incorporated 144A | 4.75 | % | 8-1-2026 | $ | 260,000 | $ | 270,000 | |||||||||
|
| |||||||||||||||
| Consumer Finance: 2.69% | ||||||||||||||||
Navient Corporation | 5.88 | 10-25-2024 | 200,000 | 205,004 | ||||||||||||
Navient Corporation | 6.63 | 7-26-2021 | 200,000 | 205,904 | ||||||||||||
Navient Corporation | 6.75 | 6-25-2025 | 200,000 | 211,000 | ||||||||||||
Quicken Loans Incorporated 144A | 5.25 | 1-15-2028 | 200,000 | 206,940 | ||||||||||||
Springleaf Finance Corporation | 6.13 | 5-15-2022 | 200,000 | 210,824 | ||||||||||||
Springleaf Finance Corporation | 7.13 | 3-15-2026 | 370,000 | 410,697 | ||||||||||||
| 1,450,369 | ||||||||||||||||
|
| |||||||||||||||
| Diversified Financial Services: 1.35% | ||||||||||||||||
Harland Clarke Holdings 144A | 9.25 | 3-1-2021 | 200,000 | 200,000 | ||||||||||||
Hilton Domestic Operating Company | 4.25 | 9-1-2024 | 200,000 | 200,666 | ||||||||||||
Refinitiv U.S. Holdings Company 144A | 8.25 | 11-15-2026 | 300,000 | 330,300 | ||||||||||||
| 730,966 | ||||||||||||||||
|
| |||||||||||||||
| Insurance: 1.12% | ||||||||||||||||
Acrisure LLC 144A | 7.00 | 11-15-2025 | 200,000 | 195,440 | ||||||||||||
Genworth Holdings Incorporated | 7.63 | 9-24-2021 | 200,000 | 205,364 | ||||||||||||
HUB International Limited 144A | 7.00 | 5-1-2026 | 200,000 | 201,990 | ||||||||||||
| 602,794 | ||||||||||||||||
|
| |||||||||||||||
| Mortgage REITs: 0.75% | ||||||||||||||||
Realogy Group LLC 144A | 9.38 | 4-1-2027 | 200,000 | 205,000 | ||||||||||||
Starwood Property Trust Incorporated | 5.00 | 12-15-2021 | 200,000 | 197,754 | ||||||||||||
| 402,754 | ||||||||||||||||
|
| |||||||||||||||
| Thrifts & Mortgage Finance: 0.40% | ||||||||||||||||
Nationstar Mortgage Holdings Incorporated 144A | 9.13 | 7-15-2026 | 200,000 | 216,604 | ||||||||||||
|
| |||||||||||||||
Health Care: 6.52% |
| |||||||||||||||
| Health Care Equipment & Supplies: 0.38% | ||||||||||||||||
Hologic Incorporated 144A | 4.38 | 10-15-2025 | 200,000 | 203,690 | ||||||||||||
|
| |||||||||||||||
| Health Care Providers & Services: 5.27% | ||||||||||||||||
Centene Corporation | 4.75 | 1-15-2025 | 250,000 | 256,338 | ||||||||||||
Centene Corporation 144A | 5.25 | 4-1-2025 | 200,000 | 205,750 | ||||||||||||
Davita Incorporated | 5.13 | 7-15-2024 | 300,000 | 303,999 | ||||||||||||
Encompass Health Corporation | 5.75 | 11-1-2024 | 116,000 | 117,024 | ||||||||||||
Envision Healthcare Corporation 144A | 8.75 | 10-15-2026 | 200,000 | 105,861 | ||||||||||||
HCA Incorporated | 5.88 | 5-1-2023 | 220,000 | 240,350 | ||||||||||||
Jaguar Holding Company II 144A | 6.38 | 8-1-2023 | 200,000 | 206,376 | ||||||||||||
MEDNAX Incorporated 144A | 6.25 | 1-15-2027 | 200,000 | 191,990 | ||||||||||||
MPH Acquisition Holdings LLC 144A | 7.13 | 6-1-2024 | 300,000 | 279,066 | ||||||||||||
MPT Operating Partnership LP | 5.00 | 10-15-2027 | 200,000 | 208,702 | ||||||||||||
Polaris Intermediate Corporation 144A | 8.50 | 12-1-2022 | 230,000 | 195,523 | ||||||||||||
Tenet Healthcare Corporation | 5.13 | 5-1-2025 | 300,000 | 302,250 | ||||||||||||
Tenet Healthcare Corporation 144A | 6.25 | 2-1-2027 | 220,000 | 230,450 | ||||||||||||
| 2,843,679 | ||||||||||||||||
|
| |||||||||||||||
| Life Sciences Tools & Services: 0.58% | ||||||||||||||||
Avantor Incorporated 144A | 6.00 | 10-1-2024 | 300,000 | 314,874 | ||||||||||||
|
| |||||||||||||||
The accompanying notes are an integral part of these financial statements.
Wells Fargo Funds | 167
Table of Contents
Portfolio of investments—February 29, 2020
HIGH YIELD CORPORATE BOND PORTFOLIO
| Interest rate | Maturity date | Principal | Value | |||||||||||||
| Pharmaceuticals: 0.29% | ||||||||||||||||
Endo Finance LLC 144A | 6.00 | % | 7-15-2023 | $ | 200,000 | $ | 157,004 | |||||||||
|
| |||||||||||||||
Industrials: 6.65% |
| |||||||||||||||
| Aerospace & Defense: 1.30% | ||||||||||||||||
Alcoa Incorporated | 5.87 | 2-23-2022 | 280,000 | 294,700 | ||||||||||||
TransDigm Group Incorporated | 6.38 | 6-15-2026 | 200,000 | 205,510 | ||||||||||||
TransDigm Group Incorporated | 6.50 | 7-15-2024 | 200,000 | 204,500 | ||||||||||||
| 704,710 | ||||||||||||||||
|
| |||||||||||||||
| Air Freight & Logistics: 0.38% | ||||||||||||||||
XPO Logistics Incorporated 144A | 6.13 | 9-1-2023 | 200,000 | 204,126 | ||||||||||||
|
| |||||||||||||||
| Commercial Services & Supplies: 1.28% | ||||||||||||||||
ADT Corporation | 6.25 | 10-15-2021 | 240,000 | 250,253 | ||||||||||||
APTIM Corporation 144A | 7.75 | 6-15-2025 | 200,000 | 113,834 | ||||||||||||
Pitney Bowes Incorporated | 4.63 | 3-15-2024 | 200,000 | 190,600 | ||||||||||||
West Corp Company 144A | 8.50 | 10-15-2025 | 200,000 | 134,500 | ||||||||||||
| 689,187 | ||||||||||||||||
|
| |||||||||||||||
| Construction & Engineering: 1.38% | ||||||||||||||||
AECOM | 5.88 | 10-15-2024 | 200,000 | 219,500 | ||||||||||||
Taylor Morrison Communities Incorporated 144A | 5.88 | 4-15-2023 | 200,000 | 214,000 | ||||||||||||
United Rentals North America Incorporated | 5.50 | 5-15-2027 | 300,000 | 313,500 | ||||||||||||
| 747,000 | ||||||||||||||||
|
| |||||||||||||||
| Electrical Equipment: 0.40% | ||||||||||||||||
Vertiv Group Corporation 144A | 9.25 | 10-15-2024 | 200,000 | 213,876 | ||||||||||||
|
| |||||||||||||||
| Professional Services: 0.41% | ||||||||||||||||
The Dun & Bradstreet Corporation 144A | 10.25 | 2-15-2027 | 200,000 | 224,500 | ||||||||||||
|
| |||||||||||||||
| Road & Rail: 0.41% | ||||||||||||||||
The Hertz Corporation 144A | 5.50 | 10-15-2024 | 230,000 | 220,186 | ||||||||||||
|
| |||||||||||||||
| Trading Companies & Distributors: 1.09% | ||||||||||||||||
Beacon Escrow Corporation 144A | 4.88 | 11-1-2025 | 200,000 | 192,940 | ||||||||||||
FXI Holdings Incorporated 144A | 7.88 | 11-1-2024 | 200,000 | 188,000 | ||||||||||||
Herc Holdings Incorporated 144A | 5.50 | 7-15-2027 | 200,000 | 207,480 | ||||||||||||
| 588,420 | ||||||||||||||||
|
| |||||||||||||||
Information Technology: 5.51% |
| |||||||||||||||
| Communications Equipment: 1.17% | ||||||||||||||||
CommScope Incorporated 144A | 5.50 | 6-15-2024 | 260,000 | 247,026 | ||||||||||||
CommScope Technologies Finance LLC 144A | 5.00 | 3-15-2027 | 200,000 | 180,980 | ||||||||||||
Viasat Incorporated 144A | 5.63 | 4-15-2027 | 200,000 | 202,625 | ||||||||||||
| 630,631 | ||||||||||||||||
|
| |||||||||||||||
| Electronic Equipment, Instruments & Components: 0.41% | ||||||||||||||||
CDW LLC | 5.50 | 12-1-2024 | 200,000 | 220,000 | ||||||||||||
|
| |||||||||||||||
| IT Services: 0.40% | ||||||||||||||||
VeriSign Incorporated | 5.25 | 4-1-2025 | 200,000 | 216,800 | ||||||||||||
|
| |||||||||||||||
The accompanying notes are an integral part of these financial statements.
168 | Wells Fargo Funds
Table of Contents
Portfolio of investments—February 29, 2020
HIGH YIELD CORPORATE BOND PORTFOLIO
| Interest rate | Maturity date | Principal | Value | |||||||||||||
| Semiconductors & Semiconductor Equipment: 0.38% | ||||||||||||||||
Broadcom Incorporated 144A | 5.00 | % | 4-15-2025 | $ | 200,000 | $ | 203,032 | |||||||||
|
| |||||||||||||||
| Software: 1.87% | ||||||||||||||||
CDK Global Incorporated 144A | 5.25 | 5-15-2029 | 200,000 | 213,250 | ||||||||||||
IQVIA Incorporated 144A | 5.00 | 5-15-2027 | 200,000 | 206,750 | ||||||||||||
Solera Finance Incorporated 144A | 10.50 | 3-1-2024 | 200,000 | 211,252 | ||||||||||||
SS&C Technologies Incorporated 144A | 5.50 | 9-30-2027 | 200,000 | 210,500 | ||||||||||||
Veritas US Incorporated 144A | 10.50 | 2-1-2024 | 200,000 | 171,000 | ||||||||||||
| 1,012,752 | ||||||||||||||||
|
| |||||||||||||||
| Technology Hardware, Storage & Peripherals: 1.28% | ||||||||||||||||
Dell Incorporated | 4.63 | 4-1-2021 | 270,000 | 272,768 | ||||||||||||
NCR Corporation 144A | 5.75 | 9-1-2027 | 200,000 | 210,500 | ||||||||||||
Western Digital Corporation | 4.75 | 2-15-2026 | 200,000 | 206,500 | ||||||||||||
| 689,768 | ||||||||||||||||
|
| |||||||||||||||
Materials: 7.03% |
| |||||||||||||||
| Chemicals: 1.46% | ||||||||||||||||
CF Industries Incorporated | 4.95 | 6-1-2043 | 200,000 | 212,160 | ||||||||||||
Chemours Company | 6.63 | 5-15-2023 | 200,000 | 192,666 | ||||||||||||
Olin Corporation | 5.00 | 2-1-2030 | 200,000 | 192,760 | ||||||||||||
Tronox Incorporated 144A | 6.50 | 4-15-2026 | 200,000 | 191,990 | ||||||||||||
| 789,576 | ||||||||||||||||
|
| |||||||||||||||
| Construction Materials: 0.57% | ||||||||||||||||
Standard Industries Incorporated 144A | 5.00 | 2-15-2027 | 300,000 | 307,982 | ||||||||||||
|
| |||||||||||||||
| Containers & Packaging: 3.07% | ||||||||||||||||
Ardagh Holdings USA Incorporated 144A | 5.25 | 8-15-2027 | 200,000 | 203,260 | ||||||||||||
Ball Corporation | 5.25 | 7-1-2025 | 200,000 | 221,166 | ||||||||||||
Berry Global Incorporated 144A | 5.63 | 7-15-2027 | 200,000 | 207,990 | ||||||||||||
BWAY Holding Company 144A | 5.50 | 4-15-2024 | 210,000 | 207,904 | ||||||||||||
Crown Americas Capital Corporation IV | 4.50 | 1-15-2023 | 200,000 | 202,800 | ||||||||||||
Flex Acquisition Company Incorporated 144A | 6.88 | 1-15-2025 | 200,000 | 194,504 | ||||||||||||
Reynolds Group Issuer Incorporated 144A | 5.13 | 7-15-2023 | 200,000 | 202,000 | ||||||||||||
Sealed Air Corporation 144A | 5.50 | 9-15-2025 | 200,000 | 219,000 | ||||||||||||
| 1,658,624 | ||||||||||||||||
|
| |||||||||||||||
| Metals & Mining: 1.93% | ||||||||||||||||
Cleveland-Cliffs Incorporated | 5.75 | 3-1-2025 | 200,000 | 182,000 | ||||||||||||
Freeport-McMoRan Incorporated | 5.25 | 9-1-2029 | 290,000 | 293,045 | ||||||||||||
Freeport-McMoRan Incorporated | 5.40 | 11-14-2034 | 200,000 | 195,071 | ||||||||||||
Novelis Corporation 144A | 4.75 | 1-30-2030 | 200,000 | 196,560 | ||||||||||||
United States Steel Corporation | 6.88 | 8-15-2025 | 200,000 | 173,166 | ||||||||||||
| 1,039,842 | ||||||||||||||||
|
| |||||||||||||||
Real Estate: 3.11% |
| |||||||||||||||
| Equity REITs: 2.55% | ||||||||||||||||
ESH Hospitality Incorporated 144A | 5.25 | 5-1-2025 | 200,000 | 201,166 | ||||||||||||
Iron Mountain Incorporated 144A | 5.25 | 3-15-2028 | 260,000 | 269,178 | ||||||||||||
iStar Incorporated | 4.25 | 8-1-2025 | 200,000 | 198,500 | ||||||||||||
The accompanying notes are an integral part of these financial statements.
Wells Fargo Funds | 169
Table of Contents
Portfolio of investments—February 29, 2020
HIGH YIELD CORPORATE BOND PORTFOLIO
| Interest rate | Maturity date | Principal | Value | |||||||||||||
| Equity REITs (continued) | ||||||||||||||||
MGM Growth Properties Operating Partnership LP | 4.50 | % | 9-1-2026 | $ | 300,000 | $ | 310,500 | |||||||||
Uniti Group Incorporated 144A | 6.00 | 4-15-2023 | 200,000 | 195,500 | ||||||||||||
VICI Properties Incorporated 144A | 4.25 | 12-1-2026 | 200,000 | 202,020 | ||||||||||||
| 1,376,864 | ||||||||||||||||
|
| |||||||||||||||
| Real Estate Management & Development: 0.56% | ||||||||||||||||
Icahn Enterprises Company | 6.25 | 2-1-2022 | 300,000 | 305,136 | ||||||||||||
|
| |||||||||||||||
Utilities: 3.49% |
| |||||||||||||||
| Electric Utilities: 0.67% | ||||||||||||||||
NextEra Energy Operating Partners LP 144A | 4.50 | 9-15-2027 | 210,000 | 219,033 | ||||||||||||
Talen Energy Supply LLC | 6.50 | 6-1-2025 | 200,000 | 143,500 | ||||||||||||
| 362,533 | ||||||||||||||||
|
| |||||||||||||||
| Gas Utilities: 0.85% | ||||||||||||||||
AmeriGas Partners LP | 5.63 | 5-20-2024 | 200,000 | 207,940 | ||||||||||||
Ferrellgas LP | 6.75 | 6-15-2023 | 300,000 | 250,626 | ||||||||||||
| 458,566 | ||||||||||||||||
|
| |||||||||||||||
| Independent Power & Renewable Electricity Producers: 1.97% | ||||||||||||||||
Calpine Corporation 144A | 5.13 | 3-15-2028 | 230,000 | 216,200 | ||||||||||||
NRG Energy Incorporated | 5.75 | 1-15-2028 | 200,000 | 207,760 | ||||||||||||
TerraForm Power Operating LLC 144A | 4.75 | 1-15-2030 | 220,000 | 228,525 | ||||||||||||
The AES Corporation | 5.50 | 4-15-2025 | 200,000 | 204,584 | ||||||||||||
Vistra Operations Company LLC 144A | 5.63 | 2-15-2027 | 200,000 | 205,000 | ||||||||||||
| 1,062,069 | ||||||||||||||||
|
| |||||||||||||||
Total Corporate Bonds and Notes (Cost $44,596,079) |
| 43,124,063 | ||||||||||||||
|
| |||||||||||||||
Yankee Corporate Bonds and Notes: 16.06% |
| |||||||||||||||
Communication Services: 4.76% |
| |||||||||||||||
| Diversified Telecommunication Services: 1.37% | ||||||||||||||||
SFR Group SA 144A | 7.38 | 5-1-2026 | 300,000 | 314,610 | ||||||||||||
Telecom Italia Capital SpA | 6.00 | 9-30-2034 | 200,000 | 222,500 | ||||||||||||
Virgin Media Finance plc 144A | 6.00 | 10-15-2024 | 200,000 | 204,394 | ||||||||||||
| 741,504 | ||||||||||||||||
|
| |||||||||||||||
| Media: 2.17% | ||||||||||||||||
Altice Finco SA 144A | 7.63 | 2-15-2025 | 320,000 | 333,200 | ||||||||||||
Nielsen Holding and Finance BV 144A | 5.00 | 2-1-2025 | 220,000 | 217,250 | ||||||||||||
UPC Holding BV 144A | 5.50 | 1-15-2028 | 200,000 | 202,820 | ||||||||||||
Videotron Limited 144A | 5.13 | 4-15-2027 | 200,000 | 209,741 | ||||||||||||
Ziggo BV 144A | 4.88 | 1-15-2030 | 200,000 | 206,571 | ||||||||||||
| 1,169,582 | ||||||||||||||||
|
| |||||||||||||||
| Wireless Telecommunication Services: 1.22% | ||||||||||||||||
C&W Senior Financing Designated Activity 144A | 6.88 | 9-15-2027 | 200,000 | 211,000 | ||||||||||||
VEON Holdings BV 144A | 4.00 | 4-9-2025 | 210,000 | 215,513 | ||||||||||||
Vodafone Group plc (5 Year USD Swap +4.87%)± | 7.00 | 4-4-2079 | 200,000 | 231,015 | ||||||||||||
| 657,528 | ||||||||||||||||
|
| |||||||||||||||
The accompanying notes are an integral part of these financial statements.
170 | Wells Fargo Funds
Table of Contents
Portfolio of investments—February 29, 2020
HIGH YIELD CORPORATE BOND PORTFOLIO
| Interest rate | Maturity date | Principal | Value | |||||||||||||
Consumer Discretionary: 3.00% |
| |||||||||||||||
| Auto Components: 0.32% | ||||||||||||||||
Adient Global Holdings Limited 144A | 4.88 | % | 8-15-2026 | $ | 200,000 | $ | 172,500 | |||||||||
|
| |||||||||||||||
| Automobiles: 1.17% | ||||||||||||||||
Fiat Chrysler Automobiles NV | 5.25 | 4-15-2023 | 200,000 | 209,002 | ||||||||||||
IHO Verwaltungs GmbH (PIK at 7.13%) 144A¥ | 6.38 | 5-15-2029 | 240,000 | 253,200 | ||||||||||||
Jaguar Land Rover Automotive plc 144A | 4.50 | 10-1-2027 | 200,000 | 168,750 | ||||||||||||
| 630,952 | ||||||||||||||||
|
| |||||||||||||||
| Hotels, Restaurants & Leisure: 1.18% | ||||||||||||||||
International Game Technology plc 144A | 6.50 | 2-15-2025 | 200,000 | 216,500 | ||||||||||||
MGM China Holdings Limited 144A | 5.88 | 5-15-2026 | 220,000 | 222,750 | ||||||||||||
Wynn Macau Limited 144A | 5.13 | 12-15-2029 | 200,000 | 196,000 | ||||||||||||
| 635,250 | ||||||||||||||||
|
| |||||||||||||||
| Leisure Products: 0.33% | ||||||||||||||||
VOC Escrow Limited 144A | 5.00 | 2-15-2028 | 200,000 | 178,500 | ||||||||||||
|
| |||||||||||||||
Energy: 2.02% |
| |||||||||||||||
| Energy Equipment & Services: 0.90% | ||||||||||||||||
Alcoa Nederland Holding Company BV 144A | 6.75 | 9-30-2024 | 200,000 | 205,004 | ||||||||||||
Noble Holding International Limited | 8.95 | 4-1-2045 | 200,000 | 70,000 | ||||||||||||
Valaris plc | 4.88 | 6-1-2022 | 200,000 | 130,000 | ||||||||||||
Valaris plc | 7.75 | 2-1-2026 | 200,000 | 78,990 | ||||||||||||
| 483,994 | ||||||||||||||||
|
| |||||||||||||||
| Oil, Gas & Consumable Fuels: 1.12% | ||||||||||||||||
KCA Deutag UK Finance plc 144A | 9.63 | 4-1-2023 | 200,000 | 117,500 | ||||||||||||
MEG Energy Corporation 144A | 6.50 | 1-15-2025 | 300,000 | 295,500 | ||||||||||||
Weatherford International Limited 144A | 11.00 | 12-1-2024 | 200,000 | 193,500 | ||||||||||||
| 606,500 | ||||||||||||||||
|
| |||||||||||||||
Financials: 3.01% |
| |||||||||||||||
| Banks: 1.50% | ||||||||||||||||
Barclays plc | 4.38 | 9-11-2024 | 200,000 | 213,315 | ||||||||||||
Deutsche Bank AG (USD ICE Swap Rate 11:00am NY 5 Year +2.55%)± | 4.88 | 12-1-2032 | 330,000 | 314,150 | ||||||||||||
Intesa Sanpaolo SpA 144A | 5.71 | 1-15-2026 | 260,000 | 282,803 | ||||||||||||
| 810,268 | ||||||||||||||||
|
| |||||||||||||||
| Diversified Financial Services: 1.51% | ||||||||||||||||
Global Aircraft Leasing Company Limited 144A | 6.50 | 9-15-2024 | 200,000 | 196,375 | ||||||||||||
Intelsat Jackson Holdings SA 144A | 8.00 | 2-15-2024 | 200,000 | 205,000 | ||||||||||||
New Red Finance Incorporated 144A | 5.00 | 10-15-2025 | 200,000 | 200,916 | ||||||||||||
Trivium Packaging Finance BV 144A | 8.50 | 8-15-2027 | 200,000 | 210,260 | ||||||||||||
| 812,551 | ||||||||||||||||
|
| |||||||||||||||
Health Care: 1.06% |
| |||||||||||||||
| Pharmaceuticals: 1.06% | ||||||||||||||||
Bausch Health Companies Incorporated 144A | 7.25 | 5-30-2029 | 220,000 | 242,000 | ||||||||||||
Bausch Health Companies Incorporated 144A | 8.50 | 1-31-2027 | 300,000 | 329,184 | ||||||||||||
| 571,184 | ||||||||||||||||
|
| |||||||||||||||
The accompanying notes are an integral part of these financial statements.
Wells Fargo Funds | 171
Table of Contents
Portfolio of investments—February 29, 2020
HIGH YIELD CORPORATE BOND PORTFOLIO
| Interest rate | Maturity date | Principal | Value | |||||||||||||
Industrials: 1.31% |
| |||||||||||||||
| Aerospace & Defense: 0.54% | ||||||||||||||||
Bombardier Incorporated 144A | 6.00 | % | 10-15-2022 | $ | 300,000 | $ | 293,813 | |||||||||
|
| |||||||||||||||
| Electrical Equipment: 0.39% | ||||||||||||||||
Sensata Technologies BV 144A | 5.00 | 10-1-2025 | 200,000 | 210,520 | ||||||||||||
|
| |||||||||||||||
| Professional Services: 0.38% | ||||||||||||||||
GFL Environmental Incorporated 144A | 5.38 | 3-1-2023 | 200,000 | 204,000 | ||||||||||||
|
| |||||||||||||||
Information Technology: 0.37% |
| |||||||||||||||
| Software: 0.37% | ||||||||||||||||
Open Text Corporation 144A | 5.63 | 1-15-2023 | 200,000 | 202,380 | ||||||||||||
|
| |||||||||||||||
Materials: 0.53% |
| |||||||||||||||
| Metals & Mining: 0.53% | ||||||||||||||||
FMG Resources Proprietary Limited 144A | 5.13 | 3-15-2023 | 280,000 | 287,756 | ||||||||||||
|
| |||||||||||||||
Total Yankee Corporate Bonds and Notes (Cost $8,870,986) |
| 8,668,782 | ||||||||||||||
|
| |||||||||||||||
| Yield | Shares | |||||||||||||||
| Short-Term Investments: 2.48% | ||||||||||||||||
| Investment Companies: 2.48% | ||||||||||||||||
Wells Fargo Government Money Market Fund Select Class (l)(u) | 1.52 | 1,339,300 | 1,339,300 | |||||||||||||
|
| |||||||||||||||
Total Short-Term Investments (Cost $1,339,300) |
| 1,339,300 | ||||||||||||||
|
| |||||||||||||||
| Total investments in securities (Cost $54,806,365) | 98.41 | % | 53,132,145 | |||||
Other assets and liabilities, net | 1.59 | 856,887 | ||||||
|
|
|
| |||||
| Total net assets | 100.00 | % | $ | 53,989,032 | ||||
|
|
|
| |||||
| 144A | The security may be resold in transactions exempt from registration, normally to qualified institutional buyers, pursuant to Rule 144A under the Securities Act of 1933. |
| ± | Variable rate investment. The rate shown is the rate in effect at period end. |
| ¥ | Apayment-in-kind (PIK) security is a security in which the issuer may make interest or dividend payments in cash or additional securities or a combination of both. The rate shown is the rate in effect at period end. |
| (l) | The issuer of the security is an affiliated person of the Portfolio as defined in the Investment Company Act of 1940. |
| (u) | The rate represents the7-day annualized yield at period end. |
Abbreviations:
| LIBOR | London Interbank Offered Rate |
| REIT | Real estate investment trust |
The accompanying notes are an integral part of these financial statements.
172 | Wells Fargo Funds
Table of Contents
Portfolio of investments—February 29, 2020
HIGH YIELD CORPORATE BOND PORTFOLIO
Investments in Affiliates
An affiliated investment is an investment in which the Portfolio owns at least 5% of the outstanding voting shares of the issuer or as a result of other relationships, such as the Portfolio and the issuer having the same adviser or investment manager. Transactions with issuers that were either affiliated persons of the Portfolio at the beginning of the period or the end of the period were as follows:
| Shares, beginning of period | Shares purchased | Shares sold | Shares, end of period | Net realized gains (losses) | Net change in unrealized gains (losses) | Income from affiliated securities | Value, end of period | % of net assets | ||||||||||||||||||||||||||||
| Short-Term Investments | ||||||||||||||||||||||||||||||||||||
Investment Companies | ||||||||||||||||||||||||||||||||||||
Wells Fargo Government Money Market Fund Select Class | 486,162 | 17,422,603 | (16,569,465 | ) | 1,339,300 | $ | 0 | $ | 0 | $ | 16,925 | $ | 1,339,300 | 2.48 | % | |||||||||||||||||||||
The accompanying notes are an integral part of these financial statements.
Wells Fargo Funds | 173
Table of Contents
Portfolio of investments—February 29, 2020
INTERNATIONAL GOVERNMENT BOND PORTFOLIO
Interest rate | Maturity date | Principal | Value | |||||||||||||
| Foreign Government Bonds: 99.15% | ||||||||||||||||
Australian Government Bond Series 145 | 2.75 | % | 6-21-2035 | AUD | 350,000 | $ | 283,484 | |||||||||
Australian Government Bond Series 150 | 3.00 | 3-21-2047 | AUD | 190,000 | 168,003 | |||||||||||
Belgium Government Bond Series 71 | 3.75 | 6-22-2045 | EUR | 220,000 | 444,664 | |||||||||||
Bundesrepublik Deutschland | 0.01 | 2-15-2030 | EUR | 100,000 | 117,337 | |||||||||||
Bundesrepublik Deutschland | 0.25 | 8-15-2028 | EUR | 100,000 | 119,435 | |||||||||||
Canada Government | 2.75 | 12-1-2048 | CAD | 300,000 | 300,644 | |||||||||||
Canada Government | 5.00 | 6-1-2037 | CAD | 100,000 | 117,387 | |||||||||||
Czech Republic | 3.85 | 9-29-2021 | CZK | 2,380,000 | 106,732 | |||||||||||
Finland Government Bond 144A | 0.01 | 9-15-2023 | EUR | 390,000 | 441,008 | |||||||||||
France Government Bond 144A | 1.25 | 5-25-2036 | EUR | 370,000 | 489,092 | |||||||||||
France Government Bond 144A | 1.50 | 5-25-2050 | EUR | 280,000 | 402,928 | |||||||||||
Ireland Government Bond Series 2023 | 3.90 | 3-20-2023 | EUR | 160,000 | 200,734 | |||||||||||
Italy Buoni Poliennali del Tesoro 144A | 3.35 | 3-1-2035 | EUR | 280,000 | 382,717 | |||||||||||
Italy Buoni Poliennali del Tesoro 144A | 3.85 | 9-1-2049 | EUR | 327,000 | 499,085 | |||||||||||
Japan Government 5 Year Bond | 0.10 | 6-20-2021 | JPY | 196,000,000 | 1,824,968 | |||||||||||
Japan Government 5 Year Bond Series 136 | 0.10 | 6-20-2023 | JPY | 49,000,000 | 459,885 | |||||||||||
Korea Treasury Bond | 3.75 | 12-10-2033 | KRW | 105,000,000 | 112,266 | |||||||||||
Korea Treasury Bond | 4.00 | 12-10-2031 | KRW | 315,000,000 | 333,660 | |||||||||||
Malaysia Government Bond | 4.23 | 6-30-2031 | MYR | 1,240,000 | 327,867 | |||||||||||
Mexico | 8.00 | 12-7-2023 | MXN | 7,780,000 | 413,317 | |||||||||||
Netherlands Government Bond 144A | 0.25 | 7-15-2029 | EUR | 370,000 | 437,167 | |||||||||||
New Zealand Government Bond | 2.75 | 4-15-2037 | NZD | 150,000 | 112,572 | |||||||||||
Norway Government Bond Series 480 144A | 2.00 | 4-26-2028 | NOK | 980,000 | 111,427 | |||||||||||
Poland Series 0428 | 2.75 | 4-25-2028 | PLN | 1,260,000 | 345,401 | |||||||||||
Republic of Austria 144A | 0.50 | 2-20-2029 | EUR | 390,000 | 465,224 | |||||||||||
Russia Government Bond | 7.70 | 3-16-2039 | RUB | 11,790,000 | 197,463 | |||||||||||
Singapore Government Bond | 2.88 | 7-1-2029 | SGD | 280,000 | 227,435 | |||||||||||
Spain Government Bond 144A | 1.40 | 7-30-2028 | EUR | 370,000 | 450,419 | |||||||||||
Switzerland Bond | 4.00 | 2-11-2023 | CHF | 100,000 | 118,677 | |||||||||||
Thailand Government Bond | 2.40 | 12-17-2023 | THB | 6,650,000 | 222,457 | |||||||||||
United Kingdom Gilt | 0.75 | 7-22-2023 | GBP | 680,000 | 884,725 | |||||||||||
Total Foreign Government Bonds (Cost $11,135,469) |
| 11,118,180 | ||||||||||||||
|
| |||||||||||||||
| Yield | Shares | |||||||||||||||
| Short-Term Investments: 0.46% | ||||||||||||||||
| Investment Companies: 0.46% | ||||||||||||||||
Wells Fargo Government Money Market Fund Select Class (l)(u) | 1.52 | 51,894 | 51,894 | |||||||||||||
|
| |||||||||||||||
Total Short-Term Investments (Cost $51,894) |
| 51,894 | ||||||||||||||
|
| |||||||||||||||
| Total investments in securities (Cost $11,187,363) | 99.61 | % | 11,170,074 | |||||
Other assets and liabilities, net | 0.39 | 44,201 | ||||||
|
|
|
| |||||
| Total net assets | 100.00 | % | $ | 11,214,275 | ||||
|
|
|
| |||||
| 144A | The security may be resold in transactions exempt from registration, normally to qualified institutional buyers, pursuant to Rule 144A under the Securities Act of 1933. |
| (l) | The issuer of the security is an affiliated person of the Portfolio as defined in the Investment Company Act of 1940. |
| (u) | The rate represents the7-day annualized yield at period end. |
The accompanying notes are an integral part of these financial statements.
174 | Wells Fargo Funds
Table of Contents
Portfolio of investments—February 29, 2020
INTERNATIONAL GOVERNMENT BOND PORTFOLIO
Abbreviations:
| AUD | Australian dollar |
| CAD | Canadian dollar |
| CHF | Swiss franc |
| CZK | Czech koruna |
| EUR | Euro |
| GBP | Great British pound |
| JPY | Japanese yen |
| KRW | Republic of Korea won |
| MXN | Mexican peso |
| MYR | Malaysian ringgit |
| NOK | Norwegian krone |
| NZD | New Zealand dollar |
| PLN | Polish zloty |
| RUB | Russian ruble |
| SGD | Singapore dollar |
| THB | Thai baht |
Forward Foreign Currency Contracts
| Currency to be received | Currency to be delivered | Counterparty | Settlement date | Unrealized gains | Unrealized losses | |||||||||
| 512,887 USD | 55,800,000 JPY | State Street Bank | 3/6/2020 | $ | 0 | $ | (4,535 | ) | ||||||
| 491,812 USD | 380,000 GBP | State Street Bank | 3/6/2020 | 4,553 | 0 | |||||||||
| 113,337 USD | 155,000 SGD | State Street Bank | 3/6/2020 | 2,056 | 0 | |||||||||
| 108,945 USD | 3,300,000 THB | State Street Bank | 3/6/2020 | 4,361 | 0 | |||||||||
| 106,443 USD | 2,110,000 MXN | State Street Bank | 3/6/2020 | 0 | (707 | ) | ||||||||
| 122,943 USD | 480,000 PLN | State Street Bank | 3/6/2020 | 552 | 0 | |||||||||
| 154,919 USD | 240,000 AUD | State Street Bank | 3/6/2020 | 0 | (1,443 | ) | ||||||||
| 22,614 USD | 220,000 SEK | State Street Bank | 3/6/2020 | 0 | (284 | ) | ||||||||
| 460,000 SEK | 48,359 USD | State Street Bank | 3/6/2020 | 0 | (481 | ) | ||||||||
| 830,000 SEK | 87,190 USD | State Street Bank | 3/6/2020 | 0 | (803 | ) | ||||||||
| 240,000 CAD | 180,708 USD | State Street Bank | 3/6/2020 | 0 | (1,903 | ) | ||||||||
| 475,000 AUD | 322,069 USD | State Street Bank | 3/6/2020 | 0 | (12,603 | ) | ||||||||
| 22,042 USD | 150,000 DKK | State Street Bank | 3/6/2020 | 0 | (121 | ) | ||||||||
| 587,000 EUR | 650,773 USD | State Street Bank | 3/6/2020 | 0 | (2,628 | ) | ||||||||
| 300,000 CZK | 12,947 USD | State Street Bank | 3/6/2020 | 70 | 0 | |||||||||
| 1,450,000 DKK | 215,286 USD | State Street Bank | 3/6/2020 | 0 | (1,041 | ) | ||||||||
| 153,000 CAD | 115,199 USD | State Street Bank | 3/6/2020 | 0 | (1,211 | ) | ||||||||
| 150,000 NOK | 16,311 USD | State Street Bank | 3/6/2020 | 0 | (368 | ) | ||||||||
| 10,000 AUD | 6,801 USD | State Street Bank | 3/6/2020 | 0 | (286 | ) | ||||||||
| 206,621 USD | 13,400,000 RUB | State Street Bank | 3/12/2020 | 6,572 | 0 | |||||||||
| 209,130 USD | 875,000 MYR | State Street Bank | 3/12/2020 | 1,590 | 0 | |||||||||
| 385,000,000 KRW | 324,771 USD | State Street Bank | 3/12/2020 | 0 | (7,729 | ) | ||||||||
| 265,000 EUR | 292,631 USD | State Street Bank | 6/8/2020 | 1,521 | 0 | |||||||||
| 108,614 USD | 175,000 NZD | State Street Bank | 6/8/2020 | 0 | (865 | ) | ||||||||
|
|
|
| |||||||||||
| $ | 21,275 | $ | (37,008 | ) | ||||||||||
|
|
|
| |||||||||||
The accompanying notes are an integral part of these financial statements.
Wells Fargo Funds | 175
Table of Contents
Portfolio of investments—February 29, 2020
INTERNATIONAL GOVERNMENT BOND PORTFOLIO
Investments in Affiliates
An affiliated investment is an investment in which the Portfolio owns at least 5% of the outstanding voting shares of the issuer or as a result of other relationships, such as the Portfolio and the issuer having the same adviser or investment manager. Transactions with issuers that were either affiliated persons of the Portfolio at the beginning of the period or the end of the period were as follows:
| Shares, beginning of period | Shares purchased | Shares sold | Shares, end of period | Net realized gains (losses) | Net change in unrealized gains (losses) | Income from affiliated securities | Value, end of period | % of net assets | ||||||||||||||||||||||||||||
| Short-Term Investments | ||||||||||||||||||||||||||||||||||||
Investment Companies | ||||||||||||||||||||||||||||||||||||
Wells Fargo Government Money Market Fund Select Class | 13,185 | 1,083,316 | (1,044,607 | ) | 51,894 | $ | 0 | $ | 0 | $ | 1,549 | $ | 51,894 | 0.46 | % | |||||||||||||||||||||
The following table shows the percent of total long-term investments by country allocation as of February 29, 2020:
Japan | 20.54 | % | ||
France | 8.02 | |||
United Kingdom | 7.96 | |||
Italy | 7.93 | |||
Austria | 4.18 | |||
Australia | 4.06 | |||
Spain | 4.05 | |||
South Korea | 4.01 | |||
Belgium | 4.00 | |||
Finland | 3.97 | |||
Netherlands | 3.93 | |||
Canada | 3.76 | |||
Mexico | 3.72 | |||
Poland | 3.11 | |||
Malaysia | 2.95 | |||
Germany | 2.13 | |||
Singapore | 2.05 | |||
Thailand | 2.00 | |||
Ireland | 1.81 | |||
Russia | 1.78 | |||
Switzerland | 1.07 | |||
New Zealand | 1.01 | |||
Norway | 1.00 | |||
Czech Republic | 0.96 | |||
|
| |||
| 100.00 | % | |||
|
|
The accompanying notes are an integral part of these financial statements.
176 | Wells Fargo Funds
Table of Contents
Portfolio of investments—February 29, 2020
INVESTMENT GRADE CORPORATE BOND PORTFOLIO
Interest rate | Maturity date | Principal | Value | |||||||||||||
| Corporate Bonds and Notes: 80.01% | ||||||||||||||||
Communication Services: 3.99% |
| |||||||||||||||
| Diversified Telecommunication Services: 0.99% | ||||||||||||||||
AT&T Incorporated | 3.00 | % | 2-15-2022 | $ | 200,000 | $ | 205,400 | |||||||||
AT&T Incorporated | 3.40 | 6-15-2022 | 70,000 | 72,864 | ||||||||||||
AT&T Incorporated | 4.00 | 1-15-2022 | 210,000 | 219,792 | ||||||||||||
AT&T Incorporated | 4.30 | 12-15-2042 | 350,000 | 387,937 | ||||||||||||
AT&T Incorporated | 4.50 | 5-15-2035 | 230,000 | 264,619 | ||||||||||||
AT&T Incorporated | 4.90 | 6-15-2042 | 36,000 | 42,458 | ||||||||||||
Verizon Communications Incorporated | 3.85 | 11-1-2042 | 260,000 | 294,558 | ||||||||||||
Verizon Communications Incorporated | 4.13 | 3-16-2027 | 200,000 | 228,157 | ||||||||||||
Verizon Communications Incorporated | 4.67 | 3-15-2055 | 655,000 | 869,979 | ||||||||||||
| 2,585,764 | ||||||||||||||||
|
| |||||||||||||||
| Entertainment: 0.27% | ||||||||||||||||
Viacom Incorporated | 6.88 | 4-30-2036 | 238,000 | 327,258 | ||||||||||||
Walt Disney Company | 2.55 | 2-15-2022 | 175,000 | 179,492 | ||||||||||||
Walt Disney Company | 4.13 | 12-1-2041 | 175,000 | 214,337 | ||||||||||||
| 721,087 | ||||||||||||||||
|
| |||||||||||||||
| Interactive Media & Services: 0.17% | ||||||||||||||||
Alphabet Incorporated | 3.38 | 2-25-2024 | 87,000 | 94,048 | ||||||||||||
Alphabet Incorporated | 3.63 | 5-19-2021 | 350,000 | 359,744 | ||||||||||||
| 453,792 | ||||||||||||||||
|
| |||||||||||||||
| Media: 2.56% | ||||||||||||||||
CBS Corporation | 3.70 | 8-15-2024 | 350,000 | 375,666 | ||||||||||||
CBS Corporation | 4.85 | 7-1-2042 | 140,000 | 158,757 | ||||||||||||
CBS Corporation | 4.90 | 8-15-2044 | 350,000 | 397,668 | ||||||||||||
Charter Communications Operating LLC | 4.46 | 7-23-2022 | 400,000 | 424,478 | ||||||||||||
Charter Communications Operating LLC | 4.91 | 7-23-2025 | 400,000 | 448,182 | ||||||||||||
Comcast Corporation | 2.35 | 1-15-2027 | 210,000 | 217,053 | ||||||||||||
Comcast Corporation | 3.13 | 7-15-2022 | 350,000 | 364,964 | ||||||||||||
Comcast Corporation | 4.00 | 11-1-2049 | 200,000 | 237,233 | ||||||||||||
Comcast Corporation | 4.40 | 8-15-2035 | 210,000 | 259,648 | ||||||||||||
Comcast Corporation | 4.75 | 3-1-2044 | 262,000 | 338,822 | ||||||||||||
Discovery Communications LLC | 3.30 | 5-15-2022 | 175,000 | 180,905 | ||||||||||||
Discovery Communications LLC | 3.95 | 3-20-2028 | 400,000 | 434,776 | ||||||||||||
Discovery Communications LLC | 4.38 | 6-15-2021 | 210,000 | 217,237 | ||||||||||||
Discovery Communications LLC | 6.35 | 6-1-2040 | 175,000 | 232,569 | ||||||||||||
Fox Corporation 144A | 5.48 | 1-25-2039 | 700,000 | 897,632 | ||||||||||||
Omnicom Group Incorporated | 3.63 | 5-1-2022 | 175,000 | 182,946 | ||||||||||||
Time Warner Cable Incorporated | 5.50 | 9-1-2041 | 210,000 | 245,616 | ||||||||||||
Time Warner Cable Incorporated | 6.55 | 5-1-2037 | 300,000 | 390,818 | ||||||||||||
Time Warner Cable Incorporated | 8.38 | 3-15-2023 | 175,000 | 208,320 | ||||||||||||
Time Warner Entertainment Company LP | 8.38 | 7-15-2033 | 210,000 | 305,301 | ||||||||||||
Viacom Incorporated | 5.50 | 5-15-2033 | 140,000 | 176,403 | ||||||||||||
| 6,694,994 | ||||||||||||||||
|
| |||||||||||||||
Consumer Discretionary: 5.07% |
| |||||||||||||||
| Auto Components: 0.12% | ||||||||||||||||
Lear Corporation | 5.25 | 1-15-2025 | 297,000 | 305,176 | ||||||||||||
|
| |||||||||||||||
The accompanying notes are an integral part of these financial statements.
Wells Fargo Funds | 177
Table of Contents
Portfolio of investments—February 29, 2020
INVESTMENT GRADE CORPORATE BOND PORTFOLIO
Interest rate | Maturity date | Principal | Value | |||||||||||||
| Automobiles: 0.54% | ||||||||||||||||
Ford Motor Company | 7.45 | % | 7-16-2031 | $ | 700,000 | $ | 793,967 | |||||||||
General Motors Company | 6.25 | 10-2-2043 | 175,000 | 198,846 | ||||||||||||
General Motors Company | 6.60 | 4-1-2036 | 350,000 | 420,796 | ||||||||||||
| 1,413,609 | ||||||||||||||||
|
| |||||||||||||||
| Hotels, Restaurants & Leisure: 1.18% | ||||||||||||||||
GLP Capital LP | 5.30 | 1-15-2029 | 400,000 | 462,240 | ||||||||||||
McDonald’s Corporation | 2.63 | 1-15-2022 | 250,000 | 255,624 | ||||||||||||
McDonald’s Corporation | 3.38 | 5-26-2025 | 245,000 | 264,221 | ||||||||||||
McDonald’s Corporation | 3.63 | 5-20-2021 | 70,000 | 71,731 | ||||||||||||
McDonald’s Corporation | 4.60 | 5-26-2045 | 175,000 | 218,347 | ||||||||||||
McDonald’s Corporation | 6.30 | 10-15-2037 | 210,000 | 298,370 | ||||||||||||
Starbucks Corporation | 4.00 | 11-15-2028 | 500,000 | 574,754 | ||||||||||||
Starbucks Corporation | 4.50 | 11-15-2048 | 800,000 | 953,011 | ||||||||||||
| 3,098,298 | ||||||||||||||||
|
| |||||||||||||||
| Household Durables: 0.12% | ||||||||||||||||
Whirlpool Corporation | 4.00 | 3-1-2024 | 87,000 | 94,260 | ||||||||||||
Whirlpool Corporation | 4.70 | 6-1-2022 | 140,000 | 149,346 | ||||||||||||
Whirlpool Corporation | 4.85 | 6-15-2021 | 70,000 | 73,053 | ||||||||||||
| 316,659 | ||||||||||||||||
|
| |||||||||||||||
| Internet & Direct Marketing Retail: 0.79% | ||||||||||||||||
Amazon.com Incorporated | 4.05 | 8-22-2047 | 400,000 | 512,074 | ||||||||||||
Amazon.com Incorporated | 4.25 | 8-22-2057 | 400,000 | 536,144 | ||||||||||||
Amazon.com Incorporated | 4.95 | 12-5-2044 | 300,000 | 411,467 | ||||||||||||
eBay Incorporated | 4.00 | 7-15-2042 | 175,000 | 177,374 | ||||||||||||
Expedia Incorporated | 4.50 | 8-15-2024 | 70,000 | 76,340 | ||||||||||||
QVC Incorporated | 4.38 | 3-15-2023 | 210,000 | 218,726 | ||||||||||||
QVC Incorporated | 5.13 | 7-2-2022 | 140,000 | 148,603 | ||||||||||||
| 2,080,728 | ||||||||||||||||
|
| |||||||||||||||
| Leisure Products: 0.05% | ||||||||||||||||
Hasbro Incorporated | 6.35 | 3-15-2040 | 108,000 | 135,693 | ||||||||||||
|
| |||||||||||||||
| Multiline Retail: 0.73% | ||||||||||||||||
Dollar General Corporation | 3.25 | 4-15-2023 | 245,000 | 257,191 | ||||||||||||
Kohl’s Corporation | 3.25 | 2-1-2023 | 105,000 | 108,227 | ||||||||||||
Macy’s Retail Holdings Incorporated | 3.88 | 1-15-2022 | 140,000 | 143,174 | ||||||||||||
Nordstrom Incorporated | 4.00 | 10-15-2021 | 175,000 | 179,673 | ||||||||||||
Nordstrom Incorporated | 5.00 | 1-15-2044 | 70,000 | 68,176 | ||||||||||||
Target Corporation | 2.90 | 1-15-2022 | 175,000 | 180,301 | ||||||||||||
Target Corporation | 3.63 | 4-15-2046 | 210,000 | 242,943 | ||||||||||||
Target Corporation | 3.90 | 11-15-2047 | 600,000 | 723,863 | ||||||||||||
| 1,903,548 | ||||||||||||||||
|
| |||||||||||||||
| Specialty Retail: 1.48% | ||||||||||||||||
AutoZone Incorporated | 2.88 | 1-15-2023 | 175,000 | 181,722 | ||||||||||||
AutoZone Incorporated | 3.13 | 7-15-2023 | 105,000 | 110,249 | ||||||||||||
Home Depot Incorporated | 3.50 | 9-15-2056 | 260,000 | 294,416 | ||||||||||||
Home Depot Incorporated | 3.75 | 2-15-2024 | 350,000 | 381,748 | ||||||||||||
Home Depot Incorporated | 4.40 | 4-1-2021 | 350,000 | 358,914 | ||||||||||||
Lowe’s Companies Incorporated | 2.50 | 4-15-2026 | 350,000 | 361,568 | ||||||||||||
The accompanying notes are an integral part of these financial statements.
178 | Wells Fargo Funds
Table of Contents
Portfolio of investments—February 29, 2020
INVESTMENT GRADE CORPORATE BOND PORTFOLIO
Interest rate | Maturity date | Principal | Value | |||||||||||||
| Specialty Retail (continued) | ||||||||||||||||
Lowe’s Companies Incorporated | 3.12 | % | 4-15-2022 | $ | 140,000 | $ | 144,064 | |||||||||
Lowe’s Companies Incorporated | 3.75 | 4-15-2021 | 105,000 | 106,993 | ||||||||||||
Lowe’s Companies Incorporated | 3.88 | 9-15-2023 | 175,000 | 188,754 | ||||||||||||
Lowe’s Companies Incorporated | 4.25 | 9-15-2044 | 175,000 | 199,492 | ||||||||||||
Lowe’s Companies Incorporated | 4.38 | 9-15-2045 | 200,000 | 234,854 | ||||||||||||
O’Reilly Automotive Incorporated | 3.80 | 9-1-2022 | 105,000 | 110,270 | ||||||||||||
O’Reilly Automotive Incorporated | 4.63 | 9-15-2021 | 105,000 | 109,180 | ||||||||||||
Unilever Capital Corporation | 2.00 | 7-28-2026 | 500,000 | 521,369 | ||||||||||||
Unilever Capital Corporation | 5.90 | 11-15-2032 | 410,000 | 578,045 | ||||||||||||
| 3,881,638 | ||||||||||||||||
|
| |||||||||||||||
| Textiles, Apparel & Luxury Goods: 0.06% | ||||||||||||||||
Nike Incorporated | 2.25 | 5-1-2023 | 70,000 | 72,188 | ||||||||||||
Nike Incorporated | 3.63 | 5-1-2043 | 70,000 | 79,831 | ||||||||||||
| 152,019 | ||||||||||||||||
|
| |||||||||||||||
Consumer Staples: 6.74% |
| |||||||||||||||
| Beverages: 2.06% | ||||||||||||||||
Anheuser-Busch InBev Finance Company | 4.00 | 1-17-2043 | 210,000 | 226,379 | ||||||||||||
Anheuser-Busch InBev Finance Company | 4.63 | 2-1-2044 | 245,000 | 293,463 | ||||||||||||
Anheuser-Busch InBev Worldwide Incorporated | 3.75 | 7-15-2042 | 252,000 | 269,946 | ||||||||||||
Anheuser-Busch InBev Worldwide Incorporated | 4.75 | 4-15-2058 | 400,000 | 483,536 | ||||||||||||
Constellation Brands Incorporated | 3.15 | 8-1-2029 | 300,000 | 315,703 | ||||||||||||
Constellation Brands Incorporated | 3.75 | 5-1-2021 | 98,000 | 100,714 | ||||||||||||
Constellation Brands Incorporated | 4.25 | 5-1-2023 | 360,000 | 385,381 | ||||||||||||
Keurig Dr Pepper Incorporated | 4.60 | 5-25-2028 | 700,000 | 806,811 | ||||||||||||
Molson Coors Brewing Company | 2.10 | 7-15-2021 | 260,000 | 261,991 | ||||||||||||
PepsiCo Incorporated | 2.75 | 3-5-2022 | 259,000 | 265,600 | ||||||||||||
PepsiCo Incorporated | 3.00 | 8-25-2021 | 175,000 | 179,028 | ||||||||||||
PepsiCo Incorporated | 3.60 | 8-13-2042 | 285,000 | 331,698 | ||||||||||||
PepsiCo Incorporated | 4.00 | 3-5-2042 | 175,000 | 209,184 | ||||||||||||
PepsiCo Incorporated | 4.25 | 10-22-2044 | 140,000 | 175,363 | ||||||||||||
The Coca-Cola Company | 2.55 | 6-1-2026 | 500,000 | 534,299 | ||||||||||||
The Coca-Cola Company | 2.88 | 10-27-2025 | 200,000 | 215,988 | ||||||||||||
The Coca-Cola Company | 3.20 | 11-1-2023 | 280,000 | 299,013 | ||||||||||||
The Coca-Cola Company | 3.30 | 9-1-2021 | 49,000 | 50,576 | ||||||||||||
| 5,404,673 | ||||||||||||||||
|
| |||||||||||||||
| Food & Staples Retailing: 1.22% | ||||||||||||||||
Sysco Corporation | 3.30 | 7-15-2026 | 200,000 | 217,079 | ||||||||||||
Sysco Corporation | 5.38 | 9-21-2035 | 200,000 | 273,070 | ||||||||||||
The Kroger Company | 3.40 | 4-15-2022 | 175,000 | 181,261 | ||||||||||||
The Kroger Company | 3.85 | 8-1-2023 | 175,000 | 188,063 | ||||||||||||
The Kroger Company | 5.00 | 4-15-2042 | 175,000 | 209,817 | ||||||||||||
The Kroger Company | 5.15 | 8-1-2043 | 105,000 | 131,625 | ||||||||||||
The Kroger Company | 6.90 | 4-15-2038 | 210,000 | 298,304 | ||||||||||||
Wal-Mart Stores Incorporated | 4.25 | 4-15-2021 | 350,000 | 361,508 | ||||||||||||
Wal-Mart Stores Incorporated | 4.88 | 7-8-2040 | 175,000 | 239,336 | ||||||||||||
Wal-Mart Stores Incorporated | 5.63 | 4-1-2040 | 180,000 | 266,322 | ||||||||||||
Wal-Mart Stores Incorporated | 5.88 | 4-5-2027 | 70,000 | 88,968 | ||||||||||||
Walgreens Boots Alliance Incorporated | 3.45 | 6-1-2026 | 200,000 | 210,290 | ||||||||||||
Walgreens Boots Alliance Incorporated | 3.80 | 11-18-2024 | 200,000 | 213,712 | ||||||||||||
Walgreens Boots Alliance Incorporated | 4.80 | 11-18-2044 | 300,000 | 313,106 | ||||||||||||
| 3,192,461 | ||||||||||||||||
|
| |||||||||||||||
The accompanying notes are an integral part of these financial statements.
Wells Fargo Funds | 179
Table of Contents
Portfolio of investments—February 29, 2020
INVESTMENT GRADE CORPORATE BOND PORTFOLIO
Interest rate | Maturity date | Principal | Value | |||||||||||||
| Food Products: 1.42% | ||||||||||||||||
Archer-Daniels-Midland Company | 4.54 | % | 3-26-2042 | $ | 175,000 | $ | 221,344 | |||||||||
Campbell Soup Company | 2.50 | 8-2-2022 | 85,000 | 86,624 | ||||||||||||
Conagra Brands Incorporated | 4.60 | 11-1-2025 | 200,000 | 223,738 | ||||||||||||
Conagra Brands Incorporated | 4.85 | 11-1-2028 | 600,000 | 697,153 | ||||||||||||
Conagra Foods Incorporated | 8.25 | 9-15-2030 | 84,000 | 121,345 | ||||||||||||
General Mills Incorporated | 3.65 | 2-15-2024 | 175,000 | 187,627 | ||||||||||||
General Mills Incorporated | 4.20 | 4-17-2028 | 800,000 | 921,790 | ||||||||||||
J.M. Smucker Company | 3.50 | 10-15-2021 | 210,000 | 216,678 | ||||||||||||
Mead Johnson Nutrition Company | 5.90 | 11-1-2039 | 70,000 | 102,412 | ||||||||||||
Tyson Foods Incorporated | 4.35 | 3-1-2029 | 300,000 | 352,245 | ||||||||||||
Tyson Foods Incorporated | 4.50 | 6-15-2022 | 350,000 | 371,005 | ||||||||||||
Tyson Foods Incorporated | 4.88 | 8-15-2034 | 175,000 | 217,037 | ||||||||||||
| 3,718,998 | ||||||||||||||||
|
| |||||||||||||||
| Household Products: 0.73% | ||||||||||||||||
Clorox Company | 3.05 | 9-15-2022 | 113,000 | 117,139 | ||||||||||||
Clorox Company | 3.50 | 12-15-2024 | 140,000 | 152,734 | ||||||||||||
Colgate-Palmolive Company | 2.30 | 5-3-2022 | 350,000 | 358,414 | ||||||||||||
Kimberly-Clark Corporation | 2.40 | 6-1-2023 | 105,000 | 108,699 | ||||||||||||
Kimberly-Clark Corporation | 6.63 | 8-1-2037 | 140,000 | 215,359 | ||||||||||||
Procter & Gamble Company | 2.45 | 11-3-2026 | 900,000 | 971,895 | ||||||||||||
| 1,924,240 | ||||||||||||||||
|
| |||||||||||||||
| Personal Products: 0.08% | ||||||||||||||||
Estee Lauder Companies Incorporated | 6.00 | 5-15-2037 | 140,000 | 203,650 | ||||||||||||
|
| |||||||||||||||
| Tobacco: 1.23% | ||||||||||||||||
Altria Group Incorporated | 4.00 | 1-31-2024 | 62,000 | 67,051 | ||||||||||||
Altria Group Incorporated | 4.25 | 8-9-2042 | 350,000 | 356,358 | ||||||||||||
Altria Group Incorporated | 4.50 | 5-2-2043 | 175,000 | 182,161 | ||||||||||||
Altria Group Incorporated | 4.75 | 5-5-2021 | 200,000 | 207,339 | ||||||||||||
Philip Morris International Incorporated | 2.50 | 8-22-2022 | 175,000 | 179,735 | ||||||||||||
Philip Morris International Incorporated | 2.63 | 3-6-2023 | 122,000 | 126,149 | ||||||||||||
Philip Morris International Incorporated | 3.25 | 11-10-2024 | 210,000 | 223,425 | ||||||||||||
Philip Morris International Incorporated | 4.13 | 3-4-2043 | 210,000 | 237,445 | ||||||||||||
Philip Morris International Incorporated | 4.25 | 11-10-2044 | 210,000 | 243,176 | ||||||||||||
Philip Morris International Incorporated | 4.50 | 3-20-2042 | 140,000 | 164,340 | ||||||||||||
Reynolds American Incorporated | 4.00 | 6-12-2022 | 280,000 | 294,073 | ||||||||||||
Reynolds American Incorporated | 4.45 | 6-12-2025 | 350,000 | 386,435 | ||||||||||||
Reynolds American Incorporated | 5.70 | 8-15-2035 | 210,000 | 250,781 | ||||||||||||
Reynolds American Incorporated | 6.15 | 9-15-2043 | 87,000 | 104,952 | ||||||||||||
Reynolds American Incorporated | 7.25 | 6-15-2037 | 140,000 | 185,553 | ||||||||||||
| 3,208,973 | ||||||||||||||||
|
| |||||||||||||||
| Energy: 7.72% | ||||||||||||||||
| Energy Equipment & Services: 0.43% | ||||||||||||||||
Halliburton Company | 3.50 | 8-1-2023 | 350,000 | 368,517 | ||||||||||||
Halliburton Company | 3.80 | 11-15-2025 | 350,000 | 383,872 | ||||||||||||
Halliburton Company | 4.50 | 11-15-2041 | 175,000 | 186,145 | ||||||||||||
Halliburton Company | 4.75 | 8-1-2043 | 175,000 | 188,853 | ||||||||||||
| 1,127,387 | ||||||||||||||||
|
| |||||||||||||||
The accompanying notes are an integral part of these financial statements.
180 | Wells Fargo Funds
Table of Contents
Portfolio of investments—February 29, 2020
INVESTMENT GRADE CORPORATE BOND PORTFOLIO
Interest rate | Maturity date | Principal | Value | |||||||||||||
| Oil, Gas & Consumable Fuels: 7.29% | ||||||||||||||||
Apache Corporation | 3.25 | % | 4-15-2022 | $ | 253,000 | $ | 258,042 | |||||||||
Apache Corporation | 5.25 | 2-1-2042 | 70,000 | 70,469 | ||||||||||||
Boardwalk Pipelines LP | 3.38 | 2-1-2023 | 70,000 | 72,275 | ||||||||||||
BP Capital Markets America Incorporated | 3.94 | 9-21-2028 | 200,000 | 226,371 | ||||||||||||
Cheniere Corpus Christi Holdings LLC | 5.13 | 6-30-2027 | 1,500,000 | 1,629,197 | ||||||||||||
Chevron Corporation | 2.10 | 5-16-2021 | 260,000 | 262,391 | ||||||||||||
Chevron Corporation | 2.36 | 12-5-2022 | 525,000 | 538,018 | ||||||||||||
Columbia Pipeline Group Incorporated | 5.80 | 6-1-2045 | 140,000 | 189,322 | ||||||||||||
ConocoPhillips Company | 4.30 | 11-15-2044 | 210,000 | 251,599 | ||||||||||||
ConocoPhillips Company | 5.90 | 10-15-2032 | 175,000 | 234,909 | ||||||||||||
ConocoPhillips Company | 6.95 | 4-15-2029 | 210,000 | 286,383 | ||||||||||||
Devon Energy Corporation | 7.95 | 4-15-2032 | 150,000 | 209,356 | ||||||||||||
Enbridge Energy Partners LP | 5.50 | 9-15-2040 | 140,000 | 180,780 | ||||||||||||
Energy Transfer Partners LP | 4.75 | 1-15-2026 | 280,000 | 308,506 | ||||||||||||
Energy Transfer Partners LP | 4.90 | 2-1-2024 | 210,000 | 228,806 | ||||||||||||
Energy Transfer Partners LP | 5.95 | 10-1-2043 | 140,000 | 155,530 | ||||||||||||
Energy Transfer Partners LP | 7.50 | 7-1-2038 | 70,000 | 90,232 | ||||||||||||
Enterprise Products Operating LLC | 4.45 | 2-15-2043 | 355,000 | 392,511 | ||||||||||||
Enterprise Products Operating LLC | 4.85 | 3-15-2044 | 280,000 | 329,312 | ||||||||||||
Enterprise Products Operating LLC | 5.70 | 2-15-2042 | 140,000 | 174,371 | ||||||||||||
Enterprise Products Operating LLC | 5.95 | 2-1-2041 | 70,000 | 90,741 | ||||||||||||
Enterprise Products Operating LLC | 7.55 | 4-15-2038 | 70,000 | 104,629 | ||||||||||||
EQT Corporation | 4.88 | 11-15-2021 | 210,000 | 207,375 | ||||||||||||
Exxon Mobil Corporation | 2.71 | 3-6-2025 | 350,000 | 367,571 | ||||||||||||
Exxon Mobil Corporation | 3.04 | 3-1-2026 | 500,000 | 538,501 | ||||||||||||
Hess Corporation | 7.30 | 8-15-2031 | 269,000 | 344,156 | ||||||||||||
Kinder Morgan Energy Partners LP | 3.45 | 2-15-2023 | 175,000 | 182,737 | ||||||||||||
Kinder Morgan Energy Partners LP | 5.00 | 8-15-2042 | 175,000 | 194,354 | ||||||||||||
Kinder Morgan Energy Partners LP | 5.00 | 3-1-2043 | 157,000 | 171,433 | ||||||||||||
Kinder Morgan Energy Partners LP | 5.50 | 3-1-2044 | 210,000 | 251,014 | ||||||||||||
Kinder Morgan Energy Partners LP | 5.80 | 3-15-2035 | 70,000 | 84,621 | ||||||||||||
Magellan Midstream Partners LP | 5.15 | 10-15-2043 | 140,000 | 171,549 | ||||||||||||
Marathon Oil Corporation | 3.85 | 6-1-2025 | 245,000 | 258,873 | ||||||||||||
Marathon Oil Corporation | 5.20 | 6-1-2045 | 140,000 | 156,564 | ||||||||||||
Marathon Petroleum Corporation | 3.63 | 9-15-2024 | 350,000 | 373,819 | ||||||||||||
Marathon Petroleum Corporation | 3.80 | 4-1-2028 | 385,000 | 408,229 | ||||||||||||
Marathon Petroleum Corporation | 5.13 | 3-1-2021 | 24,000 | 24,682 | ||||||||||||
MPLX LP | 4.13 | 3-1-2027 | 200,000 | 214,443 | ||||||||||||
MPLX LP | 4.88 | 6-1-2025 | 200,000 | 222,194 | ||||||||||||
MPLX LP | 4.90 | 4-15-2058 | 1,100,000 | 1,099,904 | ||||||||||||
MPLX LP | 5.20 | 3-1-2047 | 220,000 | 231,883 | ||||||||||||
NextEra Energy Capital | 4.50 | 6-1-2021 | 140,000 | 144,330 | ||||||||||||
Noble Energy Incorporated | 3.90 | 11-15-2024 | 210,000 | 223,867 | ||||||||||||
Occidental Petroleum Corporation | 3.00 | 2-15-2027 | 200,000 | 199,534 | ||||||||||||
Occidental Petroleum Corporation | 3.50 | 6-15-2025 | 200,000 | 206,547 | ||||||||||||
Occidental Petroleum Corporation | 4.40 | 4-15-2046 | 200,000 | 181,221 | ||||||||||||
ONEOK Incorporated | 4.00 | 7-13-2027 | 200,000 | 217,590 | ||||||||||||
ONEOK Incorporated | 4.55 | 7-15-2028 | 500,000 | 560,056 | ||||||||||||
ONEOK Partners LP | 3.38 | 10-1-2022 | 350,000 | 362,065 | ||||||||||||
Phillips 66 | 4.65 | 11-15-2034 | 140,000 | 165,915 | ||||||||||||
Plains All American Pipeline LP | 3.60 | 11-1-2024 | 210,000 | 217,616 | ||||||||||||
Plains All American Pipeline LP | 3.85 | 10-15-2023 | 350,000 | 364,475 | ||||||||||||
Plains All American Pipeline LP | 4.90 | 2-15-2045 | 175,000 | 166,033 | ||||||||||||
Plains All American Pipeline LP | 6.65 | 1-15-2037 | 140,000 | 165,590 | ||||||||||||
The accompanying notes are an integral part of these financial statements.
Wells Fargo Funds | 181
Table of Contents
Portfolio of investments—February 29, 2020
INVESTMENT GRADE CORPORATE BOND PORTFOLIO
Interest rate | Maturity date | Principal | Value | |||||||||||||
| Oil, Gas & Consumable Fuels (continued) | ||||||||||||||||
Sabine Pass Liquefaction LLC | 5.00 | % | 3-15-2027 | $ | 400,000 | $ | 441,463 | |||||||||
Sabine Pass Liquefaction LLC | 5.63 | 3-1-2025 | 200,000 | 226,458 | ||||||||||||
Sabine Pass Liquefaction LLC | 5.88 | 6-30-2026 | 200,000 | 230,341 | ||||||||||||
Spectra Energy Partners LP | 3.38 | 10-15-2026 | 300,000 | 322,293 | ||||||||||||
Spectra Energy Partners LP | 4.75 | 3-15-2024 | 245,000 | 269,529 | ||||||||||||
Sunoco Logistics Partner LP | 3.45 | 1-15-2023 | 140,000 | 144,487 | ||||||||||||
Sunoco Logistics Partner LP | 4.95 | 1-15-2043 | 105,000 | 103,935 | ||||||||||||
Sunoco Logistics Partner LP | 5.35 | 5-15-2045 | 140,000 | 144,538 | ||||||||||||
TC Pipelines LP | 4.65 | 6-15-2021 | 210,000 | 215,809 | ||||||||||||
Tennessee Gas Pipeline Company | 7.00 | 10-15-2028 | 175,000 | 228,698 | ||||||||||||
Valero Energy Corporation | 7.50 | 4-15-2032 | 710,000 | 984,506 | ||||||||||||
Western Gas Partners LP | 4.00 | 7-1-2022 | 280,000 | 286,756 | ||||||||||||
Williams Partners LP | 3.35 | 8-15-2022 | 175,000 | 181,646 | ||||||||||||
Williams Partners LP | 6.30 | 4-15-2040 | 273,000 | 336,809 | ||||||||||||
| 19,079,759 | ||||||||||||||||
|
| |||||||||||||||
Financials: 17.89% |
| |||||||||||||||
| Banks: 6.55% | ||||||||||||||||
ABB Finance (USA) Incorporated | 4.38 | 5-8-2042 | 26,000 | 33,241 | ||||||||||||
Australia & New Zealand Banking Group Limited | 2.55 | 11-23-2021 | 250,000 | 254,373 | ||||||||||||
Australia & New Zealand Banking Group Limited | 2.63 | 5-19-2022 | 300,000 | 309,155 | ||||||||||||
Australia & New Zealand Banking Group Limited | 2.63 | 11-9-2022 | 500,000 | 516,343 | ||||||||||||
Bank of America Corporation | 3.25 | 10-21-2027 | 525,000 | 563,986 | ||||||||||||
Bank of America Corporation (3 Month LIBOR +1.19%)± | 3.95 | 1-23-2049 | 200,000 | 241,850 | ||||||||||||
Bank of America Corporation | 4.18 | 11-25-2027 | 560,000 | 621,991 | ||||||||||||
Bank of America Corporation | 4.25 | 10-22-2026 | 280,000 | 312,600 | ||||||||||||
Bank One Corporation | 7.63 | 10-15-2026 | 168,000 | 222,522 | ||||||||||||
Capital One Bank Corporation | 2.28 | 1-28-2026 | 1,350,000 | 1,373,439 | ||||||||||||
Citigroup Incorporated | 2.75 | 4-25-2022 | 200,000 | 204,572 | ||||||||||||
Citigroup Incorporated | 4.60 | 3-9-2026 | 200,000 | 226,337 | ||||||||||||
Citigroup Incorporated | 4.65 | 7-30-2045 | 300,000 | 392,266 | ||||||||||||
Citigroup Incorporated | 4.75 | 5-18-2046 | 300,000 | 378,463 | ||||||||||||
Citizens Financial Group Incorporated | 4.30 | 12-3-2025 | 200,000 | 223,252 | ||||||||||||
Compass Bank | 3.88 | 4-10-2025 | 250,000 | 269,517 | ||||||||||||
Deutsche Bank | 3.95 | 2-27-2023 | 300,000 | 311,432 | ||||||||||||
Discover Bank | 4.20 | 8-8-2023 | 310,000 | 333,265 | ||||||||||||
Discover Bank | 4.25 | 3-13-2026 | 250,000 | 280,717 | ||||||||||||
Discover Bank | 4.65 | 9-13-2028 | 250,000 | 291,579 | ||||||||||||
Fifth Third Bank | 3.95 | 3-14-2028 | 400,000 | 457,402 | ||||||||||||
Fifth Third Bank | 2.25 | 6-14-2021 | 200,000 | 202,168 | ||||||||||||
Fifth Third Bank | 2.88 | 10-1-2021 | 300,000 | 307,031 | ||||||||||||
Huntington Bancshares Incorporated | 2.30 | 1-14-2022 | 300,000 | 302,879 | ||||||||||||
JPMorgan Chase & Company | 2.95 | 10-1-2026 | 325,000 | 344,542 | ||||||||||||
JPMorgan Chase & Company | 3.20 | 1-25-2023 | 200,000 | 209,675 | ||||||||||||
JPMorgan Chase & Company | 4.13 | 12-15-2026 | 500,000 | 562,583 | ||||||||||||
JPMorgan Chase & Company (3 Month LIBOR +1.58%)± | 4.26 | 2-22-2048 | 240,000 | 300,201 | ||||||||||||
Key Bank NA | 3.18 | 10-15-2027 | 250,000 | 258,428 | ||||||||||||
Key Bank NA | 3.30 | 6-1-2025 | 250,000 | 270,510 | ||||||||||||
KeyCorp Incorporated | 4.10 | 4-30-2028 | 400,000 | 455,377 | ||||||||||||
KeyCorp Incorporated | 5.10 | 3-24-2021 | 300,000 | 310,831 | ||||||||||||
Truist Financial Corporation | 2.05 | 5-10-2021 | 210,000 | 211,398 | ||||||||||||
Truist Financial Corporation | 2.85 | 10-26-2024 | 500,000 | 526,295 | ||||||||||||
Truist Financial Corporation | 3.30 | 5-15-2026 | 200,000 | 216,128 | ||||||||||||
Truist Financial Corporation | 3.80 | 10-30-2026 | 400,000 | 449,186 | ||||||||||||
The accompanying notes are an integral part of these financial statements.
182 | Wells Fargo Funds
Table of Contents
Portfolio of investments—February 29, 2020
INVESTMENT GRADE CORPORATE BOND PORTFOLIO
Interest rate | Maturity date | Principal | Value | |||||||||||||
| Banks (continued) | ||||||||||||||||
People’s United Financial Incorporated | 3.65 | % | 12-6-2022 | $ | 105,000 | $ | 109,719 | |||||||||
PNC Bank NA | 2.15 | 4-29-2021 | 250,000 | 252,223 | ||||||||||||
PNC Bank NA | 2.95 | 1-30-2023 | 300,000 | 311,062 | ||||||||||||
PNC Bank NA | 3.30 | 10-30-2024 | 500,000 | 537,921 | ||||||||||||
PNC Bank NA | 4.20 | 11-1-2025 | 250,000 | 282,175 | ||||||||||||
Santander Holdings USA Incorporated | 4.50 | 7-17-2025 | 350,000 | 384,607 | ||||||||||||
Santander UK Group Holdings plc (3 Month LIBOR +1.40%)± | 3.82 | 11-3-2028 | 1,000,000 | 1,086,816 | ||||||||||||
UnionBanCal Corporation | 3.50 | 6-18-2022 | 140,000 | 145,977 | ||||||||||||
US Bancorp | 2.38 | 7-22-2026 | 190,000 | 198,844 | ||||||||||||
US Bancorp | 3.00 | 3-15-2022 | 350,000 | 361,270 | ||||||||||||
US Bancorp | 3.60 | 9-11-2024 | 350,000 | 380,071 | ||||||||||||
US Bancorp | 4.13 | 5-24-2021 | 350,000 | 360,851 | ||||||||||||
| 17,157,070 | ||||||||||||||||
|
| |||||||||||||||
| Capital Markets: 3.58% | ||||||||||||||||
AGL Capital Corporation | 4.40 | 6-1-2043 | 140,000 | 164,187 | ||||||||||||
Bank of New York Mellon Corporation | 2.50 | 4-15-2021 | 350,000 | 353,870 | ||||||||||||
Bank of New York Mellon Corporation | 2.95 | 1-29-2023 | 300,000 | 311,574 | ||||||||||||
Bank of New York Mellon Corporation | 3.40 | 1-29-2028 | 300,000 | 330,278 | ||||||||||||
Bank of New York Mellon Corporation | 3.55 | 9-23-2021 | 420,000 | 432,885 | ||||||||||||
BlackRock Incorporated | 3.50 | 3-18-2024 | 1,000,000 | 1,079,227 | ||||||||||||
CME Group Incorporated | 4.15 | 6-15-2048 | 200,000 | 260,124 | ||||||||||||
Goldman Sachs Group Incorporated (3 Month LIBOR +1.51%)± | 3.69 | 6-5-2028 | 700,000 | 765,266 | ||||||||||||
Goldman Sachs Group Incorporated | 3.75 | 5-22-2025 | 350,000 | 378,800 | ||||||||||||
Goldman Sachs Group Incorporated | 6.13 | 2-15-2033 | 200,000 | 277,667 | ||||||||||||
Jefferies Group Incorporated | 5.13 | 1-20-2023 | 175,000 | 191,092 | ||||||||||||
Jefferies Group Incorporated | 6.45 | 6-8-2027 | 105,000 | 126,583 | ||||||||||||
Jefferies Group Incorporated | 6.88 | 4-15-2021 | 105,000 | 110,841 | ||||||||||||
Legg Mason Incorporated | 4.75 | 3-15-2026 | 190,000 | 221,068 | ||||||||||||
Moody’s Corporation | 4.50 | 9-1-2022 | 175,000 | 186,078 | ||||||||||||
Moody’s Corporation | 5.25 | 7-15-2044 | 210,000 | 287,283 | ||||||||||||
Morgan Stanley | 4.30 | 1-27-2045 | 350,000 | 430,053 | ||||||||||||
Morgan Stanley | 5.00 | 11-24-2025 | 200,000 | 230,785 | ||||||||||||
Morgan Stanley | 6.25 | 8-9-2026 | 300,000 | 374,226 | ||||||||||||
Morgan Stanley | 7.25 | 4-1-2032 | 329,000 | 487,338 | ||||||||||||
Northern Trust Corporation | 3.95 | 10-30-2025 | 175,000 | 196,846 | ||||||||||||
PPL Capital Funding Incorporated | 3.10 | 5-15-2026 | 100,000 | 106,020 | ||||||||||||
PPL Capital Funding Incorporated | 3.40 | 6-1-2023 | 500,000 | 525,093 | ||||||||||||
PPL Capital Funding Incorporated | 4.70 | 6-1-2043 | 87,000 | 104,821 | ||||||||||||
S&P Global Incorporated | 4.00 | 6-15-2025 | 227,000 | 255,225 | ||||||||||||
State Street Corporation | 1.95 | 5-19-2021 | 600,000 | 604,368 | ||||||||||||
State Street Corporation | 2.65 | 5-19-2026 | 400,000 | 421,197 | ||||||||||||
TD Ameritrade Holding Corporation | 3.63 | 4-1-2025 | 140,000 | 152,978 | ||||||||||||
| 9,365,773 | ||||||||||||||||
|
| |||||||||||||||
| Consumer Finance: 2.64% | ||||||||||||||||
American Express Company | 2.50 | 8-1-2022 | 400,000 | 407,826 | ||||||||||||
American Express Company | 2.65 | 12-2-2022 | 402,000 | 414,140 | ||||||||||||
American Express Company | 4.20 | 11-6-2025 | 200,000 | 226,222 | ||||||||||||
American Express Credit Corporation | 2.25 | 5-5-2021 | 200,000 | 201,707 | ||||||||||||
American Honda Finance Corporation | 1.65 | 7-12-2021 | 500,000 | 502,117 | ||||||||||||
American Honda Finance Corporation | 2.90 | 2-16-2024 | 200,000 | 210,176 | ||||||||||||
American Honda Finance Corporation | 3.45 | 7-14-2023 | 200,000 | 213,534 | ||||||||||||
The accompanying notes are an integral part of these financial statements.
Wells Fargo Funds | 183
Table of Contents
Portfolio of investments—February 29, 2020
INVESTMENT GRADE CORPORATE BOND PORTFOLIO
Interest rate | Maturity date | Principal | Value | |||||||||||||
| Consumer Finance (continued) | ||||||||||||||||
Capital One Financial Corporation | 3.75 | % | 7-28-2026 | $ | 525,000 | $ | 562,492 | |||||||||
Capital One Financial Corporation | 4.75 | 7-15-2021 | 315,000 | 328,414 | ||||||||||||
Caterpillar Financial Services Corporation | 2.63 | 3-1-2023 | 260,000 | 268,433 | ||||||||||||
Caterpillar Financial Services Corporation | 3.25 | 12-1-2024 | 200,000 | 214,980 | ||||||||||||
Caterpillar Financial Services Corporation | 3.75 | 11-24-2023 | 175,000 | 189,939 | ||||||||||||
Discover Financial Services | 3.95 | 11-6-2024 | 200,000 | 216,718 | ||||||||||||
Ford Motor Credit Company LLC | 3.10 | 5-4-2023 | 200,000 | 200,777 | ||||||||||||
General Motors Financial Company Incorporated | 3.70 | 5-9-2023 | 380,000 | 394,719 | ||||||||||||
John Deere Capital Corporation | 3.90 | 7-12-2021 | 210,000 | 217,731 | ||||||||||||
Synchrony Financial | 3.70 | 8-4-2026 | 200,000 | 210,368 | ||||||||||||
Synchrony Financial | 5.15 | 3-19-2029 | 900,000 | 1,049,374 | ||||||||||||
Toyota Motor Credit Corporation | 2.60 | 1-11-2022 | 300,000 | 307,135 | ||||||||||||
Toyota Motor Credit Corporation | 2.63 | 1-10-2023 | 310,000 | 322,110 | ||||||||||||
Toyota Motor Credit Corporation | 3.40 | 9-15-2021 | 245,000 | 252,843 | ||||||||||||
| 6,911,755 | ||||||||||||||||
|
| |||||||||||||||
| Diversified Financial Services: 0.19% | ||||||||||||||||
National Rural Utilities Cooperative Finance Corporation | 3.40 | 2-7-2028 | 300,000 | 336,665 | ||||||||||||
National Rural Utilities Cooperative Finance Corporation | 4.02 | 11-1-2032 | 140,000 | 172,325 | ||||||||||||
| 508,990 | ||||||||||||||||
|
| |||||||||||||||
| Insurance: 4.34% | ||||||||||||||||
ACE INA Holdings Incorporated | 2.70 | 3-13-2023 | 280,000 | 290,995 | ||||||||||||
ACE INA Holdings Incorporated | 3.15 | 3-15-2025 | 200,000 | 216,030 | ||||||||||||
ACE INA Holdings Incorporated | 3.35 | 5-15-2024 | 350,000 | 377,160 | ||||||||||||
Allstate Corporation (3 Month LIBOR +2.12%)± | 6.50 | 5-15-2067 | 140,000 | 177,800 | ||||||||||||
American International Group Incorporated | 4.50 | 7-16-2044 | 300,000 | 367,937 | ||||||||||||
American International Group Incorporated | 4.88 | 6-1-2022 | 600,000 | 639,347 | ||||||||||||
American International Group Incorporated (3 Month LIBOR +2.87%)± | 5.75 | 4-1-2048 | 200,000 | 221,250 | ||||||||||||
Aon Corporation | 6.25 | 9-30-2040 | 70,000 | 104,192 | ||||||||||||
Arch Capital Group Limited | 5.14 | 11-1-2043 | 147,000 | 204,455 | ||||||||||||
Berkshire Hathaway Finance Corporation | 4.40 | 5-15-2042 | 180,000 | 224,567 | ||||||||||||
Berkshire Hathaway Finance Corporation | 5.75 | 1-15-2040 | 175,000 | 253,430 | ||||||||||||
Berkshire Hathaway Incorporated | 3.00 | 2-11-2023 | 75,000 | 78,639 | ||||||||||||
Berkshire Hathaway Incorporated | 3.13 | 3-15-2026 | 525,000 | 569,063 | ||||||||||||
Berkshire Hathaway Incorporated | 3.40 | 1-31-2022 | 175,000 | 181,703 | ||||||||||||
Berkshire Hathaway Incorporated | 4.50 | 2-11-2043 | 275,000 | 351,834 | ||||||||||||
Chubb Corporation | 6.00 | 5-11-2037 | 196,000 | 296,490 | ||||||||||||
Hartford Financial Services Group Incorporated | 4.30 | 4-15-2043 | 30,000 | 36,719 | ||||||||||||
Lincoln National Corporation | 4.00 | 9-1-2023 | 175,000 | 189,092 | ||||||||||||
Loews Corporation | 2.63 | 5-15-2023 | 105,000 | 109,006 | ||||||||||||
Loews Corporation | 4.13 | 5-15-2043 | 140,000 | 173,409 | ||||||||||||
Marsh & McLennan Companies Incorporated | 4.38 | 3-15-2029 | 1,100,000 | 1,281,928 | ||||||||||||
Marsh & McLennan Companies Incorporated | 4.80 | 7-15-2021 | 210,000 | 218,002 | ||||||||||||
MetLife Incorporated | 3.05 | 12-15-2022 | 190,000 | 198,110 | ||||||||||||
MetLife Incorporated | 4.13 | 8-13-2042 | 210,000 | 251,168 | ||||||||||||
MetLife Incorporated | 4.37 | 9-15-2023 | 400,000 | 442,125 | ||||||||||||
MetLife Incorporated | 4.72 | 12-15-2044 | 175,000 | 226,100 | ||||||||||||
MetLife Incorporated | 6.38 | 6-15-2034 | 196,000 | 291,790 | ||||||||||||
MetLife Incorporated | 6.40 | 12-15-2066 | 200,000 | 247,040 | ||||||||||||
MetLife Incorporated | 6.50 | 12-15-2032 | 140,000 | 206,834 | ||||||||||||
Principal Financial Group Incorporated | 3.30 | 9-15-2022 | 175,000 | 183,217 | ||||||||||||
Principal Financial Group Incorporated | 3.40 | 5-15-2025 | 140,000 | 151,759 | ||||||||||||
Progressive Corporation | 6.25 | 12-1-2032 | 252,000 | 366,915 | ||||||||||||
The accompanying notes are an integral part of these financial statements.
184 | Wells Fargo Funds
Table of Contents
Portfolio of investments—February 29, 2020
INVESTMENT GRADE CORPORATE BOND PORTFOLIO
Interest rate | Maturity date | Principal | Value | |||||||||||||
| Insurance (continued) | ||||||||||||||||
Prudential Financial Incorporated | 3.91 | % | 12-7-2047 | $ | 155,000 | $ | 175,463 | |||||||||
Prudential Financial Incorporated | 3.94 | 12-7-2049 | 200,000 | 220,530 | ||||||||||||
Prudential Financial Incorporated | 4.50 | 11-16-2021 | 175,000 | 183,694 | ||||||||||||
Prudential Financial Incorporated | 4.60 | 5-15-2044 | 350,000 | 427,011 | ||||||||||||
Prudential Financial Incorporated (3 Month LIBOR +3.04%)± | 5.20 | 3-15-2044 | 175,000 | 186,792 | ||||||||||||
Prudential Financial Incorporated | 5.75 | 7-15-2033 | 350,000 | 478,503 | ||||||||||||
Prudential Financial Incorporated | 6.63 | 12-1-2037 | 45,000 | 67,755 | ||||||||||||
Reinsurance Group of America Incorporated | 5.00 | 6-1-2021 | 42,000 | 43,832 | ||||||||||||
Transatlantic Holdings Incorporated | 8.00 | 11-30-2039 | 70,000 | 116,593 | ||||||||||||
Travelers Companies Incorporated | 5.35 | 11-1-2040 | 245,000 | 343,032 | ||||||||||||
| 11,371,311 | ||||||||||||||||
|
| |||||||||||||||
| Mortgage REITs: 0.59% | ||||||||||||||||
CC Holdings GS V LLC | 3.85 | 4-15-2023 | 350,000 | 371,627 | ||||||||||||
ERP Operating LP | 4.00 | 8-1-2047 | 400,000 | 474,314 | ||||||||||||
Ventas Realty LP | 4.40 | 1-15-2029 | 600,000 | 689,450 | ||||||||||||
| 1,535,391 | ||||||||||||||||
|
| |||||||||||||||
Health Care: 9.44% |
| |||||||||||||||
| Biotechnology: 1.38% | ||||||||||||||||
AbbVie Incorporated | 2.30 | 5-14-2021 | 350,000 | 351,723 | ||||||||||||
AbbVie Incorporated | 3.20 | 5-14-2026 | 420,000 | 447,166 | ||||||||||||
AbbVie Incorporated | 4.45 | 5-14-2046 | 200,000 | 230,509 | ||||||||||||
Amgen Incorporated | 3.63 | 5-15-2022 | 200,000 | 207,311 | ||||||||||||
Amgen Incorporated | 3.63 | 5-22-2024 | 350,000 | 378,000 | ||||||||||||
Amgen Incorporated | 3.88 | 11-15-2021 | 200,000 | 207,233 | ||||||||||||
Amgen Incorporated | 5.75 | 3-15-2040 | 56,000 | 75,028 | ||||||||||||
Amgen Incorporated | 6.40 | 2-1-2039 | 175,000 | 251,222 | ||||||||||||
Baxalta Incorporated | 5.25 | 6-23-2045 | 280,000 | 393,181 | ||||||||||||
Gilead Sciences Incorporated | 3.65 | 3-1-2026 | 350,000 | 385,252 | ||||||||||||
Gilead Sciences Incorporated | 4.50 | 2-1-2045 | 200,000 | 244,838 | ||||||||||||
Gilead Sciences Incorporated | 4.75 | 3-1-2046 | 350,000 | 449,210 | ||||||||||||
| 3,620,673 | ||||||||||||||||
|
| |||||||||||||||
| Health Care Equipment & Supplies: 1.21% | ||||||||||||||||
Abbott Laboratories | 6.00 | 4-1-2039 | 105,000 | 157,328 | ||||||||||||
Abbott Laboratories | 6.15 | 11-30-2037 | 166,000 | 247,271 | ||||||||||||
Becton Dickinson & Company | 2.89 | 6-6-2022 | 500,000 | 513,375 | ||||||||||||
Becton Dickinson & Company | 3.13 | 11-8-2021 | 210,000 | 215,405 | ||||||||||||
Boston Scientific Corporation | 3.85 | 5-15-2025 | 200,000 | 220,322 | ||||||||||||
Boston Scientific Corporation | 4.70 | 3-1-2049 | 600,000 | 782,957 | ||||||||||||
Medtronic Incorporated | 3.15 | 3-15-2022 | 350,000 | 362,640 | ||||||||||||
Medtronic Incorporated | 3.50 | 3-15-2025 | 200,000 | 218,952 | ||||||||||||
Stryker Corporation | 4.63 | 3-15-2046 | 350,000 | 447,685 | ||||||||||||
| 3,165,935 | ||||||||||||||||
|
| |||||||||||||||
| Health Care Providers & Services: 2.98% | ||||||||||||||||
Aetna Incorporated | 4.13 | 11-15-2042 | 175,000 | 187,955 | ||||||||||||
Aetna Incorporated | 4.50 | 5-15-2042 | 200,000 | 225,666 | ||||||||||||
AmerisourceBergen Corporation | 3.50 | 11-15-2021 | 210,000 | 215,964 | ||||||||||||
AmerisourceBergen Corporation | 4.25 | 3-1-2045 | 175,000 | 189,813 | ||||||||||||
Anthem Incorporated | 4.38 | 12-1-2047 | 200,000 | 226,869 | ||||||||||||
The accompanying notes are an integral part of these financial statements.
Wells Fargo Funds | 185
Table of Contents
Portfolio of investments—February 29, 2020
INVESTMENT GRADE CORPORATE BOND PORTFOLIO
Interest rate | Maturity date | Principal | Value | |||||||||||||
| Health Care Providers & Services (continued) | ||||||||||||||||
Cardinal Health Incorporated | 2.62 | % | 6-15-2022 | $ | 400,000 | $ | 409,612 | |||||||||
Catholic Health Initiatives | 4.35 | 11-1-2042 | 175,000 | 197,619 | ||||||||||||
Cigna Corporation 144A | 3.00 | 7-15-2023 | 300,000 | 311,499 | ||||||||||||
Cigna Corporation 144A | 4.00 | 2-15-2022 | 175,000 | 181,540 | ||||||||||||
Cigna Corporation 144A | 4.80 | 7-15-2046 | 210,000 | 252,741 | ||||||||||||
Cigna Corporation 144A | 6.13 | 11-15-2041 | 175,000 | 238,994 | ||||||||||||
CVS Caremark Corporation | 2.75 | 12-1-2022 | 350,000 | 360,408 | ||||||||||||
CVS Caremark Corporation | 5.30 | 12-5-2043 | 210,000 | 259,879 | ||||||||||||
CVS Health Corporation | 2.13 | 6-1-2021 | 260,000 | 261,507 | ||||||||||||
HCA Incorporated | 5.50 | 6-15-2047 | 500,000 | 593,871 | ||||||||||||
Humana Incorporated | 3.15 | 12-1-2022 | 210,000 | 218,100 | ||||||||||||
Kaiser Foundation Hospitals | 4.88 | 4-1-2042 | 175,000 | 238,403 | ||||||||||||
Laboratory Corporation of America Holdings | 3.75 | 8-23-2022 | 39,000 | 40,740 | ||||||||||||
Laboratory Corporation of America Holdings | 4.00 | 11-1-2023 | 105,000 | 112,688 | ||||||||||||
McKesson Corporation | 2.85 | 3-15-2023 | 140,000 | 144,497 | ||||||||||||
Quest Diagnostics Incorporated | 4.70 | 4-1-2021 | 112,000 | 115,600 | ||||||||||||
UnitedHealth Group Incorporated | 4.20 | 1-15-2047 | 200,000 | 239,570 | ||||||||||||
UnitedHealth Group Incorporated | 4.25 | 3-15-2043 | 175,000 | 208,835 | ||||||||||||
UnitedHealth Group Incorporated | 4.25 | 4-15-2047 | 300,000 | 363,056 | ||||||||||||
UnitedHealth Group Incorporated | 4.25 | 6-15-2048 | 300,000 | 363,980 | ||||||||||||
UnitedHealth Group Incorporated | 5.80 | 3-15-2036 | 175,000 | 240,012 | ||||||||||||
UnitedHealth Group Incorporated | 6.63 | 11-15-2037 | 105,000 | 156,318 | ||||||||||||
WellPoint Incorporated | 3.13 | 5-15-2022 | 350,000 | 361,359 | ||||||||||||
WellPoint Incorporated | 3.30 | 1-15-2023 | 200,000 | 209,046 | ||||||||||||
WellPoint Incorporated | 4.65 | 1-15-2043 | 315,000 | 369,506 | ||||||||||||
WellPoint Incorporated | 4.65 | 8-15-2044 | 50,000 | 58,319 | ||||||||||||
WellPoint Incorporated | 5.85 | 1-15-2036 | 200,000 | 259,278 | ||||||||||||
| 7,813,244 | ||||||||||||||||
|
| |||||||||||||||
| Life Sciences Tools & Services: 0.31% | ||||||||||||||||
Agilent Technologies Incorporated | 3.88 | 7-15-2023 | 105,000 | 111,711 | ||||||||||||
Thermo Fisher Scientific Incorporated | 3.00 | 4-15-2023 | 200,000 | 208,719 | ||||||||||||
Thermo Fisher Scientific Incorporated | 4.15 | 2-1-2024 | 280,000 | 305,358 | ||||||||||||
Thermo Fisher Scientific Incorporated | 5.30 | 2-1-2044 | 140,000 | 189,498 | ||||||||||||
| 815,286 | ||||||||||||||||
|
| |||||||||||||||
| Pharmaceuticals: 3.56% | ||||||||||||||||
Bristol-Myers Squibb Company 144A | 3.25 | 8-15-2022 | 350,000 | 365,859 | ||||||||||||
Bristol-Myers Squibb Company | 3.25 | 11-1-2023 | 109,000 | 116,011 | ||||||||||||
Bristol-Myers Squibb Company | 3.25 | 8-1-2042 | 175,000 | 194,523 | ||||||||||||
Bristol-Myers Squibb Company 144A | 3.88 | 8-15-2025 | 175,000 | 193,837 | ||||||||||||
Bristol-Myers Squibb Company 144A | 4.25 | 10-26-2049 | 400,000 | 514,547 | ||||||||||||
Bristol-Myers Squibb Company | 4.50 | 3-1-2044 | 200,000 | 263,050 | ||||||||||||
Bristol-Myers Squibb Company 144A | 4.63 | 5-15-2044 | 240,000 | 312,250 | ||||||||||||
Eli Lilly & Company | 2.75 | 6-1-2025 | 70,000 | 74,975 | ||||||||||||
Eli Lilly & Company | 3.95 | 3-15-2049 | 600,000 | 733,302 | ||||||||||||
GlaxoSmithKline Capital Incorporated | 2.80 | 3-18-2023 | 140,000 | 145,492 | ||||||||||||
GlaxoSmithKline Capital Incorporated | 2.85 | 5-8-2022 | 700,000 | 721,284 | ||||||||||||
GlaxoSmithKline Capital Incorporated | 5.38 | 4-15-2034 | 210,000 | 293,164 | ||||||||||||
Johnson & Johnson | 3.38 | 12-5-2023 | 300,000 | 323,664 | ||||||||||||
Johnson & Johnson | 3.70 | 3-1-2046 | 175,000 | 212,759 | ||||||||||||
Johnson & Johnson | 4.38 | 12-5-2033 | 200,000 | 250,890 | ||||||||||||
Johnson & Johnson | 4.85 | 5-15-2041 | 140,000 | 188,659 | ||||||||||||
Johnson & Johnson | 4.95 | 5-15-2033 | 126,000 | 165,952 | ||||||||||||
The accompanying notes are an integral part of these financial statements.
186 | Wells Fargo Funds
Table of Contents
Portfolio of investments—February 29, 2020
INVESTMENT GRADE CORPORATE BOND PORTFOLIO
Interest rate | Maturity date | Principal | Value | |||||||||||||
| Pharmaceuticals (continued) | ||||||||||||||||
Merck & Company Incorporated | 2.35 | % | 2-10-2022 | $ | 250,000 | $ | 254,450 | |||||||||
Merck & Company Incorporated | 2.75 | 2-10-2025 | 270,000 | 286,047 | ||||||||||||
Merck & Company Incorporated | 3.70 | 2-10-2045 | 200,000 | 237,340 | ||||||||||||
Mylan Incorporated | 4.20 | 11-29-2023 | 200,000 | 215,394 | ||||||||||||
Novartis Capital Corporation | 2.40 | 9-21-2022 | 350,000 | 360,198 | ||||||||||||
Novartis Capital Corporation | 3.40 | 5-6-2024 | 700,000 | 756,296 | ||||||||||||
Novartis Capital Corporation | 3.70 | 9-21-2042 | 175,000 | 209,710 | ||||||||||||
Pfizer Incorporated | 3.00 | 12-15-2026 | 400,000 | 433,651 | ||||||||||||
Pfizer Incorporated | 4.13 | 12-15-2046 | 420,000 | 519,554 | ||||||||||||
Pfizer Incorporated | 4.30 | 6-15-2043 | 210,000 | 270,422 | ||||||||||||
Schering-Plough Corporation | 6.50 | 12-1-2033 | 175,000 | 255,370 | ||||||||||||
Zoetis Incorporated | 4.70 | 2-1-2043 | 350,000 | 451,932 | ||||||||||||
| 9,320,582 | ||||||||||||||||
|
| |||||||||||||||
Industrials: 8.58% |
| |||||||||||||||
| Aerospace & Defense: 2.41% | ||||||||||||||||
General Dynamics Corporation | 2.25 | 11-15-2022 | 350,000 | 358,017 | ||||||||||||
General Dynamics Corporation | 3.75 | 5-15-2028 | 600,000 | 680,948 | ||||||||||||
General Dynamics Corporation | 3.88 | 7-15-2021 | 140,000 | 144,038 | ||||||||||||
Lockheed Martin Corporation | 3.35 | 9-15-2021 | 175,000 | 180,320 | ||||||||||||
Lockheed Martin Corporation | 4.07 | 12-15-2042 | 229,000 | 280,633 | ||||||||||||
Lockheed Martin Corporation | 4.70 | 5-15-2046 | 350,000 | 468,001 | ||||||||||||
Lockheed Martin Corporation | 6.15 | 9-1-2036 | 122,000 | 176,590 | ||||||||||||
Northrop Grumman Corporation | 3.50 | 3-15-2021 | 210,000 | 214,041 | ||||||||||||
Northrop Grumman Corporation | 4.03 | 10-15-2047 | 400,000 | 476,871 | ||||||||||||
Northrop Grumman Corporation | 5.05 | 11-15-2040 | 70,000 | 91,461 | ||||||||||||
Northrop Grumman Corporation | 7.75 | 2-15-2031 | 210,000 | 313,338 | ||||||||||||
Precision Castparts Corporation | 2.50 | 1-15-2023 | 175,000 | 181,056 | ||||||||||||
Precision Castparts Corporation | 3.90 | 1-15-2043 | 140,000 | 167,896 | ||||||||||||
Raytheon Company | 2.50 | 12-15-2022 | 245,000 | 252,249 | ||||||||||||
Raytheon Company | 7.20 | 8-15-2027 | 84,000 | 112,965 | ||||||||||||
Rockwell Collins Incorporated | 3.70 | 12-15-2023 | 245,000 | 262,659 | ||||||||||||
Rockwell Collins Incorporated | 4.80 | 12-15-2043 | 175,000 | 229,844 | ||||||||||||
Textron Incorporated | 4.30 | 3-1-2024 | 140,000 | 152,783 | ||||||||||||
The Boeing Company | 2.60 | 10-30-2025 | 300,000 | 306,764 | ||||||||||||
The Boeing Company | 2.80 | 3-1-2023 | 200,000 | 205,892 | ||||||||||||
The Boeing Company | 3.20 | 3-1-2029 | 200,000 | 213,852 | ||||||||||||
The Boeing Company | 5.88 | 2-15-2040 | 21,000 | 28,204 | ||||||||||||
United Technologies Corporation | 3.75 | 11-1-2046 | 200,000 | 230,010 | ||||||||||||
United Technologies Corporation | 7.50 | 9-15-2029 | 400,000 | 583,064 | ||||||||||||
| 6,311,496 | ||||||||||||||||
|
| |||||||||||||||
| Air Freight & Logistics: 0.80% | ||||||||||||||||
FedEx Corporation | 3.88 | 8-1-2042 | 140,000 | 138,258 | ||||||||||||
FedEx Corporation | 4.00 | 1-15-2024 | 203,000 | 220,735 | ||||||||||||
FedEx Corporation | 4.55 | 4-1-2046 | 350,000 | 384,247 | ||||||||||||
FedEx Corporation | 4.90 | 1-15-2034 | 175,000 | 205,122 | ||||||||||||
FedEx Corporation | 5.10 | 1-15-2044 | 210,000 | 243,877 | ||||||||||||
United Parcel Service Incorporated | 2.35 | 5-16-2022 | 300,000 | 305,699 | ||||||||||||
United Parcel Service Incorporated | 2.45 | 10-1-2022 | 280,000 | 287,071 | ||||||||||||
United Parcel Service Incorporated | 6.20 | 1-15-2038 | 206,000 | 303,309 | ||||||||||||
| 2,088,318 | ||||||||||||||||
|
| |||||||||||||||
The accompanying notes are an integral part of these financial statements.
Wells Fargo Funds | 187
Table of Contents
Portfolio of investments—February 29, 2020
INVESTMENT GRADE CORPORATE BOND PORTFOLIO
Interest rate | Maturity date | Principal | Value | |||||||||||||
| Airlines: 0.18% | ||||||||||||||||
American Airlines Incorporated | 3.20 | % | 12-15-2029 | $ | 52,979 | $ | 56,924 | |||||||||
American Airlines Incorporated | 3.38 | 11-1-2028 | 24,880 | 26,686 | ||||||||||||
American Airlines Incorporated | 4.95 | 7-15-2024 | 102,384 | 107,735 | ||||||||||||
Delta Air Lines Incorporated | 6.82 | 2-10-2024 | 31,717 | 34,752 | ||||||||||||
United Airlines Incorporated | 4.30 | 2-15-2027 | 167,377 | 183,386 | ||||||||||||
US Airways Group Incorporated | 3.95 | 5-15-2027 | 68,498 | 73,978 | ||||||||||||
| 483,461 | ||||||||||||||||
|
| |||||||||||||||
| Building Products: 0.08% | ||||||||||||||||
Masco Corporation | 4.38 | 4-1-2026 | 190,000 | 214,750 | ||||||||||||
|
| |||||||||||||||
| Commercial Services & Supplies: 0.51% | ||||||||||||||||
Cintas Corporation No. 2 | 3.25 | 6-1-2022 | 70,000 | 72,275 | ||||||||||||
Republic Services Incorporated | 2.90 | 7-1-2026 | 260,000 | 276,306 | ||||||||||||
Republic Services Incorporated | 5.25 | 11-15-2021 | 35,000 | 37,272 | ||||||||||||
Waste Management Incorporated | 4.10 | 3-1-2045 | 650,000 | 797,920 | ||||||||||||
Waste Management Incorporated | 4.60 | 3-1-2021 | 140,000 | 142,932 | ||||||||||||
| 1,326,705 | ||||||||||||||||
|
| |||||||||||||||
| Industrial Conglomerates: 1.27% | ||||||||||||||||
3M Company | 4.00 | 9-14-2048 | 800,000 | 943,926 | ||||||||||||
3M Company | 5.70 | 3-15-2037 | 227,000 | 326,204 | ||||||||||||
General Electric Company | 3.10 | 1-9-2023 | 300,000 | 311,404 | ||||||||||||
General Electric Company | 4.13 | 10-9-2042 | 400,000 | 427,403 | ||||||||||||
General Electric Company | 4.50 | 3-11-2044 | 200,000 | 231,886 | ||||||||||||
General Electric Company | 5.88 | 1-14-2038 | 200,000 | 256,494 | ||||||||||||
Honeywell International Incorporated | 3.35 | 12-1-2023 | 140,000 | 150,750 | ||||||||||||
Honeywell International Incorporated | 3.81 | 11-21-2047 | 500,000 | 634,796 | ||||||||||||
Honeywell International Incorporated | 4.25 | 3-1-2021 | 35,000 | 35,980 | ||||||||||||
| 3,318,843 | ||||||||||||||||
|
| |||||||||||||||
| Machinery: 0.80% | ||||||||||||||||
Caterpillar Incorporated | 3.80 | 8-15-2042 | 105,000 | 125,197 | ||||||||||||
Caterpillar Incorporated | 4.75 | 5-15-2064 | 300,000 | 410,461 | ||||||||||||
Deere & Company | 2.60 | 6-8-2022 | 350,000 | 357,327 | ||||||||||||
Deere & Company | 5.38 | 10-16-2029 | 210,000 | 274,444 | ||||||||||||
Dover Corporation | 5.38 | 10-15-2035 | 140,000 | 185,682 | ||||||||||||
Illinois Tool Works Incorporated | 3.38 | 9-15-2021 | 84,000 | 86,301 | ||||||||||||
Illinois Tool Works Incorporated | 3.90 | 9-1-2042 | 214,000 | 270,324 | ||||||||||||
Parker Hannifin Corporation | 3.50 | 9-15-2022 | 70,000 | 73,489 | ||||||||||||
Parker Hannifin Corporation | 6.25 | 5-15-2038 | 42,000 | 60,325 | ||||||||||||
Stanley Black & Decker Incorporated | 2.90 | 11-1-2022 | 245,000 | 254,600 | ||||||||||||
| 2,098,150 | ||||||||||||||||
|
| |||||||||||||||
| Professional Services: 0.07% | ||||||||||||||||
Verisk Analytics Incorporated | 4.13 | 9-12-2022 | 175,000 | 185,951 | ||||||||||||
|
| |||||||||||||||
| Road & Rail: 1.86% | ||||||||||||||||
Burlington Northern Santa Fe LLC | 3.00 | 3-15-2023 | 210,000 | 218,771 | ||||||||||||
Burlington Northern Santa Fe LLC | 3.40 | 9-1-2024 | 210,000 | 226,789 | ||||||||||||
Burlington Northern Santa Fe LLC | 4.55 | 9-1-2044 | 210,000 | 259,910 | ||||||||||||
Burlington Northern Santa Fe LLC | 4.95 | 9-15-2041 | 140,000 | �� | 181,888 | |||||||||||
Burlington Northern Santa Fe LLC | 5.15 | 9-1-2043 | 210,000 | 283,092 | ||||||||||||
CSX Corporation | 3.40 | 8-1-2024 | 278,000 | 297,427 | ||||||||||||
The accompanying notes are an integral part of these financial statements.
188 | Wells Fargo Funds
Table of Contents
Portfolio of investments—February 29, 2020
INVESTMENT GRADE CORPORATE BOND PORTFOLIO
Interest rate | Maturity date | Principal | Value | |||||||||||||
| Road & Rail (continued) | ||||||||||||||||
CSX Corporation | 4.50 | % | 8-1-2054 | $ | 350,000 | $ | 434,036 | |||||||||
CSX Corporation | 4.75 | 5-30-2042 | 161,000 | 201,744 | ||||||||||||
CSX Corporation | 6.22 | 4-30-2040 | 140,000 | 204,579 | ||||||||||||
Kansas City Southern | 3.00 | 5-15-2023 | 51,000 | 53,164 | ||||||||||||
Kansas City Southern | 4.30 | 5-15-2043 | 140,000 | 169,796 | ||||||||||||
Norfolk Southern Corporation | 2.90 | 6-15-2026 | 250,000 | 267,031 | ||||||||||||
Norfolk Southern Corporation | 2.90 | 2-15-2023 | 400,000 | 415,985 | ||||||||||||
Norfolk Southern Corporation | 3.15 | 6-1-2027 | 300,000 | 324,510 | ||||||||||||
Norfolk Southern Corporation | 3.85 | 1-15-2024 | 140,000 | 151,891 | ||||||||||||
Union Pacific Corporation | 2.75 | 4-15-2023 | 200,000 | 206,495 | ||||||||||||
Union Pacific Corporation | 3.25 | 1-15-2025 | 175,000 | 187,482 | ||||||||||||
Union Pacific Corporation | 3.75 | 3-15-2024 | 140,000 | 151,056 | ||||||||||||
Union Pacific Corporation | 3.80 | 10-1-2051 | 200,000 | 222,536 | ||||||||||||
Union Pacific Corporation | 4.15 | 1-15-2045 | 175,000 | 202,827 | ||||||||||||
Union Pacific Corporation | 4.30 | 6-15-2042 | 175,000 | 207,593 | ||||||||||||
| 4,868,602 | ||||||||||||||||
|
| |||||||||||||||
| Trading Companies & Distributors: 0.60% | ||||||||||||||||
Air Lease Corporation | 3.25 | 3-1-2025 | 200,000 | 209,101 | ||||||||||||
Air Lease Corporation | 3.63 | 12-1-2027 | 900,000 | 949,949 | ||||||||||||
GATX Corporation | 4.85 | 6-1-2021 | 70,000 | 72,768 | ||||||||||||
W.W. Grainger Incorporated | 4.60 | 6-15-2045 | 280,000 | 352,972 | ||||||||||||
| 1,584,790 | ||||||||||||||||
|
| |||||||||||||||
| Information Technology: 6.76% | ||||||||||||||||
| Communications Equipment: 0.39% | ||||||||||||||||
Cisco Systems Incorporated | 2.20 | 9-20-2023 | 300,000 | 308,373 | ||||||||||||
Cisco Systems Incorporated | 2.95 | 2-28-2026 | 340,000 | 366,543 | ||||||||||||
Cisco Systems Incorporated | 3.00 | 6-15-2022 | 340,000 | 354,374 | ||||||||||||
| 1,029,290 | ||||||||||||||||
|
| |||||||||||||||
| Electronic Equipment, Instruments & Components: 0.13% | ||||||||||||||||
Corning Incorporated | 5.75 | 8-15-2040 | 105,000 | 134,770 | ||||||||||||
Keysight Technologies Incorporated | 4.55 | 10-30-2024 | 175,000 | 195,564 | ||||||||||||
| 330,334 | ||||||||||||||||
|
| |||||||||||||||
| IT Services: 1.78% | ||||||||||||||||
Fidelity National Information Services Incorporated | 3.00 | 8-15-2026 | 400,000 | 427,277 | ||||||||||||
Fidelity National Information Services Incorporated | 3.50 | 4-15-2023 | 49,000 | 51,576 | ||||||||||||
Fiserv Incorporated | 3.50 | 7-1-2029 | 1,000,000 | 1,093,000 | ||||||||||||
Fiserv Incorporated | 3.85 | 6-1-2025 | 210,000 | 229,605 | ||||||||||||
IBM Corporation | 1.88 | 8-1-2022 | 280,000 | 283,380 | ||||||||||||
IBM Corporation | 3.38 | 8-1-2023 | 210,000 | 223,632 | ||||||||||||
IBM Corporation | 5.88 | 11-29-2032 | 175,000 | 242,291 | ||||||||||||
IBM Corporation | 7.00 | 10-30-2025 | 210,000 | 267,735 | ||||||||||||
Mastercard Incorporated | 3.50 | 2-26-2028 | 400,000 | 445,653 | ||||||||||||
Total System Services Incorporated | 3.75 | 6-1-2023 | 105,000 | 111,278 | ||||||||||||
Visa Incorporated | 2.75 | 9-15-2027 | 300,000 | 319,690 | ||||||||||||
Visa Incorporated | 2.80 | 12-14-2022 | 800,000 | 830,643 | ||||||||||||
Western Union Company | 6.20 | 11-17-2036 | 122,000 | 149,875 | ||||||||||||
| 4,675,635 | ||||||||||||||||
|
| |||||||||||||||
The accompanying notes are an integral part of these financial statements.
Wells Fargo Funds | 189
Table of Contents
Portfolio of investments—February 29, 2020
INVESTMENT GRADE CORPORATE BOND PORTFOLIO
Interest rate | Maturity date | Principal | Value | |||||||||||||
| Semiconductors & Semiconductor Equipment: 1.84% | ||||||||||||||||
Analog Devices Incorporated | 2.88 | % | 6-1-2023 | $ | 105,000 | $ | 109,203 | |||||||||
Applied Materials Incorporated | 4.30 | 6-15-2021 | 210,000 | 218,107 | ||||||||||||
Applied Materials Incorporated | 5.85 | 6-15-2041 | 140,000 | 208,788 | ||||||||||||
Broadcom Corporation | 3.50 | 1-15-2028 | 900,000 | 929,396 | ||||||||||||
Broadcom Corporation | 3.88 | 1-15-2027 | 300,000 | 314,612 | ||||||||||||
Intel Corporation | 2.60 | 5-19-2026 | 220,000 | 230,792 | ||||||||||||
Intel Corporation | 4.10 | 5-19-2046 | 300,000 | 369,263 | ||||||||||||
Intel Corporation | 4.25 | 12-15-2042 | 175,000 | 218,433 | ||||||||||||
Intel Corporation | 4.90 | 7-29-2045 | 230,000 | 309,654 | ||||||||||||
Micron Technology Incorporated | 5.33 | 2-6-2029 | 500,000 | 573,917 | ||||||||||||
Qualcomm Incorporated | 3.25 | 5-20-2027 | 200,000 | 215,798 | ||||||||||||
Qualcomm Incorporated | 3.45 | 5-20-2025 | 700,000 | 760,909 | ||||||||||||
Texas Instruments Incorporated | 2.25 | 5-1-2023 | 175,000 | 178,996 | ||||||||||||
Xilinx Incorporated | 3.00 | 3-15-2021 | 175,000 | 177,810 | ||||||||||||
| 4,815,678 | ||||||||||||||||
|
| |||||||||||||||
| Software: 1.04% | ||||||||||||||||
Autodesk Incorporated | 3.60 | 12-15-2022 | 175,000 | 183,656 | ||||||||||||
Microsoft Corporation | 3.75 | 5-1-2043 | 33,000 | 39,614 | ||||||||||||
Microsoft Corporation | 4.50 | 2-6-2057 | 750,000 | 1,053,849 | ||||||||||||
Microsoft Corporation | 5.20 | 6-1-2039 | 77,000 | 109,779 | ||||||||||||
Oracle Corporation | 3.40 | 7-8-2024 | 200,000 | 214,542 | ||||||||||||
Oracle Corporation | 4.00 | 7-15-2046 | 350,000 | 417,790 | ||||||||||||
Oracle Corporation | 4.30 | 7-8-2034 | 175,000 | 215,154 | ||||||||||||
Oracle Corporation | 4.38 | 5-15-2055 | 200,000 | 255,169 | ||||||||||||
Salesforce.com Incorporated | 3.70 | 4-11-2028 | 200,000 | 226,034 | ||||||||||||
| 2,715,587 | ||||||||||||||||
|
| |||||||||||||||
| Technology Hardware, Storage & Peripherals: 1.58% | ||||||||||||||||
Apple Incorporated | 3.35 | 2-9-2027 | 200,000 | 219,978 | ||||||||||||
Apple Incorporated | 3.75 | 11-13-2047 | 400,000 | 478,168 | ||||||||||||
Apple Incorporated | 4.38 | 5-13-2045 | 350,000 | 447,371 | ||||||||||||
Apple Incorporated | 4.65 | 2-23-2046 | 200,000 | 266,022 | ||||||||||||
Dell International LLC 144A | 8.10 | 7-15-2036 | 400,000 | 549,211 | ||||||||||||
Diamond 1 Finance Corporation 144A | 4.42 | 6-15-2021 | 400,000 | 412,023 | ||||||||||||
Hewlett-Packard Enterprise Company | 4.90 | 10-15-2025 | 900,000 | 1,019,452 | ||||||||||||
Hewlett-Packard Enterprise Company | 6.00 | 9-15-2041 | 332,000 | 380,904 | ||||||||||||
Seagate HDD | 4.75 | 1-1-2025 | 350,000 | 370,008 | ||||||||||||
| 4,143,137 | ||||||||||||||||
|
| |||||||||||||||
Materials: 2.82% |
| |||||||||||||||
| Chemicals: 1.69% | ||||||||||||||||
Air Products & Chemicals Incorporated | 3.00 | 11-3-2021 | 175,000 | 180,249 | ||||||||||||
Dow Chemical Company | 3.50 | 10-1-2024 | 200,000 | 214,471 | ||||||||||||
Dow Chemical Company | 4.25 | 10-1-2034 | 175,000 | 195,047 | ||||||||||||
Dow Chemical Company | 5.25 | 11-15-2041 | 175,000 | 212,662 | ||||||||||||
DuPont de Nemours Incorporated | 4.73 | 11-15-2028 | 900,000 | 1,040,814 | ||||||||||||
Eastman Chemical Company | 4.80 | 9-1-2042 | 140,000 | 159,384 | ||||||||||||
Ecolab Incorporated | 4.35 | 12-8-2021 | 286,000 | 301,016 | ||||||||||||
Mosaic Company | 3.75 | 11-15-2021 | 80,000 | 82,479 | ||||||||||||
Mosaic Company | 5.63 | 11-15-2043 | 175,000 | 207,124 | ||||||||||||
Praxair Incorporated | 2.45 | 2-15-2022 | 140,000 | 142,351 | ||||||||||||
Praxair Incorporated | 2.70 | 2-21-2023 | 105,000 | 108,443 | ||||||||||||
The accompanying notes are an integral part of these financial statements.
190 | Wells Fargo Funds
Table of Contents
Portfolio of investments—February 29, 2020
INVESTMENT GRADE CORPORATE BOND PORTFOLIO
Interest rate | Maturity date | Principal | Value | |||||||||||||
| Chemicals (continued) | ||||||||||||||||
Praxair Incorporated | 4.05 | % | 3-15-2021 | $ | 140,000 | $ | 143,914 | |||||||||
The Sherwin-Williams Company | 4.50 | 6-1-2047 | 1,200,000 | 1,440,369 | ||||||||||||
| 4,428,323 | ||||||||||||||||
|
| |||||||||||||||
| Containers & Packaging: 0.50% | ||||||||||||||||
International Paper Company | 3.00 | 2-15-2027 | 200,000 | 212,106 | ||||||||||||
International Paper Company | 3.65 | 6-15-2024 | 350,000 | 375,353 | ||||||||||||
International Paper Company | 7.30 | 11-15-2039 | 175,000 | 261,970 | ||||||||||||
International Paper Company | 7.50 | 8-15-2021 | 214,000 | 232,454 | ||||||||||||
MeadWestvaco Corporation | 7.95 | 2-15-2031 | 35,000 | 50,150 | ||||||||||||
Packaging Corporation of America | 3.65 | 9-15-2024 | 175,000 | 189,763 | ||||||||||||
| 1,321,796 | ||||||||||||||||
|
| |||||||||||||||
| Metals & Mining: 0.56% | ||||||||||||||||
Barrick Gold Finance Company LLC | 5.70 | 5-30-2041 | 210,000 | 285,293 | ||||||||||||
Newmont Goldcorp Corporation | 3.70 | 3-15-2023 | 210,000 | 223,098 | ||||||||||||
Nucor Corporation | 4.00 | 8-1-2023 | 132,000 | 142,080 | ||||||||||||
Nucor Corporation | 5.20 | 8-1-2043 | 140,000 | 186,601 | ||||||||||||
Nucor Corporation | 6.40 | 12-1-2037 | 140,000 | 204,846 | ||||||||||||
Southern Copper Corporation | 6.75 | 4-16-2040 | 308,000 | 420,483 | ||||||||||||
| 1,462,401 | ||||||||||||||||
|
| |||||||||||||||
| Paper & Forest Products: 0.07% | ||||||||||||||||
Georgia-Pacific LLC | 8.00 | 1-15-2024 | 140,000 | 173,983 | ||||||||||||
|
| |||||||||||||||
Real Estate: 3.74% |
| |||||||||||||||
| Equity REITs: 3.74% | ||||||||||||||||
Alexandria Real Estate Equities Incorporated | 4.70 | 7-1-2030 | 400,000 | 483,123 | ||||||||||||
American Campus Communities Incorporated | 3.75 | 4-15-2023 | 70,000 | 74,501 | ||||||||||||
American Tower Corporation | 3.50 | 1-31-2023 | 295,000 | 310,597 | ||||||||||||
American Tower Corporation | 4.00 | 6-1-2025 | 350,000 | 385,429 | ||||||||||||
American Tower Corporation | 5.00 | 2-15-2024 | 245,000 | 274,770 | ||||||||||||
AvalonBay Communities Incorporated | 3.45 | 6-1-2025 | 140,000 | 153,034 | ||||||||||||
AvalonBay Communities Incorporated | 4.20 | 12-15-2023 | 175,000 | 192,539 | ||||||||||||
Boston Properties LP | 2.75 | 10-1-2026 | 500,000 | 529,019 | ||||||||||||
Boston Properties LP | 3.13 | 9-1-2023 | 105,000 | 110,412 | ||||||||||||
Boston Properties LP | 3.80 | 2-1-2024 | 300,000 | 323,737 | ||||||||||||
Boston Properties LP | 3.85 | 2-1-2023 | 200,000 | 212,484 | ||||||||||||
Boston Properties LP | 4.13 | 5-15-2021 | 210,000 | 215,349 | ||||||||||||
Corporate Office Properties LP | 3.60 | 5-15-2023 | 70,000 | 73,389 | ||||||||||||
Crown Castle International Corporation | 3.70 | 6-15-2026 | 350,000 | 380,392 | ||||||||||||
Crown Castle International Corporation | 4.88 | 4-15-2022 | 50,000 | 53,079 | ||||||||||||
Crown Castle International Corporation | 5.25 | 1-15-2023 | 350,000 | 384,050 | ||||||||||||
Digital Realty Trust LP | 3.63 | 10-1-2022 | 140,000 | 146,329 | ||||||||||||
Digital Realty Trust LP | 3.95 | 7-1-2022 | 140,000 | 146,860 | ||||||||||||
Equity One Incorporated | 3.75 | 11-15-2022 | 175,000 | 184,413 | ||||||||||||
Essex Portfolio LP | 3.25 | 5-1-2023 | 70,000 | 73,522 | ||||||||||||
Federal Realty Investment Trust | 4.50 | 12-1-2044 | 175,000 | 219,662 | ||||||||||||
HCP Incorporated | 3.15 | 8-1-2022 | 70,000 | 72,377 | ||||||||||||
HCP Incorporated | 6.75 | 2-1-2041 | 95,000 | 146,026 | ||||||||||||
Health Care REIT Incorporated | 4.00 | 6-1-2025 | 210,000 | 231,483 | ||||||||||||
Health Care REIT Incorporated | 4.50 | 1-15-2024 | 140,000 | 153,684 | ||||||||||||
Hospitality Properties Trust | 4.65 | 3-15-2024 | 350,000 | 369,672 | ||||||||||||
The accompanying notes are an integral part of these financial statements.
Wells Fargo Funds | 191
Table of Contents
Portfolio of investments—February 29, 2020
INVESTMENT GRADE CORPORATE BOND PORTFOLIO
Interest rate | Maturity date | Principal | Value | |||||||||||||
| Equity REITs (continued) | ||||||||||||||||
Host Hotels & Resorts Company | 3.75 | % | 10-15-2023 | $ | 70,000 | $ | 74,408 | |||||||||
Host Hotels & Resorts Company | 4.75 | 3-1-2023 | 175,000 | 189,529 | ||||||||||||
Kilroy Realty Corporation | 3.80 | 1-15-2023 | 175,000 | 184,853 | ||||||||||||
Kimco Realty Corporation | 2.80 | 10-1-2026 | 350,000 | 367,245 | ||||||||||||
Liberty Property LP | 4.40 | 2-15-2024 | 109,000 | 121,320 | ||||||||||||
Mid-America Apartments LP | 4.30 | 10-15-2023 | 35,000 | 38,141 | ||||||||||||
National Retail Properties Incorporated | 3.30 | 4-15-2023 | 70,000 | 73,259 | ||||||||||||
National Retail Properties Incorporated | 3.80 | 10-15-2022 | 70,000 | 74,171 | ||||||||||||
Plum Creek Timberlands LP | 3.25 | 3-15-2023 | 192,000 | 200,176 | ||||||||||||
Realty Income Corporation | 4.65 | 8-1-2023 | 210,000 | 231,096 | ||||||||||||
Simon Property Group LP | 3.30 | 1-15-2026 | 410,000 | 444,899 | ||||||||||||
Simon Property Group LP | 3.75 | 2-1-2024 | 175,000 | 188,262 | ||||||||||||
Simon Property Group LP | 4.75 | 3-15-2042 | 175,000 | 219,948 | ||||||||||||
Ventas Realty LP | 3.50 | 2-1-2025 | 400,000 | 428,591 | ||||||||||||
VEREIT Operating Partnership LP | 4.60 | 2-6-2024 | 98,000 | 107,812 | ||||||||||||
VEREIT Operating Partnership LP | 4.88 | 6-1-2026 | 119,000 | 135,841 | ||||||||||||
Welltower Incorporated | 4.95 | 9-1-2048 | 400,000 | 519,193 | ||||||||||||
Weyerhaeuser Company | 7.38 | 3-15-2032 | 200,000 | 283,688 | ||||||||||||
| 9,782,364 | ||||||||||||||||
|
| |||||||||||||||
Utilities: 7.26% |
| |||||||||||||||
| Electric Utilities: 5.43% | ||||||||||||||||
Alabama Power Company | 3.55 | 12-1-2023 | 175,000 | 187,850 | ||||||||||||
Alabama Power Company | 3.85 | 12-1-2042 | 140,000 | 161,113 | ||||||||||||
Alabama Power Company | 4.15 | 8-15-2044 | 105,000 | 124,855 | ||||||||||||
American Electric Power Company Incorporated | 2.95 | 12-15-2022 | 300,000 | 311,077 | ||||||||||||
Appalachian Power Company | 3.40 | 6-1-2025 | 175,000 | 188,232 | ||||||||||||
Appalachian Power Company | 4.45 | 6-1-2045 | 175,000 | 213,629 | ||||||||||||
Appalachian Power Company | 7.00 | 4-1-2038 | 70,000 | 107,234 | ||||||||||||
Arizona Public Service Company | 3.15 | 5-15-2025 | 105,000 | 112,365 | ||||||||||||
Arizona Public Service Company | 4.50 | 4-1-2042 | 70,000 | 88,726 | ||||||||||||
Baltimore Gas & Electric Company | 3.50 | 8-15-2046 | 50,000 | 54,761 | ||||||||||||
Carolina Power & Light Company | 2.80 | 5-15-2022 | 175,000 | 179,345 | ||||||||||||
CenterPoint Energy Houston | 3.55 | 8-1-2042 | 175,000 | 199,189 | ||||||||||||
CenterPoint Energy Houston | 4.50 | 4-1-2044 | 175,000 | 226,826 | ||||||||||||
Commonwealth Edison Company | 3.80 | 10-1-2042 | 70,000 | 81,035 | ||||||||||||
Commonwealth Edison Company | 5.90 | 3-15-2036 | 175,000 | 245,824 | ||||||||||||
Connecticut Light & Power Company | 4.15 | 6-1-2045 | 87,000 | 109,069 | ||||||||||||
Consolidated Edison Company of New York Incorporated Series07-A | 6.30 | 8-15-2037 | 175,000 | 253,568 | ||||||||||||
Consolidated Edison Company of New York Incorporated Series14-C | 4.63 | 12-1-2054 | 300,000 | 386,630 | ||||||||||||
Consolidated Edison Company of New York Incorporated Series16-C | 4.30 | 12-1-2056 | 245,000 | 296,930 | ||||||||||||
DTE Electric Company | 3.65 | 3-15-2024 | 105,000 | 113,640 | ||||||||||||
Duke Energy Corporation | 3.05 | 8-15-2022 | 70,000 | 72,086 | ||||||||||||
Duke Energy Corporation | 3.95 | 10-15-2023 | 140,000 | 150,272 | ||||||||||||
Duke Energy Florida Incorporated | 3.85 | 11-15-2042 | 70,000 | 79,946 | ||||||||||||
Duke Energy Indiana Incorporated | 4.90 | 7-15-2043 | 105,000 | 138,793 | ||||||||||||
Duke Energy Indiana Incorporated | 6.45 | 4-1-2039 | 45,000 | 70,193 | ||||||||||||
Duke Energy Progress Incorporated | 4.10 | 3-15-2043 | 105,000 | 123,378 | ||||||||||||
Emera US Finance LP | 3.55 | 6-15-2026 | 200,000 | 217,159 | ||||||||||||
Entergy Arkansas Incorporated | 3.70 | 6-1-2024 | 175,000 | 189,723 | ||||||||||||
Entergy Gulf States Louisiana LLC | 5.59 | 10-1-2024 | 84,000 | 98,646 | ||||||||||||
Eversource Energy | 2.80 | 5-1-2023 | 122,000 | 126,778 | ||||||||||||
Exelon Corporation | 4.95 | 6-15-2035 | 140,000 | 171,437 | ||||||||||||
The accompanying notes are an integral part of these financial statements.
192 | Wells Fargo Funds
Table of Contents
Portfolio of investments—February 29, 2020
INVESTMENT GRADE CORPORATE BOND PORTFOLIO
Interest rate | Maturity date | Principal | Value | |||||||||||||
| Electric Utilities (continued) | ||||||||||||||||
Exelon Generation Company LLC | 4.25 | % | 6-15-2022 | $ | 157,000 | $ | 165,303 | |||||||||
FirstEnergy Corporation | 4.25 | 3-15-2023 | 168,000 | 179,803 | ||||||||||||
Florida Power & Light Company | 4.05 | 6-1-2042 | 175,000 | 216,699 | ||||||||||||
Florida Power & Light Company | 5.95 | 2-1-2038 | 224,000 | 335,054 | ||||||||||||
Florida Power & Light Company | 5.96 | 4-1-2039 | 175,000 | 266,350 | ||||||||||||
Florida Power Corporation | 5.65 | 4-1-2040 | 87,000 | 124,951 | ||||||||||||
Georgia Power Company | 4.30 | 3-15-2042 | 175,000 | 203,055 | ||||||||||||
Interstate Power & Light Company | 6.25 | 7-15-2039 | 21,000 | 29,115 | ||||||||||||
Kansas City Power & Light Company | 3.15 | 3-15-2023 | 140,000 | 146,702 | ||||||||||||
MidAmerican Energy Holdings Company | 5.95 | 5-15-2037 | 210,000 | 304,266 | ||||||||||||
MidAmerican Energy Holdings Company | 6.13 | 4-1-2036 | 140,000 | 200,092 | ||||||||||||
MidAmerican Energy Holdings Company | 6.75 | 12-30-2031 | 105,000 | 156,243 | ||||||||||||
Northern States Power Company of Minnesota | 2.15 | 8-15-2022 | 175,000 | 178,920 | ||||||||||||
Northern States Power Company of Minnesota | 2.60 | 5-15-2023 | 105,000 | 108,619 | ||||||||||||
Northern States Power Company of Minnesota | 3.40 | 8-15-2042 | 175,000 | 199,780 | ||||||||||||
Northern States Power Company of Minnesota | 5.35 | 11-1-2039 | 28,000 | 39,639 | ||||||||||||
NSTAR Electric Company | 2.38 | 10-15-2022 | 140,000 | 143,760 | ||||||||||||
NSTAR Electric Company | 5.50 | 3-15-2040 | 70,000 | 98,053 | ||||||||||||
Oglethorpe Power Corporation | 5.95 | 11-1-2039 | 105,000 | 133,975 | ||||||||||||
Ohio Edison Company | 6.88 | 7-15-2036 | 175,000 | 271,539 | ||||||||||||
Ohio Power Company | 5.38 | 10-1-2021 | 45,000 | 47,924 | ||||||||||||
Oncor Electric Delivery Company LLC | 4.55 | 12-1-2041 | 140,000 | 183,724 | ||||||||||||
Oncor Electric Delivery Company LLC | 7.00 | 5-1-2032 | 122,000 | 183,428 | ||||||||||||
PacifiCorp | 3.60 | 4-1-2024 | 175,000 | 189,772 | ||||||||||||
PacifiCorp | 4.10 | 2-1-2042 | 70,000 | 85,267 | ||||||||||||
PacifiCorp | 5.75 | 4-1-2037 | 175,000 | 247,879 | ||||||||||||
Potomac Electric Power Company | 3.60 | 3-15-2024 | 175,000 | 187,661 | ||||||||||||
Potomac Electric Power Company | 6.50 | 11-15-2037 | 140,000 | 208,614 | ||||||||||||
PPL Capital Funding Incorporated | 4.20 | 6-15-2022 | 140,000 | 147,240 | ||||||||||||
PPL Electric Utilities | 4.75 | 7-15-2043 | 105,000 | 135,722 | ||||||||||||
PPL Electric Utilities | 6.25 | 5-15-2039 | 31,000 | 45,859 | ||||||||||||
PSEG Power LLC | 8.63 | 4-15-2031 | 75,000 | 107,016 | ||||||||||||
Public Service Company of Colorado | 2.25 | 9-15-2022 | 70,000 | 71,320 | ||||||||||||
Public Service Electric & Gas Company | 2.38 | 5-15-2023 | 140,000 | 144,036 | ||||||||||||
Public Service Electric & Gas Company | 3.65 | 9-1-2042 | 175,000 | 203,797 | ||||||||||||
Public Service Electric & Gas Company | 3.80 | 1-1-2043 | 140,000 | 165,775 | ||||||||||||
Public Service Electric & Gas Company | 3.95 | 5-1-2042 | 70,000 | 84,416 | ||||||||||||
Public Service Electric & Gas Company | 5.80 | 5-1-2037 | 70,000 | 99,261 | ||||||||||||
South Carolina Electric & Gas Company | 5.10 | 6-1-2065 | 100,000 | 144,109 | ||||||||||||
Southern California Edison Company | 3.88 | 6-1-2021 | 449,000 | 457,297 | ||||||||||||
Southern California Edison Company | 3.90 | 3-15-2043 | 105,000 | 114,940 | ||||||||||||
Southern California Edison Company | 5.35 | 7-15-2035 | 126,000 | 167,255 | ||||||||||||
Southern California Edison Company | 5.50 | 3-15-2040 | 140,000 | 188,888 | ||||||||||||
Southern California Edison Company | 6.00 | 1-15-2034 | 70,000 | 97,218 | ||||||||||||
Southern Company | 2.95 | 7-1-2023 | 200,000 | 207,859 | ||||||||||||
Southwestern Electric Power Company | 6.20 | 3-15-2040 | 35,000 | 50,134 | ||||||||||||
TXU Electric Delivery Company | 7.25 | 1-15-2033 | 52,000 | 80,347 | ||||||||||||
Union Electric Company | 3.90 | 9-15-2042 | 175,000 | 212,709 | ||||||||||||
Union Electric Company | 8.45 | 3-15-2039 | 56,000 | 99,130 | ||||||||||||
Virginia Electric & Power Company | 3.10 | 5-15-2025 | 70,000 | 74,561 | ||||||||||||
Virginia Electric & Power Company | 3.45 | 2-15-2024 | 105,000 | 111,921 | ||||||||||||
Virginia Electric & Power Company | 4.20 | 5-15-2045 | 105,000 | 126,821 | ||||||||||||
Virginia Electric & Power Company | 4.45 | 2-15-2044 | 105,000 | 129,963 | ||||||||||||
Virginia Electric & Power Company | 6.00 | 1-15-2036 | 70,000 | 99,531 | ||||||||||||
The accompanying notes are an integral part of these financial statements.
Wells Fargo Funds | 193
Table of Contents
Portfolio of investments—February 29, 2020
INVESTMENT GRADE CORPORATE BOND PORTFOLIO
Interest rate | Maturity date | Principal | Value | |||||||||||||
| Electric Utilities (continued) | ||||||||||||||||
Westar Energy Incorporated | 4.10 | % | 4-1-2043 | $ | 210,000 | $ | 258,700 | |||||||||
Wisconsin Electric Power Company | 5.63 | 5-15-2033 | 70,000 | 95,530 | ||||||||||||
Wisconsin Electric Power Company | 5.70 | 12-1-2036 | 105,000 | 145,317 | ||||||||||||
Wisconsin Power & Light Company | 6.38 | 8-15-2037 | 175,000 | 252,289 | ||||||||||||
| 14,235,457 | ||||||||||||||||
|
| |||||||||||||||
| Gas Utilities: 0.36% | ||||||||||||||||
Atmos Energy Corporation | 4.13 | 10-15-2044 | 245,000 | 291,631 | ||||||||||||
Atmos Energy Corporation | 5.50 | 6-15-2041 | 42,000 | 57,114 | ||||||||||||
CenterPoint Energy Resources Corporation | 5.85 | 1-15-2041 | 77,000 | 106,787 | ||||||||||||
National Fuel Gas Company | 3.75 | 3-1-2023 | 218,000 | 228,266 | ||||||||||||
One Gas Incorporated | 3.61 | 2-1-2024 | 70,000 | 74,647 | ||||||||||||
One Gas Incorporated | 4.66 | 2-1-2044 | 35,000 | 44,094 | ||||||||||||
Piedmont Natural Gas Company | 4.65 | 8-1-2043 | 35,000 | 42,848 | ||||||||||||
Southern California Gas Company | 5.13 | 11-15-2040 | 70,000 | 90,165 | ||||||||||||
| 935,552 | ||||||||||||||||
|
| |||||||||||||||
| Multi-Utilities: 1.38% | ||||||||||||||||
Black Hills Corporation | 4.25 | 11-30-2023 | 210,000 | 228,141 | ||||||||||||
CMS Energy Corporation | 5.05 | 3-15-2022 | 245,000 | 260,530 | ||||||||||||
Consumers Energy Company | 3.95 | 5-15-2043 | 140,000 | 169,463 | ||||||||||||
Dominion Resources Incorporated | 2.75 | 9-15-2022 | 210,000 | 214,776 | ||||||||||||
Dominion Resources Incorporated | 4.90 | 8-1-2041 | 42,000 | 52,145 | ||||||||||||
Dominion Resources Incorporated | 5.95 | 6-15-2035 | 157,000 | 212,119 | ||||||||||||
DTE Energy Company | 3.30 | 6-15-2022 | 70,000 | 72,728 | ||||||||||||
DTE Energy Company | 3.85 | 12-1-2023 | 170,000 | 182,109 | ||||||||||||
Entergy Louisiana LLC | 4.20 | 4-1-2050 | 500,000 | 623,707 | ||||||||||||
NiSource Finance Corporation | 5.65 | 2-1-2045 | 140,000 | 191,153 | ||||||||||||
Puget Energy Incorporated | 3.65 | 5-15-2025 | 140,000 | 150,348 | ||||||||||||
Puget Energy Incorporated | 6.00 | 9-1-2021 | 175,000 | 186,793 | ||||||||||||
Sempra Energy | 2.88 | 10-1-2022 | 140,000 | 144,269 | ||||||||||||
Sempra Energy | 3.25 | 6-15-2027 | 300,000 | 321,480 | ||||||||||||
Sempra Energy | 4.00 | 2-1-2048 | 400,000 | 442,719 | ||||||||||||
WEC Energy Group Incorporated | 3.55 | 6-15-2025 | 140,000 | 152,439 | ||||||||||||
| 3,604,919 | ||||||||||||||||
|
| |||||||||||||||
| Water Utilities: 0.09% | ||||||||||||||||
American Water Capital Corporation | 3.40 | 3-1-2025 | 210,000 | 228,476 | ||||||||||||
|
| |||||||||||||||
Total Corporate Bonds and Notes (Cost $187,618,909) |
| 209,553,154 | ||||||||||||||
|
| |||||||||||||||
Yankee Corporate Bonds and Notes: 18.56% |
| |||||||||||||||
Communication Services: 1.78% |
| |||||||||||||||
| Diversified Telecommunication Services: 0.43% | ||||||||||||||||
British Telecommunications plc | 9.63 | 12-15-2030 | 200,000 | 316,721 | ||||||||||||
Telefonica Emisiones SA | 4.90 | 3-6-2048 | 300,000 | 365,227 | ||||||||||||
Telefonica Europe BV | 8.25 | 9-15-2030 | 294,000 | 433,443 | ||||||||||||
| 1,115,391 | ||||||||||||||||
|
| |||||||||||||||
| Wireless Telecommunication Services: 1.35% | ||||||||||||||||
America Movil SAB de CV | 4.38 | 4-22-2049 | 500,000 | 619,515 | ||||||||||||
America Movil SAB de CV | 6.38 | 3-1-2035 | 395,000 | 568,524 | ||||||||||||
The accompanying notes are an integral part of these financial statements.
194 | Wells Fargo Funds
Table of Contents
Portfolio of investments—February 29, 2020
INVESTMENT GRADE CORPORATE BOND PORTFOLIO
Interest rate | Maturity date | Principal | Value | |||||||||||||
| Wireless Telecommunication Services (continued) | ||||||||||||||||
Rogers Communications Incorporated | 4.35 | % | 5-1-2049 | $ | 300,000 | $ | 357,908 | |||||||||
Rogers Communications Incorporated | 4.50 | 3-15-2043 | 740,000 | 878,338 | ||||||||||||
Vodafone Group plc | 2.95 | 2-19-2023 | 190,000 | 197,736 | ||||||||||||
Vodafone Group plc | 4.38 | 2-19-2043 | 350,000 | 394,481 | ||||||||||||
Vodafone Group plc | 6.25 | 11-30-2032 | 210,000 | 282,109 | ||||||||||||
Vodafone Group plc | 7.88 | 2-15-2030 | 175,000 | 250,572 | ||||||||||||
| 3,549,183 | ||||||||||||||||
|
| |||||||||||||||
Consumer Discretionary: 0.42% |
| |||||||||||||||
| Auto Components: 0.08% | ||||||||||||||||
Magna International Incorporated | 4.15 | 10-1-2025 | 175,000 | 196,280 | ||||||||||||
|
| |||||||||||||||
| Internet & Direct Marketing Retail: 0.34% | ||||||||||||||||
Alibaba Group Holding Limited | 3.13 | 11-28-2021 | 250,000 | 256,314 | ||||||||||||
Alibaba Group Holding Limited | 3.40 | 12-6-2027 | 400,000 | 430,613 | ||||||||||||
Alibaba Group Holding Limited | 3.60 | 11-28-2024 | 200,000 | 214,925 | ||||||||||||
| 901,852 | ||||||||||||||||
|
| |||||||||||||||
Consumer Staples: 0.15% |
| |||||||||||||||
| Beverages: 0.15% | ||||||||||||||||
Diageo Capital plc | 2.63 | 4-29-2023 | 210,000 | 217,795 | ||||||||||||
Diageo Capital plc | 5.88 | 9-30-2036 | 122,000 | 177,888 | ||||||||||||
| 395,683 | ||||||||||||||||
|
| |||||||||||||||
Energy: 1.88% |
| |||||||||||||||
| Oil, Gas & Consumable Fuels: 1.88% | ||||||||||||||||
BP Capital Markets plc | 3.81 | 2-10-2024 | 350,000 | 378,189 | ||||||||||||
Canadian Natural Resources Limited | 3.85 | 6-1-2027 | 200,000 | 213,822 | ||||||||||||
Canadian Natural Resources Limited | 3.90 | 2-1-2025 | 210,000 | 228,187 | ||||||||||||
Canadian Natural Resources Limited | 4.95 | 6-1-2047 | 200,000 | 237,994 | ||||||||||||
Canadian Natural Resources Limited | 6.75 | 2-1-2039 | 110,000 | 152,375 | ||||||||||||
Cenovus Energy Incorporated | 3.00 | 8-15-2022 | 145,000 | 149,365 | ||||||||||||
Cenovus Energy Incorporated | 6.75 | 11-15-2039 | 240,000 | 295,616 | ||||||||||||
Encana Corporation | 6.50 | 8-15-2034 | 200,000 | 214,458 | ||||||||||||
Husky Energy Incorporated | 6.80 | 9-15-2037 | 70,000 | 92,356 | ||||||||||||
Petro-Canada | 5.95 | 5-15-2035 | 140,000 | 193,078 | ||||||||||||
Suncor Energy Incorporated | 5.95 | 12-1-2034 | 52,000 | 71,848 | ||||||||||||
Total Capital Canada Limited | 2.75 | 7-15-2023 | 245,000 | 255,081 | ||||||||||||
Total Capital International SA | 2.70 | 1-25-2023 | 385,000 | 398,117 | ||||||||||||
Total Capital International SA | 2.88 | 2-17-2022 | 175,000 | 180,125 | ||||||||||||
Total Capital International SA | 3.75 | 4-10-2024 | 350,000 | 380,749 | ||||||||||||
TransCanada PipeLines Limited | 3.75 | 10-16-2023 | 175,000 | 186,586 | ||||||||||||
TransCanada PipeLines Limited | 4.63 | 3-1-2034 | 850,000 | 993,573 | ||||||||||||
TransCanada PipeLines Limited | 6.10 | 6-1-2040 | 210,000 | 293,828 | ||||||||||||
| 4,915,347 | ||||||||||||||||
|
| |||||||||||||||
Financials: 11.55% |
| |||||||||||||||
| Banks: 9.46% | ||||||||||||||||
Banco Santander SA | 4.38 | 4-12-2028 | 800,000 | 901,842 | ||||||||||||
Bank of Montreal | 1.90 | 8-27-2021 | 470,000 | 473,409 | ||||||||||||
Bank of Montreal | 2.35 | 9-11-2022 | 200,000 | 204,376 | ||||||||||||
The accompanying notes are an integral part of these financial statements.
Wells Fargo Funds | 195
Table of Contents
Portfolio of investments—February 29, 2020
INVESTMENT GRADE CORPORATE BOND PORTFOLIO
Interest rate | Maturity date | Principal | Value | |||||||||||||
| Banks (continued) | ||||||||||||||||
Bank of Montreal (5 Year USD Swap +1.43%)± | 3.80 | % | 12-15-2032 | $ | 600,000 | $ | 646,680 | |||||||||
Bank of Nova Scotia | 2.45 | 9-19-2022 | 300,000 | 307,859 | ||||||||||||
Bank of Nova Scotia | 4.50 | 12-16-2025 | 500,000 | 564,884 | ||||||||||||
Barclays plc | 4.38 | 1-12-2026 | 200,000 | 220,690 | ||||||||||||
Barclays plc | 5.25 | 8-17-2045 | 400,000 | 508,144 | ||||||||||||
BNP Paribas | 4.25 | 10-15-2024 | 400,000 | 436,177 | ||||||||||||
BPCE SA | 2.75 | 12-2-2021 | 330,000 | 337,101 | ||||||||||||
Cooperatieve Rabobank UA | 3.75 | 7-21-2026 | 780,000 | 846,017 | ||||||||||||
Credit Suisse Group Funding Limited | 3.45 | 4-16-2021 | 550,000 | 560,938 | ||||||||||||
Credit Suisse Group Funding Limited | 4.55 | 4-17-2026 | 750,000 | 845,981 | ||||||||||||
HSBC Holdings plc | 4.00 | 3-30-2022 | 200,000 | 209,122 | ||||||||||||
HSBC Holdings plc (3 Month LIBOR +1.55%)± | 4.04 | 3-13-2028 | 1,500,000 | 1,643,345 | ||||||||||||
HSBC Holdings plc (3 Month LIBOR +1.53%)± | 4.58 | 6-19-2029 | 400,000 | 454,348 | ||||||||||||
HSBC Holdings plc | 4.88 | 1-14-2022 | 175,000 | 185,289 | ||||||||||||
ING Banking Group plc | 4.55 | 10-2-2028 | 900,000 | 1,063,198 | ||||||||||||
Lloyds Banking Group plc (3 Month LIBOR +1.21%)± | 3.57 | 11-7-2028 | 800,000 | 848,081 | ||||||||||||
Lloyds Banking Group plc | 4.58 | 12-10-2025 | 250,000 | 273,227 | ||||||||||||
Lloyds Banking Group plc | 5.30 | 12-1-2045 | 300,000 | 387,543 | ||||||||||||
Mitsubishi UFJ Financial Group Incorporated | 2.19 | 9-13-2021 | 600,000 | 607,123 | ||||||||||||
Mitsubishi UFJ Financial Group Incorporated | 2.76 | 9-13-2026 | 700,000 | 736,879 | ||||||||||||
Mitsubishi UFJ Financial Group Incorporated | 3.68 | 2-22-2027 | 200,000 | 220,749 | ||||||||||||
Mizuho Financial Group | 2.95 | 2-28-2022 | 750,000 | 770,473 | ||||||||||||
Mizuho Financial Group | 3.17 | 9-11-2027 | 600,000 | 646,459 | ||||||||||||
National Australia Bank Limited | 2.50 | 7-12-2026 | 800,000 | 833,200 | ||||||||||||
Rabobank Nederland NV | 3.88 | 2-8-2022 | 250,000 | 261,743 | ||||||||||||
Royal Bank of Canada | 4.65 | 1-27-2026 | 700,000 | 809,439 | ||||||||||||
Royal Bank of Scotland Group plc | 3.88 | 9-12-2023 | 300,000 | 319,069 | ||||||||||||
Royal Bank of Scotland Group plc | 4.80 | 4-5-2026 | 400,000 | 457,276 | ||||||||||||
Royal Bank of Scotland Group plc (3 Month LIBOR +1.91%)± | 5.08 | 1-27-2030 | 600,000 | 710,116 | ||||||||||||
Santander UK plc | 4.00 | 3-13-2024 | 200,000 | 216,639 | ||||||||||||
Sumitomo Mitsui Banking Corporation | 3.95 | 7-19-2023 | 250,000 | 269,419 | ||||||||||||
Sumitomo Mitsui Financial Group | 2.35 | 1-15-2025 | 2,000,000 | 2,038,837 | ||||||||||||
Sumitomo Mitsui Financial Group | 3.01 | 10-19-2026 | 655,000 | 692,046 | ||||||||||||
Svenska Handelsbanken AB | 3.35 | 5-24-2021 | 850,000 | 870,851 | ||||||||||||
Toronto Dominion Bank | 1.80 | 7-13-2021 | 200,000 | 201,043 | ||||||||||||
Toronto Dominion Bank | 3.50 | 7-19-2023 | 300,000 | 320,841 | ||||||||||||
Toronto Dominion Bank (5 Year USD Swap +2.21%)± | 3.63 | 9-15-2031 | 525,000 | 571,631 | ||||||||||||
Westpac Banking Corporation | 2.10 | 5-13-2021 | 350,000 | 352,232 | ||||||||||||
Westpac Banking Corporation | 2.50 | 6-28-2022 | 200,000 | 205,782 | ||||||||||||
Westpac Banking Corporation | 2.85 | 5-13-2026 | 700,000 | 738,013 | ||||||||||||
| 24,768,111 | ||||||||||||||||
|
| |||||||||||||||
| Capital Markets: 0.07% | ||||||||||||||||
Invesco Finance plc | 4.00 | 1-30-2024 | 175,000 | 191,398 | ||||||||||||
|
| |||||||||||||||
| Diversified Financial Services: 1.82% | ||||||||||||||||
Barrick Australian Finance Proprietary Limited | 5.95 | 10-15-2039 | 135,000 | 184,879 | ||||||||||||
BHP Billiton Finance USA Limited | 3.85 | 9-30-2023 | 200,000 | 218,436 | ||||||||||||
Brookfield Finance Incorporated | 4.25 | 6-2-2026 | 200,000 | 226,867 | ||||||||||||
ConocoPhillips Canada Funding Company | 5.95 | 10-15-2036 | 210,000 | 295,443 | ||||||||||||
DH Europe Finance II | 2.60 | 11-15-2029 | 1,300,000 | 1,348,934 | ||||||||||||
GE Capital International Funding Company | 3.37 | 11-15-2025 | 550,000 | 586,336 | ||||||||||||
Medtronic Global Holdings Company | 3.35 | 4-1-2027 | 300,000 | 331,575 | ||||||||||||
Shell International Finance BV | 2.25 | 1-6-2023 | 175,000 | 179,313 | ||||||||||||
The accompanying notes are an integral part of these financial statements.
196 | Wells Fargo Funds
Table of Contents
Portfolio of investments—February 29, 2020
INVESTMENT GRADE CORPORATE BOND PORTFOLIO
Interest rate | Maturity date | Principal | Value | |||||||||||||
| Diversified Financial Services (continued) | ||||||||||||||||
Shell International Finance BV | 2.38 | % | 8-21-2022 | $ | 175,000 | $ | 179,220 | |||||||||
Shell International Finance BV | 2.88 | 5-10-2026 | 230,000 | 244,817 | ||||||||||||
Shell International Finance BV | 3.25 | 5-11-2025 | 350,000 | 377,167 | ||||||||||||
Shell International Finance BV | 3.40 | 8-12-2023 | 175,000 | 186,410 | ||||||||||||
Shell International Finance BV | 3.63 | 8-21-2042 | 175,000 | 189,018 | ||||||||||||
WPP Finance Limited 2010 | 3.75 | 9-19-2024 | 200,000 | 215,137 | ||||||||||||
| 4,763,552 | ||||||||||||||||
|
| |||||||||||||||
| Insurance: 0.20% | ||||||||||||||||
Aon plc | 3.88 | 12-15-2025 | 200,000 | 222,214 | ||||||||||||
Aon plc | 4.00 | 11-27-2023 | 105,000 | 113,396 | ||||||||||||
XLIT Limited | 5.25 | 12-15-2043 | 140,000 | 203,633 | ||||||||||||
| 539,243 | ||||||||||||||||
|
| |||||||||||||||
Health Care: 1.24% |
| |||||||||||||||
| Health Care Equipment & Supplies: 0.10% | ||||||||||||||||
Koninklijke Philips Electronics NV | 6.88 | 3-11-2038 | 175,000 | 269,509 | ||||||||||||
|
| |||||||||||||||
| Pharmaceuticals: 1.14% | ||||||||||||||||
Actavis Funding SCS | 3.85 | 6-15-2024 | 350,000 | 379,387 | ||||||||||||
Actavis Funding SCS | 4.85 | 6-15-2044 | 350,000 | 426,802 | ||||||||||||
AstraZeneca plc | 3.38 | 11-16-2025 | 500,000 | 547,683 | ||||||||||||
AstraZeneca plc | 4.38 | 11-16-2045 | 200,000 | 259,517 | ||||||||||||
Mylan NV | 3.95 | 6-15-2026 | 700,000 | 761,069 | ||||||||||||
Shire plc ADR | 3.20 | 9-23-2026 | 560,000 | 600,652 | ||||||||||||
| 2,975,110 | ||||||||||||||||
|
| |||||||||||||||
Industrials: 0.77% |
| |||||||||||||||
| Aerospace & Defense: 0.12% | ||||||||||||||||
Embraer Netherlands Finance BV | 5.05 | 6-15-2025 | 290,000 | 316,100 | ||||||||||||
|
| |||||||||||||||
| Machinery: 0.15% | ||||||||||||||||
Ingersoll-Rand Luxembourg Finance SA | 4.50 | 3-21-2049 | 300,000 | 386,186 | ||||||||||||
|
| |||||||||||||||
| Professional Services: 0.13% | ||||||||||||||||
Thomson Reuters Corporation | 4.30 | 11-23-2023 | 210,000 | 228,827 | ||||||||||||
Thomson Reuters Corporation | 5.85 | 4-15-2040 | 94,000 | 124,187 | ||||||||||||
| 353,014 | ||||||||||||||||
|
| |||||||||||||||
| Road & Rail: 0.16% | ||||||||||||||||
Canadian National Railway Company | 6.20 | 6-1-2036 | 140,000 | 203,845 | ||||||||||||
Canadian Pacific Railway Company | 4.45 | 3-15-2023 | 140,000 | 150,958 | ||||||||||||
Canadian Pacific Railway Company | 5.95 | 5-15-2037 | 45,000 | 64,932 | ||||||||||||
| 419,735 | ||||||||||||||||
|
| |||||||||||||||
| Trading Companies & Distributors: 0.21% | ||||||||||||||||
AerCap Ireland Capital DAC | 3.95 | 2-1-2022 | 520,000 | 537,224 | ||||||||||||
|
| |||||||||||||||
Materials: 0.77% |
| |||||||||||||||
| Chemicals: 0.45% | ||||||||||||||||
LyondellBasell Industries NV | 4.63 | 2-26-2055 | 350,000 | 391,487 | ||||||||||||
Nutrien Limited | 3.63 | 3-15-2024 | 200,000 | 213,662 | ||||||||||||
The accompanying notes are an integral part of these financial statements.
Wells Fargo Funds | 197
Table of Contents
Portfolio of investments—February 29, 2020
INVESTMENT GRADE CORPORATE BOND PORTFOLIO
Interest rate | Maturity date | Principal | Value | |||||||||||||
| Chemicals (continued) | ||||||||||||||||
Nutrien Limited | 5.00 | % | 4-1-2049 | $ | 200,000 | $ | 248,919 | |||||||||
Nutrien Limited | 5.63 | 12-1-2040 | 140,000 | 179,752 | ||||||||||||
Nutrien Limited | 6.13 | 1-15-2041 | 115,000 | 153,272 | ||||||||||||
| 1,187,092 | ||||||||||||||||
|
| |||||||||||||||
| Metals & Mining: 0.32% | ||||||||||||||||
Rio Tinto Finance (USA) Limited | 4.13 | 8-21-2042 | 175,000 | 209,815 | ||||||||||||
Vale Overseas Limited | 6.88 | 11-21-2036 | 382,000 | 503,205 | ||||||||||||
Vale Overseas Limited | 6.88 | 11-10-2039 | 91,000 | 120,632 | ||||||||||||
| 833,652 | ||||||||||||||||
|
| |||||||||||||||
Total Yankee Corporate Bonds and Notes (Cost $44,394,608) |
| 48,613,662 | ||||||||||||||
|
| |||||||||||||||
| Yield | Shares | |||||||||||||||
| Short-Term Investments: 0.11% |
| |||||||||||||||
| Investment Companies: 0.11% | ||||||||||||||||
Wells Fargo Government Money Market Fund Select Class (l)(u) | 1.52 | 289,733 | 289,733 | |||||||||||||
|
| |||||||||||||||
Total Short-Term Investments (Cost $289,733) |
| 289,733 | ||||||||||||||
|
| |||||||||||||||
| Total investments in securities (Cost $232,303,250) | 98.68 | % | 258,456,549 | |||||
Other assets and liabilities, net | 1.32 | 3,459,308 | ||||||
|
|
|
| |||||
| Total net assets | 100.00 | % | $ | 261,915,857 | ||||
|
|
|
| |||||
| 144A | The security may be resold in transactions exempt from registration, normally to qualified institutional buyers, pursuant to Rule 144A under the Securities Act of 1933. |
| ± | Variable rate investment. The rate shown is the rate in effect at period end. |
| (l) | The issuer of the security is an affiliated person of the Portfolio as defined in the Investment Company Act of 1940. |
| (u) | The rate represents the7-day annualized yield at period end. |
Abbreviations:
| ADR | American depositary receipt |
| LIBOR | London Interbank Offered Rate |
| REIT | Real estate investment trust |
Investments in Affiliates
An affiliated investment is an investment in which the Portfolio owns at least 5% of the outstanding voting shares of the issuer or as a result of other relationships, such as the Portfolio and the issuer having the same adviser or investment manager. Transactions with issuers that were either affiliated persons of the Portfolio at the beginning of the period or the end of the period were as follows:
| Shares, beginning of period | Shares purchased | Shares sold | Shares, end of period | Net realized gains (losses) | Net change in unrealized gains (losses) | Income from affiliated securities | Value, end of period | % of net assets | ||||||||||||||||||||||||||||
| Short-Term Investments | ||||||||||||||||||||||||||||||||||||
Investment Companies | ||||||||||||||||||||||||||||||||||||
Wells Fargo Government Money Market Fund Select Class | 854,059 | 45,498,682 | (46,063,008 | ) | 289,733 | $ | 0 | $ | 0 | $ | 28,280 | $ | 289,733 | 0.11 | % | |||||||||||||||||||||
The accompanying notes are an integral part of these financial statements.
198 | Wells Fargo Funds
Table of Contents
Portfolio of investments—February 29, 2020
STRATEGIC RETIREMENT BOND PORTFOLIO
| Interest rate | Maturity date | Principal | Value | |||||||||||||
| Agency Securities: 1.25% | ||||||||||||||||
FHLB | 2.00 | % | 9-9-2022 | $ | 200,000 | $ | 205,207 | |||||||||
FHLB | 2.13 | 6-9-2023 | 35,000 | 36,318 | ||||||||||||
FHLB | 2.38 | 9-10-2021 | 200,000 | 204,183 | ||||||||||||
FHLB | 2.75 | 12-13-2024 | 20,000 | 21,605 | ||||||||||||
FHLB | 3.25 | 6-9-2023 | 50,000 | 53,732 | ||||||||||||
FNMA | 1.38 | 10-7-2021 | 45,000 | 45,282 | ||||||||||||
FNMA | 1.88 | 9-24-2026 | 55,000 | 57,500 | ||||||||||||
FNMA | 2.13 | 4-24-2026 | 28,000 | 29,618 | ||||||||||||
FNMA | 2.63 | 9-6-2024 | 100,000 | 107,211 | ||||||||||||
FNMA | 2.88 | 9-12-2023 | 175,000 | 186,717 | ||||||||||||
Total Agency Securities (Cost $913,630) |
| 947,373 | ||||||||||||||
|
| |||||||||||||||
| U.S. Treasury Securities: 98.36% | ||||||||||||||||
TIPS | 0.13 | 4-15-2021 | 1,122,199 | 1,123,302 | ||||||||||||
TIPS | 0.13 | 1-15-2022 | 1,487,335 | 1,497,301 | ||||||||||||
TIPS | 0.13 | 4-15-2022 | 1,720,242 | 1,731,607 | ||||||||||||
TIPS | 0.13 | 7-15-2022 | 1,249,320 | 1,266,292 | ||||||||||||
TIPS | 0.13 | 1-15-2023 | 1,490,709 | 1,508,278 | ||||||||||||
TIPS | 0.13 | 7-15-2024 | 2,492,399 | 2,553,958 | ||||||||||||
TIPS | 0.13 | 10-15-2024 | 1,146,821 | 1,176,621 | ||||||||||||
TIPS | 0.13 | 7-15-2026 | 1,101,006 | 1,135,685 | ||||||||||||
TIPS | 0.25 | 1-15-2025 | 770,315 | 793,466 | ||||||||||||
TIPS | 0.25 | 7-15-2029 | 884,057 | 929,619 | ||||||||||||
TIPS | 0.38 | 7-15-2023 | 1,844,064 | 1,893,562 | ||||||||||||
TIPS | 0.38 | 7-15-2025 | 1,674,193 | 1,746,216 | ||||||||||||
TIPS | 0.38 | 1-15-2027 | 1,462,739 | 1,530,029 | ||||||||||||
TIPS | 0.38 | 7-15-2027 | 1,523,240 | 1,602,985 | ||||||||||||
TIPS | 0.50 | 4-15-2024 | 636,806 | 658,120 | ||||||||||||
TIPS | 0.50 | 1-15-2028 | 1,380,372 | 1,464,243 | ||||||||||||
TIPS | 0.63 | 7-15-2021 | 1,863,021 | 1,889,237 | ||||||||||||
TIPS | 0.63 | 4-15-2023 | 1,820,808 | 1,870,929 | ||||||||||||
TIPS | 0.63 | 1-15-2024 | 1,284,151 | 1,332,080 | ||||||||||||
TIPS | 0.63 | 1-15-2026 | 1,065,268 | 1,124,690 | ||||||||||||
TIPS | 0.75 | 7-15-2028 | 1,335,987 | 1,455,698 | ||||||||||||
TIPS | 0.88 | 1-15-2029 | 961,736 | 1,059,029 | ||||||||||||
TIPS | 1.75 | 1-15-2028 | 723,712 | 838,052 | ||||||||||||
TIPS | 2.00 | 1-15-2026 | 1,042,258 | 1,185,348 | ||||||||||||
TIPS | 2.38 | 1-15-2025 | 591,664 | 670,908 | ||||||||||||
TIPS | 2.38 | 1-15-2027 | 583,611 | 691,499 | ||||||||||||
TIPS | 2.50 | 1-15-2029 | 580,497 | 723,321 | ||||||||||||
TIPS | 3.63 | 4-15-2028 | 79,441 | 104,442 | ||||||||||||
TIPS | 3.88 | 4-15-2029 | 1,188,009 | 1,636,194 | ||||||||||||
U.S. Treasury Bond | 0.13 | 1-15-2030 | 589,292 | 612,808 | ||||||||||||
U.S. Treasury Bond | 2.88 | 5-15-2028 | 645,000 | 735,502 | ||||||||||||
U.S. Treasury Bond | 6.13 | 11-15-2027 | 215,000 | 296,171 | ||||||||||||
U.S. Treasury Bond | 6.13 | 8-15-2029 | 115,000 | 166,710 | ||||||||||||
U.S. Treasury Bond | 6.38 | 8-15-2027 | 125,000 | 173,027 | ||||||||||||
U.S. Treasury Bond | 6.88 | 8-15-2025 | 20,000 | 26,304 | ||||||||||||
U.S. Treasury Note | 1.13 | 7-31-2021 | 493,000 | 493,867 | ||||||||||||
U.S. Treasury Note | 1.13 | 9-30-2021 | 510,000 | 511,215 | ||||||||||||
U.S. Treasury Note | 1.25 | 10-31-2021 | 513,000 | 515,485 | ||||||||||||
U.S. Treasury Note | 1.25 | 7-31-2023 | 488,000 | 493,833 | ||||||||||||
U.S. Treasury Note | 1.38 | 4-30-2021 | 479,000 | 480,647 | ||||||||||||
U.S. Treasury Note | 1.38 | 6-30-2023 | 489,000 | 496,660 | ||||||||||||
The accompanying notes are an integral part of these financial statements.
Wells Fargo Funds | 199
Table of Contents
Portfolio of investments—February 29, 2020
STRATEGIC RETIREMENT BOND PORTFOLIO
| Interest rate | Maturity date | Principal | Value | |||||||||||||
| U.S. Treasury Securities (continued) | ||||||||||||||||
U.S. Treasury Note | 1.38 | % | 8-31-2023 | $ | 490,000 | $ | 498,020 | |||||||||
U.S. Treasury Note | 1.38 | 9-30-2023 | 339,000 | 344,654 | ||||||||||||
U.S. Treasury Note | 1.38 | 8-31-2026 | 380,000 | 388,253 | ||||||||||||
U.S. Treasury Note | 1.50 | 3-31-2023 | 450,000 | 458,420 | ||||||||||||
U.S. Treasury Note | 1.50 | 8-15-2026 | 325,000 | 334,534 | ||||||||||||
U.S. Treasury Note | 1.63 | 8-15-2022 | 365,000 | 371,601 | ||||||||||||
U.S. Treasury Note | 1.63 | 11-15-2022 | 695,000 | 708,629 | ||||||||||||
U.S. Treasury Note | 1.63 | 4-30-2023 | 483,000 | 494,056 | ||||||||||||
U.S. Treasury Note | 1.63 | 5-31-2023 | 435,000 | 445,127 | ||||||||||||
U.S. Treasury Note | 1.63 | 10-31-2023 | 486,000 | 498,682 | ||||||||||||
U.S. Treasury Note | 1.63 | 2-15-2026 | 663,000 | 686,827 | ||||||||||||
U.S. Treasury Note | 1.63 | 5-15-2026 | 649,000 | 672,704 | ||||||||||||
U.S. Treasury Note | 1.75 | 2-28-2022 | 483,000 | 491,000 | ||||||||||||
U.S. Treasury Note | 1.75 | 3-31-2022 | 484,000 | 492,413 | ||||||||||||
U.S. Treasury Note | 1.75 | 5-31-2022 | 507,000 | 516,566 | ||||||||||||
U.S. Treasury Note | 1.75 | 6-30-2022 | 305,000 | 311,029 | ||||||||||||
U.S. Treasury Note | 1.75 | 9-30-2022 | 420,000 | 429,270 | ||||||||||||
U.S. Treasury Note | 1.75 | 1-31-2023 | 10,000 | 10,248 | ||||||||||||
U.S. Treasury Note | 1.75 | 5-15-2023 | 130,000 | 133,519 | ||||||||||||
U.S. Treasury Note | 1.88 | 2-28-2022 | 450,000 | 458,473 | ||||||||||||
U.S. Treasury Note | 1.88 | 4-30-2022 | 505,000 | 515,455 | ||||||||||||
U.S. Treasury Note | 1.88 | 8-31-2022 | 417,000 | 427,116 | ||||||||||||
U.S. Treasury Note | 1.88 | 8-31-2024 | 160,000 | 166,694 | ||||||||||||
U.S. Treasury Note | 1.88 | 7-31-2026 | 500,000 | 526,426 | ||||||||||||
U.S. Treasury Note | 2.00 | 5-31-2021 | 469,000 | 474,533 | ||||||||||||
U.S. Treasury Note | 2.00 | 10-31-2021 | 479,000 | 487,233 | ||||||||||||
U.S. Treasury Note | 2.00 | 2-15-2022 | 10,000 | 10,210 | ||||||||||||
U.S. Treasury Note | 2.00 | 7-31-2022 | 190,000 | 195,025 | ||||||||||||
U.S. Treasury Note | 2.00 | 11-30-2022 | 645,000 | 664,375 | ||||||||||||
U.S. Treasury Note | 2.00 | 2-15-2023 | 285,000 | 294,285 | ||||||||||||
U.S. Treasury Note | 2.00 | 4-30-2024 | 10,000 | 10,441 | ||||||||||||
U.S. Treasury Note | 2.00 | 5-31-2024 | 269,000 | 281,084 | ||||||||||||
U.S. Treasury Note | 2.00 | 6-30-2024 | 185,000 | 193,477 | ||||||||||||
U.S. Treasury Note | 2.00 | 2-15-2025 | 597,000 | 627,759 | ||||||||||||
U.S. Treasury Note | 2.00 | 8-15-2025 | 645,000 | 680,273 | ||||||||||||
U.S. Treasury Note | 2.00 | 11-15-2026 | 660,000 | 701,018 | ||||||||||||
U.S. Treasury Note | 2.13 | 12-31-2021 | 474,000 | 484,184 | ||||||||||||
U.S. Treasury Note | 2.13 | 12-31-2022 | 510,000 | 527,651 | ||||||||||||
U.S. Treasury Note | 2.13 | 2-29-2024 | 378,000 | 395,925 | ||||||||||||
U.S. Treasury Note | 2.13 | 3-31-2024 | 690,000 | 723,476 | ||||||||||||
U.S. Treasury Note | 2.13 | 5-15-2025 | 75,000 | 79,471 | ||||||||||||
U.S. Treasury Note | 2.25 | 3-31-2021 | 458,000 | 463,797 | ||||||||||||
U.S. Treasury Note | 2.25 | 4-30-2021 | 635,000 | 643,731 | ||||||||||||
U.S. Treasury Note | 2.25 | 7-31-2021 | 463,000 | 471,175 | ||||||||||||
U.S. Treasury Note | 2.25 | 12-31-2023 | 472,000 | 495,877 | ||||||||||||
U.S. Treasury Note | 2.25 | 1-31-2024 | 474,000 | 498,404 | ||||||||||||
U.S. Treasury Note | 2.25 | 10-31-2024 | 490,000 | 519,496 | ||||||||||||
U.S. Treasury Note | 2.25 | 11-15-2024 | 10,000 | 10,606 | ||||||||||||
U.S. Treasury Note | 2.25 | 2-15-2027 | 580,000 | 626,898 | ||||||||||||
U.S. Treasury Note | 2.25 | 8-15-2027 | 480,000 | 521,044 | ||||||||||||
U.S. Treasury Note | 2.25 | 11-15-2027 | 650,000 | 706,850 | ||||||||||||
U.S. Treasury Note | 2.38 | 5-15-2027 | 453,000 | 494,602 | ||||||||||||
U.S. Treasury Note | 2.50 | 1-15-2022 | 585,000 | 601,979 | ||||||||||||
U.S. Treasury Note | 2.50 | 8-15-2023 | 544,000 | 573,644 | ||||||||||||
The accompanying notes are an integral part of these financial statements.
200 | Wells Fargo Funds
Table of Contents
Portfolio of investments—February 29, 2020
STRATEGIC RETIREMENT BOND PORTFOLIO
| Interest rate | Maturity date | Principal | Value | |||||||||||||
| U.S. Treasury Securities (continued) | ||||||||||||||||
U.S. Treasury Note | 2.63 | % | 12-31-2023 | $ | 375,000 | $ | 399,170 | |||||||||
U.S. Treasury Note | 2.63 | 3-31-2025 | 345,000 | 373,799 | ||||||||||||
U.S. Treasury Note | 2.63 | 1-31-2026 | 445,000 | 486,649 | ||||||||||||
U.S. Treasury Note | 2.75 | 9-15-2021 | 560,000 | 575,094 | ||||||||||||
U.S. Treasury Note | 2.75 | 8-31-2023 | 510,000 | 542,413 | ||||||||||||
U.S. Treasury Note | 2.75 | 11-15-2023 | 556,000 | 593,291 | ||||||||||||
U.S. Treasury Note | 2.75 | 2-15-2024 | 585,000 | 626,773 | ||||||||||||
U.S. Treasury Note | 2.75 | 8-31-2025 | 325,000 | 355,951 | ||||||||||||
U.S. Treasury Note | 2.75 | 2-15-2028 | 520,000 | 586,808 | ||||||||||||
U.S. Treasury Note | 2.88 | 4-30-2025 | 470,000 | 515,660 | ||||||||||||
U.S. Treasury Note | 2.88 | 5-31-2025 | 490,000 | 538,158 | ||||||||||||
U.S. Treasury Note | 2.88 | 11-30-2025 | 125,000 | 138,188 | ||||||||||||
U.S. Treasury Note | 2.88 | 8-15-2028 | 390,000 | 445,941 | ||||||||||||
U.S. Treasury Note | 3.13 | 11-15-2028 | 480,000 | 560,381 | ||||||||||||
U.S. Treasury Note | 6.00 | 2-15-2026 | 146,000 | 188,523 | ||||||||||||
U.S. Treasury Note | 6.50 | 11-15-2026 | 30,000 | 40,699 | ||||||||||||
U.S. Treasury Note | 6.63 | 2-15-2027 | 235,000 | 323,832 | ||||||||||||
U.S. Treasury Note | 6.75 | 8-15-2026 | 220,000 | 299,200 | ||||||||||||
U.S. Treasury Note | 8.00 | 11-15-2021 | 331,000 | 370,203 | ||||||||||||
U.S. Treasury Note | 8.13 | 5-15-2021 | 309,000 | 335,048 | ||||||||||||
U.S. Treasury Note | 8.13 | 8-15-2021 | 300,000 | 330,691 | ||||||||||||
Total U.S. Treasury Securities (Cost $71,764,781) |
| 74,659,651 | ||||||||||||||
|
| |||||||||||||||
| Yield | Shares | |||||||||||||||
| Short-Term Investments: 0.37% | ||||||||||||||||
Investment Companies: 0.37% |
| |||||||||||||||
Wells Fargo Government Money Market Fund Select Class (l)(u) | 1.52 | 281,311 | 281,311 | |||||||||||||
|
| |||||||||||||||
Total Short-Term Investments (Cost $281,311) |
| 281,311 | ||||||||||||||
|
| |||||||||||||||
| Total investments in securities (Cost $72,959,722) | 99.98 | % | 75,888,335 | |||||
Other assets and liabilities, net | 0.02 | 15,001 | ||||||
|
|
|
| |||||
| Total net assets | 100.00 | % | $ | 75,903,336 | ||||
|
|
|
| |||||
| (l) | The issuer of the security is an affiliated person of the Portfolio as defined in the Investment Company Act of 1940. |
| (u) | The rate represents the7-day annualized yield at period end. |
Abbreviations:
| FHLB | Federal Home Loan Bank |
| FNMA | Federal National Mortgage Association |
| TIPS | Treasury inflation-protected securities |
The accompanying notes are an integral part of these financial statements.
Wells Fargo Funds | 201
Table of Contents
Portfolio of investments—February 29, 2020
STRATEGIC RETIREMENT BOND PORTFOLIO
Investments in Affiliates
An affiliated investment is an investment in which the Portfolio owns at least 5% of the outstanding voting shares of the issuer or as a result of other relationships, such as the Portfolio and the issuer having the same adviser or investment manager. Transactions with issuers that were either affiliated persons of the Portfolio at the beginning of the period or the end of the period were as follows:
| Shares, beginning of period | Shares purchased | Shares sold | Shares, end of period | Net realized gains (losses) | Net change in unrealized gains (losses) | Income from affiliated securities | Value, end of period | % of net assets | ||||||||||||||||||||||||||||
Short-Term Investments | ||||||||||||||||||||||||||||||||||||
Investment Companies | ||||||||||||||||||||||||||||||||||||
Wells Fargo Government Money Market Fund Select Class | 140,309 | 16,409,799 | (16,268,797 | ) | 281,311 | $ | 0 | $ | 0 | $ | 4,694 | $ | 281,311 | 0.37 | % | |||||||||||||||||||||
The accompanying notes are an integral part of these financial statements.
202 | Wells Fargo Funds
Table of Contents
Portfolio of investments—February 29, 2020
| Shares | Value | |||||||||||||||
| Common Stocks: 99.46% |
| |||||||||||||||
Real Estate: 99.46% |
| |||||||||||||||
| Equity REITs: 99.46% | ||||||||||||||||
Acadia Realty Trust | 2,862 | $ | 65,370 | |||||||||||||
Alexander & Baldwin Incorporated | 2,189 | 41,153 | ||||||||||||||
Alexander’s Incorporated | 69 | 21,459 | ||||||||||||||
Alexandria Real Estate Equities Incorporated | 4,215 | 640,174 | ||||||||||||||
American Assets Trust Incorporated | 1,627 | 67,439 | ||||||||||||||
American Campus Communities Incorporated | 4,421 | 192,048 | ||||||||||||||
American Finance Trust Incorporated | 3,465 | 36,036 | ||||||||||||||
American Homes 4 Rent Class A | 8,424 | 218,097 | ||||||||||||||
Americold Realty Trust | 6,273 | 192,393 | ||||||||||||||
Apartment Investment & Management Company Class A | 4,873 | 233,124 | ||||||||||||||
Apple Hospitality REIT Incorporated | 6,994 | 91,412 | ||||||||||||||
Armada Hoffler Properties Incorporated | 1,791 | 30,017 | ||||||||||||||
AvalonBay Communities Incorporated | 4,566 | 915,894 | ||||||||||||||
Boston Properties Incorporated | 5,095 | 656,949 | ||||||||||||||
Brandywine Realty Trust | 5,686 | 77,216 | ||||||||||||||
Brixmor Property Group Incorporated | 9,938 | 180,971 | ||||||||||||||
Brookfield Property REIT Class A | 2,080 | 33,925 | ||||||||||||||
Camden Property Trust | 3,140 | 332,777 | ||||||||||||||
Colony Capital Incorporated | 15,438 | 61,134 | ||||||||||||||
Columbia Property Trust Incorporated | 3,810 | 71,857 | ||||||||||||||
Community Healthcare Trust Incorporated | 612 | 29,150 | ||||||||||||||
CoreCivic Incorporated | 3,902 | 57,789 | ||||||||||||||
Corporate Office Properties Trust | 3,624 | 91,832 | ||||||||||||||
Cousins Properties Incorporated | 4,770 | 170,241 | ||||||||||||||
CubeSmart | 6,292 | 190,459 | ||||||||||||||
DiamondRock Hospitality | 6,692 | 61,031 | ||||||||||||||
Digital Realty Trust Incorporated | 6,734 | 808,821 | ||||||||||||||
Diversified Healthcare Trust | 7,777 | 48,917 | ||||||||||||||
Douglas Emmett Incorporated | 5,513 | 210,486 | ||||||||||||||
Duke Realty Corporation | 11,986 | 389,185 | ||||||||||||||
Easterly Government Properties Incorporated | 2,441 | 58,023 | ||||||||||||||
EastGroup Properties Incorporated | 1,247 | 156,785 | ||||||||||||||
Empire State Realty Trust Incorporated Class A | 5,917 | 69,229 | ||||||||||||||
Equity Commonwealth | 3,861 | 121,467 | ||||||||||||||
Equity Lifestyle Properties Incorporated | 5,610 | 383,331 | ||||||||||||||
Equity Residential | 11,973 | 899,172 | ||||||||||||||
Essential Properties Realty | 2,905 | 66,554 | ||||||||||||||
Essex Property Trust Incorporated | 2,164 | 613,191 | ||||||||||||||
Extra Space Storage Incorporated | 4,087 | 410,171 | ||||||||||||||
Federal Realty Investment Trust | 2,518 | 292,944 | ||||||||||||||
First Industrial Realty Trust Incorporated | 4,093 | 157,581 | ||||||||||||||
Gaming and Leisure Properties Incorporated | 6,751 | 301,567 | ||||||||||||||
Global Medical REIT Incorporated | 1,280 | 17,882 | ||||||||||||||
Healthcare Realty Trust Incorporated | 4,263 | 146,221 | ||||||||||||||
Healthcare Trust of America Incorporated Class A | 6,681 | 208,046 | ||||||||||||||
Healthpeak Properties Incorporated | 16,575 | 524,433 | ||||||||||||||
Highwoods Properties Incorporated | 3,322 | 149,091 | ||||||||||||||
Host Hotels & Resorts Incorporated | 23,956 | 346,883 | ||||||||||||||
Hudson Pacific Properties Incorporated | 5,069 | 163,627 | ||||||||||||||
Independence Realty Trust Incorporated | 2,926 | 38,799 | ||||||||||||||
Industrial Logistics Properties Trust | 2,119 | 43,779 | ||||||||||||||
Innovative Industrial Properties Incorporated | 503 | 46,246 | ||||||||||||||
The accompanying notes are an integral part of these financial statements.
Wells Fargo Funds | 203
Table of Contents
Portfolio of investments—February 29, 2020
U.S. REIT PORTFOLIO
| Shares | Value | |||||||||||||||
| Equity REITs (continued) | ||||||||||||||||
Invitation Homes Incorporated | 17,688 | $ | 507,469 | |||||||||||||
Iron Mountain Incorporated | 9,265 | 281,749 | ||||||||||||||
JBG Smith Properties | 4,132 | 151,562 | ||||||||||||||
Jernigan Capital Incorporated | 717 | 12,849 | ||||||||||||||
Kilroy Realty Corporation | 3,409 | 247,800 | ||||||||||||||
Kimco Realty Corporation | 13,620 | 236,307 | ||||||||||||||
Kite Realty Group Trust | 2,797 | 45,172 | ||||||||||||||
Lamar Advertising Company Class A | 2,843 | 238,073 | ||||||||||||||
Life Storage Incorporated | 1,491 | 160,894 | ||||||||||||||
LTC Properties Incorporated | 1,269 | 56,889 | ||||||||||||||
Mack-Cali Realty Corporation | 2,789 | 52,935 | ||||||||||||||
Mid-America Apartment Communities Incorporated | 3,700 | 478,262 | ||||||||||||||
National Health Investors Incorporated | 1,384 | 113,114 | ||||||||||||||
National Storage Affiliates Trust | 1,931 | 65,152 | ||||||||||||||
NexPoint Residential Trust Incorporated | 638 | 28,391 | ||||||||||||||
Office Properties Income Trust | 1,572 | 45,792 | ||||||||||||||
Outfront Media Incorporated | 4,680 | 123,271 | ||||||||||||||
Paramount Group Incorporated | 6,364 | 77,323 | ||||||||||||||
Park Hotels & Resorts Incorporated | 7,920 | 144,619 | ||||||||||||||
Pebblebrook Hotel Trust | 4,264 | 86,175 | ||||||||||||||
Pennsylvania REIT | 2,126 | 5,017 | ||||||||||||||
Piedmont Office Realty Trust Incorporated Class A | 4,069 | 87,850 | ||||||||||||||
Prologis Incorporated | 24,314 | 2,049,184 | ||||||||||||||
PS Business Parks Incorporated | 643 | 95,518 | ||||||||||||||
Public Storage Incorporated | 4,844 | 1,012,977 | ||||||||||||||
Regency Centers Corporation | 5,455 | 313,335 | ||||||||||||||
Retail Opportunity Investment Corporation | 3,803 | 57,045 | ||||||||||||||
Rexford Industrial Realty Incorporated | 3,569 | 166,922 | ||||||||||||||
RLJ Lodging Trust | 5,533 | 73,091 | ||||||||||||||
RPT Realty | 2,548 | 33,022 | ||||||||||||||
Ryman Hospitality Properties Incorporated | 1,655 | 115,039 | ||||||||||||||
SBA Communications Corporation | 3,625 | 960,951 | ||||||||||||||
Seritage Growth Property Class A | 1,121 | 38,540 | ||||||||||||||
Service Properties Trust | 5,379 | 97,252 | ||||||||||||||
Simon Property Group Incorporated | 9,944 | 1,223,908 | ||||||||||||||
SITE Centers Corporation | 5,085 | 58,528 | ||||||||||||||
SL Green Realty Corporation | 2,634 | 206,611 | ||||||||||||||
STAG Industrial Incorporated | 4,961 | 138,809 | ||||||||||||||
Summit Hotel Properties Incorporated | 3,382 | 31,351 | ||||||||||||||
Sun Communities Incorporated | 2,957 | 452,066 | ||||||||||||||
Sunstone Hotel Investors Incorporated | 7,347 | 80,450 | ||||||||||||||
Tanger Factory Outlet Centers Incorporated | 3,139 | 37,605 | ||||||||||||||
Taubman Centers Incorporated | 2,099 | 109,274 | ||||||||||||||
Terreno Realty Corporation | 2,102 | 115,337 | ||||||||||||||
The Geo Group Incorporated | 3,880 | 56,803 | ||||||||||||||
The Macerich Company | 4,896 | 99,976 | ||||||||||||||
UDR Incorporated | 9,492 | 426,950 | ||||||||||||||
Uniti Group Incorporated | 5,782 | 56,432 | ||||||||||||||
Universal Health Realty Income Trust | 407 | 43,842 | ||||||||||||||
Urban Edge Properties | 3,858 | 62,500 | ||||||||||||||
Ventas Incorporated | 12,124 | 651,907 | ||||||||||||||
VICI Properties Incorporated | 15,412 | 386,225 | ||||||||||||||
Vornado Realty Trust | 5,776 | 309,478 | ||||||||||||||
Washington Prime Group Incorporated | 6,268 | 17,237 | ||||||||||||||
Washington REIT | 2,606 | 69,971 | ||||||||||||||
The accompanying notes are an integral part of these financial statements.
204 | Wells Fargo Funds
Table of Contents
Portfolio of investments—February 29, 2020
U.S. REIT PORTFOLIO
| Shares | Value | |||||||||||||||
| Equity REITs (continued) | ||||||||||||||||
Weingarten Realty Investors | 3,988 | $ | 107,397 | |||||||||||||
Welltower Incorporated | 13,131 | 982,461 | ||||||||||||||
Xenia Hotels & Resorts Incorporated | 3,724 | 55,711 | ||||||||||||||
Total Common Stocks (Cost $23,335,680) | 25,472,748 | |||||||||||||||
|
| |||||||||||||||
| Yield | ||||||||||||||||
| Short-Term Investments: 0.94% | ||||||||||||||||
| Investment Companies: 0.94% | ||||||||||||||||
Wells Fargo Government Money Market Fund Select Class (l)(u) | 1.52 | % | 239,974 | 239,974 | ||||||||||||
|
| |||||||||||||||
Total Short-Term Investments (Cost $239,974) | 239,974 | |||||||||||||||
|
| |||||||||||||||
| Total investments in securities (Cost $23,575,654) | 100.40 | % | 25,712,722 | |||||
Other assets and liabilities, net | (0.40 | ) | (102,101 | ) | ||||
|
|
|
| |||||
| Total net assets | 100.00 | % | $ | 25,610,621 | ||||
|
|
|
| |||||
| (l) | The issuer of the security is an affiliated person of the Portfolio as defined in the Investment Company Act of 1940. |
| (u) | The rate represents the7-day annualized yield at period end. |
Abbreviations:
| REIT | Real estate investment trust |
Investments in Affiliates
An affiliated investment is an investment in which the Portfolio owns at least 5% of the outstanding voting shares of the issuer or as a result of other relationships, such as the Portfolio and the issuer having the same adviser or investment manager. Transactions with issuers that were either affiliated persons of the Portfolio at the beginning of the period or the end of the period were as follows:
| Shares, beginning of period | Shares purchased | Shares sold | Shares, end of period | Net realized gains (losses) | Net change in unrealized gains (losses) | Income from affiliated securities | Value, end of period | % of net assets | ||||||||||||||||||||||||||||
| Short-Term Investments | ||||||||||||||||||||||||||||||||||||
Investment Companies | ||||||||||||||||||||||||||||||||||||
Wells Fargo Government Money Market Fund Select Class | 192,034 | 8,807,844 | (8,759,904 | ) | 239,974 | $ | 0 | $ | 0 | $ | 2,481 | $ | 239,974 | 0.94 | % | |||||||||||||||||||||
The accompanying notes are an integral part of these financial statements.
Wells Fargo Funds | 205
Table of Contents
Statements of assets and liabilities—February 29, 2020
| Bloomberg Barclays US Aggregate ex-Corporate Portfolio | Emerging Markets Bond Portfolio | |||||||
Assets | ||||||||
Investments in unaffiliated securities, at value (see cost below) | $ | 659,052,545 | $ | 41,612,004 | ||||
Investments in affiliated securities, at value (see cost below) | 11,379,432 | 922,295 | ||||||
Cash | 0 | 0 | ||||||
Segregated cash for futures contracts | 0 | 0 | ||||||
Foreign currency, at value (see cost below) | 0 | 0 | ||||||
Receivable for investments sold | 7,496,738 | 377,021 | ||||||
Receivable for dividends and interest | 2,917,158 | 593,235 | ||||||
Unrealized gains on forward foreign currency contracts | 0 | 0 | ||||||
Prepaid expenses and other assets | 4,614 | 0 | ||||||
|
| |||||||
Total assets | 680,850,487 | 43,504,555 | ||||||
|
| |||||||
Liabilities | ||||||||
Payable for investments purchased | 15,164,962 | 874,528 | ||||||
Payable for daily variation margin on open futures contracts | 0 | 0 | ||||||
Unrealized losses on forward foreign currency contracts | 0 | 0 | ||||||
Advisory fee payable | 68,947 | 3,078 | ||||||
Custody and accounting fees payable | 85,477 | 0 | ||||||
Professional fees payable | 75,627 | 46,701 | ||||||
Trustees’ fees and expenses payable | 2,785 | 2,785 | ||||||
Accrued expenses and other liabilities | 17,353 | 29,775 | ||||||
|
| |||||||
Total liabilities | 15,415,151 | 956,867 | ||||||
|
| |||||||
Total net assets | $ | 665,435,336 | $ | 42,547,688 | ||||
|
| |||||||
Investments in unaffiliated securities, at cost | $ | 625,037,382 | $ | 41,845,925 | ||||
|
| |||||||
Investments in affiliated securities, at cost | $ | 11,379,432 | $ | 922,295 | ||||
|
| |||||||
Foreign currency, at cost | $ | 0 | $ | 0 | ||||
|
| |||||||
The accompanying notes are an integral part of these financial statements.
206 | Wells Fargo Funds
Table of Contents
Statements of assets and liabilities—February 29, 2020
Factor Enhanced Markets Portfolio | Factor Enhanced International Portfolio | Factor Enhanced Large Cap Portfolio | Factor Enhanced Small Cap Portfolio | High Yield Corporate Bond Portfolio | International Government Bond Portfolio | Investment Bond Portfolio | ||||||||||||||||||||
| $ | 207,278,801 | $ | 555,558,672 | $ | 915,777,589 | $ | 220,801,896 | $ | 51,792,845 | $ | 11,118,180 | $ | 258,166,816 | |||||||||||||
| 6,720,374 | 24,301,039 | 37,548,710 | 6,867,519 | 1,339,300 | 51,894 | 289,733 | ||||||||||||||||||||
| 0 | 0 | 0 | 1,360 | 500 | 0 | 209,472 | ||||||||||||||||||||
| 1,778,000 | 3,474,000 | 6,508,000 | 1,880,000 | 0 | 0 | 0 | ||||||||||||||||||||
| 1,293,558 | 446,374 | 0 | 0 | 0 | 32,293 | 0 | ||||||||||||||||||||
| 192,618 | 0 | 0 | 0 | 0 | 9,555,093 | 1,742,232 | ||||||||||||||||||||
| 659,152 | 2,591,624 | 2,140,985 | 238,612 | 908,035 | 89,390 | 2,574,719 | ||||||||||||||||||||
| 0 | 0 | 0 | 0 | 0 | 21,275 | 0 | ||||||||||||||||||||
| 1,103 | 500,171 | 1,835 | 1,006 | 1,156 | 2,012 | 4,614 | ||||||||||||||||||||
|
| |||||||||||||||||||||||||
| 217,923,606 | 586,871,880 | 961,977,119 | 229,790,393 | 54,041,836 | 20,870,137 | 262,987,586 | ||||||||||||||||||||
|
| |||||||||||||||||||||||||
| 0 | 0 | 0 | 0 | 0 | 9,575,481 | 906,360 | ||||||||||||||||||||
| 34,560 | 216,000 | 84,389 | 59,651 | 0 | 0 | 0 | ||||||||||||||||||||
| 0 | 0 | 0 | 0 | 0 | 37,008 | 0 | ||||||||||||||||||||
| 3,042 | 280,330 | 277,920 | 19,405 | 4,409 | 2,286 | 58,983 | ||||||||||||||||||||
| 799,277 | 473,246 | 132,515 | 92,196 | 0 | 0 | 42,039 | ||||||||||||||||||||
| 49,234 | 54,233 | 48,423 | 48,335 | 41,915 | 30,921 | 51,394 | ||||||||||||||||||||
| 2,785 | 2,785 | 2,785 | 2,785 | 2,785 | 2,805 | 2,875 | ||||||||||||||||||||
| 13,349 | 0 | 1,478 | 776 | 3,695 | 7,361 | 10,078 | ||||||||||||||||||||
|
| |||||||||||||||||||||||||
| 902,247 | 1,026,594 | 547,510 | 223,148 | 52,804 | 9,655,862 | 1,071,729 | ||||||||||||||||||||
|
| |||||||||||||||||||||||||
| $ | 217,021,359 | $ | 585,845,286 | $ | 961,429,609 | $ | 229,567,245 | $ | 53,989,032 | $ | 11,214,275 | $ | 261,915,857 | |||||||||||||
|
| |||||||||||||||||||||||||
| $ | 216,449,068 | $ | 541,322,603 | $ | 775,088,430 | $ | 224,519,287 | $ | 53,467,065 | $ | 11,135,469 | $ | 232,013,517 | |||||||||||||
|
| |||||||||||||||||||||||||
| $ | 6,720,374 | $ | 24,301,039 | $ | 37,548,710 | $ | 6,867,519 | $ | 1,339,300 | $ | 51,894 | $ | 289,733 | |||||||||||||
|
| |||||||||||||||||||||||||
| $ | 1,312,403 | $ | 448,769 | $ | 0 | $ | 0 | $ | 0 | $ | 33,245 | $ | 0 | |||||||||||||
|
| |||||||||||||||||||||||||
The accompanying notes are an integral part of these financial statements.
Wells Fargo Funds | 207
Table of Contents
Statements of assets and liabilities—February 29, 2020
| Strategic Retirement Bond Portfolio | U.S. REIT Portfolio | |||||||
Assets | ||||||||
Investments in unaffiliated securities, at value (see cost below) | $ | 75,607,024 | $ | 25,472,748 | ||||
Investments in affiliated securities, at value (see cost below) | 281,311 | 239,974 | ||||||
Cash | 3,909 | 0 | ||||||
Receivable for investments sold | 594,926 | 109,967 | ||||||
Receivable for dividends and interest | 249,258 | 13,882 | ||||||
Receivable from adviser | 946 | 4,744 | ||||||
Prepaid expenses and other assets | 283 | 6,326 | ||||||
|
| |||||||
Total assets | 76,737,657 | 25,847,641 | ||||||
|
| |||||||
Liabilities | ||||||||
Payable for investments purchased | 755,586 | 201,444 | ||||||
Professional fees payable | 60,918 | 32,791 | ||||||
Trustees’ fees and expenses payable | 2,785 | 2,785 | ||||||
Accrued expenses and other liabilities | 15,032 | 0 | ||||||
|
| |||||||
Total liabilities | 834,321 | 237,020 | ||||||
|
| |||||||
Total net assets | $ | 75,903,336 | $ | 25,610,621 | ||||
|
| |||||||
Investments in unaffiliated securities, at cost | $ | 72,678,411 | $ | 23,335,680 | ||||
|
| |||||||
Investments in affiliated securities, at cost | $ | 281,311 | $ | 239,974 | ||||
|
| |||||||
The accompanying notes are an integral part of these financial statements.
208 | Wells Fargo Funds
Table of Contents
This page is intentionally left blank.
Table of Contents
Statements of operations—year ended February 29, 2020
| Bloomberg Barclays US Aggregate ex-Corporate Portfolio | Emerging Markets Bond Portfolio | |||||||
Investment income | ||||||||
Interest* | $ | 14,974,118 | $ | 2,311,383 | ||||
Income from affiliated securities | 185,121 | 7,448 | ||||||
Dividends** | 0 | 0 | ||||||
|
| |||||||
Total investment income | 15,159,239 | 2,318,831 | ||||||
|
| |||||||
Expenses | ||||||||
Advisory fee | 317,770 | 109,354 | ||||||
Custody and accounting fees | 58,871 | 18,665 | ||||||
Professional fees | 48,126 | 59,379 | ||||||
Shareholder report expenses | 8,410 | 7,470 | ||||||
Trustees’ fees and expenses | 20,459 | 20,459 | ||||||
Interest expense | 0 | 0 | ||||||
Other fees and expenses | 17,041 | 9,257 | ||||||
|
| |||||||
Total expenses | 470,677 | 224,584 | ||||||
Less: Fee waivers and/or expense reimbursements | (63,442 | ) | (71,097 | ) | ||||
|
| |||||||
Net expenses | 407,235 | 153,487 | ||||||
|
| |||||||
Net investment income (loss) | 14,752,004 | 2,165,344 | ||||||
|
| |||||||
Realized and unrealized gains (losses) on investments | ||||||||
Net realized gains (losses) on |
| |||||||
Unaffiliated securities | 2,813,519 | 332,518 | ||||||
Futures contracts | 0 | 0 | ||||||
Forward foreign currency contracts | 0 | 0 | ||||||
Foreign currency and foreign currency translations | 0 | 0 | ||||||
|
| |||||||
Net realized gain (losses) on investments | 2,813,519 | 332,518 | ||||||
|
| |||||||
Net change in unrealized gains (losses) on |
| |||||||
Unaffiliated securities | 44,821,599 | 1,113,039 | ||||||
Futures contracts | 0 | 0 | ||||||
Forward foreign currency contracts | 0 | 0 | ||||||
Foreign currency and foreign currency translations | 0 | 0 | ||||||
|
| |||||||
Net change in unrealized gains (losses) on investments | 44,821,599 | 1,113,039 | ||||||
|
| |||||||
Net realized and unrealized gains (losses) on investments | 47,635,118 | 1,445,557 | ||||||
|
| |||||||
Net increase (decrease) in net assets resulting from operations | $ | 62,387,122 | $ | 3,610,901 | ||||
|
| |||||||
* Net of foreign interest withholding taxes in the amount of | $0 | $0 | ||||||
**Net of foreign dividend withholding taxes in the amount of | $0 | $0 | ||||||
The accompanying notes are an integral part of these financial statements.
210 | Wells Fargo Funds
Table of Contents
Statements of operations—year ended February 29, 2020
| Factor Enhanced Emerging Markets Portfolio | Factor Enhanced International Portfolio | Factor Enhanced Large Cap Portfolio | Factor Enhanced Small Cap Portfolio | High Yield Corporate Bond Portfolio | International Government Bond Portfolio | Investment Portfolio | ||||||||||||||||||||
| $ | 28,271 | $ | 41,437 | $ | 103,537 | $ | 30,086 | $ | 3,700,426 | $ | 118,500 | $ | 9,593,913 | |||||||||||||
| 136,960 | 355,656 | 609,610 | 185,648 | 16,925 | 1,549 | 28,280 | ||||||||||||||||||||
| 7,060,245 | 18,469,276 | 24,512,813 | 3,898,641 | 0 | 0 | 0 | ||||||||||||||||||||
|
| |||||||||||||||||||||||||
| 7,225,476 | 18,866,369 | 25,225,960 | 4,114,375 | 3,717,351 | 120,049 | 9,622,193 | ||||||||||||||||||||
|
| |||||||||||||||||||||||||
| 374,704 | 1,020,540 | 1,142,672 | 406,113 | 159,659 | 27,898 | 131,568 | ||||||||||||||||||||
| 820,658 | 512,621 | 152,491 | 127,324 | 13,297 | 9,267 | 50,723 | ||||||||||||||||||||
| 48,126 | 48,992 | 48,992 | 48,904 | 59,449 | 41,504 | 48,904 | ||||||||||||||||||||
| 6,473 | 6,561 | 6,561 | 6,547 | 6,602 | 6,781 | 6,914 | ||||||||||||||||||||
| 20,459 | 20,459 | 20,459 | 20,459 | 20,459 | 20,459 | 20,459 | ||||||||||||||||||||
| 0 | 444 | 446 | 0 | 0 | 0 | 0 | ||||||||||||||||||||
| 30,523 | 37,783 | 22,110 | 11,079 | 9,432 | 14,742 | 10,773 | ||||||||||||||||||||
|
| |||||||||||||||||||||||||
| 1,300,943 | 1,647,400 | 1,393,731 | 620,426 | 268,898 | 120,651 | 269,341 | ||||||||||||||||||||
| (338,496 | ) | (344,955 | ) | (134,569 | ) | (143,147 | ) | (80,318 | ) | 0 | (82,500 | ) | ||||||||||||||
|
| |||||||||||||||||||||||||
| 962,447 | 1,302,445 | 1,259,162 | 477,279 | 188,580 | 120,651 | 186,841 | ||||||||||||||||||||
|
| |||||||||||||||||||||||||
| 6,263,029 | 17,563,924 | 23,966,798 | 3,637,096 | 3,528,771 | (602 | ) | 9,435,352 | |||||||||||||||||||
|
| |||||||||||||||||||||||||
| (7,793,947 | ) | (2,687,181 | ) | 74,131,610 | 6,498,647 | (1,300,689 | ) | 734,219 | 3,167,122 | |||||||||||||||||
| 548,183 | 2,665,842 | 6,928,889 | 953,390 | 0 | 0 | 0 | ||||||||||||||||||||
| 0 | 0 | 0 | 0 | 0 | (122,369 | ) | 0 | |||||||||||||||||||
| (466,622 | ) | 169,133 | 0 | 0 | 0 | 17,081 | 0 | |||||||||||||||||||
|
| |||||||||||||||||||||||||
| (7,712,386 | ) | 147,794 | 81,060,499 | 7,452,037 | (1,300,689 | ) | 628,931 | 3,167,122 | ||||||||||||||||||
|
| |||||||||||||||||||||||||
| (11,376,521 | ) | (257,219 | ) | (40,169,298 | ) | (22,865,885 | ) | 811,481 | (100,964 | ) | 25,957,585 | |||||||||||||||
| (319,709 | ) | (2,981,989 | ) | (5,672,190 | ) | (909,537 | ) | 0 | 0 | 0 | ||||||||||||||||
| 0 | 0 | 0 | 0 | 0 | 21,072 | 0 | ||||||||||||||||||||
| (17,996 | ) | (1,244 | ) | 0 | 0 | 0 | (2,952 | ) | 0 | |||||||||||||||||
|
| |||||||||||||||||||||||||
| (11,714,226 | ) | (3,240,452 | ) | (45,841,488 | ) | (23,775,422 | ) | 811,481 | (82,844 | ) | 25,957,585 | |||||||||||||||
|
| |||||||||||||||||||||||||
| (19,426,612 | ) | (3,092,658 | ) | 35,219,011 | (16,323,385 | ) | (489,208 | ) | 546,087 | 29,124,707 | ||||||||||||||||
|
| |||||||||||||||||||||||||
| $ | (13,163,583 | ) | $ | 14,471,266 | $ | 59,185,809 | $ | (12,686,289 | ) | $ | 3,039,563 | $ | 545,485 | $ | 38,560,059 | |||||||||||
|
| |||||||||||||||||||||||||
| $7 | $0 | $0 | $0 | $525 | $5,188 | $0 | ||||||||||||||||||||
| $1,043,312 | $3,155,001 | $80,835 | $985 | $0 | $0 | $0 | ||||||||||||||||||||
The accompanying notes are an integral part of these financial statements.
Wells Fargo Funds | 211
Table of Contents
Statements of operations—year ended February 29, 2020
| Strategic Retirement Bond Portfolio | U.S. REIT Portfolio | |||||||
Investment income | ||||||||
Interest | $ | 1,714,205 | $ | 0 | ||||
Income from affiliated securities | 4,694 | 2,481 | ||||||
Dividends | 0 | 968,157 | ||||||
|
| |||||||
Total investment income | 1,718,899 | 970,638 | ||||||
|
| |||||||
Expenses | ||||||||
Advisory fee | 36,167 | 33,182 | ||||||
Custody and accounting fees | 11,246 | 34,760 | ||||||
Professional fees | 48,904 | 40,698 | ||||||
Shareholder report expenses | 7,321 | 5,378 | ||||||
Trustees’ fees and expenses | 20,459 | 20,459 | ||||||
Other fees and expenses | 8,203 | 8,193 | ||||||
|
| |||||||
Total expenses | 132,300 | 142,670 | ||||||
Less: Fee waivers and/or expense reimbursements | (53,701 | ) | (80,516 | ) | ||||
|
| |||||||
Net expenses | 78,599 | 62,154 | ||||||
|
| |||||||
Net investment income | 1,640,300 | 908,484 | ||||||
|
| |||||||
Realized and unrealized gains (losses) on investments | ||||||||
Net realized gains on investments | 168,387 | 3,095,201 | ||||||
Net change in unrealized gains (losses) on investments | 3,638,073 | (2,169,132 | ) | |||||
|
| |||||||
Net realized and unrealized gains (losses) on investments | 3,806,460 | 926,069 | ||||||
|
| |||||||
Net increase in net assets resulting from operations | $ | 5,446,760 | $ | 1,834,553 | ||||
|
| |||||||
The accompanying notes are an integral part of these financial statements.
212 | Wells Fargo Funds
Table of Contents
Statements of changes in net assets
| Bloomberg Barclays US Aggregate ex-Corporate Portfolio | ||||||||
| Year ended February 29, 2020 | Year ended February 28, 2019 | |||||||
Operations |
| |||||||
Net investment income | $ | 14,752,004 | $ | 19,677,785 | ||||
Net realized gains (losses) on investments | 2,813,519 | (11,621,062 | ) | |||||
Net change in unrealized gains (losses) on investments | 44,821,599 | 15,499,429 | ||||||
|
| |||||||
Net increase in net assets resulting from operations | 62,387,122 | 23,556,152 | ||||||
|
| |||||||
Capital transactions | ||||||||
Transactions in investors’ beneficial interests | ||||||||
Contributions | 135,893,333 | 133,856,823 | ||||||
Withdrawals | (144,584,522 | ) | (572,102,499 | ) | ||||
|
| |||||||
Net decrease in net assets resulting from capital transactions | (8,691,189 | ) | (438,245,676 | ) | ||||
|
| |||||||
Total increase (decrease) in net assets | 53,695,933 | (414,689,524 | ) | |||||
|
| |||||||
Net assets | ||||||||
Beginning of period | 611,739,403 | 1,026,428,927 | ||||||
|
| |||||||
End of period | $ | 665,435,336 | $ | 611,739,403 | ||||
|
| |||||||
The accompanying notes are an integral part of these financial statements.
Wells Fargo Funds | 213
Table of Contents
Statements of changes in net assets
| Emerging Markets Bond Portfolio | ||||||||
| Year ended February 29, 2020 | Year ended February 28, 2019 | |||||||
Operations |
| |||||||
Net investment income | $ | 2,165,344 | $ | 2,825,982 | ||||
Net realized gains (losses) on investments | 332,518 | (2,373,659 | ) | |||||
Net change in unrealized gains (losses) on investments | 1,113,039 | 226,207 | ||||||
|
| |||||||
Net increase in net assets resulting from operations | 3,610,901 | 678,530 | ||||||
|
| |||||||
Capital transactions | ||||||||
Transactions in investors’ beneficial interests | ||||||||
Contributions | 5,447,656 | 15,122,153 | ||||||
Withdrawals | (10,607,041 | ) | (46,658,191 | ) | ||||
|
| |||||||
Net decrease in net assets resulting from capital transactions | (5,159,385 | ) | (31,536,038 | ) | ||||
|
| |||||||
Total decrease in net assets | (1,548,484 | ) | (30,857,508 | ) | ||||
|
| |||||||
Net assets | ||||||||
Beginning of period | 44,096,172 | 74,953,680 | ||||||
|
| |||||||
End of period | $ | 42,547,688 | $ | 44,096,172 | ||||
|
| |||||||
The accompanying notes are an integral part of these financial statements.
214 | Wells Fargo Funds
Table of Contents
Statements of changes in net assets
| Factor Enhanced Emerging Markets Portfolio | ||||||||
| Year ended February 29, 2020 | Year ended February 28, 2019 | |||||||
Operations |
| |||||||
Net investment income | $ | 6,263,029 | $ | 7,123,928 | ||||
Net realized losses on investments | (7,712,386 | ) | (27,844,608 | ) | ||||
Net change in unrealized gains (losses) on investments | (11,714,226 | ) | (17,615,861 | ) | ||||
|
| |||||||
Net decrease in net assets resulting from operations | (13,163,583 | ) | (38,336,541 | ) | ||||
|
| |||||||
Capital transactions | ||||||||
Transactions in investors’ beneficial interests | ||||||||
Contributions | 33,085,504 | 94,308,309 | ||||||
Withdrawals | (59,525,153 | ) | (162,925,681 | ) | ||||
|
| |||||||
Net decrease in net assets resulting from capital transactions | (26,439,649 | ) | (68,617,372 | ) | ||||
|
| |||||||
Total decrease in net assets | (39,603,232 | ) | (106,953,913 | ) | ||||
|
| |||||||
Net assets | ||||||||
Beginning of period | 256,624,591 | 363,578,504 | ||||||
|
| |||||||
End of period | $ | 217,021,359 | $ | 256,624,591 | ||||
|
| |||||||
The accompanying notes are an integral part of these financial statements.
Wells Fargo Funds | 215
Table of Contents
Statements of changes in net assets
| Factor Enhanced International Portfolio | ||||||||
| Year ended February 29, 2020 | Year ended February 28, 2019 | |||||||
Operations |
| |||||||
Net investment income | $ | 17,563,924 | $ | 28,525,291 | ||||
Net realized gains (losses) on investments | 147,794 | (28,540,454 | ) | |||||
Net change in unrealized gains (losses) on investments | (3,240,452 | ) | (33,623,117 | ) | ||||
|
| |||||||
Net increase (decrease) in net assets resulting from operations | 14,471,266 | (33,638,280 | ) | |||||
|
| |||||||
Capital transactions | ||||||||
Transactions in investors’ beneficial interests | ||||||||
Contributions | 33,306,923 | 104,744,531 | ||||||
Withdrawals | (159,917,517 | ) | (510,735,440 | ) | ||||
|
| |||||||
Net decrease in net assets resulting from capital transactions | (126,610,594 | ) | (405,990,909 | ) | ||||
|
| |||||||
Total decrease in net assets | (112,139,328 | ) | (439,629,189 | ) | ||||
|
| |||||||
Net assets | ||||||||
Beginning of period | 697,984,614 | 1,137,613,803 | ||||||
|
| |||||||
End of period | $ | 585,845,286 | $ | 697,984,614 | ||||
|
| |||||||
The accompanying notes are an integral part of these financial statements.
216 | Wells Fargo Funds
Table of Contents
Statements of changes in net assets
| Factor Enhanced Large Cap Portfolio | ||||||||
| Year ended February 29, 2020 | Year ended February 28, 2019 | |||||||
Operations |
| |||||||
Net investment income | $ | 23,966,798 | $ | 33,328,397 | ||||
Net realized gains on investments | 81,060,499 | 121,046,659 | ||||||
Net change in unrealized gains (losses) on investments | (45,841,488 | ) | (51,351,040 | ) | ||||
|
| |||||||
Net increase in net assets resulting from operations | 59,185,809 | 103,024,016 | ||||||
|
| |||||||
Capital transactions | ||||||||
Transactions in investors’ beneficial interests | ||||||||
Contributions | 30,265,251 | 148,666,933 | ||||||
Withdrawals | (301,569,041 | ) | (987,981,319 | ) | ||||
|
| |||||||
Net decrease in net assets resulting from capital transactions | (271,303,790 | ) | (839,314,386 | ) | ||||
|
| |||||||
Total decrease in net assets | (212,117,981 | ) | (736,290,370 | ) | ||||
|
| |||||||
Net assets | ||||||||
Beginning of period | 1,173,547,590 | 1,909,837,960 | ||||||
|
| |||||||
End of period | $ | 961,429,609 | $ | 1,173,547,590 | ||||
|
| |||||||
The accompanying notes are an integral part of these financial statements.
Wells Fargo Funds | 217
Table of Contents
Statements of changes in net assets
| Factor Enhanced Small Cap Portfolio | ||||||||
| Year ended February 29, 2020 | Year ended February 28, 2019 | |||||||
Operations |
| |||||||
Net investment income | $ | 3,637,096 | $ | 4,775,578 | ||||
Net realized gains on investments | 7,452,037 | 32,272,918 | ||||||
Net change in unrealized gains (losses) on investments | (23,775,422 | ) | (6,095,947 | ) | ||||
|
| |||||||
Net increase (decrease) in net assets resulting from operations | (12,686,289 | ) | 30,952,549 | |||||
|
| |||||||
Capital transactions | ||||||||
Transactions in investors’ beneficial interests | ||||||||
Contributions | 31,716,956 | 64,244,206 | ||||||
Withdrawals | (67,498,202 | ) | (273,672,529 | ) | ||||
|
| |||||||
Net decrease in net assets resulting from capital transactions | (35,781,246 | ) | (209,428,323 | ) | ||||
|
| |||||||
Total decrease in net assets | (48,467,535 | ) | (178,475,774 | ) | ||||
|
| |||||||
Net assets | ||||||||
Beginning of period | 278,034,780 | 456,510,554 | ||||||
|
| |||||||
End of period | $ | 229,567,245 | $ | 278,034,780 | ||||
|
| |||||||
The accompanying notes are an integral part of these financial statements.
218 | Wells Fargo Funds
Table of Contents
Statements of changes in net assets
| High Yield Corporate Bond Portfolio | ||||||||
| Year ended February 29, 2020 | Year ended February 28, 2019 | |||||||
Operations |
| |||||||
Net investment income | $ | 3,528,771 | $ | 6,558,657 | ||||
Net realized losses on investments | (1,300,689 | ) | (3,427,913 | ) | ||||
Net change in unrealized gains (losses) on investments | 811,481 | 55,211 | ||||||
|
| |||||||
Net increase in net assets resulting from operations | 3,039,563 | 3,185,955 | ||||||
|
| |||||||
Capital transactions | ||||||||
Transactions in investors’ beneficial interests | ||||||||
Contributions | 8,823,305 | 14,575,719 | ||||||
Withdrawals | (45,182,920 | ) | (60,910,365 | ) | ||||
|
| |||||||
Net decrease in net assets resulting from capital transactions | (36,359,615 | ) | (46,334,646 | ) | ||||
|
| |||||||
Total decrease in net assets | (33,320,052 | ) | (43,148,691 | ) | ||||
|
| |||||||
Net assets | ||||||||
Beginning of period | 87,309,084 | 130,457,775 | ||||||
|
| |||||||
End of period | $ | 53,989,032 | $ | 87,309,084 | ||||
|
| |||||||
The accompanying notes are an integral part of these financial statements.
Wells Fargo Funds | 219
Table of Contents
Statements of changes in net assets
| International Government Bond Portfolio | ||||||||
| Year ended February 29, 2020 | Year ended February 28, 2019 | |||||||
Operations |
| |||||||
Net investment income (loss) | $ | (602 | ) | $ | 29,137 | |||
Net realized gains (losses) on investments | 628,931 | (428,746 | ) | |||||
Net change in unrealized gains (losses) on investments | (82,844 | ) | (76,796 | ) | ||||
|
| |||||||
Net increase (decrease) in net assets resulting from operations | 545,485 | (476,405 | ) | |||||
|
| |||||||
Capital transactions | ||||||||
Transactions in investors’ beneficial interests | ||||||||
Contributions | 443 | 1,004,217 | ||||||
Withdrawals | (50,294 | ) | (5,171 | ) | ||||
|
| |||||||
Net increase (decrease) in net assets resulting from capital transactions | (49,851 | ) | 999,046 | |||||
|
| |||||||
Total increase in net assets | 495,634 | 522,641 | ||||||
|
| |||||||
Net assets | ||||||||
Beginning of period | 10,718,641 | 10,196,000 | ||||||
|
| |||||||
End of period | $ | 11,214,275 | $ | 10,718,641 | ||||
|
| |||||||
The accompanying notes are an integral part of these financial statements.
220 | Wells Fargo Funds
Table of Contents
Statements of changes in net assets
| Investment Grade Corporate Bond Portfolio | ||||||||
| Year ended February 29, 2020 | Year ended February 28, 2019 | |||||||
Operations |
| |||||||
Net investment income | $ | 9,435,352 | $ | 13,756,980 | ||||
Net realized gains (losses) on investments | 3,167,122 | (4,249,388 | ) | |||||
Net change in unrealized gains (losses) on investments | 25,957,585 | (4,066,644 | ) | |||||
|
| |||||||
Net increase in net assets resulting from operations | 38,560,059 | 5,440,948 | ||||||
|
| |||||||
Capital transactions | ||||||||
Transactions in investors’ beneficial interests | ||||||||
Contributions | 29,912,651 | 66,284,750 | ||||||
Withdrawals | (70,686,869 | ) | (269,591,983 | ) | ||||
|
| |||||||
Net decrease in net assets resulting from capital transactions | (40,774,218 | ) | (203,307,233 | ) | ||||
|
| |||||||
Total decrease in net assets | (2,214,159 | ) | (197,866,285 | ) | ||||
|
| |||||||
Net assets | ||||||||
Beginning of period | 264,130,016 | 461,996,301 | ||||||
|
| |||||||
End of period | $ | 261,915,857 | $ | 264,130,016 | ||||
|
| |||||||
The accompanying notes are an integral part of these financial statements.
Wells Fargo Funds | 221
Table of Contents
Statements of changes in net assets
| Strategic Retirement Bond Portfolio | ||||||||
| Year ended February 29, 2020 | Year ended February 28, 2019 | |||||||
Operations |
| |||||||
Net investment income | $ | 1,640,300 | $ | 2,226,980 | ||||
Net realized gains (losses) on investments | 168,387 | (1,315,845 | ) | |||||
Net change in unrealized gains (losses) on investments | 3,638,073 | 1,248,713 | ||||||
|
| |||||||
Net increase in net assets resulting from operations | 5,446,760 | 2,159,848 | ||||||
|
| |||||||
Capital transactions | ||||||||
Transactions in investors’ beneficial interests | ||||||||
Contributions | 11,312,659 | 19,159,799 | ||||||
Withdrawals | (13,995,099 | ) | (74,404,978 | ) | ||||
|
| |||||||
Net decrease in net assets resulting from capital transactions | (2,682,440 | ) | (55,245,179 | ) | ||||
|
| |||||||
Total increase (decrease) in net assets | 2,764,320 | (53,085,331 | ) | |||||
|
| |||||||
Net assets | ||||||||
Beginning of period | 73,139,016 | 126,224,347 | ||||||
|
| |||||||
End of period | $ | 75,903,336 | $ | 73,139,016 | ||||
|
| |||||||
The accompanying notes are an integral part of these financial statements.
222 | Wells Fargo Funds
Table of Contents
Statements of changes in net assets
| U.S. REIT Portfolio | ||||||||
| Year ended February 29, 2020 | Year ended February 28, 2019 | |||||||
Operations |
| |||||||
Net investment income | $ | 908,484 | $ | 1,656,997 | ||||
Net realized gains on investments | 3,095,201 | 1,717,011 | ||||||
Net change in unrealized gains (losses) on investments | (2,169,132 | ) | 7,122,923 | |||||
|
| |||||||
Net increase in net assets resulting from operations | 1,834,553 | 10,496,931 | ||||||
|
| |||||||
Capital transactions | ||||||||
Transactions in investors’ beneficial interests | ||||||||
Contributions | 5,390,330 | 9,516,600 | ||||||
Withdrawals | (25,181,044 | ) | (42,660,330 | ) | ||||
|
| |||||||
Net decrease in net assets resulting from capital transactions | (19,790,714 | ) | (33,143,730 | ) | ||||
|
| |||||||
Total decrease in net assets | (17,956,161 | ) | (22,646,799 | ) | ||||
|
| |||||||
Net assets | ||||||||
Beginning of period | 43,566,782 | 66,213,581 | ||||||
|
| |||||||
End of period | $ | 25,610,621 | $ | 43,566,782 | ||||
|
| |||||||
The accompanying notes are an integral part of these financial statements.
Wells Fargo Funds | 223
Table of Contents
| Ratio to average net assets (annualized) | Total | Portfolio turnover | ||||||||||||||||||
| Net investment income | Gross expenses | Net expenses | ||||||||||||||||||
Bloomberg Barclays US Aggregateex-Corporate Portfolio | ||||||||||||||||||||
Year ended February 29, 2020 | 2.32 | % | 0.07 | % | 0.06 | % | 10.34 | % | 46 | % | ||||||||||
Year ended February 28, 2019 | 2.38 | % | 0.08 | % | 0.07 | % | 3.23 | % | 72 | % | ||||||||||
Year ended February 28, 20182 | 2.03 | % | 0.08 | % | 0.07 | % | (1.39 | )% | 221 | % | ||||||||||
Emerging Markets Bond Portfolio | ||||||||||||||||||||
Year ended February 29, 2020 | 4.95 | % | 0.51 | % | 0.35 | % | 8.59 | % | 36 | % | ||||||||||
Year ended February 28, 2019 | 4.70 | % | 0.44 | % | 0.40 | % | 2.84 | % | 38 | % | ||||||||||
Year ended February 28, 20182 | 4.19 | % | 0.44 | % | 0.43 | % | 0.62 | % | 174 | % | ||||||||||
Factor Enhanced Emerging Markets Portfolio | ||||||||||||||||||||
Year ended February 29, 2020 | 2.51 | % | 0.52 | % | 0.39 | % | (6.15 | )% | 59 | % | ||||||||||
Year ended February 28, 2019 | 2.33 | % | 0.58 | % | 0.45 | % | (11.16 | )% | 81 | % | ||||||||||
Year ended February 28, 20182 | 1.56 | % | 0.49 | % | 0.49 | % | 13.43 | % | 136 | % | ||||||||||
Factor Enhanced International Portfolio | ||||||||||||||||||||
Year ended February 29, 2020 | 2.58 | % | 0.24 | % | 0.19 | % | 1.23 | % | 44 | % | ||||||||||
Year ended February 28, 2019 | 3.03 | % | 0.23 | % | 0.20 | % | (2.91 | )% | 47 | % | ||||||||||
Year ended February 28, 20182 | 1.74 | % | 0.21 | % | 0.21 | % | 8.99 | % | 106 | % | ||||||||||
Factor Enhanced Large Cap Portfolio | ||||||||||||||||||||
Year ended February 29, 2020 | 2.10 | % | 0.12 | % | 0.11 | % | 4.00 | % | 25 | % | ||||||||||
Year ended February 28, 2019 | 2.09 | % | 0.12 | % | 0.11 | % | 7.60 | % | 23 | % | ||||||||||
Year ended February 28, 20182 | 1.94 | % | 0.12 | % | 0.12 | % | 11.92 | % | 75 | % | ||||||||||
Factor Enhanced Small Cap Portfolio | ||||||||||||||||||||
Year ended February 29, 2020 | 1.35 | % | 0.23 | % | 0.18 | % | (5.94 | )% | 40 | % | ||||||||||
Year ended February 28, 2019 | 1.29 | % | 0.21 | % | 0.19 | % | 7.05 | % | 37 | % | ||||||||||
Year ended February 28, 20182 | 1.23 | % | 0.19 | % | 0.19 | % | 8.75 | % | 85 | % | ||||||||||
High Yield Corporate Bond Portfolio | ||||||||||||||||||||
Year ended February 29, 2020 | 5.54 | % | 0.42 | % | 0.30 | % | 3.97 | % | 52 | % | ||||||||||
Year ended February 28, 2019 | 6.06 | % | 0.34 | % | 0.32 | % | 3.70 | % | 47 | % | ||||||||||
Year ended February 28, 20182 | 5.36 | % | 0.37 | % | 0.37 | % | 0.49 | % | 122 | % | ||||||||||
International Government Bond Portfolio | ||||||||||||||||||||
Year ended February 29, 2020 | (0.01 | )% | 1.08 | % | 1.08 | % | 5.07 | % | 291 | % | ||||||||||
Year ended February 28, 2019 | 0.28 | % | 1.10 | % | 1.10 | % | (4.67 | )% | 276 | % | ||||||||||
Year ended February 28, 20183 | (0.18 | )% | 1.69 | % | 1.69 | % | 1.95 | % | 224 | % | ||||||||||
Investment Grade Corporate Bond Portfolio | ||||||||||||||||||||
Year ended February 29, 2020 | 3.59 | % | 0.10 | % | 0.07 | % | 15.72 | % | 18 | % | ||||||||||
Year ended February 28, 2019 | 3.74 | % | 0.09 | % | 0.08 | % | 2.29 | % | 25 | % | ||||||||||
Year ended February 28, 20182 | 3.48 | % | 0.08 | % | 0.08 | % | (0.12 | )% | 61 | % | ||||||||||
Strategic Retirement Bond Portfolio | ||||||||||||||||||||
Year ended February 29, 2020 | 2.27 | % | 0.18 | % | 0.11 | % | 7.75 | % | 41 | % | ||||||||||
Year ended February 28, 2019 | 2.23 | % | 0.16 | % | 0.14 | % | 2.47 | % | 23 | % | ||||||||||
Year ended February 28, 20182 | 1.45 | % | 0.17 | % | 0.17 | % | (1.40 | )% | 193 | % | ||||||||||
U.S. REIT Portfolio | ||||||||||||||||||||
Year ended February 29, 2020 | 2.73 | % | 0.43 | % | 0.19 | % | 2.65 | % | 26 | % | ||||||||||
Year ended February 28, 2019 | 2.91 | % | 0.26 | % | 0.23 | % | 19.52 | % | 20 | % | ||||||||||
Year ended February 28, 20182 | 2.53 | % | 0.33 | % | 0.32 | % | (8.74 | )% | 51 | % | ||||||||||
| 1 | Returns for periods of less than one year are not annualized. |
| 2 | For the period from May 23, 2017 (commencement of operations) to February 28, 2018 |
| 3 | For the period from August 16, 2017 (commencement of operations) to February 28, 2018 |
The accompanying notes are an integral part of these financial statements.
224 | Wells Fargo Funds
Table of Contents
1. ORGANIZATION
Wells Fargo Master Trust (the “Trust”), a Delaware statutory trust organized on March 10, 1999, is anopen-end management investment company registered under the Investment Company Act of 1940, as amended (the “1940 Act”). As an investment company, the Trust follows the accounting and reporting guidance in Financial Accounting Standards Board (“FASB”)Accounting Standards Codification Topic 946, Financial Services – Investment Companies. These financial statements report on the following portfolios: Wells Fargo Bloomberg Barclays US Aggregateex-Corporate Portfolio (“Bloomberg Barclays US Aggregateex-Corporate Portfolio”), Wells Fargo Emerging Markets Bond Portfolio (“Emerging Markets Bond Portfolio”), Wells Fargo Factor Enhanced Emerging Markets Portfolio (“Factor Enhanced Emerging Markets Portfolio”), Wells Fargo Factor Enhanced International Portfolio (“Factor Enhanced International Portfolio”), Wells Fargo Factor Enhanced Large Cap Portfolio (“Factor Enhanced Large Cap Portfolio”), Wells Fargo Factor Enhanced Small Cap Portfolio (“Factor Enhanced Small Cap Portfolio”), Wells Fargo High Yield Corporate Bond Portfolio (“High Yield Corporate Bond Portfolio”), Wells Fargo International Government Bond Portfolio (“International Government Bond Portfolio”), Wells Fargo Investment Grade Corporate Bond Portfolio (“Investment Grade Corporate Bond Portfolio”), Wells Fargo Strategic Retirement Bond Portfolio (“Strategic Retirement Bond Portfolio”) and Wells Fargo U.S. REIT Portfolio (“U.S. REIT Portfolio”) (each, a “Portfolio”, collectively, the “Porfolios”). Each Portfolio is a diversified series of the Trust and is structured as a partnership for federal income tax purposes.
The Portfolios offer their shares only to other affiliated Wells Fargo Funds and not directly to the public.
2. SIGNIFICANT ACCOUNTING POLICIES
The following significant accounting policies, which are consistently followed in the preparation of the financial statements of each Portfolio, are in conformity with U.S. generally accepted accounting principles which require management to make estimates and assumptions that affect the reported amounts of assets and liabilities, disclosure of contingent assets and liabilities at the date of the financial statements, and the reported amounts of revenues and expenses during the reporting period. Actual results could differ from those estimates.
Securities valuation
All investments are valued each business day as of the close of regular trading on the New York Stock Exchange (generally 4 p.m. Eastern Time), although the Portfolios may deviate from this calculation time under unusual or unexpected circumstances.
Debt securities are valued at the evaluated bid price provided by an independent pricing service (e.g. taking into account various factors, including yields, maturities, or credit ratings) or, if a reliable price is not available, the quoted bid price from an independent broker-dealer.
Equity securities and futures contracts that are listed on a foreign or domestic exchange or market are valued at the official closing price or, if none, the last sales price. If no sale occurs on the principal exchange or market that day, a fair value price will be determined in accordance with the Portfolios’ Valuation Procedures.
Forward foreign currency contracts are recorded at the forward rate provided by an independent foreign currency pricing source at a time each business day specified by the Wells Fargo Asset Management Pricing Committee at Wells Fargo Funds Management, LLC (“Funds Management”).
The values of securities denominated in foreign currencies are translated into U.S. dollars at rates provided by an independent foreign currency pricing source at a time each business day specified by the Wells Fargo Asset Management Pricing Committee.
Many securities markets and exchanges outside the U.S. close prior to the close of the New York Stock Exchange and therefore may not fully reflect trading or events that occur after the close of the principal exchange in which the foreign securities are traded, but before the close of the New York Stock Exchange. If such trading or events are expected to materially affect the value of such securities, then fair value pricing procedures approved by the Board of Trustees of the Portfolios are applied. These procedures take into account multiple factors including movements in U.S. securities markets after foreign exchanges close. Foreign securities that are fair valued under these procedures are categorized as Level 2 and the application of these procedures may result in transfers between Level 1 and Level 2. Depending on market activity, such fair valuations may be frequent. Such fair value pricing may result in net asset values that are higher or lower than net asset values based on the last reported sales price or latest quoted bid price. On February 29, 2020, such fair value pricing was used in pricing certain foreign securities in Factor Enhanced Emerging Markets Portfolio and Factor Enhanced International Portfolio.
Investments in registeredopen-end investment companies are valued at net asset value.
Investments which are not valued using the methods discussed above are valued at their fair value, as determined in good faith by the Board of Trustees. The Board of Trustees has established a Valuation Committee comprised of the Trustees and has
Wells Fargo Funds | 225
Table of Contents
Notes to financial statements
delegated to it the authority to take any actions regarding the valuation of portfolio securities that the Valuation Committee deems necessary or appropriate, including determining the fair value of portfolio securities, unless the determination has been delegated to the Wells Fargo Asset Management Pricing Committee. The Board of Trustees retains the authority to make or ratify any valuation decisions or approve any changes to the Valuation Procedures as it deems appropriate. On a quarterly basis, the Board of Trustees receives reports on any valuation actions taken by the Valuation Committee or the Wells Fargo Asset Management Pricing Committee which may include items for ratification.
Foreign currency translation
The accounting records of each Portfolio are maintained in U.S. dollars. The values of other assets and liabilities denominated in foreign currencies are translated into U.S. dollars at rates provided by an independent foreign currency pricing source at a time each business day specified by the Wells Fargo Asset Management Pricing Committee. Purchases and sales of securities, and income and expenses are converted at the rate of exchange on the respective dates of such transactions. Net realized foreign exchange gains or losses arise from sales of foreign currencies, currency gains or losses realized between the trade and settlement dates on securities transactions, and the difference between the amounts of dividends, interest and foreign withholding taxes recorded and the U.S. dollar equivalent of the amounts actually paid or received. Net unrealized foreign exchange gains and losses arise from changes in the fair value of assets and liabilities other than investments in securities resulting from changes in exchange rates. The changes in net assets arising from changes in exchange rates of securities and the changes in net assets resulting from changes in market prices of securities are not separately presented. Such changes are included in net realized and unrealized gains or losses from investments.
Forward foreign currency contracts
A forward foreign currency contract is an agreement between two parties to purchase or sell a specific currency for an agreed upon price at a future date. The Portfolio enters into forward foreign currency contracts to facilitate transactions in foreign denominated securities and to attempt to minimize the risk to the Portfolio from adverse changes in the relationship between currencies. Forward foreign currency contracts are recorded at the forward rate andmarked-to-market daily. When the contracts are closed, realized gains and losses arising from such transactions are recorded as realized gains or losses on forward foreign currency contracts. The Portfolio is subject to foreign currency risk and may be exposed to risks if the counterparties to the contracts are unable to meet the terms of their contracts or if the value of the foreign currency changes unfavorably. The Portfolio’s maximum risk of loss from counterparty credit risk is the unrealized gains on the contracts. This risk may be mitigated if there is a master netting arrangement between the Portfolio and the counterparty.
When-issued transactions
Each Portfolio may purchase securities on a forward commitment or when-issued basis. A Portfolio records a when-issued transaction on the trade date and will segregate assets in an amount at least equal in value to the Portfolio’s commitment to purchase when-issued securities. Securities purchased on a when-issued basis aremarked-to-market daily and the Portfolio begins earning interest on the settlement date. Losses may arise due to changes in the market value of the underlying securities or if the counterparty does not perform under the contract.
Futures contracts
Futures contracts are agreements between each Portfolio and a counterparty to buy or sell a specific amount of a commodity, financial instrument or currency at a specified price and on a specified date. A Portfolio may buy and sell futures contracts in order to gain exposure to, or protect against, changes in security values and foreign exchange rates and is subject to equity price risk and foreign currency risk. The primary risks associated with the use of futures contracts are the imperfect correlation between changes in market values of securities held by the Portfolio and the prices of futures contracts, and the possibility of an illiquid market. Futures contracts are generally entered into on a regulated futures exchange and cleared through a clearinghouse associated with the exchange. With futures contracts, there is minimal counterparty risk to the Portfolio since futures contracts are exchange traded and the exchange’s clearinghouse, as the counterparty to all exchange traded futures, guarantees the futures contracts against default.
Upon entering into a futures contracts, the Portfolio is required to deposit either cash or securities (initial margin) with the broker in an amount equal to a certain percentage of the contract value. Subsequent payments (variation margin) are paid to or from the broker each day equal to the daily changes in the contract value. Such payments are recorded as unrealized gains or losses and, if any, shown as variation margin receivable (payable) in the Statements of Assets and Liabilities. Should the Portfolio fail to make requested variation margin payments, the broker can gain access to the initial margin to satisfy the Portfolio’s payment obligations. When the contracts are closed, a realized gain or loss is recorded in the Statements of Operations.
Security transactions and income recognition
Securities transactions are recorded on a trade date basis. Realized gains or losses are recorded on the basis of identified cost.
226 | Wells Fargo Funds
Table of Contents
Notes to financial statements
Interest income is accrued daily and bond discounts are accreted and premiums are amortized daily. To the extent debt obligations are placed onnon-accrual status, any related interest income may be reduced by writing off interest receivables when the collection of all or a portion of interest has been determined to be doubtful based on consistently applied procedures and the fair value has decreased. If the issuer subsequently resumes interest payments or when the collectability of interest is reasonably assured, the debt obligation is removed fromnon-accrual status.
Dividend income is recognized on theex-dividend date, except for certain dividends from foreign securities which are recorded as soon as the custodian verifies theex-dividend date.
Income from foreign securities is recorded net of foreign taxes withheld where recovery of such taxes is not assured.
Federal and other taxes
Each Portfolio is treated as a separate entity for federal income tax purposes. Each Portfolio is not required to pay federal income taxes on its net investment income and net capital gain as it is treated as a partnership for federal income tax purposes. All interest, dividends, gains and losses of the Portfolio are deemed to have been “passed through” to the interest holders in proportion to their holdings of the Portfolio regardless of whether such interest, dividends and gains have been distributed by the Portfolio.
Each Portfolio’s income and federal excise tax returns and all financial records supporting those returns for the fiscal years since commencement of operations are subject to examination by the federal and Delaware revenue authorities. Management has analyzed each Portfolio’s tax positions taken on federal, state, and foreign tax returns for all open tax years and does not believe that there are any uncertain tax positions that require recognition of a tax liability.
As of February 29, 2020, the aggregate cost of all investments for federal income tax purposes and the unrealized gains (losses) were as follows:
| Tax cost | Gross unrealized gains | Gross unrealized losses | Net unrealized gains (losses) | |||||||||||||
Bloomberg Barclays US Aggregateex-Corporate Portfolio | $ | 636,140,690 | $ | 34,297,165 | $ | (5,878 | ) | $ | 34,291,287 | |||||||
Emerging Markets Bond Portfolio | 42,801,112 | 0 | (266,813 | ) | (266,813 | ) | ||||||||||
Factor Enhanced Emerging Markets Portfolio | 233,370,365 | 0 | (19,854,450 | ) | (19,854,450 | ) | ||||||||||
Factor Enhanced International Portfolio | 570,115,437 | 13,210,421 | (6,412,421 | ) | 6,798,000 | |||||||||||
Factor Enhanced Large Cap Portfolio | 813,855,259 | 140,565,361 | (6,901,724 | ) | 133,663,637 | |||||||||||
Factor Enhanced Small Cap Portfolio | 235,813,258 | 0 | (9,174,094 | ) | (9,174,094 | ) | ||||||||||
High Yield Corporate Bond Portfolio | 54,863,675 | 0 | (1,731,530 | ) | (1,731,530 | ) | ||||||||||
International Government Bond Portfolio | 11,200,368 | 0 | (46,027 | ) | (46,027 | ) | ||||||||||
Investment Grade Corporate Bond Portfolio | 232,908,836 | 26,153,299 | (605,586 | ) | 25,547,713 | |||||||||||
Strategic Retirement Bond Portfolio | 72,987,105 | 2,932,479 | (31,249 | ) | 2,901,230 | |||||||||||
U.S. REIT Portfolio | 24,500,429 | 2,124,771 | (912,478 | ) | 1,212,293 | |||||||||||
3. FAIR VALUATION MEASUREMENTS
Fair value measurements of investments are determined within a framework that has established a fair value hierarchy based upon the various data inputs utilized in determining the value of each Portfolio’s investments. The three-level hierarchy gives the highest priority to unadjusted quoted prices in active markets for identical assets or liabilities (Level 1) and the lowest priority to unobservable inputs (Level 3). Each Portfolio’s investments are classified within the fair value hierarchy based on the lowest level of input that is significant to the fair value measurement. The inputs are summarized into three broad levels as follows:
| ∎ | Level 1 – quoted prices in active markets for identical securities |
| ∎ | Level 2 – other significant observable inputs (including quoted prices for similar securities, interest rates, prepayment speeds, credit risk, etc.) |
| ∎ | Level 3 – significant unobservable inputs (including the Portfolio’s own assumptions in determining the fair value of investments) |
Wells Fargo Funds | 227
Table of Contents
Notes to financial statements
The inputs or methodologies used for valuing investments in securities are not necessarily an indication of the risk associated with investing in those securities.
The following is a summary of the inputs used in valuing each Portfolio’s assets and liabilities as of February 29, 2020:
| Bloomberg Barclays US Aggregate ex-Corporate Portfolio | Quoted prices (Level 1) | Other significant observable inputs (Level 2) | Significant (Level 3) | Total | ||||||||||||
Assets | ||||||||||||||||
Investments in: | ||||||||||||||||
Agency securities | $ | 0 | $ | 251,858,709 | $ | 0 | $ | 251,858,709 | ||||||||
Asset-backed securities | 0 | 4,017,679 | 0 | 4,017,679 | ||||||||||||
Municipal obligations | 0 | 5,865,210 | 0 | 5,865,210 | ||||||||||||
Non-agency mortgage-backed securities | 0 | 10,194,533 | 0 | 10,194,533 | ||||||||||||
U.S. Treasury securities | 352,222,173 | 0 | 0 | 352,222,173 | ||||||||||||
Yankee corporate bonds and notes | 0 | 20,400,064 | 0 | 20,400,064 | ||||||||||||
Yankee government bonds | 0 | 14,494,177 | 0 | 14,494,177 | ||||||||||||
Short-term investments | ||||||||||||||||
Investment companies | 11,379,432 | 0 | 0 | 11,379,432 | ||||||||||||
Total assets | $ | 363,601,605 | $ | 306,830,372 | $ | 0 | $ | 670,431,977 | ||||||||
| Emerging Markets Bond Portfolio | Quoted prices (Level 1) | Other significant observable inputs (Level 2) | Significant (Level 3) | Total | ||||||||||||
Assets | ||||||||||||||||
Investments in: | ||||||||||||||||
Yankee corporate bonds and notes | $ | 0 | $ | 5,925,086 | $ | 0 | $ | 5,925,086 | ||||||||
Yankee government bonds | 0 | 35,686,918 | 0 | 35,686,918 | ||||||||||||
Short-term investments | ||||||||||||||||
Investment companies | 922,295 | 0 | 0 | 922,295 | ||||||||||||
Total assets | $ | 922,295 | $ | 41,612,004 | $ | 0 | $ | 42,534,299 | ||||||||
228 | Wells Fargo Funds
Table of Contents
Notes to financial statements
| Factor Enhanced Emerging Markets Portfolio | Quoted prices (Level 1) | Other significant observable inputs (Level 2) | Significant (Level 3) | Total | ||||||||||||
Assets | ||||||||||||||||
Investments in: | ||||||||||||||||
Common stocks | ||||||||||||||||
Belgium | $ | 27,131 | $ | 0 | $ | 0 | $ | 27,131 | ||||||||
Brazil | 11,864,671 | 12,806 | 0 | 11,877,477 | ||||||||||||
Chile | 971,188 | 1,346,682 | 0 | 2,317,870 | ||||||||||||
China | 8,822,790 | 28,715,689 | 0 | 37,538,479 | ||||||||||||
Columbia | 693,515 | 0 | 0 | 693,515 | ||||||||||||
Czech Republic | 249,644 | 350,220 | 0 | 599,864 | ||||||||||||
Egypt | 505,936 | 0 | 0 | 505,936 | ||||||||||||
Greece | 104,725 | 778,177 | 0 | 882,902 | ||||||||||||
Hong Kong | 0 | 3,502,569 | 0 | 3,502,569 | ||||||||||||
Hungary | 438,622 | 568,065 | 0 | 1,006,687 | ||||||||||||
India | 6,404,032 | 30,731,941 | 19,732 | 37,155,705 | ||||||||||||
Indonesia | 226,906 | 4,155,225 | 0 | 4,382,131 | ||||||||||||
Malaysia | 803,702 | 4,361,179 | 0 | 5,164,881 | ||||||||||||
Mexico | 7,333,148 | 0 | 0 | 7,333,148 | ||||||||||||
Netherlands | 0 | 177,437 | 0 | 177,437 | ||||||||||||
Philippines | 1,042,143 | 3,122,133 | 31,407 | 4,195,683 | ||||||||||||
Romania | 0 | 131,464 | 0 | 131,464 | ||||||||||||
Russia | 406,152 | 13,583,777 | 0 | 13,989,929 | ||||||||||||
South Africa | 1,579,316 | 5,365,110 | 0 | 6,944,426 | ||||||||||||
South Korea | 201,100 | 24,180,315 | 0 | 24,381,415 | ||||||||||||
Taiwan | 154,952 | 25,726,489 | 0 | 25,881,441 | ||||||||||||
Thailand | 218,674 | 9,689,338 | 0 | 9,908,012 | ||||||||||||
Turkey | 77,711 | 1,860,214 | 0 | 1,937,925 | ||||||||||||
Foreign corporate bonds and notes | 0 | 3,269 | 0 | 3,269 | ||||||||||||
Preferred stocks | ||||||||||||||||
Brazil | 6,116,373 | 0 | 0 | 6,116,373 | ||||||||||||
Chile | 51,120 | 120,586 | 0 | 171,706 | ||||||||||||
Columbia | 238,442 | 0 | 0 | 238,442 | ||||||||||||
Russia | 171,400 | 27,701 | 0 | 199,101 | ||||||||||||
Rights | ||||||||||||||||
South Korea | 0 | 241 | 0 | 241 | ||||||||||||
Warrants | ||||||||||||||||
Malaysia | 0 | 11,545 | 0 | 11,545 | ||||||||||||
Thailand | 0 | 2,097 | 0 | 2,097 | ||||||||||||
Short-term investments | ||||||||||||||||
Investment companies | 6,720,374 | 0 | 0 | 6,720,374 | ||||||||||||
Total assets | $ | 55,423,767 | $ | 158,524,269 | $ | 51,139 | $ | 213,999,175 | ||||||||
Liabilities | ||||||||||||||||
Futures contracts | $ | 483,260 | $ | 0 | $ | 0 | $ | 483,260 | ||||||||
Total liabilities | $ | 483,260 | $ | 0 | $ | 0 | $ | 483,260 | ||||||||
Wells Fargo Funds | 229
Table of Contents
Notes to financial statements
| Factor Enhanced International Portfolio | Quoted prices (Level 1) | Other significant observable inputs (Level 2) | Significant (Level 3) | Total | ||||||||||||
Assets | ||||||||||||||||
Investments in: | ||||||||||||||||
Common stocks | ||||||||||||||||
Australia | $ | 129,127 | $ | 50,362,773 | $ | 0 | $ | 50,491,900 | ||||||||
Austria | 0 | 1,532,734 | 0 | 1,532,734 | ||||||||||||
Belgium | 554,905 | 3,193,462 | 0 | 3,748,367 | ||||||||||||
Canada | 59,892,132 | 1,042,746 | 0 | 60,934,878 | ||||||||||||
China | 0 | 1,774,414 | 0 | 1,774,414 | ||||||||||||
Denmark | 1,394,829 | 12,007,880 | 0 | 13,402,709 | ||||||||||||
Finland | 349,713 | 6,348,974 | 0 | 6,698,687 | ||||||||||||
France | 859,689 | 31,538,169 | 0 | 32,397,858 | ||||||||||||
Germany | 1,213,610 | 25,438,694 | 0 | 26,652,304 | ||||||||||||
Hong Kong | 101,080 | 15,604,065 | 0 | 15,705,145 | ||||||||||||
Ireland | 1,771,955 | 6,614,148 | 0 | 8,386,103 | ||||||||||||
Italy | 0 | 8,566,963 | 0 | 8,566,963 | ||||||||||||
Japan | 153,208 | 122,447,882 | 0 | 122,601,090 | ||||||||||||
Luxembourg | 302,250 | 1,292,956 | 0 | 1,595,206 | ||||||||||||
Netherlands | 1,878,646 | 16,415,120 | 0 | 18,293,766 | ||||||||||||
New Zealand | 0 | 2,565,603 | 0 | 2,565,603 | ||||||||||||
Norway | 0 | 4,297,102 | 0 | 4,297,102 | ||||||||||||
Papua New Guinea | 0 | 235,896 | 0 | 235,896 | ||||||||||||
Poland | 117,878 | 1,546,848 | 0 | 1,664,726 | ||||||||||||
Portugal | 0 | 1,174,660 | 0 | 1,174,660 | ||||||||||||
Singapore | 0 | 9,743,710 | 0 | 9,743,710 | ||||||||||||
Spain | 137,031 | 11,681,786 | 0 | 11,818,817 | ||||||||||||
Sweden | 760,807 | 17,188,512 | 0 | 17,949,319 | ||||||||||||
Switzerland | 879,197 | 48,149,083 | 0 | 49,028,280 | ||||||||||||
Thailand | 0 | 268,370 | 0 | 268,370 | ||||||||||||
United Kingdom | 1,075,018 | 81,386,244 | 0 | 82,461,262 | ||||||||||||
United States | 161,542 | 0 | 0 | 161,542 | ||||||||||||
Preferred stocks | ||||||||||||||||
Germany | 0 | 1,400,846 | 0 | 1,400,846 | ||||||||||||
Rights | ||||||||||||||||
Spain | 0 | 6,415 | 0 | 6,415 | ||||||||||||
Short-term investments | ||||||||||||||||
Investment companies | 24,301,039 | 0 | 0 | 24,301,039 | ||||||||||||
Total assets | $ | 96,033,656 | $ | 483,826,055 | $ | 0 | $ | 579,859,711 | ||||||||
Liabilities | ||||||||||||||||
Futures contracts | $ | 2,946,274 | $ | 0 | $ | 0 | $ | 2,946,274 | ||||||||
Total liabilities | $ | 2,946,274 | $ | 0 | $ | 0 | $ | 2,946,274 | ||||||||
230 | Wells Fargo Funds
Table of Contents
Notes to financial statements
| Factor Enhanced Large Cap Portfolio | Quoted prices (Level 1) | Other significant observable inputs (Level 2) | Significant (Level 3) | Total | ||||||||||||
Assets | ||||||||||||||||
Investments in: | ||||||||||||||||
Common stocks | ||||||||||||||||
Communication services | $ | 83,539,097 | $ | 0 | $ | 0 | $ | 83,539,097 | ||||||||
Consumer discretionary | 86,202,122 | 0 | 0 | 86,202,122 | ||||||||||||
Consumer staples | 93,202,603 | 0 | 0 | 93,202,603 | ||||||||||||
Energy | 31,220,500 | 0 | 0 | 31,220,500 | ||||||||||||
Financials | 112,081,616 | 0 | 0 | 112,081,616 | ||||||||||||
Health care | 168,813,051 | 0 | 0 | 168,813,051 | ||||||||||||
Industrials | 110,803,737 | 0 | 0 | 110,803,737 | ||||||||||||
Information technology | 100,460,375 | 0 | 0 | 100,460,375 | ||||||||||||
Materials | 26,678,598 | 0 | 0 | 26,678,598 | ||||||||||||
Real estate | 58,998,368 | 0 | 0 | 58,998,368 | ||||||||||||
Utilities | 43,636,206 | 0 | 0 | 43,636,206 | ||||||||||||
Rights | ||||||||||||||||
Health care | 0 | 141,316 | 0 | 141,316 | ||||||||||||
Short-term investments | ||||||||||||||||
Investment companies | 37,548,710 | 0 | 0 | 37,548,710 | ||||||||||||
Total assets | $ | 953,184,983 | $ | 141,316 | $ | 0 | $ | 953,326,299 | ||||||||
Liabilities | ||||||||||||||||
Futures contracts | $ | 5,807,403 | $ | 0 | $ | 0 | $ | 5,807,403 | ||||||||
Total liabilities | $ | 5,807,403 | $ | 0 | $ | 0 | $ | 5,807,403 | ||||||||
| Factor Enhanced Small Cap Portfolio | Quoted prices (Level 1) | Other significant observable inputs (Level 2) | Significant (Level 3) | Total | ||||||||||||
Assets | ||||||||||||||||
Investments in: | ||||||||||||||||
Common stocks | ||||||||||||||||
Communication services | $ | 6,834,090 | $ | 0 | $ | 32,978 | $ | 6,867,068 | ||||||||
Consumer discretionary | 26,630,671 | 0 | 0 | 26,630,671 | ||||||||||||
Consumer staples | 9,543,453 | 0 | 0 | 9,543,453 | ||||||||||||
Energy | 4,892,565 | 0 | 0 | 4,892,565 | ||||||||||||
Financials | 45,388,202 | 0 | 0 | 45,388,202 | ||||||||||||
Health care | 28,935,676 | 0 | 0 | 28,935,676 | ||||||||||||
Industrials | 32,653,617 | 0 | 0 | 32,653,617 | ||||||||||||
Information technology | 28,562,803 | 0 | 0 | 28,562,803 | ||||||||||||
Materials | 8,978,374 | 0 | 0 | 8,978,374 | ||||||||||||
Real estate | 21,380,823 | 0 | 61,417 | 21,442,240 | ||||||||||||
Utilities | 6,905,841 | 0 | 0 | 6,905,841 | ||||||||||||
Rights | ||||||||||||||||
Financials | 0 | 0 | 0 | 0 | ||||||||||||
Health care | 0 | 178 | 1,208 | 1,386 | ||||||||||||
Warrants | ||||||||||||||||
Energy | 0 | 0 | 0 | 0 | ||||||||||||
Short-term investments | ||||||||||||||||
Investment companies | 6,867,519 | 0 | 0 | 6,867,519 | ||||||||||||
Total assets | $ | 227,573,634 | $ | 178 | $ | 95,603 | $ | 227,669,415 | ||||||||
Liabilities | ||||||||||||||||
Futures contracts | $ | 1,030,251 | $ | 0 | $ | 0 | $ | 1,030,251 | ||||||||
Total liabilities | $ | 1,030,251 | $ | 0 | $ | 0 | $ | 1,030,251 | ||||||||
Wells Fargo Funds | 231
Table of Contents
Notes to financial statements
| High Yield Corporate Bond Portfolio | Quoted prices (Level 1) | Other significant observable inputs (Level 2) | Significant (Level 3) | Total | ||||||||||||
Assets | ||||||||||||||||
Investments in: | ||||||||||||||||
Corporate bonds and notes | $ | 0 | $ | 43,124,063 | $ | 0 | $ | 43,124,063 | ||||||||
Yankee corporate bonds and notes | 0 | 8,668,782 | 0 | 8,668,782 | ||||||||||||
Short-term investments | ||||||||||||||||
Investment companies | 1,339,300 | 0 | 0 | 1,339,300 | ||||||||||||
Total assets | $ | 1,339,300 | $ | 51,792,845 | $ | 0 | $ | 53,132,145 | ||||||||
| International Government Bond Portfolio | Quoted prices (Level 1) | Other significant observable inputs (Level 2) | Significant (Level 3) | Total | ||||||||||||
Assets | ||||||||||||||||
Investments in: | ||||||||||||||||
Foreign government bonds | $ | 0 | $ | 11,118,180 | $ | 0 | $ | 11,118,180 | ||||||||
Short-term investments | ||||||||||||||||
Investment companies | 51,894 | 0 | 0 | 51,894 | ||||||||||||
| 51,894 | 11,118,180 | 0 | 11,170,074 | |||||||||||||
Forward foreign currency contracts | 0 | 21,275 | 0 | 21,275 | ||||||||||||
Total assets | $ | 51,894 | $ | 11,139,455 | $ | 0 | $ | 11,191,349 | ||||||||
Liabilities | ||||||||||||||||
Forward foreign currency contracts | $ | 0 | $ | 37,008 | $ | 0 | $ | 37,008 | ||||||||
Total liabilities | $ | 0 | $ | 37,008 | $ | 0 | $ | 37,008 | ||||||||
| Investment Grade Corporate Bond Portfolio | Quoted prices (Level 1) | Other significant observable inputs (Level 2) | Significant (Level 3) | Total | ||||||||||||
Assets | ||||||||||||||||
Investments in: | ||||||||||||||||
Corporate bonds and notes | $ | 0 | $ | 209,553,154 | $ | 0 | $ | 209,553,154 | ||||||||
Yankee corporate bonds and notes | 0 | 48,613,662 | 0 | 48,613,662 | ||||||||||||
Short-term investments | ||||||||||||||||
Investment companies | 289,733 | 0 | 0 | 289,733 | ||||||||||||
Total assets | $ | 289,733 | $ | 258,166,816 | $ | 0 | $ | 258,456,549 | ||||||||
| Strategic Retirement Bond Portfolio | Quoted prices (Level 1) | Other significant observable inputs (Level 2) | Significant (Level 3) | Total | ||||||||||||
Assets | ||||||||||||||||
Investments in: | ||||||||||||||||
Agency securities | $ | 0 | $ | 947,373 | $ | 0 | $ | 947,373 | ||||||||
U.S. Treasury securities | 74,659,651 | 0 | 0 | 74,659,651 | ||||||||||||
Short-term investments | ||||||||||||||||
Investment companies | 281,311 | 0 | 0 | 281,311 | ||||||||||||
Total assets | $ | 74,940,962 | $ | 947,373 | $ | 0 | $ | 75,888,335 | ||||||||
232 | Wells Fargo Funds
Table of Contents
Notes to financial statements
| U.S. REIT Portfolio | Quoted prices (Level 1) | Other significant observable inputs (Level 2) | Significant (Level 3) | Total | ||||||||||||
Assets | ||||||||||||||||
Investments in: | ||||||||||||||||
Common stocks | ||||||||||||||||
Real estate | $ | 25,472,748 | $ | 0 | $ | 0 | $ | 25,472,748 | ||||||||
Short-term investments | ||||||||||||||||
Investment companies | 239,974 | 0 | 0 | 239,974 | ||||||||||||
Total assets | $ | 25,712,722 | $ | 0 | $ | 0 | $ | 25,712,722 | ||||||||
Additional sector, industry or geographic detail for each Portfolio is included in the Portfolio of investments.
Futures contracts and forward foreign currency contracts are reported at their cumulative unrealized gains (losses) at measurement date as reported in the tables following each applicable Portfolio of Investments. For futures contracts, the current day’s variation margin is reported on the Statements of Assets and Liabilities. All other assets and liabilities are reported at their market value at measurement date.
For the year ended February 29, 2020, the Portfolios did not have any transfers into/out of Level 3.
4. TRANSACTIONS WITH AFFILIATES
Advisory fees
The Trust has entered into an advisory contract with Funds Management, an indirect wholly owned subsidiary of Wells Fargo & Company (“Wells Fargo”). The adviser is responsible for implementing investment policies and guidelines and for supervising the applicable subadvisers, who are responsible forday-to-day portfolio management of the Portfolios. Pursuant to the contract, Funds Management is entitled to receive an advisory fee at the following annual rate based on the average daily net assets of each Portfolio.
Bloomberg Barclays US Aggregateex-Corporate Portfolio Investment Grade Corporate Bond Portfolio Strategic Retirement Bond Portfolio | Average daily net assets | Advisory fee | ||||
| First $5 billion | 0.05 | % | ||||
| Next $5 billion | 0.04 | |||||
| Over $10 billion | 0.03 | |||||
Emerging Markets Bond Portfolio High Yield Corporate Bond Portfolio International Government Bond Portfolio | Average daily net assets | Advisory fee | ||||
| First $5 billion | 0.25 | % | ||||
| Next $5 billion | 0.23 | |||||
| Over $10 billion | 0.21 | |||||
Factor Enhanced Emerging Markets Portfolio Factor Enhanced International Portfolio Factor Enhanced Small Cap Portfolio | Average daily net assets | Advisory fee | ||||
| First $5 billion | 0.15 | % | ||||
| Next $5 billion | 0.13 | |||||
| Over $10 billion | 0.11 | |||||
Factor Enhanced Large Cap Portfolio U.S. REIT Portfolio | Average daily net assets | Advisory fee | ||||
| First $5 billion | 0.10 | % | ||||
| Next $5 billion | 0.08 | |||||
| Over $10 billion | 0.06 | |||||
Wells Fargo Funds | 233
Table of Contents
Notes to financial statements
For the year ended February 29, 2020, the advisory fee was equivalent to an annual rate for each Portfolio as follows:
| Advisory fee | ||||
Bloomberg Barclays US Aggregate ex-Corporate Portfolio | 0.05 | % | ||
Emerging Markets Bond Portfolio | 0.25 | |||
Factor Enhanced Emerging Markets Portfolio | 0.15 | |||
Factor Enhanced International Portfolio | 0.15 | |||
Factor Enhanced Large Cap Portfolio | 0.10 | |||
Factor Enhanced Small Cap Portfolio | 0.15 | |||
High Yield Corporate Bond Portfolio | 0.25 | |||
International Government Bond Portfolio | 0.25 | |||
Investment Grade Corporate Bond Portfolio | 0.05 | |||
Strategic Retirement Bond Portfolio | 0.05 | |||
U.S. REIT Portfolio | 0.10 | |||
Funds Management has retained the services of certain subadvisers to provide daily portfolio management to the Portfolios. Funds Management has engaged Wells Capital Management Incorporated (“WellsCap”) and Wells Fargo Asset Management (International) Limited (“WFAM (I) Limited”), each an affiliate of Funds Management and an indirect, wholly owned subsidiary of Wells Fargo, as subadvisers. Prior to August 1, 2019, Wells Fargo Asset Management (International), LLC (“WFAM (I) LLC”) was the subadviser for Emerging Markets Bond Portfolio and International Government Bond Portfolio. Effective August 1, 2019, WFAM (I) LLC merged with WFAM (I) Limited and WFAM (I) Limited became the subadviser to these Portfolios. This transaction did not result in any changes to the services provided to these Portfolios or to the strategies or fees and expenses. The fee forsub-advisory services is borne by Funds Management. The subadvisers are each entitled to receive from Funds Management an annual subadvisory fee which is calculated based on the average daily net assets of each Portfolio as follows:
| Subadvisory fee | ||||||||||
| Subadviser | starting at | declining to | ||||||||
Bloomberg Barclays US Aggregateex-Corporate Portfolio | WellsCap | 0.04 | % | 0.03 | % | |||||
Emerging Markets Bond Portfolio | WFAM (I) Limited | 0.09 | 0.07 | |||||||
Factor Enhanced Emerging Markets Portfolio | WellsCap | 0.08 | 0.05 | |||||||
Factor Enhanced International Portfolio | WellsCap | 0.08 | 0.05 | |||||||
Factor Enhanced Large Cap Portfolio | WellsCap | 0.06 | 0.04 | |||||||
Factor Enhanced Small Cap Portfolio | WellsCap | 0.08 | 0.05 | |||||||
High Yield Corporate Bond Portfolio | WellsCap | 0.09 | 0.07 | |||||||
International Government Bond Portfolio | WFAM (I) Limited | 0.09 | 0.07 | |||||||
Investment Grade Corporate Bond Portfolio | WellsCap | 0.04 | 0.03 | |||||||
Strategic Retirement Bond Portfolio | WellsCap | 0.04 | 0.03 | |||||||
U.S. REIT Portfolio | WellsCap | 0.06 | 0.04 | |||||||
Funds Management has voluntarily waived and/or reimbursed advisory fees to the extent necessary to maintain certain net operating expense ratios for the Portfolios.
Interfund transactions
The Portfolios may purchase or sell portfolio investment securities to certain other Wells Fargo affiliates pursuant to Rule17a-7 under the 1940 Act and under procedures adopted by the Board of Trustees. The procedures have been designed to ensure that these interfund transactions, which do not incur broker commissions, are effected at current market prices.
234 | Wells Fargo Funds
Table of Contents
Notes to financial statements
5. INVESTMENT PORTFOLIO TRANSACTIONS
Purchases and sales of investments, excluding short-term securities, for the year ended February 29, 2020 were as follows:
| Purchases at cost | Sales proceeds | |||||||||||||||
U.S. government | Non-U.S. government | U.S. government | Non-U.S. government | |||||||||||||
Bloomberg Barclays US Aggregateex-Corporate Portfolio | $ | 307,916,397 | $ | 28,879,069 | $ | 256,175,659 | $ | 29,995,789 | ||||||||
Emerging Markets Bond Portfolio | 0 | 15,209,255 | 0 | 17,810,261 | ||||||||||||
Factor Enhanced Emerging Markets Portfolio | 0 | 138,836,075 | 0 | 157,590,204 | ||||||||||||
Factor Enhanced International Portfolio | 0 | 280,483,534 | 0 | 382,891,851 | ||||||||||||
Factor Enhanced Large Cap Portfolio | 0 | 273,029,226 | 0 | 501,992,653 | ||||||||||||
Factor Enhanced Small Cap Portfolio | 0 | 101,910,738 | 0 | 121,467,164 | ||||||||||||
High Yield Corporate Bond Portfolio | 0 | 31,683,821 | 0 | 62,908,632 | ||||||||||||
International Government Bond Portfolio | 0 | 31,946,163 | 0 | 32,009,115 | ||||||||||||
Investment Grade Corporate Bond Portfolio | 0 | 46,237,098 | 0 | 73,593,548 | ||||||||||||
Strategic Retirement Bond Portfolio | 29,041,108 | 769,500 | 30,373,054 | 1,159,613 | ||||||||||||
U.S. REIT Portfolio | 0 | 8,457,891 | 0 | 26,958,065 | ||||||||||||
6. DERIVATIVE TRANSACTIONS
During the year ended February 29, 2020, Factor Enhanced Emerging Markets Portfolio, Factor Enhanced International Portfolio, Factor Enhanced Large Cap Portfolio and Factor Enhanced Small Cap Portfolio entered into futures contracts to gain market exposure. International Government Bond Portfolio entered into forward foreign currency contracts for economic hedging purposes.
The table below discloses the volume of the following Portfolio’s derivative activity during the year ended February 29, 2020.
Factor Enhanced Emerging Markets Portfolio | Factor Enhanced International Portfolio | Factor Enhanced Large Cap Portfolio | Factor Enhanced Small Cap Portfolio | International Government Bond Portfolio | ||||||||||||||||
Futures contracts | ||||||||||||||||||||
Average notional balance on long futures | $ | 10,346,239 | $ | 24,802,004 | $ | 39,145,394 | $ | 11,207,809 | N/A | |||||||||||
Average notional balance on short futures | 0 | 0 | 0 | 0 | N/A | |||||||||||||||
Forward foreign currency contracts | ||||||||||||||||||||
Average contract amounts to buy | N/A | N/A | N/A | N/A | $ | 2,277,079 | ||||||||||||||
Average contract amounts to sell | N/A | N/A | N/A | N/A | 2,178,821 | |||||||||||||||
The fair value, realized gains or losses and change in unrealized gains or losses, if any, on derivative instruments are reflected in the corresponding financial statement captions.
For certain types of derivative transactions, the Portfolios have entered into International Swaps and Derivatives Association, Inc. master agreements (“ISDA Master Agreements”) or similar agreements with approved counterparties. The ISDA Master Agreements or similar agreements may have requirements to deliver/deposit securities or cash to/with an exchange or broker-dealer as collateral and allows the Portfolio to offset, with each counterparty, certain derivative financial instrument’s assets and/or liabilities with collateral held or pledged. Collateral requirements differ by type of derivative. Collateral or margin requirements are set by the broker or exchange clearinghouse for exchange traded derivatives while collateral terms are contract specific forover-the-counter traded derivatives. Cash collateral that has been pledged to cover obligations of the Portfolio under ISDA Master Agreements or similar agreements, if any, are reported separately in the Statements of Assets and Liabilities. Securities pledged as collateral, if any, are noted in the Portfolio of Investments. With respect to balance sheet offsetting, absent an event of default by the counterparty or a termination of the agreement, the reported amounts of financial assets and financial liabilities in the Statements of Assets and Liabilities are not offset across transactions between the
Wells Fargo Funds | 235
Table of Contents
Notes to financial statements
Portfolio and the applicable counterparty. A reconciliation of the gross amounts on the Statements of Assets and Liabilities to the net amounts by counterparty, including any collateral exposure, for OTC derivatives is as follows:
| Counterparty | Gross amounts of assets in the | Amounts subject to netting agreements | Collateral received | Net amount of assets | ||||||||||||
International Government Bond Portfolio | State Street Bank | $21,275 | $ | (21,275 | ) | $ | 0 | $ | 0 | |||||||
| Counterparty | Gross amounts of liabilities in the Statements of Assets and Liabilities | Amounts subject to netting agreements | Collateral pledged | Net amount of liabilities | ||||||||||||
International Government Bond Portfolio | State Street Bank | $37,008 | $ | (21,275 | ) | $ | 0 | $ | 15,733 | |||||||
7. BANK BORROWINGS
The Trust, along with Wells Fargo Variable Trust and Wells Fargo Funds Trust (excluding the money market funds), are parties to a $280,000,000 revolving credit agreement whereby each Portfolio is permitted to use bank borrowings for temporary or emergency purposes, such as to fund shareholder redemption requests. Interest under the credit agreement is charged to each Portfolio based on a borrowing rate equal to the higher of the Federal Funds rate in effect on that day plus 1.25% or the overnight LIBOR rate in effect on that day plus 1.25%. In addition, an annual commitment fee equal to 0.25% of the unused balance is allocated to each participating fund.
During the year ended February 29, 2020, the Portfolios had the following borrowing activity:
| Average borrowings outstanding | Weighted average interest rate | Interest paid | ||||||||||
Factor Enhanced International Portfolio | $ | 15,363 | 2.89 | % | $ | 444 | ||||||
Factor Enhanced Large Cap Portfolio | 15,540 | 2.87 | % | 446 | ||||||||
8. INDEMNIFICATION
Under the Trust’s organizational documents, the officers and Trustees have been granted certain indemnification rights against certain liabilities that may arise out of performance of their duties to the Trust. Additionally, in the normal course of business, the Trust may enter into contracts with service providers that contain a variety of indemnification clauses. The Trust’s maximum exposure under these arrangements is dependent on future claims that may be made against the Portfolios and, therefore, cannot be estimated.
9. NEW ACCOUNTING PRONOUNCEMENTS
In August 2018, FASB issued Accounting Standards Update (“ASU”)No. 2018-13, Fair Value Measurement (Topic 820)Disclosure Framework—Changes to the Disclosure Requirements for Fair Value Measurement. ASU2018-13 updates the disclosure requirements for fair value measurements by modifying or removing certain disclosures and adding certain new disclosures. The amendments are effective for fiscal years, and interim periods within those fiscal years, beginning after December 15, 2019. Early adoption is permitted. Management has adopted the removal and modification of disclosures early, as permitted, and will adopt the additional new disclosures at the effective date.
In March 2017, FASB issued ASUNo. 2017-08,Premium Amortization on Purchased Callable Debt Securities. ASU2017-08 shortens the amortization period for certain callable debt securities held at a premium and requires the premium to be amortized to the earliest call date. The amendments do not require an accounting change for securities held at a discount and discounts will continue to be accreted to the maturity date of the security. ASU2017-08 is effective for fiscal years beginning after December 15, 2018 and for interim periods within those fiscal years. During the current reporting period, management of each Portfolio adopted the change in accounting policy which did not have a material impact to each Portfolio’s financial statements.
236 | Wells Fargo Funds
Table of Contents
Notes to financial statements
10. SUBSEQUENT EVENT
On March 11, 2020, the World Health Organization announced that it had made the assessment that coronavirus disease 2019(“COVID-19”) is a pandemic. The impacts ofCOVID-19 is adversely affecting the entire global economy, individual companies and investment products, and the market in general. There is significant uncertainty around the extent and duration of business disruptions related toCOVID-19 and the impact may be short term or may last for an extended period of time. The risk of further spreading ofCOVID-19 has led to significant uncertainty and volatility in the financial markets and the value of the Portfolios and the securities in which the Portfolios invest have generally been adversely affected by impacts caused byCOVID-19.
Wells Fargo Funds | 237
Table of Contents
Report of independent registered public accounting firm
To the Shareholders of the Portfolios and Board of Trustees
Wells Fargo Master Trust:
Opinion on the Financial Statements
We have audited the accompanying statements of assets and liabilities of Wells Fargo Bloomberg Barclays US Aggregate ex-Corporate Portfolio, Wells Fargo Emerging Markets Bond Portfolio, Wells Fargo Factor Enhanced Emerging Markets Portfolio, Wells Fargo Factor Enhanced International Portfolio, Wells Fargo Factor Enhanced Large Cap Portfolio, Wells Fargo Factor Enhanced Small Cap Portfolio, Wells Fargo High Yield Corporate Bond Portfolio, Wells Fargo International Government Bond Portfolio, Wells Fargo Investment Grade Corporate Bond Portfolio, Wells Fargo Strategic Retirement Bond Portfolio, and Wells Fargo U.S. REIT Portfolio (collectively, the Portfolios), eleven of the portfolios constituting Wells Fargo Master Trust, including the portfolios of investments, as of February 29, 2020, the related statements of operations for the year then ended, the statements of changes in net assets for each of the years in the two-year period then ended, and the related notes (collectively, the financial statements) and the financial highlights for each of the years or periods in the period from May 23, 2017 (commencement of operations) to February 29, 2020, except for Wells Fargo International Government Bond Portfolio, which is for each of the years or periods in the period from August 16, 2017 (commencement of operations) to February 29, 2020. In our opinion, the financial statements and financial highlights present fairly, in all material respects, the financial position of the Portfolios as of February 29, 2020, the results of their operations for the year then ended, the changes in their net assets for each of the years in the two-year period then ended, and the financial highlights for each of the years or periods in the period from the commencement of operations to February 29, 2020, in conformity with U.S. generally accepted accounting principles.
Basis for Opinion
These financial statements and financial highlights are the responsibility of the Portfolios’ management. Our responsibility is to express an opinion on these financial statements and financial highlights based on our audits. We are a public accounting firm registered with the Public Company Accounting Oversight Board (United States) (PCAOB) and are required to be independent with respect to the Portfolios in accordance with the U.S. federal securities laws and the applicable rules and regulations of the Securities and Exchange Commission and the PCAOB.
We conducted our audits in accordance with the standards of the PCAOB. Those standards require that we plan and perform the audit to obtain reasonable assurance about whether the financial statements and financial highlights are free of material misstatement, whether due to error or fraud. Our audits included performing procedures to assess the risks of material misstatement of the financial statements and financial highlights, whether due to error or fraud, and performing procedures that respond to those risks. Such procedures included examining, on a test basis, evidence regarding the amounts and disclosures in the financial statements and financial highlights. Such procedures also included confirmation of securities owned as of February 29, 2020, by correspondence with the custodian, transfer agent, and brokers, or by other appropriate auditing procedures. Our audits also included evaluating the accounting principles used and significant estimates made by management, as well as evaluating the overall presentation of the financial statements and financial highlights. We believe that our audits provide a reasonable basis for our opinion.
We have not been able to determine the specific year that we began serving as the auditor of one or more Wells Fargo Funds investment companies; however we are aware that we have served as the auditor of one or more Wells Fargo Funds investment companies since at least 1955.
Boston, Massachusetts
April 28, 2020
238 | Wells Fargo Funds
Table of Contents
TAX INFORMATION
Pursuant to Section 852 of the Internal Revenue Code, the following amounts were designated as a 20% rate gain distribution for the fiscal year ended February 29, 2020:
20% rate gain distribution | ||||
U.S. Core Bond Fund | $ | 3,786 | ||
For the fiscal year ended February 29, 2020, the percentage of ordinary income distributed which was derived from interest on U.S. government securities was as follows:
%of U.S. government income | ||||
U.S. Core Bond Fund | 24.10 | % | ||
PROXY VOTING INFORMATION
A description of the policies and procedures used to determine how to vote proxies relating to portfolio securities is available without charge, upon request, by calling1-800-222-8222, visiting our website atwfam.com, or visiting the SEC website at sec.gov. Information regarding how the proxies related to portfolio securities were voted during the most recent12-month period ended June 30 is available on the website atwfam.comor by visiting the SEC website at sec.gov.
QUARTERLY PORTFOLIO HOLDINGS INFORMATION
The Funds and Portfolios file their complete schedule of portfolio holdings with the SEC for the first and third quarters of each fiscal year as an exhibit to their reports on FormN-PORT. Shareholders may view the filed FormN-PORT by visiting the SEC website at sec.gov.
Wells Fargo Funds | 239
Table of Contents
Other information (unaudited)
BOARD OF TRUSTEES AND OFFICERS
Each of the Trustees and Officers1 listed in the table below acts in identical capacities for each fund in the Wells Fargo family of funds, which consists of 146 mutual funds comprising the Wells Fargo Funds Trust, Wells Fargo Variable Trust, Wells Fargo Master Trust and fourclosed-end funds (collectively the “Fund Complex”). This table should be read in conjunction with the Prospectus and the Statement of Additional Information2. The mailing address of each Trustee and Officer is 525 Market Street, 12th Floor, San Francisco, CA 94105. Each Trustee and Officer serves an indefinite term, however, each Trustee serves such term until reaching the mandatory retirement age established by the Trustees.
Independent Trustees
Name and year of birth | Position held and length of service* | Principal occupations during past five years or longer | Current other public company or investment company directorships | |||
William R. Ebsworth (Born 1957) | Trustee, since 2015 | Retired. From 1984 to 2013, equities analyst, portfolio manager, research director and chief investment officer at Fidelity Management and Research Company in Boston, Tokyo, and Hong Kong, and retired in 2013 as Chief Investment Officer of Fidelity Strategic Advisers, Inc. where he led a team of investment professionals managing client assets. Prior thereto, Board member of Hong Kong Securities Clearing Co., Hong Kong Options Clearing Corp., the Thailand International Fund, Ltd., Fidelity Investments Life Insurance Company, and Empire Fidelity Investments Life Insurance Company. Audit Committee Chair and Investment Committee Chair of the Vincent Memorial Hospital Endowment(non-profit organization). Mr. Ebsworth is a CFA® charterholder. | N/A | |||
Jane A. Freeman (Born 1953) | Trustee, since 2015; Chair Liaison, since 2018 | Retired. From 2012 to 2014 and 1999 to 2008, Chief Financial Officer of Scientific Learning Corporation. From 2008 to 2012, Ms. Freeman provided consulting services related to strategic business projects. Prior to 1999, Portfolio Manager at Rockefeller & Co. and Scudder, Stevens & Clark. Board member of the Harding Loevner Funds from 1996 to 2014, serving as both Lead Independent Director and chair of the Audit Committee. Board member of the Russell Exchange Traded Funds Trust from 2011 to 2012 and the chair of the Audit Committee. Ms. Freeman is a Board Member of The Ruth Bancroft Garden(non-profit organization). She is also an inactive Chartered Financial Analyst. | N/A | |||
Isaiah Harris, Jr. (Born 1952) | Trustee, since 2009; Audit Committee Chairman, since 2019 | Retired. Chairman of the Board of CIGNA Corporation since 2009, and Director since 2005. From 2003 to 2011, Director of Deluxe Corporation. Prior thereto, President and CEO of BellSouth Advertising and Publishing Corp. from 2005 to 2007, President and CEO of BellSouth Enterprises from 2004 to 2005 and President of BellSouth Consumer Services from 2000 to 2003. Emeritus member of the Iowa State University Foundation Board of Governors. Emeritus Member of the Advisory Board of Iowa State University School of Business. Advisory Board Member, Palm Harbor Academy (private school). Advisory Board Member, Child Evangelism Fellowship(non-profit). Mr. Harris is a certified public accountant (inactive status). | CIGNA Corporation | |||
Judith M. Johnson (Born 1949) | Trustee, since 2008; Audit Committee Chairman, from 2009 to 2018 | Retired. Prior thereto, Chief Executive Officer and Chief Investment Officer of Minneapolis Employees Retirement Fund from 1996 to 2008. Ms. Johnson is an attorney, certified public accountant and a certified managerial accountant. | N/A | |||
240 | Wells Fargo Funds
Table of Contents
Other information (unaudited)
Name and year of birth | Position held and length of service* | Principal occupations during past five years or longer | Current other public company or investment company directorships | |||
David F. Larcker (Born 1950) | Trustee, since 2009 | James Irvin Miller Professor of Accounting at the Graduate School of Business, Stanford University, Director of the Corporate Governance Research Initiative and Senior Faculty of The Rock Center for Corporate Governance since 2006. From 2005 to 2008, Professor of Accounting at the Graduate School of Business, Stanford University. Prior thereto, Ernst & Young Professor of Accounting at The Wharton School, University of Pennsylvania from 1985 to 2005. | N/A | |||
Olivia S. Mitchell (Born 1953) | Trustee, since 2006; Nominating and Governance Committee Chair, since 2018 | International Foundation of Employee Benefit Plans Professor, Wharton School of the University of Pennsylvania since 1993. Director of Wharton’s Pension Research Council and Boettner Center on Pensions & Retirement Research, and Research Associate at the National Bureau of Economic Research. Previously, Cornell University Professor from 1978 to 1993. | N/A | |||
Timothy J. Penny (Born 1951) | Trustee, since 1996; Chairman, since 2018 | President and Chief Executive Officer of Southern Minnesota Initiative Foundation, anon-profit organization, since 2007. Member of the Board of Trustees of NorthStar Education Finance, Inc., anon-profit organization, since 2007. | N/A | |||
James G. Polisson (Born 1959) | Trustee, since 2018 | Retired. Chief Marketing Officer, Source (ETF) UK Services, Ltd, from 2015 to 2017. From 2012 to 2015, Principal of The Polisson Group, LLC, a management consulting, corporate advisory and principal investing company. Chief Executive Officer and Managing Director at Russell Investments, Global Exchange Traded Funds from 2010 to 2012. Managing Director of Barclays Global Investors from 1998 to 2010 and Global Chief Marketing Officer for iShares and Barclays Global Investors from 2000 to 2010. Trustee of the San Francisco Mechanics’ Institute, anon-profit organization, from 2013 to 2015. Board member of the Russell Exchange Traded Fund Trust from 2011 to 2012. Director of Barclays Global Investors Holdings Deutschland GmbH from 2006 to 2009. Mr. Polisson is an attorney and has a retired status with the Massachusetts and District of Columbia Bar Associations. | N/A | |||
Pamela Wheelock3 (Born 1959) | Trustee, since January 2020; previously Trustee from January 2018 to July 2019 | Board member of the Destination Medical Center Economic Development Agency, Rochester, Minnesota since 2019. Acting Commissioner, Minnesota Department of Human Services, July 2019 through September 2019. Human Services Manager (part-time), Minnesota Department of Human Services, October 2019 through December 2019. Chief Operating Officer, Twin Cities Habitat for Humanity from 2017 to 2019. Vice President of University Services, University of Minnesota from 2012 to 2016. Prior thereto, on the Board of Directors, Governance Committee and Finance Committee for the Minnesota Philanthropy Partners (Saint Paul Foundation) from 2012 to 2018, Interim Chief Executive Officer of Blue Cross Blue Shield of Minnesota from 2011 to 2012, Chairman of the Board from 2009 to 2012 and Board Director from 2003 to 2015. Vice President, Leadership and Community Engagement, Bush Foundation, Saint Paul, Minnesota (a private foundation) from 2009 to 2011. Executive Vice President and Chief Financial Officer, Minnesota Sports and Entertainment from 2004 to 2009 and Senior Vice President from 2002 to 2004. Executive Vice President of the Minnesota Wild Foundation from 2004 to 2008. Commissioner of Finance, State of Minnesota, from 1999 to 2002. Currently Board Chair of the Minnesota Wild Foundation since 2010. | N/A | |||
| * | Length of service dates reflect the Trustee’s commencement of service with the Trust’s predecessor entities, where applicable. |
Wells Fargo Funds | 241
Table of Contents
Other information (unaudited)
Officers
Name and year of birth | Position held and length of service | Principal occupations during past five years or longer | ||
| Andrew Owen (Born 1960) | President, since 2017 | Executive Vice President of Wells Fargo & Company and Head of Affiliated Managers, Wells Fargo Asset Management, since 2014. In addition, Mr. Owen is currently President, Chief Executive Officer and Director of Wells Fargo Funds Management, LLC since 2017. Prior thereto, Executive Vice President responsible for marketing, investments and product development for Wells Fargo Funds Management, LLC, from 2009 to 2014. | ||
| Jeremy DePalma1 (Born 1974) | Treasurer, since 2012 | Senior Vice President of Wells Fargo Funds Management, LLC since 2009. Senior Vice President of Evergreen Investment Management Company, LLC from 2008 to 2010 and head of the Fund Reporting and Control Team within Fund Administration from 2005 to 2010. | ||
| Michelle Rhee (Born 1966) | Chief Legal Officer, since 2019 | Secretary of Wells Fargo Funds Management, LLC, Chief Legal Counsel of Wells Fargo Asset Management and Assistant General Counsel of Wells Fargo Bank, N.A. since 2018. Associate General Counsel and Managing Director of Bank of America Corporation from 2004 to 2018. | ||
| Catherine Kennedy (Born 1969) | Secretary, since 2019 | Vice President of Wells Fargo Funds Management, LLC and Senior Counsel of the Wells Fargo Legal Department since 2010. Vice President and Senior Counsel of Evergreen Investment Management Company, LLC from 1998 to 2010. | ||
| Michael H. Whitaker(Born 1967) | Chief Compliance Officer, since 2016 | Chief Compliance Officer of Wells Fargo Asset Management since 2016. Senior Vice President and Chief Compliance Officer for Fidelity Investments from 2007 to 2016. | ||
| David Berardi (Born 1975) | Assistant Treasurer, since 2009 | Vice President of Wells Fargo Funds Management, LLC since 2009. Vice President of Evergreen Investment Management Company, LLC from 2008 to 2010. Manager of Fund Reporting and Control for Evergreen Investment Management Company, LLC from 2004 to 2010. | ||
| 1 | Jeremy DePalma acts as Treasurer of 82 funds and Assistant Treasurer of 64 funds in the Fund Complex. |
| 2 | The Statement of Additional Information includes additional information about the Trustees and is available, without charge, upon request, by calling1-800-222-8222 or by visiting the website atwfam.com. |
| 3 | Pamela Wheelock wasre-appointed to the Board effective January 1, 2020. |
242 | Wells Fargo Funds
Table of Contents
For more information
More information about Wells Fargo Funds is available free upon request. To obtain literature, please write, visit the Funds’ website, or call:
Wells Fargo Funds
P.O. Box 219967
Kansas City, MO 64121-9967
Website:wfam.com
Individual investors:1-800-222-8222
Retail investment professionals:1-888-877-9275
Institutional investment professionals:1-866-765-0778

This report and the financial statements contained herein are submitted for the general information of the shareholders of Wells Fargo Funds. If this report is used for promotional purposes, distribution of the report must be accompanied or preceded by a current prospectus. Before investing, please consider the investment objectives, risks, charges, and expenses of the investment. For a current prospectus and, if available, a summary prospectus, containing this information, call1-800-222-8222 or visit the Funds’ website atwfam.com. Read the prospectus carefully before you invest or send money.
Wells Fargo Asset Management (WFAM) is the trade name for certain investment advisory/management firms owned by Wells Fargo & Company. These firms include but are not limited to Wells Capital Management Incorporated and Wells Fargo Funds Management, LLC. Certain products managed by WFAM entities are distributed by Wells Fargo Funds Distributor, LLC (a broker-dealer and Member FINRA).
This material is for general informational and educational purposes only and is NOT intended to provide investment advice or a recommendation of any kind—including a recommendation for any specific investment, strategy, or plan.
INVESTMENT PRODUCTS: NOT FDIC INSURED ◾ NO BANK GUARANTEE ◾ MAY LOSE VALUE
© 2020 Wells Fargo & Company. All rights reserved
PAR-0220-04684 04-20
AII/AR160 02-20
Table of Contents
| ITEM 2. | CODE OF ETHICS |
(a) As of the end of the period covered by the report, Wells Fargo Funds Trust has adopted a code of ethics that applies to its President and Treasurer. A copy of the code of ethics is filed as an exhibit to this FormN-CSR.
(c) During the period covered by this report, there were no amendments to the provisions of the code of ethics adopted in Item 2(a) above.
(d) During the period covered by this report, there were no implicit or explicit waivers to the provisions of the code of ethics adopted in Item 2(a) above.
| ITEM 3. | AUDIT COMMITTEE FINANCIAL EXPERT |
The Board of Trustees of Wells Fargo Funds Trust has determined that Judith Johnson is an audit committee financial expert, as defined in Item 3 of FormN-CSR. Mrs. Johnson is independent for purposes of Item 3 of FormN-CSR.
| ITEM 4. | PRINCIPAL ACCOUNTANT FEES AND SERVICES |
(a), (b), (c), (d) The following table presents aggregate fees billed in each of the last two fiscal years for services rendered
to the Registrant by the Registrant’s principal accountant. These fees were billed to the registrant and were approved by
the Registrant’s audit committee.
| Fiscal year ended February 29, 2020 | Fiscal year ended February 28, 2019 | |||||||
Audit fees | $ | 496,090 | $ | 569,750 | ||||
Audit-related fees | — | — | ||||||
Tax fees(1) | 88,080 | 120,940 | ||||||
All other fees | — | — | ||||||
|
|
|
| |||||
| $ | 584,170 | * | $ | 690,690 | ||||
|
|
|
| |||||
| * | Excludes amounts related to Funds that liquidated during the fiscal year. |
| (1) | Tax fees consist of fees for tax compliance, tax advice, tax planning and excise tax. |
If the Chairman approves of such service, he or she shall sign the statement prepared by Management. Such written statement shall be presented to the full Committees at their next regularly scheduled meetings.
(f) Not applicable
(g) Not applicable
(h) Not applicable
| ITEM 5. | AUDIT COMMITTEE OF LISTED REGISTRANTS |
Not applicable.
Table of Contents
| ITEM 6. | INVESTMENTS |
A Portfolio of Investments for each series of Wells Fargo Funds Trust is included as part of the report to shareholders filed under Item 1 of this Form.
| ITEM 7. | DISCLOSURE OF PROXY VOTING POLICIES AND PROCEDURES FORCLOSED-END MANAGEMENT INVESTMENT COMPANIES |
Not applicable.
| ITEM 8. | PORTFOLIO MANAGERS OF CLOSED-END MANAGEMENT INVESTMENT COMPANIES |
Not applicable.
| ITEM 9. | PURCHASES OF EQUITY SECURITIES BYCLOSED-END MANAGEMENT INVESTMENT COMPANY AND AFFILIATED PURCHASERS |
Not applicable.
| ITEM 10. | SUBMISSION OF MATTERS TO A VOTE OF SECURITY HOLDERS |
There have been no material changes to the procedures by which shareholders may recommend nominees to the registrant’s Board of Trustees that have been implemented since the registrant’s last provided disclosure in response to the requirements of this Item.
| ITEM 11. | CONTROLS AND PROCEDURES |
(a) The President and Treasurer have concluded that the Wells Fargo Funds Trust disclosure controls and procedures (as defined in Rule30a-3(c) under the Investment Company Act of 1940) provide reasonable assurances that material information relating to the registrant is made known to them by the appropriate persons based on their evaluation of these controls and procedures as of a date within 90 days of the filing of this report.
(b) There were no significant changes in the registrant’s internal controls over financial reporting (as defined in Rule30a-3(d) under the Investment Company Act of 1940) that occurred during the most recent fiscal half-year of the period covered by this report that materially affected, or is reasonably likely to materially affect, the registrant’s internal control over financial reporting.
| ITEM 12. | DISCLOSURES OF SECURITIES LENDING ACTIVITES FORCLOSED-END MANAGEMENT INVESTMENT COMPANIES |
Not applicable.
Table of Contents
Table of Contents
SIGNATURES
Pursuant to the requirements of the Securities Exchange Act of 1934 and the Investment Company Act of 1940, the registrant has duly caused this report to be signed on its behalf by the undersigned, thereunto duly authorized.
| Wells Fargo Funds Trust | ||
| By: | /s/ Andrew Owen | |
| Andrew Owen | ||
| President | ||
| Date: April 28, 2020 | ||
Pursuant to the requirements of the Securities Exchange Act of 1934 and the Investment Company Act of 1940, this report has been signed below by the following persons on behalf of the registrant and in the capacities and on the date indicated.
| Wells Fargo Funds Trust | ||
| By: | /s/ Andrew Owen | |
| Andrew Owen | ||
| President | ||
| Date: April 28, 2020 | ||
| By: | /s/Jeremy DePalma | |
| Jeremy DePalma | ||
| Treasurer | ||
| Date: April 28, 2020 | ||