UNITED STATES
SECURITIES AND EXCHANGE COMMISSION
Washington, D.C. 20549
FORM N-CSR
CERTIFIED SHAREHOLDER REPORT OF REGISTERED
MANAGEMENT INVESTMENT COMPANIES
Investment Company Act file number: 811-09255
Wells Fargo Variable Trust
(Exact name of registrant as specified in charter)
525 Market St., San Francisco, CA 94105
(Address of principal executive offices) (Zip code)
C. David Messman
Wells Fargo Funds Management, LLC
525 Market St., San Francisco, CA 94105
(Name and address of agent for service)
Registrant’s telephone number, including area code: 800-643-9691
Date of fiscal year end: December 31, 2010
Date of reporting period: December 31, 2010
ITEM 1. REPORT TO SHAREHOLDERS
Sign up for electronic delivery of prospectuses and shareholder
reports at www.wellsfargo.com/advantagedelivery
WELLS FARGO ADVANTAGE VARIABLE TRUST FUNDS
§ Wells Fargo Advantage VT Core Equity Fund
Reduce clutter. Save trees.
Sign up for electronic delivery of prospectuses and shareholder reports at www.wellsfargo.com/advantagedelivery
| | | | | |
| Contents | | | | |
| |
Letter to Shareholders | | | 2 | |
| | | | | |
Performance Highlights | | | 6 | |
| | | | | |
Fund Expenses | | | 10 | |
| | | | | |
Portfolio of Investments | | | 11 | |
| | | | | |
Financial Statements | | | | |
| Statement of Assets and Liabilities | | | 15 | |
| Statement of Operations | | | 16 | |
| Statements of Changes in Net Assets | | | 17 | |
| Financial Highlights | | | 18 | |
| | | | | |
Notes to Financial Statements | | | 20 | |
| | | | | |
Report of Independent Registered Public Accounting Firm | | | 26 | |
| | | | | |
Other Information | | | 27 | |
| | | | | |
List of Abbreviations | | | 31 | |
The views expressed are as of December 31, 2010, and are those of the Fund managers. Any reference to a specific security in this report is not a recommendation to purchase or sell any specific security or adopt any investment strategy. The views are subject to change at any time in response to changing circumstances in the market and are not intended to predict or guarantee the future performance of any individual security, market sector or the markets generally, or the Wells Fargo Advantage VT Core Equity Fund.
NOT FDIC INSURED § NO BANK GUARANTEE § MAY LOSE VALUE
WELLS FARGO
| 1932 | | Keystone creates one of the first mutual fund families. |
| |
| 1971 | | Wells Fargo & Company introduces one of the first institutional index funds. |
| |
| 1978 | | Wells Fargo applies Markowitz and Sharpe’s research on Modern Portfolio Theory to introduce one of the industry’s first Tactical Asset Allocation (TAA) models in institutional separately managed accounts. |
| |
| 1984 | | Wells Fargo Stagecoach Funds launches its first asset allocation fund. |
| |
| 1989 | | The Tactical Asset Allocation (TAA) Model is first applied to Wells Fargo’s asset allocation mutual funds. |
| |
| 1994 | | Wells Fargo introduces the LifePath Funds, one of the first suites of target date funds (now the Wells Fargo Advantage Dow Jones Target Date FundsSM). |
| |
| 1996 | | Evergreen Investments and Keystone Funds merge. |
| |
| 1997 | | Wells Fargo launches Wells Fargo Advantage WealthBuilder PortfoliosSM, a fund-of-funds suite of products that includes the use of quantitative models to shift assets among investment styles. |
| |
| 1999 | | Norwest Advantage Funds and Stagecoach Funds are reorganized into Wells Fargo Funds after the merger of Norwest and Wells Fargo. |
| |
| 2002 | | Evergreen Retail and Evergreen Institutional companies form the umbrella asset management company, Evergreen Investments. |
| |
| 2005 | | The integration of Strong Funds with Wells Fargo Funds creates Wells Fargo Advantage Funds, resulting in one of the top 20 mutual fund companies in the United States. |
| |
| 2006 | | Wells Fargo Advantage Funds relaunches the target date product line as Wells Fargo Advantage Dow Jones Target Date Funds. |
| |
| 2010 | | The mergers and reorganizations of Evergreen and Wells Fargo Advantage mutual funds are completed, unifying the families under the brand of Wells Fargo Advantage Funds. |
Wells Fargo Advantage Funds®
Wells Fargo Advantage Funds skillfully guides institutions, financial advisors, and individuals through the investment terrain to help them reach their financial objectives. Everything we do on behalf of investors is backed by our unique combination of qualifications.
Strength
Our organization is built on the standards of integrity and service established by our parent company—Wells Fargo & Company—more than 150 years ago. And, because we’re part of a highly diversified financial enterprise, we offer the depth of resources to help investors succeed.
Expertise
Our multi-boutique model offers investors access to the independent thinking of premier investment managers that have been chosen for their time-tested strategies. While each team specializes in a specific investment strategy, collectively they provide investors a wide choice of distinct investment styles. Our dedication to investment excellence doesn’t end with our expertise in manager selection—risk management, analysis, and rigorous ongoing review seek to ensure each manager’s investment process remains consistent.
Partnership
Our collaborative approach is built around understanding the needs and goals of our clients. By adhering to core principles of sound judgment and steady guidance, we support you through every stage of the investment decision process.
Carefully consider the investment objectives, risks, charges, and expenses before investing. For a current prospectus for Wells Fargo Advantage Funds containing this and other information, visit wellsfargo.com/advantagefunds. Read it carefully before investing.
Wells Fargo Funds Management, LLC, a wholly owned subsidiary of Wells Fargo & Company, provides investment advisory and administrative services for Wells Fargo Advantage Funds®. Other affiliates of Wells Fargo & Company provide subadvisory and other services for the Funds. The Funds are distributed by Wells Fargo Funds Distributor, LLC, Member FINRA/SIPC, an affiliate of Wells Fargo & Company.
The “Dow Jones Target Date Indexes” are a product of Dow Jones Indexes, a licensed trademark of CME Group Index Services LLC (“CME”). “Dow Jones” and “Dow Jones Target Date Indexes” are service marks of Dow Jones Trademark Holdings, LLC, and have been licensed for use for certain purposes by CME and sublicensed for use by Global Index Advisors, Inc., and Wells Fargo Funds Management, LLC. The Dow Jones Target Date Indexes are based in part on the Barclays Capital Bond Indexes, which are published by Barclays Capital Inc. The Wells Fargo Advantage Dow Jones Target Date Funds, based on the Dow Jones Target Date Indexes, are not sponsored, endorsed, sold, or promoted by Dow Jones, CME or Barclays Capital or any of their respective affiliates, and neither Dow Jones, CME nor Barclays Capital nor any of their respective affiliates makes any representation regarding the advisability of investing in such product(s) and/or about the quality, accuracy, and/or completeness of the Dow Jones Target Date Indexes or the Barclays Capital Bond Indexes. IN NO EVENT SHALL DOW JONES, CME, BARCLAYS CAPITAL, OR ANY OF THEIR LICENSORS HAVE ANY LIABILITY FOR ANY SPECIAL, PUNITIVE, INDIRECT, OR CONSEQUENTIAL DAMAGES (INCLUDING LOST PROFITS), EVEN IF NOTIFIED OF THE POSSIBILITY OF SUCH DAMAGES.
NOT FDIC INSURED § NO BANK GUARANTEE § MAY LOSE VALUE
Not part of the annual report.
Wells Fargo Advantage Funds offers more than 120 mutual funds across a wide range of asset classes, representing over $236 billion in assets under management, as of December 31, 2010.
| | | | | |
| Equity Funds | | | | |
| |
| Asia Pacific Fund | | Enterprise Fund† | | Opportunity Fund† |
| C&B Large Cap Value Fund | | Equity Value Fund | | Precious Metals Fund |
| C&B Mid Cap Value Fund | | Global Opportunities Fund | | Premier Large Company Growth Fund |
| Capital Growth Fund | | Growth Fund | | Small Cap Growth Fund |
| Classic Value Fund | | Growth Opportunities Fund | | Small Cap Opportunities Fund |
| Common Stock Fund | | Health Care Fund | | Small Cap Value Fund |
| Core Equity Fund | | Index Fund | | Small Company Growth Fund |
| Disciplined Global Equity Fund | | International Equity Fund | | Small Company Value Fund |
| Disciplined U.S. Core Fund | | International Value Fund | | Small/Mid Cap Core Fund |
| Disciplined Value Fund | | Intrinsic Small Cap Value Fund | | Small/Mid Cap Value Fund |
Discovery Fund† | | Intrinsic Value Fund | | Social Sustainability Fund† |
| Diversified Equity Fund | | Intrinsic World Equity Fund | | Special Mid Cap Value Fund |
| Diversified International Fund | | Large Cap Core Fund | | Special Small Cap Value Fund |
| Diversified Small Cap Fund | | Large Cap Growth Fund | | Specialized Technology Fund |
| Emerging Growth Fund | | Large Company Value Fund | | Strategic Large Cap Growth Fund |
| Emerging Markets Equity Fund | | Mid Cap Growth Fund | | Traditional Small Cap Growth Fund |
Endeavor Select Fund† | | Omega Growth Fund | | Utility and Telecommunications Fund |
| | | | | |
| Bond Funds | | | | |
| |
| Adjustable Rate Government Fund | | Inflation-Protected Bond Fund | | Short-Term Bond Fund |
| California Limited-Term Tax-Free Fund | | Intermediate Tax/AMT-Free Fund | | Short-Term High Yield Bond Fund |
| California Tax-Free Fund | | International Bond Fund | | Short-Term Municipal Bond Fund |
| Colorado Tax-Free Fund | | Minnesota Tax-Free Fund | | Strategic Municipal Bond Fund |
| Government Securities Fund | | Municipal Bond Fund | | Total Return Bond Fund |
| High Income Fund | | North Carolina Tax-Free Fund | | Ultra Short-Term Income Fund |
| High Yield Bond Fund | | Pennsylvania Tax-Free Fund | | Ultra Short-Term Municipal Income Fund |
| Income Plus Fund | | Short Duration Government Bond Fund | | Wisconsin Tax-Free Fund |
| | | | | |
| Asset Allocation Funds | | | | |
| |
| Asset Allocation Fund | | WealthBuilder Equity Portfolio† | | Target 2020 Fund† |
| Conservative Allocation Fund | | WealthBuilder Growth Allocation Portfolio† | | Target 2025 Fund† |
| Diversified Capital Builder Fund | | WealthBuilder Growth Balanced Portfolio† | | Target 2030 Fund† |
| Diversified Income Builder Fund | | WealthBuilder Moderate Balanced Portfolio† | | Target 2035 Fund† |
| Growth Balanced Fund | | WealthBuilder Tactical Equity Portfolio† | | Target 2040 Fund† |
| Index Asset Allocation Fund | | Target Today Fund† | | Target 2045 Fund† |
| Moderate Balanced Fund | | Target 2010 Fund† | | Target 2050 Fund† |
WealthBuilder Conservative Allocation Portfolio† | | Target 2015 Fund† | | |
| | | | | |
| Money Market Funds | | | | |
| |
| 100% Treasury Money Market Fund | | Minnesota Money Market Fund | | New Jersey Municipal Money Market Fund |
| California Municipal Money Market Fund | | Money Market Fund | | New York Municipal Money Market Fund |
| Cash Investment Money Market Fund | | Municipal Cash Management Money Market Fund | | Pennsylvania Municipal Money Market Fund |
| Government Money Market Fund | | Municipal Money Market Fund | | Prime Investment Money Market Fund |
Heritage Money Market Fund† | | National Tax-Free Money Market Fund | | Treasury Plus Money Market Fund |
| | | | | |
| Variable Trust Funds1 | | | | |
| |
| VT Core Equity Fund | | VT Intrinsic Value Fund | | VT Small Cap Value Fund |
VT Discovery Fund† | | VT Omega Growth Fund | | VT Total Return Bond Fund |
| VT Index Asset Allocation Fund | | VT Opportunity Fund† | | |
| VT International Equity Fund | | VT Small Cap Growth Fund | | |
An investment in a money market fund is not insured or guaranteed by the Federal Deposit Insurance Corporation or any other government agency. Although the Wells Fargo Advantage Money Market Funds seek to preserve the value of your investment at $1.00 per share, it is possible to lose money by investing in a money market fund.
| | |
| 1. | | The Variable Trust Funds are generally available only through insurance company variable contracts. |
| |
| † | | In this report, the Wells Fargo Advantage Discovery FundSM, Wells Fargo Advantage Endeavor Select FundSM, Wells Fargo Advantage Enterprise FundSM, Wells Fargo Advantage Opportunity FundSM, Wells Fargo Advantage Social Sustainability FundSM, Wells Fargo Advantage WealthBuilder Conservative Allocation PortfolioSM, Wells Fargo Advantage WealthBuilder Equity PortfolioSM, Wells Fargo Advantage WealthBuilder Growth Allocation PortfolioSM, Wells Fargo Advantage WealthBuilder Growth Balanced PortfolioSM, Wells Fargo Advantage WealthBuilder Moderate Balanced PortfolioSM, Wells Fargo Advantage WealthBuilder Tactical Equity PortfolioSM, Wells Fargo Advantage Dow Jones Target Today FundSM, Wells Fargo Advantage Dow Jones Target 2010 FundSM, Wells Fargo Advantage Dow Jones Target 2015 FundSM, Wells Fargo Advantage Dow Jones Target 2020 FundSM, Wells Fargo Advantage Dow Jones Target 2025 FundSM, Wells Fargo Advantage Dow Jones Target 2030 FundSM, Wells Fargo Advantage Dow Jones Target 2035 FundSM, Wells Fargo Advantage Dow Jones Target 2040 FundSM, Wells Fargo Advantage Dow Jones Target 2045 FundSM, Wells Fargo Advantage Dow Jones Target 2050 FundSM, Wells Fargo Advantage Heritage Money Market FundSM, Wells Fargo Advantage VT Discovery FundSM, and Wells Fargo Advantage VT Opportunity FundSM are referred to as the Discovery Fund, Endeavor Select Fund, Enterprise Fund, Opportunity Fund, Social Sustainability Fund, WealthBuilder Conservative Allocation Portfolio, WealthBuilder Equity Portfolio, WealthBuilder Growth Allocation Portfolio, WealthBuilder Growth Balanced Portfolio, WealthBuilder Moderate Balanced Portfolio, WealthBuilder Tactical Equity Portfolio, Target Today Fund, Target 2010 Fund, Target 2015 Fund, Target 2020 Fund, Target 2025 Fund, Target 2030 Fund, Target 2035 Fund, Target 2040 Fund, Target 2045 Fund, Target 2050 Fund, Heritage Money Market Fund, VT Discovery Fund, and VT Opportunity Fund, respectively. |
Not part of the annual report.
| | |
| 2 Wells Fargo Advantage VT Core Equity Fund | | Letter to Shareholders |

Karla M. Rabusch,
President
Wells Fargo Advantage Funds
The equity markets delivered strong full-year returns against the backdrop of a strengthening economy.
Dear Valued Shareholder:
We are pleased to provide you with this annual report for the Wells Fargo Advantage VT Core Equity Fund for the 12 months that ended December 31, 2010. The equity markets delivered strong full-year returns against the backdrop of a strengthening economy. However, the year was not without its share of macroeconomic challenges and market volatility, once again highlighting the value of a sound, well-diversified investment strategy. As always, we believe that such a strategy can enable investors to balance risks and opportunities as they pursue long-term financial goals in a dynamic market environment.
The economic recovery stayed on track.
The U.S. economic recovery that began in the summer of 2009 gained momentum in 2010, particularly toward the end of the year. Gross domestic product (GDP) grew at an annualized rate of 3.2% in the fourth quarter of 2010—capping a streak of six consecutive quarters of positive GDP growth—and 2.9% for the full year. Although the path of recovery has been uneven at times and growth remains subpar compared with previous recoveries, the general consensus among economists is that the economy will likely avoid a double-dip recession. That said, persistent weakness in the labor and housing markets bears close watching in the months ahead.
Jobs and housing remained troublesome.
At the end of the year, the unemployment rate stood at 9.4%, down from 9.9% a year earlier, but still stubbornly high. Unfortunately, the drop may be attributable more to a decline in the labor force than a meaningful uptick in hiring. In fact, employers added just 1.1 million jobs for all of 2010, suggesting that the improving economy has yet to translate into widespread hiring. Meanwhile, the beleaguered housing market was an ongoing source of concern, despite some tentative late-year signs of stabilization.
Other economic data were more encouraging, reflecting greater confidence in the recovery on the part of both consumers and businesses. Retail sales came in strong at certain points during the year, including the critical holiday shopping season, and industrial production and new orders have picked up. Although still reluctant to hire, businesses have gradually increased spending in other areas, such as equipment and technology. Core inflation, which excludes volatile food and energy prices, remained benign.
The Fed continued to do its part.
With inflation subdued, the Federal Reserve (the Fed) held its target range for the federal funds rate—a proxy for short-term interest rates—steady at 0% to 0.25%. In its final statement of 2010, the Fed noted that economic expansion continues to be restrained by headwinds such as high unemployment, modest income growth, lower housing wealth, and tight credit. As a result, the Fed indicated that it intends to keep short-term rates at historically low levels for as long as needed to promote a more robust recovery.
| | |
| Letter to Shareholders | | Wells Fargo Advantage VT Core Equity Fund 3 |
The Fed also stated that it plans to proceed with other stimulus measures, including its second round of quantitative easing (QE2)—a plan to purchase $600 billion in long-term Treasury securities by mid-2011. The ‘preannouncement’ of QE2 in the third quarter of 2010 marked a turning point for the equity markets in that it ushered in a favorable shift in investor sentiment. By and large, investors interpreted the plan as further evidence of the Fed’s commitment to avoiding deflation and spurring economic growth.
2010 was another solid year for equities.
QE2 was certainly not the only catalyst for the equity markets during 2010. Along with more upbeat economic data, better-than-expected corporate earnings power played a role in driving stock prices higher. Throughout the year, quarterly earnings per share for the majority of companies in the S&P 500 Index consistently exceeded Wall Street estimates. As 2010 drew to a close, the midterm congressional elections and the extension of the Bush-era tax cuts provided additional tailwinds, helping the markets finish the year on a strong note.
It was the second straight year of double-digit total returns for the broad equity market indexes. The S&P 500 Index and the Dow Jones Industrial Average advanced 15.1% and 14.1%, respectively, while the tech-heavy NASDAQ Composite Index returned 18.2%. Investors were generally rewarded across the market-capitalization spectrum—with small- and mid-cap stocks outpacing large-cap stocks—as well as across most economic sectors. In terms of investment styles, growth stocks outperformed their value counterparts for the year.
To be sure, the gains were hard-earned, as the markets had to contend with numerous issues along the way, including the European sovereign debt crisis, China’s efforts to slow growth, and doubts about the sustainability of the domestic recovery. The second quarter in particular witnessed bouts of heightened market volatility, most notably the so-called “flash crash” in May. As the year progressed, however, volatility—as measured by the Chicago Board Options Exchange Volatility Index—abated amid reduced fears of a double-dip recession.
Investors should keep a long-term perspective.
In our view, the equity markets’ dramatic rebound over the past two years from a severe downturn underscores the importance of maintaining a disciplined, long-term investment strategy through changing market cycles. By staying focused on your long-term goals, you may be better positioned both to navigate falling markets and participate in rising markets.
To help you build a well-diversified strategy based on your personal objectives and risk tolerance, Wells Fargo Advantage Funds® offers more than 120 mutual funds and other investments covering a wide range of asset classes and investment styles. Although diversification cannot guarantee an investment profit or prevent losses, we believe it can be an effective way to manage investment risk and potentially smooth out overall portfolio performance.
Along with more upbeat economic data, better-than-expected corporate earnings power played a role in driving stock prices higher.
| | |
| 4 Wells Fargo Advantage VT Core Equity Fund | | Letter to Shareholders |
Thank you for choosing Wells Fargo Advantage Funds. We appreciate your continued confidence in us and are committed to helping you meet your financial needs. If you have any questions about your investments, please contact your investment professional, call us at 1-800-222-8222, or visit wellsfargo.com/advantagefunds.
Sincerely,
Karla M. Rabusch
President
Wells Fargo Advantage Funds
This page is intentionally left blank.
| | |
| 6 Wells Fargo Advantage VT Core Equity Fund | | Performance Highlights (Unaudited) |
Wells Fargo Advantage VT Core Equity Fund
INVESTMENT OBJECTIVE
The Fund seeks long-term capital appreciation.
INVESTMENT ADVISER
Wells Fargo Funds Management, LLC
SUB-ADVISER
Wells Capital Management Incorporated
PORTFOLIO MANAGER
Ann M. Miletti
FUND INCEPTION
March 1, 1996
PERFORMANCE SUMMARY
12 MONTH TOTAL RETURN AS OF DECEMBER 31, 2010
| | | | | |
|
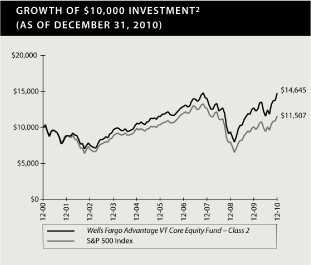
| Class 2 | | | 16.18 | % |
S&P 500® Index1 | | | 15.06 | % |
Figures quoted represent past performance, which is no guarantee of future results and do not reflect the deduction of taxes that a shareholder may pay on fund distributions or the redemption of fund shares. Investment return and principal value of an investment will fluctuate so that an investor’s shares, when redeemed, may be worth more or less than their original cost. Current performance may be lower or higher than the performance data quoted. Current month-end performance is available by calling 1-866-765-0778. Performance figures of the Fund do not reflect fees charged pursuant to the terms of variable life insurance policies and variable annuity contracts.
The adviser has committed, through July 18, 2013, to waive fees and/or reimburse expenses to maintain the contractual expense cap at 1.00% for the Class 2 shares, excluding acquired fund fees and certain other expenses. Without these reductions, the Fund’s returns would have been lower. The Fund’s net expense ratio is 1.00% for the Class 2 shares. The Fund’s gross expense ratio is 1.02% for the Class 2 shares.
| | |
| 1. | | The S&P 500® Index consists of 500 stocks chosen for market size, liquidity, and industry group representation. It is a market-value weighted index with each stock’s weight in the index proportionate to its market value. You cannot invest directly in an index. |
| |
| 2. | | The chart compares the performance of the Wells Fargo Advantage VT Core Equity Fund Class 2 for the most recent ten years of the Fund with the S&P 500® Index. The chart assumes a hypothetical $10,000 investment and reflects all operating expenses of the Fund. |
| | |
| Performance Highlights (Unaudited) | | Wells Fargo Advantage VT Core Equity Fund 7 |
Wells Fargo Advantage VT Core Equity Fund (continued)
MANAGER’S DISCUSSION
Fund Highlights Fiscal Year 2010
| § | | The Fund outperformed its benchmark, the S&P 500 Index, for the 12-month period that ended December 31, 2010. |
| |
| § | | Stock selection within the consumer discretionary and information technology sectors more than offset a drag on results within the financials sector. |
| |
| § | | Leading contributors to the Fund’s performance were Ancestry.com, CBS Corporation, Amazon.com, and Burger King Holdings. Detractors from performance included Bank of America Corporation and Moody’s Corporation, as well as a lack of exposure to Apple Incorporated. |
| |
| § | | On December 27, 2010, the Wells Capital Management Core Equity team, led by Ann M. Miletti, assumed portfolio management responsibilities for the Fund. |
Our emphasis on companies with solid fundamentals and sustainable competitive advantages was favored by the market.
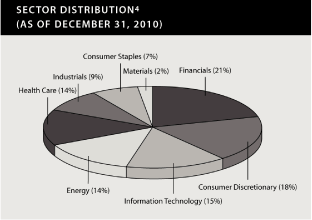
The Fund outperformed its benchmark during three of the last four quarters. Excess returns were particularly notable during March and September 2010, as our emphasis on companies with solid fundamentals and sustainable competitive advantages was favored by the market. At the sector level, outperformance has been concentrated within the consumer discretionary and information technology sectors.
An overweight to and stock selection within consumer discretionary aided results. For example, Amazon.com benefited from increased e-commerce penetration. Online sales still account for only 6% to 8% of total retail sales but are growing at a nearly 15% annual rate. Amazon.com has capitalized on this trend by increasing its market share at the expense of traditional brick-and-mortar retailers, which typically have lower inventory turnover and higher cost structures.
Information technology holdings also aided results through investments in companies such as FactSet Research Systems and Ancestry.com. In our opinion, Ancestry.com has proven that it is a sticky, sustainable business. It has been accelerating its subscriber growth by about 30%, which is primarily due to increased awareness created by its advertising campaign in TV media. Also, the company has recently retired debt, further strengthening its balance sheet. FactSet offers a one-stop shop for an investor who wants to perform in-depth market and company research. Its share price benefited from the company’s extraordinarily high retention rate of 95%, its better-than-expected earnings during each of the last four quarters, and its ability to maintain a strong growth rate in a weak market.
TEN LARGEST EQUITY HOLDINGS3
(AS OF DECEMBER 31, 2010)
| | | | | |
|
| QUALCOMM Incorporated | | | 4.29 | % |
| Moody’s Corporation | | | 3.34 | % |
| CBS Corporation Class B | | | 3.33 | % |
| Bank of America Corporation | | | 2.85 | % |
| Merck & Company Incorporated | | | 2.82 | % |
| Home Depot Incorporated | | | 2.72 | % |
| Pfizer Incorporated | | | 2.64 | % |
| JPMorgan Chase & Company | | | 2.52 | % |
| Amazon.com Incorporated | | | 2.50 | % |
| Exxon Mobil Corporation | | | 2.35 | % |
| | |
| 3. | | The ten largest equity holdings are calculated based on the value of the securities divided by total investments of the Fund. Holdings are subject to change and may have changed since the date specified. |
| | |
| 8 Wells Fargo Advantage VT Core Equity Fund | | Performance Highlights (Unaudited) |
Wells Fargo Advantage VT Core Equity Fund (continued)
A longer-term focus on company fundamentals held back additional gains, particularly around mid-year.
Despite the Fund’s outperformance over the past 12 months, the trailing returns of the second quarter resulted from the team’s unwillingness to follow negative, near-term market sentiment when its longer-term investment thesis had not changed. An example of this phenomenon during the year was Bank of America, which was a detractor from performance in the portfolio. The market appeared to discount the stock to extremely cheap levels, believing that it had capital issues and ill-timed acquisitions over the past couple of years. Uncertainty regarding financial reform was an additional headwind for the stock. In contrast to the broader market, we recognized long-term value in the firm’s national branch footprint and its strong Merrill Lynch global franchise.
As broad economic conditions improve, companies that have positioned themselves to take advantage of secular trends and tailwinds are likely to grow profits.
We feel better about the market outlook following the November elections and expect the political landscape to be less anti-business going into 2011. However, we believe that the U.S. will experience slightly slower growth than normal in the coming year because of high unemployment and other significant structural problems. In an effort to avoid a deep recession, policymakers and legislators have driven the deficit to $1.3 trillion and have applied quantitative easing that could potentially spur inflation. Eventually, the country will be challenged with addressing this deficit.
In the meantime, as broad economic conditions improve, companies that have positioned themselves to take advantage of secular trends are likely to grow profits. We expect to see those companies that have internal drivers—such as new management, new products, and new sources of demand—generate positive excess returns.
On a stock-by-stock basis, there are many attractively valued companies that offer sustainable competitive advantages in a slow-growth environment. Our investment approach is designed to fundamentally value a business, taking into consideration several assessments, including its competitive positioning and growth catalysts. Regardless of the environment in 2011 and beyond, we believe that our investment process allows us to exploit “market emotion” over short-term periods in order to capture relative value from attractive opportunities.
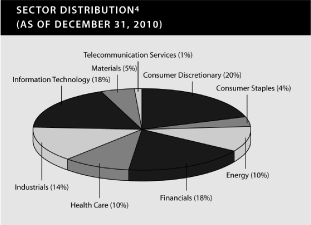
| | |
| 4. | | Sector distribution is subject to change and is calculated based on the total common stock investments of the Fund. |
| | |
| Performance Highlights (Unaudited) | | Wells Fargo Advantage VT Core Equity Fund 9 |
Wells Fargo Advantage VT Core Equity Fund (continued)
AVERAGE ANNUAL TOTAL RETURN (%) (AS OF DECEMBER 31, 2010)5
| | | | | | | | | | | | | | | | | | | | | | | | | | | | | |
| | | Inception | | | | | | | | | | | | | | | | | | Expense Ratios6 |
| | | Date | | 6 Months* | | 1 Year | | 5 Year | | 10 Year | | Gross | | Net7 |
| |
| Class 1 | | | 3/1/1996 | | | | 27.65 | | | | 16.46 | | | | 5.36 | | | | 4.10 | | | | 0.77 | % | | | 0.75 | % |
| Class 2 | | | 7/31/2002 | | | | 27.54 | | | | 16.18 | | | | 5.10 | | | | 3.89 | | | | 1.02 | % | | | 1.00 | % |
S&P 500® Index1 | | | | | | | 23.27 | | | | 15.06 | | | | 2.29 | | | | 1.41 | | | | | | | | | |
| | |
| * | | Returns for periods of less than one year are not annualized. |
Figures quoted represent past performance, which is no guarantee of future results and do not reflect the deduction of taxes that a shareholder may pay on fund distributions or the redemption of fund shares. Investment return and principal value of an investment will fluctuate so that an investor’s shares, when redeemed, may be worth more or less than their original cost. Current performance may be lower or higher than the performance data quoted. Current month-end performance is available by calling 1-866-765-0778. Performance figures of the Fund do not reflect fees charged pursuant to the terms of variable life insurance policies and variable annuity contracts.
Stock fund values fluctuate in response to the activities of individual companies and general market and economic conditions. The use of derivatives may reduce returns and/or increase volatility. Certain investment strategies tend to increase the total risk of an investment (relative to the broader market). This Fund is exposed to foreign investment risk. Consult the Fund’s prospectus for additional information on these and other risks.
Please refer to the prospectus provided by your participating insurance company for detailed information describing the separate accounts for information regarding surrender charges, mortality and expense risk fees and other charges that may be assessed by the participating insurance companies.
| | |
| 5. | | Performance shown for Class 2 shares prior to its inception reflects the performance of Class 1 shares, adjusted to reflect the higher expenses applicable to Class 2 shares. Historical performance shown for all classes of the Fund prior to July 19, 2010 is based on the performance of the fund’s predecessor, Evergreen VA Fundamental Large Cap Fund. |
| |
| 6. | | Reflects the expense ratio as stated in the July 19, 2010 prospectuses. |
| |
| 7. | | The investment adviser has contractually committed through July 18, 2013 to waive fees and/or reimburse expenses to maintain the Fund’s contractual expense ratio for Class 1 shares at 0.75%, and for Class 2 shares at 1.00%, excluding acquired fund fees and certain other expenses. Without these reductions, the Fund’s returns would have been lower. |
| | |
| 10 Wells Fargo Advantage VT Core Equity Fund | | Fund Expenses (Unaudited) |
As a shareholder of the Fund, you incur two types of costs: (1) transaction costs, including sales charges (loads) on purchase payments, redemption fees (if any) and exchange fees (if any); and (2) ongoing costs, including management fees; distribution (12b-1) and/or shareholder service fees; and other Fund expenses. This example is intended to help you understand your ongoing costs (in dollars) of investing in the Fund and to compare these costs with the ongoing costs of investing in other mutual funds.
The example is based on an investment of $1,000 invested at the beginning of the six-month period and held for the entire period from July 1, 2010 to December 31, 2010.
Actual expenses
The “Actual” line of the table below provides information about actual account values and actual expenses. You may use the information in this line, together with the amount you invested, to estimate the expenses that you paid over the period. Simply divide your account value by $1,000 (for example, an $8,600 account value divided by $1,000 = 8.6), then multiply the result by the number in the “Actual” line under the heading entitled “Expenses Paid During Period” for your applicable class of shares to estimate the expenses you paid on your account during this period.
Hypothetical example for comparison purposes
The “Hypothetical” line of the table below provides information about hypothetical account values and hypothetical expenses based on the Fund’s actual expense ratio and an assumed rate of return of 5% per year before expenses, which is not the Fund’s actual return. The hypothetical account values and expenses may not be used to estimate the actual ending account balance or expenses you paid for the period. You may use this information to compare the ongoing costs of investing in the Fund and other funds. To do so, compare this 5% hypothetical example with the 5% hypothetical examples that appear in the shareholder reports of the other funds.
Please note that the expenses shown in the table are meant to highlight your ongoing costs only and do not reflect any transactional costs, such as sales charges (loads), redemption fees, exchange fees or separate account charges assessed by participating insurance companies. Therefore, the “Hypothetical” line of the table is useful in comparing ongoing costs only, and will not help you determine the relative total costs of owning different funds. In addition, if these transactional costs were included, your costs would have been higher.
| | | | | | | | | | | | | | | | | |
| | | Beginning | | Ending | | Expenses | | |
| | | Account Value | | Account Value | | Paid During | | Net Annual |
| | | 07-01-2010 | | 12-31-2010 | | the Period1 | | Expense Ratio |
| |
Class 1 | | | | | | | | | | | | | | | | |
| Actual | | $ | 1,000.00 | | | $ | 1,276.47 | | | $ | 4.41 | | | | 0.76 | % |
| Hypothetical (5% return before expenses) | | $ | 1,000.00 | | | $ | 1,021.61 | | | $ | 3.91 | | | | 0.76 | % |
Class 2 | | | | | | | | | | | | | | | | |
| Actual | | $ | 1,000.00 | | | $ | 1,275.41 | | | $ | 5.80 | | | | 1.00 | % |
| Hypothetical (5% return before expenses) | | $ | 1,000.00 | | | $ | 1,020.38 | | | $ | 5.15 | | | | 1.00 | % |
| | |
| 1. | | Expenses are equal to the Fund’s annualized expense ratio multiplied by the average account value over the period, multiplied by the number of days in the most recent fiscal half-year divided by the number of days in the fiscal year (to reflect the one-half year period). |
| | |
| Portfolio of Investments—December 31, 2010 | | Wells Fargo Advantage VT Core Equity Fund 11 |
| | | | | | | | | |
| Shares | | Security Name | | Value | |
| Common Stocks: 95.78% | | | | |
| | | | | | | | | |
| Consumer Discretionary: 17.60% | | | | |
| | | | | | | | | |
| Hotels, Restaurants & Leisure: 0.99% | | | | |
| | 53,782 | | | International Speedway Corporation Class A | | $ | 1,407,475 | |
| | | | | | | | |
| | | | | | | | | |
| Internet & Catalog Retail: 5.26% | | | | |
| | 23,105 | | | Amazon.com Incorporated† | | | 4,158,900 | |
| | 58,383 | | | Blue Nile Incorporated†« | | | 3,331,334 | |
| | | | | | | | | |
| | | | | | | | 7,490,234 | |
| | | | | | | | |
| | | | | | | | | |
| Media: 5.75% | | | | |
| | 290,914 | | | CBS Corporation Class B | | | 5,541,912 | |
| | 57,677 | | | Omnicom Group Incorporated« | | | 2,641,607 | |
| | | | | | | | | |
| | | | | | | | 8,183,519 | |
| | | | | | | | |
| | | | | | | | | |
| Specialty Retail: 4.21% | | | | |
| | 129,087 | | | Home Depot Incorporated« | | | 4,525,790 | |
| | 58,865 | | | Lowe’s Companies Incorporated | | | 1,476,334 | |
| | | | | | | | | |
| | | | | | | | 6,002,124 | |
| | | | | | | | |
| | | | | | | | | |
| Textiles, Apparel & Luxury Goods: 1.39% | | | | |
| | 80,263 | | | Timberland Company† | | | 1,973,667 | |
| | | | | | | | |
| | | | | | | | | |
| Consumer Staples: 6.49% | | | | |
| | | | | | | | | |
| Beverages: 2.28% | | | | |
| | 106,028 | | | Diageo plc | | | 1,958,902 | |
| | 19,723 | | | PepsiCo Incorporated | | | 1,288,504 | |
| | | | | | | | | |
| | | | | | | | 3,247,406 | |
| | | | | | | | |
| | | | | | | | | |
| Food Products: 0.76% | | | | |
| | 23,339 | | | McCormick & Company Incorporated« | | | 1,085,964 | |
| | | | | | | | |
| |
| Household Products: 2.23% | | | | |
| | 29,711 | | | Clorox Company | | | 1,880,112 | |
| | 20,092 | | | Procter & Gamble Company | | | 1,292,518 | |
| | | | | | | | | |
| | | | | | | | 3,172,630 | |
| | | | | | | | |
| | | | | | | | | |
| Tobacco: 1.22% | | | | |
| | 29,584 | | | Philip Morris International | | | 1,731,552 | |
| | | | | | | | |
| | | | | | | | | |
| Energy: 13.28% | | | | |
| | | | | | | | | |
| Energy Equipment & Services: 2.47% | | | | |
| | 42,056 | | | Schlumberger Limited | | | 3,511,676 | |
| | | | | | | | |
| | | | | | | | | |
| Oil, Gas & Consumable Fuels: 10.81% | | | | |
| | 26,033 | | | Apache Corporation | | | 3,103,915 | |
| | 40,548 | | | Chevron Corporation | | | 3,700,005 | |
| | 53,035 | | | Exxon Mobil Corporation | | | 3,877,919 | |
| | 26,539 | | | Occidental Petroleum Corporation† | | | 2,603,476 | |
| | 44,076 | | | Ultra Petroleum Corporation†« | | | 2,105,511 | |
| | | | | | | | | |
| | | | | | | | 15,390,826 | |
| | | | | | | | |
| | |
| 12 Wells Fargo Advantage VT Core Equity Fund | | Portfolio of Investments—December 31, 2010 |
| | | | | | | | | |
| Shares | | Security Name | | Value | |
| Financials: 19.65% | | | | |
| | | | | | | | | |
| Capital Markets: 6.04% | | | | |
| | 18,468 | | | Goldman Sachs Group Incorporated | | $ | 3,105,579 | |
| | 79,503 | | | State Street Corporation | | | 3,684,169 | |
| | 28,068 | | | T. Rowe Price Group Incorporated« | | | 1,811,509 | |
| | | | | | | | | |
| | | | | | | | 8,601,257 | |
| | | | | | | | |
| | | | | | | | | |
| Consumer Finance: 1.38% | | | | |
| | 45,848 | | | American Express Company | | | 1,967,796 | |
| | | | | | | | |
| | | | | | | | | |
| Diversified Financial Services: 10.67% | | | | |
| | 87,285 | | | Apollo Management LP†(i)†† | | | 698,280 | |
| | 355,539 | | | Bank of America Corporation | | | 4,742,890 | |
| | 98,731 | | | JPMorgan Chase & Company | | | 4,188,169 | |
| | 209,292 | | | Moody’s Corporation | | | 5,554,610 | |
| | | | | | | | | |
| | | | | | | | 15,183,949 | |
| | | | | | | | |
| | | | | | | | | |
| Insurance: 1.56% | | | | |
| | 37,722 | | | Prudential Financial Incorporated | | | 2,214,659 | |
| | | | | | | | |
| | | | | | | | | |
| Health Care: 13.11% | | | | |
| | | | | | | | | |
| Biotechnology: 2.70% | | | | |
| | 70,031 | | | Amgen Incorporated† | | | 3,844,702 | |
| | | | | | | | |
| | | | | | | | | |
| Health Care Equipment & Supplies: 1.22% | | | | |
| | 46,760 | | | Medtronic Incorporated | | | 1,734,328 | |
| | | | | | | | |
| | | | | | | | | |
| Pharmaceuticals: 9.19% | | | | |
| | 21,692 | | | Johnson & Johnson Company | | | 1,341,650 | |
| | 129,901 | | | Merck & Company Incorporated | | | 4,681,632 | |
| | 45,346 | | | Novartis AG ADR« | | | 2,673,147 | |
| | 250,808 | | | Pfizer Incorporated | | | 4,391,648 | |
| | | | | | | | | |
| | | | | | | | 13,088,077 | |
| | | | | | | | |
| | | | | | | | | |
| Industrials: 9.15% | | | | |
| | | | | | | | | |
| Aerospace & Defense: 2.02% | | | | |
| | 23,074 | | | Boeing Company | | | 1,505,809 | |
| | 17,381 | | | United Technologies Corporation | | | 1,368,232 | |
| | | | | | | | | |
| | | | | | | | 2,874,041 | |
| | | | | | | | |
| | | | | | | | | |
| Air Freight & Logistics: 1.28% | | | | |
| | 25,141 | | | United Parcel Service Incorporated Class B« | | | 1,824,734 | |
| | | | | | | | |
| | | | | | | | | |
| Commercial Services & Supplies: 3.97% | | | | |
| | 73,688 | | | Avery Dennison Corporation« | | | 3,119,950 | |
| | 82,592 | | | Robert Half International Incorporated« | | | 2,527,315 | |
| | | | | | | | | |
| | | | | | | | 5,647,265 | |
| | | | | | | | |
| | | | | | | | | |
| Industrial Conglomerates: 1.88% | | | | |
| | 146,588 | | | General Electric Company | | | 2,681,095 | |
| | | | | | | | |
| | |
| Portfolio of Investments—December 31, 2010 | | Wells Fargo Advantage VT Core Equity Fund 13 |
| | | | | | | | | |
| Shares | | Security Name | | Value | |
| Information Technology: 14.71% | | | | |
| | | | | | | | | |
| Communications Equipment: 5.96% | | | | |
| | 67,007 | | | Cisco Systems Incorporated†« | | $ | 1,355,552 | |
| | 143,973 | | | QUALCOMM Incorporated | | | 7,125,224 | |
| | | | | | | | | |
| | | | | | | | 8,480,776 | |
| | | | | | | | |
| | | | | | | | | |
| Internet Software & Services: 3.75% | | | | |
| | 68,575 | | | Ancestry.com Incorporated† | | | 1,942,044 | |
| | 5,716 | | | Google Incorporated Class A† | | | 3,395,133 | |
| | | | | | | | | |
| | | | | | | | 5,337,177 | |
| | | | | | | | |
| | | | | | | | | |
| IT Services: 0.73% | | | | |
| | 14,825 | | | Visa Incorporated Class A | | | 1,043,384 | |
| | | | | | | | |
| | | | | | | | | |
| Software: 4.27% | | | | |
| | 11,104 | | | FactSet Research Systems Incorporated« | | | 1,041,111 | |
| | 9,500 | | | Nintendo Company Limited | | | 2,788,336 | |
| | 71,620 | | | Oracle Corporation | | | 2,241,701 | |
| | | | | | | | | |
| | | | | | | | 6,071,148 | |
| | | | | | | | |
| | | | | | | | | |
| Materials: 1.79% | | | | |
| | | | | | | | | |
| Chemicals: 1.79% | | | | |
| | 28,011 | | | Air Products & Chemicals Incorporated | | | 2,547,600 | |
| | | | | | | | |
| | | | | | | | | |
| Total Common Stocks (Cost $107,632,666) | | | 136,339,061 | |
| | | | | | | | |
| | | | | | | | | |
| | | | | | | | | | | | | | | | | |
| Principal | | | | | Interest Rate | | | Maturity Date | | | | | |
| Short-Term Investments: 20.98% | | | | | | | | | | | | |
| | | | | | | | | | | | | | | | | |
| Corporate Bonds and Notes: 0.02% | | | | | | | | | | | | |
| $ | 24,876 | | | Gryphon Funding Limited(v)(a)(i) | | | 0.00 | % | | | 08/05/2011 | | | | 10,104 | |
| | 32,721 | | | VFNC Corporation(v)±††(a)(i) | | | 0.26 | | | | 09/29/2011 | | | | 18,324 | |
| | | | | | | | | | | | | | | | | |
| | | | | | | | | | | | | | | | 28,428 | |
| | | | | | | | | | | | | | | | |
| | | | | | | | | | | | | | | | | |
| Shares | | | | | Yield | | | | | | | | | |
| Investment Companies: 20.96% | | | | | | | | | | | | |
| | 4,198,369 | | | Wells Fargo Advantage Cash Investment Money Market Fund(l)(u) | | | 0.14 | | | | | | | | 4,198,369 | |
| | 25,635,656 | | | Wells Fargo Securities Lending Cash Investments, LLC(v)(l)(u) | | | 0.27 | | | | | | | | 25,635,656 | |
| | | | | | | | | | | | | | | | | |
| | | | | | | | | | | | | | | | 29,834,025 | |
| | | | | | | | | | | | | | | | |
| | | | | | | | | | | | | | | | | |
| Total Short-Term Investments (Cost $29,852,021) | | | | | | | | | | | 29,862,453 | |
| | | | | | | | | | | | | | | | |
| | | | | | | | | | | | | | | | | |
| | | | | | | | | | | | | | | | | |
Total Investments in Securities
(Cost $137,484,687)* | | | 116.76 | % | | | | | | | 166,201,514 | |
| Other Assets and Liabilities, Net | | | (16.76 | ) | | | | | | | (23,850,867 | ) |
| | | | | | | | | | | | | | | |
| Total Net Assets | | | 100.00 | % | | | | | | $ | 142,350,647 | |
| | | | | | | | | | | | | | | |
| | |
| 14 Wells Fargo Advantage VT Core Equity Fund | | Portfolio of Investments—December 31, 2010 |
| | |
| (v) | | Security represents investment of cash collateral received from securities on loan. |
| |
| † | | Non-income earning securities. |
| |
| (l) | | Investment in an affiliate. |
| |
| « | | All or a portion of this security is on loan. |
| |
| ± | | Variable rate investments. |
| |
| †† | | Securities that may be resold to “qualified institutional buyers” under Rule 144A or securities offered pursuant to Section 4(2) of the Securities Act of 1933, as amended. |
| |
| (a) | | Security is fair valued by the Management Valuation Team, and in certain instances by the Board of Trustees, in accordance with procedures approved by the Board of Trustees. |
| |
| (i) | | Illiquid security for which the designation as illiquid is unaudited. |
| |
| (u) | | Rate shown is the 7-day annualized yield at period end. |
| |
| * | | Cost for federal income tax purposes is $137,935,641 and net unrealized appreciation (depreciation) consists of: |
| | | | | |
|
| Gross unrealized appreciation | | $ | 33,362,958 | |
| Gross unrealized depreciation | | | (5,097,085 | ) |
| | | | | |
| Net unrealized appreciation | | $ | 28,265,873 | |
The accompanying notes are an integral part of these financial statements.
| | |
| Statement of Assets and Liabilities—December 31, 2010 | | Wells Fargo Advantage VT Core Equity Fund 15 |
| | | | | |
| Assets | | | | |
| Investments | | | | |
| In unaffiliated securities (including securities on loan), at value | | $ | 136,367,489 | |
| In affiliated securities, at value | | | 29,834,025 | |
| | | | |
| Total investments, at value (see cost below) | | | 166,201,514 | |
| Receivable for investments sold | | | 1,913,849 | |
| Receivable for Fund shares sold | | | 912 | |
| Receivable for dividends | | | 173,040 | |
| Receivable for securities lending income | | | 5,249 | |
| Prepaid expenses and other assets | | | 1,770 | |
| | | | |
| Total assets | | | 168,296,334 | |
| | | | |
| | | | | |
Liabilities | | | | |
| Payable for Fund shares redeemed | | | 134,048 | |
| Payable upon receipt of securities loaned | | | 25,653,651 | |
| Investment advisory fee payable | | | 70,849 | |
| Distribution fees payable | | | 13,775 | |
| Due to other related parties | | | 17,074 | |
| Accrued expenses and other liabilities | | | 56,290 | |
| | | | |
| Total liabilities | | | 25,945,687 | |
| | | | |
Total net assets | | $ | 142,350,647 | |
| | | | |
| | | | | |
NET ASSETS CONSIST OF | | | | |
| Paid-in capital | | $ | 112,007,186 | |
| Undistributed net investment income | | | 487,722 | |
| Accumulated net realized gains on investments | | | 1,138,912 | |
| Net unrealized gains on investments | | | 28,716,827 | |
| | | | |
Total net assets | | $ | 142,350,647 | |
| | | | |
| | | | | |
COMPUTATION OF NET ASSET VALUE PER SHARE1 | | | | |
| Net assets — Class 1 | | $ | 54,604,794 | |
| Shares outstanding — Class 1 | | | 2,754,835 | |
| Net asset value per share — Class 1 | | $ | 19.82 | |
| Net assets — Class 2 | | $ | 87,745,853 | |
| Shares outstanding — Class 2 | | | 4,448,498 | |
| Net asset value per share — Class 2 | | $ | 19.72 | |
| | | | |
| | | | | |
| Total investments, at cost | | $ | 137,484,687 | |
| | | | |
| Securities on loan, at value | | $ | 24,994,640 | |
| | | | |
| | |
| 1. | | The Fund has unlimited number of authorized shares. |
The accompanying notes are an integral part of these financial statements.
| | |
| 16 Wells Fargo Advantage VT Core Equity Fund1 | | Statement of Operations—For the Year Ended December 31, 2010 |
| | | | | |
|
Investment income | | | | |
| Dividends* | | $ | 2,256,076 | |
| Income from affiliated securities | | | 14,878 | |
| Securities lending income, net | | | 23,056 | |
| | | | |
| Total investment income | | | 2,294,010 | |
| | | | |
| | | | | |
Expenses | | | | |
| Investment advisory fee | | | 759,232 | |
| Administration fees | | | | |
| Fund level | | | 98,401 | |
| Class 1 | | | 18,832 | |
| Class 2 | | | 30,283 | |
| Distribution fees | | | | |
| Class 2 | | | 193,518 | |
| Custody and accounting fees | | | 23,211 | |
| Professional fees | | | 33,160 | |
| Shareholder report expenses | | | 31,999 | |
| Trustees’ fees and expenses | | | 8,610 | |
| Transfer agent fees | | | 221 | |
| Other fees and expenses | | | 8,925 | |
| | | | |
| Total expenses | | | 1,206,392 | |
| Less: Fee waivers and/or expense reimbursements | | | (9,325 | ) |
| | | | |
| Net expenses | | | 1,197,067 | |
| | | | |
Net investment income | | | 1,096,943 | |
| | | | |
| | | | | |
NET REALIZED AND UNREALIZED GAINS (LOSSES) ON INVESTMENTS | | | | |
| | | | | |
Net realized gains (losses) on: | | | | |
| Unaffiliated securities | | | 9,499,485 | |
| Affiliated securities | | | (46,267 | ) |
| | | | |
| Net realized gains on investments | | | 9,453,218 | |
| | | | |
Net change in unrealized gains (losses) on: | | | | |
| Unaffiliated securities | | | 10,227,263 | |
| Affiliated securities | | | 34,209 | |
| | | | |
| Net change in unrealized gains (losses) on investments | | | 10,261,472 | |
| | | | |
| Net realized and unrealized gains on investments | | | 19,714,690 | |
| | | | |
Net increase in net assets resulting from operations | | $ | 20,811,633 | |
| | | | |
| | | | | |
| * Net of foreign withholding taxes of | | $ | 25,054 | |
| | | | |
| | |
| 1. | | After the close of business on July 16, 2010, the Fund acquired the net assets of Evergreen VA Fundamental Large Cap Fund and Wells Fargo VT Large Company Core Fund. Evergreen VA Fundamental Large Cap Fund became the accounting and performance survivor in the transaction. The information for the period prior to July 19, 2010 is that of Evergreen VA Fundamental Large Cap Fund. |
| |
| The accompanying notes are an integral part of these financial statements. |
| | |
| Statements of Changes in Net Assets | | Wells Fargo Advantage VT Core Equity Fund 17 |
| | | | | | | | | |
| | | Year Ended | | Year Ended |
| | | December 31, 20101 | | December 31, 20091 |
| |
Operations | | | | | | | | |
| Net investment income | | $ | 1,096,943 | | | $ | 1,150,133 | |
| Net realized gains on investments | | | 9,453,218 | | | | 2,552,219 | |
| Net change in unrealized gains (losses) on investments | | | 10,261,472 | | | | 28,577,586 | |
| | | |
| Net increase in net assets resulting from operations | | | 20,811,633 | | | | 32,279,938 | |
| | | |
| | | | | | | | | |
Distributions to shareholders from | | | | | | | | |
| Net investment income | | | | | | | | |
| Class 1 | | | (293,687 | ) | | | (585,714 | ) |
| Class 2 | | | (318,046 | ) | | | (622,741 | ) |
| | | |
| Total distributions to shareholders | | | (611,733 | ) | | | (1,208,455 | ) |
| | | |
| | | | | | | | | | | | | | | | | |
| | | Shares | | | | | | | Shares | | | | | |
Capital share transactions | | | | | | | | | | | | | | | | |
| Proceeds from shares sold | | | | | | | | | | | | | | | | |
| Class 1 | | | 230,873 | | | | 3,961,049 | | | | 291,872 | | | | 4,135,369 | |
| Class 2 | | | 512,488 | | | | 8,959,500 | | | | 1,079,151 | | | | 15,738,661 | |
| | | |
| | | | | | | | 12,920,549 | | | | | | | | 19,874,030 | |
| | | |
| Reinvestment of distributions | | | | | | | | | | | | | | | | |
| Class 1 | | | 17,735 | | | | 293,687 | | | | 34,792 | | | | 585,714 | |
| Class 2 | | | 19,276 | | | | 318,046 | | | | 37,123 | | | | 622,741 | |
| | | |
| | | | | | | | 611,733 | | | | | | | | 1,208,455 | |
| | | |
| Payment for shares redeemed | | | | | | | | | | | | | | | | |
| Class 1 | | | (684,360 | ) | | | (11,906,405 | ) | | | (772,069 | ) | | | (10,700,945 | ) |
| Class 2 | | | (871,529 | ) | | | (15,163,263 | ) | | | (313,864 | ) | | | (4,390,489 | ) |
| | | |
| | | | | | | | (27,069,668 | ) | | | | | | | (15,091,434 | ) |
| | | |
| Net asset value of shares issued in acquisition | | | | | | | | | | | | | | | | |
| Class 2 | | | 562,629 | | | | 8,994,391 | | | | 0 | | | | 0 | |
| | | |
| Net increase (decrease) in net assets resulting from capital share transactions | | | | | | | (4,542,995 | ) | | | | | | | 5,991,051 | |
| | | |
Total increase in net assets | | | | | | | 15,656,905 | | | | | | | | 37,062,534 | |
Net assets | | | | | | | | | | | | | | | | |
Beginning of period | | | | | | | 126,693,742 | | | | | | | | 89,631,208 | |
| | | |
| End of period | | | | | | $ | 142,350,647 | | | | | | | $ | 126,693,742 | |
| | | |
| Undistributed (overdistributed) net investment income | | | | | | $ | 487,722 | | | | | | | $ | (11,250 | ) |
| | | |
| | |
| 1. | | After the close of business on July 16, 2010, the Fund acquired the net assets of Evergreen VA Fundamental Large Cap Fund and Wells Fargo VT Large Company Core Fund. Evergreen VA Fundamental Large Cap Fund became the accounting and performance survivor in the transaction. The information for the periods prior to July 19, 2010 are those of Evergreen VA Fundamental Large Cap Fund. |
The accompanying notes are an integral part of these financial statements.
| | |
| 18 Wells Fargo Advantage VT Core Equity Fund1 | | Financial Highlights |
| | | | | | | | | | | | | | | | | | | | | |
| | | Beginning | | | | | | Net Realized | | Distributions | | |
| | | Net Asset | | Net | | and Unrealized | | from Net | | Distributions |
| | | Value Per | | Investment | | Gains (Losses) | | Investment | | from Net |
| | | Share | | Income | | on Investments | | Income | | Realized Gains |
| |
| Class 1 | | | | | | | | | | | | | | | | | | | | |
| January 1, 2010 to December 31, 2010 | | $ | 17.12 | | | | 0.20 | | | | 2.60 | | | | (0.10 | ) | | | 0.00 | |
| January 1, 2009 to December 31, 2009 | | $ | 12.72 | | | | 0.20 | | | | 4.38 | | | | (0.18 | ) | | | 0.00 | |
| January 1, 2008 to December 31, 2008 | | $ | 19.33 | | | | 0.29 | | | | (6.64 | ) | | | (0.26 | ) | | | 0.00 | |
| January 1, 2007 to December 31, 2007 | | $ | 19.60 | | | | 0.25 | | | | 1.37 | | | | (0.22 | ) | | | (1.67 | ) |
| January 1, 2006 to December 31, 2006 | | $ | 17.89 | | | | 0.25 | | | | 2.02 | | | | (0.24 | ) | | | (0.32 | ) |
| | | | | | | | | | | | | | | | | | | | | |
| Class 2 | | | | | | | | | | | | | | | | | | | | |
| January 1, 2010 to December 31, 2010 | | $ | 17.06 | | | | 0.14 | | | | 2.60 | | | | (0.08 | ) | | | 0.00 | |
| January 1, 2009 to December 31, 2009 | | $ | 12.68 | | | | 0.15 | | | | 4.38 | | | | (0.15 | ) | | | 0.00 | |
| January 1, 2008 to December 31, 2008 | | $ | 19.25 | | | | 0.20 | | | | (6.56 | ) | | | (0.21 | ) | | | 0.00 | |
| January 1, 2007 to December 31, 2007 | | $ | 19.53 | | | | 0.16 | | | | 1.40 | | | | (0.17 | ) | | | (1.67 | ) |
| January 1, 2006 to December 31, 2006 | | $ | 17.83 | | | | 0.18 | | | | 2.03 | | | | (0.19 | ) | | | (0.32 | ) |
| | |
| 1. | | After the close of business on July 16, 2010, the Fund acquired the net assets of Evergreen VA Fundamental Large Cap Fund and Wells Fargo Advantage VT Large Company Core Fund. Evergreen VA Fundamental Large Cap Fund became the accounting and performance survivor in the transaction. The information for the periods prior to July 19, 2010 are of those of Evergreen VA Fundamental Large Cap Fund. |
| |
| 2. | | Total return calculations would have been lower had certain expenses not been waived or reimbursed during the periods shown. |
| |
| 3. | | Calculated on the basis of the Fund as a whole without distinguishing between the classes of shares issued. |
The accompanying notes are an integral part of these financial statements.
| | |
| Financial Highlights | | Wells Fargo Advantage VT Core Equity Fund 19 |
| | | | | | | | | | | | | | | | | | | | | | | | | |
| Ending | | | | | | | | | | |
| Net Asset | | Ratio to Average Net Assets | | | | | | Portfolio | | Net Assets at |
| Value Per | | Net Investment | | Gross | | Net | | Total | | Turnover | | End of Period |
| Share | | Income | | Expenses | | Expenses | | Return2 | | Rate3 | | (000’s omitted) |
| |
| |
| $19.82 | | | 1.00 | % | | | 0.79 | % | | | 0.78 | % | | | 16.46 | % | | | 28 | % | | $ | 54,605 | |
| $17.12 | | | 1.27 | % | | | 0.85 | % | | | 0.85 | % | | | 36.06 | % | | | 35 | % | | $ | 54,624 | |
| $12.72 | | | 1.45 | % | | | 0.79 | % | | | 0.79 | % | | | (32.85 | )% | | | 25 | % | | $ | 46,238 | |
| $19.33 | | | 1.09 | % | | | 0.75 | % | | | 0.75 | % | | | 8.29 | % | | | 21 | % | | $ | 90,276 | |
| $19.60 | | | 1.19 | % | | | 0.74 | % | | | 0.74 | % | | | 12.67 | % | | | 21 | % | | $ | 112,413 | |
| | | | | | | | | | | | | | | | | | | | | | | | | |
| |
| $19.72 | | | 0.75 | % | | | 1.03 | % | | | 1.03 | % | | | 16.18 | % | | | 28 | % | | $ | 87,746 | |
| $17.06 | | | 0.99 | % | | | 1.10 | % | | | 1.10 | % | | | 35.75 | % | | | 35 | % | | $ | 72,070 | |
| $12.68 | | | 1.20 | % | | | 1.05 | % | | | 1.05 | % | | | (33.01 | )% | | | 25 | % | | $ | 43,393 | |
| $19.25 | | | 0.83 | % | | | 1.00 | % | | | 1.00 | % | | | 8.01 | % | | | 21 | % | | $ | 66,201 | |
| $19.53 | | | 0.94 | % | | | 0.99 | % | | | 0.99 | % | | | 12.39 | % | | | 21 | % | | $ | 65,913 | |
| | |
| 20 Wells Fargo Advantage VT Core Equity Fund | | Notes to Financial Statements |
1. ORGANIZATION
Wells Fargo Variable Trust (the “Trust”), a Delaware statutory trust organized on March 10, 1999, is an open-end management investment company registered under the Investment Company Act of 1940, as amended (the “1940 Act”). These financial statements report on Wells Fargo Advantage VT Core Equity Fund (the “Fund”) which is a diversified series of the Trust.
After the close of business on July 16, 2010, the net assets of Evergreen VA Fundamental Large Cap Fund and Wells Fargo Advantage VT Large Company Core Fund were acquired by the Fund, which was created to receive the assets of Evergreen VA Fundamental Large Cap Fund and Wells Fago Advantage VT Large Company Core Fund, in an exchange for shares of the Fund. Evergreen VA Fundamental Large Cap Fund became the accounting and performance survivor in the reorganizations and as a result the accounting and performance history of Evergreen VA Fundamental Large Cap Fund has been carried forward in the financial statements contained herein.
2. SIGNIFICANT ACCOUNTING POLICIES
The following significant accounting policies, which are consistently followed in the preparation of the financial statements of the Fund, are in conformity with U.S. generally accepted accounting principles which require management to make estimates and assumptions that affect the reported amounts of assets and liabilities, disclosure of contingent assets and liabilities at the date of the financial statements, and the reported amounts of revenues and expenses during the reporting period. Actual results could differ from those estimates. Management has considered the circumstances under which the Fund should recognize or make disclosures regarding events or transactions occurring subsequent to the balance sheet date through the date the financial statements are issued. Adjustments or additional disclosures, if any, have been included in these financial statements.
Securities valuation
Investments in securities are valued each business day as of the close of regular trading on the New York Stock Exchange, which is usually 4:00 p.m. (Eastern Time). Securities which are traded on a national or foreign securities exchange are valued at the last reported sales price, except that securities listed on The Nasdaq Stock Market, Inc. (“Nasdaq”) are valued at the Nasdaq Official Closing Price (“NOCP”), and if no NOCP is available, then at the last reported sales price. If no sales price is shown on the Nasdaq, the bid price will be used. In the absence of any sale of securities listed on the Nasdaq, and in the case of other securities, including U.S. Government obligations, but excluding debt securities maturing in 60 days or less, the price will be deemed “stale” and the valuations will be determined in accordance with the Fund’s Fair Valuation Procedures.
Securities denominated in foreign currencies are translated into U.S. dollars using the closing rates of exchange in effect on the day of valuation.
Many securities markets and exchanges outside the U.S. close prior to the close of the New York Stock Exchange and therefore may not fully reflect trading or events that occur after the close of the principal exchange in which the foreign investments are traded but before the close of the New York Stock Exchange. If such trading or events are expected to materially affect the value of the investments, then those investments are fair valued following procedures approved by the Board of Trustees. These procedures take into account multiple factors including movements in U.S. securities markets after foreign exchanges close. Depending on market activity, such fair valuations may be frequent. Such fair value pricing may result in NAVs that are higher or lower than NAVs based on the closing price or latest quoted bid price.
Debt securities of sufficient credit quality with original maturities of 60 days or less and any collateral received from securities lending invested in securities generally are valued at amortized cost which approximates fair value. The amortized cost method involves valuing a security at its cost, plus accretion of discount or minus amortization of premium over the period until maturity.
Investments in open-end mutual funds and non-registered investment companies are generally valued at net asset value.
Certain investments which are not valued using any of the methods discussed above, are valued at their fair value, as determined by procedures established in good faith and approved by the Board of Trustees.
The valuation techniques used by the Fund to measure fair value are consistent with the market approach, income approach and/or cost approach, where applicable, for each security type.
| | |
| Notes to Financial Statements | | Wells Fargo Advantage VT Core Equity Fund 21 |
Foreign currency translation
The accounting records of the Fund are maintained in U.S. dollars. Assets, including investment securities, and liabilities denominated in foreign currency are translated into U.S. dollars at the prevailing rates of exchange at the date of valuation. Purchases and sales of securities, and income and expenses are translated at the prevailing rate of exchange on the respective dates of such transactions. Reported net realized foreign exchange gains or losses arise from sales of foreign currencies, currency gains or losses realized between the trade and settlement dates on securities transactions, and the difference between the amounts of dividends, interest and foreign withholding taxes recorded and the U.S. dollar equivalent of the amounts actually paid or received. Net unrealized foreign exchange gains and losses arise from changes in the fair value of assets and liabilities other than investments in securities resulting in changes in exchange rates.
The changes in net assets arising from changes in exchange rates and the changes in net assets resulting from changes in market prices of securities are not separately presented. Such changes are recorded with net realized and unrealized gains or losses from investments. Gains and losses from certain foreign currency transactions are treated as ordinary income for U.S. federal income tax purposes.
Security loans
The Fund may lend its securities from time to time in order to earn additional income in the form of fees or interest on securities received as collateral or the investment of any cash received as collateral. The Fund continues to receive interest or dividends on the securities loaned. The Fund receives collateral in the form of cash or securities with a value at least equal to the value of the securities on loan. The value of the loaned securities is determined at the close of each business day and any additional required collateral is delivered to the Fund on the next business day. In the event of default or bankruptcy by the borrower, the Fund could experience delays and costs in recovering the loaned securities or in gaining access to the collateral. In addition, the investment of any cash collateral received may lose all or part of its value. The Fund has the right under the lending agreement to recover the securities from the borrower on demand.
The Fund lends its securities through an unaffiliated securities lending agent. Cash collateral received in connection with its securities lending transactions is invested in Wells Fargo Securities Lending Cash Investments, LLC (the “Cash Collateral Fund”). The Cash Collateral Fund is exempt from registration under Section 3(c)(7) of the 1940 Act and is managed by Wells Fargo Funds Management LLC (“Funds Management”) and is sub-advised by Wells Capital Management Incorporated (“Wells Capital Management”). Funds Management receives an investment advisory fee starting at 0.05% and declining to 0.01% as the average daily net assets of the Cash Collateral Fund increase. All of the fees received by Funds Management are paid to Wells Capital Management for its services as sub-adviser. The Cash Collateral Fund seeks to provide a positive return compared to the daily Fed Funds Open rate by investing in high-quality, U.S. dollar-denominated short-term money market instruments. Cash Collateral Fund investments are fair valued based upon the amortized cost valuation technique. Income earned from investment in the Cash Collateral Fund is included in securities lending income on the Statement of Operations.
In a securities lending transaction, the net asset value of the Fund will be affected by an increase or decrease in the value of the securities loaned and by an increase or decrease in the value of instruments in which cash collateral is invested. The amount of securities lending activity undertaken by the Fund fluctuates from time to time. As a result of the reorganizations on July 16, 2010, the Fund holds securities related to defaulted or impaired structured investment vehicles. After the occurrence of a default or impairment of structured investment vehicles purchased in a joint account by Wells Fargo Advantage VT Large Company Core Fund’s former securities lending agent, as the various participating funds’ lending activity fluctuated, their ratable interest in the joint account, including their ratable exposure to the defaulted or impaired structured investment vehicles fluctuated depending on the relative activity of each participating fund. In order to eliminate the fluctuation of the various participating funds’ ratable exposure to the defaulted or impaired structured investment vehicles, the adviser to the funds recommended to the Board of Trustees, and the Board of Trustees approved, actions designed to fix the allocation of percentage ownership in defaulted or impaired structured investment vehicles among all funds participating in securities lending (“side pocketing”) based on each participating fund’s percentage ownership of the total cash collateral investment joint account as of the date the fixed allocation is implemented. Accordingly, on February 13, 2009 a side pocketing occurred, which fixed each participating fund’s ownership of defaulted or impaired structured investment vehicle in the joint account based on each participating fund’s percentage ownership of the joint account as of such date.
| | |
| 22 Wells Fargo Advantage VT Core Equity Fund | | Notes to Financial Statements |
Security transactions and income recognition
Securities transactions are recorded on a trade date basis. Realized gains or losses are reported on the basis of identified cost of securities delivered.
Dividend income is recognized on the ex-dividend date, except for certain dividends from foreign securities, which are recorded as soon as the Fund is informed of the ex-dividend date. Dividend income from foreign securities is recorded net of foreign taxes withheld where recovery of such taxes is not assured.
Distributions to shareholders
Distributions to shareholders from net investment income and net realized gains, if any, are recorded on the ex-dividend date. Such distributions are determined in conformity with income tax regulations, which may differ from generally accepted accounting principles.
The timing and character of distributions made during the period from net investment income or net realized gains may differ from their ultimate characterization for federal income tax purposes. To the extent that these differences are permanent in nature, such amounts are reclassified within the capital accounts based on their federal tax-basis treatment. Temporary differences do not require reclassifications. At December 31, 2010, as a result of permanent book-to-tax differences, the following reclassification adjustments were made on the Statement of Assets and Liabilities:
| | | | | | | | | | | |
| | | | | Accumulated Net | | |
| Undistributed Net | | Realized Gains | | |
| Investment Income | | on Investment | | Paid-in Capital |
| $ | 13,762 | | | $ | 3,257,081 | | | $ | (3,270,843 | ) |
Federal and other taxes
The Fund intends to continue to qualify as a regulated investment company by distributing substantially all of its investment company taxable income and any net realized capital gains (after reduction for capital loss carryforwards) sufficient to relieve it from all, or substantially all, federal income taxes. Accordingly, no provision for federal income taxes was required.
The Fund’s income and federal excise tax returns and all financial records supporting those returns (including those of the predecessor funds) for the prior three fiscal years are subject to examination by the federal and Delaware revenue authorities.
As of December 31, 2010, the Fund had estimated net capital loss carryforwards, which are available to offset future net realized capital gains, in the amount of $2,524,725 with $886,236 expiring in 2016 and $1,638,489 expiring in 2017.
Under the recently enacted Regulated Investment Company Modernization Act of 2010, the Fund will be permitted to carry forward capital losses incurred in taxable years beginning after December 22, 2010 for an unlimited period. However, any losses incurred during those future taxable years will be required to be utilized prior to the losses incurred in pre-enactment taxable years. As a result of this ordering rule, pre-enactment capital loss carryforwards may be more likely to expire unused. Additionally, post-enactment capital losses that are carried forward will retain their character as either short-term or long-term capital losses rather than being considered all short-term as under previous law.
Class allocations
The separate classes of shares offered by the Fund differ principally in distribution and administration fees. Shareholders of each class bear certain expenses that pertain to that particular class. All shareholders bear the common expenses of the Fund, earn income from the portfolio, and are allocated unrealized gains and losses pro rata based on the average daily net assets of each class, without distinction between share classes. Dividends are determined separately for each class based on income and expenses allocable to each class. Realized gains and losses are allocated to each class pro rata based upon the net assets of each class on the date realized. Differences in per share dividend rates generally result from the relative weightings of pro rata income and realized gain allocations and from differences in separate class expenses, including distribution and administration fees.
3. FAIR VALUATION MEASUREMENTS
Fair value measurements of investments are determined within a framework that has established a fair value hierarchy based upon the various data inputs utilized in determining the value of the Fund’s investments. The three-level hierarchy gives the highest priority to unadjusted quoted prices in active markets for identical assets or liabilities (Level 1) and the
| | |
| Notes to Financial Statements | | Wells Fargo Advantage VT Core Equity Fund 23 |
lowest priority to unobservable inputs (Level 3). The Fund’s investments are classified within the fair value hierarchy based on the lowest level of input that is significant to the fair value measurement. The inputs are summarized into three broad levels as follows:
| § | | Level 1 — quoted prices in active markets for identical securities |
| § | | Level 2 — other significant observable inputs (including quoted prices for similar securities, interest rates, prepayment speeds, credit risk, etc.) |
| § | | Level 3 — significant unobservable inputs (including the Fund’s own assumptions in determining the fair value of investments) |
The inputs or methodologies used for valuing securities are not necessarily an indication of the risk associated with investing in those securities.
As of December 31, 2010, the inputs used in valuing the Fund’s assets, which are carried at fair value, were as follows:
| | | | | | | | | | | | | | | | | |
| | | | | | | Significant Other | | Significant | | |
| | | | | | | Observable | | Unobservable | | |
| | | Quoted Prices | | Inputs | | Inputs | | |
| Investments in Securities | | (Level 1) | | (Level 2) | | (Level 3) | | Total |
Equity securities | | | | | | | | | | | | | | | | |
Common stocks | | $ | 135,640,781 | | | $ | 698,280 | | | $ | 0 | | | $ | 136,339,061 | |
Short-term investments | | | | | | | | | | | | | | | | |
Corporate bonds and notes | | | 0 | | | | 0 | | | | 28,428 | | | | 28,428 | |
Investment companies | | | 4,198,369 | | | | 25,635,656 | | | | 0 | | | | 29,834,025 | |
| | | $ | 139,839,150 | | | $ | 26,333,936 | | | $ | 28,428 | | | $ | 166,201,514 | |
Further details on the major security types listed above can be found in the Fund’s Portfolio of Investments.
The following is a reconciliation of assets in which significant unobservable inputs (Level 3) were used in determining fair value:
| | | | | |
| | | Corporate bonds |
| | | and notes |
Balance as of December 31, 2009 | | $ | 0 | |
| Transfers in from acquisitions | | | 28,428 | |
Balance as of December 31, 2010 | | $ | 28,428 | |
Change in unrealized gains (losses) included in earnings relating to securities still held at December 31, 2010 | | $ | 0 | |
4. TRANSACTIONS WITH AFFILIATES AND OTHER EXPENSES
Investment advisory fees
The Trust has entered into an investment advisory contract with Funds Management, an indirect wholly owned subsidiary of Wells Fargo & Company (“Wells Fargo”). The investment adviser is responsible for implementing investment policies and guidelines and for supervising the investment sub-adviser, who is responsible for day-to-day portfolio management of the Fund.
Pursuant to the contract, Funds Management is paid an annual investment advisory fee starting at 0.55% and declining to 0.40% as the average daily net assets of the Fund increase. Prior to July 19, 2010, the predecessor fund, Evergreen VA Fundamental Large Cap Fund, paid an investment advisory fee to Evergreen Investment Management Company, LLC (“EIMC”), an affiliate of Funds Management, at an annual rate which started at 0.70% and declined to 0.50% as the aggregate average daily net assets of the Fund and its retail counterpart, Evergreen Fundamental Large Cap Fund, increased. For the year ended December 31, 2010, the investment advisory fee was equivalent to an annual rate of 0.59% of the Fund’s average daily net assets.
Funds Management may retain the services of certain investment sub-advisers to provide daily portfolio management to the Fund. The fees related to investment sub-advisory services are borne directly by the investment adviser and do not increase the overall fees paid by the Fund to the investment adviser. Wells Capital Management,
| | |
| 24 Wells Fargo Advantage VT Core Equity Fund | | Notes to Financial Statements |
an affiliate of Funds Management, is the investment sub-adviser to the Fund and is paid a fee by the investment adviser at an annual rate starting at 0.35% and declining to 0.15% as the average daily net assets of the Fund increase.
Administration and transfer agent fees
The Trust has entered into an Administration Agreement with Funds Management. Under this Agreement, for providing administrative services, which includes paying fees and expenses for services provided by the transfer agent, sub-transfer agents, omnibus account servicers and record-keepers, Funds Management is entitled to receive the following annual fees:
| | | | | | | | | |
| | | | | | | Administration Fees |
| | | | | | | (% of Average |
| | | Average Daily Net Assets | | Daily Net Assets) |
| Fund level | | First $5 billion | | | 0.05 | % |
| | | Next $5 billion | | | 0.04 | |
| | | Over $10 billion | | | 0.03 | |
| Class 1 and Class 2 | | All asset levels | | | 0.08 | |
Prior to July 19, 2010, the predecessor fund paid EIMC a fund level administrator fee at an annual rate determined by applying percentage rates to the aggregate average daily net assets of the Evergreen funds (excluding money market funds) which started at 0.10% and declined to 0.05% as the aggregate average daily net assets of the Evergreen funds (excluding money market funds) increased.
Funds Management and/or EIMC has contractually waived and/or reimbursed investment advisory and administration fees to the extent necessary to maintain certain net operating expense ratios for the Fund. Waiver of fees and/or reimbursement of expenses by Funds Management and/or EIMC were made first from fund level expenses on a proportionate basis and then from class specific expenses.
Prior to July 19, 2010, the predecessor fund paid Evergreen Service Company, LLC, an affiliate of EIMC and a subsidiary of Wells Fargo, a transfer and dividend disbursing agent fee.
Distribution fees
The Trust has adopted a Distribution Plan for Class 2 shares of the Fund pursuant to Rule 12b-1 under the 1940 Act. Distribution fees are charged to the Class 2 shares and paid to Wells Fargo Funds Distributor, LLC, the principal underwriter, at an annual rate of 0.25% of its average daily net assets. Prior to July 19, 2010, Class 2 shares of the predecessor fund also paid distribution fees at an annual rate of 0.25% of its average daily net assets.
5. INVESTMENT PORTFOLIO TRANSACTIONS
Purchases and sales of investments, exclusive of short-term securities (securities with maturities of one year or less at purchase date) for the year ended December 31, 2010 were $35,360,634 and $52,949,510, respectively.
6. ACQUISITIONS
After the close of business on July 16, 2010, the Fund acquired the net assets of Evergreen VA Fundamental Large Cap Fund and Wells Fargo Advantage VT Large Company Core Fund. The purpose of the transaction was to combine three funds with similar investment objectives and strategies. The acquisitions were accomplished by a tax-free exchange of all of the shares of Evergreen VA Fundamental Large Cap Fund and Wells Fargo Advantage VT Large Company Core Fund. Shareholders holding Class 1 and Class 2 shares of Evergreen VA Fundamental Large Cap Fund received Class 1 and Class 2 shares, respectively, of the Fund in the reorganization. Existing shareholders of Wells Fargo Advantage VT Large Company Core Fund received Class 2 shares of the Fund in the reorganization. The Fund was newly created to receive the assets of Evergreen VA Fundamental Large Cap Fund and Wells Fargo Advantage VT Large Company Core Fund. Evergreen VA Fundamental Large Cap Fund became the accounting and performance survivor in the reorganizations. The investment portfolio of Evergreen VA Fundamental Large Cap Fund and Wells Fargo Advantage VT Large Company Core Fund with fair values of $115,710,077 and $8,948,186, respectively, and identified costs of $107,871,481 and $9,585,014, respectively, on July 16, 2010 were the principal assets acquired by the Fund. For financial reporting purposes, assets received and shares issued by the Fund were recorded at fair value; however, the cost basis of the investments received from Evergreen VA Fundamental Large Cap Fund and Wells Fargo Advantage VT Large Company Core Fund were carried forward to align
| | |
| Notes to Financial Statements | | Wells Fargo Advantage VT Core Equity Fund 25 |
ongoing reporting of the Fund’s realized and unrealized gains and losses with amounts distributable to shareholders for tax purposes. The value of net assets acquired, unrealized gains (losses) acquired, exchange ratio and number of shares issued were as follows:
| | | | | | | | | | | | | | | | | |
| | | Value of Net | | Unrealized | | Exchange | | Number of |
| Acquired Fund | | Assets Acquired | | Gains (Losses) | | Ratio | | Shares Issued |
| Evergreen VA Fundamental Large Cap Fund | | $ | 115,708,933 | | | $ | 7,838,596 | | | | 1.00 | | | 2,977,966 Class 1 |
| | | | | | | | | | | | 1.00 | | | 4,248,849 Class 2 |
| Wells Fargo Advantage VT Large Company Core Fund | | | 8,994,391 | | | | (636,828 | ) | | | 0.72 | | | 562,629 Class 2 |
The aggregate net assets of the Fund immediately after the acquisitions were $124,703,324.
Assuming the acquisitions had been completed January 1, 2010, the beginning of the annual reporting period for the Fund, the pro forma results of operations for the year ended December 31, 2010 would have been
| | | | | |
|
Net investment income | | $ | 1,153,573 | |
Net realized and unrealized gains (losses) on investments | | $ | 19,454,530 | |
Net increase in net assets resulting from operations | | $ | 20,608,103 | |
Because the combined investment portfolios have been managed as a single integrated portfolio since the acquisition was completed, it is not practicable to separate the amounts of revenue and earnings of Wells Fargo Advantage VT Large Company Core Fund that have been included in the Fund’s Statement of Operations since July 19, 2010.
7. BANK BORROWINGS
The Trust and Wells Fargo Funds Trust (excluding the money market funds) are parties to a $125,000,000 revolving credit agreement with State Street Bank and Trust Company, whereby the Fund is permitted to use bank borrowings for temporary or emergency purposes, such as to fund shareholder redemption requests. Interest under the credit agreement is charged to the Fund based on a borrowing rate equal to the higher of the Federal Funds rate in effect on that day plus 1.25% or the overnight LIBOR rate in effect on that day plus 1.25%. In addition, under the credit agreement, the Fund pays an annual commitment fee equal to 0.125% of the unused balance, which is allocated pro rata. Prior to September 7, 2010, the annual commitment fee paid by the Fund was 0.15% of the unused balance.
For the year ended December 31, 2010, there were no borrowings by the Fund under the agreement.
8. DISTRIBUTIONS TO SHAREHOLDERS
The tax character of distributions paid during the years ended December 31, 2010 and December 31, 2009 were as follows:
| | | | | | | | | |
| | | Year ended December 31, |
| | | 2010 | | 2009 |
| Ordinary Income | | $ | 611,733 | | | $ | 1,208,455 | |
As of December 31, 2010 the components of distributable earnings on a tax basis were as follows:
| | | | | | | | | | | | | | | |
| Undistributed | | Undistributed | | | | |
| Ordinary | | Long-Term | | Unrealized | | Capital Loss |
| Income | | Gain | | Gains (Losses) | | Carryforward |
| $ | 500,095 | | | $ | 4,114,590 | | | $ | 28,265,873 | | | $ | (2,524,725 | ) |
9. INDEMNIFICATION
Under the Trust’s organizational documents, the officers and directors are indemnified against certain liabilities that may arise out of performance of their duties to the Trust. Additionally, in the normal course of business, the Trust may enter into contracts with service providers that contain a variety of indemnification clauses. The Trust’s maximum exposure under these arrangements is dependent on future claims that may be made against the Fund and, therefore, cannot be estimated.
| | |
| 26 Wells Fargo Advantage VT Core Equity Fund | | Report of Independent Registered Public Accounting Firm |
BOARD OF TRUSTEES AND SHAREHOLDERS OF WELLS FARGO VARIABLE TRUST:
We have audited the accompanying statement of assets and liabilities, including the portfolio of investments, of the Wells Fargo Advantage VT Core Equity Fund (the “Fund”), one of the funds constituting the Wells Fargo Variable Trust, as of December 31, 2010, and the related statement of operations for the year then ended, statements of changes in net assets for each of the years in the two year period then ended, and the financial highlights for each of the years in the five year period then ended. These financial statements and financial highlights are the responsibility of the Fund’s management. Our responsibility is to express an opinion on these financial statements and financial highlights based on our audits.
We conducted our audits in accordance with the standards of the Public Company Accounting Oversight Board (United States). Those standards require that we plan and perform the audit to obtain reasonable assurance about whether the financial statements and financial highlights are free of material misstatement. An audit includes examining, on a test basis, evidence supporting the amounts and disclosures in the financial statements. Our procedures included confirmation of securities owned as of December 31, 2010, by correspondence with custodian and brokers, or by other appropriate auditing procedures. An audit also includes assessing the accounting principles used and significant estimates made by management, as well as evaluating the overall financial statement presentation. We believe that our audits provide a reasonable basis for our opinion.
In our opinion, the financial statements and financial highlights referred to above present fairly, in all material respects, the financial position of the Wells Fargo Advantage VT Core Equity Fund as of December 31, 2010, the results of its operations for the year then ended, changes in its net assets for each of the years in the two year period then ended, and the financial highlights for each of the years in the five year period then ended, in conformity with U.S. generally accepted accounting principles.
Boston, Massachusetts
February 25, 2011
| | |
| Other Information (Unaudited) | | Wells Fargo Advantage VT Core Equity Fund 27 |
PROXY VOTING INFORMATION
A description of the policies and procedures that the Fund uses to determine how to vote proxies relating to portfolio securities is available without charge, upon request, by calling 1-800-222-8222, visiting our Web site at wellsfargo.com/advantagefunds, or visiting the SEC Web site at www.sec.gov. Information regarding how the Fund voted proxies relating to portfolio securities during the most recent 12-month period ended June 30 is available without charge on the Fund’s Web site at wellsfargo.com/advantagefunds or by visiting the SEC Web site at www.sec.gov.
| | |
| 28 Wells Fargo Advantage VT Core Equity Fund | | Other Information (Unaudited) |
PORTFOLIO HOLDINGS INFORMATION
The complete portfolio holdings for the Fund are publicly available on the Fund’s Web site (www.wellsfargo.com/advantagefunds) on a monthly, 30-day or more delayed basis. In addition, top ten holdings information for the Fund is publicly available on the Fund’s Web site on a monthly, seven-day or more delayed basis. The Fund files its complete schedule of portfolio holdings with the SEC for the first and third quarters of each fiscal year on Form N-Q, which is available without charge by visiting the SEC Web site at www.sec.gov. In addition, the Fund’s Form N-Q may be reviewed and copied at the SEC’s Public Reference Room in Washington, DC, and at regional offices in New York City, at 233 Broadway, and in Chicago, at 175 West Jackson Boulevard, Suite 900. Information about the Public Reference Room may be obtained by calling 1-800-SEC-0330.
BOARD OF TRUSTEES
The following table provides basic information about the Board of Trustees (the “Trustees”) of the Wells Fargo Variable Trust (the “Trust”) and Officers of the Trust. This table should be read in conjunction with the Prospectus and the Statement of Additional Information1 of the Fund. Each of the Trustees and Officers listed below acts in identical capacities for the Wells Fargo Advantage family of funds, which consists of 152 funds comprising the Trust, Wells Fargo Funds Trust, Wells Fargo Master Trust and four closed-end funds (collectively the “Fund Complex”). All of the Trustees are also Members of the Audit and Governance Committees of each Trust in the Fund Complex. The mailing address of each Trustee and Officer is 525 Market Street, 12th Floor, San Francisco, CA 94105. Each Trustee and Officer serves an indefinite term, however, each Trustee serves such term until reaching the mandatory retirement age established by the Trustees.
Independent Trustees
| | | | | | | |
| Name and | | Position Held and | | | | |
| Year of Birth | | Length of Service | | Principal Occupations During Past Five Years | | Other Directorships |
Peter G. Gordon
(Born 1942) | | Trustee, since 1998; Chairman, since 2005 (Lead Trustee since 2001) | | Co-Founder, Chairman, President and CEO of Crystal Geyser. Water Company. Trustee Emeritus, Colby College | | Asset Allocation
Trust |
| | | | | | | |
Isaiah Harris, Jr.
(Born 1952) | | Trustee, since 2009 | | Retired. Prior thereto, President and CEO of BellSouth Advertising and Publishing Corp. from 2005 to 2007, President and CEO of BellSouth Enterprises from 2004 to 2005 and President of BellSouth Consumer Services from 2000 to 2003. Emeritus member of the Iowa State University Foundation Board of Governors. Emeritus Member of the Advisory Board of Iowa State University School of Business. Mr. Harris is a certified public accountant. | | CIGNA Corporation; Deluxe Corporation; Asset Allocation Trust |
| | | | | | | |
Judith M. Johnson
(Born 1949) | | Trustee, since 2008 | | Retired. Prior thereto, Chief Executive Officer and Chief Investment Officer of Minneapolis Employees Retirement Fund from 1996 to 2008. Ms. Johnson is an attorney, certified public accountant and a certified managerial accountant. | | Asset Allocation
Trust |
| | | | | | | |
Leroy Keith, Jr.
(Born 1939) | | Trustee, since 2010 | | Chairman, Bloc Global Services (development and construction), Trustee of the Evergreen Funds from 1983 to 2010. Former Managing Director, Almanac Capital Management (commodities firm), former Partner, Stonington Partners, Inc. (private equity fund), former Director, Obagi Medical Products Co. and former Director, Lincoln Educational Services. | | Trustee, Virtus Fund Complex (consisting of 45 portfolios as of 12/31/10); Director, Diversapack Co. (packaging company); Asset Allocation Trust |
| | | | | | | |
David F. Larcker
(Born 1951) | | Trustee, since 2009 | | James Irvin Miller Professor of Accounting at the Graduate School of Business, Stanford University, Director of Corporate Governance Research Program and Co-Director of The Rock Center for Corporate Governance since 2006. From 2005 to 2008, Professor of Accounting at the Graduate School of Business, Stanford University. Prior thereto, Ernst & Young Professor of Accounting at The Wharton School, University of Pennsylvania from 1985 to 2005. | | Asset Allocation
Trust |
| | |
| Other Information (Unaudited) | | Wells Fargo Advantage VT Core Equity Fund 29 |
| | | | | | | |
| Name and | | Position Held and | | | | |
| Year of Birth | | Length of Service | | Principal Occupations During Past Five Years | | Other Directorships |
Olivia S. Mitchell
(Born 1953) | | Trustee, since 2006 | | International Foundation of Employee Benefit Plans Professor and Chair of the Department of Insurance and Risk Management, Wharton School of the University of Pennsylvania since 1993. Director of Wharton’s Pension Research Council and Boettner Center on Pensions & Retirement Research, and Research Associate at the National Bureau of Economic Research. Previously, Cornell University Professor from 1978 to 1993. | | Asset Allocation
Trust |
| | | | | | | |
Timothy J. Penny
(Born 1951) | | Trustee, since 1996 | | President and CEO of Southern Minnesota Initiative Foundation, a non-profit organization, since 2007 and Senior Fellow at the Humphrey Institute Policy Forum at the University of Minnesota since 1995. Member of the Board of Trustees of NorthStar Education Finance, Inc., a non-profit organization, since 2007. | | Asset Allocation
Trust |
| | | | | | | |
Michael S. Scofield
(Born 1943) | | Trustee, since 2010 | | Currently serves on the Investment Company Institute’s Board of Governors and Executive Committee as well the Independent Director’s Counsel Board of Governors and Executive Committee. Former Chairman of the Independent Directors Counsel. Trustee of the Evergreen Funds from 1984 to 2010. Retired Attorney, Law Offices of Michael S. Scofield and former Director and Chairman, Branded Media Corporation (multi-media branding company). | | Asset Allocation
Trust |
| | | | | | | |
Donald C. Willeke
(Born 1940) | | Trustee, since 1996 | | Principal of the law firm of Willeke & Daniels. General Counsel of the Minneapolis Employees Retirement Fund from 1984 until its consolidation into the Minnesota Public Employees Retirement Association on June 30, 2010. | | Asset Allocation
Trust |
Officers
| | | | | | | |
| Name and | | Position Held and | | | | |
| Year of Birth | | Length of Service | | Principal Occupations During Past Five Years | | |
Karla M. Rabusch
(Born 1959) | | President, since 2003 | | Executive Vice President of Wells Fargo Bank, N.A. and President of Wells Fargo Funds Management, LLC since 2003. Senior Vice President and Chief Administrative Officer of Wells Fargo Funds Management, LLC from 2001 to 2003. | | |
| | | | | | | |
C. David Messman
(Born 1960) | | Secretary, since 2000; Chief Legal Counsel, since 2003 | | Senior Vice President and Secretary of Wells Fargo Funds Management, LLC since 2001. Vice President and Managing Counsel of Wells Fargo Bank, N.A. since 1996. | | |
| | | | | | | |
Kasey Phillips
(Born 1970) | | Treasurer, since 2009 | | Senior Vice President of Wells Fargo Funds Management, LLC since 2009. Senior Vice President of Evergreen Investment Management Company, LLC from 2006 to 2010. Treasurer of the Evergreen Funds from 2005 to 2010. Vice President and Assistant Vice President of Evergreen Investment Services, Inc. from 1999 to 2006. | | |
| | | | | | | |
David Berardi
(Born 1975) | | Assistant Treasurer,
since 2009 | | Vice President of Wells Fargo Funds Management, LLC since 2009. Vice President of Evergreen Investment Management Company, LLC from 2008 to 2010. Assistant Vice President of Evergreen Investment Services, Inc. from 2004 to 2008. Manager of Fund Reporting and Control for Evergreen Investment Management Company, LLC from 2004 to 2010. | | |
| | | | | | | |
Jeremy DePalma
(Born 1974) | | Assistant Treasurer,
since 2009 | | Senior Vice President of Wells Fargo Funds Management, LLC since 2009. Senior Vice President of Evergreen Investment Management Company, LLC from 2008 to 2010. Vice President, Evergreen Investment Services, Inc. from 2004 to 2007. Assistant Vice President, Evergreen Investment Services, Inc. from 2000 to 2004 and the head of the Fund Reporting and Control Team within Fund Administration from 2005 to 2010. | | |
| | |
| 30 Wells Fargo Advantage VT Core Equity Fund | | Other Information (Unaudited) |
| | | | | | | |
| Name and | | Position Held and | | | | |
| Year of Birth | | Length of Service | | Principal Occupations During Past Five Years | | |
Debra Ann Early
(Born 1964) | | Chief Compliance Officer,
since 2007 | | Chief Compliance Officer of Wells Fargo Funds Management, LLC since 2007. Chief Compliance Officer of Parnassus Investments from 2005 to 2007. Chief Financial Officer of Parnassus Investments from 2004 to 2007 and Senior Audit Manager of PricewaterhouseCoopers LLP from 1998 to 2004. | | |
| | |
| 1. | | The Statement of Additional Information includes additional information about the Fund’s Trustees and is available, without charge, upon request, by calling 1-800-222-8222 or by visiting the Fund’s Web site at www.wellsfargo.com/advantagefunds. |
| | |
| List of Abbreviations | | Wells Fargo Advantage VT Core Equity Fund 31 |
The following is a list of common abbreviations for terms and entities which may have appeared in this report.
| | | | | |
|
| ABAG | | — | | Association of Bay Area Governments |
| ADR | | — | | American Depositary Receipt |
| ADS | | — | | American Depository Shares |
| AMBAC | | — | | American Municipal Bond Assurance Corporation |
| AMT | | — | | Alternative Minimum Tax |
| ARM | | — | | Adjustable Rate Mortgages |
| AUD | | — | | Australian Dollar |
| BART | | — | | Bay Area Rapid Transit |
| BRL | | — | | Brazil Real |
| CAD | | — | | Canadian Dollar |
| CDA | | — | | Community Development Authority |
| CDO | | — | | Collateralized Debt Obligation |
| CDSC | | — | | Contingent Deferred Sales Charge |
| CGIC | | — | | Capital Guaranty Insurance Company |
| CGY | | — | | Capital Guaranty Corporation |
| CHF | | — | | Swiss Franc |
| CIFG | | — | | CDC (Caisse des Dépôts et Consignations) IXIS Financial Guarantee |
| COP | | — | | Certificate of Participation |
| CP | | — | | Commercial Paper |
| CTF | | — | | Common Trust Fund |
| DEM | | — | | Deutsche Mark |
| DKK | | — | | Danish Krone |
| DW&P | | — | | Department of Water & Power |
| DWR | | — | | Department of Water Resources |
| ECFA | | — | | Educational & Cultural Facilities Authority |
| EDFA | | — | | Economic Development Finance Authority |
| ETET | | — | | Eagle Tax-Exempt Trust |
| ETF | | — | | Exchange-Traded Fund |
| EUR | | — | | Euro |
| FFCB | | — | | Federal Farm Credit Bank |
| FGIC | | — | | Financial Guaranty Insurance Corporation |
| FHA | | — | | Federal Housing Authority |
| FHAG | | — | | Federal Housing Agency |
| FHLB | | — | | Federal Home Loan Bank |
| FHLMC | | — | | Federal Home Loan Mortgage Corporation |
| FNMA | | — | | Federal National Mortgage Association |
| FRF | | — | | French Franc |
| FSA | | — | | Farm Service Agency |
| GBP | | — | | Great British Pound |
| GDR | | — | | Global Depositary Receipt |
| GNMA | | — | | Government National Mortgage Association |
| GO | | — | | General Obligation |
| HCFR | | — | | Healthcare Facilities Revenue |
| HEFA | | — | | Health & Educational Facilities Authority |
| HEFAR | | — | | Higher Education Facilities Authority Revenue |
| HFA | | — | | Housing Finance Authority |
| HFFA | | — | | Health Facilities Financing Authority |
| HKD | | — | | Hong Kong Dollar |
| HUD | | — | | Housing & Urban Development |
| HUF | | — | | Hungarian Forint |
| IDA | | — | | Industrial Development Authority |
| IDAG | | — | | Industrial Development Agency |
| IDR | | — | | Industrial Development Revenue |
| IEP | | — | | Irish Pound |
| JPY | | — | | Japanese Yen |
| KRW | | — | | Republic of Korea Won |
| LIBOR | | — | | London Interbank Offered Rate |
| LLC | | — | | Limited Liability Company |
| LLP | | — | | Limited Liability Partnership |
| LOC | | — | | Letter of Credit |
| LP | | — | | Limited Partnership |
| MBIA | | — | | Municipal Bond Insurance Association |
| MFHR | | — | | Multi-Family Housing Revenue |
| MFMR | | — | | Multi-Family Mortgage Revenue |
| MMD | | — | | Municipal Market Data |
| MTN | | — | | Medium Term Note |
| MUD | | — | | Municipal Utility District |
| MXN | | — | | Mexican Peso |
| MYR | | — | | Malaysian Ringgit |
| NATL-RE | | — | | National Public Finance Guarantee Corporation |
| NLG | | — | | Netherlands Guilder |
| NOK | | — | | Norwegian Krone |
| NZD | | — | | New Zealand Dollar |
| PCFA | | — | | Pollution Control Finance Authority |
| PCR | | — | | Pollution Control Revenue |
| PFA | | — | | Public Finance Authority |
| PFFA | | — | | Public Facilities Financing Authority |
| plc | | — | | Public Limited Company |
| PLN | | — | | Polish Zloty |
| PSFG | | — | | Public School Fund Guaranty |
| R&D | | — | | Research & Development |
| RDA | | — | | Redevelopment Authority |
| RDFA | | — | | Redevelopment Finance Authority |
| REITS | | — | | Real Estate Investment Trusts |
| SEK | | — | | Swedish Krona |
| SFHR | | — | | Single Family Housing Revenue |
| SFMR | | — | | Single Family Mortgage Revenue |
| SGD | | — | | Singapore Dollar |
| SKK | | — | | Slovakian Koruna |
| SLMA | | — | | Student Loan Marketing Association |
| SPDR | | — | | Standard & Poor’s Depositary Receipts |
| STIT | | — | | Short-Term Investment Trust |
| TBA | | — | | To Be Announced |
| TRAN | | — | | Tax Revenue Anticipation Notes |
| TRY | | — | | Turkish Lira |
| USD | | — | | United States Dollar |
| XLCA | | — | | XL Capital Assurance |
| ZAR | | — | | South African Rand |
This page is intentionally left blank.
This page is intentionally left blank.
This page is intentionally left blank.
Sign up for electronic delivery of prospectuses and shareholder
reports as www.wellsfargo.com/advvantagedelivery
More information about Wells Fargo Advantage Funds is available free upon request. To obtain literature, please write, e-mail, visit the Funds’ Web site, or call:
Wells Fargo Advantage Funds
P.O. Box 8266
Boston, MA 02266-8266
E-mail: wfaf@wellsfargo.com
Web site:www.wellsfargo.com/advantagefunds
Individual Investors: 1-800-222-8222
Retail Investment Professionals: 1-888-877-9275
Institutional Investment Professionals: 1-866-765-0778
This report and the financial statements contained herein are submitted for the general information of the shareholders of Wells Fargo Advantage Funds. If this report is used for promotional purposes, distribution of the report must be accompanied or preceded by a current prospectus. For a prospectus containing more complete information, including charges and expenses, call 1-800-222-8222 or visit the Fund’s Web site at www.wellsfargo.com/advantagefunds. Please consider the investment objectives, risks, charges, and expenses of the investment carefully before investing. This and other information about Wells Fargo Advantage Funds can be found in the current prospectus. Read the prospectus carefully before you invest or send money.
Wells Fargo Funds Management, LLC, a wholly owned subsidiary of Wells Fargo & Company, provides investment advisory and administrative services for Wells Fargo Advantage Funds. Other affiliates of Wells Fargo & Company provide subadvisory and other services for the Funds. The Funds are distributed by Wells Fargo Funds Distributor, LLC, Member FINRA/SIPC, an affiliate of Wells Fargo & Company.
NOT FDIC INSURED § NO BANK GUARANTEE § MAY LOSE VALUE
| | | | |
| | | | | |
| © 2011 Wells Fargo Funds Management, LLC. All rights reserved. | | www.wellsfargo.com/advantagefunds | | 200911 02-11 |
| | | | | AVT0/AR146 12-10 |
WELLS FARGO ADVANTAGE VARIABLE TRUST FUNDS
■ Wells Fargo Advantage VT Discovery FundSM
Reduce clutter. Save trees.
Sign up for electronic delivery of prospectuses and shareholder reports at www.wellsfargo.com/advantagedelivery
| | | | | |
| Contents | | | | |
Letter to Shareholders | | | 2 | |
| | | | | |
Performance Highlights | | | 6 | |
| | | | | |
Fund Expenses | | | 11 | |
| | | | | |
Portfolio of Investments | | | 12 | |
| | | | | |
Financial Statements | | | | |
| Statement of Assets and Liabilities | | | 16 | |
| Statement of Operations | | | 17 | |
| Statements of Changes in Net Assets | | | 18 | |
| Financial Highlights | | | 20 | |
| | | | | |
Notes to Financial Statements | | | 22 | |
| | | | | |
Report of Independent Registered Public Accounting Firm | | | 27 | |
| | | | | |
Other Information | | | 28 | |
| | | | | |
List of Abbreviations | | | 32 | |
The views expressed are as of December 31, 2010, and are those of the Fund managers. Any reference to a specific security in this report is not a recommendation to purchase or sell any specific security or adopt any investment strategy. The views are subject to change at any time in response to changing circumstances in the market and are not intended to predict or guarantee the future performance of any individual security, market sector or the markets generally, or the Wells Fargo Advantage VT Discovery Fund.
NOT FDIC INSURED ■ NO BANK GUARANTEE ■ MAY LOSE VALUE

| | | |
|
| WELLS FARGO |
| | | INVESTMENT HISTORY |
| | | |
1932 | | Keystone creates one of the first mutual fund families. |
| | | |
1971 | | Wells Fargo & Company introduces one of the first institutional index funds. |
| | | |
1978 | | Wells Fargo applies Markowitz and Sharpe’s research on Modern Portfolio Theory to introduce one of the industry’s first Tactical Asset Allocation (TAA) models in institutional separately managed accounts. |
| | | |
1984 | | Wells Fargo Stagecoach Funds launches its first asset allocation fund. |
| | | |
1989 | | The Tactical Asset Allocation (TAA) Model is first applied to Wells Fargo’s asset allocation mutual funds. |
| | | |
1994 | | Wells Fargo introduces the LifePath Funds, one of the first suites of target date funds (now the Wells Fargo Advantage Dow Jones Target Date FundsSM). |
| | | |
1996 | | Evergreen Investments and Keystone Funds merge. |
| | | |
1997 | | Wells Fargo launches Wells Fargo Advantage WealthBuilder PortfoliosSM, a fund-of-funds suite of products that includes the use of quantitative models to shift assets among investment styles. |
| | | |
1999 | | Norwest Advantage Funds and Stagecoach Funds are reorganized into Wells Fargo Funds after the merger of Norwest and Wells Fargo. |
| | | |
2002 | | Evergreen Retail and Evergreen Institutional companies form the umbrella asset management company, Evergreen Investments. |
| | | |
2005 | | The integration of Strong Funds with Wells Fargo Funds creates Wells Fargo Advantage Funds, resulting in one of the top 20 mutual fund companies in the United States. |
| | | |
2006 | | Wells Fargo Advantage Funds relaunches the target date product line as Wells Fargo Advantage Dow Jones Target Date Funds. |
| | | |
2010 | | The mergers and reorganizations of Evergreen and Wells Fargo Advantage mutual funds are completed, unifying the families under the brand of Wells Fargo Advantage Funds. |
| | | |
| | | Not part of the annual report. |
Wells Fargo Advantage Funds®
Wells Fargo Advantage Funds skillfully guides institutions, financial advisors, and individuals through the investment terrain to help them reach their financial objectives. Everything we do on behalf of investors is backed by our unique combination of qualifications.
Strength
Our organization is built on the standards of integrity and service established by our parent company—Wells Fargo & Company—more than 150 years ago. And, because we’re part of a highly diversified financial enterprise, we offer the depth of resources to help investors succeed.
Expertise
Our multi-boutique model offers investors access to the independent thinking of premier investment managers that have been chosen for their time-tested strategies. While each team specializes in a specific investment strategy, collectively they provide investors a wide choice of distinct investment styles. Our dedication to investment excellence doesn’t end with our expertise in manager selection—risk management, analysis, and rigorous ongoing review seek to ensure each manager’s investment process remains consistent.
Partnership
Our collaborative approach is built around understanding the needs and goals of our clients. By adhering to core principles of sound judgment and steady guidance, we support you through every stage of the investment decision process.
Carefully consider the investment objectives, risks, charges, and expenses before investing. For a current prospectus for Wells Fargo Advantage Funds containing this and other information, visit wellsfargo.com/advantagefunds. Read it carefully before investing.
Wells Fargo Funds Management, LLC, a wholly owned subsidiary of Wells Fargo & Company, provides investment advisory and administrative services for Wells Fargo Advantage Funds®. Other affiliates of Wells Fargo & Company provide subadvisory and other services for the Funds. The Funds are distributed by Wells Fargo Funds Distributor, LLC, Member FINRA/SIPC, an affiliate of Wells Fargo & Company.
The “Dow Jones Target Date Indexes” are a product of Dow Jones Indexes, a licensed trademark of CME Group Index Services LLC (“CME”). “Dow Jones” and “Dow Jones Target Date Indexes” are service marks of Dow Jones Trademark Holdings, LLC, and have been licensed for use for certain purposes by CME and sublicensed for use by Global Index Advisors, Inc., and Wells Fargo Funds Management, LLC. The Dow Jones Target Date Indexes are based in part on the Barclays Capital Bond Indexes, which are published by Barclays Capital Inc. The Wells Fargo Advantage Dow Jones Target Date Funds, based on the Dow Jones Target Date Indexes, are not sponsored, endorsed, sold, or promoted by Dow Jones, CME or Barclays Capital or any of their respective affiliates, and neither Dow Jones, CME nor Barclays Capital nor any of their respective affiliates makes any representation regarding the advisability of investing in such product(s) and/or about the quality, accuracy, and/or completeness of the Dow Jones Target Date Indexes or the Barclays Capital Bond Indexes. IN NO EVENT SHALL DOW JONES, CME, BARCLAYS CAPITAL, OR ANY OF THEIR LICENSORS HAVE ANY LIABILITY FOR ANY SPECIAL, PUNITIVE, INDIRECT, OR CONSEQUENTIAL DAMAGES (INCLUDING LOST PROFITS), EVEN IF NOTIFIED OF THE POSSIBILITY OF SUCH DAMAGES.
NOT FDIC INSURED ■ NO BANK GUARANTEE ■ MAY LOSE VALUE
Wells Fargo Advantage Funds offers more than 120 mutual funds across a wide range of asset classes, representing over $236 billion in assets under management, as of December 31, 2010.
| | | | | |
|
Equity Funds | | | | |
| Asia Pacific Fund | | Enterprise Fund† | | Opportunity Fund† |
| C&B Large Cap Value Fund | | Equity Value Fund | | Precious Metals Fund |
| C&B Mid Cap Value Fund | | Global Opportunities Fund | | Premier Large Company Growth Fund |
| Capital Growth Fund | | Growth Fund | | Small Cap Growth Fund |
| Classic Value Fund | | Growth Opportunities Fund | | Small Cap Opportunities Fund |
| Common Stock Fund | | Health Care Fund | | Small Cap Value Fund |
| Core Equity Fund | | Index Fund | | Small Company Growth Fund |
| Disciplined Global Equity Fund | | International Equity Fund | | Small Company Value Fund |
| Disciplined U.S. Core Fund | | International Value Fund | | Small/Mid Cap Core Fund |
| Disciplined Value Fund | | Intrinsic Small Cap Value Fund | | Small/Mid Cap Value Fund |
Discovery Fund† | | Intrinsic Value Fund | | Social Sustainability Fund† |
| Diversified Equity Fund | | Intrinsic World Equity Fund | | Special Mid Cap Value Fund |
| Diversified International Fund | | Large Cap Core Fund | | Special Small Cap Value Fund |
| Diversified Small Cap Fund | | Large Cap Growth Fund | | Specialized Technology Fund |
| Emerging Growth Fund | | Large Company Value Fund | | Strategic Large Cap Growth Fund |
| Emerging Markets Equity Fund | | Mid Cap Growth Fund | | Traditional Small Cap Growth Fund |
Endeavor Select Fund† | | Omega Growth Fund | | Utility and Telecommunications Fund |
| | | | | |
Bond Funds | | | | |
| |
| Adjustable Rate Government Fund | | Inflation-Protected Bond Fund | | Short-Term Bond Fund |
| California Limited-Term Tax-Free Fund | | Intermediate Tax/AMT-Free Fund | | Short-Term High Yield Bond Fund |
| California Tax-Free Fund | | International Bond Fund | | Short-Term Municipal Bond Fund |
| Colorado Tax-Free Fund | | Minnesota Tax-Free Fund | | Strategic Municipal Bond Fund |
| Government Securities Fund | | Municipal Bond Fund | | Total Return Bond Fund |
| High Income Fund | | North Carolina Tax-Free Fund | | Ultra Short-Term Income Fund |
| High Yield Bond Fund | | Pennsylvania Tax-Free Fund | | Ultra Short-Term Municipal Income Fund |
| Income Plus Fund | | Short Duration Government Bond Fund | | Wisconsin Tax-Free Fund |
| | | | | |
Asset Allocation Funds | | | | |
| |
| Asset Allocation Fund | | WealthBuilder Equity Portfolio† | | Target 2020 Fund† |
| Conservative Allocation Fund | | WealthBuilder Growth Allocation Portfolio† | | Target 2025 Fund† |
| Diversified Capital Builder Fund | | WealthBuilder Growth Balanced Portfolio† | | Target 2030 Fund† |
| Diversified Income Builder Fund | | WealthBuilder Moderate Balanced Portfolio† | | Target 2035 Fund† |
| Growth Balanced Fund | | WealthBuilder Tactical Equity Portfolio† | | Target 2040 Fund† |
| Index Asset Allocation Fund | | Target Today Fund† | | Target 2045 Fund† |
| Moderate Balanced Fund | | Target 2010 Fund† | | Target 2050 Fund† |
WealthBuilder Conservative Allocation Portfolio† | | Target 2015 Fund† | | |
| | | | | |
Money Market Funds | | | | |
| |
| 100% Treasury Money Market Fund | | Minnesota Money Market Fund | | New Jersey Municipal Money Market Fund |
| California Municipal Money Market Fund | | Money Market Fund | | New York Municipal Money Market Fund |
| Cash Investment Money Market Fund | | Municipal Cash Management Money Market Fund | | Pennsylvania Municipal Money Market Fund |
| Government Money Market Fund | | Municipal Money Market Fund | | Prime Investment Money Market Fund |
Heritage Money Market Fund† | | National Tax-Free Money Market Fund | | Treasury Plus Money Market Fund |
| | | | | |
Variable Trust Funds1 | | | | |
| |
| VT Core Equity Fund | | VT Intrinsic Value Fund | | VT Small Cap Value Fund |
VT Discovery Fund† | | VT Omega Growth Fund | | VT Total Return Bond Fund |
| VT Index Asset Allocation Fund | | VT Opportunity Fund† | | |
| VT International Equity Fund | | VT Small Cap Growth Fund | | |
An investment in a money market fund is not insured or guaranteed by the Federal Deposit Insurance Corporation or any other government agency. Although the Wells Fargo Advantage Money Market Funds seek to preserve the value of your investment at $1.00 per share, it is possible to lose money by investing in a money market fund.
| | |
| 1. | | The Variable Trust Funds are generally available only through insurance company variable contracts. |
| |
| † | | In this report, the Wells Fargo Advantage Discovery FundSM, Wells Fargo Advantage Endeavor Select FundSM, Wells Fargo Advantage Enterprise FundSM, Wells Fargo Advantage Opportunity FundSM, Wells Fargo Advantage Social Sustainability FundSM, Wells Fargo Advantage WealthBuilder Conservative Allocation PortfolioSM, Wells Fargo Advantage WealthBuilder Equity PortfolioSM, Wells Fargo Advantage WealthBuilder Growth Allocation PortfolioSM, Wells Fargo Advantage WealthBuilder Growth Balanced PortfolioSM, Wells Fargo Advantage WealthBuilder Moderate Balanced PortfolioSM, Wells Fargo Advantage WealthBuilder Tactical Equity PortfolioSM, Wells Fargo Advantage Dow Jones Target Today FundSM, Wells Fargo Advantage Dow Jones Target 2010 FundSM, Wells Fargo Advantage Dow Jones Target 2015 FundSM, Wells Fargo Advantage Dow Jones Target 2020 FundSM, Wells Fargo Advantage Dow Jones Target 2025 FundSM, Wells Fargo Advantage Dow Jones Target 2030 FundSM, Wells Fargo Advantage Dow Jones Target 2035 FundSM, Wells Fargo Advantage Dow Jones Target 2040 FundSM, Wells Fargo Advantage Dow Jones Target 2045 FundSM, Wells Fargo Advantage Dow Jones Target 2050 FundSM, Wells Fargo Advantage Heritage Money Market FundSM, Wells Fargo Advantage VT Discovery FundSM, and Wells Fargo Advantage VT Opportunity FundSM are referred to as the Discovery Fund, Endeavor Select Fund, Enterprise Fund, Opportunity Fund, Social Sustainability Fund, WealthBuilder Conservative Allocation Portfolio, WealthBuilder Equity Portfolio, WealthBuilder Growth Allocation Portfolio, WealthBuilder Growth Balanced Portfolio, WealthBuilder Moderate Balanced Portfolio, WealthBuilder Tactical Equity Portfolio, Target Today Fund, Target 2010 Fund, Target 2015 Fund, Target 2020 Fund, Target 2025 Fund, Target 2030 Fund, Target 2035 Fund, Target 2040 Fund, Target 2045 Fund, Target 2050 Fund, Heritage Money Market Fund, VT Discovery Fund, and VT Opportunity Fund, respectively. |
Not part of the annual report.
| | |
| 2 Wells Fargo Advantage VT Discovery Fund | | Letter to Shareholders |
Karla M. Rabusch,
President
Wells Fargo Advantage Funds
The equity markets delivered strong full-year returns against the backdrop of a strengthening economy.
Dear Valued Shareholder:
We are pleased to provide you with this annual report for the Wells Fargo Advantage VT Discovery Fund for the 12 months that ended December 31, 2010. The equity markets delivered strong full-year returns against the backdrop of a strengthening economy. However, the year was not without its share of macroeconomic challenges and market volatility, once again highlighting the value of a sound, well-diversified investment strategy. As always, we believe that such a strategy can enable investors to balance risks and opportunities as they pursue long-term financial goals in a dynamic market environment.
The economic recovery stayed on track.
The U.S. economic recovery that began in the summer of 2009 gained momentum in 2010, particularly toward the end of the year. Gross domestic product (GDP) grew at an annualized rate of 3.2% in the fourth quarter of 2010—capping a streak of six consecutive quarters of positive GDP growth—and 2.9% for the full year. Although the path of recovery has been uneven at times and growth remains subpar compared with previous recoveries, the general consensus among economists is that the economy will likely avoid a double-dip recession. That said, persistent weakness in the labor and housing markets bears close watching in the months ahead.
Jobs and housing remained troublesome.
At the end of the year, the unemployment rate stood at 9.4%, down from 9.9% a year earlier, but still stubbornly high. Unfortunately, the drop may be attributable more to a decline in the labor force than a meaningful uptick in hiring. In fact, employers added just 1.1 million jobs for all of 2010, suggesting that the improving economy has yet to translate into widespread hiring. Meanwhile, the beleaguered housing market was an ongoing source of concern, despite some tentative late-year signs of stabilization.
Other economic data were more encouraging, reflecting greater confidence in the recovery on the part of both consumers and businesses. Retail sales came in strong at certain points during the year, including the critical holiday shopping season, and industrial production and new orders have picked up. Although still reluctant to hire, businesses have gradually increased spending in other areas, such as equipment and technology. Core inflation, which excludes volatile food and energy prices, remained benign.
The Fed continued to do its part.
With inflation subdued, the Federal Reserve (the Fed) held its target range for the federal funds rate—a proxy for short-term interest rates—steady at 0% to 0.25%. In its final statement of 2010, the Fed noted that economic expansion continues to be restrained by headwinds such as high unemployment, modest income growth, lower housing wealth, and tight credit. As a result, the Fed indicated that it intends to keep short-term rates at historically low levels for as long as needed to promote a more robust recovery.
| | |
| Letter to Shareholders | | Wells Fargo Advantage VT Discovery Fund 3 |
The Fed also stated that it plans to proceed with other stimulus measures, including its second round of quantitative easing (QE2)—a plan to purchase $600 billion in long-term Treasury securities by mid-2011. The ‘preannouncement’ of QE2 in the third quarter of 2010 marked a turning point for the equity markets in that it ushered in a favorable shift in investor sentiment. By and large, investors interpreted the plan as further evidence of the Fed’s commitment to avoiding deflation and spurring economic growth.
2010 was another solid year for equities.
QE2 was certainly not the only catalyst for the equity markets during 2010. Along with more upbeat economic data, better-than-expected corporate earnings power played a role in driving stock prices higher. Throughout the year, quarterly earnings per share for the majority of companies in the S&P 500 Index consistently exceeded Wall Street estimates. As 2010 drew to a close, the midterm congressional elections and the extension of the Bush-era tax cuts provided additional tailwinds, helping the markets finish the year on a strong note.
It was the second straight year of double-digit total returns for the broad equity market indexes. The S&P 500 Index and the Dow Jones Industrial Average advanced 15.1% and 14.1%, respectively, while the tech-heavy NASDAQ Composite Index returned 18.2%. Investors were generally rewarded across the market-capitalization spectrum—with small- and mid-cap stocks outpacing large-cap stocks—as well as across most economic sectors. In terms of investment styles, growth stocks outperformed their value counterparts for the year.
To be sure, the gains were hard-earned, as the markets had to contend with numerous issues along the way, including the European sovereign debt crisis, China’s efforts to slow growth, and doubts about the sustainability of the domestic recovery. The second quarter in particular witnessed bouts of heightened market volatility, most notably the so-called “flash crash” in May. As the year progressed, however, volatility—as measured by the Chicago Board Options Exchange Volatility Index—abated amid reduced fears of a double-dip recession.
Investors should keep a long-term perspective.
In our view, the equity markets’ dramatic rebound over the past two years from a severe downturn underscores the importance of maintaining a disciplined, long-term investment strategy through changing market cycles. By staying focused on your long-term goals, you may be better positioned both to navigate falling markets and participate in rising markets.
To help you build a well-diversified strategy based on your personal objectives and risk tolerance, Wells Fargo Advantage Funds® offers more than 120 mutual funds and other investments covering a wide range of asset classes and investment styles. Although diversification cannot guarantee an investment profit or prevent losses, we believe it can be an effective way to manage investment risk and potentially smooth out overall portfolio performance.
Along with more upbeat economic data, better-than-expected corporate earnings power played a role in driving stock prices higher.
| | |
| 4 Wells Fargo Advantage VT Discovery Fund | | Letter to Shareholders |
Thank you for choosing Wells Fargo Advantage Funds. We appreciate your continued confidence in us and are committed to helping you meet your financial needs. If you have any questions about your investments, please contact your investment professional, call us at 1-800-222-8222, or visit wellsfargo.com/advantagefunds.
Sincerely,
Karla M. Rabusch
President
Wells Fargo Advantage Funds
This page is intentionally left blank.
| | |
| 6 Wells Fargo Advantage VT Discovery Fund | | Performance Highlights (Unaudited) |
Wells Fargo Advantage VT Discovery Fund
INVESTMENT OBJECTIVE
The Fund seeks long-term capital appreciation.
INVESTMENT ADVISER
Wells Fargo Funds Management, LLC
SUB-ADVISER
Wells Capital Management Incorporated
PORTFOLIO MANAGERS
James M. Leach, CFA
Thomas J. Pence, CFA
FUND INCEPTION
May 8, 1992
PERFORMANCE SUMMARY
| | | | | |
| 12 MONTH TOTAL RETURN AS OF DECEMBER 31, 2010 | | | | |
| |
| Class 2 | | | 35.54 | % |
Russell 2500TM Growth Index1 | | | 28.86 | % |
Figures quoted represent past performance, which is no guarantee of future results and do not reflect the deduction of taxes that a shareholder may pay on fund distributions or the redemption of fund shares. Investment return and principal value of an investment will fluctuate so that an investor’s shares, when redeemed, may be worth more or less than their original cost. Current performance may be lower or higher than the performance data quoted. Current month-end performance is available by calling 1-866-765-0778. Performance figures of the Fund do not reflect fees charged pursuant to the terms of variable life insurance policies and variable annuity contracts.
The adviser has committed, through April 30, 2011 to waive fees and/or reimburse expenses to maintain the contractual expense cap at 1.15% for the Class 2 shares, excluding acquired fund fees and certain other expenses. Without these reductions, the returns would have been lower. The Fund’s net expense ratio is 1.16% for the Class 2 shares. The Fund’s gross expense ratio is 1.36% for Class 2 shares.
| | |
| 1. | | The Russell 2500TM Growth Index measures the performance of those Russell 2500 companies with higher price-to-book ratios and higher forecasted growth values. You cannot invest directly in an index. |
| |
| 2. | | The chart compares the performance of the Wells Fargo Advantage VT Discovery Fund Class 2 for the most recent ten years of the Fund with the Russell 2500TM Growth Index. The chart assumes a hypothetical $10,000 investment and reflects all operating expenses of the Fund. |
| | |
| Performance Highlights (Unaudited) | | Wells Fargo Advantage VT Discovery Fund 7 |
Wells Fargo Advantage VT Discovery Fund (continued)
MANAGER’S DISCUSSION
Fund highlights
| ■ | | The Fund outperformed its benchmark, the Russell 2500TM Growth Index, over the 12-month period that ended December 31, 2010. |
| |
| ■ | | Strong stock selection in the industrials, energy, and information technology sectors contributed to performance, while holdings in telecommunication services were a slight headwind. |
| |
| ■ | | Investor sentiment swung wildly during the period, with the majority of our outperformance occurring in the second half of the year. As the economic recovery strengthened, our emphasis on strong, secular growth companies was rewarded. |
| |
| ■ | | We remain focused on bottom-up stock selection and on maintaining an appropriate balance between risk and return potential. |
2010 was an eventful year.
Following a remarkably strong rebound in corporate earnings, 2010 began amid improved prospects for a sustainable economic recovery. As the year unfolded, however, a number of macro risks emerged to dampen investor confidence and create market volatility, including the sovereign debt crisis in Europe, concerns over deficit spending, and indications of slowing growth in China. Toward the end of the year, sentiment again shifted as better-than-expected economic data combined with the Federal Reserve’s second round of quantitative easing (QE2), the midterm elections, and pro-growth tax legislation to lift investor optimism and fuel a powerful, broad-based market rally.
Stock selection drove outperformance.
Strong stock selection in the industrials, energy, and information technology sectors added meaningfully to the Fund’s outperformance. Dollar Thrifty Automotive Group and United Continental Holdings Inc. both generated robust returns, as rationalized capacity combined with a strong rebound in corporate expense budgets. Medium-sized energy exploration and production companies more leveraged to oil than natural gas also performed well, with Concho Resources and Pioneer Natural Resources up more than 80% each. Finally, data processing and storage companies Isilon Systems
| | | | | |
| TEN LARGEST EQUITY HOLDINGS3 | | | | |
| (AS OF DECEMBER 31, 2010) | | | | |
| |
| BorgWarner Incorporated | | | 2.52 | % |
| SBA Communications Corporation Class A | | | 2.47 | % |
| Concho Resources Incorporated | | | 2.16 | % |
| Alexion Pharmaceuticals Incorporated | | | 2.15 | % |
| Pioneer Natural Resources Company | | | 2.11 | % |
| Equinix Incorporated | | | 1.84 | % |
| NetLogic Microsystems Incorporated | | | 1.73 | % |
| Wabco Holdings Incorporated | | | 1.70 | % |
| Guess Incorporated | | | 1.68 | % |
| Dick’s Sporting Goods Incorporated | | | 1.68 | % |
| | |
| 3. | | The ten largest equity holdings are calculated based on the value of the securities divided by total investments of the Fund. Holdings are subject to change and may have changed since the date specified. |
| | |
| 8 Wells Fargo Advantage VT Discovery Fund | | Performance Highlights (Unaudited) |
Wells Fargo Advantage VT Discovery Fund (continued)
Incorporated and Netezza Corporation were notable contributors, as both companies benefited from growth in digitization, which has resulted in greater demand for storage and storage file systems.
Although the impact was fairly minor, stock selection in the telecommunication services sector hurt the Fund’s relative results. Our thesis on Neutral Tandem, a maker of communication switches, was based on increased communications originating from nontraditional sources such as cellular phones and cable operators. With a broad national network and with minutes of use increasing, we anticipated substantial growth for the company. Unfortunately, stiff pricing competition from regional competitors resulted in changing fundamentals, leading us to sell the stock.
We focused on secular growth themes.
We have positioned the portfolio to favor companies with attractive valuations and strong earnings growth prospects, particularly those that are likely to differentiate themselves through secular, rather than cyclical, growth drivers. Throughout the year, we rotated out of some cyclical exposures, or “developing situations,” and into companies that can generate higher visible growth—what we refer to as “core” growth names. Key secular growth themes guiding our recent portfolio decisions include innovative new products, information technology equipment, emerging markets, and market share gainers.
We are optimistic entering 2011.
As we proceed into 2011, we believe that many companies exhibit sound balance sheets, strong free cash flows, and reasonable share valuations. Accordingly, we remain upbeat about prospects for continued corporate earnings growth and positive equity returns.
It appears that the long-awaited transition from government stimulus to private-sector spending is finally occurring. After years of frugality, and with new tax incentives serving as a catalyst, company management teams are beginning to invest their massive cash reserves in research and development, capital equipment, technology, and labor. As a precursor to future capital spending, share repurchases and merger and acquisition activity increased during 2010. We also believe that consumer confidence and spending will continue to improve as the labor market
| | |
| 4. | | Sector distribution is subject to change and is calculated based on the total common stock investments of the Fund. |
| | |
| Performance Highlights (Unaudited) | | Wells Fargo Advantage VT Discovery Fund 9 |
Wells Fargo Advantage VT Discovery Fund (continued)
slowly recovers. As top-line demand picks up, many companies are poised for incremental profit margin expansion that will drive further earnings growth.
Global investors appear to be taking notice of these trends, providing a potential tailwind for U.S. stocks. In fact, we believe that we are seeing a shift from a “cyclical” to a “secular” investing environment in which investors will be more apt to reward companies with solid revenue and earnings growth. Such an environment has historically been conducive to our fundamental stock selection, or what we like to call “surrounding the company.”
| | |
| 10 Wells Fargo Advantage VT Discovery Fund | | Performance Highlights (Unaudited) |
Wells Fargo Advantage VT Discovery Fund (continued)
AVERAGE ANNUAL TOTAL RETURN (%) (AS OF DECEMBER 31, 2010)
| | | | | | | | | | | | | | | | | | | | | | | | | | | |
| | | | | | | | | | | | | | | | | | | | | Expense Ratios5 |
| | | Inception Date | | 6 Months* | | 1 Year | | 5 Year | | 10 Year | | Gross | | Net6 |
| |
| Class 2 | | 5/8/1992 | | | 32.26 | | | | 35.54 | | | | 8.21 | | | | 9.03 | | | | 1.36 | % | | | 1.16 | % |
Russell 2500TM Growth Index1 | | | | | 31.25 | | | | 28.86 | | | | 5.63 | | | | 4.19 | | | | | | | | | |
| | |
| * | | Returns for periods of less than one year are not annualized. |
Figures quoted represent past performance, which is no guarantee of future results and do not reflect the deduction of taxes that a shareholder may pay on fund distributions or the redemption of fund shares. Investment return and principal value of an investment will fluctuate so that an investor’s shares, when redeemed, may be worth more or less than their original cost. Current performance may be lower or higher than the performance data quoted. Current month-end performance is available by calling 1-866-765-0778. Performance figures of the Fund do not reflect fees charged pursuant to the terms of variable life insurance policies and variable annuity contracts.
Please keep in mind that high double-digit returns were primarily achieved during favorable market conditions. You should not expect that such favorable returns can be consistently achieved. A Fund’s performance, especially for very short time periods, should not be the sole factor in making your investment decision.
Stock fund values fluctuate in response to the activities of individual companies and general market and economic conditions. Smaller company stocks tend to be more volatile and less liquid than those of larger companies. The use of derivatives may reduce returns and/or increase volatility. Active trading results in increased turnover and trading expenses and may generate higher short-term capital gains. Certain investment strategies tend to increase the total risk of an investment (relative to the broader market). This Fund is exposed to foreign investment risk. Consult the Fund’s prospectus for additional information on these and other risks.
Please refer to the prospectus provided by your participating insurance company for detailed information describing the separate accounts for information regarding surrender charges, mortality and expense risk fees and other charges that may be assessed by the participating insurance companies.
| | |
| 5. | | Reflects the expense ratio as stated in the May 1, 2010 prospectus. |
| |
| 6. | | The investment adviser has contractually committed through April 30, 2011 to waive fees and/or reimburse expenses maintain the Fund’s contractual expense ratio for Class 2 shares at 1.15%, excluding acquired fund fees and certain other expenses. Without these reductions, the Fund’s returns would have been lower. |
| | |
| Fund Expenses (Unaudited) | | Wells Fargo Advantage VT Discovery Fund 11 |
As a shareholder of the Fund, you incur two types of costs: (1) transaction costs, including sales charges (loads) on purchase payments, redemption fees (if any) and exchange fees (if any); and (2) ongoing costs, including management fees; distribution (12b-1) and/or shareholder service fees; and other Fund expenses. This example is intended to help you understand your ongoing costs (in dollars) of investing in the Fund and to compare these costs with the ongoing costs of investing in other mutual funds.
The example is based on an investment of $1,000 invested at the beginning of the six-month period and held for the entire period from July 1, 2010 to December 31, 2010.
Actual expenses
The “Actual” line of the table below provides information about actual account values and actual expenses. You may use the information in this line, together with the amount you invested, to estimate the expenses that you paid over the period. Simply divide your account value by $1,000 (for example, an $8,600 account value divided by $1,000 = 8.6), then multiply the result by the number in the “Actual” line under the heading entitled “Expenses Paid During Period” for your applicable class of shares to estimate the expenses you paid on your account during this period.
Hypothetical example for comparison purposes
The “Hypothetical” line of the table below provides information about hypothetical account values and hypothetical expenses based on the Fund’s actual expense ratio and an assumed rate of return of 5% per year before expenses, which is not the Fund’s actual return. The hypothetical account values and expenses may not be used to estimate the actual ending account balance or expenses you paid for the period. You may use this information to compare the ongoing costs of investing in the Fund and other funds. To do so, compare this 5% hypothetical example with the 5% hypothetical examples that appear in the shareholder reports of the other funds.
Please note that the expenses shown in the table are meant to highlight your ongoing costs only and do not reflect any transactional costs, such as sales charges (loads), redemption fees, exchange fees or separate account charges assessed by participating insurance companies. Therefore, the “Hypothetical” line of the table is useful in comparing ongoing costs only, and will not help you determine the relative total costs of owning different funds. In addition, if these transactional costs were included, your costs would have been higher.
| | | | | | | | | | | | | | | | | |
| | | Beginning | | Ending | | Expenses | | |
| | | Account Value | | Account Value | | Paid During | | Net Annual |
| | | 07-01-2010 | | 12-31-2010 | | the Period1 | | Expense Ratio |
| |
Class 2 | | | | | | | | | | | | | | | | |
| Actual | | $ | 1,000.00 | | | $ | 1,322.56 | | | $ | 6.81 | | | | 1.15 | % |
| Hypothetical (5% return before expenses) | | $ | 1,000.00 | | | $ | 1,019.62 | | | $ | 5.92 | | | | 1.15 | % |
| | |
| 1. | | Expenses are equal to the Fund’s annualized expense ratio multiplied by the average account value over the period, multiplied by the number of days in the most recent fiscal half-year divided by the number of days in the fiscal year (to reflect the one half year period.) |
| | |
| 12 Wells Fargo Advantage VT Discovery Fund | | Portfolio of Investments—December 31, 2010 |
| | | | | | | | | |
| Shares | | | Security Name | | Value | |
| Common Stocks: 97.60% | | | | |
| | | | | | | | | |
| Consumer Discretionary: 23.48% | | | | |
| | | | | | | | | |
| Auto Components: 4.51% | | | | |
| | 45,400 | | | BorgWarner Incorporated†« | | $ | 3,285,144 | |
| | 32,400 | | | TRW Automotive Holdings Corporation† | | | 1,707,480 | |
| | | | | | | | | |
| | | | | | | | 4,992,624 | |
| | | | | | | | |
| | | | | | | | | |
| Diversified Consumer Services: 1.47% | | | | |
| | 28,800 | | | Coinstar Incorporated†« | | | 1,625,472 | |
| | | | | | | | |
| | | | | | | | | |
| Hotels, Restaurants & Leisure: 2.56% | | | | |
| | 13,900 | | | Panera Bread Company†« | | | 1,406,819 | |
| | 83,600 | | | Texas Roadhouse Incorporated† | | | 1,435,412 | |
| | | | | | | | | |
| | | | | | | | 2,842,231 | |
| | | | | | | | |
| | | | | |
| Internet & Catalog Retail: 1.62% | | | | |
| | 4,500 | | | Priceline.com Incorporated† | | | 1,797,975 | |
| | | | | | | | |
| | | | | | | | | |
| Media: 3.14% | | | | |
| | 31,500 | | | Scripps Networks Interactive Incorporated | | | 1,630,125 | |
| | 67,900 | | | Virgin Media Incorporated« | | | 1,849,596 | |
| | | | | | | | | |
| | | | | | | | 3,479,721 | |
| | | | | | | | |
| | | | | | | | | |
| Specialty Retail: 10.18% | | | | |
| | 58,300 | | | Dick’s Sporting Goods Incorporated†« | | | 2,186,250 | |
| | 21,500 | | | Genesco Incorporated† | | | 806,035 | |
| | 46,400 | | | Guess Incorporated | | | 2,195,648 | |
| | 64,583 | | | HHGregg Incorporated†« | | | 1,353,014 | |
| | 18,300 | | | Jo Ann Stores Incorporated† | | | 1,102,026 | |
| | 60,814 | | | Penske Auto Group Incorporated†« | | | 1,059,380 | |
| | 31,500 | | | Urban Outfitters Incorporated† | | | 1,128,015 | |
| | 42,900 | | | Vitamin Shoppe Incorporated† | | | 1,443,156 | |
| | | | | | | | | |
| | | | | | | | 11,273,524 | |
| | | | | | | | |
| | | | | |
| Consumer Staples: 1.02% | | | | |
| | | | | | | | | |
| Food & Staples Retailing: 1.02% | | | | |
| | 23,500 | | | BJ’s Wholesale Club Incorporated† | | | 1,125,650 | |
| | | | | | | | |
| | | | | | | | | |
| Energy: 8.29% | | | | |
| | | | | | | | | |
| Oil, Gas & Consumable Fuels: 8.29% | | | | |
| | 71,500 | | | Brigham Exploration Company† | | | 1,947,660 | |
| | 32,100 | | | Concho Resources Incorporated† | | | 2,814,207 | |
| | 31,700 | | | Pioneer Natural Resources Company | | | 2,752,194 | |
| | 42,569 | | | Swift Energy Company† | | | 1,666,576 | |
| | | | | | | | | |
| | | | | | | | 9,180,637 | |
| | | | | | | | |
| | | | | | | | | |
| Financials: 2.99% | | | | |
| | | | | | | | | |
| Commercial Banks: 1.21% | | | | |
| | 40,700 | | | Wintrust Financial Corporation« | | | 1,344,321 | |
| | | | | | | | |
| | | | | | | | | |
| Insurance: 1.78% | | | | |
| | 41,350 | | | Aspen Insurance Holdings Limited | | | 1,183,437 | |
| | 17,082 | | | Endurance Specialty Holdings Limited | | | 786,968 | |
| | | | | | | | | |
| | | | | | | | 1,970,405 | |
| | | | | | | | |
| | |
| Portfolio of Investments—December 31, 2010 | | Wells Fargo Advantage VT Discovery Fund 13 |
| | | | | | | | | |
| Shares | | | Security Name | | Value |
| Health Care: 11.73% | | | | |
| | | | | | | | | |
| Biotechnology: 3.70% | | | | |
| | 34,800 | | | Alexion Pharmaceuticals Incorporated†« | | $ | 2,803,140 | |
| | 29,900 | | | Pharmasset Incorporated† | | | 1,297,959 | |
| | | | | | | | | |
| | | | | | | | 4,101,099 | |
| | | | | | | | | |
| | | | | | | | | |
| Health Care Equipment & Supplies: 3.92% | | | | |
| | 18,887 | | | Alere Incorporated†« | | | 691,264 | |
| | 34,279 | | | Sirona Dental Systems Incorporated† | | | 1,432,177 | |
| | 16,300 | | | Varian Medical Systems Incorporated†« | | | 1,129,264 | |
| | 39,800 | | | Volcano Corporation† | | | 1,086,938 | |
| | | | | | | | | |
| | | | | | | | 4,339,643 | |
| | | | | | | | | |
| | | | | | | | | |
| Health Care Providers & Services: 2.80% | | | | |
| | 27,100 | | | AmerisourceBergen Corporation | | | 924,652 | |
| | 33,683 | | | Emergency Medical Services Corporation† | | | 2,176,259 | |
| | | | | | | | | |
| | | | | | | | 3,100,911 | |
| | | | | | | | | |
| | | | | | | | | |
| Life Sciences Tools & Services: 1.31% | | | | |
| | 87,800 | | | Bruker BioSciences Corporation† | | | 1,457,480 | |
| | | | | | | | |
| | | | | |
| Industrials: 18.68% | | | | |
| | | | | |
| Aerospace & Defense: 3.25% | | | | |
| | 37,300 | | | Embraer SA ADR | | | 1,096,620 | |
| | 32,164 | | | GeoEye Incorporated† | | | 1,363,432 | |
| | 15,800 | | | Transdign Group Incorporated† | | | 1,137,758 | |
| | | | | | | | | |
| | | | | | | | 3,597,810 | |
| | | | | | | | | |
| | | | | | | | | |
| Air Freight & Logistics: 1.33% | | | | |
| | 26,500 | | | Atlas Air Worldwide Holdings Incorporated† | | | 1,479,495 | |
| | | | | | | | |
| | | | | |
| Airlines: 2.24% | | | | |
| | 55,400 | | | Delta Air Lines Incorporated† | | | 698,040 | |
| | 75,100 | | | United Continental Holdings Incorporated†« | | | 1,788,882 | |
| | | | | | | | | |
| | | | | | | | 2,486,922 | |
| | | | | | | | | |
| | | | | | | | | |
| Electrical Equipment: 1.61% | | | | |
| | 33,800 | | | Wesco International Incorporated† | | | 1,784,640 | |
| | | | | | | | |
| | | | | |
| Machinery: 6.15% | | | | |
| | 31,600 | | | AGCO Corporation† | | | 1,600,856 | |
| | 51,200 | | | Kennametal Incorporated | | | 2,020,352 | |
| | 11,300 | | | Parker Hannifin Corporation | | | 975,190 | |
| | 36,379 | | | Wabco Holdings Incorporated† | | | 2,216,572 | |
| | | | | | | | | |
| | | | | | | | 6,812,970 | |
| | | | | | | | | |
| | | | | | | | | |
| Professional Services: 1.04% | | | | |
| | 18,300 | | | Manpower Incorporated | | | 1,148,508 | |
| | | | | | | | |
| | | | | |
| Road & Rail: 3.06% | | | | |
| | 82,000 | | | Avis Budget Group Incorporated†« | | | 1,275,920 | |
| | 44,100 | | | Kansas City Southern† | | | 2,110,626 | |
| | | | | | | | | |
| | | | | | | | 3,386,546 | |
| | | | | | | | | |
| | |
| 14 Wells Fargo Advantage VT Discovery Fund | | Portfolio of Investments—December 31, 2010 |
| | | | | | | | | |
| Shares | | | Security Name | | Value | |
| Information Technology: 24.05% | | | | |
| | | | | | | | | |
| Communications Equipment: 5.47% | | | | |
| | 25,900 | | | Acme Packet Incorporated† | | $ | 1,376,844 | |
| | 12,600 | | | F5 Networks Incorporated† | | | 1,640,016 | |
| | 70,739 | | | Finisar Corporation†« | | | 2,100,241 | |
| | 31,101 | | | Hisoft Technology International Limited† | | | 939,250 | |
| | | | | | | | | |
| | | | | | | | 6,056,351 | |
| | | | | | | | |
| | | | | | | | | |
| Internet Software & Services: 3.16% | | | | |
| | 29,563 | | | Equinix Incorporated† | | | 2,402,289 | |
| | 15,600 | | | OpenTable Incorporated† | | | 1,099,488 | |
| | | | | | | | | |
| | | | | | | | 3,501,777 | |
| | | | | | | | |
| | | | | | | | | |
| IT Services: 2.76% | | | | |
| | 54,600 | | | Gartner Incorporated† | | | 1,812,720 | |
| | 103,170 | | | Sapient Corporation | | | 1,248,357 | |
| | | | | | | | | |
| | | | | | | | 3,061,077 | |
| | | | | | | | |
| | | | | | | | | |
| Semiconductors & Semiconductor Equipment: 4.56% | | | | |
| | 89,000 | | | ARM Holdings plc ADR« | | | 1,846,750 | |
| | 76,700 | | | Atmel Corporation† | | | 944,944 | |
| | 71,900 | | | NetLogic Microsystems Incorporated†« | | | 2,258,379 | |
| | | | | | | | | |
| | | | | | | | 5,050,073 | |
| | | | | | | | |
| | | | | | | | | |
| Software: 8.10% | | | | |
| | 27,200 | | | Concur Technologies Incorporated†« | | | 1,412,496 | |
| | 32,242 | | | Longtop Financial Technologies Limited ADR† | | | 1,166,516 | |
| | 49,075 | | | Reald Incorporated† | | | 1,272,024 | |
| | 24,200 | | | Red Hat Incorporated† | | | 1,104,730 | |
| | 72,550 | | | SuccessFactors Incorporated†« | | | 2,101,048 | |
| | 96,900 | | | TIBCO Software Incorporated† | | | 1,909,899 | |
| | | | | | | | | |
| | | | | | | | 8,966,713 | |
| | | | | | | | |
| | | | | | | | | |
| Materials: 1.55% | | | | |
| | | | | | | | | |
| Chemicals: 0.42% | | | | |
| | 10,900 | | | Kronos Worldwide Incorporated | | | 463,141 | |
| | | | | | | | |
| | | | | |
| Containers & Packaging: 1.13% | | | | |
| | 38,400 | | | Bemis Company Incorporated | | | 1,254,144 | |
| | | | | | | | |
| | | | | | | | | |
| Telecommunication Services: 5.81% | | | | |
| | | | | | | | | |
| Diversified Telecommunication Services: 1.26% | | | | |
| | 169,200 | | | Iradium Communications Incorporated†« | | | 1,395,900 | |
| | | | | | | | |
| | | | | | | | | |
| Wireless Telecommunication Services: 4.55% | | | | |
| | 40,800 | | | NII Holdings Incorporated† | | | 1,822,128 | |
| | 78,600 | | | SBA Communications Corporation Class A† | | | 3,217,884 | |
| | | | | | | | | |
| | | | | | | | 5,040,012 | |
| | | | | | | | |
| | | | | | | | | |
| Total Common Stocks (Cost $77,958,682) | | | 108,117,772 | |
| | | | | | | | |
| | |
| Portfolio of Investments—December 31, 2010 | | Wells Fargo Advantage VT Discovery Fund 15 |
| | | | | | | | | | | | | | | | | | | | | |
| Principal | | | Security Name | | | | | | Interest Rate | | Maturity Date | | | Value | |
| Short-Term Investments: 20.07% | | | | | | | | | | | | | | | | |
| | | | | | | | | | | | | | | | | | | | | |
| Corporate Bonds & Notes: 0.72% | | | | | | | | | | | | | | | | |
| $ | 695,233 | | | Gryphon Funding Limited(v)(a)(i) | | | | | | | 0.00 | % | | | 08/05/2011 | | | $ | 282,404 | |
| | 914,487 | | | VFNC Corporation(v)±††(a)(i) | | | | | | | 0.26 | | | | 09/29/2011 | | | | 512,113 | |
| | | | | | | | | | | | | | | | | | | | | |
| | | | | | | | | | | | | | | | | | | | 794,517 | |
| Shares | | | | | | | | | Yield | | | | | | | | |
| Investment Companies: 19.35% | | | | | | | | | | | | | | | | |
| | 2,769,183 | | | Wells Fargo Advantage Cash Investment Money Market Fund(l)(u) | | | | | | | 0.14 | | | | | | | | 2,769,183 | |
| | 18,665,349 | | | Wells Fargo Securities Lending Cash Investments, LLC(v)(l)(u) | | | | | | | 0.27 | | | | | | | | 18,665,349 | |
| | | | | | | | | | | | | | | | | | | | | |
| | | | | | | | | | | | | | | | | | | | 21,434,532 | |
| | | | | | | | | | | | | | | | | | | | |
| | | | | | | | | | | | | | | | | | | | | |
| Total Short-Term Investments (Cost $21,937,477) | | | | | | | | | | | | | | | 22,229,049 | |
| | | | | | | | | | | | | | | | | | | | |
| | | | | | | | | | | | | | | | | | | | | |
| Total Investments in Securities (Cost $99,896,159)* | | | 117.67 | % | | | | | | | | | | | 130,346,821 | |
| | | | | | | | | | | | | | | | | | | | | |
| Other Assets and Liabilities, Net | | | (17.67 | ) | | | | | | | | | | | (19,591,603 | ) |
| | | | | | | | | | | | | | | | | | | |
| | | | | | | | | | | | | | | | | | | | | |
| Total Net Assets | | | 100.00 | % | | | | | | | | | | $ | 110,755,218 | |
| | | | | | | | | | | | | | | | | | | |
| | |
| (v) | | Security represents investment of cash collateral received from securities on loan. |
| |
| † | | Non-income earning securities. |
| |
| (l) | | Investment in an affiliate. |
| |
| « | | All or a portion of this security is on loan. |
| |
| ± | | Variable rate investments. |
| |
| †† | | Securities that may be resold to “qualified institutional buyers” under Rule 144A or securities offered pursuant to Section 4(2) of the Securities Act of 1933, as amended. |
| |
| (a) | | Security is fair valued by the Management Valuation Team, and in certain instances by the Board of Trustees, in accordance with procedures approved by the Board of Trustees. |
| |
| (i) | | Illiquid security for which the designation as illiquid is unaudited. |
| |
| (u) | | Rate shown is the 7-day annualized yield at period end. |
| |
| * | | Cost for federal income tax purposes is $100,625,482 and net unrealized appreciation (depreciation) consists of: |
| | | | | |
|
| Gross unrealized appreciation | | $ | 30,970,619 | |
| Gross unrealized depreciation | | | (1,249,280 | ) |
| | | | |
| Net unrealized appreciation | | $ | 29,721,339 | |
The accompanying notes are an integral part of these financial statements.
| | |
| 16 Wells Fargo Advantage VT Discovery Fund | | Statement of Assets and Liabilities—December 31, 2010 |
| | | | | |
|
Assets | | | | |
| Investments | | | | |
| In unaffiliated securities (including securities on loan), at value | | $ | 108,912,289 | |
| In affiliated securities, at value | | | 21,434,532 | |
| | | | |
| Total investments, at value (see cost below) | | | 130,346,821 | |
| Receivable for Fund shares sold | | | 105,460 | |
| Receivable for dividends | | | 17,821 | |
| Receivable for securities lending income | | | 2,763 | |
| Prepaid expenses and other assets | | | 1,146 | |
| | | | |
| Total assets | | | 130,474,011 | |
| | | | |
| | | | | |
Liabilities | | | | |
| Payable for investments purchased | | | 57,837 | |
| Payable for Fund shares redeemed | | | 322,561 | |
| Payable upon receipt of securities loaned | | | 19,168,293 | |
| Investment advisory fee payable | | | 69,889 | |
| Distribution fees payable | | | 24,896 | |
| Due to other related parties | | | 11,943 | |
| Accrued expenses and other liabilities | | | 63,374 | |
| | | | |
| Total liabilities | | | 19,718,793 | |
| | | | |
Total net assets | | $ | 110,755,218 | |
| | | | |
| | | | | |
NET ASSETS CONSIST OF | | | | |
| Paid-in capital | | $ | 113,756,807 | |
| Accumulated net realized losses on investments | | | (33,452,251 | ) |
| Net unrealized gains on investments | | | 30,450,662 | |
| | | | |
Total net assets | | $ | 110,755,218 | |
| | | | |
| | | | | |
COMPUTATION OF NET ASSET VALUE PER SHARE1 | | | | |
| Net assets — Class 2 | | $ | 110,755,218 | |
| Shares outstanding — Class 2 | | | 5,204,486 | |
| Net asset value and offering price per share — Class 2 | | $ | 21.28 | |
| | | | |
| | | | | |
| Total investments, at cost | | $ | 99,896,159 | |
| | | | |
| Securities on loan, at value | | $ | 18,657,008 | |
| | | | |
| | |
| 1. | | The Fund has on unlimited number of authorized shares. |
The accompanying notes are an integral part of these financial statements.
| | |
| Statement of Operations—For the Year Ended December 31, 2010 | | Wells Fargo Advantage VT Discovery Fund 17 |
| | | | | |
|
Investment income | | | | |
| Dividends | | $ | 342,406 | |
| Income from affiliated securities | | | 3,850 | |
| Securities lending income, net | | | 65,446 | |
| | | | |
| Total investment income | | | 411,702 | |
| | | | |
| | | | | |
Expenses | | | | |
| Investment advisory fee | | | 677,234 | |
| Administration fees | | | | |
| Fund level | | | 97,956 | |
Class 21 | | | 37,528 | |
| Distribution fees | | | | |
Class 21 | | | 233,684 | |
| Custody and accounting fees | | | 18,335 | |
| Professional fees | | | 35,254 | |
| Shareholder report expenses | | | 63,479 | |
| Trustees’ fees and expenses | | | 10,549 | |
| Other fees and expenses | | | 4,237 | |
| | | | |
| Total expenses | | | 1,178,256 | |
| Less: Fee waivers and/or expense reimbursements | | | (104,996 | ) |
| | | | |
| Net expenses | | | 1,073,260 | |
| | | | |
| Net investment loss | | | (661,558 | ) |
| | | | |
| | | | | |
NET REALIZED AND UNREALIZED GAINS (LOSSES) ON INVESTMENTS | | | | |
| Net realized gains on unaffiliated securities | | | 15,071,192 | |
| Net change in unrealized gains (losses) on unaffiliated securities | | | 14,985,606 | |
| | | | |
| Net realized and unrealized gains (losses) on investments | | | 30,056,798 | |
| | | | |
Net increase in net assets resulting from operations | | $ | 29,395,240 | |
| | | | |
| | |
| 1. | | After the close of business on July 16, 2010, existing shares of the Fund were renamed Class 2 shares. |
The accompanying notes are an integral part of these financial statements.
| | |
| 18 Wells Fargo Advantage VT Discovery Fund | | Statements of Changes in Net Assets |
| | | | | | | | | | | | | | | | | |
| | | Year Ended | | | Year Ended | |
| | | December 31, 2010 | | | December 31, 2009 | |
| |
Operations | | | | | | | | | | | | | | | | |
| Net investment loss | | | | | | $ | (661,558 | ) | | | | | | $ | (611,462 | ) |
| Net realized gains (losses) on investments | | | | | | | 15,071,192 | | | | | | | | (16,013,534 | ) |
| Net change in unrealized gains (losses) on investments | | | | | | | 14,985,606 | | | | | | | | 50,911,309 | |
| | | |
| Net increase in net assets resulting from operations | | | | | | | 29,395,240 | | | | | | | | 34,286,313 | |
| | | |
| | | | | | | | | | | | | | | | | |
| | | Shares | | | | | | Shares | | | | |
Capital share transactions | | | | | | | | | | | | | | | | |
Proceeds from shares sold — Class 21 | | | 796,770 | | | | 14,304,397 | | | | 1,433,818 | | | | 17,828,923 | |
Payment for shares redeemed — Class 21 | | | (1,076,715 | ) | | | (19,068,998 | ) | | | (6,063,907 | ) | | | (79,139,381 | ) |
| | | |
| Net decrease in net assets resulting from capital share transactions | | | | | | | (4,764,601 | ) | | | | | | | (61,310,458 | ) |
| | | |
| | | | | | | | | | | | | | | | | |
| Total increase (decrease) in net assets | | | | | | | 24,630,639 | | | | | | | | (27,024,145 | ) |
| | | | | |
Net assets | | | | | | | | | | | | | | | | |
Beginning of period | | | | | | | 86,124,579 | | | | | | | | 113,148,724 | |
| | | |
End of period | | | | | | $ | 110,755,218 | | | | | | | $ | 86,124,579 | |
| | | |
Undistributed net investment income | | | | | | $ | 0 | | | | | | | $ | 0 | |
| | | |
| | |
| 1. | | After the close of business on July 16, 2010, existing shares of the Fund were renamed Class 2 shares. |
The accompanying notes are an integral part of these financial statements.
This page is intentionally left blank.
| | |
| 20 Wells Fargo Advantage VT Discovery Fund | | Financial Highlights |
| | | | | | | | | | | | | | | | | |
| | | Beginning | | | | | | Net Realized | | Ending |
| | | Net Asset | | Net | | and Unrealized | | Net Asset |
| | | Value Per | | Investment | | Gains (Losses) | | Value Per |
| | | Share | | Loss | | on Investments | | Share |
| |
Class 22 | | | | | | | | | | | | | | | | |
| January 1, 2010 to December 31, 2010 | | $ | 15.70 | | | | (0.13 | ) | | | 5.71 | | | $ | 21.28 | |
| January 1, 2009 to December 31, 2009 | | $ | 11.19 | | | | (0.11 | ) | | | 4.62 | | | $ | 15.70 | |
| January 1, 2008 to December 31, 2008 | | $ | 20.11 | | | | (0.11 | ) | | | (8.81 | ) | | $ | 11.19 | |
| January 1, 2007 to December 31, 2007 | | $ | 16.44 | | | | (0.15 | ) | | | 3.82 | | | $ | 20.11 | |
| January 1, 2006 to December 31, 2006 | | $ | 14.34 | | | | (0.13 | ) | | | 2.23 | | | $ | 16.44 | |
| | |
| 1. | | Total return calculations would have been lower had certain expenses not been waived or reimbursed during the periods shown. |
| |
| 2. | | After the close of business on July 16, 2010, existing shares of the Fund were renamed Class 2 shares. |
The accompanying notes are an integral part of these financial statements.
| | |
| Financial Highlights | | Wells Fargo Advantage VT Discovery Fund 21 |
| | | | | | | | | | | | | | | | | | | | | |
| Ratio to Average Net Assets | | | | | | Portfolio | | Net Assets at |
| Net Investment | | Gross | | Net | | Total | | Turnover | | End of Period |
| Loss | | Expenses | | Expenses | | Return1 | | Rate | | (000’s omitted) |
| |
| | | | | | | | | | | | | | | | | | | | | |
| (0.71)% | | | 1.26 | % | | | 1.15 | % | | | 35.54 | % | | | 101 | % | | $ | 110,755 | |
| (0.61)% | | | 1.35 | % | | | 1.15 | % | | | 40.30 | % | | | 208 | % | | $ | 86,125 | |
| (0.63)% | | | 1.27 | % | | | 1.15 | % | | | (44.36 | )% | | | 166 | % | | $ | 113,149 | |
| (0.72)% | | | 1.21 | % | | | 1.15 | % | | | 22.32 | % | | | 135 | % | | $ | 238,894 | |
| (0.76)% | | | 1.21 | % | | | 1.15 | % | | | 14.64 | % | | | 114 | % | | $ | 233,947 | |
| | |
| 22 Wells Fargo Advantage VT Discovery Fund | | Notes to Financial Statements |
1. ORGANIZATION
Wells Fargo Variable Trust (the “Trust”), a Delaware statutory trust organized on March 10, 1999, is an open-end management investment company registered under the Investment Company Act of 1940, as amended (the “1940 Act”). These financial statements report on Wells Fargo Advantage VT Discovery Fund (the “Fund”) which is a diversified series of the Trust. After the close of business on July 16, 2010, existing shares of the Fund were renamed Class 2 shares.
2. SIGNIFICANT ACCOUNTING POLICIES
The following significant accounting policies, which are consistently followed in the preparation of the financial statements of the Fund, are in conformity with U.S. generally accepted accounting principles which require management to make estimates and assumptions that affect the reported amounts of assets and liabilities, disclosure of contingent assets and liabilities at the date of the financial statements, and the reported amounts of revenues and expenses during the reporting period. Actual results could differ from those estimates. Management has considered the circumstances under which the Fund should recognize or make disclosures regarding events or transactions occurring subsequent to the balance sheet date through the date the financial statements are issued. Adjustments or additional disclosures, if any, have been included in these financial statements.
Securities valuation
Investments in securities are valued each business day as of the close of regular trading on the New York Stock Exchange, which is usually 4:00 p.m. (Eastern Time). Securities which are traded on a national or foreign securities exchange are valued at the last reported sales price, except that securities listed on The Nasdaq Stock Market, Inc. (“Nasdaq”) are valued at the Nasdaq Official Closing Price (“NOCP”), and if no NOCP is available, then at the last reported sales price. If no sales price is shown on the Nasdaq, the bid price will be used. In the absence of any sale of securities listed on the Nasdaq, and in the case of other securities, including U.S. Government obligations, but excluding debt securities maturing in 60 days or less, the price will be deemed “stale” and the valuations will be determined in accordance with the Fund’s Fair Valuation Procedures.
Debt securities of sufficient credit quality with original maturities of 60 days or less and any collateral received from securities lending invested in securities generally are valued at amortized cost which approximates fair value. The amortized cost method involves valuing a security at its cost, plus accretion of discount or minus amortization of premium over the period until maturity.
Investments in open-end mutual funds and non-registered investment companies are generally valued at net asset value.
Certain investments which are not valued using any of the methods discussed above, are valued at their fair value, as determined by procedures established in good faith and approved by the Board of Trustees.
The valuation techniques used by the Fund to measure fair value are consistent with the market approach, income approach and/or cost approach, where applicable, for each security type.
Security loans
The Fund may lend its securities from time to time in order to earn additional income in the form of fees or interest on securities received as collateral or the investment of any cash received as collateral. The Fund continues to receive interest or dividends on the securities loaned. The Fund receives collateral in the form of cash or securities with a value at least equal to the value of the securities on loan. The value of the loaned securities is determined at the close of each business day and any additional required collateral is delivered to the Fund on the next business day. In the event of default or bankruptcy by the borrower, the Fund could experience delays and costs in recovering the loaned securities or in gaining access to the collateral. In addition, the investment of any cash collateral received may lose all or part of its value. The Fund has the right under the lending agreement to recover the securities from the borrower on demand.
The Fund lends its securities through an unaffiliated securities lending agent. Cash collateral received in connection with its securities lending transactions is invested in Wells Fargo Securities Lending Cash Investments, LLC (the “Cash Collateral Fund”). The Cash Collateral Fund is exempt from registration under Section 3(c)(7) of the 1940 Act and is managed by Wells Fargo Funds Management LLC (“Funds Management”) and is sub-advised by Wells Capital Management Incorporated (“Wells Capital Management”). Funds Management receives an investment advisory fee
| | |
| Notes to Financial Statements | | Wells Fargo Advantage VT Discovery Fund 23 |
starting at 0.05% and declining to 0.01% as the average daily net assets of the Cash Collateral Fund increase. All of the fees received by Funds Management are paid to Wells Capital Management for its services as sub-adviser. The Cash Collateral Fund seeks to provide a positive return compared to the daily Fed Funds Open rate by investing in high-quality, U.S. dollar-denominated short-term money market instruments. Cash Collateral Fund investments are fair valued based upon the amortized cost valuation technique. Income earned from investment in the Cash Collateral Fund is included in securities lending income on the Statement of Operations.
Prior to April 1, 2010, Wells Fargo Bank, N.A. acted as the securities lending agent for the Fund and was entitled to receive for its services 25% of the revenues earned on the securities lending activities. For the year ended December 31, 2010, Wells Fargo Bank, N.A. waived its share of revenues earned on securities lending activities. Such waivers by Wells Fargo Bank, N.A. had the impact of increasing securities lending income on the Statement of Operations. The value of the securities on loan and the liability to return the collateral are shown on the Statement of Assets and Liabilities.
In a securities lending transaction, the net asset value of the Fund will be affected by an increase or decrease in the value of the securities loaned and by an increase or decrease in the value of instruments in which cash collateral is invested. The amount of securities lending activity undertaken by the Fund fluctuates from time to time. After the occurrence of a default or impairment of structured investment vehicles purchased in a joint account by the Fund’s former securities lending agent, as the various participating Funds’ lending activity fluctuated, their ratable interest in the joint account, including their ratable exposure to the defaulted or impaired structured investment vehicles fluctuated depending on the relative activity of each participating Fund. In order to eliminate the fluctuation of the various participating Funds’ ratable exposure to the defaulted or impaired structured investment vehicles, the adviser to the Funds recommended to the Board of Trustees, and the Board of Trustees approved, actions designed to fix the allocation of percentage ownership in defaulted or impaired structured investment vehicles among all funds participating in securities lending (“side pocketing”) based on each participating Fund’s percentage ownership of the total cash collateral investment joint account as of the date the fixed allocation is implemented. Accordingly, on February 13, 2009 a side pocketing occurred, which fixed each participating Fund’s ownership of defaulted or impaired structured investment vehicle in the joint account based on each participating Fund’s percentage ownership of the joint account as of such date.
Security transactions and income recognition
Securities transactions are recorded on a trade date basis. Realized gains or losses are reported on the basis of identified cost of securities delivered.
Dividend income is recognized on the ex-dividend date.
Distributions to shareholders
Distributions to shareholders from net investment income and net realized gains, if any, are recorded on the ex-dividend date. Such distributions are determined in conformity with income tax regulations, which may differ from generally accepted accounting principles.
The timing and character of distributions made during the period from net investment income or net realized gains may differ from their ultimate characterization for federal income tax purposes. To the extent that these differences are permanent in nature, such amounts are reclassified within the capital accounts based on their federal tax-basis treatment. Temporary differences do not require reclassifications. At December 31, 2010, as a result of permanent book-to-tax differences, the following reclassification adjustments were made on the Statement of Assets and Liabilities:
| | | | | | | | | | | |
| Undistributed | | Accumulated Net | | |
| Net Investment | | Realized Losses | | |
| Income | | on Investment | | Paid-in Capital |
| $ | 661,558 | | | $ | (42,972 | ) | | $ | (618,586 | ) |
Federal and other taxes
The Fund intends to continue to qualify as a regulated investment company by distributing substantially all of its investment company taxable income and any net realized capital gains (after reduction for capital loss
| | |
| 24 Wells Fargo Advantage VT Discovery Fund | | Notes to Financial Statements |
carryforwards) sufficient to relieve it from all, or substantially all, federal income taxes. Accordingly, no provision for federal income taxes was required.
The Fund’s income and federal excise tax returns and all financial records supporting those returns for the prior three fiscal years are subject to examination by the federal and Delaware revenue authorities.
As of December 31, 2010, the Fund had estimated net capital loss carryforwards, which are available to offset future net realized capital gains, in the amount of $32,722,930 expiring in 2017.
Under the recently enacted Regulated Investment Company Modernization Act of 2010, the Fund will be permitted to carry forward capital losses incurred in taxable years beginning after December 22, 2010 for an unlimited period. However, any losses incurred during those future taxable years will be required to be utilized prior to the losses incurred in pre-enactment taxable years. As a result of this ordering rule, pre-enactment capital loss carryforwards may be more likely to expire unused. Additionally, post-enactment capital losses that are carried forward will retain their character as either short-term or long-term capital losses rather than being considered all short-term as under previous law.
3. FAIR VALUATION MEASUREMENTS
Fair value measurements of investments are determined within a framework that has established a fair value hierarchy based upon the various data inputs utilized in determining the value of the Fund’s investments. The three-level hierarchy gives the highest priority to unadjusted quoted prices in active markets for identical assets or liabilities (Level 1) and the lowest priority to unobservable inputs (Level 3). The Fund’s investments are classified within the fair value hierarchy based on the lowest level of input that is significant to the fair value measurement. The inputs are summarized into three broad levels as follows:
| § | | Level 1 — quoted prices in active markets for identical securities |
| |
| § | | Level 2 — other significant observable inputs (including quoted prices for similar securities, interest rates, prepayment speeds, credit risk, etc.) |
| |
| § | | Level 3 — significant unobservable inputs (including the Fund’s own assumptions in determining the fair value of investments) |
The inputs or methodologies used for valuing securities are not necessarily an indication of the risk associated with investing in those securities.
As of December 31, 2010, the inputs used in valuing the Fund’s assets, which are carried at fair value, were as follows:
| | | | | | | | | | | | | | | | | |
| | | | | | | Significant Other | | | Significant | | | | |
| | | | | | | Observable | | | Unobservable | | | | |
| | | Quoted Prices | | | Inputs | | | Inputs | | | | |
| Investments in Securities | | (Level 1) | | | (Level 2) | | | (Level 3) | | | Total | |
| |
Equity securities | | | | | | | | | | | | | | | | |
| | | | | |
Common stocks | | $ | 108,117,772 | | | $ | 0 | | | $ | 0 | | | $ | 108,117,772 | |
| | | | | |
Short-term investments | | | | | | | | | | | | | | | | |
Corporate bonds and notes | | | 0 | | | | 0 | | | | 794,517 | | | | 794,517 | |
| | | | | |
Investment companies | | | 2,769,183 | | | | 18,665,349 | | | | 0 | | | | 21,434,532 | |
| | | $ | 110,886,955 | | | $ | 18,665,349 | | | $ | 794,517 | | | $ | 130,346,821 | |
Further details on the major security types listed above can be found in the Fund’s Portfolio of Investments.
| | |
| Notes to Financial Statements | | Wells Fargo Advantage VT Discovery Fund 25 |
The following is a reconciliation of assets in which significant unobservable inputs (Level 3) were used in determining fair value:
| | | | | |
| | | Corporate |
| | | bonds |
| | | and notes |
| |
Balance as of December 31, 2009 | | $ | 842,417 | |
| Accrued discounts (premiums) | | | 0 | |
| Realized gains (losses) | | | 0 | |
| Change in unrealized gains (losses) | | | 192,864 | |
| Purchases | | | 0 | |
| Sales | | | (240,764 | ) |
| Transfers into Level 3 | | | 0 | |
| Transfers out of Level 3 | | | 0 | |
Balance as of December 31, 2010 | | $ | 794,517 | |
| | | | | |
Change in unrealized gains (losses) included in earnings relating to securities still held at December 31, 2010 | | $ | 59,907 | |
4. TRANSACTIONS WITH AFFILIATES AND OTHER EXPENSES
Investment advisory fees
The Trust has entered into an investment advisory contract with Funds Management, an indirect wholly owned subsidiary of Wells Fargo & Company (“Wells Fargo”). The investment adviser is responsible for implementing investment policies and guidelines and for supervising the investment sub-adviser, who is responsible for day-to-day portfolio management of the Fund.
Pursuant to the contract, Funds Management is paid an annual investment advisory fee starting at 0.70% and declining to 0.55% as the average daily net assets of the Fund increase. Prior to July 19, 2010, the Fund paid an annual investment advisory fee which started at 0.75% and declined to 0.60% as average daily net assets increased. For the year ended December 31, 2010, the investment advisory fee was equivalent to an annual rate of 0.72% of the Fund’s average daily net assets.
Funds Management may retain the services of certain investment sub-advisers to provide daily portfolio management to the Fund. The fees related to investment sub-advisory services are borne directly by the investment adviser and do not increase the overall fees paid by the Fund to the investment adviser. Wells Capital Management, an affiliate of Funds Management, is the investment sub-adviser to the Fund and is paid a fee by the investment adviser at an annual rate starting at 0.45% and declining to 0.35% as the average daily net assets of the Fund increase.
Administration and transfer agent fees
The Trust has entered into an Administration Agreement with Funds Management. Under this Agreement, for providing administrative services, which includes paying fees and expenses for services provided by the transfer agent, sub-transfer agents, omnibus account servicers and record-keepers, Funds Management is entitled to receive the following annual fees:
| | | | | | | | | |
| | | | | | | Administration Fees | |
| | | | | | | (% of Average | |
| | | Average Daily Net Assets | | | Daily Net Assets) | |
| |
| Fund level | | First $5 billion | | | 0.05 | % |
| | | Next $5 billion | | | 0.04 | |
| | | Over $10 billion | | | 0.03 | |
| | | | | |
| Class 2 | | All asset levels | | | 0.08 | |
Prior to July 19, 2010, Funds Management received from the Fund, for its existing class, an annual fee which started at 0.16% and declined to 0.14% as the average daily net assets of the Fund increased.
| | |
| 26 Wells Fargo Advantage VT Discovery | | Fund Notes to Financial Statements |
Funds Management has contractually waived and/or reimbursed investment advisory and administration fees to the extent necessary to maintain certain net operating expense ratios for the Fund. Waiver of fees and/or reimbursement of expenses by Funds Management were made first from fund level expenses on a proportionate basis and then from class specific expenses.
Distribution fees
The Trust has adopted a Distribution Plan for Class 2 shares of the Fund pursuant to Rule 12b-1 under the 1940 Act. Distribution fees are charged to the Class 2 shares and paid to Wells Fargo Funds Distributor, LLC, the principal underwriter, at an annual rate of 0.25% of its average daily net assets.
5. INVESTMENT PORTFOLIO TRANSACTIONS
Purchases and sales of investments, exclusive of short-term securities (securities with maturities of one year or less at purchase date) for the year ended December 31, 2010 were $91,548,036 and $96,661,316, respectively.
6. BANK BORROWINGS
The Trust and Wells Fargo Funds Trust (excluding the money market funds) are parties to a $125,000,000 revolving credit agreement with State Street Bank and Trust Company, whereby the Fund is permitted to use bank borrowings for temporary or emergency purposes, such as to fund shareholder redemption requests. Interest under the credit agreement is charged to the Fund based on a borrowing rate equal to the higher of the Federal Funds rate in effect on that day plus 1.25% or the overnight LIBOR rate in effect on that day plus 1.25%. In addition, under the credit agreement, the Fund pays an annual commitment fee equal to 0.125% of the unused balance, which is allocated pro rata. Prior to September 7, 2010, the annual commitment fee paid by the Fund was 0.15% of the unused balance.
For the year ended December 31, 2010, there were no borrowings by the Fund under the agreement.
7. DISTRIBUTIONS TO SHAREHOLDERS
As of December 31, 2010, the components of distributable earnings on a tax basis were as follows:
| | | | | | | |
| Unrealized | | Capital Loss |
| Gains (Losses) | | Carryforward |
| $ | 29,721,339 | | | $ | (32,722,930 | ) |
8. INDEMNIFICATION
Under the Trust’s organizational documents, the officers and directors are indemnified against certain liabilities that may arise out of performance of their duties to the Trust. Additionally, in the normal course of business, the Trust may enter into contracts with service providers that contain a variety of indemnification clauses. The Trust’s maximum exposure under these arrangements is dependent on future claims that may be made against the Fund and, therefore, cannot be estimated.
| | |
| Report of Independent Registered Public Accounting Firm | | Wells Fargo Advantage Variable Trust Funds 27 |
BOARD OF TRUSTEES AND SHAREHOLDERS OF
WELLS FARGO VARIABLE TRUST:
We have audited the accompanying statement of assets and liabilities, including the portfolio of investments, of the Wells Fargo Advantage VT Discovery Fund (the “Fund”), one of the funds constituting the Wells Fargo Variable Trust, as of December 31, 2010, and the related statement of operations for the year then ended, statements of changes in net assets for each of the years in the two year period then ended, and the financial highlights for each of the years in the five year period then ended. These financial statements and financial highlights are the responsibility of the Fund’s management. Our responsibility is to express an opinion on these financial statements and financial highlights based on our audits.
We conducted our audits in accordance with the standards of the Public Company Accounting Oversight Board (United States). Those standards require that we plan and perform the audit to obtain reasonable assurance about whether the financial statements and financial highlights are free of material misstatement. An audit includes examining, on a test basis, evidence supporting the amounts and disclosures in the financial statements. Our procedures included confirmation of securities owned as of December 31, 2010, by correspondence with custodian and brokers, or by other appropriate auditing procedures. An audit also includes assessing the accounting principles used and significant estimates made by management, as well as evaluating the overall financial statement presentation. We believe that our audits provide a reasonable basis for our opinion.
In our opinion, the financial statements and financial highlights referred to above present fairly, in all material respects, the financial position of the Wells Fargo Advantage VT Discovery Fund as of December 31, 2010, the results of its operations for the year then ended, changes in its net assets for each of the years in the two year period then ended, and the financial highlights for each of the years in the five year period then ended, in conformity with U.S. generally accepted accounting principles.
Boston, Massachusetts
February 25, 2011
| | |
| 28 Wells Fargo Advantage Variable Trust Funds | | Other Information (Unaudited) |
PROXY VOTING INFORMATION
A description of the policies and procedures that the Fund uses to determine how to vote proxies relating to portfolio securities is available without charge, upon request, by calling 1-800-222-8222, visiting our Web site at www.wellsfargo.com/advantagefunds, or visiting the SEC Web site at www.sec.gov. Information regarding how the Fund voted proxies relating to portfolio securities during the most recent 12-month period ended June 30 is available without charge on the Fund’s Web site at www.wellsfargo.com/advantagefunds or by visiting the SEC Web site at www.sec.gov.
| | |
| Other Information (Unaudited) | | Wells Fargo Advantage VT Discovery Fund 29 |
PORTFOLIO HOLDINGS INFORMATION
The complete portfolio holdings for the Fund are publicly available on the Fund’s Web site (www.wellsfargo.com/advantagefunds) on a monthly, 30-day or more delayed basis. In addition, top ten holdings information for the Fund is publicly available on the Fund’s Web site on a monthly, seven-day or more delayed basis. The Fund files its complete schedule of portfolio holdings with the SEC for the first and third quarters of each fiscal year on Form N-Q, which is available without charge by visiting the SEC Web site at www.sec.gov. In addition, the Fund’s Form N-Q may be reviewed and copied at the SEC’s Public Reference Room in Washington, DC, and at regional offices in New York City, at 233 Broadway, and in Chicago, at 175 West Jackson Boulevard, Suite 900. Information about the Public Reference Room may be obtained by calling 1-800-SEC-0330.
BOARD OF TRUSTEES
The following table provides basic information about the Board of Trustees (the “Trustees”) of the Wells Fargo Variable Trust (the “Trust”) and Officers of the Trust. This table should be read in conjunction with the Prospectus and the Statement of Additional Information1 of the Fund. Each of the Trustees and Officers listed below acts in identical capacities for the Wells Fargo Advantage family of funds, which consists of 152 funds comprising the Trust, Wells Fargo Funds Trust, Wells Fargo Master Trust and four closed-end funds (collectively the “Fund Complex”). All of the Trustees are also Members of the Audit and Governance Committees of each Trust in the Fund Complex. The mailing address of each Trustee and Officer is 525 Market Street, 12th Floor, San Francisco, CA 94105. Each Trustee and Officer serves an indefinite term, however, each Trustee serves such term until reaching the mandatory retirement age established by the Trustees.
Independent Trustees
| | | | | | | |
| Name and | | Position Held and | | | | |
| Year of Birth | | Length of Service | | Principal Occupations During Past Five Years | | Other Directorships |
| |
| Peter G. Gordon (Born 1942) | | Trustee, since 1998; Chairman, since 2005 (Lead Trustee since 2001) | | Co-Founder, Chairman, President and CEO of Crystal Geyser. Water Company. Trustee Emeritus, Colby College | | Asset Allocation
Trust |
| Isaiah Harris, Jr. (Born 1952) | | Trustee, since 2009 | | Retired. Prior thereto, President and CEO of BellSouth Advertising and Publishing Corp. from 2005 to 2007, President and CEO of BellSouth Enterprises from 2004 to 2005 and President of BellSouth Consumer Services from 2000 to 2003. Emeritus member of the Iowa State University Foundation Board of Governors. Emeritus Member of the Advisory Board of Iowa State University School of Business. Mr. Harris is a certified public accountant. | | CIGNA Corporation; Deluxe Corporation; Asset Allocation Trust |
| | | | | | | |
Judith M. Johnson
(Born 1949) | | Trustee, since 2008 | | Retired. Prior thereto, Chief Executive Officer and Chief Investment Officer of Minneapolis Employees Retirement Fund from 1996 to 2008. Ms. Johnson is an attorney, certified public accountant and a certified managerial accountant. | | Asset Allocation
Trust |
| | | | | | | |
| Leroy Keith, Jr. (Born 1939) | | Trustee, since 2010 | | Chairman, Bloc Global Services (development and construction), Trustee of the Evergreen Funds from 1983 to 2010. Former Managing Director, Almanac Capital Management (commodities firm), former Partner, Stonington Partners, Inc. (private equity fund), former Director, Obagi Medical Products Co. and former Director, Lincoln Educational Services. | | Trustee, Virtus Fund Complex (consisting of 45 portfolios as of 12/31/10); Director, Diversapack Co. (packaging company); Asset Allocation Trust |
| | | | | | | |
| David F. Larcker (Born 1951) | | Trustee, since 2009 | | James Irvin Miller Professor of Accounting at the Graduate School of Business, Stanford University, Director of Corporate Governance Research Program and Co-Director of The Rock Center for Corporate Governance since 2006. From 2005 to 2008, Professor of Accounting at the Graduate School of Business, Stanford University. Prior thereto, Ernst & Young Professor of Accounting at The Wharton School, University of Pennsylvania from 1985 to 2005. | | Asset Allocation
Trust |
| | |
| 30 Wells Fargo Advantage VT Discovery Fund | | Other Information (Unaudited) |
| | | | | | | |
| Name and | | Position Held and | | | | |
| Year of Birth | | Length of Service | | Principal Occupations During Past Five Years | | Other Directorships |
| |
| Olivia S. Mitchell (Born 1953) | | Trustee, since 2006 | | International Foundation of Employee Benefit Plans Professor and Chair of the Department of Insurance and Risk Management, Wharton School of the University of Pennsylvania since 1993. Director of Wharton’s Pension Research Council and Boettner Center on Pensions & Retirement Research, and Research Associate at the National Bureau of Economic Research. Previously, Cornell University Professor from 1978 to 1993. | | Asset Allocation
Trust |
| | | | | | | |
| Timothy J. Penny (Born 1951) | | Trustee, since 1996 | | President and CEO of Southern Minnesota Initiative Foundation, a non-profit organization, since 2007 and Senior Fellow at the Humphrey Institute Policy Forum at the University of Minnesota since 1995. Member of the Board of Trustees of NorthStar Education Finance, Inc., a non-profit organization, since 2007. | | Asset Allocation
Trust |
| | | | | | | |
| Michael S. Scofield (Born 1943) | | Trustee, since 2010 | | Currently serves on the Investment Company Institute’s Board of Governors and Executive Committee as well the Independent Director’s Counsel Board of Governors and Executive Committee. Former Chairman of the Independent Directors Counsel. Trustee of the Evergreen Funds from 1984 to 2010. Retired Attorney, Law Offices of Michael S. Scofield and former Director and Chairman, Branded Media Corporation (multi-media branding company). | | Asset Allocation
Trust |
| | | | | | | |
| Donald C. Willeke (Born 1940) | | Trustee, since 1996 | | Principal of the law firm of Willeke & Daniels. General Counsel of the Minneapolis Employees Retirement Fund from 1984 until its consolidation into the Minnesota Public Employees Retirement Association on June 30, 2010. | | Asset Allocation
Trust |
Officers
| | | | | | | |
| Name and | | Position Held and | | | | |
| Year of Birth | | Length of Service | | Principal Occupations During Past Five Years | | |
| |
Karla M. Rabusch
(Born 1959) | | President, since 2003 | | Executive Vice President of Wells Fargo Bank, N.A. and President of Wells Fargo Funds Management, LLC since 2003. Senior Vice President and Chief Administrative Officer of Wells Fargo Funds Management, LLC from 2001 to 2003. | | |
| | | | | | | |
C. David Messman
(Born 1960) | | Secretary, since 2000; Chief Legal Counsel, since 2003 | | Senior Vice President and Secretary of Wells Fargo Funds Management, LLC since 2001. Vice President and Managing Counsel of Wells Fargo Bank, N.A. since 1996. | | |
| | | | | | | |
Kasey Phillips
(Born 1970) | | Treasurer, since 2009 | | Senior Vice President of Wells Fargo Funds Management, LLC since 2009. Senior Vice President of Evergreen Investment Management Company, LLC from 2006 to 2010. Treasurer of the Evergreen Funds from 2005 to 2010. Vice President and Assistant Vice President of Evergreen Investment Services, Inc. from 1999 to 2006. | | |
| | | | | | | |
David Berardi
(Born 1975) | | Assistant Treasurer,
since 2009 | | Vice President of Wells Fargo Funds Management, LLC since 2009. Vice President of Evergreen Investment Management Company, LLC from 2008 to 2010. Assistant Vice President of Evergreen Investment Services, Inc. from 2004 to 2008. Manager of Fund Reporting and Control for Evergreen Investment Management Company, LLC from 2004 to 2010. | | |
| | | | | | | |
Jeremy DePalma
(Born 1974) | | Assistant Treasurer,
since 2009 | | Senior Vice President of Wells Fargo Funds Management, LLC since 2009. Senior Vice President of Evergreen Investment Management Company, LLC from 2008 to 2010. Vice President, Evergreen Investment Services, Inc. from 2004 to 2007. Assistant Vice President, Evergreen Investment Services, Inc. from 2000 to 2004 and the head of the Fund Reporting and Control Team within Fund Administration from 2005 to 2010. | | |
| | |
| Other Information (Unaudited) | | Wells Fargo Advantage VT Discovery Fund 31 |
| | | | | | | |
| Name and | | Position Held and | | | | |
| Year of Birth | | Length of Service | | Principal Occupations During Past Five Years | | |
| |
Debra Ann Early
(Born 1964) | | Chief Compliance Officer,
since 2007 | | Chief Compliance Officer of Wells Fargo Funds Management, LLC since 2007. Chief Compliance Officer of Parnassus Investments from 2005 to 2007. Chief Financial Officer of Parnassus Investments from 2004 to 2007 and Senior Audit Manager of PricewaterhouseCoopers LLP from 1998 to 2004. | | |
| | |
| 1. | | The Statement of Additional Information includes additional information about the Fund’s Trustees and is available, without charge, upon request, by calling 1-800-222-8222 or by visiting the Fund’s Web site at www.wellsfargo.com/advantagefunds. |
| | |
| 32 Wells Fargo Advantage VT Discovery Fund | | List of Abbreviations |
The following is a list of common abbreviations for terms and entities which may have appeared in this report.
| | | | | |
|
| ABAG | | — | | Association of Bay Area Governments |
| ADR | | — | | American Depositary Receipt |
| ADS | | — | | American Depository Shares |
| AMBAC | | — | | American Municipal Bond Assurance Corporation |
| AMT | | — | | Alternative Minimum Tax |
| ARM | | — | | Adjustable Rate Mortgages |
| AUD | | — | | Australian Dollar |
| BART | | — | | Bay Area Rapid Transit |
| BRL | | — | | Brazil Real |
| CAD | | — | | Canadian Dollar |
| CDA | | — | | Community Development Authority |
| CDO | | — | | Collateralized Debt Obligation |
| CDSC | | — | | Contingent Deferred Sales Charge |
| CGIC | | — | | Capital Guaranty Insurance Company |
| CGY | | — | | Capital Guaranty Corporation |
| CHF | | — | | Swiss Franc |
| CIFG | | — | | CDC (Caisse des Dépôts et Consignations) IXIS Financial Guarantee |
| COP | | — | | Certificate of Participation |
| CP | | — | | Commercial Paper |
| CTF | | — | | Common Trust Fund |
| DEM | | — | | Deutsche Mark |
| DKK | | — | | Danish Krone |
| DW&P | | — | | Department of Water & Power |
| DWR | | — | | Department of Water Resources |
| ECFA | | — | | Educational & Cultural Facilities Authority |
| EDFA | | — | | Economic Development Finance Authority |
| ETET | | — | | Eagle Tax-Exempt Trust |
| ETF | | — | | Exchange-Traded Fund |
| EUR | | — | | Euro |
| FFCB | | — | | Federal Farm Credit Bank |
| FGIC | | — | | Financial Guaranty Insurance Corporation |
| FHA | | — | | Federal Housing Authority |
| FHAG | | — | | Federal Housing Agency |
| FHLB | | — | | Federal Home Loan Bank |
| FHLMC | | — | | Federal Home Loan Mortgage Corporation |
| FNMA | | — | | Federal National Mortgage Association |
| FRF | | — | | French Franc |
| FSA | | — | | Farm Service Agency |
| GBP | | — | | Great British Pound |
| GDR | | — | | Global Depositary Receipt |
| GNMA | | — | | Government National Mortgage Association |
| GO | | — | | General Obligation |
| HCFR | | — | | Healthcare Facilities Revenue |
| HEFA | | — | | Health & Educational Facilities Authority |
| HEFAR | | — | | Higher Education Facilities Authority Revenue |
| HFA | | — | | Housing Finance Authority |
| HFFA | | — | | Health Facilities Financing Authority |
| HKD | | — | | Hong Kong Dollar |
| HUD | | — | | Housing & Urban Development |
| HUF | | — | | Hungarian Forint |
| IDA | | — | | Industrial Development Authority |
| IDAG | | — | | Industrial Development Agency |
| IDR | | — | | Industrial Development Revenue |
| IEP | | — | | Irish Pound |
| JPY | | — | | Japanese Yen |
| KRW | | — | | Republic of Korea Won |
| LIBOR | | — | | London Interbank Offered Rate |
| LLC | | — | | Limited Liability Company |
| LLP | | — | | Limited Liability Partnership |
| LOC | | — | | Letter of Credit |
| LP | | — | | Limited Partnership |
| MBIA | | — | | Municipal Bond Insurance Association |
| MFHR | | — | | Multi-Family Housing Revenue |
| MFMR | | — | | Multi-Family Mortgage Revenue |
| MMD | | — | | Municipal Market Data |
| MTN | | — | | Medium Term Note |
| MUD | | — | | Municipal Utility District |
| MXN | | — | | Mexican Peso |
| MYR | | — | | Malaysian Ringgit |
| NATL-RE | | — | | National Public Finance Guarantee Corporation |
| NLG | | — | | Netherlands Guilder |
| NOK | | — | | Norwegian Krone |
| NZD | | — | | New Zealand Dollar |
| PCFA | | — | | Pollution Control Finance Authority |
| PCR | | — | | Pollution Control Revenue |
| PFA | | — | | Public Finance Authority |
| PFFA | | — | | Public Facilities Financing Authority |
| plc | | — | | Public Limited Company |
| PLN | | — | | Polish Zloty |
| PSFG | | — | | Public School Fund Guaranty |
| R&D | | — | | Research & Development |
| RDA | | — | | Redevelopment Authority |
| RDFA | | — | | Redevelopment Finance Authority |
| REITS | | — | | Real Estate Investment Trusts |
| SEK | | — | | Swedish Krona |
| SFHR | | — | | Single Family Housing Revenue |
| SFMR | | — | | Single Family Mortgage Revenue |
| SGD | | — | | Singapore Dollar |
| SKK | | — | | Slovakian Koruna |
| SLMA | | — | | Student Loan Marketing Association |
| SPDR | | — | | Standard & Poor’s Depositary Receipts |
| STIT | | — | | Short-Term Investment Trust |
| TBA | | — | | To Be Announced |
| TRAN | | — | | Tax Revenue Anticipation Notes |
| TRY | | — | | Turkish Lira |
| USD | | — | | United States Dollar |
| XLCA | | — | | XL Capital Assurance |
| ZAR | | — | | South African Rand |
This page is intentionally left blank.
This page is intentionally left blank.
More information about Wells Fargo Advantage Funds is available free upon request. To obtain literature, please write, e-mail, visit the Funds’ Web site, or call:
Wells Fargo Advantage Funds
P.O. Box 8266
Boston, MA 02266-8266
E-mail: wfaf@wellsfargo.com
Web site: www.wellsfargo.com/advantagefunds
Individual Investors: 1- 800-222-8222
Retail Investment Professionals: 1- 888-877-9275
Institutional Investment Professionals: 1- 866-765-0778
This report and the financial statements contained herein are submitted for the general information of the shareholders of Wells Fargo Advantage Funds. If this report is used for promotional purposes, distribution of the report must be accompanied or preceded by a current prospectus. For a prospectus containing more complete information, including charges and expenses, call 1-800-222-8222 or visit the Fund’s Web site at www.wellsfargo.com/advantagefunds. Please consider the investment objectives, risks, charges, and expenses of the investment carefully before investing. This and other information about Wells Fargo Advantage Funds can be found in the current prospectus. Read the prospectus carefully before you invest or send money.
Wells Fargo Funds Management, LLC, a wholly owned subsidiary of Wells Fargo & Company, provides investment advisory and administrative services for Wells Fargo Advantage Funds. Other affiliates of Wells Fargo & Company provide subadvisory and other services for the Funds. The Funds are distributed by Wells Fargo Funds Distributor, LLC, Member FINRA/SIPC, an affiliate of Wells Fargo & Company.
NOT FDIC INSURED ■ NO BANK GUARANTEE ■ MAY LOSE VALUE
| | | | | | |
| | | | | | | |
| | | | | | | |
| © 2011 Wells Fargo Funds Management, LLC. All rights reserved. | | | www.wellsfargo.com/advantagefunds | | | 200912 02-11 |
| | | | | | | AVT1/AR147 12-10 |
| | | | | |
|
| | | WELLS FARGO ADVANTAGE VARIABLE TRUST FUNDS |
| | | | | |
| | | § | | Wells Fargo Advantage VT Index Asset Allocation Fund |
| | | | | (formerly Wells Fargo Advantage VT Asset Allocation Fund) |
Reduce clutter. Save trees.
Sign up for electronic delivery of prospectuses and shareholder reports at www.wellsfargo.com/advantagedelivery
| | | | | |
|
Contents | | | | |
| | | | | |
Letter to Shareholders | | | 2 | |
| | | | | |
Performance Highlights | | | 6 | |
| | | | | |
Fund Expenses | | | 10 | |
| | | | | |
Portfolio of Investments | | | 11 | |
| | | | | |
Financial Statements | | | | |
| Statement of Assets and Liabilities | | | 25 | |
| Statement of Operations | | | 26 | |
| Statements of Changes in Net Assets | | | 27 | |
| Financial Highlights | | | 28 | |
| | | | | |
Notes to Financial Statements | | | 30 | |
| | | | | |
Report of Independent Registered Public Accounting Firm | | | 37 | |
| | | | | |
Other Information | | | 38 | |
| | | | | |
List of Abbreviations | | | 42 | |
The views expressed are as of December 31, 2010, and are those of the Fund managers. Any reference to a specific security in this report is not a recommendation to purchase or sell any specific security or adopt any investment strategy. The views are subject to change at any time in response to changing circumstances in the market and are not intended to predict or guarantee the future performance of any individual security, market sector or the markets generally, or the Wells Fargo Advantage VT Index Asset Allocation Fund.
NOT FDIC INSURED § NO BANK GUARANTEE § MAY LOSE VALUE
WELLS FARGO
INVESTMENT HISTORY
| | | |
|
1932 | | Keystone creates one of the first mutual fund families. |
| | | |
1971 | | Wells Fargo & Company introduces one of the first institutional index funds. |
| | | |
1978 | | Wells Fargo applies Markowitz and Sharpe’s research on Modern Portfolio Theory to introduce one of the industry’s first Tactical Asset Allocation (TAA) models in institutional separately managed accounts. |
| | | |
1984 | | Wells Fargo Stagecoach Funds launches its first asset allocation fund. |
| | | |
1989 | | The Tactical Asset Allocation (TAA) Model is first applied to Wells Fargo’s asset allocation mutual funds. |
| | | |
1994 | | Wells Fargo introduces the LifePath Funds, one of the first suites of target date funds (now the Wells Fargo Advantage Dow Jones Target Date FundsSM). |
| | | |
1996 | | Evergreen Investments and Keystone Funds merge. |
| | | |
1997 | | Wells Fargo launches Wells Fargo Advantage WealthBuilder PortfoliosSM, a fund-of-funds suite of products that includes the use of quantitative models to shift assets among investment styles. |
| | | |
1999 | | Norwest Advantage Funds and Stagecoach Funds are reorganized into Wells Fargo Funds after the merger of Norwest and Wells Fargo. |
| | | |
2002 | | Evergreen Retail and Evergreen Institutional companies form the umbrella asset management company, Evergreen Investments. |
| | | |
2005 | | The integration of Strong Funds with Wells Fargo Funds creates Wells Fargo Advantage Funds, resulting in one of the top 20 mutual fund companies in the United States. |
| | | |
2006 | | Wells Fargo Advantage Funds relaunches the target date product line as Wells Fargo Advantage Dow Jones Target Date Funds. |
| | | |
2010 | | The mergers and reorganizations of Evergreen and Wells Fargo Advantage mutual funds are completed, unifying the families under the brand of Wells Fargo Advantage Funds. |
Wells Fargo Advantage Funds®
Wells Fargo Advantage Funds skillfully guides institutions, financial advisors, and individuals through the investment terrain to help them reach their financial objectives. Everything we do on behalf of investors is backed by our unique combination of qualifications.
Strength
Our organization is built on the standards of integrity and service established by our parent company—Wells Fargo & Company—more than 150 years ago. And, because we’re part of a highly diversified financial enterprise, we offer the depth of resources to help investors succeed.
Expertise
Our multi-boutique model offers investors access to the independent thinking of premier investment managers that have been chosen for their time-tested strategies. While each team specializes in a specific investment strategy, collectively they provide investors a wide choice of distinct investment styles. Our dedication to investment excellence doesn’t end with our expertise in manager selection—risk management, analysis, and rigorous ongoing review seek to ensure each manager’s investment process remains consistent.
Partnership
Our collaborative approach is built around understanding the needs and goals of our clients. By adhering to core principles of sound judgment and steady guidance, we support you through every stage of the investment decision process.
Carefully consider the investment objectives, risks, charges, and expenses before investing. For a current prospectus for Wells Fargo Advantage Funds containing this and other information, visit wellsfargo.com/advantagefunds. Read it carefully before investing.
Wells Fargo Funds Management, LLC, a wholly owned subsidiary of Wells Fargo & Company, provides investment advisory and administrative services for Wells Fargo Advantage Funds®. Other affiliates of Wells Fargo & Company provide subadvisory and other services for the Funds. The Funds are distributed by Wells Fargo Funds Distributor, LLC, Member FINRA/SIPC, an affiliate of Wells Fargo & Company.
The“Dow Jones Target Date Indexes“are a product of Dow Jones Indexes, a licensed trademark of CME Group Index Services LLC (“CME”). “Dow Jones” and “Dow Jones Target Date Indexes” are service marks of Dow Jones Trademark Holdings, LLC, and have been licensed for use for certain purposes by CME and sublicensed for use by Global Index Advisors, Inc., and Wells Fargo Funds Management, LLC. The Dow Jones Target Date Indexes are based in part on the Barclays Capital Bond Indexes, which are published by Barclays Capital Inc. The Wells Fargo Advantage Dow Jones Target Date Funds, based on the Dow Jones Target Date Indexes, are not sponsored, endorsed, sold, or promoted by Dow Jones, CME or Barclays Capital or any of their respective affiliates, and neither Dow Jones, CME nor Barclays Capital nor any of their respective affiliates makes any representation regarding the advisability of investing in such product(s) and/or about the quality, accuracy, and/or completeness of the Dow Jones Target Date Indexes or the Barclays Capital Bond Indexes. IN NO EVENT SHALL DOW JONES, CME, BARCLAYS CAPITAL, OR ANY OF THEIR LICENSORS HAVE ANY LIABILITY FOR ANY SPECIAL, PUNITIVE, INDIRECT, OR CONSEQUENTIAL DAMAGES (INCLUDING LOST PROFITS), EVEN IF NOTIFIED OF THE POSSIBILITY OF SUCH DAMAGES.
NOT FDIC INSURED § NO BANK GUARANTEE § MAY LOSE VALUE
Not part of the annual report.
Wells Fargo Advantage Funds offers more than 120 mutual funds across a wide range of asset classes, representing over $236 billion in assets under management, as of December 31, 2010.
| | | | | |
|
Equity Funds | | | | |
| |
| Asia Pacific Fund | | Enterprise Fund† | | Opportunity Fund† |
| C&B Large Cap Value Fund | | Equity Value Fund | | Precious Metals Fund |
| C&B Mid Cap Value Fund | | Global Opportunities Fund | | Premier Large Company Growth Fund |
| Capital Growth Fund | | Growth Fund | | Small Cap Growth Fund |
| Classic Value Fund | | Growth Opportunities Fund | | Small Cap Opportunities Fund |
| Common Stock Fund | | Health Care Fund | | Small Cap Value Fund |
| Core Equity Fund | | Index Fund | | Small Company Growth Fund |
| Disciplined Global Equity Fund | | International Equity Fund | | Small Company Value Fund |
| Disciplined U.S. Core Fund | | International Value Fund | | Small/Mid Cap Core Fund |
| Disciplined Value Fund | | Intrinsic Small Cap Value Fund | | Small/Mid Cap Value Fund |
Discovery Fund† | | Intrinsic Value Fund | | Social Sustainability Fund† |
| Diversified Equity Fund | | Intrinsic World Equity Fund | | Special Mid Cap Value Fund |
| Diversified International Fund | | Large Cap Core Fund | | Special Small Cap Value Fund |
| Diversified Small Cap Fund | | Large Cap Growth Fund | | Specialized Technology Fund |
| Emerging Growth Fund | | Large Company Value Fund | | Strategic Large Cap Growth Fund |
| Emerging Markets Equity Fund | | Mid Cap Growth Fund | | Traditional Small Cap Growth Fund |
Endeavor Select Fund† | | Omega Growth Fund | | Utility and Telecommunications Fund |
| | | | | |
Bond Funds | | | | |
| |
| Adjustable Rate Government Fund | | Inflation-Protected Bond Fund | | Short-Term Bond Fund |
| California Limited-Term Tax-Free Fund | | Intermediate Tax/AMT-Free Fund | | Short-Term High Yield Bond Fund |
| California Tax-Free Fund | | International Bond Fund | | Short-Term Municipal Bond Fund |
| Colorado Tax-Free Fund | | Minnesota Tax-Free Fund | | Strategic Municipal Bond Fund |
| Government Securities Fund | | Municipal Bond Fund | | Total Return Bond Fund |
| High Income Fund | | North Carolina Tax-Free Fund | | Ultra Short-Term Income Fund |
| High Yield Bond Fund | | Pennsylvania Tax-Free Fund | | Ultra Short-Term Municipal Income Fund |
| Income Plus Fund | | Short Duration Government Bond Fund | | Wisconsin Tax-Free Fund |
| | | | | |
Asset Allocation Funds | | | | |
| |
| Asset Allocation Fund | | WealthBuilder Equity Portfolio† | | Target 2020 Fund† |
| Conservative Allocation Fund | | WealthBuilder Growth Allocation Portfolio† | | Target 2025 Fund† |
| Diversified Capital Builder Fund | | WealthBuilder Growth Balanced Portfolio† | | Target 2030 Fund† |
| Diversified Income Builder Fund | | WealthBuilder Moderate Balanced Portfolio† | | Target 2035 Fund† |
| Growth Balanced Fund | | WealthBuilder Tactical Equity Portfolio† | | Target 2040 Fund† |
| Index Asset Allocation Fund | | Target Today Fund† | | Target 2045 Fund† |
| Moderate Balanced Fund | | Target 2010 Fund† | | Target 2050 Fund† |
WealthBuilder Conservative Allocation Portfolio† | | Target 2015 Fund† | | |
| | | | | |
Money Market Funds | | | | |
| |
| 100% Treasury Money Market Fund | | Minnesota Money Market Fund | | New Jersey Municipal Money Market Fund |
| California Municipal Money Market Fund | | Money Market Fund | | New York Municipal Money Market Fund |
| Cash Investment Money Market Fund | | Municipal Cash Management Money Market Fund | | Pennsylvania Municipal Money Market Fund |
| Government Money Market Fund | | Municipal Money Market Fund | | Prime Investment Money Market Fund |
Heritage Money Market Fund† | | National Tax-Free Money Market Fund | | Treasury Plus Money Market Fund |
| | | | | |
Variable Trust Funds1 | | | | |
| |
| VT Core Equity Fund | | VT Intrinsic Value Fund | | VT Small Cap Value Fund |
VT Discovery Fund† | | VT Omega Growth Fund | | VT Total Return Bond Fund |
| VT Index Asset Allocation Fund | | VT Opportunity Fund† | | |
| VT International Equity Fund | | VT Small Cap Growth Fund | | |
An investment in a money market fund is not insured or guaranteed by the Federal Deposit Insurance Corporation or any other government agency. Although the Wells Fargo Advantage Money Market Funds seek to preserve the value of your investment at $1.00 per share, it is possible to lose money by investing in a money market fund.
| | |
| 1. | | The Variable Trust Funds are generally available only through insurance company variable contracts. |
| |
| † | | In this report, the Wells Fargo Advantage Discovery FundSM, Wells Fargo Advantage Endeavor Select FundSM, Wells Fargo Advantage Enterprise FundSM, Wells Fargo Advantage Opportunity FundSM, Wells Fargo Advantage Social Sustainability FundSM, Wells Fargo Advantage WealthBuilder Conservative Allocation PortfolioSM, Wells Fargo Advantage WealthBuilder Equity PortfolioSM, Wells Fargo Advantage WealthBuilder Growth Allocation PortfolioSM, Wells Fargo Advantage WealthBuilder Growth Balanced PortfolioSM, Wells Fargo Advantage WealthBuilder Moderate Balanced PortfolioSM, Wells Fargo Advantage WealthBuilder Tactical Equity PortfolioSM, Wells Fargo Advantage Dow Jones Target Today FundSM, Wells Fargo Advantage Dow Jones Target 2010 FundSM, Wells Fargo Advantage Dow Jones Target 2015 FundSM, Wells Fargo Advantage Dow Jones Target 2020 FundSM, Wells Fargo Advantage Dow Jones Target 2025 FundSM, Wells Fargo Advantage Dow Jones Target 2030 FundSM, Wells Fargo Advantage Dow Jones Target 2035 FundSM, Wells Fargo Advantage Dow Jones Target 2040 FundSM, Wells Fargo Advantage Dow Jones Target 2045 FundSM, Wells Fargo Advantage Dow Jones Target 2050 FundSM, Wells Fargo Advantage Heritage Money Market FundSM, Wells Fargo Advantage VT Discovery FundSM, and Wells Fargo Advantage VT Opportunity FundSM are referred to as the Discovery Fund, Endeavor Select Fund, Enterprise Fund, Opportunity Fund, Social Sustainability Fund, WealthBuilder Conservative Allocation Portfolio, WealthBuilder Equity Portfolio, WealthBuilder Growth Allocation Portfolio, WealthBuilder Growth Balanced Portfolio, WealthBuilder Moderate Balanced Portfolio, WealthBuilder Tactical Equity Portfolio, Target Today Fund, Target 2010 Fund, Target 2015 Fund, Target 2020 Fund, Target 2025 Fund, Target 2030 Fund, Target 2035 Fund, Target 2040 Fund, Target 2045 Fund, Target 2050 Fund, Heritage Money Market Fund, VT Discovery Fund, and VT Opportunity Fund, respectively. |
Not part of the annual report.
| | |
| 2 Wells Fargo Advantage VT Index Asset Allocation Fund | | Letter to Shareholders |
 Karla M. Rabusch,
President
Wells Fargo Advantage FundsThe equity markets delivered strong full-year returns against the backdrop of a strengthening economy.
Dear Valued Shareholder:
We are pleased to provide you with this annual report for the Wells Fargo Advantage VT Index Asset Allocation Fund for the 12 months that ended December 31, 2010. The equity markets delivered strong full-year returns against the backdrop of a strengthening economy. However, the year was not without its share of macroeconomic challenges and market volatility, once again highlighting the value of a sound, well-diversified investment strategy. As always, we believe that such a strategy can enable investors to balance risks and opportunities as they pursue long-term financial goals in a dynamic market environment.
The economic recovery stayed on track.
The U.S. economic recovery that began in the summer of 2009 gained momentum in 2010, particularly toward the end of the year. Gross domestic product (GDP) grew at an annualized rate of 3.2% in the fourth quarter of 2010—capping a streak of six consecutive quarters of positive GDP growth—and 2.9% for the full year. Although the path of recovery has been uneven at times and growth remains subpar compared with previous recoveries, the general consensus among economists is that the economy will likely avoid a double-dip recession. That said, persistent weakness in the labor and housing markets bears close watching in the months ahead.
Jobs and housing remained troublesome.
At the end of the year, the unemployment rate stood at 9.4%, down from 9.9% a year earlier, but still stubbornly high. Unfortunately, the drop may be attributable more to a decline in the labor force than a meaningful uptick in hiring. In fact, employers added just 1.1 million jobs for all of 2010, suggesting that the improving economy has yet to translate into widespread hiring. Meanwhile, the beleaguered housing market was an ongoing source of concern, despite some tentative late-year signs of stabilization.
Other economic data were more encouraging, reflecting greater confidence in the recovery on the part of both consumers and businesses. Retail sales came in strong at certain points during the year, including the critical holiday shopping season, and industrial production and new orders have picked up. Although still reluctant to hire, businesses have gradually increased spending in other areas, such as equipment and technology. Core inflation, which excludes volatile food and energy prices, remained benign.
The Fed continued to do its part.
With inflation subdued, the Federal Reserve (the Fed) held its target range for the federal funds rate—a proxy for short-term interest rates—steady at 0% to 0.25%. In its final statement of 2010, the Fed noted that economic expansion continues to be restrained by headwinds such as high unemployment, modest income growth, lower housing wealth, and tight credit. As a result, the Fed indicated that it intends to keep short-term rates at historically low levels for as long as needed to promote a more robust recovery.
| | |
| Letter to Shareholders | | Wells Fargo Advantage VT Index Asset Allocation Fund 3 |
The Fed also stated that it plans to proceed with other stimulus measures, including its second round of quantitative easing (QE2)—a plan to purchase $600 billion in long-term Treasury securities by mid-2011. The ‘preannouncement’ of QE2 in the third quarter of 2010 marked a turning point for the equity markets in that it ushered in a favorable shift in investor sentiment. By and large, investors interpreted the plan as further evidence of the Fed’s commitment to avoiding deflation and spurring economic growth.
2010 was another solid year for equities.
QE2 was certainly not the only catalyst for the equity markets during 2010. Along with more upbeat economic data, better-than-expected corporate earnings power played a role in driving stock prices higher. Throughout the year, quarterly earnings per share for the majority of companies in the S&P 500 Index consistently exceeded Wall Street estimates. As 2010 drew to a close, the midterm congressional elections and the extension of the Bush-era tax cuts provided additional tailwinds, helping the markets finish the year on a strong note.
It was the second straight year of double-digit total returns for the broad equity market indexes. The S&P 500 Index and the Dow Jones Industrial Average advanced 15.1% and 14.1%, respectively, while the tech-heavy NASDAQ Composite Index returned 18.2%. Investors were generally rewarded across the market-capitalization spectrum—with small- and mid-cap stocks outpacing large-cap stocks—as well as across most economic sectors. In terms of investment styles, growth stocks outperformed their value counterparts for the year.
To be sure, the gains were hard-earned, as the markets had to contend with numerous issues along the way, including the European sovereign debt crisis, China’s efforts to slow growth, and doubts about the sustainability of the domestic recovery. The second quarter in particular witnessed bouts of heightened market volatility, most notably the so-called “flash crash” in May. As the year progressed, however, volatility—as measured by the Chicago Board Options Exchange Volatility Index—abated amid reduced fears of a double-dip recession.
Investors should keep a long-term perspective.
In our view, the equity markets’ dramatic rebound over the past two years from a severe downturn underscores the importance of maintaining a disciplined, long-term investment strategy through changing market cycles. By staying focused on your long-term goals, you may be better positioned both to navigate falling markets and participate in rising markets.
To help you build a well-diversified strategy based on your personal objectives and risk tolerance, Wells Fargo Advantage Funds® offers more than 120 mutual funds and other investments covering a wide range of asset classes and investment styles. Although diversification cannot guarantee an investment profit or prevent losses, we believe it can be an effective way to manage investment risk and potentially smooth out overall portfolio performance.
Along with more upbeat economic data, better-than-expected corporate earnings power played a role in driving stock prices higher.
| | |
| 4 Wells Fargo Advantage VT Index Asset Allocation Fund | | Letter to Shareholders |
Thank you for choosing Wells Fargo Advantage Funds. We appreciate your continued confidence in us and are committed to helping you meet your financial needs. If you have any questions about your investments, please contact your investment professional, call us at 1-800-222-8222, or visit wellsfargo.com/advantagefunds.
Sincerely,
Karla M. Rabusch
President
Wells Fargo Advantage Funds
This page is intentionally left blank.
| | |
| 6 Wells Fargo Advantage VT Index Asset Allocation Fund | | Performance Highlights (Unaudited) |
Wells Fargo Advantage VT Index Asset Allocation Fund
INVESTMENT OBJECTIVE
The Fund seeks long-term total return, consisting of capital appreciation and current income.
INVESTMENT ADVISER
Wells Fargo Funds Management, LLC
SUB-ADVISER
Wells Capital Management Incorporated
PORTFOLIO MANAGERS
Gregory T. Genung, CFA, CAIA
Jeffrey P. Mellas, CAIA
FUND INCEPTION
April 15, 1994
PERFORMANCE SUMMARY
12 MONTH TOTAL RETURN AS OF DECEMBER 31, 2010
| | | | | |
|
| Class 2 | | | 13.29 | % |
S&P 500® Index1 | | | 15.06 | % |
Barclays Capital 20+ Year U.S. Treasury Index2 | | | 9.38 | % |
Index Asset Allocation Composite Index3 | | | 14.01 | % |
Figures quoted represent past performance, which is no guarantee of future results and do not reflect the deduction of taxes that a shareholder may pay on fund distributions or the redemption of fund shares. Investment return and principal value of an investment will fluctuate so that an investor’s shares, when redeemed, may be worth more or less than their original cost. Current performance may be lower or higher than the performance data quoted. Current month-end performance is available by calling 1-866-765-0778. Performance figures of the Fund do not reflect fees charged pursuant to the terms of variable life insurance policies and variable annuity contracts.
The advisor has committed, through April 30, 2011, to waive fees and/or reimburse expenses to maintain the contractual expense cap at 1.00% for the Class 2 shares, excluding acquired fund fees and certain other expenses. Without these reductions, the Fund’s returns would have been lower. The Fund’s net expense ratio is 1.00% for the Class 2 shares. The Fund’s gross expense ratio is 1.07% for the Class 2 shares.
| | |
| 1. | | The S&P 500® Index consists of 500 stocks chosen for market size, liquidity, and industry group representation. It is a market value weighted index with each stock’s weight in the index proportionate to its market value. You cannot invest directly in an index. |
| |
| 2. | | The Barclays Capital 20+ Year U. S. Treasury Index is an unmanaged index composed of securities in the U.S. Treasury Index with maturities of 20 years or greater. You cannot invest directly in an index. |
| |
| 3. | | The Index Asset Allocation Composite Index is weighted 60% in the S&P 500 Index and 40% in the Barclays Capital 20+ Year U.S. Treasury Index. You cannot invest directly in an index. |
| | |
| Performance Highlights (Unaudited) | | Wells Fargo Advantage VT Index Asset Allocation Fund 7 |
Wells Fargo Advantage VT Index Asset Allocation Fund (continued)
MANAGER’S DISCUSSION
Fund Highlights
| § | | The Fund underperformed the Index Asset Allocation Composite Index and the S&P 500 Index for the 12-month period that ended December 31, 2010, but outperformed the Barclays Capital 20+ Year U.S. Treasury Index. |
| |
| § | | At the end of the period, the Fund was at a maximum equity overweighting, with an effective target allocation of 85% stocks and 15% bonds. |
| |
| § | | Because stocks outperformed bonds over the period, the Fund benefited from its equity overweight. Net of fees, however, the Fund underperformed. Because the Fund is an indexed portfolio, our goal is to have the Fund’s performance closely track that of the benchmark. |
The performance of U.S. stocks over the 12-month period could best be described as volatile, with 3% swings in monthly performance in nine of the 12 months of 2010. Investors who increased their portfolio weight to equities over the past year were well rewarded, however, as the S&P 500 Index returned 15.06% for the year. The strong gains in 2010 came after the gains in 2009, and we believe they reflect the continued economic recovery in the U.S.
A large portion of U.S. gross domestic product (GDP) is accounted for by business investment and personal consumption; both were instrumental in the economic improvement we witnessed in 2010. Capital expenditures increased as companies perceived the economic recovery, their increasing capacity utilization, and their dwindling inventory levels as more than transitory. The Obama administration’s extension of the Bush-era tax cuts also removed a barrier of uncertainty for businesses, providing greater clarity on future personnel and investment costs. The employment picture improved as the number of initial jobless claimants and those continuing to claim unemployment benefits both trended downward while the number of employees on the payrolls at private companies and in the manufacturing industries improved to levels of two years ago. Consumer spending increased in line with rising confidence as shown by a University of Michigan survey. A second round of quantitative easing stimulus enacted by the Federal Reserve (Fed) helped abate the fear of a double-dip recession, which provided many Americans the comfort needed to make previously deferred purchases.
TEN LARGEST PORTFOLIO HOLDINGS5
(AS OF DECEMBER 31, 2010)
| | | | | |
|
| US Treasury Bond 4.63% 02/15/2040 | | | 3.73 | % |
| US Treasury Bond 4.38% 05/15/2040 | | | 3.38 | % |
| US Treasury Bond 4.38% 11/15/2039 | | | 3.38 | % |
| US Treasury Bond 4.50% 08/15/2039 | | | 3.12 | % |
| US Treasury Bond 3.88% 08/15/2040 | | | 2.87 | % |
| US Treasury Bond 4.25% 05/15/2039 | | | 2.48 | % |
| US Treasury Bond 4.25% 11/15/2040 | | | 2.24 | % |
| US Treasury Bond 4.50% 02/15/2036 | | | 2.07 | % |
| Exxon Mobil Corporation | | | 1.79 | % |
| US Treasury Bond 4.50% 05/15/2038 | | | 1.64 | % |
| | |
| 4. | | The chart compares the performance of the Wells Fargo Advantage VT Index Asset Allocation Fund Class 2 for the most recent ten years of the Fund with the Index Asset Allocation Composite Index, S&P 500® Index and the Barclays Capital 20+ Year U.S. Treasury Index. The chart assumes a hypothetical $10,000 investment and reflects all operating expenses of the Fund. |
| |
| 5. | | The ten largest portfolio holdings are calculated based on the value of the securities divided by total investments of the Fund. Holdings are subject to change and may have changed since the date specified. |
| | |
| 8 Wells Fargo Advantage VT Index Asset Allocation Fund | | Performance Highlights (Unaudited) |
Wells Fargo Advantage VT Index Asset Allocation Fund (continued)
In the end, interest rates remained anchored at historically low levels, which pushed investors toward riskier assets such as equities for higher returns. U.S. stocks finished 2010 with the best fourth-quarter performance since 1991, which came after the best September performance since 1939. These strong returns helped propel the S&P 500 Index to a level not seen since before the Lehman Brothers crisis in August 2008. All 10 sectors in the index contributed to the gain, with consumer discretionary stocks leading the way. For the year, the S&P 500 Index returned 15.06%, and the Barclays Capital 20+ Year Treasury Index returned 9.38%.
On a gross-of-fees basis, the Fund modestly outpaced the Index Asset Allocation Composite Index for the 12-month period. Net of fees, however, the Fund underperformed. Because the Fund is an indexed portfolio, our goal is to have the Fund’s performance closely track that of the benchmark.
In the underlying portfolio, the Fund invests a neutral allocation of 60% stocks and 40% bonds and employs futures contracts to tactically make adjustments to that allocation. The Tactical Asset Allocation (TAA) Model shifted to its maximum overweight equity position in late 2007, and we maintained that effective allocation of 85% stocks and 15% bonds throughout 2010. As confidence in the economic rebound expanded, many investors reallocated their portfolios away from bonds and back into equities. The outperformance of stocks relative to bonds aided the Fund’s performance when compared with the neutral benchmark allocation.
There were no changes to the Fund’s tactical allocation.
There were changes to the underlying indexes, and we made those adjustments congruently with the S&P 500 Index and the Barclays Capital 20+ Year U.S. Treasury Index throughout the year.
The TAA Model continues to favor stocks relative to bonds.
We believe that the U.S. economy will continue to recover and grow. In our view, corporate earnings should show steady improvement, interest rates should remain relatively low, and inflation should remain benign for the foreseeable future. We expect to see job creation progress with the advancement of the economic recovery, which, in turn, should boost personal consumption as more Americans find work. We believe that such a scenario would allow for price/earnings multiples to expand and stocks to further their rally. We see bond prices as more susceptible to a potential sell-off given the low interest-rate environment and the inverse relationship of fixed-rate bond prices to interest rates. Given our outlook, we plan to remain overweight stocks until such time that we see relative valuation between stocks and bonds return to more normal levels.
| | |
| 6. | | Sector distribution is subject to change and is calculated based on the total long-term investments of the Fund. |
| | |
| Performance Highlights (Unaudited) | | Wells Fargo Advantage VT Index Asset Allocation Fund 9 |
Wells Fargo Advantage VT Index Asset Allocation Fund (continued)
AVERAGE ANNUAL TOTAL RETURN (%) (AS OF DECEMBER 31, 2010)
| | | | | | | | | | | | | | | | | | | | | | | | | | | | | |
| | | | | | | | | | | | | | | | | | | | | | | Expense Ratio7 |
| | | Inception Date | | 6 Months* | | 1 Year | | 5 Year | | 10 Year | | Gross | | Net8 |
| Class 2 | | | 4/15/1994 | | | | 17.35 | | | | 13.29 | | | | 2.27 | | | | 2.43 | | | | 1.07 | % | | | 1.00 | % |
S&P 500® Index1 | | | | | | | 23.27 | | | | 15.06 | | | | 2.29 | | | | 1.41 | | | | | | | | | |
Barclays Capital 20+ Year U.S. Treasury Index2 | | | | | | | (4.80 | ) | | | 9.38 | | | | 5.03 | | | | 6.44 | | | | | | | | | |
Index Asset Allocation Composite Index3 | | | | | | | 11.84 | | | | 14.01 | | | | 4.16 | | | | 4.07 | | | | | | | | | |
| | |
| * | | Returns for periods of less than one year are not annualized. |
Figures quoted represent past performance, which is no guarantee of future results and do not reflect the deduction of taxes that a shareholder may pay on fund distributions or the redemption of fund shares. Investment return and principal value of an investment will fluctuate so that an investor’s shares, when redeemed, may be worth more or less than their original cost. Current performance may be lower or higher than the performance data quoted. Current month-end performance is available by calling 1-866-765-0778. Performance figures of the Fund do not reflect fees charged pursuant to the terms of variable life insurance policies and variable annuity contracts.
Balanced funds may invest in stocks and bonds. Stock values fluctuate in response to the activities of individual companies and general market and economic conditions. Bond values fluctuate in response to the financial condition of individual issuers, general market and economic conditions, and changes in interest rates. In general, when interest rates rise, bond values fall and investors may lose principal value. The use of derivatives may reduce returns and/or increase volatility. Consult the Fund’s prospectus for additional information on these and other risks.
Please refer to the prospectus provided by your participating insurance company for detailed information describing the separate accounts for information regarding surrender charges, mortality and expense risk fees and other charges that may be assessed by the participating insurance companies.
| | |
| 7. | | Reflects the expense ratio as stated in the May 1, 2010 prospectus. |
| |
| 8. | | The investment adviser has contractually committed through April 30, 2011 to waive fees and/or reimburse expenses maintain the Fund’s contractual expense cap at 1.00% for Class 2 shares, excluding acquired fund fees and certain other expenses. Without these reductions, the Fund’s returns would have been lower. |
| | |
| 10 Wells Fargo Advantage VT Index Asset Allocation Fund | | Fund Expenses (Unaudited) |
As a shareholder of the Fund, you incur two types of costs: (1) transaction costs, including sales charges (loads) on purchase payments, redemption fees (if any) and exchange fees (if any); and (2) ongoing costs, including management fees; distribution (12b-1) and/or shareholder service fees; and other Fund expenses. This example is intended to help you understand your ongoing costs (in dollars) of investing in the Fund and to compare these costs with the ongoing costs of investing in other mutual funds.
The example is based on an investment of $1,000 invested at the beginning of the six-month period and held for the entire period from July 1, 2010 to December 31, 2010.
Actual expenses
The “Actual” line of the table below provides information about actual account values and actual expenses. You may use the information in this line, together with the amount you invested, to estimate the expenses that you paid over the period. Simply divide your account value by $1,000 (for example, an $8,600 account value divided by $1,000 = 8.6), then multiply the result by the number in the “Actual” line under the heading entitled “Expenses Paid During Period” for your applicable class of shares to estimate the expenses you paid on your account during this period.
Hypothetical example for comparison purposes
The “Hypothetical” line of the table below provides information about hypothetical account values and hypothetical expenses based on the Fund’s actual expense ratio and an assumed rate of return of 5% per year before expenses, which is not the Fund’s actual return. The hypothetical account values and expenses may not be used to estimate the actual ending account balance or expenses you paid for the period. You may use this information to compare the ongoing costs of investing in the Fund and other funds. To do so, compare this 5% hypothetical example with the 5% hypothetical examples that appear in the shareholder reports of the other funds.
Please note that the expenses shown in the table are meant to highlight your ongoing costs only and do not reflect any transactional costs, such as sales charges (loads), redemption fees, exchange fees or separate account charges assessed by participating insurance companies. Therefore, the “Hypothetical” line of the table is useful in comparing ongoing costs only, and will not help you determine the relative total costs of owning different funds. In addition, if these transactional costs were included, your costs would have been higher.
| | | | | | | | | | | | | | | | | |
| | | Beginning | | Ending | | Expenses | | |
| | | Account Value | | Account Value | | Paid During | | Net Annual |
| | | 07-01-2010 | | 12-31-2010 | | the Period1 | | Expense Ratio |
Class 2 | | | | | | | | | | | | | | | | |
| Actual | | $ | 1,000.00 | | | $ | 1,173.46 | | | $ | 5.54 | | | | 1.00 | % |
| Hypothetical (5% return before expenses) | | $ | 1,000.00 | | | $ | 1,020.38 | | | $ | 5.15 | | | | 1.00 | % |
| | |
| 1. | | Expenses are equal to the Fund’s annualized expense ratio multiplied by the average account value over the period, multiplied by the number of days in the most recent six-month period divided by 365 (to reflect the one-half year period). |
| | | |
|
| Portfolio of Investments—December 31, 2010 | | Wells Fargo Advantage VT Index Asset Allocation Fund 11 |
| | | | | | | | | |
| Shares | | | Security Name | | Value | |
| Common Stocks: 60.45% | | | | |
| | | | | | | | | |
| Consumer Discretionary: 6.39% | | | | |
| | | | | | | | | |
| Auto Components: 0.15% | | | | |
| | 3,672 | | | Johnson Controls Incorporated | | $ | 140,270 | |
| | 1,322 | | | The Goodyear Tire & Rubber Company† | | | 15,666 | |
| | | | | | | | | |
| | | | | | | | 155,936 | |
| | | | | | | | |
| | | | | | | | | |
| Automobiles: 0.38% | | | | |
| | 20,403 | | | Ford Motor Company† | | | 342,566 | |
| | 1,282 | | | Harley-Davidson Incorporated | | | 44,447 | |
| | | | | | | | | |
| | | | | | | | 387,013 | |
| | | | | | | | |
| | | | | | | | | |
| Distributors: 0.04% | | | | |
| | 857 | | | Genuine Parts Company | | | 43,998 | |
| | | | | | | | |
| | | | | | | | | |
| Diversified Consumer Services: 0.06% | | | | |
| | 692 | | | Apollo Group Incorporated Class A† | | | 27,327 | |
| | 339 | | | DeVry Incorporated | | | 16,265 | |
| | 1,680 | | | H&R Block Incorporated | | | 20,009 | |
| | | | | | | | | |
| | | | | | | | 63,601 | |
| | | | | | | | |
| | | | | | | | | |
| Hotels, Restaurants & Leisure: 1.04% | | | | |
| | 2,345 | | | Carnival Corporation | | | 108,128 | |
| | 753 | | | Darden Restaurants Incorporated | | | 34,969 | |
| | 1,623 | | | International Game Technology | | | 28,711 | |
| | 1,567 | | | Marriott International Incorporated Class A | | | 65,093 | |
| | 5,753 | | | McDonald’s Corporation | | | 441,600 | |
| | 4,035 | | | Starbucks Corporation« | | | 129,645 | |
| | 1,038 | | | Starwood Hotels & Resorts Worldwide Incorporated | | | 63,090 | |
| | 952 | | | Wyndham Worldwide Corporation« | | | 28,522 | |
| | 411 | | | Wynn Resorts Limited« | | | 42,678 | |
| | 2,551 | | | Yum! Brands Incorporated | | | 125,127 | |
| | | | | | | | | |
| | | | | | | | 1,067,563 | |
| | | | | | | | |
| | | | | | | | | |
| Household Durables: 0.25% | | | | |
| | 1,528 | | | D.R. Horton Incorporated« | | | 18,229 | |
| | 830 | | | Fortune Brands Incorporated | | | 50,008 | |
| | 378 | | | Harman International Industries Incorporated† | | | 17,501 | |
| | 797 | | | Leggett & Platt Incorporated« | | | 18,140 | |
| | 866 | | | Lennar Corporation« | | | 16,238 | |
| | 1,580 | | | Newell Rubbermaid Incorporated« | | | 28,724 | |
| | 1,831 | | | Pulte Homes Incorporated†« | | | 13,769 | |
| | 903 | | | Stanley Black & Decker Incorporated | | | 60,384 | |
| | 413 | | | Whirlpool Corporation« | | | 36,687 | |
| | | | | | | | | |
| | | | | | | | 259,680 | |
| | | | | | | | |
| | | | | | | | | |
| Internet & Catalog Retail: 0.47% | | | | |
| | 1,930 | | | Amazon.com Incorporated† | | | 347,400 | |
| | 1,101 | | | Expedia Incorporated | | | 27,624 | |
| | 267 | | | Priceline.com Incorporated† | | | 106,680 | |
| | | | | | | | 481,704 | |
| | | | | | | | |
| | | |
|
| 12 Wells Fargo Advantage VT Index Asset Allocation Fund | | Portfolio of Investments—December 31, 2010 |
| | | | | | | | | |
| Shares | | | Security Name | | Value | |
| Leisure Equipment & Products: 0.08% | | | | |
| | 741 | | | Hasbro Incorporated | | $ | 34,960 | |
| | 1,954 | | | Mattel Incorporated | | | 49,690 | |
| | | | | | | | | |
| | | | | | | | 84,650 | |
| | | | | | | | |
| | | | | | | | | |
| Media: 1.89% | | | | |
| | 1,307 | | | Cablevision Systems Corporation New York Group Class A | | | 44,229 | |
| | 3,707 | | | CBS Corporation Class B | | | 70,618 | |
| | 15,194 | | | Comcast Corporation Class A | | | 333,812 | |
| | 4,540 | | | DIRECTV Group Incorporated† | | | 181,282 | |
| | 1,548 | | | Discovery Communications Incorporated Class C†« | | | 64,552 | |
| | 1,301 | | | Gannett Company Incorporated | | | 19,632 | |
| | 2,661 | | | Interpublic Group of Companies Incorporated† | | | 28,260 | |
| | 1,671 | | | McGraw-Hill Companies Incorporated | | | 60,841 | |
| | 198 | | | Meredith Corporation« | | | 6,861 | |
| | 12,436 | | | News Corporation Class A | | | 181,068 | |
| | 1,640 | | | Omnicom Group Incorporated« | | | 75,112 | |
| | 490 | | | Scripps Networks Interactive Incorporated | | | 25,358 | |
| | 1,937 | | | Time Warner Cable Incorporated | | | 127,900 | |
| | 6,040 | | | Time Warner Incorporated | | | 194,307 | |
| | 3,292 | | | Viacom Incorporated Class B | | | 130,396 | |
| | 10,311 | | | Walt Disney Company | | | 386,766 | |
| | 29 | | | Washington Post Company Class B | | | 12,746 | |
| | | | | | | | | |
| | | | | | | | 1,943,740 | |
| | | | | | | | |
| | | | | | | | | |
| Multiline Retail: 0.51% | | | | |
| | 411 | | | Big Lots Incorporated†« | | | 12,519 | |
| | 685 | | | Family Dollar Stores Incorporated | | | 34,051 | |
| | 1,287 | | | JCPenney Company Incorporated | | | 41,583 | |
| | 1,592 | | | Kohl’s Corporation†« | | | 86,509 | |
| | 2,306 | | | Macy’s Incorporated | | | 58,342 | |
| | 916 | | | Nordstrom Incorporated | | | 38,820 | |
| | 239 | | | Sears Holdings Corporation†« | | | 17,626 | |
| | 3,856 | | | Target Corporation | | | 231,861 | |
| | | | | | | | | |
| | | | | | | | 521,311 | |
| | | | | | | | |
| | | | | | | | | |
| Specialty Retail: 1.18% | | | | |
| | 478 | | | Abercrombie & Fitch Company Class A | | | 27,547 | |
| | 346 | | | AutoNation Incorporated† | | | 9,757 | |
| | 148 | | | AutoZone Incorporated† | | | 40,343 | |
| | 1,411 | | | Bed Bath & Beyond Incorporated† | | | 69,351 | |
| | 1,798 | | | Best Buy Company Incorporated | | | 61,653 | |
| | 1,224 | | | CarMax Incorporated†« | | | 39,021 | |
| | 824 | | | GameStop Corporation Class A†« | | | 18,853 | |
| | 2,392 | | | Gap Incorporated | | | 52,959 | |
| | 8,924 | | | Home Depot Incorporated« | | | 312,875 | |
| | 1,440 | | | Limited Brands Incorporated | | | 44,251 | |
| | 7,515 | | | Lowe’s Companies Incorporated | | | 188,476 | |
| | 760 | | | O’Reilly Automotive Incorporated† | | | 45,919 | |
| | 619 | | | RadioShack Corporation« | | | 11,445 | |
| | 655 | | | Ross Stores Incorporated | | | 41,429 | |
| | 3,938 | | | Staples Incorporated« | | | 89,668 | |
| | 688 | | | Tiffany & Company | | | 42,842 | |
| | 2,155 | | | TJX Companies Incorporated | | | 95,660 | |
| | 701 | | | Urban Outfitters Incorporated†« | | | 25,103 | |
| | | | | | | | | |
| | | | | | | | 1,217,152 | |
| | | | | | | | |
| | | |
|
| Portfolio of Investments—December 31, 2010 | | Wells Fargo Advantage VT Index Asset Allocation Fund 13 |
| | | | | | | | | |
| Shares | | | Security Name | | Value | |
| Textiles, Apparel & Luxury Goods: 0.34% | | | | |
| | 1,614 | | | Coach Incorporated« | | $ | 89,270 | |
| | 2,081 | | | Nike Incorporated Class B | | | 177,759 | |
| | 352 | | | Polo Ralph Lauren Corporation | | | 39,044 | |
| | 472 | | | VF Corporation« | | | 40,677 | |
| | | | | | | | | |
| | | | | | | | 346,750 | |
| | | | | | | | |
| | | | | | | | | |
| Consumer Staples: 6.43% | | | | |
| | | | | | | | | |
| Beverages: 1.54% | | | | |
| | 565 | | | Brown-Forman Corporation Class B | | | 39,335 | |
| | 1,844 | | | Coca-Cola Enterprises Incorporated | | | 46,155 | |
| | 970 | | | Constellation Brands Incorporated Class A† | | | 21,486 | |
| | 1,236 | | | Dr Pepper Snapple Group Incorporated | | | 43,458 | |
| | 861 | | | Molson Coors Brewing Company | | | 43,214 | |
| | 8,630 | | | PepsiCo Incorporated | | | 563,798 | |
| | 12,645 | | | The Coca-Cola Company | | | 831,662 | |
| | | | | | | | | |
| | | | | | | | 1,589,108 | |
| | | | | | | | |
| | | | | | | | | |
| Food & Staples Retailing: 1.43% | | | | |
| | 2,354 | | | Costco Wholesale Corporation« | | | 169,982 | |
| | 7,399 | | | CVS Caremark Corporation | | | 257,263 | |
| | 3,472 | | | Kroger Company« | | | 77,634 | |
| | 2,030 | | | Safeway Incorporated« | | | 45,655 | |
| | 1,155 | | | SUPERVALU Incorporated« | | | 11,123 | |
| | 3,186 | | | Sysco Corporation | | | 93,668 | |
| | 10,668 | | | Wal-Mart Stores Incorporated | | | 575,325 | |
| | 5,041 | | | Walgreen Company | | | 196,397 | |
| | 800 | | | Whole Foods Market Incorporated | | | 40,472 | |
| | | | | | | | | |
| | | | | | | | 1,467,519 | |
| | | | | | | | |
| | | | | | | | | |
| Food Products: 1.05% | | | | |
| | 3,479 | | | Archer Daniels Midland Company | | | 104,648 | |
| | 1,042 | | | Campbell Soup Company« | | | 36,210 | |
| | 2,394 | | | ConAgra Foods Incorporated | | | 54,057 | |
| | 992 | | | Dean Foods Company†« | | | 8,769 | |
| | 3,486 | | | General Mills Incorporated | | | 124,067 | |
| | 1,746 | | | H.J. Heinz Company« | | | 86,357 | |
| | 377 | | | Hormel Foods Corporation« | | | 19,325 | |
| | 650 | | | JM Smucker Company« | | | 42,673 | |
| | 1,383 | | | Kellogg Company | | | 70,644 | |
| | 9,512 | | | Kraft Foods Incorporated Class A | | | 299,723 | |
| | 723 | | | McCormick & Company Incorporated« | | | 33,641 | |
| | 1,114 | | | Mead Johnson & Company | | | 69,347 | |
| | 3,481 | | | Sara Lee Corporation | | | 60,952 | |
| | 842 | | | The Hershey Company« | | | 39,700 | |
| | 1,622 | | | Tyson Foods Incorporated Class A« | | | 27,931 | |
| | | | | | | | | |
| | | | | | | | 1,078,044 | |
| | | | | | | | |
| | | | | | | | | |
| Household Products: 1.34% | | | | |
| | 759 | | | Clorox Company | | | 48,030 | |
| | 2,628 | | | Colgate-Palmolive Company | | | 211,212 | |
| | 2,220 | | | Kimberly-Clark Corporation | | | 139,949 | |
| | 15,243 | | | Procter & Gamble Company | | | 980,582 | |
| | | | | | | | | |
| | | | | | | | 1,379,773 | |
| | | | | | | | |
| | | |
|
| 14 Wells Fargo Advantage VT Index Asset Allocation Fund | | Portfolio of Investments—December 31, 2010 |
| | | | | | | | | |
| Shares | | | Security Name | | Value | |
| Personal Products: 0.11% | | | | |
| | 2,337 | | | Avon Products Incorporated | | $ | 67,913 | |
| | 618 | | | Estee Lauder Companies Incorporated Class A« | | | 49,873 | |
| | | | | | | | | |
| | | | | | | | 117,786 | |
| | | | | | | | |
| | | | | | | | | |
| Tobacco: 0.96% | | | | |
| | 11,369 | | | Altria Group Incorporated | | | 279,905 | |
| | 814 | | | Lorillard Incorporated | | | 66,797 | |
| | 9,880 | | | Philip Morris International | | | 578,276 | |
| | 1,841 | | | Reynolds American Incorporated | | | 60,053 | |
| | | | | | | | | |
| | | | | | | | 985,031 | |
| | | | | | | | |
| | | | | | | | | |
| Energy: 7.27% | | | | |
| | | | | | | | | |
| Energy Equipment & Services: 1.31% | | | | |
| | 2,348 | | | Baker Hughes Incorporated | | | 134,235 | |
| | 1,320 | | | Cameron International Corporation†« | | | 66,964 | |
| | 378 | | | Diamond Offshore Drilling Incorporated | | | 25,277 | |
| | 651 | | | FMC Technologies Incorporated†« | | | 57,880 | |
| | 4,953 | | | Halliburton Company« | | | 202,231 | |
| | 577 | | | Helmerich & Payne Incorporated« | | | 27,973 | |
| | 1,554 | | | Nabors Industries Limited† | | | 36,457 | |
| | 2,285 | | | National Oilwell Varco Incorporated | | | 153,666 | |
| | 687 | | | Rowan Companies Incorporated†« | | | 23,983 | |
| | 7,430 | | | Schlumberger Limited | | | 620,405 | |
| | | | | | | | | |
| | | | | | | | 1,349,071 | |
| | | | | | | | |
| | | | | | | | | |
| Oil, Gas & Consumable Fuels: 5.96% | | | | |
| | 2,698 | | | Anadarko Petroleum Corporation | | | 205,480 | |
| | 2,081 | | | Apache Corporation | | | 248,118 | |
| | 566 | | | Cabot Oil & Gas Corporation« | | | 21,423 | |
| | 3,561 | | | Chesapeake Energy Corporation | | | 92,266 | |
| | 10,959 | | | Chevron Corporation | | | 1,000,009 | |
| | 8,000 | | | ConocoPhillips | | | 544,800 | |
| | 1,229 | | | CONSOL Energy Incorporated | | | 59,901 | |
| | 2,176 | | | Denbury Resources Incorporated† | | | 41,540 | |
| | 2,352 | | | Devon Energy Corporation | | | 184,656 | |
| | 3,834 | | | El Paso Corporation | | | 52,756 | |
| | 1,383 | | | EOG Resources Incorporated | | | 126,420 | |
| | 812 | | | EQT Corporation« | | | 36,410 | |
| | 27,460 | | | Exxon Mobil Corporation | | | 2,007,875 | |
| | 1,633 | | | Hess Corporation | | | 124,990 | |
| | 3,865 | | | Marathon Oil Corporation | | | 143,121 | |
| | 556 | | | Massey Energy Company | | | 29,829 | |
| | 1,047 | | | Murphy Oil Corporation | | | 78,054 | |
| | 729 | | | Newfield Exploration Company†« | | | 52,568 | |
| | 953 | | | Noble Energy Incorporated | | | 82,034 | |
| | 4,425 | | | Occidental Petroleum Corporation† | | | 434,093 | |
| | 1,468 | | | Peabody Energy Corporation | | | 93,923 | |
| | 632 | | | Pioneer Natural Resources Company« | | | 54,870 | |
| | 956 | | | QEP Resources Incorporated | | | 34,712 | |
| | 871 | | | Range Resources Corporation« | | | 39,178 | |
| | 1,888 | | | Southwestern Energy Company† | | | 70,668 | |
| | 3,530 | | | Spectra Energy Corporation« | | | 88,215 | |
| | 656 | | | Sunoco Incorporated | | | 26,443 | |
| | 779 | | | Tesoro Petroleum Corporation« | | | 14,443 | |
| | | |
|
| Portfolio of Investments—December 31, 2010 | | Wells Fargo Advantage VT Index Asset Allocation Fund 15 |
| | | | | | | | | |
| Shares | | | Security Name | | Value | |
| Oil, Gas & Consumable Fuels (continued) | | | | |
| | 3,184 | | | The Williams Companies Incorporated | | $ | 78,708 | |
| | 3,083 | | | Valero Energy Corporation« | | | 71,279 | |
| | | | | | | | | |
| | | | | | | | 6,138,782 | |
| | | | | | | | |
| | | | | | | | | |
| Financials: 10.00% | | | | |
| | | | | | | | | |
| Capital Markets: 1.53% | | | | |
| | 1,350 | | | Ameriprise Financial Incorporated | | | 77,693 | |
| | 6,755 | | | Bank of New York Mellon Corporation« | | | 204,001 | |
| | 5,400 | | | Charles Schwab Corporation | | | 92,394 | |
| | 1,082 | | | E*TRADE Financial Corporation† | | | 17,312 | |
| | 498 | | | Federated Investors Incorporated Class B | | | 13,033 | |
| | 792 | | | Franklin Resources Incorporated | | | 88,078 | |
| | 2,784 | | | Goldman Sachs Group Incorporated | | | 468,157 | |
| | 2,516 | | | INVESCO Limited | | | 60,535 | |
| | 1,000 | | | Janus Capital Group Incorporated« | | | 12,970 | |
| | 833 | | | Legg Mason Incorporated« | | | 30,213 | |
| | 8,238 | | | Morgan Stanley | | | 224,156 | |
| | 1,318 | | | Northern Trust Corporation« | | | 73,030 | |
| | 2,733 | | | State Street Corporation | | | 126,647 | |
| | 1,396 | | | T. Rowe Price Group Incorporated« | | | 90,098 | |
| | | | | | | | | |
| | | | | | | | 1,578,317 | |
| | | | | | | | |
| | | | | | | | | |
| Commercial Banks: 1.81% | | | | |
| | 3,777 | | | Branch Banking & Trust Corporation« | | | 99,297 | |
| | 961 | | | Comerica Incorporated« | | | 40,593 | |
| | 4,336 | | | Fifth Third Bancorp | | | 63,652 | |
| | 1,421 | | | First Horizon National Corporation† | | | 16,743 | |
| | 4,701 | | | Huntington Bancshares Incorporated | | | 32,296 | |
| | 4,794 | | | KeyCorp | | | 42,427 | |
| | 650 | | | M&T Bank Corporation | | | 56,583 | |
| | 2,875 | | | Marshall & Ilsley Corporation | | | 19,895 | |
| | 2,863 | | | PNC Financial Services Group Incorporated | | | 173,841 | |
| | 6,840 | | | Regions Financial Corporation | | | 47,880 | |
| | 2,722 | | | SunTrust Banks Incorporated« | | | 80,326 | |
| | 10,446 | | | US Bancorp | | | 281,729 | |
| | 28,583 | | | Wells Fargo & Company(l) | | | 885,787 | |
| | 969 | | | Zions Bancorporation | | | 23,479 | |
| | | | | | | | | |
| | | | | | | | 1,864,528 | |
| | | | | | | | |
| | | | | | | | | |
| Consumer Finance: 0.72% | | | | |
| | 5,703 | | | American Express Company | | | 244,773 | |
| | 2,488 | | | Capital One Financial Corporation« | | | 105,889 | |
| | 2,965 | | | Discover Financial Services« | | | 54,941 | |
| | 527 | | | MasterCard Incorporated | | | 118,106 | |
| | 2,644 | | | SLM Corporation† | | | 33,288 | |
| | 2,653 | | | Visa Incorporated Class A | | | 186,718 | |
| | | | | | | | | |
| | | | | | | | 743,715 | |
| | | | | | | | |
| | | | | | | | | |
| Diversified Financial Services: 3.33% | | | | |
| | 54,920 | | | Bank of America Corporation | | | 732,633 | |
| | 9,423 | | | Berkshire Hathaway Incorporated Class B† | | | 754,877 | |
| | 158,198 | | | Citigroup Incorporated† | | | 748,277 | |
| | 364 | | | CME Group Incorporated | | | 117,117 | |
| | 398 | | | InterContinental Exchange Incorporated†« | | | 47,422 | |
| | | |
|
| 16 Wells Fargo Advantage VT Index Asset Allocation Fund | | Portfolio of Investments—December 31, 2010 |
| | | | | | | | | |
| Shares | | | Security Name | | Value | |
| Diversified Financial Services (continued) | | | | |
| | 21,288 | | | JPMorgan Chase & Company | | $ | 903,037 | |
| | 1,073 | | | Leucadia National Corporation | | | 31,310 | |
| | 1,109 | | | Moody’s Corporation | | | 29,433 | |
| | 810 | | | NASDAQ Stock Market Incorporated† | | | 19,205 | |
| | 1,421 | | | NYSE Euronext Incorporated | | | 42,602 | |
| | | | | | | | | |
| | | | | | | | 3,425,913 | |
| | | | | | | | |
| | | | | | | | | |
| Insurance: 1.63% | | | | |
| | 1,848 | | | ACE Limited | | | 115,038 | |
| | 2,566 | | | AFLAC Incorporated | | | 144,799 | |
| | 2,930 | | | Allstate Corporation | | | 93,408 | |
| | 762 | | | American International Group Incorporated†« | | | 43,906 | |
| | 1,796 | | | AON Corporation | | | 82,634 | |
| | 580 | | | Assurant Incorporated | | | 22,342 | |
| | 1,660 | | | Chubb Corporation | | | 99,002 | |
| | 886 | | | Cincinnati Financial Corporation« | | | 28,077 | |
| | 2,666 | | | Genworth Financial Incorporated† | | | 35,031 | |
| | 2,420 | | | Hartford Financial Services Group Incorporated | | | 64,106 | |
| | 1,724 | | | Lincoln National Corporation | | | 47,944 | |
| | 1,722 | | | Loews Corporation | | | 67,003 | |
| | 2,959 | | | Marsh & McLennan Companies Incorporated« | | | 80,899 | |
| | 4,935 | | | MetLife Incorporated« | | | 219,311 | |
| | 1,744 | | | Principal Financial Group Incorporated« | | | 56,785 | |
| | 2,643 | | | Prudential Financial Incorporated | | | 155,171 | |
| | 3,613 | | | The Progressive Corporation | | | 71,790 | |
| | 2,499 | | | The Travelers Companies Incorporated | | | 139,219 | |
| | 435 | | | Torchmark Corporation | | | 25,987 | |
| | 1,727 | | | UnumProvident Corporation | | | 41,828 | |
| | 1,760 | | | XL Group plc | | | 38,403 | |
| | | | | | | | | |
| | | | | | | | 1,672,683 | |
| | | | | | | | |
| | | | | | | | | |
| Real Estate Investment Trusts (REIT): 0.89% | | | | |
| | 637 | | | Apartment Investment & Management Company Class A | | | 16,460 | |
| | 464 | | | AvalonBay Communities Incorporated | | | 52,223 | |
| | 762 | | | Boston Properties Incorporated | | | 65,608 | |
| | 1,549 | | | Equity Residential | | | 80,471 | |
| | 1,984 | | | HCP Incorporated | | | 72,991 | |
| | 790 | | | Health Care REIT Incorporated | | | 37,636 | |
| | 3,626 | | | Host Hotels & Resorts Incorporated« | | | 64,797 | |
| | 2,210 | | | Kimco Realty Corporation« | | | 39,868 | |
| | 880 | | | Plum Creek Timber Company« | | | 32,956 | |
| | 3,098 | | | ProLogis | | | 44,735 | |
| | 760 | | | Public Storage Incorporated | | | 77,079 | |
| | 1,595 | | | Simon Property Group Incorporated | | | 158,687 | |
| | 855 | | | Ventas Incorporated« | | | 44,870 | |
| | 885 | | | Vornado Realty Trust | | | 73,747 | |
| | 2,918 | | | Weyerhaeuser Company | | | 55,238 | |
| | | | | | | | | |
| | | | | | | | 917,366 | |
| | | | | | | | |
| | | | | | | | | |
| Real Estate Management & Development: 0.03% | | | | |
| | 1,582 | | | CB Richard Ellis Group Incorporated Class A† | | | 32,399 | |
| | | | | | | | |
| | | | | | | | | |
| Thrifts & Mortgage Finance: 0.06% | | | | |
| | 2,867 | | | Hudson City Bancorp Incorporated | | | 36,526 | |
| | 2,009 | | | People’s United Financial Incorporated« | | | 28,146 | |
| | | | | | | | | |
| | | | | | | | 64,672 | |
| | | | | | | | |
| | | |
|
| Portfolio of Investments—December 31, 2010 | | Wells Fargo Advantage VT Index Asset Allocation Fund 17 |
| | | | | | | | | |
| Shares | | | Security Name | | Value | |
| Health Care: 6.52% | | | | |
| | | | | | | | | |
| Biotechnology: 0.78% | | | | |
| | 5,145 | | | Amgen Incorporated† | | $ | 282,461 | |
| | 1,297 | | | Biogen Idec Incorporated†« | | | 86,964 | |
| | 2,562 | | | Celgene Corporation†« | | | 151,517 | |
| | 409 | | | Cephalon Incorporated†« | | | 25,243 | |
| | 1,410 | | | Genzyme Corporation† | | | 100,392 | |
| | 4,421 | | | Gilead Sciences Incorporated† | | | 160,217 | |
| | | | | | | | | |
| | | | | | | | 806,794 | |
| | | | | | | | |
| | | | | | | | | |
| Health Care Equipment & Supplies: 0.97% | | | | |
| | 3,173 | | | Baxter International Incorporated | | | 160,617 | |
| | 1,252 | | | Becton Dickinson & Company« | | | 105,819 | |
| | 8,277 | | | Boston Scientific Corporation† | | | 62,657 | |
| | 505 | | | C.R. Bard Incorporated | | | 46,344 | |
| | 1,214 | | | CareFusion Corporation† | | | 31,200 | |
| | 773 | | | DENTSPLY International Incorporated« | | | 26,413 | |
| | 909 | | | Hospira Incorporated†« | | | 50,622 | |
| | 213 | | | Intuitive Surgical Incorporated†« | | | 54,901 | |
| | 5,880 | | | Medtronic Incorporated | | | 218,089 | |
| | 1,866 | | | St. Jude Medical Incorporated† | | | 79,772 | |
| | 1,859 | | | Stryker Corporation« | | | 99,828 | |
| | 1,075 | | | Zimmer Holdings Incorporated† | | | 57,706 | |
| | | | | | | | | |
| | | | | | | | 993,968 | |
| | | | | | | | |
| | | | | | | | | |
| Health Care Providers & Services: 1.17% | | | | |
| | 2,178 | | | Aetna Incorporated | | | 66,451 | |
| | 1,504 | | | AmerisourceBergen Corporation | | | 51,316 | |
| | 1,900 | | | Cardinal Health Incorporated | | | 72,789 | |
| | 1,475 | | | CIGNA Corporation | | | 54,074 | |
| | 808 | | | Coventry Health Care Incorporated† | | | 21,331 | |
| | 529 | | | DaVita Incorporated† | | | 36,760 | |
| | 2,870 | | | Express Scripts Incorporated† | | | 155,124 | |
| | 916 | | | Humana Incorporated† | | | 50,142 | |
| | 553 | | | Laboratory Corporation of America Holdings† | | | 48,620 | |
| | 1,378 | | | McKesson Corporation | | | 96,984 | |
| | 2,311 | | | Medco Health Solutions Incorporated† | | | 141,595 | |
| | 526 | | | Patterson Companies Incorporated | | | 16,111 | |
| | 770 | | | Quest Diagnostics Incorporated | | | 41,557 | |
| | 2,644 | | | Tenet Healthcare Corporation† | | | 17,688 | |
| | 5,989 | | | UnitedHealth Group Incorporated | | | 216,263 | |
| | 2,143 | | | WellPoint Incorporated† | | | 121,851 | |
| | | | | | | | | |
| | | | | | | | 1,208,656 | |
| | | | | | | | |
| | | | | | | | | |
| Health Care Technology: 0.04% | | | | |
| | 388 | | | Cerner Corporation†« | | | 36,759 | |
| | | | | | | | |
| | | | | | | | | |
| Life Sciences Tools & Services: 0.27% | | | | |
| | 1,016 | | | Life Technologies Corporation† | | | 56,388 | |
| | 642 | | | PerkinElmer Incorporated | | | 16,576 | |
| | 2,164 | | | Thermo Fisher Scientific Incorporated† | | | 119,799 | |
| | 647 | | | Varian Medical Systems Incorporated†« | | | 44,824 | |
| | 497 | | | Waters Corporation† | | | 38,622 | |
| | | | | | | | | |
| | | | | | | | 276,209 | |
| | | | | | | | |
| | | |
|
| 18 Wells Fargo Advantage VT Index Asset Allocation Fund | | Portfolio of Investments—December 31, 2010 |
| | | | | | | | | |
| Shares | | | Security Name | | Value | |
| Pharmaceuticals: 3.29% | | | | |
| | 8,418 | | | Abbott Laboratories | | $ | 403,306 | |
| | 1,674 | | | Allergan Incorporated« | | | 114,954 | |
| | 9,321 | | | Bristol-Myers Squibb Company | | | 246,820 | |
| | 5,526 | | | Eli Lilly & Company | | | 193,631 | |
| | 1,555 | | | Forest Laboratories Incorporated† | | | 49,729 | |
| | 14,955 | | | Johnson & Johnson | | | 924,967 | |
| | 16,777 | | | Merck & Company Incorporated | | | 604,643 | |
| | 2,370 | | | Mylan Laboratories Incorporated† | | | 50,078 | |
| | 43,619 | | | Pfizer Incorporated | | | 763,769 | |
| | 682 | | | Watson Pharmaceuticals Incorporated† | | | 35,225 | |
| | | | | | | | | |
| | | | | | | | 3,387,122 | |
| | | | | | | | |
| | | | | | | | | |
| Industrials: 6.62% | | | | |
| |
| Aerospace & Defense: 1.60% | | | | |
| | 3,994 | | | Boeing Company | | | 260,648 | |
| | 2,057 | | | General Dynamics Corporation | | | 145,965 | |
| | 682 | | | Goodrich Corporation | | | 60,064 | |
| | 4,248 | | | Honeywell International Incorporated† | | | 225,824 | |
| | 999 | | | ITT Corporation« | | | 52,058 | |
| | 616 | | | L-3 Communications Holdings Incorporated« | | | 43,422 | |
| | 1,608 | | | Lockheed Martin Corporation« | | | 112,415 | |
| | 1,590 | | | Northrop Grumman Corporation« | | | 103,000 | |
| | 776 | | | Precision Castparts Corporation« | | | 108,027 | |
| | 1,985 | | | Raytheon Company | | | 91,985 | |
| | 854 | | | Rockwell Collins Incorporated | | | 49,754 | |
| | 5,028 | | | United Technologies Corporation | | | 395,804 | |
| | | | | | | | | |
| | | | | | | | 1,648,966 | |
| | | | | | | | |
| | | | | | | | | |
| Air Freight & Logistics: 0.67% | | | | |
| | 904 | | | C.H. Robinson Worldwide Incorporated« | | | 72,492 | |
| | 1,156 | | | Expeditors International of Washington Incorporated | | | 63,118 | |
| | 1,713 | | | FedEx Corporation | | | 159,326 | |
| | 5,385 | | | United Parcel Service Incorporated Class B« | | | 390,843 | |
| | | | | | | | | |
| | | | | | | | 685,779 | |
| | | | | | | | |
| | | | | | | | | |
| Airlines: 0.05% | | | | |
| | 4,068 | | | Southwest Airlines Company« | | | 52,803 | |
| | | | | | | | |
| | | | | | | | | |
| Building Products: 0.02% | | | | |
| | 1,952 | | | Masco Corporation« | | | 24,712 | |
| | | | | | | | |
| | | | | | | | | |
| Commercial Services & Supplies: 0.36% | | | | |
| | 587 | | | Avery Dennison Corporation« | | | 24,854 | |
| | 688 | | | Cintas Corporation | | | 19,236 | |
| | 271 | | | Dun & Bradstreet Corporation« | | | 22,246 | |
| | 672 | | | Equifax Incorporated« | | | 23,923 | |
| | 1,089 | | | Iron Mountain Incorporated | | | 27,236 | |
| | 1,107 | | | Pitney Bowes Incorporated | | | 26,767 | |
| | 1,674 | | | Republic Services Incorporated | | | 49,986 | |
| | 801 | | | Robert Half International Incorporated« | | | 24,511 | |
| | 1,123 | | | RR Donnelley & Sons Company« | | | 19,619 | |
| | 465 | | | Stericycle Incorporated†« | | | 37,628 | |
| | 2,591 | | | Waste Management Incorporated†« | | | 95,530 | |
| | | | | | | | | |
| | | | | | | | 371,536 | |
| | | | | | | | |
| | | |
|
| Portfolio of Investments—December 31, 2010 | | Wells Fargo Advantage VT Index Asset Allocation Fund 19 |
| | | | | | | | | |
| Shares | | | Security Name | | Value | |
| Construction & Engineering: 0.12% | | | | |
| | 973 | | | Fluor Corporation | | $ | 64,471 | |
| | 686 | | | Jacobs Engineering Group Incorporated† | | | 31,453 | |
| | 1,173 | | | Quanta Services Incorporated†« | | | 23,366 | |
| | | | | | | | | |
| | | | | | | | 119,290 | |
| | | | | | | | |
| | | | | | | | | |
| Electrical Equipment: 0.32% | | | | |
| | 4,098 | | | Emerson Electric Company« | | | 234,283 | |
| | 772 | | | Rockwell Automation Incorporated« | | | 55,360 | |
| | 515 | | | Roper Industries Incorporated | | | 39,361 | |
| | | | | | | | | |
| | | | | | | | 329,004 | |
| | | | | | | | |
| | | | | | | | | |
| Industrial Conglomerates: 1.50% | | | | |
| | 3,892 | | | 3M Company | | | 335,880 | |
| | 58,022 | | | General Electric Company | | | 1,061,222 | |
| | 1,497 | | | Textron Incorporated | | | 35,389 | |
| | 2,665 | | | Tyco International Limited | | | 110,438 | |
| | | | | | | | | |
| | | | | | | | 1,542,929 | |
| | | | | | | | |
| | | | | | | | | |
| Machinery: 1.39% | | | | |
| | 3,456 | | | Caterpillar Incorporated | | | 323,689 | |
| | 1,077 | | | Cummins Incorporated | | | 118,481 | |
| | 2,920 | | | Danaher Corporation | | | 137,736 | |
| | 2,308 | | | Deere & Company | | | 191,679 | |
| | 1,017 | | | Dover Corporation | | | 59,444 | |
| | 916 | | | Eaton Corporation | | | 92,983 | |
| | 304 | | | Flowserve Corporation | | | 36,243 | |
| | 2,700 | | | Illinois Tool Works Incorporated | | | 144,180 | |
| | 1,764 | | | Ingersoll-Rand plc | | | 83,067 | |
| | 1,986 | | | Paccar Incorporated | | | 114,036 | |
| | 627 | | | Pall Corporation | | | 31,087 | |
| | 878 | | | Parker Hannifin Corporation | | | 75,771 | |
| | 316 | | | Snap-On Incorporated« | | | 17,879 | |
| | | | | | | | | |
| | | | | | | | 1,426,275 | |
| | | | | | | | |
| | | | | | | | | |
| Road & Rail: 0.50% | | | | |
| | 2,037 | | | CSX Corporation | | | 131,611 | |
| | 1,978 | | | Norfolk Southern Corporation | | | 124,258 | |
| | 281 | | | Ryder System Incorporated« | | | 14,792 | |
| | 2,685 | | | Union Pacific Corporation | | | 248,792 | |
| | | | | | | | | |
| | | | | | | | 519,453 | |
| | | | | | | | |
| | | | | | | | | |
| Trading Companies & Distributors: 0.09% | | | | |
| | 802 | | | Fastenal Company« | | | 48,048 | |
| | 315 | | | W.W. Grainger Incorporated« | | | 43,505 | |
| | | | | | | | | |
| | | | | | | | 91,553 | |
| | | | | | | | |
| | | | | | | | | |
| Information Technology: 11.09% | | | | |
| |
| Communications Equipment: 1.35% | | | | |
| | 30,184 | | | Cisco Systems Incorporated†« | | | 610,622 | |
| | 440 | | | F5 Networks Incorporated† | | | 57,270 | |
| | 698 | | | Harris Corporation« | | | 31,619 | |
| | 1,212 | | | JDS Uniphase Corporation† | | | 17,550 | |
| | 2,849 | | | Juniper Networks Incorporated† | | | 105,185 | |
| | 12,794 | | | Motorola Incorporated† | | | 116,042 | |
| | | |
|
| 20 Wells Fargo Advantage VT Index Asset Allocation Fund | | Portfolio of Investments—December 31, 2010 |
| | | | | | | | | |
| Shares | | | Security Name | | Value | |
| Communications Equipment (continued) | | | | |
| | 8,809 | | | QUALCOMM Incorporated | | $ | 435,957 | |
| | 2,009 | | | Tellabs Incorporated | | | 13,621 | |
| | | | | | | | | |
| | | | | | | | 1,387,866 | |
| | | | | | | | |
| | | | | | | | | |
| Computers & Peripherals: 2.67% | | | | |
| | 4,995 | | | Apple Incorporated† | | | 1,611,187 | |
| | 9,145 | | | Dell Incorporated† | | | 123,915 | |
| | 11,220 | | | EMC Corporation†« | | | 256,938 | |
| | 12,349 | | | Hewlett-Packard Company | | | 519,893 | |
| | 427 | | | Lexmark International Incorporated† | | | 14,868 | |
| | 1,968 | | | NetApp Incorporated†« | | | 108,161 | |
| | 575 | | | QLogic Corporation†« | | | 9,787 | |
| | 1,277 | | | SanDisk Corporation† | | | 63,671 | |
| | 1,251 | | | Western Digital Corporation† | | | 42,409 | |
| | | | | | | | | |
| | | | | | | | 2,750,829 | |
| | | | | | | | |
| | | | | | | | | |
| Electronic Equipment & Instruments: 0.35% | | | | |
| | 1,886 | | | Agilent Technologies Incorporated† | | | 78,137 | |
| | 950 | | | Amphenol Corporation Class A« | | | 50,141 | |
| | 8,510 | | | Corning Incorporated | | | 164,413 | |
| | 863 | | | FLIR Systems Incorporated†« | | | 25,674 | |
| | 1,067 | | | Jabil Circuit Incorporated | | | 21,436 | |
| | 752 | | | Molex Incorporated | | | 17,085 | |
| | | | | | | | | |
| | | | | | | | 356,886 | |
| | | | | | | | |
| | | | | | | | | |
| Internet Software & Services: 1.20% | | | | |
| | 992 | | | Akamai Technologies Incorporated† | | | 46,674 | |
| | 6,247 | | | eBay Incorporated† | | | 173,854 | |
| | 1,358 | | | Google Incorporated Class A† | | | 806,611 | |
| | 708 | | | Monster Worldwide Incorporated†« | | | 16,730 | |
| | 236 | | | Netflix Incorporated† | | | 41,465 | |
| | 936 | | | VeriSign Incorporated | | | 30,579 | |
| | 7,098 | | | Yahoo! Incorporated† | | | 118,040 | |
| | | | | | | | | |
| | | | | | | | 1,233,953 | |
| | | | | | | | |
| | | | | | | | | |
| IT Services: 1.52% | | | | |
| | 2,685 | | | Automatic Data Processing Incorporated | | | 124,262 | |
| | 1,652 | | | Cognizant Technology Solutions Corporation Class A† | | | 121,075 | |
| | 841 | | | Computer Sciences Corporation | | | 41,714 | |
| | 1,442 | | | Fidelity National Information Services Incorporated | | | 39,496 | |
| | 809 | | | Fiserv Incorporated† | | | 47,375 | |
| | 6,765 | | | International Business Machines Corporation | | | 992,831 | |
| | 1,752 | | | Paychex Incorporated« | | | 54,154 | |
| | 1,599 | | | SAIC Incorporated†« | | | 25,360 | |
| | 912 | | | Teradata Corporation† | | | 37,538 | |
| | 888 | | | Total System Services Incorporated« | | | 13,657 | |
| | 3,571 | | | Western Union Company« | | | 66,313 | |
| | | | | | | | | |
| | | | | | | | 1,563,775 | |
| | | | | | | | |
| | | | | | | | | |
| Office Electronics: 0.08% | | | | |
| | 7,554 | | | Xerox Corporation | | | 87,022 | |
| | | | | | | | |
| | | | | | | | | |
| Semiconductors & Semiconductor Equipment: 1.52% | | | | |
| | 3,118 | | | Advanced Micro Devices Incorporated†« | | | 25,505 | |
| | 1,702 | | | Altera Corporation« | | | 60,557 | |
| | | |
|
| Portfolio of Investments—December 31, 2010 | | Wells Fargo Advantage VT Index Asset Allocation Fund 21 |
| | | | | | | | | |
| Shares | | | Security Name | | Value | |
| Semiconductors & Semiconductor Equipment (continued) | | | | |
| | 1,626 | | | Analog Devices Incorporated | | $ | 61,251 | |
| | 7,275 | | | Applied Materials Incorporated« | | | 102,214 | |
| | 2,480 | | | Broadcom Corporation Class A« | | | 108,004 | |
| | 294 | | | First Solar Incorporated† | | | 38,261 | |
| | 30,376 | | | Intel Corporation† | | | 638,807 | |
| | 909 | | | KLA-Tencor Corporation« | | | 35,124 | |
| | 1,227 | | | Linear Technology Corporation« | | | 42,442 | |
| | 3,357 | | | LSI Logic Corporation† | | | 20,108 | |
| | 1,238 | | | MEMC Electronic Materials Incorporated† | | | 13,940 | |
| | 1,017 | | | Microchip Technology Incorporated« | | | 34,792 | |
| | 4,665 | | | Micron Technology Incorporated†« | | | 37,413 | |
| | 1,304 | | | National Semiconductor Corporation | | | 17,943 | |
| | 491 | | | Novellus Systems Incorporated† | | | 15,869 | |
| | 3,163 | | | NVIDIA Corporation†« | | | 48,710 | |
| | 987 | | | Teradyne Incorporated†« | | | 13,857 | |
| | 6,394 | | | Texas Instruments Incorporated | | | 207,805 | |
| | 1,411 | | | Xilinx Incorporated« | | | 40,891 | |
| | | | | | | | | |
| | | | | | | | 1,563,493 | |
| | | | | | | | |
| | | | | | | | | |
| Software: 2.40% | | | | |
| | 2,770 | | | Adobe Systems Incorporated† | | | 85,261 | |
| | 1,238 | | | Autodesk Incorporated†« | | | 47,292 | |
| | 967 | | | BMC Software Incorporated† | | | 45,584 | |
| | 2,089 | | | CA Incorporated | | | 51,055 | |
| | 1,022 | | | Citrix Systems Incorporated† | | | 69,915 | |
| | 1,192 | | | Compuware Corporation† | | | 13,911 | |
| | 1,807 | | | Electronic Arts Incorporated†« | | | 29,599 | |
| | 1,522 | | | Intuit Incorporated†« | | | 75,035 | |
| | 839 | | | McAfee Incorporated† | | | 38,854 | |
| | 40,999 | | | Microsoft Corporation | | | 1,144,692 | |
| | 1,914 | | | Novell Incorporated† | | | 11,331 | |
| | 21,079 | | | Oracle Corporation | | | 659,773 | |
| | 1,037 | | | Red Hat Incorporated† | | | 47,339 | |
| | 644 | | | Salesforce.com Incorporated†« | | | 85,008 | |
| | 4,227 | | | Symantec Corporation† | | | 70,760 | |
| | | | | | | | | |
| | | | | | | | 2,475,409 | |
| | | | | | | | |
| | | | | | | | | |
| Materials: 2.26% | | | | |
| | | | | | | | | |
| Chemicals: 1.28% | | | | |
| | 1,166 | | | Air Products & Chemicals Incorporated | | | 106,048 | |
| | 407 | | | Airgas Incorporated | | | 25,421 | |
| | 387 | | | CF Industries Holdings Incorporated | | | 52,303 | |
| | 6,320 | | | Dow Chemical Company | | | 215,765 | |
| | 4,971 | | | E.I. du Pont de Nemours & Company | | | 247,953 | |
| | 392 | | | Eastman Chemical Company | | | 32,959 | |
| | 1,264 | | | Ecolab Incorporated | | | 63,731 | |
| | 395 | | | FMC Corporation« | | | 31,557 | |
| | 435 | | | International Flavors & Fragrances Incorporated | | | 24,182 | |
| | 2,921 | | | Monsanto Company | | | 203,418 | |
| | 887 | | | PPG Industries Incorporated | | | 74,570 | |
| | 1,668 | | | Praxair Incorporated« | | | 159,244 | |
| | 487 | | | Sherwin-Williams Company | | | 40,786 | |
| | 660 | | | Sigma-Aldrich Corporation« | | | 43,930 | |
| | | | | | | | | |
| | | | | | | | 1,321,867 | |
| | | | | | | | |
| | | |
|
| 22 Wells Fargo Advantage VT Index Asset Allocation Fund | | Portfolio of Investments—December 31, 2010 |
| | | | | | | | | |
| Shares | | | Security Name | | Value | |
| Construction Materials: 0.03% | | | | |
| | 699 | | | Vulcan Materials Company« | | $ | 31,008 | |
| | | | | | | | |
| | | | | | | | | |
| Containers & Packaging: 0.10% | | | | |
| | 480 | | | Ball Corporation | | | 32,664 | |
| | 589 | | | Bemis Company Incorporated« | | | 19,237 | |
| | 891 | | | Owens-Illinois Incorporated† | | | 27,354 | |
| | 869 | | | Sealed Air Corporation« | | | 22,116 | |
| | | | | | | | 101,371 | |
| | | | | | | | |
| Metals & Mining: 0.76% | | | | |
| | 598 | | | AK Steel Holding Corporation | | | 9,789 | |
| | 5,562 | | | Alcoa Incorporated« | | | 85,599 | |
| | 536 | | | Allegheny Technologies Incorporated« | | | 29,576 | |
| | 737 | | | Cliffs Natural Resources Incorporated | | | 57,493 | |
| | 2,564 | | | Freeport-McMoRan Copper & Gold Incorporated Class B | | | 307,911 | |
| | 2,685 | | | Newmont Mining Corporation | | | 164,940 | |
| | 1,719 | | | Nucor Corporation« | | | 75,327 | |
| | 490 | | | Titanium Metals Corporation† | | | 8,418 | |
| | 782 | | | United States Steel Corporation | | | 45,684 | |
| | | | | | | | | |
| | | | | | | | 784,737 | |
| | | | | | | | |
| | | | | | | | | |
| Paper & Forest Products: 0.09% | | | | |
| | 2,382 | | | International Paper Company | | | 64,886 | |
| | 916 | | | MeadWestvaco Corporation« | | | 23,963 | |
| | | | | | | | | |
| | | | | | | | 88,849 | |
| | | | | | | | |
| | | | | | | | | |
| Telecommunication Services: 1.88% | | | | |
| | | | | | | | | |
| Diversified Telecommunication Services: 1.69% | | | | |
| | 32,184 | | | AT&T Incorporated | | | 945,566 | |
| | 1,651 | | | CenturyTel Incorporated | | | 76,227 | |
| | 5,412 | | | Frontier Communications Corporation« | | | 52,659 | |
| | 9,490 | | | Qwest Communications International Incorporated | | | 72,219 | |
| | 15,393 | | | Verizon Communications Incorporated | | | 550,762 | |
| | 2,634 | | | Windstream Corporation | | | 36,718 | |
| | | | | | | | | |
| | | | | | | | 1,734,151 | |
| | | | | | | | |
| | | | | | | | | |
| Wireless Telecommunication Services: 0.19% | | | | |
| | 2,173 | | | American Tower Corporation Class A† | | | 112,214 | |
| | 1,428 | | | MetroPCS Communications Incorporated†« | | | 18,036 | |
| | 16,266 | | | Sprint Nextel Corporation† | | | 68,805 | |
| | | | | | | | | |
| | | | | | | | 199,055 | |
| | | | | | | | |
| | | | | | | | | |
| Utilities: 1.99% | | | | |
| | | | | | | | | |
| Electric Utilities: 1.15% | | | | |
| | 925 | | | Allegheny Energy Incorporated | | | 22,422 | |
| | 2,615 | | | American Electric Power Company Incorporated | | | 94,088 | |
| | 1,582 | | | Consolidated Edison Incorporated« | | | 78,420 | |
| | 7,213 | | | Duke Energy Corporation« | | | 128,464 | |
| | 1,774 | | | Edison International | | | 68,476 | |
| | 985 | | | Entergy Corporation | | | 69,768 | |
| | 3,601 | | | Exelon Corporation | | | 149,946 | |
| | 1,660 | | | FirstEnergy Corporation« | | | 61,453 | |
| | 2,264 | | | Nextera Energy Incorporated | | | 117,705 | |
| | | |
|
| Portfolio of Investments—December 31, 2010 | | Wells Fargo Advantage VT Index Asset Allocation Fund 23 |
| | | | | | | | | | | | | | | | | |
| Shares | | | Security Name | | | | | | | | | | Value | |
| Electric Utilities (continued) | | | | | | | | | | | | |
| | 960 | | | Northeast Utilities | | | | | | | | | | $ | 30,605 | |
| | 1,222 | | | Pepco Holdings Incorporated | | | | | | | | | | | 22,302 | |
| | 592 | | | Pinnacle West Capital Corporation | | | | | | | | | | | 24,538 | |
| | 2,631 | | | PPL Corporation | | | | | | | | | | | 69,248 | |
| | 1,595 | | | Progress Energy Incorporated | | | | | | | | | | | 69,351 | |
| | 4,567 | | | The Southern Company« | | | | | | | | | | | 174,596 | |
| | | | | | | | | | | | | | | | | |
| | | | | | | | | | | | | | | | 1,181,382 | |
| | | | | | | | | | | | | | | | |
| | | | | | | | | | | | | | | | | |
| Gas Utilities: 0.04% | | | | | | | | | | | | |
| | 247 | | | Nicor Incorporated | | | | | | | | | | | 12,330 | |
| | 579 | | | ONEOK Incorporated« | | | | | | | | | | | 32,117 | |
| | | | | | | | | | | | | | | | | |
| | | | | | | | | | | | | | | | 44,447 | |
| | | | | | | | | | | | | | | | |
| | | | | | | | | | | | | | | | | |
| Independent Power Producers & Energy Traders: 0.10% | | | | | | | | | | | | |
| | 3,605 | | | AES Corporation† | | | | | | | | | | | 43,909 | |
| | 1,088 | | | Constellation Energy Group Incorporated | | | | | | | | | | | 33,325 | |
| | 1,346 | | | NRG Energy Incorporated† | | | | | | | | | | | 26,301 | |
| | | | | | | | | | | | | | | | | |
| | | | | | | | | | | | | | | | 103,535 | |
| | | | | | | | | | | | | | | | |
| | | | | | | | | | | | | | | | | |
| Multi-Utilities: 0.70% | | | | | | | | | | | | |
| | 1,306 | | | Ameren Corporation | | | | | | | | | | | 36,816 | |
| | 2,304 | | | CenterPoint Energy Incorporated | | | | | | | | | | | 36,219 | |
| | 1,331 | | | CMS Energy Corporation | | | | | | | | | | | 24,757 | |
| | 3,161 | | | Dominion Resources Incorporated†« | | | | | | | | | | | 135,038 | |
| | 920 | | | DTE Energy Company | | | | | | | | | | | 41,694 | |
| | 422 | | | Integrys Energy Group Incorporated | | | | | | | | | | | 20,471 | |
| | 1,515 | | | NiSource Incorporated« | | | | | | | | | | | 26,694 | |
| | 2,135 | | | PG&E Corporation | | | | | | | | | | | 102,138 | |
| | 2,755 | | | Public Service Enterprise Group Incorporated« | | | | | | | | | | | 87,637 | |
| | 616 | | | SCANA Corporation« | | | | | | | | | | | 25,010 | |
| | 1,307 | | | Sempra Energy | | | | | | | | | | | 68,591 | |
| | 1,169 | | | TECO Energy Incorporated« | | | | | | | | | | | 20,808 | |
| | 636 | | | Wisconsin Energy Corporation | | | | | | | | | | | 37,435 | |
| | 2,505 | | | Xcel Energy Incorporated | | | | | | | | | | | 58,993 | |
| | | | | | | | | | | | | | | | | |
| | | | | | | | | | | | | | | | 722,301 | |
| | | | | | | | | | | | | | | | |
| | | | | | | | | | | | | | | | | |
| Total Common Stocks (Cost $53,734,629) | | | | | | | | | | | 62,231,549 | |
| | | | | | | | | | | | | | | | |
| |
| Principal | | | | | Interest Rate | | Maturity Date | | | | |
| US Treasury Securities: 34.69% | | | | | | | | | | | | |
| | | | | | | | | | | | | | | | | |
| US Treasury Bonds: 34.69% | | | | | | | | | | | | |
| $ | 1,492,000 | | | US Treasury Bond | | | 5.38 | % | | | 02/15/2031 | | | | 1,741,677 | |
| | 2,242,000 | | | US Treasury Bond | | | 4.50 | | | | 02/15/2036 | | | | 2,321,170 | |
| | 1,335,000 | | | US Treasury Bond | | | 4.75 | | | | 02/15/2037 | | | | 1,434,708 | |
| | 1,396,000 | | | US Treasury Bond | | | 5.00 | | | | 05/15/2037 | | | | 1,557,630 | |
| | 1,341,000 | | | US Treasury Bond | | | 4.38 | | | | 02/15/2038 | | | | 1,355,248 | |
| | 1,787,000 | | | US Treasury Bond | | | 4.50 | | | | 05/15/2038 | | | | 1,841,168 | |
| | 1,914,000 | | | US Treasury Bond | | | 3.50 | | | | 02/15/2039 | | | | 1,649,330 | |
| | 2,824,000 | | | US Treasury Bond | | | 4.25 | | | | 05/15/2039 | | | | 2,782,081 | |
| | 3,413,000 | | | US Treasury Bond | | | 4.50 | | | | 08/15/2039 | | | | 3,504,724 | |
| | 3,776,000 | | | US Treasury Bond | | | 4.38 | | | | 11/15/2039 | | | | 3,796,058 | |
| | 3,995,000 | | | US Treasury Bond | | | 4.63 | | | | 02/15/2040 | | | | 4,184,763 | |
| | 3,782,000 | | | US Treasury Bond | | | 4.38 | | | | 05/15/2040 | | | | 3,800,305 | |
| | | |
|
| 24 Wells Fargo Advantage VT Index Asset Allocation Fund | | Portfolio of Investments—December 31, 2010 |
| | | | | | | | | | | | | | | | | | | | | |
| Principal | | | Security Name | | | | | | Interest Rate | | Maturity Date | | Value | |
| US Treasury Bonds (continued) | | | | | | | | | | | | | | | | |
| $ | 3,503,000 | | | US Treasury Bond | | | | | | | 3.88 | % | | | 08/15/2040 | | | $ | 3,226,592 | |
| | 2,555,000 | | | US Treasury Bond | | | | | | | 4.25 | | | | 11/15/2040 | | | | 2,513,481 | |
| | | | | | | | | | | | | | | | | | | | | |
| Total US Treasury Securities (Cost $36,334,088) | | | | | | | | | | | | | | | 35,708,935 | |
| | | | | | | | | | | | | | | | | | | |
| | | | | | | | | | | | | | | | | | | | | |
| Short-Term Investments: 13.92% | | | | | | | | | | | | | | | | |
| | | | | | | | | | | | | | | | | | | | | |
| Corporate Bonds and Notes: 0.94% | | | | | | | | | | | | | | | | |
| | 451,139 | | | Gryphon Funding Limited(v)(a)(i) | | | | | | | 0.00 | | | | 08/05/2011 | | | | 183,253 | |
| | 1,400,553 | | | VFNC Corporation(v)±††(a)(i) | | | | | | | 0.26 | | | | 09/29/2011 | | | | 784,309 | |
| |
| | | | | | | | | | | | | | | | | | | | 967,562 | |
| | | | | | | | | | | | | | | | | | | |
| | | | | | | | | | | | | | | | | | | | | |
| Shares | | | | | | | | | Yield | | | | | | | | |
| | | | | | | | | | | | | | | | | | | | | |
| Investment Companies: 10.06% | | | | | | | | | | | | | | | | |
| | 1,556,493 | | | Wells Fargo Advantage Cash Investment Money Market Fund(l)(u) | 0.14 | | | | | | | | 1,556,493 | |
| | 8,798,198 | | | Wells Fargo Securities Lending Cash Investments, LLC(v)(l)(u) | | 0.27 | | | | | | | | 8,798,198 | |
| | | | | | | | | | | | | | | | | | | | | |
| | | | | | | | | | | | | | | | | | | | 10,354,691 | |
| | | | | | | | | | | | | | | | | | | |
| Principal | | | | | | | | | Interest Rate | | | | | | | | |
| | | | | | | | | | | | | | | | | | | | | |
| US Treasury Bills: 2.92% | | | | | | | | | | | | | | | | |
| $ | 1,560,000 | | | US Treasury Bill^# | | | | | | | 0.15 | | | | 02/03/2011 | | | | 1,559,745 | |
| | 1,450,000 | | | US Treasury Bill^# | | | | | | | 0.15 | | | | 05/05/2011 | | | | 1,449,263 | |
| | | | | | | | | | | | | | | | | | | | | |
| | | | | | | | | | | | | | | | | | | | 3,009,008 | |
| | | | | | | | | | | | | | | | | | | | |
| | | | | | | | | | | | | | | | | | | | | |
| Total Short-Term Investments (Cost $13,980,429) | | | | | | | | | | | | | | | 14,331,261 | |
| | | | | | | | | | | | | | | | | | | | |
| | | | | | | | | | | | | | | | | | | | | |
Total Investments in Securities
(Cost $104,049,146)* | | | 109.06 | % | | | | | | | | | | | 112,271,745 | |
| | | | | | | | | | | | | | | | | | | | | |
| Other Assets and Liabilities, Net | | | (9.06 | ) | | | | | | | | | | | (9,326,170 | ) |
| | | | | | | | | | | | | | | | | | | |
| | | | | | | | | | | | | | | | | | | | | |
| Total Net Assets | | | 100.00 | % | | | | | | | | | | $ | 102,945,575 | |
| | | | | | | | | | | | | | | | | | | |
| | |
| † | | Non-income earning securities. |
| |
| « | | All or a portion of this security is on loan. |
| |
| (l) | | Investment in an affiliate. The total cost of affiliated investments is $11,555,740. |
| |
| # | | Security pledged as collateral for futures transactions. |
| |
| (v) | | Security represents investment of cash collateral received from securities on loan. |
| |
| ± | | Variable rate investments. |
| |
| †† | | Securities that may be resold to “qualified institutional buyers” under Rule 144A or securities offered pursuant to Section 4(2) of the Securities Act of 1933, as amended. |
| |
| (a) | | Security is fair valued by the Management Valuation Team, and in certain instances by the Board of Trustees, in accordance with procedures approved by the Board of Trustees. |
| |
| (i) | | Illiquid security for which the designation as illiquid is unaudited. |
| |
| (u) | | Rate shown is the 7-day annualized yield at period end. |
| |
| ^ | | Zero coupon security. Rate represents yield to maturity. |
| |
| * | | Cost for federal income tax purposes is $106,598,024 and net unrealized appreciation (depreciation) consists of: |
| | | | | |
|
| Gross unrealized appreciation | | $ | 18,467,301 | |
| Gross unrealized depreciation | | | (12,793,580 | ) |
| | | | |
| |
| Net unrealized appreciation | | $ | 5,673,721 | |
The accompanying notes are an integral part of these financial statements.
| | |
| Statement of Assets and Liabilities—December 31, 2010 | | Wells Fargo Advantage VT Index Asset Allocation Fund 25 |
| | | | | |
|
Assets | | | | |
| Investments | | | | |
| In unaffiliated securities (including securities on loan), at value | | $ | 101,031,267 | |
| In affiliated securities, at value | | | 11,240,478 | |
| | | | |
| Total investments, at value (see cost below) | | | 112,271,745 | |
| Receivable for investments sold | | | 4,612 | |
| Receivable for Fund shares sold | | | 106,932 | |
| Receivable for dividends and interest | | | 493,556 | |
| Receivable for securities lending income | | | 388 | |
| Prepaid expenses and other assets | | | 2,004 | |
| | | | |
| Total assets | | | 112,879,237 | |
| | | | |
| | | | | |
Liabilities | | | | |
| Payable for investments purchased | | | 1,103 | |
| Payable for Fund shares redeemed | | | 101,654 | |
| Payable upon receipt of securities loaned | | | 9,414,928 | |
| Payable for daily variation margin on open futures contracts | | | 251,522 | |
| Investment advisory fee payable | | | 50,290 | |
| Distribution fees payable | | | 22,526 | |
| Due to other related parties | | | 11,648 | |
| Accrued expenses and other liabilities | | | 79,991 | |
| | | | |
| Total liabilities | | | 9,933,662 | |
| | | | |
Total net assets | | $ | 102,945,575 | |
| | | | |
| | | | | |
NET ASSETS CONSIST OF | | | | |
| Paid-in capital | | $ | 125,146,038 | |
| Undistributed net investment income | | | 87,874 | |
| Accumulated net realized losses on investments | | | (32,021,402 | ) |
| Net unrealized gains on investments | | | 9,733,065 | |
| | | | |
Total net assets | | $ | 102,945,575 | |
| | | | |
| | | | | |
COMPUTATION OF NET ASSET VALUE PER SHARE1 | | | | |
| Net assets — Class 2 | | $ | 102,945,575 | |
| Shares outstanding — Class 2 | | | 8,783,969 | |
| Net asset value per share — Class 2 | | $ | 11.72 | |
| | | | |
| | | | | |
| Total investments, at cost | | $ | 104,049,146 | |
| | | | |
| Securities on loan, at value | | $ | 9,187,812 | |
| | | | |
| | |
| 1. | | The Fund has an unlimited number of authorized shares. |
The accompanying notes are an integral part of these financial statements.
| | |
| 26 Wells Fargo Advantage VT Index Asset Allocation Fund | | Statement of Operations—For the Year Ended December 31, 2010 |
| | | | | |
|
Investment income | | | | |
| Dividends* | | $ | 1,255,769 | |
| Interest | | | 1,601,752 | |
| Income from affiliated securities | | | 10,135 | |
| Securities lending income, net | | | 11,861 | |
| | | | |
| Total investment income | | | 2,879,517 | |
| | | | |
| | | | | |
Expenses | | | | |
| Investment advisory fee | | | 574,829 | |
| Administration fees | | | | |
| Fund level | | | 114,126 | |
Class 21 | | | 38,616 | |
| Distribution fees | | | | |
Class 21 | | | 261,286 | |
| Custody and accounting fees | | | 34,499 | |
| Professional fees | | | 33,007 | |
| Shareholder report expenses | | | 52,368 | |
| Trustees’ fees and expenses | | | 10,549 | |
| Other fees and expenses | | | 29,041 | |
| | | | |
| Total expenses | | | 1,148,321 | |
| | | | | |
| Less: Fee waivers and/or expense reimbursements | | | (105,233 | ) |
| | | | |
| Net expenses | | | 1,043,088 | |
| | | | |
| Net investment income | | | 1,836,429 | |
| | | | |
| | | | | |
NET REALIZED AND UNREALIZED GAINS (LOSSES) ON INVESTMENTS | | | | |
| | | | | |
Net realized gains (losses) on: | | | | |
| Unaffiliated securities | | | (1,085,452 | ) |
| Affiliated securities | | | 1,388 | |
| Futures transactions | | | 1,244,074 | |
| | | | |
| Net realized gains on investments | | | 160,010 | |
| | | | |
| | | | | |
Net change in unrealized gains (losses) on: | | | | |
| Unaffiliated securities | | | 10,976,411 | |
| Affiliated securities | | | 121,092 | |
| Futures transactions | | | (331,854 | ) |
| | | | |
| Net change in unrealized gains (losses) on investments | | | 10,765,649 | |
| | | | |
| Net realized and unrealized gains (losses) on investments | | | 10,925,659 | |
| | | | |
Net increase in net assets resulting from operations | | $ | 12,762,088 | |
| | | | |
|
| * Net of foreign withholding taxes of | | $ | 59 | |
| | | |
| 1. | | After the close of business on July 16, 2010, existing shares of the Fund were renamed Class 2 shares. |
The accompanying notes are an integral part of these financial statements.
| | |
| Statements of Changes in Net Assets | | Wells Fargo Advantage VT Index Asset Allocation Fund 27 |
| | | | | | | | | | | | | | | | | |
| | | Year Ended | | Year Ended |
| | | December 31, 2010 | | December 31, 2009 |
| |
Operations | | | | | | | | | | | | | | | | |
| Net investment income | | | | | | $ | 1,836,429 | | | | | | | $ | 2,226,099 | |
| Net realized gains on investments | | | | | | | 160,010 | | | | | | | | 1,161,344 | |
| Net change in unrealized gains (losses) on investments | | | | | | | 10,765,649 | | | | | | | | 11,378,299 | |
| | | |
| Net increase in net assets resulting from operations | | | | | | | 12,762,088 | | | | | | | | 14,765,742 | |
| | | |
| | | | | | | | | | | | | | | | | |
Distributions to shareholders from | | | | | | | | | | | | | | | | |
Net investment income — Class 21 | | | | | | | (1,839,244 | ) | | | | | | | (2,236,644 | ) |
| | | |
| | | | | | | | | | | | | | | | | |
| | | Shares | | | | | | Shares | | | | |
Capital shares transactions | | | | | | | | | | | | | | | | |
Proceeds from shares sold — Class 21 | | | 139,292 | | | | 1,515,929 | | | | 337,588 | | | | 3,121,375 | |
Reinvestment of distributions — Class 21 | | | 168,941 | | | | 1,839,244 | | | | 241,911 | | | | 2,236,644 | |
Payment for shares redeemed — Class 21 | | | (2,281,355 | ) | | | (24,603,284 | ) | | | (3,348,627 | ) | | | (30,574,173 | ) |
| | | |
| Net decrease in net assets resulting from capital share transactions | | | | | | | (21,248,111 | ) | | | | | | | (25,216,154 | ) |
| | | |
Total decrease in net assets | | | | | | | (10,325,267 | ) | | | | | | | (12,687,056 | ) |
| | | |
Net assets | | | | | | | | | | | | | | | | |
Beginning of period | | | | | | | 113,270,842 | | | | | | | | 125,957,898 | |
| | | |
End of period | | | | | | $ | 102,945,575 | | | | | | | $ | 113,270,842 | |
| | | |
Undistributed net investment income | | | | | | $ | 87,874 | | | | | | | $ | 91,346 | |
| | | |
| | |
| 1. | | After the close of business on July 16, 2010, existing shares of the Fund were renamed Class 2 shares. |
The accompanying notes are an integral part of these financial statements.
| | |
| 28 Wells Fargo Advantage VT Index Asset Allocation Fund | | Financial Highlights |
| | | | | | | | | | | | | | | | | | | | | |
| | | Beginning | | | | | | Net Realized | | Distributions | | |
| | | Net Asset | | Net | | and Unrealized | | from Net | | Distributions |
| | | Value Per | | Investment | | Gains (Losses) | | Investment | | from Net |
| | | Share | | Income | | on Investments | | Income | | Realized Gains |
| |
Class 22 | | | | | | | | | | | | | | | | | | | | |
| January 1, 2010 to December 31, 2010 | | $ | 10.53 | | | | 0.20 | | | | 1.18 | | | | (0.19 | ) | | | 0.00 | |
| January 1, 2009 to December 31, 2009 | | $ | 9.31 | | | | 0.19 | | | | 1.22 | | | | (0.19 | ) | | | 0.00 | |
| January 1, 2008 to December 31, 2008 | | $ | 14.64 | | | | 0.30 | | | | (4.32 | ) | | | (0.30 | ) | | | (1.01 | ) |
| January 1, 2007 to December 31, 2007 | | $ | 14.13 | | | | 0.34 | | | | 0.73 | | | | (0.33 | ) | | | (0.23 | ) |
| January 1, 2006 to December 31, 2006 | | $ | 13.05 | | | | 0.31 | | | | 1.23 | | | | (0.31 | ) | | | (0.15 | ) |
| | |
| 1. | | Total return calculations would have been lower had certain expenses not been waived or reimbursed during the periods shown. |
| |
| 2. | | After the close of business on July 16, 2010, existing shares of the Fund were renamed Class 2 shares. |
The accompanying notes are an integral part of these financial statements.
| | |
| Financial Highlights | | Wells Fargo Advantage VT Index Asset Allocation Fund 29 |
| | | | | | | | | | | | | | | | | | | | | | | | | | | | | |
| Ending | | | | | | | | | | | | |
| Net Asset | | | | Ratio to Average Net Assets | | | | | | Portfolio | | Net Assets at |
| Value Per | | | | Net Investment | | Gross | | Net | | Total | | Turnover | | End of Period |
| Share | | | | Income | | Expenses | | Expenses | | Return1 | | Rate | | (000’s omitted) |
| |
| | | | | | | | | | | | | | | | | | | | | | | | | | | | | |
| $ | 11.72 | | | | | | 1.76 | % | | | 1.10 | % | | | 1.00 | % | | | 13.29 | % | | | 25 | % | | $ | 102,946 | |
| $ | 10.53 | | | | | | 2.01 | % | | | 1.07 | % | | | 1.00 | % | | | 15.46 | % | | | 43 | % | | $ | 113,271 | |
| $ | 9.31 | | | | | | 2.37 | % | | | 1.07 | % | | | 1.00 | % | | | (29.11 | )% | | | 21 | % | | $ | 125,958 | |
| $ | 14.64 | | | | | | 2.26 | % | | | 1.02 | % | | | 1.00 | % | | | 7.60 | % | | | 25 | % | | $ | 254,054 | |
| $ | 14.13 | | | | | | 2.27 | % | | | 1.02 | % | | | 1.00 | % | | | 12.14 | % | | | 12 | % | | $ | 288,387 | |
| | |
| 30 Wells Fargo Advantage VT Index Asset Allocation Fund | | Notes to Financial Statements |
1. ORGANIZATION
Wells Fargo Variable Trust (the “Trust”), a Delaware statutory trust organized on March 10, 1999, is an open-end management investment company registered under the Investment Company Act of 1940, as amended (the “1940 Act”). These financial statements report on Wells Fargo Advantage VT Index Asset Allocation Fund (the “Fund”) (formerly, Wells Fargo Advantage VT Asset Allocation Fund) which is a diversified series of the Trust. After the close of business on July 16, 2010, existing shares of the Fund were renamed Class 2 shares.
2. SIGNIFICANT ACCOUNTING POLICIES
The following significant accounting policies, which are consistently followed in the preparation of the financial statements of the Fund, are in conformity with U.S. generally accepted accounting principles which require management to make estimates and assumptions that affect the reported amounts of assets and liabilities, disclosure of contingent assets and liabilities at the date of the financial statements, and the reported amounts of revenues and expenses during the reporting period. Actual results could differ from those estimates. Management has considered the circumstances under which the Fund should recognize or make disclosures regarding events or transactions occurring subsequent to the balance sheet date through the date the financial statements are issued. Adjustments or additional disclosures, if any, have been included in these financial statements.
Securities valuation
Investments in securities are valued each business day as of the close of regular trading on the New York Stock Exchange, which is usually 4:00 p.m. (Eastern Time). Securities which are traded on a national or foreign securities exchange are valued at the last reported sales price, except that securities listed on The Nasdaq Stock Market, Inc. (“Nasdaq”) are valued at the Nasdaq Official Closing Price (“NOCP”), and if no NOCP is available, then at the last reported sales price. If no sales price is shown on the Nasdaq, the bid price will be used. In the absence of any sale of securities listed on the Nasdaq, and in the case of other securities, including U.S. Government obligations, but excluding debt securities maturing in 60 days or less, the price will be deemed “stale” and the valuations will be determined in accordance with the Fund’s Fair Valuation Procedures.
Certain fixed income securities with maturities exceeding 60 days are valued based on available market quotations received from an independent pricing service approved by the Trust’s Board of Trustees which may utilize both transaction data and market information such as yield, prices of securities of comparable quality, coupon rate, maturity, type of issue, trading characteristics and other market data. If valuations are not available from the pricing service or values received are deemed not representative of market value, values will be obtained from a third party broker-dealer or determined based on the Fund’s Fair Value Procedures.
Debt securities of sufficient credit quality with original maturities of 60 days or less and any collateral received from securities lending invested in securities generally are valued at amortized cost which approximates fair value. The amortized cost method involves valuing a security at its cost, plus accretion of discount or minus amortization of premium over the period until maturity.
Investments in open-end mutual funds and non-registered investment companies are generally valued at net asset value.
Certain investments which are not valued using any of the methods discussed above, are valued at their fair value, as determined by procedures established in good faith and approved by the Board of Trustees.
The valuation techniques used by the Fund to measure fair value are consistent with the market approach, income approach and/or cost approach, where applicable, for each security type.
Security loans
The Fund may lend its securities from time to time in order to earn additional income in the form of fees or interest on securities received as collateral or the investment of any cash received as collateral. The Fund continues to receive interest or dividends on the securities loaned. The Fund receives collateral in the form of cash or securities with a value at least equal to the value of the securities on loan. The value of the loaned securities is determined at the close of each
| | |
| Notes to Financial Statements | | Wells Fargo Advantage VT Index Asset Allocation Fund 31 |
business day and any additional required collateral is delivered to the Fund on the next business day. In the event of default or bankruptcy by the borrower, the Fund could experience delays and costs in recovering the loaned securities or in gaining access to the collateral. In addition, the investment of any cash collateral received may lose all or part of its value. The Fund has the right under the lending agreement to recover the securities from the borrower on demand.
The Fund lends its securities through an unaffiliated securities lending agent. Cash collateral received in connection with its securities lending transactions is invested in Wells Fargo Securities Lending Cash Investments, LLC (the “Cash Collateral Fund”). The Cash Collateral Fund is exempt from registration under Section 3(c)(7) of the 1940 Act and is managed by Wells Fargo Funds Management LLC (“Funds Management”) and is sub-advised by Wells Capital Management Incorporated (“Wells Capital Management”). Funds Management receives an investment advisory fee starting at 0.05% and declining to 0.01% as the average daily net assets of the Cash Collateral Fund increase. All of the fees received by Funds Management are paid to Wells Capital Management for its services as sub-adviser. The Cash Collateral Fund seeks to provide a positive return compared to the daily Fed Funds Open rate by investing in high-quality, U.S. dollar-denominated short-term money market instruments. Cash Collateral Fund investments are fair valued based upon the amortized cost valuation technique. Income earned from investment in the Cash Collateral Fund is included in securities lending income on the Statement of Operations.
Prior to April 1, 2010, Wells Fargo Bank, N.A. acted as the securities lending agent for the Fund and was entitled to receive for its services 25% of the revenues earned on the securities lending activities. For the year ended December 31, 2010, Wells Fargo Bank, N.A. waived its share of revenues earned on securities lending activities. Such waivers by Wells Fargo Bank, N.A. had the impact of increasing securities lending income on the Statement of Operations. The value of the securities on loan and the liability to return the collateral are shown on the Statement of Assets and Liabilities.
In a securities lending transaction, the net asset value of the Fund will be affected by an increase or decrease in the value of the securities loaned and by an increase or decrease in the value of instruments in which cash collateral is invested. The amount of securities lending activity undertaken by the Fund fluctuates from time to time. After the occurrence of a default or impairment of structured investment vehicles purchased in a joint account by the Fund’s former securities lending agent, as the various participating Funds’ lending activity fluctuated, their ratable interest in the joint account, including their ratable exposure to the defaulted or impaired structured investment vehicles fluctuated depending on the relative activity of each participating Fund. In order to eliminate the fluctuation of the various participating Funds’ ratable exposure to the defaulted or impaired structured investment vehicles, the adviser to the Funds recommended to the Board of Trustees, and the Board of Trustees approved, actions designed to fix the allocation of percentage ownership in defaulted or impaired structured investment vehicles among all funds participating in securities lending (“side pocketing”) based on each participating Fund’s percentage ownership of the total cash collateral investment joint account as of the date the fixed allocation is implemented. Accordingly, on February 13, 2009 a side pocketing occurred, which fixed each participating Fund’s ownership of defaulted or impaired structured investment vehicle in the joint account based on each participating Fund’s percentage ownership of the joint account as of such date.
Futures contracts
The Fund may be subject to interest rate risk and equity price risk in the normal course of pursuing its investment objectives. The Fund may buy and sell futures contracts in order to gain exposure to, or protect against changes in, security values and interest rates. The primary risks associated with the use of futures contracts are the imperfect correlation between changes in market values of securities held by the Fund and the prices of futures contracts, and the possibility of an illiquid market.
Futures contracts are valued based upon their quoted daily settlement prices. The aggregate principal amounts of the contracts are not recorded in the financial statements. Fluctuations in the value of the contracts are recorded in the Statement of Assets and Liabilities as an asset or liability and in the Statement of Operations as unrealized gains or losses until the contracts are closed, at which point they are recorded as net realized gains or losses on futures contracts. With futures contracts, there is minimal counterparty risk to the Fund since futures are exchange traded and the exchange’s clearinghouse, as counterparty to all exchange traded futures, guarantees the futures against default.
| | |
| 32 Wells Fargo Advantage VT Index Asset Allocation Fund | | Notes to Financial Statements |
Security transactions and income recognition
Securities transactions are recorded on a trade date basis. Realized gains or losses are reported on the basis of identified cost of securities delivered.
Interest income is accrued daily and bond discounts are accreted and premiums are amortized daily based on the effective interest method. To the extent debt obligations are placed on non-accrual status, any related interest income may be reduced by writing off interest receivables when the collection of all or a portion of interest has become doubtful based on consistently applied procedures. If the issuer subsequently resumes interest payments or when the collectability of interest is reasonably assured, the debt obligation is removed from non-accrual status.
Dividend income is recognized on the ex-dividend date, except for certain dividends from foreign securities, which are recorded as soon as the Fund is informed of the ex-dividend date. Dividend income from foreign securities is recorded net of foreign taxes withheld where recovery of such taxes is not assured.
Distributions to shareholders
Distributions to shareholders from net investment income and net realized gains, if any, are recorded on the ex-dividend date. Such distributions are determined in conformity with income tax regulations, which may differ from generally accepted accounting principles.
The timing and character of distributions made during the period from net investment income or net realized gains may differ from their ultimate characterization for federal income tax purposes. To the extent that these differences are permanent in nature, such amounts are reclassified within the capital accounts based on their federal tax-basis treatment. Temporary differences do not require reclassifications. At December 31, 2010, as a result of permanent book-to-tax differences, the following reclassification adjustments were made on the Statement of Assets and Liabilities:
| | | | | | | | | | | |
| Undistributed | | Accumulated Net | | |
| Net Investment | | Realized Losses | | |
| Income | | on Investments | | Paid-in Capital |
| $ | (657 | ) | | $ | 661 | | | $ | (4 | ) |
Federal and other taxes
The Fund intends to continue to qualify as a regulated investment company by distributing substantially all of its investment company taxable income and any net realized capital gains (after reduction for capital loss carryforwards) sufficient to relieve it from all, or substantially all, federal income taxes. Accordingly, no provision for federal income taxes was required.
The Fund’s income and federal excise tax returns and all financial records supporting those returns for the prior three fiscal years are subject to examination by the federal and Delaware revenue authorities.
Under the recently enacted Regulated Investment Company Modernization Act of 2010, the Fund will be permitted to carry forward capital losses incurred in taxable years beginning after December 22, 2010 for an unlimited period. However, any losses incurred during those future taxable years will be required to be utilized prior to the losses incurred in pre-enactment taxable years. As a result of this ordering rule, pre-enactment capital loss carryforwards may be more likely to expire unused. Additionally, post-enactment capital losses that are carried forward will retain their character as either short-term or long-term capital losses rather than being considered all short-term as under previous law.
As of December 31, 2010, the Fund had estimated net capital loss carryforwards, which are available to offset future net realized capital gains, in the amount of $27,748,200 with $24,023,633 expiring in 2016 and $3,724,567 expiring in 2017.
3. FAIR VALUATION MEASUREMENTS
Fair value measurements of investments are determined within a framework that has established a fair value hierarchy based upon the various data inputs utilized in determining the value of the Fund’s investments. The three-level hierarchy gives the highest priority to unadjusted quoted prices in active markets for identical assets or liabilities
| | |
| Notes to Financial Statements | | Wells Fargo Advantage VT Index Asset Allocation Fund 33 |
(Level 1) and the lowest priority to unobservable inputs (Level 3). The Fund’s investments are classified within the fair value hierarchy based on the lowest level of input that is significant to the fair value measurement. The inputs are summarized into three broad levels as follows:
| § | | Level 1 — quoted prices in active markets for identical securities |
| |
| § | | Level 2 — other significant observable inputs (including quoted prices for similar securities, interest rates, prepayment speeds, credit risk, etc.) |
| |
| § | | Level 3 — significant unobservable inputs (including the Fund’s own assumptions in determining the fair value of investments) |
The inputs or methodologies used for valuing securities are not necessarily an indication of the risk associated with investing in those securities.
As of December 31, 2010, the inputs used in valuing the Fund’s assets, which are carried at fair value, were as follows:
| | | | | | | | | | | | | | | | | |
| | | | | | | Significant Other | | Significant | | |
| | | | | | | Observable | | Unobservable | | |
| | | Quoted Prices | | Inputs | | Inputs | | |
| Investments in Securities | | (Level 1) | | (Level 2) | | (Level 3) | | Total |
Equity securities | | | | | | | | | | | | | | | | |
Common stocks | | $ | 62,231,549 | | | $ | 0 | | | $ | 0 | | | $ | 62,231,549 | |
U.S. Treasury obligations | | | 35,708,935 | | | | 0 | | | | 0 | | | | 35,708,935 | |
Short-term investments | | | | | | | | | | | | | | | | |
Corporate bonds and notes | | | 0 | | | | 0 | | | | 967,562 | | | | 967,562 | |
Investment companies | | | 1,556,493 | | | | 8,798,198 | | | | 0 | | | | 10,354,691 | |
U.S. Treasury bills | | | 0 | | | | 3,009,008 | | | | 0 | | | | 3,009,008 | |
| | | $ | 99,496,977 | | | $ | 11,807,206 | | | $ | 967,562 | | | $ | 112,271,745 | |
Further details on the major security types listed above can be found in the Fund’s Portfolio of Investments.
As of December 31, 2010, the inputs used in valuing the Fund’s other financial instruments, which are carried at fair value, were as follows:
| | | | | | | | | | | | | | | | | |
| | | | | | | Significant Other | | Significant | | |
| | | | | | | Observable | | Unobservable | | |
| | | Quoted Prices | | Inputs | | Inputs | | |
| Other financial instruments | | (Level 1) | | (Level 2) | | (Level 3) | | Total |
Futures contracts | | $ | 1,510,466 | | | $ | 0 | | | $ | 0 | | | $ | 1,510,466 | |
The following is a reconciliation of assets in which significant unobservable inputs (Level 3) were used in determining fair value:
| | | | | |
| | | Corporate bonds |
| | | and notes |
Balance as of December 31, 2009 | | $ | 1,032,690 | |
| Realized gains (losses) | | | 0 | |
| Change in unrealized gains (losses) | | | 251,736 | |
| Purchases | | | 0 | |
| Sales | | | (316,864 | ) |
| Transfers in to Level 3 | | | 0 | |
| Transfers out of Level 3 | | | 0 | |
Balance as of December 31, 2010 | | $ | 967,562 | |
| | | | | |
Change in unrealized gains (losses) included in earnings relating to securities still held at December 31, 2010 | | $ | 85,583 | |
| | |
| 34 Wells Fargo Advantage VT Index Asset Allocation Fund | | Notes to Financial Statements |
4. TRANSACTIONS WITH AFFILIATES AND OTHER EXPENSES
Investment advisory fees
The Trust has entered into an investment advisory contract with Funds Management, an indirect wholly owned subsidiary of Wells Fargo & Company (“Wells Fargo”). The investment adviser is responsible for implementing investment policies and guidelines and for supervising the investment sub-adviser, who is responsible for day-to-day portfolio management of the Fund.
Pursuant to the contract, Funds Management is paid an annual investment advisory fee starting at 0.55% and declining to 0.40% as the average daily net assets of the Fund increase. For the year ended December 31, 2010, the investment advisory fee was equivalent to an annual rate of 0.55% of the Fund’s average daily net assets.
Funds Management may retain the services of certain investment sub-advisers to provide daily portfolio management to the Fund. The fees related to investment sub-advisory services are borne directly by the investment adviser and do not increase the overall fees paid by the Fund to the investment adviser. Wells Capital Management, an affiliate of Funds Management, is the investment sub-adviser to the Fund and is paid a fee by the investment adviser at an annual rate starting at 0.15% and declining to 0.10% as the average daily net assets of the Fund increase.
Administration and transfer agent fees
The Trust has entered into an Administration Agreement with Funds Management. Under this Agreement, for providing administrative services, which includes paying fees and expenses for services provided by the transfer agent, sub-transfer agents, omnibus account servicers and record-keepers, Funds Management is entitled to receive the following annual fees:
| | | | | | | | | |
| | | | | | | Administration Fees |
| | | | | | | (% of Average |
| | | Average Daily Net Assets | | Daily Net Assets) |
| Fund level | | First $5 billion | | | 0.05 | % |
| | | Next $5 billion | | | 0.04 | |
| | | Over $10 billion | | | 0.03 | |
| | | | | | | | | |
| Class 2 | | All asset levels | | | 0.08 | |
Prior to July 19, 2010, Funds Management received from the Fund an annual fee which started at 0.16% and declined to 0.14% as the average daily net assets of the Fund increased.
Funds Management has contractually waived and/or reimbursed investment advisory and administration fees to the extent necessary to maintain certain net operating expense ratios for the Fund. Waiver of fees and/or reimbursement of expenses by Funds Management were made first from fund level expenses on a proportionate basis and then from class specific expenses.
Distribution fees
The Trust has adopted a Distribution Plan for Class 2 shares of the Fund pursuant to Rule 12b-1 under the 1940 Act. Distribution fees are charged to the Class 2 shares and paid to Wells Fargo Funds Distributor, LLC, the principal underwriter, at an annual rate of 0.25% of its average daily net assets.
5. INVESTMENT PORTFOLIO TRANSACTIONS
Purchases and sales of investments, exclusive of short-term securities (securities with maturities of one year or less at purchase date) for the year ended December 31, 2010, were as follows:
| | | | | | | |
| Purchases at Cost | | Sales Proceeds |
| U.S. Government | | Non-U.S. Government | | U.S. Government | | Non-U.S. Government |
| $21,913,486 | | $3,020,212 | | $29,672,472 | | $13,938,380 |
6. DERIVATIVE TRANSACTIONS
During the year ended December 31, 2010, the Fund entered into futures contracts to gain market exposure.
| | |
| Notes to Financial Statements | | Wells Fargo Advantage VT Index Asset Allocation Fund 35 |
At December 31, 2010, the Fund had long and short futures contracts outstanding as follows:
| | | | | | | | | | | | | | | | | | | | | |
| | | | | | | | | | | Initial | | | | |
| Expiration | | | | | | | | | | Contract | | Value at | | Net Unrealized |
| Date | | Contracts | | Type | | Amount | | December 31, 2010 | | Gains |
| March 2011 | | 209 Short | | 30-Year
U.S. Treasury Bond | | $ | 26,503,072 | | | $ | 25,524,125 | | | $ | 978,947 | |
| | | | | | | | | | | | | | | | | | | | | |
| March 2011 | | 4 Long | | 30-Year
U.S. Treasury Bonds | | | 481,656 | | | | 488,500 | | | | 6,844 | |
| | | | | | | | | | | | | | | | | | | | | |
| March 2011 | | 85 Long | | S&P 500 Index | | | 26,101,575 | | | | 26,626,250 | | | | 524,675 | |
The Fund had an average contract amount of $27,615,327 and $25,947,590 in long and short futures contracts, respectively, during the year ended December 31, 2010.
A summary of derivative instruments by primary risk exposure is outlined in the following tables.
| | | | | | | | | |
| | | Asset Derivatives |
| | | Balance Sheet Location | | Fair Value |
| Interest rate contracts | | Net assets - Net unrealized gains on investments | | $ | 985,791 | * |
| Equity contracts | | Net assets - Net unrealized gains on investments | | | 524,675 | * |
| | | | | | | | | |
| | | | | | | $ | 1,510,466 | |
| | |
| * | | Amount represents cumulative unrealized gains (losses) on futures contracts. Only the variation margin as of December 31, 2010 is reported separately on the Statement of Assets and Liabilities. |
The effect of derivative instruments on the Statement of Operations for the year ended December 31, 2010 was as follows for the Fund:
| | | | | | | | | |
| | | Amount of Realized Gains (Losses) | | Change in Unrealized Gains (Losses) |
| | | on Future Contracts | | on Future Contracts |
| Interest rate contracts | | $ | (2,350,829 | ) | | $ | (313,179 | ) |
| Equity contracts | | | 3,594,903 | | | | (18,675 | ) |
| | | | | | | | | |
| | | $ | 1,244,074 | | | $ | (331,854 | ) |
7. BANK BORROWINGS
The Trust and Wells Fargo Funds Trust (excluding the money market funds) are parties to a $125,000,000 revolving credit agreement with State Street Bank and Trust Company, whereby the Fund is permitted to use bank borrowings for temporary or emergency purposes, such as to fund shareholder redemption requests. Interest under the credit agreement is charged to the Fund based on a borrowing rate equal to the higher of the Federal Funds rate in effect on that day plus 1.25% or the overnight LIBOR rate in effect on that day plus 1.25%. In addition, under the credit agreement, the Fund pays an annual commitment fee equal to 0.125% of the unused balance, which is allocated pro rata. Prior to September 7, 2010, the annual commitment fee paid by the Fund was 0.15% of the unused balance.
For the year ended December 31, 2010, there were no borrowings by the Fund under the agreement.
| | |
| 36 Wells Fargo Advantage VT Index Asset Allocation Fund | | Notes to Financial Statements |
8. DISTRIBUTIONS TO SHAREHOLDERS
The tax character of distributions paid during the years ended December 31, 2010 and December 31, 2009 were as follows:
| | | | | | | | | |
| | | Year ended December 31, |
| | | 2010 | | 2009 |
| Ordinary Income | | $ | 1,839,244 | | | $ | 2,236,644 | |
As of December 31, 2010, the components of distributable earnings on a tax basis were as follows:
| | | | | | | | | | | |
| Undistributed | | | | |
| Ordinary | | Unrealized | | Capital Loss |
| Income | | Gains (Losses) | | Carryforward |
| $ | 87,874 | | | $ | 5,459,863 | | | $ | (27,748,200 | ) |
9. INDEMNIFICATION
Under the Trust’s organizational documents, the officers and directors are indemnified against certain liabilities that may arise out of performance of their duties to the Trust. Additionally, in the normal course of business, the Trust may enter into contracts with service providers that contain a variety of indemnification clauses. The Trust’s maximum exposure under these arrangements is dependent on future claims that may be made against the Fund and, therefore, cannot be estimated.
| | |
| Report of Independent Registered Public Accounting Firm | | Wells Fargo Advantage VT Index Asset Allocation Fund 37 |
BOARD OF TRUSTEES AND SHAREHOLDERS OF
WELLS FARGO VARIABLE TRUST:
We have audited the accompanying statement of assets and liabilities, including the portfolio of investments, of the Wells Fargo Advantage VT Index Asset Allocation Fund (the “Fund”), one of the funds constituting the Wells Fargo Variable Trust, as of December 31, 2010, and the related statement of operations for the year then ended, statements of changes in net assets for each of the years in the two year period then ended, and the financial highlights for each of the years in the five year period then ended. These financial statements and financial highlights are the responsibility of the Fund’s management. Our responsibility is to express an opinion on these financial statements and financial highlights based on our audits.
We conducted our audits in accordance with the standards of the Public Company Accounting Oversight Board (United States). Those standards require that we plan and perform the audit to obtain reasonable assurance about whether the financial statements and financial highlights are free of material misstatement. An audit includes examining, on a test basis, evidence supporting the amounts and disclosures in the financial statements. Our procedures included confirmation of securities owned as of December 31, 2010, by correspondence with custodian and brokers, or by other appropriate auditing procedures. An audit also includes assessing the accounting principles used and significant estimates made by management, as well as evaluating the overall financial statement presentation. We believe that our audits provide a reasonable basis for our opinion.
In our opinion, the financial statements and financial highlights referred to above present fairly, in all material respects, the financial position of the Wells Fargo Advantage VT Index Asset Allocation Fund as of December 31, 2010, the results of its operations for the year then ended, changes in its net assets for each of the years in the two year period then ended, and the financial highlights for each of the years in the five year period then ended, in conformity with U.S. generally accepted accounting principles.
Boston, Massachusetts
February 25, 2011
| | |
| 38 Wells Fargo Advantage VT Index Asset Allocation Fund | | Other Information (Unaudited) |
PROXY VOTING INFORMATION
A description of the policies and procedures that the Fund uses to determine how to vote proxies relating to portfolio securities is available without charge, upon request, by calling 1-800-222-8222, visiting our Web site at wellsfargo.com/advantagefunds, or visiting the SEC Web site at www.sec.gov. Information regarding how the Fund voted proxies relating to portfolio securities during the most recent 12-month period ended June 30 is available without charge on the Fund’s Web site at wellsfargo.com/advantagefunds or by visiting the SEC Web site at www.sec.gov.
TAX INFORMATION
Pursuant to Section 854(b)(2) of the Internal Revenue Code, the Fund designates 65.22% of its ordinary income dividends distributed during the year ended December 31, 2010 as qualifying for the corporate dividends received deduction.
| | |
| Other Information (Unaudited) | | Wells Fargo Advantage VT Index Asset Allocation Fund 39 |
PORTFOLIO HOLDINGS INFORMATION
The complete portfolio holdings for the Fund are publicly available on the Fund’s Web site (www.wellsfargo.com/advantagefunds) on a monthly, 30-day or more delayed basis. In addition, top ten holdings information for the Fund is publicly available on the Fund’s Web site on a monthly, seven-day or more delayed basis. The Fund files its complete schedule of portfolio holdings with the SEC for the first and third quarters of each fiscal year on Form N-Q, which is available without charge by visiting the SEC Web site at www.sec.gov. In addition, the Fund’s Form N-Q may be reviewed and copied at the SEC’s Public Reference Room in Washington, DC, and at regional offices in New York City, at 233 Broadway, and in Chicago, at 175 West Jackson Boulevard, Suite 900. Information about the Public Reference Room may be obtained by calling 1-800-SEC-0330.
BOARD OF TRUSTEES
The following table provides basic information about the Board of Trustees (the “Trustees”) of the Wells Fargo Variable Trust (the “Trust”) and Officers of the Trust. This table should be read in conjunction with the Prospectus and the Statement of Additional Information1 of the Fund. Each of the Trustees and Officers listed below acts in identical capacities for the Wells Fargo Advantage family of funds, which consists of 152 funds comprising the Trust, Wells Fargo Funds Trust, Wells Fargo Master Trust and four closed-end funds (collectively the “Fund Complex”). All of the Trustees are also Members of the Audit and Governance Committees of each Trust in the Fund Complex. The mailing address of each Trustee and Officer is 525 Market Street, 12th Floor, San Francisco, CA 94105. Each Trustee and Officer serves an indefinite term, however, each Trustee serves such term until reaching the mandatory retirement age established by the Trustees.
Independent Trustees
| | | | | | | |
| Name and | | Position Held and | | | | |
| Year of Birth | | Length of Service | | Principal Occupations During Past Five Years | | Other Directorships |
Peter G. Gordon
(Born 1942) | | Trustee, since 1998;
Chairman, since 2005
(Lead Trustee since 2001) | | Co-Founder, Chairman, President and CEO of Crystal Geyser. Water Company. Trustee Emeritus, Colby College | | Asset Allocation
Trust |
| | | | | | | |
Isaiah Harris, Jr.
(Born 1952) | | Trustee, since 2009 | | Retired. Prior thereto, President and CEO of BellSouth Advertising and Publishing Corp. from 2005 to 2007, President and CEO of BellSouth Enterprises from 2004 to 2005 and President of BellSouth Consumer Services from 2000 to 2003. Emeritus member of the Iowa State University Foundation Board of Governors. Emeritus Member of the Advisory Board of Iowa State University School of Business. Mr. Harris is a certified public accountant. | | CIGNA Corporation; Deluxe Corporation; Asset Allocation Trust |
| | | | | | | |
Judith M. Johnson
(Born 1949) | | Trustee, since 2008 | | Retired. Prior thereto, Chief Executive Officer and Chief Investment Officer of Minneapolis Employees Retirement Fund from 1996 to 2008. Ms. Johnson is an attorney, certified public accountant and a certified managerial accountant. | | Asset Allocation
Trust |
| | | | | | | |
Leroy Keith, Jr.
(Born 1939) | | Trustee, since 2010 | | Chairman, Bloc Global Services (development and construction), Trustee of the Evergreen Funds from 1983 to 2010. Former Managing Director, Almanac Capital Management (commodities firm), former Partner, Stonington Partners, Inc. (private equity fund), former Director, Obagi Medical Products Co. and former Director, Lincoln Educational Services. | | Trustee, Virtus Fund Complex (consisting of 45 portfolios as of 12/31/10); Director, Diversapack Co. (packaging company); Asset Allocation Trust |
| | | | | | | |
David F. Larcker
(Born 1951) | | Trustee, since 2009 | | James Irvin Miller Professor of Accounting at the Graduate School of Business, Stanford University, Director of Corporate Governance Research Program and Co-Director of The Rock Center for Corporate Governance since 2006. From 2005 to 2008, Professor of Accounting at the Graduate School of Business, Stanford University. Prior thereto, Ernst & Young Professor of Accounting at The Wharton School, University of Pennsylvania from 1985 to 2005. | | Asset Allocation
Trust |
| | |
| 40 Wells Fargo Advantage VT Index Asset Allocation Fund | | Other Information (Unaudited) |
| | | | | | | |
| Name and | | Position Held and | | | | |
| Year of Birth | | Length of Service | | Principal Occupations During Past Five Years | | Other Directorships |
Olivia S. Mitchell
(Born 1953) | | Trustee, since 2006 | | International Foundation of Employee Benefit Plans Professor and Chair of the Department of Insurance and Risk Management, Wharton School of the University of Pennsylvania since 1993. Director of Wharton’s Pension Research Council and Boettner Center on Pensions & Retirement Research, and Research Associate at the National Bureau of Economic Research. Previously, Cornell University Professor from 1978 to 1993. | | Asset Allocation
Trust |
| | | | | | | |
Timothy J. Penny
(Born 1951) | | Trustee, since 1996 | | President and CEO of Southern Minnesota Initiative Foundation, a non-profit organization, since 2007 and Senior Fellow at the Humphrey Institute Policy Forum at the University of Minnesota since 1995. Member of the Board of Trustees of NorthStar Education Finance, Inc., a non-profit organization, since 2007. | | Asset Allocation
Trust |
| | | | | | | |
Michael S. Scofield
(Born 1943) | | Trustee, since 2010 | | Currently serves on the Investment Company Institute’s Board of Governors and Executive Committee as well the Independent Director’s Counsel Board of Governors and Executive Committee. Former Chairman of the Independent Directors Counsel. Trustee of the Evergreen Funds from 1984 to 2010. Retired Attorney, Law Offices of Michael S. Scofield and former Director and Chairman, Branded Media Corporation (multi-media branding company). | | Asset Allocation
Trust |
| | | | | | | |
Donald C. Willeke
(Born 1940) | | Trustee, since 1996 | | Principal of the law firm of Willeke & Daniels. General Counsel of the Minneapolis Employees Retirement Fund from 1984 until its consolidation into the Minnesota Public Employees Retirement Association on June 30, 2010. | | Asset Allocation
Trust |
Officers
| | | | | |
| Name and | | Position Held and | | |
| Year of Birth | | Length of Service | | Principal Occupations During Past Five Years |
Karla M. Rabusch
(Born 1959) | | President, since 2003 | | Executive Vice President of Wells Fargo Bank, N.A. and President of Wells Fargo Funds Management, LLC since 2003. Senior Vice President and Chief Administrative Officer of Wells Fargo Funds Management, LLC from 2001 to 2003. |
| | | | | |
C. David Messman
(Born 1960) | | Secretary, since 2000; Chief Legal Counsel, since 2003 | | Senior Vice President and Secretary of Wells Fargo Funds Management, LLC since 2001. Vice President and Managing Counsel of Wells Fargo Bank, N.A. since 1996. |
| | | | | |
Kasey Phillips
(Born 1970) | | Treasurer, since 2009 | | Senior Vice President of Wells Fargo Funds Management, LLC since 2009. Senior Vice President of Evergreen Investment Management Company, LLC from 2006 to 2010. Treasurer of the Evergreen Funds from 2005 to 2010. Vice President and Assistant Vice President of Evergreen Investment Services, Inc. from 1999 to 2006. |
| | | | | |
David Berardi
(Born 1975) | | Assistant Treasurer,
since 2009 | | Vice President of Wells Fargo Funds Management, LLC since 2009. Vice President of Evergreen Investment Management Company, LLC from 2008 to 2010. Assistant Vice President of Evergreen Investment Services, Inc. from 2004 to 2008. Manager of Fund Reporting and Control for Evergreen Investment Management Company, LLC from 2004 to 2010. |
| | | | | |
Jeremy DePalma
(Born 1974) | | Assistant Treasurer,
since 2009 | | Senior Vice President of Wells Fargo Funds Management, LLC since 2009. Senior Vice President of Evergreen Investment Management Company, LLC from 2008 to 2010. Vice President, Evergreen Investment Services, Inc. from 2004 to 2007. Assistant Vice President, Evergreen Investment Services, Inc. from 2000 to 2004 and the head of the Fund Reporting and Control Team within Fund Administration from 2005 to 2010. |
| | |
| Other Information (Unaudited) | | Wells Fargo Advantage VT Index Asset Allocation Fund 41 |
| | | | | |
| Name and | | Position Held and | | |
| Year of Birth | | Length of Service | | Principal Occupations During Past Five Years |
Debra Ann Early
(Born 1964) | | Chief Compliance Officer,
since 2007 | | Chief Compliance Officer of Wells Fargo Funds Management, LLC since 2007. Chief Compliance Officer of Parnassus Investments from 2005 to 2007. Chief Financial Officer of Parnassus Investments from 2004 to 2007 and Senior Audit Manager of PricewaterhouseCoopers LLP from 1998 to 2004. |
| | |
| 1. | | The Statement of Additional Information includes additional information about the Fund’s Trustees and is available, without charge, upon request, by calling 1-800-222-8222 or by visiting the Fund’s Web site at www.wellsfargo.com/advantagefunds. |
| | |
| 42 Wells Fargo Advantage VT Index Asset Allocation Fund | | List of Abbreviations |
The following is a list of common abbreviations for terms and entities which may have appeared in this report.
| | | | | |
|
| ABAG | | — | | Association of Bay Area Governments |
| ADR | | — | | American Depositary Receipt |
| ADS | | — | | American Depository Shares |
| AMBAC | | — | | American Municipal Bond Assurance Corporation |
| AMT | | — | | Alternative Minimum Tax |
| ARM | | — | | Adjustable Rate Mortgages |
| AUD | | — | | Australian Dollar |
| BART | | — | | Bay Area Rapid Transit |
| BRL | | — | | Brazil Real |
| CAD | | — | | Canadian Dollar |
| CDA | | — | | Community Development Authority |
| CDO | | — | | Collateralized Debt Obligation |
| CDSC | | — | | Contingent Deferred Sales Charge |
| CGIC | | — | | Capital Guaranty Insurance Company |
| CGY | | — | | Capital Guaranty Corporation |
| CHF | | — | | Swiss Franc |
| CIFG | | — | | CDC (Caisse des Dépôts et Consignations) IXIS Financial Guarantee |
| COP | | — | | Certificate of Participation |
| CP | | — | | Commercial Paper |
| CTF | | — | | Common Trust Fund |
| DEM | | — | | Deutsche Mark |
| DKK | | — | | Danish Krone |
| DW&P | | — | | Department of Water & Power |
| DWR | | — | | Department of Water Resources |
| ECFA | | — | | Educational & Cultural Facilities Authority |
| EDFA | | — | | Economic Development Finance Authority |
| ETET | | — | | Eagle Tax-Exempt Trust |
| ETF | | — | | Exchange-Traded Fund |
| EUR | | — | | Euro |
| FFCB | | — | | Federal Farm Credit Bank |
| FGIC | | — | | Financial Guaranty Insurance Corporation |
| FHA | | — | | Federal Housing Authority |
| FHAG | | — | | Federal Housing Agency |
| FHLB | | — | | Federal Home Loan Bank |
| FHLMC | | — | | Federal Home Loan Mortgage Corporation |
| FNMA | | — | | Federal National Mortgage Association |
| FRF | | — | | French Franc |
| FSA | | — | | Farm Service Agency |
| GBP | | — | | Great British Pound |
| GDR | | — | | Global Depositary Receipt |
| GNMA | | — | | Government National Mortgage Association |
| GO | | — | | General Obligation |
| HCFR | | — | | Healthcare Facilities Revenue |
| HEFA | | — | | Health & Educational Facilities Authority |
| HEFAR | | — | | Higher Education Facilities Authority Revenue |
| HFA | | — | | Housing Finance Authority |
| HFFA | | — | | Health Facilities Financing Authority |
| HKD | | — | | Hong Kong Dollar |
| HUD | | — | | Housing & Urban Development |
| HUF | | — | | Hungarian Forint |
| IDA | | — | | Industrial Development Authority |
| IDAG | | — | | Industrial Development Agency |
| IDR | | — | | Industrial Development Revenue |
| IEP | | — | | Irish Pound |
| JPY | | — | | Japanese Yen |
| KRW | | — | | Republic of Korea Won |
| LIBOR | | — | | London Interbank Offered Rate |
| LLC | | — | | Limited Liability Company |
| LLP | | — | | Limited Liability Partnership |
| LOC | | — | | Letter of Credit |
| LP | | — | | Limited Partnership |
| MBIA | | — | | Municipal Bond Insurance Association |
| MFHR | | — | | Multi-Family Housing Revenue |
| MFMR | | — | | Multi-Family Mortgage Revenue |
| MMD | | — | | Municipal Market Data |
| MTN | | — | | Medium Term Note |
| MUD | | — | | Municipal Utility District |
| MXN | | — | | Mexican Peso |
| MYR | | — | | Malaysian Ringgit |
| NATL-RE | | — | | National Public Finance Guarantee Corporation |
| NLG | | — | | Netherlands Guilder |
| NOK | | — | | Norwegian Krone |
| NZD | | — | | New Zealand Dollar |
| PCFA | | — | | Pollution Control Finance Authority |
| PCR | | — | | Pollution Control Revenue |
| PFA | | — | | Public Finance Authority |
| PFFA | | — | | Public Facilities Financing Authority |
| plc | | — | | Public Limited Company |
| PLN | | — | | Polish Zloty |
| PSFG | | — | | Public School Fund Guaranty |
| R&D | | — | | Research & Development |
| RDA | | — | | Redevelopment Authority |
| RDFA | | — | | Redevelopment Finance Authority |
| REITS | | — | | Real Estate Investment Trusts |
| SEK | | — | | Swedish Krona |
| SFHR | | — | | Single Family Housing Revenue |
| SFMR | | — | | Single Family Mortgage Revenue |
| SGD | | — | | Singapore Dollar |
| SKK | | — | | Slovakian Koruna |
| SLMA | | — | | Student Loan Marketing Association |
| SPDR | | — | | Standard & Poor’s Depositary Receipts |
| STIT | | — | | Short-Term Investment Trust |
| TBA | | — | | To Be Announced |
| TRAN | | — | | Tax Revenue Anticipation Notes |
| TRY | | — | | Turkish Lira |
| USD | | — | | United States Dollar |
| XLCA | | — | | XL Capital Assurance |
| ZAR | | — | | South African Rand |
More information about Wells Fargo Advantage Funds is available free upon request. To obtain literature, please write, e-mail, visit the Funds’ Web site, or call:
Wells Fargo Advantage Funds
P.O. Box 8266
Boston, MA 02266-8266
E-mail: wfaf@wellsfargo.com
Web site: www.wellsfargo.com/advantagefunds
Individual Investors: 1- 800-222-8222
Retail Investment Professionals: 1- 888-877-9275
Institutional Investment Professionals: 1- 866-765-0778
This report and the financial statements contained herein are submitted for the general information of the shareholders of Wells Fargo Advantage Funds. If this report is used for promotional purposes, distribution of the report must be accompanied or preceded by a current prospectus. For a prospectus containing more complete information, including charges and expenses, call 1-800-222-8222 or visit the Fund’s Web site at www.wellsfargo.com/advantagefunds. Please consider the investment objectives, risks, charges, and expenses of the investment carefully before investing. This and other information about Wells Fargo Advantage Funds can be found in the current prospectus. Read the prospectus carefully before you invest or send money.
Wells Fargo Funds Management, LLC, a wholly owned subsidiary of Wells Fargo & Company, provides investment advisory and administrative services for Wells Fargo Advantage Funds. Other affiliates of Wells Fargo & Company provide subadvisory and other services for the Funds. The Funds are distributed by Wells Fargo Funds Distributor, LLC, Member FINRA/SIPC, an affiliate of Wells Fargo & Company.
NOT FDIC INSURED § NO BANK GUARANTEE § MAY LOSE VALUE
| | | | | | |
| | | | | | | |
| | | | | | | |
| © 2011 Wells Fargo Funds Management, LLC. All rights reserved. | | | www.wellsfargo.com/advantagefunds | | | 200914 02-11 |
| | | | | | | AVT2/AR148 12-10 |
WELLS FARGO ADVANTAGE VARIABLE TRUST FUNDS
| § | | Wells Fargo Advantage VT International Equity Fund
(formerly Wells Fargo Advantage VT International Core Fund) |
Reduce clutter. Save trees.
Sign up for electronic delivery of prospectuses and shareholder reports at www.wellsfargo.com/advantagedelivery
| | | | | |
| Contents | | | | |
| |
| |
Letter to Shareholders | | | 2 | |
| |
Performance Highlights | | | 6 | |
| |
Fund Expenses | | | 11 | |
| |
Portfolio of Investments | | | 12 | |
| |
Financial Statements | | | | |
| Statement of Assets and Liabilities | | | 16 | |
| Statement of Operations | | | 17 | |
| Statements of Changes in Net Assets | | | 18 | |
| Financial Highlights | | | 20 | |
| |
Notes to Financial Statements | | | 22 | |
| |
Report of Independent Registered Public Accounting Firm | | | 29 | |
| |
Other Information | | | 30 | |
| |
List of Abbreviations | | | 34 | |
The views expressed are as of December 31, 2010, and are those of the Fund managers. Any reference to a specific security in this report is not a recommendation to purchase or sell any specific security or adopt any investment strategy. The views are subject to change at any time in response to changing circumstances in the market and are not intended to predict or guarantee the future performance of any individual security, market sector or the markets generally, or the Wells Fargo Advantage VT International Equity Fund.
NOT FDIC INSURED § NO BANK GUARANTEE § MAY LOSE VALUE
WELLS FARGO
INVESTMENT HISTORY
1932 Keystone creates one of the first mutual fund families.
1971 Wells Fargo & Company introduces one of the first institutional index funds.
1978 Wells Fargo applies Markowitz and Sharpe’s research on Modern Portfolio Theory to introduce one of the industry’s first Tactical Asset Allocation (TAA) models in institutional separately managed accounts.
1984 Wells Fargo Stagecoach Funds launches its first asset allocation fund.
1989 The Tactical Asset Allocation (TAA) Model is first applied to Wells Fargo’s asset allocation mutual funds.
1994 Wells Fargo introduces the LifePath Funds, one of the first suites of target date funds (now the Wells Fargo Advantage Dow Jones Target Date FundsSM).
1996 Evergreen Investments and Keystone Funds merge.
1997 Wells Fargo launches Wells Fargo Advantage WealthBuilder PortfoliosSM, a fund-of-funds suite of products that includes the use of quantitative models to shift assets among investment styles.
1999 Norwest Advantage Funds and Stagecoach Funds are reorganized into Wells Fargo Funds after the merger of Norwest and Wells Fargo.
2002 Evergreen Retail and Evergreen Institutional companies form the umbrella asset management company, Evergreen Investments.
2005 The integration of Strong Funds with Wells Fargo Funds creates Wells Fargo Advantage Funds, resulting in one of the top 20 mutual fund companies in the United States.
2006 Wells Fargo Advantage Funds relaunches the target date product line as Wells Fargo Advantage Dow Jones Target Date Funds.
2010 The mergers and reorganizations of Evergreen and Wells Fargo Advantage mutual funds are completed, unifying the families under the brand of Wells Fargo Advantage Funds.
Wells Fargo Advantage Funds®
Wells Fargo Advantage Funds skillfully guides institutions, financial advisors, and individuals through the investment terrain to help them reach their financial objectives. Everything we do on behalf of investors is backed by our unique combination of qualifications.
Strength
Our organization is built on the standards of integrity and service established by our parent company—Wells Fargo & Company—more than 150 years ago. And, because we’re part of a highly diversified financial enterprise, we offer the depth of resources to help investors succeed.
Expertise
Our multi-boutique model offers investors access to the independent thinking of premier investment managers that have been chosen for their time-tested strategies. While each team specializes in a specific investment strategy, collectively they provide investors a wide choice of distinct investment styles. Our dedication to investment excellence doesn’t end with our expertise in manager selection—risk management, analysis, and rigorous ongoing review seek to ensure each manager’s investment process remains consistent.
Partnership
Our collaborative approach is built around understanding the needs and goals of our clients. By adhering to core principles of sound judgment and steady guidance, we support you through every stage of the investment decision process.
Carefully consider the investment objectives, risks, charges, and expenses before investing. For a current prospectus for Wells Fargo Advantage Funds containing this and other information, visit wellsfargo.com/advantagefunds. Read it carefully before investing.
Wells Fargo Funds Management, LLC, a wholly owned subsidiary of Wells Fargo & Company, provides investment advisory and administrative services for Wells Fargo Advantage Funds®. Other affiliates of Wells Fargo & Company provide subadvisory and other services for the Funds. The Funds are distributed by Wells Fargo Funds Distributor, LLC, Member FINRA/SIPC, an affiliate of Wells Fargo & Company.
The “Dow Jones Target Date Indexes” are a product of Dow Jones Indexes, a licensed trademark of CME Group Index Services LLC (“CME”). “Dow Jones” and “Dow Jones Target Date Indexes” are service marks of Dow Jones Trademark Holdings, LLC, and have been licensed for use for certain purposes by CME and sublicensed for use by Global Index Advisors, Inc., and Wells Fargo Funds Management, LLC. The Dow Jones Target Date Indexes are based in part on the Barclays Capital Bond Indexes, which are published by Barclays Capital Inc. The Wells Fargo Advantage Dow Jones Target Date Funds, based on the Dow Jones Target Date Indexes, are not sponsored, endorsed, sold, or promoted by Dow Jones, CME or Barclays Capital or any of their respective affiliates, and neither Dow Jones, CME nor Barclays Capital nor any of their respective affiliates makes any representation regarding the advisability of investing in such product(s) and/or about the quality, accuracy, and/or completeness of the Dow Jones Target Date Indexes or the Barclays Capital Bond Indexes. IN NO EVENT SHALL DOW JONES, CME, BARCLAYS CAPITAL, OR ANY OF THEIR LICENSORS HAVE ANY LIABILITY FOR ANY SPECIAL, PUNITIVE, INDIRECT, OR CONSEQUENTIAL DAMAGES (INCLUDING LOST PROFITS), EVEN IF NOTIFIED OF THE POSSIBILITY OF SUCH DAMAGES.
NOT FDIC INSURED § NO BANK GUARANTEE § MAY LOSE VALUE
Not part of the annual report.
Wells Fargo Advantage Funds offers more than 120 mutual funds across a wide range of asset classes, representing over $236 billion in assets under management, as of December 31, 2010.
| | | | | |
|
Equity Funds | | | | |
| |
| Asia Pacific Fund | | Enterprise Fund† | | Opportunity Fund† |
| C&B Large Cap Value Fund | | Equity Value Fund | | Precious Metals Fund |
| C&B Mid Cap Value Fund | | Global Opportunities Fund | | Premier Large Company Growth Fund |
| Capital Growth Fund | | Growth Fund | | Small Cap Growth Fund |
| Classic Value Fund | | Growth Opportunities Fund | | Small Cap Opportunities Fund |
| Common Stock Fund | | Health Care Fund | | Small Cap Value Fund |
| Core Equity Fund | | Index Fund | | Small Company Growth Fund |
| Disciplined Global Equity Fund | | International Equity Fund | | Small Company Value Fund |
| Disciplined U.S. Core Fund | | International Value Fund | | Small/Mid Cap Core Fund |
| Disciplined Value Fund | | Intrinsic Small Cap Value Fund | | Small/Mid Cap Value Fund |
Discovery Fund† | | Intrinsic Value Fund | | Social Sustainability Fund† |
| Diversified Equity Fund | | Intrinsic World Equity Fund | | Special Mid Cap Value Fund |
| Diversified International Fund | | Large Cap Core Fund | | Special Small Cap Value Fund |
| Diversified Small Cap Fund | | Large Cap Growth Fund | | Specialized Technology Fund |
| Emerging Growth Fund | | Large Company Value Fund | | Strategic Large Cap Growth Fund |
| Emerging Markets Equity Fund | | Mid Cap Growth Fund | | Traditional Small Cap Growth Fund |
Endeavor Select Fund† | | Omega Growth Fund | | Utility and Telecommunications Fund |
| | | | | |
Bond Funds | | | | |
| |
| Adjustable Rate Government Fund | | Inflation-Protected Bond Fund | | Short-Term Bond Fund |
| California Limited-Term Tax-Free Fund | | Intermediate Tax/AMT-Free Fund | | Short-Term High Yield Bond Fund |
| California Tax-Free Fund | | International Bond Fund | | Short-Term Municipal Bond Fund |
| Colorado Tax-Free Fund | | Minnesota Tax-Free Fund | | Strategic Municipal Bond Fund |
| Government Securities Fund | | Municipal Bond Fund | | Total Return Bond Fund |
| High Income Fund | | North Carolina Tax-Free Fund | | Ultra Short-Term Income Fund |
| High Yield Bond Fund | | Pennsylvania Tax-Free Fund | | Ultra Short-Term Municipal Income Fund |
| Income Plus Fund | | Short Duration Government Bond Fund | | Wisconsin Tax-Free Fund |
| | | | | |
Asset Allocation Funds | | | | |
| |
| Asset Allocation Fund | | WealthBuilder Equity Portfolio† | | Target 2020 Fund† |
| Conservative Allocation Fund | | WealthBuilder Growth Allocation Portfolio† | | Target 2025 Fund† |
| Diversified Capital Builder Fund | | WealthBuilder Growth Balanced Portfolio† | | Target 2030 Fund† |
| Diversified Income Builder Fund | | WealthBuilder Moderate Balanced Portfolio† | | Target 2035 Fund† |
| Growth Balanced Fund | | WealthBuilder Tactical Equity Portfolio† | | Target 2040 Fund† |
| Index Asset Allocation Fund | | Target Today Fund† | | Target 2045 Fund† |
| Moderate Balanced Fund | | Target 2010 Fund† | | Target 2050 Fund† |
WealthBuilder Conservative Allocation Portfolio† | | Target 2015 Fund† | | |
| | | | | |
Money Market Funds | | | | |
| |
| 100% Treasury Money Market Fund | | Minnesota Money Market Fund | | New Jersey Municipal Money Market Fund |
| California Municipal Money Market Fund | | Money Market Fund | | New York Municipal Money Market Fund |
| Cash Investment Money Market Fund | | Municipal Cash Management Money Market Fund | | Pennsylvania Municipal Money Market Fund |
| Government Money Market Fund | | Municipal Money Market Fund | | Prime Investment Money Market Fund |
Heritage Money Market Fund† | | National Tax-Free Money Market Fund | | Treasury Plus Money Market Fund |
| | | | | |
Variable Trust Funds1 | | | | |
| |
| VT Core Equity Fund | | VT Intrinsic Value Fund | | VT Small Cap Value Fund |
VT Discovery Fund† | | VT Omega Growth Fund | | VT Total Return Bond Fund |
| VT Index Asset Allocation Fund | | VT Opportunity Fund† | | |
| VT International Equity Fund | | VT Small Cap Growth Fund | | |
An investment in a money market fund is not insured or guaranteed by the Federal Deposit Insurance Corporation or any other government agency. Although the Wells Fargo Advantage Money Market Funds seek to preserve the value of your investment at $1.00 per share, it is possible to lose money by investing in a money market fund.
| | |
| 1. | | The Variable Trust Funds are generally available only through insurance company variable contracts. |
| |
| † | | In this report, the Wells Fargo Advantage Discovery FundSM, Wells Fargo Advantage Endeavor Select FundSM, Wells Fargo Advantage Enterprise FundSM, Wells Fargo Advantage Opportunity FundSM, Wells Fargo Advantage Social Sustainability FundSM, Wells Fargo Advantage WealthBuilder Conservative Allocation PortfolioSM, Wells Fargo Advantage WealthBuilder Equity PortfolioSM, Wells Fargo Advantage WealthBuilder Growth Allocation PortfolioSM, Wells Fargo Advantage WealthBuilder Growth Balanced PortfolioSM, Wells Fargo Advantage WealthBuilder Moderate Balanced PortfolioSM, Wells Fargo Advantage WealthBuilder Tactical Equity PortfolioSM, Wells Fargo Advantage Dow Jones Target Today FundSM, Wells Fargo Advantage Dow Jones Target 2010 FundSM, Wells Fargo Advantage Dow Jones Target 2015 FundSM, Wells Fargo Advantage Dow Jones Target 2020 FundSM, Wells Fargo Advantage Dow Jones Target 2025 FundSM, Wells Fargo Advantage Dow Jones Target 2030 FundSM, Wells Fargo Advantage Dow Jones Target 2035 FundSM, Wells Fargo Advantage Dow Jones Target 2040 FundSM, Wells Fargo Advantage Dow Jones Target 2045 FundSM, Wells Fargo Advantage Dow Jones Target 2050 FundSM, Wells Fargo Advantage Heritage Money Market FundSM, Wells Fargo Advantage VT Discovery FundSM, and Wells Fargo Advantage VT Opportunity FundSM are referred to as the Discovery Fund, Endeavor Select Fund, Enterprise Fund, Opportunity Fund, Social Sustainability Fund, WealthBuilder Conservative Allocation Portfolio, WealthBuilder Equity Portfolio, WealthBuilder Growth Allocation Portfolio, WealthBuilder Growth Balanced Portfolio, WealthBuilder Moderate Balanced Portfolio, WealthBuilder Tactical Equity Portfolio, Target Today Fund, Target 2010 Fund, Target 2015 Fund, Target 2020 Fund, Target 2025 Fund, Target 2030 Fund, Target 2035 Fund, Target 2040 Fund, Target 2045 Fund, Target 2050 Fund, Heritage Money Market Fund, VT Discovery Fund, and VT Opportunity Fund, respectively. |
Not part of the annual report.
| | |
| | | |
| 2 Wells Fargo Advantage VT International Equity Fund | | Letter to Shareholders |
Karla M. Rabusch,
President
Wells Fargo Advantage Funds
The equity markets delivered strong full-year returns against the backdrop of a strengthening economy.
Dear Valued Shareholder:
We are pleased to provide you with this annual report for the Wells Fargo Advantage VT International Equity Fund for the 12 months that ended December 31, 2010. The equity markets delivered strong full-year returns against the backdrop of a strengthening economy. However, the year was not without its share of macroeconomic challenges and market volatility, once again highlighting the value of a sound, well-diversified investment strategy. As always, we believe that such a strategy can enable investors to balance risks and opportunities as they pursue long-term financial goals in a dynamic market environment.
The economic recovery stayed on track.
The U.S. economic recovery that began in the summer of 2009 gained momentum in 2010, particularly toward the end of the year. Gross domestic product (GDP) grew at an annualized rate of 3.2% in the fourth quarter of 2010—capping a streak of six consecutive quarters of positive GDP growth—and 2.9% for the full year. Although the path of recovery has been uneven at times and growth remains subpar compared with previous recoveries, the general consensus among economists is that the economy will likely avoid a double-dip recession. That said, persistent weakness in the labor and housing markets bears close watching in the months ahead.
Jobs and housing remained troublesome.
At the end of the year, the unemployment rate stood at 9.4%, down from 9.9% a year earlier, but still stubbornly high. Unfortunately, the drop may be attributable more to a decline in the labor force than a meaningful uptick in hiring. In fact, employers added just 1.1 million jobs for all of 2010, suggesting that the improving economy has yet to translate into widespread hiring. Meanwhile, the beleaguered housing market was an ongoing source of concern, despite some tentative late-year signs of stabilization.
Other economic data were more encouraging, reflecting greater confidence in the recovery on the part of both consumers and businesses. Retail sales came in strong at certain points during the year, including the critical holiday shopping season, and industrial production and new orders have picked up. Although still reluctant to hire, businesses have gradually increased spending in other areas, such as equipment and technology. Core inflation, which excludes volatile food and energy prices, remained benign.
The Fed continued to do its part.
With inflation subdued, the Federal Reserve (the Fed) held its target range for the federal funds rate—a proxy for short-term interest rates—steady at 0% to 0.25%. In its final statement of 2010, the Fed noted that economic expansion continues to be restrained by headwinds such as high unemployment, modest income growth, lower housing wealth, and tight credit. As a result, the Fed indicated that it intends to keep short-term rates at historically low levels for as long as needed to promote a more robust recovery.
| | |
| | | |
| Letter to Shareholders | | Wells Fargo Advantage VT International Equity Fund 3 |
The Fed also stated that it plans to proceed with other stimulus measures, including its second round of quantitative easing (QE2)—a plan to purchase $600 billion in long-term Treasury securities by mid-2011. The ‘preannouncement’ of QE2 in the third quarter of 2010 marked a turning point for the equity markets in that it ushered in a favorable shift in investor sentiment. By and large, investors interpreted the plan as further evidence of the Fed’s commitment to avoiding deflation and spurring economic growth.
2010 was another solid year for equities.
QE2 was certainly not the only catalyst for the equity markets during 2010. Along with more upbeat economic data, better-than-expected corporate earnings power played a role in driving stock prices higher. Throughout the year, quarterly earnings per share for the majority of companies in the S&P 500 Index consistently exceeded Wall Street estimates. As 2010 drew to a close, the midterm congressional elections and the extension of the Bush-era tax cuts provided additional tailwinds, helping the markets finish the year on a strong note.
It was the second straight year of double-digit total returns for the broad equity market indexes. The S&P 500 Index and the Dow Jones Industrial Average advanced 15.1% and 14.1%, respectively, while the tech-heavy NASDAQ Composite Index returned 18.2%. Investors were generally rewarded across the market-capitalization spectrum—with small- and mid-cap stocks outpacing large-cap stocks—as well as across most economic sectors. In terms of investment styles, growth stocks outperformed their value counterparts for the year.
To be sure, the gains were hard-earned, as the markets had to contend with numerous issues along the way, including the European sovereign debt crisis, China’s efforts to slow growth, and doubts about the sustainability of the domestic recovery. The second quarter in particular witnessed bouts of heightened market volatility, most notably the so-called “flash crash” in May. As the year progressed, however, volatility—as measured by the Chicago Board Options Exchange Volatility Index—abated amid reduced fears of a double-dip recession.
Investors should keep a long-term perspective.
In our view, the equity markets’ dramatic rebound over the past two years from a severe downturn underscores the importance of maintaining a disciplined, long-term investment strategy through changing market cycles. By staying focused on your long-term goals, you may be better positioned both to navigate falling markets and participate in rising markets.
To help you build a well-diversified strategy based on your personal objectives and risk tolerance, Wells Fargo Advantage Funds® offers more than 120 mutual funds and other investments covering a wide range of asset classes and investment styles. Although diversification cannot guarantee an investment profit or prevent losses, we believe it can be an effective way to manage investment risk and potentially smooth out overall portfolio performance.
Along with more upbeat economic data, better-than-expected corporate earnings power played a role in driving stock prices higher.
| | |
| | | |
| 4 Wells Fargo Advantage VT International Equity Fund | | Letter to Shareholders |
Thank you for choosing Wells Fargo Advantage Funds. We appreciate your continued confidence in us and are committed to helping you meet your financial needs. If you have any questions about your investments, please contact your investment professional, call us at 1-800-222-8222, or visit wellsfargo.com/advantagefunds.
Sincerely,
Karla M. Rabusch
President
Wells Fargo Advantage Funds
This page is intentionally left blank.
| | |
| | | |
| 6 Wells Fargo Advantage VT International Equity Fund | | Performance Highlights (Unaudited) |
Wells Fargo Advantage VT International Equity Fund
INVESTMENT OBJECTIVE
The Fund seeks long-term capital appreciation.
INVESTMENT ADVISER
Wells Fargo Funds Management, LLC
SUB-ADVISER
Wells Capital Management Incorporated
PORTFOLIO MANAGER
Francis Claró, CFA
FUND INCEPTION
August 17, 1998
PERFORMANCE SUMMARY
12 MONTH TOTAL RETURN AS OF DECEMBER 31, 2010
| | | | | |
|
| Class 2 | | | 16.50 | % |
MSCI EAFE Free Index1 | | | 7.75 | % |
Figures quoted represent past performance, which is no guarantee of future results and do not reflect the deduction of taxes that a shareholder may pay on fund distributions or the redemption of fund shares. Investment return and principal value of an investment will fluctuate so that an investor’s shares, when redeemed, may be worth more or less than their original cost. Current performance may be lower or higher than the performance data quoted. Current month-end performance is available by calling 1-866-765-0778. Performance figures of the Fund do not reflect fees charged pursuant to the terms of variable life insurance policies and variable annuity contracts.
The adviser has committed, through July 18, 2013, to waive fees and/or reimburse expenses to maintain the contractual expense cap at 0.94% for Class 2 excluding acquired fund fees and certain other expenses. Without these reductions, the Fund’s returns would have been lower. The Fund’s net expense ratio is 0.95% for the Class 2 shares. The Fund’s gross expense ratio is 1.21% for the Class 2 shares.
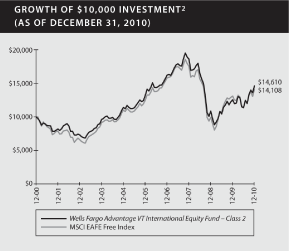
| | |
| 1. | | The Morgan Stanley Capital International Europe, Australasia, and Far East (“MSCI EAFE Free”) Free Index is an unmanaged group of securities widely regarded by investors to be representative of the stock markets of Europe, Australasia, and the Far East. MSCI Free Indices are constructed to reflect investment opportunities for global investors to account for local market restrictions on stock ownership by international investors. You cannot invest directly in an index. |
| |
| 2. | | The chart compares the performance of the Wells Fargo Advantage VT International Equity Fund Class 2 for the most recent ten years of the Fund with the MSCI EAFE Free Index. The chart assumes a hypothetical $10,000 investment and reflects all operating expenses of the Fund. |
| | |
| | | |
| Performance Highlights (Unaudited) | | Wells Fargo Advantage VT International Equity Fund 7 |
Wells Fargo Advantage VT International Equity Fund (continued)
MANAGER’S DISCUSSION
Fund highlights:
| § | | The Fund outperformed its benchmark, the MSCI EAFE Free Index, for the 12-month period that ended December 31, 2010, largely due to positive contributions from many individual holdings across a range of sectors and countries. |
| |
| § | | Continuing with moves we began in mid-2009, our bottom-up focus on stock selection resulted in larger sector overweights in consumer discretionary and information technology at the expense of underweights in financials and consumer staples. |
| |
| § | | Geographically, the individual stock and sector positionings were reflected in overweights in emerging markets and Canada, and underweights in Japan and Asia ex-Japan. |
Our selective cyclical exposure proved beneficial over the year as a whole.
The fiscal year saw the tail end of the strong bull market of 2009 being replaced by renewed investor nervousness in early 2010. Among the negative influences was the sovereign debt crisis in Europe that started in Greece and which many feared would engulf a growing number of eurozone countries. While the establishment of the European Financial Stability Facility in June initially helped to allay these fears, the markets entered a further period of volatility in July, as fears of a double-dip recession, together with continued high unemployment, came to the forefront. These fears were finally subdued, as expectations grew that the U.S. Federal Reserve would maintain a loose monetary policy and even resort to another round of quantitative easing. This helped global markets finish the fiscal year on a strong note, with the Fund generating even higher returns for its shareholders.
TEN LARGEST EQUITY HOLDINGS3
(AS OF DECEMBER 31, 2010)
| | | | | |
|
| Isuzu Motors Limited | | | 1.86 | % |
| Nestle SA | | | 1.85 | % |
| Fresenius AG | | | 1.74 | % |
| HSBC Holdings plc | | | 1.71 | % |
| Sina Corporation | | | 1.69 | % |
| Monster Worldwide Incorporated | | | 1.65 | % |
| Rio Tinto plc | | | 1.65 | % |
| Randstad Holdings NV | | | 1.57 | % |
| BHP Billiton plc | | | 1.52 | % |
| Swatch Group AG Class B | | | 1.51 | % |
Over the 12-month period, we increased exposure to consumer discretionary, principally through additional automobile and luxury good stocks. New auto holdings included Peugeot and BMW. With regards to luxury goods companies, we actively managed our existing positions, including Burberry Group plc, Compagnie Financiere Richmont SA, and Swatch Group AG Class B in effort to benefit from increased demand for luxury products, particularly from China and other leading developing countries. Selective additions to a number of gold and
| | |
| 3. | | The ten largest equity holdings are calculated based on the value of the securities divided by total investments of the Fund. Holdings are subject to change and may have changed since the date specified. |
| | |
| | | |
| 8 Wells Fargo Advantage VT International Equity Fund | | Performance Highlights (Unaudited) |
Wells Fargo Advantage VT International Equity Fund (continued)
commodity stocks were made in the materials sector. Offsetting these purchases were eliminations of a range of holdings within the financials sector. Stocks we sold during the period included Hellenic Exchanges, Deutsche Bank, and Sompo Japan Insurance Company. Within our energy holdings, we eliminated our Transocean Limited position early in 2010, before the Gulf of Mexico oil spill accident that occurred on April 20th.
In terms of sectors, our overweight in consumer discretionary, combined with strong performance from our luxury goods and auto holdings, boosted returns. The contribution from information technology, also an overweight, was supported by a number of our Chinese holdings. A small underweight in materials was more than offset by strong stock performance from a large number of holdings, which were diversified across a range of commodities. The only detractor was consumer staples, where we had an underweight exposure to this surprisingly strongly performing sector.
Geographically, Europe and the emerging markets were the leading regions, due to strong stock performance in each. While our underweight in Japan, one of the strongest performing countries within the MSCI EAFE Free Index, hampered returns, the fund greatly benefitted from good stock selection in that market. Overall, Japan was a top five contributor from a geographic perspective.
Government policy responses are limited by rising deficits, but we believe that attractive equity valuations could prove beneficial for stocks.
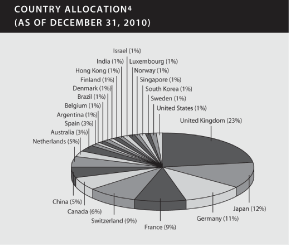
During the year, the markets realized that fiscal stimulus had its limits, causing great uncertainties regarding the future financing of deficits. Credit default swaps on sovereign issues have remained stubbornly high, a reflection of the concern about the ability of several European governments to repay debt. Hence, fiscal stimulus has turned to fiscal drag, and we believe it will remain that way in numerous countries for several years. In addition, banks are still deleveraging and reducing risk as Basel III imposes higher capital requirements on them. The policy response, particularly in the U.S., has been monetary easing, although this approach has seen some resistance globally. Moderate inflation is a desired ally of governments in developed countries, and current actions may well lead to the preferred outcome of higher prices, if economic growth returns.
| | |
| 4. | | Country allocation is subject to change and is calculated based on the total long-term investments of the Fund. |
| | |
| | | |
| Performance Highlights (Unaudited) | | Wells Fargo Advantage VT International Equity Fund 9 |
Wells Fargo Advantage VT International Equity Fund (continued)
However, we believe several significant positive drivers for equities do exist. First and foremost, valuations of equities look compelling relative to bonds. Earnings yields of equities compare favorably with bond yields, and the massive flow of funds to bonds has reduced the risk-adjusted return profile for this asset class relative to equities. Money, one of the basic raw materials that enables corporate investment, is historically cheap and becoming plentiful. Combine this with the current long period of underinvestment in capital expenditures and labor, and we should begin to see some meaningful activity in both of these areas, which should be positive for growth.
We are finding interesting stocks in developed markets in various sectors that are trading at attractive values. We believe that these stocks will reward investors; at the same time, we are identifying undervalued growth stocks in emerging markets that should provide attractive investment opportunities.
| | |
| 10 Wells Fargo Advantage VT International Equity Fund | | Performance Highlights (Unaudited) |
Wells Fargo Advantage VT International Equity Fund (continued)
AVERAGE ANNUAL TOTAL RETURN (%) (AS OF DECEMBER 31, 2010)5
| | | | | | | | | | | | | | | | | | | | | | | | | | | | | |
| | | Inception | | | | | | | | | | | | | | | | | | Expense Ratios6 |
| | | Date | | 6 Months* | | 1 Year | | 5 Year | | 10 Year | | Gross | | Net7 |
| Class 1 | | | 8/17/1998 | | | | 28.86 | | | | 16.79 | | | | 2.33 | | | | 4.09 | | | | 0.96 | % | | | 0.70 | % |
| Class 2 | | | 7/31/2002 | | | | 28.53 | | | | 16.50 | | | | 2.07 | | | | 3.86 | | | | 1.21 | % | | | 0.95 | % |
MSCI EAFE Free Index1 | | | | | | | 24.18 | | | | 7.75 | | | | 2.46 | | | | 3.50 | | | | | | | | | |
| | |
| * | | Returns for periods of less than one year are not annualized. |
Figures quoted represent past performance, which is no guarantee of future results and do not reflect the deduction of taxes that a shareholder may pay on fund distributions or the redemption of fund shares. Investment return and principal value of an investment will fluctuate so that an investor’s shares, when redeemed, may be worth more or less than their original cost. Current performance may be lower or higher than the performance data quoted. Current month-end performance is available by calling 1-866-765-0778. Performance figures of the Fund do not reflect fees charged pursuant to the terms of variable life insurance policies and variable annuity contracts.
Stock fund values fluctuate in response to the activities of individual companies and general market and economic conditions. Foreign investments are especially volatile and can rise or fall dramatically due to differences in the political and economic conditions of the host country. These risks are generally intensified in emerging markets. The use of derivatives may reduce returns and/or increase volatility. Certain investment strategies tend to increase the total risk of an investment (relative to the broader market). This Fund is exposed to active trading risk and smaller company securities risk. Consult the Fund’s prospectus for additional information on these and other risks.
Please refer to the prospectus provided by your participating insurance company for detailed information describing the separate accounts for information regarding surrender charges, mortality and expense risk fees and other charges that may be assessed by the participating insurance companies.
| | |
| 5. | | Performance shown for Class 2 shares prior to its inception reflects the performance of Class 1 shares, adjusted to reflect the higher expenses applicable to Class 2 shares. Historical performance shown for all classes of the Fund prior to July 19, 2010 is based on the performance of the fund’s predecessor, Evergreen VA International Equity Fund. Effective July 16, 2010, the Fund name changed from Wells Fargo Advantage VT International Core Fund to Wells Fargo Advantage VT International Equity Fund. |
| |
| 6. | | Reflects the expense ratio as stated in the July 19, 2010 prospectus. |
| |
| 7. | | The advisor has committed, through July 18, 2013, to waive fees and/or reimburse expenses to maintain the contractual expense cap at 0.69% for Class 1 and 0.94% for Class 2 shares excluding acquired fund fees and certain other expenses. Without these reductions, the Fund’s returns would have been lower. |
| | |
| Letter to Shareholders | | Wells Fargo Advantage VT International Equity Fund 11 |
As a shareholder of the Fund, you incur two types of costs: (1) transaction costs, including sales charges (loads) on purchase payments, redemption fees (if any) and exchange fees (if any); and (2) ongoing costs, including management fees; distribution (12b-1) and/or shareholder service fees; and other Fund expenses. This example is intended to help you understand your ongoing costs (in dollars) of investing in the Fund and to compare these costs with the ongoing costs of investing in other mutual funds.
The example is based on an investment of $1,000 invested at the beginning of the six-month period and held for the entire period from July 1, 2010 to December 31, 2010.
Actual expenses
The “Actual” line of the table below provides information about actual account values and actual expenses. You may use the information in this line, together with the amount you invested, to estimate the expenses that you paid over the period. Simply divide your account value by $1,000 (for example, an $8,600 account value divided by $1,000 = 8.6), then multiply the result by the number in the “Actual” line under the heading entitled “Expenses Paid During Period” for your applicable class of shares to estimate the expenses you paid on your account during this period.
Hypothetical example for comparison purposes
The “Hypothetical” line of the table below provides information about hypothetical account values and hypothetical expenses based on the Fund’s actual expense ratio and an assumed rate of return of 5% per year before expenses, which is not the Fund’s actual return. The hypothetical account values and expenses may not be used to estimate the actual ending account balance or expenses you paid for the period. You may use this information to compare the ongoing costs of investing in the Fund and other funds. To do so, compare this 5% hypothetical example with the 5% hypothetical examples that appear in the shareholder reports of the other funds.
Please note that the expenses shown in the table are meant to highlight your ongoing costs only and do not reflect any transactional costs, such as sales charges (loads), redemption fees exchange fees, or separate account charges assessed by participating insurance companies. Therefore, the “Hypothetical” line of the table is useful in comparing ongoing costs only, and will not help you determine the relative total costs of owning different funds. In addition, if these transactional costs were included, your costs would have been higher.
| | | | | | | | | | | | | | | | | |
| | | Beginning | | Ending | | Expenses | | |
| | | Account Value | | Account Value | | Paid During | | Net Annual |
| | | 07-01-2010 | | 12-31-2010 | | the Period1 | | Expense Ratio |
Class 1 | | | | | | | | | | | | | | | | |
| Actual | | $ | 1,000.00 | | | $ | 1,288.64 | | | $ | 4.02 | | | | 0.69 | % |
| Hypothetical (5% return before expenses) | | $ | 1,000.00 | | | $ | 1,021.96 | | | $ | 3.55 | | | | 0.69 | % |
| | | | | | | | | | | | | | | | | |
Class 2 | | | | | | | | | | | | | | | | |
| Actual | | $ | 1,000.00 | | | $ | 1,285.27 | | | $ | 5.47 | | | | 0.94 | % |
| Hypothetical (5% return before expenses) | | $ | 1,000.00 | | | $ | 1,020.69 | | | $ | 4.84 | | | | 0.94 | % |
| | |
| 1 | | Expenses are equal to the Fund’s annualized expense ratio multiplied by the average account value over the period, multiplied by the number of days in the most recent fiscal half-year divided by the number of days in the fiscal year (to reflect the one-half year period). |
| | |
| | | |
| 12 Wells Fargo Advantage VT International Equity Fund | | Portfolio of Investments—December 31, 2010 |
| | | | | | | | | |
| Shares | | | Security Name | | Value | |
| Common Stocks: 96.38% | | | | |
| | | | | | | | | |
| Argentina: 0.92% | | | | |
| | 163,939 | | | Irsa Inversiones y Representaciones SA ADR (Financials, Real Estate Management & Development) | | $ | 2,637,779 | |
| | | | | | | | |
| | | | | | | | | |
| Australia: 3.73% | | | | |
| | 338,028 | | | AMP Limited (Financials, Insurance) | | | 1,828,939 | |
| | 33,912 | | | ASX Limited (Financials, Diversified Financial Services) | | | 1,306,938 | |
| | 37,175 | | | Commonwealth Bank of Australia (Financials, Commercial Banks) | | | 1,930,407 | |
| | 26,372 | | | Macquarie Group Limited (Financials, Capital Markets) | | | 998,281 | |
| | 71,532 | | | Newcrest Mining Limited (Materials, Metals & Mining) | | | 2,958,710 | |
| | 72,712 | | | Westpac Banking Corporation (Financials, Commercial Banks) | | | 1,651,754 | |
| | | | | | | | 10,675,029 | |
| | | | | | | | |
| | | | | | | | | |
| Belgium: 0.62% | | | | |
| | 30,939 | | | Anheuser-Busch InBev NV (Consumer Staples, Beverages) | | | 1,769,514 | |
| | | | | | | | |
| | | | | | | | | |
| Brazil: 0.45% | | | | |
| | 62,860 | | | Banco Bradesco SA ADR (Financials, Commercial Banks)« | | | 1,275,429 | |
| | | | | | | | |
| | | | | | | | | |
| Canada: 6.87% | | | | |
| | 37,005 | | | Agnico-Eagle Mines Limited (Materials, Metals & Mining)« | | | 2,838,284 | |
| | 113,030 | | | Brookfield Asset Management Incorporated (Financials, Real Estate Management & Development) | | | 3,762,769 | |
| | 66,997 | | | Canadian Natural Resources Limited (Energy, Oil, Gas & Consumable Fuels) | | | 2,988,351 | |
| | 69,177 | | | EnCana Corporation (Energy, Oil, Gas & Consumable Fuels) | | | 2,023,895 | |
| | 36,659 | | | Goldcorp Incorporated (Materials, Metals & Mining) | | | 1,691,557 | |
| | 53,551 | | | Pacific Rubiales Energy Corporation (Energy, Oil, Gas & Consumable Fuels) | | | 1,817,707 | |
| | 40,343 | | | Suncor Energy Incorporated (Energy, Oil, Gas & Consumable Fuels) | | | 1,553,183 | |
| | 47,749 | | | Teck Cominco Incorporated Limited (Materials, Metals & Mining) | | | 2,967,324 | |
| | | | | | | | 19,643,070 | |
| | | | | | | | |
| | | | | | | | | |
| China: 5.12% | | | | |
| | 12,484 | | | Baidu.com Incorporated ADR (Information Technology, Internet Software & Services)† | | | 1,205,081 | |
| | 2,368,000 | | | China Infrastructure Machinery Holdings Limited (Industrials, Machinery) | | | 1,294,772 | |
| | 21,401 | | | China Mobile Limited ADR (Telecommunication Services, Wireless Telecommunication Services)« | | | 1,061,918 | |
| | 42,299 | | | Netease.com Incorporated ADR (Information Technology, Internet Software & Services)†« | | | 1,529,109 | |
| | 74,846 | | | Sina Corporation (Information Technology, Internet Software & Services)†« | | | 5,150,902 | |
| | 75,800 | | | Tencent Holdings Limited (Information Technology, Internet Software & Services) | | | 1,647,105 | |
| | 49,307 | | | Vanceinfo Technologies Incorporated ADR (Information Technology, Software)†« | | | 1,703,064 | |
| | 268,000 | | | ZTE Corporation (Telecommunication Services, Wireless Telecommunication Services) | | | 1,065,408 | |
| | | | | | | | 14,657,359 | |
| | | | | | | | |
| | | | | | | | | |
| Denmark: 0.94% | | | | |
| | 144 | | | A.P. Moller-Maersk A/S Class B (Industrials, Marine) | | | 1,303,940 | |
| | 13,713 | | | Carlsberg A/S (Consumer Staples, Beverages) | | | 1,373,009 | |
| | | | | | | | 2,676,949 | |
| | | | | | | | |
| | | | | | | | | |
| Finland: 0.42% | | | | |
| | 114,973 | | | Nokia Oyj (Telecommunication Services, Diversified Telecommunication Services)† | | | 1,189,161 | |
| | | | | | | | |
| | | | | | | | | |
| France: 8.92% | | | | |
| | 23,230 | | | Alstom RGPT (Industrials, Machinery) | | | 1,111,623 | |
| | 35,168 | | | BNP Paribas SA (Financials, Commercial Banks) | | | 2,237,432 | |
| | 32,440 | | | Carrefour SA (Consumer Staples, Food & Staples Retailing) | | | 1,337,334 | |
| | 24,520 | | | Compagnie de Saint-Gobain (Industrials, Building Products) | | | 1,261,494 | |
| | 106,509 | | | France Telecom SA (Telecommunication Services, Diversified Telecommunication Services) | | | 2,219,605 | |
| | 25,294 | | | Groupe Danone (Consumer Staples, Food Products) | | | 1,589,293 | |
| | |
| Portfolio of Investments—December 31, 2010 | | Wells Fargo Advantage VT International Equity Fund 13 |
| | | | | | | | | |
| Shares | | | Security Name | | Value | |
| France (continued) | | | | |
| | 17,037 | | | LVMH Moet Hennessy Louis Vuitton SA (Consumer Discretionary, Textiles, Apparel & Luxury Goods) | | $ | 2,802,561 | |
| | 12,410 | | | Pernod-Ricard (Consumer Staples, Beverages) | | | 1,166,814 | |
| | 100,903 | | | Peugeot SA (Consumer Discretionary, Automobiles) | | | 3,830,710 | |
| | 15,583 | | | Pinault-Printempts-Redoute SA (Consumer Discretionary, Multiline Retail) | | | 2,478,004 | |
| | 31,248 | | | Publicis Groupe (Consumer Discretionary, Media) | | | 1,628,511 | |
| | 24,149 | | | Sanofi-Aventis SA (Health Care, Pharmaceuticals) | | | 1,544,134 | |
| | 8,633 | | | Technip SA (Energy, Energy Equipment & Services) | | | 797,157 | |
| | 28,656 | | | Total SA (Energy, Oil, Gas & Consumable Fuels) | | | 1,518,318 | |
| | | | | | | | 25,522,990 | |
| | | | | | | | |
| | | | | | | | | |
| Germany: 9.04% | | | | |
| | 61,344 | | | Adidas-Salomon AG (Consumer Discretionary, Textiles, Apparel & Luxury Goods) | | | 4,007,708 | |
| | 16,765 | | | Allianz AG (Financials, Insurance) | | | 1,992,305 | |
| | 22,925 | | | BASF SE (Materials, Chemicals)† | | | 1,828,890 | |
| | 33,978 | | | Bayer AG (Health Care, Pharmaceuticals) | | | 2,510,885 | |
| | 23,248 | | | Bayerische Motoren Werke AG (Consumer Discretionary, Automobiles) | | | 1,828,252 | |
| | 55,431 | | | Daimler AG (Consumer Discretionary, Automobiles) | | | 3,757,695 | |
| | 16,326 | | | Deutsche Boerse AG (Financials, Diversified Financial Services) | | | 1,130,091 | |
| | 12,167 | | | Hochtief AG (Industrials, Construction & Engineering) | | | 1,033,082 | |
| | 24,223 | | | Metro AG (Consumer Staples, Food & Staples Retailing) | | | 1,744,052 | |
| | 12,044 | | | Muenchener Rueckversicherungs-Gesellschaft AG (Financials, Insurance) | | | 1,825,909 | |
| | 35,704 | | | SAP AG (Information Technology, Software) | | | 1,817,799 | |
| | 19,266 | | | Siemens AG (Industrials, Industrial Conglomerates) | | | 2,386,576 | |
| | | | | | | | 25,863,244 | |
| | | | | | | | |
| | | | | | | | | |
| Hong Kong: 0.44% | | | | |
| | 56,207 | | | Hong Kong Exchanges & Clearing Limited (Financials, Diversified Financial Services) | | | 1,274,868 | |
| | | | | | | | |
| | | | | | | | | |
| India: 0.40% | | | | |
| | 22,746 | | | ICICI Bank Limited ADR (Financials, Commercial Banks)« | | | 1,151,857 | |
| | | | | | | | |
| | | | | | | | | |
| Israel: 0.47% | | | | |
| | 26,095 | | | Teva Pharmaceutical Industries Limited ADR (Health Care, Pharmaceuticals)« | | | 1,360,332 | |
| | | | | | | | |
| | | | | | | | | |
| Japan: 12.12% | | | | |
| | 33,600 | | | Canon Incorporated (Information Technology, Office Electronics) | | | 1,742,284 | |
| | 1,250,000 | | | Isuzu Motors Limited (Consumer Discretionary, Automobiles) | | | 5,681,118 | |
| | 103,300 | | | Komatsu Limited (Industrials, Machinery) | | | 3,126,101 | |
| | 69,700 | | | Makita Corporation (Industrials, Machinery) | | | 2,850,154 | |
| | 642,000 | | | Nippon Yusen Kabushiki Kaisha (Industrials, Marine) | | | 2,846,656 | |
| | 165,000 | | | NKSJ Holdings Incorporated (Financials, Insurance)† | | | 1,215,297 | |
| | 274,200 | | | Nomura Holdings Incorporated (Financials, Capital Markets) | | | 1,739,291 | |
| | 592,000 | | | Sumitomo Heavy Industries Limited (Industrials, Machinery) | | | 3,806,183 | |
| | 16,500 | | | TDK Corporation (Information Technology, Electronic Equipment & Instruments) | | | 1,148,233 | |
| | 19,700 | | | Tokyo Electron Limited (Information Technology, Semiconductors & Semiconductor Equipment) | | | 1,247,173 | |
| | 282,000 | | | Toshiba Corporation (Information Technology, Computers & Peripherals) | | | 1,535,214 | |
| | 63,500 | | | Toyota Motor Corporation (Consumer Discretionary, Automobiles) | | | 2,518,414 | |
| | 74,200 | | | Uni-Charm Corporation (Consumer Discretionary, Household Products) | | | 2,951,915 | |
| | 5,792 | | | Yahoo! Japan Corporation (Information Technology, Internet Software & Services) | | | 2,247,173 | |
| | | | | | | | 34,655,206 | |
| | | | | | | | |
| | | | | | | | | |
| Luxembourg: 0.24% | | | | |
| | 18,239 | | | ArcelorMittal (Materials, Metals & Mining) | | | 691,699 | |
| | | | | | | | |
| | |
| 14 Wells Fargo Advantage VT International Equity Fund | | Portfolio of Investments—December 31, 2010 |
| | | | | | | | | |
| Shares | | | Security Name | | Value | |
| Netherlands: 5.73% | | | | |
| | 38,795 | | | ASML Holding NV (Information Technology, Semiconductors & Semiconductor Equipment) | | $ | 1,498,227 | |
| | 132,493 | | | ING Groep NV (Financials, Diversified Financial Services) | | | 1,288,927 | |
| | 34,725 | | | Koninklijke Philips Electronics NV (Materials, Chemicals) | | | 1,063,557 | |
| | 107,567 | | | New World Resources NV (Materials, Metals & Mining) | | | 1,611,670 | |
| | 90,775 | | | Randstad Holdings NV (Industrials, Commercial Services & Supplies) | | | 4,791,454 | |
| | 81,195 | | | Unilever NV (Consumer Staples, Food Products) | | | 2,528,070 | |
| | 177,699 | | | USG People NV (Industrials, Commercial Services & Supplies) | | | 3,609,379 | |
| | | | | | | | 16,391,284 | |
| | | | | | | | |
| | | | | | | | | |
| Norway: 0.51% | | | | |
| | 89,713 | | | Telenor ASA (Telecommunication Services, Diversified Telecommunication Services) | | | 1,457,535 | |
| | | | | | | | |
| | | | | | | | | |
| Singapore: 0.42% | | | | |
| | 107,000 | | | DBS Group Holdings Limited (Financials, Commercial Banks) | | | 1,193,938 | |
| | | | | | | | |
| | | | | | | | | |
| South Korea: 1.08% | | | | |
| | 8,744 | | | Hyundai Motor Company Limited (Consumer Discretionary, Automobiles) | | | 1,336,756 | |
| | 2,083 | | | Samsung Electronics Company Limited (Information Technology, Semiconductors & Semiconductor Equipment) | | | 1,741,798 | |
| | | | | | | | 3,078,554 | |
| | | | | | | | |
| | | | | | | | | |
| Spain: 2.56% | | | | |
| | 153,229 | | | Banco Bilbao Vizcaya Argentaria SA (Financials, Commercial Banks) | | | 1,547,985 | |
| | 26,152 | | | Industria de Diseno Textil SA (Consumer Discretionary, Specialty Retail) | | | 1,958,076 | |
| | 73,949 | | | Repsol YPF SA (Energy, Oil, Gas & Consumable Fuels) | | | 2,060,356 | |
| | 77,568 | | | Telefonica SA (Telecommunication Services, Diversified Telecommunication Services) | | | 1,758,492 | |
| | | | | | | | 7,324,909 | |
| | | | | | | | |
| | | | | | | | | |
| Sweden: 0.42% | | | | |
| | 61,092 | | | Skanska AB (Industrials, Construction & Engineering) | | | 1,210,822 | |
| | | | | | | | |
| | | | | | | | | |
| Switzerland: 9.73% | | | | |
| | 57,349 | | | ABB Limited (Industrials, Electrical Equipment) | | | 1,277,625 | |
| | 44,512 | | | Compagnie Financiere Richemont SA (Consumer Discretionary, Textiles, Apparel & Luxury Goods) | | | 2,618,353 | |
| | 68,513 | | | Credit Suisse Group (Financials, Capital Markets) | | | 2,760,305 | |
| | 96,383 | | | Nestle SA (Consumer Staples, Food Products) | | | 5,643,817 | |
| | 57,952 | | | Novartis AG (Health Care, Pharmaceuticals) | | | 3,405,842 | |
| | 25,532 | | | Roche Holdings AG (Health Care, Pharmaceuticals) | | | 3,741,052 | |
| | 10,294 | | | Swatch Group AG Class B (Consumer Discretionary, Textiles, Apparel & Luxury Goods) | | | 4,588,812 | |
| | 107,186 | | | UBS AG (Financials, Capital Markets) | | | 1,759,685 | |
| | 7,808 | | | Zurich Financial Services AG (Financials, Insurance) | | | 2,022,564 | |
| | | | | | | | 27,818,055 | |
| | | | | | | | |
| | | | | | | | | |
| United Kingdom: 23.47% | | | | |
| | 51,304 | | | Anglo American plc (Materials, Metals & Mining) | | | 2,668,001 | |
| | 164,953 | | | Antofagasta plc (Materials, Metals & Mining) | | | 4,145,711 | |
| | 941,242 | | | Ashtead Group plc (Industrials, Trading Companies & Distributors) | | | 2,537,290 | |
| | 653,546 | | | Barclays plc (Financials, Commercial Banks) | | | 2,666,064 | |
| | 54,463 | | | BG Group plc (Health Care, Health Care Providers & Services)† | | | 1,100,475 | |
| | 116,176 | | | BHP Billiton plc (Materials, Metals & Mining) | | | 4,620,624 | |
| | 488,446 | | | BP plc (Energy, Oil, Gas & Consumable Fuels) | | | 3,545,330 | |
| | 311,406 | | | British Airways plc (Industrials, Airlines)†« | | | 1,323,023 | |
| | 141,843 | | | Burberry Group plc (Consumer Discretionary, Textiles, Apparel & Luxury Goods) | | | 2,485,696 | |
| | 171,746 | | | Cookson Group plc (Utilities, Multi-Utilities) | | | 1,763,259 | |
| | 159,318 | | | Experian Group Limited (Financials, Diversified Financial Services) | | | 1,982,173 | |
| | 1,350,516 | | | Game Group plc (Consumer Discretionary, Specialty Retail) | | | 1,473,912 | |
| | 129,495 | | | GlaxoSmithKline plc (Health Care, Pharmaceuticals) | | | 2,503,505 | |
| | |
| | | |
| Portfolio of Investments—December 31, 2010 | | Wells Fargo Advantage VT International Equity Fund 15 |
| | | | | | | | | |
| Shares | | | Security Name | | Value | |
| United Kingdom (continued) | | | | |
| | 883,597 | | | Hays plc (Industrials, Commercial Services & Supplies) | | $ | 1,775,746 | |
| | 514,150 | | | HSBC Holdings plc (Financials, Commercial Banks) | | | 5,219,288 | |
| | 95,074 | | | Intercontinental Hotels Group plc (Consumer Discretionary, Hotels, Restaurants & Leisure) | | | 1,842,496 | |
| | 39,589 | | | Intertek Group plc (Industrials, Commercial Services & Supplies) | | | 1,095,586 | |
| | 238,921 | | | Kingfisher plc (Consumer Discretionary, Specialty Retail) | | | 981,169 | |
| | 1,722,131 | | | Lloyds TSB Group plc (Financials, Commercial Banks) | | | 1,764,027 | |
| | 168,810 | | | Persimmon plc (Consumer Discretionary, Household Durables) | | | 1,096,982 | |
| | 71,740 | | | Rio Tinto plc (Materials, Metals & Mining) | | | 5,018,140 | |
| | 118,601 | | | Royal Dutch Shell plc Class A (Energy, Oil, Gas & Consumable Fuels) | | | 3,954,316 | |
| | 47,019 | | | Standard Chartered plc (Financials, Commercial Banks) | | | 1,264,917 | |
| | 113,893 | | | Travis Perkins plc (Industrials, Trading Companies & Distributors) | | | 1,878,696 | |
| | 1,156,645 | | | Vodafone Group plc (Telecommunication Services, Wireless Telecommunication Services) | | | 2,989,912 | |
| | 159,395 | | | WPP plc (Consumer Discretionary, Media) | | | 1,962,007 | |
| | 147,564 | | | Xstrata plc (Materials, Metals & Mining) | | | 3,463,656 | |
| | | | | | | | 67,122,001 | |
| | | | | | | | |
| | | | | | | | | |
| United States: 1.76% | | | | |
| | 212,969 | | | Monster Worldwide Incorporated (Information Technology, Internet Software & Services)†« | | | 5,032,457 | |
| | | | | | | | |
| | | | | | | | | |
| Total Common Stocks (Cost $207,285,634) | | | 275,674,041 | |
| | | | | | | | |
| | | | | | | | | | | | | |
| | | | | | | | Yield | | | |
| Preferred Stocks: 1.85% | | | | | | | | |
| Germany: 1.85% | | | | | | | | |
| | 61,825 | | | Fresenius AG (Healthcare, Healthcare Providers & Services) | | | 1.42 | % | | | 5,293,255 | |
| Total Preferred Stocks (Cost $3,303,063) | | | | | | | 5,293,255 | |
| | | | | | | | | | | | |
| | | | | | | | | | | | | |
| Short-Term Investments: 8.30% | | | | | | | | |
| | | | | | | | | | | | | |
| Investment Companies: 8.30% | | | | | | | | |
| | 4,564,754 | | | Wells Fargo Advantage Cash Investment Money Market Fund(l)(u) | | | 0.14 | | | | 4,564,754 | |
| | 19,165,760 | | | Wells Fargo Securities Lending Cash Investments LLC(v)(l)(u) | | | 0.27 | | | | 19,165,760 | |
| | | | | | | | | | | | |
| | | | | | | | | | | | | |
| Total Short-Term Investments (Cost $23,730,514) | | | | | | | 23,730,514 | |
| | | | | | | | | | | | |
| | | | | | | | | |
|
Total Investments in Securities
(Cost $234,319,211)* | | | 106.53 | % | | | 304,697,810 | |
| |
Other Assets and Liabilities, Net | | | (6.53 | ) | | | (18,690,214 | ) |
| | | | | | | |
| | | | | | | | | |
Total Net Assets | | | 100.00 | % | | $ | 286,007,596 | |
| | | | | | | |
| | | |
| « | | All or a portion of this security is on loan. |
| |
| † | | Non-income earning securities. |
| |
| (l) | | Investment in an affiliate. |
| |
| (v) | | Security represents investment of cash collateral received from securities on loan. |
| |
| (u) | | Rate shown is the 7-day annualized yield at period end. |
| |
| * | | Cost for federal income tax purposes is $236,697,347 and net unrealized appreciation (depreciation) consists of: |
| | | | | |
|
| Gross unrealized appreciation | | $ | 72,548,816 | |
| Gross unrealized depreciation | | | (4,548,353 | ) |
| | | | |
| Net unrealized appreciation | | $ | 68,000,463 | |
The accompanying notes are an integral part of these financial statements.
| | |
| 16 Wells Fargo Advantage VT International Equity Fund | | Statement of Assets and Liabilities—December 31, 2010 |
| | | | | |
|
Assets | | | | |
| Investments | | | | |
| In unaffiliated securities (including securities on loan), at value | | $ | 280,967,296 | |
| In affiliated securities, at value | | | 23,730,514 | |
| | | | |
| Total investments, at value (see cost below) | | | 304,697,810 | |
| Foreign currency, at value (see cost below) | | | 205,881 | |
| Receivable for investments sold | | | 1,695 | |
| Receivable for Fund shares sold | | | 222,495 | |
| Receivable for dividends | | | 867,056 | |
| Receivable for securities lending income | | | 3,158 | |
| | | | |
| Total assets | | | 305,998,095 | |
| | | | |
| | | | | |
Liabilities | | | | |
| Payable for investments purchased | | | 219,825 | |
| Payable for Fund shares redeemed | | | 303,508 | |
| Payable upon receipt of securities loaned | | | 19,165,760 | |
| Investment advisory fee payable | | | 88,735 | |
| Distribution fees payable | | | 48,953 | |
| Due to other related parties | | | 33,338 | |
| Accrued expenses and other liabilities | | | 130,380 | |
| | | | |
| Total liabilities | | | 19,990,499 | |
| | | | |
Total net assets | | $ | 286,007,596 | |
| | | | |
| | | | | |
NET ASSETS CONSIST OF | | | | |
| Paid-in capital | | $ | 209,583,242 | |
| Undistributed net investment income | | | 585,247 | |
| Accumulated net realized gains on investments | | | 5,376,023 | |
| Net unrealized gains on investments | | | 70,463,084 | |
| | | | |
Total net assets | | $ | 286,007,596 | |
| | | | |
| | | | | |
COMPUTATION OF NET ASSET VALUE PER SHARE 1 | | | | |
| Net assets — Class 1 | | $ | 67,659,401 | |
| Shares outstanding — Class 1 | | | 11,768,855 | |
| Net asset value per share — Class 1 | | $ | 5.75 | |
| Net assets — Class 2 | | $ | 218,348,195 | |
| Shares outstanding — Class 2 | | | 38,009,104 | |
| Net asset value per share — Class 2 | | $ | 5.74 | |
| | | | |
| | | | | |
| Total investments, at cost | | $ | 234,319,211 | |
| | | | |
| Securities on loan, at value | | $ | 18,532,591 | |
| | | | |
| Foreign currency, at cost | | $ | 192,921 | |
| | | | |
| | |
| 1. | | The Fund has an unlimited number of authorized shares. |
The accompanying notes are an integral part of these financial statements.
| | |
| Statement of Operation—For the Year Ended December 31, 20101 | | Wells Fargo Advantage VT International Equity Fund 17 |
| | | | | |
|
Investment income | | | | |
| Dividends* | | $ | 10,629,161 | |
| Income from affiliated securities | | | 14,863 | |
| Securities lending income, net | | | 456,618 | |
| | | | |
| Total investment income | | | 11,100,642 | |
| | | | |
| | | | | |
Expenses | | | | |
| Investment advisory fee | | | 2,711,729 | |
| Administration fees | | | | |
| Fund level | | | 477,662 | |
| Class 1 | | | 24,100 | |
| Class 2 | | | 73,928 | |
| Distribution fees | | | | |
| Class 2 | | | 1,183,719 | |
| Custody and accounting fees | | | 350,319 | |
| Professional fees | | | 65,310 | |
| Shareholder report expenses | | | 188,539 | |
| Trustees’ fees and expenses | | | 24,547 | |
| Transfer agent fees | | | 8 | |
| Other fees and expenses | | | 54,755 | |
| | | | |
| Total expenses | | | 5,154,616 | |
| | | | | |
| Less: Fee waivers and/or expense reimbursements | | | (515,353 | ) |
| | | | |
| Net expenses | | | 4,639,263 | |
| | | | |
| Net investment income | | | 6,461,379 | |
| | | | |
| | | | | |
NET REALIZED AND UNREALIZED GAINS (LOSSES) ON INVESTMENTS | | | | |
| | | | | |
Net realized gains (losses) on: | | | | |
| Unaffiliated securities | | | 66,686,579 | |
| Future transactions | | | (15,355,917 | ) |
| Forward foreign currency contract transactions | | | (36,625 | ) |
| | | | |
| Net realized gains on investments | | | 51,294,037 | |
| | | | |
| | | | | |
Net change in unrealized gains (losses) on: | | | | |
| Unaffiliated securities | | | (68,439,640 | ) |
| Forward foreign currency contract transactions | | | 255,773 | |
| | | | |
| Net change in unrealized gains (losses) on investments | | | (68,183,867 | ) |
| | | | |
| Net realized and unrealized gains (losses) on investments | | | (16,889,830 | ) |
| | | | |
Net decrease in net assets resulting from operations | | $ | (10,428,451 | ) |
| | | | |
|
| * Net of foreign withholding taxes of | | $ | 1,166,100 | |
| | |
| |
| 1. | | After the close of business on July 16, 2010, the Fund acquired the net assets of Evergreen VA International Equity Fund, which became the accounting and performance survivor in the transaction. The information for the period prior to July 19, 2010 is that of Evergreen VA International Equity Fund. |
The accompanying notes are an integral part of these financial statements.
| | |
| 18 Wells Fargo Advantage VT International Equity Fund | | Statements of Changes in Net Assets |
| | | | | | | | | |
| | | Year Ended | | Year Ended |
| | | December 31, 20101 | | December 31, 20091 |
| |
Operations | | | | | | | | |
| Net investment income | | $ | 6,461,379 | | | $ | 4,719,978 | |
| Net realized gains on investments | | | 51,294,037 | | | | 20,158,691 | |
| Net change in unrealized gains (losses) on investments | | | (68,183,867 | ) | | | 142,572,202 | |
| | | |
| Net increase (decrease) in net assets resulting from operations | | | (10,428,451 | ) | | | 167,450,871 | |
| | | |
| | | | | | | | | |
Distributions to shareholders from | | | | | | | | |
| Net investment income | | | | | | | | |
| Class 1 | | | (634,631 | ) | | | (2,183,758 | ) |
| Class 2 | | | (6,829,353 | ) | | | (3,545,799 | ) |
| Net realized gains | | | | | | | | |
| Class 1 | | | (2,275,564 | ) | | | 0 | |
| Class 2 | | | (14,614,363 | ) | | | 0 | |
| | | |
| Total distributions to shareholders | | | (24,353,911 | ) | | | (5,729,557 | ) |
| | | |
| | | | | | | | | | | | | | | | | |
| | | Shares | | | | | | Shares | | | | |
Capital share transactions | | | | | | | | | | | | | | | | |
| Proceeds from shares sold | | | | | | | | | | | | | | | | |
| Class 1 | | | 1,134,578 | | | | 8,695,259 | | | | 954,664 | | | | 8,954,470 | |
| Class 2 | | | 9,758,149 | | | | 75,995,758 | | | | 83,166,142 | | | | 730,867,045 | |
| | | |
| | | | | | | | 84,691,017 | | | | | | | | 739,821,515 | |
| | | |
| | | | | | | | | | | | | | | | | |
| Reinvestment of distributions | | | | | | | | | | | | | | | | |
| Class 1 | | | 285,379 | | | | 2,910,195 | | | | 297,921 | | | | 2,183,758 | |
| Class 2 | | | 2,088,525 | | | | 21,443,716 | | | | 485,726 | | | | 3,545,799 | |
| | | |
| | | | | | | | 24,353,911 | | | | | | | | 5,729,557 | |
| | | |
| | | | | | | | | | | | | | | | | |
| Payment for shares redeemed | | | | | | | | | | | | | | | | |
| Class 1 | | | (2,836,858 | ) | | | (20,254,823 | ) | | | (2,159,169 | ) | | | (19,266,378 | ) |
| Class 2 | | | (79,487,176 | ) | | | (745,184,963 | ) | | | (5,456,291 | ) | | | (55,438,906 | ) |
| | | |
| | | | | | | | (765,439,786 | ) | | | | | | | (74,705,284 | ) |
| | | |
| | | | | | | | | | | | | | | | | |
| Net asset value of shares issued in acquisition | | | | | | | | | | | | | | | | |
| Class 2 | | | | | | | 16,640,001 | | | | | | | | 0 | |
| | | |
| Net increase (decrease) in net assets resulting from capital share transactions | | | | | | | (639,754,857 | ) | | | | | | | 670,845,788 | |
| | | |
Total increase (decrease) in net assets | | | | | | | (674,537,219 | ) | | | | | | | 832,567,102 | |
| | | |
| | | | | | | | | | | | | | | | | |
Net assets | | | | | | | | | | | | | | | | |
| Beginning of period | | | | | | | 960,544,815 | | | | | | | | 127,977,713 | |
| | | |
| End of period | | | | | | $ | 286,007,596 | | | | | | | $ | 960,544,815 | |
| | | |
| Undistributed net investment income | | | | | | $ | 585,247 | | | | | | | $ | 1,800,906 | |
| | | |
| | |
| 1. | | After the close of business on July 16, 2010, the Fund acquired the net assets of Evergreen VA International Equity Fund, which became the accounting and performance survivor in the transaction. The information for the periods prior to July 19, 2010 are those of Evergreen VA International Equity Fund. |
The accompanying notes are an integral part of these financial statements.
This page is intentionally left blank.
| | |
| 20 Wells Fargo Advantage VT International Equity Fund4 | | Financial Highlights |
| | | | | | | | | | | | | | | | | | | | | |
| | | Beginning | | | | | | Net Realized | | Distributions | | |
| | | Net Asset | | Net | | and Unrealized | | from Net | | Distributions |
| | | Value Per | | Investment | | Gains (Losses) | | Investment | | from Net |
| | | Share | | Income | | on Investments | | Income | | Realized Gains |
| |
| Class 1 | | | | | | | | | | | | | | | | | | | | |
| January 1, 2010 to December 31, 2010 | | $ | 5.15 | | | | 0.053 | | | | 0.78 | | | | (0.05 | ) | | | (0.18 | ) |
| January 1, 2009 to December 31, 2009 | | $ | 4.64 | | | | 0.113 | | | | 0.55 | | | | (0.15 | ) | | | 0.00 | |
| January 1, 2008 to December 31, 2008 | | $ | 8.14 | | | | 0.203 | | | | (3.52 | ) | | | 0.00 | | | | (0.18 | ) |
| January 1, 2007 to December 31, 2007 | | $ | 7.82 | | | | 0.16 | | | | 1.02 | | | | (0.20 | ) | | | (0.66 | ) |
| January 1, 2006 to December 31, 2006 | | $ | 6.91 | | | | 0.18 | | | | 1.41 | | | | (0.28 | ) | | | (0.40 | ) |
| | | | | | | | | | | | | | | | | | | | | |
| Class 2 | | | | | | | | | | | | | | | | | | | | |
| January 1, 2010 to December 31, 2010 | | $ | 5.15 | | | | 0.063 | | | | 0.75 | | | | (0.04 | ) | | | (0.18 | ) |
| January 1, 2009 to December 31, 2009 | | $ | 4.64 | | | | 0.043 | | | | 0.62 | | | | (0.15 | ) | | | 0.00 | |
| January 1, 2008 to December 31, 2008 | | $ | 8.15 | | | | 0.183 | | | | (3.51 | ) | | | 0.00 | | | | (0.18 | ) |
| January 1, 2007 to December 31, 2007 | | $ | 7.84 | | | | 0.14 | | | | 1.01 | | | | (0.18 | ) | | | (0.66 | ) |
| January 1, 2006 to December 31, 2006 | | $ | 6.93 | | | | 0.17 | | | | 1.40 | | | | (0.26 | ) | | | (0.40 | ) |
| | |
| 1. | | Total return calculations would have been lower had certain expenses not been waived or reimbursed during the periods shown. 2. Calculated on the basis of the Fund as a whole without distinguishing between the classes of shares issued. |
| |
| 3. | | Calculated based upon average shares outstanding. |
| |
| 4. | | After the close of business on July 16, 2010, the Fund acquired the net assets of Evergreen VA International Equity Fund, which became the accounting and performance survivor in the transaction. The information for the periods prior to July 19, 2010 are those of Evergreen VA International Equity Fund. The per share information has been adjusted to give effect to this transaction. |
The accompanying notes are an integral part of these financial statements.
| | |
| Financial Highlights | | Wells Fargo Advantage VT International Equity Fund4 21 |
| | | | | | | | | | | | | | | | | | | | | | | | | | | | | |
| | | Ending | | | | | | | | | | |
| | | Net Asset | | Ratio to Average Net Assets | | | | | | Portfolio | | Net Assets at |
| | | Value Per | | Net Investment | | Gross | | Net | | Total | | Turnover | | End of Period |
| | | Share | | Income | | Expenses | | Expenses | | Return1 | | Rate2 | | (000’s omitted) |
| |
| | | | | | | | | | | | | | | | | | | | | | | | | | | | | |
| | | $ | 5.75 | | | | 1.04 | % | | | 0.85 | % | | | 0.66 | % | | | 16.79 | % | | | 60 | % | | $ | 67,659 | |
| | | $ | 5.15 | | | | 2.31 | % | | | 0.68 | % | | | 0.68 | % | | | 15.95 | % | | | 205 | % | | $ | 69,407 | |
| | | $ | 4.64 | | | | 3.02 | % | | | 0.67 | % | | | 0.67 | % | | | (41.49 | )% | | | 127 | % | | $ | 71,286 | |
| | | $ | 8.14 | | | | 2.01 | % | | | 0.63 | % | | | 0.63 | % | | | 15.00 | % | | | 58 | % | | $ | 190,766 | |
| | | $ | 7.82 | | | | 2.53 | % | | | 0.68 | % | | | 0.68 | % | | | 23.16 | % | | | 74 | % | | $ | 175,518 | |
| |
| | | | | | | | | | | | | | | | | | | | | | | | | | | | | |
| | | $ | 5.74 | | | | 1.22 | % | | | 0.97 | % | | | 0.89 | % | | | 16.50 | % | | | 60 | % | | $ | 218,348 | |
| | | $ | 5.15 | | | | 0.70 | % | | | 0.89 | % | | | 0.89 | % | | | 15.47 | % | | | 205 | % | | $ | 891,137 | |
| | | $ | 4.64 | | | | 2.74 | % | | | 0.92 | % | | | 0.92 | % | | | (41.60 | )% | | | 127 | % | | $ | 56,692 | |
| | | $ | 8.15 | | | | 1.75 | % | | | 0.88 | % | | | 0.88 | % | | | 14.73 | % | | | 58 | % | | $ | 118,843 | |
| | | $ | 7.84 | | | | 2.28 | % | | | 0.93 | % | | | 0.93 | % | | | 22.89 | % | | | 74 | % | | $ | 109,836 | |
| | |
| 22 Wells Fargo Advantage VT International Equity Fund | | Notes to Financial Statements |
1. ORGANIZATION
Wells Fargo Variable Trust (the “Trust”), a Delaware statutory trust organized on March 10, 1999, is an open-end management investment company registered under the Investment Company Act of 1940, as amended (the “1940 Act”). These financial statements report on Wells Fargo Advantage VT International Equity Fund (the “Fund”) (formerly, Wells Fargo Advantage VT International Core Fund) which is a diversified series of the Trust.
Effective at the close of business on July 16, 2010, the Fund acquired the net assets of Evergreen VA International Equity Fund. Evergreen VA International Equity Fund became the accounting and performance survivor in the transaction. As a result, the accounting and performance history of Evergreen VA International Equity Fund has been carried forward in the financial statements contained herein.
2. SIGNIFICANT ACCOUNTING POLICIES
The following significant accounting policies, which are consistently followed in the preparation of the financial statements of the Fund, are in conformity with U.S. generally accepted accounting principles which require management to make estimates and assumptions that affect the reported amounts of assets and liabilities, disclosure of contingent assets and liabilities at the date of the financial statements, and the reported amounts of revenues and expenses during the reporting period. Actual results could differ from those estimates. Management has considered the circumstances under which the Fund should recognize or make disclosures regarding events or transactions occurring subsequent to the balance sheet date through the date the financial statements are issued. Adjustments or additional disclosures, if any, have been included in these financial statements.
Securities valuation
Investments in securities are valued each business day as of the close of regular trading on the New York Stock Exchange, which is usually 4:00 p.m. (Eastern Time). Securities which are traded on a national or foreign securities exchange are valued at the last reported sales price, except that securities listed on The Nasdaq Stock Market, Inc. (“Nasdaq”) are valued at the Nasdaq Official Closing Price (“NOCP”), and if no NOCP is available, then at the last reported sales price. If no sales price is shown on the Nasdaq, the bid price will be used. In the absence of any sale of securities listed on the Nasdaq, and in the case of other securities, including U.S. Government obligations, but excluding debt securities maturing in 60 days or less, the price will be deemed “stale” and the valuations will be determined in accordance with the Fund’s Fair Valuation Procedures.
Securities denominated in foreign currencies are translated into U.S. dollars using the closing rates of exchange in effect on the day of valuation.
Many securities markets and exchanges outside the U.S. close prior to the close of the New York Stock Exchange and therefore may not fully reflect trading or events that occur after the close of the principal exchange in which the foreign investments are traded but before the close of the New York Stock Exchange. If such trading or events are expected to materially affect the value of the investments, then those investments are fair valued following procedures approved by the Board of Trustees. These procedures take into account multiple factors including movements in U.S. securities markets after foreign exchanges close. Depending on market activity, such fair valuations may be frequent. Such fair value pricing may result in NAVs that are higher or lower than NAVs based on the closing price or latest quoted bid price.
Investments in open-end mutual funds and non-registered investment companies are generally valued at net asset value.
Certain investments which are not valued using any of the methods discussed above, are valued at their fair value, as determined by procedures established in good faith and approved by the Board of Trustees.
The valuation techniques used by the Fund to measure fair value are consistent with the market approach, income approach and/or cost approach, where applicable, for each security type.
Foreign currency translation
The accounting records of the Fund are maintained in U.S. dollars. Assets, including investment securities, and liabilities denominated in foreign currency are translated into U.S. dollars at the prevailing rates of exchange at the date of valuation. Purchases and sales of securities, and income and expenses are translated at the prevailing rate of exchange on the respective dates of such transactions. Reported net realized foreign exchange gains or losses arise from sales of foreign currencies, currency gains or losses realized between the trade and settlement dates on securities transactions, and the difference between the amounts of dividends, interest and foreign withholding taxes recorded and the U.S. dollar
| | |
| Notes to Financial Statements | | Wells Fargo Advantage VT International Equity Fund 23 |
equivalent of the amounts actually paid or received. Net unrealized foreign exchange gains and losses arise from changes in the fair value of assets and liabilities other than investments in securities resulting in changes in exchange rates.
The changes in net assets arising from changes in exchange rates and the changes in net assets resulting from changes in market prices of securities are not separately presented. Such changes are recorded with net realized and unrealized gains or losses from investments. Gains and losses from certain foreign currency transactions are treated as ordinary income for U.S. federal income tax purposes.
Forward foreign currency contracts
The Fund may be subject to foreign currency exchange rate risk in the normal course of pursuing its investment objectives. A forward foreign currency contract is an agreement between two parties to purchase or sell a specific currency for an agreed-upon price at a future date. The Fund enters into forward foreign currency contracts to facilitate transactions in foreign-denominated securities and to attempt to minimize the risk to the Fund from adverse changes in the relationship between currencies. Forward foreign currency contracts are recorded at the forward rate and marked-to-market daily. When the contracts are closed, realized gains and losses arising from such transactions are recorded as realized gains or losses on foreign currency related transactions. The Fund could be exposed to risks if the counterparties to the contracts are unable to meet the terms of their contracts or if the value of the foreign currency changes unfavorably. The Fund’s maximum risk of loss from counterparty credit risk is the unrealized gains or losses on the contracts. This risk is mitigated by having a master netting arrangement between the Fund and the counterparty.
Security loans
The Fund may lend its securities from time to time in order to earn additional income in the form of fees or interest on securities received as collateral or the investment of any cash received as collateral. The Fund continues to receive interest or dividends on the securities loaned. The Fund receives collateral in the form of cash or securities with a value at least equal to the value of the securities on loan. The value of the loaned securities is determined at the close of each business day and any additional required collateral is delivered to the Fund on the next business day. In the event of default or bankruptcy by the borrower, the Fund could experience delays and costs in recovering the loaned securities or in gaining access to the collateral. In addition, the investment of any cash collateral received may lose all or part of its value. The Fund has the right under the lending agreement to recover the securities from the borrower on demand.
The Fund lends its securities through an unaffiliated securities lending agent. Cash collateral received in connection with its securities lending transactions is invested in Wells Fargo Securities Lending Cash Investments, LLC (the “Cash Collateral Fund”). The Cash Collateral Fund is exempt from registration under Section 3(c)(7) of the 1940 Act and is managed by Wells Fargo Funds Management LLC (“Funds Management”) and is sub-advised by Wells Capital Management Incorporated (“Wells Capital Management”). Funds Management receives an investment advisory fee starting at 0.05% and declining to 0.01% as the average daily net assets of the Cash Collateral Fund increase. All of the fees received by Funds Management are paid to Wells Capital Management for its services as sub-adviser. The Cash Collateral Fund seeks to provide a positive return compared to the daily Fed Funds Open rate by investing in high-quality, U.S. dollar-denominated short-term money market instruments. Cash Collateral Fund investments are fair valued based upon the amortized cost valuation technique. Income earned from investment in the Cash Collateral Fund is included in securities lending income on the Statement of Operations.
Futures contracts
The Fund may be subject to equity price risk in the normal course of pursuing its investment objectives. The Fund may buy and sell futures contracts in order to gain exposure to, or protect against changes in, security values and interest rates. The primary risks associated with the use of futures contracts are the imperfect correlation between changes in market values of securities held by the Fund and the prices of futures contracts, and the possibility of an illiquid market.
Futures contracts are valued based upon their quoted daily settlement prices. The aggregate principal amounts of the contracts are not recorded in the financial statements. Fluctuations in the value of the contracts are recorded in the Statement of Assets and Liabilities as an asset or liability and in the Statement of Operations as unrealized gains or losses until the contracts are closed, at which point they are recorded as net realized gains or losses on futures contracts. With futures contracts, there is minimal counterparty risk to the Fund since futures are exchange traded and the exchange’s clearinghouse, as counterparty to all exchange traded futures, guarantees the futures against default.
| | |
| 24 Wells Fargo Advantage VT International Equity Fund | | Notes to Financial Statements |
Security transactions and income recognition
Securities transactions are recorded on a trade date basis. Realized gains or losses are reported on the basis of identified cost of securities delivered.
Dividend income is recognized on the ex-dividend date, except for certain dividends from foreign securities, which are recorded as soon as the Fund is informed of the ex-dividend date. Dividend income from foreign securities is recorded net of foreign taxes withheld where recovery of such taxes is not assured.
Distributions to shareholders
Distributions to shareholders from net investment income and net realized gains, if any, are recorded on the ex-dividend date. Such distributions are determined in conformity with income tax regulations, which may differ from generally accepted accounting principles.
The timing and character of distributions made during the period from net investment income or net realized gains may differ from their ultimate characterization for federal income tax purposes. To the extent that these differences are permanent in nature, such amounts are reclassified within the capital accounts based on their federal tax-basis treatment. Temporary differences do not require reclassifications. At December 31, 2010, as a result of permanent book-to-tax differences, the following reclassification adjustments were made on the Statement of Assets and Liabilities:
| | | | | | | | | | | |
| Undistributed | | Accumulated | | |
| Net Investment | | Net Realized | | |
| Income | | Gains on Investment | | Paid-in Capital |
| $ | (383,484 | ) | | $ | 6,139,862 | | | $ | (5,756,378 | ) |
Federal and other taxes
The Fund intends to continue to qualify as a regulated investment company by distributing substantially all of its investment company taxable income and any net realized capital gains (after reduction for capital loss carryforwards) sufficient to relieve it from all, or substantially all, federal income taxes. Accordingly, no provision for federal income taxes was required.
The Fund’s income and federal excise tax returns and all financial records supporting those returns for the prior three fiscal years are subject to examination by the federal and Delaware revenue authorities.
Under the recently enacted Regulated Investment Company Modernization Act of 2010, the Fund will be permitted to carry forward capital losses incurred in taxable years beginning after December 22, 2010 for an unlimited period. However, any losses incurred during those future taxable years will be required to be utilized prior to the losses incurred in pre-enactment taxable years. As a result of this ordering rule, pre-enactment capital loss carryforwards may be more likely to expire unused. Additionally, post-enactment capital losses that are carried forward will retain their character as either short-term or long-term capital losses rather than being considered all short-term as under previous law.
As of December 31, 2010, the Fund had estimated net capital loss carryforwards, which are available to offset future net realized capital gains, in the amount of $4,670,848 expiring in 2017.
Class allocations
The separate classes of shares offered by the Fund differ principally in distribution and administration fees. Shareholders of each class bear certain expenses that pertain to that particular class. All shareholders bear the common expenses of a Fund, earn income from the portfolio, and are allocated unrealized gains and losses pro rata based on the average daily net assets of each class, without distinction between share classes. Dividends are determined separately for each class based on income and expenses allocable to each class. Realized gains and losses are allocated to each class pro rata based upon the net assets of each class on the date realized. Differences in per share dividend rates generally result from the relative weightings of pro rata income and realized gain allocations and from differences in separate class expenses, including distribution, shareholder servicing, and administration fees.
| | |
| Notes to Financial Statements | | Wells Fargo Advantage VT International Equity Fund 25 |
3. FAIR VALUATION MEASUREMENTS
Fair value measurements of investments are determined within a framework that has established a fair value hierarchy based upon the various data inputs utilized in determining the value of the Fund’s investments. The three-level hierarchy gives the highest priority to unadjusted quoted prices in active markets for identical assets or liabilities (Level 1) and the lowest priority to unobservable inputs (Level 3). The Fund’s investments are classified within the fair value hierarchy based on the lowest level of input that is significant to the fair value measurement. The inputs are summarized into three broad levels as follows:
| § | | Level 1 — quoted prices in active markets for identical securities |
| |
| § | | Level 2 — other significant observable inputs (including quoted prices for similar securities, interest rates, prepayment speeds, credit risk, etc.) |
| |
| § | | Level 3 — significant unobservable inputs (including the Fund’s own assumptions in determining the fair value of investments) |
The inputs or methodologies used for valuing securities are not necessarily an indication of the risk associated with investing in those securities.
As of December 31, 2010, the inputs used in valuing the Fund’s assets, which are carried at fair value, were as follows:
| | | | | | | | | | | | | | | | | |
| | | | | | | Significant Other | | Significant | | |
| | | | | | | Observable | | Unobservable | | |
| | | Quoted Prices | | Inputs | | Inputs | | |
| Investments in Securities | | (Level 1) | | (Level 2) | | (Level 3) | | Total |
Equity securities | | | | | | | | | | | | | | | | |
Common stocks | | $ | 275,674,041 | | | $ | 0 | | | $ | 0 | | | $ | 275,674,041 | |
Preferred stocks | | | 5,293,255 | | | | 0 | | | | 0 | | | | 5,293,255 | |
| | | | | | | | | | | | | | | | | |
Short-term investments | | | | | | | | | | | | | | | | |
Investment companies | | | 4,564,754 | | | | 19,165,760 | | | | 0 | | | | 23,730,514 | |
| | | $ | 285,532,050 | | | $ | 19,165,760 | | | $ | 0 | | | $ | 304,697,810 | |
Further details on the major security types listed above can be found in the Fund’s Portfolio of Investments.
At the end of the period, foreign securities valued in the amount of $194,173,484 in common stocks and $5,293,255 in preferred stocks were transferred out of Level 2 and into Level 1 since adjustments to prices of foreign securities due to movements against a specified benchmark were not necessary at December 31, 2010. Transfers in and transfers out are recognized at the end of the reporting period.
4. TRANSACTIONS WITH AFFILIATES AND OTHER EXPENSES
Investment advisory fees
The Trust has entered into an investment advisory contract with Funds Management, an indirect wholly owned subsidiary of Wells Fargo & Company (“Wells Fargo”). The investment adviser is responsible for implementing investment policies and guidelines and for supervising the investment sub-adviser, who is responsible for day-to-day portfolio management of the Fund.
Pursuant to the contract, Funds Management is paid an annual investment advisory fee starting at 0.75% and declining to 0.60% as the average daily net assets of the Fund increase. Prior to July 19, 2010, the predecessor fund, Evergreen VA International Equity Fund, paid an investment advisory fee to Evergreen Investment Management Company, LLC (“EIMC”), an affiliate of Funds Management, an annual fee which started at 0.66% and declined to 0.36% as the aggregate average daily net assets of the Fund and its retail counterpart, Evergreen International Equity Fund, increased. For the year ended December 31, 2010, the investment advisory fee was equivalent to an annual rate of 0.50% of the Fund’s average daily net assets.
Funds Management may retain the services of certain investment sub-advisers to provide daily portfolio management to the Fund. The fees related to investment sub-advisory services are borne directly by the investment adviser and do not increase the overall fees paid by the Fund to the investment adviser. Wells Capital Management Incorporated, an affiliate of Funds Management, is the investment sub-adviser to the Fund and is paid a fee by the investment adviser at an annual rate starting at 0.45% and declining to 0.40% as the average daily net assets of the Fund increase.
| | |
| 26 Wells Fargo Advantage VT International Equity Fund | | Notes to Financial Statements |
Administration and transfer agent fees
The Trust has entered into an Administration Agreement with Funds Management. Under this Agreement, for providing administrative services, which includes paying fees and expenses for services provided by the transfer agent, sub-transfer agents, omnibus account servicers and record-keepers, Funds Management is entitled to receive the following annual fees:
| | | | | | | | | |
| | | | | | | Administration Fees |
| | | | | | | (% of Average |
| | | Average Daily Net Assets | | Daily Net Assets) |
| Fund level | | First $5 billion | | | 0.05 | % |
| | | Next $5 billion | | | 0.04 | |
| | | Over $10 billion | | | 0.03 | |
| Class 1 and Class 2 | | All asset levels | | | 0.08 | |
Prior to July 19, 2010, the predecessor fund paid EIMC a fund level administrator fee at an annual rate determined by applying percentage rates to the aggregate average daily net assets of the Evergreen funds (excluding money market funds) which started at 0.10% and declined to 0.05% as the aggregate average daily net assets of the Evergreen funds (excluding money market funds) increased.
Funds Management and/or EIMC has contractually waived and/or reimbursed investment advisory and administration fees to the extent necessary to maintain certain net operating expense ratios for the Fund. Waiver of fees and/or reimbursement of expenses by Funds Management and/or EIMC were made first from fund level expenses on a proportionate basis and then from class specific expenses.
Prior to July 19, 2010, the predecessor fund paid Evergreen Service Company, LLC, an affiliate of EIMC and a subsidiary of Wells Fargo, a transfer and dividend disbursing agent fee.
Distribution fees
The Trust has adopted a Distribution Plan for Class 2 shares of the Fund pursuant to Rule 12b-1 under the 1940 Act. Distribution fees are charged to the Class 2 shares and paid to Wells Fargo Funds Distributor, LLC, the principal underwriter, at an annual rate of 0.25% of its average daily net assets. Prior to July 19, 2010, Class 2 shares of the predecessor fund also paid distribution fees at an annual rate of 0.25% of its average daily net assets.
5. INVESTMENT PORTFOLIO TRANSACTIONS
Purchases and sales of investments, exclusive of short-term securities (securities with maturities of one year or less at purchase date) for the year ended December 31, 2010 were $297,779,286 and $978,455,434, respectively.
6. DERIVATIVE TRANSACTIONS
During the year ended December 31, 2010, the Fund entered into long futures contracts to gain market exposure.
As of December 31, 2010, the Fund did not have any open futures contracts but had an average contract amount of $13,818,138 in long futures contracts during the year ended December 31, 2010.
During the year ended December 31, 2010, the Fund entered into forward foreign currency exchange contracts for hedging purposes.
As of December 31, 2010, the Fund did not have any open forward foreign currency exchange contracts but had average market values of $39,214,414 and $59,401,500 in forward foreign currency exchange contracts to buy and forward foreign currency exchange contracts to sell, respectively, during the year ended December 31, 2010.
The fair value, realized gains or losses and change in unrealized gains or losses on derivative instruments are reflected in the appropriate financial statements.
| | |
| Notes to Financial Statements | | Wells Fargo Advantage VT International Equity Fund 27 |
7. ACQUISITION
| After the close of business July 16, 2010, the Fund (named Wells Fargo Advantage VT International Core Fund at the time of the reorganization), which is the legal survivor, acquired the net assets of Evergreen VA International Equity Fund, the accounting and performance survivor. The purpose of the transaction was to combine two funds with similar investment objectives and strategies. The acquisition was accomplished by a tax-free exchange of all of the shares of Evergreen VA International Equity Fund. Shareholders holding Class 1 and Class 2 shares of Evergreen VA International Equity Fund received Class 1 and Class 2, respectively, of the Fund in the reorganization. The exchange ratios and number of shares issued to the Evergreen VA International Equity Fund were as follows: |
| | | | | | | | | |
| Acquired Fund | | Exchange Ratio | | Number of Shares Issued |
| Evergreen VA International Equity Fund | | | 2.07 | | | 12,919,350 Class 1 |
| | | | 2.06 | | | 35,012,685 Class 2 |
The investment portfolio of the Fund with a fair value of $16,596,518, identified cost of $15,909,494 and unrealized gains of $687,024 at July 16, 2010 was the principal assets acquired by the accounting and performance survivor. The shares and net assets of the Fund immediately prior to the acquisition were 3,526,065 shares and $16,640,001, respectively. The aggregate net assets of Evergreen VA International Equity Fund immediately prior to the acquisition was $226,195,623. The aggregate net assets of the Fund immediately after the acquisition was $242,835,624. For financial reporting purposes, assets received and shares issued by the Fund were recorded at fair value; however, the cost basis of the investments received from the Fund was carried forward to align ongoing reporting the Fund’s realized and unrealized gains and losses with amounts distributable to shareholders for tax purposes.
Assuming the acquisition had been completed January 1, 2010, the beginning of the annual reporting period for the Fund, the pro forma results of operations for the year ended December 31, 2010 would have been:
| | | | | |
|
Net investment income | | $ | 6,329,569 | |
Net realized and unrealized losses on investments | | $ | (18,715,027 | ) |
Net decrease in net assets resulting from operations | | $ | (12,385,458 | ) |
Because the combined investment portfolios have been managed as a single integrated portfolio since the acquisition was completed, it is not practicable to separate the amounts of revenue and earnings of the Fund that have been included in the Statement of Operations since July 19, 2010.
8. BANK BORROWINGS
The Trust and Wells Fargo Funds Trust (excluding the money market funds) are parties to a $125,000,000 revolving credit agreement with State Street Bank and Trust Company, whereby the Fund is permitted to use bank borrowings for temporary or emergency purposes, such as to fund shareholder redemption requests. Interest under the credit agreement is charged to the Fund based on a borrowing rate equal to the higher of the Federal Funds rate in effect on that day plus 1.25% or the overnight LIBOR rate in effect on that day plus 1.25%. In addition, under the credit agreement, the Fund pays an annual commitment fee equal to 0.125% of the unused balance, which is allocated pro rata. Prior to September 7, 2010, the annual commitment fee paid by the Fund was 0.15% of the unused balance.
For the year ended December 31, 2010, there were no borrowings by the Fund under the agreement.
9. DISTRIBUTIONS TO SHAREHOLDERS
The tax character of distributions paid during the years ended December 31, 2010 and December 31, 2009 were as follows: Year ended December 31,
| | | | | | | | | |
| | | Year ended December 31, |
| | | 2010 | | 2009 |
| Ordinary Income | | $ | 7,463,984 | | | $ | 5,729,557 | |
| Long-term Capital Gain | | | 16,889,927 | | | | 0 | |
| | |
| 28 Wells Fargo Advantage VT International Equity Fund | | Notes to Financial Statements |
As of December 31, 2010, the components of distributable earnings on a tax basis were as follows:
| | | | | | | | | | | | | | | |
| Undistributed | | Undistributed | | | | |
| Ordinary | | Long-Term | | Unrealized | | Capital Loss |
| Income | | Gain | | Gains (Losses) | | Carryforward |
| $ | 2,216,976 | | | $ | 10,807,591 | | | $ | 68,083,669 | | | $ | (4,670,848 | ) |
10. INDEMNIFICATION
Under the Trust’s organizational documents, the officers and directors are indemnified against certain liabilities that may arise out of performance of their duties to the Trust. Additionally, in the normal course of business, the Trust may enter into contracts with service providers that contain a variety of indemnification clauses. The Trust’s maximum exposure under these arrangements is dependent on future claims that may be made against the Fund and, therefore, cannot be estimated.
| | |
| Report of Independent Registered Public Accounting Firm | | Wells Fargo Advantage VT International Equity Fund 29 |
BOARD OF TRUSTEES AND SHAREHOLDERS OF
WELLS FARGO VARIABLE TRUST:
We have audited the accompanying statement of assets and liabilities, including the portfolio of investments, of the Wells Fargo Advantage VT International Equity Fund (the “Fund”), one of the funds constituting the Wells Fargo Variable Trust, as of December 31, 2010, and the related statement of operations for the year then ended, statements of changes in net assets for each of the years in the two year period then ended, and the financial highlights for each of the years in the five year period then ended. These financial statements and financial highlights are the responsibility of the Fund’s management. Our responsibility is to express an opinion on these financial statements and financial highlights based on our audits.
We conducted our audits in accordance with the standards of the Public Company Accounting Oversight Board (United States). Those standards require that we plan and perform the audit to obtain reasonable assurance about whether the financial statements and financial highlights are free of material misstatement. An audit includes examining, on a test basis, evidence supporting the amounts and disclosures in the financial statements. Our procedures included confirmation of securities owned as of December 31, 2010, by correspondence with custodian and brokers, or by other appropriate auditing procedures. An audit also includes assessing the accounting principles used and significant estimates made by management, as well as evaluating the overall financial statement presentation. We believe that our audits provide a reasonable basis for our opinion.
In our opinion, the financial statements and financial highlights referred to above present fairly, in all material respects, the financial position of the Wells Fargo Advantage VT International Equity Fund as of December 31, 2010, the results of its operations for the year then ended, changes in its net assets for each of the years in the two year period then ended, and the financial highlights for each of the years in the five year period then ended, in conformity with U.S. generally accepted accounting principles.
Boston, Massachusetts
February 25, 2011
| | |
| 30 Wells Fargo Advantage VT International Equity Fund | | Other Information (Unaudited) |
PROXY VOTING INFORMATION
A description of the policies and procedures that the Fund uses to determine how to vote proxies relating to portfolio securities is available without charge, upon request, by calling 1-800-222-8222, visiting our Web site at www.wellsfargo.com/advantagefunds, or visiting the SEC Web site at www.sec.gov. Information regarding how the Fund voted proxies relating to portfolio securities during the most recent 12-month period ended June 30 is available without charge on the Fund’s Web site at www.wellsfargo.com/advantagefunds or by visiting the SEC Web site at www.sec.gov.
TAX INFORMATION
Pursuant to Section 853 of the Internal Revenue Code, the Fund designates the following amounts as foreign taxes paid for the year ended December 31, 2010. Foreign taxes paid for purposes of Section 853 may be less than actual foreign taxes paid for financial statement purposes.
| | | | | | | |
| Foreign Source Income* | | Creditable Foreign Taxes Paid |
| $ | 1,561,662 | | | $ | 122,453 | |
| | |
| * | | The Fund did not derive any income from ineligible foreign sources as defined under Section 901(j) of the Internal Revenue Code. |
| | |
| Other Information (Unaudited) | | Wells Fargo Advantage VT International Equity Fund 31 |
PORTFOLIO HOLDINGS INFORMATION
The complete portfolio holdings for the Fund are publicly available on the Fund’s Web site (www.wellsfargo.com/advantagefunds) on a monthly, 30-day or more delayed basis. In addition, top ten holdings information for the Fund is publicly available on the Fund’s Web site on a monthly, seven-day or more delayed basis. The Fund files its complete schedule of portfolio holdings with the SEC for the first and third quarters of each fiscal year on Form N-Q, which is available without charge by visiting the SEC Web site at www.sec.gov. In addition, the Fund’s Form N-Q may be reviewed and copied at the SEC’s Public Reference Room in Washington, DC, and at regional offices in New York City, at 233 Broadway, and in Chicago, at 175 West Jackson Boulevard, Suite 900. Information about the Public Reference Room may be obtained by calling 1-800-SEC-0330.
BOARD OF TRUSTEES
The following table provides basic information about the Board of Trustees (the “Trustees”) of the Wells Fargo Variable Trust (the “Trust”) and Officers of the Trust. This table should be read in conjunction with the Prospectus and the Statement of Additional Information1 of the Fund. Each of the Trustees and Officers listed below acts in identical capacities for the Wells Fargo Advantage family of funds, which consists of 152 funds comprising the Trust, Wells Fargo Funds Trust, Wells Fargo Master Trust and four closed-end funds (collectively the “Fund Complex”). All of the Trustees are also Members of the Audit and Governance Committees of each Trust in the Fund Complex. The mailing address of each Trustee and Officer is 525 Market Street, 12th Floor, San Francisco, CA 94105. Each Trustee and Officer serves an indefinite term, however, each Trustee serves such term until reaching the mandatory retirement age established by the Trustees.
Independent Trustees
| | | | | | | |
| Name and | | Position Held and | | | | |
| Year of Birth | | Length of Service | | Principal Occupations During Past Five Years | | Other Directorships |
Peter G. Gordon
(Born 1942) | | Trustee, since 1998; Chairman, since 2005 (Lead Trustee since 2001) | | Co-Founder, Chairman, President and CEO of Crystal Geyser. Water Company. Trustee Emeritus, Colby College | | Asset Allocation
Trust |
| | | | | | | |
Isaiah Harris, Jr.
(Born 1952) | | Trustee, since 2009 | | Retired. Prior thereto, President and CEO of BellSouth Advertising and Publishing Corp. from 2005 to 2007, President and CEO of BellSouth Enterprises from 2004 to 2005 and President of BellSouth Consumer Services from 2000 to 2003. Emeritus member of the Iowa State University Foundation Board of Governors. Emeritus Member of the Advisory Board of Iowa State University School of Business. Mr. Harris is a certified public accountant. | | CIGNA Corporation; Deluxe Corporation; Asset Allocation Trust |
| | | | | | | |
Judith M. Johnson
(Born 1949) | | Trustee, since 2008 | | Retired. Prior thereto, Chief Executive Officer and Chief Investment Officer of Minneapolis Employees Retirement Fund from 1996 to 2008. Ms. Johnson is an attorney, certified public accountant and a certified managerial accountant. | | Asset Allocation
Trust |
| | | | | | | |
Leroy Keith, Jr.
(Born 1939) | | Trustee, since 2010 | | Chairman, Bloc Global Services (development and construction), Trustee of the Evergreen Funds from 1983 to 2010. Former Managing Director, Almanac Capital Management (commodities firm), former Partner, Stonington Partners, Inc. (private equity fund), former Director, Obagi Medical Products Co. and former Director, Lincoln Educational Services. | | Trustee, Virtus Fund Complex (consisting of 45 portfolios as of 12/31/10); Director, Diversapack Co. |
| | | | | | | (packaging |
| | | | | | | company); Asset |
| | | | | | | Allocation Trust |
| | | | | | | |
David F. Larcker
(Born 1951) | | Trustee, since 2009 | | James Irvin Miller Professor of Accounting at the Graduate School of Business, Stanford University, Director of Corporate Governance Research Program and Co-Director of The Rock Center for Corporate Governance since 2006. From 2005 to 2008, Professor of Accounting at the Graduate School of Business, Stanford University. Prior thereto, Ernst & Young Professor of Accounting at The Wharton School, University of Pennsylvania from 1985 to 2005. | | Asset Allocation
Trust |
| | |
| 32 Wells Fargo Advantage VT International Equity Fund | | Other Information (Unaudited) |
| | | | | | | |
| Name and | | Position Held and | | | | |
| Year of Birth | | Length of Service | | Principal Occupations During Past Five Years | | Other Directorships |
Olivia S. Mitchell
(Born 1953) | | Trustee, since 2006 | | International Foundation of Employee Benefit Plans Professor and Chair of the Department of Insurance and Risk Management, Wharton School of the University of Pennsylvania since 1993. Director of Wharton’s Pension Research Council and Boettner Center on Pensions & Retirement Research, and Research Associate at the National Bureau of Economic Research. Previously, Cornell University Professor from 1978 to 1993. | | Asset Allocation
Trust |
| | | | | | | |
Timothy J. Penny
(Born 1951) | | Trustee, since 1996 | | President and CEO of Southern Minnesota Initiative Foundation, a non-profit organization, since 2007 and Senior Fellow at the Humphrey Institute Policy Forum at the University of Minnesota since 1995. Member of the Board of Trustees of NorthStar Education Finance, Inc., a non-profit organization, since 2007. | | Asset Allocation
Trust |
| | | | | | | |
Michael S. Scofield
(Born 1943) | | Trustee, since 2010 | | Currently serves on the Investment Company Institute’s Board of Governors and Executive Committee as well the Independent Director’s Counsel Board of Governors and Executive Committee. Former Chairman of the Independent Directors Counsel. Trustee of the Evergreen Funds from 1984 to 2010. Retired Attorney, Law Offices of Michael S. Scofield and former Director and Chairman, Branded Media Corporation (multi-media branding company). | | Asset Allocation
Trust |
| | | | | | | |
Donald C. Willeke
(Born 1940) | | Trustee, since 1996 | | Principal of the law firm of Willeke & Daniels. General Counsel of the Minneapolis Employees Retirement Fund from 1984 until its consolidation into the Minnesota Public Employees Retirement Association on June 30, 2010. | | Asset Allocation
Trust |
Officers
| | | | | | | |
| Name and | | Position Held and | | | | |
| Year of Birth | | Length of Service | | Principal Occupations During Past Five Years | | |
Karla M. Rabusch
(Born 1959) | | President, since 2003 | | Executive Vice President of Wells Fargo Bank, N.A. and President of Wells Fargo Funds Management, LLC since 2003. Senior Vice President and Chief Administrative Officer of Wells Fargo Funds Management, LLC from 2001 to 2003. | | |
| | | | | | | |
C. David Messman
(Born 1960) | | Secretary, since 2000; Chief Legal Counsel, since 2003 | | Senior Vice President and Secretary of Wells Fargo Funds Management, LLC since 2001. Vice President and Managing Counsel of Wells Fargo Bank, N.A. since 1996. | | |
| | | | | | | |
Kasey Phillips
(Born 1970) | | Treasurer, since 2009 | | Senior Vice President of Wells Fargo Funds Management, LLC since 2009. Senior Vice President of Evergreen Investment Management Company, LLC from 2006 to 2010. Treasurer of the Evergreen Funds from 2005 to 2010. Vice President and Assistant Vice President of Evergreen Investment Services, Inc. from 1999 to 2006. | | |
| | | | | | | |
David Berardi
(Born 1975) | | Assistant Treasurer,
since 2009 | | Vice President of Wells Fargo Funds Management, LLC since 2009. Vice President of Evergreen Investment Management Company, LLC from 2008 to 2010. Assistant Vice President of Evergreen Investment Services, Inc. from 2004 to 2008. Manager of Fund Reporting and Control for Evergreen Investment Management Company, LLC from 2004 to 2010. | | |
| | | | | | | |
Jeremy DePalma
(Born 1974) | | Assistant Treasurer,
since 2009 | | Senior Vice President of Wells Fargo Funds Management, LLC since 2009. Senior Vice President of Evergreen Investment Management Company, LLC from 2008 to 2010. Vice President, Evergreen Investment Services, Inc. from 2004 to 2007. Assistant Vice President, Evergreen Investment Services, Inc. from 2000 to 2004 and the head of the Fund Reporting and Control Team within Fund Administration from 2005 to 2010. | | |
| | |
| Other Information (Unaudited) | | Wells Fargo Advantage VT International Equity Fund 33 |
| | | | | |
| Name and | | Position Held and | | |
| Year of Birth | | Length of Service | | Principal Occupations During Past Five Years |
Debra Ann Early
(Born 1964) | | Chief Compliance Officer,
since 2007 | | Chief Compliance Officer of Wells Fargo Funds Management, LLC since 2007. Chief Compliance Officer of Parnassus Investments from 2005 to 2007. Chief Financial Officer of Parnassus Investments from 2004 to 2007 and Senior Audit Manager of PricewaterhouseCoopers LLP from 1998 to 2004. |
| | |
| 1. | | The Statement of Additional Information includes additional information about the Fund’s Trustees and is available, without charge, upon request, by calling 1-800-222-8222 or by visiting the Fund’s Web site at www.wellsfargo.com/advantagefunds. |
| | |
| 34 Wells Fargo Advantage VT International Equity Fund | | List of Abbreviations |
The following is a list of common abbreviations for terms and entities which may have appeared in this report.
| | | |
| ABAG | | — Association of Bay Area Governments |
| ADR | | — American Depositary Receipt |
| ADS | | — American Depository Shares |
| AMBAC | | — American Municipal Bond Assurance Corporation |
| AMT | | — Alternative Minimum Tax |
| ARM | | — Adjustable Rate Mortgages |
| AUD | | — Australian Dollar |
| BART | | — Bay Area Rapid Transit |
| BRL | | — Brazil Real |
| CAD | | — Canadian Dollar |
| CDA | | — Community Development Authority |
| CDO | | — Collateralized Debt Obligation |
| CDSC | | — Contingent Deferred Sales Charge |
| CGIC | | — Capital Guaranty Insurance Company |
| CGY | | — Capital Guaranty Corporation |
| CHF | | — Swiss Franc |
| CIFG | | — CDC (Caisse des Dépôts et Consignations) IXIS Financial Guarantee |
| COP | | — Certificate of Participation |
| CP | | — Commercial Paper |
| CTF | | — Common Trust Fund |
| DEM | | — Deutsche Mark |
| DKK | | — Danish Krone |
| DW&P | | — Department of Water & Power |
| DWR | | — Department of Water Resources |
| ECFA | | — Educational & Cultural Facilities Authority |
| EDFA | | — Economic Development Finance Authority |
| ETET | | — Eagle Tax-Exempt Trust |
| ETF | | — Exchange-Traded Fund |
| EUR | | — Euro |
| FFCB | | — Federal Farm Credit Bank |
| FGIC | | — Financial Guaranty Insurance Corporation |
| FHA | | — Federal Housing Authority |
| FHAG | | — Federal Housing Agency |
| FHLB | | — Federal Home Loan Bank |
| FHLMC | | — Federal Home Loan Mortgage Corporation |
| FNMA | | — Federal National Mortgage Association |
| FRF | | — French Franc |
| FSA | | — Farm Service Agency |
| GBP | | — Great British Pound |
| GDR | | — Global Depositary Receipt |
| GNMA | | — Government National Mortgage Association |
| GO | | — General Obligation |
| HCFR | | — Healthcare Facilities Revenue |
| HEFA | | — Health & Educational Facilities Authority |
| HEFAR | | — Higher Education Facilities Authority Revenue |
| HFA | | — Housing Finance Authority |
| HFFA | | — Health Facilities Financing Authority |
| HKD | | — Hong Kong Dollar |
| HUD | | — Housing & Urban Development |
| HUF | | — Hungarian Forint |
| IDA | | — Industrial Development Authority |
| IDAG | | — Industrial Development Agency |
| IDR | | — Industrial Development Revenue |
| IEP | | — Irish Pound |
| JPY | | — Japanese Yen |
| KRW | | — Republic of Korea Won |
| LIBOR | | — London Interbank Offered Rate |
| LLC | | — Limited Liability Company |
| LLP | | — Limited Liability Partnership |
| LOC | | — Letter of Credit |
| LP | | — Limited Partnership |
| MBIA | | — Municipal Bond Insurance Association |
| MFHR | | — Multi-Family Housing Revenue |
| MFMR | | — Multi-Family Mortgage Revenue |
| MMD | | — Municipal Market Data |
| MTN | | — Medium Term Note |
| MUD | | — Municipal Utility District |
| MXN | | — Mexican Peso |
| MYR | | — Malaysian Ringgit |
| NATL-RE | | — National Public Finance Guarantee Corporation |
| NLG | | — Netherlands Guilder |
| NOK | | — Norwegian Krone |
| NZD | | — New Zealand Dollar |
| PCFA | | — Pollution Control Finance Authority |
| PCR | | — Pollution Control Revenue |
| PFA | | — Public Finance Authority |
| PFFA | | — Public Facilities Financing Authority |
| plc | | — Public Limited Company |
| PLN | | — Polish Zloty |
| PSFG | | — Public School Fund Guaranty |
| R&D | | — Research & Development |
| RDA | | — Redevelopment Authority |
| RDFA | | — Redevelopment Finance Authority |
| REITS | | — Real Estate Investment Trusts |
| SEK | | — Swedish Krona |
| SFHR | | — Single Family Housing Revenue |
| SFMR | | — Single Family Mortgage Revenue |
| SGD | | — Singapore Dollar |
| SKK | | — Slovakian Koruna |
| SLMA | | — Student Loan Marketing Association |
| SPDR | | — Standard & Poor’s Depositary Receipts |
| STIT | | — Short-Term Investment Trust |
| TBA | | — To Be Announced |
| TRAN | | — Tax Revenue Anticipation Notes |
| TRY | | — Turkish Lira |
| USD | | — United States Dollar |
| XLCA | | — XL Capital Assurance |
| ZAR | | — South African Rand |
More information about Wells Fargo Advantage Funds is available free upon request. To obtain literature, please write, e-mail, visit the Funds’ Web site, or call:
Wells Fargo Advantage Funds
P.O. Box 8266
Boston, MA 02266-8266
E-mail: wfaf@wellsfargo.com
Web site: www.wellsfargo.com/advantagefunds
Individual Investors: 1- 800-222-8222
Retail Investment Professionals: 1-888-877-9275
Institutional Investment Professionals: 1- 866-765-0778
This report and the financial statements contained herein are submitted for the general information of the shareholders of Wells Fargo Advantage Funds. If this report is used for promotional purposes, distribution of the report must be accompanied or preceded by a current prospectus. For a prospectus containing more complete information, including charges and expenses, call 1-800-222-8222 or visit the Fund’s Web site at www.wellsfargo.com/advantagefunds. Please consider the investment objectives, risks, charges, and expenses of the investment carefully before investing. This and other information about Wells Fargo Advantage Funds can be found in the current prospectus. Read the prospectus carefully before you invest or send money.
Source: MSCI. MSCI makes no express or implied warranties or representations and shall have no liability whatsoever with respect to any MSCI data contained herein. The MSCI data may not be further redistributed or used as a basis for other indices or any securities or financial products. This report is not approved, reviewed, or produced by MSCI.
Wells Fargo Funds Management, LLC, a wholly owned subsidiary of Wells Fargo & Company, provides investment advisory and administrative services for Wells Fargo Advantage Funds. Other affiliates of Wells Fargo & Company provide subadvisory and other services for the Funds. The Funds are distributed by Wells Fargo Funds Distributor, LLC, Member FINRA/SIPC, an affiliate of Wells Fargo & Company.
NOT FDIC INSURED § NO BANK GUARANTEE § MAY LOSE VALUE
| | | | |
| |
| © 2011 Wells Fargo Funds Management, LLC. All rights reserved. | | www.wellsfargo.com/advantagefunds | | 200915 02-11
AVT3/AR149 12-10 |
| | | | | |
| | | | | |
WELLS FARGO ADVANTAGE VARIABLE TRUST FUNDS
| § | | Wells Fargo Advantage VT Intrinsic Value Fund |
Reduce clutter. Save trees.
Sign up for electronic delivery of prospectuses and shareholder reports at www.wellsfargo.com/advantagedelivery
Contents
| | | | | |
|
Letter to Shareholders | | | 2 | |
Performance Highlights | | | 6 | |
| | | | | |
Fund Expenses | | | 11 | |
Portfolio of Investments | | | 12 | |
| | | | | |
Financial Statements | | | | |
| Statement of Assets and Liabilities | | | 15 | |
| Statement of Operations | | | 16 | |
| Statements of Changes in Net Assets | | | 17 | |
| Financial Highlights | | | 18 | |
| | | | | |
Notes to Financial Statements | | | 20 | |
| | | | | |
Report of Independent Registered Public Accounting Firm | | | 26 | |
| | | | | |
Other Information | | | 27 | |
| | | | | |
List of Abbreviations | | | 31 | |
The views expressed are as of December 31, 2010, and are those of the Fund managers. Any reference to a specific security in this report is not a recommendation to purchase or sell any specific security or adopt any investment strategy. The views are subject to change at any time in response to changing circumstances in the market and are not intended to predict or guarantee the future performance of any individual security, market sector or the markets generally, or the Wells Fargo Advantage VT Intrinsic Value Fund.
NOT FDIC INSURED § NO BANK GUARANTEE § MAY LOSE VALUE

| | | |
|
| WELLS FARGO |
| | | INVESTMENT HISTORY |
| | | |
1932 | | Keystone creates one of the first mutual fund families. |
| | | |
1971 | | Wells Fargo & Company introduces one of the first institutional index funds. |
| | | |
1978 | | Wells Fargo applies Markowitz and Sharpe’s research on Modern Portfolio Theory to introduce one of the industry’s first Tactical Asset Allocation (TAA) models in institutional separately managed accounts. |
| | | |
1984 | | Wells Fargo Stagecoach Funds launches its first asset allocation fund. |
| | | |
1989 | | The Tactical Asset Allocation (TAA) Model is first applied to Wells Fargo’s asset allocation mutual funds. |
| | | |
1994 | | Wells Fargo introduces the LifePath Funds, one of the first suites of target date funds (now the Wells Fargo Advantage Dow Jones Target Date FundsSM). |
| | | |
1996 | | Evergreen Investments and Keystone Funds merge. |
| | | |
1997 | | Wells Fargo launches Wells Fargo Advantage WealthBuilder PortfoliosSM, a fund-of-funds suite of products that includes the use of quantitative models to shift assets among investment styles. |
| | | |
1999 | | Norwest Advantage Funds and Stagecoach Funds are reorganized into Wells Fargo Funds after the merger of Norwest and Wells Fargo. |
| | | |
2002 | | Evergreen Retail and Evergreen Institutional companies form the umbrella asset management company, Evergreen Investments. |
| | | |
2005 | | The integration of Strong Funds with Wells Fargo Funds creates Wells Fargo Advantage Funds, resulting in one of the top 20 mutual fund companies in the United States. |
| | | |
2006 | | Wells Fargo Advantage Funds relaunches the target date product line as Wells Fargo Advantage Dow Jones Target Date Funds. |
| | | |
2010 | | The mergers and reorganizations of Evergreen and Wells Fargo Advantage mutual funds are completed, unifying the families under the brand of Wells Fargo Advantage Funds. |
Wells Fargo Advantage Funds®
Wells Fargo Advantage Funds skillfully guides institutions, financial advisors, and individuals through the investment terrain to help them reach their financial objectives. Everything we do on behalf of investors is backed by our unique combination of qualifications.
Strength
Our organization is built on the standards of integrity and service established by our parent company—Wells Fargo & Company—more than 150 years ago. And, because we’re part of a highly diversified financial enterprise, we offer the depth of resources to help investors succeed.
Expertise
Our multi-boutique model offers investors access to the independent thinking of premier investment managers that have been chosen for their time-tested strategies. While each team specializes in a specific investment strategy, collectively they provide investors a wide choice of distinct investment styles. Our dedication to investment excellence doesn’t end with our expertise in manager selection—risk management, analysis, and rigorous ongoing review seek to ensure each manager’s investment process remains consistent.
Partnership
Our collaborative approach is built around understanding the needs and goals of our clients. By adhering to core principles of sound judgment and steady guidance, we support you through every stage of the investment decision process.
Carefully consider the investment objectives, risks, charges, and expenses before investing. For a current prospectus for Wells Fargo Advantage Funds containing this and other information, visit wellsfargo.com/advantagefunds. Read it carefully before investing.
Wells Fargo Funds Management, LLC, a wholly owned subsidiary of Wells Fargo & Company, provides investment advisory and administrative services for Wells Fargo Advantage Funds®. Other affiliates of Wells Fargo & Company provide subadvisory and other services for the Funds. The Funds are distributed by Wells Fargo Funds Distributor, LLC, Member FINRA/SIPC, an affiliate of Wells Fargo & Company.
The “Dow Jones Target Date Indexes” are a product of Dow Jones Indexes, a licensed trademark of CME Group Index Services LLC (“CME”). “Dow Jones” and “Dow Jones Target Date Indexes” are service marks of Dow Jones Trademark Holdings, LLC, and have been licensed for use for certain purposes by CME and sublicensed for use by Global Index Advisors, Inc., and Wells Fargo Funds Management, LLC. The Dow Jones Target Date Indexes are based in part on the Barclays Capital Bond Indexes, which are published by Barclays Capital Inc. The Wells Fargo Advantage Dow Jones Target Date Funds, based on the Dow Jones Target Date Indexes, are not sponsored, endorsed, sold, or promoted by Dow Jones, CME or Barclays Capital or any of their respective affiliates, and neither Dow Jones, CME nor Barclays Capital nor any of their respective affiliates makes any representation regarding the advisability of investing in such product(s) and/or about the quality, accuracy, and/or completeness of the Dow Jones Target Date Indexes or the Barclays Capital Bond Indexes. IN NO EVENT SHALL DOW JONES, CME, BARCLAYS CAPITAL, OR ANY OF THEIR LICENSORS HAVE ANY LIABILITY FOR ANY SPECIAL, PUNITIVE, INDIRECT, OR CONSEQUENTIAL DAMAGES (INCLUDING LOST PROFITS), EVEN IF NOTIFIED OF THE POSSIBILITY OF SUCH DAMAGES.
NOT FDIC INSURED § NO BANK GUARANTEE § MAY LOSE VALUE
Not part of the annual report.
Wells Fargo Advantage Funds offers more than 120 mutual funds across a wide range of asset classes, representing over $236 billion in assets under management, as of December 31, 2010.
| | | | | |
|
Equity Funds | | | | |
| |
| Asia Pacific Fund | | Enterprise Fund† | | Opportunity Fund† |
| C&B Large Cap Value Fund | | Equity Value Fund | | Precious Metals Fund |
| C&B Mid Cap Value Fund | | Global Opportunities Fund | | Premier Large Company Growth Fund |
| Capital Growth Fund | | Growth Fund | | Small Cap Growth Fund |
| Classic Value Fund | | Growth Opportunities Fund | | Small Cap Opportunities Fund |
| Common Stock Fund | | Health Care Fund | | Small Cap Value Fund |
| Core Equity Fund | | Index Fund | | Small Company Growth Fund |
| Disciplined Global Equity Fund | | International Equity Fund | | Small Company Value Fund |
| Disciplined U.S. Core Fund | | International Value Fund | | Small/Mid Cap Core Fund |
| Disciplined Value Fund | | Intrinsic Small Cap Value Fund | | Small/Mid Cap Value Fund |
Discovery Fund† | | Intrinsic Value Fund | | Social Sustainability Fund† |
| Diversified Equity Fund | | Intrinsic World Equity Fund | | Special Mid Cap Value Fund |
| Diversified International Fund | | Large Cap Core Fund | | Special Small Cap Value Fund |
| Diversified Small Cap Fund | | Large Cap Growth Fund | | Specialized Technology Fund |
| Emerging Growth Fund | | Large Company Value Fund | | Strategic Large Cap Growth Fund |
| Emerging Markets Equity Fund | | Mid Cap Growth Fund | | Traditional Small Cap Growth Fund |
Endeavor Select Fund† | | Omega Growth Fund | | Utility and Telecommunications Fund |
| | | | | |
Bond Funds | | | | |
| |
| Adjustable Rate Government Fund | | Inflation-Protected Bond Fund | | Short-Term Bond Fund |
| California Limited-Term Tax-Free Fund | | Intermediate Tax/AMT-Free Fund | | Short-Term High Yield Bond Fund |
| California Tax-Free Fund | | International Bond Fund | | Short-Term Municipal Bond Fund |
| Colorado Tax-Free Fund | | Minnesota Tax-Free Fund | | Strategic Municipal Bond Fund |
| Government Securities Fund | | Municipal Bond Fund | | Total Return Bond Fund |
| High Income Fund | | North Carolina Tax-Free Fund | | Ultra Short-Term Income Fund |
| High Yield Bond Fund | | Pennsylvania Tax-Free Fund | | Ultra Short-Term Municipal Income Fund |
| Income Plus Fund | | Short Duration Government Bond Fund | | Wisconsin Tax-Free Fund |
| | | | | |
Asset Allocation Funds | | | | |
| |
| Asset Allocation Fund | | WealthBuilder Equity Portfolio† | | Target 2020 Fund† |
| Conservative Allocation Fund | | WealthBuilder Growth Allocation Portfolio† | | Target 2025 Fund† |
| Diversified Capital Builder Fund | | WealthBuilder Growth Balanced Portfolio† | | Target 2030 Fund† |
| Diversified Income Builder Fund | | WealthBuilder Moderate Balanced Portfolio† | | Target 2035 Fund† |
| Growth Balanced Fund | | WealthBuilder Tactical Equity Portfolio† | | Target 2040 Fund† |
| Index Asset Allocation Fund | | Target Today Fund† | | Target 2045 Fund† |
| Moderate Balanced Fund | | Target 2010 Fund† | | Target 2050 Fund† |
WealthBuilder Conservative Allocation Portfolio† | | Target 2015 Fund† | | |
| | | | | |
Money Market Funds | | | | |
| |
| 100% Treasury Money Market Fund | | Minnesota Money Market Fund | | New Jersey Municipal Money Market Fund |
| California Municipal Money Market Fund | | Money Market Fund | | New York Municipal Money Market Fund |
| Cash Investment Money Market Fund | | Municipal Cash Management Money Market Fund | | Pennsylvania Municipal Money Market Fund |
| Government Money Market Fund | | Municipal Money Market Fund | | Prime Investment Money Market Fund |
Heritage Money Market Fund† | | National Tax-Free Money Market Fund | | Treasury Plus Money Market Fund |
| | | | | |
Variable Trust Funds1 | | | | |
| |
| VT Core Equity Fund | | VT Intrinsic Value Fund | | VT Small Cap Value Fund |
VT Discovery Fund† | | VT Omega Growth Fund | | VT Total Return Bond Fund |
| VT Index Asset Allocation Fund | | VT Opportunity Fund† | | |
| VT International Equity Fund | | VT Small Cap Growth Fund | | |
An investment in a money market fund is not insured or guaranteed by the Federal Deposit Insurance Corporation or any other government agency. Although the Wells Fargo Advantage Money Market Funds seek to preserve the value of your investment at $1.00 per share, it is possible to lose money by investing in a money market fund.
| | |
| 1. | | The Variable Trust Funds are generally available only through insurance company variable contracts. |
| |
| † | | In this report, the Wells Fargo Advantage Discovery FundSM, Wells Fargo Advantage Endeavor Select FundSM, Wells Fargo Advantage Enterprise FundSM, Wells Fargo Advantage Opportunity FundSM, Wells Fargo Advantage Social Sustainability FundSM, Wells Fargo Advantage WealthBuilder Conservative Allocation PortfolioSM, Wells Fargo Advantage WealthBuilder Equity PortfolioSM, Wells Fargo Advantage WealthBuilder Growth Allocation PortfolioSM, Wells Fargo Advantage WealthBuilder Growth Balanced PortfolioSM, Wells Fargo Advantage WealthBuilder Moderate Balanced PortfolioSM, Wells Fargo Advantage WealthBuilder Tactical Equity PortfolioSM, Wells Fargo Advantage Dow Jones Target Today FundSM, Wells Fargo Advantage Dow Jones Target 2010 FundSM, Wells Fargo Advantage Dow Jones Target 2015 FundSM, Wells Fargo Advantage Dow Jones Target 2020 FundSM, Wells Fargo Advantage Dow Jones Target 2025 FundSM, Wells Fargo Advantage Dow Jones Target 2030 FundSM, Wells Fargo Advantage Dow Jones Target 2035 FundSM, Wells Fargo Advantage Dow Jones Target 2040 FundSM, Wells Fargo Advantage Dow Jones Target 2045 FundSM, Wells Fargo Advantage Dow Jones Target 2050 FundSM, Wells Fargo Advantage Heritage Money Market FundSM, Wells Fargo Advantage VT Discovery FundSM, and Wells Fargo Advantage VT Opportunity FundSM are referred to as the Discovery Fund, Endeavor Select Fund, Enterprise Fund, Opportunity Fund, Social Sustainability Fund, WealthBuilder Conservative Allocation Portfolio, WealthBuilder Equity Portfolio, WealthBuilder Growth Allocation Portfolio, WealthBuilder Growth Balanced Portfolio, WealthBuilder Moderate Balanced Portfolio, WealthBuilder Tactical Equity Portfolio, Target Today Fund, Target 2010 Fund, Target 2015 Fund, Target 2020 Fund, Target 2025 Fund, Target 2030 Fund, Target 2035 Fund, Target 2040 Fund, Target 2045 Fund, Target 2050 Fund, Heritage Money Market Fund, VT Discovery Fund, and VT Opportunity Fund, respectively. |
Not part of the annual report.
| | |
| | | |
| 2 Wells Fargo Advantage VT Intrinsic Value Fund | | Letter to Shareholders |
Karla M. Rabusch,
President
Wells Fargo Advantage Funds
The equity markets delivered strong full-year returns against the backdrop of a strengthening economy.
Dear Valued Shareholder:
We are pleased to provide you with this annual report for the Wells Fargo Advantage VT Intrinsic Value Fund for the 12 months that ended December 31, 2010. The equity markets delivered strong full-year returns against the backdrop of a strengthening economy. However, the year was not without its share of macroeconomic challenges and market volatility, once again highlighting the value of a sound, well-diversified investment strategy. As always, we believe that such a strategy can enable investors to balance risks and opportunities as they pursue long-term financial goals in a dynamic market environment.
The economic recovery stayed on track.
The U.S. economic recovery that began in the summer of 2009 gained momentum in 2010, particularly toward the end of the year. Gross domestic product (GDP) grew at an annualized rate of 3.2% in the fourth quarter of 2010—capping a streak of six consecutive quarters of positive GDP growth—and 2.9% for the full year. Although the path of recovery has been uneven at times and growth remains subpar compared with previous recoveries, the general consensus among economists is that the economy will likely avoid a double-dip recession. That said, persistent weakness in the labor and housing markets bears close watching in the months ahead.
Jobs and housing remained troublesome.
At the end of the year, the unemployment rate stood at 9.4%, down from 9.9% a year earlier, but still stubbornly high. Unfortunately, the drop may be attributable more to a decline in the labor force than a meaningful uptick in hiring. In fact, employers added just 1.1 million jobs for all of 2010, suggesting that the improving economy has yet to translate into widespread hiring. Meanwhile, the beleaguered housing market was an ongoing source of concern, despite some tentative late-year signs of stabilization.
Other economic data were more encouraging, reflecting greater confidence in the recovery on the part of both consumers and businesses. Retail sales came in strong at certain points during the year, including the critical holiday shopping season, and industrial production and new orders have picked up. Although still reluctant to hire, businesses have gradually increased spending in other areas, such as equipment and technology. Core inflation, which excludes volatile food and energy prices, remained benign.
The Fed continued to do its part.
With inflation subdued, the Federal Reserve (the Fed) held its target range for the federal funds rate—a proxy for short-term interest rates—steady at 0% to 0.25%. In its final statement of 2010, the Fed noted that economic expansion continues to be restrained by headwinds such as high unemployment, modest income growth, lower housing wealth, and tight credit. As a result, the Fed indicated that it intends to keep short-term rates at historically low levels for as long as needed to promote a more robust recovery.
| | |
| | | |
| Letter to Shareholders | | Wells Fargo Advantage VT Intrinsic Value Fund 3 |
The Fed also stated that it plans to proceed with other stimulus measures, including its second round of quantitative easing (QE2)—a plan to purchase $600 billion in long-term Treasury securities by mid-2011. The ‘preannouncement’ of QE2 in the third quarter of 2010 marked a turning point for the equity markets in that it ushered in a favorable shift in investor sentiment. By and large, investors interpreted the plan as further evidence of the Fed’s commitment to avoiding deflation and spurring economic growth.
2010 was another solid year for equities.
QE2 was certainly not the only catalyst for the equity markets during 2010. Along with more upbeat economic data, better-than-expected corporate earnings power played a role in driving stock prices higher. Throughout the year, quarterly earnings per share for the majority of companies in the S&P 500 Index consistently exceeded Wall Street estimates. As 2010 drew to a close, the midterm congressional elections and the extension of the Bush-era tax cuts provided additional tailwinds, helping the markets finish the year on a strong note.
It was the second straight year of double-digit total returns for the broad equity market indexes. The S&P 500 Index and the Dow Jones Industrial Average advanced 15.1% and 14.1%, respectively, while the tech-heavy NASDAQ Composite Index returned 18.2%. Investors were generally rewarded across the market-capitalization spectrum— with small- and mid-cap stocks outpacing large-cap stocks—as well as across most economic sectors. In terms of investment styles, growth stocks outperformed their value counterparts for the year.
To be sure, the gains were hard-earned, as the markets had to contend with numerous issues along the way, including the European sovereign debt crisis, China’s efforts to slow growth, and doubts about the sustainability of the domestic recovery. The second quarter in particular witnessed bouts of heightened market volatility, most notably the so-called “flash crash” in May. As the year progressed, however, volatility—as measured by the Chicago Board Options Exchange Volatility Index—abated amid reduced fears of a double-dip recession.
Investors should keep a long-term perspective.
In our view, the equity markets’ dramatic rebound over the past two years from a severe downturn underscores the importance of maintaining a disciplined, long-term investment strategy through changing market cycles. By staying focused on your long-term goals, you may be better positioned both to navigate falling markets and participate in rising markets.
To help you build a well-diversified strategy based on your personal objectives and risk tolerance, Wells Fargo Advantage Funds® offers more than 120 mutual funds and other investments covering a wide range of asset classes and investment styles. Although diversification cannot guarantee an investment profit or prevent losses, we believe it can be an effective way to manage investment risk and potentially smooth out overall portfolio performance.
Along with more upbeat economic data, better-than-expected corporate earnings power played a role in driving stock prices higher.
| | |
| | | |
| 4 Wells Fargo Advantage VT Intrinsic Value Fund | | Letter to Shareholders |
Thank you for choosing Wells Fargo Advantage Funds. We appreciate your continued confidence in us and are committed to helping you meet your financial needs. If you have any questions about your investments, please contact your investment professional, call us at 1-800-222-8222, or visit wellsfargo.com/advantagefunds.
Sincerely,
Karla M. Rabusch
President
Wells Fargo Advantage Funds
This page is intentionally left blank.
| | |
| | | |
| 6 Wells Fargo Advantage VT Intrinsic Value Fund | | Performance Highlights (Unaudited) |
Wells Fargo Advantage VT Intrinsic Value Fund
INVESTMENT OBJECTIVE
The Fund seeks long-term capital appreciation.
INVESTMENT ADVISER
Wells Fargo Funds Management, LLC
SUB-ADVISER
Metropolitan West Capital Management, Incorporated
PORTFOLIO MANAGERS
Gary Lisenbee
Jeffrey Peck
David Graham
FUND INCEPTION
May 6, 1996
PERFORMANCE SUMMARY
12 MONTH TOTAL RETURN AS OF DECEMBER 31, 2010
| | | | | |
|
| Class 2 | | | 13.83 | % |
Russell 1000® Value Index1 | | | 15.51 | % |
Figures quoted represent past performance, which is no guarantee of future results and do not reflect the deduction of taxes that a shareholder may pay on fund distributions or the redemption of fund shares. Investment return and principal value of an investment will fluctuate so that an investor’s shares, when redeemed, may be worth more or less than their original cost. Current performance may be lower or higher than the performance data quoted. Current month-end performance is available by calling 1-866-765-0778. Performance figures of the Fund do not reflect fees charged pursuant to the terms of variable life insurance policies and variable annuity contracts.
The adviser has committed, through July 18, 2013, to waive fees and/or reimburse expenses to maintain the contractual expense cap at 1.00% for Class 2 shares, excluding acquired fund fees and certain other expenses. Without these reductions, the Fund’s returns would have been lower. The Fund’s net expense ratio is 1.00% for the Class 2 shares. The Fund’s gross expense ratio is 1.11% for the Class 2 shares.
| | |
| 1. | | The Russell 1000® Value Index measures the performance of those Russell 1000 companies with lower price-to-book ratios and lower forecasted growth values. You cannot invest directly in an index. |
| |
| 2. | | The chart compares the performance of the Wells Fargo Advantage VT Intrinsic Value Fund Class 2 for the most recent ten years of the Fund with the Russell 1000® Value Index. The chart assumes a hypothetical $10,000 investment and reflects all operating expenses of the Fund. |
| | |
| | | |
| Performance Highlights (Unaudited) | | Wells Fargo Advantage VT Intrinsic Value Fund 7 |
Wells Fargo Advantage VT Intrinsic Value Fund (continued)
MANAGER’S DISCUSSION
Fund Highlights
| § | | For the 12-month period that ended December 31, 2010, the Fund underperformed its benchmark, the Russell 1000® Value Index. Unfavorable security selection was the primary source of the Fund’s underperformance. |
| |
| § | | Stock selection in consumer staples, financials, and health care detracted from relative return. Meanwhile, security selection in the information technology, energy, and consumer discretionary sectors added value during the period. |
| |
| § | | Amid market volatility, we continued to adhere to the same bottom-up investment process. We remained focused on identifying high-quality companies in good industries that trade at discounts to our estimates of intrinsic value and possess catalysts that we believe will cause the stock price to rise over the next three to five years. |
In a strong rally, the Fund’s cash position detracted from relative results, as did positions in the consumer staples, financials, and health care sectors.
Stock selection in the consumer staples, financials, and health care sectors detracted from relative return during the 12-month period. Among the primary detractors were chocolate and confectionery maker The Hershey Company in consumer staples, Spanish bank Banco Santander S.A. in financials, and pharmaceutical firm Abbott Laboratories in health care. Meanwhile, security selection in the information technology, energy, and consumer discretionary sectors added value. Top contributors included consumer electronics firm Apple Inc. in the information technology sector, integrated energy company Hess Corporation in the energy sector, and designer Polo Ralph Lauren Corporation in the consumer discretionary sector.
Given the market’s strength over the period, cash hindered the Fund’s performance relative to its benchmark, the Russell 1000 Value Index. While the Fund’s cash position is only for transactional (as opposed to tactical allocation) purposes, cash accounted for a significant portion of the shortfall in performance. Many of the Fund’s non-U.S. holdings also detracted from performance relative to the benchmark. Nonetheless, we plan to maintain our global perspective, which we believe allows us to better understand the companies in which we invest by providing us context with respect to their worldwide competitors, suppliers, and customers.
TEN LARGEST EQUITY HOLDINGS3
(AS OF DECEMBER 31, 2010)
| | | | | |
|
| International Business Machines Corporation | | | 2.64 | % |
| EMC Corporation | | | 2.55 | % |
| Oracle Corporation | | | 2.36 | % |
| ConocoPhillips | | | 2.33 | % |
| Northrop Grumman Corporation | | | 2.18 | % |
| JPMorgan Chase & Company | | | 2.13 | % |
| eBay Incorporated | | | 2.10 | % |
| Deere & Company | | | 2.09 | % |
| Home Depot Incorporated | | | 2.09 | % |
| Hess Corporation | | | 2.07 | % |
| | |
| 3. | | The ten largest equity holdings are calculated based on the value of the securities divided by total investments of the Fund. Holdings are subject to change and may have changed since the date specified. |
| | |
| | | |
| 8 Wells Fargo Advantage VT Intrinsic Value Fund | | Performance Highlights (Unaudited) |
Wells Fargo Advantage VT Intrinsic Value Fund (continued)
The Fund’s positioning relative to the index shifted moderately during the period.
Metropolitan West Capital Management, Incorporated began managing the Fund on July 16, 2010. During the nearly six months that we managed the Fund, we added a few high-quality investments to its holdings and divested a few positions that met our sell discipline criteria. However, given our long-term investment perspective, portfolio turnover was less than 10% during the time that we managed the Fund.
As a result of stock price movements and a few trades, the positioning of the Fund relative to the benchmark shifted moderately. The Fund’s significant overweight in consumer staples decreased slightly, as we sold the Fund’s position in cosmetic producer L’Oreal Company. Within the information technology sector, a new purchase of online marketplace provider eBay Inc. increased the Fund’s overweight in this sector. Meanwhile, the Fund’s underweight in utilities increased moderately due to a reduction in the exposure to natural gas and electric holding company Dominion Resources Incorporated. Finally, the purchase of upscale retailer Nordstrom Incorporated augmented the Fund’s exposure to the consumer discretionary sector, resulting in a modest increase in the Fund’s overweight. In all cases, trades were made based on fundamental, bottom-up research, rather than top-down sector allocation decisions.
Despite challenges, we see several bright spots within the global economy.
In all economic recoveries, there are opposing forces at work. The current recovery is no exception. The factors that we identify as potentially weighing on a more robust expansion include consumer deleveraging (though this could have beneficial long-term consequences) and, until recently, sluggish employment and wage growth. Furthermore, state and local governments are facing fiscal restraints that are causing them to delay or curtail spending; even the federal government could move into deficit-reduction mode.
Despite these constraints, however, we see several bright spots within the global economy. Corporate balance sheets are, on average, highly liquid after companies spent several years scaling back capital and other expenditures. In late 2010, we began to see U.S. corporations loosen their purse strings. In typical economic cycles, subsequent to hoarding cash during and immediately after a recession,
| | |
| 4. | | Sector distribution is subject to change and is calculated based on the total common stock investments of the Fund. |
| | |
| | | |
| Performance Highlights (Unaudited) | | Wells Fargo Advantage VT Intrinsic Value Fund 9 |
Wells Fargo Advantage VT Intrinsic Value Fund (continued)
company management teams will first increase capital expenditures and then begin expanding employment. We see no reason why this cycle should prove any different. Furthermore, many emerging countries seem to be on solid financial footing and are growing at a reasonable pace, providing U.S.-based companies with sizeable export growth opportunities.
Keeping macroeconomic observations in mind, it is our objective to identify companies that have the ability to transcend the economic environment and prosper via their own internal strategies in whatever economic scenario should arise. We continue to believe that the current global economic environment favors our research-intensive investment process, which should enable us to add value for our shareholders over a complete market cycle.
| | |
| | | |
| 10 Wells Fargo Advantage VT Intrinsic Value Fund | | Performance Highlights (Unaudited) |
Wells Fargo Advantage VT Intrinsic Value Fund (continued)
AVERAGE ANNUAL TOTAL RETURN (%) (AS OF DECEMBER 31, 2010)5
| | | | | | | | | | | | | | | | | | | | | | | | | | | | | |
| | | Inception | | | | | | | | | | | | | | | | | | Expense Ratio6 |
| | | Date | | 6 Months* | | 1 Year | | 5 Year | | 10 Year | | Gross | | Net7 |
| Class 2 | | | 5/6/1996 | | | | 21.44 | | | | 13.83 | | | | 0.59 | | | | 1.51 | | | | 1.11 | % | | | 1.00 | % |
Russell 1000® Value Index1 | | | | | | | 21.74 | | | | 15.51 | | | | 1.28 | | | | 3.26 | | | | | | | | | |
| | |
| * | | Returns for periods of less than one year are not annualized. |
Figures quoted represent past performance, which is no guarantee of future results and do not reflect the deduction of taxes that a shareholder may pay on fund distributions or the redemption of fund shares. Investment return and principal value of an investment will fluctuate so that an investor’s shares, when redeemed, may be worth more or less than their original cost. Current performance may be lower or higher than the performance data quoted. Current month-end performance is available by calling 1-866-765-0778. Performance figures of the Fund do not reflect fees charged pursuant to the terms of variable life insurance policies and variable annuity contracts.
Stock fund values fluctuate in response to the activities of individual companies and general market and economic conditions. The use of derivatives may reduce returns and/or increase volatility. Certain investment strategies tend to increase the total risk of an investment (relative to the broader market). This Fund is exposed to foreign investment risk. Consult the Fund’s prospectus for additional information on these and other risks.
Please refer to the prospectus provided by your participating insurance company for detailed information describing the separate accounts for information regarding surrender charges, mortality and expense risk fees and other charges that may be assessed by the participating insurance companies.
| | |
| 5. | | Historical performance shown for Class 2 of the Fund prior to July 19, 2010 is based on the performance of the fund’s predecessor, Wells Fargo Advantage VT Equity Income Fund. |
| |
| 6. | | Reflects the expense ratio as stated in the July 19, 2010 prospectus. |
| |
| 7. | | The adviser has committed, through July 18, 2013, to waive fees and/or reimburse expenses to maintain the contractual expense cap at 1.00% for Class 2 shares, excluding acquired fund fees and certain other expenses. Without these reductions, the Fund’s returns would have been lower. The Fund’s net expense ratio is 1.00% for Class 2 shares. The Fund’s gross expense ratio is 1.11% for Class 2 shares. |
| | |
| | | |
| Fund Expenses (Unaudited) | | Wells Fargo Advantage VT Intrinsic Value Fund 11 |
As a shareholder of the Fund, you incur two types of costs: (1) transaction costs, including sales charges (loads) on purchase payments, redemption fees (if any) and exchange fees (if any); and (2) ongoing costs, including management fees; distribution (12b-1) and/or shareholder service fees; and other Fund expenses. This example is intended to help you understand your ongoing costs (in dollars) of investing in the Fund and to compare these costs with the ongoing costs of investing in other mutual funds.
The example is based on an investment of $1,000 invested at the beginning of the six-month period and held for the entire period from July 1, 2010 to December 31, 2010.
Actual expenses
The “Actual” line of the table below provides information about actual account values and actual expenses. You may use the information in this line, together with the amount you invested, to estimate the expenses that you paid over the period. Simply divide your account value by $1,000 (for example, an $8,600 account value divided by $1,000 = 8.6), then multiply the result by the number in the “Actual” line under the heading entitled “Expenses Paid During Period” for your applicable class of shares to estimate the expenses you paid on your account during this period.
Hypothetical example for comparison purposes
The “Hypothetical” line of the table below provides information about hypothetical account values and hypothetical expenses based on the Fund’s actual expense ratio and an assumed rate of return of 5% per year before expenses, which is not the Fund’s actual return. The hypothetical account values and expenses may not be used to estimate the actual ending account balance or expenses you paid for the period. You may use this information to compare the ongoing costs of investing in the Fund and other funds. To do so, compare this 5% hypothetical example with the 5% hypothetical examples that appear in the shareholder reports of the other funds.
Please note that the expenses shown in the table are meant to highlight your ongoing costs only and do not reflect any transactional costs, such as sales charges (loads), redemption fees, exchange fees or separate account charges assessed by participating insurance companies. Therefore, the “Hypothetical” line of the table is useful in comparing ongoing costs only, and will not help you determine the relative total costs of owning different funds. In addition, if these transactional costs were included, your costs would have been higher.
| | | | | | | | | | | | | | | | | |
| | | Beginning | | Ending | | Expenses | | |
| | | Account Value | | Account Value | | Paid During | | Net Annual |
| | | 07-01-2010 | | 12-31-2010 | | the Period1 | | Expense Ratio |
Class 2 | | | | | | | | | | | | | | | | |
| Actual | | $ | 1,000.00 | | | $ | 1,214.39 | | | $ | 5.64 | | | | 1.00 | % |
| Hypothetical (5% return before expenses) | | $ | 1,000.00 | | | $ | 1,020.38 | | | $ | 5.15 | | | | 1.00 | % |
| | |
| 1. | | Expenses are equal to the Fund’s annualized expense ratio multiplied by the average account value over the period, multiplied by the number of days in the most recent fiscal half-year divided by the number of days in the fiscal year (to reflect the one-half year period). |
| | |
| | | |
| 12 Wells Fargo Advantage VT Intrinsic Value Fund | | Portfolio of Investments—December 31, 2010 |
| | | | | | | | | |
| Shares | | | Security Name | | Value | |
| Common Stocks: 94.74% | | | | |
| | | | | | | | | |
| Consumer Discretionary: 10.55% | | | | |
| | | | | | | | | |
| Media: 2.57% | | | | |
| | 47,000 | | | Time Warner Incorporated | | $ | 1,511,990 | |
| | | | | | | | |
| | | | | | | | | |
| Multiline Retail: 2.94% | | | | |
| | 29,000 | | | JCPenney Company Incorporated« | | | 936,990 | |
| | 18,770 | | | Nordstrom Incorporated« | | | 795,473 | |
| | | | | | | | 1,732,463 | |
| | | | | | | | |
| | | | | | | | | |
| Specialty Retail: 2.68% | | | | |
| | 45,000 | | | Home Depot Incorporated« | | | 1,577,700 | |
| | | | | | | | |
| | | | | | | | | |
| Textiles, Apparel & Luxury Goods: 2.36% | | | | |
| | 12,500 | | | Polo Ralph Lauren Corporation | | | 1,386,500 | |
| | | | | | | | |
| | | | | | | | | |
| Consumer Staples: 12.64% | | | | |
| | | | | | | | | |
| Beverages: 2.34% | | | | |
| | 18,500 | | | Diageo plc ADR« | | | 1,375,105 | |
| | | | | | | | |
| | | | | |
| Food & Staples Retailing: 1.82% | | | | |
| | 47,700 | | | Safeway Incorporated« | | | 1,072,773 | |
| | | | | | | | |
| | | | | | | | | |
| Food Products: 8.48% | | | | |
| | 59,200 | | | ConAgra Foods Incorporated | | | 1,336,736 | |
| | 27,000 | | | H.J. Heinz Company« | | | 1,335,420 | |
| | 24,800 | | | The Hershey Company« | | | 1,169,320 | |
| | 36,600 | | | Unilever NV« | | | 1,149,240 | |
| | | | | | | | 4,990,716 | |
| | | | | | | | |
| | | | | | | | | |
| Energy: 9.51% | | | | |
| | | | | | | | | |
| Energy Equipment & Services: 2.17% | | | | |
| | 56,000 | | | Weatherford International Limited† | | | 1,276,800 | |
| | | | | | | | |
| | | | | | | | | |
| Oil, Gas & Consumable Fuels: 7.34% | | | | |
| | 25,900 | | | ConocoPhillips | | | 1,763,790 | |
| | 20,500 | | | Hess Corporation | | | 1,569,070 | |
| | 27,200 | | | QEP Resources Incorporated | | | 987,632 | |
| | | | | | | | 4,320,492 | |
| | | | | | | | |
| | | | | | | | | |
| Financials: 15.46% | | | | |
| | | | | | | | | |
| Capital Markets: 1.44% | | | | |
| | 46,900 | | | Charles Schwab Corporation | | | 802,459 | |
| | 760 | | | Northern Trust Corporation | | | 42,190 | |
| | | | | | | | 844,649 | |
| | | | | | | | |
| | | | | | | | | |
| Commercial Banks: 9.31% | | | | |
| | 108,168 | | | Banco Santander Central Hispano SA ADR« | | | 1,151,989 | |
| | 37,000 | | | East West Bancorp Incorporated | | | 723,350 | |
| | 16,000 | | | M&T Bank Corporation | | | 1,392,800 | |
| | 204,200 | | | Mitsubishi UFJ Financial Group Incorporated ADR« | | | 1,104,722 | |
| | 45,640 | | | Zions Bancorporation« | | | 1,105,857 | |
| | | | | | | | 5,478,718 | |
| | | | | | | | |
| | |
| | | |
| Portfolio of Investments—December 31, 2010 | | Wells Fargo Advantage VT Intrinsic Value Fund 13 |
| | | | | | | | | |
| Shares | | | Security Name | | Value | |
| Diversified Financial Services: 4.71% | | | | |
| | 87,100 | | | Bank of America Corporation | | $ | 1,161,914 | |
| | 37,900 | | | JPMorgan Chase & Company | | | 1,607,718 | |
| | | | | | | | 2,769,632 | |
| | | | | | | | |
| | | | | | | | | |
| Health Care: 8.31% | | | | |
| | | | | | | | | |
| Health Care Equipment & Supplies: 4.38% | | | | |
| | 26,800 | | | Baxter International Incorporated | | | 1,356,616 | |
| | 21,900 | | | Hospira IncorporatedǠ | | | 1,219,611 | |
| | | | | | | | 2,576,227 | |
| | | | | | | | |
| | | | | | | | | |
| Pharmaceuticals: 3.93% | | | | |
| | 26,300 | | | Abbott Laboratories | | | 1,260,033 | |
| | 30,100 | | | Eli Lilly & Company | | | 1,054,704 | |
| | | | | | | | 2,314,737 | |
| | | | | | | | |
| | | | | | | | | |
| Industrials: 10.39% | | | | |
| | | | | | | | | |
| Aerospace & Defense: 5.22% | | | | |
| | 21,700 | | | Boeing Company | | | 1,416,142 | |
| | 25,500 | | | Northrop Grumman Corporation« | | | 1,651,890 | |
| | | | | | | | 3,068,032 | |
| | | | | | | | |
| | | | | | | | | |
| Machinery: 5.17% | | | | |
| | 19,000 | | | Deere & Company | | | 1,577,950 | |
| | 20,500 | | | SPX Corporation« | | | 1,465,545 | |
| | | | | | | | 3,043,495 | |
| | | | | | | | |
| | | | | | | | | |
| Information Technology: 19.74% | | | | |
| | | | | | | | | |
| Computers & Peripherals: 5.91% | | | | |
| | 4,800 | | | Apple Incorporated† | | | 1,548,288 | |
| | 84,300 | | | EMC CorporationǠ | | | 1,930,470 | |
| | | | | | | | 3,478,758 | |
| | | | | | | | |
| | | | | | | | | |
| Internet Software & Services: 2.70% | | | | |
| | 57,000 | | | eBay Incorporated† | | | 1,586,310 | |
| | | | | | | | |
| | | | | | | | | |
| IT Services: 3.39% | | | | |
| | 13,600 | | | International Business Machines Corporation | | | 1,995,936 | |
| | | | | | | | |
| | | | | | | | | |
| | | | | | | | | |
| Semiconductors & Semiconductor Equipment: 2.29% | | | | |
| | 41,500 | | | Texas Instruments Incorporated | | | 1,348,750 | |
| | | | | | | | |
| | | | | | | | | |
| Software: 5.45% | | | | |
| | 28,800 | | | Intuit IncorporatedǠ | | | 1,419,840 | |
| | 57,000 | | | Oracle Corporation | | | 1,784,100 | |
| | | | | | | | 3,203,940 | |
| | | | | | | | |
| | | | | | | | | |
| Materials: 2.41% | | | | |
| | | | | | | | | |
| Chemicals: 2.41% | | | | |
| | 41,500 | | | Dow Chemical Company | | | 1,416,810 | |
| | | | | | | | |
| | | | | | | | | |
| Telecommunication Services: 2.11% | | | | |
| | | | | | | | | |
| Wireless Telecommunication Services: 2.11% | | | | |
| | 47,000 | | | Vodafone Group plc ADR« | | | 1,242,210 | |
| | | | | | | | |
| | |
| | | |
| 14 Wells Fargo Advantage VT Intrinsic Value Fund | | Portfolio of Investments—December 31, 2010 |
| | | | | | | | | | | | | | | | | | | | | |
| Shares | | | Security Name | | | | | | | | | | | | | | Value | |
| Utilities: 3.62% | | | | | | | | | | | | | | | | |
| | | | | | | | | | | | | | | | | | | | | |
| Electric Utilities: 2.11% | | | | | | | | | | | | | | | | |
| | 23,800 | | | Nextera Energy Incorporated | | | | | | | | | | | | | | $ | 1,237,362 | |
| | | | | | | | | | | | | | | | | | | | |
| | | | | | | | | | | | | | | | | | | | | |
| Gas Utilities: 0.91% | | | | | | | | | | | | | | | | |
| | 30,740 | | | Questar Corporation« | | | | | | | | | | | | | | | 535,183 | |
| | | | | | | | | | | | | | | | | | | | |
| | | | | | | | | | | | | | | | | | | | | |
| Multi-Utilities: 0.60% | | | | | | | | | | | | | | | | |
| | 8,280 | | | Dominion Resources Incorporated | | | | | | | | | | | | | | | 353,722 | |
| | | | | | | | | | | | | | | | | | | | |
| | | | | | | | | | | | | | | | | | | | | |
| Total Common Stocks (Cost $48,289,495) | | | | | | | | | | | | | | | 55,739,010 | |
| | | | | | | | | | | | | | | | | | | | |
| | | | | | | | | | | | | | | | | | | | | |
| Principal | | | | | | | | | Interest Rate | | | Maturity Date | | | | | |
| Short-Term Investments: 33.82% | | | | | | | | | | | | | | | | |
| | | | | | | | | | | | | | | | | | | | | |
| Corporate Bonds and Notes: 0.07% | | | | | | | | | | | | | | | | |
| $ | 36,529 | | | Gryphon Funding Limited(a)(v)(i) | | | | | | | 0.00 | % | | | 08/05/2011 | | | | 14,838 | |
| | 48,048 | | | VFNC Corporation(a)††(v)(i)± | | | | | | | 0.26 | | | | 09/29/2011 | | | | 26,907 | |
| | | | | | | | | | | | | | | | | | | | 41,745 | |
| | | | | | | | | | | | | | | | | | | | |
| | | | | | | | | | | | | | | | | | | | | |
| Shares | | | | | | | | | Yield | | | | | | | | | |
| Investment Companies: 33.75% | | | | | | | | | | | | | | | | |
| | 3,182,906 | | | Wells Fargo Advantage Cash Investment Money Market Fund(l)(u) | | | | | 0.14 | | | | | | | | 3,182,906 | |
| | 16,669,068 | | | Wells Fargo Securities Lending Cash Investments, LLC(v)(l)(u) | | | | | 0.27 | | | | | | | | 16,669,068 | |
| | | | | | | | | | | | | | | | | | | | 19,851,974 | |
| | | | | | | | | | | | | | | | | | | | |
| | | | | | | | | | | | | | | | | | | | | |
| Total Short-Term Investments (Cost $19,878,399) | | | | | | | | | | | | | | | 19,893,719 | |
| | | | | | | | | | | | | | | | | | | | |
| | | | | | | | | | | | | | | | | | | | | |
Total Investments in Securities
(Cost $68,167,894)* | | | 128.56 | % | | | | | | | | | | | 75,632,729 | |
| | | | | | | | | | | | | | | | | | | | | |
| Other Assets and Liabilities, Net | | | (28.56 | ) | | | | | | | | | | | (16,800,862 | ) |
| | | | | | | | | | | | | | | | | | | |
| | | | | | | | | | | | | | | | | | | | | |
| Total Net Assets | | | 100.00 | % | | | | | | | | | | $ | 58,831,867 | |
| | | | | | | | | | | | | | | | | | | |
| | |
| (a) | | Security is fair valued by the Management Valuation Team, and in certain instances by the Board of Trustees, in accordance with procedures approved by the Board of Trustees. |
| |
| †† | | Securities that may be resold to “qualified institutional buyers” under Rule 144A or securities offered pursuant to Section 4(2) of the Securities Act of 1933, as amended. |
| |
| (v) | | Security represents investment of cash collateral received from securities on loan. |
| |
| (I) | | Investment in an affiliate. |
| |
| (u) | | Rate shown is the 7-day annualized yield at period end. |
| |
| « | | All or a portion of this security is on loan. |
| |
| † | | Non-income earning securities. |
| |
| (i) | | Illiquid security for which the designation as illiquid is unaudited. |
| |
| ± | | Variable rate investments. |
| |
| * | | Cost for federal income tax purposes is $68,313,167 and net unrealized appreciation (depreciation) consists of: |
| | | | | |
|
| Gross unrealized appreciation | | $ | 9,103,394 | |
| Gross unrealized depreciation | | | (1,783,832 | ) |
| | | | |
| | | | | |
| Net unrealized appreciation | | $ | 7,319,562 | |
The accompanying notes are an integral part of these financial statements.
| | |
| Statements of Assets and Liabilities—December 31, 2010 | | Wells Fargo Advantage VT Intrinsic Value Fund 15 |
| | | | | |
|
Assets | | | | |
| Investments | | | | |
| In unaffiliated securities (including securities on loan), at value | | $ | 55,780,755 | |
| In affiliated securities, at value | | | 19,851,974 | |
| | | | |
| Total investments, at value (see cost below) | | | 75,632,729 | |
| Receivable for investments sold | | | 29,161 | |
| Receivable for Fund shares sold | | | 649 | |
| Receivable for dividends | | | 71,261 | |
| Receivable for securities lending income | | | 1,243 | |
| Prepaid expenses and other assets | | | 1,014 | |
| | | | |
| Total assets | | | 75,736,057 | |
| | | | |
| | | | | |
Liabilities | | | | |
| Payable for investments purchased | | | 82,045 | |
| Payable for Fund shares redeemed | | | 49,701 | |
| Payable upon receipt of securities loaned | | | 16,695,493 | |
| Investment advisory fee payable | | | 24,451 | |
| Distribution fees payable | | | 13,245 | |
| Due to other related parties | | | 6,886 | |
| Accrued expenses and other liabilities | | | 32,369 | |
| | | | |
| Total liabilities | | | 16,904,190 | |
| | | | |
Total net assets | | $ | 58,831,867 | |
| | | | |
| | | | | |
NET ASSETS CONSIST OF | | | | |
| Paid-in capital | | $ | 63,154,118 | |
| Undistributed net investment income | | | 285,415 | |
| Accumulated net realized losses on investments | | | (12,072,501 | ) |
| Net unrealized gains on investments | | | 7,464,835 | |
| | | | |
Total net assets | | $ | 58,831,867 | |
| | | | |
| | | | | |
COMPUTATION OF NET ASSET VALUE PER SHARE1 | | | | |
| Net assets — Class 2 | | $ | 58,831,867 | |
| Shares outstanding — Class 2 | | | 4,611,599 | |
| Net asset value per share — Class 2 | | $ | 12.76 | |
| | | | |
| | | | | |
| Total investments, at cost | | $ | 68,167,894 | |
| | | | |
| Securities on loan, at value | | $ | 16,329,441 | |
| | | | |
| | |
| 1. | | The Fund has an unlimited number of authorized shares. |
The accompanying notes are an integral part of these financial statements.
| | |
| 16 Wells Fargo Advantage VT Intrinsic Value Fund1 | | Statement of Operations—For the Year Ended December 31, 2010 |
| | | | | |
|
Investment income | | | | |
| Dividends* | | $ | 1,199,979 | |
| Income from affiliated securities | | | 3,035 | |
| Securities lending income, net | | | 9,920 | |
| | | | |
| Total investment income | | | 1,212,934 | |
| | | | |
| |
Expenses | | | | |
| Investment advisory fee | | | 291,718 | |
| Administration fees | | | | |
| Fund level | | | 55,640 | |
Class 22 | | | 21,254 | |
| Distribution fees | | | | |
Class 22 | | | 132,599 | |
| Custody and accounting fees | | | 12,263 | |
| Professional fees | | | 36,388 | |
| Shareholder report expenses | | | 20,705 | |
| Trustees’ fees and expenses | | | 12,252 | |
| Other fees and expenses | | | 3,563 | |
| | | | |
| Total expenses | | | 586,382 | |
| | | | | |
| Less: Fee waivers and/or expense reimbursements | | | (55,985 | ) |
| | | | |
| Net expenses | | | 530,397 | |
| | | | |
| Net investment income | | | 682,537 | |
| | | | |
| | | | | |
NET REALIZED AND UNREALIZED GAINS (LOSSES) ON INVESTMENTS | | | | |
| Net realized losses on unaffiliated securities | | | (1,767,637 | ) |
| Net change in unrealized gains (losses) on unaffiliated securities | | | 9,056,350 | |
| | | | |
| Net realized and unrealized gains (losses) on investments | | | 7,288,713 | |
| | | | |
Net increase in net assets resulting from operations | | $ | 7,971,250 | |
| | | | |
| | | | | |
| * Net of foreign withholding taxes of | | $ | 8,387 | |
| | | |
| 1. | | After the close of business on July 16, 2010, the Fund acquired the net assets of Wells Fargo Advantage VT Equity Income Fund and Wells Fargo Advantage VT C&B Large Cap Value Fund. Wells Fargo Advantage VT Equity Income Fund became the accounting and performance survivor in this transaction. The information for the period prior to July 19, 2010 is that of Wells Fargo Advantage VT Equity Income Fund. |
| |
| 2. | | After the close of business on July 16, 2010, existing shares of the predecessor fund were renamed Class 2 shares. |
The accompanying notes are an integral part of these financial statements.
| | |
| Statements of Changes in Net Assets | | Wells Fargo Advantage VT Intrinsic Value Fund 17 |
| | | | | | | | | | | | | | | | | |
| | | | Year Ended | | Year Ended | |
| | | | December 31, 20101 | | December 31, 20091 | |
| |
Operations | | | | | | | | | | | | | | | | |
| Net investment income | | | | | | $ | 682,537 | | | | | | | $ | 887,311 | |
| Net realized losses on investments | | | | | | | (1,767,637 | ) | | | | | | | (321,306 | ) |
| Net change in unrealized gains (losses) on investments | | | | | | | 9,056,350 | | | | | | | | 7,608,040 | |
| | | |
| Net increase in net assets resulting from operations | | | | | | | 7,971,250 | | | | | | | | 8,174,045 | |
| | | |
| | | | | | | | | | | | | | | | | |
Distributions to shareholders from | | | | | | | | | | | | | | | | |
Net investment income — Class 22 | | | | | | | (413,858 | ) | | | | | | | (910,236 | ) |
| | | |
| | | | | | | | | | | | | | | | | |
| | | Shares | | | | | | Shares | | | | |
Capital shares transactions | | | | | | | | | | | | | | | | |
Proceeds from shares sold — Class 22 | | | 4,130,068 | | | | 45,177,175 | | | | 1,577,619 | | | | 14,938,428 | |
Reinvestment of distributions — Class 22 | | | 36,555 | | | | 413,858 | | | | 91,826 | | | | 910,236 | |
Payment for shares redeemed — Class 22 | | | (5,578,424 | ) | | | (61,920,948 | ) | | | (1,255,724 | ) | | | (12,123,032 | ) |
| Net asset value of shares issued in acquisitions — Class 2 | | | 1,211,148 | | | | 13,163,306 | | | | 0 | | | | 0 | |
| | | |
| Net increase (decrease) in net assets resulting from capital share transactions | | | | | | | (3,166,609 | ) | | | | | | | 3,725,632 | |
| | | |
Total increase in net assets | | | | | | | 4,390,783 | | | | | | | | 10,989,441 | |
| | | |
| | | | | |
Net assets | | | | | | | | | | | | | | | | |
| Beginning of period | | | | | | | 54,441,084 | | | | | | | | 43,451,643 | |
| | | |
| End of period | | | | | | $ | 58,831,867 | | | | | | | $ | 54,441,084 | |
| | | |
| Undistributed net investment income | | | | | | $ | 285,415 | | | | | | | $ | 5,009 | |
| | | |
| | |
| 1. | | After the close of business on July 16, 2010, the Fund acquired the net assets of Wells Fargo Advantage VT Equity Income Fund and Wells Fargo Advantage VT C&B Large Cap Value Fund. Wells Fargo Advantage VT Equity Income Fund became the accounting and performance survivor in this transaction. The information for the periods prior to July 19, 2010 are those of Wells Fargo Advantage VT Equity Income Fund. |
| |
| 2. | | After the close of business on July 16, 2010, existing shares of the predecessor fund were renamed Class 2 shares. |
The accompanying notes are an integral part of these financial statements.
| | |
| 18 Wells Fargo Advantage VT Intrinsic Value Fund1 | | Financial Highlights |
| | | | | | | | | | | | | | | | | | | | | |
| | | Beginning | | | | | | Net Realized | | Distributions | | |
| | | Net Asset | | Net | | and Unrealized | | from Net | | Distributions |
| | | Value Per | | Investment | | Gains (Losses) | | Investment | | from Net |
| | | Share | | Income | | on Investments | | Income | | Realized Gains |
| |
Class 23 | | | | | | | | | | | | | | | | | | | | |
| January 1, 2010 to December 31, 2010 | | $ | 11.31 | | | | 0.16 | | | | 1.39 | | | | (0.10 | ) | | | 0.00 | |
| January 1, 2009 to December 31, 2009 | | $ | 9.88 | | | | 0.19 | | | | 1.44 | | | | (0.20 | ) | | | 0.00 | |
| January 1, 2008 to December 31, 2008 | | $ | 18.74 | | | | 0.30 | | | | (6.46 | ) | | | (0.28 | ) | | | (2.42 | ) |
| January 1, 2007 to December 31, 2007 | | $ | 19.75 | | | | 0.30 | | | | 0.33 | | | | (0.30 | ) | | | (1.34 | ) |
| January 1, 2006 to December 31, 2006 | | $ | 16.96 | | | | 0.28 | | | | 2.83 | | | | (0.28 | ) | | | (0.04 | ) |
| | |
| 1. | | After the close of business on July 16, 2010, the Fund acquired the net assets of Wells Fargo Advantage VT Equity Income Fund and Wells Fargo Advantage VT C&B Large Cap Value Fund. Wells Fargo Advantage VT Equity Income Fund became the accounting and performance survivor in this transaction. The information for the periods prior to July 19, 2010 are those of Wells Fargo Advantage VT Equity Income Fund. |
| |
| 2. | | Total return calculations would have been lower had certain expenses not been waived or reimbursed during the periods shown. |
| |
| 3. | | After the close of business on July 16, 2010, existing shares of the predecessor fund were renamed Class 2 shares. |
The accompanying notes are an integral part of these financial statements.
| | |
| Financial Highlights | | Wells Fargo Advantage VT Intrinsic Value Fund 19 |
| | | | | | | | | | | | | | | | | | | | | | | | | |
| Ending | | | | | | | | | | |
| Net Asset | | Ratio to Average Net Assets | | | | | | Portfolio | | Net Assets at |
| Value Per | | Net Investment | | Gross | | Net | | Total | | Turnover | | End of Period |
| Share | | Income | | Expenses | | Expenses | | Return2 | | Rate | | (000’s omitted) |
| |
| | | | | | | | | | | | | | | | | | | | | | | | | |
| $12.76 | | | 1.29 | % | | | 1.10 | % | | | 1.00 | % | | | 13.83 | % | | | 72 | % | | $ | 58,832 | |
| $11.31 | | | 1.94 | % | | | 1.18 | % | | | 1.00 | % | | | 16.86 | % | | | 16 | % | | $ | 54,441 | |
| $ 9.88 | | | 1.95 | % | | | 1.15 | % | | | 1.00 | % | | | (36.47 | )% | | | 9 | % | | $ | 43,452 | |
| $18.74 | | | 1.49 | % | | | 1.05 | % | | | 1.00 | % | | | 2.80 | % | | | 20 | % | | $ | 94,097 | |
| $19.75 | | | 1.53 | % | | | 1.04 | % | | | 1.00 | % | | | 18.55 | % | | | 14 | % | | $ | 116,232 | |
| | |
| 20 Wells Fargo Advantage VT Intrinsic Value Fund | | Notes to Financial Statements |
1. ORGANIZATION
Wells Fargo Variable Trust (the “Trust”), a Delaware statutory trust organized on March 10, 1999, is an open-end management investment company registered under the Investment Company Act of 1940, as amended (the “1940 Act”). These financial statements report on Wells Fargo Advantage VT Intrinsic Value Fund (the “Fund”) which is a diversified series of the Trust.
After the close of business on July 16, 2010, the net assets of Wells Fargo Advantage VT Equity Income Fund and Wells Fargo Advantage VT C&B Large Cap Value Fund were acquired by the Fund, which was created to receive the assets of Wells Fargo Advantage VT Equity Income Fund and Wells Fargo Advantage VT C&B Large Cap Value Fund, in an exchange for shares of the Fund. Wells Fargo Advantage VT Equity Income Fund became the accounting and performance survivor in the reorganizations and as a result the accounting and performance history of Wells Fargo Advantage VT Equity Income Fund has been carried forward in the financial statements contained herein.
2. SIGNIFICANT ACCOUNTING POLICIES
The following significant accounting policies, which are consistently followed in the preparation of the financial statements of the Fund, are in conformity with U.S. generally accepted accounting principles which require management to make estimates and assumptions that affect the reported amounts of assets and liabilities, disclosure of contingent assets and liabilities at the date of the financial statements, and the reported amounts of revenues and expenses during the reporting period. Actual results could differ from those estimates. Management has considered the circumstances under which the Fund should recognize or make disclosures regarding events or transactions occurring subsequent to the balance sheet date through the date the financial statements are issued. Adjustments or additional disclosures, if any, have been included in these financial statements.
Securities valuation
Investments in securities are valued each business day as of the close of regular trading on the New York Stock Exchange, which is usually 4:00 p.m. (Eastern Time). Securities which are traded on a national or foreign securities exchange are valued at the last reported sales price, except that securities listed on The Nasdaq Stock Market, Inc. (“Nasdaq”) are valued at the Nasdaq Official Closing Price (“NOCP”), and if no NOCP is available, then at the last reported sales price. If no sales price is shown on the Nasdaq, the bid price will be used. In the absence of any sale of securities listed on the Nasdaq, and in the case of other securities, including U.S. Government obligations, but excluding debt securities maturing in 60 days or less, the price will be deemed “stale” and the valuations will be determined in accordance with the Fund’s Fair Valuation Procedures.
Debt securities of sufficient credit quality with original maturities of 60 days or less and any collateral received from securities lending invested in securities generally are valued at amortized cost which approximates fair value. The amortized cost method involves valuing a security at its cost, plus accretion of discount or minus amortization of premium over the period until maturity.
Investments in open-end mutual funds and non-registered investment companies are generally valued at net asset value.
Certain investments which are not valued using any of the methods discussed above, are valued at their fair value, as determined by procedures established in good faith and approved by the Board of Trustees.
The valuation techniques used by the Fund to measure fair value are consistent with the market approach, income approach and/or cost approach, where applicable, for each security type.
Security loans
The Fund may lend its securities from time to time in order to earn additional income in the form of fees or interest on securities received as collateral or the investment of any cash received as collateral. The Fund continues to receive interest or dividends on the securities loaned. The Fund receives collateral in the form of cash or securities with a value at least equal to the value of the securities on loan. The value of the loaned securities is determined at the close of each business day and any additional required collateral is delivered to the Fund on the next business day. In the event of default or bankruptcy by the borrower, the Fund could experience delays and costs in recovering the loaned securities or in gaining access to the collateral. In addition, the investment of any cash collateral received may lose all or part of its value. The Fund has the right under the lending agreement to recover the securities from the borrower on demand.
| | |
| Notes to Financial Statements | | Wells Fargo Advantage VT Intrinsic Value Fund 21 |
The Fund lends its securities through an unaffiliated securities lending agent. Cash collateral received in connection with its securities lending transactions is invested in Wells Fargo Securities Lending Cash Investments, LLC (the “Cash Collateral Fund”). The Cash Collateral Fund is exempt from registration under Section 3(c)(7) of the 1940 Act and is managed by Wells Fargo Funds Management LLC (“Funds Management”) and is sub-advised by Wells Capital Management Incorporated (“Wells Capital Management”). Funds Management receives an investment advisory fee starting at 0.05% and declining to 0.01% as the average daily net assets of the Cash Collateral Fund increase. All of the fees received by Funds Management are paid to Wells Capital Management for its services as sub-adviser. The Cash Collateral Fund seeks to provide a positive return compared to the daily Fed Funds Open rate by investing in high-quality, U.S. dollar-denominated short-term money market instruments. Cash Collateral Fund investments are fair valued based upon the amortized cost valuation technique. Income earned from investment in the Cash Collateral Fund is included in securities lending income on the Statement of Operations.
Prior to April 1, 2010, Wells Fargo Bank, N.A. acted as the securities lending agent for the predecessor Fund and was entitled to receive for its services 25% of the revenues earned on the securities lending activities. For the year ended December 31, 2010, Wells Fargo Bank, N.A. waived its share of revenues earned on securities lending activities. Such waivers by Wells Fargo Bank, N.A. had the impact of increasing securities lending income on the Statement of Operations. The value of the securities on loan and the liability to return the collateral are shown on the Statement of Assets and Liabilities.
In a securities lending transaction, the net asset value of the Fund will be affected by an increase or decrease in the value of the securities loaned and by an increase or decrease in the value of instruments in which cash collateral is invested. The amount of securities lending activity undertaken by the Fund fluctuates from time to time. As a result of the reorganizations on July 16, 2010, the Fund holds securities related to defaulted or impaired structured investment vehicles. After the occurrence of a default or impairment of structured investment vehicles purchased in a joint account by the predecessor Fund’s former securities lending agent, as the various participating funds’ lending activity fluctuated, their ratable interest in the joint account, including their ratable exposure to the defaulted or impaired structured investment vehicles fluctuated depending on the relative activity of each participating fund. In order to eliminate the fluctuation of the various participating funds’ ratable exposure to the defaulted or impaired structured investment vehicles, the adviser to the funds recommended to the Board of Trustees, and the Board of Trustees approved, actions designed to fix the allocation of percentage ownership in defaulted or impaired structured investment vehicles among all funds participating in securities lending (“side pocketing”) based on each participating fund’s percentage ownership of the total cash collateral investment joint account as of the date the fixed allocation is implemented. Accordingly, on February 13, 2009 a side pocketing occurred, which fixed each participating fund’s ownership of defaulted or impaired structured investment vehicle in the joint account based on each participating fund’s percentage ownership of the joint account as of such date.
Security transactions and income recognition
Securities transactions are recorded on a trade date basis. Realized gains or losses are reported on the basis of identified cost of securities delivered.
Dividend income is recognized on the ex-dividend date, except for certain dividends from foreign securities, which are recorded as soon as the Fund is informed of the ex-dividend date. Dividend income from foreign securities is recorded net of foreign taxes withheld where recovery of such taxes is not assured.
Distributions to shareholders
Distributions to shareholders from net investment income and net realized gains, if any, are recorded on the ex-dividend date. Such distributions are determined in conformity with income tax regulations, which may differ from generally accepted accounting principles.
The timing and character of distributions made during the period from net investment income or net realized gains may differ from their ultimate characterization for federal income tax purposes. To the extent that these differences are permanent in nature, such amounts are reclassified within the capital accounts based on their federal tax-basis treatment. Temporary differences do not require reclassifications. At December 31, 2010, as a result of permanent book-to-tax differences, the following reclassification adjustments were made on the Statement of Assets and Liabilities:
| | | | | | | | | | | |
| Undistributed | | Accumulated Net | | |
| Net Investment | | Realized Losses | | |
| Income | | on Investments | | Paid-in Capital |
| $ | 11,727 | | | $ | (945 | ) | | $ | (10,782 | ) |
| | |
| 22 Wells Fargo Advantage VT Intrinsic Value Fund | | Notes to Financial Statements |
Federal and other taxes
The Fund intends to continue to qualify as a regulated investment company by distributing substantially all of its investment company taxable income and any net realized capital gains (after reduction for capital loss carryforwards) sufficient to relieve it from all, or substantially all, federal income taxes. Accordingly, no provision for federal income taxes was required.
The Fund’s income and federal excise tax returns and all financial records supporting those returns (including those of the predecessor funds) for the prior three fiscal years are subject to examination by the federal and Delaware revenue authorities.
At December 31, 2010, estimated net capital loss carryforwards, which are available to offset future net realized capital gains, were as follows:
| | | | | | | | | | | |
| Expiration |
| 2015 | | 2016 | | 2017 |
| $ | 3,869,744 | | | $ | 4,073,329 | | | $ | 3,984,155 | |
Under the recently enacted Regulated Investment Company Modernization Act of 2010, the Fund will be permitted to carry forward capital losses incurred in taxable years beginning after December 22, 2010 for an unlimited period. However, any losses incurred during those future taxable years will be required to be utilized prior to the losses incurred in pre-enactment taxable years. As a result of this ordering rule, pre-enactment capital loss carryforwards may be more likely to expire unused. Additionally, post-enactment capital losses that are carried forward will retain their character as either short-term or long-term capital losses rather than being considered all short-term as under previous law.
3. FAIR VALUATION MEASUREMENTS
Fair value measurements of investments are determined within a framework that has established a fair value hierarchy based upon the various data inputs utilized in determining the value of the Fund’s investments. The three-level hierarchy gives the highest priority to unadjusted quoted prices in active markets for identical assets or liabilities (Level 1) and the lowest priority to unobservable inputs (Level 3). The Fund’s investments are classified within the fair value hierarchy based on the lowest level of input that is significant to the fair value measurement. The inputs are summarized into three broad levels as follows:
| § | | Level 1 — quoted prices in active markets for identical securities |
| § | | Level 2 — other significant observable inputs (including quoted prices for similar securities, interest rates, prepayment speeds, credit risk, etc.) |
| § | | Level 3 — significant unobservable inputs (including the Fund’s own assumptions in determining the fair value of investments) |
The inputs or methodologies used for valuing securities are not necessarily an indication of the risk associated with investing in those securities.
As of December 31, 2010, the inputs used in valuing the Fund’s assets, which are carried at fair value, were as follows:
| | | | | | | | | | | | | | | | | |
| | | | | | | Significant Other | | Significant | | |
| | | | | | | Observable | | Unobservable | | |
| | | Quoted Prices | | Inputs | | Inputs | | |
| Investments in Securities | | (Level 1) | | (Level 2) | | (Level 3) | | Total |
Equity securities | | | | | | | | | | | | | | | | |
Common stocks | | $ | 55,739,010 | | | $ | 0 | | | $ | 0 | | | $ | 55,739,010 | |
Short-term investments | | | | | | | | | | | | | | | | |
Corporate bonds and notes | | | 0 | | | | 0 | | | | 41,745 | | | | 41,745 | |
Investment companies | | | 3,182,906 | | | | 16,669,068 | | | | 0 | | | | 19,851,974 | |
Total | | $ | 58,921,916 | | | $ | 16,669,068 | | | $ | 41,745 | | | $ | 75,632,729 | |
Further details on the major security types listed above can be found in the Fund’s Portfolio of Investments.
| | |
| Notes to Financial Statements | | Wells Fargo Advantage VT Intrinsic Value Fund 23 |
The following is a reconciliation of assets in which significant unobservable inputs (Level 3) were used in determining fair value:
| | | | | |
| | | Corporate bonds |
| | | and notes |
Balance as of December 31, 2009 | | $ | 25,045 | |
| Realized gains (losses) | | | 0 | |
| Change in unrealized gains (losses) | | | 7,296 | |
| Purchases | | | 0 | |
| Sales | | | (10,039 | ) |
| Transfers into Level 3 | | | 0 | |
| Transfers out of Level 3 | | | 0 | |
| Transfers in from acquisitions | | | 19,443 | |
Balance as of December 31, 2010 | | $ | 41,745 | |
Change in unrealized gains (losses) included in earnings relating to securities still held at December 31, 2010 | | $ | 3,148 | |
Transfers in and out of Level 3 are recognized at the end of the reporting period.
4. TRANSACTIONS WITH AFFILIATES AND OTHER EXPENSES
Investment advisory fees
The Trust has entered into an investment advisory contract with Funds Management, an indirect wholly owned subsidiary of Wells Fargo & Company (“Wells Fargo”). The investment adviser is responsible for implementing investment policies and guidelines and for supervising the investment sub-adviser, who is responsible for day-to-day portfolio management of the Fund.
Pursuant to the contract, Funds Management is paid an annual investment advisory fee starting at 0.55% and declining to 0.40% as the average daily net assets of the Fund increase. Prior to July 19, 2010, the predecessor fund, Wells Fargo Advantage VT Equity Income Fund, paid an investment advisory fee to Funds Management at the same rates. For the year ended December 31, 2010, the investment advisory fee was equivalent to an annual rate of 0.55% of the Fund’s average daily net assets.
Funds Management may retain the services of certain investment sub-advisers to provide daily portfolio management to the Fund. The fees related to investment sub-advisory services are borne directly by the investment adviser and do not increase the overall fees paid by the Fund to the investment adviser. Metropolitan West Capital Management, LLC, a subsidiary of Wells Fargo, is the investment sub-adviser to the Fund and is paid a fee by the investment adviser at an annual rate starting at 0.35% and declining to 0.20% as the average daily net assets of the Fund increase. Prior to July 19, 2010, Wells Capital Management, an affiliate of Funds Management, was the investment sub-adviser to the predecessor fund and was also paid by the investment adviser.
Administration and transfer agent fees
The Trust has entered into an Administration Agreement with Funds Management. Under this Agreement, for providing administrative services, which includes paying fees and expenses for services provided by the transfer agent, sub-transfer agents, omnibus account servicers and record-keepers, Funds Management is entitled to receive the following annual fees:
| | | | | | | |
| | | | | Administration Fees |
| | | | | (% of Average |
| | | Average Daily Net Assets | | Daily Net Assets) |
| Fund level | | First $5 billion | | | 0.05 | % |
| | | Next $5 billion | | | 0.04 | |
| | | Over $10 billion | | | 0.03 | |
| Class 2 | | All asset levels | | | 0.08 | |
Prior to July 19, 2010, Funds Management received from the predecessor fund an annual fee which started at 0.16% and declined to 0.14% as the average daily net assets increased.
| | |
| 24 Wells Fargo Advantage VT Intrinsic Value Fund | | Notes to Financial Statements |
Funds Management has contractually waived and/or reimbursed investment advisory and administration fees to the extent necessary to maintain certain net operating expense ratios for the Fund. Waiver of fees and/or reimbursement of expenses by Funds Management were made first from fund level expenses on a proportionate basis and then from class specific expenses.
Distribution fees
The Trust has adopted a Distribution Plan for Class 2 shares of the Fund pursuant to Rule 12b-1 under the 1940 Act. Distribution fees are charged to the Class 2 shares and paid to Wells Fargo Funds Distributor, LLC, the principal underwriter, at an annual rate of 0.25% of its average daily net assets. Prior to July 19, 2010, Class 2 shares of the predecessor fund paid distribution fees at the same rate.
5. INVESTMENT PORTFOLIO TRANSACTIONS
Purchases and sales of investments, exclusive of short-term securities (securities with maturities of one year or less at purchase date) for the year ended December 31, 2010 were $36,898,481 and $55,472,786, respectively.
6. ACQUISITIONS
After the close of business on July 16, 2010, the Fund acquired the net assets of Wells Fargo Advantage VT Equity Income Fund and Wells Fargo Advantage VT C&B Large Cap Value Fund. The purpose of the transactions was to combine three funds with similar investment objectives and strategies. The acquisitions were accomplished by a tax-free exchange of all of the shares of Wells Fargo Advantage VT Equity Income Fund and Wells Fargo Advantage VT C&B Large Cap Value Fund. Existing shareholders of Wells Fargo Advantage VT Equity Income Fund and Wells Fargo Advantage VT C&B Large Cap Value Fund received Class 2 shares of the Fund in the reorganizations. The Fund was newly created to receive the assets and shares of Wells Fargo Advantage VT Equity Income Fund and Wells Fargo Advantage VT C&B Large Cap Value Fund. Wells Fargo Advantage VT Equity Income Fund became the accounting and performance survivor in the reorganizations. The investment portfolio of Wells Fargo Advantage VT Equity Income Fund and Wells Fargo Advantage VT C&B Large Cap Value Fund with fair values of $40,288,244 and $13,109,804, respectively, and identified costs of $40,252,417 and $13,443,290, respectively, at July 16, 2010, were the principal assets acquired by the Fund. For financial reporting purposes, assets received and shares issued by the Fund were recorded at fair value; however, the cost basis of the investments received from Wells Fargo Advantage VT Equity Income Fund and Wells Fargo Advantage VT C&B Large Cap Value Fund were carried forward to align ongoing reporting of the Fund’s realized and unrealized gains and losses with amounts distributable to shareholders for tax purposes. The value of net assets acquired, unrealized gains and losses acquired, exchange ratio and number of shares issued were as follows:
| | | | | | | | | | | | | | | | | |
| | | Value of Net | | Unrealized | | Exchange | | Number of |
| Acquired Fund | | Assets Acquired | | Gains (Losses) | | Ratio | | Shares Issued |
| Wells Fargo Advantage VT Equity Income Fund | | $ | 40,386,838 | | | $ | 35,827 | | | | 1.00 | | | 3,715,958 Class 2 |
| Wells Fargo Advantage VT C&B Large Cap Value Fund | | | 13,163,306 | | | | (333,486 | ) | | | 0.79 | | | 1,211,148 Class 2 |
The aggregate net assets of the Fund immediately after the acquisitions were $53,550,144.
Assuming the acquisitions had been completed January 1, 2010, the beginning of the annual reporting period for the Fund, the pro forma results of operations for the year ended December 31, 2010 would have been
| | | | | |
|
Net investment income | | $ | 772,583 | |
Net realized and unrealized gains (losses) on investments | | $ | 7,077,595 | |
Net increase in net assets resulting from operations | | $ | 7,850,178 | |
Because the combined investment portfolios have been managed as a single integrated portfolio since the acquisitions were completed, it is not practicable to separate the amounts of revenue and earnings of Wells Fargo Advantage VT C&B Large Cap Value Fund that have been included in the Fund’s Statement of Operations since July 19, 2010.
| | |
| Notes to Financial Statements | | Wells Fargo Advantage VT Intrinsic Value Fund 25 |
7. BANK BORROWINGS
The Trust and Wells Fargo Funds Trust (excluding the money market funds) are parties to a $125,000,000 revolving credit agreement with State Street Bank and Trust Company, whereby the Fund is permitted to use bank borrowings for temporary or emergency purposes, such as to fund shareholder redemption requests. Interest under the credit agreement is charged to the Fund based on a borrowing rate equal to the higher of the Federal Funds rate in effect on that day plus 1.25% or the overnight LIBOR rate in effect on that day plus 1.25%. In addition, under the credit agreement, the Fund pays an annual commitment fee equal to 0.125% of the unused balance, which is allocated pro rata. Prior to September 7, 2010, the annual commitment fee paid by the Fund was 0.15% of the unused balance.
For the year ended December 31, 2010, there were no borrowings by the Fund under the agreement.
8. DISTRIBUTIONS TO SHAREHOLDERS
The tax character of distributions paid during the years ended December 31, 2010 and December 31, 2009 were as follows:
| | | | | | | | | |
| | | Year ended December 31, |
| | | 2010 | | 2009 |
| Ordinary Income | | $ | 413,858 | | | $ | 910,236 | |
As of December 31, 2010, the components of distributable earnings on a tax basis were as follows:
| | | | | | | | | | | |
| Undistributed | | | | |
| Ordinary | | Unrealized | | Capital Loss |
| Income | | Gains (Losses) | | Carryforward |
| $ | 285,415 | | | $ | 7,319,562 | | | $ | (11,927,228 | ) |
9. INDEMNIFICATION
Under the Trust’s organizational documents, the officers and directors are indemnified against certain liabilities that may arise out of performance of their duties to the Trust. Additionally, in the normal course of business, the Trust may enter into contracts with service providers that contain a variety of indemnification clauses. The Trust’s maximum exposure under these arrangements is dependent on future claims that may be made against the Fund and, therefore, cannot be estimated.
| | |
| 26 Wells Fargo Advantage VT Intrinsic Value Fund | | Report of Independent Registered Public Accounting Firm |
BOARD OF TRUSTEES AND SHAREHOLDERS OF
WELLS FARGO VARIABLE TRUST:
We have audited the accompanying statement of assets and liabilities, including the portfolio of investments, of the Wells Fargo Advantage VT Intrinsic Value Fund (the “Fund”), one of the funds constituting the Wells Fargo Variable Trust, as of December 31, 2010, and the related statement of operations for the year then ended, statements of changes in net assets for each of the years in the two year period then ended, and the financial highlights for each of the years in the five year period then ended. These financial statements and financial highlights are the responsibility of the Fund’s management. Our responsibility is to express an opinion on these financial statements and financial highlights based on our audits.
We conducted our audits in accordance with the standards of the Public Company Accounting Oversight Board (United States). Those standards require that we plan and perform the audit to obtain reasonable assurance about whether the financial statements and financial highlights are free of material misstatement. An audit includes examining, on a test basis, evidence supporting the amounts and disclosures in the financial statements. Our procedures included confirmation of securities owned as of December 31, 2010, by correspondence with custodian and brokers, or by other appropriate auditing procedures. An audit also includes assessing the accounting principles used and significant estimates made by management, as well as evaluating the overall financial statement presentation. We believe that our audits provide a reasonable basis for our opinion.
In our opinion, the financial statements and financial highlights referred to above present fairly, in all material respects, the financial position of the Wells Fargo Advantage VT Intrinsic Value Fund as of December 31, 2010, the results of its operations for the year then ended, changes in its net assets for each of the years in the two year period then ended, and the financial highlights for each of the years in the five year period then ended, in conformity with U.S. generally accepted accounting principles.
Boston, Massachusetts
February 25, 2011
| | |
| Other Information (Unaudited) | | Wells Fargo Advantage VT Intrinsic Value Fund 27 |
PROXY VOTING INFORMATION
A description of the policies and procedures that the Fund uses to determine how to vote proxies relating to portfolio securities is available without charge, upon request, by calling 1-800-222-8222, visiting our Web site at wellsfargo.com/advantagefunds, or visiting the SEC Web site at www.sec.gov. Information regarding how the Fund voted proxies relating to portfolio securities during the most recent 12-month period ended June 30 is available without charge on the Fund’s Web site at wellsfargo.com/advantagefunds or by visiting the SEC Web site at www.sec.gov.
| | |
| 28 Wells Fargo Advantage VT Intrinsic Value Fund | | Other Information (Unaudited) |
PORTFOLIO HOLDINGS INFORMATION
The complete portfolio holdings for the Fund are publicly available on the Fund’s Web site (www.wellsfargo.com/advantagefunds) on a monthly, 30-day or more delayed basis. In addition, top ten holdings information for the Fund is publicly available on the Fund’s Web site on a monthly, seven-day or more delayed basis. The Fund files its complete schedule of portfolio holdings with the SEC for the first and third quarters of each fiscal year on Form N-Q, which is available without charge by visiting the SEC Web site at www.sec.gov. In addition, the Fund’s Form N-Q may be reviewed and copied at the SEC’s Public Reference Room in Washington, DC, and at regional offices in New York City, at 233 Broadway, and in Chicago, at 175 West Jackson Boulevard, Suite 900. Information about the Public Reference Room may be obtained by calling 1-800-SEC-0330.
BOARD OF TRUSTEES
The following table provides basic information about the Board of Trustees (the “Trustees”) of the Wells Fargo Variable Trust (the “Trust”) and Officers of the Trust. This table should be read in conjunction with the Prospectus and the Statement of Additional Information1 of the Fund. Each of the Trustees and Officers listed below acts in identical capacities for the Wells Fargo Advantage family of funds, which consists of 152 funds comprising the Trust, Wells Fargo Funds Trust, Wells Fargo Master Trust and four closed-end funds (collectively the “Fund Complex”). All of the Trustees are also Members of the Audit and Governance Committees of each Trust in the Fund Complex. The mailing address of each Trustee and Officer is 525 Market Street, 12th Floor, San Francisco, CA 94105. Each Trustee and Officer serves an indefinite term, however, each Trustee serves such term until reaching the mandatory retirement age established by the Trustees.
Independent Trustees
| | | | | | | |
| Name and | | Position Held and | | | | |
| Year of Birth | | Length of Service | | Principal Occupations During Past Five Years | | Other Directorships |
| Peter G. Gordon (Born 1942) | | Trustee, since 1998; Chairman, since 2005 (Lead Trustee since 2001) | | Co-Founder, Chairman, President and CEO of Crystal Geyser. Water Company. Trustee Emeritus, Colby College | | Asset Allocation
Trust |
| | | | | | | |
| Isaiah Harris, Jr. (Born 1952) | | Trustee, since 2009 | | Retired. Prior thereto, President and CEO of BellSouth Advertising and Publishing Corp. from 2005 to 2007, President and CEO of BellSouth Enterprises from 2004 to 2005 and President of BellSouth Consumer Services from 2000 to 2003. Emeritus member of the Iowa State University Foundation Board of Governors. Emeritus Member of the Advisory Board of Iowa State University School of Business. Mr. Harris is a certified public accountant. | | CIGNA Corporation; Deluxe Corporation; Asset Allocation Trust |
| | | | | | | |
Judith M. Johnson
(Born 1949) | | Trustee, since 2008 | | Retired. Prior thereto, Chief Executive Officer and Chief Investment Officer of Minneapolis Employees Retirement Fund from 1996 to 2008. Ms. Johnson is an attorney, certified public accountant and a certified managerial accountant. | | Asset Allocation
Trust |
| | | | | | | |
| Leroy Keith, Jr. (Born 1939) | | Trustee, since 2010 | | Chairman, Bloc Global Services (development and construction), Trustee of the Evergreen Funds from 1983 to 2010. Former Managing Director, Almanac Capital Management (commodities firm), former Partner, Stonington Partners, Inc. (private equity fund), former Director, Obagi Medical Products Co. and former Director, Lincoln Educational Services. | | Trustee, Virtus Fund Complex (consisting of 45 portfolios as of 12/31/10); Director, Diversapack Co. (packaging company); Asset Allocation Trust |
| | | | | | | |
| David F. Larcker (Born 1951) | | Trustee, since 2009 | | James Irvin Miller Professor of Accounting at the Graduate School of Business, Stanford University, Director of Corporate Governance Research Program and Co-Director of The Rock Center for Corporate Governance since 2006. From 2005 to 2008, Professor of Accounting at the Graduate School of Business, Stanford University. Prior thereto, Ernst & Young Professor of Accounting at The Wharton School, University of Pennsylvania from 1985 to 2005. | | Asset Allocation
Trust |
| | |
| Other Information (Unaudited) | | Wells Fargo Advantage VT Intrinsic Value Fund 29 |
| | | | | | | |
| Name and | | Position Held and | | | | |
| Year of Birth | | Length of Service | | Principal Occupations During Past Five Years | | Other Directorships |
| Olivia S. Mitchell (Born 1953) | | Trustee, since 2006 | | International Foundation of Employee Benefit Plans Professor and Chair of the Department of Insurance and Risk Management, Wharton School of the University of Pennsylvania since 1993. Director of Wharton’s Pension Research Council and Boettner Center on Pensions & Retirement Research, and Research Associate at the National Bureau of Economic Research. Previously, Cornell University Professor from 1978 to 1993. | | Asset Allocation
Trust |
| | | | | | | |
| Timothy J. Penny (Born 1951) | | Trustee, since 1996 | | President and CEO of Southern Minnesota Initiative Foundation, a non-profit organization, since 2007 and Senior Fellow at the Humphrey Institute Policy Forum at the University of Minnesota since 1995. Member of the Board of Trustees of NorthStar Education Finance, Inc., a non-profit organization, since 2007. | | Asset Allocation
Trust |
| | | | | | | |
| Michael S. Scofield (Born 1943) | | Trustee, since 2010 | | Currently serves on the Investment Company Institute’s Board of Governors and Executive Committee as well the Independent Director’s Counsel Board of Governors and Executive Committee. Former Chairman of the Independent Directors Counsel. Trustee of the Evergreen Funds from 1984 to 2010. Retired Attorney, Law Offices of Michael S. Scofield and former Director and Chairman, Branded Media Corporation (multi-media branding company). | | Asset Allocation
Trust |
| | | | | | | |
| Donald C. Willeke (Born 1940) | | Trustee, since 1996 | | Principal of the law firm of Willeke & Daniels. General Counsel of the Minneapolis Employees Retirement Fund from 1984 until its consolidation into the Minnesota Public Employees Retirement Association on June 30, 2010. | | Asset Allocation
Trust |
| | | | | |
| Officers |
| | | | | |
| Name and | | Position Held and | | | | |
| Year of Birth | | Length of Service | | Principal Occupations During Past Five Years |
| Karla M. Rabusch (Born 1959) | | President, since 2003 | | Executive Vice President of Wells Fargo Bank, N.A. and President of Wells Fargo Funds Management, LLC since 2003. Senior Vice President and Chief Administrative Officer of Wells Fargo Funds Management, LLC from 2001 to 2003. |
| | | | | |
C. David Messman
(Born 1960) | | Secretary, since 2000; Chief Legal Counsel, since 2003 | | Senior Vice President and Secretary of Wells Fargo Funds Management, LLC since 2001. Vice President and Managing Counsel of Wells Fargo Bank, N.A. since 1996. |
| | | | | |
Kasey Phillips
(Born 1970) | | Treasurer, since 2009 | | Senior Vice President of Wells Fargo Funds Management, LLC since 2009. Senior Vice President of Evergreen Investment Management Company, LLC from 2006 to 2010. Treasurer of the Evergreen Funds from 2005 to 2010. Vice President and Assistant Vice President of Evergreen Investment Services, Inc. from 1999 to 2006. |
| | | | | |
David Berardi
(Born 1975) | | Assistant Treasurer,
since 2009 | | Vice President of Wells Fargo Funds Management, LLC since 2009. Vice President of Evergreen Investment Management Company, LLC from 2008 to 2010. Assistant Vice President of Evergreen Investment Services, Inc. from 2004 to 2008. Manager of Fund Reporting and Control for Evergreen Investment Management Company, LLC from 2004 to 2010. |
| | | | | |
Jeremy DePalma
(Born 1974) | | Assistant Treasurer,
since 2009 | | Senior Vice President of Wells Fargo Funds Management, LLC since 2009. Senior Vice President of Evergreen Investment Management Company, LLC from 2008 to 2010. Vice President, Evergreen Investment Services, Inc. from 2004 to 2007. Assistant Vice President, Evergreen Investment Services, Inc. from 2000 to 2004 and the head of the Fund Reporting and Control Team within Fund Administration from 2005 to 2010. |
| | |
| 30 Wells Fargo Advantage VT Intrinsic Value Fund | | Other Information (Unaudited) |
| | | | | | | |
| Name and | | Position Held and | | |
| Year of Birth | | Length of Service | | Principal Occupations During Past Five Years |
Debra Ann Early
(Born 1964) | | Chief Compliance Officer,
since 2007 | | Chief Compliance Officer of Wells Fargo Funds Management, LLC since 2007. Chief Compliance Officer of Parnassus Investments from 2005 to 2007. Chief Financial Officer of Parnassus Investments from 2004 to 2007 and Senior Audit Manager of PricewaterhouseCoopers LLP from 1998 to 2004. |
| | |
| 1. | | The Statement of Additional Information includes additional information about the Fund’s Trustees and is available, without charge, upon request, by calling 1-800-222-8222 or by visiting the Fund’s Web site at www.wellsfargo.com/advantagefunds. |
| | |
| List of Abbreviations | | Wells Fargo Advantage VT Intrinsic Value Fund 31 |
The following is a list of common abbreviations for terms and entities which may have appeared in this report.
| | | | | |
|
| ABAG | | — | | Association of Bay Area Governments |
| ADR | | — | | American Depositary Receipt |
| ADS | | — | | American Depository Shares |
| AMBAC | | — | | American Municipal Bond Assurance Corporation |
| AMT | | — | | Alternative Minimum Tax |
| ARM | | — | | Adjustable Rate Mortgages |
| AUD | | — | | Australian Dollar |
| BART | | — | | Bay Area Rapid Transit |
| BRL | | — | | Brazil Real |
| CAD | | — | | Canadian Dollar |
| CDA | | — | | Community Development Authority |
| CDO | | — | | Collateralized Debt Obligation |
| CDSC | | — | | Contingent Deferred Sales Charge |
| CGIC | | — | | Capital Guaranty Insurance Company |
| CGY | | — | | Capital Guaranty Corporation |
| CHF | | — | | Swiss Franc |
| CIFG | | — | | CDC (Caisse des Dépôts et Consignations) IXIS Financial Guarantee |
| COP | | — | | Certificate of Participation |
| CP | | — | | Commercial Paper |
| CTF | | — | | Common Trust Fund |
| DEM | | — | | Deutsche Mark |
| DKK | | — | | Danish Krone |
| DW&P | | — | | Department of Water & Power |
| DWR | | — | | Department of Water Resources |
| ECFA | | — | | Educational & Cultural Facilities Authority |
| EDFA | | — | | Economic Development Finance Authority |
| ETET | | — | | Eagle Tax-Exempt Trust |
| ETF | | — | | Exchange-Traded Fund |
| EUR | | — | | Euro |
| FFCB | | — | | Federal Farm Credit Bank |
| FGIC | | — | | Financial Guaranty Insurance Corporation |
| FHA | | — | | Federal Housing Authority |
| FHAG | | — | | Federal Housing Agency |
| FHLB | | — | | Federal Home Loan Bank |
| FHLMC | | — | | Federal Home Loan Mortgage Corporation |
| FNMA | | — | | Federal National Mortgage Association |
| FRF | | — | | French Franc |
| FSA | | — | | Farm Service Agency |
| GBP | | — | | Great British Pound |
| GDR | | — | | Global Depositary Receipt |
| GNMA | | — | | Government National Mortgage Association |
| GO | | — | | General Obligation |
| HCFR | | — | | Healthcare Facilities Revenue |
| HEFA | | — | | Health & Educational Facilities Authority |
| HEFAR | | — | | Higher Education Facilities Authority Revenue |
| HFA | | — | | Housing Finance Authority |
| HFFA | | — | | Health Facilities Financing Authority |
| HKD | | — | | Hong Kong Dollar |
| HUD | | — | | Housing & Urban Development |
| HUF | | — | | Hungarian Forint |
| IDA | | — | | Industrial Development Authority |
| IDAG | | — | | Industrial Development Agency |
| IDR | | — | | Industrial Development Revenue |
| IEP | | — | | Irish Pound |
| JPY | | — | | Japanese Yen |
| KRW | | — | | Republic of Korea Won |
| LIBOR | | — | | London Interbank Offered Rate |
| LLC | | — | | Limited Liability Company |
| LLP | | — | | Limited Liability Partnership |
| LOC | | — | | Letter of Credit |
| LP | | — | | Limited Partnership |
| MBIA | | — | | Municipal Bond Insurance Association |
| MFHR | | — | | Multi-Family Housing Revenue |
| MFMR | | — | | Multi-Family Mortgage Revenue |
| MMD | | — | | Municipal Market Data |
| MTN | | — | | Medium Term Note |
| MUD | | — | | Municipal Utility District |
| MXN | | — | | Mexican Peso |
| MYR | | — | | Malaysian Ringgit |
| NATL-RE | | — | | National Public Finance Guarantee Corporation |
| NLG | | — | | Netherlands Guilder |
| NOK | | — | | Norwegian Krone |
| NZD | | — | | New Zealand Dollar |
| PCFA | | — | | Pollution Control Finance Authority |
| PCR | | — | | Pollution Control Revenue |
| PFA | | — | | Public Finance Authority |
| PFFA | | — | | Public Facilities Financing Authority |
| plc | | — | | Public Limited Company |
| PLN | | — | | Polish Zloty |
| PSFG | | — | | Public School Fund Guaranty |
| R&D | | — | | Research & Development |
| RDA | | — | | Redevelopment Authority |
| RDFA | | — | | Redevelopment Finance Authority |
| REITS | | — | | Real Estate Investment Trusts |
| SEK | | — | | Swedish Krona |
| SFHR | | — | | Single Family Housing Revenue |
| SFMR | | — | | Single Family Mortgage Revenue |
| SGD | | — | | Singapore Dollar |
| SKK | | — | | Slovakian Koruna |
| SLMA | | — | | Student Loan Marketing Association |
| SPDR | | — | | Standard & Poor’s Depositary Receipts |
| STIT | | — | | Short-Term Investment Trust |
| TBA | | — | | To Be Announced |
| TRAN | | — | | Tax Revenue Anticipation Notes |
| TRY | | — | | Turkish Lira |
| USD | | — | | United States Dollar |
| XLCA | | — | | XL Capital Assurance |
| ZAR | | — | | South African Rand |
This page is intentionally left blank.
This page is intentionally left blank.
This page is intentionally left blank.
More information about Wells Fargo Advantage Funds is available free upon request. To obtain literature, please write, e-mail, visit the Funds’ Web site, or call:
Wells Fargo Advantage Funds
P.O. Box 8266
Boston, MA 02266-8266
E-mail: wfaf@wellsfargo.com
Web site: www.wellsfargo.com/advantagefunds
Individual Investors: 1-800-222-8222
Retail Investment Professionals: 1-888-877-9275
Institutional Investment Professionals: 1-866-765-0778
This report and the financial statements contained herein are submitted for the general information of the shareholders of Wells Fargo Advantage Funds. If this report is used for promotional purposes, distribution of the report must be accompanied or preceded by a current prospectus. For a prospectus containing more complete information, including charges and expenses, call 1-800-222-8222 or visit the Fund’s Web site at www.wellsfargo.com/advantagefunds. Please consider the investment objectives, risks, charges, and expenses of the investment carefully before investing. This and other information about Wells Fargo Advantage Funds can be found in the current prospectus. Read the prospectus carefully before you invest or send money.
Wells Fargo Funds Management, LLC, a wholly owned subsidiary of Wells Fargo & Company, provides investment advisory and administrative services for Wells Fargo Advantage Funds. Other affiliates of Wells Fargo & Company provide subadvisory and other services for the Funds. The Funds are distributed by Wells Fargo Funds Distributor, LLC, Member FINRA/SIPC, an affiliate of Wells Fargo & Company.
NOT FDIC INSURED § NO BANK GUARANTEE § MAY LOSE VALUE
| | | | | | |
| | | | | | | |
| | | | | | | |
| © 2011 Wells Fargo Funds Management, LLC. All rights reserved. | | | www.wellsfargo.com/advantagefunds | | | 200916 02-11 |
| �� | | | | | | AVT4/AR150 12-10 |
WELLS FARGO ADVANTAGE VARIABLE TRUST FUNDS
| • | | Wells Fargo Advantage VT Omega Growth Fund |
Reduce clutter. Save trees.
Sign up for electronic delivery of prospectuses and shareholder reports at www.wellsfargo.com/advantagedelivery
Contents
| | | | | |
|
| | | 2 | |
| | | 6 | |
| | | 11 | |
| | | 12 | |
Financial Statements | | | | |
| | | 16 | |
| | | 17 | |
| | | 18 | |
| | | 20 | |
| | | 22 | |
| | | 28 | |
| | | 29 | |
| | | 33 | |
The views expressed are as of December 31, 2010, and are those of the Fund managers. Any reference to a specific security in this report is not a recommendation to purchase or sell any specific security or adopt any investment strategy. The views are subject to change at any time in response to changing circumstances in the market and are not intended to predict or guarantee the future performance of any individual security, market sector or the markets generally, or the Wells Fargo Advantage VT Omega Growth Fund.
NOT FDIC INSURED • NO BANK GUARANTEE • MAY LOSS VALUE
WELLS FARGO INVESTMENT HISTORY
| 1932 | | Keystone creates one of the first mutual fund families. |
| |
| 1971 | | Wells Fargo & Company introduces one of the first institutional index funds. |
| |
| 1978 | | Wells Fargo applies Markowitz and Sharpe’s research on Modern Portfolio Theory to introduce one of the industry’s first Tactical Asset Allocation (TAA) models in institutional separately managed accounts. |
| |
| 1984 | | Wells Fargo Stagecoach Funds launches its first asset allocation fund. |
| |
| 1989 | | The Tactical Asset Allocation (TAA) Model is first applied to Wells Fargo’s asset allocation mutual funds. |
| |
| 1994 | | Wells Fargo introduces the LifePath Funds, one of the first suites of target date funds (now the Wells Fargo Advantage Dow Jones Target Date FundsSM). |
| |
| 1996 | | Evergreen Investments and Keystone Funds merge. |
| |
| 1997 | | Wells Fargo launches Wells Fargo Advantage WealthBuilder PortfoliosSM, a fund-of-funds suite of products that includes the use of quantitative models to shift assets among investment styles. |
| |
| 1999 | | Norwest Advantage Funds and Stagecoach Funds are reorganized into Wells Fargo Funds after the merger of Norwest and Wells Fargo. |
| |
| 2002 | | Evergreen Retail and Evergreen Institutional companies form the umbrella asset management company, Evergreen Investments. |
| |
| 2005 | | The integration of Strong Funds with Wells Fargo Funds creates Wells Fargo Advantage Funds, resulting in one of the top 20 mutual fund companies in the United States. |
| |
| 2006 | | Wells Fargo Advantage Funds relaunches the target date product line as Wells Fargo Advantage Dow Jones Target Date Funds. |
| |
| 2010 | | The mergers and reorganizations of Evergreen and Wells Fargo Advantage mutual funds are completed, unifying the families under the brand of Wells Fargo Advantage Funds. |
Wells Fargo Advantage Funds®
Wells Fargo Advantage Funds skillfully guides institutions, financial advisors, and individuals through the investment terrain to help them reach their financial objectives. Everything we do on behalf of investors is backed by our unique combination of qualifications.
Strength
Our organization is built on the standards of integrity and service established by our parent company—Wells Fargo & Company—more than 150 years ago. And, because we’re part of a highly diversified financial enterprise, we offer the depth of resources to help investors succeed.
Expertise
Our multi-boutique model offers investors access to the independent thinking of premier investment managers that have been chosen for their time-tested strategies. While each team specializes in a specific investment strategy, collectively they provide investors a wide choice of distinct investment styles. Our dedication to investment excellence doesn’t end with our expertise in manager selection—risk management, analysis, and rigorous ongoing review seek to ensure each manager’s investment process remains consistent.
Partnership
Our collaborative approach is built around understanding the needs and goals of our clients. By adhering to core principles of sound judgment and steady guidance, we support you through every stage of the investment decision process.
Carefully consider the investment objectives, risks, charges, and expenses before investing. For a current prospectus for Wells Fargo Advantage Funds containing this and other information, visit wellsfargo.com/advantagefunds. Read it carefully before investing.
Wells Fargo Funds Management, LLC, a wholly owned subsidiary of Wells Fargo & Company, provides investment advisory and administrative services for Wells Fargo Advantage Funds®. Other affiliates of Wells Fargo & Company provide subadvisory and other services for the Funds. The Funds are distributed by Wells Fargo Funds Distributor, LLC, Member FINRA/SIPC, an affiliate of Wells Fargo & Company.
The “Dow Jones Target Date Indexes” are a product of Dow Jones Indexes, a licensed trademark of CME Group Index Services LLC (“CME”). “Dow Jones” and “Dow Jones Target Date Indexes” are service marks of Dow Jones Trademark Holdings, LLC, and have been licensed for use for certain purposes by CME and sublicensed for use by Global Index Advisors, Inc., and Wells Fargo Funds Management, LLC. The Dow Jones Target Date Indexes are based in part on the Barclays Capital Bond Indexes, which are published by Barclays Capital Inc. The Wells Fargo Advantage Dow Jones Target Date Funds, based on the Dow Jones Target Date Indexes, are not sponsored, endorsed, sold, or promoted by Dow Jones, CME or Barclays Capital or any of their respective affiliates, and neither Dow Jones, CME nor Barclays Capital nor any of their respective affiliates makes any representation regarding the advisability of investing in such product(s) and/or about the quality, accuracy, and/or completeness of the Dow Jones Target Date Indexes or the Barclays Capital Bond Indexes. IN NO EVENT SHALL DOW JONES, CME, BARCLAYS CAPITAL, OR ANY OF THEIR LICENSORS HAVE ANY LIABILITY FOR ANY SPECIAL, PUNITIVE, INDIRECT, OR CONSEQUENTIAL DAMAGES (INCLUDING LOST PROFITS), EVEN IF NOTIFIED OF THE POSSIBILITY OF SUCH DAMAGES.
NOT FDIC INSURED • NO BANK GUARANTEE • MAY LOSS VALUE
Not part of the annual report.
Wells Fargo Advantage Funds offers more than 120 mutual funds across a wide range of asset classes, representing over $236 billion in assets under management, as of December 31, 2010.
Equity Funds
| | | | |
|
| |
| Asia Pacific Fund | | Enterprise Fund† | | Opportunity Fund† |
| C&B Large Cap Value Fund | | Equity Value Fund | | Precious Metals Fund |
| C&B Mid Cap Value Fund | | Global Opportunities Fund | | Premier Large Company Growth Fund |
| Capital Growth Fund | | Growth Fund | | Small Cap Growth Fund |
| Classic Value Fund | | Growth Opportunities Fund | | Small Cap Opportunities Fund |
| Common Stock Fund | | Health Care Fund | | Small Cap Value Fund |
| Core Equity Fund | | Index Fund | | Small Company Growth Fund |
| Disciplined Global Equity Fund | | International Equity Fund | | Small Company Value Fund |
| Disciplined U.S. Core Fund | | International Value Fund | | Small/Mid Cap Core Fund |
| Disciplined Value Fund | | Intrinsic Small Cap Value Fund | | Small/Mid Cap Value Fund |
Discovery Fund† | | Intrinsic Value Fund | | Social Sustainability Fund† |
| Diversified Equity Fund | | Intrinsic World Equity Fund | | Special Mid Cap Value Fund |
| Diversified International Fund | | Large Cap Core Fund | | Special Small Cap Value Fund |
| Diversified Small Cap Fund | | Large Cap Growth Fund | | Specialized Technology Fund |
| Emerging Growth Fund | | Large Company Value Fund | | Strategic Large Cap Growth Fund |
| Emerging Markets Equity Fund | | Mid Cap Growth Fund | | Traditional Small Cap Growth Fund |
Endeavor Select Fund† | | Omega Growth Fund | | Utility and Telecommunications Fund |
Bond Funds
| | | | |
|
| |
| Adjustable Rate Government Fund | | Inflation-Protected Bond Fund | | Short-Term Bond Fund |
| California Limited-Term Tax-Free Fund | | Intermediate Tax/AMT-Free Fund | | Short-Term High Yield Bond Fund |
| California Tax-Free Fund | | International Bond Fund | | Short-Term Municipal Bond Fund |
| Colorado Tax-Free Fund | | Minnesota Tax-Free Fund | | Strategic Municipal Bond Fund |
| Government Securities Fund | | Municipal Bond Fund | | Total Return Bond Fund |
| High Income Fund | | North Carolina Tax-Free Fund | | Ultra Short-Term Income Fund |
| High Yield Bond Fund | | Pennsylvania Tax-Free Fund | | Ultra Short-Term Municipal Income Fund |
| Income Plus Fund | | Short Duration Government Bond Fund | | Wisconsin Tax-Free Fund |
Asset Allocation Funds
| | | | |
|
| |
| Asset Allocation Fund | | WealthBuilder Equity Portfolio† | | Target 2020 Fund† |
| Conservative Allocation Fund | | WealthBuilder Growth Allocation Portfolio† | | Target 2025 Fund† |
| Diversified Capital Builder Fund | | WealthBuilder Growth Balanced Portfolio† | | Target 2030 Fund† |
| Diversified Income Builder Fund | | WealthBuilder Moderate Balanced Portfolio† | | Target 2035 Fund† |
| Growth Balanced Fund | | WealthBuilder Tactical Equity Portfolio† | | Target 2040 Fund† |
| Index Asset Allocation Fund | | Target Today Fund† | | Target 2045 Fund† |
| Moderate Balanced Fund | | Target 2010 Fund† | | Target 2050 Fund† |
WealthBuilder Conservative Allocation Portfolio† | | Target 2015 Fund† | | |
Money Market Funds
| | | | |
|
| |
| 100% Treasury Money Market Fund | | Minnesota Money Market Fund | | New Jersey Municipal Money Market Fund |
| California Municipal Money Market Fund | | Money Market Fund | | New York Municipal Money Market Fund |
| Cash Investment Money Market Fund | | Municipal Cash Management Money Market Fund | | Pennsylvania Municipal Money Market Fund |
| Government Money Market Fund | | Municipal Money Market Fund | | Prime Investment Money Market Fund |
Heritage Money Market Fund† | | National Tax-Free Money Market Fund | | Treasury Plus Money Market Fund |
Variable Trust Funds1
| | | | |
|
| |
| VT Core Equity Fund | | VT Intrinsic Value Fund | | VT Small Cap Value Fund |
VT Discovery Fund† | | VT Omega Growth Fund | | VT Total Return Bond Fund |
| VT Index Asset Allocation Fund | | VT Opportunity Fund† | | |
| VT International Equity Fund | | VT Small Cap Growth Fund | | |
| | |
| An investment in a money market fund is not insured or guaranteed by the Federal Deposit Insurance Corporation or any other government agency. Although the Wells Fargo Advantage Money Market Funds seek to preserve the value of your investment at $1.00 per share, it is possible to lose money by investing in a money market fund. |
| |
| 1. | | The Variable Trust Funds are generally available only through insurance company variable contracts. |
| |
| † | | In this report, the Wells Fargo Advantage Discovery FundSM, Wells Fargo Advantage Endeavor Select FundSM, Wells Fargo Advantage Enterprise FundSM, Wells Fargo Advantage Opportunity FundSM, Wells Fargo Advantage Social Sustainability FundSM, Wells Fargo Advantage WealthBuilder Conservative Allocation PortfolioSM, Wells Fargo Advantage WealthBuilder Equity PortfolioSM, Wells Fargo Advantage WealthBuilder Growth Allocation PortfolioSM, Wells Fargo Advantage WealthBuilder Growth Balanced PortfolioSM, Wells Fargo Advantage WealthBuilder Moderate Balanced PortfolioSM, Wells Fargo Advantage WealthBuilder Tactical Equity PortfolioSM, Wells Fargo Advantage Dow Jones Target Today FundSM, Wells Fargo Advantage Dow Jones Target 2010 FundSM, Wells Fargo Advantage Dow Jones Target 2015 FundSM, Wells Fargo Advantage Dow Jones Target 2020 FundSM, Wells Fargo Advantage Dow Jones Target 2025 FundSM, Wells Fargo Advantage Dow Jones Target 2030 FundSM, Wells Fargo Advantage Dow Jones Target 2035 FundSM, Wells Fargo Advantage Dow Jones Target 2040 FundSM, Wells Fargo Advantage Dow Jones Target 2045 FundSM, Wells Fargo Advantage Dow Jones Target 2050 FundSM, Wells Fargo Advantage Heritage Money Market FundSM, Wells Fargo Advantage VT Discovery FundSM, and Wells Fargo Advantage VT Opportunity FundSM are referred to as the Discovery Fund, Endeavor Select Fund, Enterprise Fund, Opportunity Fund, Social Sustainability Fund, WealthBuilder Conservative Allocation Portfolio, WealthBuilder Equity Portfolio, WealthBuilder Growth Allocation Portfolio, WealthBuilder Growth Balanced Portfolio, WealthBuilder Moderate Balanced Portfolio, WealthBuilder Tactical Equity Portfolio, Target Today Fund, Target 2010 Fund, Target 2015 Fund, Target 2020 Fund, Target 2025 Fund, Target 2030 Fund, Target 2035 Fund, Target 2040 Fund, Target 2045 Fund, Target 2050 Fund, Heritage Money Market Fund, VT Discovery Fund, and VT Opportunity Fund, respectively. |
Not part of the annual report.
| | |
| 2 Wells Fargo Advantage VT Omega Growth Fund | | Letter to Shareholders |
Karla M. Rabusch,
President
Wells Fargo Advantage Funds
The equity markets delivered strong full-year returns against the backdrop of a strengthening economy.
Dear Valued Shareholder:
We are pleased to provide you with this annual report for the Wells Fargo Advantage VT Omega Growth Fund for the 12 months that ended December 31, 2010. The equity markets delivered strong full-year returns against the backdrop of a strengthening economy. However, the year was not without its share of macroeconomic challenges and market volatility, once again highlighting the value of a sound, well-diversified investment strategy. As always, we believe that such a strategy can enable investors to balance risks and opportunities as they pursue long-term financial goals in a dynamic market environment.
The economic recovery stayed on track.
The U.S. economic recovery that began in the summer of 2009 gained momentum in 2010, particularly toward the end of the year. Gross domestic product (GDP) grew at an annualized rate of 3.2% in the fourth quarter of 2010—capping a streak of six consecutive quarters of positive GDP growth—and 2.9% for the full year. Although the path of recovery has been uneven at times and growth remains subpar compared with previous recoveries, the general consensus among economists is that the economy will likely avoid a double-dip recession. That said, persistent weakness in the labor and housing markets bears close watching in the months ahead.
Jobs and housing remained troublesome.
At the end of the year, the unemployment rate stood at 9.4%, down from 9.9% a year earlier, but still stubbornly high. Unfortunately, the drop may be attributable more to a decline in the labor force than a meaningful uptick in hiring. In fact, employers added just 1.1 million jobs for all of 2010, suggesting that the improving economy has yet to translate into widespread hiring. Meanwhile, the beleaguered housing market was an ongoing source of concern, despite some tentative late-year signs of stabilization.
Other economic data were more encouraging, reflecting greater confidence in the recovery on the part of both consumers and businesses. Retail sales came in strong at certain points during the year, including the critical holiday shopping season, and industrial production and new orders have picked up. Although still reluctant to hire, businesses have gradually increased spending in other areas, such as equipment and technology. Core inflation, which excludes volatile food and energy prices, remained benign.
The Fed continued to do its part.
With inflation subdued, the Federal Reserve (the Fed) held its target range for the federal funds rate—a proxy for short-term interest rates—steady at 0% to 0.25%. In its final statement of 2010, the Fed noted that economic expansion continues to be restrained by headwinds such as high unemployment, modest income growth, lower housing wealth, and tight credit. As a result, the Fed indicated that it intends to keep short-term rates at historically low levels for as long as needed to promote a more robust recovery.
| | |
| Letter to Shareholders | | Wells Fargo Advantage VT Omega Growth Fund 3 |
The Fed also stated that it plans to proceed with other stimulus measures, including its second round of quantitative easing (QE2)—a plan to purchase $600 billion in long-term Treasury securities by mid-2011. The ‘preannouncement’ of QE2 in the third quarter of 2010 marked a turning point for the equity markets in that it ushered in a favorable shift in investor sentiment. By and large, investors interpreted the plan as further evidence of the Fed’s commitment to avoiding deflation and spurring economic growth.
2010 was another solid year for equities.
QE2 was certainly not the only catalyst for the equity markets during 2010. Along with more upbeat economic data, better-than-expected corporate earnings power played a role in driving stock prices higher. Throughout the year, quarterly earnings per share for the majority of companies in the S&P 500 Index consistently exceeded Wall Street estimates. As 2010 drew to a close, the midterm congressional elections and the extension of the Bush-era tax cuts provided additional tailwinds, helping the markets finish the year on a strong note.
It was the second straight year of double-digit total returns for the broad equity market indexes. The S&P 500 Index and the Dow Jones Industrial Average advanced 15.1% and 14.1%, respectively, while the tech-heavy NASDAQ Composite Index returned 18.2%. Investors were generally rewarded across the market-capitalization spectrum—with small- and mid-cap stocks outpacing large-cap stocks—as well as across most economic sectors. In terms of investment styles, growth stocks outperformed their value counterparts for the year.
To be sure, the gains were hard-earned, as the markets had to contend with numerous issues along the way, including the European sovereign debt crisis, China’s efforts to slow growth, and doubts about the sustainability of the domestic recovery. The second quarter in particular witnessed bouts of heightened market volatility, most notably the so-called “flash crash” in May. As the year progressed, however, volatility—as measured by the Chicago Board Options Exchange Volatility Index—abated amid reduced fears of a double-dip recession.
Investors should keep a long-term perspective.
In our view, the equity markets’ dramatic rebound over the past two years from a severe downturn underscores the importance of maintaining a disciplined, long-term investment strategy through changing market cycles. By staying focused on your long-term goals, you may be better positioned both to navigate falling markets and participate in rising markets.
To help you build a well-diversified strategy based on your personal objectives and risk tolerance, Wells Fargo Advantage Funds® offers more than 120 mutual funds and other investments covering a wide range of asset classes and investment styles. Although diversification cannot guarantee an investment profit or prevent losses, we believe it can be an effective way to manage investment risk and potentially smooth out overall portfolio performance.
Along with more upbeat economic data, better-than-expected corporate earnings power played a role in driving stock prices higher.
| | |
| 4 Wells Fargo Advantage VT Omega Growth Fund | | Letter to Shareholders |
Thank you for choosing Wells Fargo Advantage Funds. We appreciate your continued confidence in us and are committed to helping you meet your financial needs. If you have any questions about your investments, please contact your investment professional, call us at 1-800-222-8222, or visit wellsfargo.com/advantagefunds.
Sincerely,

Karla M. Rabusch
President
Wells Fargo Advantage Funds
This page is intentionally left blank.
| | |
| 6 Wells Fargo Advantage VT Omega Growth Fund | | Performance Highlights (Unaudited) |
Wells Fargo Advantage VT Omega Growth Fund
INVESTMENT OBJECTIVE
The Fund seeks long-term capital appreciation.
INVESTMENT ADVISER
Wells Fargo Funds Management, LLC
SUB-ADVISER
Wells Capital Management Incorporated
PORTFOLIO MANAGERS
Thomas J. Pence, CFA
Michael T. Smith, CFA
FUND INCEPTION
March 6, 1997
PERFORMANCE SUMMARY
| | | | | |
| 12 MONTH TOTAL RETURN AS OF DECEMBER 31, 2010 | | | | |
| Class 2 | | | 19.48 | % |
| | | | | |
Russell 3000® Growth Index1 | | | 17.64 | % |
Figures quoted represent past performance, which is no guarantee of future results and do not reflect the deduction of taxes that a shareholder may pay on fund distributions or the redemption of fund shares.
Investment return and principal value of an investment will fluctuate so that an investor’s shares, when redeemed, may be worth more or less than their original cost. Current performance may be lower or higher than the performance data quoted. Current month-end performance is available by calling 1-866-765-0778. Performance figures of the Fund do not reflect fees charged pursuant to the terms of variable life insurance policies and variable annuity contracts.
The adviser has committed, through July 18, 2013, to waive fees and/or reimburse expenses to maintain the contractual expense cap at 1.00% for the Class 2 shares excluding acquired fund fees and certain other expenses. Without these reductions, the Fund’s returns would have been lower. The Fund’s net expense ratio is 1.00% for the Class 2 shares. The Fund’s gross expense ratio is 1.04% for the Class 2 shares.
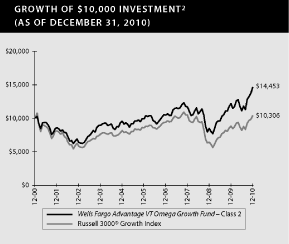
| | |
| 1. | | The Russell 3000® Growth Index measures the performance of those Russell 3000 Index companies with higher price-to-book ratios and higher forecasted growth values. The stocks in this index are also members of either the Russell 1000 Growth Index or the Russell 2000 Growth Index. You cannot invest directly in an index. |
| |
| 2. | | The chart compares the performance of the Wells Fargo Advantage VT Omega Growth Fund Class 2 for the most recent ten years of the Fund with the Russell 3000® Growth Index. The chart assumes a hypothetical $10,000 investment and reflects all operating expenses of the Fund. |
| | |
| Performance Highlights (Unaudited) | | Wells Fargo Advantage VT Omega Growth Fund 7 |
Wells Fargo Advantage VT Omega Growth Fund (continued)
MANAGER’S DISCUSSION
Fund highlights
| • | | The Fund outperformed its benchmark, the Russell 3000® Growth Index3, during the 12-month period that ended December 31, 2010, which was due to positioning in the consumer discretionary and energy sectors. Leading individual contributors were Apple Incorporated, Priceline.com Incorporated, Concho Resources Incorporated, and BorgWarner Incorporated. |
| |
| • | | On May 20, 2010, Thomas J. Pence, CFA, and Michael T. Smith, CFA, assumed management responsibilities for the Fund. From that point on, the Fund outperformed its benchmark due to strong stock selection in the consumer discretionary and information technology sectors. (Prior to May 20, 2010, the Fund underperformed.) |
Fundamental Growth team assumed Fund management on May 20, 2010.
The management style prior to May 20, 2010, focused on high-quality companies with sustainable competitive advantages that were uniquely positioned to achieve long-term secular growth, resulting in a relatively low-turnover portfolio of 40 to 50 holdings. Since the Fundamental Growth team assumed responsibilities, the Fund has become more diversified, with more holdings and a broader market-cap exposure, in keeping with our all-cap growth investment approach. In July, the Fund’s benchmark was changed to the Russell 3000 Growth Index to reflect this all-cap approach.
The Fund is managed using the same “surround the company” investment approach that we apply to our other strategies managed by the Fundamental Growth team. We believe that equity markets are inefficient and that bottom-up stock selection supported by grassroots research can add alpha5. We seek to invest in companies with credible management and effective business models that generate strong or improving returns on invested capital.
Strong stock selection drove Fund performance from May 20 on.
Since May 20, we have benefited from strong stock selection in consumer discretionary and information technology. Auto parts suppliers TRW Automotive Holdings Corporation and BorgWarner Incorporated continued to generate strong earnings amid the rebound in domestic and international auto production. Online
| | | | | |
| TEN LARGEST EQUITY HOLDINGS4 | | | | |
| (AS OF DECEMBER 31, 2010) | | | | |
| |
| Apple Incorporated | | | 4.09 | % |
| Oracle Corporation | | | 2.17 | % |
| Cummins Incorporated | | | 1.68 | % |
| BorgWarner Incorporated | | | 1.68 | % |
| NetLogic Microsystems Incorporated | | | 1.58 | % |
| ConocoPhillips | | | 1.57 | % |
| Precision Castparts Corporation | | | 1.54 | % |
| Amazon.com Incorporated | | | 1.48 | % |
| Eaton Corporation | | | 1.47 | % |
| SBA Communications Corporation Class A | | | 1.43 | % |
| | |
| 3. | | On July 19, 2010, the Fund’s benchmark was changed to the Russell 3000 Growth Index to reflect the Fund’s all-cap investment approach. |
| |
| 4. | | The ten largest equity holdings are calculated based on the value of the securities divided by total investments of the Fund. Holdings are subject to change and may have changed since the date specified. |
| |
| 5. | | Alpha measures the excess return of an investment vehicle, such as a mutual fund, relative to the return of its benchmark, given its level of risk (as measured by beta). Alpha is based on historical performance and does not represent future results. |
| | |
| 8 Wells Fargo Advantage VT Omega Growth Fund | | Performance Highlights (Unaudited) |
Wells Fargo Advantage VT Omega Growth Fund (continued)
travel retailer Priceline.com delivered solid earnings and guidance with better-than-expected growth in Europe. The information technology sector was marked by increasingly selective investor behavior. While we remained focused on key growth themes of data center growth, virtualization, and smartphone adoption, performance has been driven by company-specific innovations that provide growth regardless of changes in investor sentiment. For example, F5 Networks Incorporated, a networking equipment provider, contributed through product differentiation, leading to market share gains and strong earnings growth.
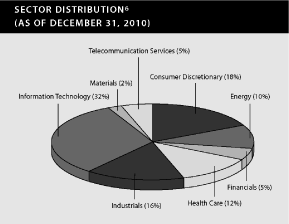
The main detractor from Fund performance during the period since May 20 was Equinix Incorporated, a leading operator of offsite data centers. We believe the company is uniquely positioned for long-term growth as more companies outsource IT infrastructure and move to a “cloud computing” environment. Unfortunately, integration issues with a company acquired by Equinix Incorporated in April led to a disappointing revenue preannouncement and share price decline. We have since reassessed our thesis for Equinix Incorporated and determined that this short-term setback may not affect the company’s long-term growth potential. The market appeared to reach a similar conclusion. The stock recovered considerably from its low, yet it was still down for the period.
The Fund underperformed prior to May 20.
The Fund underperformed from January 1 until May 20—due to unfavorable stock selection in information technology and financials. Within technology, Visa declined due to the impact of potential debit interchange rate reductions, while Google shares fell—partly as a result of the company’s public debate with China. Within consumer discretionary, online retail holdings Blue Nile and Amazon.com accounted for most of the weakness in the sector. Blue Nile’s underperformance was partially attributable to concerns about strength in its end markets. Amazon.com struggled when the firm’s forward earnings guidance came in below consensus estimates.
We are optimistic entering 2011.
As we proceed into 2011, many companies exhibit sound balance sheets, strong free cash flows, and reasonable share valuations. Accordingly, we remain upbeat about prospects for continued corporate earnings growth and positive equity returns.
| | |
| 6. | | Sector distribution is subject to change and is calculated based on the total common stock investments of the Fund. |
| | |
| Performance Highlights (Unaudited) | | Wells Fargo Advantage VT Omega Growth Fund 9 |
Wells Fargo Advantage VT Omega Growth Fund (continued)
We believe that the long-awaited transition from government stimulus to private-sector spending is finally occurring. After years of frugality, and with new tax incentives serving as a catalyst, company management teams are beginning to invest their massive cash reserves in research and development, capital equipment, technology, and labor. As a precursor to future capital spending, share repurchases and merger and acquisition activity increased during 2010. We also believe that consumer confidence and spending will continue to improve as the labor market slowly recovers. As top-line demand picks up, many companies are poised for incremental profit margin expansion that will drive further earnings growth.
Global investors appear to be taking notice of these trends, providing a potential tailwind for U.S. stocks. In fact, we believe that we are seeing a shift from a “cyclical” to a “secular” investing environment in which investors will be more apt to reward companies with solid revenue and earnings growth. Such an environment has historically been conducive to our fundamental stock selection, or what we like to call “surrounding the company.”
| | |
| 10 Wells Fargo Advantage VT Omega Growth Fund | | Performance Highlights (Unaudited) |
Wells Fargo Advantage VT Omega Growth Fund (continued)
AVERAGE ANNUAL TOTAL RETURN (%) (AS OF DECEMBER 31, 2010)7
| | | | | | | | | | | | | | | | | | | | | | | | | | | | | |
| | | | | | | | | | | | | | | | | | | | | | | Expense Ratios8 | |
| | | Inception Date | | | 6 Months* | | | 1 Year | | | 5 Year | | | 10 Year | | | Gross | | | Net9 | |
| |
| Class 1 | | | 3/6/1997 | | | | 31.03 | | | | 19.79 | | | | 8.31 | | | | 3.98 | | | | 0.79 | % | | | 0.75 | % |
| Class 2 | | | 7/31/2002 | | | | 30.86 | | | | 19.48 | | | | 8.02 | | | | 3.75 | | | | 1.04 | % | | | 1.00 | % |
Russell 3000® Growth Index1 | | | | | | | 26.83 | | | | 17.64 | | | | 3.88 | | | | 0.30 | | | | | | | | | |
| | |
| * | | Returns for periods of less than one year are not annualized. |
Figures quoted represent past performance, which is no guarantee of future results and do not reflect the deduction of taxes that a shareholder may pay on fund distributions or the redemption of fund shares. Investment return and principal value of an investment will fluctuate so that an investor’s shares, when redeemed, may be worth more or less than their original cost. Current performance may be lower or higher than the performance data quoted. Current month-end performance is available by calling 1-866-765-0778. Performance figures of the Fund do not reflect fees charged pursuant to the terms of variable life insurance policies and variable annuity contracts.
Stock fund values fluctuate in response to the activities of individual companies and general market and economic conditions. The use of derivatives may reduce returns and/or increase volatility. Certain investment strategies tend to increase the total risk of an investment (relative to the broader market). This Fund is exposed to smaller company securities risk. Consult the Fund’s prospectus for additional information on these and other risks.
Please refer to the prospectus provided by your participating insurance company for detailed information describing the separate accounts for information regarding surrender charges, mortality and expense risk fees and other charges that may be assessed by the participating insurance companies.
| | |
| 7. | | Performance shown for Class 2 shares prior to its inception reflects the performance of Class 1 shares, adjusted to reflect the higher expenses applicable to Class 2 shares. Historical performance shown for all classes of the Fund prior to July 19, 2010 is based on the performance of the fund’s predecessor, Evergreen VA Omega Fund. |
| |
| 8. | | Reflects the expense ratio as stated in the July 19, 2010 prospectus. |
| |
| 9. | | The adviser has committed, through July 18, 2013, to waive fees and/or reimburse expenses to maintain the contractual expense cap at 0.75% for Class 1 shares and 1.00% for Class 2 shares, excluding acquired fund fees and certain other expenses. Without these reductions, the Fund’s returns would have been lower. |
| | |
| Fund Expenses (Unaudited) | | Wells Fargo Advantage VT Omega Growth Fund 11 |
As a shareholder of the Fund, you incur two types of costs: (1) transaction costs, including sales charges (loads) on purchase payments, redemption fees (if any) and exchange fees (if any); and (2) ongoing costs, including management fees; distribution (12b-1) and/or shareholder service fees; and other Fund expenses. This example is intended to help you understand your ongoing costs (in dollars) of investing in the Fund and to compare these costs with the ongoing costs of investing in other mutual funds.
The example is based on an investment of $1,000 invested at the beginning of the six-month period and held for the entire period from July 1, 2010 to December 31, 2010.
Actual expenses
The “Actual” line of the table below provides information about actual account values and actual expenses. You may use the information in this line, together with the amount you invested, to estimate the expenses that you paid over the period. Simply divide your account value by $1,000 (for example, an $8,600 account value divided by $1,000 = 8.6), then multiply the result by the number in the “Actual” line under the heading entitled “Expenses Paid During Period” for your applicable class of shares to estimate the expenses you paid on your account during this period.
Hypothetical example for comparison purposes
The “Hypothetical” line of the table below provides information about hypothetical account values and hypothetical expenses based on the Fund’s actual expense ratio and an assumed rate of return of 5% per year before expenses, which is not the Fund’s actual return. The hypothetical account values and expenses may not be used to estimate the actual ending account balance or expenses you paid for the period. You may use this information to compare the ongoing costs of investing in the Fund and other funds. To do so, compare this 5% hypothetical example with the 5% hypothetical examples that appear in the shareholder reports of the other funds.
Please note that the expenses shown in the table are meant to highlight your ongoing costs only and do not reflect any transactional costs, such as sales charges (loads), redemption fees, exchange fees or separate account charges assessed by participating insurance companies. Therefore, the “Hypothetical” line of the table is useful in comparing ongoing costs only, and will not help you determine the relative total costs of owning different funds. In addition, if these transactional costs were included, your costs would have been higher.
| | | | | | | | | | | | | | | | | |
| | | Beginning | | | Ending | | | Expenses | | | | |
| | | Account Value | | | Account Value | | | Paid During | | | Net Annual | |
| | | 07-01-2010 | | | 12-31-2010 | | | the Period1 | | | Expense Ratio | |
| |
Class 1 | | | | | | | | | | | | | | | | |
| Actual | | $ | 1,000.00 | | | $ | 1,310.34 | | | $ | 4.41 | | | | 0.75 | % |
| Hypothetical (5% return before expenses) | | $ | 1,000.00 | | | $ | 1,021.66 | | | $ | 3.86 | | | | 0.75 | % |
| | | | | | | | | | | | | | | | | |
Class 2 | | | | | | | | | | | | | | | | |
| Actual | | $ | 1,000.00 | | | $ | 1,308.62 | | | $ | 5.88 | | | | 1.00 | % |
| Hypothetical (5% return before expenses) | | $ | 1,000.00 | | | $ | 1,020.38 | | | $ | 5.15 | | | | 1.00 | % |
| | |
| 1. | | Expenses are equal to the Fund’s annualized expense ratio multiplied by the average account value over the period, multiplied by the number of days in the most recent fiscal half-year divided by the number of days in the fiscal year (to reflect the one-half year period). |
| | |
| 12 Wells Fargo Advantage VT Omega Growth Fund | | Portfolio of Investments—December 31, 2010 |
| | | | | | | | | |
| Shares | | | Security Name | | Value | |
| Common Stocks: 99.03% | | | | |
| | | | | | | | | |
| Consumer Discretionary: 17.46% | | | | |
| | | | | | | | | |
| Auto Components: 3.42% | | | | |
| | 40,900 | | | BorgWarner IncorporatedǠ | | $ | 2,959,524 | |
| | 33,205 | | | TRW Automotive Holdings Corporation† | | | 1,749,903 | |
| | | | | | | | | |
| | | | | | | | 4,709,427 | |
| | | | | | | | |
| | | | | | | | | |
| Automobiles: 1.38% | | | | |
| | 28,000 | | | Daimler AG | | | 1,892,240 | |
| | | | | | | | |
| | | | | | | | | |
| Hotels, Restaurants & Leisure: 1.22% | | | | |
| | 40,500 | | | Marriott International Incorporated Class A | | | 1,682,370 | |
| | | | | | | | |
| | | | | | | | | |
| Internet & Catalog Retail: 3.53% | | | | |
| | 14,500 | | | Amazon.com Incorporated† | | | 2,610,000 | |
| | 5,600 | | | Priceline.com Incorporated† | | | 2,237,480 | |
| | | | | | | | | |
| | | | | | | | 4,847,480 | |
| | | | | | | | |
| | | | | | | | | |
| Media: 1.29% | | | | |
| | 34,294 | | | Scripps Networks Interactive Incorporated Class A | | | 1,774,715 | |
| | | | | | | | |
| | | | | | | | | |
| Multiline Retail: 4.12% | | | | |
| | 68,422 | | | Dollar General Corporation† | | | 2,098,503 | |
| | 30,200 | | | Kohl’s Corporation«† | | | 1,641,068 | |
| | 76,200 | | | Macy’s Incorporated | | | 1,927,860 | |
| | | | | | | | | |
| | | | | | | | 5,667,431 | |
| | | | | | | | |
| | | | | | | | | |
| Specialty Retail: 2.50% | | | | |
| | 54,800 | | | Dick’s Sporting Goods Incorporated«† | | | 2,055,000 | |
| | 22,870 | | | Jo-Ann Stores IncorporatedǠ | | | 1,377,231 | |
| | | | | | | | | |
| | | | | | | | 3,432,231 | |
| | | | | | | | |
| | | | | | | | | |
| Energy: 9.84% | | | | |
| | | | | | | | | |
| Energy Equipment & Services: 1.51% | | | | |
| | 50,800 | | | Halliburton Company | | | 2,074,164 | |
| | | | | | | | |
| | | | | | | | | |
| Oil, Gas & Consumable Fuels: 8.33% | | | | |
| | 72,600 | | | Brigham Exploration CompanyǠ | | | 1,977,624 | |
| | 26,244 | | | Concho Resources IncorporatedǠ | | | 2,300,811 | |
| | 40,800 | | | ConocoPhillips | | | 2,778,480 | |
| | 30,651 | | | Newfield Exploration Company† | | | 2,210,244 | |
| | 25,100 | | | Pioneer Natural Resources Company« | | | 2,179,182 | |
| | | | | | | | | |
| | | | | | | | 11,446,341 | |
| | | | | | | | |
| | | | | | | | | |
| Financials: 4.46% | | | | |
| | | | | | | | | |
| Capital Markets: 1.14% | | | | |
| | 8,214 | | | BlackRock Incorporated | | | 1,565,424 | |
| | | | | | | | |
| | | | | | | | | |
| Commercial Banks: 1.08% | | | | |
| | 61,800 | | | Itau Unibanco Holding SA ADS« | | | 1,483,816 | |
| | | | | | | | |
| | | | | | | | | |
| Consumer Finance: 0.95% | | | | |
| | 30,503 | | | American Express Company | | | 1,309,189 | |
| | | | | | | | |
| | |
| Portfolio of Investments—December 31, 2010 | | Wells Fargo Advantage VT Omega Growth Fund 13 |
| | | | | | | | | |
| Shares | | | Security Name | | Value | |
| Diversified Financial Services: 1.29% | | | | |
| | 375,620 | | | Citigroup Incorporated† | | $ | 1,776,683 | |
| | | | | | | | |
| | | | | | | | | |
| Health Care: 12.08% | | | | |
| | | | | | | | | |
| Biotechnology: 1.61% | | | | |
| | 27,446 | | | Alexion Pharmaceuticals IncorporatedǠ | | | 2,210,775 | |
| | | | | | | | |
| | | | | | | | | |
| Health Care Equipment & Supplies: 4.13% | | | | |
| | 23,607 | | | Alere IncorporatedǠ | | | 864,016 | |
| | 35,714 | | | Sirona Dental Systems IncorporatedǠ | | | 1,492,131 | |
| | 28,300 | | | Varian Medical Systems IncorporatedǠ | | | 1,960,624 | |
| | 49,700 | | | Volcano CorporationǠ | | | 1,357,307 | |
| | | | | | | | | |
| | | | | | | | 5,674,078 | |
| | | | | | | | |
| | | | | | | | | |
| Health Care Providers & Services: 3.77% | | | | |
| | 39,359 | | | Express Scripts Incorporated† | | | 2,127,354 | |
| | 15,500 | | | Laboratory Corporation of America HoldingsǠ | | | 1,362,760 | |
| | 24,069 | | | McKesson Corporation | | | 1,693,976 | |
| | | | | | | | | |
| | | | | | | | 5,184,090 | |
| | | | | | | | |
| | | | | | | | | |
| Health Care Technology: 1.54% | | | | |
| | 22,400 | | | Cerner CorporationǠ | | | 2,122,176 | |
| | | | | | | | |
| | | | | | | | | |
| Life Sciences Tools & Services: 1.03% | | | | |
| | 85,600 | | | Bruker CorporationǠ | | | 1,420,960 | |
| | | | | | | | |
| | | | | | | | | |
| Industrials: 16.29% | | | | |
| | | | | | | | | |
| Aerospace & Defense: 4.00% | | | | |
| | 46,400 | | | Embraer SA | | | 1,364,160 | |
| | 19,500 | | | Precision Castparts Corporation« | | | 2,714,595 | |
| | 19,700 | | | TransDign Group Incorporated† | | | 1,418,597 | |
| | | | | | | | | |
| | | | | | | | 5,497,352 | |
| | | | | | | | |
| | | | | | | | | |
| Airlines: 1.02% | | | | |
| | 111,600 | | | Delta Air Lines IncorporatedǠ | | | 1,406,160 | |
| | | | | | | | |
| | | | | | | | | |
| Electrical Equipment: 1.80% | | | | |
| | 43,400 | | | Emerson Electric Company | | | 2,481,178 | |
| | | | | | | | |
| | | | | | | | | |
| Machinery: 5.40% | | | | |
| | 36,800 | | | AGCO CorporationǠ | | | 1,864,288 | |
| | 26,964 | | | Cummins Incorporated | | | 2,966,310 | |
| | 25,500 | | | Eaton Corporation | | | 2,588,505 | |
| | | | | | | | | |
| | | | | | | | 7,419,103 | |
| | | | | | | | |
| | | | | | | | | |
| Professional Services: 1.04% | | | | |
| | 22,700 | | | Manpower Incorporated« | | | 1,424,652 | |
| | | | | | | | |
| | | | | | | | | |
| Road & Rail: 1.44% | | | | |
| | 21,400 | | | Union Pacific Corporation | | | 1,982,924 | |
| | | | | | | | |
| | | | | | | | | |
| Trading Companies & Distributors: 1.59% | | | | |
| | 41,300 | | | Wesco International IncorporatedǠ | | | 2,180,640 | |
| | | | | | | | |
| | |
| 14 Wells Fargo Advantage VT Omega Growth Fund | | Portfolio of Investments—December 31, 2010 |
| | | | | | | | | |
| Shares | | | Security Name | | Value | |
| Information Technology: 31.22% | | | | |
| | | | | | | | | |
| Communications Equipment: 2.86% | | | | |
| | 69,270 | | | Finisar Corporation† | | $ | 2,056,626 | |
| | 50,600 | | | Juniper Networks IncorporatedǠ | | | 1,868,152 | |
| | | | | | | | | |
| | | | | | | | 3,924,778 | |
| | | | | | | | |
| | | | | | | | | |
| Computers & Peripherals: 8.06% | | | | |
| | 22,400 | | | Apple Incorporated† | | | 7,225,344 | |
| | 88,800 | | | EMC Corporation† | | | 2,033,520 | |
| | 33,200 | | | NetApp IncorporatedǠ | | | 1,824,672 | |
| | | | | | | | | |
| | | | | | | | 11,083,536 | |
| | | | | | | | |
| | | | | | | | | |
| Internet Software & Services: 3.21% | | | | |
| | 12,800 | | | Equinix Incorporated† | | | 1,040,128 | |
| | 15,400 | | | F5 Networks Incorporated† | | | 2,004,464 | |
| | 19,900 | | | Sina CorporationǠ | | | 1,369,518 | |
| | | | | | | | | |
| | | | | | | | 4,414,110 | |
| | | | | | | | |
| | | | | | | | | |
| IT Services: 2.38% | | | | |
| | 63,319 | | | Gartner IncorporatedǠ | | | 2,102,191 | |
| | 38,840 | | | Hisoft Technology International† | | | 1,172,968 | |
| | | | | | | | | |
| | | | | | | | 3,275,159 | |
| | | | | | | | |
| | | | | | | | | |
| Semiconductors & Semiconductor Equipment: 2.04% | | | | |
| | 89,090 | | | NetLogic Microsystems Incorporated† | | | 2,798,317 | |
| | | | | | | | |
| | | | | | | | | |
| Software: 12.67% | | | | |
| | 36,500 | | | Citrix Systems Incorporated† | | | 2,496,965 | |
| | 29,000 | | | Concur Technologies IncorporatedǠ | | | 1,505,970 | |
| | 42,075 | | | Longtop Financial Technologies Limited ADSǠ | | | 1,522,274 | |
| | 122,500 | | | Oracle Corporation | | | 3,834,250 | |
| | 43,889 | | | Reald Incorporated† | | | 1,137,603 | |
| | 28,500 | | | Red Hat IncorporatedǠ | | | 1,301,025 | |
| | 13,200 | | | Salesforce.com IncorporatedǠ | | | 1,742,400 | |
| | 61,317 | | | SuccessFactors IncorporatedǠ | | | 1,775,740 | |
| | 106,700 | | | TIBCO Software Incorporated† | | | 2,103,057 | |
| | | | | | | | | |
| | | | | | | | 17,419,284 | |
| | | | | | | | |
| | | | | | | | | |
| Materials: 2.42% | | | | |
| | | | | | | | | |
| Chemicals: 1.27% | | | | |
| | 50,700 | | | LyondellBasell Class A† | | | 1,744,080 | |
| | | | | | | | |
| | | | | | | | | |
| Containers & Packaging: 1.15% | | | | |
| | 48,300 | | | Bemis Company Incorporated« | | | 1,577,479 | |
| | | | | | | | |
| | | | | | | | | |
| Telecommunication Services: 5.26% | | | | |
| | | | | | | | | |
| Wireless Telecommunication Services: 5.26% | | | | |
| | 46,500 | | | American Tower Corporation Class A† | | | 2,401,260 | |
| | 51,400 | | | NII Holdings Incorporated† | | | 2,295,524 | |
| | 61,803 | | | SBA Communications Corporation Class AǠ | | | 2,530,215 | |
| | | | | | | | 7,226,999 | |
| | | | | | | | |
| | | | | | | | | |
| Total Common Stocks (Cost $107,133,771) | | | 136,129,341 | |
| | | | | | | | |
| | |
| Portfolio of Investments—December 31, 2010 | | Wells Fargo Advantage VT Omega Growth Fund 15 |
| | | | | | | | | | | | | | | | | |
| Principal | | | Security Name | | Interest Rate | | | Maturity Date | | | Value | |
| Short-Term Investments: 29.44% | | | | | | | | | | | | |
| | | | | | | | | | | | | | | | | |
| Corporate Bonds & Notes: 0.17% | | | | | | | | | | | | |
| $ | 209,154 | | | Gryphon Funding Limited(v)(a)(i) | | | 0.00 | % | | | 08/05/2011 | | | $ | 84,958 | |
| | 275,114 | | | VFNC Corporation(v)††±(a)(i) | | | 0.26 | | | | 09/29/2011 | | | | 154,064 | |
| | | | | | | | | | | | | | | | | |
| | | | | | | | | | | | | | | | 239,022 | |
| | | | | | | | | | | | | | | | |
| | | | | | | | | | | | | | | | | |
| Shares | | | | Yield | | | | | | | | |
| Investment Companies: 29.27% | | | | | | | | | | | | |
| | 1,692,656 | | | Wells Fargo Advantage Cash Investment Money Market Fund(l)(u) | | | 0.14 | | | | | | | | 1,692,656 | |
| | 38,542,212 | | | Wells Fargo Securities Lending Cash Investments LLC(v)(l)(u) | | | 0.27 | | | | | | | | 38,542,212 | |
| | | | | | | | | | | | | | | | | |
| | | | | | | | | | | | | | | | 40,234,868 | |
| | | | | | | | | | | | | | | | |
| | | | | | | | | | | | | | | | | |
| Total Short-Term Investments (Cost $40,386,174) | | | | | | | | | | | 40,473,890 | |
| | | | | | | | | | | | | | | | |
| | | | | | | | | | | | | | | | | |
|
Total Investments in Securities (Cost $147,519,945)* | | | 128.47 | % | | | | | | | | | | | 176,603,231 | |
| | | | | | | | | | | | | | | | | |
Other Assets and Liabilities, Net | | | (28.47 | ) | | | | | | | | | | | (39,133,188 | ) |
| | | | | | | | | | | | | | | |
| | | | | | | | | | | | | | | | | |
Total Net Assets | | | 100.00 | % | | | | | | | | | | $ | 137,470,043 | |
| | | | | | | | | | | | | | | |
| | |
| (v) | | Security represents investment of cash collateral received from securities on loan. |
| |
| (l) | | Investment in an affiliate. |
| |
| « | | All or a portion of this security is on loan. |
| |
| † | | Non-income earning securities. |
| |
| †† | | Securities that may be resold to “qualified institutional buyers” under Rule 144A or securities offered pursuant to Section 4(2) of the Securities Act of 1933, as amended. |
| |
| ± | | Variable rate investments. |
| |
| (a) | | Security is fair valued by the Management Valuation Team, and in certain instances by the Board of Trustees, in accordance with procedures approved by the Board of Trustees. |
| |
| (i) | | Illiquid security for which the designation as illiquid is unaudited. |
| |
| (u) | | Rate shown is the 7-day annualized yield at period end. |
| |
| * | | Cost for federal income tax purposes is $147,733,110 and net unrealized appreciation (depreciation) consists of: |
| | | | | |
|
| Gross unrealized appreciation | | $ | 29,257,482 | |
| Gross unrealized depreciation | | | (387,361 | ) |
| | | | |
| | | | | |
| Net unrealized appreciation | | $ | 28,870,121 | |
The accompanying notes are an integral part of these financial statements.
| | |
| 16 Wells Fargo Advantage VT Omega Growth Fund | | Statement of Assets and Liabilities—December 31, 2010 |
| | | | | |
|
Assets | | | | |
| Investments | | | | |
| In unaffiliated securities (including securities on loan), at value | | $ | 136,368,363 | |
| In affiliated securities, at value | | | 40,234,868 | |
| | | | |
| Total investments, at value (see cost below) | | | 176,603,231 | |
| Receivable for investments sold | | | 447,712 | |
| Receivable for Fund shares sold | | | 35,065 | |
| Receivable for dividends | | | 48,091 | |
| Receivable for securities lending income | | | 4,907 | |
| Prepaid expenses and other assets | | | 1,920 | |
| | | | |
| Total assets | | | 177,140,926 | |
| | | | |
| | | | | |
Liabilities | | | | |
| Payable for investments purchased | | | 780,782 | |
| Payable for Fund shares redeemed | | | 43,953 | |
| Payable upon receipt of securities loaned | | | 38,693,518 | |
| Investment advisory fee payable | | | 66,689 | |
| Distribution fees payable | | | 17,578 | |
| Due to other related parties | | | 16,515 | |
| Accrued expenses and other liabilities | | | 51,848 | |
| | | | |
| Total liabilities | | | 39,670,883 | |
| | | | |
Total net assets | | $ | 137,470,043 | |
| | | | |
| | | | | |
NET ASSETS CONSIST OF | | | | |
| Paid-in capital | | $ | 119,333,189 | |
| Accumulated net investment loss | | | (3,029 | ) |
| Accumulated net realized losses on investments | | | (10,943,403 | ) |
| Net unrealized gains on investments | | | 29,083,286 | |
| | | | |
Total net assets | | $ | 137,470,043 | |
| | | | |
| | | | | |
COMPUTATION OF NET ASSET VALUE PER SHARE1 | | | | |
| Net assets – Class 1 | | $ | 54,246,222 | |
| Shares outstanding – Class 1 | | | 2,236,058 | |
| Net asset value per share – Class 1 | | $ | 24.26 | |
| Net assets – Class 2 | | $ | 83,223,821 | |
| Shares outstanding – Class 2 | | | 3,467,902 | |
| Net asset value per share – Class 2 | | $ | 24.00 | |
| | | | | |
| Total investments, at cost | | $ | 147,519,945 | |
| | | | |
| Securities on loan, at value | | $ | 37,613,683 | |
| | | | |
| | |
| 1. | | The Fund has an unlimited number of authorized shares. |
| |
| The accompanying notes are an integral part of these financial statements. |
| | |
| Statement of Operations—For the Year Ended December 31, 20101 | | Wells Fargo Advantage VT Omega Growth Fund 17 |
| | | | | |
|
Investment income | | | | |
| Dividends* | | $ | 663,788 | |
| Income from affiliated securities | | | 2,007 | |
| Securities lending income, net | | | 49,931 | |
| | | | |
| Total investment income | | | 715,726 | |
| | | | |
| | | | | |
Expenses | | | | |
| Investment advisory fee | | | 544,732 | |
| Administration fees | | | | |
| Fund level | | | 72,082 | |
| Class 1 | | | 18,344 | |
| Class 2 | | | 28,526 | |
| Distribution fees | | | | |
| Class 2 | | | 125,080 | |
| Custody and accounting fees | | | 18,920 | |
| Professional fees | | | 41,094 | |
| Shareholder report expenses | | | 32,301 | |
| Trustees’ fees and expenses | | | 7,358 | |
| Transfer agent fees | | | 276 | |
| Other fees and expenses | | | 1,926 | |
| | | | |
| Total expenses | | | 890,639 | |
| Less: Fee waivers and/or expense reimbursements | | | (10,966 | ) |
| | | | |
| Net expenses | | | 879,673 | |
| | | | |
Net investment loss | | | (163,947 | ) |
| | | | |
| | | | | |
NET REALIZED AND UNREALIZED GAINS (LOSSES) ON INVESTMENTS | | | | |
| Net realized gains on unaffiliated securities | | | 13,266,207 | |
| Net change in unrealized gains (losses) on unaffiliated securities | | | 12,283,320 | |
| | | | |
| Net realized and unrealized gains (losses) on investments | | | 25,549,527 | |
| | | | |
Net increase in net assets resulting from operations | | $ | 25,385,580 | |
| | | | |
| | | | | |
| * Net of foreign withholding taxes of | | $ | 13,604 | |
| | |
| 1. | | After the close of business on July 16, 2010, the Fund acquired the net assets of Evergreen VA Omega Fund, which became the accounting and performance survivor in the transaction. The information for the period prior to July 19, 2010 is that of Evergreen VA Omega Fund. |
The accompanying notes are an integral part of these financial statements.
| | |
| 18 Wells Fargo Advantage VT Omega Growth Fund | | Statements of Changes in Net Assets |
| | | | | | | | | | | | | | | | | |
| | | Year Ended | | | Year Ended | |
| | | December 31, 20101 | | | December 31, 20091 | |
| |
Operations | | | | | | | | | | | | | | | | |
| Net investment income (loss) | | | | | | $ | (163,947 | ) | | | | | | $ | 538,120 | |
| Net realized gains (losses) on investments | | | | | | | 13,266,207 | | | | | | | | (3,290,873 | ) |
| Net change in unrealized gains (losses) on investments | | | | | | | 12,283,320 | | | | | | | | 28,130,011 | |
| | | |
| Net increase in net assets resulting from operations | | | | | | | 25,385,580 | | | | | | | | 25,377,258 | |
| | | |
| | | | | | | | | | | | | | | | | |
Distributions to shareholders from | | | | | | | | | | | | | | | | |
| Net investment income | | | | | | | | | | | | | | | | |
| Class 1 | | | | | | | (439,899 | ) | | | | | | | (547,686 | ) |
| Class 2 | | | | | | | (140,680 | ) | | | | | | | (269,517 | ) |
| | | |
| Total distributions to shareholders | | | | | | | (580,579 | ) | | | | | | | (817,203 | ) |
| | | |
| | | | | | | | | | | | | | | | | |
| | | Shares | | | | | | Shares | | | | |
Capital shares transactions | | | | | | | | | | | | | | | | |
| Proceeds from shares sold | | | | | | | | | | | | | | | | |
| Class 1 | | | 428,669 | | | | 8,952,888 | | | | 1,104,196 | | | | 18,978,953 | |
| Class 2 | | | 494,435 | | | | 9,722,414 | | | | 692,367 | | | | 11,499,013 | |
| | | |
| | | | | | | | 18,675,302 | | | | | | | | 30,477,966 | |
| | | |
| | | | | | | | | | | | | | | | | |
| Reinvestment of distributions | | | | | | | | | | | | | | | | |
| Class 1 | | | 21,311 | | | | 439,899 | | | | 41,840 | | | | 547,686 | |
| Class 2 | | | 6,845 | | | | 140,680 | | | | 20,780 | | | | 269,517 | |
| | | |
| | | | | | | | 580,579 | | | | | | | | 817,203 | |
| | | |
| | | | | | | | | | | | | | | | | |
| Payment for shares redeemed | | | | | | | | | | | | | | | | |
| Class 1 | | | (1,143,173 | ) | | | (23,005,725 | ) | | | (707,734 | ) | | | (11,521,894 | ) |
| Class 2 | | | (1,245,566 | ) | | | (25,157,874 | ) | | | (676,272 | ) | | | (10,191,188 | ) |
| | | |
| | | | | | | | (48,163,599 | ) | | | | | | | (21,713,082 | ) |
| | | |
| | | | | | | | | | | | | | | | | |
| Net asset value of shares issued in acquisitions Class 2 | | | 2,568,116 | | | | 48,569,090 | | | | 0 | | | | 0 | |
| | | |
| Net increase in net assets resulting from capital share transactions | | | | | | | 19,661,372 | | | | | | | | 9,582,087 | |
| | | |
Total increase in net assets | | | | | | | 44,466,373 | | | | | | | | 34,142,142 | |
| | | |
Net assets | | | | | | | | | | | | | | | | |
| | | |
| Beginning of period | | | | | | | 93,003,670 | | | | | | | | 58,861,528 | |
| | | |
| End of period | | | | | | $ | 137,470,043 | | | | | | | $ | 93,003,670 | |
| | | |
| Undistributed (accumulated) net investment income (loss) | | | | | | $ | (3,029 | ) | | | | | | $ | 536,244 | |
| | | |
| | |
| 1. | | After the close of business on July 16, 2010, the Fund acquired the net assets of Evergreen VA Omega Fund, which became the accounting and performance survivor in the transaction. The information for the periods prior to July 19, 2010 are of those of Evergreen VA Omega Fund. |
The accompanying notes are an integral part of these financial statements.
This page is intentionally left blank.
| | |
| 20 Wells Fargo Advantage VT Omega Growth Fund4 | | Financial Highlights |
| | | | | | | | | | | | | | | | | | | | | |
| | | Beginning | | | Net | | | Net Realized | | | Distributions | | | Ending | |
| | | Net Asset | | | Investment | | | and Unrealized | | | from Net | | | Net Asset | |
| | | Value Per | | | Income | | | Gains (Losses) | | | Investment | | | Value Per | |
| | | Share | | | (Loss) | | | on Investments | | | Income | | | Share | |
| |
| Class 1 | | | | | | | | | | | | | | | | | | | | |
| January 1, 2010 to December 31, 2010 | | $ | 20.42 | | | | 0.03 | | | | 3.98 | | | | (0.17 | ) | | $ | 24.26 | |
| January 1, 2009 to December 31, 2009 | | $ | 14.43 | | | | 0.13 | | | | 6.09 | | | | (0.23 | ) | | $ | 20.42 | |
| January 1, 2008 to December 31, 2008 | | $ | 19.82 | | | | 0.23 | | | | (5.62 | ) | | | 0.00 | | | $ | 14.43 | |
| January 1, 2007 to December 31, 2007 | | $ | 17.80 | | | | 0.08 | | | | 2.05 | | | | (0.11 | ) | | $ | 19.82 | |
| January 1, 2006 to December 31, 2006 | | $ | 16.79 | | | | 0.05 | | | | 0.96 | | | | 0.00 | | | $ | 17.80 | |
| Class 2 | | | | | | | | | | | | | | | | | | | | |
| January 1, 2010 to December 31, 2010 | | $ | 20.19 | | | | (0.07 | )3 | | | 3.99 | | | | (0.11 | ) | | $ | 24.00 | |
| January 1, 2009 to December 31, 2009 | | $ | 14.25 | | | | 0.11 | | | | 6.00 | | | | (0.17 | ) | | $ | 20.19 | |
| January 1, 2008 to December 31, 2008 | | $ | 19.63 | | | | 0.15 | | | | (5.53 | ) | | | 0.00 | | | $ | 14.25 | |
| January 1, 2007 to December 31, 2007 | | $ | 17.62 | | | | 0.01 | | | | 2.05 | | | | (0.05 | ) | | $ | 19.63 | |
| January 1, 2006 to December 31, 2006 | | $ | 16.67 | | | | 0.01 | | | | 0.94 | | | | 0.00 | | | $ | 17.62 | |
| | |
| 1. | | Total return calculations would have been lower had certain expenses not been waived or reimbursed during the periods shown. |
| |
| 2. | | Calculated on the basis of the Fund as a whole without distinguishing between the classes of shares issued. |
| |
| 3. | | Calculated based on average shares outstanding. |
| |
| 4. | | After the close of business on July 16, 2010, the Fund acquired the net assets of Evergreen VA Omega Fund, which became the accounting and performance survivor in the transaction. The information for the periods prior to July 19, 2010 are of those of Evergreen VA Omega Fund. |
The accompanying notes are an integral part of these financial statements.
| | |
| Financial Highlights | | Wells Fargo Advantage VT Omega Growth Fund 21 |
| | | | | | | | | | | | | | | | | | | | | |
| Ratio to Average Net Assets (Annualized) | | | | | | Portfolio | | Net Assets at |
| Net Investment | | Gross | | Net | | Total | | Turnover | | End of Period |
| Income (Loss) | | Expenses | | Expenses | | Return1 | | Rate2 | | (000’s omitted) |
| | | | | | |
| 0.01% | | | 0.75 | % | | | 0.74 | % | | | 19.79 | % | | | 160 | % | | $ | 54,246 | |
| 0.86% | | | 0.76 | % | | | 0.76 | % | | | 43.97 | % | | | 28 | % | | $ | 59,807 | |
| 1.11% | | | 0.72 | % | | | 0.72 | % | | | (27.19 | )% | | | 46 | % | | $ | 35,952 | |
| 0.32% | | | 0.71 | % | | | 0.71 | % | | | 11.96 | % | | | 31 | % | | $ | 67,773 | |
| 0.26% | | | 0.70 | % | | | 0.70 | % | | | 6.02 | % | | | 126 | % | | $ | 78,068 | |
| |
| (0.34)% | | | 1.01 | % | | | 1.00 | % | | | 19.48 | % | | | 160 | % | | $ | 83,224 | |
| 0.63% | | | 1.00 | % | | | 1.00 | % | | | 43.58 | % | | | 28 | % | | $ | 33,196 | |
| 0.86% | | | 0.97 | % | | | 0.97 | % | | | (27.41 | )% | | | 46 | % | | $ | 22,910 | |
| 0.07% | | | 0.96 | % | | | 0.96 | % | | | 11.74 | % | | | 31 | % | | $ | 38,137 | |
| 0.02% | | | 0.95 | % | | | 0.95 | % | | | 5.70 | % | | | 126 | % | | $ | 37,036 | |
| | |
| 22 Wells Fargo Advantage VT Omega Growth Fund | | Notes to Financial Statements |
1. ORGANIZATION
Wells Fargo Variable Trust (the “Trust”), a Delaware statutory trust organized on March 10, 1999, is an open-end management investment company registered under the Investment Company Act of 1940, as amended (the “1940 Act”). These financial statements report on Wells Fargo Advantage VT Omega Growth Fund (the “Fund”) which is a diversified series of the Trust.
After the close of business on July 16, 2010, the net assets of Evergreen VA Omega Fund and Wells Fargo Advantage VT Large Company Growth Fund were acquired by the Fund, which was created to receive the assets of Evergreen VA Omega Fund and Wells Fargo Advantage VT Large Company Growth Fund, in an exchange for shares of the Fund. Evergreen VA Omega Fund became the accounting and performance survivor in the reorganizations and as a result the accounting and performance history of Evergreen VA Omega Fund has been carried forward in the financial statements contained herein.
2. SIGNIFICANT ACCOUNTING POLICIES
The following significant accounting policies, which are consistently followed in the preparation of the financial statements of the Fund, are in conformity with U.S. generally accepted accounting principles which require management to make estimates and assumptions that affect the reported amounts of assets and liabilities, disclosure of contingent assets and liabilities at the date of the financial statements, and the reported amounts of revenues and expenses during the reporting period. Actual results could differ from those estimates. Management has considered the circumstances under which the Fund should recognize or make disclosures regarding events or transactions occurring subsequent to the balance sheet date through the date the financial statements are issued. Adjustments or additional disclosures, if any, have been included in these financial statements.
Securities valuation
Investments in securities are valued each business day as of the close of regular trading on the New York Stock Exchange, which is usually 4:00 p.m. (Eastern Time). Securities which are traded on a national or foreign securities exchange are valued at the last reported sales price, except that securities listed on The Nasdaq Stock Market, Inc. (“Nasdaq”) are valued at the Nasdaq Official Closing Price (“NOCP”), and if no NOCP is available, then at the last reported sales price. If no sales price is shown on the Nasdaq, the bid price will be used. In the absence of any sale of securities listed on the Nasdaq, and in the case of other securities, including U.S. Government obligations, but excluding debt securities maturing in 60 days or less, the price will be deemed “stale” and the valuations will be determined in accordance with the Fund’s Fair Valuation Procedures.
Debt securities of sufficient credit quality with original maturities of 60 days or less and any collateral received from securities lending invested in securities generally are valued at amortized cost which approximates fair value. The amortized cost method involves valuing a security at its cost, plus accretion of discount or minus amortization of premium over the period until maturity.
Investments in open-end mutual funds and non-registered investment companies are generally valued at net asset value.
Certain investments which are not valued using any of the methods discussed above, are valued at their fair value, as determined by procedures established in good faith and approved by the Board of Trustees.
The valuation techniques used by the Fund to measure fair value are consistent with the market approach, income approach and/or cost approach, where applicable, for each security type.
Security loans
The Fund may lend its securities from time to time in order to earn additional income in the form of fees or interest on securities received as collateral or the investment of any cash received as collateral. The Fund continues to receive interest or dividends on the securities loaned. The Fund receives collateral in the form of cash or securities with a value at least equal to the value of the securities on loan. The value of the loaned securities is determined at the close of each business day and any additional required collateral is delivered to the Fund on the next business day. In the event of default or bankruptcy by the borrower, the Fund could experience delays and costs in recovering the loaned securities or in gaining access to the collateral. In addition, the investment of any cash collateral received may lose all or part of its value. The Fund has the right under the lending agreement to recover the securities from the borrower on demand.
| | |
| Notes to Financial Statements | | Wells Fargo Advantage VT Omega Growth Fund 23 |
The Fund lends its securities through an unaffiliated securities lending agent. Cash collateral received in connection with its securities lending transactions is invested in Wells Fargo Securities Lending Cash Investments, LLC (the “Cash Collateral Fund”). The Cash Collateral Fund is exempt from registration under Section 3(c)(7) of the 1940 Act and is managed by Wells Fargo Funds Management LLC (“Funds Management”) and is sub-advised by Wells Capital Management Incorporated (“Wells Capital Management”). Funds Management receives an investment advisory fee starting at 0.05% and declining to 0.01% as the average daily net assets of the Cash Collateral Fund increase. All of the fees received by Funds Management are paid to Wells Capital Management for its services as sub-adviser. The Cash Collateral Fund seeks to provide a positive return compared to the daily Fed Funds Open rate by investing in high-quality, U.S. dollar-denominated short-term money market instruments. Cash Collateral Fund investments are fair valued based upon the amortized cost valuation technique. Income earned from investment in the Cash Collateral Fund is included in securities lending income on the Statement of Operations.
In a securities lending transaction, the net asset value of the Fund will be affected by an increase or decrease in the value of the securities loaned and by an increase or decrease in the value of instruments in which cash collateral is invested. The amount of securities lending activity undertaken by the Fund fluctuates from time to time. As a result of the reorganizations on July 16, 2010, the Fund holds securities related to defaulted or impaired structured investment vehicles. After the occurrence of a default or impairment of structured investment vehicles purchased in a joint account by Wells Fargo Advantage VT Large Company Growth Fund’s former securities lending agent, as the various participating funds’ lending activity fluctuated, their ratable interest in the joint account, including their ratable exposure to the defaulted or impaired structured investment vehicles fluctuated depending on the relative activity of each participating fund. In order to eliminate the fluctuation of the various participating funds’ ratable exposure to the defaulted or impaired structured investment vehicles, the adviser to the funds recommended to the Board of Trustees, and the Board of Trustees approved, actions designed to fix the allocation of percentage ownership in defaulted or impaired structured investment vehicles among all funds participating in securities lending (“side pocketing”) based on each participating fund’s percentage ownership of the total cash collateral investment joint account as of the date the fixed allocation is implemented. Accordingly, on February 13, 2009 a side pocketing occurred, which fixed each participating fund’s ownership of defaulted or impaired structured investment vehicle in the joint account based on each participating fund’s percentage ownership of the joint account as of such date.
Security transactions and income recognition
Securities transactions are recorded on a trade date basis. Realized gains or losses are reported on the basis of identified cost of securities delivered.
Dividend income is recognized on the ex-dividend date, except for certain dividends from foreign securities, which are recorded as soon as the Fund is informed of the ex-dividend date. Dividend income from foreign securities is recorded net of foreign taxes withheld where recovery of such taxes is not assured.
Distributions to shareholders
Distributions to shareholders from net investment income and net realized gains, if any, are recorded on the ex-dividend date. Such distributions are determined in conformity with income tax regulations, which may differ from generally accepted accounting principles.
The timing and character of distributions made during the period from net investment income or net realized gains may differ from their ultimate characterization for federal income tax purposes. To the extent that these differences are permanent in nature, such amounts are reclassified within the capital accounts based on their federal tax-basis treatment. Temporary differences do not require reclassifications. At December 31, 2010, as a result of permanent book-to-tax differences, the following reclassification adjustments were made on the Statement of Assets and Liabilities:
| | | | | | |
| | | Accumulated Net | | | |
| | | Realized | | | |
| Accumulated Net | | Losses | | | |
| Investment Loss | | on Investments | | Paid-in Capital | |
| |
| $205,253 | | $7,661,293 | | $(7,866,546) | |
Federal and other taxes
The Fund intends to continue to qualify as a regulated investment company by distributing substantially all of its investment company taxable income and any net realized capital gains (after reduction for capital loss carryforwards) sufficient to relieve it from all, or substantially all, federal income taxes. Accordingly, no provision for federal income taxes was required.
| | |
| 24 Wells Fargo Advantage VT Omega Growth Fund | | Notes to Financial Statements |
The Fund’s income and federal excise tax returns and all financial records supporting those returns (including those of the predecessor funds) for the prior three fiscal years are subject to examination by the federal and Delaware revenue authorities.
At December 31, 2010, estimated net capital loss carryforwards, which are available to offset future net realized capital gains, were as follows:
| | | | | | | | | | | | | | | | | | | | | |
| | | Expiration | |
| 2011 | | 2012 | | | 2013 | | | 2015 | | | 2016 | | | 2017 | |
| | |
| $1,003,450 | | $ | 2,022,267 | | | $ | 1,615,063 | | | $ | 4,132,177 | | | $ | 2,303,740 | | | $ | 771,379 | |
Under the recently enacted Regulated Investment Company Modernization Act of 2010, the Fund will be permitted to carry forward capital losses incurred in taxable years beginning after December 22, 2010 for an unlimited period. However, any losses incurred during those future taxable years will be required to be utilized prior to the losses incurred in pre-enactment taxable years. As a result of this ordering rule, pre-enactment capital loss carryforwards may be more likely to expire unused. Additionally, post-enactment capital losses that are carried forward will retain their character as either short-term or long-term capital losses rather than being considered all short-term as under previous law.
Class allocations
The separate classes of shares offered by the Fund differ principally in distribution and administration fees. Shareholders of each class bear certain expenses that pertain to that particular class. All shareholders bear the common expenses of the Fund, earn income from the portfolio, and are allocated unrealized gains and losses pro rata based on the average daily net assets of each class, without distinction between share classes. Dividends are determined separately for each class based on income and expenses allocable to each class. Realized gains and losses are allocated to each class pro rata based upon the net assets of each class on the date realized. Differences in per share dividend rates generally result from the relative weightings of pro rata income and realized gain allocations and from differences in separate class expenses, including distribution and administration fees.
3. FAIR VALUATION MEASUREMENTS
Fair value measurements of investments are determined within a framework that has established a fair value hierarchy based upon the various data inputs utilized in determining the value of the Fund’s investments. The three-level hierarchy gives the highest priority to unadjusted quoted prices in active markets for identical assets or liabilities (Level 1) and the lowest priority to unobservable inputs (Level 3). The Fund’s investments are classified within the fair value hierarchy based on the lowest level of input that is significant to the fair value measurement. The inputs are summarized into three broad levels as follows:
| • | | Level 1 — quoted prices in active markets for identical securities |
| |
| • | | Level 2 — other significant observable inputs (including quoted prices for similar securities, interest rates, prepayment speeds, credit risk, etc.) |
| |
| • | | Level 3 — significant unobservable inputs (including the Fund’s own assumptions in determining the fair value of investments) |
The inputs or methodologies used for valuing securities are not necessarily an indication of the risk associated with investing in those securities.
As of December 31, 2010, the inputs used in valuing the Fund’s assets, which are carried at fair value, were as follows:
| | | | | | | | | | | | | | | | | |
| | | | | | | Significant Other | | | Significant | | | | |
| | | | | | | Observable | | | Unobservable | | | | |
| | | Quoted Prices | | | Inputs | | | Inputs | | | | |
| Investments in Securities | | (Level 1) | | | (Level 2) | | | (Level 3) | | | Total | |
| |
Equity securities | | | | | | | | | | | | | | | | |
Common stocks | | $ | 136,129,341 | | | $ | 0 | | | $ | 0 | | | $ | 136,129,341 | |
Short-term investments | | | | | | | | | | | | | | | | |
Corporate bonds and notes | | | 0 | | | | 0 | | | | 239,022 | | | | 239,022 | |
Investment companies | | | 1,692,656 | | | | 38,542,212 | | | | 0 | | | | 40,234,868 | |
| | | $ | 137,821,997 | | | $ | 38,542,212 | | | $ | 239,022 | | | $ | 176,603,231 | |
| | |
| Notes to Financial Statements | | Wells Fargo Advantage VT Omega Growth Fund 25 |
Further details on the major security types listed above can be found in the Fund’s Portfolio of Investments.
The following is a reconciliation of assets in which significant unobservable inputs (Level 3) were used in determining fair value:
| | | | | |
| | | Corporate bonds | |
| | | and notes | |
| |
Balance as of December 31, 2009 | | $ | 0 | |
| Transfers in from acquisitions | | | 239,022 | |
Balance as of December 31, 2010 | | $ | 239,022 | |
Change in unrealized gains (losses) included in earnings relating to securities still held at December 31, 2010 | | $ | 0 | |
4. TRANSACTIONS WITH AFFILIATES AND OTHER EXPENSES
Investment advisory fees
The Trust has entered into an investment advisory contract with Funds Management, an indirect wholly owned subsidiary of Wells Fargo & Company (“Wells Fargo”). The investment adviser is responsible for implementing investment policies and guidelines and for supervising the investment sub-adviser, who is responsible for day-to-day portfolio management of the Fund.
Pursuant to the contract, Funds Management is paid an annual investment advisory fee starting at 0.55% and declining to 0.40% as the average daily net assets of the Fund increase. Prior to July 19, 2010, the predecessor fund, Evergreen VA Omega Fund, paid an investment advisory fee to Evergreen Investment Management Company, LLC (“EIMC”), an affiliate of Funds Management, at an annual rate which started at 0.52% and declined to 0.41% as the aggregate average daily net assets of the Fund and its retail counterpart, Evergreen VA Omega Fund, increased. For the year ended December 31, 2010, the investment advisory fee was equivalent to an annual rate of 0.54% of the Fund’s average daily net assets.
Funds Management may retain the services of certain investment sub-advisers to provide daily portfolio management to the Fund. The fees related to investment sub-advisory services are borne directly by the investment adviser and do not increase the overall fees paid by the Fund to the investment adviser. Wells Capital Management, an affiliate of Funds Management, is the investment sub-adviser to the Fund and is paid a fee by the investment adviser at an annual rate starting at 0.35% and declining to 0.15% as the average daily net assets of the Fund increase.
Administration and transfer agent fees
The Trust has entered into an Administration Agreement with Funds Management. Under this Agreement, for providing administrative services, which includes paying fees and expenses for services provided by the transfer agent, sub-transfer agents, omnibus account servicers and record-keepers, Funds Management is entitled to receive the following annual fees:
| | | | | | | | | |
| | | | | | | Administration Fees | |
| | | | | | | (% of Average | |
| | | Average Daily Net Assets | | | Daily Net Assets) | |
| |
| Fund level | | First $5 billion | | | 0.05 | % |
| | | Next $5 billion | | | 0.04 | |
| | | Over $10 billion | | | 0.03 | |
| Class 1 and Class 2 | | All asset levels | | | 0.08 | |
Prior to July 19, 2010, the predecessor fund paid EIMC a fund level administrator fee at an annual rate determined by applying percentage rates to the aggregate average daily net assets of the Evergreen funds (excluding money market funds) which started at 0.10% and declined to 0.05% as the aggregate average daily net assets of the Evergreen funds (excluding money market funds) increased.
| | |
| 26 Wells Fargo Advantage VT Omega Growth Fund | | Notes to Financial Statements |
Funds Management and/or EIMC has contractually waived and/or reimbursed investment advisory and administration fees to the extent necessary to maintain certain net operating expense ratios for the Fund. Waiver of fees and/or reimbursement of expenses by Funds Management and/or EIMC were made first from fund level expenses on a proportionate basis and then from class specific expenses.
Prior to July 19, 2010, the predecessor fund paid Evergreen Service Company, LLC, an affiliate of EIMC and a subsidiary of Wells Fargo, a transfer and dividend disbursing agent fee.
Distribution fees
The Trust has adopted a Distribution Plan for Class 2 shares of the Fund pursuant to Rule 12b-1 under the 1940 Act. Distribution fees are charged to the Class 2 shares and paid to Wells Fargo Funds Distributor, LLC, the principal underwriter, at an annual rate of 0.25% of its average daily net assets. Prior to July 19, 2010, Class 2 shares of the predecessor fund also paid distribution fees at an annual rate of 0.25% of its average daily net assets.
5. INVESTMENT PORTFOLIO TRANSACTIONS
Purchases and sales of investments, exclusive of short-term securities (securities with maturities of one year or less at purchase date) for the year ended December 31, 2010 were $160,112,701 and $186,744,574, respectively.
6. ACQUISITIONS
After the close of business on July 16, 2010, the Fund acquired the net assets of Evergreen VA Omega Fund and Wells Fargo Advantage VT Large Company Growth Fund. The purpose of the transaction was to combine three funds with similar investment objectives and strategies. The acquisitions were accomplished by a tax-free exchange of all of the shares of Evergreen VA Omega Fund and Wells Fargo Advantage VT Large Company Growth Fund. Shareholders holding Class 1 and Class 2 shares of Evergreen VA Omega Fund received Class 1 and Class 2 shares, respectively, of the Fund in the reorganization. Existing shareholders of Wells Fargo Advantage VT Large Company Growth Fund received Class 2 shares of the Fund in the reorganization. The Fund was newly created to receive the assets of Evergreen VA Omega Fund and Wells Fargo Advantage VT Large Company Growth Fund. Evergreen VA Omega Fund became the accounting and performance survivor in the reorganizations. The investment portfolio of Evergreen VA Omega Fund and Wells Fargo Advantage VT Large Company Growth Fund with fair values of $71,682,578 and $48,538,258, respectively, and identified costs of $69,920,349 and $46,062,243, respectively, on July 16, 2010 were the principal assets acquired by the Fund. For financial reporting purposes, assets received and shares issued by the Fund were recorded at fair value; however, the cost basis of the investments received from Evergreen VA Omega Fund and Wells Fargo Advantage VT Large Company Growth Fund were carried forward to align ongoing reporting of the Fund’s realized and unrealized gains and losses with amounts distributable to shareholders for tax purposes. The value of net assets acquired, unrealized gains/losses acquired, exchange ratio and number of shares issued were as follows:
| | | | | | | | | | | | | | | | | |
| | | Value of Net | | | Unrealized | | | Exchange | | | Number of |
| Acquired Fund | | Assets Acquired | | | Gains | | | Ratio | | | Shares Issued |
| |
| Evergreen VA Omega Fund | | $ | 70,210,006 | | | $ | 1,762,229 | | | | 1.00 | | | 2,457,511 Class 1 |
| | | | | | | | | | | | 1.00 | | | 1,231,817 Class 2 |
| Wells Fargo Advantage VT Large Company Growth Fund | | $ | 48,569,090 | | | $ | 2,476,015 | | | | 0.43 | | | 2,568,116 Class 2 |
The aggregate net assets of the Fund immediately after the acquisitions were $118,779,096.
Assuming the acquisition had been completed January 1, 2010, the beginning of the annual reporting period for the Fund, the pro forma results of operations for the year ended December 31, 2010 would have been:
| | | | | |
|
Net investment loss | | $ | (116,783 | ) |
Net realized and unrealized gains (losses) on investments | | $ | 17,879,551 | |
Net increase in net assets resulting from operations | | $ | 17,762,768 | |
Because the combined investment portfolios have been managed as a single integrated portfolio since the acquisitions were completed, it is not practicable to separate the amounts of revenue and earnings of Wells Fargo Advantage VT Large Company Growth Fund that have been included in the Fund’s Statement of Operations since July 19, 2010.
| | |
| Notes to Financial Statements | | Wells Fargo Advantage VT Omega Growth Fund 27 |
7. BANK BORROWINGS
The Trust and Wells Fargo Funds Trust (excluding the money market funds) are parties to a $125,000,000 revolving credit agreement with State Street Bank and Trust Company, whereby the Fund is permitted to use bank borrowings for temporary or emergency purposes, such as to fund shareholder redemption requests. Interest under the credit agreement is charged to the Fund based on a borrowing rate equal to the higher of the Federal Funds rate in effect on that day plus 1.25% or the overnight LIBOR rate in effect on that day plus 1.25%. In addition, under the credit agreement, the Fund pays an annual commitment fee equal to 0.125% of the unused balance, which is allocated pro rata. Prior to September 7, 2010, the annual commitment fee paid by the Fund was 0.15% of the unused balance.
During the year ended December 31, 2010, there were no borrowings by the Fund under the agreement.
8. DISTRIBUTIONS TO SHAREHOLDERS
The tax character of distributions paid were $580,579 and $817,203 of ordinary income for the years ended December 31, 2010 and December 31, 2009, respectively.
As of December 31, 2010, the components of distributable earnings on a tax basis were as follows:
| | | | | | | | | |
| | | | | | |
| Undistributed | | Unrealized | | | Capital Loss | |
| Long-Term Gain | | Gains | | | Carryforward | |
| |
| $1,117,838 | | $ | 28,870,121 | | | $ | (11,848,076 | ) |
9. INDEMNIFICATION
Under the Trust’s organizational documents, the officers and directors are indemnified against certain liabilities that may arise out of performance of their duties to the Trust. Additionally, in the normal course of business, the Trust may enter into contracts with service providers that contain a variety of indemnification clauses. The Trust’s maximum exposure under these arrangements is dependent on future claims that may be made against the Fund and, therefore, cannot be estimated.
| | |
| 28 Wells Fargo Advantage VT Omega Growth Fund | | Report of Independent Registered Public Accounting Firm |
BOARD OF TRUSTEES AND SHAREHOLDERS OF WELLS FARGO VARIABLE TRUST:
We have audited the accompanying statement of assets and liabilities, including the portfolio of investments, of the Wells Fargo Advantage VT Omega Growth Fund (the “Fund”), one of the funds constituting the Wells Fargo Variable Trust, as of December 31, 2010, and the related statement of operations for the year then ended, statements of changes in net assets for each of the years in the two year period then ended, and the financial highlights for each of the years in the five years presented. These financial statements and financial highlights are the responsibility of the Fund’s management. Our responsibility is to express an opinion on these financial statements and financial highlights based on our audits.
We conducted our audits in accordance with the standards of the Public Company Accounting Oversight Board (United States). Those standards require that we plan and perform the audit to obtain reasonable assurance about whether the financial statements and financial highlights are free of material misstatement. An audit includes examining, on a test basis, evidence supporting the amounts and disclosures in the financial statements. Our procedures included confirmation of securities owned as of December 31, 2010, by correspondence with custodian and brokers, or by other appropriate auditing procedures. An audit also includes assessing the accounting principles used and significant estimates made by management, as well as evaluating the overall financial statement presentation. We believe that our audits provide a reasonable basis for our opinion.
In our opinion, the financial statements and financial highlights referred to above present fairly, in all material respects, the financial position of the Wells Fargo Advantage VT Omega Growth Fund as of December 31, 2010, the results of its operations for the year then ended, changes in its net assets for each of the years in the two year period then ended, and the financial highlights for each of the years in the five years presented, in conformity with U.S. generally accepted accounting principles.
Boston, Massachusetts
February 25, 2011
| | |
| Other Information (Unaudited) | | Wells Fargo Advantage VT Omega Growth Fund 29 |
PROXY VOTING INFORMATION
A description of the policies and procedures that the Fund uses to determine how to vote proxies relating to portfolio securities is available without charge, upon request, by calling 1-800-222-8222, visiting our Web site at www.wellsfargo.com/advantagefunds, or visiting the SEC Web site at www.sec.gov. Information regarding how the Fund voted proxies relating to portfolio securities during the most recent 12-month period ended June 30 is available without charge on the Fund’s Web site at www.wellsfargo.com/advantagefunds or by visiting the SEC Web site at www.sec.gov.
| | |
| 30 Wells Fargo Advantage VT Omega Growth Fund | | Other Information (Unaudited) |
PORTFOLIO HOLDINGS INFORMATION
The complete portfolio holdings for the Fund are publicly available on the Fund’s Web site (www.wellsfargo.com/advantagefunds) on a monthly, 30-day or more delayed basis. In addition, top ten holdings information for the Fund is publicly available on the Fund’s Web site on a monthly, seven-day or more delayed basis. The Fund files its complete schedule of portfolio holdings with the SEC for the first and third quarters of each fiscal year on Form N-Q, which is available without charge by visiting the SEC Web site at www.sec.gov. In addition, the Fund’s Form N-Q may be reviewed and copied at the SEC’s Public Reference Room in Washington, DC, and at regional offices in New York City, at 233 Broadway, and in Chicago, at 175 West Jackson Boulevard, Suite 900. Information about the Public Reference Room may be obtained by calling 1-800-SEC-0330.
BOARD OF TRUSTEES
The following table provides basic information about the Board of Trustees (the “Trustees”) of the Wells Fargo Variable Trust (the “Trust”) and Officers of the Trust. This table should be read in conjunction with the Prospectus and the Statement of Additional Information1 of the Fund. Each of the Trustees and Officers listed below acts in identical capacities for the Wells Fargo Advantage family of funds, which consists of 152 funds comprising the Trust, Wells Fargo Funds Trust, Wells Fargo Master Trust and four closed-end funds (collectively the “Fund Complex”). All of the Trustees are also Members of the Audit and Governance Committees of each Trust in the Fund Complex. The mailing address of each Trustee and Officer is 525 Market Street, 12th Floor, San Francisco, CA 94105. Each Trustee and Officer serves an indefinite term, however, each Trustee serves such term until reaching the mandatory retirement age established by the Trustees.
Independent Trustees
| | | | | | | |
| Name and | | Position Held and | | | | |
| Year of Birth | | Length of Service | | Principal Occupations During Past Five Years | | Other Directorships |
| Peter G. Gordon (Born 1942) | | Trustee, since 1998; Chairman, since 2005 (Lead Trustee since 2001) | | Co-Founder, Chairman, President and CEO of Crystal Geyser. Water Company. Trustee Emeritus, Colby College | | Asset Allocation
Trust |
| | | | | | | |
| Isaiah Harris, Jr. (Born 1952) | | Trustee, since 2009 | | Retired. Prior thereto, President and CEO of BellSouth Advertising and Publishing Corp. from 2005 to 2007, President and CEO of BellSouth Enterprises from 2004 to 2005 and President of BellSouth Consumer Services from 2000 to 2003. Emeritus member of the lowa State University Foundation Board of Governors. Emeritus Member of the Advisory Board of Iowa State University School of Business. Mr. Harris is a certified public accountant. | | CIGNA Corporation; Deluxe Corporation; Asset Allocation Trust |
| | | | | | | |
| Judith M. Johnson (Born 1949) | | Trustee, since 2008 | | Retired. Prior thereto, Chief Executive Officer and Chief Investment Officer of Minneapolis Employees Retirement Fund from 1996 to 2008. Ms. Johnson is an attorney, certified public accountant and a certified managerial accountant. | | Asset Allocation
Trust |
| | | | | | | |
| Leroy Keith, Jr. (Born 1939) | | Trustee, since 2010 | | Chairman, Bloc Global Services (development and construction), Trustee of the Evergreen Funds from 1983 to 2010. Former Managing Director, Almanac Capital Management (commodities firm), former Partner, Stonington Partners, Inc. (private equity fund), former Director, Obagi Medical Products Co. and former Director, Lincoln Educational Services. | | Trustee, Virtus Fund Complex (consisting of 45 portfolios as of 12/31/10); Director, Diversapack Co. (packaging company); Asset Allocation Trust |
| | | | | | | |
| David F. Larcker (Born 1951) | | Trustee, since 2009 | | James Irvin Miller Professor of Accounting at the Graduate School of Business, Stanford University, Director of Corporate Governance Research Program and Co-Director of The Rock Center for Corporate Governance since 2006. From 2005 to 2008, Professor of Accounting at the Graduate School of Business, Stanford University. Prior thereto, Ernst & Young Professor of Accounting at The Wharton School, University of Pennsylvania from 1985 to 2005. | | Asset Allocation
Trust |
| | |
| Other Information (Unaudited) | | Wells Fargo Advantage VT Omega Growth Fund 31 |
| | | | | | | |
| Name and | | Position Held and | | | | |
| Year of Birth | | Length of Service | | Principal Occupations During Past Five Years | | Other Directorships |
| Olivia S. Mitchell (Born 1953) | | Trustee, since 2006 | | International Foundation of Employee Benefit Plans Professor and Chair of the Department of Insurance and Risk Management, Wharton School of the University of Pennsylvania since 1993. Director of Wharton’s Pension Research Council and Boettner Center on Pensions & Retirement Research, and Research Associate at the National Bureau of Economic Research. Previously, Cornell University Professor from 1978 to 1993. | | Asset Allocation
Trust |
| | | | | | | |
| Timothy J. Penny (Born 1951) | | Trustee, since 1996 | | President and CEO of Southern Minnesota Initiative Foundation, a non-profit organization, since 2007 and Senior Fellow at the Humphrey Institute Policy Forum at the University of Minnesota since 1995. Member of the Board of Trustees of NorthStar Education Finance, Inc., a non-profit organization, since 2007. | | Asset Allocation
Trust |
| | | | | | | |
| Michael S. Scofield (Born 1943) | | Trustee, since 2010 | | Currently serves on the Investment Company Institute’s Board of Governors and Executive Committee as well the Independent Director’s Counsel Board of Governors and Executive Committee. Former Chairman of the Independent Directors Counsel. Trustee of the Evergreen Funds from 1984 to 2010. Retired Attorney, Law Offices of Michael S. Scofield and former Director and Chairman, Branded Media Corporation (multi-media branding company). | | Asset Allocation
Trust |
| | | | | | | |
| Donald C. Willeke (Born 1940) | | Trustee, since 1996 | | Principal of the law firm of Willeke & Daniels. General Counsel of the Minneapolis Employees Retirement Fund from 1984 until its consolidation into the Minnesota Public Employees Retirement Association on June 30, 2010. | | Asset Allocation
Trust |
Officers
| | | | | |
| Name and | | Position Held and | | |
| Year of Birth | | Length of Service | | Principal Occupations During Past Five Years |
| Karla M. Rabusch (Born 1959) | | President, since 2003 | | Executive Vice President of Wells Fargo Bank, N.A. and President of Wells Fargo Funds Management, LLC since 2003. Senior Vice President and Chief Administrative Officer of Wells Fargo Funds Management, LLC from 2001 to 2003. |
| | | | | |
| C. David Messman (Born 1960) | | Secretary, since 2000; Chief Legal Counsel, since 2003 | | Senior Vice President and Secretary of Wells Fargo Funds Management, LLC since 2001. Vice President and Managing Counsel of Wells Fargo Bank, N.A. since 1996. |
| | | | | |
Kasey Phillips
(Born 1970) | | Treasurer, since 2009 | | Senior Vice President of Wells Fargo Funds Management, LLC since 2009. Senior Vice President of Evergreen Investment Management Company, LLC from 2006 to 2010. Treasurer of the Evergreen Funds from 2005 to 2010. Vice President and Assistant Vice President of Evergreen Investment Services, Inc. from 1999 to 2006. |
| | | | | |
David Berardi
(Born 1975) | | Assistant Treasurer,
since 2009 | | Vice President of Wells Fargo Funds Management, LLC since 2009. Vice President of Evergreen Investment Management Company, LLC from 2008 to 2010. Assistant Vice President of Evergreen Investment Services, Inc. from 2004 to 2008. Manager of Fund Reporting and Control for Evergreen Investment Management Company, LLC from 2004 to 2010. |
| | | | | |
Jeremy DePalma
(Born 1974) | | Assistant Treasurer,
since 2009 | | Senior Vice President of Wells Fargo Funds Management, LLC since 2009. Senior Vice President of Evergreen Investment Management Company, LLC from 2008 to 2010. Vice President, Evergreen Investment Services, Inc. from 2004 to 2007. Assistant Vice President, Evergreen Investment Services, Inc. from 2000 to 2004 and the head of the Fund Reporting and Control Team within Fund Administration from 2005 to 2010. |
| | |
| 32 Wells Fargo Advantage VT Omega Growth Fund | | Other Information (Unaudited) |
| | | | | |
| Name and | | Position Held and | | |
| Year of Birth | | Length of Service | | Principal Occupations During Past Five Years |
Debra Ann Early
(Born 1964) | | Chief Compliance Officer,
since 2007 | | Chief Compliance Officer of Wells Fargo Funds Management, LLC since 2007. Chief Compliance Officer of Parnassus Investments from 2005 to 2007. Chief Financial Officer of Parnassus Investments from 2004 to 2007 and Senior Audit Manager of PricewaterhouseCoopers LLP from 1998 to 2004. |
| | |
| 1. | | The Statement of Additional Information includes additional information about the Fund’s Trustees and is available, without charge, upon request, by calling 1-800-222-8222 or by visiting the Fund’s Web site at www.wellsfargo.com/advantagefunds. |
| | |
| List of Abbreviations | | Wells Fargo Advantage VT Omega Growth Fund 33 |
The following is a list of common abbreviations for terms and entities which may have appeared in this report.
| | | | | | | |
|
| ABAG | — | Association of Bay Area Governments | | HUF | — | Hungarian Forint |
| ADR | — | American Depositary Receipt | | IDA | — | Industrial Development Authority |
| ADS | — | American Depository Shares | | IDAG | — | Industrial Development Agency |
| AMBAC | — | American Municipal Bond Assurance Corporation | | IDR | — | Industrial Development Revenue |
| AMT | — | Alternative Minimum Tax | | IEP | — | Irish Pound |
| ARM | — | Adjustable Rate Mortgages | | JPY | — | Japanese Yen |
| AUD | — | Australian Dollar | | KRW | — | Republic of Korea Won |
| BART | — | Bay Area Rapid Transit | | LIBOR | — | London Interbank Offered Rate |
| BRL | — | Brazil Real | | LLC | — | Limited Liability Company |
| CAD | — | Canadian Dollar | | LLP | — | Limited Liability Partnership |
| CDA | — | Community Development Authority | | LOC | — | Letter of Credit |
| CDO | — | Collateralized Debt Obligation | | LP | — | Limited Partnership |
| CDSC | — | Contingent Deferred Sales Charge | | MBIA | — | Municipal Bond Insurance Association |
| CGIC | — | Capital Guaranty Insurance Company | | MFHR | — | Multi-Family Housing Revenue |
| CGY | — | Capital Guaranty Corporation | | MFMR | — | Multi-Family Mortgage Revenue |
| CHF | — | Swiss Franc | | MMD | — | Municipal Market Data |
| CIFG | — | CDC (Caisse des Dépôts et Consignations) IXIS Financial Guarantee | | MTN | — | Medium Term Note |
| | MUD | — | Municipal Utility District |
| COP | — | Certificate of Participation | | MXN | — | Mexican Peso |
| CP | — | Commercial Paper | | MYR | — | Malaysian Ringgit |
| CTF | — | Common Trust Fund | | NATL-RE | — | National Public Finance Guarantee Corporation |
| DEM | — | Deutsche Mark | | NLG | — | Netherlands Guilder |
| DKK | — | Danish Krone | | NOK | — | Norwegian Krone |
| DW&P | — | Department of Water & Power | | NZD | — | New Zealand Dollar |
| DWR | — | Department of Water Resources | | PCFA | — | Pollution Control Finance Authority |
| ECFA | — | Educational & Cultural Facilities Authority | | PCR | — | Pollution Control Revenue |
| EDFA | — | Economic Development Finance Authority | | PFA | — | Public Finance Authority |
| ETET | — | Eagle Tax-Exempt Trust | | PFFA | — | Public Facilities Financing Authority |
| ETF | — | Exchange-Traded Fund | | plc | — | Public Limited Company |
| EUR | — | Euro | | PLN | — | Polish Zloty |
| FFCB | — | Federal Farm Credit Bank | | PSFG | — | Public School Fund Guaranty |
| FGIC | — | Financial Guaranty Insurance Corporation | | R&D | — | Research & Development |
| FHA | — | Federal Housing Authority | | RDA | — | Redevelopment Authority |
| FHAG | — | Federal Housing Agency | | RDFA | — | Redevelopment Finance Authority |
| FHLB | — | Federal Home Loan Bank | | REITS | — | Real Estate Investment Trusts |
| FHLMC | — | Federal Home Loan Mortgage Corporation | | SEK | — | Swedish Krona |
| FNMA | — | Federal National Mortgage Association | | SFHR | — | Single Family Housing Revenue |
| FRF | — | French Franc | | SFMR | — | Single Family Mortgage Revenue |
| FSA | — | Farm Service Agency | | SGD | — | Singapore Dollar |
| GBP | — | Great British Pound | | SKK | — | Slovakian Koruna |
| GDR | — | Global Depositary Receipt | | SLMA | — | Student Loan Marketing Association |
| GNMA | — | Government National Mortgage Association | | SPDR | — | Standard & Poor’s Depositary Receipts |
| GO | — | General Obligation | | STIT | — | Short-Term Investment Trust |
| HCFR | — | Healthcare Facilities Revenue | | TBA | — | To Be Announced |
| HEFA | — | Health & Educational Facilities Authority | | TRAN | — | Tax Revenue Anticipation Notes |
| HEFAR | — | Higher Education Facilities Authority Revenue | | TRY | — | Turkish Lira |
| HFA | — | Housing Finance Authority | | USD | — | United States Dollar |
| HFFA | — | Health Facilities Financing Authority | | XLCA | — | XL Capital Assurance |
| HKD | — | Hong Kong Dollar | | ZAR | — | South African Rand |
| HUD | — | Housing & Urban Development | | | | |
This page is intentionally left blank.
More information about Wells Fargo Advantage Funds is available free upon request. To obtain literature, please write, e-mail, visit the Funds’ Web site, or call:
Wells Fargo Advantage Funds
P.O. Box 8266
Boston, MA 02266-8266
E-mail:wfaf@wellsfargo.com
Web site:www.wellsfargo.com/advantagefunds
Individual Investors: 1-800-222-8222
Retail Investment Professionals: 1- 888-877-9275
Institutional Investment Professionals: 1- 866-765-0778
This report and the financial statements contained herein are submitted for the general information of the shareholders of Wells Fargo Advantage Funds. If this report is used for promotional purposes, distribution of the report must be accompanied or preceded by a current prospectus. For a prospectus containing more complete information, including charges and expenses, call 1-800-222-8222 or visit the Fund’s Web site at www.wellsfargo.com/advantagefunds. Please consider the investment objectives, risks, charges, and expenses of the investment carefully before investing. This and other information about Wells Fargo Advantage Funds can be found in the current prospectus. Read the prospectus carefully before you invest or send money.
Wells Fargo Funds Management, LLC, a wholly owned subsidiary of Wells Fargo & Company, provides investment advisory and administrative services for Wells Fargo Advantage Funds. Other affiliates of Wells Fargo & Company provide subadvisory and other services for the Funds. The Funds are distributed by Wells Fargo Funds Distributor, LLC, Member FINRA/SIPC, an affiliate of Wells Fargo & Company.
NOT FDIC INSURED • NO BANK GUARANTEE • MAY LOSE VALUE
| | | | | |
|
© 2011 Wells Fargo Funds Management, LLC. All rights reserved. | | www.wellsfargo.com/advantagefunds | | 200917 02-11
AVT5/AR151 12-10 |
WELLS FARGO ADVANTAGE VARIABLE TRUST FUNDS
| | § | | Wells Fargo Advantage VT Opportunity FundSM |
Reduce clutter. Save trees.
Sign up for electronic delivery of prospectuses and shareholder reports at www.wellsfargo.com/advantagedelivery
Contents
| | | | | |
|
Letter to Shareholders | | | 2 | |
| | | | | |
Performance Highlights | | | 6 | |
| | | | | |
Fund Expenses | | | 10 | |
| | | | | |
Portfolio of Investments | | | 11 | |
| | | | | |
Financial Statements | | | | |
| Statement of Assets and Liabilities | | | 16 | |
| Statement of Operations | | | 17 | |
| Statements of Changes in Net Assets | | | 18 | |
| Financial Highlights | | | 20 | |
| | | | | |
Notes to Financial Statements | | | 22 | |
| | | | | |
Report of Independent Registered Public Accounting Firm | | | 28 | |
| | | | | |
Other Information | | | 29 | |
| | | | | |
List of Abbreviations | | | 33 | |
The views expressed are as of December 31, 2010, and are those of the Fund managers. Any reference to a specific security in this report is not a recommendation to purchase or sell any specific security or adopt any investment strategy. The views are subject to change at any time in response to changing circumstances in the market and are not intended to predict or guarantee the future performance of any individual security, market sector or the markets generally, or the Wells Fargo Advantage VT Opportunity Fund.
NOT FDIC INSURED § NO BANK GURANTEE § MAY LOSE VALUE
WELLS FARGO
INVESTMENT HISTORY
| | | |
|
1932 | | Keystone creates one of the first mutual fund families. |
| | | |
1971 | | Wells Fargo & Company introduces one of the first institutional index funds. |
| | | |
1978 | | Wells Fargo applies Markowitz and Sharpe’s research on Modern Portfolio Theory to introduce one of the industry’s first Tactical Asset Allocation (TAA) models in institutional separately managed accounts. |
| | | |
1984 | | Wells Fargo Stagecoach Funds launches its first asset allocation fund. |
| | | |
1989 | | The Tactical Asset Allocation (TAA) Model is first applied to Wells Fargo’s asset allocation mutual funds. |
| | | |
1994 | | Wells Fargo introduces the LifePath Funds, one of the first suites of target date funds (now the Wells Fargo Advantage Dow Jones Target Date FundsSM). |
| | | |
1996 | | Evergreen Investments and Keystone Funds merge. |
| | | |
1997 | | Wells Fargo launches Wells Fargo Advantage WealthBuilder PortfoliosSM, a fund-of-funds suite of products that includes the use of quantitative models to shift assets among investment styles. |
| | | |
1999 | | Norwest Advantage Funds and Stagecoach Funds are reorganized into Wells Fargo Funds after the merger of Norwest and Wells Fargo. |
| | | |
2002 | | Evergreen Retail and Evergreen Institutional companies form the umbrella asset management company, Evergreen Investments. |
| | | |
2005 | | The integration of Strong Funds with Wells Fargo Funds creates Wells Fargo Advantage Funds, resulting in one of the top 20 mutual fund companies in the United States. |
| | | |
2006 | | Wells Fargo Advantage Funds relaunches the target date product line as Wells Fargo Advantage Dow Jones Target Date Funds. |
| | | |
2010 | | The mergers and reorganizations of Evergreen and Wells Fargo Advantage mutual funds are completed, unifying the families under the brand of Wells Fargo Advantage Funds. |
Wells Fargo Advantage Funds®
Wells Fargo Advantage Funds skillfully guides institutions, financial advisors, and individuals through the investment terrain to help them reach their financial objectives. Everything we do on behalf of investors is backed by our unique combination of qualifications.
Strength
Our organization is built on the standards of integrity and service established by our parent company—Wells Fargo & Company—more than 150 years ago. And, because we’re part of a highly diversified financial enterprise, we offer the depth of resources to help investors succeed.
Expertise
Our multi-boutique model offers investors access to the independent thinking of premier investment managers that have been chosen for their time-tested strategies. While each team specializes in a specific investment strategy, collectively they provide investors a wide choice of distinct investment styles. Our dedication to investment excellence doesn’t end with our expertise in manager selection—risk management, analysis, and rigorous ongoing review seek to ensure each manager’s investment process remains consistent.
Partnership
Our collaborative approach is built around understanding the needs and goals of our clients. By adhering to core principles of sound judgment and steady guidance, we support you through every stage of the investment decision process.
Carefully consider the investment objectives, risks, charges, and expenses before investing. For a current prospectus for Wells Fargo Advantage Funds containing this and other information, visit www.wellsfargo.com/advantagefunds. Read it carefully before investing.
Wells Fargo Funds Management, LLC, a wholly owned subsidiary of Wells Fargo & Company, provides investment advisory and administrative services for Wells Fargo Advantage Funds®. Other affiliates of Wells Fargo & Company provide subadvisory and other services for the Funds. The Funds are distributed by Wells Fargo Funds Distributor, LLC, Member FINRA/SIPC, an affiliate of Wells Fargo & Company.
The “Dow Jones Target Date Indexes” are a product of Dow Jones Indexes, a licensed trademark of CME Group Index Services LLC (“CME”). “Dow Jones” and “Dow Jones Target Date Indexes” are service marks of Dow Jones Trademark Holdings, LLC, and have been licensed for use for certain purposes by CME and sublicensed for use by Global Index Advisors, Inc., and Wells Fargo Funds Management, LLC. The Dow Jones Target Date Indexes are based in part on the Barclays Capital Bond Indexes, which are published by Barclays Capital Inc. The Wells Fargo Advantage Dow Jones Target Date Funds, based on the Dow Jones Target Date Indexes, are not sponsored, endorsed, sold, or promoted by Dow Jones, CME or Barclays Capital or any of their respective affiliates, and neither Dow Jones, CME nor Barclays Capital nor any of their respective affiliates makes any representation regarding the advisability of investing in such product(s) and/or about the quality, accuracy, and/or completeness of the Dow Jones Target Date Indexes or the Barclays Capital Bond Indexes. IN NO EVENT SHALL DOW JONES, CME, BARCLAYS CAPITAL, OR ANY OF THEIR LICENSORS HAVE ANY LIABILITY FOR ANY SPECIAL, PUNITIVE, INDIRECT, OR CONSEQUENTIAL DAMAGES (INCLUDING LOST PROFITS), EVEN IF NOTIFIED OF THE POSSIBILITY OF SUCH DAMAGES.
NOT FDIC INSURED § NO BANK GUARANTEE § MAY LOSE VALUE
Not part of the annual report.
Wells Fargo Advantage Funds offers more than 120 mutual funds across a wide range of asset classes, representing over $236 billion in assets under management, as of December 31, 2010.
| | | | | |
|
Equity Funds | | | | |
| |
| Asia Pacific Fund | | Enterprise Fund† | | Opportunity Fund† |
| C&B Large Cap Value Fund | | Equity Value Fund | | Precious Metals Fund |
| C&B Mid Cap Value Fund | | Global Opportunities Fund | | Premier Large Company Growth Fund |
| Capital Growth Fund | | Growth Fund | | Small Cap Growth Fund |
| Classic Value Fund | | Growth Opportunities Fund | | Small Cap Opportunities Fund |
| Common Stock Fund | | Health Care Fund | | Small Cap Value Fund |
| Core Equity Fund | | Index Fund | | Small Company Growth Fund |
| Disciplined Global Equity Fund | | International Equity Fund | | Small Company Value Fund |
| Disciplined U.S. Core Fund | | International Value Fund | | Small/Mid Cap Core Fund |
| Disciplined Value Fund | | Intrinsic Small Cap Value Fund | | Small/Mid Cap Value Fund |
Discovery Fund† | | Intrinsic Value Fund | | Social Sustainability Fund† |
| Diversified Equity Fund | | Intrinsic World Equity Fund | | Special Mid Cap Value Fund |
| Diversified International Fund | | Large Cap Core Fund | | Special Small Cap Value Fund |
| Diversified Small Cap Fund | | Large Cap Growth Fund | | Specialized Technology Fund |
| Emerging Growth Fund | | Large Company Value Fund | | Strategic Large Cap Growth Fund |
| Emerging Markets Equity Fund | | Mid Cap Growth Fund | | Traditional Small Cap Growth Fund |
Endeavor Select Fund† | | Omega Growth Fund | | Utility and Telecommunications Fund |
| | | | | |
Bond Funds | | | | |
| |
| Adjustable Rate Government Fund | | Inflation-Protected Bond Fund | | Short-Term Bond Fund |
| California Limited-Term Tax-Free Fund | | Intermediate Tax/AMT-Free Fund | | Short-Term High Yield Bond Fund |
| California Tax-Free Fund | | International Bond Fund | | Short-Term Municipal Bond Fund |
| Colorado Tax-Free Fund | | Minnesota Tax-Free Fund | | Strategic Municipal Bond Fund |
| Government Securities Fund | | Municipal Bond Fund | | Total Return Bond Fund |
| High Income Fund | | North Carolina Tax-Free Fund | | Ultra Short-Term Income Fund |
| High Yield Bond Fund | | Pennsylvania Tax-Free Fund | | Ultra Short-Term Municipal Income Fund |
| Income Plus Fund | | Short Duration Government Bond Fund | | Wisconsin Tax-Free Fund |
| | | | | |
Asset Allocation Funds | | | | |
| |
| Asset Allocation Fund | | WealthBuilder Equity Portfolio† | | Target 2020 Fund† |
| Conservative Allocation Fund | | WealthBuilder Growth Allocation Portfolio† | | Target 2025 Fund† |
| Diversified Capital Builder Fund | | WealthBuilder Growth Balanced Portfolio† | | Target 2030 Fund† |
| Diversified Income Builder Fund | | WealthBuilder Moderate Balanced Portfolio† | | Target 2035 Fund† |
| Growth Balanced Fund | | WealthBuilder Tactical Equity Portfolio† | | Target 2040 Fund† |
| Index Asset Allocation Fund | | Target Today Fund† | | Target 2045 Fund† |
| Moderate Balanced Fund | | Target 2010 Fund† | | Target 2050 Fund† |
WealthBuilder Conservative Allocation Portfolio† | | Target 2015 Fund† | | |
| | | | | |
Money Market Funds | | | | |
| |
| 100% Treasury Money Market Fund | | Minnesota Money Market Fund | | New Jersey Municipal Money Market Fund |
| California Municipal Money Market Fund | | Money Market Fund | | New York Municipal Money Market Fund |
| Cash Investment Money Market Fund | | Municipal Cash Management Money Market Fund | | Pennsylvania Municipal Money Market Fund |
| Government Money Market Fund | | Municipal Money Market Fund | | Prime Investment Money Market Fund |
Heritage Money Market Fund† | | National Tax-Free Money Market Fund | | Treasury Plus Money Market Fund |
| | | | | |
Variable Trust Funds1 | | | | |
| |
| VT Core Equity Fund | | VT Intrinsic Value Fund | | VT Small Cap Value Fund |
VT Discovery Fund† | | VT Omega Growth Fund | | VT Total Return Bond Fund |
| VT Index Asset Allocation Fund | | VT Opportunity Fund† | | |
| VT International Equity Fund | | VT Small Cap Growth Fund | | |
An investment in a money market fund is not insured or guaranteed by the Federal Deposit Insurance Corporation or any other government agency. Although the Wells Fargo Advantage Money Market Funds seek to preserve the value of your investment at $1.00 per share, it is possible to lose money by investing in a money market fund.
| | |
| 1. | | The Variable Trust Funds are generally available only through insurance company variable contracts. |
| |
| † | | In this report, the Wells Fargo Advantage Discovery FundSM, Wells Fargo Advantage Endeavor Select FundSM, Wells Fargo Advantage Enterprise FundSM, Wells Fargo Advantage Opportunity FundSM, Wells Fargo Advantage Social Sustainability FundSM, Wells Fargo Advantage WealthBuilder Conservative Allocation PortfolioSM, Wells Fargo Advantage WealthBuilder Equity PortfolioSM, Wells Fargo Advantage WealthBuilder Growth Allocation PortfolioSM, Wells Fargo Advantage WealthBuilder Growth Balanced PortfolioSM, Wells Fargo Advantage WealthBuilder Moderate Balanced PortfolioSM, Wells Fargo Advantage WealthBuilder Tactical Equity PortfolioSM, Wells Fargo Advantage Dow Jones Target Today FundSM, Wells Fargo Advantage Dow Jones Target 2010 FundSM, Wells Fargo Advantage Dow Jones Target 2015 FundSM, Wells Fargo Advantage Dow Jones Target 2020 FundSM, Wells Fargo Advantage Dow Jones Target 2025 FundSM, Wells Fargo Advantage Dow Jones Target 2030 FundSM, Wells Fargo Advantage Dow Jones Target 2035 FundSM, Wells Fargo Advantage Dow Jones Target 2040 FundSM, Wells Fargo Advantage Dow Jones Target 2045 FundSM, Wells Fargo Advantage Dow Jones Target 2050 FundSM, Wells Fargo Advantage Heritage Money Market FundSM, Wells Fargo Advantage VT Discovery FundSM, and Wells Fargo Advantage VT Opportunity FundSM are referred to as the Discovery Fund, Endeavor Select Fund, Enterprise Fund, Opportunity Fund, Social Sustainability Fund, WealthBuilder Conservative Allocation Portfolio, WealthBuilder Equity Portfolio, WealthBuilder Growth Allocation Portfolio, WealthBuilder Growth Balanced Portfolio, WealthBuilder Moderate Balanced Portfolio, WealthBuilder Tactical Equity Portfolio, Target Today Fund, Target 2010 Fund, Target 2015 Fund, Target 2020 Fund, Target 2025 Fund, Target 2030 Fund, Target 2035 Fund, Target 2040 Fund, Target 2045 Fund, Target 2050 Fund, Heritage Money Market Fund, VT Discovery Fund, and VT Opportunity Fund, respectively. |
Not part of the annual report.
| | | |
|
| 2 Wells Fargo Advantage VT Opportunity Fund | | Letter to Shareholders |
 Karla M. Rabusch,
President
Wells Fargo Advantage FundsThe equity markets delivered strong full-year returns against the backdrop of a strengthening economy.
Dear Valued Shareholder:
We are pleased to provide you with this annual report for the Wells Fargo Advantage VT Opportunity Fund for the 12 month period that ended December 31, 2010. The equity markets delivered strong returns for the year against the backdrop of a strengthening economy. However, the year was not without its share of macroeconomic challenges and market volatility, once again highlighting the value of a sound, well-diversified investment strategy. As always, we believe that such a strategy can enable investors to balance risks and opportunities as they pursue long-term financial goals in a dynamic market environment.
The economic recovery stayed on track.
The U.S. economic recovery that began in the summer of 2009 gained momentum in 2010, particularly toward the end of the year. Gross domestic product (GDP) grew at an annualized rate of 3.2% in the fourth quarter of 2010—capping a streak of six consecutive quarters of positive GDP growth—and 2.9% for the full year. Although the path of recovery has been uneven at times and growth remains subpar compared with previous recoveries, the general consensus among economists is that the economy will likely avoid a double-dip recession. That said, persistent weakness in the labor and housing markets bears close watching in the months ahead.
Jobs and housing remained troublesome.
At the end of the year, the unemployment rate stood at 9.4%, down from 9.9% a year earlier, but still stubbornly high. Unfortunately, the drop may be attributable more to a decline in the labor force than a meaningful uptick in hiring. In fact, employers added just 1.1 million jobs for all of 2010, suggesting that the improving economy has yet to translate into widespread hiring. Meanwhile, the beleaguered housing market was an ongoing source of concern, despite some tentative late-year signs of stabilization.
Other economic data were more encouraging, reflecting greater confidence in the recovery on the part of both consumers and businesses. Retail sales came in strong at certain points during the year, including the critical holiday shopping season, and industrial production and new orders have picked up. Although still reluctant to hire, businesses have gradually increased spending in other areas, such as equipment and technology. Core inflation, which excludes volatile food and energy prices, remained benign.
The Fed continued to do its part.
With inflation subdued, the Federal Reserve (the Fed) held its target range for the federal funds rate—a proxy for short-term interest rates—steady at 0% to 0.25%. In its final statement of 2010, the Fed noted that economic expansion continues to be restrained by headwinds such as high unemployment, modest income growth, lower housing wealth, and tight credit. As a result, the Fed indicated that it intends to keep short-term rates at historically low levels for as long as needed to promote a more robust recovery.
| | | |
|
| Letter to Shareholders | | Wells Fargo Advantage VT Opportunity Fund 3 |
The Fed also stated that it plans to proceed with other stimulus measures, including its second round of quantitative easing (QE2)—a plan to purchase $600 billion in long-term Treasury securities by mid-2011. The ‘preannouncement’ of QE2 in the third quarter of 2010 marked a turning point for the equity markets in that it ushered in a favorable shift in investor sentiment. By and large, investors interpreted the plan as further evidence of the Fed’s commitment to avoiding deflation and spurring economic growth.
2010 was another solid year for equities.
QE2 was certainly not the only catalyst for the equity markets during 2010. Along with more upbeat economic data, better-than-expected corporate earnings power played a role in driving stock prices higher. Throughout the year, quarterly earnings per share for the majority of companies in the S&P 500 Index consistently exceeded Wall Street estimates. As 2010 drew to a close, the midterm congressional elections and the extension of the Bush-era tax cuts provided additional tailwinds, helping the markets finish the year on a strong note.
It was the second straight year of double-digit total returns for the broad equity market indexes. The S&P 500 Index and the Dow Jones Industrial Average advanced 15.1% and 14.1%, respectively, while the tech-heavy NASDAQ Composite Index returned 18.2%. Investors were generally rewarded across the market-capitalization spectrum—with small- and mid-cap stocks outpacing large-cap stocks—as well as across most economic sectors. In terms of investment styles, growth stocks outperformed their value counterparts for the year.
To be sure, the gains were hard-earned, as the markets had to contend with numerous issues along the way, including the European sovereign debt crisis, China’s efforts to slow growth, and doubts about the sustainability of the domestic recovery. The second quarter in particular witnessed bouts of heightened market volatility, most notably the so-called “flash crash” in May. As the year progressed, however, volatility—as measured by the Chicago Board Options Exchange Volatility Index—abated amid reduced fears of a double-dip recession.
Investors should keep a long-term perspective.
In our view, the equity markets’ dramatic rebound over the past two years from a severe downturn underscores the importance of maintaining a disciplined, long-term investment strategy through changing market cycles. By staying focused on your long-term goals, you may be better positioned both to navigate falling markets and participate in rising markets.
To help you build a well-diversified strategy based on your personal objectives and risk tolerance, Wells Fargo Advantage Funds® offers more than 120 mutual funds and other investments covering a wide range of asset classes and investment styles. Although diversification cannot guarantee an investment profit or prevent losses, we believe it can be an effective way to manage investment risk and potentially smooth out overall portfolio performance.
Along with more upbeat economic data, better-than-expected corporate earnings power played a role in driving stock prices higher.
| | | |
|
| 4 Wells Fargo Advantage VT Opportunity Fund | | Letter to Shareholders |
Thank you for choosing Wells Fargo Advantage Funds. We appreciate your continued confidence in us and are committed to helping you meet your financial needs. If you have any questions about your investments, please contact your investment professional, call us at 1-800-222-8222, or visit wellsfargo.com/advantagefunds.
Sincerely,

Karla M. Rabusch
President
Wells Fargo Advantage Funds
This page is intentionally left blank.
| | | |
|
| 6 Wells Fargo Advantage VT Opportunity Fund | | Performance Highlights (Unaudited) |
Wells Fargo Advantage VT Opportunity FundSM
INVESTMENT OBJECTIVE
The Fund seeks long-term capital appreciation.
INVESTMENT ADVISER
Wells Fargo Funds Management, LLC
SUB-ADVISER
Wells Capital Management Incorporated
PORTFOLIO MANAGER
Ann M. Miletti
FUND INCEPTION
May 8, 1992
PERFORMANCE SUMMARY
12 MONTH TOTAL RETURN AS OF DECEMBER 31, 2010
| | | | | |
|
| Class 2 | | | 23.76 | % |
Russell Midcap® Index1 | | | 25.48 | % |
Figures quoted represent past performance, which is no guarantee of future results and do not reflect the deduction of taxes that a shareholder may pay on fund distributions or the redemption of fund shares. Investment return and principal value of an investment will fluctuate so that an investor’s shares, when redeemed, may be worth more or less than their original cost. Current performance may be lower or higher than the performance data quoted. Current month-end performance is available by calling 1-866-765-0778. Performance figures of the Fund do not reflect fees charged pursuant to the terms of variable life insurance policies and variable annuity contracts.
The adviser has committed, through April 30, 2011, to waive fees and/or reimburse expenses to maintain the contractual expense cap at 1.07% for the Class 2 shares excluding acquired fund fees and certain other expenses. Without these reductions, the Fund’s returns would have been lower. The Fund’s net expense ratio is 1.09% for the Class 2 shares. The Fund’s gross expense ratio is 1.34% for the Class 2 shares.
| | |
| 1. | | The Russell Midcap® Index measures the performance of the 800 smallest companies in the Russell 1000® Index, which represent approximately 25% of the total market capitalization of the Russell 1000® Index. You cannot invest directly in an index. |
| |
| 2. | | The chart compares the performance of the Wells Fargo Advantage VT Opportunity Fund Class 2 for the most recent ten years of the Fund with the Russell Midcap® Index. The chart assumes a hypothetical $10,000 investment and reflects all operating expenses of the Fund. |
| | | |
|
| Performance Highlights (Unaudited) | | Wells Fargo Advantage VT Opportunity Fund 7 |
Wells Fargo Advantage VT Opportunity FundSM (continued)
MANAGER’S DISCUSSION
Fund highlights
| § | | The Fund underperformed its benchmark, the Russell Midcap® Index, for the 12-month period ended December 31, 2010. |
| |
| § | | Holdings in the consumer discretionary and financials sectors detracted from relative returns, offsetting positive stock selection in the information technology and other sectors. |
| |
| § | | As the market rallied over the past year, our process remained disciplined. We continued to look for well-positioned businesses with solid business models, strong management teams, and favorable trends, and that trade at attractive discounts to our estimated private market value (PMV). Private market value is the value of all the individual business segments of a company, added together. |
Stock selection and sector weights both contributed to the Fund’s investment results.
The information technology sector was the top contributor to relative performance during the 12-month period that ended December 31, 2010, due to positive stock selection, especially in areas related to the continuing move toward digital mobility, storage, and cloud computing. Key holdings included Red Hat, Incorporated (up 47%); NetApp, Incorporated (up 59%); and Akamai Technologies, Incorporated (up more than 80%).
In the health care sector, Health Management Associates, Incorporated, (HMA) was a key contributor over the 12-month period. HMA did well (up 31%) despite the general volume softness in the hospital space. HMA has unique volume and profit strategies related to its management strategy of increased emergency room productivity and careful physician recruitment. We continue to hold the stock because it still trades at a reasonable discount to PMV, and we remain confident in the management of the company.
TEN LARGEST EQUITY HOLDINGS3
(AS OF DECEMBER 31, 2010)
| | | | | |
|
| Weatherford International Limited | | | 1.28 | % |
| Global Payments Incorporated | | | 1.23 | % |
| Praxair Incorporated | | | 1.21 | % |
| ON Semiconductor Corporation | | | 1.18 | % |
| National Oilwell Varco Incorporated | | | 1.17 | % |
| Alliance Data Systems Corporation | | | 1.16 | % |
| Manpower Incorporated | | | 1.12 | % |
| Comcast Corporation Class A | | | 1.12 | % |
| Nordstrom Incorporated | | | 1.09 | % |
| Microsemi Corporation | | | 1.09 | % |
Collectively, the Fund’s energy holdings detracted from results, although virtually all of the energy sector shortfall can be attributed to one stock, Transocean Ltd., which was negatively affected by the Gulf oil spill last year. We believe that the company remains fundamentally strong with solid businesses and growth potential. Nevertheless, this one holding offset good stock selection in other energy positions, including National Oilwell Varco, Incorporated; Weatherford International Limited and Peabody Energy Corporation.
| | |
| 3. | | The ten largest equity holdings are calculated based on the value of the securities divided by total investments of the Fund. Holdings are subject to change and may have changed since the date specified. |
| | | |
|
| 8 Wells Fargo Advantage VT Opportunity Fund | | Performance Highlights (Unaudited) |
Wells Fargo Advantage VT Opportunity FundSM (continued)
Lastly, the consumer discretionary sector lagged its counterpart in the benchmark in 2010. The culprit was primarily in the retail space, where mixed stock selection occurred. For example, key holding Target Corporation (up 26%) outperformed. However, other retail positions (Kohl’s, Staples, Incorporated; and Best Buy Company Incorporated) were laggards, as the economy continued to struggle to produce a vibrant recovery. Of course, the consumer discretionary space is large with various subsectors, and better results were evident in many of those areas. Cablevision Systems Corporation is one example, rising 60% on announced intentions to split Rainbow Media Holdings off from the cable operations that fueled some merger and acquisition speculation about the attractiveness of the cable business.
Our methodology of buying stocks that are selling at a discount to their intrinsic PMVs and selling stocks that approach their PMVs continues.
Our discipline allows us to be patient with stocks that are out of favor with the market. This past year, we witnessed very aggressive fiscal and monetary policies designed to “kick start” a lackluster economic recovery. The Federal Reserve’s announcement that it would purchase $600 billion in U.S. Treasury bonds as part of the second round of quantitative easing, or its “QE2” program, was perhaps the most visible evidence of the policymakers’ unprecedented actions. The passage of pro-growth tax legislation was another remarkable development.
We view these macroeconomic and policy actions favorably. Our PMV techniques help us to separate the “noise” from the fundamentals and are particularly useful in this type of financial environment.
Uncertainty remains, but opportunities remain as well.
Looking ahead, we remain constructive on the technological innovations spurring top- and bottom-line growth opportunities in individual companies. Additionally, industrial companies are likely to continue to benefit from order and production growth. Health care and financials are sectors with some changing headwinds, so we remain selective in those areas.
| | |
| 4. | | Sector distribution is subject to change and is calculated based on the total common stock investments of the Fund. |
| | | |
|
| Performance Highlights (Unaudited) | | Wells Fargo Advantage VT Opportunity Fund 9 |
Wells Fargo Advantage VT Opportunity FundSM (continued)
AVERAGE ANNUAL TOTAL RETURN (%) (AS OF DECEMBER 31, 2010)
| | | | | | | | | | | | | | | | | | | | | | | | | | | | | |
| | | Inception | | | | | | | | | | | | | | | | | | Expense Ratios5 |
| | | Date | | 6 Months* | | 1 Year | | 5 Year | | 10 Year | | Gross | | Net6 |
| Class 2 | | | 5/8/1992 | | | | 27.67 | | | | 23.76 | | | | 5.56 | | | | 4.90 | | | | 1.34 | % | | | 1.09 | % |
Russell Midcap® Index1 | | | | | | | 28.12 | | | | 25.48 | | | | 4.66 | | | | 6.54 | | | | | | | | | |
| | |
| * | | Returns for periods of less than one year are not annualized. |
Figures quoted represent past performance, which is no guarantee of future results and do not reflect the deduction of taxes that a shareholder may pay on fund distributions or the redemption of fund shares. Investment return and principal value of an investment will fluctuate so that an investor’s shares, when redeemed, may be worth more or less than their original cost. Current performance may be lower or higher than the performance data quoted. Current month-end performance is available by calling 1-866-765-0778. Performance figures of the Fund do not reflect fees charged pursuant to the terms of variable life insurance policies and variable annuity contracts.
Stock fund values fluctuate in response to the activities of individual companies and general market and economic conditions. Smaller company stocks tend to be more volatile and less liquid than those of larger companies. The use of derivatives may reduce returns and/or increase volatility. Certain investment strategies tend to increase the total risk of an investment (relative to the broader market). This Fund is exposed to foreign investment risk. Consult the Fund’s prospectus for additional information on these and other risks.
Please refer to the prospectus provided by your participating insurance company for detailed information describing the separate accounts for information regarding surrender charges, mortality and expense risk fees and other charges that may be assessed by the participating insurance companies.
| | |
| 5. | | Reflects the expense ratio as stated in the May 1, 2010 prospectus. |
| |
| 6. | | The investment adviser has contractually committed through April 30, 2011 to waive fees and/or reimburse expenses maintain the Fund’s contractual expense cap at 1.07% for the Class 2 shares, excluding acquired fund fees and certain other expenses. Without these reductions, the Fund’s returns would have been lower. |
| | | |
|
| 10 Wells Fargo Advantage VT Opportunity Fund | | Fund Expenses (Unaudited) |
As a shareholder of the Fund, you incur two types of costs: (1) transaction costs, including sales charges (loads) on purchase payments, redemption fees (if any) and exchange fees (if any); and (2) ongoing costs, including management fees; distribution (12b-1) and/or shareholder service fees; and other Fund expenses. This example is intended to help you understand your ongoing costs (in dollars) of investing in the Fund and to compare these costs with the ongoing costs of investing in other mutual funds.
The example is based on an investment of $1,000 invested at the beginning of the six-month period and held for the entire period from July 1, 2010 to December 31, 2010.
Actual expenses
The “Actual” line of the table below provides information about actual account values and actual expenses. You may use the information in this line, together with the amount you invested, to estimate the expenses that you paid over the period. Simply divide your account value by $1,000 (for example, an $8,600 account value divided by $1,000 = 8.6), then multiply the result by the number in the “Actual” line under the heading entitled “Expenses Paid During Period” for your applicable class of shares to estimate the expenses you paid on your account during this period.
Hypothetical example for comparison purposes
The “Hypothetical” line of the table below provides information about hypothetical account values and hypothetical expenses based on the Fund’s actual expense ratio and an assumed rate of return of 5% per year before expenses, which is not the Fund’s actual return. The hypothetical account values and expenses may not be used to estimate the actual ending account balance or expenses you paid for the period. You may use this information to compare the ongoing costs of investing in the Fund and other funds. To do so, compare this 5% hypothetical example with the 5% hypothetical examples that appear in the shareholder reports of the other funds.
Please note that the expenses shown in the table are meant to highlight your ongoing costs only and do not reflect any transactional costs, such as sales charges (loads), redemption fees, exchange fees or separate account charges assessed by participating insurance companies. Therefore, the “Hypothetical” line of the table is useful in comparing ongoing costs only, and will not help you determine the relative total costs of owning different funds. In addition, if these transactional costs were included, your costs would have been higher.
| | | | | | | | | | | | | | | | | |
| | | Beginning | | Ending | | Expenses | | |
| | | Account Value | | Account Value | | Paid During | | Net Annual |
| | | 07-01-2010 | | 12-31-2010 | | the Period1 | | Expense Ratio |
Class 2 | | | | | | | | | | | | | | | | |
| Actual | | $ | 1,000.00 | | | $ | 1,276.68 | | | $ | 6.21 | | | | 1.07 | % |
| Hypothetical (5% return before expenses) | | $ | 1,000.00 | | | $ | 1,020.03 | | | $ | 5.51 | | | | 1.07 | % |
| | |
| 1. | | Expenses are equal to the Fund’s annualized expense ratio multiplied by the average account value over the period, multiplied by the number of days in the most recent fiscal half-year divided by the number of days in the fiscal year (to reflect the one-half year period). |
| | | |
|
| Portfolio of Investments—December 31, 2010 | | Wells Fargo Advantage VT Opportunity Fund 11 |
| | | | | | | | | |
| Shares | | | Security Name | | Value | |
| Common Stocks: 95.34% | | | | |
| | | | | | | | | |
| Consumer Discretionary: 20.79% | | | | |
| | | | | | | | | |
| Auto Components: 1.28% | | | | |
| | 56,300 | | | Johnson Controls Incorporated | | $ | 2,150,660 | |
| | | | | | | | |
| | | | | | | | | |
| Commercial Services & Supplies: 1.54% | | | | |
| | 36,435 | | | Alliance Data Systems Corporation†« | | | 2,587,978 | |
| | | | | | | | |
| | | | | | | | | |
| Diversified Consumer Services: 1.37% | | | | |
| | 58,454 | | | Apollo Group Incorporated Class A† | | | 2,308,348 | |
| | | | | | | | |
| | | | | | | | | |
| Hotels, Restaurants & Leisure: 2.38% | | | | |
| | 44,520 | | | Carnival Corporation | | | 2,052,817 | |
| | 42,223 | | | Darden Restaurants Incorporated« | | | 1,960,836 | |
| | | | | | | | | |
| | | | | | | | 4,013,653 | |
| | | | | | | | |
| | | | | | | | | |
| Internet & Catalog Retail: 1.27% | | | | |
| | 135,200 | | | Liberty Media Corporation Interactive Series A† | | | 2,132,104 | |
| | | | | | | | |
| | | | | | | | | |
| Media: 6.25% | | | | |
| | 60,610 | | | Cablevision Systems Corporation New York Group Class A | | | 2,051,042 | |
| | 119,800 | | | Comcast Corporation Class A | | | 2,493,038 | |
| | 48,200 | | | Liberty Global Incorporated Series A†« | | | 1,705,316 | |
| | 49,830 | | | Omnicom Group Incorporated | | | 2,282,214 | |
| | 38,396 | | | Scripps Networks Interactive Incorporated | | | 1,986,993 | |
| | | | | | | | | |
| | | | | | | | 10,518,603 | |
| | | | | | | | |
| | | | | | | | | |
| Multiline Retail: 4.26% | | | | |
| | 44,500 | | | Kohl’s Corporation†« | | | 2,418,130 | |
| | 57,455 | | | Nordstrom Incorporated« | | | 2,434,943 | |
| | 38,400 | | | Target Corporation« | | | 2,308,992 | |
| | | | | | | | | |
| | | | | | | | 7,162,065 | |
| | | | | | | | |
| | | | | | | | | |
| Specialty Retail: 2.44% | | | | |
| | 49,200 | | | Best Buy Company Incorporated | | | 1,687,068 | |
| | 106,600 | | | Staples Incorporated« | | | 2,427,282 | |
| | | | | | | | | |
| | | | | | | | 4,114,350 | |
| | | | | | | | |
| | | | | | | | | |
| Consumer Staples: 3.93% | | | | |
| | | | | | | | | |
| Food & Staples Retailing: 1.43% | | | | |
| | 107,430 | | | Kroger Company | | | 2,402,135 | |
| | | | | | | | |
| | | | | | | | | |
| Food Products: 1.13% | | | | |
| | 53,600 | | | General Mills Incorporated | | | 1,907,624 | |
| | | | | | | | |
| | | | | | | | | |
| Household Products: 1.37% | | | | |
| | 33,360 | | | Church & Dwight Company Incorporated« | | | 2,302,507 | |
| | | | | | | | |
| | | | | | | | | |
| Energy: 8.98% | | | | |
| | | | | | | | | |
| Energy Equipment & Services: 4.60% | | | | |
| | 38,980 | | | National Oilwell Varco Incorporated | | | 2,621,405 | |
| | 32,630 | | | Transocean Limited†« | | | 2,268,111 | |
| | 125,310 | | | Weatherford International Limited† | | | 2,857,068 | |
| | | | | | | | | |
| | | | | | | | 7,746,584 | |
| | | | | | | | |
| | | |
|
| 12 Wells Fargo Advantage VT Opportunity Fund | | Portfolio of Investments—December 31, 2010 |
| | | | | | | | | |
| Shares | | | Security Name | | Value | |
| Oil, Gas & Consumable Fuels: 4.38% | | | | |
| | 18,950 | | | Apache Corporation | | $ | 2,259,409 | |
| | 16,370 | | | Peabody Energy Corporation | | | 1,047,353 | |
| | 44,236 | | | Range Resources Corporation« | | | 1,989,735 | |
| | 55,300 | | | Southwestern Energy Company† | | | 2,069,879 | |
| | | | | | | | | |
| | | | | | | | 7,366,376 | |
| | | | | | | | |
| | | | | | | | | |
| Financials: 16.65% | | | | |
| | | | | | | | | |
| Capital Markets: 2.80% | | | | |
| | 20,148 | | | Bank of New York Mellon Corporation | | | 608,470 | |
| | 97,592 | | | INVESCO Limited | | | 2,348,064 | |
| | 92,103 | | | TD Ameritrade Holding Corporation | | | 1,749,036 | |
| | | | | | | | | |
| | | | | | | | 4,705,570 | |
| | | | | | | | |
| | | | | | | | | |
| Commercial Banks: 2.69% | | | | |
| | 90,310 | | | Branch Banking & Trust Corporation« | | | 2,374,250 | |
| | 35,153 | | | City National Corporation« | | | 2,156,988 | |
| | | | | | | | | |
| | | | | | | | 4,531,238 | |
| | | | | | | | |
| | | | | | | | | |
| Consumer Finance: 1.34% | | | | |
| | 10,050 | | | MasterCard Incorporated | | | 2,252,306 | |
| | | | | | | | |
| | | | | | | | | |
| Insurance: 4.80% | | | | |
| | 30,630 | | | ACE Limited | | | 1,906,718 | |
| | 40,600 | | | Reinsurance Group of America Incorporated | | | 2,180,626 | |
| | 31,276 | | | RenaissanceRe Holdings Limited« | | | 1,991,968 | |
| | 100,899 | | | The Progressive Corporation | | | 2,004,863 | |
| | | | | | | | | |
| | | | | | | | 8,084,175 | |
| | | | | | | | |
| | | | | | | | | |
| Real Estate Investment Trusts (REIT): 3.78% | | | | |
| | 117,700 | | | BioMed Realty Trust Incorporated« | | | 2,195,105 | |
| | 21,100 | | | Equity Residential | | | 1,096,145 | |
| | 58,188 | | | Host Hotels & Resorts Incorporated« | | | 1,039,820 | |
| | 77,100 | | | LaSalle Hotel Properties« | | | 2,035,440 | |
| | | | | | | | | |
| | | | | | | | 6,366,510 | |
| | | | | | | | |
| | | | | | | | | |
| Thrifts & Mortgage Finance: 1.24% | | | | |
| | 148,770 | | | People’s United Financial Incorporated« | | | 2,084,268 | |
| | | | | | | | |
| | | | | | | | | |
| Health Care: 9.88% | | | | |
| | | | | | | | | |
| Biotechnology: 1.17% | | | | |
| | 32,014 | | | Cephalon Incorporated†« | | | 1,975,904 | |
| | | | | | | | |
| | | | | | | | | |
| Health Care Equipment & Supplies: 3.77% | | | | |
| | 22,770 | | | C.R. Bard Incorporated« | | | 2,089,603 | |
| | 50,170 | | | Covidien Limited | | | 2,290,762 | |
| | 36,676 | | | Zimmer Holdings Incorporated† | | | 1,968,768 | |
| | | | | | | | | |
| | | | | | | | 6,349,133 | |
| | | | | | | | |
| | | | | | | | | |
| Health Care Providers & Services: 2.40% | | | | |
| | 237,500 | | | Health Management Associates Incorporated Class A†« | | | 2,265,750 | |
| | 25,200 | | | McKesson Corporation | | | 1,773,576 | |
| | | | | | | | | |
| | | | | | | | 4,039,326 | |
| | | | | | | | |
| | | |
|
| Portfolio of Investments—December 31, 2010 | | Wells Fargo Advantage VT Opportunity Fund 13 |
| | | | | | | | | |
| Shares | | | Security Name | | Value | |
| Life Sciences Tools & Services: 2.54% | | | | |
| | 37,690 | | | Thermo Fisher Scientific Incorporated† | | $ | 2,086,518 | |
| | 28,070 | | | Waters Corporation† | | | 2,181,320 | |
| | | | | | | | | |
| | | | | | | | 4,267,838 | |
| | | | | | | | |
| | | | | | | | | |
| Industrials: 13.71% | | | | |
| | | | | | | | | |
| Aerospace & Defense: 1.03% | | | | |
| | 29,650 | | | Rockwell Collins Incorporated | | | 1,727,409 | |
| | | | | | | | |
| | | | | | | | | |
| Building Products: 1.35% | | | | |
| | 179,830 | | | Masco Corporation« | | | 2,276,648 | |
| | | | | | | | |
| | | | | | | | | |
| Commercial Services & Supplies: 1.16% | | | | |
| | 65,240 | | | Republic Services Incorporated | | | 1,948,066 | |
| | | | | | | | |
| |
| Construction & Engineering: 1.37% | | | |
| | 50,200 | | | Jacobs Engineering Group Incorporated† | | | 2,301,670 | |
| | | | | | | | |
| | | | | | | | | |
| Electrical Equipment: 2.00% | | | | |
| | 47,700 | | | AMETEK Incorporated | | | 1,872,225 | |
| | 20,900 | | | Rockwell Automation Incorporated« | | | 1,498,739 | |
| | | | | | | | | |
| | | | | | | | 3,370,964 | |
| | | | | | | | |
| | | | | | | | | |
| Machinery: 4.19% | | | | |
| | 40,770 | | | Dover Corporation | | | 2,383,007 | |
| | 44,210 | | | Illinois Tool Works Incorporated | | | 2,360,814 | |
| | 6,706 | | | Oshkosh Corporation† | | | 236,319 | |
| | 41,890 | | | Pall Corporation | | | 2,076,906 | |
| | | | | | | | | |
| | | | | | | | 7,057,046 | |
| | | | | | | | |
| | | | | | | | | |
| Professional Services: 1.49% | | | | |
| | 39,879 | | | Manpower Incorporated« | | | 2,502,806 | |
| | | | | | | | |
| | | | | | | | | |
| Road & Rail: 1.12% | | | | |
| | 46,422 | | | J.B. Hunt Transport Services Incorporated« | | | 1,894,482 | |
| | | | | | | | |
| | | | | | | | | |
| Information Technology: 15.42% | | | | |
| | | | | | | | | |
| Communications Equipment: 1.19% | | | | |
| | 51,600 | | | Polycom Incorporated†« | | | 2,011,368 | |
| | | | | | | | |
| | | | | | | | | |
| Computers & Peripherals: 1.05% | | | | |
| | 32,200 | | | NetApp Incorporated†« | | | 1,769,712 | |
| | | | | | | | |
| | | | | | | | | |
| Electronic Equipment & Instruments: 1.34% | | | | |
| | 42,660 | | | Amphenol Corporation Class A | | | 2,251,595 | |
| | | | | | | | |
| | | | | | | | | |
| Internet Software & Services: 1.69% | | | | |
| | 18,920 | | | Akamai Technologies Incorporated† | | | 890,186 | |
| | 24,000 | | | Equinix Incorporated† | | | 1,950,240 | |
| | | | | | | | | |
| | | | | | | | 2,840,426 | |
| | | | | | | | |
| | | | | | | | | |
| IT Services: 1.64% | | | | |
| | 59,608 | | | Global Payments Incorporated« | | | 2,754,486 | |
| | | | | | | | |
| | | | | | | | | |
| Semiconductors & Semiconductor Equipment: 4.99% | | | | |
| | 45,550 | | | Altera Corporation« | | | 1,620,669 | |
| | 260,300 | | | ARM Holdings plc | | | 1,717,893 | |
| | | |
|
| 14 Wells Fargo Advantage VT Opportunity Fund | | Portfolio of Investments—December 31, 2010 |
| | | | | | | | | | | | | | | | | | | | | |
| Shares | | | Security Name | | | | | | | | | | | | | | Value | |
| Semiconductors & Semiconductor Equipment (continued) | | | | | | | | | | | | | | | | |
| | 106,200 | | | Microsemi Corporation† | | | | | | | | | | | | | | $ | 2,431,980 | |
| | 266,340 | | | ON Semiconductor Corporation†« | | | | | | | | | | | | | | | 2,631,439 | |
| | | | | | | | | | | | | | | | | | | | | |
| | | | | | | | | | | | | | | | | | | | 8,401,981 | |
| | | | | | | | | | | | | | | | | | | | |
| | | | | | | | | | | | | | | | | | | | | |
| Software: 3.52% | | | | | | | | | | | | | | | | |
| | 59,300 | | | Autodesk Incorporated†« | | | | | | | | | | | | | | | 2,265,260 | |
| | 111,400 | | | Electronic Arts Incorporated†« | | | | | | | | | | | | | | | 1,824,732 | |
| | 40,280 | | | Red Hat Incorporated† | | | | | | | | | | | | | | | 1,838,782 | |
| | | | | | | | | | | | | | | | | | | | | |
| | | | | | | | | | | | | | | | | | | | 5,928,774 | |
| | | | | | | | | | | | | | | | | | | | |
| | | | | | | | | | | | | | | | | | | | | |
| Materials: 5.04% | | | | | | | | | | | | | | | | |
| | | | | | | | | | | | | | | | | | | | | |
| Chemicals: 1.60% | | | | | | | | | | | | | | | | |
| | 28,270 | | | Praxair Incorporated | | | | | | | | | | | | | | | 2,698,937 | |
| | | | | | | | | | | | | | | | | | | | |
| | | | | | | | | | | | | | | | | | | | | |
| Containers & Packaging: 2.67% | | | | | | | | | | | | | | | | |
| | 70,580 | | | Crown Holdings Incorporated† | | | | | | | | | | | | | | | 2,355,960 | |
| | 83,740 | | | Sealed Air Corporation« | | | | | | | | | | | | | | | 2,131,183 | |
| | | | | | | | | | | | | | | | | | | | | |
| | | | | | | | | | | | | | | | | | | | 4,487,143 | |
| | | | | | | | | | | | | | | | | | | | |
| | | | | | | | | | | | | | | | | | | | | |
| Metals & Mining: 0.77% | | | | | | | | | | | | | | | | |
| | 16,830 | | | Agnico-Eagle Mines Limited« | | | | | | | | | | | | | | | 1,290,861 | |
| | | | | | | | | | | | | | | | | | | | |
| | | | | | | | | | | | | | | | | | | | | |
| Telecommunication Services: 0.94% | | | | | | | | | | | | | | | | |
| | | | | | | | | | | | | | | | | | | | | |
| Wireless Telecommunication Services: 0.94% | | | | | | | | | | | | | | | | |
| | 30,660 | | | American Tower Corporation Class A† | | | | | | | | | | | | | | | 1,583,282 | |
| | | | | | | | | | | | | | | | | | | | |
| | | | | | | | | | | | | | | | | | | | | |
| Total Common Stocks (Cost $117,905,180) | | | | | | | | | | | | | | | 160,466,911 | |
| | | | | | | | | | | | | | | | | | | | |
| | | | | | | | | | | | | | | | | | | | | |
| Investment companies: 1.00% | | | | | | | | | | | | | | | | |
| | 10,200 | | | SPDR S&P MidCap 400 ETF Trust | | | | | | | | | | | | | | | 1,679,736 | |
| | | | | | | | | | | | | | | | | | | | |
| | | | | | | | | | | | | | | | | | | | | |
| Total Investment companies (Cost $1,694,588) | | | | | | | | | | | | | | | 1,679,736 | |
| | | | | | | | | | | | | | | | | | | | |
| | | | | | | | | | | | | | | |
| Principal | | | | | | | | | Interest Rate | | Maturity Date | | | | |
| Short-Term Investments: 36.49% | | | | | | | | | | | | | | | | |
| | | | | | | | | | | | | | | | | | | | | |
| Corporate Bonds & Notes: 1.50% | | | | | | | | | | | | | | | | |
| $ | 2,205,502 | | | Gryphon Funding Limited(v)(a)(i) | | | | | | | 0.00 | % | | | 08/05/2011 | | | | 895,875 | |
| | 2,901,047 | | | VFNC Corporation(v)±††(a)(i) | | | | | | | 0.26 | | | | 09/29/2011 | | | | 1,624,586 | |
| | | | | | | | | | | | | | | | | | | | | |
| | | | | | | | | | | | | | | | | | | | 2,520,461 | |
| | | | | | | | | | | | | | | | | | | | |
| |
| Shares | | | | | | | | | Yield | | | | | | | | |
| Investment Companies: 34.99% | | | | | | | | | | | | | | | | |
| | 7,851,452 | | | Wells Fargo Advantage Cash Investment Money Market Fund(l)(u) | 0.14 | | | | | | | | 7,851,452 | |
| | 51,045,642 | | | Wells Fargo Securities Lending Cash Investments LLC(v)(l)(u) | | | 0.27 | | | | | | | | 51,045,642 | |
| | | | | | | | | | | | | | | | | | | | | |
| | | | | | | | | | | | | | | | | | | | 58,897,094 | |
| | | | | | | | | | | | | | | | | | | | |
| | | | | | | | | | | | | | | | | | | | | |
| Total Short-Term Investments (Cost $60,492,594) | | | | | | | | | | | | | | | 61,417,555 | |
| | | | | | | | | | | | | | | | | | | | |
| | | | | | | | | | | | | | | | | | | | | |
Total Investments in Securities
(Cost $180,092,362)* | | | 132.83 | % | | | | | | | | | | | 223,564,202 | |
| | | | | | | | | | | | | | | | | | | | | |
| Other Assets and Liabilities, Net | | | (32.83 | ) | | | | | | | | | | | (55,257,104 | ) |
| | | | | | | | | | | | | | | | | | | |
| | | | | | | | | | | | | | | | | | | | | |
| Total Net Assets | | | 100.00 | % | | | | | | | | | | $ | 168,307,098 | |
| | | | | | | | | | | | | | | | | | | |
| | | |
|
| Portfolio of Investments—December 31, 2010 | | Wells Fargo Advantage VT Opportunity Fund 15 |
| | |
| (v) | | Security represents investment of cash collateral received from securities on loan. |
| |
| † | | Non-income earning securities. |
| |
| (l) | | Investment in an affiliate. |
| |
| « | | All or a portion of this security is on loan. |
| |
| ± | | Variable rate investments. |
| |
| †† | | Securities that may be resold to “qualified institutional buyers” under Rule 144A or securities offered pursuant to Section 4(2) of the Securities Act of 1933, as amended. |
| |
| (a) | | Security is fair valued by the Management Valuation Team, and in certain instances by the Board of Trustees, in accordance with procedures approved by the Board of Trustees. |
| |
| (i) | | Illiquid security for which the designation as illiquid is unaudited. |
| |
| (u) | | Rate shown is the 7-day annualized yield at period end. |
| |
| * | | Cost for federal income tax purposes is $187,449,787 and net unrealized appreciation (depreciation) consists of: |
| | | | | |
| Gross unrealized appreciation | | $ | 46,815,825 | |
| Gross unrealized depreciation | | | (10,701,410 | ) |
| | | | |
| |
| Net unrealized appreciation | | $ | 36,114,415 | |
The accompanying notes are an integral part of these financial statements.
| | | |
|
| 16 Wells Fargo Advantage VT Opportunity Fund | | Statement of Assets and Liabilities—December 31, 2010 |
| | | | | |
|
Assets | | | | |
| Investments | | | | |
| In unaffiliated securities (including securities on loan), at value | | $ | 164,667,108 | |
| In affiliated securities, at value | | | 58,897,094 | |
| | | | |
| Total investments, at value ( see cost below) | | | 223,564,202 | |
| Foreign currency, at value (see cost below) | | | 12,008 | |
| Receivable for investments sold | | | 802,430 | |
| Receivable for Fund shares sold | | | 53,486 | |
| Receivable for dividends | | | 119,379 | |
| Prepaid expenses and other assets | | | 167 | |
| | | | |
| Total assets | | | 224,551,672 | |
| | | | |
| | | | | |
Liabilities | | | | |
| Payable for investments purchased | | | 2,402,630 | |
| Payable for Fund shares redeemed | | | 367,876 | |
| Payable upon receipt of securities loaned | | | 52,641,142 | |
| Investment advisory fee payable | | | 314,650 | |
| Distribution fees payable | | | 38,026 | |
| Due to other related parties | | | 16,370 | |
| Accrued expenses and other liabilities | | | 463,880 | |
| | | | |
| Total liabilities | | | 56,244,574 | |
| | | | |
Total net assets | | $ | 168,307,098 | |
| | | | |
| | | | | |
NET ASSETS CONSIST OF | | | | |
| Paid-in capital | | $ | 191,287,864 | |
| Undistributed net investment income | | | 88,428 | |
| Accumulated net realized losses on investments | | | (66,540,857 | ) |
| Net unrealized gains on investments | | | 43,471,663 | |
| | | | |
Total net assets | | $ | 168,307,098 | |
| | | | |
| | | | | |
COMPUTATION OF NET ASSET VALUE PER SHARE1 | | | | |
| Net assets — Class 2 | | $ | 168,307,098 | |
| Shares outstanding — Class 2 | | | 9,134,752 | |
| Net asset value per share — Class 2 | | $ | 18.42 | |
| | | | |
| | | | | |
| Total investments, at cost | | $ | 180,092,362 | |
| | | | |
| Securities on loan, at value | | $ | 51,152,690 | |
| | | | |
| Foreign currency, at cost | | $ | 12,185 | |
| | | | |
| | |
| 1. | | The Fund has an unlimited number of authorized shares. |
The accompanying notes are an integral part of these financial statements.
| | | |
|
| Statement of Operations—For the Year Ended December 31, 2010 | | Wells Fargo Advantage VT Opportunity Fund 17 |
| | | | | |
|
Investment income | | | | |
| Dividends* | | $ | 1,752,273 | |
| Income from affiliated securities | | | 8,898 | |
| Securities lending income, net | | | 33,498 | |
| | | | |
| Total investment income | | | 1,794,669 | |
| | | | |
| | | | | |
Expenses | | | | |
| Investment advisory fee | | | 1,099,207 | |
| Administration fees | | | | |
| Fund level | | | 168,008 | |
Class 21 | | | 60,223 | |
| Distribution fees | | | | |
Class 21 | | | 391,899 | |
| Custody and accounting fees | | | 15,021 | |
| Professional fees | | | 40,581 | |
| Shareholder report expenses | | | 45,781 | |
| Trustees’ fees and expenses | | | 10,549 | |
| Other fees and expenses | | | 11,124 | |
| | | | |
| Total expenses | | | 1,842,393 | |
| | | | | |
Less: Fee waivers and/or expense reimbursements | | | (168,590 | ) |
| | | | |
| Net expenses | | | 1,673,803 | |
| | | | |
| Net investment income | | | 120,866 | |
| | | | |
| | | | | |
REALIZED AND UNREALIZED GAINS (LOSSES) ON INVESTMENTS | | | | |
| Net realized gains on unaffiliated securities and foreign currencies | | | 19,746,984 | |
| Net change in unrealized gains (losses) on unaffiliated securities and foreign currencies | | | 14,072,322 | |
| | | | |
| Net realized and unrealized gains (losses) on investments | | | 33,819,306 | |
| | | | |
Net increase in net assets resulting from operations | | $ | 33,940,172 | |
| | | | |
| | | | | |
| |
| * Net of foreign withholding taxes of | | $ | 377 | |
| | |
| |
| 1. After the close of business on July 16, 2010, existing shares of the Fund were renamed Class 2 shares. |
The accompanying notes are an integral part of these financial statements.
| | | |
|
| 18 Wells Fargo Advantage VT Opportunity Fund | | Statements of Changes in Net Assets |
| | | | | | | | | | | | | | | | | |
| | | Year Ended | | Year Ended |
| | | December 31, 2010 | | December 31, 2009 |
| |
Operations | | | | | | | | | | | | | | | | |
| Net investment income | | | | | | $ | 120,866 | | | | | | | $ | 1,145,424 | |
| Net realized gains (losses) on investments | | | | | | | 19,746,984 | | | | | | | | (35,715,713 | ) |
| Net change in unrealized gains (losses) on investments | | | | | | | 14,072,322 | | | | | | | | 158,792,953 | |
| | | |
| Net increase in net assets resulting from operations | | | | | | | 33,940,172 | | | | | | | | 124,222,664 | |
| | | |
| | | | | | | | | | | | | | | | | |
Distributions to shareholders from | | | | | | | | | | | | | | | | |
| Net investment income — Class 2* | | | | | | | (1,195,940 | ) | | | | | | | 0 | |
| | | |
| | | | | | | | | | | | | | | | | |
| | | Shares | | | | | | Shares | | | | |
Capital share transactions | | | | | | | | | | | | | | | | |
| Proceeds from shares sold — Class 2* | | | 826,626 | | | | 13,114,185 | | | | 4,540,032 | | | | 55,033,529 | |
| Reinvestment of distributions — Class 2* | | | 82,938 | | | | 1,195,940 | | | | 0 | | | | 0 | |
| Cost of shares redeemed — Class 2* | | | (2,085,400 | ) | | | (33,529,757 | ) | | | (31,456,579 | ) | | | (402,671,184 | ) |
| | | |
| Net decrease in net assets resulting from capital share transactions | | | | | | | (19,219,632 | ) | | | | | | | (347,637,655 | ) |
| | | |
Net increase (decrease) in net assets | | | | | | | 13,524,600 | | | | | | | | (223,414,991 | ) |
| | | |
| | | | | | | | | | | | | | | | | |
Net assets | | | | | | | | | | | | | | | | |
| Beginning of period | | | | | | | 154,782,498 | | | | | | | | 378,197,489 | |
| | | |
| End of period | | | | | | $ | 168,307,098 | | | | | | | $ | 154,782,498 | |
| | | |
| Undistributed net investment income | | | | | | $ | 88,428 | | | | | | | $ | 1,094,975 | |
| | | |
| | |
| * | | After the close of business on July 16, 2010, existing shares of the Fund were renamed Class 2 shares. |
The accompanying notes are an integral part of these financial statements.
This page is intentionally left blank.
| | | |
|
| 20 Wells Fargo Advantage VT Opportunity Fund | | Financial Highlights |
| | | | | | | | | | | | | | | | | | | | | |
| | | Beginning | | | | | | Net Realized | | Distributions | | |
| | | Net Asset | | Net | | and Unrealized | | from Net | | Distributions |
| | | Value Per | | Investment | | Gains (Losses) | | Investment | | from Net |
| | | Share | | Income | | on Investments | | Income | | Realized Gains |
| |
Class 22 | | | | | | | | | | | | | | | | | | | | |
| January 1, 2010 to December 31, 2010 | | $ | 15.01 | | | | 0.02 | | | | 3.51 | | | | (0.12 | ) | | | 0.00 | |
| January 1, 2009 to December 31, 2009 | | $ | 10.16 | | | | 0.11 | | | | 4.74 | | | | 0.00 | | | | 0.00 | |
| January 1, 2008 to December 31, 2008 | | $ | 22.03 | | | | 0.12 | | | | (7.30 | ) | | | (0.37 | ) | | | (4.32 | ) |
| January 1, 2007 to December 31, 2007 | | $ | 24.02 | | | | 0.21 | | | | 1.60 | | | | (0.16 | ) | | | (3.64 | ) |
| January 1, 2006 to December 31, 2006 | | $ | 24.22 | | | | 0.13 | | | | 2.43 | | | | 0.00 | | | | (2.76 | ) |
| | |
| 1. | | Total return calculations would have been lower had certain expenses not been waived or reimbursed during the periods shown. |
| |
| 2. | | After the close of business on July 16, 2010, existing shares of the Fund were renamed Class 2 shares. |
The accompanying notes are an integral part of these financial statements.
| | | |
|
| Financial Highlights | | Wells Fargo Advantage VT Opportunity Fund 21 |
| | | | | | | | | | | | | | | | | | | | | | | | | | | | | |
| | | Ending | | | | | | | | | | | | | | |
| | | Net Asset | | Ratio to Average Net Assets | | | | | | Portfolio | | Net Assets at |
| | | Value Per | | Net Investment | | Gross | | Net | | Total | | Turnover | | End of Period |
| | | Share | | Income | | Expenses | | Expenses | | Return1 | | Rate | | (000’s omitted) |
| |
| | | | | | | | | | | | | | | | | | | | | | | | | | | | | |
| | | $ | 18.42 | | | | 0.08 | % | | | 1.18 | % | | | 1.07 | % | | | 23.76 | % | | | 40 | % | | $ | 168,307 | |
| | | $ | 15.01 | | | | 0.39 | % | | | 1.32 | % | | | 1.07 | % | | | 47.74 | % | | | 50 | % | | $ | 154,782 | |
| | | $ | 10.16 | | | | 0.47 | % | | | 1.21 | % | | | 1.07 | % | | | (40.10 | )% | | | 70 | % | | $ | 378,197 | |
| | | $ | 22.03 | | | | 0.74 | % | | | 1.19 | % | | | 1.07 | % | | | 6.63 | % | | | 64 | % | | $ | 779,286 | |
| | | $ | 24.02 | | | | 0.48 | % | | | 1.18 | % | | | 1.07 | % | | | 12.22 | % | | | 41 | % | | $ | 897,047 | |
| | | |
|
| 22 Wells Fargo Advantage VT Opportunity Fund | | Notes to Financial Statements |
1. ORGANIZATION
Wells Fargo Variable Trust (the “Trust”), a Delaware statutory trust organized on March 10, 1999, is an open-end management investment company registered under the Investment Company Act of 1940, as amended (the “1940 Act”). These financial statements report on Wells Fargo Advantage VT Opportunity Fund (the “Fund”) which is a diversified series of the Trust. After the close of business on July 16, 2010, existing shares of the Fund were renamed Class 2 shares.
2. SIGNIFICANT ACCOUNTING POLICIES
The following significant accounting policies, which are consistently followed in the preparation of the financial statements of the Fund, are in conformity with U.S. generally accepted accounting principles which require management to make estimates and assumptions that affect the reported amounts of assets and liabilities, disclosure of contingent assets and liabilities at the date of the financial statements, and the reported amounts of revenues and expenses during the reporting period. Actual results could differ from those estimates. Management has considered the circumstances under which the Fund should recognize or make disclosures regarding events or transactions occurring subsequent to the balance sheet date through the date the financial statements are issued. Adjustments or additional disclosures, if any, have been included in these financial statements.
Securities valuation
Investments in securities are valued each business day as of the close of regular trading on the New York Stock Exchange, which is usually 4:00 p.m. (Eastern Time). Securities which are traded on a national or foreign securities exchange are valued at the last reported sales price, except that securities listed on The Nasdaq Stock Market, Inc. (“Nasdaq”) are valued at the Nasdaq Official Closing Price (“NOCP”), and if no NOCP is available, then at the last reported sales price. If no sales price is shown on the Nasdaq, the bid price will be used. In the absence of any sale of securities listed on the Nasdaq, and in the case of other securities, including U.S. Government obligations, but excluding debt securities maturing in 60 days or less, the price will be deemed “stale” and the valuations will be determined in accordance with the Fund’s Fair Valuation Procedures.
Securities denominated in foreign currencies are translated into U.S. dollars using the closing rates of exchange in effect on the day of valuation.
Many securities markets and exchanges outside the U.S. close prior to the close of the New York Stock Exchange and therefore may not fully reflect trading or events that occur after the close of the principal exchange in which the foreign investments are traded but before the close of the New York Stock Exchange. If such trading or events are expected to materially affect the value of the investments, then those investments are fair valued following procedures approved by the Board of Trustees. These procedures take into account multiple factors including movements in U.S. securities markets after foreign exchanges close. Depending on market activity, such fair valuations may be frequent. Such fair value pricing may result in NAVs that are higher or lower than NAVs based on the closing price or latest quoted bid price.
Debt securities of sufficient credit quality with original maturities of 60 days or less and any collateral received from securities lending invested in securities, generally are valued at amortized cost which approximates fair value. The amortized cost method involves valuing a security at its cost, plus accretion of discount or minus amortization of premium over the period until maturity.
Investments in open-end mutual funds and non-registered investment companies are generally valued at net asset value.
Certain investments which are not valued using any of the methods discussed above, are valued at their fair value, as determined by procedures established in good faith and approved by the Board of Trustees.
The valuation techniques used by the Fund to measure fair value are consistent with the market approach, income approach and/or cost approach, where applicable, for each security type.
Foreign currency translation
The accounting records of the Fund are maintained in U.S. dollars. Assets, including investment securities, and liabilities denominated in foreign currency are translated into U.S. dollars at the prevailing rates of exchange at the date of valuation. Purchases and sales of securities, and income and expenses are translated at the prevailing rate of exchange
| | | |
|
| Notes to Financial Statements | | Wells Fargo Advantage VT Opportunity Fund 23 |
on the respective dates of such transactions. Reported net realized foreign exchange gains or losses arise from sales of foreign currencies, currency gains or losses realized between the trade and settlement dates on securities transactions, and the difference between the amounts of dividends, interest and foreign withholding taxes recorded and the U.S. dollar equivalent of the amounts actually paid or received. Net unrealized foreign exchange gains and losses arise from changes in the fair value of assets and liabilities other than investments in securities resulting in changes in exchange rates.
The changes in net assets arising from changes in exchange rates and the changes in net assets resulting from changes in market prices of securities are not separately presented. Such changes are recorded with net realized and unrealized gains or losses from investments. Gains and losses from certain foreign currency transactions are treated as ordinary income for U.S. federal income tax purposes.
Security loans
The Fund may lend its securities from time to time in order to earn additional income in the form of fees or interest on securities received as collateral or the investment of any cash received as collateral. The Fund continues to receive interest or dividends on the securities loaned. The Fund receives collateral in the form of cash or securities with a value at least equal to the value of the securities on loan. The value of the loaned securities is determined at the close of each business day and any additional required collateral is delivered to the Fund on the next business day. In the event of default or bankruptcy by the borrower, the Fund could experience delays and costs in recovering the loaned securities or in gaining access to the collateral. In addition, the investment of any cash collateral received may lose all or part of its value. The Fund has the right under the lending agreement to recover the securities from the borrower on demand.
The Fund lends its securities through an unaffiliated securities lending agent. Cash collateral received in connection with its securities lending transactions is invested in Wells Fargo Securities Lending Cash Investments, LLC (the “Cash Collateral Fund”). The Cash Collateral Fund is exempt from registration under Section 3(c)(7) of the 1940 Act and is managed by Wells Fargo Funds Management LLC (“Funds Management”) and is sub-advised by Wells Capital Management Incorporated (“Wells Capital Management”). Funds Management receives an investment advisory fee starting at 0.05% and declining to 0.01% as the average daily net assets of the Cash Collateral Fund increase. All of the fees received by Funds Management are paid to Wells Capital Management for its services as sub-adviser. The Cash Collateral Fund seeks to provide a positive return compared to the daily Fed Funds Open rate by investing in high-quality, U.S. dollar-denominated short-term money market instruments. Cash Collateral Fund investments are fair valued based upon the amortized cost valuation technique. Income earned from investment in the Cash Collateral Fund is included in securities lending income on the Statement of Operations.
Prior to April 1, 2010, Wells Fargo Bank, N.A. acted as the securities lending agent for the Fund and was entitled to receive for its services 25% of the revenues earned on the securities lending activities. For the year ended December 31, 2010, Wells Fargo Bank, N.A. waived its share of revenues earned on securities lending activities. Such waivers by Wells Fargo Bank, N.A. had the impact of increasing securities lending income on the Statement of Operations. The value of the securities on loan and the liability to return the collateral are shown on the Statement of Assets and Liabilities.
In a securities lending transaction, the net asset value of the Fund will be affected by an increase or decrease in the value of the securities loaned and by an increase or decrease in the value of instruments in which cash collateral is invested. The amount of securities lending activity undertaken by the Fund fluctuates from time to time. After the occurrence of a default or impairment of structured investment vehicles purchased in a joint account by the Fund’s former securities lending agent, as the various participating Funds’ lending activity fluctuated, their ratable interest in the joint account, including their ratable exposure to the defaulted or impaired structured investment vehicles fluctuated depending on the relative activity of each participating Fund. In order to eliminate the fluctuation of the various participating Funds’ ratable exposure to the defaulted or impaired structured investment vehicles, the adviser to the Funds recommended to the Board of Trustees, and the Board of Trustees approved, actions designed to fix the allocation of percentage ownership in defaulted or impaired structured investment vehicles among all funds participating in securities lending (“side pocketing”) based on each participating Fund’s percentage ownership of the total cash collateral investment joint account as of the date the fixed allocation is implemented. Accordingly, on February 13, 2009 a side pocketing occurred, which fixed each participating Fund’s ownership of defaulted or impaired structured investment vehicle in the joint account based on each participating Fund’s percentage ownership of the joint account as of such date.
| | | |
|
| 24 Wells Fargo Advantage VT Opportunity Fund | | Notes to Financial Statements |
Security transactions and income recognition
Securities transactions are recorded on a trade date basis. Realized gains or losses are reported on the basis of identified cost of securities delivered.
Dividend income is recognized on the ex-dividend date, except for certain dividends from foreign securities, which are recorded as soon as the Fund is informed of the ex-dividend date. Dividend income from foreign securities is recorded net of foreign taxes withheld where recovery of such taxes is not assured.
Distributions to shareholders
Distributions to shareholders from net investment income and net realized gains, if any, are recorded on the ex-dividend date. Such distributions are determined in conformity with income tax regulations, which may differ from generally accepted accounting principles.
The timing and character of distributions made during the period from net investment income or net realized gains may differ from their ultimate characterization for federal income tax purposes. To the extent that these differences are permanent in nature, such amounts are reclassified within the capital accounts based on their federal tax-basis treatment. Temporary differences do not require reclassifications. At December 31, 2010, as a result of permanent book-to-tax differences, the following reclassification adjustments were made on the Statement of Assets and Liabilities:
| | | | | | | |
| | | | | Accumulated |
| Undistributed | | Net Realized |
| Net Investment | | Losses on |
| Income | | Investments |
| $ | 68,527 | | | $ | (68,527 | ) |
Federal and other taxes
The Fund intends to continue to qualify as a regulated investment company by distributing substantially all of its investment company taxable income and any net realized capital gains (after reduction for capital loss carryforwards) sufficient to relieve it from all, or substantially all, federal income taxes. Accordingly, no provision for federal income taxes was required.
The Fund’s income and federal excise tax returns and all financial records supporting those returns for the prior three fiscal years are subject to examination by the federal and Delaware revenue authorities.
Under the recently enacted Regulated Investment Company Modernization Act of 2010, the Fund will be permitted to carry forward capital losses incurred in taxable years beginning after December 22, 2010 for an unlimited period. However, any losses incurred during those future taxable years will be required to be utilized prior to the losses incurred in pre-enactment taxable years. As a result of this ordering rule, pre-enactment capital loss carryforwards may be more likely to expire unused. Additionally, post-enactment capital losses that are carried forward will retain their character as either short-term or long-term capital losses rather than being considered all short-term as under previous law.
As of December 31, 2010, the Fund had estimated net capital loss carryforwards, which are available to offset future net realized capital gains, in the amount of $59,079,494 with $2,140,021 expiring in 2016 and $56,939,473 expiring in 2017.
3. FAIR VALUATION MEASUREMENTS
Fair value measurements of investments are determined within a framework that has established a fair value hierarchy based upon the various data inputs utilized in determining the value of the Fund’s investments. The three-level hierarchy gives the highest priority to unadjusted quoted prices in active markets for identical assets or liabilities (Level 1) and the lowest priority to unobservable inputs (Level 3). The Fund’s investments are classified within the fair value hierarchy based on the lowest level of input that is significant to the fair value measurement. The inputs are summarized into three broad levels as follows:
| § | | Level 1 — quoted prices in active markets for identical securities |
| |
| § | | Level 2 — other significant observable inputs (including quoted prices for similar securities, interest rates, prepayment speeds, credit risk, etc.) |
| |
| § | | Level 3 — significant unobservable inputs (including the Fund’s own assumptions in determining the fair value of investments) |
| | | |
|
| Notes to Financial Statements | | Wells Fargo Advantage VT Opportunity Fund 25 |
The inputs or methodologies used for valuing securities are not necessarily an indication of the risk associated with investing in those securities.
As of December 31, 2010, the inputs used in valuing the Fund’s assets, which are carried at fair value, were as follows:
| | | | | | | | | | | | | | | | | |
| | | | | | | Significant Other | | Significant | | |
| | | | | | | Observable | | Unobservable | | |
| | | Quoted Prices | | Inputs | | Inputs | | |
| Investments in Securities | | (Level 1) | | (Level 2) | | (Level 3) | | Total |
Equity securities | | | | | | | | | | | | | | | | |
Common stocks | | $ | 160,466,911 | | | $ | 0 | | | $ | 0 | | | $ | 160,466,911 | |
Investment companies | | | 1,679,736 | | | | 0 | | | | 0 | | | | 1,679,736 | |
Short-term investments | | | | | | | | | | | | | | | | |
Corporate bonds and notes | | | 0 | | | | 0 | | | | 2,520,461 | | | | 2,520,461 | |
Investment companies | | | 7,851,452 | | | | 51,045,642 | | | | 0 | | | | 58,897,094 | |
| | | $ | 169,998,099 | | | $ | 51,045,642 | | | $ | 2,520,461 | | | $ | 223,564,202 | |
Further details on the major security types listed above can be found in the Fund’s Portfolio of Investments.
The following is a reconciliation of assets in which significant unobservable inputs (Level 3) were used in determining fair value:
| | | | | |
| | | Corporate |
| | | bonds |
| | | and notes |
Balance as of December 31, 2009 | | $ | 2,672,417 | |
| Accrued discounts (premiums) | | | 0 | |
| Realized gains (losses) | | | 0 | |
| Change in unrealized gains (losses) | | | 611,825 | |
| Purchases | | | 0 | |
| Sales | | | (763,781 | ) |
| Transfers into level 3 | | | 0 | |
| Transfers out of Level 3 | | | 0 | |
Balance as of December 31, 2010 | | $ | 2,520,461 | |
Change in unrealized gains (losses) included in earnings relating to securities still held at December 31, 2010 | | $ | 190,045 | |
4. TRANSACTIONS WITH AFFILIATES AND OTHER EXPENSES
Investment advisory fees
The Trust has entered into an investment advisory contract with Funds Management, an indirect wholly owned subsidiary of Wells Fargo & Company (“Wells Fargo”). The investment adviser is responsible for implementing investment policies and guidelines and for supervising the investment sub-adviser, who is responsible for day-to-day portfolio management of the Fund.
Pursuant to the contract, Funds Management is paid an annual investment advisory fee starting at 0.65% and declining to 0.55% as the average daily net assets of the Fund increase. Prior to July 19, 2010, the Fund paid Funds Management an annual investment advisory fee which started at 0.75% and declined to 0.60% as the average daily net assets of the Fund increased. For the year ended December 31, 2010, the investment advisory fee was equivalent to an annual rate of 0.70% of the Fund’s average daily net assets.
Funds Management may retain the services of certain investment sub-advisers to provide daily portfolio management to the Fund. The fees related to investment sub-advisory services are borne directly by the investment adviser and do not increase the overall fees paid by the Fund to the investment adviser. Wells Capital Management, an affiliate of Funds Management, is the investment sub-adviser to the Fund and is paid a fee by the investment adviser at an annual rate starting at 0.45% and declining to 0.30% as the average daily net assets of the Fund increase.
| | | |
|
| 26 Wells Fargo Advantage VT Opportunity Fund | | Notes to Financial Statements |
Administration and transfer agent fees
The Trust has entered into an Administration Agreement with Funds Management. Under this Agreement, for providing administrative services, which includes paying fees and expenses for services provided by the transfer agent, sub-transfer agents, omnibus account servicers and record-keepers, Funds Management is entitled to receive the following annual fees:
| | | | | | | |
| | | | | Administration Fees |
| | | | | (% of Average |
| | | Average Daily Net Assets | | Daily Net Assets) |
| Fund level | | First $5 billion | | | 0.05 | % |
| | | Next $5 billion | | | 0.04 | |
| | | Over $10 billion | | | 0.03 | |
| Class 2 | | All asset levels | | | 0.08 | |
Prior to July 19, 2010, Funds Management received from the Fund an annual fee which started at 0.16% and declined to 0.14% as the average daily net assets of the Fund increased.
Funds Management has contractually waived and/or reimbursed investment advisory and administration fees to the extent necessary to maintain certain net operating expense ratios for the Fund. Waiver of fees and/or reimbursement of expenses by Funds Management were made first from fund level expenses on a proportionate basis and then from class specific expenses.
Distribution fees
The Trust has adopted a Distribution Plan for Class 2 shares of the Fund pursuant to Rule 12b-1 under the 1940 Act. Distribution fees are charged to the Class 2 shares and paid to Wells Fargo Funds Distributor, LLC, the principal underwriter, at an annual rate of 0.25% of its average daily net assets.
5. INVESTMENT PORTFOLIO TRANSACTIONS
Purchases and sales of investments, exclusive of short-term securities (securities with maturities of one year or less at purchase date) for the year ended December 31, 2010 were $59,733,139 and $76,537,994, respectively.
6. BANK BORROWINGS
The Trust and Wells Fargo Funds Trust (excluding the money market funds) are parties to a $125,000,000 revolving credit agreement with State Street Bank and Trust Company, whereby the Fund is permitted to use bank borrowings for temporary or emergency purposes, such as to fund shareholder redemption requests. Interest under the credit agreement is charged to the Fund based on a borrowing rate equal to the higher of the Federal Funds rate in effect on that day plus 1.25% or the overnight LIBOR rate in effect on that day plus 1.25%. In addition, under the credit agreement, the Fund pays an annual commitment fee equal to 0.125% of the unused balance, which is allocated pro rata. Prior to September 7, 2010, the annual commitment fee paid by the Fund was 0.15% of the unused balance.
For the year ended December 31, 2010, there were no borrowings by the Fund under the agreement.
7. DISTRIBUTIONS TO SHAREHOLDERS
The tax character of distributions paid in ordinary income during the years ended December 31, 2010 and December 31, 2009 were $1,195,940 and $0, respectively.
As of December 31, 2010, the components of distributable earnings on a tax basis were as follows:
| | | | | | | | | | | |
| Undistributed | | | | |
| Ordinary | | Unrealized | | Capital Loss |
| Income | | Gains | | Carryforward |
| $ | 88,430 | | | $ | 36,010,298 | | | $ | (59,079,494 | ) |
| | | |
|
| Notes to Financial Statements | | Wells Fargo Advantage VT Opportunity Fund 27 |
8. INDEMNIFICATION
Under the Trust’s organizational documents, the officers and directors are indemnified against certain liabilities that may arise out of performance of their duties to the Trust. Additionally, in the normal course of business, the Trust may enter into contracts with service providers that contain a variety of indemnification clauses. The Trust’s maximum exposure under these arrangements is dependent on future claims that may be made against the Fund and, therefore, cannot be estimated.
| | | |
|
| 28 Wells Fargo Advantage VT Opportunity Fund | | Report of Independent Registered Public Accounting Firm |
BOARD OF TRUSTEES AND SHAREHOLDERS OF
WELLS FARGO VARIABLE TRUST:
We have audited the accompanying statement of assets and liabilities, including the portfolio of investments, of the Wells Fargo Advantage VT Opportunity Fund (the “Fund”), one of the funds constituting the Wells Fargo Variable Trust, as of December 31, 2010, and the related statement of operations for the year then ended, statements of changes in net assets for each of the years in the two year period then ended, and the financial highlights for each of the years in the five year period then ended. These financial statements and financial highlights are the responsibility of the Fund’s management. Our responsibility is to express an opinion on these financial statements and financial highlights based on our audits.
We conducted our audits in accordance with the standards of the Public Company Accounting Oversight Board (United States). Those standards require that we plan and perform the audit to obtain reasonable assurance about whether the financial statements and financial highlights are free of material misstatement. An audit includes examining, on a test basis, evidence supporting the amounts and disclosures in the financial statements. Our procedures included confirmation of securities owned as of December 31, 2010, by correspondence with custodian and brokers, or by other appropriate auditing procedures. An audit also includes assessing the accounting principles used and significant estimates made by management, as well as evaluating the overall financial statement presentation. We believe that our audits provide a reasonable basis for our opinion.
In our opinion, the financial statements and financial highlights referred to above present fairly, in all material respects, the financial position of the Wells Fargo Advantage VT Opportunity Fund as of December 31, 2010, the results of its operations for the year then ended, changes in its net assets for each of the years in the two year period then ended, and the financial highlights for each of the years in the five year period then ended, in conformity with U.S. generally accepted accounting principles.
Boston, Massachusetts
February 25, 2011
| | | |
|
| Other Information (Unaudited) | | Wells Fargo Advantage VT Opportunity Fund 29 |
PROXY VOTING INFORMATION
A description of the policies and procedures that the Fund uses to determine how to vote proxies relating to portfolio securities is available without charge, upon request, by calling 1-800-222-8222, visiting our Web site at www.wellsfargo.com/advantagefunds, or visiting the SEC Web site at www.sec.gov. Information regarding how the Fund voted proxies relating to portfolio securities during the most recent 12-month period ended June 30 is available without charge on the Fund’s Web site at www.wellsfargo.com/advantagefunds or by visiting the SEC Web site at www.sec.gov.
TAX INFORMATION
Pursuant to Section 854(b)(2) of the Internal Revenue Code, the Fund designates 100% of its ordinary income dividends distributed during the year ended December 31, 2010 as qualifying for the corporate dividends received deduction.
| | | |
|
| 30 Wells Fargo Advantage VT Opportunity Fund | | Other Information (Unaudited) |
PORTFOLIO HOLDINGS INFORMATION
The complete portfolio holdings for the Fund are publicly available on the Fund’s Web site (www.wellsfargo.com/-advantagefunds) on a monthly, 30-day or more delayed basis. In addition, top ten holdings information for the Fund is publicly available on the Fund’s Web site on a monthly, seven-day or more delayed basis. The Fund files its complete schedule of portfolio holdings with the SEC for the first and third quarters of each fiscal year on Form N-Q, which is available without charge by visiting the SEC Web site at www.sec.gov. In addition, the Fund’s Form N-Q may be reviewed and copied at the SEC’s Public Reference Room in Washington, DC, and at regional offices in New York City, at 233 Broadway, and in Chicago, at 175 West Jackson Boulevard, Suite 900. Information about the Public Reference Room may be obtained by calling 1-800-SEC-0330.
BOARD OF TRUSTEES
The following table provides basic information about the Board of Trustees (the “Trustees”) of the Wells Fargo Variable Trust (the “Trust”) and Officers of the Trust. This table should be read in conjunction with the Prospectus and the Statement of Additional Information1 of the Fund. Each of the Trustees and Officers listed below acts in identical capacities for the Wells Fargo Advantage family of funds, which consists of 152 funds comprising the Trust, Wells Fargo Funds Trust, Wells Fargo Master Trust and four closed-end funds (collectively the “Fund Complex”). All of the Trustees are also Members of the Audit and Governance Committees of each Trust in the Fund Complex. The mailing address of each Trustee and Officer is 525 Market Street, 12th Floor, San Francisco, CA 94105. Each Trustee and Officer serves an indefinite term, however, each Trustee serves such term until reaching the mandatory retirement age established by the Trustees.
Independent Trustees
| | | | | | | |
| Name and | | Position Held and | | | | |
| Year of Birth | | Length of Service | | Principal Occupations During Past Five Years | | Other Directorships |
Peter G. Gordon
(Born 1942) | | Trustee, since 1998; Chairman, since 2005 (Lead Trustee since 2001) | | Co-Founder, Chairman, President and CEO of Crystal Geyser. Water Company. Trustee Emeritus, Colby College | | Asset Allocation
Trust |
| | | | | | | |
Isaiah Harris, Jr.
(Born 1952) | | Trustee, since 2009 | | Retired. Prior thereto, President and CEO of BellSouth Advertising and Publishing Corp. from 2005 to 2007, President and CEO of BellSouth Enterprises from 2004 to 2005 and President of BellSouth Consumer Services from 2000 to 2003. Emeritus member of the Iowa State University Foundation Board of Governors. Emeritus Member of the Advisory Board of Iowa State University School of Business. Mr. Harris is a certified public accountant. | | CIGNA Corporation; Deluxe Corporation; Asset Allocation Trust |
| | | | | | | |
Judith M. Johnson
(Born 1949) | | Trustee, since 2008 | | Retired. Prior thereto, Chief Executive Officer and Chief Investment Officer of Minneapolis Employees Retirement Fund from 1996 to 2008. Ms. Johnson is an attorney, certified public accountant and a certified managerial accountant. | | Asset Allocation
Trust |
| | | | | | | |
Leroy Keith, Jr.
(Born 1939) | | Trustee, since 2010 | | Chairman, Bloc Global Services (development and construction), Trustee of the Evergreen Funds from 1983 to 2010. Former Managing Director, Almanac Capital Management (commodities firm), former Partner, Stonington Partners, Inc. (private equity fund), former Director, Obagi Medical Products Co. and former Director, Lincoln Educational Services. | | Trustee, Virtus Fund Complex (consisting of 45 portfolios as of 12/31/10); Director, Diversapack Co. (packaging company); Asset Allocation Trust |
| | | | | | | |
David F. Larcker
(Born 1951) | | Trustee, since 2009 | | James Irvin Miller Professor of Accounting at the Graduate School of Business, Stanford University, Director of Corporate Governance Research Program and Co-Director of The Rock Center for Corporate Governance since 2006. From 2005 to 2008, Professor of Accounting at the Graduate School of Business, Stanford University. Prior thereto, Ernst & Young Professor of Accounting at The Wharton School, University of Pennsylvania from 1985 to 2005. | | Asset Allocation
Trust |
| | | |
|
| Other Information (Unaudited) | | Wells Fargo Advantage VT Opportunity Fund 31 |
| | | | | | | |
| Name and | | Position Held and | | | | |
| Year of Birth | | Length of Service | | Principal Occupations During Past Five Years | | Other Directorships |
Olivia S. Mitchell
(Born 1953) | | Trustee, since 2006 | | International Foundation of Employee Benefit Plans Professor and Chair of the Department of Insurance and Risk Management, Wharton School of the University of Pennsylvania since 1993. Director of Wharton’s Pension Research Council and Boettner Center on Pensions & Retirement Research, and Research Associate at the National Bureau of Economic Research. Previously, Cornell University Professor from 1978 to 1993. | | Asset Allocation
Trust |
| | | | | | | |
Timothy J. Penny
(Born 1951) | | Trustee, since 1996 | | President and CEO of Southern Minnesota Initiative Foundation, a non-profit organization, since 2007 and Senior Fellow at the Humphrey Institute Policy Forum at the University of Minnesota since 1995. Member of the Board of Trustees of NorthStar Education Finance, Inc., a non-profit organization, since 2007. | | Asset Allocation
Trust |
| | | | | | | |
Michael S. Scofield
(Born 1943) | | Trustee, since 2010 | | Currently serves on the Investment Company Institute’s Board of Governors and Executive Committee as well the Independent Director’s Counsel Board of Governors and Executive Committee. Former Chairman of the Independent Directors Counsel. Trustee of the Evergreen Funds from 1984 to 2010. Retired Attorney, Law Offices of Michael S. Scofield and former Director and Chairman, Branded Media Corporation (multi-media branding company). | | Asset Allocation
Trust |
| | | | | | | |
Donald C. Willeke
(Born 1940) | | Trustee, since 1996 | | Principal of the law firm of Willeke & Daniels. General Counsel of the Minneapolis Employees Retirement Fund from 1984 until its consolidation into the Minnesota Public Employees Retirement Association on June 30, 2010. | | Asset Allocation
Trust |
Officers
| | | | | |
| Name and | | Position Held and | | |
| Year of Birth | | Length of Service | | Principal Occupations During Past Five Years |
Karla M. Rabusch
(Born 1959) | | President, since 2003 | | Executive Vice President of Wells Fargo Bank, N.A. and President of Wells Fargo Funds Management, LLC since 2003. Senior Vice President and Chief Administrative Officer of Wells Fargo Funds Management, LLC from 2001 to 2003. |
| | | | | |
C. David Messman
(Born 1960) | | Secretary, since 2000; Chief Legal Counsel, since 2003 | | Senior Vice President and Secretary of Wells Fargo Funds Management, LLC since 2001. Vice President and Managing Counsel of Wells Fargo Bank, N.A. since 1996. |
| | | | | |
Kasey Phillips
(Born 1970) | | Treasurer, since 2009 | | Senior Vice President of Wells Fargo Funds Management, LLC since 2009. Senior Vice President of Evergreen Investment Management Company, LLC from 2006 to 2010. Treasurer of the Evergreen Funds from 2005 to 2010. Vice President and Assistant Vice President of Evergreen Investment Services, Inc. from 1999 to 2006. |
| | | | | |
David Berardi
(Born 1975) | | Assistant Treasurer,
since 2009 | | Vice President of Wells Fargo Funds Management, LLC since 2009. Vice President of Evergreen Investment Management Company, LLC from 2008 to 2010. Assistant Vice President of Evergreen Investment Services, Inc. from 2004 to 2008. Manager of Fund Reporting and Control for Evergreen Investment Management Company, LLC from 2004 to 2010. |
| | | | | |
Jeremy DePalma
(Born 1974) | | Assistant Treasurer,
since 2009 | | Senior Vice President of Wells Fargo Funds Management, LLC since 2009. Senior Vice President of Evergreen Investment Management Company, LLC from 2008 to 2010. Vice President, Evergreen Investment Services, Inc. from 2004 to 2007. Assistant Vice President, Evergreen Investment Services, Inc. from 2000 to 2004 and the head of the Fund Reporting and Control Team within Fund Administration from 2005 to 2010. |
| | | |
|
| 32 Wells Fargo Advantage VT Opportunity Fund | | Other Information (Unaudited) |
| | | | | |
| Name and | | Position Held and | | |
| Year of Birth | | Length of Service | | Principal Occupations During Past Five Years |
Debra Ann Early
(Born 1964) | | Chief Compliance Officer,
since 2007 | | Chief Compliance Officer of Wells Fargo Funds Management, LLC since 2007. Chief Compliance Officer of Parnassus Investments from 2005 to 2007. Chief Financial Officer of Parnassus Investments from 2004 to 2007 and Senior Audit Manager of PricewaterhouseCoopers LLP from 1998 to 2004. |
| | |
| 1. | | The Statement of Additional Information includes additional information about the Fund’s Trustees and is available, without charge, upon request, by calling 1-800-222-8222 or by visiting the Fund’s Web site at www.wellsfargo.com/advantagefunds. |
| | | |
|
| List of Abbreviations | | Wells Fargo Advantage VT Opportunity Fund 33 |
The following is a list of common abbreviations for terms and entities which may have appeared in this report.
| | | |
| ABAG | | — Association of Bay Area Governments |
| ADR | | — American Depositary Receipt |
| ADS | | — American Depository Shares |
| AMBAC | | — American Municipal Bond Assurance Corporation |
| AMT | | — Alternative Minimum Tax |
| ARM | | — Adjustable Rate Mortgages |
| AUD | | — Australian Dollar |
| BART | | — Bay Area Rapid Transit |
| BRL | | — Brazil Real |
| CAD | | — Canadian Dollar |
| CDA | | — Community Development Authority |
| CDO | | — Collateralized Debt Obligation |
| CDSC | | — Contingent Deferred Sales Charge |
| CGIC | | — Capital Guaranty Insurance Company |
| CGY | | — Capital Guaranty Corporation |
| CHF | | — Swiss Franc |
| CIFG | | — CDC (Caisse des Dépôts et Consignations) IXIS Financial Guarantee |
| COP | | — Certificate of Participation |
| CP | | — Commercial Paper |
| CTF | | — Common Trust Fund |
| DEM | | — Deutsche Mark |
| DKK | | — Danish Krone |
| DW&P | | — Department of Water & Power |
| DWR | | — Department of Water Resources |
| ECFA | | — Educational & Cultural Facilities Authority |
| EDFA | | — Economic Development Finance Authority |
| ETET | | — Eagle Tax-Exempt Trust |
| ETF | | — Exchange-Traded Fund |
| EUR | | — Euro |
| FFCB | | — Federal Farm Credit Bank |
| FGIC | | — Financial Guaranty Insurance Corporation |
| FHA | | — Federal Housing Authority |
| FHAG | | — Federal Housing Agency |
| FHLB | | — Federal Home Loan Bank |
| FHLMC | | — Federal Home Loan Mortgage Corporation |
| FNMA | | — Federal National Mortgage Association |
| FRF | | — French Franc |
| FSA | | — Farm Service Agency |
| GBP | | — Great British Pound |
| GDR | | — Global Depositary Receipt |
| GNMA | | — Government National Mortgage Association |
| GO | | — General Obligation |
| HCFR | | — Healthcare Facilities Revenue |
| HEFA | | — Health & Educational Facilities Authority |
| HEFAR | | — Higher Education Facilities Authority Revenue |
| HFA | | — Housing Finance Authority |
| HFFA | | — Health Facilities Financing Authority |
| HKD | | — Hong Kong Dollar |
| HUD | | — Housing & Urban Development |
| HUF | | — Hungarian Forint |
| IDA | | — Industrial Development Authority |
| IDAG | | — Industrial Development Agency |
| IDR | | — Industrial Development Revenue |
| IEP | | — Irish Pound |
| JPY | | — Japanese Yen |
| KRW | | — Republic of Korea Won |
| LIBOR | | — London Interbank Offered Rate |
| LLC | | — Limited Liability Company |
| LLP | | — Limited Liability Partnership |
| LOC | | — Letter of Credit |
| LP | | — Limited Partnership |
| MBIA | | — Municipal Bond Insurance Association |
| MFHR | | — Multi-Family Housing Revenue |
| MFMR | | — Multi-Family Mortgage Revenue |
| MMD | | — Municipal Market Data |
| MTN | | — Medium Term Note |
| MUD | | — Municipal Utility District |
| MXN | | — Mexican Peso |
| MYR | | — Malaysian Ringgit |
| NATL-RE | | — National Public Finance Guarantee Corporation |
| NLG | | — Netherlands Guilder |
| NOK | | — Norwegian Krone |
| NZD | | — New Zealand Dollar |
| PCFA | | — Pollution Control Finance Authority |
| PCR | | — Pollution Control Revenue |
| PFA | | — Public Finance Authority |
| PFFA | | — Public Facilities Financing Authority |
| plc | | — Public Limited Company |
| PLN | | — Polish Zloty |
| PSFG | | — Public School Fund Guaranty |
| R&D | | — Research & Development |
| RDA | | — Redevelopment Authority |
| RDFA | | — Redevelopment Finance Authority |
| REITS | | — Real Estate Investment Trusts |
| SEK | | — Swedish Krona |
| SFHR | | — Single Family Housing Revenue |
| SFMR | | — Single Family Mortgage Revenue |
| SGD | | — Singapore Dollar |
| SKK | | — Slovakian Koruna |
| SLMA | | — Student Loan Marketing Association |
| SPDR | | — Standard & Poor’s Depositary Receipts |
| STIT | | — Short-Term Investment Trust |
| TBA | | — To Be Announced |
| TRAN | | — Tax Revenue Anticipation Notes |
| TRY | | — Turkish Lira |
| USD | | — United States Dollar |
| XLCA | | — XL Capital Assurance |
| ZAR | | — South African Rand |
This page is intentionally left blank.
More information about Wells Fargo Advantage Funds is available free upon request. To obtain literature, please write, e-mail, visit the Funds’ Web site, or call:
Wells Fargo Advantage Funds
P.O. Box 8266
Boston, MA 02266-8266
E-mail: wfaf@wellsfargo.com
Web site: www.wellsfargo.com/advantagefunds
Individual Investors: 1-800-222-8222
Retail Investment Professionals: 1- 888-877-9275
Institutional Investment Professionals: 1- 866-765-0778
This report and the financial statements contained herein are submitted for the general information of the shareholders of Wells Fargo Advantage Funds. If this report is used for promotional purposes, distribution of the report must be accompanied or preceded by a current prospectus. For a prospectus containing more complete information, including charges and expenses, call 1-800-222-8222 or visit the Fund’s Web site at www.wellsfargo.com/advantagefunds. Please consider the investment objectives, risks, charges, and expenses of the investment carefully before investing. This and other information about Wells Fargo Advantage Funds can be found in the current prospectus. Read the prospectus carefully before you invest or send money.
Wells Fargo Funds Management, LLC, a wholly owned subsidiary of Wells Fargo & Company, provides investment advisory and administrative services for Wells Fargo Advantage Funds. Other affiliates of Wells Fargo & Company provide subadvisory and other services for the Funds. The Funds are distributed by Wells Fargo Funds Distributor, LLC, Member FINRA/SIPC, an affiliate of Wells Fargo & Company.
NOT FDIC INSURED § NO BANK GUARANTEE § MAY LOSE VALUE
| | | | | | |
| | | | | | | |
| | | | | | | |
| © 2011 Wells Fargo Funds Management, LLC. All rights reserved. | | | www.wellsfargo.com/advantagefunds | | | 200918 02-11 |
| | | | | | | AVT6/AR152 12-10 |
WELLS FARGO ADVANTAGE VARIABLE TRUST FUNDS
• Wells Fargo Advantage VT Small Cap Growth Fund
Reduce clutter. Save trees.
Sign up for electronic delivery of prospectuses and shareholder reports at www.wellsfargo.com/advantagedelivery
Contents
| | | | | |
|
| | | 2 | |
| | | 6 | |
| | | | | |
| | | 10 | |
| | | 11 | |
| | | | | |
Financial Statements | | | | |
| | | 16 | |
| | | 17 | |
| | | 18 | |
| | | 20 | |
| | | | | |
| | | 22 | |
| | | | | |
| | | 28 | |
| | | | | |
| | | 29 | |
| | | | | |
| | | 33 | |
The views expressed are as of December 31, 2010, and are those of the Fund managers. Any reference to a specific security in this report is not a recommendation to purchase or sell any specific security or adopt any investment strategy. The views are subject to change at any time in response to changing circumstances in the market and are not intended to predict or guarantee the future performance of any individual security, market sector or the markets generally, or the Wells Fargo Advantage VT Small Cap Growth Fund.
NOT FDIC INSURED • NO BANK GUARANTEE • MAY LOSE VALUE
WELLS FARGO INVESTMENT HISTORY
| 1932 | | Keystone creates one of the first mutual fund families. |
| 1971 | | Wells Fargo & Company introduces one of the first institutional index funds. |
| 1978 | | Wells Fargo applies Markowitz and Sharpe’s research on Modern Portfolio Theory to introduce one of the industry’s first Tactical Asset Allocation (TAA) models in institutional separately managed accounts. |
| |
| 1984 | | Wells Fargo Stagecoach Funds launches its first asset allocation fund. |
| |
| 1989 | | The Tactical Asset Allocation (TAA) Model is first applied to Wells Fargo’s asset allocation mutual funds. |
| |
| 1994 | | Wells Fargo introduces the LifePath Funds, one of the first suites of target date funds (now the Wells Fargo Advantage Dow Jones Target Date FundsSM). |
| |
| 1996 | | Evergreen Investments and Keystone Funds merge. |
| |
| 1997 | | Wells Fargo launches Wells Fargo Advantage WealthBuilder PortfoliosSM, a fund-of-funds suite of products that includes the use of quantitative models to shift assets among investment styles. |
| |
| 1999 | | Norwest Advantage Funds and Stagecoach Funds are reorganized into Wells Fargo Funds after the merger of Norwest and Wells Fargo. |
| |
| 2002 | | Evergreen Retail and Evergreen Institutional companies form the umbrella asset management company, Evergreen Investments. |
| |
| 2005 | | The integration of Strong Funds with Wells Fargo Funds creates Wells Fargo Advantage Funds, resulting in one of the top 20 mutual fund companies in the United States. |
| |
| 2006 | | Wells Fargo Advantage Funds relaunches the target date product line as Wells Fargo Advantage Dow Jones Target Date Funds. |
| |
| 2010 | | The mergers and reorganizations of Evergreen and Wells Fargo Advantage mutual funds are completed, unifying the families under the brand of Wells Fargo Advantage Funds. |
Wells Fargo Advantage Funds®
Wells Fargo Advantage Funds skillfully guides institutions, financial advisors, and individuals through the investment terrain to help them reach their financial objectives. Everything we do on behalf of investors is backed by our unique combination of qualifications.
Strength
Our organization is built on the standards of integrity and service established by our parent company—Wells Fargo & Company—more than 150 years ago. And, because we’re part of a highly diversified financial enterprise, we offer the depth of resources to help investors succeed.
Expertise
Our multi-boutique model offers investors access to the independent thinking of premier investment managers that have been chosen for their time-tested strategies. While each team specializes in a specific investment strategy, collectively they provide investors a wide choice of distinct investment styles. Our dedication to investment excellence doesn’t end with our expertise in manager selection—risk management, analysis, and rigorous ongoing review seek to ensure each manager’s investment process remains consistent.
Partnership
Our collaborative approach is built around understanding the needs and goals of our clients. By adhering to core principles of sound judgment and steady guidance, we support you through every stage of the investment decision process.
Carefully consider the investment objectives, risks, charges, and expenses before investing. For a current prospectus for Wells Fargo Advantage Funds containing this and other information, visit wellsfargo.com/advantagefunds. Read it carefully before investing.
Wells Fargo Funds Management, LLC, a wholly owned subsidiary of Wells Fargo & Company, provides investment advisory and administrative services for Wells Fargo Advantage Funds®. Other affiliates of Wells Fargo & Company provide subadvisory and other services for the Funds. The Funds are distributed by Wells Fargo Funds Distributor, LLC, Member FINRA/SIPC, an affiliate of Wells Fargo & Company.
The “Dow Jones Target Date Indexes” are a product of Dow Jones Indexes, a licensed trademark of CME Group Index Services LLC (“CME”). “Dow Jones” and “Dow Jones Target Date Indexes” are service marks of Dow Jones Trademark Holdings, LLC, and have been licensed for use for certain purposes by CME and sublicensed for use by Global Index Advisors, Inc., and Wells Fargo Funds Management, LLC. The Dow Jones Target Date Indexes are based in part on the Barclays Capital Bond Indexes, which are published by Barclays Capital Inc. The Wells Fargo Advantage Dow Jones Target Date Funds, based on the Dow Jones Target Date Indexes, are not sponsored, endorsed, sold, or promoted by Dow Jones, CME or Barclays Capital or any of their respective affiliates, and neither Dow Jones, CME nor Barclays Capital nor any of their respective affiliates makes any representation regarding the advisability of investing in such product(s) and/or about the quality, accuracy, and/or completeness of the Dow Jones Target Date Indexes or the Barclays Capital Bond Indexes. IN NO EVENT SHALL DOW JONES, CME, BARCLAYS CAPITAL, OR ANY OF THEIR LICENSORS HAVE ANY LIABILITY FOR ANY SPECIAL, PUNITIVE, INDIRECT, OR CONSEQUENTIAL DAMAGES (INCLUDING LOST PROFITS), EVEN IF NOTIFIED OF THE POSSIBILITY OF SUCH DAMAGES.
NOT FDIC INSURED • NO BANK GUARANTEE • MAY LOSE VALUE
Not part of the annual report.
Wells Fargo Advantage Funds offers more than 120 mutual funds across a wide range of asset classes, representing over $236 billion in assets under management, as of December 31, 2010.
| | | | | |
| Equity Funds | | | | |
| |
| Asia Pacific Fund | | Enterprise Fund† | | Opportunity Fund† |
| C&B Large Cap Value Fund | | Equity Value Fund | | Precious Metals Fund |
| C&B Mid Cap Value Fund | | Global Opportunities Fund | | Premier Large Company Growth Fund |
| Capital Growth Fund | | Growth Fund | | Small Cap Growth Fund |
| Classic Value Fund | | Growth Opportunities Fund | | Small Cap Opportunities Fund |
| Common Stock Fund | | Health Care Fund | | Small Cap Value Fund |
| Core Equity Fund | | Index Fund | | Small Company Growth Fund |
| Disciplined Global Equity Fund | | International Equity Fund | | Small Company Value Fund |
| Disciplined U.S. Core Fund | | International Value Fund | | Small/Mid Cap Core Fund |
| Disciplined Value Fund | | Intrinsic Small Cap Value Fund | | Small/Mid Cap Value Fund |
| Discovery Fund† | | Intrinsic Value Fund | | Social Sustainability Fund† |
| Diversified Equity Fund | | Intrinsic World Equity Fund | | Special Mid Cap Value Fund |
| Diversified International Fund | | Large Cap Core Fund | | Special Small Cap Value Fund |
| Diversified Small Cap Fund | | Large Cap Growth Fund | | Specialized Technology Fund |
| Emerging Growth Fund | | Large Company Value Fund | | Strategic Large Cap Growth Fund |
| Emerging Markets Equity Fund | | Mid Cap Growth Fund | | Traditional Small Cap Growth Fund |
| Endeavor Select Fund† | | Omega Growth Fund | | Utility and Telecommunications Fund |
| |
Bond Funds | | | | |
| |
| Adjustable Rate Government Fund | | Inflation-Protected Bond Fund | | Short-Term Bond Fund |
| California Limited-Term Tax-Free Fund | | Intermediate Tax/AMT-Free Fund | | Short-Term High Yield Bond Fund |
| California Tax-Free Fund | | International Bond Fund | | Short-Term Municipal Bond Fund |
| Colorado Tax-Free Fund | | Minnesota Tax-Free Fund | | Strategic Municipal Bond Fund |
| Government Securities Fund | | Municipal Bond Fund | | Total Return Bond Fund |
| High Income Fund | | North Carolina Tax-Free Fund | | Ultra Short-Term Income Fund |
| High Yield Bond Fund | | Pennsylvania Tax-Free Fund | | Ultra Short-Term Municipal Income Fund |
| Income Plus Fund | | Short Duration Government Bond Fund | | Wisconsin Tax-Free Fund |
| |
Asset Allocation Funds | | | | |
| |
| Asset Allocation Fund | | WealthBuilder Equity Portfolio† | | Target 2020 Fund† |
| Conservative Allocation Fund | | WealthBuilder Growth Allocation Portfolio† | | Target 2025 Fund† |
| Diversified Capital Builder Fund | | WealthBuilder Growth Balanced Portfolio† | | Target 2030 Fund† |
| Diversified Income Builder Fund | | WealthBuilder Moderate Balanced Portfolio† | | Target 2035 Fund† |
| Growth Balanced Fund | | WealthBuilder Tactical Equity Portfolio† | | Target 2040 Fund† |
| Index Asset Allocation Fund | | Target Today Fund† | | Target 2045 Fund† |
| Moderate Balanced Fund | | Target 2010 Fund† | | Target 2050 Fund† |
WealthBuilder Conservative
Allocation Portfolio† | | Target 2015 Fund† | | |
| |
Money Market Funds | | | | |
| |
| 100% Treasury Money Market Fund | | Minnesota Money Market Fund | | New Jersey Municipal Money Market Fund |
| California Municipal Money Market Fund | | Money Market Fund | | New York Municipal Money Market Fund |
| Cash Investment Money Market Fund | | Municipal Cash Management Money Market Fund | | Pennsylvania Municipal Money Market Fund |
| Government Money Market Fund | | Municipal Money Market Fund | | Prime Investment Money Market Fund |
| Heritage Money Market Fund† | | National Tax-Free Money Market Fund | | Treasury Plus Money Market Fund |
| |
Variable Trust Funds1 | | | | |
| |
| VT Core Equity Fund | | VT Intrinsic Value Fund | | VT Small Cap Value Fund |
| VT Discovery Fund† | | VT Omega Growth Fund | | VT Total Return Bond Fund |
| VT Index Asset Allocation Fund | | VT Opportunity Fund† | | |
| VT International Equity Fund | | VT Small Cap Growth Fund | | |
An investment in a money market fund is not insured or guaranteed by the Federal Deposit Insurance Corporation or any other government agency. Although the Wells Fargo Advantage Money Market Funds seek to preserve the value of your investment at $1.00 per share, it is possible to lose money by investing in a money market fund.
| | |
| |
| 1. | | The Variable Trust Funds are generally available only through insurance company variable contracts. |
| |
| † | | In this report, the Wells Fargo Advantage Discovery FundSM, Wells Fargo Advantage Endeavor Select FundSM, Wells Fargo Advantage Enterprise FundSM, Wells Fargo Advantage Opportunity FundSM, Wells Fargo Advantage Social Sustainability FundSM, Wells Fargo Advantage WealthBuilder Conservative Allocation PortfolioSM, Wells Fargo Advantage WealthBuilder Equity PortfolioSM, Wells Fargo Advantage WealthBuilder Growth Allocation PortfolioSM, Wells Fargo Advantage WealthBuilder Growth Balanced PortfolioSM, Wells Fargo Advantage WealthBuilder Moderate Balanced PortfolioSM, Wells Fargo Advantage WealthBuilder Tactical Equity PortfolioSM, Wells Fargo Advantage Dow Jones Target Today FundSM, Wells Fargo Advantage Dow Jones Target 2010 FundSM, Wells Fargo Advantage Dow Jones Target 2015 FundSM, Wells Fargo Advantage Dow Jones Target 2020 FundSM, Wells Fargo Advantage Dow Jones Target 2025 FundSM, Wells Fargo Advantage Dow Jones Target 2030 FundSM, Wells Fargo Advantage Dow Jones Target 2035 FundSM, Wells Fargo Advantage Dow Jones Target 2040 FundSM, Wells Fargo Advantage Dow Jones Target 2045 FundSM, Wells Fargo Advantage Dow Jones Target 2050 FundSM, Wells Fargo Advantage Heritage Money Market FundSM, Wells Fargo Advantage VT Discovery FundSM, and Wells Fargo Advantage VT Opportunity FundSM are referred to as the Discovery Fund, Endeavor Select Fund, Enterprise Fund, Opportunity Fund, Social Sustainability Fund, WealthBuilder Conservative Allocation Portfolio, WealthBuilder Equity Portfolio, WealthBuilder Growth Allocation Portfolio, WealthBuilder Growth Balanced Portfolio, WealthBuilder Moderate Balanced Portfolio, WealthBuilder Tactical Equity Portfolio, Target Today Fund, Target 2010 Fund, Target 2015 Fund, Target 2020 Fund, Target 2025 Fund, Target 2030 Fund, Target 2035 Fund, Target 2040 Fund, Target 2045 Fund, Target 2050 Fund, Heritage Money Market Fund, VT Discovery Fund, and VT Opportunity Fund, respectively. |
Not part of the annual report.
| | |
| 2 Wells Fargo Advantage VT Small Cap Growth Fund | | Letter to Shareholders |
Karla M. Rabusch,
President
Wells Fargo Advantage Funds
The equity markets delivered strong full-year returns against the backdrop of a strengthening economy.
Dear Valued Shareholder:
We are pleased to provide you with this annual report for the Wells Fargo Advantage VT Small Cap Growth Fund for the 12 months that ended December 31, 2010. The equity markets delivered strong full-year returns against the backdrop of a strengthening economy. However, the year was not without its share of macroeconomic challenges and market volatility, once again highlighting the value of a sound, well-diversified investment strategy. As always, we believe that such a strategy can enable investors to balance risks and opportunities as they pursue long-term financial goals in a dynamic market environment.
The economic recovery stayed on track.
The U.S. economic recovery that began in the summer of 2009 gained momentum in 2010, particularly toward the end of the year. Gross domestic product (GDP) grew at an annualized rate of 3.2% in the fourth quarter of 2010—capping a streak of six consecutive quarters of positive GDP growth—and 2.9% for the full year. Although the path of recovery has been uneven at times and growth remains subpar compared with previous recoveries, the general consensus among economists is that the economy will likely avoid a double-dip recession. That said, persistent weakness in the labor and housing markets bears close watching in the months ahead.
Jobs and housing remained troublesome.
At the end of the year, the unemployment rate stood at 9.4%, down from 9.9% a year earlier, but still stubbornly high. Unfortunately, the drop may be attributable more to a decline in the labor force than a meaningful uptick in hiring. In fact, employers added just 1.1 million jobs for all of 2010, suggesting that the improving economy has yet to translate into widespread hiring. Meanwhile, the beleaguered housing market was an ongoing source of concern, despite some tentative late-year signs of stabilization.
Other economic data were more encouraging, reflecting greater confidence in the recovery on the part of both consumers and businesses. Retail sales came in strong at certain points during the year, including the critical holiday shopping season, and industrial production and new orders have picked up. Although still reluctant to hire, businesses have gradually increased spending in other areas, such as equipment and technology. Core inflation, which excludes volatile food and energy prices, remained benign.
The Fed continued to do its part.
With inflation subdued, the Federal Reserve (the Fed) held its target range for the federal funds rate—a proxy for short-term interest rates—steady at 0% to 0.25%. In its final statement of 2010, the Fed noted that economic expansion continues to be restrained by headwinds such as high unemployment, modest income growth, lower housing wealth, and tight credit. As a result, the Fed indicated that it intends to keep short-term rates at historically low levels for as long as needed to promote a more robust recovery.
| | |
| Letter to Shareholders | | Wells Fargo Advantage VT Small Cap Growth Fund 3 |
The Fed also stated that it plans to proceed with other stimulus measures, including its second round of quantitative easing (QE2)—a plan to purchase $600 billion in long-term Treasury securities by mid-2011. The ‘preannouncement’ of QE2 in the third quarter of 2010 marked a turning point for the equity markets in that it ushered in a favorable shift in investor sentiment. By and large, investors interpreted the plan as further evidence of the Fed’s commitment to avoiding deflation and spurring economic growth.
2010 was another solid year for equities.
QE2 was certainly not the only catalyst for the equity markets during 2010. Along with more upbeat economic data, better-than-expected corporate earnings power played a role in driving stock prices higher. Throughout the year, quarterly earnings per share for the majority of companies in the S&P 500 Index consistently exceeded Wall Street estimates. As 2010 drew to a close, the midterm congressional elections and the extension of the Bush-era tax cuts provided additional tailwinds, helping the markets finish the year on a strong note.
It was the second straight year of double-digit total returns for the broad equity market indexes. The S&P 500 Index and the Dow Jones Industrial Average advanced 15.1% and 14.1%, respectively, while the tech-heavy NASDAQ Composite Index returned 18.2%. Investors were generally rewarded across the market-capitalization spectrum—with small- and mid-cap stocks outpacing large-cap stocks—as well as across most economic sectors. In terms of investment styles, growth stocks outperformed their value counterparts for the year.
To be sure, the gains were hard-earned, as the markets had to contend with numerous issues along the way, including the European sovereign debt crisis, China’s efforts to slow growth, and doubts about the sustainability of the domestic recovery. The second quarter in particular witnessed bouts of heightened market volatility, most notably the so-called “flash crash” in May. As the year progressed, however, volatility—as measured by the Chicago Board Options Exchange Volatility Index—abated amid reduced fears of a double-dip recession.
Investors should keep a long-term perspective.
In our view, the equity markets’ dramatic rebound over the past two years from a severe downturn underscores the importance of maintaining a disciplined, long-term investment strategy through changing market cycles. By staying focused on your long-term goals, you may be better positioned both to navigate falling markets and participate in rising markets.
To help you build a well-diversified strategy based on your personal objectives and risk tolerance, Wells Fargo Advantage Funds® offers more than 120 mutual funds and other investments covering a wide range of asset classes and investment styles. Although diversification cannot guarantee an investment profit or prevent losses, we believe it can be an effective way to manage investment risk and potentially smooth out overall portfolio performance.
Along with more upbeat economic data, better-than-expected corporate earnings power played a role in driving stock prices higher.
| | |
| 4 Wells Fargo Advantage VT Small Cap Growth Fund | | Letter to Shareholders |
Thank you for choosing Wells Fargo Advantage Funds. We appreciate your continued confidence in us and are committed to helping you meet your financial needs. If you have any questions about your investments, please contact your investment professional, call us at 1-800-222-8222, or visit wellsfargo.com/advantagefunds.
Sincerely,
Karla M. Rabusch
President
Wells Fargo Advantage Funds
This page is intentionally left blank.
| | |
| 6 Wells Fargo Advantage VT Small Cap Growth Fund | | Performance Highlights (Unaudited) |
Wells Fargo Advantage VT Small Cap Growth Fund
INVESTMENT OBJECTIVE
The Fund seeks long-term capital appreciation.
INVESTMENT ADVISER
Wells Fargo Funds Management, LLC
SUB-ADVISER
Wells Capital Management Incorporated
PORTFOLIO MANAGERS
Jerome “Cam” Philpott, CFA
Stuart Roberts
FUND INCEPTION
May 1, 1995
PERFORMANCE SUMMARY
12 MONTH TOTAL RETURN AS OF DECEMBER 31, 2010
| | | | | |
|
| Class 2 | | | 26.77 | % |
Russell 2000® Growth Index1 | | | 29.09 | % |
Figures quoted represent past performance, which is no guarantee of future results and do not reflect the deduction of taxes that a shareholder may pay on fund distributions or the redemption of fund shares. Investment return and principal value of an investment will fluctuate so that an investor’s shares, when redeemed, may be worth more or less than their original cost. Current performance may be lower or higher than the performance data quoted. Current month-end performance is available by calling 1-866-765-0778. Performance figures of the Fund do not reflect fees charged pursuant to the terms of variable life insurance policies and variable annuity contracts.
The adviser has committed, through April 30, 2011, to waive fees and/or reimburse expenses to maintain the contractual expense cap at 1.20% for the Class 2 shares excluding acquired fund fees and certain other expenses. Without these reductions, the Fund’s returns would have been lower. The Fund’s net expense ratio is 1.21% for the Class 2 shares. The Fund’s gross expense ratio is 1.27% for the Class 2 shares.
| | |
| 1. | | The Russell 2000® Growth Index measures the performance of those Russell 2000 companies with higher price-to-book ratios and higher forecasted growth values. You cannot invest directly in an index. |
| |
| 2. | | The chart compares the performance of the Wells Fargo Advantage VT Small Cap Growth Fund Class 2 for the most recent ten years of the Fund with the Russell 2000® Growth Index. The chart assumes a hypothetical $10,000 investment and reflects all operating expenses of the Fund. |
| | |
| Performance Highlights (Unaudited) | | Wells Fargo Advantage VT Small Cap Growth Fund 7 |
Wells Fargo Advantage VT Small Cap Growth Fund (continued)
MANAGER’S DISCUSSION
Fund highlights
| • | | The Fund underperformed its benchmark, the Russell 2000® Growth Index, for the 12-month period that ended December 31, 2010. |
| |
| • | | Adverse stock selection in multiple sectors, including information technology and telecommunication services, detracted from relative performance. |
| |
| • | | Leading contributors to relative performance were found in the health care and consumer discretionary sectors. |
| |
| • | | We have continued to employ a bottom-up investment process, based on individual company fundamentals rather than top-down, cyclical trends, when making allocation decisions. |
Portfolio results varied by sector.
In the health care sector, the Fund outperformed due to strong stock selection and an underweight position relative to the index. A number of our holdings in the sector posted solid quarterly results, including ev3 Inc., an endovascular device company; Volcano Corporation, a medical device company focused on vascular disease; and ViroPharma Incorporated, a biotechnology company. Our holdings in the consumer discretionary sector also delivered good relative performance. Overall, investors were pleasantly surprised by the strength of macroeconomic reports in early 2010, and earnings multiples for consumer stocks expanded. As we found attractive buying opportunities in the sector, we increased the Fund’s weighting accordingly. Shutterfly Inc., an online photography company, was a leading contributor, advancing more than 95% for the year. Live Nation Entertainment, a global producer of live music concerts, was another top performer as the company posted positive operating results.
The information technology sector was our strongest contributor on an absolute basis, yet it underperformed on a relative basis. In mid-August, Dell Inc. and Hewlett-Packard Co. started a bidding war for 3Par Inc., which sparked merger and acquisition (M&A) fever among investors in the data storage industry. As a result, the sector as a whole experienced relatively strong performance. Given our strict valuation discipline, we were underweight in the sector because we thought that the companies were a bit overpriced leading up to the M&A clamor. The largest individual detractor was Global Cash Access, a transaction processor focused on the gaming industry. However, the portfolio also had several positive contributors within information technology that benefited from favorable
TEN LARGEST EQUITY HOLDINGS3
(AS OF DECEMBER 31, 2010)
| | | | | |
|
| GSI Commerce Incorporated | | | 3.35 | % |
| Microsemi Corporation | | | 2.36 | % |
| Scientific Games Corporation Class A | | | 2.18 | % |
| PMC-Sierra Incorporated | | | 2.08 | % |
| Dollar Financial Corporation | | | 1.97 | % |
| Bridgepoint Education Incorporated | | | 1.96 | % |
| National Cinemedia Incorporated | | | 1.95 | % |
| Gaylord Entertainment Company | | | 1.95 | % |
| Wright Express Corporation | | | 1.88 | % |
| Corporate Executive Board Company | | | 1.86 | % |
| | |
| 3. | | The ten largest equity holdings are calculated based on the value of the securities divided by total investments of the Fund. Holdings are subject to change and may have changed since the date specified. |
| | |
| 8 Wells Fargo Advantage VT Small Cap Growth Fund | | Performance Highlights (Unaudited) |
Wells Fargo Advantage VT Small Cap Growth Fund (continued)
earnings releases, including Gartner Inc., a technology research and advisory company, and Synchronoss Technologies, a customer activation software company. We significantly reduced our position in Gartner following its share price appreciation.
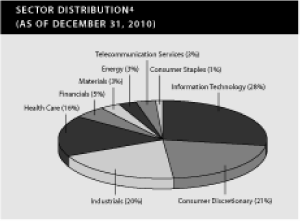
Our telecommunications holdings underperformed the benchmark, and an overweight position in the sector hurt relative returns as well. Leap Wireless International Inc., which provides local wireless services through its Cricket brand, performed poorly as subscriber growth was below our expectations. We sold the shares on the belief that the company was losing market share. Cbeyond Inc., an alternative communications company, was a poor performer in the early part of the year but rebounded somewhat later in the year. The company made an acquisition that enhanced the services offered to its end customers, which we believe will provide incremental market opportunities going forward. PAETEC Holding Corp., a competitive local exchange company, also reported mixed results; it was a weak performer late in the year following strong performance earlier on. Ultimately, we think the company’s stock price will come to reflect its strong underlying fundamentals.
We are optimistic on our holdings entering 2011.
Despite headwinds along the way, stocks recorded a remarkable 12-month advance. Particularly striking was that all of the market indexes that were negative for the year at the end of August delivered robust gains from September through year-end. In our view, investors simply became too bearish about macroeconomic growth earlier in the year and then responded favorably to better-than-expected data during the final four months. Still, our experience tells us that stocks rarely go straight up even when the economy and corporate fundamentals are improving, so it would not surprise us if the market pauses after such a strong advance.
For the portfolio, we remain focused on finding opportunities one company at a time from a bottom-up perspective. We think many managers were overly influenced by macroeconomic concerns this past year, given the volatility in stock prices, yet we continued to adhere to our disciplined investment process. We believe that small-cap growth stocks as a group are attractive going forward and are optimistic regarding the fundamentals of the companies in our portfolio. Additionally, given the current strength of corporate balance sheets across capitalization categories, we would not be surprised to see an increase in M&A activity going forward.
| | |
| 4. | | Sector distribution is subject to change and is calculated based on the total common stock investments of the Fund. |
| | |
| Performance Highlights (Unaudited) | | Wells Fargo Advantage VT Small Cap Growth Fund 9 |
Wells Fargo Advantage VT Small Cap Growth Fund (continued)
AVERAGE ANNUAL TOTAL RETURN (%) (AS OF DECEMBER 31, 2010)5
| | | | | | | | | | | | | | | | | | | | | | | | | | | |
| | | | | | | | | | | | | | | | | | | | | Expense Ratios6 |
| | | Inception Date | | 6 Months* | | 1 Year | | 5 Year | | 10 Year | | Gross | | Net7 |
| Class 1 | | 7/16/2010 | | | 28.75 | | | | 26.93 | | | | 9.66 | | | | 2.45 | | | | 0.99 | % | | | 0.96 | % |
| Class 2 | | 5/1/1995 | | | 28.59 | | | | 26.77 | | | | 9.63 | | | | 2.44 | | | | 1.27 | % | | | 1.21 | % |
Russell 2000® Growth Index1 | | | | | 32.14 | | | | 29.09 | | | | 5.30 | | | | 3.78 | | | | | | | | | |
| | |
| * | | Returns for periods of less than one year are not annualized. |
Figures quoted represent past performance, which is no guarantee of future results and do not reflect the deduction of taxes that a shareholder may pay on fund distributions or the redemption of fund shares. Investment return and principal value of an investment will fluctuate so that an investor’s shares, when redeemed, may be worth more or less than their original cost. Current performance may be lower or higher than the performance data quoted. Current month-end performance is available by calling 1-866-765-0778. Performance figures of the Fund do not reflect fees charged pursuant to the terms of variable life insurance policies and variable annuity contracts.
Please keep in mind that high double-digit returns were primarily achieved during favorable market conditions. You should not expect that such favorable returns can be consistently achieved. A Fund’s performance, especially for very short time periods, should not be the sole factor in making your investment decision.
Stock fund values fluctuate in response to the activities of individual companies and general market and economic conditions. Smaller company stocks tend to be more volatile and less liquid than those of larger companies. The use of derivatives may reduce returns and/or increase volatility. Consult the Fund’s prospectus for additional information on these and other risks.
Please refer to the prospectus provided by your participating insurance company for detailed information describing the separate accounts for information regarding surrender charges, mortality and expense risk fees and other charges that may be assessed by the participating insurance companies.
| | |
| 5. | | Performance shown for Class 1 shares prior to its inception reflects the performance of Class 2 shares, and includes the higher expenses applicable to Class 2 shares. If these expenses had not been included, returns would be higher. |
| |
| 6. | | Reflects the expense ratio as stated in the July 19, 2010 prospectus, for Class 1. Reflects the expense ratio as stated in the May 1, 2010 prospectus for Class 2. |
| |
| 7. | | For Class 1, the investment adviser has contractually committed through July 18, 2013 to waive fees and/or reimburse expenses to maintain the Fund’s contractual expense ratio for Class 1 at 0.95%, excluding acquired fund fees and certain other expenses. Without these reductions, the Fund’s returns would have been lower. For Class 2, the investment adviser has contractually committed through April 30, 2011 to waive fees and/or reimburse expenses to maintain the Fund’s contractual expense ratio for Class 2 at 1.20%, excluding acquired fund fees and certain other expenses. Without these reductions, the Fund’s returns would have been lower. |
| | |
| 10 Wells Fargo Advantage VT Small Cap Growth Fund | | Fund Expenses (Unaudited) |
As a shareholder of the Fund, you incur two types of costs: (1) transaction costs, including sales charges (loads) on purchase payments, redemption fees (if any) and exchange fees (if any); and (2) ongoing costs, including management fees; distribution (12b-1) and/or shareholder service fees; and other Fund expenses. This example is intended to help you understand your ongoing costs (in dollars) of investing in the Fund and to compare these costs with the ongoing costs of investing in other mutual funds.
The example is based on an investment of $1,000 invested at the beginning of the six-month period and held for the entire period from July 1, 2010 to December 31, 2010.
Actual expenses
The “Actual” line of the table below provides information about actual account values and actual expenses. You may use the information in this line, together with the amount you invested, to estimate the expenses that you paid over the period. Simply divide your account value by $1,000 (for example, an $8,600 account value divided by $1,000 = 8.6), then multiply the result by the number in the “Actual” line under the heading entitled “Expenses Paid During Period” for your applicable class of shares to estimate the expenses you paid on your account during this period.
Hypothetical example for comparison purposes
The “Hypothetical” line of the table below provides information about hypothetical account values and hypothetical expenses based on the Fund’s actual expense ratio and an assumed rate of return of 5% per year before expenses, which is not the Fund’s actual return. The hypothetical account values and expenses may not be used to estimate the actual ending account balance or expenses you paid for the period. You may use this information to compare the ongoing costs of investing in the Fund and other funds. To do so, compare this 5% hypothetical example with the 5% hypothetical examples that appear in the shareholder reports of the other funds.
Please note that the expenses shown in the table are meant to highlight your ongoing costs only and do not reflect any transactional costs, such as sales charges (loads), redemption fees, exchange fees or separate account charges assessed by participating insurance companies. Therefore, the “Hypothetical” line of the table is useful in comparing ongoing costs only, and will not help you determine the relative total costs of owning different funds. In addition, if these transactional costs were included, your costs would have been higher.
| | | | | | | | | | | | | | | | | |
| | | Beginning | | | Ending | | | Expenses | | | | |
| | | Account Value | | | Account Value | | | Paid During | | | Net Annual | |
| | | 07-01-2010 | | | 12-31-2010 | | | the Period1 | | | Expense Ratio | |
Class 1 | | | | | | | | | | | | | | | | |
| Actual | | $ | 1,000.00 | | | $ | 1,287.54 | | | $ | 5.54 | | | | 0.95 | % |
| Hypothetical (5% return before expenses) | | $ | 1,000.00 | | | $ | 1,020.64 | | | $ | 4.89 | | | | 0.95 | % |
Class 2 | | | | | | | | | | | | | | | | |
| Actual | | $ | 1,000.00 | | | $ | 1,285.94 | | | $ | 6.99 | | | | 1.20 | % |
| Hypothetical (5% return before expenses) | | $ | 1,000.00 | | | $ | 1,019.36 | | | $ | 6.17 | | | | 1.20 | % |
| | |
| 1. | | Expenses are equal to the Fund’s annualized expense ratio multiplied by the average account value over the period, multiplied by the number of days in the most recent fiscal half-year divided by the number of days in the fiscal year (to reflect the one-half year period). |
| | |
| | | |
| Portfolio of Investments—December 31, 2010 | | Wells Fargo Advantage VT Small Cap Growth Fund 11 |
| | | | | | | | | |
| Shares | | | Security Name | | Value | |
| Common Stocks: 95.89% | | | | |
| | | | | | | | | |
| Consumer Discretionary: 20.18% | | | | |
| | | | | | | | | |
| Diversified Consumer Services: 3.99% | | | | |
| | 286,867 | | | Bridgepoint Education Incorporated† | | $ | 5,450,473 | |
| | 61,900 | | | Coinstar IncorporatedǠ | | | 3,493,636 | |
| | 133,182 | | | Grand Canyon Education Incorporated† | | | 2,609,035 | |
| | | | | | | | | |
| | | | | | | | 11,553,144 | |
| | | | | | | | |
| | | | | | | | | |
| Hotels, Restaurants & Leisure: 6.57% | | | | |
| | 150,500 | | | Gaylord Entertainment CompanyǠ | | | 5,408,970 | |
| | 360,344 | | | Great Wolf Resorts Incorporated† | | | 944,101 | |
| | 124,500 | | | Ruby Tuesday Incorporated† | | | 1,625,970 | |
| | 607,540 | | | Scientific Games Corporation Class A† | | | 6,051,098 | |
| | 271,922 | | | Shuffle Master Incorporated† | | | 3,113,507 | |
| | 41,667 | | | WMS Industries Incorporated† | | | 1,885,015 | |
| | | | | | | | | |
| | | | | | | | 19,028,661 | |
| | | | | | | | |
| | | | | | | | | |
| Household Durables: 0.70% | | | | |
| | 43,600 | | | Harman International Industries Incorporated† | | | 2,018,680 | |
| | | | | | | | |
| | | | | | | | | |
| Internet & Catalog Retail: 1.44% | | | | |
| | 119,380 | | | Shutterfly Incorporated† | | | 4,181,881 | |
| | | | | | | | |
| | | | | | | | | |
| Leisure Equipment & Products: 1.59% | | | | |
| | 59,001 | | | Polaris Industries Incorporated« | | | 4,603,258 | |
| | | | | | | | |
| Media: 3.79% | | | | |
| | 344,428 | | | Live Nation IncorporatedǠ | | | 3,933,368 | |
| | 272,177 | | | National Cinemedia Incorporated | | | 5,419,044 | |
| | 81,312 | | | Reachlocal IncorporatedǠ | | | 1,618,922 | |
| | | | | | | | | |
| | | | | | | | 10,971,334 | |
| | | | | | | | |
| | | | | | | | | |
| Specialty Retail: 2.10% | | | | |
| | 133,820 | | | Express Incorporated« | | | 2,515,816 | |
| | 51,100 | | | HHGregg IncorporatedǠ | | | 1,070,545 | |
| | 238,400 | | | Pier 1 Imports IncorporatedǠ | | | 2,503,200 | |
| | | | | | | | | |
| | | | | | | | 6,089,561 | |
| | | | | | | | |
| | | | | | | | | |
| Consumer Staples: 0.47% | | | | |
| | | | | | | | | |
| Beverages: 0.47% | | | | |
| | 96,079 | | | Primo Water CorporationǠ | | | 1,365,283 | |
| | | | | | | | |
| | | | | | | | | |
| Energy: 2.71% | | | | |
| | | | | | | | | |
| Oil, Gas & Consumable Fuels: 2.71% | | | | |
| | 75,050 | | | Brigham Exploration Company† | | | 2,044,362 | |
| | 107,000 | | | Carrizo Oil & Gas IncorporatedǠ | | | 3,690,430 | |
| | 319,900 | | | Kodiak Oil & Gas CorporationǠ | | | 2,111,340 | |
| | | | | | | | | |
| | | | | | | | 7,846,132 | |
| | | | | | | | |
| | | | | | | | | |
| Financials: 4.83% | | | | |
| | | | | | | | | |
| Capital Markets: 0.62% | | | | |
| | 215,300 | | | MF Global Holdings Limited† | | | 1,799,908 | |
| | | | | | | | |
| | |
| | | |
| 12 Wells Fargo Advantage VT Small Cap Growth Fund | | Portfolio of Investments—December 31, 2010 |
| | | | | | | | | |
| Shares | | | Security Name | | Value | |
| Commercial Banks: 0.55% | | | | |
| | 166,300 | | | First Commonwealth Financial Corporation | | $ | 1,177,404 | |
| | 68,100 | | | Park Sterling Corporation† | | | 419,496 | |
| | | | | | | | | |
| | | | | | | | 1,596,900 | |
| | | | | | | | |
| | | | | | | | | |
| Consumer Finance: 2.26% | | | | |
| | 190,700 | | | Dollar Financial Corporation† | | | 5,459,741 | |
| | 85,038 | | | Netspend Holdings Incorporated† | | | 1,090,187 | |
| | | | | | | | | |
| | | | | | | | 6,549,928 | |
| | | | | | | | |
| | | | | | | | | |
| Insurance: 1.40% | | | | |
| | 158,400 | | | Tower Group Incorporated« | | | 4,051,872 | |
| | | | | | | | |
| | | | | | | | | |
| Health Care: 15.99% | | | | |
| | | | | | | | | |
| Biotechnology: 4.15% | | | | |
| | 143,900 | | | Acorda Therapeutics Incorporated† | | | 3,922,714 | |
| | 244,903 | | | Halozyme Therapeutics IncorporatedǠ | | | 1,939,632 | |
| | 109,000 | | | Onyx Pharmaceuticals Incorporated† | | | 4,018,830 | |
| | 226,816 | | | Vanda Pharmaceuticals IncorporatedǠ | | | 2,145,679 | |
| | | | | | | | | |
| | | | | | | | 12,026,855 | |
| | | | | | | | |
| | | | | | | | | |
| Health Care Equipment & Supplies: 4.53% | | | | |
| | 98,400 | | | Greatbatch Incorporated† | | | 2,376,360 | |
| | 53,605 | | | Sirona Dental Systems IncorporatedǠ | | | 2,239,617 | |
| | 130,181 | | | SonoSite Incorporated† | | | 4,113,720 | |
| | 194,168 | | | Spectranetics Corporation† | | | 1,001,907 | |
| | 123,959 | | | Volcano Corporation† | | | 3,385,320 | |
| | | | | | | | | |
| | | | | | | | 13,116,924 | |
| | | | | | | | |
| | | | | | | | | |
| Health Care Providers & Services: 1.10% | | | | |
| | 125,400 | | | Centene Corporation† | | | 3,177,636 | |
| | | | | | | | |
| | | | | | | | | |
| Health Care Technology: 1.34% | | | | |
| | 55,801 | | | Quality Systems Incorporated | | | 3,896,026 | |
| | | | | | | | |
| | | | | | | | | |
| Life Sciences Tools & Services: 1.23% | | | | |
| | 244,400 | | | Affymetrix IncorporatedǠ | | | 1,229,332 | |
| | 128,026 | | | Luminex Corporation† | | | 2,340,315 | |
| | | | | | | | | |
| | | | | | | | 3,569,647 | |
| | | | | | | | |
| | | | | | | | | |
| Pharmaceuticals: 3.64% | | | | |
| | 143,800 | | | Auxilium Pharmaceuticals Incorporated† | | | 3,034,180 | |
| | 75,600 | | | Impax Laboratories Incorporated† | | | 1,520,316 | |
| | 80,000 | | | Jazz Pharmaceuticals Incorporated† | | | 1,574,400 | |
| | 254,600 | | | ViroPharma Incorporated† | | | 4,409,672 | |
| | | | | | | | | |
| | | | | | | | 10,538,568 | |
| | | | | | | | |
| | | | | | | | | |
| Industrials: 19.28% | | | | |
| | | | | | | | | |
| Aerospace & Defense: 1.66% | | | | |
| | 85,900 | | | DigitalGlobe Incorporated† | | | 2,723,889 | |
| | 30,579 | | | Esterline Technologies CorporationǠ | | | 2,097,414 | |
| | | | | | | | | |
| | | | | | | | 4,821,303 | |
| | | | | | | | |
| | |
| | | |
| Portfolio of Investments—December 31, 2010 | | Wells Fargo Advantage VT Small Cap Growth Fund 13 |
| | | | | | | | | |
| Shares | | | Security Name | | Value | |
| Air Freight & Logistics: 2.09% | | | | |
| | 69,800 | | | Atlas Air Worldwide Holdings Incorporated† | | $ | 3,896,934 | |
| | 101,800 | | | UTI Worldwide Incorporated | | | 2,158,160 | |
| | | | | | | | | |
| | | | | | | | 6,055,094 | |
| | | | | | | | |
| | | | | | | | | |
| Commercial Services & Supplies: 9.03% | | | | |
| | 28,400 | | | Clean Harbors IncorporatedǠ | | | 2,387,872 | |
| | 137,412 | | | Corporate Executive Board Company | | | 5,159,821 | |
| | 81,400 | | | ICF International Incorporated† | | | 2,093,608 | |
| | 489,067 | | | InnerWorkings IncorporatedǠ | | | 3,203,389 | |
| | 101,100 | | | Kforce Incorporated† | | | 1,635,798 | |
| | 370,368 | | | On Assignment Incorporated† | | | 3,018,499 | |
| | 165,195 | | | Resources Connection Incorporated | | | 3,070,975 | |
| | 209,024 | | | Sykes Enterprises Incorporated† | | | 4,234,826 | |
| | 21,300 | | | United Stationers Incorporated† | | | 1,359,153 | |
| | | | | | | | | |
| | | | | | | | 26,163,941 | |
| | | | | | | | |
| | | | | | | | | |
| Electrical Equipment: 0.69% | | | | |
| | 37,600 | | | Wesco International Incorporated† | | | 1,985,280 | |
| | | | | | | | |
| | | | | | | | | |
| Machinery: 5.40% | | | | |
| | 67,292 | | | Chart Industries Incorporated† | | | 2,273,124 | |
| | 30,500 | | | Circor International Incorporated | | | 1,289,540 | |
| | 40,046 | | | Gardner Denver Incorporated | | | 2,755,966 | |
| | 76,100 | | | Robbins & Myers Incorporated« | | | 2,722,858 | |
| | 17,699 | | | The Middleby Corporation† | | | 1,494,150 | |
| | 266,950 | | | Wabash National CorporationǠ | | | 3,163,358 | |
| | 37,000 | | | Wabtec Corporation | | | 1,956,930 | |
| | | | | | | | | |
| | | | | | | | 15,655,926 | |
| | | | | | | | |
| | | | | | | | | |
| Road & Rail: 0.41% | | | | |
| | 90,950 | | | RailAmerica Incorporated† | | | 1,177,803 | |
| | | | | | | | |
| | | | | | | | | |
| Information Technology: 27.18% | | | | |
| | | | | | | | | |
| Communications Equipment: 1.79% | | | | |
| | 79,000 | | | Blue Coat Systems Incorporated† | | | 2,359,730 | |
| | 102,031 | | | Ixia† | | | 1,712,080 | |
| | 84,200 | | | Oclaro IncorporatedǠ | | | 1,107,230 | |
| | | | | | | | | |
| | | | | | | | 5,179,040 | |
| | | | | | | | |
| | | | | | | | | |
| Internet Software & Services: 9.65% | | | | |
| | 87,500 | | | Ancestry.com Incorporated† | | | 2,478,000 | |
| | 52,300 | | | Constant Contact IncorporatedǠ | | | 1,620,777 | |
| | 69,518 | | | DealerTrack Holdings Incorporated† | | | 1,395,226 | |
| | 79,636 | | | Dice Holdings Incorporated† | | | 1,142,777 | |
| | 400,896 | | | GSI Commerce Incorporated† | | | 9,300,787 | |
| | 278,893 | | | Marchex Incorporated Class B | | | 2,660,639 | |
| | 784,661 | | | Move IncorporatedǠ | | | 2,016,579 | |
| | 182,177 | | | Quinstreet Incorporated† | | | 3,499,620 | |
| | 83,361 | | | VistaPrint NV† | | | 3,834,606 | |
| | | | | | | | | |
| | | | | | | | 27,949,011 | |
| | | | | | | | |
| | |
| | | |
| 14 Wells Fargo Advantage VT Small Cap Growth Fund | | Portfolio of Investments—December 31, 2010 |
| | | | | | | | | | | | | | | | | |
| Shares | | | Security Name | | | | | | | | | | Value | |
| IT Services: 5.01% | | | | | | | | | | | | |
| | 126,043 | | �� | Euronet Worldwide Incorporated† | | | | | | | | | | $ | 2,198,190 | |
| | | | | | | | | |
| | 81,246 | | | Gartner Incorporated† | | | | | | | | | | | 2,697,367 | |
| | 487,183 | | | Global Cash Access Incorporated† | | | | | | | | | | | 1,554,114 | |
| | 233,191 | | | Sapient Corporation | | | | | | | | | | | 2,821,611 | |
| | 113,772 | | | Wright Express Corporation† | | | | | | | | | | | 5,233,512 | |
| | | | | | | | | |
| | | | | | | | | | | | | | | | 14,504,794 | |
| | | | | | | | | | | | | | | | | |
| Semiconductors & Semiconductor Equipment: 5.71% | | | | | | | | | | | | |
| | 255,200 | | | JA Solar Holdings Company LimitedǠ | | | | | | | | | | | 1,765,984 | |
| | 285,899 | | | Microsemi Corporation† | | | | | | | | | | | 6,547,087 | |
| | 148,602 | | | Monolithic Power Systems Incorporated† | | | | | | | | | | | 2,454,905 | |
| | | | | | | | | |
| | 672,200 | | | PMC-Sierra Incorporated† | | | | | | | | | | | 5,774,198 | |
| | | | | | | | | | | | | | | | 16,542,174 | |
| | | | | | | | | | | | | | | | | |
| Software: 5.02% | | | | | | | | | | | | |
| | 62,000 | | | Blackboard Incorporated† | | | | | | | | | | | 2,560,600 | |
| | 192,658 | | | Synchronoss Technologies Incorporated† | | | | | | | | | | | 5,145,895 | |
| | 81,251 | | | Taleo Corporation Class A† | | | | | | | | | | | 2,246,590 | |
| | 352,862 | | | THQ IncorporatedǠ | | | | | | | | | | | 2,138,344 | |
| | | | | | | | | |
| | 284,100 | | | Tivo IncorporatedǠ | | | | | | | | | | | 2,451,783 | |
| | | | | | | | | | | | | | | | 14,543,212 | |
| | | | | | | | | | | | | | | | | |
| Materials: 2.77% | | | | | | | | | | | | |
| | | | | | | | | | | | | | | | | |
| Chemicals: 2.21% | | | | | | | | | | | | |
| | 145,139 | | | Calgon Carbon CorporationǠ | | | | | | | | | | | 2,194,502 | |
| | 53,800 | | | Intrepid Potash IncorporatedǠ | | | | | | | | | | | 2,006,202 | |
| | 95,400 | | | Solutia Incorporated† | | | | | | | | | | | 2,201,832 | |
| | | | | | | | | |
| | | | | | | | | | | | | | | | 6,402,536 | |
| | | | | | | | | | | | | | | | | |
| Containers & Packaging: 0.56% | | | | | | | | | | | | |
| | | | | | | | | |
| | 124,150 | | | Graham Packaging Corporation† | | | | | | | | | | | 1,618,916 | |
| | | | | | | | | | | | | | | | | |
| Telecommunication Services: 2.48% | | | | | | | | | | | | |
| | | | | | | | | | | | | | | | | |
| Diversified Telecommunication Services: 2.48% | | | | | | | | | | | | |
| | 328,019 | | | Cbeyond IncorporatedǠ | | | | | | | | | | | 5,012,130 | |
| | 582,700 | | | PAETEC Holding CorporationǠ | | | | | | | | | | | 2,179,298 | |
| | | | | | | | | |
| | | | | | | | | | | | | | | | 7,191,428 | |
| | | | | | | | | | | | | | | | | |
| | | | | | | | | |
| Total Common Stocks (Cost $233,932,057) | | | | | | | | | | | 277,772,656 | |
| | | | | | | | | | | | | | | | | |
| Principal | | Interest Rate | | Maturity Date | | | | |
| Short-Term Investments: 23.44% | | | | | | | | | | | | |
| | | | | | | | | | | | | | | | | |
| Corporate Bonds & Notes: 0.38% | | | | | | | | | | | | |
| | 964,665 | | | Gryphon Funding Limited(a)(i)(v) | | | 0.00 | % | | | 08/05/2011 | | | | 391,847 | |
| | 1,268,890 | | | VFNC Corporation(a)(i)(v)±†† | | | 0.26 | | | | 09/29/2011 | | | | 710,577 | |
| | | | | | | | | |
| | | | | | | | | | | | | | | | 1,102,424 | |
| | |
| | | |
| Portfolio of Investments—December 31, 2010 | | Wells Fargo Advantage VT Small Cap Growth Fund 15 |
| | | | | | | | | | | | | | | | | |
| Shares | | | Security Name | | | | | Yield | | | Value | |
| Investment Companies: 23.06% | | | | | | | | | | | | |
| | 14,673,852 | | | Wells Fargo Advantage Cash Investment Money Market Fund(l)(u) | | | | | | | 0.14 | % | | $ | 14,673,852 | |
| | 52,136,082 | | | Wells Fargo Securities Lending Cash Investments LLC(v)(l)(u) | | | | | | | 0.27 | | | | 52,136,082 | |
| | | | | | | | | | | | | | | | 66,809,934 | |
| | | | | | | | | | | | | | | | | |
| Total Short-Term Investments (Cost $67,507,791) | | | | | | | | | | | 67,912,358 | |
| | | | | | | | | | | | | | | | | |
Total Investments in Securities
(Cost $301,439,848)* | | | 119.33 | % | | | | | | | 345,685,014 | |
| Other Assets and Liabilities, Net | | | (19.33 | ) | | | | | | | (56,005,648 | ) |
| | | | | | | | | | | | | | | |
| | | | | | | | | | | | | | | | | |
| Total Net Assets | | | 100.00 | % | | | | | | $ | 289,679,366 | |
| | | | | | | | | | | | | | | |
| | |
| † | | Non-income earning securities. |
| |
| « | | All or a portion of this security is on loan. |
| |
| (l) | | Investment in an affiliate. |
| |
| (a) | | Security is fair valued by the Management Valuation Team, and in certain instances by the Board of Trustees, in accordance with procedures approved by the Board of Trustees. |
| |
| (i) | | Illiquid security for which the designation as illiquid is unaudited. |
| |
| (v) | | Security represents investment of cash collateral received from securities on loan. |
| |
| ± | | Variable rate investments. |
| |
| †† | | Securities that may be resold to “qualified institutional buyers” under Rule 144A or securities offered pursuant to Section 4(2) of the Securities Act of 1933, as amended. |
| |
| (u) | | Rate shown is the 7-day annualized yield at period end. |
| |
| * | | Cost for federal income tax purposes is $306,158,110 and net unrealized appreciation (depreciation) consists of: |
| | | | | |
|
| Gross unrealized appreciation | | $ | 54,678,956 | |
| Gross unrealized depreciation | | | (15,152,052 | ) |
| Net unrealized appreciation | | $ | 39,526,904 | |
The accompanying notes are an integral part of these financial statements.
| | |
| 16 Wells Fargo Advantage VT Small Cap Growth Fund | | Statement of Assets and Liabilities—December 31, 2010 |
| | | | | |
|
Assets | | | | |
| Investments | | | | |
| In unaffiliated securities (including securities on loan), at value | | $ | 278,875,080 | |
| In affiliated securities, at value | | | 66,809,934 | |
| | | | |
| Total investments, at value (see cost below) | | | 345,685,014 | |
| Receivable for investments sold | | | 340,750 | |
| Receivable for Fund shares sold | | | 576,277 | |
| Receivable for dividends | | | 18,453 | |
| Receivable for securities lending income | | | 6,549 | |
| Prepaid expenses and other assets | | | 4,504 | |
| | | | |
| Total assets | | | 346,631,547 | |
| | | | |
| | | | | |
Liabilities | | | | |
| Payable for investments purchased | | | 3,402,908 | |
| Payable for Fund shares redeemed | | | 331,948 | |
| Payable upon receipt of securities loaned | | | 52,833,938 | |
| Investment advisory fee payable | | | 210,148 | |
| Distribution fees payable | | | 60,310 | |
| Due to other related parties | | | 36,396 | |
| Accrued expenses and other liabilities | | | 76,533 | |
| | | | |
| Total liabilities | | | 56,952,181 | |
| | | | |
Total net assets | | $ | 289,679,366 | |
| | | | |
| | | | | |
NET ASSETS CONSIST OF | | | | |
| Paid-in capital | | $ | 257,802,705 | |
| Undistributed net investment loss | | | (1,998 | ) |
| Accumulated net realized losses on investments | | | (12,366,507 | ) |
| Net unrealized gains on investments | | | 44,245,166 | |
| | | | |
Total net assets | | $ | 289,679,366 | |
| | | | |
| | | | | |
COMPUTATION OF NET ASSET VALUE PER SHARE 1 | | | | |
| Net assets — Class 1 | | $ | 42,433,600 | |
| Shares outstanding — Class 1 | | | 5,264,222 | |
| Net asset value per share — Class 1 | | $ | 8.06 | |
| Net assets — Class 2 | | $ | 247,245,766 | |
| Shares outstanding — Class 2 | | | 30,707,355 | |
| Net asset value per share — Class 2 | | $ | 8.05 | |
| | | | |
| | | | | |
| Total investments, at cost | | $ | 301,439,848 | |
| | | | |
| Securities on loan, at value | | $ | 51,016,576 | |
| | | | |
| | |
| 1 | | The Fund has an unlimited number of authorized shares. |
The accompanying notes are an integral part of these financial statements.
| | |
| Statement of Operations—For the Year Ended December 31, 2010 | | Wells Fargo Advantage VT Small Cap Growth Fund 17 |
| | | | | |
|
Investment income | | | | |
| Dividends | | $ | 781,061 | |
| Income from affiliated securities | | | 7,387 | |
| Securities lending income, net | | | 67,746 | |
| | | | |
| Total investment income | | | 856,194 | |
| | | | |
| | | | | |
Expenses | | | | |
| Investment advisory fee | | | 1,717,006 | |
| Administration fees | | | | |
| Fund level | | | 232,878 | |
| Class 1** | | | 13,987 | |
| Class 2* | | | 83,043 | |
| Distribution fees | | | | |
| Class 2* | | | 528,626 | |
| Custody and accounting fees | | | 35,996 | |
| Professional fees | | | 29,110 | |
| Shareholder report expenses | | | 72,169 | |
| Trustees’ fees and expenses | | | 12,155 | |
| Other fees and expenses | | | 4,714 | |
| | | | |
| Total expenses | | | 2,729,684 | |
| | | | | |
Less: Fee waivers and/or expense reimbursements | | | (33,934 | ) |
| | | | |
| Net expenses | | | 2,695,750 | |
| | | | |
Net investment loss | | | (1,839,556 | ) |
| | | | |
| | | | | |
NET REALIZED AND UNREALIZED GAINS (LOSSES) ON INVESTMENTS | | | | |
| | | | | |
| Net realized gains on unaffiliated securities | | | 27,159,838 | |
| Net change in unrealized gains (losses) on unaffiliated securities | | | 34,892,151 | |
| | | | |
| Net realized and unrealized gains (losses) on investments | | | 62,051,989 | |
| | | | |
Net increase in net assets resulting from operations | | $ | 60,212,433 | |
| | | | |
| | |
| * | | After the close of business on July 16, 2010, existing shares of the Fund were renamed Class 2 shares. |
| |
| ** | | Class commenced operations on July 16, 2010. |
The accompanying notes are an integral part of these financial statements.
| | |
| 18 Wells Fargo Advantage VT Small Cap Growth Fund | | Statements of Changes in Net Assets |
| | | | | | | | | | | | | | | | | |
| | | Year Ended | | | Year Ended | |
| | | December 31, 2010 | | | December 31, 2009 | |
Operations | | | | | | | | | | | | | | | | |
| Net investment loss | | | | | | $ | (1,839,556 | ) | | | | | | $ | (964,406 | ) |
| Net realized gains (losses) on investments | | | | | | | 27,159,838 | | | | | | | | (9,759,000 | ) |
| Net change in unrealized gains (losses) on investments | | | | | | | 34,892,151 | | | | | | | | 69,420,121 | |
| | | |
| Net increase in net assets resulting from operations | | | | | | | 60,212,433 | | | | | | | | 58,696,715 | |
| | | |
| | | | | | | | | | | | | | | | | |
| | | Shares | | | | | | | Shares | | | | | |
Capital share transactions | | | | | | | | | | | | | | | | |
| Proceeds from shares sold | | | | | | | | | | | | | | | | |
| Class 1** | | | 345,312 | | | | 2,449,216 | | | NA | | | NA | |
| Class 2* | | | 9,158,617 | | | | 64,586,061 | | | | 12,954,722 | | | | 69,566,868 | |
| | | |
| | | | | | | | 67,035,277 | | | | | | | | 69,566,868 | |
| | | |
| | | | | | | | | | | | | | | | | |
| Payment for shares redeemed | | | | | | | | | | | | | | | | |
| Class 1** | | | (831,507 | ) | | | (5,663,229 | ) | | NA | | | NA | |
| Class 2* | | | (8,891,344 | ) | | | (61,045,657 | ) | | | (10,173,454 | ) | | | (52,914,729 | ) |
| | | |
| | | | | | | | (66,708,886 | ) | | | | | | | (52,914,729 | ) |
| | | |
| | | | | | | | | | | | | | | | | |
| Net asset value of shares issued in acquisition | | | | | | | | | | | | | | | | |
| Class 1** | | | 5,750,417 | | | | 36,024,647 | | | NA | | | NA | |
| Class 2* | | | 1,240,431 | | | | 7,770,923 | | | | 0 | | | | 0 | |
| | | |
| | | | | | | | 43,795,570 | | | | | | | | 0 | |
| | | |
| Net increase in net assets resulting from capital share transactions | | | | | | | 44,121,961 | | | | | | | | 16,652,139 | |
| | | |
Total increase in net assets | | | | | | | 104,334,394 | | | | | | | | 75,348,854 | |
| | | |
| | | | | | | | | | | | | | | | | |
Net assets | | | | | | | | | | | | | | | | |
| Beginning of period | | | | | | | 185,344,972 | | | | | | | | 109,996,118 | |
| | | |
| End of period | | | | | | $ | 289,679,366 | | | | | | | $ | 185,344,972 | |
| | | |
| Undistributed net investment income (loss) | | | | | | $ | (1,998 | ) | | | | | | $ | 0 | |
| | | |
| | |
| * | | After the close of business on July 16, 2010, existing shares of the Fund were renamed Class 2 shares. |
| |
| ** | | Class commenced operations on July 16, 2010. |
The accompanying notes are an integral part of these financial statements.
This page is intentionally left blank.
| | |
| 20 Wells Fargo Advantage VT Small Cap Growth Fund | | Financial Highlights |
| | | | | | | | | | | | | | | | | |
| | | Beginning | | | | | | | Net Realized | | | | |
| | | Net Asset | | | Net | | | and Unrealized | | | Distributions | |
| | | Value Per | | | Investment | | | Gains (Losses) | | | from Net | |
| | | Share | | | Loss | | | on Investments | | | Realized Gains | |
| |
| Class 1 | | | | | | | | | | | | | | | | |
July 16, 20103 to December 31, 2010 | | $ | 6.26 | | | | (0.02 | ) | | | 1.82 | | | | 0.00 | |
| | | | | | | | | | | | | | | | | |
Class 24 | | | | | | | | | | | | | | | | |
| January 1, 2010 to December 31, 2010 | | $ | 6.35 | | | | (0.06 | ) | | | 1.76 | | | | 0.00 | |
| January 1, 2009 to December 31, 2009 | | $ | 4.16 | | | | (0.03 | ) | | | 2.22 | | | | 0.00 | |
| January 1, 2008 to December 31, 2008 | | $ | 9.69 | | | | (0.05 | ) | | | (3.31 | ) | | | (2.17 | ) |
| January 1, 2007 to December 31, 2007 | | $ | 9.96 | | | | (0.07 | ) | | | 1.52 | | | | (1.72 | ) |
| January 1, 2006 to December 31, 2006 | | $ | 8.34 | | | | (0.09 | ) | | | 1.94 | | | | (0.23 | ) |
| | |
| 1. | | Total return calculations would have been lower had certain expenses not been waived or reimbursed during the periods shown. Returns for periods less than one year are not annualized. |
| |
| 2. | | Calculated on the basis of the Fund as a whole without distinguishing between the classes of shares issued. Portfolio turnover rates presented for periods of less than one year are not annualized. |
| |
| 3. | | Class commenced operations on July 16, 2010 |
| |
| 4. | | After the close of business on July 16, 2010, existing shares of the Fund were renamed Class 2 shares. |
The accompanying notes are an integral part of these financial statements.
| | |
| Financial Highlights | | Wells Fargo Advantage VT Small Cap Growth Fund 21 |
| | | | | | | | | | | | | | | | | | | | | | | | | |
| Ending | | | | | | | | | | | | | |
| Net Asset | | Ratio to Average Net Assets (Annualized) | | | | | | | Portfolio | | | Net Assets at | |
| Value Per | | Net Investment | | | Gross | | | Net | | | Total | | | Turnover | | | End of Period | |
| Share | | Loss | | | Expenses | | | Expenses | | | Return1 | | | Rate2 | | | (000’s omitted) | |
| |
| $8.06 | | | (0.58 | )% | | | 0.95 | % | | | 0.95 | % | | | 26.93 | % | | | 71 | % | | $ | 42,434 | |
| | | | | | | | | | | | | | | | | | | | | | | | | |
| $8.05 | | | (0.82 | )% | | | 1.22 | % | | | 1.20 | % | | | 26.77 | % | | | 71 | % | | $ | 247,246 | |
| $6.35 | | | (0.69 | )% | | | 1.26 | % | | | 1.20 | % | | | 52.64 | % | | | 75 | % | | $ | 185,345 | |
| $4.16 | | | (0.73 | )% | | | 1.26 | % | | | 1.20 | % | | | (41.42 | )% | | | 76 | % | | $ | 109,996 | |
| $9.69 | | | (0.73 | )% | | | 1.22 | % | | | 1.20 | % | | | 13.81 | % | | | 121 | % | | $ | 221,394 | |
| $9.96 | | | (0.98 | )% | | | 1.23 | % | | | 1.20 | % | | | 22.75 | % | | | 135 | % | | $ | 190,516 | |
| | |
| | | |
| 22 Wells Fargo Advantage VT Small Cap Growth Fund | | Notes to Financial Statements |
1. ORGANIZATION
Wells Fargo Variable Trust (the “Trust”), a Delaware statutory trust organized on March 10, 1999, is an open-end management investment company registered under the Investment Company Act of 1940, as amended (the “1940 Act”). These financial statements report on Wells Fargo Advantage VT Small Cap Growth Fund (the “Fund”) which is a diversified series of the Trust. After the close of business on July 16, 2010, existing shares of the Fund were renamed Class 2 shares.
2. SIGNIFICANT ACCOUNTING POLICIES
The following significant accounting policies, which are consistently followed in the preparation of the financial statements of the Fund, are in conformity with U.S. generally accepted accounting principles which require management to make estimates and assumptions that affect the reported amounts of assets and liabilities, disclosure of contingent assets and liabilities at the date of the financial statements, and the reported amounts of revenues and expenses during the reporting period. Actual results could differ from those estimates. Management has considered the circumstances under which the Fund should recognize or make disclosures regarding events or transactions occurring subsequent to the balance sheet date through the date the financial statements are issued. Adjustments or additional disclosures, if any, have been included in these financial statements.
Securities valuation
Investments in securities are valued each business day as of the close of regular trading on the New York Stock Exchange, which is usually 4:00 p.m. (Eastern Time). Securities which are traded on a national or foreign securities exchange are valued at the last reported sales price, except that securities listed on The Nasdaq Stock Market, Inc. (“Nasdaq”) are valued at the Nasdaq Official Closing Price (“NOCP”), and if no NOCP is available, then at the last reported sales price. If no sales price is shown on the Nasdaq, the bid price will be used. In the absence of any sale of securities listed on the Nasdaq, and in the case of other securities, including U.S. Government obligations, but excluding debt securities maturing in 60 days or less, the price will be deemed “stale” and the valuations will be determined in accordance with the Fund’s Fair Valuation Procedures.
Debt securities of sufficient credit quality with original maturities of 60 days or less and any collateral received from securities lending invested in securities generally are valued at amortized cost which approximates fair value. The amortized cost method involves valuing a security at its cost, plus accretion of discount or minus amortization of premium over the period until maturity.
Investments in open-end mutual funds and non-registered investment companies are generally valued at net asset value.
Certain investments which are not valued using any of the methods discussed above, are valued at their fair value, as determined by procedures established in good faith and approved by the Board of Trustees.
The valuation techniques used by the Fund to measure fair value are consistent with the market approach, income approach and/or cost approach, where applicable, for each security type.
Security loans
The Fund may lend its securities from time to time in order to earn additional income in the form of fees or interest on securities received as collateral or the investment of any cash received as collateral. The Fund continues to receive interest or dividends on the securities loaned. The Fund receives collateral in the form of cash or securities with a value at least equal to the value of the securities on loan. The value of the loaned securities is determined at the close of each business day and any additional required collateral is delivered to the Fund on the next business day. In the event of default or bankruptcy by the borrower, the Fund could experience delays and costs in recovering the loaned securities or in gaining access to the collateral. In addition, the investment of any cash collateral received may lose all or part of its value. The Fund has the right under the lending agreement to recover the securities from the borrower on demand.
The Fund lends its securities through an unaffiliated securities lending agent. Cash collateral received in connection with its securities lending transactions is invested in Wells Fargo Securities Lending Cash Investments, LLC (the “Cash Collateral Fund”). The Cash Collateral Fund is exempt from registration under Section 3(c)(7) of the 1940 Act and is managed by Wells Fargo Funds Management LLC (“Funds Management”) and is sub-advised by Wells Capital Management Incorporated (“Wells Capital Management”). Funds Management receives an investment advisory fee starting at 0.05% and declining to 0.01% as the average daily net assets of the Cash Collateral Fund increase. All of the
| | |
| | | |
| Notes to Financial Statements | | Wells Fargo Advantage VT Small Cap Growth Fund 23 |
fees received by Funds Management are paid to Wells Capital Management for its services as sub-adviser. The Cash Collateral Fund seeks to provide a positive return compared to the daily Fed Funds Open rate by investing in high-quality, U.S. dollar-denominated short-term money market instruments. Cash Collateral Fund investments are fair valued based upon the amortized cost valuation technique. Income earned from investment in the Cash Collateral Fund is included in securities lending income on the Statement of Operations.
Prior to April 1, 2010, Wells Fargo Bank, N.A. acted as the securities lending agent for the Fund and was entitled to receive for its services 25% of the revenues earned on the securities lending activities. For the year ended December 31, 2010, Wells Fargo Bank, N.A. waived a portion of its share of revenues earned on securities lending activities. Such waivers by Wells Fargo Bank, N.A. had the impact of increasing securities lending income on the Statement of Operations. The value of the securities on loan and the liability to return the collateral are shown on the Statement of Assets and Liabilities.
In a securities lending transaction, the net asset value of the Fund will be affected by an increase or decrease in the value of the securities loaned and by an increase or decrease in the value of instruments in which cash collateral is invested. The amount of securities lending activity undertaken by the Fund fluctuates from time to time. After the occurrence of a default or impairment of structured investment vehicles purchased in a joint account by the Fund’s former securities lending agent, as the various participating Funds’ lending activity fluctuated, their ratable interest in the joint account, including their ratable exposure to the defaulted or impaired structured investment vehicles fluctuated depending on the relative activity of each participating Fund. In order to eliminate the fluctuation of the various participating Funds’ ratable exposure to the defaulted or impaired structured investment vehicles, the adviser to the Funds recommended to the Board of Trustees, and the Board of Trustees approved, actions designed to fix the allocation of percentage ownership in defaulted or impaired structured investment vehicles among all funds participating in securities lending (“side pocketing”) based on each participating Fund’s percentage ownership of the total cash collateral investment joint account as of the date the fixed allocation is implemented. Accordingly, on February 13, 2009 a side pocketing occurred, which fixed each participating Fund’s ownership of defaulted or impaired structured investment vehicle in the joint account based on each participating Fund’s percentage ownership of the joint account as of such date.
Security transactions and income recognition
Securities transactions are recorded on a trade date basis. Realized gains or losses are reported on the basis of identified cost of securities delivered.
Dividend income is recognized on the ex-dividend date.
Distributions to shareholders
Distributions to shareholders from net investment income and net realized gains, if any, are recorded on the ex-dividend date. Such distributions are determined in conformity with income tax regulations, which may differ from generally accepted accounting principles.
The timing and character of distributions made during the period from net investment income or net realized gains may differ from their ultimate characterization for federal income tax purposes. To the extent that these differences are permanent in nature, such amounts are reclassified within the capital accounts based on their federal tax-basis treatment. Temporary differences do not require reclassifications. At December 31, 2010, as a result of permanent book-to-tax differences, the following reclassification adjustments were made on the Statement of Assets and Liabilities:
| | | | | | | | | | | | | |
| | | | | | | Accumulated Net | | |
| | | | | | | Realized | | |
| | | Undistributed Net | | Losses | | |
| | | Investment Loss | | on Investments | | Paid-in Capital |
| |
| | | $ | 1,839,071 | | | $ | (44,119 | ) | | $ | (1,794,952 | ) |
Federal and other taxes
The Fund intends to continue to qualify as a regulated investment company by distributing substantially all of its investment company taxable income and any net realized capital gains (after reduction for capital loss carryforwards) sufficient to relieve it from all, or substantially all, federal income taxes. Accordingly, no provision for federal income taxes was required.
| | |
| | | |
| 24 Wells Fargo Advantage VT Small Cap Growth Fund | | Notes to Financial Statements |
The Fund’s income and federal excise tax returns and all financial records supporting those returns for the prior three fiscal years are subject to examination by the federal and Delaware revenue authorities.
As of December 31, 2010, the Fund had estimated net capital loss carryforwards, which are available to offset future net realized capital gains, in the amount of $7,648,245 with $374,608 expiring in 2015, $2,685,844 expiring in 2016 and $4,587,793 expiring in 2017.
Under the recently enacted Regulated Investment Company Modernization Act of 2010, the Fund will be permitted to carry forward capital losses incurred in taxable years beginning after December 22, 2010 for an unlimited period. However, any losses incurred during those future taxable years will be required to be utilized prior to the losses incurred in pre-enactment taxable years. As a result of this ordering rule, pre-enactment capital loss carryforwards may be more likely to expire unused. Additionally, post-enactment capital losses that are carried forward will retain their character as either short-term or long-term capital losses rather than being considered all short-term as under previous law.
Class allocations
The separate classes of shares offered by the Fund differ principally in distribution and administration fees. Shareholders of each class bear certain expenses that pertain to that particular class. All shareholders bear the common expenses of the Fund, earn income from the portfolio, and are allocated unrealized gains and losses pro rata based on the average daily net assets of each class, without distinction between share classes. Dividends are determined separately for each class based on income and expenses allocable to each class. Realized gains and losses are allocated to each class pro rata based upon the net assets of each class on the date realized. Differences in per share dividend rates generally result from the relative weightings of pro rata income and realized gain allocations and from differences in separate class expenses, including distribution and administration fees.
3. FAIR VALUATION MEASUREMENTS
Fair value measurements of investments are determined within a framework that has established a fair value hierarchy based upon the various data inputs utilized in determining the value of the Fund’s investments. The three-level hierarchy gives the highest priority to unadjusted quoted prices in active markets for identical assets or liabilities (Level 1) and the lowest priority to unobservable inputs (Level 3). The Fund’s investments are classified within the fair value hierarchy based on the lowest level of input that is significant to the fair value measurement. The inputs are summarized into three broad levels as follows:
| • | | Level 1 – quoted prices in active markets for identical securities |
| |
| • | | Level 2 – other significant observable inputs (including quoted prices for similar securities, interest rates, prepayment speeds, credit risk, etc.) |
| |
| • | | Level 3 – significant unobservable inputs (including the Fund’s own assumptions in determining the fair value of investments) |
The inputs or methodologies used for valuing securities are not necessarily an indication of the risk associated with investing in those securities.
As of December 31, 2010, the inputs used in valuing the Fund’s assets, which are carried at fair value, were as follows:
| | | | | | | | | | | | | | | | | |
| | | | | | | Significant Other | | | Significant | | | | |
| | | | | | | Observable | | | Unobservable | | | | |
| | | Quoted Prices | | | Inputs | | | Inputs | | | | |
| Investments in Securities | | (Level 1) | | | (Level 2) | | | (Level 3) | | | Total | |
| |
Equity securities | | | | | | | | | | | | | | | | |
Common stocks | | $ | 277,772,656 | | | $ | 0 | | | $ | 0 | | | $ | 277,772,656 | |
Short-term investments | | | | | | | | | | | | | | | | |
Corporate bonds and notes | | | 0 | | | | 0 | | | | 1,102,424 | | | | 1,102,424 | |
Investment companies | | | 14,673,852 | | | | 52,136,082 | | | | 0 | | | | 66,809,934 | |
Total | | $ | 292,446,508 | | | $ | 52,136,082 | | | $ | 1,102,424 | | | $ | 345,685,014 | |
Further details on the major security types listed above can be found in the Fund’s Portfolio of Investments.
| | |
| | | |
| Notes to Financial Statements | | Wells Fargo Advantage VT Small Cap Growth Fund 25 |
The following is a reconciliation of assets in which significant unobservable inputs (Level 3) were used in determining fair value:
| | | | | |
| | | Corporate | |
| | | bonds and notes | |
| |
Balance as of December 31, 2009 | | $ | 1,168,890 | |
| Realized gains (losses) | | | 0 | |
| Change in unrealized gains (losses) | | | 267,603 | |
| Purchases | | | 0 | |
| Sales | | | (334,069 | ) |
| Transfers into Level 3 | | | 0 | |
| Transfers out of Level 3 | | | 0 | |
Balance as of December 31, 2010 | | $ | 1,102,424 | |
Change in unrealized gains (losses) included in earnings relating to securities still held at December 31, 2010 | | $ | 83,123 | |
4. TRANSACTIONS WITH AFFILIATES AND OTHER EXPENSES
Investment advisory fees
The Trust has entered into an investment advisory contract with Funds Management, an indirect wholly owned subsidiary of Wells Fargo & Company (“Wells Fargo”). The investment adviser is responsible for implementing investment policies and guidelines and for supervising the investment sub-adviser, who is responsible for day-to-day portfolio management of the Fund.
Pursuant to the contract, Funds Management is paid an annual investment advisory fee starting at 0.75% and declining to 0.60% as the average daily net assets of the Fund increase. For the year ended December 31, 2010, the investment advisory fee was equivalent to an annual rate of 0.75% of the Fund’s average daily net assets.
Funds Management may retain the services of certain investment sub-advisers to provide daily portfolio management to the Fund. The fees related to investment sub-advisory services are borne directly by the investment adviser and do not increase the overall fees paid by the Fund to the investment adviser. Wells Capital Management, an affiliate of Funds Management, is the investment sub-adviser to the Fund and is paid a fee by the investment adviser at an annual rate starting at 0.55% and declining to 0.40% as the average daily net assets of the Fund increase.
Administration and transfer agent fees
The Trust has entered into an Administration Agreement with Funds Management. Under this Agreement, for providing administrative services, which includes paying fees and expenses for services provided by the transfer agent, sub-transfer agents, omnibus account servicers and record-keepers, Funds Management is entitled to receive the following annual fees:
| | | | | | | | | |
| | | | | | | Administration Fees | |
| | | | | | | (% of Average | |
| | | Average Daily Net Assets | | | Daily Net Assets) | |
| |
| Fund level | | First $5 billion | | | 0.05 | % |
| | | Next $5 billion | | | 0.04 | |
| | | Over $10 billion | | | 0.03 | |
| Class 1 and Class 2 | | All asset levels | | | 0.08 | |
Prior to July 19, 2010, Funds Management received from the Fund, for its existing class, an annual fee which started at 0.16% and declined to 0.14% as the average daily net assets of the Fund increased.
Funds Management has contractually waived and/or reimbursed investment advisory and administration fees to the extent necessary to maintain certain net operating expense ratios for the Fund. Waiver of fees and/or reimbursement of expenses by Funds Management were made first from fund level expenses on a proportionate basis and then from class specific expenses.
| | |
| | | |
| 26 Wells Fargo Advantage VT Small Cap Growth Fund | | Notes to Financial Statements |
Distribution fees
The Trust has adopted a Distribution Plan for Class 2 shares of the Fund pursuant to Rule 12b-1 under the 1940 Act. Distribution fees are charged to the Class 2 shares and paid to Wells Fargo Funds Distributor, LLC, the principal underwriter, at an annual rate of 0.25% of its average daily net assets.
5. INVESTMENT PORTFOLIO TRANSACTIONS
Purchases and sales of investments, exclusive of short-term securities (securities with maturities of one year or less at purchase date) for the year ended December 31, 2010, were $157,063,581 and $166,533,135 respectively.
6. ACQUISITION
After the close of business on July 16, 2010, the Fund acquired the net assets of Evergreen VA Growth Fund and renamed its existing shares as Class 2 shares. The purpose of the transaction was to combine two funds with similar investment objectives and strategies. Shareholders holding Class 1 and Class 2 shares of Evergreen VA Growth Fund received Class 1 and Class 2 shares of the Fund in the reorganization. The acquisition was accomplished by a tax-free exchange of all of the shares of Evergreen VA Growth Fund for 6,990,848 shares of the Fund valued at $43,795,570 at an exchange ratio of 1.82 and 1.78 for Class 1 and Class 2 shares, respectively. The investment portfolio of Evergreen VA Growth Fund with a fair value of $43,824,635, identified cost of $43,592,498 and unrealized gains of $232,137 at July 16, 2010 were the principal assets acquired by the Fund. The aggregate net assets of Evergreen VA Growth Fund and the Fund immediately prior to the acquisition were $43,795,570 and $198,568,568, respectively. The aggregate net assets of the Fund immediately after the acquisition were $242,364,138. For financial reporting purposes, assets received and shares issued by the Fund were recorded at fair value; however, the cost basis of the investments received from Evergreen VA Growth Fund was carried forward to align ongoing reporting of the Fund’s realized and unrealized gains and losses with amounts distributable to shareholders for tax purposes.
Assuming the acquisition had been completed January 1, 2010, the beginning of the annual reporting period for the Fund, the pro forma results of operations for the year ended December 31, 2010 would have been:
| | | | | |
|
Net investment loss | | $ | (2,025,264 | ) |
Net realized and unrealized gains on investments | | $ | 61,432,964 | |
Net increase in net assets resulting from operations | | $ | 59,407,700 | |
Because the combined investment portfolios have been managed as a single integrated portfolio since the acquisition was completed, it is not practicable to separate the amounts of revenue and earnings of Evergreen VA Growth Fund that have been included in the Fund’s Statement of Operations since July 19, 2010.
7. BANK BORROWINGS
The Trust and Wells Fargo Funds Trust (excluding the money market funds) are parties to a $125,000,000 revolving credit agreement with State Street Bank and Trust Company, whereby the Fund is permitted to use bank borrowings for temporary or emergency purposes, such as to fund shareholder redemption requests. Interest under the credit agreement is charged to the Fund based on a borrowing rate equal to the higher of the Federal Funds rate in effect on that day plus 1.25% or the overnight LIBOR rate in effect on that day plus 1.25%. In addition, under the credit agreement, the Fund pays an annual commitment fee equal to 0.125% of the unused balance, which is allocated pro rata. Prior to September 7, 2010, the annual commitment fee paid by the Fund was 0.15% of the unused balance.
For the year ended December 31, 2010, there were no borrowings by the Fund under the agreement.
8. DISTRIBUTIONS TO SHAREHOLDERS
As of December 31, 2010, the components of distributable earnings on a tax basis were as follows:
| | | | | | | | | |
| | | Unrealized | | Capital Loss |
| | | Gains | | Carryforward |
| |
| | | $ | 39,526,904 | | | $ | (7,648,245 | ) |
| | |
| | | |
| Notes to Financial Statements | | Wells Fargo Advantage VT Small Cap Growth Fund 27 |
9. INDEMNIFICATION
Under the Trust’s organizational documents, the officers and directors are indemnified against certain liabilities that may arise out of performance of their duties to the Trust. Additionally, in the normal course of business, the Trust may enter into contracts with service providers that contain a variety of indemnification clauses. The Trust’s maximum exposure under these arrangements is dependent on future claims that may be made against the Fund and, therefore, cannot be estimated.
| | |
| | | |
| 28 Wells Fargo Advantage VT Small Cap Growth Fund | | Report of Independent Registered Public Accounting Firm |
BOARD OF TRUSTEES AND SHAREHOLDERS OF
WELLS FARGO VARIABLE TRUST:
We have audited the accompanying statement of assets and liabilities, including the portfolio of investments, of the Wells Fargo Advantage VT Small Cap Growth Fund (the “Fund”), one of the funds constituting the Wells Fargo Variable Trust, as of December 31, 2010, and the related statement of operations for the year then ended, statements of changes in net assets for each of the years in the two year period then ended, and the financial highlights for the years or periods presented. These financial statements and financial highlights are the responsibility of the Fund’s management. Our responsibility is to express an opinion on these financial statements and financial highlights based on our audits.
We conducted our audits in accordance with the standards of the Public Company Accounting Oversight Board (United States). Those standards require that we plan and perform the audit to obtain reasonable assurance about whether the financial statements and financial highlights are free of material misstatement. An audit includes examining, on a test basis, evidence supporting the amounts and disclosures in the financial statements. Our procedures included confirmation of securities owned as of December 31, 2010, by correspondence with custodian and brokers, or by other appropriate auditing procedures. An audit also includes assessing the accounting principles used and significant estimates made by management, as well as evaluating the overall financial statement presentation. We believe that our audits provide a reasonable basis for our opinion.
In our opinion, the financial statements and financial highlights referred to above present fairly, in all material respects, the financial position of the Wells Fargo Advantage VT Small Cap Growth Fund as of December 31, 2010, the results of its operations for the year then ended, changes in its net assets for each of the years in the two year period then ended, and the financial highlights for the years or periods presented, in conformity with U.S. generally accepted accounting principles.
Boston, Massachusetts
February 25, 2011
| | |
| | | |
| Other Information (Unaudited) | | Wells Fargo Advantage VT Small Cap Growth Fund 29 |
PROXY VOTING INFORMATION
A description of the policies and procedures that the Fund uses to determine how to vote proxies relating to portfolio securities is available without charge, upon request, by calling 1-800-222-8222, visiting our Web site at www.wellsfargo.com/advantagefunds, or visiting the SEC Web site at www.sec.gov. Information regarding how the Fund voted proxies relating to portfolio securities during the most recent 12-month period ended June 30 is available without charge on the Fund’s Web site at www.wellsfargo.com/advantagefunds or by visiting the SEC Web site at www.sec.gov.
| | |
| 30 Wells Fargo Advantage VT Small Cap Growth Fund | | Other Information (Unaudited) |
PORTFOLIO HOLDINGS INFORMATION
The complete portfolio holdings for the Fund are publicly available on the Fund’s Web site (www.wellsfargo.com/advantagefunds) on a monthly, 30-day or more delayed basis. In addition, top ten holdings information for the Fund is publicly available on the Fund’s Web site on a monthly, seven-day or more delayed basis. The Fund files its complete schedule of portfolio holdings with the SEC for the first and third quarters of each fiscal year on Form N-Q, which is available without charge by visiting the SEC Web site at www.sec.gov. In addition, the Fund’s Form N-Q may be reviewed and copied at the SEC’s Public Reference Room in Washington, DC, and at regional offices in New York City, at 233 Broadway, and in Chicago, at 175 West Jackson Boulevard, Suite 900. Information about the Public Reference Room may be obtained by calling 1-800-SEC-0330.
BOARD OF TRUSTEES
The following table provides basic information about the Board of Trustees (the “Trustees”) of the Wells Fargo Variable Trust (the “Trust”) and Officers of the Trust. This table should be read in conjunction with the Prospectus and the Statement of Additional Information1 of the Fund. Each of the Trustees and Officers listed below acts in identical capacities for the Wells Fargo Advantage family of funds, which consists of 152 funds comprising the Trust, Wells Fargo Funds Trust, Wells Fargo Master Trust and four closed-end funds (collectively the “Fund Complex”). All of the Trustees are also Members of the Audit and Governance Committees of each Trust in the Fund Complex. The mailing address of each Trustee and Officer is 525 Market Street, 12th Floor, San Francisco, CA 94105. Each Trustee and Officer serves an indefinite term, however, each Trustee serves such term until reaching the mandatory retirement age established by the Trustees.
Independent Trustees
| | | | | | | |
| Name and | | Position Held and | | | | |
| Year of Birth | | Length of Service | | Principal Occupations During Past Five Years | | Other Directorships |
| |
Peter G. Gordon
(Born 1942) | | Trustee, since 1998; Chairman, since 2005 (Lead Trustee since 2001) | | Co-Founder, Chairman, President and CEO of Crystal Geyser. Water Company. Trustee Emeritus, Colby College | | Asset Allocation
Trust |
| | | | | | | |
Isaiah Harris, Jr.
(Born 1952) | | Trustee, since 2009 | | Retired. Prior thereto, President and CEO of BellSouth Advertising and Publishing Corp. from 2005 to 2007, President and CEO of BellSouth Enterprises from 2004 to 2005 and President of BellSouth Consumer Services from 2000 to 2003. Emeritus member of the Iowa State University Foundation Board of Governors. Emeritus Member of the Advisory Board of Iowa State University School of Business. Mr. Harris is a certified public accountant. | | CIGNA Corporation; Deluxe Corporation; Asset Allocation Trust |
| | | | | | | |
Judith M. Johnson
(Born 1949) | | Trustee, since 2008 | | Retired. Prior thereto, Chief Executive Officer and Chief Investment Officer of Minneapolis Employees Retirement Fund from 1996 to 2008 Ms. Johnson is an attorney, certified public accountant and a certified managerial accountant. | | Asset Allocation
Trust |
| | | | | | | |
Leroy Keith, Jr.
(Born 1939) | | Trustee, since 2010 | | Chairman, Bloc Global Services (development and construction), Trustee of the Evergreen Funds from 1983 to 2010. Former Managing Director, Almanac Capital Management (commodities firm), former Partner, Stonington Partners, Inc. (private equity fund), former Director, Obagi Medical Products Co. and former Director, Lincoln Educational Services. | | Trustee, Virtus Fund Complex (consisting of 45 portfolios as of 12/31/10); Director, Diversapack Co. (packaging company); Asset Allocation Trust |
| | | | | | | |
David F. Larcker
(Born 1951) | | Trustee, since 2009 | | James Irvin Miller Professor of Accounting at the Graduate School of Business, Stanford University, Director of Corporate Governance Research Program and Co-Director of The Rock Center for Corporate Governance since 2006. From 2005 to 2008, Professor of Accounting at the Graduate School of Business, Stanford University. Prior thereto, Ernst & Young Professor of Accounting at The Wharton School, University of Pennsylvania from 1985 to 2005. | | Asset Allocation Trust |
| | |
| Other Information (Unaudited) | | Wells Fargo Advantage VT Small Cap Growth Fund 31 |
| | | | | | | |
| Name and | | Position Held and | | | | |
| Year of Birth | | Length of Service | | Principal Occupations During Past Five Years | | Other Directorships |
| |
Olivia S. Mitchell
(Born 1953) | | Trustee, since 2006 | | International Foundation of Employee Benefit Plans Professor and Chair of the Department of Insurance and Risk Management, Wharton School of the University of Pennsylvania since 1993. Director of Wharton’s Pension Research Council and Boettner Center on Pensions & Retirement Research, and Research Associate at the National Bureau of Economic Research. Previously, Cornell University Professor from 1978 to 1993. | | Asset Allocation Trust |
| | | | | | | |
Timothy J. Penny
(Born 1951) | | Trustee, since 1996 | | President and CEO of Southern Minnesota Initiative Foundation, a non-profit organization, since 2007 and Senior Fellow at the Humphrey Institute Policy Forum at the University of Minnesota since 1995. Member of the Board of Trustees of NorthStar Education Finance, Inc., a non-profit organization, since 2007. | | Asset Allocation Trust |
| | | | | | | |
Michael S. Scofield
(Born 1943) | | Trustee, since 2010 | | Currently serves on the Investment Company Institute’s Board of Governors and Executive Committee as well the Independent Director’s Counsel Board of Governors and Executive Committee. Former Chairman of the Independent Directors Counsel. Trustee of the Evergreen Funds from 1984 to 2010. Retired Attorney, Law Offices of Michael S. Scofield and former Director and Chairman, Branded Media Corporation (multi-media branding company). | | Asset Allocation Trust |
| | | | | | | |
Donald C. Willeke
(Born 1940) | | Trustee, since 1996 | | Principal of the law firm of Willeke & Daniels. General Counsel of the Minneapolis Employees Retirement Fund from 1984 until its consolidation into the Minnesota Public Employees Retirement Association on June 30, 2010. | | Asset Allocation Trust |
Officers
| | | | | | | |
| Name and | | Position Held and | | | | |
| Year of Birth | | Length of Service | | Principal Occupations During Past Five Years | | |
| |
Karla M. Rabusch
(Born 1959) | | President, since 2003 | | Executive Vice President of Wells Fargo Bank, N.A. and President of Wells Fargo Funds Management, LLC since 2003. Senior Vice President and Chief Administrative Officer of Wells Fargo Funds Management, LLC from 2001 to 2003. | | |
| | | | | | | |
C. David Messman
(Born 1960) | | Secretary, since 2000; Chief Legal Counsel, since 2003 | | Senior Vice President and Secretary of Wells Fargo Funds Management, LLC since 2001. Vice President and Managing Counsel of Wells Fargo Bank, N.A. since 1996. | | |
| | | | | | | |
Kasey Phillips
(Born 1970) | | Treasurer, since 2009 | | Senior Vice President of Wells Fargo Funds Management, LLC since 2009. Senior Vice President of Evergreen Investment Management Company, LLC from 2006 to 2010. Treasurer of the Evergreen Funds from 2005 to 2010. Vice President and Assistant Vice President of Evergreen Investment Services, Inc. from 1999 to 2006. | | |
| | | | | | | |
David Berardi
(Born 1975) | | Assistant Treasurer, since 2009 | | Vice President of Wells Fargo Funds Management, LLC since 2009. Vice President of Evergreen Investment Management Company, LLC from 2008 to 2010. Assistant Vice President of Evergreen Investment Services, Inc. from 2004 to 2008. Manager of Fund Reporting and Control for Evergreen Investment Management Company, LLC from 2004 to 2010. | | |
| | | | | | | |
Jeremy DePalma
(Born 1974) | | Assistant Treasurer, since 2009 | | Senior Vice President of Wells Fargo Funds Management, LLC since 2009. Senior Vice President of Evergreen Investment Management Company, LLC from 2008 to 2010. Vice President, Evergreen Investment Services, Inc. from 2004 to 2007. Assistant Vice President, Evergreen Investment Services, Inc. from 2000 to 2004 and the head of the Fund Reporting and Control Team within Fund Administration from 2005 to 2010. | | |
| | | | | | | |
| | |
| 32 Wells Fargo Advantage VT Small Cap Growth Fund | | Other Information (Unaudited) |
| | | | | | | |
| Name and | | Position Held and | | | | |
| Year of Birth | | Length of Service | | Principal Occupations During Past Five Years | | |
| |
Debra Ann Early
(Born 1964) | | Chief Compliance Officer,
since 2007 | | Chief Compliance Officer of Wells Fargo Funds Management, LLC since 2007. Chief Compliance Officer of Parnassus Investments from 2005 to 2007. Chief Financial Officer of Parnassus Investments from 2004 to 2007 and Senior Audit Manager of PricewaterhouseCoopers LLP from 1998 to 2004. | | |
| | |
| 1. | | The Statement of Additional Information includes additional information about the Fund’s Trustees and is available, without charge, upon request, by calling 1-800-222-8222 or by visiting the Fund’s Web site at www.wellsfargo.com/advantagefunds. |
| | |
| List of Abbreviations | | Wells Fargo Advantage VT Small Cap Growth Fund 33 |
The following is a list of common abbreviations for terms and entities which may have appeared in this report.
| | | | | |
|
| ABAG | | — | | Association of Bay Area Governments |
| ADR | | — | | American Depositary Receipt |
| ADS | | — | | American Depository Shares |
| AMBAC | | — | | American Municipal Bond Assurance Corporation |
| AMT | | — | | Alternative Minimum Tax |
| ARM | | — | | Adjustable Rate Mortgages |
| AUD | | — | | Australian Dollar |
| BART | | — | | Bay Area Rapid Transit |
| BRL | | — | | Brazil Real |
| CAD | | — | | Canadian Dollar |
| CDA | | — | | Community Development Authority |
| CDO | | — | | Collateralized Debt Obligation |
| CDSC | | — | | Contingent Deferred Sales Charge |
| CGIC | | — | | Capital Guaranty Insurance Company |
| CGY | | — | | Capital Guaranty Corporation |
| CHF | | — | | Swiss Franc |
| CIFG | | — | | CDC (Caisse des Dépôts et Consignations) IXIS Financial Guarantee |
| COP | | — | | Certificate of Participation |
| CP | | — | | Commercial Paper |
| CTF | | — | | Common Trust Fund |
| DEM | | — | | Deutsche Mark |
| DKK | | — | | Danish Krone |
| DW&P | | — | | Department of Water & Power |
| DWR | | — | | Department of Water Resources |
| ECFA | | — | | Educational & Cultural Facilities Authority |
| EDFA | | — | | Economic Development Finance Authority |
| ETET | | — | | Eagle Tax-Exempt Trust |
| ETF | | — | | Exchange-Traded Fund |
| EUR | | — | | Euro |
| FFCB | | — | | Federal Farm Credit Bank |
| FGIC | | — | | Financial Guaranty Insurance Corporation |
| FHA | | — | | Federal Housing Authority |
| FHAG | | — | | Federal Housing Agency |
| FHLB | | — | | Federal Home Loan Bank |
| FHLMC | | — | | Federal Home Loan Mortgage Corporation |
| FNMA | | — | | Federal National Mortgage Association |
| FRF | | — | | French Franc |
| FSA | | — | | Farm Service Agency |
| GBP | | — | | Great British Pound |
| GDR | | — | | Global Depositary Receipt |
| GNMA | | — | | Government National Mortgage Association |
| GO | | — | | General Obligation |
| HCFR | | — | | Healthcare Facilities Revenue |
| HEFA | | — | | Health & Educational Facilities Authority |
| HEFAR | | — | | Higher Education Facilities Authority Revenue |
| HFA | | — | | Housing Finance Authority |
| HFFA | | — | | Health Facilities Financing Authority |
| HKD | | — | | Hong Kong Dollar |
| HUD | | — | | Housing & Urban Development |
| | | | | |
|
| HUF | | — | | Hungarian Forint |
| IDA | | — | | Industrial Development Authority |
| IDAG | | — | | Industrial Development Agency |
| IDR | | — | | Industrial Development Revenue |
| IEP | | — | | Irish Pound |
| JPY | | — | | Japanese Yen |
| KRW | | — | | Republic of Korea Won |
| LIBOR | | — | | London Interbank Offered Rate |
| LLC | | — | | Limited Liability Company |
| LLP | | — | | Limited Liability Partnership |
| LOC | | — | | Letter of Credit |
| LP | | — | | Limited Partnership |
| MBIA | | — | | Municipal Bond Insurance Association |
| MFHR | | — | | Multi-Family Housing Revenue |
| MFMR | | — | | Multi-Family Mortgage Revenue |
| MMD | | — | | Municipal Market Data |
| MTN | | — | | Medium Term Note |
| MUD | | — | | Municipal Utility District |
| MXN | | — | | Mexican Peso |
| MYR | | — | | Malaysian Ringgit |
| NATL-RE | | — | | National Public Finance Guarantee Corporation |
| NLG | | — | | Netherlands Guilder |
| NOK | | — | | Norwegian Krone |
| NZD | | — | | New Zealand Dollar |
| PCFA | | — | | Pollution Control Finance Authority |
| PCR | | — | | Pollution Control Revenue |
| PFA | | — | | Public Finance Authority |
| PFFA | | — | | Public Facilities Financing Authority |
| plc | | — | | Public Limited Company |
| PLN | | — | | Polish Zloty |
| PSFG | | — | | Public School Fund Guaranty |
| R&D | | — | | Research & Development |
| RDA | | — | | Redevelopment Authority |
| RDFA | | — | | Redevelopment Finance Authority |
| REITS | | — | | Real Estate Investment Trusts |
| SEK | | — | | Swedish Krona |
| SFHR | | — | | Single Family Housing Revenue |
| SFMR | | — | | Single Family Mortgage Revenue |
| SGD | | — | | Singapore Dollar |
| SKK | | — | | Slovakian Koruna |
| SLMA | | — | | Student Loan Marketing Association |
| SPDR | | — | | Standard & Poor’s Depositary Receipts |
| STIT | | — | | Short-Term Investment Trust |
| TBA | | — | | To Be Announced |
| TRAN | | — | | Tax Revenue Anticipation Notes |
| TRY | | — | | Turkish Lira |
| USD | | — | | United States Dollar |
| XLCA | | — | | XL Capital Assurance |
| ZAR | | — | | South African Rand |
This page is intentionally left blank.
More information about Wells Fargo Advantage Funds is available free upon request. To obtain literature, please write, e-mail, visit the Funds’ Web site, or call:
Wells Fargo Advantage Funds
P.O. Box 8266
Boston, MA 02266-8266
E-mail: wfaf@wellsfargo.com
Web site: www.wellsfargo.com/advantagefunds
Individual Investors: 1-800-222-8222
Retail Investment Professionals: 1-888-877-9275
Institutional Investment Professionals: 1-866-765-0778
This report and the financial statements contained herein are submitted for the general information of the shareholders of Wells Fargo Advantage Funds. If this report is used for promotional purposes, distribution of the report must be accompanied or preceded by a current prospectus. For a prospectus containing more complete information, including charges and expenses, call 1-800-222-8222 or visit the Fund’s Web site at www.wellsfargo.com/advantagefunds. Please consider the investment objectives, risks, charges, and expenses of the investment carefully before investing. This and other information about Wells Fargo Advantage Funds can be found in the current prospectus. Read the prospectus carefully before you invest or send money.
Wells Fargo Funds Management, LLC, a wholly owned subsidiary of Wells Fargo & Company, provides investment advisory and administrative services for Wells Fargo Advantage Funds. Other affiliates of Wells Fargo & Company provide subadvisory and other services for the Funds. The Funds are distributed by Wells Fargo Funds Distributor, LLC, Member FINRA/SIPC, an affiliate of Wells Fargo & Company.
NOT FDIC INSURED • NO BANK GUARANTEE • MAY LOSE VALUE
| | | | | |
|
© 2011 Wells Fargo Funds Management, LLC. All rights reserved. | | www.wellsfargo.com/advantagefunds | | 200919 02-11 |
| | | | | AVT7/AR153 12-10 |
WELLS FARGO ADVANTAGE VARIABLE TRUST FUNDS
| |
| | • | | Wells Fargo Advantage VT Small Cap Value Fund |
| |
| | | | (formerly Wells Fargo Advantage VT Small/Mid Cap Value Fund) |
Reduce clutter. Save trees.
Sign up for electronic delivery of prospectuses and shareholder reports at www.wellsfargo.com/advantagedelivery
| | | | | |
| Contents | | | | |
| | | 2 | |
| | | 6 | |
| | | 10 | |
| | | 11 | |
Financial Statements | | | | |
| | | 17 | |
| | | 18 | |
| | | 19 | |
| | | 20 | |
| | | 22 | |
| | | 28 | |
| | | 29 | |
| | | 33 | |
The views expressed are as of December 31, 2010, and are those of the Fund managers. Any reference to a specific security in this report is not a recommendation to purchase or sell any specific security or adopt any investment strategy. The views are subject to change at any time in response to changing circumstances in the market and are not intended to predict or guarantee the future performance of any individual security, market sector or the markets generally, or the Wells Fargo Advantage VT Small Cap Value Fund.
NOT FDIC INSURED • INSURED • NO BANK GUARENTEE • MAY LOSE VALUE

| | | |
|
| WELLS FARGO |
| | | INVESTMENT HISTORY |
| | | |
1932 | | Keystone creates one of the first mutual fund families. |
| | | |
1971 | | Wells Fargo & Company introduces one of the first institutional index funds. |
| | | |
1978 | | Wells Fargo applies Markowitz and Sharpe’s research on Modern Portfolio Theory to introduce one of the industry’s first Tactical Asset Allocation (TAA) models in institutional separately managed accounts. |
| | | |
1984 | | Wells Fargo Stagecoach Funds launches its first asset allocation fund. |
| | | |
1989 | | The Tactical Asset Allocation (TAA) Model is first applied to Wells Fargo’s asset allocation mutual funds. |
| | | |
1994 | | Wells Fargo introduces the LifePath Funds, one of the first suites of target date funds (now the Wells Fargo Advantage Dow Jones Target Date FundsSM). |
| | | |
1996 | | Evergreen Investments and Keystone Funds merge. |
| | | |
1997 | | Wells Fargo launches Wells Fargo Advantage WealthBuilder PortfoliosSM, a fund-of-funds suite of products that includes the use of quantitative models to shift assets among investment styles. |
| | | |
1999 | | Norwest Advantage Funds and Stagecoach Funds are reorganized into Wells Fargo Funds after the merger of Norwest and Wells Fargo. |
| | | |
2002 | | Evergreen Retail and Evergreen Institutional companies form the umbrella asset management company, Evergreen Investments. |
| | | |
2005 | | The integration of Strong Funds with Wells Fargo Funds creates Wells Fargo Advantage Funds, resulting in one of the top 20 mutual fund companies in the United States. |
| | | |
2006 | | Wells Fargo Advantage Funds relaunches the target date product line as Wells Fargo Advantage Dow Jones Target Date Funds. |
| | | |
2010 | | The mergers and reorganizations of Evergreen and Wells Fargo Advantage mutual funds are completed, unifying the families under the brand of Wells Fargo Advantage Funds. |
Wells Fargo Advantage Funds®
Wells Fargo Advantage Funds skillfully guides institutions, financial advisors, and individuals through the investment terrain to help them reach their financial objectives. Everything we do on behalf of investors is backed by our unique combination of qualifications.
Strength
Our organization is built on the standards of integrity and service established by our parent company—Wells Fargo & Company—more than 150 years ago. And, because we’re part of a highly diversified financial enterprise, we offer the depth of resources to help investors succeed.
Expertise
Our multi-boutique model offers investors access to the independent thinking of premier investment managers that have been chosen for their time-tested strategies. While each team specializes in a specific investment strategy, collectively they provide investors a wide choice of distinct investment styles. Our dedication to investment excellence doesn’t end with our expertise in manager selection—risk management, analysis, and rigorous ongoing review seek to ensure each manager’s investment process remains consistent.
Partnership
Our collaborative approach is built around understanding the needs and goals of our clients. By adhering to core principles of sound judgment and steady guidance, we support you through every stage of the investment decision process.
Carefully consider the investment objectives, risks, charges, and expenses before investing. For a current prospectus for Wells Fargo Advantage Funds containing this and other information, visit wellsfargo.com/advantagefunds. Read it carefully before investing.
Wells Fargo Funds Management, LLC, a wholly owned subsidiary of Wells Fargo & Company, provides investment advisory and administrative services for Wells Fargo Advantage Funds®. Other affiliates of Wells Fargo & Company provide subadvisory and other services for the Funds. The Funds are distributed by Wells Fargo Funds Distributor, LLC, Member FINRA/SIPC, an affiliate of Wells Fargo & Company.
The “Dow Jones Target Date Indexes” are a product of Dow Jones Indexes, a licensed trademark of CME Group Index Services LLC (“CME”). “Dow Jones” and “Dow Jones Target Date Indexes” are service marks of Dow Jones Trademark Holdings, LLC, and have been licensed for use for certain purposes by CME and sublicensed for use by Global Index Advisors, Inc., and Wells Fargo Funds Management, LLC. The Dow Jones Target Date Indexes are based in part on the Barclays Capital Bond Indexes, which are published by Barclays Capital Inc. The Wells Fargo Advantage Dow Jones Target Date Funds, based on the Dow Jones Target Date Indexes, are not sponsored, endorsed, sold, or promoted by Dow Jones, CME or Barclays Capital or any of their respective affiliates, and neither Dow Jones, CME nor Barclays Capital nor any of their respective affiliates makes any representation regarding the advisability of investing in such product(s) and/or about the quality, accuracy, and/or completeness of the Dow Jones Target Date Indexes or the Barclays Capital Bond Indexes. IN NO EVENT SHALL DOW JONES, CME, BARCLAYS CAPITAL, OR ANY OF THEIR LICENSORS HAVE ANY LIABILITY FOR ANY SPECIAL, PUNITIVE, INDIRECT, OR CONSEQUENTIAL DAMAGES (INCLUDING LOST PROFITS), EVEN IF NOTIFIED OF THE POSSIBILITY OF SUCH DAMAGES.
NOT FDIC INSURED • INSURED • NO BANK GUARENTEE • MAY LOSE VALUE
Not part of the annual report.
Wells Fargo Advantage Funds offers more than 120 mutual funds across a wide range of asset classes, representing over $236 billion in assets under management, as of December 31, 2010.
| | | | | |
|
Equity Funds | | | | |
| Asia Pacific Fund | | Enterprise Fund† | | Opportunity Fund† |
| C&B Large Cap Value Fund | | Equity Value Fund | | Precious Metals Fund |
| C&B Mid Cap Value Fund | | Global Opportunities Fund | | Premier Large Company Growth Fund |
| Capital Growth Fund | | Growth Fund | | Small Cap Growth Fund |
| Classic Value Fund | | Growth Opportunities Fund | | Small Cap Opportunities Fund |
| Common Stock Fund | | Health Care Fund | | Small Cap Value Fund |
| Core Equity Fund | | Index Fund | | Small Company Growth Fund |
| Disciplined Global Equity Fund | | International Equity Fund | | Small Company Value Fund |
| Disciplined U.S. Core Fund | | International Value Fund | | Small/Mid Cap Core Fund |
| Disciplined Value Fund | | Intrinsic Small Cap Value Fund | | Small/Mid Cap Value Fund |
Discovery Fund† | | Intrinsic Value Fund | | Social Sustainability Fund† |
| Diversified Equity Fund | | Intrinsic World Equity Fund | | Special Mid Cap Value Fund |
| Diversified International Fund | | Large Cap Core Fund | | Special Small Cap Value Fund |
| Diversified Small Cap Fund | | Large Cap Growth Fund | | Specialized Technology Fund |
| Emerging Growth Fund | | Large Company Value Fund | | Strategic Large Cap Growth Fund |
| Emerging Markets Equity Fund | | Mid Cap Growth Fund | | Traditional Small Cap Growth Fund |
Endeavor Select Fund† | | Omega Growth Fund | | Utility and Telecommunications Fund |
| | | | | |
Bond Funds | | | | |
| Adjustable Rate Government Fund | | Inflation-Protected Bond Fund | | Short-Term Bond Fund |
| California Limited-Term Tax-Free Fund | | Intermediate Tax/AMT-Free Fund | | Short-Term High Yield Bond Fund |
| California Tax-Free Fund | | International Bond Fund | | Short-Term Municipal Bond Fund |
| Colorado Tax-Free Fund | | Minnesota Tax-Free Fund | | Strategic Municipal Bond Fund |
| Government Securities Fund | | Municipal Bond Fund | | Total Return Bond Fund |
| High Income Fund | | North Carolina Tax-Free Fund | | Ultra Short-Term Income Fund |
| High Yield Bond Fund | | Pennsylvania Tax-Free Fund | | Ultra Short-Term Municipal Income Fund |
| Income Plus Fund | | Short Duration Government Bond Fund | | Wisconsin Tax-Free Fund |
| | | | | |
Asset Allocation Funds | | | | |
| Asset Allocation Fund | | WealthBuilder Equity Portfolio† | | Target 2020 Fund† |
| Conservative Allocation Fund | | WealthBuilder Growth Allocation Portfolio† | | Target 2025 Fund† |
| Diversified Capital Builder Fund | | WealthBuilder Growth Balanced Portfolio† | | Target 2030 Fund† |
| Diversified Income Builder Fund | | WealthBuilder Moderate Balanced Portfolio† | | Target 2035 Fund† |
| Growth Balanced Fund | | WealthBuilder Tactical Equity Portfolio† | | Target 2040 Fund† |
| Index Asset Allocation Fund | | Target Today Fund† | | Target 2045 Fund† |
| Moderate Balanced Fund | | Target 2010 Fund† | | Target 2050 Fund† |
WealthBuilder Conservative Allocation Portfolio† | | Target 2015 Fund† | | |
| | | | | |
Money Market Funds | | | | |
| 100% Treasury Money Market Fund | | Minnesota Money Market Fund | | New Jersey Municipal Money Market Fund |
| California Municipal Money Market Fund | | Money Market Fund | | New York Municipal Money Market Fund |
| Cash Investment Money Market Fund | | Municipal Cash Management Money Market Fund | | Pennsylvania Municipal Money Market Fund |
| Government Money Market Fund | | Municipal Money Market Fund | | Prime Investment Money Market Fund |
Heritage Money Market Fund† | | National Tax-Free Money Market Fund | | Treasury Plus Money Market Fund |
| | | | | |
Variable Trust Funds1 | | | | |
| VT Core Equity Fund | | VT Intrinsic Value Fund | | VT Small Cap Value Fund |
VT Discovery Fund† | | VT Omega Growth Fund | | VT Total Return Bond Fund |
| VT Index Asset Allocation Fund | | VT Opportunity Fund† | | |
| VT International Equity Fund | | VT Small Cap Growth Fund | | |
An investment in a money market fund is not insured or guaranteed by the Federal Deposit Insurance Corporation or any other government agency. Although the Wells Fargo Advantage Money Market Funds seek to preserve the value of your investment at $1.00 per share, it is possible to lose money by investing in a money market fund.
| | |
| 1. | | The Variable Trust Funds are generally available only through insurance company variable contracts. |
| |
| † | | In this report, the Wells Fargo Advantage Discovery FundSM, Wells Fargo Advantage Endeavor Select FundSM, Wells Fargo Advantage Enterprise FundSM, Wells Fargo Advantage Opportunity FundSM, Wells Fargo Advantage Social Sustainability FundSM, Wells Fargo Advantage WealthBuilder Conservative Allocation PortfolioSM, Wells Fargo Advantage WealthBuilder Equity PortfolioSM, Wells Fargo Advantage WealthBuilder Growth Allocation PortfolioSM, Wells Fargo Advantage WealthBuilder Growth Balanced PortfolioSM, Wells Fargo Advantage WealthBuilder Moderate Balanced PortfolioSM, Wells Fargo Advantage WealthBuilder Tactical Equity PortfolioSM, Wells Fargo Advantage Dow Jones Target Today FundSM, Wells Fargo Advantage Dow Jones Target 2010 FundSM, Wells Fargo Advantage Dow Jones Target 2015 FundSM, Wells Fargo Advantage Dow Jones Target 2020 FundSM, Wells Fargo Advantage Dow Jones Target 2025 FundSM, Wells Fargo Advantage Dow Jones Target 2030 FundSM, Wells Fargo Advantage Dow Jones Target 2035 FundSM, Wells Fargo Advantage Dow Jones Target 2040 FundSM, Wells Fargo Advantage Dow Jones Target 2045 FundSM, Wells Fargo Advantage Dow Jones Target 2050 FundSM, Wells Fargo Advantage Heritage Money Market FundSM, Wells Fargo Advantage VT Discovery FundSM, and Wells Fargo Advantage VT Opportunity FundSM are referred to as the Discovery Fund, Endeavor Select Fund, Enterprise Fund, Opportunity Fund, Social Sustainability Fund, WealthBuilder Conservative Allocation Portfolio, WealthBuilder Equity Portfolio, WealthBuilder Growth Allocation Portfolio, WealthBuilder Growth Balanced Portfolio, WealthBuilder Moderate Balanced Portfolio, WealthBuilder Tactical Equity Portfolio, Target Today Fund, Target 2010 Fund, Target 2015 Fund, Target 2020 Fund, Target 2025 Fund, Target 2030 Fund, Target 2035 Fund, Target 2040 Fund, Target 2045 Fund, Target 2050 Fund, Heritage Money Market Fund, VT Discovery Fund, and VT Opportunity Fund, respectively. |
Not part of the annual report.
| | |
| | | |
| 2 Wells Fargo Advantage VT Small Cap Value Fund | | Letter to Shareholders |
Karla M. Rubusch,
President
Wells Fargo Advantage Funds
The equity markets delivered strong full-year returns against the backdrop of a strengthening economy.
Dear Valued Shareholder:
We are pleased to provide you with this annual report for the Wells Fargo Advantage VT Small Cap Value Fund for the 12 months that ended December 31, 2010. The equity markets delivered strong full-year returns against the backdrop of a strengthening economy. However, the year was not without its share of macroeconomic challenges and market volatility, once again highlighting the value of a sound, well-diversified investment strategy. As always, we believe that such a strategy can enable investors to balance risks and opportunities as they pursue long-term financial goals in a dynamic market environment.
The economic recovery stayed on track.
The U.S. economic recovery that began in the summer of 2009 gained momentum in 2010, particularly toward the end of the year. Gross domestic product (GDP) grew at an annualized rate of 3.2% in the fourth quarter of 2010—capping a streak of six consecutive quarters of positive GDP growth—and 2.9% for the full year. Although the path of recovery has been uneven at times and growth remains subpar compared with previous recoveries, the general consensus among economists is that the economy will likely avoid a double-dip recession. That said, persistent weakness in the labor and housing markets bears close watching in the months ahead.
Jobs and housing remained troublesome.
At the end of the year, the unemployment rate stood at 9.4%, down from 9.9% a year earlier, but still stubbornly high. Unfortunately, the drop may be attributable more to a decline in the labor force than a meaningful uptick in hiring. In fact, employers added just 1.1 million jobs for all of 2010, suggesting that the improving economy has yet to translate into widespread hiring. Meanwhile, the beleaguered housing market was an ongoing source of concern, despite some tentative late-year signs of stabilization.
Other economic data were more encouraging, reflecting greater confidence in the recovery on the part of both consumers and businesses. Retail sales came in strong at certain points during the year, including the critical holiday shopping season, and industrial production and new orders have picked up. Although still reluctant to hire, businesses have gradually increased spending in other areas, such as equipment and technology. Core inflation, which excludes volatile food and energy prices, remained benign.
The Fed continued to do its part.
With inflation subdued, the Federal Reserve (the Fed) held its target range for the federal funds rate—a proxy for short-term interest rates—steady at 0% to 0.25%. In its final statement of 2010, the Fed noted that economic expansion continues to be restrained by headwinds such as high unemployment, modest income growth, lower housing wealth, and tight credit. As a result, the Fed indicated that it intends to keep short-term rates at historically low levels for as long as needed to promote a more robust recovery.
| | |
| | | |
| Letter to Shareholders | | Wells Fargo Advantage VT Small Cap Value Fund 3 |
The Fed also stated that it plans to proceed with other stimulus measures, including its second round of quantitative easing (QE2)—a plan to purchase $600 billion in long-term Treasury securities by mid-2011. The ‘preannouncement’ of QE2 in the third quarter of 2010 marked a turning point for the equity markets in that it ushered in a favorable shift in investor sentiment. By and large, investors interpreted the plan as further evidence of the Fed’s commitment to avoiding deflation and spurring economic growth.
2010 was another solid year for equities.
QE2 was certainly not the only catalyst for the equity markets during 2010. Along with more upbeat economic data, better-than-expected corporate earnings power played a role in driving stock prices higher. Throughout the year, quarterly earnings per share for the majority of companies in the S&P 500 Index consistently exceeded Wall Street estimates. As 2010 drew to a close, the midterm congressional elections and the extension of the Bush-era tax cuts provided additional tailwinds, helping the markets finish the year on a strong note.
It was the second straight year of double-digit total returns for the broad equity market indexes. The S&P 500 Index and the Dow Jones Industrial Average advanced 15.1% and 14.1%, respectively, while the tech-heavy NASDAQ Composite Index returned 18.2%. Investors were generally rewarded across the market-capitalization spectrum—with small- and mid-cap stocks outpacing large-cap stocks—as well as across most economic sectors. In terms of investment styles, growth stocks outperformed their value counterparts for the year.
To be sure, the gains were hard-earned, as the markets had to contend with numerous issues along the way, including the European sovereign debt crisis, China’s efforts to slow growth, and doubts about the sustainability of the domestic recovery. The second quarter in particular witnessed bouts of heightened market volatility, most notably the so-called “flash crash” in May. As the year progressed, however, volatility—as measured by the Chicago Board Options Exchange Volatility Index—abated amid reduced fears of a double-dip recession.
Investors should keep a long-term perspective.
In our view, the equity markets’ dramatic rebound over the past two years from a severe downturn underscores the importance of maintaining a disciplined, long-term investment strategy through changing market cycles. By staying focused on your long-term goals, you may be better positioned both to navigate falling markets and participate in rising markets.
To help you build a well-diversified strategy based on your personal objectives and risk tolerance, Wells Fargo Advantage Funds® offers more than 120 mutual funds and other investments covering a wide range of asset classes and investment styles. Although diversification cannot guarantee an investment profit or prevent losses, we believe it can be an effective way to manage investment risk and potentially smooth out overall portfolio performance.
Along with more upbeat economic data, better-than-expected corporate earnings power played a role in driving stock prices higher.
| | |
| | | |
| 4 Wells Fargo Advantage VT Small Cap Value Fund | | Letter to Shareholders |
Thank you for choosing Wells Fargo Advantage Funds. We appreciate your continued confidence in us and are committed to helping you meet your financial needs. If you have any questions about your investments, please contact your investment professional, call us at 1-800-222-8222, or visit wellsfargo.com/advantagefunds.
Sincerely,
Karla M. Rabusch
President
Wells Fargo Advantage Funds
This page is intentionally left blank.
| | |
| | | |
| 6 Wells Fargo Advantage VT Small Cap Value Fund | | Performance Highlights (Unaudited) |
Wells Fargo Advantage VT Small Cap Value Fund
INVESTMENT OBJECTIVE
The Fund seeks long-term capital appreciation.
INVESTMENT ADVISER
Wells Fargo Funds Management, LLC
SUB-ADVISER
Wells Capital Management Incorporated
PORTFOLIO MANAGER
I. Charles Rinaldi
FUND INCEPTION
October 10, 1997
PERFORMANCE SUMMARY
| | | | | |
| 12 MONTH TOTAL RETURN AS OF DECEMBER 31, 2010 | | | | |
| |
| Class 2 | | | 17.25 | % |
Russell 2500® Value Index1 | | | 24.82 | % |
Figures quoted represent past performance, which is no guarantee of future results and do not reflect the deduction of taxes that a shareholder may pay on fund distributions or the redemption of fund shares. Investment return and principal value of an investment will fluctuate so that an investor’s shares, when redeemed, may be worth more or less than their original cost. Current performance may be lower or higher than the performance data quoted. Current month-end performance is available by calling 1-866-765-0778. Performance figures of the Fund do not reflect fees charged pursuant to the terms of variable life insurance policies and variable annuity contracts.
The advisor has committed, through April 30, 2011, to waive fees and/or reimburse expenses to maintain the contractual expense cap at 1.14% for the Class 2 shares, excluding acquired fund fees and certain other expenses. Without these reductions, the Fund’s returns would have been lower. The Fund’s net expense ratio is 1.15% for the Class 2 shares. The Fund’s gross expense ratio is 2.57% for the Class 2 shares.
| 1. | | The Russell 2500® Value Index measures the performance of those Russell 2500 companies with lower price-to-book ratios and lower forecasted growth values. You cannot invest directly in an index. |
| |
| 2. | | The chart compares the performance of the Wells Fargo Advantage VT Small Cap Value Fund Class 2 for the most recent ten years of the Fund with the Russell 2500 Value Index. The chart assumes a hypothetical $10,000 investment and reflects all operating expenses of the Fund. |
| | |
| Performance Highlights (Unaudited) | | Wells Fargo Advantage VT Small Cap Value Fund 7 |
Wells Fargo Advantage VT Small Cap Value Fund (continued)
MANAGER’S DISCUSSION
Fund highlights
| • | | The Fund underperformed its benchmark for the 12-month period due to weak stock selection in the consumer discretionary, energy, and materials sectors. |
| |
| • | | While the Fund’s overweight to precious metals companies aided relative results, key holdings in the sector underperformed their peers. |
| |
| • | | Portfolio turnover remained moderate, as we believe that the underlying fundamentals of the Fund’s key holdings are strong, despite short-term underperformance. |
| |
| • | | Tepid economic growth and persistently high unemployment remained key risks for the equity market. |
Weak stock selection in the consumer discretionary, energy, and materials sectors resulted in the Fund’s underperformance for the period.
The 12-month period that ended December 31, 2010, marked a second consecutive year of strong gains for the equity market after the market decline in 2008. All broad-based stock market indexes logged double-digit gains for the period. The Fund ended the period with solid gains but trailed its benchmark, the Russell 2000® Value Index. While 2010 saw plenty of back-and-forth market action, the year ended with four consecutive months of gains, fueled in part by the Federal Reserve’s announcement of a fresh round of quantitative easing.
Consumer discretionary stocks posted strong returns during the period, but the Fund’s holdings did not keep pace. The Fund was underweight to retailers, which had earnings that recovered sharply off of trough levels. Despite retailers’ outperformance, we remain skeptical of the sustainability of their earnings growth over the medium to long term. We believe that consumer deleveraging will unfold over the next several years, which does not auger well for continued strength in the group.
As the economy improved, the price of oil steadily advanced. Energy stocks followed and turned in a solid year. While we had our share of winners, the Fund’s key holding, InterOil Corporation, failed to keep pace after a terrific year in 2009. InterOil is an emerging exploration and production company with assets in Papua New Guinea. The company’s fundamentals improved on several key announcements, but its stock languished. During the 12-month period, the company announced a joint venture with Mitsui Group on a
| | | | | |
| TEN LARGEST EQUITY HOLDINGS3 | | | | |
| (AS OF DECEMBER 31, 2010) | | | | |
| InterOil Corporation | | | 6.94 | % |
| Randgold Resources Limited ADR | | | 5.31 | % |
| Chimera Investment Corporation | | | 3.83 | % |
| McMoRan Exploration Company | | | 2.81 | % |
| Range Resources Corporation | | | 2.30 | % |
| Chicago Bridge and Iron Company NV | | | 2.18 | % |
| United Continental Holdings Incorporated | | | 2.15 | % |
| Agro Group International Holdings Limited | | | 1.60 | % |
| GEO Group Incorporated | | | 1.56 | % |
| Ion Geophysical Corporation | | | 1.43 | % |
| | |
| 3. | | The ten largest equity holdings are calculated based on the value of the securities divided by total investments of the Fund. Holdings are subject to change and may have changed since the date specified. |
| | |
| 8 Wells Fargo Advantage VT Small Cap Value Fund | | Performance Highlights (Unaudited) |
Wells Fargo Advantage VT Small Cap Value Fund (continued)
condensate stripping plant, with Mitsui responsible for financing the entire plant. Mitsui has the option to convert its $550 million investment into a 2.5% interest in the larger liquefied natural gas (LNG) project, with an option to purchase another 2.5%. InterOil also announced an agreement with Energy World Corp. to build a two-million-ton-per-year land-based LNG plant. Final investment decisions for both projects are due in the first half of 2011, setting the stage for InterOil to define the terms with which it can monetize the resources found at the Elk and Antelope natural gas fields. The company has a strong balance sheet and is on the path to monetizing its resources. We believe that the stock will reflect the positive fundamentals in the upcoming year.
With higher gold prices, shares of gold-mining companies generally performed well. The Fund’s overweight to the group aided relative results but was more than offset by weakness in key holding Randgold Resources. Weakness in the West African miner was in part attributable to news related to its Tongon mine in Ivory Coast. Tongon should be a key contributor to the company’s production growth over the next several years. The mine is progressing toward final completion but has yet to reach full production; it is currently operating on a curtailed basis due to delays related to materials. While the political unrest in Ivory Coast hasn’t resulted in security issues at or near the mine, it has affected production schedules and will cause further delays. We believe that the company is financially strong and has multiple assets that should continue to operate. Moreover, CEO Mark Bristow, given his South African roots, seems adept at navigating the political landscape in the region. We have full confidence in Randgold’s prospects as one of the best-positioned companies in the sector.
We remain cautiously optimistic and focused on the long term.
Over the past 12 months, investors’ risk appetite fluctuated based upon macroeconomic events, resulting in seesawing markets. In such environments, we believe it’s prudent to continue to emphasize diversification and to maintain a long-term focus. Looking ahead, we believe there is reason to be optimistic, as corporate profits have rebounded sharply off of depressed levels. However, persistently high unemployment remains a key deterrent to long-term economic recovery.
Our investment process is designed to capture a wide range of investment opportunities. We will typically construct the portfolio using a broad mix of stocks with varying characteristics in an attempt to withstand shifts in the market. We believe that this broad approach to small-cap investing should continue to serve our clients well.
| | |
| 4. | | Sector distribution is subject to change and is calculated based on the total common stock investments of the Fund. |
| | |
| Performance Highlights (Unaudited) | | Wells Fargo Advantage VT Small Cap Value Fund 9 |
Wells Fargo Advantage VT Small Cap Value Fund (continued)
AVERAGE ANNUAL TOTAL RETURN (%) (AS OF DECEMBER 31, 2010)5
| | | | | | | | | | | | | | | | | | | | | | | | | | | | | |
| | | | | | | | | | | | | | | | | | | | | | | Expense Ratios6 | |
| | | Inception Date | | | 6 Months* | | | 1 Year | | | 5 Year | | | 10 Year | | | Gross | | | Net7 | |
| Class 1 | | | 7/16/2010 | | | | 23.37 | | | | 17.38 | | | | 3.68 | | | | 6.08 | | | | 2.29 | % | | | 0.90 | % |
| Class 2 | | | 10/10/1997 | | | | 23.23 | | | | 17.25 | | | | 3.66 | | | | 6.07 | | | | 2.57 | % | | | 1.15 | % |
Russell 2500® Value Index1 | | | | | | | 26.81 | | | | 24.82 | | | | 3.85 | | | | 8.53 | | | | | | | | | |
| | |
| * | | Returns for periods of less than one year are not annualized. |
Figures quoted represent past performance, which is no guarantee of future results and do not reflect the deduction of taxes that a shareholder may pay on fund distributions or the redemption of fund shares. Investment return and principal value of an investment will fluctuate so that an investor’s shares, when redeemed, may be worth more or less than their original cost. Current performance may be lower or higher than the performance data quoted. Current month-end performance is available by calling 1-866-765-0778. Performance figures of the Fund do not reflect fees charged pursuant to the terms of variable life insurance policies and variable annuity contracts.
Stock fund values fluctuate in response to the activities of individual companies and general market and economic conditions. Smaller company stocks tend to be more volatile and less liquid than those of larger companies. The use of derivatives may reduce returns and/or increase volatility. Certain investment strategies tend to increase the total risk of an investment (relative to the broader market). This Fund is exposed to foreign investment risk. Consult the Fund’s prospectus for additional information on these and other risks.
Please refer to the prospectus provided by your participating insurance company for detailed information describing the separate accounts for information regarding surrender charges, mortality and expense risk fees and other charges that may be assessed by the participating insurance companies.
| | |
| 5. | | Performance shown for Class 1 shares prior to its inception reflects the performance of Class 2 shares, and includes the higher expenses applicable to Class 2 shares. If these expenses had not been included, returns would be higher. Effective May 1, 2010, the Fund name changed from the Wells Fargo Advantage VT Small/Mid Cap Value Fund to the Wells Fargo Advantage VT Small Cap Value Fund. |
| |
| 6. | | Reflects the expense ratio as stated in the July 19, 2010 prospectuses. |
| |
| 7. | | The investment adviser has contractually committed through July 18, 2013 to waive fees and/or reimburse expenses to maintain the Fund’s contractual expense ratio for Class 1 shares at 0.89%, and 1.14% through April 30, 2011 for Class 2 shares, excluding acquired fund fees and certain other expenses. Without these reductions, the Fund’s returns would have been lower. |
| | |
| 10 Wells Fargo Advantage VT Small Cap Value Fund | | Fund Expenses (Unaudited) |
As a shareholder of the Fund, you incur two types of costs: (1) transaction costs, including sales charges (loads) on purchase payments, redemption fees (if any) and exchange fees (if any); and (2) ongoing costs, including management fees; distribution (12b-1) and/or shareholder service fees; and other Fund expenses. This example is intended to help you understand your ongoing costs (in dollars) of investing in the Fund and to compare these costs with the ongoing costs of investing in other mutual funds.
The example is based on an investment of $1,000 invested at the beginning of the six-month period and held for the entire period from July 1, 2010 to December 31, 2010.
Actual expenses
The “Actual” line of the table below provides information about actual account values and actual expenses. You may use the information in this line, together with the amount you invested, to estimate the expenses that you paid over the period. Simply divide your account value by $1,000 (for example, an $8,600 account value divided by $1,000 = 8.6), then multiply the result by the number in the “Actual” line under the heading entitled “Expenses Paid During Period” for your applicable class of shares to estimate the expenses you paid on your account during this period.
Hypothetical example for comparison purposes
The “Hypothetical” line of the table below provides information about hypothetical account values and hypothetical expenses based on the Fund’s actual expense ratio and an assumed rate of return of 5% per year before expenses, which is not the Fund’s actual return. The hypothetical account values and expenses may not be used to estimate the actual ending account balance or expenses you paid for the period. You may use this information to compare the ongoing costs of investing in the Fund and other funds. To do so, compare this 5% hypothetical example with the 5% hypothetical examples that appear in the shareholder reports of the other funds.
Please note that the expenses shown in the table are meant to highlight your ongoing costs only and do not reflect any transactional costs, such as sales charges (loads), redemption fees, exchange fees or separate account fees assessed by participating insurance companies. Therefore, the “Hypothetical” line of the table is useful in comparing ongoing costs only, and will not help you determine the relative total costs of owning different funds. In addition, if these transactional costs were included, your costs would have been higher.
| | | | | | | | | | | | | | | | | |
| | | Beginning | | | Ending | | | Expenses | | | | |
| | | Account Value | | | Account Value | | | Paid During | | | Net Annual | |
| | | 07-01-2010 | | | 12-31-2010 | | | the Period1 | | | Expense Ratio | |
Class 1 | | | | | | | | | | | | | | | | |
| Actual | | $ | 1,000.00 | | | $ | 1,233.68 | | | $ | 5.07 | | | | 0.89 | % |
| Hypothetical (5% return before expenses) | | | | | | | | | | | | | | | | |
| | | $ | 1,000.00 | | | $ | 1,020.94 | | | $ | 4.58 | | | | 0.89 | % |
Class 2 | | | | | | | | | | | | | | | | |
| Actual | | $ | 1,000.00 | | | $ | 1,232.32 | | | $ | 6.48 | | | | 1.14 | % |
| Hypothetical (5% return before expenses) | | | | | | | | | | | | | | | | |
| | | $ | 1,000.00 | | | $ | 1,019.67 | | | $ | 5.87 | | | | 1.14 | % |
| | |
| 1. | | Expenses are equal to the Fund’s annualized expenses ratio multiplied by the average account value over the period, multiplied by the number of days in the most recent fiscal half-year divided by the number of days in the fiscal year (to reflect the one-half year period). |
| | |
| Portfolio of Investments—December 31, 2010 | | Wells Fargo Advantage VT Small Cap Value Fund 11 |
| | | |
| | | | | | | | | |
| Shares | | | Security Name | | Value | |
| Common Stocks: 91.14% |
| | | | | | | | | |
| Consumer Discretionary: 4.99% |
| | | | | | | | | |
| Diversified Consumer Services: 0.41% |
| | 24,800 | | | Cambium Learning Group Incorporated† | | $ | 85,312 | |
| | 45,100 | | | Corinthian Colleges Incorporated† | | | 234,971 | |
| |
| | | | | | | | 320,283 | |
| | | | | | | | |
| | | | | | | | | |
| Hotels, Restaurants & Leisure: 0.87% |
| | 34,900 | | | Scientific Games Corporation Class A† | | | 347,604 | |
| | 72,000 | | | Wendy’s Arby’s Group Incorporated | | | 332,640 | |
| |
| | | | | | | | 680,244 | |
| | | | | | | | |
| | | | | | | | | |
| Household Durables: 0.93% |
| | 6,525 | | | Cavco Industries Incorporated† | | | 304,652 | |
| | 9,100 | | | KB Home Incorporated | | | 122,761 | |
| | 11,405 | | | Skyline Corporation | | | 297,442 | |
| |
| | | | | | | | 724,855 | |
| | | | | | | | |
| | | | | | | | | |
| Internet & Catalog Retail: 0.09% |
| | 38,950 | | | dELiA*s Incorporated† | | | 67,773 | |
| | | | | | | | |
| | | | | | | | | |
| Media: 0.63% |
| | 13,300 | | | Discovery Communications Incorporated Class A† | | | 487,977 | |
| | | | | | | | |
| | | | | | | | | |
| Multiline Retail: 0.20% |
| | 14,600 | | | Saks Incorporated† | | | 156,220 | |
| | | | | | | | |
| | | | | | | | | |
| Specialty Retail: 1.86% |
| | 34,800 | | | Collective Brands Incorporated† | | | 734,280 | |
| | 7,400 | | | Foot Locker Incorporated | | | 145,188 | |
| | 5,200 | | | rue21 Incorporated† | | | 152,412 | |
| | 26,795 | | | Talbots Incorporated† | | | 228,293 | |
| | 5,600 | | | Vitamin Shoppe Incorporated† | | | 188,384 | |
| |
| | | | | | | | 1,448,557 | |
| | | | | | | | |
| | | | | | | | | |
| Consumer Staples: 1.83% |
| | | | | | | | | |
| Food Products: 1.13% |
| | 46,900 | | | Del Monte Foods Company | | | 881,720 | |
| | | | | | | | |
| | | | | | | | | |
| Personal Products: 0.70% |
| | 45,700 | | | Prestige Brands Holdings Incorporated† | | | 546,115 | |
| | | | | | | | |
| | | | | | | | | |
| Energy: 24.65% |
| | | | | | | | | |
| Energy Equipment & Services: 8.87% |
| | 137,200 | | | Global Industries Limited† | | | 950,796 | |
| | 22,770 | | | Helix Energy Solutions Group Incorporated† | | | 276,428 | |
| | 17,700 | | | Helmerich & Payne Incorporated | | | 858,096 | |
| | 129,500 | | | ION Geophysical Corporation† | | | 1,098,160 | |
| | 53,200 | | | Key Energy Services Incorporated† | | | 690,536 | |
| | 138,940 | | | Newpark Resources Incorporated† | | | 855,870 | |
| | 11,400 | | | Oceaneering International Incorporated† | | | 839,382 | |
| | 43,400 | | | Parker Drilling Company† | | | 198,338 | |
| | 15,500 | | | PHI Incorporated (non-voting)† | | | 292,020 | |
| | 2,700 | | | PHI Incorporated (voting)† | | | 57,051 | |
| | 8,200 | | | Pride International Incorporated† | | | 270,600 | |
| | 67,750 | | | Vantage Drilling Company† | | | 137,533 | |
| | 38,600 | | | Willbros Group Incorporated† | | | 379,052 | |
| |
| | | | | | | | 6,903,862 | |
| | | | | | | | |
| | |
| 12 Wells Fargo Advantage VT Small Cap Value Fund | | Portfolio of Investments—December 31, 2010 |
| | | |
| | | | | | | | | |
| Shares | | | Security Name | | Value | |
| Oil, Gas & Consumable Fuels: 15.78% |
| | 19,800 | | | Forest Oil Corporation† | | $ | 751,806 | |
| | 73,720 | | | InterOil Corporation† | | | 5,313,000 | |
| | 125,700 | | | McMoRan Exploration Company† | | | 2,154,498 | |
| | 7,300 | | | Newfield Exploration Company† | | | 526,403 | |
| | 3,100 | | | Noble Energy Incorporated | | | 266,848 | |
| | 18,100 | | | Petrohawk Energy Corporation† | | | 330,325 | |
| | 15,300 | | | PetroQuest Energy Incorporated† | | | 115,209 | |
| | 4,200 | | | Pioneer Natural Resources Company | | | 364,644 | |
| | 5,530 | | | Plains Exploration & Product Company† | | | 177,734 | |
| | 39,100 | | | Range Resources Corporation | | | 1,758,718 | |
| | 42,640 | | | Trilogy Energy Corporation | | | 527,479 | |
| |
| | | | | | | | 12,286,664 | |
| | | | | | | | |
| | | | | | | | | |
| Financials: 17.44% |
| | | | | | | | | |
| Commercial Banks: 4.61% |
| | 5,600 | | | Ameris Bancorp | | | 59,024 | |
| | 16,015 | | | Associated Banc-Corporation | | | 242,627 | |
| | 21,400 | | | Bancorp Incorporated† | | | 217,638 | |
| | 31,133 | | | Center Financial Corporation† | | | 235,988 | |
| | 24,500 | | | CenterState Banks Incorporated | | | 194,040 | |
| | 8,400 | | | City National Corporation | | | 515,424 | |
| | 22,021 | | | First Horizon National Corporation† | | | 259,413 | |
| | 8,800 | | | IBERIABANK Corporation | | | 520,344 | |
| | 18,500 | | | Park Sterling Corporation† | | | 113,960 | |
| | 6,680 | | | Sandy Spring Bancorp Incorporated | | | 123,112 | |
| | 5,400 | | | SVB Financial Group† | | | 286,470 | |
| | 15,865 | | | Western Liberty Bancorp† | | | 86,306 | |
| | 44,100 | | | Whitney Holding Corporation | | | 624,015 | |
| | 26,400 | | | Wilmington Trust Corporation | | | 114,576 | |
| |
| | | | | | | | 3,592,937 | |
| | | | | | | | |
| | | | | | | | | |
| Insurance: 2.89% |
| | 32,600 | | | Argo Group International Holdings Limited | | | 1,220,870 | |
| | 33,500 | | | Hilltop Holdings Incorporated† | | | 332,320 | |
| | 10,300 | | | Mercury General Corporation | | | 443,003 | |
| | 16,700 | | | OneBeacon Insurance Group Limited | | | 253,172 | |
| |
| | | | | | | | 2,249,365 | |
| | | | | | | | |
| | | | | | | | | |
| Real Estate Investment Trusts (REIT): 9.57% |
| | 69,300 | | | Anworth Mortgage Asset Corporation | | | 485,100 | |
| | 8,000 | | | Armour Residential Incorporated | | | 62,480 | |
| | 79,100 | | | Capstead Mortgage Corporation | | | 995,869 | |
| | 712,400 | | | Chimera Investment Corporation | | | 2,927,964 | |
| | 9,160 | | | Crexus Investment Corporation | | | 119,996 | |
| | 18,600 | | | Hatteras Financial Corporation | | | 563,022 | |
| | 33,055 | | | Invesco Mortgage Capital | | | 721,921 | |
| | 99,240 | | | MFA Mortgage Investments Incorporated | | | 809,798 | |
| | 20,100 | | | Redwood Trust Incorporated | | | 300,093 | |
| | 13,870 | | | Sun Communities Incorporated | | | 462,010 | |
| |
| | | | | | | | 7,448,253 | |
| | | | | | | | |
| | | | | | | | | |
| Thrifts & Mortgage Finance: 0.37% |
| | 15,000 | | | First Niagara Financial Group Incorporated | | | 209,700 | |
| | 6,900 | | | Northwest Bancshares Incorporated | | | 81,144 | |
| |
| | | | | | | | 290,844 | |
| | | | | | | | |
| | |
| Portfolio of Investments—December 31, 2010 | | Wells Fargo Advantage VT Small Cap Value Fund 13 |
| | | |
| | | | | | | | | |
| Shares | | | Security Name | | Value | |
| Health Care: 6.89% |
| | | | | | | | | |
| Biotechnology: 0.46% |
| | 5,000 | | | Gen-Probe Incorporated† | | $ | 291,750 | |
| | 10,800 | | | Infinity Pharmaceuticals Incorporated† | | | 64,044 | |
| |
| | | | | | | | 355,794 | |
| | | | | | | | |
| | | | | | | | | |
| Health Care Equipment & Supplies: 2.18% |
| | 15,950 | | | Hologic Incorporated† | | | 300,179 | |
| | 103,700 | | | Orasure Technologies Incorporated† | | | 596,275 | |
| | 8,400 | | | Steris Corporation | | | 306,264 | |
| | 23,900 | | | Symmetry Medical Incorporated† | | | 221,075 | |
| | 3,900 | | | Varian Medical Systems Incorporated† | | | 270,192 | |
| |
| | | | | | | | 1,693,985 | |
| | | | | | | | |
| | | | | | | | | |
| Health Care Providers & Services: 2.71% |
| | 18,100 | | | Amedisys Incorporated† | | | 606,350 | |
| | 6,000 | | | Community Health Systems Incorporated† | | | 224,220 | |
| | 42,800 | | | Cross Country Healthcare Incorporated† | | | 362,516 | |
| | 25,000 | | | Gentiva Health Services Incorporated† | | | 665,000 | |
| | 10,500 | | | Healthways Incorporated† | | | 117,180 | |
| | 5,200 | | | Omnicare Incorporated | | | 132,028 | |
| |
| | | | | | | | 2,107,294 | |
| | | | | | | | |
| | | | | | | | | |
| Health Care Technology: 0.18% |
| | 6,000 | | | Medidata Solutions Incorporated† | | | 143,280 | |
| | | | | | | | |
| | | | | | | | | |
| Life Sciences Tools & Services: 1.36% |
| | 29,600 | | | Accelrys Incorporated† | | | 245,680 | |
| | 4,500 | | | Life Technologies Corporation† | | | 249,750 | |
| | 26,600 | | | Nordion Incorporated† | | | 302,974 | |
| | 12,400 | | | Parexel International Corporation† | | | 263,252 | |
| |
| | | | | | | | 1,061,656 | |
| | | | | | | | |
| | | | | | | | | |
| Industrials: 13.03% |
| | | | | | | | | |
| Aerospace & Defense: 0.16% |
| | 36,800 | | | Ascent Solar Technologies Incorporated† | | | 123,648 | |
| | | | | | | | |
| | | | | | | | | |
| Airlines: 4.59% |
| | 14,100 | | | Alaska Air Group Incorporated† | | | 799,329 | |
| | 73,600 | | | Delta Air Lines Incorporated† | | | 927,360 | |
| | 6,500 | | | Lan Airlines SA ADR | | | 200,070 | |
| | 69,100 | | | United Continental Holdings Incorporated† | | | 1,645,962 | |
| |
| | | | | | | | 3,572,721 | |
| | | | | | | | |
| | | | | | | | | |
| Building Products: 0.22% |
| | 1,850 | | | Webco Industries Incorporated(a)† | | | 170,200 | |
| | | | | | | | |
| | | | | | | | | |
| Commercial Services & Supplies: 4.13% |
| | 32,300 | | | ABM Industries Incorporated | | | 849,490 | |
| | 54,160 | | | ACCO Brands Corporation† | | | 461,443 | |
| | 48,500 | | | GEO Group Incorporated† | | | 1,196,010 | |
| | 20,900 | | | Healthcare Services Group | | | 340,044 | |
| | 8,600 | | | Kforce Incorporated† | | | 139,148 | |
| | 6,800 | | | Verisk Analytics Incorporated Class A† | | | 231,744 | |
| | | | | | | | | |
| | | | | | | | 3,217,879 | |
| | | | | | | | |
| | |
| 14 Wells Fargo Advantage VT Small Cap Value Fund | | Portfolio of Investments—December 31, 2010 |
| | | |
| | | | | | | | | |
| Shares | | | Security Name | | Value | |
| Construction & Engineering: 2.33% |
| | 50,800 | | | Chicago Bridge & Iron Company NV† | | $ | 1,671,320 | |
| | 14,800 | | | Primoris Services Corporation | | | 141,191 | |
| | | | | | | | | |
| | | | | | | | 1,812,511 | |
| | | | | | | | |
| | | | | | | | | |
| Electrical Equipment: 0.87% |
| | 34,400 | | | GrafTech International Limited† | | | 682,496 | |
| | | | | | | | |
| | | | | | | | | |
| Marine: 0.03% |
| | 10,100 | | | Star Bulk Carriers Corporation | | | 26,967 | |
| | | | | | | | |
| | | | | | | | | |
| Professional Services: 0.39% |
| | 46,558 | | | Hill International Incorporated† | | | 301,230 | |
| | | | | | | | |
| | | | | | | | | |
| Road & Rail: 0.31% |
| | 23,500 | | | Covenant Transport Incorporated Class A† | | | 228,420 | |
| | 2,924 | | | YRC Worldwide Incorporated† | | | 10,877 | |
| | | | | | | | | |
| | | | | | | | 239,297 | |
| | | | | | | | |
| | | | | | | | | |
| Information Technology: 6.71% |
| | | | | | | | | |
| Communications Equipment: 1.68% |
| | 46,000 | | | Brocade Communications Systems Incorporated† | | | 243,340 | |
| | 38,300 | | | China GrenTech Corporation Limited ADR† | | | 121,794 | |
| | 51,200 | | | Harmonic Incorporated† | | | 438,784 | |
| | 283,000 | | | MRV Communications Incorporated† | | | 506,570 | |
| | | | | | | | 1,310,488 | |
| | | | | | | | |
| | | | | | | | | |
| Computers & Peripherals: 1.66% |
| | 70,000 | | | Cray Incorporated† | | | 500,500 | |
| | 62,400 | | | Intermec Incorporated† | | | 789,984 | |
| | | | | | | | | |
| | | | | | | | 1,290,484 | |
| | | | | | | | |
| | | | | | | | | |
| Electronic Equipment & Instruments: 3.28% |
| | 12,935 | | | Cognex Corporation | | | 380,548 | |
| | 17,500 | | | Coherent Incorporated† | | | 789,950 | |
| | 20,200 | | | OSI Systems Incorporated† | | | 734,472 | |
| | 63,500 | | | Power One Incorporated† | | | 647,700 | |
| | | | | | | | | |
| | | | | | | | 2,552,670 | |
| | | | | | | | |
| | | | | | | | | |
| Office Electronics: 0.09% |
| | 1,800 | | | Zebra Technologies Corporation† | | | 68,382 | |
| | | | | | | | |
| | | | | | | | | |
| Materials: 14.98% |
| | | | | | | | | |
| Chemicals: 0.52% |
| | 26,800 | | | Calgon Carbon Corporation† | | | 405,216 | |
| | | | | | | | |
| | | | | | | | | |
| Containers & Packaging: 0.24% |
| | 161,600 | | | Intertape Polymer Group Incorporated† | | | 185,840 | |
| | | | | | | | |
| | | | | | | | | |
| Metals & Mining: 13.86% |
| | 12,900 | | | Agnico-Eagle Mines Limited | | | 989,430 | |
| | 21,100 | | | Carpenter Technology Corporation | | | 849,064 | |
| | 53,000 | | | Eldorado Gold Corporation | | | 984,210 | |
| | 72,500 | | | Great Basin Gold Limited† | | | 214,600 | |
| | |
| Portfolio of Investments—December 31, 2010 | | Wells Fargo Advantage VT Small Cap Value Fund 15 |
| | | |
| | | | | | | | | |
| Shares | | | Security Name | | Value | |
| Metals & Mining (continued) |
| | 11,200 | | | Harry Winston Diamond Corporation† | | $ | 131,040 | |
| | 58,200 | | | Jaguar Mining Incorporated† | | | 414,966 | |
| | 40,300 | | | Petaquilla Minerals Limited† | | | 42,678 | |
| | 49,400 | | | Randgold Resources Limited ADR | | | 4,067,102 | |
| | 14,840 | | | Royal Gold Incorporated | | | 810,709 | |
| | 3,469 | | | Sandstorm Metals & Energy Limited† | | | 4,012 | |
| | 210,240 | | | Sandstorm Resources Limited† | | | 169,156 | |
| | 14,600 | | | Silver Standard Resources Incorporated† | | | 412,012 | |
| | 45,900 | | | Steel Dynamics Incorporated | | | 839,970 | |
| | 7,700 | | | United States Steel Corporation | | | 449,834 | |
| | 32,500 | | | Yamana Gold Incorporated | | | 416,000 | |
| |
| | | | | | | | 10,794,783 | |
| | | | | | | | |
| | | | | | | | | |
| Paper & Forest Products: 0.36% |
| | 32,100 | | | Wausau Paper Corporation | | | 276,381 | |
| | | | | | | | |
| | | | | | | | | |
| Telecommunication Services: 0.62% |
| | | | | | | | | |
| Diversified Telecommunication Services: 0.62% |
| | 173,000 | | | Cincinnati Bell Incorporated† | | | 484,400 | |
| | | | | | | | |
| | | | | | | | | |
| Total Common Stocks (Cost $58,411,658) | | | 70,963,271 | |
| | | | | | | | |
| | | | | | | | | |
| Investment Companies: 1.52% |
| | 12,100 | | | KBW Regional Banking ETF | | | 320,045 | |
| | 13,996 | | | Market Vectors Gold Miners ETF | | | 860,334 | |
| | | | | | | | | |
| Total Investment Companies (Cost $974,088) | | | 1,180,379 | |
| | | | | | | | |
| | | | | | | | | | | | | | | | | | | | | |
| | | | | | | | | | | | | | | Expiration Date | | | | |
| Warrants: 0.00% | | | | | | | | | | | | |
| | | | | | | | | | | | | | | | | | | | | |
| Financials: 0.00% | | | | | | | | | | | | |
| | | | | | | | | | | | | | | | | | | | | |
| Real Estate Investment Trusts (REITs): 0.00% | | | | | | | | | | | | |
| | 1,000 | | | Armour Residential Incorporated† | | | | | | | | | | | 11/07/2011 | | | | 75 | |
| | | | | | | | | | | | | | | | | | | | |
| | | | | | | | | |
| Total Warrants (Cost $160) | | | | | | | | | | | 75 | |
| | | | | | | | | | | | | | | | | | | | |
| | | | | | | | | | | | | | | | | | | | | |
| | | | | | | | | | | Yield | | | | | | | | |
| Short-Term Investments: 5.64% | | | | | | | | |
| | | | | | | | | | | | | | | | | | | | | |
| Investment Companies: 5.64% | | | | | | | | |
| | 4,395,721 | | | Wells Fargo Advantage Cash Investment Money Market Fund(l)(u) | | | | | | | 0.14 | % | | | | | | | 4,395,721 | |
| | | | | | | | | | | | | | | | | | | | |
| | | | | | | | | | | | | | | | | | | | | |
| Total Short-Term Investments (Cost $4,395,721) | | | | | | | 4,395,721 | |
| | | | | | | | | | | | | | | | | | | | |
| | | | | | | | | | | | | | | | | | | | | |
| Total Investments in Securities (Cost $63,781,627)* | | | 98.30 | % | | | | | | | | | | | 76,539,446 | |
| Other Assets and Liabilities, Net | | | 1.70 | | | | | | | | | | | | 1,321,006 | |
| | | | | | | | | | | | | | | | | | | |
| | | | | | | | | | | | | | | | | | | | | |
| Total Net Assets | | | 100.00 | % | | | | | | | | | | $ | 77,860,452 | |
| | | | | | | | | | | | | | | | | | | |
| | |
| 16 Wells Fargo Advantage VT Small Cap Value Fund | | Portfolio of Investments—June 30, 2010 |
| | | |
| | |
| † | | Non-income earning securities. |
| |
| (a) | | Security is fair valued by the Management Valuation Team, and in certain instances by the Board of Trustees, in accordance with procedures approved by the |
| |
| | | Board of Trustees. |
| |
| (l) | | Investment in an affiliate. |
| |
| (u) | | Rate shown is the 7-day annualized yield at period end. |
| |
| * | | Cost for federal income tax purposes is $64,279,714 and net unrealized appreciation (depreciation) consists of: |
| | | | | |
|
| Gross unrealized appreciation | | $ | 14,006,727 | |
| Gross unrealized depreciation | | | (1,746,995 | ) |
| | | | |
| Net unrealized appreciation | | $ | 12,259,732 | |
The accompanying notes are an integral part of these financial statements.
| | |
| Statement of Assets and Liabilities—December 31, 2010 | | Wells Fargo Advantage VT Small Cap Value Fund 17 |
| | | | | |
|
Assets | | | | |
| Investments | | | | |
| In unaffiliated securities, at value | | $ | 72,143,725 | |
| In affiliated securities, at value | | | 4,395,721 | |
| | | | |
| Total investments, at value (see cost below) | | | 76,539,446 | |
| Foreign currency, at value (see cost below) | | | 66,718 | |
| Receivable for investments sold | | | 1,189,751 | |
| Receivable for Fund shares sold | | | 9,570 | |
| Receivable for dividends | | | 276,018 | |
| Prepaid expenses and other assets | | | 1,279 | |
| | | | |
| Total assets | | | 78,082,782 | |
| | | | |
| | | | | |
Liabilities | | | | |
| Payable for investments purchased | | | 106,241 | |
| Payable for Fund shares redeemed | | | 34,332 | |
| Investment advisory fee payable | | | 47,827 | |
| Distribution fees payable | | | 4,694 | |
| Due to other related parties | | | 9,362 | |
| Professional fees payable | | | 17,742 | |
| Accrued expenses and other liabilities | | | 2,132 | |
| | | | |
| Total liabilities | | | 222,330 | |
| | | | |
Total net assets | | $ | 77,860,452 | |
| | | | |
| | | | | |
NET ASSETS CONSIST OF | | | | |
| Paid-in capital | | $ | 86,943,041 | |
| Undistributed net investment income | | | 499,936 | |
| Accumulated net realized losses on investments | | | (22,341,472 | ) |
| Net unrealized gains on investments | | | 12,758,947 | |
| | | | |
Total net assets | | $ | 77,860,452 | |
| | | | |
| | | | | |
COMPUTATION OF NET ASSET VALUE PER SHARE1 | | | | |
| Net assets — Class 1 | | $ | 58,254,650 | |
| Shares outstanding — Class 1 | | | 6,441,392 | |
| Net asset value per share — Class 1 | | $ | 9.04 | |
| Net assets — Class 2 | | $ | 19,605,802 | |
| Shares outstanding — Class 2 | | | 2,170,293 | |
| Net asset value per share — Class 2 | | $ | 9.03 | |
| | | | |
| | | | | |
| Total investments, at cost | | $ | 63,781,627 | |
| | | | |
| Foreign currency, at cost | | $ | 65,590 | |
| | | | |
| | |
| 1. | | The Fund has an unlimited number of authorized shares. |
The accompanying notes are an integral part of these financial statements.
| | |
| 18 Wells Fargo Advantage VT Small Cap Value Fund | | Statement of Operations—For the Year Ended December 31, 2010 |
| | | | | |
|
Investment income | | | | |
| Dividends† | | $ | 869,313 | |
| Income from affiliated securities | | | 4,504 | |
| Securities lending income, net | | | 40,130 | |
| | | | |
| Total investment income | | | 913,947 | |
| | | | |
| | | | | |
Expenses | | | | |
| Investment advisory fee | | | 301,451 | |
| Administration fees | | | | |
| Fund level | | | 26,590 | |
| Class 1* | | | 20,308 | |
| Class 2** | | | 7,124 | |
| Distribution fees | | | | |
| Class 2** | | | 37,020 | |
| Custody and accounting fees | | | 13,883 | |
| Professional fees | | | 34,913 | |
| Shareholder report expenses | | | 15,801 | |
| Trustees’ fees and expenses | | | 10,230 | |
| Other fees and expenses | | | 2,894 | |
| | | | |
| Total expenses | | | 470,214 | |
| Less: Fee waivers and/or expense reimbursements | | | (75,776 | ) |
| | | | |
| Net expenses | | | 394,438 | |
| | | | |
| Net investment income | | | 519,509 | |
| | | | |
| | | | | |
NET REALIZED AND UNREALIZED GAINS (LOSSES) ON INVESTMENTS | | | | |
| | | | | |
| Net realized gains on unaffiliated securities | | | 1,492,997 | |
| Net change in unrealized gains (losses) on unaffiliated securities | | | 12,781,203 | |
| | | | |
| Net realized and unrealized gains (losses) on investments | | | 14,274,200 | |
| | | | |
Net increase in net assets resulting from operations | | $ | 14,793,709 | |
| | | | |
| | | | | |
| † Net of foreign withholding taxes of | | $ | 3,343 | |
| | |
| * | | Class commenced operations on July 16, 2010. |
| |
| ** | | After the close of business on July 16, 2010, existing shares of the Fund were renamed Class 2 shares. |
The accompanying notes are an integral part of these financial statements.
| | |
| Statements of Changes in Net Assets | | Wells Fargo Advantage VT Small Cap Value Fund 19 |
| | | | | | | | | | | | | | | | | |
| | | Year Ended | | | Year Ended | |
| | | December 31, 2010 | | | December 31, 2009 | |
| |
Operations | | | | | | | | | | | | | | | | |
| Net investment income | | | | | | $ | 519,509 | | | | | | | $ | 124,103 | |
| Net realized gains (losses) on investments | | | | | | | 1,492,997 | | | | | | | | (2,340,447 | ) |
| Net change in unrealized gains (losses) on investments | | | | | | | 12,781,203 | | | | | | | | 6,490,502 | |
| | | |
| Net increase in net assets resulting from operations | | | | | | | 14,793,709 | | | | | | | | 4,274,158 | |
| | | |
| | | |
Distributions to shareholders from | | | | | | | | | | | | | | | | |
| Net investment income | | | | | | | | | | | | | | | | |
| Class 1* | | | | | | | 0 | | | | | | | NA |
| Class 2** | | | | | | | (154,516 | ) | | | | | | | (108,823 | ) |
| | | |
| Total distributions to shareholders | | | | | | | (154,516 | ) | | | | | | | (108,823 | ) |
| | | |
| | | |
| | | Shares | | | | | | Shares | | | | |
Capital share transactions | | | | | | | | | | | | | | | | |
| Proceeds from shares sold | | | | | | | | | | | | | | | | |
| Class 1* | | | 219,798 | | | | 1,707,233 | | | NA | | NA |
| Class 2** | | | 301,633 | | | | 2,296,529 | | | | 557,400 | | | | 3,582,603 | |
| | | |
| | | | | | | | 4,003,762 | | | | | | | | 3,582,603 | |
| | | |
| Reinvestment of distributions | | | | | | | | | | | | | | | | |
| Class 1* | | | 0 | | | | 0 | | | NA | | NA |
| Class 2** | | | 21,138 | | | | 154,516 | | | | 18,570 | | | | 108,823 | |
| | | |
| | | | | | | | 154,516 | | | | | | | | 108,823 | |
| | | |
| Payment for shares redeemed | | | | | | | | | | | | | | | | |
| Class 1* | | | (811,923 | ) | | | (6,559,421 | ) | | NA | | NA |
| Class 2** | | | (897,225 | ) | | | (7,075,687 | ) | | | (642,164 | ) | | | (3,767,477 | ) |
| | | |
| | | | | | | | (13,635,108 | ) | | | | | | | (3,767,477 | ) |
| | | |
| Net asset value of shares issued in acquisition | | | | | | | | | | | | | | | | |
| Class 1* | | | 7,033,517 | | | | 51,770,209 | | | NA | | NA |
| Class 2** | | | 1,210,549 | | | | 8,910,235 | | | | 0 | | | | 0 | |
| | | |
| | | | | | | | 60,680,444 | | | | | | | NA |
| | | |
| Net increase (decrease) in net assets resulting from | | | | | | | | | | | | | | | | |
| capital share transactions | | | | | | | 51,203,614 | | | | | | | | (76,051 | ) |
| | | |
| Total increase in net assets | | | | | | | 65,842,807 | | | | | | | | 4,089,284 | |
| | | |
Net assets | | | | | | | | | | | | | | | | |
Beginning of period | | | | | | | 12,017,645 | | | | | | | | 7,928,361 | |
| | | |
End of period | | | | | | $ | 77,860,452 | | | | | | | $ | 12,017,645 | |
| | | |
| Undistributed net investment income | | | | | | $ | 499,936 | | | | | | | $ | 111,069 | |
| | | |
| | |
| * | | Class commenced operations on July 16, 2010. |
| |
| ** | | After the close of business on July 16, 2010, existing shares of the Fund were renamed Class 2 shares. |
The accompanying notes are an integral part of these financial statements.
| | |
| 20 Wells Fargo Advantage VT Small Cap Value Fund | | Financial Highlights |
| | | | | | | | | | | | | | | | | | | | | |
| | | Beginning | | | | | | | Net Realized | | | Distributions | | | | |
| | | Net Asset | | | Net | | | and Unrealized | | | from Net | | | Distributions | |
| | | Value Per | | | Investment | | | Gains (Losses) | | | Investment | | | from Net | |
| | | Share | | | Income (Loss) | | | on Investments | | | Income | | | Realized Gains | |
| |
| Class 1 | | | | | | | | | | | | | | | | | | | | |
July 16, 20101 to December 31, 2010 | | $ | 7.36 | | | | 0.052 | | | | 1.63 | | | | 0.00 | | | | 0.00 | |
| | | | | | | | | | | | | | | | | | | | | |
Class 25 | | | | | | | | | | | | | | | | | | | | |
| January 1, 2010 to December 31, 2010 | | $ | 7.83 | | | | 0.12 | | | | 1.20 | | | | (0.12 | ) | | | 0.00 | |
| January 1, 2009 to December 31, 2009 | | $ | 4.95 | | | | 0.08 | | | | 2.87 | | | | (0.07 | ) | | | 0.00 | |
| January 1, 2008 to December 31, 2008 | | $ | 11.08 | | | | 0.092 | | | | (4.21 | ) | | | 0.00 | | | | (2.01 | ) |
| January 1, 2007 to December 31, 2007 | | $ | 13.22 | | | | (0.04 | ) | | | 0.21 | | | | 0.00 | | | | (2.31 | ) |
| January 1, 2006 to December 31, 2006 | | $ | 13.66 | | | | (0.03 | ) | | | 1.84 | | | | 0.00 | | | | (2.25 | ) |
| | |
| 1. | | Class commenced operations on July 16, 2010. |
| |
| 2. | | Calculated based upon average shares outstanding. |
| |
| 3. | | Total return calculations would have been lower had certain expenses not been waived or reimbursed during the periods shown. Returns for periods of less than one year are not annualized. |
| |
| 4. | | Calculated on the basis of the Fund as a whole without distinguishing between the classes of shares issued. Portfolio turnover rates presented for periods of less than one year are not annualized. |
| |
| 5. | | After the close of business on July 16, 2010, existing shares of the Fund were renamed Class 2 shares. |
The accompanying notes are an integral part of these financial statements.
| | |
| Financial Highlights | | Wells Fargo Advantage VT Small Cap Value Fund 21 |
| | | | | | | | | | | | | | | | | | | | | | | | | | | |
| Ending | | | | | | | | | | | | | | |
| Net Asset | | | Ratio to Average Net Assets (Annualized) | | | | | | | Portfolio | | | Net Assets at | |
| Value Per | | | Net Investment | | | Gross | | | Net | | | Total | | | Turnover | | | End of Period | |
| Share | | | Income (Loss) | | | Expenses | | | Expenses | | | Return3 | | | Rate4 | | | (000’s omitted) | |
| |
| $ | 9.04 | | | | 1.43 | % | | | 0.96 | % | | | 0.89 | % | | | 22.83 | % | | | 61 | % | | $ | 58,255 | |
| | | | | | | | | | | | | | | | | | | | | | | | | | | |
| $ | 9.03 | | | | 1.06 | % | | | 1.52 | % | | | 1.14 | % | | | 17.25 | % | | | 61 | % | | $ | 19,606 | |
| $ | 7.83 | | | | 1.39 | % | | | 2.56 | % | | | 1.14 | % | | | 60.18 | % | | | 45 | % | | $ | 12,018 | |
| $ | 4.95 | | | | 1.18 | % | | | 1.69 | % | | | 1.14 | % | | | (44.55 | )% | | | 39 | % | | $ | 7,928 | |
| $ | 11.08 | | | | (0.31 | )% | | | 1.51 | % | | | 1.14 | % | | | (0.32 | )% | | | 60 | % | | $ | 17,527 | |
| $ | 13.22 | | | | (0.23 | )% | | | 1.46 | % | | | 1.14 | % | | | 15.29 | % | | | 81 | % | | $ | 23,462 | |
| | |
| 22 Wells Fargo Advantage VT Small Cap Value Fund | | Notes to Financial Statements |
1. ORGANIZATION
Wells Fargo Variable Trust (the “Trust”), a Delaware statutory trust organized on March 10, 1999, is an open-end management investment company registered under the Investment Company Act of 1940, as amended (the “1940 Act”). These financial statements report on Wells Fargo Advantage VT Small Cap Value Fund (the “Fund”) (formerly, Wells Fargo Advantage VT Small/Mid Cap Value Fund) which is a diversified series of the Trust. After the close of business on July 16, 2010, existing shares of the Fund were renamed Class 2 shares.
2. SIGNIFICANT ACCOUNTING POLICIES
The following significant accounting policies, which are consistently followed in the preparation of the financial statements of the Fund, are in conformity with U.S. generally accepted accounting principles which require management to make estimates and assumptions that affect the reported amounts of assets and liabilities, disclosure of contingent assets and liabilities at the date of the financial statements, and the reported amounts of revenues and expenses during the reporting period. Actual results could differ from those estimates. Management has considered the circumstances under which the Fund should recognize or make disclosures regarding events or transactions occurring subsequent to the balance sheet date through the date the financial statements are issued. Adjustments or additional disclosures, if any, have been included in these financial statements.
Securities valuation
Investments in securities are valued each business day as of the close of regular trading on the New York Stock Exchange, which is usually 4:00 p.m. (Eastern Time). Securities which are traded on a national or foreign securities exchange are valued at the last reported sales price, except that securities listed on The Nasdaq Stock Market, Inc. (“Nasdaq”) are valued at the Nasdaq Official Closing Price (“NOCP”), and if no NOCP is available, then at the last reported sales price. If no sales price is shown on the Nasdaq, the bid price will be used. In the absence of any sale of securities listed on the Nasdaq, and in the case of other securities, including U.S. Government obligations, but excluding debt securities maturing in 60 days or less, the price will be deemed “stale” and the valuations will be determined in accordance with the Fund’s Fair Valuation Procedures.
Investments in open-end mutual funds and non-registered investment companies are generally valued at net asset value.
Certain investments which are not valued using any of the methods discussed above, are valued at their fair value, as determined by procedures established in good faith and approved by the Board of Trustees.
The valuation techniques used by the Fund to measure fair value are consistent with the market approach, income approach and/or cost approach, where applicable, for each security type.
Security transactions and income recognition
Securities transactions are recorded on a trade date basis. Realized gains or losses are reported on the basis of identified cost of securities delivered.
Dividend income is recognized on the ex-dividend date, except for certain dividends from foreign securities, which are recorded as soon as the Fund is informed of the ex-dividend date. Dividend income from foreign securities is recorded net of foreign taxes withheld where recovery of such taxes is not assured.
Distributions to shareholders
Distributions to shareholders from net investment income and net realized gains, if any, are recorded on the ex-dividend date. Such distributions are determined in conformity with income tax regulations, which may differ from generally accepted accounting principles.
The timing and character of distributions made during the period from net investment income or net realized gains may differ from their ultimate characterization for federal income tax purposes. To the extent that these differences are permanent in nature, such amounts are reclassified within the capital accounts based on their federal tax-basis treatment. Temporary differences do not require reclassifications. At December 31, 2010, as a
| | |
| Notes to Financial Statements | | Wells Fargo Advantage VT Small Cap Value Fund 23 |
result of permanent book-to-tax differences, the following reclassification adjustments were made on the Statement of Assets and Liabilities:
| | | | | | | | | |
| | | | | | | Accumulated Net | |
| | | | | | | Realized | |
| | | Undistributed Net | | | Losses | |
| | | Investment Income | | | on Investments | |
| | | $ | 25,788 | | | $ | (25,788 | ) |
Security loans
The Fund may lend its securities from time to time in order to earn additional income in the form of fees or interest on securities received as collateral or the investment of any cash received as collateral. The Fund continues to receive interest or dividends on the securities loaned. The Fund receives collateral in the form of cash or securities with a value at least equal to the value of the securities on loan. The value of the loaned securities is determined at the close of each business day and any additional required collateral is delivered to the Fund on the next business day. In the event of default or bankruptcy by the borrower, the Fund could experience delays and costs in recovering the loaned securities or in gaining access to the collateral. In addition, the investment of any cash collateral received may lose all or part of its value. The Fund has the right under the lending agreement to recover the securities from the borrower on demand.
The Fund lends its securities through an unaffiliated securities lending agent. Cash collateral received in connection with its securities lending transactions is invested in Wells Fargo Securities Lending Cash Investments, LLC (the “Cash Collateral Fund”). The Cash Collateral Fund is exempt from registration under Section 3(c)(7) of the 1940 Act and is managed by Wells Fargo Funds Management LLC (“Funds Management”) and is sub-advised by Wells Capital Management Incorporated (“Wells Capital Management”). Funds Management receives an investment advisory fee starting at 0.05% and declining to 0.01% as the average daily net assets of the Cash Collateral Fund increase. All of the fees received by Funds Management are paid to Wells Capital Management for its services as sub-adviser. The Cash Collateral Fund seeks to provide a positive return compared to the daily Fed Funds Open rate by investing in high-quality, U.S. dollar-denominated short-term money market instruments. Cash Collateral Fund investments are fair valued based upon the amortized cost valuation technique. Income earned from investment in the Cash Collateral Fund is included in securities lending income on the Statement of Operations.
Federal and other taxes
The Fund intends to continue to qualify as a regulated investment company by distributing substantially all of its investment company taxable income and any net realized capital gains (after reduction for capital loss carryforwards) sufficient to relieve it from all, or substantially all, federal income taxes. Accordingly, no provision for federal income taxes was required.
The Fund’s income and federal excise tax returns and all financial records supporting those returns for the prior three fiscal years are subject to examination by the federal and Delaware revenue authorities.
As of December 31, 2010, the Fund had estimated net capital loss carryforwards, which are available to offset future net realized capital gains, in the amount of $21,893,727 with $932,272 expiring in 2015, $7,675,453 expiring in 2016 and $13,286,002 expiring in 2017.
Under the recently enacted Regulated Investment Company Modernization Act of 2010, the Fund will be permitted to carry forward capital losses incurred in taxable years beginning after December 22, 2010 for an unlimited period. However, any losses incurred during those future taxable years will be required to be utilized prior to the losses incurred in pre-enactment taxable years. As a result of this ordering rule, pre-enactment capital loss carryforwards may be more likely to expire unused. Additionally, post-enactment capital losses that are carried forward will retain their character as either short-term or long-term capital losses rather than being considered all short-term as under previous law.
Class allocations
The separate classes of shares offered by the Fund differ principally in applicable distribution and administration fees. Shareholders of each class bear certain expenses that pertain to that particular class. All shareholders bear the common expenses of the Fund, earn income from the portfolio, and are allocated unrealized gains and losses pro rata based
| | |
| 24 Wells Fargo Advantage VT Small Cap Value Fund | | Notes to Financial Statements |
on the average daily net assets of each class, without distinction between share classes. Dividends are determined separately for each class based on income and expenses allocable to each class. Realized gains and losses are allocated to each class pro rata based upon the net assets of each class on the date realized. Differences in per share dividend rates generally result from the relative weightings of pro rata income and realized gain allocations and from differences in separate class expenses, including distribution and administration fees.
3. FAIR VALUATION MEASUREMENTS
Fair value measurements of investments are determined within a framework that has established a fair value hierarchy based upon the various data inputs utilized in determining the value of the Fund’s investments. The three-level hierarchy gives the highest priority to unadjusted quoted prices in active markets for identical assets or liabilities (Level 1) and the lowest priority to unobservable inputs (Level 3). The Fund’s investments are classified within the fair value hierarchy based on the lowest level of input that is significant to the fair value measurement. The inputs are summarized into three broad levels as follows:
| • | | Level 1 — quoted prices in active markets for identical securities |
| • | | Level 2 — other significant observable inputs (including quoted prices for similar securities, interest rates, prepayment speeds, credit risk, etc.) |
| • | | Level 3 — significant unobservable inputs (including the Fund’s own assumptions in determining the fair value of investments) |
The inputs or methodologies used for valuing securities are not necessarily an indication of the risk associated with investing in those securities.
As of December 31, 2010, the inputs used in valuing the Fund’s assets, which are carried at fair value, were as follows:
| | | | | | | | | | | | | | | | | |
| | | | | | | Significant Other | | | Significant | | | | |
| | | | | | | Observable | | | Unobservable | | | | |
| | | Quoted Prices | | | Inputs | | | Inputs | | | | |
| Investments in Securities | | (Level 1) | | | (Level 2) | | | (Level 3) | | | Total | |
Equity securities | | | | | | | | | | | | | | | | |
Common stocks | | $ | 70,793,071 | | | $ | 0 | | | $ | 170,200 | | | $ | 70,963,271 | |
Warrants | | | 0 | | | | 75 | | | | 0 | | | | 75 | |
Investment companies | | | 1,180,379 | | | | 0 | | | | 0 | | | | 1,180,379 | |
Short-term investments | | | | | | | | | | | | | | | | |
Investment companies | | | 4,395,721 | | | | 0 | | | | 0 | | | | 4,395,721 | |
| | | $ | 76,369,171 | | | $ | 75 | | | $ | 170,200 | | | $ | 76,539,446 | |
Further details on the major security types listed above can be found in the Fund’s Portfolio of Investments.
The following is a reconciliation of assets in which significant unobservable inputs (Level 3) were used in determining fair value:
| | | | | |
| | | Common Stocks | |
Balance as of December 31, 2009 | | $ | 0 | |
| Accrued discounts (premiums) | | | 0 | |
| Realized gain (loss) | | | 0 | |
| Change in unrealized appreciation (depreciation) | | | 46,799 | |
| Purchases | | | 123,401 | |
| Sales | | | 0 | |
| Transfers into Level 3 | | | 0 | |
| Transfers out of Level 3 | | | 0 | |
Balance as of December 31, 2010 | | $ | 170,200 | |
Change in unrealized gains (losses) included in earnings relating to securities still held at December 31, 2010 | | $ | 46,799 | |
| | |
| Notes to Financial Statements | | Wells Fargo Advantage VT Small Cap Value Fund 25 |
4. TRANSACTIONS WITH AFFILIATES AND OTHER EXPENSES
Investment advisory fees
The Trust has entered into an investment advisory contract with Funds Management, an indirect wholly owned subsidiary of Wells Fargo & Company (“Wells Fargo”). The investment adviser is responsible for implementing investment policies and guidelines and for supervising the investment sub-adviser, who is responsible for day-to-day portfolio management of the Fund.
Pursuant to the contract, Funds Management is paid an annual investment advisory fee starting at 0.75% and declining to 0.60% as the average daily net assets of the Fund increase. For the year ended December 31, 2010, the investment advisory fee was equivalent to an annual rate of 0.75% of the Fund’s average daily net assets.
Funds Management may retain the services of certain investment sub-advisers to provide daily portfolio management to the Fund. The fees related to investment sub-advisory services are borne directly by the investment adviser and do not increase the overall fees paid by the Fund to the investment adviser. Wells Capital Management, an affiliate of Funds Management, is the investment sub-adviser to the Fund and is paid a fee by the investment adviser at an annual rate starting at 0.45% and declining to 0.35% as the average daily net assets of the Fund increase.
Administration and transfer agent fees
The Trust has entered into an Administration Agreement with Funds Management. Under this Agreement, for providing administrative services, which includes paying fees and expenses for services provided by the transfer agent, sub-transfer agents, omnibus account servicers and record-keepers, Funds Management is entitled to receive the following annual fees:
| | | | | | | | | |
| | | | | | | Administration Fees | |
| | | | | | | (% of Average | |
| | | Average Daily Net Assets | | | Daily Net Assets) | |
| Fund level | | First $5 billion | | | 0.05 | % |
| | | Next $5 billion | | | 0.04 | |
| | | Over $10 billion | | | 0.03 | |
| | | | | | | | | |
| Class 1 and Class 2 | | All asset levels | | | 0.08 | |
Prior to July 19, 2010, Funds Management received from the Fund, for its existing class, an annual fee which started at 0.16% and declined to 0.14% as the average daily net assets of the Fund increased.
Funds Management has contractually waived and/or reimbursed investment advisory and administration fees to the extent necessary to maintain certain net operating expense ratios for the Fund. Waiver of fees and/or reimbursement of expenses by Funds Management were made first from fund level expenses on a proportionate basis and then from class specific expenses.
Distribution fees
The Trust has adopted a Distribution Plan for Class 2 shares of the Fund pursuant to Rule 12b-1 under the 1940 Act. Distribution fees are charged to the Class 2 shares and paid to Wells Fargo Funds Distributor, LLC, the principal underwriter, at an annual rate of 0.25% of its average daily net assets.
5. INVESTMENT PORTFOLIO TRANSACTIONS
Purchases and sales of investments, exclusive of short-term securities (securities with maturities of one year or less at purchase date) for the year ended December 31, 2010 were $23,392,740 and $24,928,445, respectively.
| | |
| 26 Wells Fargo Advantage VT Small Cap Value Fund | | Notes to Financial Statements |
6. ACQUISITION
After the close of business on July 16, 2010, the Fund acquired the net assets of Evergreen VA Special Values Fund and renamed its existing shares as Class 2 shares. The purpose of the transaction was to combine two funds with similar investment objectives and strategies. Shareholders holding Class 1 and Class 2 shares of Evergreen VA Special Values Fund received Class 1 and Class 2 shares, respectively, of the Fund in the reorganization. The acquisition was accomplished by a tax-free exchange of all of the shares of Evergreen VA Special Values Fund for 8,244,066 shares of the Fund valued at $60,680,444 at an exchange ratio of 1.56 and 1.55 for Class 1 and Class 2 shares, respectively. The investment portfolio of Evergreen VA Special Value Fund with a fair value of $60,693,159, identified cost of $60,659,673 and unrealized gain of $33,486 at July 16, 2010 were the principal assets acquired by the Fund. The aggregate net assets of Evergreen VA Special Values Fund and the Fund immediately prior to the acquisition were $60,680,444 and $9,494,728, respectively. The aggregate net assets of the Fund immediately after the acquisition were $70,175,172. For financial reporting purposes, assets received and shares issued by the Fund were recorded at fair value; however, the cost basis of the investments received from Evergreen VA Special Values Fund was carried forward to align ongoing reporting of the Fund’s realized and unrealized gains and losses with amounts distributable to shareholders for tax purposes.
Assuming the acquisition had been completed January 1, 2010, the beginning of the annual reporting period for the Fund, the pro forma results of operations for the year ended December 31, 2010 would have been:
| | | | | |
|
Net investment income | | $ | 624,969 | |
Net realized and unrealized gains (losses) on investments | | $ | 13,030,505 | |
Net increase in net assets resulting from operations | | $ | 13,655,474 | |
Because the combined investment portfolios have been managed as a single integrated portfolio since the acquisition was completed, it is not practicable to separate the amounts of revenue and earnings of Evergreen VA Special Values Fund that have been included in the Fund’s Statement of Operations since July 19, 2010.
7. BANK BORROWINGS
The Trust and Wells Fargo Funds Trust (excluding the money market funds) are parties to a $125,000,000 revolving credit agreement with State Street Bank and Trust Company, whereby the Fund is permitted to use bank borrowings for temporary or emergency purposes, such as to fund shareholder redemption requests. Interest under the credit agreement is charged to the Fund based on a borrowing rate equal to the higher of the Federal Funds rate in effect on that day plus 1.25% or the overnight LIBOR rate in effect on that day plus 1.25%. In addition, under the credit agreement, the Fund pays an annual commitment fee equal to 0.125% of the unused balance, which is allocated pro rata. Prior to September 7, 2010, the annual commitment fee paid by the Fund was 0.15% of the unused balance.
For the year ended December 31, 2010, there were no borrowings by the Fund under the agreement.
8. DISTRIBUTIONS TO SHAREHOLDERS
The tax character of distributions paid during the years ended December 31, 2010 and December 31, 2009 were as follows:
| | | | | | | | | |
| | | Year Ended December 31, | |
| | | 2010 | | | 2009 | |
| Ordinary Income | | $ | 154,516 | | | $ | 108,823 | |
| | |
| Notes to Financial Statements | | Wells Fargo Advantage VT Small Cap Value Fund 27 |
As of December 31, 2010, the components of distributable earnings on a tax basis were as follows:
| | | | | | | | | | | | | |
| | | Undistributed | | | | | | | |
| | | Ordinary | | | Unrealized | | | Capital Loss | |
| | | Income | | | Gains | | | Carryforward | |
| | | $ | 552,879 | | | $ | 12,260,865 | | | $ | (21,893,727 | ) |
9. INDEMNIFICATION
Under the Trust’s organizational documents, the officers and directors are indemnified against certain liabilities that may arise out of performance of their duties to the Trust. Additionally, in the normal course of business, the Trust may enter into contracts with service providers that contain a variety of indemnification clauses. The Trust’s maximum exposure under these arrangements is dependent on future claims that may be made against the Fund and, therefore, cannot be estimated.
| | |
| 28 Wells Fargo Advantage VT Small Cap Value Fund | | Report of Independent Registered Public Accounting Firm |
BOARD OF TRUSTEES AND SHAREHOLDERS OF
WELLS FARGO VARIABLE TRUST:
We have audited the accompanying statement of assets and liabilities, including the portfolio of investments, of the Wells Fargo Advantage VT Small Cap Value Fund (the “Fund”), one of the funds constituting the Wells Fargo Variable Trust, as of December 31, 2010, and the related statement of operations for the year then ended, statements of changes in net assets for each of the years in the two year period then ended, and the financial highlights for the years or periods presented. These financial statements and financial highlights are the responsibility of the Fund’s management. Our responsibility is to express an opinion on these financial statements and financial highlights based on our audits.
We conducted our audits in accordance with the standards of the Public Company Accounting Oversight Board (United States). Those standards require that we plan and perform the audit to obtain reasonable assurance about whether the financial statements and financial highlights are free of material misstatement. An audit includes examining, on a test basis, evidence supporting the amounts and disclosures in the financial statements. Our procedures included confirmation of securities owned as of December 31, 2010, by correspondence with custodian and brokers, or by other appropriate auditing procedures. An audit also includes assessing the accounting principles used and significant estimates made by management, as well as evaluating the overall financial statement presentation. We believe that our audits provide a reasonable basis for our opinion.
In our opinion, the financial statements and financial highlights referred to above present fairly, in all material respects, the financial position of the Wells Fargo Advantage VT Small Cap Value Fund as of December 31, 2010, the results of its operations for the year then ended, changes in its net assets for each of the years in the two year period then ended, and the financial highlights for the years or periods presented, in conformity with U.S. generally accepted accounting principles.
Boston,Massachusetts
February 25, 2011
| | |
| Other Information (Unaudited) | | Wells Fargo Advantage VT Small Cap Value Fund 29 |
PROXY VOTING INFORMATION
A description of the policies and procedures that the Fund uses to determine how to vote proxies relating to portfolio securities is available without charge, upon request, by calling 1-800-222-8222, visiting our Web site at www.wellsfargo.com/advantagefunds, or visiting the SEC Web site at www.sec.gov. Information regarding how the Fund voted proxies relating to portfolio securities during the most recent 12-month period ended June 30 is available without charge on the Fund’s Web site at www.wellsfargo.com/advantagefunds or by visiting the SEC Web site at www.sec.gov.
TAX INFORMATION
Pursuant to Section 854(b)(2) of the Internal Revenue Code, the Fund designates a percentage of its ordinary income dividends distributed during the year ended December 31, 2010 as qualifying for the corporate dividends-received deduction:
| | | | | |
| | | Dividend-Received |
| | | Deduction (% of |
| | | Ordinary Fund |
| | | Income Dividends) |
| | | | 31.08 | % |
| | |
| 30 Wells Fargo Advantage VT Small Cap Value Fund | | Other Information (Unaudited) |
PORTFOLIO HOLDINGS INFORMATION
The complete portfolio holdings for the Fund are publicly available on the Fund’s Web site (www.wellsfargo.com/advantagefunds) on a monthly, 30-day or more delayed basis. In addition, top ten holdings information for the Fund is publicly available on the Fund’s Web site on a monthly, seven-day or more delayed basis. The Fund files its complete schedule of portfolio holdings with the SEC for the first and third quarters of each fiscal year on Form N-Q, which is available without charge by visiting the SEC Web site at www.sec.gov. In addition, the Fund’s Form N-Q may be reviewed and copied at the SEC’s Public Reference Room in Washington, DC, and at regional offices in New York City, at 233 Broadway, and in Chicago, at 175 West Jackson Boulevard, Suite 900. Information about the Public Reference Room may be obtained by calling 1-800-SEC-0330.
BOARD OF TRUSTEES
The following table provides basic information about the Board of Trustees (the “Trustees”) of the Wells Fargo Variable Trust (the “Trust”) and Officers of the Trust. This table should be read in conjunction with the Prospectus and the Statement of Additional Information1 of the Fund. Each of the Trustees and Officers listed below acts in identical capacities for the Wells Fargo Advantage family of funds, which consists of 152 funds comprising the Trust, Wells Fargo Funds Trust, Wells Fargo Master Trust and four closed-end funds (collectively the “Fund Complex”). All of the Trustees are also Members of the Audit and Governance Committees of each Trust in the Fund Complex. The mailing address of each Trustee and Officer is 525 Market Street, 12th Floor, San Francisco, CA 94105. Each Trustee and Officer serves an indefinite term, however, each Trustee serves such term until reaching the mandatory retirement age established by the Trustees.
Independent Trustees
| | | | | | | |
| Name and | | Position Held and | | | | |
| Year of Birth | | Length of Service | | Principal Occupations During Past Five Years | | Other Directorships |
| |
| Peter G. Gordon (Born 1942) | | Trustee, since 1998; Chairman, since 2005 (Lead Trustee since 2001) | | Co-Founder, Chairman, President and CEO of Crystal Geyser. Water Company. Trustee Emeritus, Colby College | | Asset Allocation
Trust |
| | | | | | | |
| Isaiah Harris, Jr. (Born 1952) | | Trustee, since 2009 | | Retired. Prior thereto, President and CEO of BellSouth Advertising and Publishing Corp. from 2005 to 2007, President and CEO of BellSouth Enterprises from 2004 to 2005 and President of BellSouth Consumer Services from 2000 to 2003. Emeritus member of the Iowa State University Foundation Board of Governors. Emeritus Member of the Advisory Board of Iowa State University School of Business. Mr. Harris is a certified public accountant. | | CIGNA Corporation; Deluxe Corporation; Asset Allocation Trust |
| | | | | | | |
| Judith M. Johnson (Born 1949) | | Trustee, since 2008 | | Retired. Prior thereto, Chief Executive Officer and Chief Investment Officer of Minneapolis Employees Retirement Fund from 1996 to 2008. Ms. Johnson is an attorney, certified public accountant and a certified managerial accountant. | | Asset Allocation
Trust |
| | | | | | | |
| Leroy Keith, Jr. (Born 1939) | | Trustee, since 2010 | | Chairman, Bloc Global Services (development and construction), Trustee of the Evergreen Funds from 1983 to 2010. Former Managing Director, Almanac Capital Management (commodities firm), former Partner, Stonington Partners, Inc. (private equity fund), former Director, Obagi Medical Products Co. and former Director, Lincoln Educational Services. | | Trustee, Virtus Fund Complex (consisting of 45 portfolios as of 12/31/10); Director, Diversapack Co. (packaging company); Asset Allocation Trust |
| | | | | | | |
David F. Larcker
(Born 1951) | | Trustee, since 2009 | | James Irvin Miller Professor of Accounting at the Graduate School of Business, Stanford University, Director of Corporate Governance Research Program and Co-Director of The Rock Center for Corporate Governance since 2006. From 2005 to 2008, Professor of Accounting at the Graduate School of Business, Stanford University. Prior thereto, Ernst & Young Professor of Accounting at The Wharton School, University of Pennsylvania from 1985 to 2005. | | Asset Allocation
Trust |
| | |
| Other Information (Unaudited) | | Wells Fargo Advantage VT Small Cap Value Fund 31 |
| | | | | | | |
| Name and | | Position Held and | | | | |
| Year of Birth | | Length of Service | | Principal Occupations During Past Five Years | | Other Directorship |
| |
| Olivia S. Mitchell (Born 1953) | | Trustee, since 2006 | | International Foundation of Employee Benefit Plans Professor and Chair of the Department of Insurance and Risk Management, Wharton School of the University of Pennsylvania since 1993. Director of Wharton’s Pension Research Council and Boettner Center on Pensions & Retirement Research, and Research Associate at the National Bureau of Economic Research. Previously, Cornell University Professor from 1978 to 1993. | | Asset Allocation
Trust |
| | | | | | | |
| Timothy J. Penny (Born 1951) | | Trustee, since 1996 | | President and CEO of Southern Minnesota Initiative Foundation, a non-profit organization, since 2007 and Senior Fellow at the Humphrey Institute Policy Forum at the University of Minnesota since 1995. Member of the Board of Trustees of NorthStar Education Finance, Inc., a non-profit organization, since 2007. | | Asset Allocation
Trust |
| | | | | | | |
| Michael S. Scofield (Born 1943) | | Trustee, since 2010 | | Currently serves on the Investment Company Institute’s Board of Governors and Executive Committee as well the Independent Director’s Counsel Board of Governors and Executive Committee. Former Chairman of the Independent Directors Counsel. Trustee of the Evergreen Funds from 1984 to 2010. Retired Attorney, Law Offices of Michael S. Scofield and former Director and Chairman, Branded Media Corporation (multi-media branding company). | | Asset Allocation
Trust |
| | | | | | | |
| Donald C. Willeke (Born 1940) | | Trustee, since 1996 | | Principal of the law firm of Willeke & Daniels. General Counsel of the Minneapolis Employees Retirement Fund from 1984 until its consolidation into the Minnesota Public Employees Retirement Association on June 30, 2010. | | Asset Allocation
Trust |
Officers
| | | | | | | |
| Name and | | Position Held and | | | | |
| Year of Birth | | Length of Service | | Principal Occupations During Past Five Years | | |
| |
Karla M. Rabusch
(Born 1959) | | President, since 2003 | | Executive Vice President of Wells Fargo Bank, N.A. and President of Wells Fargo Funds Management, LLC since 2003. Senior Vice President and Chief Administrative Officer of Wells Fargo Funds Management, LLC from 2001 to 2003. | | |
| | | | | | | |
| C. David Messman (Born 1960) | | Secretary, since 2000; Chief Legal Counsel, since 2003 | | Senior Vice President and Secretary of Wells Fargo Funds Management, LLC since 2001. Vice President and Managing Counsel of Wells Fargo Bank, N.A. since 1996. | | |
| | | | | | | |
Kasey Phillips
(Born 1970) | | Treasurer, since 2009 | | Senior Vice President of Wells Fargo Funds Management, LLC since 2009. Senior Vice President of Evergreen Investment Management Company, LLC from 2006 to 2010. Treasurer of the Evergreen Funds from 2005 to 2010. Vice President and Assistant Vice President of Evergreen Investment Services, Inc. from 1999 to 2006. | | |
| | | | | | | |
David Berardi
(Born 1975) | | Assistant Treasurer,
since 2009 | | Vice President of Wells Fargo Funds Management, LLC since 2009. Vice President of Evergreen Investment Management Company, LLC from 2008 to 2010. Assistant Vice President of Evergreen Investment Services, Inc. from 2004 to 2008. Manager of Fund Reporting and Control for Evergreen Investment Management Company, LLC from 2004 to 2010. | | |
| | | | | | | |
Jeremy DePalma
(Born 1974) | | Assistant Treasurer,
since 2009 | | Senior Vice President of Wells Fargo Funds Management, LLC since 2009. Senior Vice President of Evergreen Investment Management Company, LLC from 2008 to 2010. Vice President, Evergreen Investment Services, Inc. from 2004 to 2007. Assistant Vice President, Evergreen Investment Services, Inc. from 2000 to 2004 and the head of the Fund Reporting and Control Team within Fund Administration from 2005 to 2010. | | |
| | |
| 32 Wells Fargo Advantage VT Small Cap Value Fund | | Other Information (Unaudited) |
| | | | | | | |
| Name and | | Position Held and | | | | |
| Year of Birth | | Length of Service | | Principal Occupations During Past Five Years | | |
| |
Debra Ann Early
(Born 1964) | | Chief Compliance Officer,
since 2007 | | Chief Compliance Officer of Wells Fargo Funds Management, LLC since 2007. Chief Compliance Officer of Parnassus Investments from 2005 to 2007. Chief Financial Officer of Parnassus Investments from 2004 to 2007 and Senior Audit Manager of PricewaterhouseCoopers LLP from 1998 to 2004. | | |
| | |
| 1. | | The Statement of Additional Information includes additional information about the Fund’s Trustees and is available, without charge, upon request, by calling 1-800-222-8222 or by visiting the Fund’s Web site at www.wellsfargo.com/advantagefunds. |
| | |
| List of Abbreviations | | Wells Fargo Advantage VT Small Cap Value Fund 33 |
The following is a list of common abbreviations for terms and entities which may have appeared in this report.
| | | | | | | |
|
| ABAG | — | Association of Bay Area Governments | | HUD | — | Housing & Urban Development |
| ADR | — | American Depositary Receipt | | HUF | — | Hungarian Forint |
| ADS | — | American Depository Shares | | IDA | — | Industrial Development Authority |
| AMBAC | — | American Municipal Bond Assurance Corporation | | IDAG | — | Industrial Development Agency |
| AMT | — | Alternative Minimum Tax | | IDR | — | Industrial Development Revenue |
| ARM | — | Adjustable Rate Mortgages | | IEP | — | Irish Pound |
| AUD | — | Australian Dollar | | JPY | — | Japanese Yen |
| BART | — | Bay Area Rapid Transit | | KRW | — | Republic of Korea Won |
| BRL | — | Brazil Real | | LIBOR | — | London Interbank Offered Rate |
| CAD | — | Canadian Dollar | | LLC | — | Limited Liability Company |
| CDA | — | Community Development Authority | | LLP | — | Limited Liability Partnership |
| CDO | — | Collateralized Debt Obligation | | LOC | — | Letter of Credit |
| CDSC | — | Contingent Deferred Sales Charge | | LP | — | Limited Partnership |
| CGIC | — | Capital Guaranty Insurance Company | | MBIA | — | Municipal Bond Insurance Association |
| CGY | — | Capital Guaranty Corporation | | MFHR | — | Multi-Family Housing Revenue |
| CHF | — | Swiss Franc | | MFMR | — | Multi-Family Mortgage Revenue |
| CIFG | — | CDC (Caisse des Dépôts et Consignations) IXIS Financial | | MMD | — | Municipal Market Data |
| | | Guarantee | | MTN | — | Medium Term Note |
| COP | — | Certificate of Participation | | MUD | — | Municipal Utility District |
| CP | — | Commercial Paper | | MXN | — | Mexican Peso |
| CTF | — | Common Trust Fund | | MYR | — | Malaysian Ringgit |
| DEM | — | Deutsche Mark | | NATL-RE | — | National Public Finance Guarantee Corporation |
| DKK | — | Danish Krone | | NLG | — | Netherlands Guilder |
| DW&P | — | Department of Water & Power | | NOK | — | Norwegian Krone |
| DWR | — | Department of Water Resources | | NZD | — | New Zealand Dollar |
| ECFA | — | Educational & Cultural Facilities Authority | | PCFA | — | Pollution Control Finance Authority |
| EDFA | — | Economic Development Finance Authority | | PCR | — | Pollution Control Revenue |
| ETET | — | Eagle Tax-Exempt Trust | | PFA | — | Public Finance Authority |
| ETF | — | Exchange-Traded Fund | | PFFA | — | Public Facilities Financing Authority |
| EUR | — | Euro | | plc | — | Public Limited Company |
| FFCB | — | Federal Farm Credit Bank | | PLN | — | Polish Zloty |
| FGIC | — | Financial Guaranty Insurance Corporation | | PSFG | — | Public School Fund Guaranty |
| FHA | — | Federal Housing Authority | | R&D | — | Research & Development |
| FHAG | — | Federal Housing Agency | | RDA | — | Redevelopment Authority |
| FHLB | — | Federal Home Loan Bank | | RDFA | — | Redevelopment Finance Authority |
| FHLMC | — | Federal Home Loan Mortgage Corporation | | REITS | — | Real Estate Investment Trusts |
| FNMA | — | Federal National Mortgage Association | | SEK | — | Swedish Krona |
| FRF | — | French Franc | | SFHR | — | Single Family Housing Revenue |
| FSA | — | Farm Service Agency | | SFMR | — | Single Family Mortgage Revenue |
| GBP | — | Great British Pound | | SGD | — | Singapore Dollar |
| GDR | — | Global Depositary Receipt | | SKK | — | Slovakian Koruna |
| GNMA | — | Government National Mortgage Association | | SLMA | — | Student Loan Marketing Association |
| GO | — | General Obligation | | SPDR | — | Standard & Poor’s Depositary Receipts |
| HCFR | — | Healthcare Facilities Revenue | | STIT | — | Short-Term Investment Trust |
| HEFA | — | Health & Educational Facilities Authority | | TBA | — | To Be Announced |
| HEFAR | — | Higher Education Facilities Authority Revenue | | TRAN | — | Tax Revenue Anticipation Notes |
| HFA | — | Housing Finance Authority | | TRY | — | Turkish Lira |
| HFFA | — | Health Facilities Financing Authority | | USD | — | United States Dollar |
| HKD | — | Hong Kong Dollar | | XLCA | — | XL Capital Assurance |
| | | | | ZAR | — | South African Rand |
This page is intentionally left blank.
More information about Wells Fargo Advantage Funds is available free upon request. To obtain literature, please write, e-mail, visit the Funds’ Web site, or call:
Wells Fargo Advantage Funds
P.O. Box 8266
Boston, MA
02266-8266 E-mail:
wfaf@wellsfargo.com
Web site: www.wellsfargo.com/advantagefunds
Individual Investors: 1- 800-222-8222
Retail Investment Professionals: 1- 888-877-9275
Institutional Investment Professionals: 1- 866-765-0778
This report and the financial statements contained herein are submitted for the general information of the shareholders of Wells Fargo Advantage Funds. If this report is used for promotional purposes, distribution of the report must be accompanied or preceded by a current prospectus. For a prospectus containing more complete information, including charges and expenses, call 1-800-222-8222 or visit the Fund’s Web site at www.wellsfargo.com/advantagefunds. Please consider the investment objectives, risks, charges, and expenses of the investment carefully before investing. This and other information about Wells Fargo Advantage Funds can be found in the current prospectus. Read the prospectus carefully before you invest or send money.
Wells Fargo Funds Management, LLC, a wholly owned subsidiary of Wells Fargo & Company, provides investment advisory and administrative services for Wells Fargo Advantage Funds. Other affiliates of Wells Fargo & Company provide subadvisory and other services for the Funds. The Funds are distributed by Wells Fargo Funds Distributor, LLC, Member FINRA/SIPC, an affiliate of Wells Fargo & Company.
NOT FDIC INSURED § NO BANK GUARANTEE § MAY LOSE VALUE
| | | | |
| | | | | |
| © 2011 Wells Fargo Funds Management, LLC. All rights reserved. | | www.wellsfargo.com/advantagefunds | | 200920 02-11 |
| | | | | AVT8/AR154 12-10 |
WELLS FARGO ADVANTAGE VARIABLE TRUST FUNDS
| | § | | Wells Fargo Advantage VT Total Return Bond Fund |
Reduce clutter. Save trees.
Sign up for electronic delivery of prospectuses and shareholder reports at www.wellsfargo.com/advantagedelivery
Contents
| | | | | |
|
Letter to Shareholders | | | 2 | |
| | | | | |
Performance Highlights | | | 6 | |
| | | | | |
Fund Expenses | | | 10 | |
| | | | | |
Portfolio of Investments | | | 11 | |
| | | | | |
Financial Statements | | | | |
| Statement of Assets and Liabilities | | | 26 | |
| Statement of Operations | | | 27 | |
| Statements of Changes in Net Assets | | | 28 | |
| Financial Highlights | | | 30 | |
| | | | | |
Notes to Financial Statements | | | 32 | |
| | | | | |
Report of Independent Registered Public Accounting Firm | | | 39 | |
| | | | | |
Other Information | | | 40 | |
| | | | | |
List of Abbreviations | | | 44 | |
The views expressed are as of December 31, 2010, and are those of the Fund managers. Any reference to a specific security in this report is not a recommendation to purchase or sell any specific security or adopt any investment strategy. The views are subject to change at any time in response to changing circumstances in the market and are not intended to predict or guarantee the future performance of any individual security, market sector or the markets generally, or the Wells Fargo Advantage VT Total Return Bond Fund.
NOT FDIC INSURED § NO BANK GUARANTEE § MAY LOSE VALUE
WELLS FARGO
INVESTMENT HISTORY
| | | |
|
1932 | | Keystone creates one of the first mutual fund families. |
| | | |
1971 | | Wells Fargo & Company introduces one of the first institutional index funds. |
| | | |
1978 | | Wells Fargo applies Markowitz and Sharpe’s research on Modern Portfolio Theory to introduce one of the industry’s first Tactical Asset Allocation (TAA) models in institutional separately managed accounts. |
| | | |
1984 | | Wells Fargo Stagecoach Funds launches its first asset allocation fund. |
| | | |
1989 | | The Tactical Asset Allocation (TAA) Model is first applied to Wells Fargo’s asset allocation mutual funds. |
| | | |
1994 | | Wells Fargo introduces the LifePath Funds, one of the first suites of target date funds (now the Wells Fargo Advantage Dow Jones Target Date FundsSM). |
| | | |
1996 | | Evergreen Investments and Keystone Funds merge. |
| | | |
1997 | | Wells Fargo launches Wells Fargo Advantage WealthBuilder PortfoliosSM, a fund-of-funds suite of products that includes the use of quantitative models to shift assets among investment styles. |
| | | |
1999 | | Norwest Advantage Funds and Stagecoach Funds are reorganized into Wells Fargo Funds after the merger of Norwest and Wells Fargo. |
| | | |
2002 | | Evergreen Retail and Evergreen Institutional companies form the umbrella asset management company, Evergreen Investments. |
| | | |
2005 | | The integration of Strong Funds with Wells Fargo Funds creates Wells Fargo Advantage Funds, resulting in one of the top 20 mutual fund companies in the United States. |
| | | |
2006 | | Wells Fargo Advantage Funds relaunches the target date product line as Wells Fargo Advantage Dow Jones Target Date Funds. |
| | | |
2010 | | The mergers and reorganizations of Evergreen and Wells Fargo Advantage mutual funds are completed, unifying the families under the brand of Wells Fargo Advantage Funds. |
Wells Fargo Advantage Funds ®
Wells Fargo Advantage Funds skillfully guides institutions, financial advisors, and individuals through the investment terrain to help them reach their financial objectives. Everything we do on behalf of investors is backed by our unique combination of qualifications.
Strength
Our organization is built on the standards of integrity and service established by our parent company—Wells Fargo & Company—more than 150 years ago. And, because we’re part of a highly diversified financial enterprise, we offer the depth of resources to help investors succeed.
Expertise
Our multi-boutique model offers investors access to the independent thinking of premier investment managers that have been chosen for their time-tested strategies. While each team specializes in a specific investment strategy, collectively they provide investors a wide choice of distinct investment styles. Our dedication to investment excellence doesn’t end with our expertise in manager selection—risk management, analysis, and rigorous ongoing review seek to ensure each manager’s investment process remains consistent.
Partnership
Our collaborative approach is built around understanding the needs and goals of our clients. By adhering to core principles of sound judgment and steady guidance, we support you through every stage of the investment decision process.
Carefully consider the investment objectives, risks, charges, and expenses before investing. For a current prospectus for Wells Fargo Advantage Funds containing this and other information, visit wellsfargo.com/advantagefunds. Read it carefully before investing.
Wells Fargo Funds Management, LLC, a wholly owned subsidiary of Wells Fargo & Company, provides investment advisory and administrative services for Wells Fargo Advantage Funds ®. Other affiliates of Wells Fargo & Company provide subadvisory and other services for the Funds. The Funds are distributed by Wells Fargo Funds Distributor, LLC, Member FINRA/SIPC, an affiliate of Wells Fargo & Company.
The “Dow Jones Target Date Indexes” are a product of Dow Jones Indexes, a licensed trademark of CME Group Index Services LLC (“CME”). “Dow Jones” and “Dow Jones Target Date Indexes” are service marks of Dow Jones Trademark Holdings, LLC, and have been licensed for use for certain purposes by CME and sublicensed for use by Global Index Advisors, Inc., and Wells Fargo Funds Management, LLC. The Dow Jones Target Date Indexes are based in part on the Barclays Capital Bond Indexes, which are published by Barclays Capital Inc. The Wells Fargo Advantage Dow Jones Target Date Funds, based on the Dow Jones Target Date Indexes, are not sponsored, endorsed, sold, or promoted by Dow Jones, CME or Barclays Capital or any of their respective affiliates, and neither Dow Jones, CME nor Barclays Capital nor any of their respective affiliates makes any representation regarding the advisability of investing in such product(s) and/or about the quality, accuracy, and/or completeness of the Dow Jones Target Date Indexes or the Barclays Capital Bond Indexes. IN NO EVENT SHALL DOW JONES, CME, BARCLAYS CAPITAL, OR ANY OF THEIR LICENSORS HAVE ANY LIABILITY FOR ANY SPECIAL, PUNITIVE, INDIRECT, OR CONSEQUENTIAL DAMAGES (INCLUDING LOST PROFITS), EVEN IF NOTIFIED OF THE POSSIBILITY OF SUCH DAMAGES.
NOT FDIC INSURED § NO BANK GUARANTEE § MAY LOSE VALUE
Not part of the annual report.
Wells Fargo Advantage Funds offers more than 120 mutual funds across a wide range of asset classes, representing over $236 billion in assets under management, as of December 31, 2010.
| | | | | |
|
Equity Funds | | | | |
| |
| Asia Pacific Fund | | Enterprise Fund† | | Opportunity Fund† |
| C&B Large Cap Value Fund | | Equity Value Fund | | Precious Metals Fund |
| C&B Mid Cap Value Fund | | Global Opportunities Fund | | Premier Large Company Growth Fund |
| Capital Growth Fund | | Growth Fund | | Small Cap Growth Fund |
| Classic Value Fund | | Growth Opportunities Fund | | Small Cap Opportunities Fund |
| Common Stock Fund | | Health Care Fund | | Small Cap Value Fund |
| Core Equity Fund | | Index Fund | | Small Company Growth Fund |
| Disciplined Global Equity Fund | | International Equity Fund | | Small Company Value Fund |
| Disciplined U.S. Core Fund | | International Value Fund | | Small/Mid Cap Core Fund |
| Disciplined Value Fund | | Intrinsic Small Cap Value Fund | | Small/Mid Cap Value Fund |
Discovery Fund† | | Intrinsic Value Fund | | Social Sustainability Fund† |
| Diversified Equity Fund | | Intrinsic World Equity Fund | | Special Mid Cap Value Fund |
| Diversified International Fund | | Large Cap Core Fund | | Special Small Cap Value Fund |
| Diversified Small Cap Fund | | Large Cap Growth Fund | | Specialized Technology Fund |
| Emerging Growth Fund | | Large Company Value Fund | | Strategic Large Cap Growth Fund |
| Emerging Markets Equity Fund | | Mid Cap Growth Fund | | Traditional Small Cap Growth Fund |
Endeavor Select Fund† | | Omega Growth Fund | | Utility and Telecommunications Fund |
| | | | | |
|
Bond Funds | | | | |
| |
| Adjustable Rate Government Fund | | Inflation-Protected Bond Fund | | Short-Term Bond Fund |
| California Limited-Term Tax-Free Fund | | Intermediate Tax/AMT-Free Fund | | Short-Term High Yield Bond Fund |
| California Tax-Free Fund | | International Bond Fund | | Short-Term Municipal Bond Fund |
| Colorado Tax-Free Fund | | Minnesota Tax-Free Fund | | Strategic Municipal Bond Fund |
| Government Securities Fund | | Municipal Bond Fund | | Total Return Bond Fund |
| High Income Fund | | North Carolina Tax-Free Fund | | Ultra Short-Term Income Fund |
| High Yield Bond Fund | | Pennsylvania Tax-Free Fund | | Ultra Short-Term Municipal Income Fund |
| Income Plus Fund | | Short Duration Government Bond Fund | | Wisconsin Tax-Free Fund |
| | | | | |
|
Asset Allocation Funds | | | | |
| |
| Asset Allocation Fund | | WealthBuilder Equity Portfolio† | | Target 2020 Fund† |
| Conservative Allocation Fund | | WealthBuilder Growth Allocation Portfolio† | | Target 2025 Fund† |
| Diversified Capital Builder Fund | | WealthBuilder Growth Balanced Portfolio† | | Target 2030 Fund† |
| Diversified Income Builder Fund | | WealthBuilder Moderate Balanced Portfolio† | | Target 2035 Fund† |
| Growth Balanced Fund | | WealthBuilder Tactical Equity Portfolio† | | Target 2040 Fund† |
| Index Asset Allocation Fund | | Target Today Fund† | | Target 2045 Fund† |
| Moderate Balanced Fund | | Target 2010 Fund† | | Target 2050 Fund† |
WealthBuilder Conservative Allocation Portfolio† | | Target 2015 Fund† | | |
| | | | | |
|
Money Market Funds | | | | |
| |
| 100% Treasury Money Market Fund | | Minnesota Money Market Fund | | New Jersey Municipal Money Market Fund |
| California Municipal Money Market Fund | | Money Market Fund | | New York Municipal Money Market Fund |
| Cash Investment Money Market Fund | | Municipal Cash Management Money Market Fund | | Pennsylvania Municipal Money Market Fund |
| Government Money Market Fund | | Municipal Money Market Fund | | Prime Investment Money Market Fund |
Heritage Money Market Fund† | | National Tax-Free Money Market Fund | | Treasury Plus Money Market Fund |
| | | | | |
|
Variable Trust Funds1 | | | | |
| |
| VT Core Equity Fund | | VT Intrinsic Value Fund | | VT Small Cap Value Fund |
VT Discovery Fund† | | VT Omega Growth Fund | | VT Total Return Bond Fund |
| VT Index Asset Allocation Fund | | VT Opportunity Fund† | | |
| VT International Equity Fund | | VT Small Cap Growth Fund | | |
An investment in a money market fund is not insured or guaranteed by the Federal Deposit Insurance Corporation or any other government agency. Although the Wells Fargo Advantage Money Market Funds seek to preserve the value of your investment at $1.00 per share, it is possible to lose money by investing in a money market fund.
| | |
| 1. | | The Variable Trust Funds are generally available only through insurance company variable contracts. |
| |
| † | | In this report, the Wells Fargo Advantage Discovery FundSM, Wells Fargo Advantage Endeavor Select FundSM, Wells Fargo Advantage Enterprise FundSM, Wells Fargo Advantage Opportunity FundSM, Wells Fargo Advantage Social Sustainability FundSM, Wells Fargo Advantage WealthBuilder Conservative Allocation PortfolioSM, Wells Fargo Advantage WealthBuilder Equity PortfolioSM, Wells Fargo Advantage WealthBuilder Growth Allocation PortfolioSM, Wells Fargo Advantage WealthBuilder Growth Balanced PortfolioSM, Wells Fargo Advantage WealthBuilder Moderate Balanced PortfolioSM, Wells Fargo Advantage WealthBuilder Tactical Equity PortfolioSM, Wells Fargo Advantage Dow Jones Target Today FundSM, Wells Fargo Advantage Dow Jones Target 2010 FundSM, Wells Fargo Advantage Dow Jones Target 2015 FundSM, Wells Fargo Advantage Dow Jones Target 2020 FundSM, Wells Fargo Advantage Dow Jones Target 2025 FundSM, Wells Fargo Advantage Dow Jones Target 2030 FundSM, Wells Fargo Advantage Dow Jones Target 2035 FundSM, Wells Fargo Advantage Dow Jones Target 2040 FundSM, Wells Fargo Advantage Dow Jones Target 2045 FundSM, Wells Fargo Advantage Dow Jones Target 2050 FundSM, Wells Fargo Advantage Heritage Money Market FundSM, Wells Fargo Advantage VT Discovery FundSM, and Wells Fargo Advantage VT Opportunity FundSM are referred to as the Discovery Fund, Endeavor Select Fund, Enterprise Fund, Opportunity Fund, Social Sustainability Fund, WealthBuilder Conservative Allocation Portfolio, WealthBuilder Equity Portfolio, WealthBuilder Growth Allocation Portfolio, WealthBuilder Growth Balanced Portfolio, WealthBuilder Moderate Balanced Portfolio, WealthBuilder Tactical Equity Portfolio, Target Today Fund, Target 2010 Fund, Target 2015 Fund, Target 2020 Fund, Target 2025 Fund, Target 2030 Fund, Target 2035 Fund, Target 2040 Fund, Target 2045 Fund, Target 2050 Fund, Heritage Money Market Fund, VT Discovery Fund, and VT Opportunity Fund, respectively. |
Not part of the annual report.
| | |
| 2 Wells Fargo Advantage VT Total Return Bond Fund | | Letter to Shareholders |
Karla M. Rabusch,
President
Wells Fargo Advantage Funds
Both the fixed income and equity markets delivered strong full-year returns against the backdrop of a strengthening economy.
Dear Valued Shareholder:
We are pleased to provide you with this annual report for the Wells Fargo Advantage VT Total Return Bond Fund for the 12 months that ended December 31, 2010. Both the fixed income and equity markets delivered strong full-year returns against the backdrop of a strengthening economy. However, the year was not without its share of macroeconomic challenges and market volatility, once again highlighting the value of a sound, well-diversified investment strategy. As always, we believe that such a strategy can enable investors to balance risks and opportunities as they pursue long-term financial goals in a dynamic market environment.
The economic recovery stayed on track.
The U.S. economic recovery that began in the summer of 2009 gained momentum in 2010, particularly toward the end of the year. Gross domestic product (GDP) grew at an annualized rate of 3.2% in the fourth quarter of 2010—capping a streak of six consecutive quarters of positive GDP growth—and 2.9% for the full year. Although the path of recovery has been uneven at times and growth remains subpar compared with previous recoveries, the general consensus among economists is that the economy will likely avoid a double-dip recession. That said, persistent weakness in the labor and housing markets bears close watching in the months ahead.
Jobs and housing remained troublesome.
At the end of the year, the unemployment rate stood at 9.4%, down from 9.9% a year earlier, but still stubbornly high. Unfortunately, the drop may be attributable more to a decline in the labor force than a meaningful uptick in hiring. In fact, employers added just 1.1 million jobs for all of 2010, suggesting that the improving economy has yet to translate into widespread hiring. Meanwhile, the beleaguered housing market was an ongoing source of concern, despite some tentative late-year signs of stabilization.
Other economic data were more encouraging, reflecting greater confidence in the recovery on the part of both consumers and businesses. Retail sales came in strong at certain points during the year, including the critical holiday shopping season, and industrial production and new orders have picked up. Although still reluctant to hire, businesses have gradually increased spending in other areas, such as equipment and technology. Core inflation, which excludes volatile food and energy prices, remained benign.
The Fed continued to do its part.
With inflation subdued, the Federal Reserve (the Fed) held its target range for the federal funds rate—a proxy for short-term interest rates—steady at 0% to 0.25%. In its final statement of 2010, the Fed noted that economic expansion continues to be restrained by headwinds such as high unemployment, modest income growth, lower housing wealth, and tight credit. As a result, the Fed indicated that it intends to keep short-term rates at historically low levels for as long as needed to promote a more robust recovery.
| | |
| Letter to Shareholders | | Wells Fargo Advantage VT Total Return Bond Fund 3 |
The Fed also stated that it plans to proceed with other stimulus measures, including its second round of quantitative easing (QE2)—a plan to purchase $600 billion in long-term Treasury securities by mid-2011. The ‘preannouncement’ of QE2 in the third quarter of 2010 marked a turning point for the equity markets in that it ushered in a favorable shift in investor sentiment. By and large, investors interpreted the plan as further evidence of the Fed’s commitment to avoiding deflation and spurring economic growth.
2010 was another solid year for fixed income and equities.
Fixed Income securities generally performed well during the year, benefitting from a continued rally in U.S. Treasuries and improving economic conditions. Along with more upbeat economic data, better-than-expected corporate earnings power played a role in driving stock prices higher and corporate bond yields lower. Throughout the year, quarterly earnings per share for the majority of companies in the S&P 500 Index consistently exceeded Wall Street estimates. As 2010 drew to a close, the midterm congressional elections and the extension of the Bush-era tax cuts provided additional tailwinds, helping the markets finish the year on a strong note.
It was the second straight year of double-digit total returns for the broad equity market indexes. The S&P 500 Index and the Dow Jones Industrial Average advanced 15.1% and 14.1%, respectively, while the tech-heavy NASDAQ Composite Index returned 18.2%. Investors were generally rewarded across the market-capitalization spectrum— with small- and mid-cap stocks outpacing large-cap stocks—as well as across most economic sectors. In terms of investment styles, growth stocks outperformed their value counterparts for the year.
To be sure, the gains were hard-earned, as the markets had to contend with numerous issues along the way, including the European sovereign debt crisis, China’s efforts to slow growth, and doubts about the sustainability of the domestic recovery. The second quarter in particular witnessed bouts of heightened market volatility, most notably the so-called “flash crash” in May. As the year progressed, however, volatility—as measured by the Chicago Board Options Exchange Volatility Index—abated amid reduced fears of a double-dip recession.
Investors should keep a long-term perspective.
In our view, the equity markets’ dramatic rebound over the past two years from a severe downturn underscores the importance of maintaining a disciplined, long-term investment strategy through changing market cycles. By staying focused on your long-term goals, you may be better positioned both to navigate falling markets and participate in rising markets.
To help you build a well-diversified strategy based on your personal objectives and risk tolerance, Wells Fargo Advantage Funds ® offers more than 120 mutual funds and other investments covering a wide range of asset classes and investment styles. Although diversification cannot guarantee an investment profit or prevent losses, we believe it can be an effective way to manage investment risk and potentially smooth out overall portfolio performance.
Along with more upbeat economic data, better-than-expected corporate earnings power played a role in driving stock prices higher.
| | |
| 4 Wells Fargo Advantage VT Total Return Bond Fund | | Letter to Shareholders |
Thank you for choosing Wells Fargo Advantage Funds. We appreciate your continued confidence in us and are committed to helping you meet your financial needs. If you have any questions about your investments, please contact your investment professional, call us at 1-800-222-8222, or visit www.wellsfargo.com/advantagefunds.
Sincerely,
Karla M. Rabusch
President
Wells Fargo Advantage Funds
This page is intentionally left blank.
| | |
| 6 Wells Fargo Advantage VT Total Return Bond Fund | | Performance Highlights (Unaudited) |
Wells Fargo Advantage VT Total Return Bond Fund
INVESTMENT OBJECTIVE
The Fund seeks total return, consisting of income and capital appreciation.
INVESTMENT ADVISER
Wells Fargo Funds Management, LLC
SUB-ADVISER
Wells Capital Management Incorporated
PORTFOLIO MANAGERS
Troy Ludgood
Thomas O’Connor, CFA
FUND INCEPTION
September 20, 1999
PERFORMANCE SUMMARY
| | | | | |
| 12 Month Total Return as of December 31, 2010 | | | | |
| | | |
| Class 2 | | | 7.04 | % |
Barclays Capital U.S. Aggregate Bond Index1 | | | 6.54 | % |
Figures quoted represent past performance, which is no guarantee of future results and do not reflect the deduction of taxes that a shareholder may pay on fund distributions or the redemption of fund shares. Investment return and principal value of an investment will fluctuate so that an investor’s shares, when redeemed, may be worth more or less than their original cost. Current performance may be lower or higher than the performance data quoted. Current month-end performance is available by calling 1-866-765-0778. Performance figures of the Fund do not reflect fees charged pursuant to the terms of variable life insurance policies and variable annuity contracts.
The adviser has committed, through April 30, 2011, to waive fees and/or reimburse expenses to maintain the contractual expense cap at 0.90% for the Class 2 shares excluding acquired fund fees and certain other expenses. Without these reductions, the Fund’s returns would have been lower. The Fund’s net expense ratio is 0.91% for the Class 2 shares. The Fund’s gross expense ratio is 1.21% for the Class 2 shares.
| | |
| 1. | | The Barclays Capital U.S. Aggregate Bond Index is composed of the Barclays Capital Government/Credit Index and the Mortgage-Backed Securities Index and includes U.S. Treasury issues, agency issues, corporate bond issues, and mortgage-backed securities. You cannot invest directly in an index. |
| |
| 2. | | The chart compares the performance of the Wells Fargo Advantage VT Total Return Bond Fund Class 2 for the most recent ten years of the Fund with the Barclays Capital U.S. Aggregate Bond Index. The chart assumes a hypothetical $10,000 investment and reflects all operating expenses of the Fund. |
| | |
| Performance Highlights (Unaudited) | | Wells Fargo Advantage VT Total Return Bond Fund 7 |
Wells Fargo Advantage VT Total Return Bond Fund (continued)
MANAGER’S DISCUSSION
Fund Highlights
| ▪ | | The Fund outperformed its benchmark during the 12-month period that ended December 31, 2010, due mainly to specific security selections in agency mortgages, corporate bonds, asset-backed securities (ABS), and commercial mortgage-backed securities (CMBS). |
| |
| ▪ | | Broad overweights in the CMBS and ABS sectors contributed to excess performance during the period. |
| |
| ▪ | | Our underweights in agency debt and lower-rated subordinated CMBS tranches detracted from performance. Our overweight in agency CMBS also detracted from performance. |
Lower-quality securities generally outperformed higher-quality securities during the period.
During 2010, lower-quality assets outperformed Treasuries as the economic outlook continually improved. Liquidity provided by the Federal Reserve’s second round of quantitative easing (QE2) poured into virtually every corner of the global capital markets, benefiting all spread products. The CMBS sector was the top performer of the Barclays Capital U.S. Aggregate Bond Index, as conditions in the commercial real estate lending markets continued to improve and market loss estimates decreased. The mortgage sector, led by higher-coupon mortgages, outperformed Treasuries. Despite bouts of choppiness in the market due to European sovereign stress and renewed tensions in the Korean Peninsula, the credit sector also outperformed.
Economic indicators were mixed earlier in the year, before improving sharply in the fourth quarter, particularly in December, as manufacturing, retail sales, and consumer confidence data all came in better than expected. Treasury yields moved significantly lower during the first three quarters of 2010, with longer-dated bonds outperforming. Short-term yields were more stable, with the 2-year Treasury falling from 1.14% at the start of the year to a low of 0.33% early in the fourth quarter, while the 5-year Treasury fell from a yield of 2.68% to a low of 1.03%. However, as economic data came in better than expected in the fourth quarter, Treasury yields reversed course, rising 20 to 80 basis points (100 basis points equals one percentage point) across the curve from their lows.
An overweight in credits and tactical trading in structured products helped performance.
Although we began and ended 2010 with close to a 4.0% overweight in credits, our positioning was quite dynamic throughout the course of the year. During the first
| | |
| 3. | | Portfolio allocation is subject to change and is calculated based on the total long-term investments of the Fund. |
| | |
| 8 Wells Fargo Advantage VT Total Return Bond Fund | | Performance Highlights (Unaudited) |
Wells Fargo Advantage VT Total Return Bond Fund (continued)
quarter, we increased credit exposure by adding positions in high-quality defensive corporates, such as Pepsi, Kraft, and Wal-Mart. At the same time, we reduced positioning in the information technology and energy sectors as spread levels met our relative-value targets. Additionally, we pared back noncorporate exposure on strength. Credit markets were hit hard in the second quarter, as risk aversion surfaced in response to the European sovereign crisis, the lawsuit by the Securities and Exchange Commission against Goldman Sachs, uncertain bank regulation, and the Gulf of Mexico oil spill. We reduced exposure in names that we viewed as most vulnerable to these pressures. Volatility waned during the summer as many of these issues were addressed, and spreads rallied going into the fourth quarter. We used the record new-issue market in September to increase corporate exposure and maintained that overweight through year-end, ending with a 4.2% overweight.
In agency mortgages, we moved to a risk-adjusted underweight early in 2010, ahead of the end of the Fed’s mortgage-backed securities purchase program. In the third quarter, mortgages underperformed due to faster-than-expected prepayment speeds, and we moved to an overweight. We ended the year close to neutral by shifting our coupon exposure to take advantage of improved relative value in lower-coupon mortgages.
We found good relative-value trading opportunities in the CMBS sector throughout the year and increased our risk-adjusted overweight from 1.9% to 3.0%. Throughout the year, we tactically traded around our overweight in seasoned CMBS bonds, and in the fourth quarter we added exposure to bonds that originated in 2005 with 30% credit enhancement, as well as new 2009 and 2010 CMBS deals. During 2010, we increased our consumer ABS overweight from 4.8% to 5.8%, adding student loan floating-rate notes (FRNs) while reducing our overweight to credit card FRNs. We also executed a number of relative-value swaps within the credit card and student loan sectors during 2010.
Continued improvement in the U.S. economy may benefit riskier domestic securities.
Favorable momentum in the U.S. economy appears to be well established, with most indicators pointing to accelerating growth in the first half of 2011. Manufacturing surveys remain strong, and consumer demand has picked up. With good fundamental momentum and robust liquidity in the markets provided by accommodative monetary policy, prospects for riskier domestic assets, such as U.S. corporates, ABS, CMBS, and MBS, remain favorable. We are modestly overweight in those sectors. Improving confidence in the U.S. banking sector would be a welcome positive for corporate markets, while limited net issuance in ABS and CMBS should provide a good technical backdrop as debt outstanding declines. In mortgages, rising interest rates and slower-than-expected prepayment speeds have resulted in improved relative-value opportunities in lower coupons.
Longer-term, we are monitoring potential risks that the markets could encounter in 2011. In addition to the risks of exogenous shocks arising from geopolitical developments or policy action, we are considering economic scenarios in which the Federal Reserve could begin to tighten monetary policy. Mindful of potential surprises, we remain focused on bottom-up security selection as the primary driver of performance in 2011.
| | |
| Performance Highlights (Unaudited) | | Wells Fargo Advantage VT Total Return Bond Fund 9 |
Wells Fargo Advantage VT Total Return Bond Fund (continued)
AVERAGE ANNUAL TOTAL RETURN (%) (AS OF DECEMBER 31, 2010)
| | | | | | | | | | | | | | | | | | | | | | | | | | | | | |
| | | | | | | | | | | | | | | | | | | | | | | Expense Ratios4 |
| | | Inception Date | | 6 Months* | | 1 Year | | 5 Year | | 10 Year | | Gross | | Net5 |
| Class 2 | | | 9/20/1999 | | | | 1.46 | | | | 7.04 | | | | 6.24 | | | | 6.09 | | | | 1.21 | % | | | 0.91 | % |
Barclays Capital U.S. Aggregate Bond Index1 | | | | | | | 1.15 | | | | 6.54 | | | | 5.80 | | | | 5.84 | | | | | | | | | |
| | |
| * | | Returns for periods of less than one year are not annualized. |
Figures quoted represent past performance, which is no guarantee of future results and do not reflect the deduction of taxes that a shareholder may pay on fund distributions or the redemption of fund shares. Investment return and principal value of an investment will fluctuate so that an investor’s shares, when redeemed, may be worth more or less than their original cost. Current performance may be lower or higher than the performance data quoted. Current month-end performance is available by calling 1-866-765-0778. Performance figures of the Fund do not reflect fees charged pursuant to the terms of variable life insurance policies and variable annuity contracts.
Bond fund values fluctuate in response to the financial condition of individual issuers, general market and economic conditions, and changes in interest rates. In general, when interest rates rise, bond fund values fall and investors may lose principal value. The use of derivatives may reduce returns and/or increase volatility. Active trading results in increased turnover and trading expenses and may generate higher short-term capital gains. Certain investment strategies tend to increase the total risk of an investment (relative to the broader market). This Fund is exposed to foreign investment risk and mortgage- and asset- backed securities risk. Consult the Fund’s prospectus for additional information on these and other risks.
Please refer to the prospectus provided by your participating insurance company for detailed information describing the separate accounts for information regarding surrender charges, mortality and expense risk fees and other charges that may be assessed by the participating insurance companies.
| | |
| 4. | | Reflects the expense ratio as stated in the May 1, 2010 prospectus. |
| |
| 5. | | The adviser has committed, through April 30, 2011, to waive fees and/or reimburse expenses to maintain the contractual expense cap at 0.90% for Class 2 shares, excluding acquired fund fees and certain other expenses. Without these reductions, the Fund’s returns would have been lower. |
| | |
| 10 Wells Fargo Advantage VT Total Return Bond Fund | | Fund Expenses (Unaudited) |
As a shareholder of the Fund, you incur two types of costs: (1) transaction costs, including sales charges (loads) on purchase payments, redemption fees (if any) and exchange fees (if any); and (2) ongoing costs, including management fees; distribution (12b-1) and/or shareholder service fees; and other Fund expenses. This example is intended to help you understand your ongoing costs (in dollars) of investing in the Fund and to compare these costs with the ongoing costs of investing in other mutual funds.
The example is based on an investment of $1,000 invested at the beginning of the six-month period and held for the entire period from July 1, 2010 to December 31, 2010.
Actual expenses
The “Actual” line of the table below provides information about actual account values and actual expenses. You may use the information in this line, together with the amount you invested, to estimate the expenses that you paid over the period. Simply divide your account value by $1,000 (for example, an $8,600 account value divided by $1,000 = 8.6), then multiply the result by the number in the “Actual” line under the heading entitled “Expenses Paid During Period” for your applicable class of shares to estimate the expenses you paid on your account during this period.
Hypothetical example for comparison purposes
The “Hypothetical” line of the table below provides information about hypothetical account values and hypothetical expenses based on the Fund’s actual expense ratio and an assumed rate of return of 5% per year before expenses, which is not the Fund’s actual return. The hypothetical account values and expenses may not be used to estimate the actual ending account balance or expenses you paid for the period. You may use this information to compare the ongoing costs of investing in the Fund and other funds. To do so, compare this 5% hypothetical example with the 5% hypothetical examples that appear in the shareholder reports of the other funds.
Please note that the expenses shown in the table are meant to highlight your ongoing costs only and do not reflect any transactional costs, such as sales charges (loads), redemption fees, exchange fees or separate account charges assessed by participating insurance companies. Therefore, the “Hypothetical” line of the table is useful in comparing ongoing costs only, and will not help you determine the relative total costs of owning different funds. In addition, if these transactional costs were included, your costs would have been higher.
| | | | | | | | | | | | | | | | | |
| | | Beginning | | Ending | | Expenses | | |
| | | Account Value | | Account Value | | Paid During | | Net Annual |
| | | 07-01-2010 | | 12-31-2010 | | the Period1 | | Expense Ratio |
Class 2 | | | | | | | | | | | | | | | | |
| Actual | | $ | 1,000.00 | | | $ | 1,014.56 | | | $ | 4.26 | | | | 0.83 | % |
| Hypothetical (5% return before expenses) | | $ | 1,000.00 | | | $ | 1,021.25 | | | $ | 4.27 | | | | 0.83 | % |
| | |
| 1. | | Expenses are equal to the Fund’s annualized expense ratio multiplied by the average account value over the period, multiplied by the number of days in the most recent fiscal half-year divided by the number of days in the fiscal year (to reflect the one-half year period). |
| | |
| Portfolio of Investments—December 31, 2010 | | Wells Fargo Advantage VT Total Return Bond Fund 11 |
| | | | | | | | | | | | | | | | | |
| Principal | | | Security Name | | Interest Rate | | Maturity Date | | | Value | |
| Agency Securities: 53.20% | | | | | | | | | | | | |
| | | | | | | | | | | | | | | | | |
| Federal Home Loan Mortgage Corporation: 14.56% | | | | | | | | | | | | |
| $ | 1,000,000 | | | FHLMC%% | | | 4.50 | % | | | 02/01/2040 | | | $ | 1,021,881 | |
| | 200,000 | | | FHLMC%% | | | 4.00 | | | | 05/15/2030 | | | | 200,375 | |
| | 100,000 | | | FHLMC%% | | | 4.50 | | | | 06/15/2028 | | | | 103,156 | |
| | 213,711 | | | FHLMC #1B3430± | | | 6.15 | | | | 06/01/2037 | | | | 229,933 | |
| | 2,050 | | | FHLMC #1B7562± | | | 5.85 | | | | 11/01/2037 | | | | 2,203 | |
| | 28,270 | | | FHLMC #1G0784± | | �� | 5.67 | | | | 03/01/2036 | | | | 30,271 | |
| | 220,971 | | | FHLMC #1G1347± | | | 5.83 | | | | 11/01/2036 | | | | 237,928 | |
| | 112,961 | | | FHLMC #1G1404± | | | 5.89 | | | | 12/01/2036 | | | | 121,593 | |
| | 17,321 | | | FHLMC #1G1614± | | | 5.89 | | | | 03/01/2037 | | | | 18,631 | |
| | 48,426 | | | FHLMC #1G1873± | | | 5.70 | | | | 03/01/2036 | | | | 51,887 | |
| | 79,524 | | | FHLMC #1H1334± | | | 5.95 | | | | 06/01/2036 | | | | 85,120 | |
| | 40,991 | | | FHLMC #1J1920± | | | 5.58 | | | | 10/01/2038 | | | | 43,814 | |
| | 107,766 | | | FHLMC #1Q0175± | | | 6.06 | | | | 11/01/2036 | | | | 115,965 | |
| | 134,282 | | | FHLMC #1Q0960± | | | 5.97 | | | | 06/01/2038 | | | | 144,020 | |
| | 136,405 | | | FHLMC #3598MA | | | 4.50 | | | | 11/15/2038 | | | | 143,114 | |
| | 293,529 | | | FHLMC #3631 | | | 4.00 | | | | 02/15/2040 | | | | 302,944 | |
| | 215,321 | | | FHLMC #3652AP | | | 4.50 | | | | 03/15/2040 | | | | 228,112 | |
| | 240,000 | | | FHLMC #3724 | | | 5.50 | | | | 06/15/2037 | | | | 260,261 | |
| | 6,425 | | | FHLMC #847703± | | | 5.95 | | | | 01/01/2037 | | | | 6,898 | |
| | 48,031 | | | FHLMC #A78331 | | | 6.00 | | | | 03/01/2034 | | | | 52,786 | |
| | 96,422 | | | FHLMC #A79090 | | | 6.50 | | | | 07/01/2034 | | | | 108,419 | |
| | 60,949 | | | FHLMC #A95465 | | | 4.50 | | | | 12/01/2040 | | | | 62,515 | |
| | 486,000 | | | FHLMC #A95800 | | | 4.50 | | | | 12/01/2040 | | | | 498,483 | |
| | 175,000 | | | FHLMC #C91349 | | | 4.50 | | | | 12/01/2030 | | | | 181,901 | |
| | 249,000 | | | FHLMC #D98507 | | | 3.50 | | | | 01/01/2031 | | | | 243,607 | |
| | 92,780 | | | FHLMC #E01497 | | | 5.50 | | | | 11/01/2018 | | | | 100,065 | |
| | 71,558 | | | FHLMC #E01539 | | | 5.50 | | | | 12/01/2018 | | | | 77,176 | |
| | 2,230,524 | | | FHLMC #G01820 | | | 5.50 | | | | 06/01/2035 | | | | 2,393,024 | |
| | 402,835 | | | FHLMC #G05823 | | | 6.00 | | | | 08/01/2034 | | | | 442,712 | |
| | 749,151 | | | FHLMC #G06008 | | | 6.00 | | | | 12/01/2035 | | | | 823,311 | |
| | 59,203 | | | FHLMC #G11594 | | | 5.50 | | | | 08/01/2019 | | | | 63,856 | |
| | 56,713 | | | FHLMC #G11653 | | | 5.50 | | | | 12/01/2019 | | | | 61,170 | |
| | 115,882 | | | FHLMC #G11944 | | | 5.50 | | | | 07/01/2020 | | | | 124,989 | |
| | 78,953 | | | FHLMC #H19030 | | | 5.50 | | | | 08/01/2037 | | | | 83,693 | |
| | 50,260 | | | FHLMC #J02372 | | | 5.50 | | | | 05/01/2020 | | | | 54,398 | |
| | 45,298 | | | FHLMC #J02373 | | | 5.50 | | | | 05/01/2020 | | | | 49,028 | |
| | 52,797 | | | FHLMC #J02376 | | | 6.00 | | | | 05/01/2020 | | | | 58,016 | |
| | 151,334 | | | FHLMC #K007A1 | | | 3.34 | | | | 12/25/2019 | | | | 153,663 | |
| | 45,756 | | | FHLMC #U50015 | | | 4.50 | | | | 10/01/2030 | | | | 47,274 | |
| | 128,000 | | | FHLMC #U60362 | | | 4.50 | | | | 12/01/2040 | | | | 131,848 | |
| | 709,000 | | | FHLMC #U60371 | | | 4.50 | | | | 01/01/2041 | | | | 730,313 | |
| | 148,231 | | | FHLMC #Z40026 | | | 5.50 | | | | 01/01/2033 | | | | 158,057 | |
| | 132,881 | | | FHLMC Series 2479 Class PG | | | 6.00 | | | | 08/15/2032 | | | | 145,301 | |
| | 235,000 | | | FHLMC Series 2558 Class BD | | | 5.00 | | | | 01/15/2018 | | | | 254,496 | |
| | 80,000 | | | FHLMC Series 2590 Class BY | | | 5.00 | | | | 03/15/2018 | | | | 86,706 | |
| | 12,398 | | | FHLMC Series 2727 Class PW | | | 3.57 | | | | 06/15/2029 | | | | 12,626 | |
| | 191,000 | | | FHLMC Series 2843 Class BC | | | 5.00 | | | | 08/15/2019 | | | | 207,095 | |
| | 694,867 | | | FHLMC Series 2980 Class QA | | | 6.00 | | | | 05/15/2035 | | | | 762,856 | |
| | 291,539 | | | FHLMC Series 3028 Class PG | | | 5.50 | | | | 09/15/2035 | | | | 310,668 | |
| | 4,417 | | | FHLMC Series 3052 Class MH | | | 5.25 | | | | 10/15/2034 | | | | 4,755 | |
| | 64,807 | | | FHLMC Series 3325 Class JL | | | 5.50 | | | | 06/15/2037 | | | | 70,766 | |
| | 166,000 | | | FHLMC Series K003 Class AAVB | | | 4.77 | | | | 05/25/2018 | | | | 177,244 | |
| | 195,443 | | | FHLMC Series K008 Class A1 | | | 2.75 | | | | 12/25/2019 | | | | 192,212 | |
| | |
| 12 Wells Fargo Advantage VT Total Return Bond Fund | | Portfolio of Investments—December 31, 2010 |
| | | | | | | | | | | | | | | | | |
| Principal | | | Security Name | | Interest Rate | | Maturity Date | | | | Value | |
| Federal Home Loan Mortgage Corporation (continued) | | | | | | | | | | | | |
| $ | 39,177 | | | FHLMC Series T-57 Class 1A3 Preassign 00073 | | | 7.50 | % | | | 07/25/2043 | | | $ | 45,714 | |
| | 50,221 | | | FHLMC Series T-59 Class 1A3 Preassign 00329 | | | 7.50 | | | | 10/25/2043 | | | | 58,752 | |
| | 54,537 | | | FHLMC Series T-60 Class 1A3 Preassign 00462 | | | 7.50 | | | | 03/25/2044 | | | | 63,638 | |
| | | | | | | | | | | | | | | | | |
| | | | | | | | | | | | | | | | 12,441,239 | |
| | | | | | | | | | | | | | | | |
| | | | | | | | | | | | | | | | | |
| Federal National Mortgage Association: 34.11% | | | | | | | | | | | | |
| | 100,000 | | | FNMA%% | | | 4.50 | | | | 12/25/2028 | | | | 103,219 | |
| | 500,000 | | | FNMA%%(a) | | | 3.00 | | | | 10/25/2025 | | | | 488,750 | |
| | 1,000,000 | | | FNMA%% | | | 3.50 | | | | 08/25/2025 | | | | 1,006,875 | |
| | 1,700,000 | | | FNMA%% | | | 3.50 | | | | 09/25/2025 | | | | 1,706,905 | |
| | 300,000 | | | FNMA%% | | | 4.00 | | | | 06/25/2030 | | | | 301,219 | |
| | 500,000 | | | FNMA%% | | | 4.50 | | | | 01/25/2039 | | | | 511,797 | |
| | 179,000 | | | FNMA%% | | | 4.50 | | | | 11/25/2039 | | | | 185,740 | |
| | 500,000 | | | FNMA%% | | | 6.00 | | | | 09/25/2035 | | | | 542,500 | |
| | 99,401 | | | FNMA #190129 | | | 6.00 | | | | 11/01/2023 | | | | 109,645 | |
| | 141,737 | | | FNMA #190338 | | | 5.50 | | | | 07/01/2033 | | | | 152,778 | |
| | 38,845 | | | FNMA #190346 | | | 5.50 | | | | 12/01/2033 | | | | 41,871 | |
| | 542,911 | | | FNMA #255361 | | | 5.50 | | | | 08/01/2024 | | | | 586,768 | |
| | 92,094 | | | FNMA #310017 | | | 7.00 | | | | 06/01/2035 | | | | 104,922 | |
| | 288,761 | | | FNMA #460408 | | | 6.20 | | | | 05/01/2011 | | | | 288,595 | |
| | 268,615 | | | FNMA #460515 | | | 6.06 | | | | 09/01/2011 | | | | 274,955 | |
| | 227,187 | | | FNMA #462404± | | | 6.27 | | | | 09/01/2037 | | | | 245,721 | |
| | 169,651 | | | FNMA #545269 | | | 5.94 | | | | 11/01/2011 | | | | 172,254 | |
| | 351,781 | | | FNMA #545547 | | | 6.08 | | | | 03/01/2012 | | | | 362,608 | |
| | 78,382 | | | FNMA #555221 | | | 6.25 | | | | 04/01/2011 | | | | 78,340 | |
| | 596,655 | | | FNMA #555424 | | | 5.50 | | | | 05/01/2033 | | | | 643,134 | |
| | 126,854 | | | FNMA #677018 | | | 5.50 | | | | 01/01/2033 | | | | 136,577 | |
| | 380,548 | | | FNMA #725162 | | | 6.00 | | | | 02/01/2034 | | | | 419,212 | |
| | 315,917 | | | FNMA #725205 | | | 5.00 | | | | 03/01/2034 | | | | 334,130 | |
| | 2,393,139 | | | FNMA #725228 | | | 6.00 | | | | 03/01/2034 | | | | 2,636,289 | |
| | 1,442,245 | | | FNMA #725229 | | | 6.00 | | | | 03/01/2034 | | | | 1,588,782 | |
| | 134,561 | | | FNMA #725423 | | | 5.50 | | | | 05/01/2034 | | | | 145,043 | |
| | 161,183 | | | FNMA #725424 | | | 5.50 | | | | 04/01/2034 | | | | 173,739 | |
| | 116,520 | | | FNMA #725690 | | | 6.00 | | | | 08/01/2034 | | | | 127,813 | |
| | 210,781 | | | FNMA #735116 | | | 6.00 | | | | 12/01/2034 | | | | 232,197 | |
| | 216,691 | | | FNMA #735503 | | | 6.00 | | | | 04/01/2035 | | | | 238,707 | |
| | 30,718 | | | FNMA #735504 | | | 6.00 | | | | 04/01/2035 | | | | 33,839 | |
| | 69,386 | | | FNMA #808350 | | | 5.50 | | | | 09/01/2034 | | | | 74,326 | |
| | 38,105 | | | FNMA #838303± | | | 6.00 | | | | 07/01/2037 | | | | 40,918 | |
| | 141,126 | | | FNMA #863729± | | | 5.49 | | | | 01/01/2036 | | | | 150,392 | |
| | 180,179 | | | FNMA #888560 | | | 6.00 | | | | 11/01/2035 | | | | 198,485 | |
| | 110,698 | | | FNMA #888635 | | | 5.50 | | | | 09/01/2036 | | | | 119,321 | |
| | 97,632 | | | FNMA #888941± | | | 6.05 | | | | 10/01/2037 | | | | 104,934 | |
| | 268,592 | | | FNMA #889213 | | | 5.50 | | | | 10/01/2020 | | | | 289,786 | |
| | 583,072 | | | FNMA #890248 | | | 6.00 | | | | 07/01/2040 | | | | 642,656 | |
| | 29,183 | | | FNMA #893916± | | | 6.34 | | | | 10/01/2036 | | | | 31,429 | |
| | 36,565 | | | FNMA #905629± | | | 6.02 | | | | 12/01/2036 | | | | 39,242 | |
| | 62,641 | | | FNMA #906403± | | | 5.89 | | | | 01/01/2037 | | | | 67,387 | |
| | 82,849 | | | FNMA #906404± | | | 5.90 | | | | 01/01/2037 | | | | 89,092 | |
| | 47,894 | | | FNMA #909569± | | | 5.85 | | | | 02/01/2037 | | | | 51,590 | |
| | 46,011 | | | FNMA #910293± | | | 5.94 | | | | 03/01/2037 | | | | 49,396 | |
| | 54,191 | | | FNMA #914819± | | | 5.91 | | | | 04/01/2037 | | | | 58,237 | |
| | 54,442 | | | FNMA #931591 | | | 4.50 | | | | 11/01/2019 | | | | 56,637 | |
| | 67,364 | | | FNMA #938185± | | | 5.94 | | | | 07/01/2037 | | | | 72,329 | |
| | 18,663 | | | FNMA #941143± | | | 6.05 | | | | 10/01/2037 | | | | 20,059 | |
| | |
| Portfolio of Investments—December 31, 2010 | | Wells Fargo Advantage VT Total Return Bond Fund 13 |
| | | | | | | | | | | | | | | | | |
| Principal | | | Security Name | | Interest Rate | | Maturity Date | | | Value | |
| Federal National Mortgage Association (continued) | | | | | | | | | | | | |
| $ | 16,807 | | | FNMA #945646± | | | 6.04 | % | | | 09/01/2037 | | | $ | 18,069 | |
| | 30,829 | | | FNMA #947424± | | | 5.66 | | | | 10/01/2037 | | | | 33,060 | |
| | 72,792 | | | FNMA #949690± | | | 5.84 | | | | 09/01/2037 | | | | 78,137 | |
| | 32,432 | | | FNMA #952835± | | | 5.93 | | | | 09/01/2037 | | | | 34,889 | |
| | 32,191 | | | FNMA #959331± | | | 6.06 | | | | 11/01/2037 | | | | 34,639 | |
| | 254,791 | | | FNMA #995485 | | | 6.00 | | | | 04/01/2035 | | | | 280,679 | |
| | 178,395 | | | FNMA #995508 | | | 6.00 | | | | 12/01/2035 | | | | 196,521 | |
| | 41,457 | | | FNMA #AB1218 | | | 3.50 | | | | 07/01/2025 | | | | 41,811 | |
| | 127,388 | | | FNMA #AB1579 | | | 4.50 | | | | 10/01/2040 | | | | 131,437 | |
| | 493,655 | | | FNMA #AB1991 | | | 3.50 | | | | 12/01/2030 | | | | 483,040 | |
| | 236,357 | | | FNMA #AB1992 | | | 3.50 | | | | 12/01/2030 | | | | 231,274 | |
| | 87,848 | | | FNMA #AD0086± | | | 5.52 | | | | 02/01/2039 | | | | 94,179 | |
| | 75,834 | | | FNMA #AD0212 | | | 5.50 | | | | 04/01/2021 | | | | 81,817 | |
| | 215,350 | | | FNMA #AD0584 | | | 7.00 | | | | 01/01/2039 | | | | 244,009 | |
| | 245,122 | | | FNMA #AD0682 | | | 6.00 | | | | 12/01/2035 | | | | 270,027 | |
| | 128,166 | | | FNMA #AD0716 | | | 6.50 | | | | 12/01/2030 | | | | 143,711 | |
| | 274,914 | | | FNMA #AE0096 | | | 5.50 | | | | 07/01/2025 | | | | 297,397 | |
| | 610,705 | | | FNMA #AE0133 | | | 6.00 | | | | 07/01/2037 | | | | 672,945 | |
| | 473,351 | | | FNMA #AE0303 | | | 6.00 | | | | 08/01/2040 | | | | 521,737 | |
| | 818,766 | | | FNMA #AE0364 | | | 5.50 | | | | 09/01/2040 | | | | 881,302 | |
| | 494,113 | | | FNMA #AE0482 | | | 5.50 | | | | 10/01/2040 | | | | 531,985 | |
| | 218,863 | | | FNMA #AE3925 | | | 3.50 | | | | 11/01/2030 | | | | 214,157 | |
| | 618,581 | | | FNMA #MA0511 | | | 4.50 | | | | 09/01/2030 | | | | 641,719 | |
| | 202,634 | | | FNMA #MA0582 | | | 3.50 | | | | 11/01/2030 | | | | 198,277 | |
| | 589,232 | | | FNMA #MA0602 | | | 3.50 | | | | 12/01/2030 | | | | 576,562 | |
| | 351,000 | | | FNMA #MA0625 | | | 3.50 | | | | 01/01/2031 | | | | 343,453 | |
| | 263,000 | | | FNMA #MA0632 | | | 4.50 | | | | 01/01/2041 | | | | 271,358 | |
| | 745,000 | | | FNMA #MA0634 | | | 4.50 | | | | 01/01/2031 | | | | 772,866 | |
| | 960,037 | | | FNMA Series 2001-81 Class HE(o) | | | 6.50 | | | | 01/25/2032 | | | | 1,070,370 | |
| | 36,385 | | | FNMA Series 2001-T7 Class A1 | | | 7.50 | | | | 02/25/2041 | | | | 41,200 | |
| | 38,665 | | | FNMA Series 2002-33 Class A2 | | | 7.50 | | | | 06/25/2032 | | | | 45,223 | |
| | 149,000 | | | FNMA Series 2002-94 Class HQ | | | 4.50 | | | | 01/25/2018 | | | | 158,447 | |
| | 29,912 | | | FNMA Series 2002-T16 Class A3 | | | 7.50 | | | | 07/25/2042 | | | | 34,698 | |
| | 30,041 | | | FNMA Series 2002-T18 Class A4 | | | 7.50 | | | | 08/25/2042 | | | | 34,923 | |
| | 53,622 | | | FNMA Series 2002-T6 Class A2 | | | 7.50 | | | | 10/25/2041 | | | | 60,921 | |
| | 38,149 | | | FNMA Series 2002-W4 Class A5 | | | 7.50 | | | | 05/25/2042 | | | | 44,349 | |
| | 82,929 | | | FNMA Series 2004-60 Class PA | | | 5.50 | | | | 04/25/2034 | | | | 90,210 | |
| | 73,707 | | | FNMA Series 2005-58 Class MA | | | 5.50 | | | | 07/25/2035 | | | | 81,433 | |
| | 469 | | | FNMA Series 2007-30 Class MA | | | 4.25 | | | | 02/25/2037 | | | | 488 | |
| | 112,599 | | | FNMA Series 2007-77 Class MH | | | 6.00 | | | | 12/25/2036 | | | | 122,274 | |
| | 204,747 | | | FNMA Series 2009-102 Class PN | | | 5.00 | | | | 11/25/2039 | | | | 216,615 | |
| | 71,000 | | | FNMA Series 2009-5A Class BX | | | 5.50 | | | | 08/25/2038 | | | | 76,765 | |
| | 264,567 | | | FNMA Series 2009-71 Class JT | | | 6.00 | | | | 06/25/2036 | | | | 291,520 | |
| | 333,572 | | | FNMA Series 2009-78 Class J | | | 5.00 | | | | 09/25/2019 | | | | 357,235 | |
| | 122,949 | | | FNMA Series 2009-93 Class PD | | | 4.50 | | | | 09/25/2039 | | | | 125,212 | |
| | 132,000 | | | FNMA Series 2009-M1 Class A2 | | | 4.29 | | | | 07/25/2019 | | | | 135,388 | |
| | 241,000 | | | FNMA Series 2009-M2 Class A3 | | | 4.00 | | | | 01/25/2019 | | | | 243,169 | |
| | 123,992 | | | FNMA Series 2010-15 Class KA | | | 4.00 | | | | 03/25/2039 | | | | 128,527 | |
| | 461,387 | | | FNMA Series 2010-54 Class EA | | | 4.50 | | | | 06/25/2040 | | | | 473,597 | |
| | 100,000 | | | FNMA Series 2010-M1 Class A2 | | | 4.45 | | | | 09/25/2019 | | | | 103,014 | |
| | 634,000 | | | FNMA Series 2010-M3 Class A3± | | | 4.33 | | | | 03/25/2020 | | | | 647,179 | |
| | 96,000 | | | FNMA Series K005 Class A2 | | | 4.32 | | | | 11/25/2019 | | | | 97,974 | |
| | | | | | | | | | | | | | | | | |
| | | | | | | | | | | | | | | | 29,132,928 | |
| | | | | | | | | | | | | | | | |
| | |
| 14 Wells Fargo Advantage VT Total Return Bond Fund | | Portfolio of Investments—December 31, 2010 |
| | | | | | | | | | | | | | | | | |
| Principal | | | Security Name | | Interest Rate | | Maturity Date | | | Value | |
| Government National Mortgage Association: 4.53% | | | | | | | | | | | | |
| $ | 72,000 | | | GNMA%% | | | 3.00 | % | | | 01/20/2034 | | | $ | 71,914 | |
| | 2,000,000 | | | GNMA%% | | | 3.50 | | | | 09/20/2040 | | | | 1,924,064 | |
| | 98,000 | | | GNMA%% | | | 3.00 | | | | 12/20/2033 | | | | 99,470 | |
| | 500,000 | | | GNMA%% | | | 3.50 | | | | 10/20/2040 | | | | 479,766 | |
| | 121,000 | | | GNMA%% | | | 3.50 | | | | 03/20/2034 | | | | 124,666 | |
| | 118,000 | | | GNMA%% | | | 3.50 | | | | 02/20/2034 | | | | 122,093 | |
| | 173,729 | | | GNMA #082664± | | | 3.50 | | | | 11/20/2040 | | | | 180,565 | |
| | 416,570 | | | GNMA #782044 | | | 6.50 | | | | 12/15/2032 | | | | 476,749 | |
| | 127,000 | | | GNMA Series 2006-37 Class JG | | | 5.00 | | | | 07/20/2036 | | | | 134,422 | |
| | 244,045 | | | GNMA Series 2009-64 Class EQ | | | 4.00 | | | | 07/16/2039 | | | | 251,516 | |
| | | | | | | | | | | | | | | | | |
| | | | | | | | | | | | | | | | 3,865,225 | |
| | | | | | | | | | | | | | | | |
| | | | | | | | | | | | | | | | | |
| Total Agency Securities (Cost $45,077,617) | | | | | | | | | | | 45,439,392 | |
| | | | | | | | | | | | | | | | |
| | | | | | | | | | | | | | | | | |
| Asset Backed Securities: 9.52% | | | | | | | | | | | | |
| | 250,000 | | | Aesop Series 2010-5A Class A± | | | 3.15 | | | | 03/20/2017 | | | | 244,146 | |
| | 130,000 | | | Ally Master Owner Trust Series 2010-1 Class A± | | | 2.01 | | | | 01/15/2015 | | | | 132,356 | |
| | 191,000 | | | Allya Auto Receivables Trust Series 2010-4 Class A4 | | | 1.35 | | | | 12/15/2015 | | | | 186,663 | |
| | 72,000 | | | Bank of America Credit Card Trust Series 2006-A12 Class A± | | | 0.28 | | | | 03/15/2014 | | | | 71,896 | |
| | 167,000 | | | Bank of America Credit Card Trust Series 2008-7 Class A± | | | 0.96 | | | | 12/15/2014 | | | | 168,159 | |
| | 286,000 | | | Capital One Multi-Asset Execution Trust Series 2004-A8 Class A8± | | | 0.39 | | | | 08/15/2014 | | | | 285,473 | |
| | 293,000 | | | Capital One Multi-Asset Execution Trust Series 2005-A10 Class A± | | | 0.34 | | | | 09/15/2015 | | | | 291,021 | |
| | 239,000 | | | Capital One Multi-Asset Execution Trust Series 2005-A6 Class A6± | | | 0.34 | | | | 07/15/2015 | | | | 237,396 | |
| | 204,000 | | | Capital One Multi-Asset Execution Trust Series 2006-A12 Class A± | | | 0.32 | | | | 07/15/2016 | | | | 201,717 | |
| | 215,000 | | | Capital One Multi-Asset Execution Trust Series 2006-A5 Class A5± | | | 0.32 | | | | 01/15/2016 | | | | 213,140 | |
| | 335,000 | | | Capital One Multi-Asset Execution Trust Series 2009-A2 Class A2± | | | 3.20 | | | | 04/15/2014 | | | | 338,918 | |
| | 198,000 | | | Captial One Multi-Asset Execution Trust Series 2007-A8 Class A8± | | | 0.60 | | | | 10/15/2015 | | | | 197,425 | |
| | 115,000 | | | Chase Issuance Trust Series 2009-A2 Class A2± | | | 1.81 | | | | 04/15/2014 | | | | 116,908 | |
| | 181,000 | | | CitiBank Credit Card Issuance Trust Series 2009-A2 Class A2± | | | 1.81 | | | | 05/15/2014 | | | | 184,167 | |
| | 185,000 | | | CitiBank Credit Card Issuance Trust Series 2009-A5 Class A5± | | | 2.25 | | | | 12/23/2014 | | | | 189,118 | |
| | 100,000 | | | Discover Card Master Trust Series 2008-A3 Class A3± | | | 5.10 | | | | 10/15/2013 | | | | 101,324 | |
| | 296,000 | | | Discover Card Master Trust Series 2009-A2 Class A± | | | 1.56 | | | | 02/17/2015 | | | | 300,436 | |
| | 366,000 | | | Ford Credit Floorplan Master Owner Trust Series 2010-1 Class A± | | | 1.91 | | | | 12/15/2014 | | | | 372,711 | |
| | 87,833 | | | Honda Auto Receivables Owner Trust Series 2010-1 Class A2± | | | 0.62 | | | | 02/21/2012 | | | | 87,875 | |
| | 91,000 | | | MBNA Credit Card Master Note Trust Series 2006-A5 Class A5± | | | 0.32 | | | | 10/15/2015 | | | | 90,365 | |
| | 13,856 | | | Morgan Stanley ABS Capital I Series 2007-HE2 Class A2A± | | | 0.30 | | | | 01/25/2037 | | | | 13,430 | |
| | 10,717 | | | Morgan Stanley Home Equity Loans Series 2007-1 Class A1± | | | 0.31 | | | | 12/25/2036 | | | | 10,463 | |
| | 178,000 | | | Nelnet Student Loan Trust Series 2004-5 Class A5± | | | 0.47 | | | | 10/27/2036 | | | | 165,680 | |
| | 517,000 | | | Nelnet Student Loan Trust Series 2008-3 Class A4± | | | 1.94 | | | | 11/25/2024 | | | | 533,506 | |
| | 322,233 | | | SLM Student Loan Trust Series 2004-5 Class A4± | | | 0.44 | | | | 01/25/2021 | | | | 320,901 | |
| | 181,000 | | | SLM Student Loan Trust Series 2004-7 Class A5± | | | 0.46 | | | | 01/27/2020 | | | | 179,734 | |
| | 607,000 | | | SLM Student Loan Trust Series 2004-9 Class A5± | | | 0.44 | | | | 01/27/2020 | | | | 597,914 | |
| | 100,000 | | | SLM Student Loan Trust Series 2005-7 Class A3± | | | 1.64 | | | | 07/25/2025 | | | | 102,780 | |
| | 133,000 | | | SLM Student Loan Trust Series 2005-7 Class A4± | | | 0.44 | | | | 10/25/2029 | | | | 122,908 | |
| | 191,000 | | | SLM Student Loan Trust Series 2006-3 Class A4± | | | 0.37 | | | | 07/25/2019 | | | | 189,230 | |
| | 247,000 | | | SLM Student Loan Trust Series 2007-4 Class A3± | | | 0.35 | | | | 01/25/2022 | | | | 245,010 | |
| | 360,000 | | | SLM Student Loan Trust Series 2008-1 Class A4A± | | | 1.90 | | | | 12/15/2032 | | | | 372,492 | |
| | 101,000 | | | SLM Student Loan Trust Series 2008-4 Class A2± | | | 1.34 | | | | 07/25/2016 | | | | 102,460 | |
| | 121,000 | | | SLM Student Loan Trust Series 2008-4 Class A4± | | | 1.94 | | | | 07/25/2022 | | | | 126,045 | |
| | 448,858 | | | SLM Student Loan Trust Series 2008-5 Class A2± | | | 1.39 | | | | 10/25/2016 | | | | 454,452 | |
| | 277,000 | | | SLM Student Loan Trust Series 2008-5 Class A4± | | | 1.99 | | | | 07/25/2023 | | | | 288,104 | |
| | 290,000 | | | SLM Student Loan Trust Series 2008-6 Class A2± | | | 0.84 | | | | 10/25/2017 | | | | 291,597 | |
| | | | | | | | | | | | | | | | | |
| Total Asset Backed Securities (Cost $8,123,047) | | | | | | | | | | | 8,127,920 | |
| | | | | | | | | | | | | | | | |
| | |
| Portfolio of Investments—December 31, 2010 | | Wells Fargo Advantage VT Total Return Bond Fund 15 |
| | | | | | | | | | | | | | | | | |
| Principal | | | Security Name | | Interest Rate | | Maturity Date | | | Value | |
| Collateralized Mortgage Obligations: 14.74% | | | | | | | | | | | | |
| $ | 194,000 | | | Acre Arta Series 2010-A1 | | | 3.85 | % | | | 01/14/2029 | | | $ | 194,347 | |
| | 110,227 | | | Asset Securitization Corporation Series 1996-D3 Class A2± | | | 7.55 | | | | 10/13/2026 | | | | 112,380 | |
| | 47,000 | | | Bank of America Commercial Mortgage Incorporated Series 2004-6 Class A3 | | | 4.51 | | | | 12/10/2042 | | | | 48,186 | |
| | 100,000 | | | Bank of America Commercial Mortgage Incorporated Series 2002-PB2 Class B | | | 6.31 | | | | 06/11/2035 | | | | 104,058 | |
| | 258,000 | | | Bank of America Commercial Mortgage Incorporated Series 2005-4 Class A5A | | | 4.93 | | | | 07/10/2045 | | | | 269,372 | |
| | 64,000 | | | Bank of America Commercial Mortgage Incorporated Series 2005-5 Class A4± | | | 5.12 | | | | 10/10/2045 | | | | 68,584 | |
| | 57,000 | | | Bank of America Commercial Mortgage Incorporated Series 2005-6 Class A4± | | | 5.20 | | | | 09/10/2047 | | | | 61,221 | |
| | 287,000 | | | Bank of America Commercial Mortgage Incorporated Series 2006-5 Class A4 | | | 5.41 | | | | 09/10/2047 | | | | 300,372 | |
| | 216,000 | | | Bear Stearns Commercial Mortgage Securities Incorporated Series 2002-PBW1 Class A2± | | | 4.72 | | | | 11/11/2035 | | | | 224,605 | |
| | 31,833 | | | Bear Stearns Commercial Mortgage Securities Incorporated Series 2003-T12 Class A3± | | | 4.24 | | | | 08/13/2039 | | | | 32,326 | |
| | 69,000 | | | Bear Stearns Commercial Mortgage Securities Incorporated Series 2004-PWR4 Class A3± | | | 5.47 | | | | 06/11/2041 | | | | 74,198 | |
| | 137,000 | | | Bear Stearns Commercial Mortgage Securities Incorporated Series 2005-PWR 7 Class A3± | | | 5.12 | | | | 02/11/2041 | | | | 144,831 | |
| | 67,028 | | | Bear Stearns Commercial Mortgage Securities Incorporated Series 2005-PWR7 Class A | | | 4.95 | | | | 02/11/2041 | | | | 68,577 | |
| | 27,057 | | | Bear Stearns Commercial Mortgage Securities Incorporated Series 2007-PRW1 Class A1 | | | 5.59 | | | | 06/11/2040 | | | | 27,512 | |
| | 26,523 | | | Citigroup Mortgage Loan Trust Incorporated Series 2007-AHL1 Class A2A± | | | 0.30 | | | | 12/25/2036 | | | | 25,504 | |
| | 124,000 | | | Commercial Mortgage Pass-Through Certificate Series 1999-C1 Class A4± | | | 6.98 | | | | 01/17/2032 | | | | 133,799 | |
| | 151,000 | | | Commercial Mortgage Pass-Through Certificate Series 2001-J2 Class B | | | 6.30 | | | | 07/16/2034 | | | | 154,477 | |
| | 92,000 | | | Commercial Mortgage Pass-Through Certificate Series 2004-LB2A Class A4 | | | 4.72 | | | | 03/10/2039 | | | | 97,042 | |
| | 50,000 | | | Commercial Mortgage Pass-Through Certificate Series 2007-C9 Class A4± | | | 5.81 | | | | 12/10/2049 | | | | 53,796 | |
| | 104,813 | | | Commercial Mortgage Pass-Through Certificate Series 2010-C1 Class A1 | | | 3.16 | | | | 07/10/2046 | | | | 105,049 | |
| | 136,000 | | | Commercial Mortgage Pass-Through Certificate Series 2010-CI Class A3 | | | 4.21 | | | | 07/10/2046 | | | | 132,019 | |
| | 2,143 | | | Credit Suisse First Boston Mortgage Securities Corporation Series 2002-CKS4 Class A1 | | | 4.49 | | | | 11/15/2036 | | | | 2,144 | |
| | 84,000 | | | Credit Suisse First Boston Mortgage Securities Corporation Series 2002-CKS4 Class A2 | | | 5.18 | | | | 11/15/2036 | | | | 87,586 | |
| | 87,000 | | | Credit Suisse First Boston Mortgage Securities Corporation Series 2003-C4 Class B± | | | 5.25 | | | | 08/15/2036 | | | | 90,670 | |
| | 63,000 | | | Credit Suisse First Boston Mortgage Securities Corporation Series 2003-CPN1 Class A2 | | | 4.60 | | | | 03/15/2035 | | | | 66,059 | |
| | 47,000 | | | Credit Suisse First Boston Mortgage Securities Corporation Series 2003-CPN1 Class B | | | 4.72 | | | | 03/15/2035 | | | | 48,371 | |
| | 31,267 | | | Credit Suisse First Boston Mortgage Securities Corporation Series 2005-C1 Class A3 | | | 4.81 | | | | 02/15/2038 | | | | 32,155 | |
| | 114,000 | | | Credit Suisse First Boston Mortgage Securities Corporation Series 2005-C2 Class A4 | | | 4.83 | | | | 04/15/2037 | | | | 117,660 | |
| | 78,000 | | | Credit Suisse First Boston Mortgage Securities Corporation Series 2007-C2 Class A2± | | | 5.45 | | | | 01/15/2049 | | | | 79,525 | |
| | 129,792 | | | ESA Trust Series 2010-ESHA Class A | | | 2.95 | | | | 11/05/2027 | | | | 127,649 | |
| | 111,000 | | | First Union National Bank Commercial Mortgage Series 2001-C4 Class B(l) | | | 6.42 | | | | 12/12/2033 | | | | 114,977 | |
| | 3,577 | | | GE Capital Commercial Mortgage Corporation Series 2001-3 Class A1 | | | 5.56 | | | | 06/10/2038 | | | | 3,591 | |
| | 99,876 | | | GE Capital Commercial Mortgage Corporation Series 2002-1A Class A3 | | | 6.27 | | | | 12/10/2035 | | | | 104,049 | |
| | 39,806 | | | GMAC Commercial Mortgage Securities Incorporated Series 2001-C2 Class A2 | | | 6.70 | | | | 04/15/2034 | | | | 40,063 | |
| | 104,000 | | | GMAC Commercial Mortgage Securities Incorporated Series 2003-C2 Class A2± | | | 5.47 | | | | 05/10/2040 | | | | 111,957 | |
| | 89,000 | | | GMAC Commercial Mortgage Securities Incorporated Series 2003-C2 Class B± | | | 5.49 | | | | 05/10/2040 | | | | 93,727 | |
| | 26,000 | | | GMAC Commercial Mortgage Securities Incorporated Series 2003-C2 Class D± | | | 5.49 | | | | 05/10/2040 | | | | 26,227 | |
| | 113,000 | | | GMAC Commercial Mortgage Securities Incorporated Series 2004-C2 Class A4± | | | 5.30 | | | | 08/10/2038 | | | | 120,285 | |
| | 45,000 | | | Goldman Sachs Mortgage Securities Corporation II Series 2004-GG2 Class A6± | | | 5.40 | | | | 08/10/2038 | | | | 48,336 | |
| | 60,000 | | | Greenwich Capital Commercial Funding Corporation Series 2003-C1 Class B | | | 4.23 | | | | 07/05/2035 | | | | 61,998 | |
| | 227,000 | | | Greenwich Capital Commercial Funding Corporation Series 2005-GG5 Class A5± | | | 5.22 | | | | 04/10/2037 | | | | 240,882 | |
| | |
| 16 Wells Fargo Advantage VT Total Return Bond Fund | | Portfolio of Investments—December 31, 2010 |
| | | | | | | | | | | | | | | | | |
| Principal | | | Security Name | | Interest Rate | | Maturity Date | | | Value | |
| Collateralized Mortgage Obligations (continued) | | | | | | | | | | | | |
| $ | 9,729 | | | GS Mortgage Securities Corporation II Series 2004-C1 Class A2 | | | 4.32 | % | | | 10/10/2028 | | | $ | 9,723 | |
| | 118,000 | | | GS Mortgage Securities Corporation II Series 2005-GG4 Class A4 | | | 4.75 | | | | 07/10/2039 | | | | 124,437 | |
| | 105,000 | | | GS Mortgage Securities Corporation II Series 2010-C2 | | | 3.85 | | | | 12/10/2043 | | | | 106,915 | |
| | 264,000 | | | GS Mortgage Securities Corporation II Series 2010-C2± | | | 5.16 | | | | 12/10/2043 | | | | 272,078 | |
| | 283,476 | | | Impact Funding LLC Series 2010-1 Class A1 | | | 5.31 | | | | 01/25/2051 | | | | 274,918 | |
| | 14,360 | | | JPMorgan Chase Commercial Mortgage Securities Corporation Series 2000-C10 Class C± | | | 7.64 | | | | 08/15/2032 | | | | 14,422 | |
| | 59,000 | | | JPMorgan Chase Commercial Mortgage Securities Corporation Series 2001-CIBC2 Class D± | | | 6.85 | | | | 04/15/2035 | | | | 59,614 | |
| | 30,000 | | | JPMorgan Chase Commercial Mortgage Securities Corporation Series 2002-C2 Class B± | | | 5.21 | | | | 12/12/2034 | | | | 31,197 | |
| | 76,000 | | | JPMorgan Chase Commercial Mortgage Securities Corporation Series 2002-CIB5 Class A2 | | | 5.16 | | | | 10/12/2037 | | | | 79,892 | |
| | 67,000 | | | JPMorgan Chase Commercial Mortgage Securities Corporation Series 2002-CIBC4 Class C± | | | 6.45 | | | | 05/12/2034 | | | | 69,486 | |
| | 50,608 | | | JPMorgan Chase Commercial Mortgage Securities Corporation Series 2003-C1 Class A1 | | | 4.28 | | | | 01/12/2037 | | | | 51,876 | |
| | 23,104 | | | JPMorgan Chase Commercial Mortgage Securities Corporation Series 2003-CB6 Class A1 | | | 4.39 | | | | 07/12/2037 | | | | 23,817 | |
| | 92,000 | | | JPMorgan Chase Commercial Mortgage Securities Corporation Series 2003-CB7 Class A4± | | | 4.88 | | | | 01/12/2038 | | | | 97,471 | |
| | 87,000 | | | JPMorgan Chase Commercial Mortgage Securities Corporation Series 2004-C2 Class A3± | | | 5.23 | | | | 05/15/2041 | | | | 92,596 | |
| | 203,000 | | | JPMorgan Chase Commercial Mortgage Securities Corporation Series 2004-CB9 Class A4± | | | 5.36 | | | | 06/12/2041 | | | | 217,130 | |
| | 52,304 | | | JPMorgan Chase Commercial Mortgage Securities Corporation Series 2004-CIBC9 Class A2± | | | 5.11 | | | | 06/12/2041 | | | | 52,729 | |
| | 79,000 | | | JPMorgan Chase Commercial Mortgage Securities Corporation Series 2004-LN2 Class A2 | | | 5.12 | | | | 07/15/2041 | | | | 82,519 | |
| | 39,000 | | | JPMorgan Chase Commercial Mortgage Securities Corporation Series 2005-LDP4 Class A4± | | | 4.92 | | | | 10/15/2042 | | | | 41,313 | |
| | 96,000 | | | JPMorgan Chase Commercial Mortgage Securities Corporation Series 2005-LDP5 Class A4± | | | 5.20 | | | | 12/15/2044 | | | | 103,350 | |
| | 92,000 | | | JPMorgan Chase Commercial Mortgage Securities Corporation Series 2006 Class A4± | | | 5.48 | | | | 12/12/2044 | | | | 98,030 | |
| | 99,960 | | | JPMorgan Chase Commercial Mortgage Securities Corporation Series 2006-CB14 Class A2 | | | 5.44 | | | | 12/12/2044 | | | | 100,463 | |
| | 52,000 | | | JPMorgan Chase Commercial Mortgage Securities Corporation Series 2006-CB16 Class A4 | | | 5.55 | | | | 05/12/2045 | | | | 55,556 | |
| | 95,000 | | | JPMorgan Chase Commercial Mortgage Securities Corporation Series 2006-CB17 Class A4 | | | 5.43 | | | | 12/12/2043 | | | | 100,706 | |
| | 49,000 | | | JPMorgan Chase Commercial Mortgage Securities Corporation Series 2006-LDP9 Class A2 | | | 5.13 | | | | 05/15/2047 | | | | 51,055 | |
| | 49,000 | | | JPMorgan Chase Commercial Mortgage Securities Corporation Series 2006-LDP9 Class A3 | | | 5.34 | | | | 05/15/2047 | | | | 50,854 | |
| | 129,000 | | | JPMorgan Chase Commercial Mortgage Securities Corporation Series 2007-LD12 Class A3± | | | 5.99 | | | | 02/15/2051 | | | | 135,113 | |
| | 100,000 | | | JPMorgan Chase Commercial Mortgage Securities Corporation Series 2007-LDP11 Class A± | | | 5.82 | | | | 06/15/2049 | | | | 106,038 | |
| | 158 | | | JPMorgan Chase Commercial Mortgage Securities Corporation Series 2008-C2 Class A1 | | | 5.02 | | | | 02/12/2051 | | | | 158 | |
| | 240,000 | | | JPMorgan Chase Commercial Mortgage Securities Corporation Series 2009-IWST Class A2 | | | 5.63 | | | | 12/05/2027 | | | | 257,349 | |
| | 155,000 | | | JPMorgan Chase Commercial Mortgage Securities Corporation Series 2010-A2 Class A2 | | | 4.31 | | | | 08/05/2032 | | | | 146,156 | |
| | |
| Portfolio of Investments—December 31, 2010 | | Wells Fargo Advantage VT Total Return Bond Fund 17 |
| | | | | | | | | | | | | | | | | |
| Principal | | | Security Name | | Interest Rate | | Maturity Date | | | Value | |
| Collateralized Mortgage Obligations (continued) | | | | | | | | | | | | |
| $ | 238,703 | | | JPMorgan Chase Commercial Mortgage Securities Corporation Series 2010-C1 Class A1 | | | 3.85 | % | | | 06/15/2043 | | | $ | 244,512 | |
| | 87,296 | | | Lehman Brothers UBS Commercial Mortgage Trust Series 2001-C2 Class A2 | | | 6.65 | | | | 11/15/2027 | | | | 87,498 | |
| | 160,462 | | | Lehman Brothers UBS Commercial Mortgage Trust Series 2001-C3 Class A2 | | | 6.37 | | | | 12/15/2028 | | | | 162,439 | |
| | 200,000 | | | Lehman Brothers UBS Commercial Mortgage Trust Series 2002-C2 Class A4 | | | 5.59 | | | | 06/15/2031 | | | | 209,280 | |
| | 38,082 | | | Lehman Brothers UBS Commercial Mortgage Trust Series 2002-C4 Class A4 | | | 4.56 | | | | 09/15/2026 | | | | 38,767 | |
| | 451,000 | | | Lehman Brothers UBS Commercial Mortgage Trust Series 2002-C4 Class A5 | | | 4.85 | | | | 09/15/2031 | | | | 471,649 | |
| | 103,000 | | | Lehman Brothers UBS Commercial Mortgage Trust Series 2002-C7 Class A4 | | | 4.96 | | | | 12/15/2031 | | | | 108,837 | |
| | 136,000 | | | Lehman Brothers UBS Commercial Mortgage Trust Series 2003-C8 Class A4± | | | 5.12 | | | | 11/15/2032 | | | | 145,338 | |
| | 55,000 | | | Lehman Brothers UBS Commercial Mortgage Trust Series 2004-C1 Class A4 | | | 4.57 | | | | 01/15/2031 | | | | 57,426 | |
| | 51,000 | | | Lehman Brothers UBS Commercial Mortgage Trust Series 2004-C7 Class A5 | | | 4.63 | | | | 10/15/2029 | | | | 52,928 | |
| | 50,000 | | | Lehman Brothers UBS Commercial Mortgage Trust Series 2005-C1 Class A4 | | | 4.74 | | | | 02/15/2030 | | | | 52,371 | |
| | 146,000 | | | Lehman Brothers UBS Commercial Mortgage Trust Series 2005-C2 Class A4 | | | 5.00 | | | | 04/15/2030 | | | | 150,280 | |
| | 24,000 | | | Lehman Brothers UBS Commercial Mortgage Trust Series 2007-C1 Class AAB | | | 5.40 | | | | 02/15/2040 | | | | 25,157 | |
| | 53,000 | | | Lehman Brothers UBS Commercial Mortgage Trust Series 2007-C3 Class A3± | | | 5.93 | | | | 07/15/2044 | | | | 56,223 | |
| | 125,000 | | | Lehman Brothers UBS Commercial Mortgage Trust Series 2007-C3 Class A4± | | | 5.94 | | | | 07/15/2044 | | | | 133,709 | |
| | 184,000 | | | Lehman Brothers UBS Commercial Mortgage Trust Series 2007-C6 Class A3 | | | 5.93 | | | | 07/15/2040 | | | | 192,845 | |
| | 88,000 | | | Lehman Brothers UBS Commercial Mortgage Trust Series 2008-C1 Class A2± | | | 6.15 | | | | 04/15/2041 | | | | 95,386 | |
| | 157,000 | | | Merrill Lynch Mortgage Trust Series 2003-KEY1 Class A4± | | | 5.24 | | | | 11/12/2035 | | | | 166,421 | |
| | 158,000 | | | Merrill Lynch Mortgage Trust Series 2004-KEY2 Class A4± | | | 4.86 | | | | 08/12/2039 | | | | 165,085 | |
| | 70,517 | | | Merrill Lynch Mortgage Trust Series 2005-CIP1 Class A2 | | | 4.96 | | | | 07/12/2038 | | | | 71,846 | |
| | 76,000 | | | Merrill Lynch Mortgage Trust Series 2005-CIP1 Class A3A± | | | 4.95 | | | | 07/12/2038 | | | | 78,755 | |
| | 176,000 | | | Merrill Lynch Mortgage Trust Series 2005-CKI1 Class A6± | | | 5.24 | | | | 11/12/2037 | | | | 189,445 | |
| | 100,000 | | | Morgan Stanley Capital I Series 2003-IQ6 Class A4 | | | 4.97 | | | | 12/15/2041 | | | | 106,556 | |
| | 113,000 | | | Morgan Stanley Capital I Series 2003-T11 Class A4 | | | 5.15 | | | | 06/13/2041 | | | | 120,161 | |
| | 132,000 | | | Morgan Stanley Capital I Series 2004-IQ8 Class A4 | | | 4.90 | | | | 06/15/2040 | | | | 136,275 | |
| | 85,000 | | | Morgan Stanley Capital I Series 2004-T15 Class A4± | | | 5.27 | | | | 06/13/2041 | | | | 91,046 | |
| | 113,000 | | | Morgan Stanley Capital I Series 2005 HQ7 Class A4± | | | 5.19 | | | | 11/14/2042 | | | | 121,647 | |
| | 248,000 | | | Morgan Stanley Capital I Series 2005-HQ6 Class A4 | | | 4.99 | | | | 08/13/2042 | | | | 262,599 | |
| | 122,000 | | | Morgan Stanley Capital I Series 2006-IQ12 Class ANM | | | 5.31 | | | | 12/15/2043 | | | | 123,328 | |
| | 47,986 | | | Morgan Stanley Capital I Series 2007-HQ13 Class A1 | | | 5.36 | | | | 12/15/2044 | | | | 49,841 | |
| | 215,000 | | | Morgan Stanley Capital I Series 2007-HQ13 Class A3 | | | 5.57 | | | | 12/15/2044 | | | | 220,752 | |
| | 32,000 | | | Morgan Stanley Capital I Series 2007-IQ14 Class AAB± | | | 5.65 | | | | 04/15/2049 | | | | 33,791 | |
| | 87,480 | | | Morgan Stanley Dean Witter Capital I Series 2001-TOP3 Class A4 | | | 6.39 | | | | 07/15/2033 | | | | 88,748 | |
| | 81,000 | | | Morgan Stanley Dean Witter Capital I Series 2003-HQ2 Class A2 | | | 4.92 | | | | 03/12/2035 | | | | 85,450 | |
| | 84,000 | | | Morgan Stanley Dean Witter Capital I Series 2004-HQ3 Class A4 | | | 4.80 | | | | 01/13/2041 | | | | 88,002 | |
| | 185,792 | | | Morgan Stanley Dean Witter Capital I Series 2004-T15 Class A2 | | | 4.69 | | | | 06/13/2041 | | | | 185,688 | |
| | 100,000 | | | Morgan Stanley Dean Witter Capital I Series 2005-IQ9 Class A5 | | | 4.70 | | | | 07/15/2056 | | | | 105,129 | |
| | 27,800 | | | Morgan Stanley Mortgage Loan Trust Series 2007-6XS Class 2A1S± | | | 0.37 | | | | 02/25/2047 | | | | 22,787 | |
| | 128,000 | | | Nomura Asset Securities Corporation Series 1998-D6 Class A2± | | | 7.05 | | | | 03/15/2030 | | | | 140,954 | |
| | 16,775 | | | PNC Mortgage Acceptance Corporation Series 2001-C1 Class A2 | | | 6.36 | | | | 03/12/2034 | | | | 16,785 | |
| | 44,000 | | | Prudential Mortgage Capital Funding LLC Series 2001-ROCK Class B | | | 6.76 | | | | 05/10/2034 | | | | 44,699 | |
| | 20,753 | | | Salomon Brothers Mortgage Securities Incorporated VII Series 2000-C2 Class C± | | | 7.73 | | | | 07/18/2033 | | | | 20,807 | |
| | 108,059 | | | Salomon Brothers Mortgage Securities Incorporated VII Series 2001-C2 Class A3 | | | 6.50 | | | | 11/13/2036 | | | | 110,601 | |
| | 58,314 | | | Sequoia Mortgage Trust Series 2010-H1 Series A1± | | | 3.75 | | | | 02/25/2040 | | | | 59,211 | |
| | 293,273 | | | US Bank NA Series 2007-1 Class A | | | 5.92 | | | | 05/25/2012 | | | | 305,112 | |
| | 17,824 | | | Wachovia Bank Commercial Mortgage Trust Series 2003-C7 Class A1(l) | | | 4.24 | | | | 10/15/2035 | | | | 17,961 | |
| | 116,000 | | | Wachovia Bank Commercial Mortgage Trust Series 2003-C8 Class A3(l) | | | 4.45 | | | | 11/15/2035 | | | | 119,542 | |
| | | | | | | | | | | | | | | | | |
| Total Collateralized Mortgage Obligations (Cost $12,511,611) | | | | | | | | | | | 12,590,796 | |
| | | | | | | | | | | | | | | | |
| | | | | | | | | | | | | | | | | |
| Corporate Bonds and Notes: 18.07% | | | | | | | | | | | | |
| | | | | | | | | | | | | | | | | |
| Consumer Discretionary: 0.80% | | | | | | | | | | | | |
| | | | | | | | | | | | | | | | | |
| Leisure Equipment & Products: 0.09% | | | | | | | | | | | | |
| | 75,000 | | | Mattel Incorporated | | | 6.20 | | | | 10/01/2040 | | | | 73,790 | |
| | | | | | | | | | | | | | | | |
| | |
| 18 Wells Fargo Advantage VT Total Return Bond Fund | | Portfolio of Investments—December 31, 2010 |
| | | | | | | | | | | | | | | | | |
| Principal | | | Security Name | | Interest Rate | | Maturity Date | | | Value | |
| Media: 0.71% | | | | | | | | | | | | |
| $ | 163,000 | | | Comcast Corporation | | | 8.38 | % | | | 03/15/2013 | | | $ | 185,477 | |
| | 67,000 | | | DirecTV Incorporated | | | 6.00 | | | | 08/15/2040 | | | | 67,263 | |
| | 20,000 | | | Discovery Communications LLC | | | 6.35 | | | | 06/01/2040 | | | | 21,602 | |
| | 157,000 | | | NBC Universal Incorporated | | | 2.88 | | | | 04/01/2016 | | | | 153,382 | |
| | 130,000 | | | NBC Universal Incorporated | | | 4.38 | | | | 04/01/2021 | | | | 126,179 | |
| | 55,000 | | | NBC Universal Incorporated | | | 5.95 | | | | 04/01/2041 | | | | 54,994 | |
| | | | | | | | | | | | | | | | | |
| | | | | | | | | | | | | | | | 608,897 | |
| | | | | | | | | | | | | | | | |
| | | | | | | | | | | | | | | | | |
| Consumer Staples: 1.16% | | | | | | | | | | | | |
| | | | | | | | | | | | | | | | | |
| Beverages: 0.64% | | | | | | | | | | | | |
| | 220,000 | | | Anheuser-Busch InBev Worldwide Incorporated | | | 4.13 | | | | 01/15/2015 | | | | 231,708 | |
| | 205,000 | | | Coca Cola Company | | | 1.50 | | | | 11/15/2015 | | | | 196,768 | |
| | 125,000 | | | Coca Cola Company | | | 3.15 | | | | 11/15/2020 | | | | 117,286 | |
| | | | | | | | | | | | | | | | | |
| | | | | | | | | | | | | | | | 545,762 | |
| | | | | | | | | | | | | | | | |
| | | | | | | | | | | | | | | | | |
| Food & Staples Retailing: 0.17% | | | | | | | | | | | | |
| | 150,000 | | | WalMart Stores Incorporated | | | 3.25 | | | | 10/25/2020 | | | | 140,977 | |
| | | | | | | | | | | | | | | | |
| | | | | | | | | | | | | | | | | |
| Food Products: 0.16% | | | | | | | | | | | | |
| | 75,000 | | | Kraft Foods Incorporated Class A | | | 5.38 | | | | 02/10/2020 | | | | 80,720 | |
| | 50,000 | | | Kraft Foods Incorporated Class A | | | 6.50 | | | | 02/09/2040 | | | | 56,031 | |
| | | | | | | | | | | | | | | | | |
| | | | | | | | | | | | | | | | 136,751 | |
| | | | | | | | | | | | | | | | |
| Tobacco: 0.19% | | | | | | | | | | | | |
| | 38,000 | | | Altria Group Incorporated | | | 9.70 | | | | 11/10/2018 | | | | 50,131 | |
| | 80,000 | | | Altria Group Incorporated | | | 10.20 | | | | 02/06/2039 | | | | 115,623 | |
| | | | | | | | | | | | | | | | | |
| | | | | | | | | | | | | | | | 165,754 | |
| | | | | | | | | | | | | | | | |
| | | | | | | | | | | | | | | | | |
| Energy: 2.11% | | | | | | | | | | | | |
| | | | | | | | | | | | | | | | | |
| Oil, Gas & Consumable Fuels: 2.11% | | | | | | | | | | | | |
| | 290,000 | | | Anadarko Petroleum Corporation | | | 5.95 | | | | 09/15/2016 | | | | 311,544 | |
| | 128,000 | | | Anadarko Petroleum Corporation | | | 6.38 | | | | 09/15/2017 | | | | 139,431 | |
| | 85,000 | | | Energy Transfer Partners LP | | | 9.00 | | | | 04/15/2019 | | | | 106,486 | |
| | 92,000 | | | Husky Energy Incorporated | | | 7.25 | | | | 12/15/2019 | | | | 109,241 | |
| | 125,000 | | | Kinder Morgan Energy LLC | | | 6.00 | | | | 01/15/2018 | | | | 122,813 | |
| | 75,000 | | | Midamerican Energy Holdings Company | | | 6.50 | | | | 09/15/2037 | | | | 84,841 | |
| | 255,000 | | | Occidental Petroleum Corporation | | | 2.50 | | | | 02/01/2016 | | | | 254,279 | |
| | 175,000 | | | Occidental Petroleum Corporation | | | 4.10 | | | | 02/01/2021 | | | | 177,878 | |
| | 75,000 | | | PacifiCorp | | | 6.25 | | | | 10/15/2037 | | | | 84,995 | |
| | 119,000 | | | Plains All American Pipeline LP | | | 3.95 | | | | 09/15/2015 | | | | 122,960 | |
| | 35,000 | | | Plains All American Pipeline LP | | | 6.65 | | | | 01/15/2037 | | | | 36,788 | |
| | 254,000 | | | Rockies Express Pipeline | | | 3.90 | | | | 04/15/2015 | | | | 251,229 | |
| | | | | | | | | | | | | | | | | |
| | | | | | | | | | | | | | | | 1,802,485 | |
| | | | | | | | | | | | | | | | |
| | | | | | | | | | | | | | | | | |
| Financials: 7.61% | | | | | | | | | | | | |
| | | | | | | | | | | | | | | | | |
| Capital Markets: 1.12% | | | | | | | | | | | | |
| | 178,000 | | | Goldman Sachs Group Incorporated | | | 6.00 | | | | 06/15/2020 | | | | 192,358 | |
| | 89,000 | | | Goldman Sachs Group Incorporated | | | 6.75 | | | | 10/01/2037 | | | | 90,993 | |
| | 160,000 | | | Lazard Group LLC | | | 7.13 | | | | 05/15/2015 | | | | 172,287 | |
| | 220,000 | | | Lazard Group LLC | | | 6.85 | | | | 06/15/2017 | | | | 230,147 | |
| | 170,000 | | | Morgan Stanley | | | 3.45 | | | | 11/02/2015 | | | | 165,743 | |
| | 100,000 | | | Morgan Stanley | | | 5.95 | | | | 12/28/2017 | | | | 105,804 | |
| | | | | | | | | | | | | | | | | |
| | | | | | | | | | | | | | | | 957,332 | |
| | | | | | | | | | | | | | | | |
| | |
| Portfolio of Investments—December 31, 2010 | | Wells Fargo Advantage VT Total Return Bond Fund 19 |
| | | | | | | | | | | | | | | | | |
| Principal | | | Security Name | | Interest Rate | | Maturity Date | | | Value | |
| Commercial Banks: 0.22% | | | | | | | | | | | | |
| $ | 190,000 | | | Westpac Banking Corporation | | | 3.00 | % | | | 12/09/2015 | | | $ | 189,643 | |
| | | | | | | | | | | | | | | | |
| | | | | | | | | | | | | | | | | |
| Consumer Finance: 0.74% | | | | | | | | | | | | |
| | 330,000 | | | American Express Company | | | 2.75 | | | | 09/15/2015 | | | | 324,616 | |
| | 250,000 | | | Capital One Bank USA NA | | | 8.80 | | | | 07/15/2019 | | | | 307,510 | |
| | | | | | | | | | | | | | | | | |
| | | | | | | | | | | | | | | | 632,126 | |
| | | | | | | | | | | | | | | | |
| | | | | | | | | | | | | | | | | |
| Diversified Financial Services: 3.72% | | | | | | | | | | | | |
| | 155,000 | | | Bank of America Corporation | | | 7.38 | | | | 05/15/2014 | | | | 172,295 | |
| | 220,000 | | | Bank of America Corporation | | | 3.70 | | | | 09/01/2015 | | | | 218,100 | |
| | 125,000 | | | Bank of America Corporation | | | 6.00 | | | | 09/01/2017 | | | | 131,001 | |
| | 185,000 | | | Bank of America Corporation | | | 5.63 | | | | 07/01/2020 | | | | 188,606 | |
| | 190,000 | | | Bank of America Corporation | | | 5.88 | | | | 01/05/2021 | | | | 196,576 | |
| | 255,000 | | | Barclays Bank plc | | | 2.50 | | | | 09/21/2015 | | | | 245,756 | |
| | 200,000 | | | Barclays Bank plc | | | 5.14 | | | | 10/14/2020 | | | | 179,950 | |
| | 340,000 | | | BNP Paribas | | | 2.20 | | | | 11/02/2015 | | | | 325,625 | |
| | 370,000 | | | Citigroup Incorporated« | | | 1.88 | | | | 10/22/2012 | | | | 377,410 | |
| | 106,000 | | | Citigroup Incorporated | | | 6.38 | | | | 08/12/2014 | | | | 117,152 | |
| | 112,000 | | | Citigroup Incorporated | | | 4.75 | | | | 05/19/2015 | | | | 117,275 | |
| | 255,000 | | | Citigroup Incorporated | | | 4.59 | | | | 12/15/2015 | | | | 265,840 | |
| | 95,000 | | | Citigroup Incorporated | | | 5.38 | | | | 08/09/2020 | | | | 98,706 | |
| | 300,000 | | | JPMorgan Chase & Company | | | 6.00 | | | | 10/01/2017 | | | | 332,569 | |
| | 155,000 | | | JPMorgan Chase & Company | | | 6.80 | | | | 10/01/2037 | | | | 159,819 | |
| | 50,000 | | | JPMorgan Chase & Company | | | 5.50 | | | | 10/15/2040 | | | | 51,107 | |
| | | | | | | | | | | | | | | | | |
| | | | | | | | | | | | | | | | 3,177,787 | |
| | | | | | | | | | | | | | | | |
| | | | | | | | | | | | | | | | | |
| Insurance: 0.71% | | | | | | | | | | | | |
| | 190,000 | | | American International Group | | | 6.40 | | | | 12/15/2020 | | | | 199,350 | |
| | 130,000 | | | Hartford Financial Services Group | | | 5.50 | | | | 03/30/2020 | | | | 131,874 | |
| | 91,000 | | | Liberty Mutual Group | | | 7.50 | | | | 08/15/2036 | | | | 90,477 | |
| | 50,000 | | | Prudential Financial Incorporated | | | 4.50 | | | | 11/15/2020 | | | | 48,898 | |
| | 60,000 | | | Prudential Financial Incorporated | | | 6.20 | | | | 11/15/2040 | | | | 63,471 | |
| | 70,000 | | | WR Berkley Corporation | | | 5.38 | | | | 09/15/2020 | | | | 68,318 | |
| | | | | | | | | | | | | | | | | |
| | | | | | | | | | | | | | | | 602,388 | |
| | | | | | | | | | | | | | | | |
| | | | | | | | | | | | | | | | | |
| Real Estate Investment Trusts: 1.10% | | | | | | | | | | | | |
| | 75,000 | | | Boston Properties LP | | | 4.13 | | | | 05/15/2021 | | | | 71,103 | |
| | 21,000 | | | HCP Incorporated Series MTN | | | 6.30 | | | | 09/15/2016 | | | | 22,622 | |
| | 55,000 | | | HCP Incorporated Series MTN | | | 6.70 | | | | 01/30/2018 | | | | 59,008 | |
| | 160,000 | | | Health Care Property Investors Incorporated | | | 5.65 | | | | 12/15/2013 | | | | 171,865 | |
| | 30,000 | | | Health Care Property Investors Incorporated | | | 6.00 | | | | 01/30/2017 | | | | 31,376 | |
| | 50,000 | | | Kilroy Realty Corporation | | | 5.00 | | | | 11/03/2015 | | | | 49,637 | |
| | 80,000 | | | Kilroy Realty Corporation | | | 6.63 | | | | 06/01/2020 | | | | 79,580 | |
| | 87,000 | | | Reckson Operating Partnership LP | | | 7.75 | | | | 03/15/2020 | | | | 93,090 | |
| | 85,000 | | | Tanger Properties LP | | | 6.13 | | | | 06/01/2020 | | | | 91,242 | |
| | 70,000 | | | Ventas Realty LP | | | 3.13 | | | | 11/30/2015 | | | | 67,444 | |
| | 80,000 | | | WEA Finance LLC | | | 7.50 | | | | 06/02/2014 | | | | 90,797 | |
| | 95,000 | | | WEA Finance LLC | | | 7.13 | | | | 04/15/2018 | | | | 109,285 | |
| | | | | | | | | | | | | | | | | |
| | | | | | | | | | | | | | | | 937,049 | |
| | | | | | | | | | | | | | | | |
| | | | | | | | | | | | | | | | | |
| Health Care: 1.21% | | | | | | | | | | | | |
| | | | | | | | | | | | | | | | | |
| Biotechnology: 0.24% | | | | | | | | | | | | |
| | 220,000 | | | Amgen Incorporated« | | | 3.45 | | | | 10/01/2020 | | | | 209,624 | |
| | | | | | | | | | | | | | | | |
| | |
| 20 Wells Fargo Advantage VT Total Return Bond Fund | | Portfolio of Investments—December 31, 2010 |
| | | | | | | | | | | | | | | | | |
| Principal | | | Security Name | | Interest Rate | | Maturity Date | | | Value | |
| Health Care Equipment & Supplies: 0.09% | | | | | | | | | | | | |
| $ | 80,000 | | | Becton Dickinson & Company | | | 3.25 | % | | | 11/12/2020 | | | $ | 75,090 | |
| | | | | | | | | | | | | | | | |
| |
| Health Care Providers & Services: 0.18% | | | | | | | | | | | | |
| | 155,000 | | | Coventry Health Care Incorporated | | | 5.95 | | | | 03/15/2017 | | | | 157,586 | |
| | | | | | | | | | | | | | | | |
| |
| Life Sciences Tools & Services: 0.32% | | | | | | | | | | | | |
| | 205,000 | | | Life Technologies Corporation | | | 3.50 | | | | 01/15/2016 | | | | 204,375 | |
| | 70,000 | | | Life Technologies Corporation | | | 5.00 | | | | 01/15/2021 | | | | 69,341 | |
| | | | | | | | | | | | | | | | | |
| | | | | | | | | | | | | | | | 273,716 | |
| | | | | | | | | | | | | | | | |
| | | | | | | | | | | | | | | | | |
| Pharmaceuticals: 0.38% | | | | | | | | | | | | |
| | 215,000 | | | Allergan Incorporated | | | 3.38 | | | | 09/15/2020 | | | | 202,793 | |
| | 120,000 | | | Merck & Company Incorporated | | | 3.88 | | | | 01/15/2021 | | | | 119,253 | |
| | | | | | | | | | | | | | | | | |
| | | | | | | | | | | | | | | | 322,046 | |
| | | | | | | | | | | | | | | | |
| | | | | | | | | | | | | | | | | |
| Industrials: 0.44% | | | | | | | | | | | | |
| | | | | | | | | | | | | | | | | |
| Aerospace & Defense: 0.23% | | | | | | | | | | | | |
| | 75,000 | | | Northrop Grumman Corporation | | | 3.50 | | | | 03/15/2021 | | | | 69,817 | |
| | 55,000 | | | Northrop Grumman Corporation | | | 5.05 | | | | 11/15/2040 | | | | 51,386 | |
| | 85,000 | | | Raytheon Corporation | | | 3.13 | | | | 10/15/2020 | | | | 78,378 | |
| | | | | | | | | | | | | | | | | |
| | | | | | | | | | | | | | | | 199,581 | |
| | | | | | | | | | | | | | | | |
| | | | | | | | | | | | | | | | | |
| Road & Rail: 0.21% | | | | | | | | | | | | |
| | 171,000 | | | BSNF Railway Company | | | 5.75 | | | | 05/01/2040 | | | | 176,920 | |
| | | | | | | | | | | | | | | | |
| | | | | | | | | | | | | | | | | |
| Information Technology: 0.82% | | | | | | | | | | | | |
| | | | | | | | | | | | | | | | | |
| Communications Equipment: 0.04% | | | | | | | | | | | | |
| | 35,000 | | | Harris Corporation | | | 6.15 | | | | 12/15/2040 | | | | 35,821 | |
| | | | | | | | | | | | | | | | |
| | | | | | | | | | | | | | | | | |
| Computers & Peripherals: 0.45% | | | | | | | | | | | | |
| | 265,000 | | | Hewlett Packard Company LP | | | 2.13 | | | | 09/13/2015 | | | | 261,668 | |
| | 130,000 | | | Hewlett Packard Company LP | | | 3.75 | | | | 12/01/2020 | | | | 127,152 | |
| | | | | | | | | | | | | | | | | |
| | | | | | | | | | | | | | | | 388,820 | |
| | | | | | | | | | | | | | | | |
| | | | | | | | | | | | | | | | | |
| Electronic Equipment & Instruments: 0.14% | | | | | | | | | | | | |
| | 50,000 | | | Arrow Electronics Incorporated | | | 3.38 | | | | 11/01/2015 | | | | 48,470 | |
| | 75,000 | | | Arrow Electronics Incorporated | | | 5.13 | | | | 03/01/2021 | | | | 71,710 | |
| | | | | | | | | | | | | | | | | |
| | | | | | | | | | | | | | | | 120,180 | |
| | | | | | | | | | | | | | | | |
| | | | | | | | | | | | | | | | | |
| IT Services: 0.06% | | | | | | | | | | | | |
| | 50,000 | | | SAIC Incorporated | | | 5.95 | | | | 12/01/2040 | | | | 50,701 | |
| | | | | | | | | | | | | | | | |
| | | | | | | | | | | | | | | | | |
| Software: 0.13% | | | | | | | | | | | | |
| | 106,000 | | | Adobe Systems Incorporated | | | 4.75 | | | | 02/01/2020 | | | | 108,428 | |
| | | | | | | | | | | | | | | | |
| | | | | | | | | | | | | | | | | |
| Materials: 0.87% | | | | | | | | | | | | |
| | | | | | | | | | | | | | | | | |
| Chemicals: 0.67% | | | | | | | | | | | | |
| | 165,000 | | | Dow Chemical Company | | | 4.85 | | | | 08/15/2012 | | | | 173,940 | |
| | 90,000 | | | Dow Chemical Company | | | 5.90 | | | | 02/15/2015 | | | | 99,647 | |
| | 168,000 | | | Dow Chemical Company | | | 8.55 | | | | 05/15/2019 | | | | 210,546 | |
| | 90,000 | | | Dow Chemical Company | | | 4.25 | | | | 11/15/2020 | | | | 86,211 | |
| | | | | | | | | | | | | | | | | |
| | | | | | | | | | | | | | | | 570,344 | |
| | | | | | | | | | | | | | | | |
| | |
| Portfolio of Investments—December 31, 2010 | | Wells Fargo Advantage VT Total Return Bond Fund 21 |
| | | | | | | | | | | | | | | | | |
| Principal | | | Security Name | | Interest Rate | | Maturity Date | | | Value | |
| Metals & Mining: 0.20% | | | | | | | | | | | | |
| $ | 185,000 | | | Codelco Incorporated | | | 3.75 | % | | | 11/04/2020 | | | $ | 175,294 | |
| | | | | | | | | | | | | | | | |
| | | | | | | | | | | | | | | | | |
| Telecommunication Services: 1.09% | | | | | | | | | | | | |
| | | | | | | | | | | | | | | | | |
| Diversified Telecommunication Services: 0.39% | | | | | | | | | | | | |
| | 95,000 | | | Frontier Communications Corporation | | | 8.25 | | | | 04/15/2017 | | | | 104,263 | |
| | 25,000 | | | Frontier Communications Corporation | | | 8.13 | | | | 10/01/2018 | | | | 27,438 | |
| | 50,000 | | | Frontier Communications Corporation | | | 8.50 | | | | 04/15/2020 | | | | 54,625 | |
| | 130,000 | | | Qwest Corporation | | | 7.50 | | | | 10/01/2014 | | | | 145,600 | |
| | | | | | | | | | | | | | | | | |
| | | | | | | | | | | | | | | | 331,926 | |
| | | | | | | | | | | | | | | | |
| | | | | | | | | | | | | | | | | |
| Wireless Telecommunication Services: 0.70% | | | | | | | | | | | | |
| | 180,000 | | | American Tower Corporation | | | 4.50 | | | | 01/15/2018 | | | | 178,428 | |
| | 53,000 | | | American Tower Corporation | | | 5.05 | | | | 09/01/2020 | | | | 52,122 | |
| | 85,000 | | | Cellco Partnership / Verizon Wireless Capital LLC | | | 8.50 | | | | 11/15/2018 | | | | 111,227 | |
| | 230,000 | | | Verizon Wireless Corporation | | | 5.55 | | | | 02/01/2014 | | | | 253,622 | |
| | | | | | | | | | | | | | | | | |
| | | | | | | | | | | | | | | | 595,399 | |
| | | | | | | | | | | | | | | | |
| | | | | | | | | | | | | | | | | |
| Utilities Revenue: 1.96% | | | | | | | | | | | | |
| | | | | | | | | | | | | | | | | |
| Electric Utilities: 1.12% | | | | | | | | | | | | |
| | 190,000 | | | DPL Incorporated | | | 6.88 | | | | 09/01/2011 | | | | 197,185 | |
| | 140,000 | | | Duke Energy Corporation | | | 6.30 | | | | 02/01/2014 | | | | 155,938 | |
| | 30,000 | | | Exelon Generation Company LLC | | | 4.00 | | | | 10/01/2020 | | | | 28,075 | |
| | 50,000 | | | Exelon Generation Company LLC | | | 5.75 | | | | 10/01/2041 | | | | 47,638 | |
| | 80,000 | | | FirstEnergy Solutions Company | | | 6.05 | | | | 08/15/2021 | | | | 82,181 | |
| | 50,000 | | | FirstEnergy Solutions Company | | | 6.80 | | | | 08/15/2039 | | | | 48,460 | |
| | 300,000 | | | Nevada Power Company Series A | | | 8.25 | | | | 06/01/2011 | | | | 309,061 | |
| | 85,000 | | | Progress Energy Incorporated | | | 6.85 | | | | 04/15/2012 | | | | 91,049 | |
| | | | | | | | | | | | | | | | | |
| | | | | | | | | | | | | | | | 959,587 | |
| | | | | | | | | | | | | | | | |
| | | | | | | | | | | | | | | | | |
| Gas Utilities: 0.22% | | | | | | | | | | | | |
| | 95,000 | | | El Paso Pipeline Corporation | | | 7.50 | | | | 11/15/2040 | | | | 98,455 | |
| | 90,000 | | | Pacific Gas & Electric Company | | | 5.40 | | | | 01/15/2040 | | | | 90,910 | |
| | | | | | | | | | | | | | | | | |
| | | | | | | | | | | | | | | | 189,365 | |
| | | | | | | | | | | | | | | | |
| | | | | | | | | | | | | | | | | |
| Independent Power Producers & Energy Traders: 0.08% | | | | | | | | | | | | |
| | 70,000 | | | Constellation Energy Group | | | 5.15 | | | | 12/01/2020 | | | | 68,915 | |
| | | | | | | | | | | | | | | | |
| | | | | | | | | | | | | | | | | |
| Multi-Utilities: 0.54% | | | | | | | | | | | | |
| | 110,000 | | | CMS Energy Corporation | | | 5.05 | | | | 02/15/2018 | | | | 108,766 | |
| | 270,000 | | | Dominion Resources Incorporated | | | 8.88 | | | | 01/15/2019 | | | | 349,843 | |
| | | | | | | | | | | | | | | | | |
| | | | | | | | | | | | | | | | 458,609 | |
| | | | | | | | | | | | | | | | |
| | | | | | | | | | | | | | | | | |
| Total Corporate Bonds and Notes (Cost $15,170,390) | | | | | | | | | | | 15,438,693 | |
| | | | | | | | | | | | | | | | |
| | | | | | | | | | | | | | | | | |
| Yankee Corporate Bonds and Notes: 5.99% | | | | | | | | | | | | |
| | | | | | | | | | | | | | | | | |
| Consumer Discretionary: 0.27% | | | | | | | | | | | | |
| | | | | | | | | | | | | | | | | |
| Media: 0.27% | | | | | | | | | | | | |
| | 110,000 | | | British Sky Broadcasting Group plc | | | 9.50 | | | | 11/15/2018 | | | | 144,078 | |
| | 80,000 | | | Thomson Reuters Corporation | | | 5.95 | | | | 07/15/2013 | | | | 88,808 | |
| | | | | | | | | | | | | | | | | |
| | | | | | | | | | | | | | | | 232,886 | |
| | | | | | | | | | | | | | | | |
| | | | | | | | | | | | | | | | | |
| Consumer Staples: 0.15% | | | | | | | | | | | | |
| | | | | | | | | | | | | | | | | |
| Food & Staples Retailing: 0.15% | | | | | | | | | | | | |
| | 130,000 | | | Woolworths Limited | | | 4.00 | | | | 09/22/2020 | | | | 125,888 | |
| | | | | | | | | | | | | | | | |
| | |
| 22 Wells Fargo Advantage VT Total Return Bond Fund | | Portfolio of Investments—December 31, 2010 |
| | | | | | | | | | | | | | | | | |
| Principal | | | Security Name | | Interest Rate | | Maturity Date | | | Value | |
| Energy: 0.71% | | | | | | | | | | | | |
| | | | | | | | | | | | | | | | | |
| Oil, Gas & Consumable Fuels: 0.71% | | | | | | | | | | | | |
| $ | 75,000 | | | Husky Energy Incorporated | | | 5.90 | % | | | 06/15/2014 | | | $ | 82,424 | |
| | 55,000 | | | Petro Canada | | | 6.80 | | | | 05/15/2038 | | | | 62,651 | |
| | 185,000 | | | Shell International | | | 3.10 | | | | 06/28/2015 | | | | 189,986 | |
| | 265,000 | | | Transocean Incorporated | | | 4.95 | | | | 11/15/2015 | | | | 273,867 | |
| | | | | | | | | | | | | | | | | |
| | | | | | | | | | | | | | | | 608,928 | |
| | | | | | | | | | | | | | | | |
| | | | | | | | | | | | | | | | | |
| Financials: 3.00% | | | | | | | | | | | | |
| | | | | | | | | | | | | | | | | |
| Commercial Banks: 1.67% | | | | | | | | | | | | |
| | 295,000 | | | DnB Nor Boligkreditt AS | | | 2.10 | | | | 10/14/2015 | | | | 280,544 | |
| | 134,000 | | | HSBC Holdings PLC | | | 6.80 | | | | 06/01/2038 | | | | 144,896 | |
| | 105,000 | | | Itau Unibanco Holding SA | | | 6.20 | | | | 04/15/2020 | | | | 107,871 | |
| | 199,000 | | | Korea Development Bank | | | 3.25 | | | | 03/09/2016 | | | | 193,518 | |
| | 190,000 | | | Lloyds TSB Bank plc | | | 6.50 | | | | 09/14/2020 | | | | 174,806 | |
| | 260,000 | | | Nordea Bank AB | | | 3.70 | | | | 11/13/2014 | | | | 267,999 | |
| | 248,000 | | | Swedish Export Credit | | | 3.25 | | | | 09/16/2014 | | | | 259,759 | |
| | | | | | | | | | | | | | | | | |
| | | | | | | | | | | | | | | | 1,429,393 | |
| | | | | | | | | | | | | | | | |
| | | | | | | | | | | | | | | | | |
| Consumer Finance: 0.29% | | | | | | | | | | | | |
| | 245,000 | | | Finance For Danish Industry | | | 2.00 | | | | 06/12/2013 | | | | 249,069 | |
| | | | | | | | | | | | | | | | |
| | | | | | | | | | | | | | | | | |
| Diversified Financial Services: 0.18% | | | | | | | | | | | | |
| | 140,000 | | | Credit Suisse New York NY | | | 6.00 | | | | 02/15/2018 | | | | 150,121 | |
| | | | | | | | | | | | | | | | |
| | | | | | | | | | | | | | | | | |
| Real Estate Investment Trusts: 0.39% | | | | | | | | | | | | |
| | 210,000 | | | Qatari Diar Finance QSC | | | 5.00 | | | | 07/21/2020 | | | | 209,003 | |
| | 116,000 | | | Westfield Group | | | 5.40 | | | | 10/01/2012 | | | | 122,974 | |
| | | | | | | | | | | | | | | | | |
| | | | | | | | | | | | | | | | 331,977 | |
| | | | | | | | | | | | | | | | |
| | | | | | | | | | | | | | | | | |
| Thrifts & Mortgage Finance: 0.47% | | | | | | | | | | | | |
| | 385,000 | | | Achmea Hypotheekbank NV | | | 3.20 | | | | 11/03/2014 | | | | 400,563 | |
| | | | | | | | | | | | | | | | |
| | | | | | | | | | | | | | | | | |
| Materials: 0.19% | | | | | | | | | | | | |
| | | | | | | | | | | | | | | | | |
| Metals & Mining: 0.19% | | | | | | | | | | | | |
| | 100,000 | | | Vale Overseas Limited | | | 4.63 | | | | 09/15/2020 | | | | 99,008 | |
| | 54,000 | | | Vale Overseas Limited | | | 6.88 | | | | 11/10/2039 | | | | 59,666 | |
| | | | | | | | | | | | | | | | | |
| | | | | | | | | | | | | | | | 158,674 | |
| | | | | | | | | | | | | | | | |
| | | | | | | | | | | | | | | | | |
| Telecommunication Services: 1.44% | | | | | | | | | | | | |
| | | | | | | | | | | | | | | | | |
| Diversified Telecommunication Services: 0.73% | | | | | | | | | | | | |
| | 55,000 | | | British Telecommunications PLC | | | 9.88 | | | | 12/15/2030 | | | | 73,306 | |
| | 275,000 | | | Hutchison Whampoa International Limited | | | 4.63 | | | | 09/11/2015 | | | | 288,718 | |
| | 80,000 | | | Telefonica Emisiones SAU | | | 5.98 | | | | 06/20/2011 | | | | 81,774 | |
| | 190,000 | | | Telemar Norte Leste SAU | | | 5.50 | | | | 10/23/2020 | | | | 182,875 | |
| | | | | | | | | | | | | | | | | |
| | | | | | | | | | | | | | | | 626,673 | |
| | | | | | | | | | | | | | | | |
| | | | | | | | | | | | | | | | | |
| Wireless Telecommunication Services: 0.71% | | | | | | | | | | | | |
| | 246,000 | | | America Movil SAB SA | | | 5.00 | | | | 10/16/2019 | | | | 256,038 | |
| | 35,000 | | | Rogers Cable Incorporated | | | 5.50 | | | | 03/15/2014 | | | | 38,225 | |
| | 190,000 | | | Rogers Wireless Incorporated | | | 6.38 | | | | 03/01/2014 | | | | 213,485 | |
| | 100,000 | | | Telefonica Moviles Chile | | | 2.88 | | | | 11/09/2015 | | | | 95,978 | |
| | | | | | | | | | | | | | | | | |
| | | | | | | | | | | | | | | | 603,726 | |
| | | | | | | | | | | | | | | | |
| | |
| Portfolio of Investments—December 31, 2010 | | Wells Fargo Advantage VT Total Return Bond Fund 23 |
| | | | | | | | | | | | | | | | | |
| Principal | | | Security Name | | Interest Rate | | Maturity Date | | | Value | |
| Utilities Revenue: 0.23% | | | | | | | | | | | | |
| | | | | | | | | | | | | | | | | |
| Electric Utilities: 0.11% | | | | | | | | | | | | |
| $ | 100,000 | | | Korea Hydro & Nuclear Power Company Limited | | | 3.13 | % | | | 09/16/2015 | | | $ | 96,946 | |
| | | | | | | | | | | | | | | | |
| | | | | | | | | | | | | | | | | |
| Gas Utilities: 0.12% | | | | | | | | | | | | |
| | 100,000 | | | Odebrecht Drilling SA | | | 6.35 | | | | 06/30/2021 | | | | 104,000 | |
| | | | | | | | | | | | | | | | |
| | | | | | | | | | | | | | | | | |
| Total Yankee Corporate Bonds and Notes (Cost $5,050,906) | | | | | | | | | | | 5,118,844 | |
| | | | | | | | | | | | | | | | |
| | | | | | | | | | | | | | | | | |
| Yankee Government Bonds: 1.76% | | | | | | | | | | | | |
| | 100,000 | | | Federal Republic of Brazil | | | 5.63 | | | | 01/07/2041 | | | | 99,250 | |
| | 105,000 | | | Korea | | | 5.50 | | | | 10/17/2012 | | | | 111,141 | |
| | 188,000 | | | Norway | | | 1.75 | | | | 10/05/2015 | | | | 182,440 | |
| | 190,000 | | | Province Of Ontario Canada | | | 3.15 | | | | 12/15/2017 | | | | 188,825 | |
| | 170,000 | | | Republic of Chile | | | 3.88 | | | | 08/05/2020 | | | | 167,120 | |
| | 95,000 | | | Republic of Peru | | | 5.63 | | | | 11/18/2050 | | | | 87,875 | |
| | 120,000 | | | Republic of Poland | | | 3.88 | | | | 07/16/2015 | | | | 121,965 | |
| | 100,000 | | | Russia | | | 3.63 | | | | 04/29/2015 | | | | 100,130 | |
| | 430,000 | | | State of Qatar | | | 4.00 | | | | 01/20/2015 | | | | 445,050 | |
| | | | | | | | | | | | | | | | | |
| Total Yankee Government Bonds (Cost $1,510,355) | | | | | | | | | | | 1,503,796 | |
| | | | | | | | | | | | | | | | |
| | | | | | | | | | | | | | | | | |
| Municipal Bonds and Notes: 0.88% | | | | | | | | | | | | |
| | | | | | | | | | | | | | | | | |
| California: 0.44% | | | | | | | | | | | | |
| | 25,000 | | | California State Build America Bonds (Property Tax Revenue) | | | 7.63 | | | | 03/01/2040 | | | | 26,348 | |
| | 125,000 | | | California State Build America Bonds (Property Tax Revenue) | | | 7.60 | | | | 11/01/2040 | | | | 130,925 | |
| | 100,000 | | | Los Angeles CA Community College District Build America Bonds (Property Tax Revenue) | | | 6.75 | | | | 08/01/2049 | | | | 103,571 | |
| | 110,000 | | | Los Angeles CA Department of Water & Power Build America Bonds (Utilities Revenue) | | | 6.57 | | | | 07/01/2045 | | | | 112,650 | |
| | | | | | | | | | | | | | | | | |
| | | | | | | | | | | | | | | | 373,494 | |
| | | | | | | | | | | | | | | | |
| | | | | | | | | | | | | | | | | |
| Nevada: 0.16% | | | | | | | | | | | | |
| | 130,000 | | | Clark County NV Series C (Transportation Revenue) | | | 6.82 | | | | 07/01/2045 | | | | 133,333 | |
| | | | | | | | | | | | | | | | |
| | | | | | | | | | | | | | | | | |
| New Jersey: 0.16% | | | | | | | | | | | | |
| | 130,000 | | | New Jersey State Turnpike Authority (Transportation Revenue) | | | 7.10 | | | | 01/01/2041 | | | | 141,552 | |
| | | | | | | | | | | | | | | | |
| | | | | | | | | | | | | | | | | |
| Texas: 0.12% | | | | | | | | | | | | |
| | 110,000 | | | North Texas Tollway Authority (Transportation Revenue) | | | 6.72 | | | | 01/01/2049 | | | | 107,659 | |
| | | | | | | | | | | | | | | | |
| |
| Total Municipal Bonds and Notes (Cost $751,752) | | | | | | | | | | | 756,038 | |
| | | | | | | | | | | | | | | | |
| | | | | | | | | | | | | | | | | |
| US Treasury Securities: 11.13% | | | | | | | | | | | | |
| | | | | | | | | | | | | | | | | |
| US Treasury Bonds: 4.18% | | | | | | | | | | | | |
| | 45,000 | | | US Treasury Bond(o) | | | 1.38 | | | | 11/30/2015 | | | | 43,731 | |
| | 1,158,000 | | | US Treasury Bond(o) | | | 5.38 | | | | 02/15/2031 | | | | 1,351,784 | |
| | 760,000 | | | US Treasury Bond(o) | | | 4.50 | | | | 02/15/2036 | | | | 786,837 | |
| | 1,009,000 | | | US Treasury Bond(o) | | | 4.38 | | | | 05/15/2040 | | | | 1,013,884 | |
| | 136,000 | | | US Treasury Bond« | | | 3.88 | | | | 08/15/2040 | | | | 125,269 | |
| | 250,000 | | | US Treasury Bond(o) | | | 4.25 | | | | 11/15/2040 | | | | 245,938 | |
| | | | | | | | | | | | | | | | | |
| | | | | | | | | | | | | | | | 3,567,443 | |
| | | | | | | | | | | | | | | | |
| | |
| 24 Wells Fargo Advantage VT Total Return Bond Fund | | Portfolio of Investments—December 31, 2010 |
| | | | | | | | | | | | | | | | | |
| Principal | | | Security Name | | Interest Rate | | Maturity Date | | | Value | |
| US Treasury Notes: 6.95% | | | | | | | | | | | | |
| $ | 80,000 | | | US Treasury Note(o) | | | 0.50 | % | | | 11/30/2012 | | | $ | 79,897 | |
| | 730,000 | | | US Treasury Note(o) | | | 0.63 | | | | 12/31/2012 | | | | 730,399 | |
| | 936,000 | | | US Treasury Note(o) | | | 0.75 | | | | 12/15/2013 | | | | 929,346 | |
| | 563,000 | | | US Treasury Note(o) | | | 4.25 | | | | 11/15/2014 | | | | 622,423 | |
| | 2,598,000 | | | US Treasury Note(o) | | | 2.13 | | | | 12/31/2015 | | | | 2,611,801 | |
| | 43,000 | | | US Treasury Note(o) | | | 8.88 | | | | 08/15/2017 | | | | 59,730 | |
| | 440,000 | | | US Treasury Note(o) | | | 2.75 | | | | 12/31/2017 | | | | 440,963 | |
| | 304,000 | | | US Treasury Note(o) | | | 2.63 | | | | 11/15/2020 | | | | 286,757 | |
| | 136,000 | | | US Treasury Note(o) | | | 6.25 | | | | 05/15/2030 | | | | 174,802 | |
| | | | | | | | | | | | | | | | | |
| | | | | | | | | | | | | | | | 5,936,118 | |
| | | | | | | | | | | | | | | | |
| | | | | | | | | | | | | | | | | |
| Total US Treasury Securities (Cost $9,556,429) | | | | | | | | | | | 9,503,561 | |
| | | | | | | | | | | | | | | | |
| |
| Short-Term Investments: 2.46% | | | | | | | | | | | | |
| | | | | | | | | | | | | | | | | |
| Corporate Bonds & Notes: 0.65% | | | | | | | | | | | | |
| | 257,871 | | | Gryphon Funding Limited(v)(i)(a) | | | 0.00 | | | | 08/05/2011 | | | | 104,747 | |
| | | | | | | | | | | | | | | | | |
| | 800,556 | | | VFNC Corporation(v)±††(i)(a) | | | 0.26 | | | | 09/29/2011 | | | | 448,312 | |
| | | | | | | | | | | | | | | | | |
| | | | | | | | | | | | | | | | 553,059 | |
| | | | | | | | | | | | | | | | |
| | | | | | | | | | | | | | | | | | | | | |
| Shares | | | | | | | | | Yield | | | | | | | |
| Investment Companies: 1.81% | | | | | | | | | | | | | | | | |
| | 1,436,296 | | | Wells Fargo Advantage Cash Investment Money Market Fund(l)(u)(o) | | | | | | | 0.14 | % | | | | | | | 1,436,296 | |
| | 110,017 | | | Wells Fargo Securities Lending Cash Investments LLC(v)(l)(u) | | | | | | | 0.27 | | | | | | | | 110,017 | |
| | | | | | | | | | | | | | | | | | | | | |
| | | | | | | | | | | | �� | | | | | | | | 1,546,313 | |
| | | | | | | | | | | | | | | | | | | | |
| | | | | | | | | | | | | | | | | | | | | |
| Total Short-Term Investments (Cost $1,898,836) | | | | | | | | | | | | | | | 2,099,372 | |
| | | | | | | | | | | | | | | | | | | | |
| | | | | | | | | | | | | | | | | | | | | |
Total Investments in Securities
(Cost $99,650,943)* | | | 117.75 | % | | | | | | | | | | | 100,578,412 | |
| |
| | | | | | | | | | | | | | | | | | | | |
| Other Assets and Liabilities, Net | | | (17.75 | ) | | | | | | | | | | | (15,162,829 | ) |
| | | | | | | | | | | | | | | | | | | |
| |
| Total Net Assets | | | 100.00 | % | | | | | | | | | | $ | 85,415,583 | |
| | | | | | | | | | | | | | | | | | | |
| | | | | | | | | | | | | | | | | |
| Principal | | | | | Interest Rate | | Maturity Date | | | | | |
| Schedule of TBA Sale Commitments: (2.28%) | | | | | | | | | | | | |
| $ | (200,000 | ) | | FNMA%% | | | 5.50 | % | | | 04/25/2035 | | | $ | (213,594 | ) |
| | (1,600,000 | ) | | FNMA%% | | | 6.00 | | | | 08/25/2038 | | | | (1,736,000 | ) |
| | | | | | | | | | | | | | | | |
| | | | | | | | | | | | | | | | | |
| Total Schedule of TBA Sale Commitments (Proceeds $(1,940,180)) | | | | | | $ | (1,949,594 | ) |
| | | | | | | | | | | | | | | | |
| | |
| Portfolio of Investments—December 31, 2010 | | Wells Fargo Advantage VT Total Return Bond Fund 25 |
| | |
| (v) | | Security represents investment of cash collateral received from securities on loan. |
| |
| ± | | Variable rate investments. |
| |
| ++ | | Securities that may be resold to “qualified institutional buyers” under rule 144A or securities offered pursuant to Section 4(2) of the Securities Act of 1933, as amended. |
| |
| (I) | | Investment in an affiliate. |
| |
| (i) | | Illiquid security for which the designation as illiquid is unaudited. |
| |
| « | | All or a portion of this security is on loan. |
| |
| %% | | Securities issued on a when-issued (TBA) and/or delayed delivery basis. |
| |
| (a) | | Security is fair valued by the Management Valuation Team, and in certain instances by the Board of Trustees, in accordance with procedures approved by the Board of Trustees. |
| |
| (o) | | Security pledged as collateral for when-issued (TBA) securities. |
| |
| (u) | | Rate shown is the 7-day annualized yield at period end. |
| |
| * | | Cost for federal income tax purposes is $100,109,172 and net unrealized appreciation (depreciation) consists of: |
| | | | | |
|
| Gross unrealized appreciation | | $ | 1,614,800 | |
| Gross unrealized depreciation | | | (1,145,560 | ) |
| | | | |
| Net unrealized appreciation | | $ | 469,240 | |
The accompanying notes are an integral part of these financial statements.
| | | |
|
| 26 Wells Fargo Advantage VT Total Return Bond Fund | | Statement of Assets and Liabilities—December 31, 2010 |
| | | | | |
|
Assets | | | | |
| Investments | | | | |
| In unaffiliated securities (including securities on loan), at value | | $ | 98,779,619 | |
| In affiliated securities, at value | | | 1,798,793 | |
| | | | |
| Total investments, at value (see cost below) | | | 100,578,412 | |
| Receivable for investments sold | | | 43,365,185 | |
| Principal paydown receivable | | | 18,714 | |
| Receivable for Fund shares sold | | | 28,769 | |
| Receivable for interest | | | 551,848 | |
| Receivable for securities lending income | | | 6,444 | |
| Prepaid expenses and other assets | | | 1,010 | |
| | | | |
| Total assets | | | 144,550,382 | |
| | | | |
| | | | | |
Liabilities | | | | |
| Dividends payable | | | 13,472 | |
| Payable for investments purchased | | | 56,363,956 | |
| Payable for Fund shares redeemed | | | 67,294 | |
| Payable upon receipt of securities loaned | | | 462,540 | |
| Payable for interest on TBA sale commitments | | | 2,675 | |
| Payable for TBA sale commitments, at value | | | 1,949,594 | |
| Investment advisory fee payable | | | 106,260 | |
| Distribution fees payable | | | 19,328 | |
| Due to custodian bank | | | 7,696 | |
| Due to other related parties | | | 10,049 | |
| Accrued expenses and other liabilities | | | 131,935 | |
| | | | |
| Total liabilities | | | 59,134,799 | |
| | | | |
Total net assets | | $ | 85,415,583 | |
| | | | |
| | | | | |
NET ASSETS CONSIST OF | | | | |
| Paid-in capital | | $ | 88,397,090 | |
| Undistributed net investment income | | | 41,738 | |
| Accumulated net realized losses on investments | | | (3,941,300 | ) |
| Net unrealized gains on investments | | | 918,055 | |
| | | | |
Total net assets | | $ | 85,415,583 | |
| | | | |
| | | | | |
COMPUTATION OF NET ASSET VALUE PER SHARE1 | | | | |
| Net assets — Class 2 | | $ | 85,415,583 | |
| Shares outstanding — Class 2 | | | 8,201,985 | |
| Net asset value per share — Class 2 | | $ | 10.41 | |
| | | | |
| | | | | |
| Total investments, at cost | | $ | 99,650,943 | |
| | | | |
| Securities on loan, at value | | $ | 455,280 | |
| | | | |
| Proceeds received from TBA sale commitments | | $ | 1,940,180 | |
| | | | |
1. The Fund has an unlimited number of authorized shares.
The accompanying notes are an integral part of these financial statements.
| | | |
|
| Statement of Operations—For the year Ended December 31 2010 | | Wells Fargo Advantage VT Total Return Bond Fund 27 |
| | | | | |
|
Investment income | | | | |
| Interest* | | $ | 3,053,660 | |
| Income from affiliated securities | | | 36,817 | |
| Securities lending income, net | | | 1,408 | |
| | | | |
| Total investment income | | | 3,091,885 | |
| | | | |
| | | | | |
Expenses | | | | |
| Investment advisory fee | | | 342,560 | |
| Administration fees | | | | |
| Fund level | | | 91,404 | |
Class 21 | | | 33,178 | |
| Distribution fees | | | | |
Class 21 | | | 214,100 | |
| Custody and accounting fees | | | 21,401 | |
| Professional fees | | | 21,558 | |
| Shareholder report expenses | | | 34,491 | |
| Trustees’ fees and expenses | | | 12,254 | |
| Other fees and expenses | | | 4,394 | |
| | | | |
| Total expenses | | | 775,340 | |
| | | | | |
Less: Fee waivers and/or expense reimbursements | | | (35,155 | ) |
| | | | |
| Net expenses | | | 740,185 | |
| | | | |
| Net investment income | | | 2,351,700 | |
| | | | |
| | | | | |
NET REALIZED AND UNREALIZED GAINS (LOSSES) ON INVESTMENTS | | | | |
Net realized gains (losses) on: | | | | |
| Unaffiliated securities | | | 5,093,231 | |
| Affiliated securities | | | 13,451 | |
| TBA sale commitments | | | (81,520 | ) |
| | | | |
| Net realized gains on investments | | | 5,025,162 | |
| | | | |
| | | | | |
Net change in unrealized gains (losses) on: | | | | |
| Unaffiliated securities | | | (1,719,375 | ) |
| Affiliated securities | | | 9,365 | |
| TBA sale commitments | | | (10,117 | ) |
| | | | |
| Net change in unrealized gains (losses) on investments | | | (1,720,127 | ) |
| | | | |
| Net realized and unrealized gains (losses) on investments | | | 3,305,035 | |
| | | | |
Net increase assets resulting from operations | | $ | 5,656,735 | |
| | | | |
| | | | |
|
| * Net of foreign withholding taxes of | | $ | 2,639 | |
1. After the close of business on July 16, 2010, existing shares of the Fund were renamed Class 2 shares.
The accompanying notes are an integral part of these financial statements.
| | | |
|
| 28 Wells Fargo Advantage VT Total Return Bond Fund | | Statement of Changes in Net Assets |
| | | | | | | | | | | | | | | | | |
| | | | | | | Year Ended | | | | | | Year Ended |
| | | | | | | December 31, 2010 | | | | | | December 31, 2009 |
| |
Operations | | | | | | | | | | | | | | | | |
| Net investment income | | | | | | $ | 2,351,700 | | | | | | | $ | 3,721,497 | |
| Net realized gains on investments | | | | | | | 5,025,162 | | | | | | | | 1,385,968 | |
| Net change in unrealized gains (losses) on investments | | | | | | | (1,720,127 | ) | | | | | | | 5,138,033 | |
| | | |
| Net increase in net assets resulting from operations | | | | | | | 5,656,735 | | | | | | | | 10,245,498 | |
| | | |
| | | | | | | | | | | | | | | | | |
Distributions to shareholders from | | | | | | | | | | | | | | | | |
Net investment income — Class 21 | | | | | | | (2,911,613 | ) | | | | | | | (4,144,480 | ) |
Net realized gains — Class 21 | | | | | | | (1,599,718 | ) | | | | | | | (384,241 | ) |
| | | |
| Total distributions to shareholders | | | | | | | (4,511,331 | ) | | | | | | | (4,528,721 | ) |
| | | |
| |
| | | Shares | | | | | | Shares | | | | |
| |
Capital shares transactions | | | | | | | | | | | | | | | | |
Proceeds from shares sold — Class 21 | | | 1,128,306 | | | | 11,845,200 | | | | 2,307,327 | | | | 23,374,243 | |
Reinvestment of distributions — Class 21 | | | 430,547 | | | | 4,523,836 | | | | 447,370 | | | | 4,514,417 | |
Payment for shares redeemed — Class 21 | | | (5,530,492 | ) | | | (58,415,579 | ) | | | (3,203,494 | ) | | | (32,081,199 | ) |
| Net asset value of shares issued in acquisition — Class 2 | | | 2,976,311 | | | | 31,182,320 | | | | 0 | | | | 0 | |
| | | |
| Net decrease in net assets resulting from capital share transactions | | | | | | | (10,864,223 | ) | | | | | | | (4,192,539 | ) |
| | | |
| Total increase (decrease) in net assets | | | | | | | (9,718,819 | ) | | | | | | | 1,524,238 | |
| | | |
Net assets | | | | | | | | | | | | | | | | |
Beginning of period | | | | | | | 95,134,402 | | | | | | | | 93,610,164 | |
| | | |
End of period | | | | | | $ | 85,415,583 | | | | | | | $ | 95,134,402 | |
| | | |
| Undistributed net investment income | | | | | | $ | 41,738 | | | | | | | $ | 37,448 | |
| | | |
1. After the close of business on July 16, 2010, existing shares of the Fund were renamed Class 2 shares.
The accompanying notes are an integral part of these financial statements.
This page is intentionally left blank.
| | | |
|
| 30 Wells Fargo Advantage VT Total Return Bond Fund | | Financial Highlights |
| | | | | | | | | | | | | | | | | | | | | |
| | | Beginning | | | | | | Net Realized | | Distributions | | |
| | | Net Asset | | | | | | and Unrealized | | from Net | | Distributions |
| | | Value Per | | Net Investment | | Gains (Losses) | | Investment | | from Net |
| | | Share | | Income | | on Investments | | Income | | Realized Gains |
| |
Class 22 | | | | | | | | | | | | | | | | | | | | |
| January 1, 2010 to December 31, 2010 | | $ | 10.34 | | | | 0.29 | | | | 0.43 | | | | (0.36 | ) | | | (0.29 | ) |
| January 1, 2009 to December 31, 2009 | | $ | 9.70 | | | | 0.42 | | | | 0.72 | | | | (0.46 | ) | | | (0.04 | ) |
| January 1, 2008 to December 31, 2008 | | $ | 9.94 | | | | 0.44 | | | | (0.21 | ) | | | (0.47 | ) | | | 0.00 | |
| January 1, 2007 to December 31, 2007 | | $ | 9.81 | | | | 0.45 | | | | 0.13 | | | | (0.45 | ) | | | 0.00 | |
| January 1, 2006 to December 31, 2006 | | $ | 9.86 | | | | 0.43 | | | | (0.05 | ) | | | (0.43 | ) | | | 0.00 | |
1. Total return calculations would have been lower had certain expenses not been waived or reimbursed during the periods shown.
2. After the close of business on July 16, 2010, existing shares of the Fund were renamed Class 2 shares.
The accompanying notes are an integral part of these financial statements.
| | |
| | | |
| Financial Highlights | | Wells Fargo Advantage VT Total Return Bond Fund 31 |
| | | | | | | | | | | | | | | | | | | | | | | | | | | | | |
| | | Ending | | | | | | | | | | |
| | | Net Asset | | Ratio to Average Net Assets | | | | | | Portfolio | | Net Assets at |
| | | Value Per | | Net Investment | | Gross | | Net | | Total | | Turnover | | End of Period |
| | | Share | | Income | | Expenses | | Expenses | | Return1 | | Rate | | (000’s omitted) |
| |
| |
| | | $ | 10.41 | | | | 2.76 | % | | | 0.91 | % | | | 0.86 | % | | | 7.04 | % | | | 838 | % | | $ | 85,416 | |
| | | $ | 10.34 | | | | 4.07 | % | | | 1.20 | % | | | 0.85 | % | | | 11.99 | % | | | 580 | % | | $ | 95,134 | |
| | | $ | 9.70 | | | | 4.55 | % | | | 1.19 | % | | | 0.90 | % | | | 2.39 | % | | | 692 | % | | $ | 93,610 | |
| | | $ | 9.94 | | | | 4.58 | % | | | 0.94 | % | | | 0.90 | % | | | 6.08 | % | | | 580 | % | | $ | 129,098 | |
| | | $ | 9.81 | | | | 4.36 | % | | | 0.95 | % | | | 0.90 | % | | | 3.92 | % | | | 662 | % | | $ | 116,449 | |
| | |
| | | |
| 32 Wells Fargo Advantage VT Total Return Bond Fund | | Notes to Financial Statements |
1. ORGANIZATION
Wells Fargo Variable Trust (the “Trust”), a Delaware statutory trust organized on March 10, 1999, is an open-end management investment company registered under the Investment Company Act of 1940, as amended (the “1940 Act”). These financial statements report on Wells Fargo Advantage VT Total Return Bond Fund (the “Fund”) which is a diversified series of the Trust. After the close of business on July 16, 2010, existing shares of the Fund were renamed Class 2 shares.
2. SIGNIFICANT ACCOUNTING POLICIES
The following significant accounting policies, which are consistently followed in the preparation of the financial statements of the Fund, are in conformity with U.S. generally accepted accounting principles which require management to make estimates and assumptions that affect the reported amounts of assets and liabilities, disclosure of contingent assets and liabilities at the date of the financial statements, and the reported amounts of revenues and expenses during the reporting period. Actual results could differ from those estimates. Management has considered the circumstances under which the Fund should recognize or make disclosures regarding events or transactions occurring subsequent to the balance sheet date through the date the financial statements are issued. Adjustments or additional disclosures, if any, have been included in these financial statements.
Securities valuation
Certain fixed income securities with maturities exceeding 60 days are valued based on available market quotations received from an independent pricing service approved by the Trust’s Board of Trustees which may utilize both transaction data and market information such as yield, prices of securities of comparable quality, coupon rate, maturity, type of issue, trading characteristics and other market data. If valuations are not available from the pricing service or values received are deemed not representative of market value, values will be obtained from a third party broker-dealer or determined based on the Fund’s Fair Value Procedures.
Debt securities of sufficient credit quality with original maturities of 60 days or less and any collateral received from securities lending invested in securities generally are valued at amortized cost which approximates fair value. The amortized cost method involves valuing a security at its cost, plus accretion of discount or minus amortization of premium over the period until maturity.
Investments in open-end mutual funds and non-registered investment companies are generally valued at net asset value.
Certain investments which are not valued using any of the methods discussed above, are valued at their fair value, as determined by procedures established in good faith and approved by the Board of Trustees.
The valuation techniques used by the Fund to measure fair value are consistent with the market approach, income approach and/or cost approach, where applicable, for each security type.
Security loans
The Fund may lend its securities from time to time in order to earn additional income in the form of fees or interest on securities received as collateral or the investment of any cash received as collateral. The Fund continues to receive interest or dividends on the securities loaned. The Fund receives collateral in the form of cash or securities with a value at least equal to the value of the securities on loan. The value of the loaned securities is determined at the close of each business day and any additional required collateral is delivered to the Fund on the next business day. In the event of default or bankruptcy by the borrower, the Fund could experience delays and costs in recovering the loaned securities or in gaining access to the collateral. In addition, the investment of any cash collateral received may lose all or part of its value. The Fund has the right under the lending agreement to recover the securities from the borrower on demand.
The Fund lends its securities through an unaffiliated securities lending agent. Cash collateral received in connection with its securities lending transactions is invested in Wells Fargo Securities Lending Cash Investments, LLC (the “Cash Collateral Fund”). The Cash Collateral Fund is exempt from registration under Section 3(c)(7) of the 1940 Act and is managed by Wells Fargo Funds Management LLC (“Funds Management”) and is sub-advised by Wells Capital Management Incorporated (“Wells Capital Management”). Funds Management receives an investment advisory fee starting at 0.05% and declining to 0.01% as the average daily net assets of the Cash Collateral Fund increase. All of the fees received by Funds Management are paid to Wells Capital Management for its services as sub-adviser. The Cash
| | |
| | | |
| Notes to Financial Statements | | Wells Fargo Advantage VT Total Return Bond Fund 33 |
Collateral Fund seeks to provide a positive return compared to the daily Fed Funds Open rate by investing in high-quality, U.S. dollar-denominated short-term money market instruments. Cash Collateral Fund investments are fair valued based upon the amortized cost valuation technique. Income earned from investment in the Cash Collateral Fund is included in securities lending income on the Statement of Operations.
Prior to April 1, 2010, Wells Fargo Bank, N.A. acted as the securities lending agent for the Fund and was entitled to receive for its services 25% of the revenues earned on the securities lending activities. For the year ended December 31, 2010, Wells Fargo Bank, N.A. waived a portion of its share of revenues earned on securities lending activities. Such waivers by Wells Fargo Bank, N.A. had the impact of increasing securities lending income on the Statement of Operations. The value of the securities on loan and the liability to return the collateral are shown on the Statement of Assets and Liabilities.
In a securities lending transaction, the net asset value of the Fund will be affected by an increase or decrease in the value of the securities loaned and by an increase or decrease in the value of instruments in which cash collateral is invested. The amount of securities lending activity undertaken by the Fund fluctuates from time to time. After the occurrence of a default or impairment of structured investment vehicles purchased in a joint account by the Fund’s former securities lending agent, as the various participating Funds’ lending activity fluctuated, their ratable interest in the joint account, including their ratable exposure to the defaulted or impaired structured investment vehicles fluctuated depending on the relative activity of each participating Fund. In order to eliminate the fluctuation of the various participating Funds’ ratable exposure to the defaulted or impaired structured investment vehicles, the adviser to the Funds recommended to the Board of Trustees, and the Board of Trustees approved, actions designed to fix the allocation of percentage ownership in defaulted or impaired structured investment vehicles among all funds participating in securities lending (“side pocketing”) based on each participating Fund’s percentage ownership of the total cash collateral investment joint account as of the date the fixed allocation is implemented. Accordingly, on February 13, 2009 a side pocketing occurred, which fixed each participating Fund’s ownership of defaulted or impaired structured investment vehicle in the joint account based on each participating Fund’s percentage ownership of the joint account as of such date.
When-issued transactions
The Fund may purchase securities on a forward commitment or ‘when-issued’ basis. The Fund records a when-issued transaction on the trade date and will segregate assets to cover its obligation by confirming the availability of qualifying assets having a value sufficient to make payment for the securities purchased. Securities purchased on a when-issued basis are marked-to-market daily and the Fund begins earning interest on the settlement date. Losses may arise due to changes in the market value of the underlying securities or if the counterparty does not perform under the contract.
Short sales
The Fund may sell a security it does not own in anticipation of a decline in the market value of that security (short sale). When the Fund makes a short sale, it must borrow the security sold short and deliver it to the buyer. The Fund is then obligated to replace the security borrowed by purchasing the security at the market price at the time of replacement.
The Fund records the proceeds as a liability which is marked-to-market daily based upon quotations from an independent pricing service or from brokers, which use prices provided by market makers, and any change in value is recorded as an unrealized gain or loss. Any interest or dividends accrued on such borrowed securities during the period of the loan are recorded as an expense on the Statement of Operations. To borrow the security, the Fund may be required to pay a premium, which would decrease the proceeds of the security sold. A gain, limited to the price at which the Fund sold the security short, or a loss, unlimited in size, will be recognized upon the closing of a short sale if the market price at the closing is less than or greater than, respectively, the proceeds originally received. Until the short sale is closed or the borrowed security is replaced, the Fund maintains a segregated account of cash or liquid securities, the dollar value of which is at least equal to the market value of the security at the time of the short sale.
TBA sale commitments
The Fund may enter into To Be Announced (“TBA”) sale commitments to hedge its portfolio positions or to sell mortgage-backed securities it owns under delayed delivery arrangements. Proceeds of TBA sale commitments are not received until the contractual settlement date. During the time a TBA sale commitment is outstanding, equivalent deliverable securities, or an offsetting TBA purchase commitment deliverable on or before the sale commitment date, are held as “cover” for the transaction. Unsettled TBA sale commitments are valued at the current market value of the
| | |
| | | |
| 34 Wells Fargo Advantage VT Total Return Bond Fund | | Notes to Financial Statements |
underlying securities, generally according to the procedures described under “Securities valuation”. The contract is marked-to-market daily and the change in market value is recorded by the Fund as an unrealized gain or loss. If the TBA sale commitment is closed through the acquisition of an offsetting purchase commitment, the Fund realizes a gain or loss. If the Fund delivers securities under the commitment, the Fund realizes a gain or a loss from the sale of the securities based upon the unit price established at the date the commitment was entered into.
Mortgage dollar roll transactions
The Fund may engage in mortgage dollar roll transactions with respect to mortgage-backed securities issued by Government National Mortgage Association (GNMA), Federal National Mortgage Association (FNMA) and Federal Home Loan Mortgage Corporation (FHLMC). In a mortgage dollar roll transaction, the Fund sells a mortgage-backed security to a financial institution, such as a bank or broker-dealer and simultaneously agrees to repurchase a substantially similar security from the institution at a later date at an agreed upon price. The mortgage-backed securities that are repurchased will bear the same interest rate as those sold, but generally will be collateralized by different pools of mortgages with different pre-payment histories. During the roll period, the Fund foregoes principal and interest paid on the securities. The Fund is compensated by the difference between the current sales price and the forward price for the future purchase as well as by the earnings on the cash proceeds of the initial sale. Mortgage dollar rolls may be renewed without physical delivery of the securities subject to the contract. The Fund accounts for the dollar roll transactions as purchases and sales.
Security transactions and income recognition
Securities transactions are recorded on a trade date basis. Realized gains or losses are reported on the basis of identified cost of securities delivered.
Interest income is accrued daily and bond discounts are accreted and premiums are amortized daily based on the effective interest method. To the extent debt obligations are placed on non-accrual status, any related interest income may be reduced by writing off interest receivables when the collection of all or a portion of interest has become doubtful based on consistently applied procedures. If the issuer subsequently resumes interest payments or when the collectability of interest is reasonably assured, the debt obligation is removed from non-accrual status.
Interest income from foreign securities is recorded net of foreign taxes withheld where recovery of such taxes is not assured.
Distributions to shareholders
Distributions to shareholders from net investment income are accrued daily and paid monthly. Distributions from net realized gains, if any, are recorded on the ex-dividend date. Such distributions are determined in conformity with income tax regulations, which may differ from generally accepted accounting principles.
The timing and character of distributions made during the period from net investment income or net realized gains may differ from their ultimate characterization for federal income tax purposes. To the extent that these differences are permanent in nature, such amounts are reclassified within the capital accounts based on their federal tax-basis treatment. Temporary differences do not require reclassifications. At December 31, 2010, as a result of permanent book-to-tax differences, the following reclassification adjustments were made on the Statement of Assets and Liabilities:
| | | | | | | |
| Undistributed | | Accumulated Net |
| Net Investment | | Realized Losses |
| Income | | on Investments |
| $ | 565,106 | | | $ | (565,106 | ) |
Federal and other taxes
The Fund intends to continue to qualify as a regulated investment company by distributing substantially all of its investment company taxable income and any net realized capital gains (after reduction for capital loss carryforwards) sufficient to relieve it from all, or substantially all, federal income taxes. Accordingly, no provision for federal income taxes was required.
The Fund’s income and federal excise tax returns and all financial records supporting those returns for the prior three fiscal years are subject to examination by the federal and Delaware revenue authorities.
| | |
| | | |
| Notes to Financial Statements | | Wells Fargo Advantage VT Total Return Bond Fund 35 |
As of December 31, 2010, the Fund had estimated net capital loss carryforwards, which are available to offset future net realized capital gains, in the amount of $6,658,604 with $1,963,738 expiring in 2015, and $4,694,866 expiring in 2016.
Under the recently enacted Regulated Investment Company Modernization Act of 2010, the Fund will be permitted to carry forward capital losses incurred in taxable years beginning after December 22, 2010 for an unlimited period. However, any losses incurred during those future taxable years will be required to be utilized prior to the losses incurred in pre-enactment taxable years. As a result of this ordering rule, pre-enactment capital loss carryforwards may be more likely to expire unused. Additionally, post-enactment capital losses that are carried forward will retain their character as either short-term or long-term capital losses rather than being considered all short-term as under previous law.
As of December 31, 2010, the Fund had $153,046 of current year deferred post-October capital losses, which will be treated as realized for tax purposes on the first day of the succeeding year.
3. FAIR VALUATION MEASUREMENTS
Fair value measurements of investments are determined within a framework that has established a fair value hierarchy based upon the various data inputs utilized in determining the value of the Fund’s investments. The three-level hierarchy gives the highest priority to unadjusted quoted prices in active markets for identical assets or liabilities (Level 1) and the lowest priority to unobservable inputs (Level 3). The Fund’s investments are classified within the fair value hierarchy based on the lowest level of input that is significant to the fair value measurement. The inputs are summarized into three broad levels as follows:
| § | | Level 1 — quoted prices in active markets for identical securities |
| |
| § | | Level 2 — other significant observable inputs (including quoted prices for similar securities, interest rates, prepayment speeds, credit risk, etc.) |
| |
| § | | Level 3 — significant unobservable inputs (including the Fund’s own assumptions in determining the fair value of investments) |
The inputs or methodologies used for valuing securities are not necessarily an indication of the risk associated with investing in those securities.
As of December 31, 2010, the inputs used in valuing the Fund’s assets, which are carried at fair value, were as follows:
| | | | | | | | | | | | | | | | | |
| | | | | | | Significant Other | | Significant | | |
| | | | | | | Observable | | Unobservable | | |
| | | Quoted Prices | | Inputs | | Inputs | | |
| Investments in Securities | | (Level 1) | | (Level 2) | | (Level 3) | | Total |
Agency securities | | $ | 0 | | | $ | 44,835,509 | | | $ | 603,883 | | | $ | 45,439,392 | |
Asset-backed securities | | | 0 | | | | 8,127,920 | | | | 0 | | | | 8,127,920 | |
Collateralized mortgage obligations | | | 0 | | | | 12,318,718 | | | | 272,078 | | | | 12,590,796 | |
Corporate bonds and notes | | | 0 | | | | 15,438,693 | | | | 0 | | | | 15,438,693 | |
Yankee corporate bonds | | | 0 | | | | 5,118,844 | | | | 0 | | | | 5,118,844 | |
Yankee government bonds | | | 0 | | | | 1,503,796 | | | | 0 | | | | 1,503,796 | |
Municipal bonds and notes | | | 0 | | | | 756,038 | | | | 0 | | | | 756,038 | |
U.S. Treasury securities | | | 9,503,561 | | | | 0 | | | | 0 | | | | 9,503,561 | |
Short-term investments | | | | | | | | | | | | | | | | |
Corporate bonds and notes | | | 0 | | | | 0 | | | | 553,059 | | | | 553,059 | |
Investment companies | | | 1,436,296 | | | | 110,017 | | | | 0 | | | | 1,546,313 | |
| | | $ | 10,939,857 | | | $ | 88,209,535 | | | $ | 1,429,020 | | | $ | 100,578,412 | |
Further details on the major security types listed above can be found in the Fund’s Portfolio of Investments.
| | | | | | | | | | | | | | | | | |
| | | | | | | Significant Other | | Significant | | |
| | | | | | | Observable | | Unobservable | | |
| | | Quoted Prices | | Inputs | | Inputs | | |
| | | (Level 1) | | (Level 2) | | (Level 3) | | Total |
Investments in TBA sale commitments | | $ | 0 | | | $ | (1,949,594 | ) | | $ | 0 | | | $ | (1,949,594 | ) |
| | |
| | | |
| 36 Wells Fargo Advantage VT Total Return Bond Fund | | Notes to Financial Statements |
The following is a reconciliation of assets in which significant unobservable inputs (Level 3) were used in determining fair value:
| | | | | | | | | | | | | | | | | |
| | | | | | | Collateralized | | Corporate | | |
| | | Agency | | Mortgage | | bonds and | | |
| | | Securities | | obligation | | notes | | Total |
Balance as of December 31, 2009 | | $ | 0 | | | $ | 0 | | | $ | 590,286 | | | $ | 590,286 | |
| Realized gains (losses) | | | (1,692 | ) | | | 0 | | | | 0 | | | | (1,692 | ) |
| Change in unrealized gains (losses) | | | 189 | | | | 5,453 | | | | 135,566 | | | | 141,208 | |
| Purchases | | | 789,434 | | | | 266,625 | | | | 0 | | | | 1,056,059 | |
| Sales | | | (184,048 | ) | | | 0 | | | | (172,793 | ) | | | (356,841 | ) |
| Transfers in of Level 3 | | | 0 | | | | 0 | | | | 0 | | | | 0 | |
| Transfers out of Level 3 | | | 0 | | | | 0 | | | | 0 | | | | 0 | |
Balance as of December 31, 2010 | | $ | 603,883 | | | $ | 272,078 | | | $ | 553,059 | | | $ | 1,429,020 | |
| | | | | | | | | | | | | | | | | |
Change in unrealized gains (losses) included in earnings relating to securities still held at December 31, 2010 | | $ | 189 | | | $ | 5,453 | | | $ | 45,288 | | | $ | 50,930 | |
4. TRANSACTIONS WITH AFFILIATES AND OTHER EXPENSES
Investment advisory fees
The Trust has entered into an investment advisory contract with Funds Management an indirect wholly owned subsidiary of Wells Fargo & Company (“Wells Fargo”). The investment adviser is responsible for implementing investment policies and guidelines and for supervising the investment sub-adviser, who is responsible for day-to-day portfolio management of the Fund.
Pursuant to the contract, Funds Management is paid an annual investment advisory fee starting at 0.40% declining to 0.30% as the average daily net assets of the Fund increase. Prior to July 19, 2010, the Fund paid an annual investment advisory fee which started at 0.40% and declined to 0.30% as the average daily net assets of the Fund increased. For the year ended December 31, 2010, the investment advisory fee was equivalent to an annual rate of 0.40% of the Fund’s average daily net assets.
Funds Management may retain the services of certain investment sub-advisers to provide daily portfolio management to the Fund. The fees related to investment sub-advisory services are borne directly by the investment adviser and do not increase the overall fees paid by the Fund to the investment adviser. Wells Capital Management Incorporated (“Wells Capital Management”), an affiliate of Funds Management, is the investment sub-adviser to the Fund and is paid a fee by the investment adviser at an annual rate starting at 0.20% and declining to 0.10% as the average daily net assets of the Fund increase.
Administration and transfer agent fees
The Trust has entered into an Administration Agreement with Funds Management. Under this Agreement, for providing administrative services, which includes paying fees and expenses for services provided by the transfer agent, sub-transfer agents, omnibus account servicers and record-keepers, Funds Management is entitled to receive the following annual fees:
| | | | | | | | | |
| | | | | | | Administration Fees |
| | | | | | | (% of Average |
| | | Average Daily Net Assets | | Daily Net Assets) |
| Fund level | | First $5 billion | | | 0.05 | % |
| | | Next $5 billion | | | 0.04 | |
| | | Over $10 billion | | | 0.03 | |
| | | | | | | | | |
| Class 2 | | All asset levels | | | 0.08 | |
Prior to July 19, 2010, Funds Management received from the Fund, for its existing class, an annual fee which started at 0.16% and declined to 0.14% as the average daily net assets of the Fund increased.
Funds Management has contractually waived and/or reimbursed investment advisory and administration fees to the extent necessary to maintain certain net operating expense ratios for the Fund.
| | |
| | | |
| Notes to Financial Statements | | Wells Fargo Advantage VT Total Return Bond Fund 37 |
Distribution fees
The Trust has adopted a Distribution Plan for Class 2 shares of the Fund pursuant to Rule 12b-1 under the 1940 Act. Distribution fees are charged to the Class 2 shares and paid to Wells Fargo Funds Distributor, LLC, the principal underwriter, at an annual rate of 0.25% of its average daily net assets.
5. INVESTMENT PORTFOLIO TRANSACTIONS
Purchases and sales of investments, exclusive of short-term securities (securities with maturities of one year or less at purchase date) for the year ended December 31, 2010, were as follows:
| | | | | | | |
| Purchases at Cost | | Sales Proceeds |
| U.S. Government | | Non-U.S. Government | | U.S. Government | | Non-U.S. Government |
| $671,297,184 | | $90,965,625 | | $678,657,816 | | $107,985,059 |
6. ACQUISITION
Effective at the close of business on July 16, 2010, the Fund acquired the net assets of Evergreen VA Core Bond Fund. The purpose of the transaction was to combine two funds with similar investment objectives and strategies. The Fund renamed its existing single class share as Class 2. The acquisition was accomplished by a tax-free exchange of all of the shares of Evergreen VA Core Bond Fund for 2,976,311 shares of the Fund valued at $31,182,320 at an exchange ratio of 0.83 for Class 2 shares. Shareholders holding Class 2 shares of Evergreen VA Core Bond Fund received Class 2 shares of the Fund in the reorganization. The investment portfolio of Evergreen VA Core Bond Fund with a fair value of $31,099,786, identified cost of $30,533,822 and unrealized gains of $565,964 at July 16, 2010 were the principal assets acquired by the Fund. The aggregate net assets of Evergreen VA Core Bond Fund and the Fund immediately prior to the acquisition were $31,182,320 and $58,161,686, respectively. The aggregate net assets of the Fund immediately after the acquisition were $89,344,006. For financial reporting purposes, assets received and shares issued by the Fund were recorded at fair value; however, the cost basis of the investments received from Evergreen VA Core Bond Fund was carried forward to align ongoing reporting of the Fund’s realized and unrealized gains and losses with amounts distributable to shareholders for tax purposes.
Assuming the acquisition had been completed January 1, 2010, the beginning of the annual reporting period for the Fund, the Fund’s pro forma results of operations for the year ended December 31, 2010 would have been:
| | | | | |
| Net investment income | | $ | 2,883,307 | |
| Net realized and unrealized gains (losses) on investments | | $ | 3,976,870 | |
| Net increase in net assets resulting from operations | | $ | 6,860,177 | |
Because the combined investment portfolios have been managed as a single integrated portfolio since the acquisition was completed, it is not practicable to separate the amounts of revenue and earnings of Evergreen VA Core Bond Fund that have been included in the Fund’s Statement of Operations since July 19, 2010.
7. BANK BORROWINGS
The Trust and Wells Fargo Funds Trust (excluding the money market funds) are parties to a $125,000,000 revolving credit agreement with State Street Bank and Trust Company, whereby the Fund is permitted to use bank borrowings for temporary or emergency purposes, such as to fund shareholder redemption requests. Interest under the credit agreement is charged to the Fund based on a borrowing rate equal to the higher of the Federal Funds rate in effect on that day plus 1.25% or the overnight LIBOR rate in effect on that day plus 1.25%. In addition, under the credit agreement, the Fund pays an annual commitment fee equal to 0.125% of the unused balance, which is allocated pro rata. Prior to September 7, 2010, the annual commitment fee paid by the Fund was 0.15% of the unused balance.
For the year ended December 31, 2010, there were no borrowings by the Fund under the agreement.
| | |
| | | |
| 38 Wells Fargo Advantage VT Total Return Bond Fund | | Notes to Financial Statements |
8. DISTRIBUTIONS TO SHAREHOLDERS
The tax character of distributions paid during the years ended December 31, 2010 and December 31, 2009 were as follows:
| | | | | | | | | |
| | | Year ended December 31, | |
| | | 2010 | | | 2009 | |
| Ordinary Income | | $ | 4,511,331 | | | $ | 4,528,721 | |
As of December 31, 2010, the components of distributable earnings on a tax basis were as follows:
| | | | | | | | | | | | | | | |
| Undistributed | | | Undistributed | | | | | | | |
| Ordinary | | | Long-Term | | | Unrealized | | | Capital Loss | |
| Income | | | Gain | | | Gains | | | Carryforward* | |
| $ | 2,667,810 | | | $ | 707,806 | | | $ | 469,240 | | | $ | (6,811,650 | ) |
| | |
| * | | This amount includes the post-October loss, which will reverse on the first day of the following fiscal year. |
9. INDEMNIFICATION
Under the Trust’s organizational documents, the officers and directors are indemnified against certain liabilities that may arise out of performance of their duties to the Trust. Additionally, in the normal course of business, the Trust may enter into contracts with service providers that contain a variety of indemnification clauses. The Trust’s maximum exposure under these arrangements is dependent on future claims that may be made against the Fund and, therefore, cannot be estimated.
| | |
| | | |
| Report of Independent Registered Public Accounting Firm | | Wells Fargo Advantage VT Total Return Bond Fund 39 |
BOARD OF TRUSTEES AND SHAREHOLDERS OF
WELLS FARGO VARIABLE TRUST:
We have audited the accompanying statement of assets and liabilities, including the portfolio of investments, of the Wells Fargo Advantage VT Total Return Bond Fund (the “Fund”), one of the funds constituting the Wells Fargo Variable Trust, as of December 31, 2010, and the related statement of operations for the year then ended, statements of changes in net assets for each of the years in the two year period then ended, and the financial highlights for each of the years in the five year period then ended. These financial statements and financial highlights are the responsibility of the Fund’s management. Our responsibility is to express an opinion on these financial statements and financial highlights based on our audits.
We conducted our audits in accordance with the standards of the Public Company Accounting Oversight Board (United States). Those standards require that we plan and perform the audit to obtain reasonable assurance about whether the financial statements and financial highlights are free of material misstatement. An audit includes examining, on a test basis, evidence supporting the amounts and disclosures in the financial statements. Our procedures included confirmation of securities owned as of December 31, 2010, by correspondence with custodian and brokers, or by other appropriate auditing procedures. An audit also includes assessing the accounting principles used and significant estimates made by management, as well as evaluating the overall financial statement presentation. We believe that our audits provide a reasonable basis for our opinion.
In our opinion, the financial statements and financial highlights referred to above present fairly, in all material respects, the financial position of the Wells Fargo Advantage VT Total Return Bond Fund as of December 31, 2010, the results of its operations for the year then ended, changes in its net assets for each of the years in the two year period then ended, and the financial highlights for each of the years in the five year period then ended, in conformity with U.S. generally accepted accounting principles.
Boston, Massachusetts
February 25, 2011
| | |
| 40 Wells Fargo Advantage VT Total Return Bond Fund | | Other Information (Unaudited) |
PROXY VOTING INFORMATION
A description of the policies and procedures that the Fund uses to determine how to vote proxies relating to portfolio securities is available without charge, upon request, by calling 1-800-222-8222, visiting our Web site at wellsfargo.com/advantagefunds, or visiting the SEC Web site at www.sec.gov. Information regarding how the Fund voted proxies relating to portfolio securities during the most recent 12-month period ended June 30 is available without charge on the Fund’s Web site at wellsfargo.com/advantagefunds or by visiting the SEC Web site at www.sec.gov.
| | |
| Other Information (Unaudited) | | Wells Fargo Advantage VT Total Return Bond Fund 41 |
PORTFOLIO HOLDINGS INFORMATION
The complete portfolio holdings for the Fund are publicly available on the Fund’s Web site (www.wellsfargo.com/advantagefunds) on a monthly, 30-day or more delayed basis. In addition, top ten holdings information for the Fund is publicly available on the Fund’s Web site on a monthly, seven-day or more delayed basis. The Fund files its complete schedule of portfolio holdings with the SEC for the first and third quarters of each fiscal year on Form N-Q, which is available without charge by visiting the SEC Web site at www.sec.gov. In addition, the Fund’s Form N-Q may be reviewed and copied at the SEC’s Public Reference Room in Washington, DC, and at regional offices in New York City, at 233 Broadway, and in Chicago, at 175 West Jackson Boulevard, Suite 900. Information about the Public Reference Room may be obtained by calling 1-800-SEC-0330.
BOARD OF TRUSTEES
The following table provides basic information about the Board of Trustees (the “Trustees”) of the Wells Fargo Variable Trust (the “Trust”) and Officers of the Trust. This table should be read in conjunction with the Prospectus and the Statement of Additional Information1 of the Fund. Each of the Trustees and Officers listed below acts in identical capacities for the Wells Fargo Advantage family of funds, which consists of 152 funds comprising the Trust, Wells Fargo Funds Trust, Wells Fargo Master Trust and four closed-end funds (collectively the “Fund Complex”). All of the Trustees are also Members of the Audit and Governance Committees of each Trust in the Fund Complex. The mailing address of each Trustee and Officer is 525 Market Street, 12th Floor, San Francisco, CA 94105. Each Trustee and Officer serves an indefinite term, however, each Trustee serves such term until reaching the mandatory retirement age established by the Trustees.
Independent Trustees
| | | | | | | |
| Name and | | Position Held and | | | | |
| Year of Birth | | Length of Service | | Principal Occupations During Past Five Years | | Other Directorships |
Peter G. Gordon
(Born 1942) | | Trustee, since 1998;
Chairman, since 2005
(Lead Trustee since 2001) | | Co-Founder, Chairman, President and CEO of Crystal Geyser. Water Company. Trustee Emeritus, Colby College. | | Asset Allocation
Trust |
| | | | | | | |
| | | | | | | |
Isaiah Harris, Jr.
(Born 1952) | | Trustee, since 2009 | | Retired. Prior thereto, President and CEO of BellSouth Advertising and Publishing Corp. from 2005 to 2007, President and CEO of BellSouth Enterprises from 2004 to 2005 and President of BellSouth Consumer Services from 2000 to 2003. Emeritus member of the Iowa State University Foundation Board of Governors. Emeritus Member of the Advisory Board of Iowa State University School of Business. Mr. Harris is a certified public accountant. | | CIGNA Corporation;
Deluxe Corporation;
Asset Allocation
Trust |
| | | | | | | |
Judith M. Johnson
(Born 1949) | | Trustee, since 2008 | | Retired. Prior thereto, Chief Executive Officer and Chief Investment Officer of Minneapolis Employees Retirement Fund from 1996 to 2008. Ms. Johnson is an attorney, certified public accountant and a certified managerial accountant. | | Asset Allocation
Trust |
| | | | | | | |
Leroy Keith, Jr.
(Born 1939) | | Trustee, since 2010 | | Chairman, Bloc Global Services (development and construction), Trustee of the Evergreen Funds from 1983 to 2010. Former Managing Director, Almanac Capital Management (commodities firm), former Partner, Stonington Partners, Inc. (private equity fund), former Director, Obagi Medical Products Co. and former Director, Lincoln Educational Services. | | Trustee, Virtus Fund Complex (consisting of 45 portfolios as of 12/31/10); Director, Diversapack Co. (packaging company); Asset Allocation Trust |
| | | | | | | |
David F. Larcker
(Born 1951) | | Trustee, since 2009 | | James Irvin Miller Professor of Accounting at the Graduate School of Business, Stanford University, Director of Corporate Governance Research Program and Co-Director of The Rock Center for Corporate Governance since 2006. From 2005 to 2008, Professor of Accounting at the Graduate School of Business, Stanford University. Prior thereto, Ernst & Young Professor of Accounting at The Wharton School, University of Pennsylvania from 1985 to 2005. | | Asset Allocation Trust |
| | |
| 42 Wells Fargo Advantage VT Total Return Bond Fund | | Other Information (Unaudited) |
| | | | | | | |
| Name and | | Position Held and | | | | |
| Year of Birth | | Length of Service | | Principal Occupations During Past Five Years | | Other Directorships |
Olivia S. Mitchell
(Born 1953) | | Trustee, since 2006 | | International Foundation of Employee Benefit Plans Professor and Chair of the Department of Insurance and Risk Management, Wharton School of the University of Pennsylvania since 1993. Director of Wharton’s Pension Research Council and Boettner Center on Pensions & Retirement Research, and Research Associate at the National Bureau of Economic Research. Previously, Cornell University Professor from 1978 to 1993. | | Asset Allocation
Trust |
| | | | | | | |
Timothy J. Penny
(Born 1951) | | Trustee, since 1996 | | President and CEO of Southern Minnesota Initiative Foundation, a non-profit organization, since 2007 and Senior Fellow at the Humphrey Institute Policy Forum at the University of Minnesota since 1995. Member of the Board of Trustees of NorthStar Education Finance, Inc., a non-profit organization, since 2007. | | Asset Allocation
Trust |
| | | | | | | |
Michael S. Scofield
(Born 1943) | | Trustee, since 2010 | | Currently serves on the Investment Company Institute’s Board of Governors and Executive Committee as well the Independent Director’s Counsel Board of Governors and Executive Committee. Former Chairman of the Independent Directors Counsel. Trustee of the Evergreen Funds from 1984 to 2010. Retired Attorney, Law Offices of Michael S. Scofield and former Director and Chairman, Branded Media Corporation (multi-media branding company). | | Asset Allocation
Trust |
| | | | | | | |
Donald C. Willeke
(Born 1940) | | Trustee, since 1996 | | Principal of the law firm of Willeke & Daniels. General Counsel of the Minneapolis Employees Retirement Fund from 1984 until its consolidation into the Minnesota Public Employees Retirement Association on June 30, 2010. | | Asset Allocation
Trust |
Officers
| | | | | |
| Name and | | Position Held and | | |
| Year of Birth | | Length of Service | | Principal Occupations During Past Five Years |
Karla M. Rabusch
(Born 1959) | | President, since 2003 | | Executive Vice President of Wells Fargo Bank, N.A. and President of Wells Fargo Funds Management, LLC since 2003. Senior Vice President and Chief Administrative Officer of Wells Fargo Funds Management, LLC from 2001 to 2003. |
| | | | | |
C. David Messman
(Born 1960) | | Secretary, since 2000; Chief Legal Counsel,
since 2003 | | Senior Vice President and Secretary of Wells Fargo Funds Management, LLC since 2001. Vice President and Managing Counsel of Wells Fargo Bank, N.A. since 1996. |
| | | | | |
Kasey Phillips
(Born 1970) | | Treasurer, since 2009 | | Senior Vice President of Wells Fargo Funds Management, LLC since 2009. Senior Vice President of Evergreen Investment Management Company, LLC from 2006 to 2010. Treasurer of the Evergreen Funds from 2005 to 2010. Vice President and Assistant Vice President of Evergreen Investment Services, Inc. from 1999 to 2006. |
| | | | | |
David Berardi
(Born 1975) | | Assistant Treasurer,
since 2009 | | Vice President of Wells Fargo Funds Management, LLC since 2009. Vice President of Evergreen Investment Management Company, LLC from 2008 to 2010. Assistant Vice President of Evergreen Investment Services, Inc. from 2004 to 2008. Manager of Fund Reporting and Control for Evergreen Investment Management Company, LLC from 2004 to 2010. |
| | | | | |
Jeremy DePalma
(Born 1974) | | Assistant Treasurer,
since 2009 | | Senior Vice President of Wells Fargo Funds Management, LLC since 2009. Senior Vice President of Evergreen Investment Management Company, LLC from 2008 to 2010. Vice President, Evergreen Investment Services, Inc. from 2004 to 2007. Assistant Vice President, Evergreen Investment Services, Inc. from 2000 to 2004 and the head of the Fund Reporting and Control Team within Fund Administration from 2005 to 2010. |
| | |
| Other Information (Unaudited) | | Wells Fargo Advantage VT Total Return Bond Fund 43 |
| | | | | |
| Name and | | Position Held and | | |
| Year of Birth | | Length of Service | | Principal Occupations During Past Five Years |
Debra Ann Early
(Born 1964) | | Chief Compliance Officer,
since 2007 | | Chief Compliance Officer of Wells Fargo Funds Management, LLC since 2007. Chief Compliance Officer of Parnassus Investments from 2005 to 2007. Chief Financial Officer of Parnassus Investments from 2004 to 2007 and Senior Audit Manager of PricewaterhouseCoopers LLP from 1998 to 2004. |
| | |
| 1. | | The Statement of Additional Information includes additional information about the Fund’s Trustees and is available, without charge, upon request, by calling 1-800-222-8222 or by visiting the Fund’s Web site at www.wellsfargo.com/advantagefunds. |
| | |
| 44 Wells Fargo Advantage VT Total Return Bond Fund | | List of Abbreviations |
The following is a list of common abbreviations for terms and entities which may have appeared in this report.
| | | |
|
| ABAG | | — Association of Bay Area Governments |
| ADR | | — American Depositary Receipt |
| ADS | | — American Depository Shares |
| AMBAC | | — American Municipal Bond Assurance Corporation |
| AMT | | — Alternative Minimum Tax |
| ARM | | — Adjustable Rate Mortgages |
| AUD | | — Australian Dollar |
| BART | | — Bay Area Rapid Transit |
| BRL | | — Brazil Real |
| CAD | | — Canadian Dollar |
| CDA | | — Community Development Authority |
| CDO | | — Collateralized Debt Obligation |
| CDSC | | — Contingent Deferred Sales Charge |
| CGIC | | — Capital Guaranty Insurance Company |
| CGY | | — Capital Guaranty Corporation |
| CHF | | — Swiss Franc |
| CIFG | | — CDC (Caisse des Dépôts et Consignations) IXIS Financial Guarantee |
| COP | | — Certificate of Participation |
| CP | | — Commercial Paper |
| CTF | | — Common Trust Fund |
| DEM | | — Deutsche Mark |
| DKK | | — Danish Krone |
| DW&P | | — Department of Water & Power |
| DWR | | — Department of Water Resources |
| ECFA | | — Educational & Cultural Facilities Authority |
| EDFA | | — Economic Development Finance Authority |
| ETET | | — Eagle Tax-Exempt Trust |
| ETF | | — Exchange-Traded Fund |
| EUR | | — Euro |
| FFCB | | — Federal Farm Credit Bank |
| FGIC | | — Financial Guaranty Insurance Corporation |
| FHA | | — Federal Housing Authority |
| FHAG | | — Federal Housing Agency |
| FHLB | | — Federal Home Loan Bank |
| FHLMC | | — Federal Home Loan Mortgage Corporation |
| FNMA | | — Federal National Mortgage Association |
| FRF | | — French Franc |
| FSA | | — Farm Service Agency |
| GBP | | — Great British Pound |
| GDR | | — Global Depositary Receipt |
| GNMA | | — Government National Mortgage Association |
| GO | | — General Obligation |
| HCFR | | — Healthcare Facilities Revenue |
| HEFA | | — Health & Educational Facilities Authority |
| HEFAR | | — Higher Education Facilities Authority Revenue |
| HFA | | — Housing Finance Authority |
| HFFA | | — Health Facilities Financing Authority |
| HKD | | — Hong Kong Dollar |
| HUD | | — Housing & Urban Development |
| HUF | | — Hungarian Forint |
| IDA | | — Industrial Development Authority |
| IDAG | | — Industrial Development Agency |
| IDR | | — Industrial Development Revenue |
| IEP | | — Irish Pound |
| JPY | | — Japanese Yen |
| KRW | | — Republic of Korea Won |
| LIBOR | | — London Interbank Offered Rate |
| LLC | | — Limited Liability Company |
| LLP | | — Limited Liability Partnership |
| LOC | | — Letter of Credit |
| LP | | — Limited Partnership |
| MBIA | | — Municipal Bond Insurance Association |
| MFHR | | — Multi-Family Housing Revenue |
| MFMR | | — Multi-Family Mortgage Revenue |
| MMD | | — Municipal Market Data |
| MTN | | — Medium Term Note |
| MUD | | — Municipal Utility District |
| MXN | | — Mexican Peso |
| MYR | | — Malaysian Ringgit |
| NATL-RE | | — National Public Finance Guarantee Corporation |
| NLG | | — Netherlands Guilder |
| NOK | | — Norwegian Krone |
| NZD | | — New Zealand Dollar |
| PCFA | | — Pollution Control Finance Authority |
| PCR | | — Pollution Control Revenue |
| PFA | | — Public Finance Authority |
| PFFA | | — Public Facilities Financing Authority |
| plc | | — Public Limited Company |
| PLN | | — Polish Zloty |
| PSFG | | — Public School Fund Guaranty |
| R&D | | — Research & Development |
| RDA | | — Redevelopment Authority |
| RDFA | | — Redevelopment Finance Authority |
| REITS | | — Real Estate Investment Trusts |
| SEK | | — Swedish Krona |
| SFHR | | — Single Family Housing Revenue |
| SFMR | | — Single Family Mortgage Revenue |
| SGD | | — Singapore Dollar |
| SKK | | — Slovakian Koruna |
| SLMA | | — Student Loan Marketing Association |
| SPDR | | — Standard & Poor’s Depositary Receipts |
| STIT | | — Short-Term Investment Trust |
| TBA | | — To Be Announced |
| TRAN | | — Tax Revenue Anticipation Notes |
| TRY | | — Turkish Lira |
| USD | | — United States Dollar |
| XLCA | | — XL Capital Assurance |
| ZAR | | — South African Rand |
This page is intentionally left blank.
This page is intentionally left blank.
More information about Wells Fargo Advantage Funds is available free upon request. To obtain literature, please write, e-mail, visit the Funds’ Web site, or call:
Wells Fargo Advantage Funds
P.O. Box 8266
Boston, MA 02266-8266
E-mail: wfaf@wellsfargo.com
Web site: www.wellsfargo.com/advantagefunds
Individual Investors: 1-800-222-8222
Retail Investment Professionals: 1-888-877-9275
Institutional Investment Professionals: 1- 866-765-0778
This report and the financial statements contained herein are submitted for the general information of the shareholders of Wells Fargo Advantage Funds. If this report is used for promotional purposes, distribution of the report must be accompanied or preceded by a current prospectus. For a prospectus containing more complete information, including charges and expenses, call 1-800-222-8222 or visit the Fund’s Web site at www.wellsfargo.com/advantagefunds. Please consider the investment objectives, risks, charges, and expenses of the investment carefully before investing. This and other information about Wells Fargo Advantage Funds can be found in the current prospectus. Read the prospectus carefully before you invest or send money.
Wells Fargo Funds Management, LLC, a wholly owned subsidiary of Wells Fargo & Company, provides investment advisory and administrative services for Wells Fargo Advantage Funds. Other affiliates of Wells Fargo & Company provide subadvisory and other services for the Funds. The Funds are distributed by Wells Fargo Funds Distributor, LLC, Member FINRA/SIPC, an affiliate of Wells Fargo & Company.
NOT FDIC INSURED ▪ NO BANK GUARANTEE ▪ MAY LOSE VALUE
| | | | | |
|
| © 2011 Wells Fargo Funds Management, LLC. All rights reserved. | | www.wellsfargo.com/advantagefunds | | 200921 02-11
AVT9/AR155 12-10 |
ITEM 2. CODE OF ETHICS
As of the end of the period, December 31, 2010, Wells Fargo Variable Trust has adopted a code of ethics, as defined in Item 2 of Form N-CSR, that applies to its President and Treasurer. A copy of the code of ethics is filed as an exhibit to this Form N-CSR.
ITEM 3. AUDIT COMMITTEE FINANCIAL EXPERT
The Board of Trustees of Wells Fargo Variable Trust has determined that Judith Johnson is an audit committee financial expert, as defined in Item 3 of Form N-CSR. Mrs. Johnson is independent for purposes of Item 3 of Form N-CSR.
ITEM 4. PRINCIPAL ACCOUNTANT FEES AND SERVICES
(a)
Audit Fees — Provided below are the aggregate fees billed for the fiscal years ended December 31, 2009 and December 31, 2010 for professional services rendered by the principal accountant for the audit of the Registrant’s annual financial statements or services that are normally provided by the accountant in connection with statutory and regulatory filings or engagements.
For the fiscal years ended December 31, 2009 and December 31, 2010, the Audit Fees were $261,090 and $284,730, respectively.
(b)
Audit-Related Fees — There were no audit-related fees incurred for the fiscal years ended December 31, 2009 and December 31, 2010 for assurance and related services by the principal accountant for the Registrant.
(c)
Tax Fees — Provided below are the aggregate fees billed for the fiscal years ended December 31, 2009 and December 31, 2010 for professional services rendered by the principal accountant for the Registrant for tax compliance, tax advice, and tax planning.
For the fiscal years ended December 31, 2009 and December 31, 2010, the Tax Fees were $23,640 and $21,020, respectively. The incurred Tax Fees are comprised of tax preparation and consulting services.
(d)
All Other Fees — There were no other fees incurred for the fiscal years ended December 31, 2009 and December 31, 2010.
(e)(1)
The Chairman of the Audit Committees is authorized to pre-approve: (1) audit services to the mutual funds of Wells Fargo Variable Trust; (2) non-audit tax or compliance consulting or training services provided to the Funds by the independent auditors (“Auditors”) if the fees for any particular engagement are not anticipated to exceed $50,000; and (3) non-audit tax or compliance consulting or training services provided by the Auditors to a Fund’s investment adviser and its controlling entities (where pre-approval is required because the engagement relates directly to the operations and financial reporting of the Fund) if the fee to the Auditors for any particular engagement is not anticipated to exceed $50,000. For any such pre-approval sought from the Chairman, Management shall prepare a brief description of the proposed services. If the Chairman approves of such service, he or she shall sign the statement prepared by Management. Such written statement shall be presented to the full Committees at their next regularly scheduled meetings.
(e)(2)
Not Applicable.
(f)
Not Applicable.
(g)
Provided below are the aggregate non-audit fees billed for the fiscal years ended December 31, 2009 and December 31, 2010, by the principal accountant for services rendered to the Registrant, and rendered to the Registrant’s investment adviser, and any entity controlling, controlled by, or under common control with the adviser that provides ongoing services to the Registrant.
For the fiscal year ended December 31, 2009, the Registrant incurred non-audit fees in the amount of $70,000. The non-audit fees consist of SAS70 control reviews of Wells Fargo Bank, N.A.
For the fiscal year ended December 31, 2009, the Registrant’s investment adviser incurred non-audit fees in the amount of $45,000. The non-audit fees relates to examination of securities pursuant to rule 206 (4)-2 under the Investment Advisors Act of 1940.
(h)
The Registrant’s audit committee of the board of directors has determined that non-audit services rendered to the registrant’s investment adviser, that were not pre-approved pursuant to paragraph (c)(7)(ii) of Rule 2-01 of the Regulation S-X, does not compromise the independence of the principal accountant.
ITEM 5. AUDIT COMMITTEE OF LISTED REGISTRANTS
Not applicable.
ITEMS 6. SCHEDULE OF INVESTMENTS
The Schedule of Investments is included as part of the report to shareholders filed under Item 1 of this Form.
| | |
| ITEM 7. | | DISCLOSURE OF PROXY VOTING POLICIES AND PROCEDURES FOR CLOSED-END MANAGEMENT INVESTMENT COMPANIES |
Not applicable.
ITEM 8. PORTFOLIO MANAGERS OF CLOSED-END MANAGEMENT INVESTMENT COMPANIES
Not applicable.
| | |
| ITEM 9. | | PURCHASES OF EQUITY SECURITIES BY CLOSED-END MANAGEMENT INVESTMENT COMPANY AND AFFILIATED PURCHASES |
Not applicable.
ITEM 10. SUBMISSION OF MATTERS TO A VOTE OF SECURITY HOLDERS
The Governance Committee (the “Committee”) of the Board of Trustees of the registrant (the “Trust”) has adopted procedures by which a shareholder of any series of the Trust may submit properly a nominee recommendation for the Committee’s consideration.
The shareholder must submit any such recommendation (a “Shareholder Recommendation”) in writing to the Trust, to the attention of the Trust’s Secretary, at the address of the principal executive offices of the Trust.
The Shareholder Recommendation must be delivered to, or mailed and received at, the principal executive offices of the Trust not less than forty-five (45) calendar days nor more than seventy-five (75) calendar days prior to the date of the Committee meeting at which the nominee would be considered.
The Shareholder Recommendation must include: (i) a statement in writing setting forth (A) the name, age, date of birth, business address, residence address and nationality of the person recommended by the shareholder (the “candidate”); (B) the series (and, if applicable, class) and number of all shares of the Trust owned of record or beneficially by the candidate, as reported to such shareholder by the candidate; (C) any other information regarding the candidate called for with respect to director nominees by paragraphs (a), (d), (e) and (f) of Item 401 of Regulation S-K or paragraph (b) of Item 22 of Rule 14a-101 (Schedule 14A) under the Securities Exchange Act of 1934, as amended (the “Exchange Act”), adopted by the Securities and Exchange Commission (or the corresponding provisions of any regulation or rule subsequently adopted by the Securities and Exchange Commission or any successor agency applicable to the Trust); (D) any other information regarding the candidate that would be required to be disclosed if the candidate were a nominee in a proxy statement or other filing required to be made in
connection with solicitation of proxies for election of directors pursuant to Section 14 of the Exchange Act and the rules and regulations promulgated thereunder; and (E) whether the recommending shareholder believes that the candidate is or will be an “interested person” of the Trust (as defined in the Investment Company Act of 1940, as amended) and, if not an “interested person,” information regarding the candidate that will be sufficient for the Trust to make such determination; (ii) the written and signed consent of the candidate to be named as a nominee and to serve as a Trustee if elected; (iii) the recommending shareholder’s name as it appears on the Trust’s books; (iv) the series (and, if applicable, class) and number of all shares of the Trust owned beneficially and of record by the recommending shareholder; and (v) a description of all arrangements or understandings between the recommending shareholder and the candidate and any other person or persons (including their names) pursuant to which the recommendation is being made by the recommending shareholder. In addition, the Committee may require the candidate to interview in person and furnish such other information as it may reasonably require or deem necessary to determine the eligibility of such candidate to serve as a Trustee of the Trust.
ITEM 11. CONTROLS AND PROCEDURES
(a) The President and Treasurer have concluded that the Wells Fargo Variable Trust (the “Trust”) disclosure controls and procedures (as defined in Rule 30a-3(c) under the Investment Company Act of 1940) provide reasonable assurances that material information relating to the Trust is made known to them by the appropriate persons based on their evaluation of these controls and procedures as of a date within 90 days of the filing of this report.
(b) There were no significant changes in the Trust’s internal controls over financial reporting (as defined in Rule 30a-3(d) under the Investment Company Act of 1940) that occurred during the second quarter of the period covered by this report that materially affected, or is reasonably likely to materially affect, the registrant’s internal control over financial reporting.
ITEM 12. EXHIBITS
(a)(1) Code of Ethics pursuant to Item 2 of Form N-CSR is filed and attached hereto as Exhibit 10a.
(a)(2) Certification pursuant to Rule 30a-2(a) under the Investment Company Act of 1940 (17 CFR 270.30a-2(a)) is filed and attached hereto as Exhibit 99.CERT.
(a)(3) Not applicable.
(b) Certification pursuant to Rule 30a-2(b) under the Investment Company Act of 1940 (17 CFR 270.30a-2(b)) is filed and attached hereto as Exhibit 99.906CERT.
SIGNATURES
Pursuant to the requirements of the Securities Exchange Act of 1934 and the Investment Company Act of 1940, the registrant has duly caused this report to be signed on its behalf by the undersigned, thereunto duly authorized.
| | | | | |
| | Wells Fargo Variable Trust
| |
| | By: | /s/ Karla M. Rabusch | |
| | | Karla M. Rabusch | |
| | | President | |
| |
| | Date: February 25, 2011 | |
| |
Pursuant to the requirements of the Securities Exchange Act of 1934 and the Investment Company Act of 1940, this report has been signed below by the following persons on behalf of the registrant and in the capacities and on the date indicated.
| | | | | |
| | | |
| | By: | /s/ Karla M. Rabusch | |
| | | Karla M. Rabusch | |
| | | President | |
| |
| | Date: February 25, 2011 | |
| |
| | | |
| | By: | /s/ Kasey L. Phillips | |
| | | Kasey L. Phillips | |
| | | Treasurer | |
| |
| | | Date: February 25, 2011 | |