Table of Contents

UNITED STATES
SECURITIES AND EXCHANGE COMMISSION
Washington, D.C. 20549
FORM N-CSR
CERTIFIED SHAREHOLDER REPORT OF REGISTERED
MANAGEMENT INVESTMENT COMPANIES
Investment Company Act file number: 811-09255
Wells Fargo Variable Trust
(Exact name of registrant as specified in charter)
525 Market St., San Francisco, CA 94105
(Address of principal executive offices) (Zip code)
C. David Messman
Wells Fargo Funds Management, LLC
525 Market St., San Francisco, CA 94105
(Name and address of agent for service)
Registrant’s telephone number, including area code: 800-222-8222
Date of fiscal year end: Registrant is making a filing for 9 of its series, Wells Fargo Advantage VT Discovery Fund, Wells Fargo Advantage VT Index Asset Allocation Fund, Wells Fargo Advantage VT International Equity Fund, Wells Fargo Advantage VT Intrinsic Value Fund, Wells Fargo Advantage VT Omega Growth Fund, Wells Fargo Advantage VT Opportunity Fund, Wells Fargo Advantage VT Small Cap Growth Fund, Wells Fargo Advantage VT Small Cap Value Fund, and Wells Fargo Advantage VT Total Return Bond Fund. Each series has a December 31 fiscal year end.
Date of reporting period: December 31, 2013
Table of Contents
ITEM 1. REPORT TO STOCKHOLDERS
Table of Contents

Wells Fargo Advantage VT Discovery FundSM

Annual Report
December 31, 2013

Table of Contents
Reduce clutter. Save trees.
Sign up for electronic delivery of prospectuses and shareholder reports at wellsfargo.com/advantagedelivery
| 2 | ||||
| 4 | ||||
| 8 | ||||
| 9 | ||||
Financial statements | ||||
| 14 | ||||
| 15 | ||||
| 16 | ||||
| 17 | ||||
| 18 | ||||
| 22 | ||||
| 23 | ||||
| 26 | ||||
The views expressed and any forward-looking statements are as of December 31, 2013, unless otherwise noted, and are those of the Fund managers and/or Wells Fargo Funds Management, LLC. Discussions of individual securities, or the markets generally, or any Wells Fargo Advantage Fund are not intended as individual recommendations. Future events or results may vary significantly from those expressed in any forward-looking statements; the views expressed are subject to change at any time in response to changing circumstances in the market. Wells Fargo Funds Management, LLC and the Fund disclaim any obligation to publicly update or revise any views expressed or forward-looking statements.
NOT FDIC INSURED ¡ NO BANK GUARANTEE ¡ MAY LOSE VALUE
Table of Contents
| 2 | Wells Fargo Advantage VT Discovery Fund | Letter to shareholders (unaudited) |

Karla M. Rabusch
President
Wells Fargo Advantage Funds
Major central banks continued to inject liquidity into the banks and the markets through various quantitative easing policies.
Dear Valued Shareholder:
We are pleased to offer you this annual report for the Wells Fargo Advantage VT Discovery Fund for the 12-month period that ended December 31, 2013. Much of the period was marked by monetary easing by global central banks. During the period, investor concerns that the U.S. Federal Reserve (Fed) would end its bond-buying program initially led to higher interest rates, resulting in losses for bond indexes and volatility for global stock indexes. These fears dissipated in late September 2013 and ended altogether in mid-December 2013 when the Fed announced a tapering timeline that was far more moderate than some had feared. Growing confidence that the U.S. economy was staging a fragile recovery resulted in double-digit returns for domestic stock market indexes for the 12-month reporting period.
Central banks continued to provide stimulus.
Major central banks continued to inject liquidity into the banks and the markets through various quantitative easing policies. Throughout the reporting period, the Federal Open Market Committee (FOMC)—the Fed’s monetary policymaking body—kept its key interest rate near zero in order to support the economy and the financial system. Entering the reporting period, the FOMC had committed to purchase $40 billion per month in mortgage-backed securities to support the housing market and $45 billion per month in long-term U.S. Treasuries to keep interest rates low. Because the markets benefited from the FOMC’s liquidity, the prices of both stocks and bonds initially fell after the FOMC indicated in May 2013 that it might reduce (or taper) its bond-buying program. In mid-December 2013, the FOMC announced that it would reduce its bond-buying program by $10 billion per month beginning in January 2014. The tapering was less aggressive than some investors had feared, and the markets ended 2013 strongly.
European markets continued to benefit from the European Central Bank’s (ECB’s) September 2012 announcement that it would purchase an unlimited amount of one- to three-year sovereign debt from countries that had formally applied for a bailout. As a result, when the tiny eurozone nation of Cyprus was forced to implement capital controls and impose losses on uninsured bank depositors in March 2013, global stock markets remained resilient despite short-term volatility. In May 2013, the ECB cut its key rate to a then-historic low of 0.5%. The ECB’s aggressive actions helped ease investor worries about a eurozone sovereign debt default. Given the substantial ties between the U.S. and Europe, the improved sentiment about the eurozone helped provide a tailwind for U.S. markets.
U.S. stock markets gained on relatively good news.
For most of the period, U.S. economic data remained moderately positive, gaining strength as the period progressed. Reported gross domestic product growth came in at a solid 1.1% annualized rate in the first quarter of 2013, a 2.5% annualized rate in the second quarter, a 4.1% annualized rate in the third quarter, and a 3.2% annualized rate (an advance estimate as of January 31, 2014) in the fourth quarter.
The most significant negative effect was the ongoing fight in Washington, D.C., over the federal budget and debt limit. The Budget Control Act of 2011, which was passed to resolve a previous fight over the federal debt ceiling, mandated budget sequestration that took effect on March 1, 2013, and was an overhang on economic growth throughout the remainder of the reporting period. Most recently, Congress was unable to pass a resolution to continue to fund the federal government, and thus, the federal government underwent a partial shutdown from September 30, 2013, through October 16, 2013.The government reopened after the president and Congress reached a deal that funded the government through January 15, 2014, and raised the debt limit through February 7, 2014. In
Table of Contents
| Letter to shareholders (unaudited) | Wells Fargo Advantage VT Discovery Fund | 3 |
December 2013, Congress passed the Ryan-Murray budget agreement, which funded the government through fiscal 2015, lessening the near-term prospect of another shutdown.
Despite political headwinds, the relatively positive outlook for the U.S. economy contributed to a strong domestic stock market for most of the reporting period. Economically sensitive sectors, such as industrials and consumer discretionary, outperformed. Dividend-paying stocks led the market earlier in 2013 as investors sought yield in a historically low-yielding environment, but rising interest rates later in the period dampened their relative performance. Judging by various Russell indexes, small-cap stocks outperformed large-cap stocks, and growth stocks outperformed value stocks.
Don’t let short-term uncertainty derail long-term investment goals.
While periods of uncertainty can present challenges, they can also create opportunities, and experience has taught us that maintaining long-term investment goals can be an effective way to plan for the future. Although diversification cannot guarantee an investment profit or prevent losses, we believe it can be an effective way to manage investment risk and potentially smooth out overall portfolio performance. We encourage investors to know their investments and to understand that appropriate levels of risk-taking may unlock opportunities.
Thank you for choosing to invest with Wells Fargo Advantage Funds. We appreciate your confidence in us and remain committed to helping you meet your financial needs. For current information about your fund investments, contact your investment professional, visit our website at wellsfargoadvantagefunds.com, or call us directly at 1-800-222-8222. We are available 24 hours a day, 7 days a week.
Sincerely,

Karla M. Rabusch
President
Wells Fargo Advantage Funds
Despite political headwinds, the relatively positive outlook for the U.S. economy contributed to a strong domestic stock market for most of the reporting period.
Notice to shareholders
The Fund and Funds Management, LLC (“Funds Management”) have received an exemptive order from the SEC that permits Funds Management, subject to the approval of the Board of Trustees of the Fund, to select or replace certain subadvisers to manage all or a portion of the Fund’s assets and enter into, amend or terminate a sub-advisory agreement with certain subadvisers without obtaining shareholder approval (“Multi-manager Structure”). The Multi-manager Structure applies to subadvisers that are not affiliated with Funds Management or the Fund, except to the extent that affiliation arises solely because such subadvisers provide sub-advisory services to the Fund (“Non-affiliated Subadvisers”), as well as subadvisers that are indirect or direct wholly-owned subsidiaries of Funds Management or of another company that, indirectly or directly, wholly owns Funds Management (“Wholly-owned Subadvisers”).
Pursuant to the SEC order, Funds Management, with the approval of the Board of Trustees, has the discretion to terminate any subadvisers and allocate and reallocate the Fund’s assets among any other Non-affiliated Subadvisers or Wholly-owned Subadvisers. Funds Management, subject to oversight and supervision by the Board of Trustees, has responsibility to continue to oversee any subadvisers to the Fund and to recommend, for approval by the Board of Trustees, the hiring, termination and replacement of subadvisers for the Fund. In the event that a new subadviser is hired pursuant to the Multi-manager Structure, the Fund is required to provide notice to shareholders within 90 days.
Please contact your investment professional or call us directly at 1-800-222-8222 if you have any questions on this Notice to Shareholders.
Table of Contents
| 4 | Wells Fargo Advantage VT Discovery Fund | Performance highlights (unaudited) |
Investment objective
The Fund seeks long-term capital appreciation.
Adviser
Wells Fargo Funds Management, LLC
Subadviser
Wells Capital Management Incorporated
Portfolio managers
Thomas J. Pence, CFA
Michael T. Smith, CFA
Chris Warner, CFA
Average annual total returns (%) as of December 31, 2013
| Expense ratios1 (%) | ||||||||||||||||||||||||
| Inception date | 1 year | 5 year | 10 year | Gross | Net2 | |||||||||||||||||||
| Class 2 | 5-8-1992 | 43.80 | 26.45 | 12.20 | 1.21 | 1.15 | ||||||||||||||||||
| Russell 2500TM Growth Index3 | – | 40.65 | 24.03 | 10.11 | – | – | ||||||||||||||||||
Figures quoted represent past performance, which is no guarantee of future results and do not reflect the deduction of taxes that a shareholder may pay on fund distributions or the redemption of fund shares. Investment return and principal value of an investment will fluctuate so that an investor’s shares, when redeemed, may be worth more or less than their original cost. Current performance may be lower or higher than the performance data quoted, which assumes the reinvestment of dividends and capital gains. Current month-end performance is available by calling 1-800-222-8222. Performance figures of the Fund do not reflect fees charged pursuant to the terms of variable life insurance policies and variable annuity contracts. If fees had been reflected, performance would have been lower.
Index returns do not include transaction costs associated with buying and selling securities, any mutual fund fees or expenses, or any taxes. It is not possible to invest directly in an index.
Please keep in mind that high double-digit returns were primarily achieved during favorable market conditions. You should not expect that such favorable returns can be consistently achieved. A Fund’s performance, especially for very short time periods, should not be the sole factor in making your investment decision.
Stock values fluctuate in response to the activities of individual companies and general market and economic conditions. Smaller-company stocks tend to be more volatile and less liquid than those of larger companies. Certain investment strategies tend to increase the total risk of an investment (relative to the broader market). The Fund is exposed to foreign investment risk. Consult the Fund’s prospectus for additional information on these and other risks.
Please refer to the prospectus provided by your participating insurance company for detailed information describing the separate accounts for information regarding surrender charges, mortality and expense risk fees, and other charges that may be assessed by the participating insurance companies.
Please see footnotes on page 5.
Table of Contents
| Performance highlights (unaudited) | Wells Fargo Advantage VT Discovery Fund | 5 |
| Growth of $10,000 investment4 as of December 31, 2013 | ||
| ||

| 1. | Reflects the expense ratios as stated in the most recent prospectus. |
| 2. | The Adviser has committed through April 30, 2014, to waive fees and/or reimburse expenses to the extent necessary to cap the Fund’s Total Annual Fund Operating Expenses After Fee Waiver, excluding certain expenses, at the amount shown. Brokerage commissions, stamp duty fees, interest, taxes, acquired fund fees and expenses, and extraordinary expenses are excluded from the cap. Without this cap, the Fund’s returns would have been lower. |
| 3. | The Russell 2500™ Growth Index measures the performance of those Russell 2500 companies with higher price-to-book ratios and higher forecasted growth values. You cannot invest directly in an index. |
| 4. | The chart compares the performance of Class 2 shares for the most recent ten years with the Russell 2500™ Growth Index. The chart assumes a hypothetical $10,000 investment and reflects all operating expenses of the Fund. Performance figures of the Fund do not reflect fees charged pursuant to the terms of variable life insurance policies and variable annuity contracts. |
| 5. | The ten largest equity holdings are calculated based on the value of the securities divided by total net assets of the Fund. Holdings are subject to change and may have changed since the date specified. |
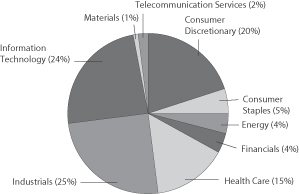
| 6. | Sector distribution is subject to change and is calculated based on the total long-term investments of the Fund. |
Table of Contents
| 6 | Wells Fargo Advantage VT Discovery Fund | Performance highlights (unaudited) |
MANAGER’S DISCUSSION
Fund highlights
| n | The Fund outperformed its benchmark, the Russell 2500 Growth Index, for the 12-month period that ended December 31, 2013. |
| n | Effective stock selection in the information technology (IT) and industrials sectors contributed positively to performance; positioning in the consumer discretionary sector was the most significant headwind. |
| n | The U.S. equity market delivered strong performance in 2013 despite some volatility along the way. |
| n | We view the stock market appreciation during 2013 as a correction from overly pessimistic valuations in prior years and not indicative of an overvalued market. Superior earnings growth profiles have yet to be fully valued, and we continue to see upside into 2014 for many of our investment themes. |
2013 asset class overview
The 2013 U.S. equity market was much like a long road trip. The drive clearly was successful and enjoyable for investors, but the trip was not without its share of speed bumps, congestion, and detours. The journey started on a high note in the first quarter; investors looked beyond geopolitical events and government gridlock, focusing instead on significant policy stimulus from global central bankers and clear signs of improving housing and employment markets. In the second quarter, however, two speed bumps surfaced. A series of mixed U.S. economic data, coupled with the Federal Reserve’s (Fed’s) discussion about eventually tapering its quantitative easing program, triggered significant investor concern. But pleasant driving conditions returned in the third quarter as investors shifted gears, abandoned their defensive bias, and displayed a clear preference for risk assets. Valuation multiples expanded, fundamentals were rewarded, and the more cyclical sectors of the equity market enjoyed a strong rally. A bit of winter fog early in the fourth quarter slowed driving once again, but a surprise budget compromise and strong U.S. economic data improved visibility, and the pace picked back up. Over the course of 2013, foreign investors came to realize that the U.S. offers the best road conditions for investing because the U.S. economy is in significantly better shape than the economies of other developed markets. As 2013 ended, capital flowed into U.S. stocks in a broad-based rally, capping an impressive year for U.S. equity investors.
We believe that, in any market environment, a portfolio’s construction must balance risk and return. We strive to provide this balance through a portfolio composed of three distinct types of growth companies. Core growth holdings, which represent 40%–50% of assets, are companies with stable growth records, proven management teams, and relatively low volatility. Developing situations, which also represent 40%–50% of the portfolio, are firms we believe are entering a period of accelerated growth driven by a new product, business plan, or management team. Developing situations are characterized by an attractive valuation level and average volatility. The remainder of the portfolio (5%–10% of assets) is dedicated to valuation opportunities—holdings we believe carry above-average growth potential and relatively high volatility.
Our conviction level always drives each stock’s relative weight in the portfolio. This direct relationship helps us position our highest-conviction ideas to potentially make a significant impact on performance.
| Ten largest equity holdings5 (%) as of December 31, 2013 | ||||
Vantiv Incorporated Class A | 2.23 | |||
Alliance Data Systems Corporation | 2.02 | |||
Constellation Brands Incorporated Class A | 2.02 | |||
DigitalGlobe Incorporated | 1.96 | |||
B/E Aerospace Incorporated | 1.87 | |||
Wabtec Corporation | 1.84 | |||
LKQ Corporation | 1.78 | |||
Copa Holdings SA Class A | 1.72 | |||
Kansas City Southern | 1.66 | |||
AMC Networks Incorporated Class A | 1.64 | |||
Effective security selection enabled the Fund to outperform its benchmark.
Security selection in the IT sector contributed significantly to returns in 2013. Internet software and service providers performed well, especially firms exposed to an improving real estate market. Zillow Incorporated—the largest online residential real estate marketplace—benefited from the housing rebound, which drove traffic to its website. We have since sold off this holding. Within commercial real estate, CoStar Group Incorporated—a provider of market analytics and comparable-sales data—enjoyed strong results as funding for transactions improved throughout 2013. Alliance Data Systems Corporation, which issues private-label credit cards, rose sharply after posting better-than-expected earnings growth. Finally, ServiceNow Incorporated—a provider of cloud-based IT service management solutions—reported a dramatic rise in revenue, well above consensus estimates.
Please see footnotes on page 5.
Table of Contents
| Performance highlights (unaudited) | Wells Fargo Advantage VT Discovery Fund | 7 |
| Sector distribution6 as of December 31, 2013 | ||
| ||
Security selection within the industrials sector also proved additive to performance. Railroad Kansas City Southern rose sharply, benefiting from stronger North American manufacturing activity via its rail lines into Mexico and increased transportation of oil by rail. Within airlines, shares of Panama-based Copa Holdings SA climbed, boosted by fleet expansion, the addition of new routes, and strong customer demand.
Positioning in the consumer discretionary sector modestly detracted from relative returns in 2013. Certain specialty retailers were particularly weak. Although Ulta Salon, Cosmetics & Fragrance Incorporated, posted a strong second quarter, third-quarter results were below expectations, and the firm lowered its guidance.
Given the company’s weak results and outlook, we exited the stock. Our position in fashion retailer Chico’s FAS Incorporated, which we no longer hold, also weighed on returns after the company tempered its guidance for future growth.
2014 outlook
As we move into 2014, many investors question the durability of the U.S. equities rally. They wonder whether the market has become overvalued and are concerned about the economy’s ability to thrive as the Fed winds down quantitative easing. We acknowledge that several constructive developments—a resurgence of U.S. manufacturing, strength in durable goods, a stronger housing market—have been factored into equity valuations. As a result, 2013 was a year of rising multiples for a broad swath of industries. However, we view the multiple expansion as a correction of overly pessimistic valuations in previous years, not as overvaluation, and believe U.S. stocks remain reasonably priced.
Even as our view remains optimistic for U.S. equities, we maintain a steady balance in the portfolio. We believe the portfolio’s superior earnings growth profile has not been fully valued and stands to benefit as the market shifts into a more discerning phase. We see continued upside in portfolio themes such as internet commerce, U.S. manufacturing and energy production, credit card-transaction growth, and innovations in biotechnology and generic drugs. And, we remain confident in our disciplined investment process, through which we dig deep to develop an edge and construct portfolios one stock at time, based on a bottom-up conviction. Unwavering dedication to our proven process enabled the Fund to outperform in 2013.
Please see footnotes on page 5.
Table of Contents
| 8 | Wells Fargo Advantage VT Discovery Fund | Fund expenses (unaudited) |
As a shareholder of the Fund, you incur ongoing costs, including management fees, distribution (12b-1) fees, and other Fund expenses. This example is intended to help you understand your ongoing costs (in dollars) of investing in the Fund and to compare these costs with the ongoing costs of investing in other mutual funds.
The example is based on an investment of $1,000 invested at the beginning of the six-month period and held for the entire period from July 1, 2013 to December 31, 2013.
Actual expenses
The “Actual” line of the table below provides information about actual account values and actual expenses. You may use the information in this line, together with the amount you invested, to estimate the expenses that you paid over the period. Simply divide your account value by $1,000 (for example, an $8,600 account value divided by $1,000 = 8.6), then multiply the result by the number in the “Actual” line under the heading entitled “Expenses Paid During Period” for your applicable class of shares to estimate the expenses you paid on your account during this period.
Hypothetical example for comparison purposes
The “Hypothetical” line of the table below provides information about hypothetical account values and hypothetical expenses based on the Fund’s actual expense ratio and an assumed rate of return of 5% per year before expenses, which is not the Fund’s actual return. The hypothetical account values and expenses may not be used to estimate the actual ending account balance or expenses you paid for the period. You may use this information to compare the ongoing costs of investing in the Fund and other funds. To do so, compare this 5% hypothetical example with the 5% hypothetical examples that appear in the shareholder reports of the other funds.
Please note that the expenses shown in the table are meant to highlight your ongoing costs only and do not reflect any separate account charges assessed by participating insurance companies. Therefore, the “Hypothetical” line of the table is useful in comparing ongoing costs only, and will not help you determine the relative total costs of owning different funds. In addition, if these separate account charges assessed by participating insurance companies were included, your costs would have been higher.
| Beginning account value 7-1-2013 | Ending account value 12-31-2013 | Expenses paid during the period1 | Net annual expense ratio | |||||||||||||
Class 2 | ||||||||||||||||
Actual | $ | 1,000.00 | $ | 1,213.28 | $ | 6.42 | 1.15 | % | ||||||||
Hypothetical (5% return before expenses) | $ | 1,000.00 | $ | 1,019.41 | $ | 5.85 | 1.15 | % | ||||||||
| 1. | Expenses paid is equal to the annualized expense ratio multiplied by the average account value over the period, multiplied by the number of days in the most recent fiscal half-year divided by the number of days in the fiscal year (to reflect the one-half year period). |
Table of Contents
| Portfolio of investments—December 31, 2013 | Wells Fargo Advantage VT Discovery Fund | 9 |
| Security name | Shares | Value | ||||||||||
Common Stocks: 97.16% | ||||||||||||
Consumer Discretionary: 19.72% | ||||||||||||
| Auto Components: 1.41% | ||||||||||||
BorgWarner Incorporated | 40,000 | $ | 2,236,400 | |||||||||
|
| |||||||||||
| Distributors: 1.78% | ||||||||||||
LKQ Corporation † | 85,824 | 2,823,610 | ||||||||||
|
| |||||||||||
| Hotels, Restaurants & Leisure: 0.67% | ||||||||||||
Krispy Kreme Doughnuts Incorporated † | 55,300 | 1,066,737 | ||||||||||
|
| |||||||||||
| Internet & Catalog Retail: 2.31% | ||||||||||||
Groupon Incorporated † | 143,300 | 1,686,641 | ||||||||||
HomeAway Incorporated † | 48,100 | 1,966,328 | ||||||||||
| 3,652,969 | ||||||||||||
|
| |||||||||||
| Media: 1.64% | ||||||||||||
AMC Networks Incorporated Class A † | 38,200 | 2,601,802 | ||||||||||
|
| |||||||||||
| Specialty Retail: 7.36% | ||||||||||||
Conn’s Incorporated † | 18,300 | 1,441,857 | ||||||||||
DSW Incorporated Class A | 45,086 | 1,926,525 | ||||||||||
Finish Line Incorporated Class A | 47,200 | 1,329,624 | ||||||||||
GNC Holdings Incorporated Class A | 32,219 | 1,883,201 | ||||||||||
Lithia Motors Incorporated Class A | 22,000 | 1,527,240 | ||||||||||
Lumber Liquidators Holdings Incorporated Ǡ | 17,500 | 1,800,575 | ||||||||||
Restoration Hardware Holdings Incorporated † | 25,945 | 1,746,099 | ||||||||||
| 11,655,121 | ||||||||||||
|
| |||||||||||
| Textiles, Apparel & Luxury Goods: 4.55% | ||||||||||||
Movado Group Incorporated | 39,600 | 1,742,796 | ||||||||||
PVH Corporation | 13,400 | 1,822,668 | ||||||||||
Skechers U.S.A. Incorporated Class A † | 41,259 | 1,366,911 | ||||||||||
Under Armour Incorporated Class A † | 26,000 | 2,269,800 | ||||||||||
| 7,202,175 | ||||||||||||
|
| |||||||||||
Consumer Staples: 4.75% | ||||||||||||
| Beverages: 2.02% | ||||||||||||
Constellation Brands Incorporated Class A † | 45,400 | 3,195,252 | ||||||||||
|
| |||||||||||
| Food & Staples Retailing: 1.70% | ||||||||||||
Rite Aid Corporation † | 227,600 | 1,151,656 | ||||||||||
United Natural Foods Incorporated † | 20,500 | 1,545,495 | ||||||||||
| 2,697,151 | ||||||||||||
|
| |||||||||||
| Food Products: 1.03% | ||||||||||||
Annie’s Incorporated «† | 37,887 | 1,630,656 | ||||||||||
|
| |||||||||||
Energy: 3.49% | ||||||||||||
| Oil, Gas & Consumable Fuels: 3.49% | ||||||||||||
Bonanza Creek Energy Incorporated † | 15,700 | 682,479 | ||||||||||
Delek US Holdings Incorporated | 28,217 | 970,947 | ||||||||||
The accompanying notes are an integral part of these financial statements.
Table of Contents
| 10 | Wells Fargo Advantage VT Discovery Fund | Portfolio of investments—December 31, 2013 |
| Security name | Shares | Value | ||||||||||
| Oil, Gas & Consumable Fuels (continued) | ||||||||||||
Diamondback Energy Incorporated † | 13,700 | $ | 724,182 | |||||||||
Gulfport Energy Corporation † | 25,799 | 1,629,207 | ||||||||||
Oasis Petroleum Incorporated † | 32,400 | 1,521,828 | ||||||||||
| 5,528,643 | ||||||||||||
|
| |||||||||||
Financials: 4.25% | ||||||||||||
| Capital Markets: 1.59% | ||||||||||||
Affiliated Managers Group Incorporated † | 11,600 | 2,515,808 | ||||||||||
|
| |||||||||||
| Commercial Banks: 1.48% | ||||||||||||
Texas Capital Bancshares Incorporated † | 37,624 | 2,340,213 | ||||||||||
|
| |||||||||||
| Insurance: 0.64% | ||||||||||||
eHealth Incorporated † | 22,000 | 1,022,780 | ||||||||||
|
| |||||||||||
| Real Estate Management & Development: 0.54% | ||||||||||||
CBRE Group Incorporated † | 32,800 | 862,640 | ||||||||||
|
| |||||||||||
Health Care: 14.36% | ||||||||||||
| Biotechnology: 6.98% | ||||||||||||
Alkermes plc † | 34,800 | 1,414,968 | ||||||||||
Alnylam Pharmaceuticals Incorporated † | 20,800 | 1,338,064 | ||||||||||
BioMarin Pharmaceutical Incorporated † | 24,067 | 1,691,188 | ||||||||||
Cepheid Incorporated † | 43,265 | 2,021,341 | ||||||||||
Cubist Pharmaceuticals Incorporated † | 13,734 | 945,861 | ||||||||||
Insmed Incorporated † | 53,200 | 904,932 | ||||||||||
Isis Pharmaceuticals Incorporated † | 9,645 | 384,257 | ||||||||||
Keryx Biopharmaceuticals Incorporated Ǡ | 45,800 | 593,110 | ||||||||||
NPS Pharmaceuticals Incorporated † | 24,650 | 748,374 | ||||||||||
Puma Biotechnology Incorporated † | 7,700 | 797,181 | ||||||||||
Vanda Pharmaceuticals Incorporated Ǡ | 17,991 | 223,268 | ||||||||||
| 11,062,544 | ||||||||||||
|
| |||||||||||
| Health Care Equipment & Supplies: 2.24% | ||||||||||||
Cooper Companies Incorporated | 15,200 | 1,882,368 | ||||||||||
Wright Medical Group Incorporated † | 54,375 | 1,669,856 | ||||||||||
| 3,552,224 | ||||||||||||
|
| |||||||||||
| Health Care Providers & Services: 2.02% | ||||||||||||
Envision Healthcare Holdings Incorporated † | 52,835 | 1,876,699 | ||||||||||
Team Health Holdings Incorporated † | 28,900 | 1,316,395 | ||||||||||
| 3,193,094 | ||||||||||||
|
| |||||||||||
| Health Care Technology: 0.93% | ||||||||||||
athenahealth Incorporated Ǡ | 11,000 | 1,479,500 | ||||||||||
|
| |||||||||||
| Life Sciences Tools & Services: 0.87% | ||||||||||||
Bruker BioSciences Corporation † | 69,700 | 1,377,969 | ||||||||||
|
| |||||||||||
The accompanying notes are an integral part of these financial statements.
Table of Contents
| Portfolio of investments—December 31, 2013 | Wells Fargo Advantage VT Discovery Fund | 11 |
| Security name | Shares | Value | ||||||||||
| Pharmaceuticals: 1.32% | ||||||||||||
Salix Pharmaceuticals Limited † | 23,200 | $ | 2,086,608 | |||||||||
|
| |||||||||||
Industrials: 24.51% | ||||||||||||
| Aerospace & Defense: 3.83% | ||||||||||||
B/E Aerospace Incorporated † | 34,000 | 2,959,020 | ||||||||||
DigitalGlobe Incorporated † | 75,594 | 3,110,693 | ||||||||||
| 6,069,713 | ||||||||||||
|
| |||||||||||
| Airlines: 2.89% | ||||||||||||
Allegiant Travel Company | 17,709 | 1,867,237 | ||||||||||
Copa Holdings SA Class A | 17,000 | 2,721,870 | ||||||||||
| 4,589,107 | ||||||||||||
|
| |||||||||||
| Building Products: 1.61% | ||||||||||||
Fortune Brands Home & Security Incorporated | 55,691 | 2,545,079 | ||||||||||
|
| |||||||||||
| Construction & Engineering: 1.20% | ||||||||||||
Quanta Services Incorporated † | 60,100 | 1,896,756 | ||||||||||
|
| |||||||||||
| Machinery: 6.63% | ||||||||||||
Chart Industries Incorporated † | 19,900 | 1,903,236 | ||||||||||
Colfax Corporation † | 26,118 | 1,663,455 | ||||||||||
Graco Incorporated | 29,200 | 2,281,104 | ||||||||||
Proto Labs Incorporated † | 24,600 | 1,751,028 | ||||||||||
Wabtec Corporation | 39,200 | 2,911,384 | ||||||||||
| 10,510,207 | ||||||||||||
|
| |||||||||||
| Professional Services: 3.73% | ||||||||||||
Advisory Board Company † | 31,800 | 2,024,706 | ||||||||||
Towers Watson & Company Class A | 19,000 | 2,424,590 | ||||||||||
Verisk Analytics Incorporated Class A † | 22,200 | 1,458,984 | ||||||||||
| 5,908,280 | ||||||||||||
|
| |||||||||||
| Road & Rail: 2.99% | ||||||||||||
Kansas City Southern | 21,200 | 2,625,196 | ||||||||||
Old Dominion Freight Line Incorporated † | 39,800 | 2,110,196 | ||||||||||
| 4,735,392 | ||||||||||||
|
| |||||||||||
| Trading Companies & Distributors: 1.63% | ||||||||||||
United Rentals Incorporated † | 33,200 | 2,587,940 | ||||||||||
|
| |||||||||||
Information Technology: 23.25% | ||||||||||||
| Communications Equipment: 0.62% | ||||||||||||
Ubiquiti Networks Incorporated « | 21,400 | 983,544 | ||||||||||
|
| |||||||||||
| Computers & Peripherals: 1.36% | ||||||||||||
Stratasys Limited † | 16,028 | 2,158,972 | ||||||||||
|
| |||||||||||
The accompanying notes are an integral part of these financial statements.
Table of Contents
| 12 | Wells Fargo Advantage VT Discovery Fund | Portfolio of investments—December 31, 2013 |
| Security name | Shares | Value | ||||||||||||
| Electronic Equipment, Instruments & Components: 2.87% | ||||||||||||||
Cognex Corporation | 33,400 | $ | 1,275,212 | |||||||||||
FEI Company | 21,000 | 1,876,560 | ||||||||||||
IPG Photonics Corporation « | 18,000 | 1,396,980 | ||||||||||||
| 4,548,752 | ||||||||||||||
|
| |||||||||||||
| Internet Software & Services: 3.57% | ||||||||||||||
Cornerstone OnDemand Incorporated † | 43,100 | 2,298,954 | ||||||||||||
CoStar Group Incorporated † | 11,300 | 2,085,754 | ||||||||||||
Shutterstock Incorporated Ǡ | 15,181 | 1,269,587 | ||||||||||||
| 5,654,295 | ||||||||||||||
|
| |||||||||||||
| IT Services: 4.26% | ||||||||||||||
Alliance Data Systems Corporation † | 12,200 | 3,207,746 | ||||||||||||
Vantiv Incorporated Class A † | 108,353 | 3,533,391 | ||||||||||||
| 6,741,137 | ||||||||||||||
|
| |||||||||||||
| Semiconductors & Semiconductor Equipment: 1.76% | ||||||||||||||
Cavium Incorporated † | 38,800 | 1,338,988 | ||||||||||||
Cree Incorporated † | 23,100 | 1,445,367 | ||||||||||||
| 2,784,355 | ||||||||||||||
|
| |||||||||||||
| Software: 8.81% | ||||||||||||||
ACI Worldwide Incorporated † | 24,800 | 1,612,000 | ||||||||||||
Aspen Technology Incorporated † | 61,900 | 2,587,420 | ||||||||||||
CommVault Systems Incorporated † | 34,400 | 2,575,872 | ||||||||||||
Fleetmatics Group plc Ǡ | 40,604 | 1,756,123 | ||||||||||||
Guidewire Software Incorporated † | 34,900 | 1,712,543 | ||||||||||||
ServiceNow Incorporated † | 35,886 | 2,009,975 | ||||||||||||
Splunk Incorporated † | 10,886 | 747,542 | ||||||||||||
Tableau Software Incorporated Class A † | 13,915 | 959,161 | ||||||||||||
| 13,960,636 | ||||||||||||||
|
| |||||||||||||
Materials: 1.36% | ||||||||||||||
| Chemicals: 1.36% | ||||||||||||||
W.R. Grace & Company † | 21,800 | 2,155,366 | ||||||||||||
|
| |||||||||||||
Telecommunication Services: 1.47% | ||||||||||||||
| Wireless Telecommunication Services: 1.47% | ||||||||||||||
SBA Communications Corporation Class A † | 25,984 | 2,334,400 | ||||||||||||
|
| |||||||||||||
Total Common Stocks (Cost $112,969,587) | 153,947,827 | |||||||||||||
|
| |||||||||||||
| Yield | ||||||||||||||
Short-Term Investments: 8.66% | ||||||||||||||
| Investment Companies: 8.66% | ||||||||||||||
Wells Fargo Advantage Cash Investment Money Market Fund, Select Class (l)(u) | 0.06 | % | 5,482,751 | 5,482,751 | ||||||||||
Wells Fargo Securities Lending Cash Investments, LLC (l)(u)(r)(v) | 0.08 | 8,249,750 | 8,249,750 | |||||||||||
Total Short-Term Investments (Cost $13,732,501) | 13,732,501 | |||||||||||||
|
| |||||||||||||
The accompanying notes are an integral part of these financial statements.
Table of Contents
| Portfolio of investments—December 31, 2013 | Wells Fargo Advantage VT Discovery Fund | 13 |
| Value | ||||||||
| Total investments in securities | ||||||||
| (Cost $126,702,088) * | 105.82 | % | $ | 167,680,328 | ||||
Other assets and liabilities, net | (5.82 | ) | (9,229,269 | ) | ||||
|
|
|
| |||||
| Total net assets | 100.00 | % | $ | 158,451,059 | ||||
|
|
|
| |||||
| † | Non-income-earning security |
| « | All or a portion of this security is on loan. |
| (l) | Investment in an affiliate |
| (u) | Rate shown is the 7-day annualized yield at period end. |
| (r) | The investment company is exempt from registration under Section 3(c)(7) of the Investment Company Act of 1940, as amended. |
| (v) | Security represents investment of cash collateral received from securities on loan. |
| * | Cost for federal income tax purposes is $126,790,962 and unrealized appreciation (depreciation) consists of: |
Gross unrealized appreciation | $ | 41,464,542 | ||
Gross unrealized depreciation | (575,176 | ) | ||
|
| |||
Net unrealized appreciation | $ | 40,889,366 |
The accompanying notes are an integral part of these financial statements.
Table of Contents
| 14 | Wells Fargo Advantage VT Discovery Fund | Statement of assets and liabilities—December 31, 2013 |
Assets | ||||
Investments | ||||
In unaffiliated securities (including securities on loan), at value (see cost below) | $ | 153,947,827 | ||
In affiliated securities, at value (see cost below) | 13,732,501 | |||
|
| |||
Total investments, at value (see cost below) | 167,680,328 | |||
Receivable for investments sold | 133,730 | |||
Receivable for Fund shares sold | 193,030 | |||
Receivable for dividends | 48,582 | |||
Receivable for securities lending income | 7,573 | |||
Prepaid expenses and other assets | 844 | |||
|
| |||
Total assets | 168,064,087 | |||
|
| |||
Liabilities | ||||
Payable for investments purchased | 1,055,678 | |||
Payable for Fund shares redeemed | 94,284 | |||
Payable upon receipt of securities loaned | 8,249,750 | |||
Advisory fee payable | 93,493 | |||
Distribution fees payable | 33,774 | |||
Due to other related parties | 17,563 | |||
Accrued expenses and other liabilities | 68,486 | |||
|
| |||
Total liabilities | 9,613,028 | |||
|
| |||
Total net assets | $ | 158,451,059 | ||
|
| |||
NET ASSETS CONSIST OF | ||||
Paid-in capital | $ | 98,587,046 | ||
Accumulated net realized gains on investments | 18,885,773 | |||
Net unrealized gains on investments | 40,978,240 | |||
|
| |||
Total net assets | $ | 158,451,059 | ||
|
| |||
COMPUTATION OF NET ASSET VALUE PER SHARE1 | ||||
Net assets – Class 2 | $ | 158,451,059 | ||
Shares outstanding – Class 2 | 4,501,084 | |||
Net asset value per share – Class 2 | $35.20 | |||
Investments in unaffiliated securities (including securities on loan), at cost | $ | 112,969,587 | ||
|
| |||
Investments in affiliated securities, at cost | $ | 13,732,501 | ||
|
| |||
Total investments, at cost | $ | 126,702,088 | ||
|
| |||
Securities on loan, at value | $ | 8,109,438 | ||
|
| |||
| 1. | The Fund has an unlimited number of authorized shares. |
The accompanying notes are an integral part of these financial statements.
Table of Contents
| Statement of operations—year ended December 31, 2013 | Wells Fargo Advantage VT Discovery Fund | 15 |
Investment income | ||||
Dividends | $ | 595,309 | ||
Securities lending income, net | 194,613 | |||
Income from affiliated securities | 2,565 | |||
|
| |||
Total investment income | 792,487 | |||
|
| |||
Expenses | ||||
Advisory fee | 942,708 | |||
Administration fees | ||||
Fund level | 67,336 | |||
Class 2 | 107,738 | |||
Distribution fees | ||||
Class 2 | 336,681 | |||
Custody and accounting fees | 23,311 | |||
Professional fees | 41,683 | |||
Shareholder report expenses | 30,302 | |||
Trustees’ fees and expenses | 15,248 | |||
Other fees and expenses | 3,841 | |||
|
| |||
Total expenses | 1,568,848 | |||
Less: Fee waivers and/or expense reimbursements | (20,113 | ) | ||
|
| |||
Net expenses | 1,548,735 | |||
|
| |||
Net investment loss | (756,248 | ) | ||
|
| |||
REALIZED AND UNREALIZED GAINS (LOSSES) ON INVESTMENTS | ||||
Net realized gains on investments | 20,431,198 | |||
Net change in unrealized gains (losses) on investments | 28,686,095 | |||
|
| |||
Net realized and unrealized gains (losses) on investments | 49,117,293 | |||
|
| |||
Net increase in net assets resulting from operations | $ | 48,361,045 | ||
|
| |||
The accompanying notes are an integral part of these financial statements.
Table of Contents
| 16 | Wells Fargo Advantage VT Discovery Fund | Statement of changes in net assets |
| Year ended December 31, 2013 | Year ended December 31, 2012 | |||||||||||||||
Operations |
| |||||||||||||||
Net investment loss | $ | (756,248 | ) | $ | (33,766 | ) | ||||||||||
Net realized gains on investments | 20,431,198 | 8,609,836 | ||||||||||||||
Net change in unrealized gains (losses) on investments | 28,686,095 | 8,243,827 | ||||||||||||||
|
|
|
|
|
|
|
| |||||||||
Net increase in net assets resulting from operations | 48,361,045 | 16,819,897 | ||||||||||||||
|
|
|
|
|
|
|
| |||||||||
Distributions to shareholders from | ||||||||||||||||
Net investment income – Class 2 | (9,591 | ) | 0 | |||||||||||||
Net realized gains – Class 2 | (3,722,690 | ) | 0 | |||||||||||||
|
|
|
|
|
|
|
| |||||||||
Total distributions to shareholders | (3,732,281 | ) | 0 | |||||||||||||
|
|
|
|
|
|
|
| |||||||||
| Shares | Shares | |||||||||||||||
Capital share transactions | ||||||||||||||||
Proceeds from shares sold – Class 2 | 727,800 | 22,421,892 | 769,807 | 18,739,662 | ||||||||||||
Reinvestment of distributions – Class 2 | 121,930 | 3,732,281 | 0 | 0 | ||||||||||||
Payment for shares redeemed – Class 2 | (779,470 | ) | (23,790,323 | ) | (929,140 | ) | (22,200,607 | ) | ||||||||
|
|
|
|
|
|
|
| |||||||||
Net increase (decrease) in net assets resulting from capital share transactions | 2,363,850 | (3,460,945 | ) | |||||||||||||
|
|
|
|
|
|
|
| |||||||||
Total increase in net assets | 46,992,614 | 13,358,952 | ||||||||||||||
|
|
|
|
|
|
|
| |||||||||
Net assets | ||||||||||||||||
Beginning of period | 111,458,445 | 98,099,493 | ||||||||||||||
|
|
|
|
|
|
|
| |||||||||
End of period | $ | 158,451,059 | $ | 111,458,445 | ||||||||||||
|
|
|
|
|
|
|
| |||||||||
Undistributed net investment income | $ | 0 | $ | 0 | ||||||||||||
|
|
|
|
|
|
|
| |||||||||
The accompanying notes are an integral part of these financial statements.
Table of Contents
| Financial highlights | Wells Fargo Advantage VT Discovery Fund | 17 |
(For a share outstanding throughout each period)
| Year ended December 31 | ||||||||||||||||||||
| CLASS 2 | 2013 | 2012 | 2011 | 20101 | 2009 | |||||||||||||||
Net asset value, beginning of period | $ | 25.16 | $ | 21.37 | $ | 21.28 | $ | 15.70 | $ | 11.19 | ||||||||||
Net investment loss | (0.17 | ) | (0.01 | ) | (0.18 | ) | (0.13 | ) | (0.11 | ) | ||||||||||
Net realized and unrealized gains (losses) on investments | 11.06 | 3.80 | 0.27 | 5.71 | 4.62 | |||||||||||||||
|
|
|
|
|
|
|
|
|
| |||||||||||
Total from investment operations | 10.89 | 3.79 | 0.09 | 5.58 | 4.51 | |||||||||||||||
Distributions to shareholders from | ||||||||||||||||||||
Net investment income | (0.00 | )2 | 0.00 | 0.00 | 0.00 | 0.00 | ||||||||||||||
Net realized gains | (0.85 | ) | 0.00 | 0.00 | 0.00 | 0.00 | ||||||||||||||
|
|
|
|
|
|
|
|
|
| |||||||||||
Total distributions to shareholders | (0.85 | ) | 0.00 | 0.00 | 0.00 | 0.00 | ||||||||||||||
Net asset value, end of period | $ | 35.20 | $ | 25.16 | $ | 21.37 | $ | 21.28 | $ | 15.70 | ||||||||||
Total return | 43.80 | % | 17.74 | % | 0.42 | % | 35.54 | % | 40.30 | % | ||||||||||
Ratios to average net assets (annualized) | ||||||||||||||||||||
Gross expenses | 1.16 | % | 1.21 | % | 1.18 | % | 1.26 | % | 1.35 | % | ||||||||||
Net expenses | 1.15 | % | 1.15 | % | 1.15 | % | 1.15 | % | 1.15 | % | ||||||||||
Net investment loss | (0.56 | )% | (0.03 | )% | (0.75 | )% | (0.71 | )% | (0.61 | )% | ||||||||||
Supplemental data | ||||||||||||||||||||
Portfolio turnover rate | 88 | % | 98 | % | 113 | % | 101 | % | 208 | % | ||||||||||
Net assets, end of period (000s omitted) | $158,451 | $111,458 | $98,099 | $110,755 | $86,125 | |||||||||||||||
| 1. | After the close of business on July 16, 2010, existing shares of the Fund were renamed Class 2 shares. |
| 2. | Amount is less than $0.005 per share. |
The accompanying notes are an integral part of these financial statements.
Table of Contents
| 18 | Wells Fargo Advantage VT Discovery Fund | Notes to financial statements |
1. ORGANIZATION
Wells Fargo Variable Trust (the “Trust”), a Delaware statutory trust organized on March 10, 1999, is an open-end management investment company registered under the Investment Company Act of 1940, as amended (the “1940 Act”). These financial statements report on the Wells Fargo Advantage VT Discovery Fund (the “Fund”) which is a diversified series of the Trust.
2. SIGNIFICANT ACCOUNTING POLICIES
The following significant accounting policies, which are consistently followed in the preparation of the financial statements of the Fund, are in conformity with U.S. generally accepted accounting principles which require management to make estimates and assumptions that affect the reported amounts of assets and liabilities, disclosure of contingent assets and liabilities at the date of the financial statements, and the reported amounts of revenues and expenses during the reporting period. Actual results could differ from those estimates.
Securities valuation
All investments are valued each business day as of the close of regular trading on the New York Stock Exchange (generally 4 p.m. Eastern Time).
Equity securities that are listed on a foreign or domestic exchange or market are valued at the official closing price or, if none, the last sales price. If no sale occurs on the primary exchange or market for the security that day, the prior day’s price will be deemed “stale” and fair values will be determined in accordance with the Fund’s Valuation Procedures.
Investments in registered open-end investment companies are valued at net asset value. Non-registered investment vehicles are fair valued at net asset value.
Investments which are not valued using any of the methods discussed above are valued at their fair value, as determined in good faith by the Board of Trustees of the Fund. The Board of Trustees has established a Valuation Committee comprised of the Trustees and has delegated to it the authority to take any actions regarding the valuation of portfolio securities that the Valuation Committee deems necessary or appropriate, including determining the fair value of portfolio securities, unless the determination has been delegated to the Management Valuation Team of Wells Fargo Funds Management, LLC (“Funds Management”). The Board of Trustees retains the authority to make or ratify any valuation decisions or approve any changes to the Valuation Procedures as it deems appropriate. On a quarterly basis, the Board of Trustees receives reports on any valuation actions taken by the Valuation Committee or the Management Valuation Team which may include items for ratification.
Valuations of fair valued securities are compared to the next actual sales price when available, or other appropriate market values, to assess the continued appropriateness of the fair valuation methodologies used. These securities are fair valued on a day-to-day basis, taking into consideration changes to appropriate market information and any significant changes to the inputs considered in the valuation process until there is a readily available price provided on an exchange or by an independent pricing service. Valuations received from an independent pricing service or independent broker-dealer quotes are periodically validated by comparisons to most recent trades and valuations provided by other independent pricing services in addition to the review of prices by the adviser and/or subadviser. Unobservable inputs used in determining fair valuations are identified based on the type of security, taking into consideration factors utilized by market participants in valuing the investment, knowledge about the issuer and the current market environment.
Security loans
The Fund may lend its securities from time to time in order to earn additional income in the form of fees or interest on securities received as collateral or the investment of any cash received as collateral. The Fund continues to receive interest or dividends on the securities loaned. The Fund receives collateral in the form of cash or securities with a value at least equal to the value of the securities on loan. The value of the loaned securities is determined at the close of each business day and any additional required collateral is delivered to the Fund on the next business day. In a securities lending transaction, the net asset value of the Fund will be affected by an increase or decrease in the value of the securities loaned and by an increase or decrease in the value of the instrument in which collateral is invested. The amount of securities lending activity undertaken by the Fund fluctuates from time to time. In the event of default or bankruptcy by the borrower, the Fund may be prevented from recovering the loaned securities or gaining access to the collateral or may experience delays or costs in doing so. In addition, the investment of any cash collateral received may lose all or part of its value. The Fund has the right under the lending agreement to recover the securities from the borrower on demand.
The Fund lends its securities through an unaffiliated securities lending agent. Cash collateral received in connection with its securities lending transactions is invested in Wells Fargo Securities Lending Cash Investments, LLC (the “Securities
Table of Contents
| Notes to financial statements | Wells Fargo Advantage VT Discovery Fund | 19 |
Lending Fund”). The Securities Lending Fund is exempt from registration under Section 3(c)(7) of the 1940 Act and is managed by Funds Management and is subadvised by Wells Capital Management Incorporated (“WellsCap”). Funds Management receives an advisory fee starting at 0.05% and declining to 0.01% as the average daily net assets of the Securities Lending Fund increase. All of the fees received by Funds Management are paid to WellsCap for its services as subadviser. The Securities Lending Fund seeks to provide a positive return compared to the daily Fed Funds Open rate by investing in high-quality, U.S. dollar-denominated short-term money market instruments. Securities Lending Fund investments are fair valued based upon the amortized cost valuation technique. Income earned from investment in the Securities Lending Fund is included in securities lending income on the Statement of Operations.
Security transactions and income recognition
Securities transactions are recorded on a trade date basis. Realized gains or losses are recorded on the basis of identified cost. Dividend income is recognized on the ex-dividend date.
Distributions to shareholders
Distributions to shareholders from net investment income and net realized gains, if any, are recorded on the ex-dividend date. Such distributions are determined in conformity with federal income tax regulations, which may differ in amount or character from net investment income and realized gains recognized for purposes of U.S. generally accepted accounting principles.
Federal and other taxes
The Fund intends to continue to qualify as a regulated investment company by distributing substantially all of its investment company taxable income and any net realized capital gains (after reduction for capital loss carryforwards) sufficient to relieve it from all, or substantially all, federal income taxes. Accordingly, no provision for federal income taxes was required.
The Fund’s income and federal excise tax returns and all financial records supporting those returns for the prior three fiscal years are subject to examination by the federal and Delaware revenue authorities. Management has analyzed the Fund’s tax positions taken on federal, state, and foreign tax returns for all open tax years and does not believe that there are any uncertain tax positions that require recognition of a tax liability.
Reclassifications are made to the Fund’s capital accounts for permanent tax differences to reflect income and gains available for distribution (or available capital loss carryforwards) under federal income tax regulations. U.S. generally accepted accounting principles requires that certain components of net assets be adjusted to reflect permanent differences between financial and tax reporting. These reclassifications have no effect on net assets or net asset values per share. The primary permanent difference causing such reclassifications is due to net operating losses. At December 31, 2013, as a result of permanent book-to-tax differences, the following reclassification adjustments were made on the Statement of Assets and Liabilities:
| Paid-in capital | Undistributed net investment income | Accumulated net realized gains on investments | ||
| $6,925 | $765,839 | $(772,764) |
3. FAIR VALUATION MEASUREMENTS
Fair value measurements of investments are determined within a framework that has established a fair value hierarchy based upon the various data inputs utilized in determining the value of the Fund’s investments. The three-level hierarchy gives the highest priority to unadjusted quoted prices in active markets for identical assets or liabilities (Level 1) and the lowest priority to significant unobservable inputs (Level 3). The Fund’s investments are classified within the fair value hierarchy based on the lowest level of input that is significant to the fair value measurement. The inputs are summarized into three broad levels as follows:
| n | Level 1 – quoted prices in active markets for identical securities |
| n | Level 2 – other significant observable inputs (including quoted prices for similar securities, interest rates, prepayment speeds, credit risk, use of amortized cost, etc.) |
| n | Level 3 – significant unobservable inputs (including the Fund’s own assumptions in determining the fair value of investments) |
The inputs or methodologies used for valuing investments in securities are not necessarily an indication of the risk associated with investing in those securities.
Table of Contents
| 20 | Wells Fargo Advantage VT Discovery Fund | Notes to financial statements |
As of December 31, 2013, the inputs used in valuing investments in securities were as follows:
| Investments in securities | Quoted prices (Level 1) | Other significant (Level 2) | Significant unobservable inputs (Level 3) | Total | ||||||||||||
Equity securities | ||||||||||||||||
Common stocks | $ | 153,947,827 | $ | 0 | $ | 0 | $ | 153,947,827 | ||||||||
Short-term investments | ||||||||||||||||
Investment companies | 5,482,751 | 8,249,750 | 0 | 13,732,501 | ||||||||||||
| $ | 159,430,578 | $ | 8,249,750 | $ | 0 | $ | 167,680,328 | |||||||||
Transfers in and transfers out are recognized at the end of the reporting period. For the year ended December 31, 2013, the Fund did not have any transfers into/out of Level 1, Level 2, or Level 3.
4. TRANSACTIONS WITH AFFILIATES AND OTHER EXPENSES
Advisory fee
The Trust has entered into an advisory contract with Funds Management, an indirect wholly owned subsidiary of Wells Fargo & Company (“Wells Fargo”). The adviser is responsible for implementing investment policies and guidelines and for supervising the subadviser, who is responsible for day-to-day portfolio management of the Fund.
Pursuant to the contract, Funds Management is entitled to receive an annual advisory fee starting at 0.70% and declining to 0.55% as the average daily net assets of the Fund increase. For the year ended December 31, 2013, the advisory fee was equivalent to an annual rate of 0.70% of the Fund’s average daily net assets.
Funds Management has retained the services of a subadviser to provide daily portfolio management to the Fund. The fee for subadvisory services is borne by Funds Management. WellsCap, an affiliate of Funds Management and an indirect, wholly owned subsidiary of Wells Fargo, is the subadviser to the Fund and is entitled to receive a fee from Funds Management at an annual rate starting at 0.45% and declining to 0.35% as the average daily net assets of the Fund increase.
Administration and transfer agent fees
The Trust has entered into an administration agreement with Funds Management. Under this agreement, for providing administrative services, which includes paying fees and expenses for services provided by the transfer agent, sub-transfer agents, omnibus account servicers and record-keepers, Funds Management is entitled to receive from the Fund an annual fund level administration fee starting at 0.05% and declining to 0.03% as the average daily net assets of the Fund increase and for Class 2 shares, a class level administration fee of 0.08% which is calculated based on its average daily net assets.
Funds Management has contractually waived and/or reimbursed advisory and administration fees to the extent necessary to maintain certain net operating expense ratios for the Fund. Waiver of fees and/or reimbursement of expenses by Funds Management were made first from fund level expenses on a proportionate basis and then from class specific expenses. Funds Management has committed through April 30, 2014 to waive fees and/or reimburse expenses to the extent necessary to cap the Fund’s expenses at 1.15% for Class 2 shares.
Distribution fees
The Trust has adopted a Distribution Plan for Class 2 shares of the Fund pursuant to Rule 12b-1 under the 1940 Act. Distribution fees are charged to Class 2 shares and paid to Wells Fargo Funds Distributor, LLC, the principal underwriter, at an annual rate of 0.25% of its average daily net assets.
5. INVESTMENT PORTFOLIO TRANSACTIONS
Purchases and sales of investments, excluding U.S. government obligations (if any) and short-term securities, for the year ended December 31, 2013 were $116,035,255 and $120,422,472, respectively.
6. BANK BORROWINGS
The Trust and Wells Fargo Funds Trust (excluding the money market funds and certain other funds) are parties to a $150,000,000 revolving credit agreement with State Street Bank and Trust Company, whereby the Fund is permitted to use bank borrowings for temporary or emergency purposes, such as to fund shareholder redemption requests. Interest
Table of Contents
| Notes to financial statements | Wells Fargo Advantage VT Discovery Fund | 21 |
under the credit agreement is charged to the Fund based on a borrowing rate equal to the higher of the Federal Funds rate in effect on that day plus 1.25% or the overnight LIBOR rate in effect on that day plus 1.25%. In addition, an annual commitment fee equal to 0.10% of the unused balance is allocated to each participating fund. For the year ended December 31, 2013, the Fund paid $206 in commitment fees.
For the year ended December 31, 2013, there were no borrowings by the Fund under the agreement.
7. DISTRIBUTIONS TO SHAREHOLDERS
The tax character of distributions paid for the year ended December 31, 2013 was $9,591 and $3,722,690 of ordinary income and long-term capital gain, respectively. For the year ended December 31, 2012, the Fund did not pay any distributions to shareholders.
As of December 31, 2013, the components of distributable earnings on a tax basis were as follows:
| Undistributed ordinary income | Undistributed long-term gain | Unrealized gains | ||
| $6,355,354 | $12,619,293 | $40,889,366 |
8. INDEMNIFICATION
Under the Trust’s organizational documents, the officers and directors are indemnified against certain liabilities that may arise out of performance of their duties to the Trust. Additionally, in the normal course of business, the Trust may enter into contracts with service providers that contain a variety of indemnification clauses. The Trust’s maximum exposure under these arrangements is dependent on future claims that may be made against the Fund and, therefore, cannot be estimated.
Table of Contents
| 22 | Wells Fargo Advantage VT Discovery Fund | Report of independent registered public accounting firm |
BOARD OF TRUSTEES AND SHAREHOLDERS OF WELLS FARGO VARIABLE TRUST:
We have audited the accompanying statement of assets and liabilities, including the portfolio of investments, of the Wells Fargo Advantage VT Discovery Fund (the “Fund”), one of the funds constituting the Wells Fargo Variable Trust, as of December 31, 2013, and the related statement of operations for the year then ended, statements of changes in net assets for each of the years in the two-year period then ended, and the financial highlights for each of the years in the five-year period then ended. These financial statements and financial highlights are the responsibility of the Fund’s management. Our responsibility is to express an opinion on these financial statements and financial highlights based on our audits.
We conducted our audits in accordance with the standards of the Public Company Accounting Oversight Board (United States). Those standards require that we plan and perform the audit to obtain reasonable assurance about whether the financial statements and financial highlights are free of material misstatement. An audit includes examining, on a test basis, evidence supporting the amounts and disclosures in the financial statements. Our procedures included confirmation of securities owned as of December 31, 2013, by correspondence with the custodian and brokers or by other appropriate auditing procedures. An audit also includes assessing the accounting principles used and significant estimates made by management, as well as evaluating the overall financial statement presentation. We believe that our audits provide a reasonable basis for our opinion.
In our opinion, the financial statements and financial highlights referred to above present fairly, in all material respects, the financial position of the Wells Fargo Advantage VT Discovery Fund as of December 31, 2013, the results of its operations for the year then ended, the changes in its net assets for each of the years in the two-year period then ended, and the financial highlights for each of the years in the five-year period then ended, in conformity with U.S. generally accepted accounting principles.

Boston, Massachusetts
February 27, 2014
Table of Contents
| Other information (unaudited) | Wells Fargo Advantage VT Discovery Fund | 23 |
TAX INFORMATION
For corporate shareholders, pursuant to Section 854 of the Internal Revenue Code, 99.88% of ordinary income dividends qualify for the corporate dividends-received deduction for the fiscal year ended December 31, 2013.
Pursuant to Section 852 of the Internal Revenue Code, $3,722,690 was designated as long-term capital gain distributions for the fiscal year ended December 31, 2013.
PROXY VOTING INFORMATION
A description of the policies and procedures that the Fund uses to determine how to vote proxies relating to portfolio securities is available without charge, upon request, by calling 1-800-222-8222, visiting our website at wellsfargoadvantagefunds.com, or visiting the SEC website at sec.gov. Information regarding how the Fund voted proxies relating to portfolio securities during the most recent 12-month period ended June 30 is available without charge on the Fund’s website at wellsfargoadvantagefunds.com or by visiting the SEC website at sec.gov.
PORTFOLIO HOLDINGS INFORMATION
The complete portfolio holdings for the Fund are publicly available on the Fund’s website (wellsfargoadvantagefunds.com) on a monthly, 30-day or more delayed basis. In addition, top ten holdings information for the Fund is publicly available on the Fund’s website on a monthly, seven-day or more delayed basis. The Fund files its complete schedule of portfolio holdings with the SEC for the first and third quarters of each fiscal year on Form N-Q, which is available without charge by visiting the SEC website at sec.gov. In addition, the Fund’s Form N-Q may be reviewed and copied at the SEC’s Public Reference Room in Washington, DC, and at regional offices in New York City, at 233 Broadway, and in Chicago, at 175 West Jackson Boulevard, Suite 900. Information about the Public Reference Room may be obtained by calling 1-800-SEC-0330.
Table of Contents
| 24 | Wells Fargo Advantage VT Discovery Fund | Other information (unaudited) |
BOARD OF TRUSTEES AND OFFICERS
Each of the Trustees and Officers listed in the table below acts in identical capacities for each fund in the Wells Fargo Advantage family of funds, which consists of 132 mutual funds1 comprising the Wells Fargo Funds Trust, Wells Fargo Variable Trust, Wells Fargo Master Trust and four closed-end funds (collectively the “Fund Complex”). This table should be read in conjunction with the Prospectus and the Statement of Additional Information2. All of the Trustees are also Members of the Audit and Governance Committees of each Trust in the Fund Complex. The mailing address of each Trustee and Officer is 525 Market Street, 12th Floor, San Francisco, CA 94105. Each Trustee and Officer serves an indefinite term, however, each Trustee serves such term until reaching the mandatory retirement age established by the Trustees.
Independent Trustees
Name and year of birth | Position held and length of service* | Principal occupations during past five years | Other directorships during | |||
| Peter G. Gordon (Born 1942) | Trustee, since 1998; Chairman, since 2005 | Co-Founder, Retired Chairman, President and CEO of Crystal Geyser Water Company. Trustee Emeritus, Colby College. | Asset Allocation Trust | |||
| Isaiah Harris, Jr. (Born 1952) | Trustee, since 2009 | Retired. Prior thereto, President and CEO of BellSouth Advertising and Publishing Corp. from 2005 to 2007, President and CEO of BellSouth Enterprises from 2004 to 2005 and President of BellSouth Consumer Services from 2000 to 2003. Emeritus member of the Iowa State University Foundation Board of Governors. Emeritus Member of the Advisory Board of Iowa State University School of Business. Advisory Board Member, Palm Harbor Academy (charter school). Mr. Harris is a certified public accountant. | CIGNA Corporation; Deluxe Corporation; Asset Allocation Trust | |||
| Judith M. Johnson (Born 1949) | Trustee, since 2008; Audit Committee Chairman, since 2008 | Retired. Prior thereto, Chief Executive Officer and Chief Investment Officer of Minneapolis Employees Retirement Fund from 1996 to 2008. Ms. Johnson is an attorney, certified public accountant and a certified managerial accountant. | Asset Allocation Trust | |||
| Leroy Keith, Jr. (Born 1939) | Trustee, since 2010 | Chairman, Bloc Global Services (development and construction). Trustee of the Evergreen Funds from 1983 to 2010. Former Managing Director, Almanac Capital Management (commodities firm), former Partner, Stonington Partners, Inc. (private equity fund), former Director, Obagi Medical Products Co. and former Director, Lincoln Educational Services. | Trustee, Virtus Fund Complex (consisting of 50 portfolios as of 12/16/2013); Asset Allocation Trust | |||
| David F. Larcker (Born 1950) | Trustee, since 2009 | James Irvin Miller Professor of Accounting at the Graduate School of Business, Stanford University, Morgan Stanley Director of the Center for Leadership Development and Research and Senior Faculty of The Rock Center for Corporate Governance since 2006. From 2005 to 2008, Professor of Accounting at the Graduate School of Business, Stanford University. Prior thereto, Ernst & Young Professor of Accounting at The Wharton School, University of Pennsylvania from 1985 to 2005. | Asset Allocation Trust | |||
| Olivia S. Mitchell (Born 1953) | Trustee, since 2006 | International Foundation of Employee Benefit Plans Professor, Wharton School of the University of Pennsylvania since 1993. Director of Wharton’s Pension Research Council and Boettner Center on Pensions & Retirement Research, and Research Associate at the National Bureau of Economic Research. Previously, Cornell University Professor from 1978 to 1993. | Asset Allocation Trust | |||
| Timothy J. Penny (Born 1951) | Trustee, since 1996 | President and CEO of Southern Minnesota Initiative Foundation, a non-profit organization, since 2007 and Senior Fellow at the Humphrey Institute Policy Forum at the University of Minnesota since 1995. Member of the Board of Trustees of NorthStar Education Finance, Inc., a non-profit organization, since 2007. | Asset Allocation Trust |
Table of Contents
| Other information (unaudited) | Wells Fargo Advantage VT Discovery Fund | 25 |
Name and year of birth | Position held and length of service* | Principal occupations during past five years | Other directorships during | |||
| Michael S. Scofield (Born 1943) | Trustee, since 2010 | Served on the Investment Company Institute’s Board of Governors and Executive Committee from 2008-2011 as well the Governing Council of the Independent Directors Council from 2006-2011 and the Independent Directors Council Executive Committee from 2008-2011. Chairman of the IDC from 2008-2010. Institutional Investor (Fund Directions) Trustee of Year in 2007. Trustee of the Evergreen Funds (and its predecessors) from 1984 to 2010. Chairman of the Evergreen Funds from 2000-2010. Former Trustee of the Mentor Funds. Retired Attorney, Law Offices of Michael S. Scofield. | Asset Allocation Trust | |||
| Donald C. Willeke (Born 1940) | Trustee, since 1996 | Principal of the law firm of Willeke & Daniels. General Counsel of the Minneapolis Employees Retirement Fund from 1984 until its consolidation into the Minnesota Public Employees Retirement Association on June 30, 2010. Director and Vice Chair of The Tree Trust (non-profit corporation). Director of the American Chestnut Foundation (non-profit corporation). | Asset Allocation Trust |
| * | Length of service dates reflect the Trustee’s commencement of service with the Trust’s predecessor entities, where applicable. |
Officers
Name and year of birth | Position held and length of service | Principal occupations during past five years | ||||
Karla M. Rabusch (Born 1959) | President, since 2003 | Executive Vice President of Wells Fargo Bank, N.A. and President of Wells Fargo Funds Management, LLC since 2003. | ||||
| Jeremy DePalma1 (Born 1974) | Treasurer, since 2012 | Senior Vice President of Wells Fargo Funds Management, LLC since 2009. Senior Vice President of Evergreen Investment Management Company, LLC from 2008 to 2010. Vice President, Evergreen Investment Services, Inc. from 2004 to 2007. Head of the Fund Reporting and Control Team within Fund Administration from 2005 to 2010. | ||||
| C. David Messman (Born 1960) | Secretary, since 2000; Chief Legal Officer, since 2003 | Senior Vice President and Secretary of Wells Fargo Funds Management, LLC since 2001. Vice President and Managing Counsel of Wells Fargo Bank, N.A. since 1996. | ||||
Debra Ann Early (Born 1964) | Chief Compliance Officer, since 2007 | Chief Compliance Officer of Wells Fargo Funds Management, LLC since 2007. Chief Compliance Officer of Parnassus Investments from 2005 to 2007. Chief Financial Officer of Parnassus Investments from 2004 to 2007. | ||||
David Berardi (Born 1975) | Assistant Treasurer, since 2009 | Vice President of Wells Fargo Funds Management, LLC since 2009. Vice President of Evergreen Investment Management Company, LLC from 2008 to 2010. Assistant Vice President of Evergreen Investment Services, Inc. from 2004 to 2008. Manager of Fund Reporting and Control for Evergreen Investment Management Company, LLC from 2004 to 2010. |
| 1. | Jeremy DePalma acts as Treasurer of 59 funds and Assistant Treasurer of 73 funds in the Fund Complex. |
| 2. | The Statement of Additional Information includes additional information about the Trustees and is available, without charge, upon request, by calling 1-800-222-8222 or by visiting the website at wellsfargoadvantagefunds.com. |
Table of Contents
| 26 | Wells Fargo Advantage VT Discovery Fund | List of abbreviations |
The following is a list of common abbreviations for terms and entities that may have appeared in this report.
| ACA | — ACA Financial Guaranty Corporation |
| ADR | — American depositary receipt |
| ADS | — American depositary shares |
| AGC | — Assured Guaranty Corporation |
| AGM | — Assured Guaranty Municipal |
| Ambac | — Ambac Financial Group Incorporated |
| AMT | — Alternative minimum tax |
| AUD | — Australian dollar |
| BAN | — Bond anticipation notes |
| BHAC | — Berkshire Hathaway Assurance Corporation |
| BRL | — Brazilian real |
| CAB | — Capital appreciation bond |
| CAD | — Canadian dollar |
| CCAB | — Convertible capital appreciation bond |
| CDA | — Community Development Authority |
| CDO | — Collateralized debt obligation |
| CHF | — Swiss franc |
| COP | — Certificate of participation |
| DKK | — Danish krone |
| DRIVER | — Derivative inverse tax-exempt receipts |
| DW&P | — Department of Water & Power |
| DWR | — Department of Water Resources |
| ECFA | — Educational & Cultural Facilities Authority |
| EDA | — Economic Development Authority |
| EDFA | — Economic Development Finance Authority |
| ETF | — Exchange-traded fund |
| EUR | — Euro |
| FDIC | — Federal Deposit Insurance Corporation |
| FFCB | — Federal Farm Credit Banks |
| FGIC | — Financial Guaranty Insurance Corporation |
| FHA | — Federal Housing Administration |
| FHLB | — Federal Home Loan Bank |
| FHLMC | — Federal Home Loan Mortgage Corporation |
| FICO | — The Financing Corporation |
| FNMA | — Federal National Mortgage Association |
| FSA | — Farm Service Agency |
| GBP | — Great British pound |
| GDR | — Global depositary receipt |
| GNMA | — Government National Mortgage Association |
| GO | — General obligation |
| HCFR | — Healthcare facilities revenue |
| HEFA | — Health & Educational Facilities Authority |
| HEFAR | — Higher education facilities authority revenue |
| HFA | — Housing Finance Authority |
| HFFA | — Health Facilities Financing Authority |
| HKD | — Hong Kong dollar |
| HUD | — Department of Housing and Urban Development |
| HUF | — Hungarian forint |
| IDA | — Industrial Development Authority |
| IDAG | — Industrial Development Agency |
| IDR | — Industrial development revenue |
| IEP | — Irish pound |
| JPY | — Japanese yen |
| KRW | — Republic of Korea won |
| LIBOR | — London Interbank Offered Rate |
| LIQ | — Liquidity agreement |
| LLC | — Limited liability company |
| LLP | — Limited liability partnership |
| LOC | — Letter of credit |
| LP | — Limited partnership |
| MBIA | — Municipal Bond Insurance Association |
| MFHR | — Multifamily housing revenue |
| MSTR | — Municipal securities trust receipts |
| MTN | — Medium-term note |
| MUD | — Municipal Utility District |
| MXN | — Mexican peso |
| MYR | — Malaysian ringgit |
| National | — National Public Finance Guarantee Corporation |
| NGN | — Nigerian naira |
| NOK | — Norwegian krone |
| NZD | — New Zealand dollar |
| PCFA | — Pollution Control Financing Authority |
| PCL | — Public Company Limited |
| PCR | — Pollution control revenue |
| PFA | — Public Finance Authority |
| PFFA | — Public Facilities Financing Authority |
| PFOTER | — Puttable floating option tax-exempt receipts |
| plc | — Public limited company |
| PLN | — Polish zloty |
| PUTTER | — Puttable tax-exempt receipts |
| R&D | — Research & development |
| Radian | — Radian Asset Assurance |
| RAN | — Revenue anticipation notes |
| RDA | — Redevelopment Authority |
| RDFA | — Redevelopment Finance Authority |
| REIT | — Real estate investment trust |
| ROC | — Reset option certificates |
| RON | — Romanian lei |
| RUB | — Russian ruble |
| SAVRS | — Select auction variable rate securities |
| SBA | — Small Business Authority |
| SEK | — Swedish krona |
| SFHR | — Single-family housing revenue |
| SFMR | — Single-family mortgage revenue |
| SGD | — Singapore dollar |
| SKK | — Slovakian koruna |
| SPA | — Standby purchase agreement |
| SPDR | — Standard & Poor’s Depositary Receipts |
| STRIPS | — Separate trading of registered interest and principal securities |
| TAN | — Tax anticipation notes |
| TBA | — To be announced |
| THB | — Thai baht |
| TIPS | — Treasury inflation-protected securities |
| TRAN | — Tax revenue anticipation notes |
| TRY | — Turkish lira |
| TTFA | — Transportation Trust Fund Authority |
| TVA | — Tennessee Valley Authority |
| ZAR | — South African rand |
Table of Contents
This page is intentionally left blank.
Table of Contents
This page is intentionally left blank.
Table of Contents


For more information
More information about Wells Fargo Advantage Funds is available free upon request. To obtain literature, please write, email, visit the Fund’s website, or call:
Wells Fargo Advantage Funds
P.O. Box 8266
Boston, MA 02266-8266
Email: wfaf@wellsfargo.com
Website: wellsfargoadvantagefunds.com
Individual investors: 1-800-222-8222
Retail investment professionals: 1-888-877-9275
Institutional investment professionals: 1-866-765-0778
This report and the financial statements contained herein are submitted for the general information of the shareholders of Wells Fargo Advantage Funds. If this report is used for promotional purposes, distribution of the report must be accompanied or preceded by a current prospectus. For a current prospectus and, if available, a summary prospectus containing more complete information, including charges and expenses, call 1-800-222-8222 or visit the Fund’s website at wellsfargoadvantagefunds.com . Please consider the investment objectives, risks, charges, and expenses of the investment carefully before investing. This and other information about Wells Fargo Advantage Funds can be found in the current prospectus. Read the prospectus carefully before you invest or send money.
Wells Fargo Funds Management, LLC, a wholly owned subsidiary of Wells Fargo & Company, provides investment advisory and administrative services for Wells Fargo Advantage Funds. Other affiliates of Wells Fargo & Company provide subadvisory and other services for the Funds. The Funds are distributed by Wells Fargo Funds Distributor, LLC, Member FINRA/SIPC, an affiliate of Wells Fargo & Company.
NOT FDIC INSURED ¡ NO BANK GUARANTEE ¡ MAY LOSE VALUE
© 2014 Wells Fargo Funds Management, LLC. All rights reserved.
222092 02-14 AVT1/AR147 12-13 |
Table of Contents

Wells Fargo Advantage
VT Index Asset Allocation Fund

Annual Report
December 31, 2013

Table of Contents
Reduce clutter. Save trees.
Sign up for electronic delivery of prospectuses and shareholder reports at wellsfargo.com/advantagedelivery
| 2 | ||||
| 4 | ||||
| 8 | ||||
| 9 | ||||
Financial statements | ||||
| 25 | ||||
| 26 | ||||
| 27 | ||||
| 28 | ||||
| 29 | ||||
| 35 | ||||
| 36 | ||||
| 39 | ||||
The views expressed and any forward-looking statements are as of December 31, 2013, unless otherwise noted, and are those of the Fund managers and/or Wells Fargo Funds Management, LLC. Discussions of individual securities, or the markets generally, or any Wells Fargo Advantage Fund are not intended as individual recommendations. Future events or results may vary significantly from those expressed in any forward-looking statements; the views expressed are subject to change at any time in response to changing circumstances in the market. Wells Fargo Funds Management, LLC and the Fund disclaim any obligation to publicly update or revise any views expressed or forward-looking statements.
NOT FDIC INSURED ¡ NO BANK GUARANTEE ¡ MAY LOSE VALUE
Table of Contents
| 2 | Wells Fargo Advantage VT Index Asset Allocation Fund | Letter to shareholders (unaudited) |

Karla M. Rabusch
President
Wells Fargo Advantage Funds
Major central banks continued to provide support to the economy with accommodative monetary policies.
Dear Valued Shareholder:
We are pleased to offer you this annual report for the Wells Fargo Advantage VT Index Asset Allocation Fund for the 12-month period that ended December 31, 2013. Much of the period was marked by monetary easing by major central banks around the world. Anticipation that the U.S. Federal Reserve (Fed) would end its bond-buying program led to higher interest rates, resulting in losses for bond indexes and volatility for global stock indexes. Growing confidence that the U.S. economy was gaining momentum resulted in double-digit returns for domestic stock market indexes for the 12-month reporting period. Longer-term interest rates stabilized after spiking higher earlier in the year, and short-term interest rates remained at ultra-low levels throughout the period.
Central banks continued to provide stimulus.
Major central banks continued to provide support to the economy with accommodative monetary policies. Throughout the reporting period, the Federal Open Market Committee (FOMC)—the Fed’s monetary policymaking body—kept its key interest rate near zero in order to support the economy and the financial system. Entering the reporting period, the FOMC had committed to purchase mortgage-backed securities to support the housing market and long-term U.S. Treasuries to keep interest rates low. The markets benefited from the FOMC’s liquidity, such that both stocks and bonds initially sold off after indications in May 2013 that the FOMC might reduce (or taper) its bond-buying program. In mid-December, however, the FOMC conveyed confidence in the strength of the economy by announcing it would begin tapering its bond-buying program by $10 billion in January 2014.
European markets continued to benefit from the European Central Bank’s (ECB’s) September 2012 announcement that it would purchase an unlimited amount of one- to three-year sovereign debt from countries that had formally applied for a bailout. As a result, when the tiny eurozone nation of Cyprus was forced to implement capital controls and impose losses on uninsured bank depositors in March 2013, global stock markets remained resilient despite short-term volatility. In May 2013, the ECB cut its key rate to a then-historic low of 0.5%. The ECB’s aggressive actions helped ease investor worries about a eurozone sovereign debt default. Given the substantial ties between the U.S. and Europe, the improved sentiment about the eurozone helped provide a tailwind for U.S. markets.
Better economic news propelled stocks higher, but higher interest rates caused bond prices to fall.
For most of the period, U.S. economic data remained moderately positive, gaining strength as the period progressed. Reported gross domestic product growth came in at a solid 1.1% annualized rate in the first quarter of 2013, a 2.5% annualized rate in the second quarter, a 4.1% annualized rate in the third quarter, and a 3.2% annualized rate (an advance estimate as of January 31, 2014) in the fourth quarter. The jobs picture continued to slowly improve as the unemployment rate declined from 7.9% to 6.7%. Meanwhile, inflation remained low.
The economy also seemed to shrug off uncertainties due to political wrangling in Washington, D.C., over the federal budget and debt limit. The Budget Control Act of 2011 mandated budget sequestration that took effect on March 1, 2013. At the end of its fiscal year, Congress was unable to pass a resolution to continue to fund the federal government, and thus the federal government underwent a partial shutdown from September 30, 2013, through October 16, 2013. The government reopened after the president and Congress reached a deal that funded the government through January 15, 2014, and raised the debt limit through
Table of Contents
| Letter to shareholders (unaudited) | Wells Fargo Advantage VT Index Asset Allocation Fund | 3 |
February 7, 2014. In December 2013, Congress passed the Ryan-Murray budget agreement that funded the government through fiscal 2015, lessening the near-term prospect of another shutdown.
Despite political headwinds, the relatively positive outlook for the U.S. economy contributed to a strong domestic stock market for most of the reporting period. On the bond front, 10-year Treasury bond yields nearly doubled in 2013, ending the year at a yield of 3.03%. Higher interest rates hurt bonds, especially longer-term Treasury securities that are most sensitive to interest-rate changes.
Don’t let short-term uncertainty derail long-term investment goals.
While periods of uncertainty can present challenges, they can also create opportunities, and experience has taught us that maintaining long-term investment goals can be an effective way to plan for the future. Although diversification cannot guarantee an investment profit or prevent losses, we believe it can be an effective way to manage investment risk and potentially smooth out overall portfolio performance. We encourage investors to know their investments and to understand that appropriate levels of risk-taking may unlock opportunities.
Thank you for choosing to invest with Wells Fargo Advantage Funds. We appreciate your confidence in us and remain committed to helping you meet your financial needs. For current information about your fund investments, contact your investment professional, visit our website at wellsfargoadvantagefunds.com, or call us directly at 1-800-222-8222. We are available 24 hours a day, 7 days a week.
Sincerely,

Karla M. Rabusch
President
Wells Fargo Advantage Funds
While periods of uncertainty can present challenges, they can also create opportunities, and experience has taught us that maintaining long-term investment goals can be an effective way to plan for the future.
Notice to shareholders
The Fund and Funds Management, LLC (“Funds Management”) have received an exemptive order from the SEC that permits Funds Management, subject to the approval of the Board of Trustees of the Fund, to select or replace certain subadvisers to manage all or a portion of the Fund’s assets and enter into, amend or terminate a sub-advisory agreement with certain subadvisers without obtaining shareholder approval (“Multi-manager Structure”). The Multi-manager Structure applies to subadvisers that are not affiliated with Funds Management or the Fund, except to the extent that affiliation arises solely because such subadvisers provide sub-advisory services to the Fund (“Non-affiliated Subadvisers”), as well as subadvisers that are indirect or direct wholly-owned subsidiaries of Funds Management or of another company that, indirectly or directly, wholly owns Funds Management (“Wholly-owned Subadvisers”).
Pursuant to the SEC order, Funds Management, with the approval of the Board of Trustees, has the discretion to terminate any subadvisers and allocate and reallocate the Fund’s assets among any other Non-affiliated Subadvisers or Wholly-owned Subadvisers. Funds Management, subject to oversight and supervision by the Board of Trustees, has responsibility to continue to oversee any subadvisers to the Fund and to recommend, for approval by the Board of Trustees, the hiring, termination and replacement of subadvisers for the Fund. In the event that a new subadviser is hired pursuant to the Multi-manager Structure, the Fund is required to provide notice to shareholders within 90 days.
Please contact your investment professional or call us directly at 1-800-222-8222 if you have any questions on this Notice to Shareholders.
Table of Contents
| 4 | Wells Fargo Advantage VT Index Asset Allocation Fund | Performance highlights (unaudited) |
Investment objective
The Fund seeks long-term total return, consisting of capital appreciation and current income.
Adviser
Wells Fargo Funds Management, LLC
Subadviser
Wells Capital Management Incorporated
Portfolio managers
Kandarp Acharya, CFA, FRM
Christian L. Chan, CFA
Average annual total returns1 (%) as of December 31, 2013
| Expense ratios1 (%) | ||||||||||||||||||||||
| Inception date | 1 year | 5 year | 10 year | Gross | Net2 | |||||||||||||||||
| Class 2 | 4-15-1994 | 19.63 | 13.50 | 6.34 | 1.13 | 1.00 | ||||||||||||||||
| Index Asset Allocation Composite Index3 | – | 11.90 | 11.48 | 7.53 | – | – | ||||||||||||||||
| Barclays U.S. Treasury 20+ Year Index4 | – | (13.88 | ) | 0.48 | 6.07 | – | – | |||||||||||||||
| S&P 500 Index5 | – | 32.39 | 17.94 | 7.41 | – | – | ||||||||||||||||
Figures quoted represent past performance, which is no guarantee of future results and do not reflect the deduction of taxes that a shareholder may pay on fund distributions or the redemption of fund shares. Investment return and principal value of an investment will fluctuate so that an investor’s shares, when redeemed, may be worth more or less than their original cost. Current performance may be lower or higher than the performance data quoted, which assumes the reinvestment of dividends and capital gains. Current month-end performance is available by calling 1-800-222-8222. Performance figures of the Fund do not reflect fees charged pursuant to the terms of variable life insurance policies and variable annuity contracts. If fees had been reflected, performance would have been lower.
Index returns do not include transaction costs associated with buying and selling securities, any mutual fund fees or expenses, or any taxes. It is not possible to invest directly in an index.
Balanced funds may invest in stocks and bonds. Stock values fluctuate in response to the activities of individual companies and general market and economic conditions. Bond values fluctuate in response to the financial condition of individual issuers, general market and economic conditions, and changes in interest rates. In general, when interest rates rise, bond values fall and investors may lose principal value. The use of derivatives may reduce returns and/or increase volatility. Consult the Fund’s prospectus for additional information on these and other risks.
Please refer to the prospectus provided by your participating insurance company for detailed information describing the separate accounts for information regarding surrender charges, mortality and expense risk fees, and other charges that may be assessed by the participating insurance companies.
Please see footnotes on page 5.
Table of Contents
| Performance highlights (unaudited) | Wells Fargo Advantage VT Index Asset Allocation Fund | 5 |
| Growth of $10,000 investment6 as of December 31, 2013 | ||
| ||

| 1. | Reflects the expense ratios as stated in the most recent prospectus. |
| 2. | The Adviser has committed through April 30, 2014, to waive fees and/or reimburse expenses to the extent necessary to cap the Fund’s Total Annual Fund Operating Expenses After Fee Waiver, excluding certain expenses, at the amount shown. Brokerage commissions, stamp duty fees, interest, taxes, acquired fund fees and expenses, and extraordinary expenses are excluded from the cap. Without this cap, the Fund’s returns would have been lower. |
| 3. | Source: Wells Fargo Funds Management, LLC. The Index Asset Allocation Composite Index is weighted 40% in the Barclays U.S. Treasury 20+ Year Index and 60% in the S&P 500 Index. You cannot invest directly in an index. |
| 4. | The Barclays U.S. Treasury 20+ Year Index is an unmanaged index composed of securities in the U.S. Treasury Index with maturities of 20 years or greater. You cannot invest directly in an index. |
| 5. | The S&P 500 Index consists of 500 stocks chosen for market size, liquidity, and industry group representation. It is a market-value-weighted index with each stock’s weight in the index proportionate to its market value. You cannot invest directly in an index. |
| 6. | The chart compares the performance of Class 2 shares for the most recent ten years with the S&P 500 Index, the Barclays U.S. Treasury 20+ Year Index, and the Index Asset Allocation Composite Index. The chart assumes a hypothetical $10,000 investment and reflects all operating expenses of the Fund. Performance figures of the Fund do not reflect fees charged pursuant to the terms of variable life insurance policies and variable annuity contracts. |
| 7. | The ten largest holdings are calculated based on the value of the securities divided by total net assets of the Fund. Holdings are subject to change and may have changed since the date specified. |
| 8. | Target allocations are subject to change. Cash and cash equivalents are not reflected in the calculations of target allocations. Neutral target allocation is the target allocation of the Fund as stated in the Fund’s prospectus. Current target allocation is the current allocation of the Fund based on our Tactical Asset Allocation Model as of the date specified and is subject to change |
| 9. | Equity sector distribution is subject to change and is calculated based on the total long-term equity investments of the Fund. |
Table of Contents
| 6 | Wells Fargo Advantage VT Index Asset Allocation Fund | Performance highlights (unaudited) |
MANAGER’S DISCUSSION
Fund highlights
| n | The Fund outperformed the Index Asset Allocation Composite Index and the Barclays U.S. Treasury 20+ Year Index benchmarks but underperformed the S&P 500 Index for the 12-month period that ended December 31, 2013. |
| n | The Fund’s tactical overweight in stocks contributed positively to the performance of the Fund as the S&P 500 Index outperformed long-term U.S. Treasury bonds by a wide margin. For the 12-month period, the S&P 500 Index rose by 32.4% and the Barclays U.S. Treasury 20+ Year Index lost 13.9%. |
Renewed optimism propelled stocks higher during the year.
Equity markets soared during the 12-month period, as better economic conditions and a continued accommodative monetary policy by the Federal Reserve boosted confidence among investors. The unemployment rate, although still above precrisis levels, declined steadily throughout the year, while housing prices rose. As 2013 came to a close, it appeared as if the economic recovery was on a sustainable path, and the performance of equity markets during the year undoubtedly reflected a higher level of optimism among investors. With the exception of emerging markets, most equity markets posted double-digit returns. The S&P 500 Index closed out the year with a 32% gain—its best calendar year performance since 1997. Meanwhile, U.S. Treasury yields rose sharply, pushing bond market returns into negative territory for the year.
| Ten largest holdings7 (%) as of December 31, 2013 | ||||
U.S. Treasury Bond, 4.38%, 5-15-2040 | 2.43 | |||
U.S. Treasury Bond, 3.75%, 8-15-2041 | 2.36 | |||
U.S. Treasury Bond, 4.25%, 11-15-2040 | 2.35 | |||
U.S. Treasury Bond, 4.63%, 2-15-2040 | 2.31 | |||
U.S. Treasury Bond, 4.38%, 11-15-2039 | 2.16 | |||
U.S. Treasury Bond, 3.88%, 8-15-2040 | 1.97 | |||
U.S. Treasury Bond, 4.38% 5-15-2041 | 1.96 | |||
Apple Incorporated | 1.95 | |||
U.S. Treasury Bond, 4.75%, 2-15-2041 | 1.83 | |||
U.S. Treasury Bond, 3.13%, 11-15-2041 | 1.71 | |||
The tactical shift toward stocks contributed positively to performance, as the S&P 500 Index outperformed long-term U.S. Treasury bonds for the 12-month period.
During the period, the Fund employed a Tactical Asset Allocation (TAA) Model, which seeks to enhance returns by shifting the effective allocations based on the relative attractiveness of stocks and bonds. The Fund’s stock holdings seek to replicate the holdings of the S&P 500 Index, and its bond holdings seek to replicate the holdings of the Barclays U.S. Treasury 20+ Year Index. The Fund maintained its equity overweight throughout the year, with a targeted allocation of 68% stocks and 32% bonds as of year-end. Because of price fluctuations, the
Fund’s actual allocation on a particular day may have differed slightly from the target allocation. The emphasis on stocks contributed positively to the relative performance during the past year as U.S. stocks handsomely outperformed U.S. Treasury bonds. The Fund’s neutral target allocation is 60% stocks and 40% bonds.
| Neutral target allocation8 as of December 31, 2013 | ||
| ||
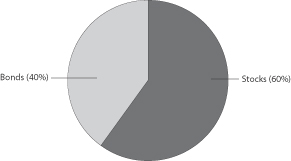
| Current target allocation8 as of December 31, 2013 | ||
| ||
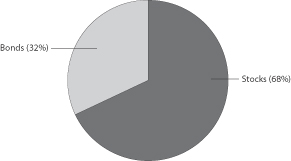
Please see footnotes on page 5.
Table of Contents
| Performance highlights (unaudited) | Wells Fargo Advantage VT Index Asset Allocation Fund | 7 |
The TAA Model continued to favor stocks relative to bonds at the close of the period.
The model is a relative-value model, measuring the expected returns on stocks versus the expected returns on bonds. Given historically low Treasury yields and reasonably priced equity markets, the model continued to favor stocks at the close of the period. The Fund changed portfolio managers on September 30, 2013. The new portfolio managers intend to continue to use the TAA Model but may also consider additional factors, such as monetary policy, growth prospects, valuations, and market sentiment.
| Equity sector distribution9 as of December 31, 2013 | ||
| ||

Please see footnotes on page 5.
Table of Contents
| 8 | Wells Fargo Advantage VT Index Asset Allocation Fund | Fund expenses (unaudited) |
As a shareholder of the Fund, you incur ongoing costs, including management fees, distribution (12b-1) fees, and other Fund expenses. This example is intended to help you understand your ongoing costs (in dollars) of investing in the Fund and to compare these costs with the ongoing costs of investing in other mutual funds.
The example is based on an investment of $1,000 invested at the beginning of the six-month period and held for the entire period from July 1, 2013 to December 31, 2013.
Actual expenses
The “Actual” line of the table below provides information about actual account values and actual expenses. You
may use the information in this line, together with the amount you invested, to estimate the expenses that you paid over the period. Simply divide your account value by $1,000 (for example, an $8,600 account value divided by $1,000 = 8.6), then multiply the result by the number in the “Actual” line under the heading entitled “Expenses Paid During Period” for your applicable class of shares to estimate the expenses you paid on your account during this period.
Hypothetical example for comparison purposes
The “Hypothetical” line of the table below provides information about hypothetical account values and hypothetical expenses based on the Fund’s actual expense ratio and an assumed rate of return of 5% per year before expenses, which is not the Fund’s actual return. The hypothetical account values and expenses may not be used to estimate the actual ending account balance or expenses you paid for the period. You may use this information to compare the ongoing costs of investing in the Fund and other funds. To do so, compare this 5% hypothetical example with the 5% hypothetical examples that appear in the shareholder reports of the other funds.
Please note that the expenses shown in the table are meant to highlight your ongoing costs only and do not reflect any separate account charges assessed by participating insurance companies. Therefore, the “Hypothetical” line of the table is useful in comparing ongoing costs only, and will not help you determine the relative total costs of owning different funds. In addition, if these separate account charges assessed by participating insurance companies were included, your costs would have been higher.
| Beginning account value 7-1-2013 | Ending account value 12-31-2013 | Expenses paid during the period1 | Net annual expense ratio | |||||||||||||
Class 2 | ||||||||||||||||
Actual | $ | 1,000.00 | $ | 1,091.96 | $ | 5.27 | 1.00 | % | ||||||||
Hypothetical (5% return before expenses) | $ | 1,000.00 | $ | 1,020.16 | $ | 5.09 | 1.00 | % | ||||||||
| 1. | Expenses paid is equal to the annualized expense ratio multiplied by the average account value over the period, multiplied by the number of days in the most recent fiscal half-year divided by the number of days in the fiscal year (to reflect the one-half year period). |
Table of Contents
| Portfolio of investments—December 31, 2013 | Wells Fargo Advantage VT Index Asset Allocation Fund | 9 |
| Security name | Shares | Value | ||||||||||
Common Stocks: 61.56% | ||||||||||||
Consumer Discretionary: 7.67% | ||||||||||||
| Auto Components: 0.27% | ||||||||||||
BorgWarner Incorporated | 746 | $ | 41,709 | |||||||||
Delphi Automotive plc | 922 | 55,440 | ||||||||||
Johnson Controls Incorporated | 2,234 | 114,604 | ||||||||||
The Goodyear Tire & Rubber Company | 811 | 19,342 | ||||||||||
| 231,095 | ||||||||||||
|
| |||||||||||
| Automobiles: 0.45% | ||||||||||||
Ford Motor Company | 12,530 | 193,338 | ||||||||||
General Motors Company † | 3,709 | 151,587 | ||||||||||
Harley-Davidson Incorporated | 722 | 49,991 | ||||||||||
| 394,916 | ||||||||||||
|
| |||||||||||
| Distributors: 0.05% | ||||||||||||
Genuine Parts Company | 502 | 41,761 | ||||||||||
|
| |||||||||||
| Diversified Consumer Services: 0.03% | ||||||||||||
H&R Block Incorporated | 892 | 25,904 | ||||||||||
|
| |||||||||||
| Hotels, Restaurants & Leisure: 1.07% | ||||||||||||
Carnival Corporation | 1,427 | 57,323 | ||||||||||
Chipotle Mexican Grill Incorporated † | 99 | 52,745 | ||||||||||
Darden Restaurants Incorporated | 448 | 24,358 | ||||||||||
International Game Technology | 816 | 14,819 | ||||||||||
Marriott International Incorporated Class A | 728 | 35,934 | ||||||||||
McDonald’s Corporation | 3,210 | 311,466 | ||||||||||
Starbucks Corporation | 2,457 | 192,604 | ||||||||||
Starwood Hotels & Resorts Worldwide Incorporated | 617 | 49,021 | ||||||||||
Wyndham Worldwide Corporation | 418 | 30,802 | ||||||||||
Wynn Resorts Limited | 261 | 50,689 | ||||||||||
Yum! Brands Incorporated | 1,451 | 109,710 | ||||||||||
| 929,471 | ||||||||||||
|
| |||||||||||
| Household Durables: 0.25% | ||||||||||||
D.R. Horton Incorporated | 943 | 21,048 | ||||||||||
Garmin Limited « | 398 | 18,396 | ||||||||||
Harman International Industries Incorporated | 218 | 17,843 | ||||||||||
Leggett & Platt Incorporated | 463 | 14,325 | ||||||||||
Lennar Corporation | 560 | 22,154 | ||||||||||
Mohawk Industries Incorporated † | 203 | 30,227 | ||||||||||
Newell Rubbermaid Incorporated | 935 | 30,303 | ||||||||||
Pulte Homes Incorporated | 1,179 | 24,016 | ||||||||||
Whirlpool Corporation | 255 | 39,999 | ||||||||||
| 218,311 | ||||||||||||
|
| |||||||||||
| Internet & Catalog Retail: 0.92% | ||||||||||||
Amazon.com Incorporated † | 1,201 | 478,947 | ||||||||||
Expedia Incorporated | 338 | 23,545 | ||||||||||
The accompanying notes are an integral part of these financial statements.
Table of Contents
| 10 | Wells Fargo Advantage VT Index Asset Allocation Fund | Portfolio of investments—December 31, 2013 |
| Security name | Shares | Value | ||||||||||
| Internet & Catalog Retail (continued) | ||||||||||||
Netflix Incorporated † | 194 | $ | 71,425 | |||||||||
priceline.com Incorporated † | 165 | 191,796 | ||||||||||
TripAdvisor Incorporated † | 359 | 29,736 | ||||||||||
| 795,449 | ||||||||||||
|
| |||||||||||
| Leisure Equipment & Products: 0.09% | ||||||||||||
Hasbro Incorporated | 378 | 20,794 | ||||||||||
Mattel Incorporated | 1,105 | 52,576 | ||||||||||
| 73,370 | ||||||||||||
|
| |||||||||||
| Media: 2.30% | ||||||||||||
Cablevision Systems Corporation New York Group Class A | 706 | 12,659 | ||||||||||
CBS Corporation Class B | 1,837 | 117,090 | ||||||||||
Comcast Corporation Class A | 8,447 | 438,948 | ||||||||||
DIRECTV Group Incorporated † | 1,590 | 109,853 | ||||||||||
Discovery Communications Incorporated Class A † | 735 | 66,459 | ||||||||||
Gannett Company Incorporated | 757 | 22,392 | ||||||||||
Graham Holdings Company Class B | 14 | 9,286 | ||||||||||
Interpublic Group of Companies Incorporated | 1,354 | 23,966 | ||||||||||
News Corporation Class A † | 1,622 | 29,228 | ||||||||||
Omnicom Group Incorporated | 829 | 61,653 | ||||||||||
Scripps Networks Interactive Incorporated | 355 | 30,676 | ||||||||||
Time Warner Cable Incorporated | 911 | 123,441 | ||||||||||
Time Warner Incorporated | 2,940 | 204,977 | ||||||||||
Twenty-First Century Fox Incorporated | 6,408 | 225,433 | ||||||||||
Viacom Incorporated Class B | 1,332 | 116,337 | ||||||||||
Walt Disney Company | 5,348 | 408,587 | ||||||||||
| 2,000,985 | ||||||||||||
|
| |||||||||||
| Multiline Retail: 0.43% | ||||||||||||
Dollar General Corporation † | 976 | 58,872 | ||||||||||
Dollar Tree Incorporated † | 679 | 38,309 | ||||||||||
Family Dollar Stores Incorporated | 316 | 20,531 | ||||||||||
Kohl’s Corporation | 657 | 37,285 | ||||||||||
Macy’s Incorporated | 1,204 | 64,294 | ||||||||||
Nordstrom Incorporated | 465 | 28,737 | ||||||||||
Target Corporation | 2,023 | 127,995 | ||||||||||
| 376,023 | ||||||||||||
|
| |||||||||||
| Specialty Retail: 1.36% | ||||||||||||
AutoNation Incorporated † | 208 | 10,336 | ||||||||||
AutoZone Incorporated † | 109 | 52,095 | ||||||||||
Bed Bath & Beyond Incorporated † | 703 | 56,451 | ||||||||||
Best Buy Company Incorporated | 905 | 36,091 | ||||||||||
CarMax Incorporated † | 712 | 33,478 | ||||||||||
GameStop Corporation Class A | 387 | 19,064 | ||||||||||
Gap Incorporated | 856 | 33,452 | ||||||||||
Home Depot Incorporated | 4,582 | 377,282 | ||||||||||
L Brands Incorporated | 787 | 48,676 | ||||||||||
Lowe’s Companies Incorporated | 3,411 | 169,015 | ||||||||||
The accompanying notes are an integral part of these financial statements.
Table of Contents
| Portfolio of investments—December 31, 2013 | Wells Fargo Advantage VT Index Asset Allocation Fund | 11 |
| Security name | Shares | Value | ||||||||||
| Specialty Retail (continued) | ||||||||||||
O’Reilly Automotive Incorporated † | 345 | $ | 44,405 | |||||||||
PetSmart Incorporated | 335 | 24,371 | ||||||||||
Ross Stores Incorporated | 699 | 52,376 | ||||||||||
Staples Incorporated | 2,162 | 34,354 | ||||||||||
Tiffany & Company | 355 | 32,937 | ||||||||||
TJX Companies Incorporated | 2,307 | 147,025 | ||||||||||
Urban Outfitters Incorporated † | 356 | 13,208 | ||||||||||
| 1,184,616 | ||||||||||||
|
| |||||||||||
| Textiles, Apparel & Luxury Goods: 0.45% | ||||||||||||
Coach Incorporated | 907 | 50,910 | ||||||||||
Fossil Group Incorporated † | 160 | 19,190 | ||||||||||
Michael Kors Holdings Limited † | 558 | 45,304 | ||||||||||
Nike Incorporated Class B | 2,408 | 189,365 | ||||||||||
PVH Corporation | 270 | 36,725 | ||||||||||
Ralph Lauren Corporation | 192 | 33,901 | ||||||||||
VF Corporation | 282 | 17,580 | ||||||||||
| 392,975 | ||||||||||||
|
| |||||||||||
Consumer Staples: 5.97% | ||||||||||||
| Beverages: 1.33% | ||||||||||||
Beam Incorporated | 525 | 35,732 | ||||||||||
Brown-Forman Corporation Class B | 523 | 39,523 | ||||||||||
Coca-Cola Enterprises Incorporated | 780 | 34,421 | ||||||||||
Constellation Brands Incorporated Class A † | 538 | 37,864 | ||||||||||
Dr Pepper Snapple Group Incorporated | 645 | 31,424 | ||||||||||
Molson Coors Brewing Company | 511 | 28,693 | ||||||||||
Monster Beverage Corporation † | 445 | 30,158 | ||||||||||
PepsiCo Incorporated | 4,961 | 411,465 | ||||||||||
The Coca-Cola Company | 12,315 | 508,733 | ||||||||||
| 1,158,013 | ||||||||||||
|
| |||||||||||
| Food & Staples Retailing: 1.43% | ||||||||||||
Costco Wholesale Corporation | 1,414 | 168,280 | ||||||||||
CVS Caremark Corporation | 3,873 | 277,191 | ||||||||||
Safeway Incorporated | 785 | 25,567 | ||||||||||
Sysco Corporation | 1,882 | 67,940 | ||||||||||
The Kroger Company | 1,690 | 66,806 | ||||||||||
Wal-Mart Stores Incorporated | 5,260 | 413,909 | ||||||||||
Walgreen Company | 2,744 | 157,615 | ||||||||||
Whole Foods Market Incorporated | 1,176 | 68,008 | ||||||||||
| 1,245,316 | ||||||||||||
|
| |||||||||||
| Food Products: 0.96% | ||||||||||||
Archer Daniels Midland Company | 2,111 | 91,617 | ||||||||||
Campbell Soup Company | 581 | 25,146 | ||||||||||
ConAgra Foods Incorporated | 1,354 | 45,630 | ||||||||||
General Mills Incorporated | 2,045 | 102,066 | ||||||||||
Hormel Foods Corporation | 435 | 19,649 | ||||||||||
JM Smucker Company | 338 | 35,024 | ||||||||||
The accompanying notes are an integral part of these financial statements.
Table of Contents
| 12 | Wells Fargo Advantage VT Index Asset Allocation Fund | Portfolio of investments—December 31, 2013 |
| Security name | Shares | Value | ||||||||||
| Food Products (continued) | ||||||||||||
Kellogg Company | 829 | $ | 50,627 | |||||||||
Kraft Foods Group Incorporated | 1,925 | 103,796 | ||||||||||
McCormick & Company Incorporated | 425 | 29,291 | ||||||||||
Mead Johnson Nutrition Company | 655 | 54,863 | ||||||||||
Mondelez International Incorporated Class A | 5,675 | 200,328 | ||||||||||
The Hershey Company | 480 | 46,670 | ||||||||||
Tyson Foods Incorporated Class A | 881 | 29,478 | ||||||||||
| 834,185 | ||||||||||||
|
| |||||||||||
| Household Products: 1.22% | ||||||||||||
Clorox Company | 415 | 38,495 | ||||||||||
Colgate-Palmolive Company | 2,837 | 185,001 | ||||||||||
Kimberly-Clark Corporation | 1,226 | 128,068 | ||||||||||
Procter & Gamble Company | 8,732 | 710,872 | ||||||||||
| 1,062,436 | ||||||||||||
|
| |||||||||||
| Personal Products: 0.10% | ||||||||||||
Avon Products Incorporated | 1,396 | 24,039 | ||||||||||
Estee Lauder Companies Incorporated Class A | 832 | 62,666 | ||||||||||
| 86,705 | ||||||||||||
|
| |||||||||||
| Tobacco: 0.93% | ||||||||||||
Altria Group Incorporated | 6,394 | 245,466 | ||||||||||
Lorillard Incorporated | 1,198 | 60,715 | ||||||||||
Philip Morris International | 5,163 | 449,852 | ||||||||||
Reynolds American Incorporated | 1,015 | 50,740 | ||||||||||
| 806,773 | ||||||||||||
|
| |||||||||||
Energy: 6.31% | ||||||||||||
| Energy Equipment & Services: 1.15% | ||||||||||||
Baker Hughes Incorporated | 1,428 | 78,911 | ||||||||||
Cameron International Corporation † | 766 | 45,600 | ||||||||||
Diamond Offshore Drilling Incorporated | 223 | 12,693 | ||||||||||
Ensco plc Class A | 753 | 43,057 | ||||||||||
FMC Technologies Incorporated † | 755 | 39,419 | ||||||||||
Halliburton Company | 2,729 | 138,497 | ||||||||||
Helmerich & Payne Incorporated | 344 | 28,924 | ||||||||||
Nabors Industries Limited | 838 | 14,238 | ||||||||||
National Oilwell Varco Incorporated | 1,373 | 109,195 | ||||||||||
Noble Corp plc | 814 | 30,501 | ||||||||||
Rowan Companies plc † | 403 | 14,250 | ||||||||||
Schlumberger Limited | 4,260 | 383,869 | ||||||||||
Transocean Limited | 1,100 | 54,362 | ||||||||||
| 993,516 | ||||||||||||
|
| |||||||||||
| Oil, Gas & Consumable Fuels: 5.16% | ||||||||||||
Anadarko Petroleum Corporation | 1,621 | 128,578 | ||||||||||
Apache Corporation | 1,284 | 110,347 | ||||||||||
The accompanying notes are an integral part of these financial statements.
Table of Contents
| Portfolio of investments—December 31, 2013 | Wells Fargo Advantage VT Index Asset Allocation Fund | 13 |
| Security name | Shares | Value | ||||||||||
| Oil, Gas & Consumable Fuels (continued) | ||||||||||||
Cabot Oil & Gas Corporation | 1,366 | $ | 52,946 | |||||||||
Chesapeake Energy Corporation | 1,653 | 44,862 | ||||||||||
Chevron Corporation | 6,219 | 776,815 | ||||||||||
ConocoPhillips Company | 3,942 | 278,502 | ||||||||||
CONSOL Energy Incorporated | 733 | 27,883 | ||||||||||
Denbury Resources Incorporated † | 1,193 | 19,601 | ||||||||||
Devon Energy Corporation | 1,231 | 76,162 | ||||||||||
EOG Resources Incorporated | 877 | 147,196 | ||||||||||
EQT Corporation | 491 | 44,082 | ||||||||||
Exxon Mobil Corporation | 14,100 | 1,426,920 | ||||||||||
Hess Corporation | 920 | 76,360 | ||||||||||
Kinder Morgan Incorporated | 2,193 | 78,948 | ||||||||||
Marathon Oil Corporation | 2,253 | 79,531 | ||||||||||
Marathon Petroleum Corporation | 990 | 90,813 | ||||||||||
Murphy Oil Corporation | 569 | 36,917 | ||||||||||
Newfield Exploration Company † | 442 | 10,886 | ||||||||||
Noble Energy Incorporated | 1,156 | 78,735 | ||||||||||
Occidental Petroleum Corporation | 2,618 | 248,972 | ||||||||||
Peabody Energy Corporation | 874 | 17,069 | ||||||||||
Phillips 66 | 1,948 | 150,249 | ||||||||||
Pioneer Natural Resources Company | 455 | 83,752 | ||||||||||
QEP Resources Incorporated | 589 | 18,053 | ||||||||||
Range Resources Corporation | 532 | 44,853 | ||||||||||
Southwestern Energy Company † | 1,156 | 45,465 | ||||||||||
Spectra Energy Corporation | 2,186 | 77,865 | ||||||||||
Tesoro Corporation | 445 | 26,033 | ||||||||||
The Williams Companies Incorporated | 2,244 | 86,551 | ||||||||||
Valero Energy Corporation | 1,776 | 89,510 | ||||||||||
WPX Energy Incorporated † | 653 | 13,308 | ||||||||||
| 4,487,764 | ||||||||||||
|
| |||||||||||
Financials: 9.94% | ||||||||||||
| Capital Markets: 1.38% | ||||||||||||
Ameriprise Financial Incorporated | 636 | 73,172 | ||||||||||
Bank of New York Mellon Corporation | 3,767 | 131,619 | ||||||||||
BlackRock Incorporated | 412 | 130,386 | ||||||||||
Charles Schwab Corporation | 3,763 | �� | 97,838 | |||||||||
E*TRADE Financial Corporation † | 935 | 18,363 | ||||||||||
Franklin Resources Incorporated | 1,312 | 75,742 | ||||||||||
Goldman Sachs Group Incorporated | 1,373 | 243,378 | ||||||||||
Invesco Limited | 1,450 | 52,780 | ||||||||||
Legg Mason Incorporated | 346 | 15,044 | ||||||||||
Morgan Stanley | 4,505 | 141,277 | ||||||||||
Northern Trust Corporation | 732 | 45,303 | ||||||||||
State Street Corporation | 1,432 | 105,094 | ||||||||||
T. Rowe Price Group Incorporated | 848 | 71,037 | ||||||||||
| 1,201,033 | ||||||||||||
|
| |||||||||||
The accompanying notes are an integral part of these financial statements.
Table of Contents
| 14 | Wells Fargo Advantage VT Index Asset Allocation Fund | Portfolio of investments—December 31, 2013 |
| Security name | Shares | Value | ||||||||||
| Commercial Banks: 1.73% | ||||||||||||
Branch Banking & Trust Corporation | 2,314 | $ | 86,358 | |||||||||
Comerica Incorporated | 596 | 28,334 | ||||||||||
Fifth Third Bancorp | 2,873 | 60,419 | ||||||||||
Huntington Bancshares Incorporated | 2,702 | 26,074 | ||||||||||
KeyCorp | 2,929 | 39,307 | ||||||||||
M&T Bank Corporation | 424 | 49,362 | ||||||||||
PNC Financial Services Group Incorporated | 1,735 | 134,601 | ||||||||||
Regions Financial Corporation | 4,542 | 44,920 | ||||||||||
SunTrust Banks Incorporated | 1,748 | 64,344 | ||||||||||
US Bancorp | 5,969 | 241,148 | ||||||||||
Wells Fargo & Company (l) | 15,585 | 707,559 | ||||||||||
Zions Bancorporation | 607 | 18,186 | ||||||||||
| 1,500,612 | ||||||||||||
|
| |||||||||||
| Consumer Finance: 0.62% | ||||||||||||
American Express Company | 3,003 | 272,462 | ||||||||||
Capital One Financial Corporation | 1,870 | 143,261 | ||||||||||
Discover Financial Services | 1,549 | 86,667 | ||||||||||
SLM Corporation | 1,410 | 37,055 | ||||||||||
| 539,445 | ||||||||||||
|
| |||||||||||
| Diversified Financial Services: 3.21% | ||||||||||||
Bank of America Corporation | 34,686 | 540,061 | ||||||||||
Berkshire Hathaway Incorporated Class B † | 5,892 | 698,556 | ||||||||||
Citigroup Incorporated | 9,844 | 512,971 | ||||||||||
CME Group Incorporated | 1,011 | 79,323 | ||||||||||
IntercontinentalExchange Group Incorporated | 374 | 84,120 | ||||||||||
JPMorgan Chase & Company | 12,268 | 717,433 | ||||||||||
Leucadia National Corporation | 1,020 | 28,907 | ||||||||||
McGraw-Hill Financial Incorporated | 878 | 68,660 | ||||||||||
Moody’s Corporation | 611 | 47,945 | ||||||||||
The NASDAQ OMX Group Incorporated | 371 | 14,766 | ||||||||||
| 2,792,742 | ||||||||||||
|
| |||||||||||
| Insurance: 1.85% | ||||||||||||
ACE Limited | 1,105 | 114,401 | ||||||||||
AFLAC Incorporated | 1,523 | 101,736 | ||||||||||
Allstate Corporation | 1,469 | 80,119 | ||||||||||
American International Group Incorporated | 4,780 | 244,019 | ||||||||||
Aon plc | 970 | 81,373 | ||||||||||
Assurant Incorporated | 235 | 15,597 | ||||||||||
Chubb Corporation | 815 | 78,753 | ||||||||||
Cincinnati Financial Corporation | 477 | 24,980 | ||||||||||
Genworth Financial Incorporated † | 1,617 | 25,112 | ||||||||||
Lincoln National Corporation | 851 | 43,929 | ||||||||||
Loews Corporation | 992 | 47,854 | ||||||||||
Marsh & McLennan Companies Incorporated | 1,772 | 85,694 | ||||||||||
MetLife Incorporated | 3,627 | 195,568 | ||||||||||
Principal Financial Group Incorporated | 894 | 44,083 | ||||||||||
The accompanying notes are an integral part of these financial statements.
Table of Contents
| Portfolio of investments—December 31, 2013 | Wells Fargo Advantage VT Index Asset Allocation Fund | 15 |
| Security name | Shares | Value | ||||||||||
| Insurance (continued) | ||||||||||||
Prudential Financial Incorporated | 1,499 | $ | 138,238 | |||||||||
The Hartford Financial Services Group Incorporated | 1,467 | 53,149 | ||||||||||
The Progressive Corporation | 1,785 | 48,677 | ||||||||||
The Travelers Companies Incorporated | 1,176 | 106,475 | ||||||||||
Torchmark Corporation | 293 | 22,898 | ||||||||||
UnumProvident Corporation | 853 | 29,923 | ||||||||||
XL Group plc | 921 | 29,325 | ||||||||||
| 1,611,903 | ||||||||||||
|
| |||||||||||
| Real Estate Management & Development: 0.03% | ||||||||||||
CBRE Group Incorporated † | 906 | 23,828 | ||||||||||
|
| |||||||||||
| REITs: 1.09% | ||||||||||||
American Tower Corporation | 1,283 | 102,409 | ||||||||||
Apartment Investment & Management Company Class A | 469 | 12,152 | ||||||||||
AvalonBay Communities Incorporated | 390 | 46,110 | ||||||||||
Boston Properties Incorporated | 495 | 49,683 | ||||||||||
Equity Residential | 1,081 | 56,071 | ||||||||||
HCP Incorporated | 1,481 | 53,790 | ||||||||||
Health Care REIT Incorporated | 930 | 49,820 | ||||||||||
Host Hotels & Resorts Incorporated | 2,473 | 48,075 | ||||||||||
Kimco Realty Corporation | 1,318 | 26,031 | ||||||||||
Plum Creek Timber Company | 573 | 26,650 | ||||||||||
Prologis Incorporated | 1,619 | 59,822 | ||||||||||
Public Storage Incorporated | 466 | 70,142 | ||||||||||
Simon Property Group Incorporated | 998 | 151,856 | ||||||||||
The Macerich Company | 457 | 26,913 | ||||||||||
Ventas Incorporated | 947 | 54,244 | ||||||||||
Vornado Realty Trust | 564 | 50,078 | ||||||||||
Weyerhaeuser Company | 1,879 | 59,320 | ||||||||||
| 943,166 | ||||||||||||
|
| |||||||||||
| Thrifts & Mortgage Finance: 0.03% | ||||||||||||
Hudson City Bancorp Incorporated | 1,547 | 14,588 | ||||||||||
People’s United Financial Incorporated | 1,044 | 15,785 | ||||||||||
| 30,373 | ||||||||||||
|
| |||||||||||
Health Care: 7.98% | ||||||||||||
| Biotechnology: 1.50% | ||||||||||||
Alexion Pharmaceuticals Incorporated † | 635 | 84,493 | ||||||||||
Amgen Incorporated | 2,423 | 276,610 | ||||||||||
Biogen Idec Incorporated † | 762 | 213,170 | ||||||||||
Celgene Corporation † | 1,338 | 226,068 | ||||||||||
Gilead Sciences Incorporated † | 4,987 | 374,773 | ||||||||||
Regeneron Pharmaceuticals Incorporated † | 253 | 69,636 | ||||||||||
Vertex Pharmaceuticals Incorporated † | 773 | 57,434 | ||||||||||
| 1,302,184 | ||||||||||||
|
| |||||||||||
| Health Care Equipment & Supplies: 1.26% | ||||||||||||
Abbott Laboratories | 5,078 | 194,640 | ||||||||||
The accompanying notes are an integral part of these financial statements.
Table of Contents
| 16 | Wells Fargo Advantage VT Index Asset Allocation Fund | Portfolio of investments—December 31, 2013 |
| Security name | Shares | Value | ||||||||||
| Health Care Equipment & Supplies (continued) | ||||||||||||
Baxter International Incorporated | 1,768 | $ | 122,964 | |||||||||
Becton Dickinson & Company | 630 | 69,609 | ||||||||||
Boston Scientific Corporation † | 4,364 | 52,455 | ||||||||||
C.R. Bard Incorporated | 252 | 33,753 | ||||||||||
CareFusion Corporation † | 685 | 27,277 | ||||||||||
Covidien plc | 1,490 | 101,469 | ||||||||||
DENTSPLY International Incorporated | 464 | 22,495 | ||||||||||
Edwards Lifesciences Corporation † | 355 | 23,345 | ||||||||||
Intuitive Surgical Incorporated † | 125 | 48,010 | ||||||||||
Medtronic Incorporated | 3,257 | 186,919 | ||||||||||
St. Jude Medical Incorporated | 951 | 58,914 | ||||||||||
Stryker Corporation | 957 | 71,909 | ||||||||||
Varian Medical Systems Incorporated † | 342 | 26,570 | ||||||||||
Zimmer Holdings Incorporated | 557 | 51,907 | ||||||||||
| 1,092,236 | ||||||||||||
|
| |||||||||||
| Health Care Providers & Services: 1.26% | ||||||||||||
Aetna Incorporated | 1,196 | 82,034 | ||||||||||
AmerisourceBergen Corporation | 745 | 52,381 | ||||||||||
Cardinal Health Incorporated | 1,111 | 74,226 | ||||||||||
Cigna Corporation | 901 | 78,819 | ||||||||||
DaVita Incorporated † | 576 | 36,501 | ||||||||||
Express Scripts Holding Company † | 2,645 | 185,785 | ||||||||||
Humana Incorporated | 510 | 52,642 | ||||||||||
Laboratory Corporation of America Holdings † | 285 | 26,040 | ||||||||||
McKesson Corporation | 737 | 118,952 | ||||||||||
Patterson Companies Incorporated | 271 | 11,165 | ||||||||||
Quest Diagnostics Incorporated | 474 | 25,378 | ||||||||||
Tenet Healthcare Corporation † | 317 | 13,352 | ||||||||||
UnitedHealth Group Incorporated | 3,299 | 248,415 | ||||||||||
WellPoint Incorporated | 971 | 89,711 | ||||||||||
| 1,095,401 | ||||||||||||
|
| |||||||||||
| Health Care Technology: 0.06% | ||||||||||||
Cerner Corporation † | 965 | 53,789 | ||||||||||
|
| |||||||||||
| Life Sciences Tools & Services: 0.32% | ||||||||||||
Agilent Technologies Incorporated | 1,080 | 61,765 | ||||||||||
Life Technologies Corporation † | �� | 559 | 42,372 | |||||||||
PerkinElmer Incorporated | 367 | 15,131 | ||||||||||
Thermo Fisher Scientific Incorporated | 1,171 | 130,391 | ||||||||||
Waters Corporation † | 274 | 27,400 | ||||||||||
| 277,059 | ||||||||||||
|
| |||||||||||
| Pharmaceuticals: 3.58% | ||||||||||||
Abbvie Incorporated | 5,142 | 271,549 | ||||||||||
Actavis plc † | 574 | 96,432 | ||||||||||
Allergan Incorporated | 957 | 106,304 | ||||||||||
Bristol-Myers Squibb Company | 5,320 | 282,758 | ||||||||||
Eli Lilly & Company | 3,228 | 164,628 | ||||||||||
The accompanying notes are an integral part of these financial statements.
Table of Contents
| Portfolio of investments—December 31, 2013 | Wells Fargo Advantage VT Index Asset Allocation Fund | 17 |
| Security name | Shares | Value | ||||||||||
| Pharmaceuticals (continued) | ||||||||||||
Forest Laboratories Incorporated † | 778 | $ | 46,703 | |||||||||
Hospira Incorporated † | 534 | 22,044 | ||||||||||
Johnson & Johnson Services Incorporated | 9,116 | 834,934 | ||||||||||
Merck & Company Incorporated | 9,455 | 473,223 | ||||||||||
Mylan Laboratories Incorporated † | 1,243 | 53,946 | ||||||||||
Perrigo Company plc | 428 | 65,681 | ||||||||||
Pfizer Incorporated | 21,024 | 643,965 | ||||||||||
Zoetis Incorporated | 1,616 | 52,827 | ||||||||||
| 3,114,994 | ||||||||||||
|
| |||||||||||
Industrials: 6.73% | ||||||||||||
| Aerospace & Defense: 1.70% | ||||||||||||
General Dynamics Corporation | 1,079 | 103,098 | ||||||||||
Honeywell International Incorporated | 2,541 | 232,171 | ||||||||||
L-3 Communications Holdings Incorporated | 287 | 30,669 | ||||||||||
Lockheed Martin Corporation | 875 | 130,078 | ||||||||||
Northrop Grumman Corporation | 719 | 82,405 | ||||||||||
Precision Castparts Corporation | 471 | 126,840 | ||||||||||
Raytheon Company | 1,041 | 94,419 | ||||||||||
Rockwell Collins Incorporated | 438 | 32,377 | ||||||||||
Textron Incorporated | 886 | 32,569 | ||||||||||
The Boeing Company | 2,230 | 304,373 | ||||||||||
United Technologies Corporation | 2,733 | 311,015 | ||||||||||
| 1,480,014 | ||||||||||||
|
| |||||||||||
| Air Freight & Logistics: 0.51% | ||||||||||||
C.H. Robinson Worldwide Incorporated | 494 | 28,820 | ||||||||||
Expeditors International of Washington Incorporated | 665 | 29,426 | ||||||||||
FedEx Corporation | 958 | 137,732 | ||||||||||
United Parcel Service Incorporated Class B | 2,325 | 244,311 | ||||||||||
| 440,289 | ||||||||||||
|
| |||||||||||
| Airlines: 0.14% | ||||||||||||
Delta Air Lines Incorporated | 2,768 | 76,037 | ||||||||||
Southwest Airlines Company | 2,256 | 42,503 | ||||||||||
| 118,540 | ||||||||||||
|
| |||||||||||
| Building Products: 0.05% | ||||||||||||
Allegion plc † | 291 | 12,859 | ||||||||||
Masco Corporation | 1,196 | 27,233 | ||||||||||
| 40,092 | ||||||||||||
|
| |||||||||||
| Commercial Services & Supplies: 0.31% | ||||||||||||
Cintas Corporation | 324 | 19,307 | ||||||||||
Iron Mountain Incorporated | 555 | 16,844 | ||||||||||
Pitney Bowes Incorporated | 669 | 15,588 | ||||||||||
Republic Services Incorporated | 874 | 29,017 | ||||||||||
Stericycle Incorporated † | 279 | 32,411 | ||||||||||
The ADT Corporation | 651 | 26,346 | ||||||||||
Tyco International Limited | 1,525 | 62,586 | ||||||||||
Waste Management Incorporated | 1,422 | 63,805 | ||||||||||
| 265,904 | ||||||||||||
|
| |||||||||||
The accompanying notes are an integral part of these financial statements.
Table of Contents
| 18 | Wells Fargo Advantage VT Index Asset Allocation Fund | Portfolio of investments—December 31, 2013 |
| Security name | Shares | Value | ||||||||||
| Construction & Engineering: 0.10% | ||||||||||||
Fluor Corporation | 525 | $ | 42,152 | |||||||||
Jacobs Engineering Group Incorporated † | 425 | 26,771 | ||||||||||
Quanta Services Incorporated † | 705 | 22,250 | ||||||||||
| 91,173 | ||||||||||||
|
| |||||||||||
| Electrical Equipment: 0.48% | ||||||||||||
AMETEK Incorporated | 791 | 41,662 | ||||||||||
Eaton Corporation plc | 1,528 | 116,311 | ||||||||||
Emerson Electric Company | 2,277 | 159,800 | ||||||||||
Rockwell Automation Incorporated | 447 | 52,818 | ||||||||||
Roper Industries Incorporated | 324 | 44,932 | ||||||||||
| 415,523 | ||||||||||||
|
| |||||||||||
| Industrial Conglomerates: 1.56% | ||||||||||||
3M Company | 2,069 | 290,177 | ||||||||||
Danaher Corporation | 1,943 | 150,000 | ||||||||||
General Electric Company | 32,761 | 918,291 | ||||||||||
| 1,358,468 | ||||||||||||
|
| |||||||||||
| Machinery: 1.09% | ||||||||||||
Caterpillar Incorporated | 2,081 | 188,976 | ||||||||||
Cummins Incorporated | 567 | 79,930 | ||||||||||
Deere & Company | 1,245 | 113,706 | ||||||||||
Dover Corporation | 552 | 53,290 | ||||||||||
Flowserve Corporation | 453 | 35,710 | ||||||||||
Illinois Tool Works Incorporated | 1,333 | 112,079 | ||||||||||
Ingersoll-Rand plc | 878 | 54,085 | ||||||||||
Joy Global Incorporated | 350 | 20,472 | ||||||||||
Paccar Incorporated | 1,148 | 67,927 | ||||||||||
Pall Corporation | 357 | 30,470 | ||||||||||
Parker Hannifin Corporation | 482 | 62,004 | ||||||||||
Pentair Limited | 648 | 50,330 | ||||||||||
Snap-On Incorporated | 189 | 20,699 | ||||||||||
Stanley Black & Decker Incorporated | 504 | 40,668 | ||||||||||
Xylem Incorporated | 598 | 20,691 | ||||||||||
| 951,037 | ||||||||||||
|
| |||||||||||
| Professional Services: 0.11% | ||||||||||||
Dun & Bradstreet Corporation | 125 | 15,344 | ||||||||||
Equifax Incorporated | 397 | 27,429 | ||||||||||
Nielsen Holdings NV | 821 | 37,676 | ||||||||||
Robert Half International Incorporated | 454 | 19,063 | ||||||||||
| 99,512 | ||||||||||||
|
| |||||||||||
| Road & Rail: 0.57% | ||||||||||||
CSX Corporation | 3,296 | 94,826 | ||||||||||
Kansas City Southern Railway Company | 358 | 44,331 | ||||||||||
Norfolk Southern Corporation | 1,004 | 93,201 | ||||||||||
Ryder System Incorporated | 174 | 12,838 | ||||||||||
Union Pacific Corporation | 1,501 | 252,168 | ||||||||||
| 497,364 | ||||||||||||
|
| |||||||||||
The accompanying notes are an integral part of these financial statements.
Table of Contents
| Portfolio of investments—December 31, 2013 | Wells Fargo Advantage VT Index Asset Allocation Fund | 19 |
| Security name | Shares | Value | ||||||||||
| Trading Companies & Distributors: 0.11% | ||||||||||||
Fastenal Company | 893 | $ | 42,426 | |||||||||
W.W. Grainger Incorporated | 203 | 51,850 | ||||||||||
| 94,276 | ||||||||||||
|
| |||||||||||
Information Technology: 11.59% | ||||||||||||
| Communications Equipment: 1.08% | ||||||||||||
Cisco Systems Incorporated | 17,656 | 396,377 | ||||||||||
F5 Networks Incorporated † | 254 | 23,078 | ||||||||||
Harris Corporation | 347 | 24,224 | ||||||||||
Juniper Networks Incorporated † | 1,626 | 36,699 | ||||||||||
Motorola Solutions Incorporated | 757 | 51,098 | ||||||||||
QUALCOMM Incorporated | 5,467 | 405,925 | ||||||||||
| 937,401 | ||||||||||||
|
| |||||||||||
| Computers & Peripherals: 2.59% | ||||||||||||
Apple Incorporated | 3,022 | 1,695,674 | ||||||||||
EMC Corporation | 6,797 | 170,945 | ||||||||||
Hewlett-Packard Company | 6,272 | 175,491 | ||||||||||
NetApp Incorporated | 1,099 | 45,213 | ||||||||||
SanDisk Corporation | 738 | 52,059 | ||||||||||
Seagate Technology plc | 1,060 | 59,530 | ||||||||||
Western Digital Corporation | 680 | 57,052 | ||||||||||
| 2,255,964 | ||||||||||||
|
| |||||||||||
| Electronic Equipment, Instruments & Components: 0.26% | ||||||||||||
Amphenol Corporation Class A | 512 | 45,660 | ||||||||||
Corning Incorporated | 4,714 | 84,003 | ||||||||||
FLIR Systems Incorporated | 464 | 13,966 | ||||||||||
Jabil Circuit Incorporated | 610 | 10,638 | ||||||||||
TE Connectivity Limited | 1,339 | 73,792 | ||||||||||
| 228,059 | ||||||||||||
|
| |||||||||||
| Internet Software & Services: 1.98% | ||||||||||||
Akamai Technologies Incorporated † | 576 | 27,176 | ||||||||||
eBay Incorporated † | 3,816 | 209,460 | ||||||||||
Facebook Incorporated Class A † | 5,575 | 304,730 | ||||||||||
Google Incorporated Class A † | 919 | 1,029,932 | ||||||||||
VeriSign Incorporated † | 417 | 24,928 | ||||||||||
Yahoo! Incorporated † | 3,099 | 125,324 | ||||||||||
| 1,721,550 | ||||||||||||
|
| |||||||||||
| IT Services: 2.26% | ||||||||||||
Accenture plc | 2,080 | 171,018 | ||||||||||
Alliance Data Systems Corporation † | 160 | 42,069 | ||||||||||
Automatic Data Processing Incorporated | 1,556 | 125,740 | ||||||||||
Cognizant Technology Solutions Corporation Class A † | 982 | 99,162 | ||||||||||
Computer Sciences Corporation | 476 | 26,599 | ||||||||||
Fidelity National Information Services Incorporated | 938 | 50,352 | ||||||||||
The accompanying notes are an integral part of these financial statements.
Table of Contents
| 20 | Wells Fargo Advantage VT Index Asset Allocation Fund | Portfolio of investments—December 31, 2013 |
| Security name | Shares | Value | ||||||||||
| IT Services (continued) | ||||||||||||
Fiserv Incorporated † | 843 | $ | 49,779 | |||||||||
International Business Machines Corporation | 3,341 | 626,671 | ||||||||||
MasterCard Incorporated Class A | 333 | 278,208 | ||||||||||
Paychex Incorporated | 1,058 | 48,171 | ||||||||||
Teradata Corporation † | 522 | 23,746 | ||||||||||
Total System Services Incorporated | 539 | 17,938 | ||||||||||
Visa Incorporated Class A | 1,662 | 370,094 | ||||||||||
Western Union Company | 1,792 | 30,912 | ||||||||||
| 1,960,459 | ||||||||||||
|
| |||||||||||
| Office Electronics: 0.05% | ||||||||||||
Xerox Corporation | 3,788 | 46,100 | ||||||||||
|
| |||||||||||
| Semiconductors & Semiconductor Equipment: 1.25% | ||||||||||||
Altera Corporation | 1,054 | 34,287 | ||||||||||
Analog Devices Incorporated | 1,018 | 51,847 | ||||||||||
Applied Materials Incorporated | 3,966 | 70,159 | ||||||||||
Broadcom Corporation Class A | 1,772 | 52,540 | ||||||||||
First Solar Incorporated † | 227 | 12,403 | ||||||||||
Intel Corporation | 16,239 | 421,564 | ||||||||||
KLA-Tencor Corporation | 544 | 35,066 | ||||||||||
Lam Research Corporation † | 530 | 28,859 | ||||||||||
Linear Technology Corporation | 763 | 34,755 | ||||||||||
LSI Corporation | 1,774 | 19,549 | ||||||||||
Microchip Technology Incorporated « | 650 | 29,088 | ||||||||||
Micron Technology Incorporated † | 3,296 | 71,721 | ||||||||||
NVIDIA Corporation | 1,884 | 30,182 | ||||||||||
Texas Instruments Incorporated | 3,582 | 157,286 | ||||||||||
Xilinx Incorporated | 876 | 40,226 | ||||||||||
| 1,089,532 | ||||||||||||
|
| |||||||||||
| Software: 2.12% | ||||||||||||
Adobe Systems Incorporated † | 1,509 | 90,359 | ||||||||||
Autodesk Incorporated † | 733 | 36,892 | ||||||||||
CA Incorporated | 1,054 | 35,467 | ||||||||||
Citrix Systems Incorporated † | 597 | 37,760 | ||||||||||
Electronic Arts Incorporated † | 1,013 | 23,238 | ||||||||||
Intuit Incorporated | 933 | 71,207 | ||||||||||
Microsoft Corporation | 24,462 | 915,613 | ||||||||||
Oracle Corporation | 11,521 | 440,793 | ||||||||||
Red Hat Incorporated † | 612 | 34,296 | ||||||||||
Salesforce.com Incorporated † | 1,822 | 100,556 | ||||||||||
Symantec Corporation | 2,288 | 53,951 | ||||||||||
| 1,840,132 | ||||||||||||
|
| |||||||||||
Materials: 2.16% | ||||||||||||
| Chemicals: 1.57% | ||||||||||||
Air Products & Chemicals Incorporated | 690 | 77,128 | ||||||||||
Airgas Incorporated | 213 | 23,824 | ||||||||||
The accompanying notes are an integral part of these financial statements.
Table of Contents
| Portfolio of investments—December 31, 2013 | Wells Fargo Advantage VT Index Asset Allocation Fund | 21 |
| Security name | Shares | Value | ||||||||||
| Chemicals (continued) | ||||||||||||
CF Industries Holdings Incorporated | 187 | $ | 43,578 | |||||||||
E.I. du Pont de Nemours & Company | 3,003 | 195,105 | ||||||||||
Eastman Chemical Company | 504 | 40,673 | ||||||||||
Ecolab Incorporated | 877 | 91,445 | ||||||||||
FMC Corporation | 433 | 32,674 | ||||||||||
International Flavors & Fragrances Incorporated | 263 | 22,613 | ||||||||||
LyondellBasell Industries NV Class A | 1,403 | 112,633 | ||||||||||
Monsanto Company | 1,712 | 199,534 | ||||||||||
Mosaic Company | 1,120 | 52,942 | ||||||||||
PPG Industries Incorporated | 456 | 86,485 | ||||||||||
Praxair Incorporated | 954 | 124,049 | ||||||||||
Sherwin-Williams Company | 277 | 50,830 | ||||||||||
Sigma-Aldrich Corporation | 389 | 36,570 | ||||||||||
The Dow Chemical Company | 3,930 | 174,492 | ||||||||||
| 1,364,575 | ||||||||||||
|
| |||||||||||
| Construction Materials: 0.03% | ||||||||||||
Vulcan Materials Company | 423 | 25,135 | ||||||||||
|
| |||||||||||
| Containers & Packaging: 0.14% | ||||||||||||
Avery Dennison Corporation | 312 | 15,659 | ||||||||||
Ball Corporation | 467 | 24,125 | ||||||||||
Bemis Company Incorporated | 334 | 13,681 | ||||||||||
MeadWestvaco Corporation | 581 | 21,456 | ||||||||||
Owens-Illinois Incorporated † | 539 | 19,285 | ||||||||||
Sealed Air Corporation | 637 | 21,690 | ||||||||||
| 115,896 | ||||||||||||
|
| |||||||||||
| Metals & Mining: 0.34% | ||||||||||||
Alcoa Incorporated | 3,524 | 37,460 | ||||||||||
Allegheny Technologies Incorporated | 359 | 12,791 | ||||||||||
Cliffs Natural Resources Incorporated « | 497 | 13,026 | ||||||||||
Freeport-McMoRan Copper & Gold Incorporated Class B | 3,360 | 126,806 | ||||||||||
Newmont Mining Corporation | 1,599 | 36,825 | ||||||||||
Nucor Corporation | 1,037 | 55,355 | ||||||||||
United States Steel Corporation | 486 | 14,337 | ||||||||||
| 296,600 | ||||||||||||
|
| |||||||||||
| Paper & Forest Products: 0.08% | ||||||||||||
International Paper Company | 1,450 | 71,094 | ||||||||||
|
| |||||||||||
Telecommunication Services: 1.42% | ||||||||||||
| Diversified Telecommunication Services: 1.33% | ||||||||||||
AT&T Incorporated | 17,227 | 605,701 | ||||||||||
CenturyLink Incorporated | 1,931 | 61,502 | ||||||||||
Frontier Communications Corporation « | 3,224 | 14,992 | ||||||||||
Verizon Communications Incorporated | 9,349 | 459,410 | ||||||||||
Windstream Holdings Incorporated « | 1,950 | 15,561 | ||||||||||
| 1,157,166 | ||||||||||||
|
| |||||||||||
The accompanying notes are an integral part of these financial statements.
Table of Contents
| 22 | Wells Fargo Advantage VT Index Asset Allocation Fund | Portfolio of investments—December 31, 2013 |
| Security name | Shares | Value | ||||||||||
| Wireless Telecommunication Services: 0.09% | ||||||||||||
Crown Castle International Corporation † | 1,082 | $ | 79,451 | |||||||||
|
| |||||||||||
Utilities: 1.79% | ||||||||||||
| Electric Utilities: 0.93% | ||||||||||||
American Electric Power Company Incorporated | 1,565 | 73,148 | ||||||||||
Duke Energy Corporation | 2,268 | 156,515 | ||||||||||
Edison International | 1,043 | 48,291 | ||||||||||
Entergy Corporation | 577 | 36,507 | ||||||||||
Exelon Corporation | 2,758 | 75,542 | ||||||||||
FirstEnergy Corporation | 1,339 | 44,160 | ||||||||||
NextEra Energy Incorporated | 1,390 | 119,012 | ||||||||||
Northeast Utilities | 1,020 | 43,238 | ||||||||||
Pepco Holdings Incorporated | 808 | 15,457 | ||||||||||
Pinnacle West Capital Corporation | 356 | 18,840 | ||||||||||
PPL Corporation | 2,043 | 61,474 | ||||||||||
The Southern Company | 2,838 | 116,670 | ||||||||||
| 808,854 | ||||||||||||
|
| |||||||||||
| Gas Utilities: 0.07% | ||||||||||||
AGL Resources Incorporated | 381 | 17,995 | ||||||||||
ONEOK Incorporated | 665 | 41,350 | ||||||||||
| 59,345 | ||||||||||||
|
| |||||||||||
| Independent Power Producers & Energy Traders: 0.07% | ||||||||||||
AES Corporation | 2,133 | 30,950 | ||||||||||
NRG Energy Incorporated | 1,044 | 29,984 | ||||||||||
| 60,934 | ||||||||||||
|
| |||||||||||
| Multi-Utilities: 0.72% | ||||||||||||
Ameren Corporation | 778 | 28,132 | ||||||||||
CenterPoint Energy Incorporated | 1,374 | 31,849 | ||||||||||
CMS Energy Corporation | 856 | 22,915 | ||||||||||
Consolidated Edison Incorporated | 946 | 52,295 | ||||||||||
Dominion Resources Incorporated | 1,864 | 120,582 | ||||||||||
DTE Energy Company | 571 | 37,909 | ||||||||||
Integrys Energy Group Incorporated | 256 | 13,929 | ||||||||||
NiSource Incorporated | 1,004 | 33,012 | ||||||||||
PG&E Corporation | 1,467 | 59,091 | ||||||||||
Public Service Enterprise Group Incorporated | 1,635 | 52,385 | ||||||||||
SCANA Corporation | 453 | 21,259 | ||||||||||
Sempra Energy | 727 | 65,256 | ||||||||||
TECO Energy Incorporated | 660 | 11,378 | ||||||||||
Wisconsin Energy Corporation | 729 | 30,138 | ||||||||||
Xcel Energy Incorporated | 1,605 | 44,840 | ||||||||||
| 624,970 | ||||||||||||
|
| |||||||||||
Total Common Stocks (Cost $32,855,025) | 53,513,758 | |||||||||||
|
| |||||||||||
The accompanying notes are an integral part of these financial statements.
Table of Contents
| Portfolio of investments—December 31, 2013 | Wells Fargo Advantage VT Index Asset Allocation Fund | 23 |
| Interest rate | Maturity date | Principal | Value | |||||||||||||
U.S. Treasury Securities: 36.35% | ||||||||||||||||
U.S. Treasury Bond | 2.75 | % | 8-15-2042 | $ | 1,079,000 | $ | 851,398 | |||||||||
U.S. Treasury Bond | 2.75 | 11-15-2042 | 992,000 | 780,891 | ||||||||||||
U.S. Treasury Bond | 2.88 | 5-15-2043 | 1,416,000 | 1,142,756 | ||||||||||||
U.S. Treasury Bond | 3.00 | 5-15-2042 | 862,000 | 719,770 | ||||||||||||
U.S. Treasury Bond | 3.13 | 11-15-2041 | 1,729,000 | 1,487,210 | ||||||||||||
U.S. Treasury Bond | 3.13 | 2-15-2042 | 1,025,000 | 880,056 | ||||||||||||
U.S. Treasury Bond | 3.13 | 2-15-2043 | 1,236,000 | 1,053,690 | ||||||||||||
U.S. Treasury Bond | 3.50 | 2-15-2039 | 1,216,000 | 1,140,760 | ||||||||||||
U.S. Treasury Bond | 3.63 | 8-15-2043 | 1,348,000 | 1,267,752 | ||||||||||||
U.S. Treasury Bond | 3.75 | 8-15-2041 | 2,115,000 | 2,053,534 | ||||||||||||
U.S. Treasury Bond | 3.75 | 11-15-2043 | 985,000 | 948,216 | ||||||||||||
U.S. Treasury Bond | 3.88 | 8-15-2040 | 1,718,000 | 1,711,826 | ||||||||||||
U.S. Treasury Bond | 4.25 | 5-15-2039 | 1,241,000 | 1,318,563 | ||||||||||||
U.S. Treasury Bond | 4.25 | 11-15-2040 | 1,930,000 | 2,045,800 | ||||||||||||
U.S. Treasury Bond | 4.38 | 2-15-2038 | 688,000 | 746,050 | ||||||||||||
U.S. Treasury Bond | 4.38 | 11-15-2039 | 1,734,000 | 1,877,596 | ||||||||||||
U.S. Treasury Bond | 4.38 | 5-15-2040 | 1,951,000 | 2,111,653 | ||||||||||||
U.S. Treasury Bond | 4.38 | 5-15-2041 | 1,580,000 | 1,707,882 | ||||||||||||
U.S. Treasury Bond | 4.50 | 2-15-2036 | 916,000 | 1,015,901 | ||||||||||||
U.S. Treasury Bond | 4.50 | 5-15-2038 | 872,000 | 963,288 | ||||||||||||
U.S. Treasury Bond | 4.50 | 8-15-2039 | 1,098,000 | 1,212,604 | ||||||||||||
U.S. Treasury Bond | 4.63 | 2-15-2040 | 1,785,000 | 2,008,125 | ||||||||||||
U.S. Treasury Bond | 4.75 | 2-15-2037 | 404,000 | 463,211 | ||||||||||||
U.S. Treasury Bond | 4.75 | 2-15-2041 | 1,390,000 | 1,593,288 | ||||||||||||
U.S. Treasury Bond | 5.00 | 5-15-2037 | 421,000 | 499,214 | ||||||||||||
Total U.S. Treasury Securities (Cost $31,780,524) | 31,601,034 | |||||||||||||||
|
| |||||||||||||||
| Yield | Shares | |||||||||||||||
Short-Term Investments: 1.82% | ||||||||||||||||
| Investment Companies: 1.11% | ||||||||||||||||
Wells Fargo Advantage Cash Investment Money Market Fund, Select Class (l)(u) | 0.06 | 881,690 | 881,690 | |||||||||||||
Wells Fargo Securities Lending Cash Investments, LLC (v)(r)(l)(u) | 0.08 | 82,375 | 82,375 | |||||||||||||
| 964,065 | ||||||||||||||||
|
| |||||||||||||||
| Principal | ||||||||||||||||
| U.S. Treasury Securities: 0.71% | ||||||||||||||||
U.S.Treasury Bill #(z) | 0.03 | 3-27-2014 | $ | 619,000 | 618,910 | |||||||||||
|
| |||||||||||||||
Total Short-Term Investments (Cost $1,582,964) | 1,582,975 | |||||||||||||||
|
| |||||||||||||||
Total investments in securities (Cost $66,218,513) * | 99.73 | % | 86,697,767 | |||||
Other assets and liabilities, net | 0.27 | 237,368 | ||||||
|
|
|
| |||||
| Total net assets | 100.00 | % | $ | 86,935,135 | ||||
|
|
|
|
The accompanying notes are an integral part of these financial statements.
Table of Contents
| 24 | Wells Fargo Advantage VT Index Asset Allocation Fund | Portfolio of investments—December 31, 2013 |
| † | Non-income-earning security |
| (l) | Investment in an affiliate |
| « | All or a portion of this security is on loan. |
| (u) | Rate shown is the 7-day annualized yield at period end. |
| (v) | Security represents investment of cash collateral received from securities on loan. |
| (r) | The investment company is exempt from registration under Section 3(c)(7) of the Investment Company Act of 1940, as amended. |
| # | All or a portion of this security is segregated as collateral for investments in derivative instruments. |
| (z) | Zero coupon security. Rate represents yield to maturity at time of purchase. |
| * | Cost for federal income tax purposes is $68,600,945 and unrealized appreciation (depreciation) consists of: |
Gross unrealized appreciation | $ | 22,421,706 | ||
Gross unrealized depreciation | (4,324,884 | ) | ||
|
| |||
Net unrealized appreciation | $ | 18,096,822 |
The accompanying notes are an integral part of these financial statements.
Table of Contents
| Statement of assets and liabilities—December 31, 2013 | Wells Fargo Advantage VT Index Asset Allocation Fund | 25 |
Assets | ||||
Investments | ||||
In unaffiliated securities (including securities on loan), at value (see cost below) | $ | 85,026,143 | ||
In affiliated securities, at value (see cost below) | 1,671,624 | |||
|
| |||
Total investments, at value (see cost below) | 86,697,767 | |||
Cash | 435 | |||
Receivable for Fund shares sold | 112,810 | |||
Receivable for dividends and interest | 391,396 | |||
Receivable for daily variation margin on open futures contracts | 47,834 | |||
Receivable for securities lending income | 52 | |||
Prepaid expenses and other assets | 2,544 | |||
|
| |||
Total assets | 87,252,838 | |||
|
| |||
Liabilities | ||||
Payable for Fund shares redeemed | 77,915 | |||
Payable upon receipt of securities loaned | 82,375 | |||
Payable for daily variation margin on open futures contracts | 1,406 | |||
Advisory fee payable | 33,020 | |||
Distribution fees payable | 18,953 | |||
Due to other related parties | 9,855 | |||
Shareholder report expenses payable | 48,380 | |||
Professional fees payable | 30,699 | |||
Accrued expenses and other liabilities | 15,100 | |||
|
| |||
Total liabilities | 317,703 | |||
|
| |||
Total net assets | $ | 86,935,135 | ||
|
| |||
NET ASSETS CONSIST OF | ||||
Paid-in capital | $ | 80,953,436 | ||
Undistributed net investment income | 86,778 | |||
Accumulated net realized losses on investments | (14,849,528 | ) | ||
Net unrealized gains on investments | 20,744,449 | |||
|
| |||
Total net assets | $ | 86,935,135 | ||
|
| |||
COMPUTATION OF NET ASSET VALUE PER SHARE1 | ||||
Net assets – Class 2 | $ | 86,935,135 | ||
Shares outstanding – Class 2 | 5,483,760 | |||
Net asset value per share – Class 2 | $15.85 | |||
Investments in unaffiliated securities (including securities on loan), at cost | $ | 64,736,568 | ||
|
| |||
Investments in affiliated securities, at cost | $ | 1,481,945 | ||
|
| |||
Total investments, at cost | $ | 66,218,513 | ||
|
| |||
Securities on loan, at value | $ | 79,505 | ||
|
| |||
| 1. | The Fund has an unlimited number of authorized shares. |
The accompanying notes are an integral part of these financial statements.
Table of Contents
| 26 | Wells Fargo Advantage VT Index Asset Allocation Fund | Statement of operations—year ended December 31, 2013 |
Investment income | ||||
Dividends* | $ | 1,118,044 | ||
Interest | 1,085,137 | |||
Income from affiliated securities | 22,066 | |||
Securities lending income, net | 2,538 | |||
|
| |||
Total investment income | 2,227,785 | |||
|
| |||
Expenses | ||||
Advisory fee | 477,029 | |||
Administration fees | ||||
Fund level | 43,366 | |||
Class 2 | 69,386 | |||
Distribution fees | ||||
Class 2 | 216,831 | |||
Custody and accounting fees | 45,151 | |||
Professional fees | 44,915 | |||
Shareholder report expenses | 29,151 | |||
Trustees’ fees and expenses | 12,125 | |||
Other fees and expenses | 21,889 | |||
|
| |||
Total expenses | 959,843 | |||
Less: Fee waivers and/or expense reimbursements | (92,518 | ) | ||
|
| |||
Net expenses | 867,325 | |||
|
| |||
Net investment income | 1,360,460 | |||
|
| |||
REALIZED AND UNREALIZED GAINS (LOSSES) ON INVESTMENTS | ||||
Net realized gains (losses) on: | ||||
Unaffiliated securities | 4,258,941 | |||
Affiliated securities | (109,866 | ) | ||
Futures transactions | 6,368,980 | |||
|
| |||
Net realized gains on investments | 10,518,055 | |||
|
| |||
Net change in unrealized gains (losses) on: | ||||
Unaffiliated securities | 3,410,931 | |||
Affiliated securities | 306,673 | |||
Futures transactions | (7,408 | ) | ||
|
| |||
Net change in unrealized gains (losses) on investments | 3,710,196 | |||
|
| |||
Net realized and unrealized gains (losses) on investments | 14,228,251 | |||
|
| |||
Net increase in net assets resulting from operations | $ | 15,588,711 | ||
|
| |||
* Net of foreign dividend withholding taxes in the amount of | $265 | |||
The accompanying notes are an integral part of these financial statements.
Table of Contents
| Statement of changes in net assets | Wells Fargo Advantage VT Index Asset Allocation Fund | 27 |
| Year ended December 31, 2013 | Year ended | |||||||||||||||
Operations | ||||||||||||||||
Net investment income | $ | 1,360,460 | $ | 1,400,042 | ||||||||||||
Net realized gains on investments | 10,518,055 | 6,436,511 | ||||||||||||||
Net change in unrealized gains (losses) on investments | 3,710,196 | 3,201,816 | ||||||||||||||
|
|
|
|
|
|
|
| |||||||||
Net increase in net assets resulting from operations | 15,588,711 | 11,038,369 | ||||||||||||||
|
|
|
|
|
|
|
| |||||||||
Distributions to shareholders from | ||||||||||||||||
Net investment income - Class 2 | (1,413,380 | ) | (1,279,304 | ) | ||||||||||||
|
|
|
|
|
|
|
| |||||||||
| Shares | Shares | |||||||||||||||
Capital share transactions | ||||||||||||||||
Proceeds from shares sold - Class 2 | 169,662 | 2,539,040 | 246,140 | 3,219,986 | ||||||||||||
Reinvestment of distributions - Class 2 | 95,451 | 1,413,380 | 96,440 | 1,279,304 | ||||||||||||
Payment for shares redeemed - Class 2 | (1,077,142 | ) | (15,983,942 | ) | (1,443,157 | ) | (18,869,318 | ) | ||||||||
|
|
|
|
|
|
|
| |||||||||
Net decrease in net assets resulting from capital share transactions | (12,031,522 | ) | (14,370,028 | ) | ||||||||||||
|
|
|
|
|
|
|
| |||||||||
Total increase (decrease) in net assets | 2,143,809 | (4,610,963 | ) | |||||||||||||
|
|
|
|
|
|
|
| |||||||||
Net assets | ||||||||||||||||
Beginning of period | 84,791,326 | 89,402,289 | ||||||||||||||
|
|
|
|
|
|
|
| |||||||||
End of period | $ | 86,935,135 | $ | 84,791,326 | ||||||||||||
|
|
|
|
|
|
|
| |||||||||
Undistributed net investment income | $ | 86,778 | $ | 137,973 | ||||||||||||
|
|
|
|
|
|
|
| |||||||||
The accompanying notes are an integral part of these financial statements.
Table of Contents
| 28 | Wells Fargo Advantage VT Index Asset Allocation Fund | Financial highlights |
(For a share outstanding throughout each period)
| Year ended December 31 | ||||||||||||||||||||
| CLASS 2 | 2013 | 2012 | 2011 | 20101 | 2009 | |||||||||||||||
Net asset value, beginning of period | $13.47 | $12.09 | $11.72 | $10.53 | $9.31 | |||||||||||||||
Net investment income | 0.24 | 0.21 | 0.21 | 0.20 | 0.19 | |||||||||||||||
Net realized and unrealized gains (losses) on investments | 2.39 | 1.36 | 0.54 | 1.18 | 1.22 | |||||||||||||||
|
|
|
|
|
|
|
|
|
| |||||||||||
Total from investment operations | 2.63 | 1.57 | 0.75 | 1.38 | 1.41 | |||||||||||||||
Distributions to shareholders from | ||||||||||||||||||||
Net investment income | (0.25 | ) | (0.19 | ) | (0.38 | ) | (0.19 | ) | (0.19 | ) | ||||||||||
Net asset value, end of period | $15.85 | $13.47 | $12.09 | $11.72 | $10.53 | |||||||||||||||
Total return | 19.63 | % | 13.03 | % | 6.48 | % | 13.29 | % | 15.46 | % | ||||||||||
Ratios to average net assets (annualized) | ||||||||||||||||||||
Gross expenses | 1.11 | % | 1.13 | % | 1.06 | % | 1.10 | % | 1.07 | % | ||||||||||
Net expenses | 1.00 | % | 1.00 | % | 0.99 | % | 1.00 | % | 1.00 | % | ||||||||||
Net investment income | 1.57 | % | 1.58 | % | 1.70 | % | 1.76 | % | 2.01 | % | ||||||||||
Supplemental data | ||||||||||||||||||||
Portfolio turnover rate | 11 | % | 8 | % | 17 | % | 25 | % | 43 | % | ||||||||||
Net assets, end of period (000s omitted) | $ | 86,935 | $ | 84,791 | $ | 89,402 | $ | 102,946 | $ | 113,271 | ||||||||||
| 1. | After the close of business on July 16, 2010, existing shares of the Fund were renamed Class 2 shares. |
The accompanying notes are an integral part of these financial statements.
Table of Contents
| Notes to financial statements | Wells Fargo Advantage VT Index Asset Allocation Fund | 29 |
1. ORGANIZATION
Wells Fargo Variable Trust (the “Trust”), a Delaware statutory trust organized on March 10, 1999, is an open-end management investment company registered under the Investment Company Act of 1940, as amended (the “1940 Act”). These financial statements report on the Wells Fargo Advantage VT Index Asset Allocation Fund (the “Fund”) which is a diversified series of the Trust.
2. SIGNIFICANT ACCOUNTING POLICIES
The following significant accounting policies, which are consistently followed in the preparation of the financial statements of the Fund, are in conformity with U.S. generally accepted accounting principles which require management to make estimates and assumptions that affect the reported amounts of assets and liabilities, disclosure of contingent assets and liabilities at the date of the financial statements, and the reported amounts of revenues and expenses during the reporting period. Actual results could differ from those estimates.
Securities valuation
All investments are valued each business day as of the close of regular trading on the New York Stock Exchange (generally 4 p.m. Eastern Time).
Equity securities and futures that are listed on a foreign or domestic exchange or market are valued at the official closing price or, if none, the last sales price. If no sale occurs on the primary exchange or market for the security that day, the prior day’s price will be deemed “stale” and fair values will be determined in accordance with the Fund’s Valuation Procedures.
Fixed income securities acquired with maturities exceeding 60 days are valued based on evaluated bid prices provided by an independent pricing service which may utilize both transaction data and market information such as yield, quality, coupon rate, maturity, type of issue, trading characteristics and other market data. If prices are not available from the independent pricing service or prices received are deemed not representative of market value, prices will be obtained from an independent broker-dealer or otherwise determined based on the Fund’s Valuation Procedures.
Short-term securities, with maturities of 60 days or less at time of purchase, generally are valued at amortized cost which approximates fair value. The amortized cost method involves valuing a security at its cost, plus accretion of discount or minus amortization of premium over the period until maturity.
Investments in registered open-end investment companies are valued at net asset value. Non-registered investment vehicles are fair valued at net asset value.
Investments which are not valued using any of the methods discussed above are valued at their fair value, as determined in good faith by the Board of Trustees of the Fund. The Board of Trustees has established a Valuation Committee comprised of the Trustees and has delegated to it the authority to take any actions regarding the valuation of portfolio securities that the Valuation Committee deems necessary or appropriate, including determining the fair value of portfolio securities, unless the determination has been delegated to the Management Valuation Team of Wells Fargo Funds Management, LLC (“Funds Management”). The Board of Trustees retains the authority to make or ratify any valuation decisions or approve any changes to the Valuation Procedures as it deems appropriate. On a quarterly basis, the Board of Trustees receives reports on any valuation actions taken by the Valuation Committee or the Management Valuation Team which may include items for ratification.
Valuations of fair valued securities are compared to the next actual sales price when available, or other appropriate market values, to assess the continued appropriateness of the fair valuation methodologies used. These securities are fair valued on a day-to-day basis, taking into consideration changes to appropriate market information and any significant changes to the inputs considered in the valuation process until there is a readily available price provided on an exchange or by an independent pricing service. Valuations received from an independent pricing service or independent broker-dealer quotes are periodically validated by comparisons to most recent trades and valuations provided by other independent pricing services in addition to the review of prices by the adviser and/or subadviser. Unobservable inputs used in determining fair valuations are identified based on the type of security, taking into consideration factors utilized by market participants in valuing the investment, knowledge about the issuer and the current market environment.
Security loans
The Fund may lend its securities from time to time in order to earn additional income in the form of fees or interest on securities received as collateral or the investment of any cash received as collateral. The Fund continues to receive interest or dividends on the securities loaned. The Fund receives collateral in the form of cash or securities with a value at
Table of Contents
| 30 | Wells Fargo Advantage VT Index Asset Allocation Fund | Notes to financial statements |
least equal to the value of the securities on loan. The value of the loaned securities is determined at the close of each business day and any additional required collateral is delivered to the Fund on the next business day. In a securities lending transaction, the net asset value of the Fund will be affected by an increase or decrease in the value of the securities loaned and by an increase or decrease in the value of the instrument in which collateral is invested. The amount of securities lending activity undertaken by the Fund fluctuates from time to time. In the event of default or bankruptcy by the borrower, the Fund may be prevented from recovering the loaned securities or gaining access to the collateral or may experience delays or costs in doing so. In addition, the investment of any cash collateral received may lose all or part of its value. The Fund has the right under the lending agreement to recover the securities from the borrower on demand.
The Fund lends its securities through an unaffiliated securities lending agent. Cash collateral received in connection with its securities lending transactions is invested in Wells Fargo Securities Lending Cash Investments, LLC (the “Securities Lending Fund”). The Securities Lending Fund is exempt from registration under Section 3(c)(7) of the 1940 Act and is managed by Funds Management and is subadvised by Wells Capital Management Incorporated (“WellsCap”). Funds Management receives an advisory fee starting at 0.05% and declining to 0.01% as the average daily net assets of the Securities Lending Fund increase. All of the fees received by Funds Management are paid to WellsCap for its services as subadviser. The Securities Lending Fund seeks to provide a positive return compared to the daily Fed Funds Open rate by investing in high-quality, U.S. dollar-denominated short-term money market instruments. Securities Lending Fund investments are fair valued based upon the amortized cost valuation technique. Income earned from investment in the Securities Lending Fund is included in securities lending income on the Statement of Operations.
Futures contracts
The Fund may be subject to interest rate risk and equity price risk in the normal course of pursuing its investment objectives. The Fund may buy and sell futures contracts in order to gain exposure to, or protect against, changes in security values and interest rates. The primary risks associated with the use of futures contracts are the imperfect correlation between changes in market values of securities held by the Fund and the prices of futures contracts, and the possibility of an illiquid market.
The aggregate principal amounts of the contracts are not recorded in the financial statements. Fluctuations in the value of the contracts are recorded in the Statement of Assets and Liabilities as an asset or liability and in the Statement of Operations as unrealized gains or losses until the contracts are closed, at which point they are recorded as net realized gains or losses on futures contracts. With futures contracts, there is minimal counterparty risk to the Fund since futures are exchange traded and the exchange’s clearinghouse, as counterparty to all exchange traded futures, guarantees the futures against default.
Security transactions and income recognition
Securities transactions are recorded on a trade date basis. Realized gains or losses are recorded on the basis of identified cost.
Interest income is accrued daily and bond discounts are accreted and premiums are amortized daily based on the effective interest method. To the extent debt obligations are placed on non-accrual status, any related interest income may be reduced by writing off interest receivables when the collection of all or a portion of interest has become doubtful based on consistently applied procedures. If the issuer subsequently resumes interest payments or when the collectability of interest is reasonably assured, the debt obligation is removed from non-accrual status.
Dividend income is recognized on the ex-dividend date. Dividend income is recorded net of foreign taxes withheld where recovery of such taxes is not assured.
Distributions to shareholders
Distributions to shareholders from net investment income and net realized gains, if any, are recorded on the ex-dividend date. Such distributions are determined in conformity with federal income tax regulations, which may differ in amount or character from net investment income and realized gains recognized for purposes of U.S. generally accepted accounting principles.
Federal and other taxes
The Fund intends to continue to qualify as a regulated investment company by distributing substantially all of its investment company taxable income and any net realized capital gains (after reduction for capital loss carryforwards) sufficient to relieve it from all, or substantially all, federal income taxes. Accordingly, no provision for federal income taxes was required.
Table of Contents
| Notes to financial statements | Wells Fargo Advantage VT Index Asset Allocation Fund | 31 |
The Fund’s income and federal excise tax returns and all financial records supporting those returns for the prior three fiscal years are subject to examination by the federal and Delaware revenue authorities. Management has analyzed the Fund’s tax positions taken on federal, state, and foreign tax returns for all open tax years and does not believe that there are any uncertain tax positions that require recognition of a tax liability.
Reclassifications are made to the Fund’s capital accounts for permanent tax differences to reflect income and gains available for distribution (or available capital loss carryforwards) under federal income tax regulations. U.S. generally accepted accounting principles requires that certain components of net assets be adjusted to reflect permanent differences between financial and tax reporting. These reclassifications have no effect on net assets or net asset values per share. At December 31, 2013, as a result of permanent book-to-tax differences, the following reclassification adjustments were made on the Statement of Assets and Liabilities:
Undistributed net investment income | Accumulated net realized losses on investments | |
| $1,725 | $(1,725) |
As of December 31, 2013, the Fund had capital loss carryforwards available to offset future net realized capital gains in the amount of $10,883,722 with $7,159,155 expiring in 2016 and $3,724,567 expiring in 2017.
3. FAIR VALUATION MEASUREMENTS
Fair value measurements of investments are determined within a framework that has established a fair value hierarchy based upon the various data inputs utilized in determining the value of the Fund’s investments. The three-level hierarchy gives the highest priority to unadjusted quoted prices in active markets for identical assets or liabilities (Level 1) and the lowest priority to significant unobservable inputs (Level 3). The Fund’s investments are classified within the fair value hierarchy based on the lowest level of input that is significant to the fair value measurement. The inputs are summarized into three broad levels as follows:
| n | Level 1 – quoted prices in active markets for identical securities |
| n | Level 2 – other significant observable inputs (including quoted prices for similar securities, interest rates, prepayment speeds, credit risk, use of amortized cost, etc.) |
| n | Level 3 – significant unobservable inputs (including the Fund’s own assumptions in determining the fair value of investments) |
The inputs or methodologies used for valuing investments in securities are not necessarily an indication of the risk associated with investing in those securities.
As of December 31, 2013, the inputs used in valuing investments in securities were as follows:
| Investments in securities | Quoted prices (Level 1) | Other significant (Level 2) | Significant unobservable inputs (Level 3) | Total | ||||||||||||
Equity securities | ||||||||||||||||
Common stocks | $ | 53,513,758 | $ | 0 | $ | 0 | $ | 53,513,758 | ||||||||
U.S. Treasury securities | 31,601,034 | 0 | 0 | 31,601,034 | ||||||||||||
Short-term investments | ||||||||||||||||
Investment companies | 881,690 | 82,375 | 0 | 964,065 | ||||||||||||
U.S. Treasury securities | 618,910 | 0 | 0 | 618,910 | ||||||||||||
| $ | 86,615,392 | $ | 82,375 | $ | 0 | $ | 86,697,767 | |||||||||
As of December 31, 2013, the inputs used in valuing the Fund’s other financial instruments were as follows:
| Other financial instruments | Quoted prices (Level 1) | Other significant (Level 2) | Significant unobservable inputs (Level 3) | Total | ||||||||||||
Futures contracts | $ | 265,195 | * | $ | 0 | $ | 0 | $ | 265,195 | |||||||
| * | Amount represents the net unrealized gains. |
Table of Contents
| 32 | Wells Fargo Advantage VT Index Asset Allocation Fund | Notes to financial statements |
Transfers in and transfers out are recognized at the end of the reporting period. For the year ended December 31, 2013, the Fund did not have any transfers into/out of Level 1, Level 2, or Level 3.
4. TRANSACTIONS WITH AFFILIATES AND OTHER EXPENSES
Advisory fee
The Trust has entered into an advisory contract with Funds Management, an indirect wholly owned subsidiary of Wells Fargo & Company (“Wells Fargo”). The adviser is responsible for implementing investment policies and guidelines and for supervising the subadviser, who is responsible for day-to-day portfolio management of the Fund.
Pursuant to the contract, Funds Management is entitled to receive an annual advisory fee starting at 0.55% and declining to 0.40% as the average daily net assets of the Fund increase. For the year ended December 31, 2013, the advisory fee was equivalent to an annual rate of 0.55% of the Fund’s average daily net assets.
Funds Management has retained the services of a subadviser to provide daily portfolio management to the Fund. The fee for subadvisory services is borne by Funds Management. WellsCap, an affiliate of Funds Management and an indirect, wholly owned subsidiary of Wells Fargo, is the subadviser to the Fund and is entitled to receive a fee from Funds Management at an annual rate starting at 0.15% and declining to 0.10% as the average daily net assets of the Fund increase.
Administration and transfer agent fees
The Trust has entered into an administration agreement with Funds Management. Under this agreement, for providing administrative services, which includes paying fees and expenses for services provided by the transfer agent, sub-transfer agents, omnibus account servicers and record-keepers, Funds Management is entitled to receive from the Fund an annual fund level administration fee starting at 0.05% and declining to 0.03% as the average daily net assets of the Fund increase and, for Class 2 shares, a class level administration fee of 0.08% of its average daily net assets.
Funds Management has contractually waived and/or reimbursed advisory and administration fees to the extent necessary to maintain certain net operating expense ratios for the Fund. Waiver of fees and/or reimbursement of expenses by Funds Management were made first from fund level expenses on a proportionate basis and then from class specific expenses. Funds Management has committed through April 30, 2014, to waive fees and/or reimburse expenses to the extent necessary to cap the Fund’s expenses at 1.00% for Class 2 shares.
Distribution fees
The Trust has adopted a Distribution Plan for Class 2 shares of the Fund pursuant to Rule 12b-1 under the 1940 Act. Distribution fees are charged to Class 2 shares and paid to Wells Fargo Funds Distributor, LLC, the principal underwriter, at an annual rate of 0.25% of the average daily net assets of Class 2 shares.
5. INVESTMENT PORTFOLIO TRANSACTIONS
Purchases and sales of investments, excluding short-term securities, for the year ended December 31, 2013 were as follows:
Purchases at cost | Sales proceeds | |||||||||||
| U.S. government | Non-U.S. government | U.S. government | Non-U.S. government | |||||||||
$6,766,271 | $ | 2,082,076 | $ | 0 | $ | 12,097,396 | ||||||
6. DERIVATIVE TRANSACTIONS
During the year ended December 31, 2013, the Fund entered into futures contracts to gain market exposure to certain asset classes consistent with an active asset allocation strategy.
At December 31, 2013, the Fund had long and short futures contracts outstanding as follows:
| Expiration date | Contracts | Type | Contract value at December 31, 2013 | Unrealized gains (losses) | ||||||||
| 3-20-2014 | 15 Long | S&P 500 Index | $ | 6,904,125 | $ | 165,870 | ||||||
| 3-20-2014 | 3 Long | U.S. Treasury Bonds | 384,938 | (6,617 | ) | |||||||
| 3-20-2014 | 50 Short | U.S. Treasury Bonds | 6,415,625 | 105,942 | ||||||||
Table of Contents
| Notes to financial statements | Wells Fargo Advantage VT Index Asset Allocation Fund | 33 |
The Fund had an average notional amount of $19,190,099 and $18,010,493 in long and short futures contracts, respectively, during the year ended December 31, 2013.
A summary of derivative instruments by primary risk exposure is outlined in the following tables.
The fair value of derivative instruments as of December 31, 2013 was as follows for the Fund:
Asset derivatives | Liability derivatives | |||||||||||
| Statement of Assets and Liabilities location | Fair value | Statement of Assets and Liabilities location | Fair value | |||||||||
Interest rate contracts | Net assets – Net unrealized gains on investments | $ | 105,942 | * | Net assets – Net unrealized gains on investments | $ | 6,617 | * | ||||
Equity contracts | Net assets – Net unrealized gains on investments | 165,870 | * | Net assets – Net unrealized gains on investments | 0 | |||||||
| $ | 271,812 | $ | 6,617 | |||||||||
| * | Amount represents cumulative unrealized gains/losses on futures contracts. Only the receivable for variation margin as of December 31, 2013, which represents the current day’s variation margin, is reported separately on the Statement of Assets and Liabilities. |
The effect of derivative instruments on the Statement of Operations for the year ended December 31, 2013 was as follows for the Fund:
| Amount of realized gains on derivatives | Change in unrealized gains (losses) on derivatives | |||||||
Equity contracts | $ | 4,554,764 | $ | 181,649 | ||||
Interest rate contracts | 1,814,216 | (189,057 | ) | |||||
| $ | 6,368,980 | $ | (7,408 | ) | ||||
For certain types of derivative transactions, the Fund has entered into International Swaps and Derivatives Association, Inc. master agreements (“ISDA Master Agreements”) or similar agreements with approved counterparties. The ISDA Master Agreements or similar agreements may have requirements to deliver/deposit securities or cash to/with an exchange or broker-dealer as collateral and allows the Fund to offset, with each counterparty, certain derivative financial instrument’s assets and/or liabilities with collateral held or pledged. Collateral requirements differ by type of derivative. Collateral or margin requirements are set by the broker or exchange clearing house for exchange traded derivatives while collateral terms are contract specific for over-the-counter traded. Cash collateral that has been pledged to cover obligations of the Fund under derivative contracts, if any, will be reported separately in the Statement of Assets and Liabilities. Securities pledged as collateral, if any, for the same purpose are noted in the Portfolio of Investments. With respect to balance sheet offsetting, absent an event of default by the counterparty or a termination of the agreement, the reported amounts of financial assets and financial liabilities in the Statement of Assets and Liabilities are not offset across transactions between the Fund and the applicable counterparty. A reconciliation of the gross amounts on the Statement of Assets and Liabilities to the net amounts by derivative type, including any collateral exposure, is as follows:
| Investment type | Counterparty | Gross amounts of Liabilities | Amounts to netting | Collateral | Net amount (not less than $0) | |||||||||||||||
Futures - variation margin | Goldman Sachs | $ | 47,834 | $ | (1,406 | ) | $ | 0 | $ | 46,428 | ||||||||||
| Investment type | Counterparty | Gross amounts of Liabilities | Amounts to netting | Collateral | Net amount (not less than $0) | |||||||||||||||
Futures - variation margin | Goldman Sachs | $ | 1,406 | $ | (1,406 | ) | $ | 0 | $ | 0 | ||||||||||
Table of Contents
| 34 | Wells Fargo Advantage VT Index Asset Allocation Fund | Notes to financial statements |
7. BANK BORROWINGS
The Trust and Wells Fargo Funds Trust (excluding the money market funds and certain other funds) are parties to a $150,000,000 revolving credit agreement with State Street Bank and Trust Company, whereby the Fund is permitted to use bank borrowings for temporary or emergency purposes, such as to fund shareholder redemption requests. Interest under the credit agreement is charged to the Fund based on a borrowing rate equal to the higher of the Federal Funds rate in effect on that day plus 1.25% or the overnight LIBOR rate in effect on that day plus 1.25%. In addition, an annual commitment fee equal to 0.10% of the unused balance is allocated to each participating fund. For the year ended December 31, 2013, the Fund paid $146 in commitment fees.
For the year ended December 31, 2013, there were no borrowings by the Fund under the agreement.
8. DISTRIBUTIONS TO SHAREHOLDERS
The tax character of distributions paid was $1,413,380 and $1,279,304 of ordinary income for the years ended December 31, 2013 and December 31, 2012, respectively.
As of December 31, 2013, the components of distributable earnings on a tax basis were as follows:
Undistributed ordinary income | Unrealized gains | Capital loss carryforward | ||
| $86,778 | $16,778,643 | $(10,883,722) |
9. INDEMNIFICATION
Under the Trust’s organizational documents, the officers and directors are indemnified against certain liabilities that may arise out of performance of their duties to the Trust. Additionally, in the normal course of business, the Trust may enter into contracts with service providers that contain a variety of indemnification clauses. The Trust’s maximum exposure under these arrangements is dependent on future claims that may be made against the Fund and, therefore, cannot be estimated.
Table of Contents
| Report of independent registered public accounting firm | Wells Fargo Advantage VT Index Asset Allocation Fund | 35 |
BOARD OF TRUSTEES AND SHAREHOLDERS OF WELLS FARGO VARIABLE TRUST:
We have audited the accompanying statement of assets and liabilities, including the portfolio of investments, of the Wells Fargo Advantage VT Index Asset Allocation Fund (the “Fund”), one of the funds constituting the Wells Fargo Variable Trust, as of December 31, 2013, and the related statement of operations for the year then ended, statements of changes in net assets for each of the years in the two-year period then ended, and the financial highlights for each of the years in the five-year period then ended. These financial statements and financial highlights are the responsibility of the Fund’s management. Our responsibility is to express an opinion on these financial statements and financial highlights based on our audits.
We conducted our audits in accordance with the standards of the Public Company Accounting Oversight Board (United States). Those standards require that we plan and perform the audit to obtain reasonable assurance about whether the financial statements and financial highlights are free of material misstatement. An audit includes examining, on a test basis, evidence supporting the amounts and disclosures in the financial statements. Our procedures included confirmation of securities owned as of December 31, 2013, by correspondence with the custodian and brokers or by other appropriate auditing procedures. An audit also includes assessing the accounting principles used and significant estimates made by management, as well as evaluating the overall financial statement presentation. We believe that our audits provide a reasonable basis for our opinion.
In our opinion, the financial statements and financial highlights referred to above present fairly, in all material respects, the financial position of the Wells Fargo Advantage VT Index Asset Allocation Fund as of December 31, 2013, the results of its operations for the year then ended, the changes in its net assets for each of the years in the two-year period then ended, and the financial highlights for each of the years in the five-year period then ended, in conformity with U.S. generally accepted accounting principles.

Boston, Massachusetts
February 27, 2014
Table of Contents
| 36 | Wells Fargo Advantage VT Index Asset Allocation Fund | Other information (unaudited) |
TAX INFORMATION
For corporate shareholders, pursuant to Section 854 of the Internal Revenue Code, 72.82% of ordinary income dividends qualify for the corporate dividends-received deduction for the fiscal year ended December 31, 2013.
For the fiscal year ended December 31, 2013, 49.61% of the ordinary income distributed was derived from interest on U.S. government securities.
PROXY VOTING INFORMATION
A description of the policies and procedures that the Fund uses to determine how to vote proxies relating to portfolio securities is available without charge, upon request, by calling 1-800-222-8222, visiting our website at wellsfargoadvantagefunds.com, or visiting the SEC website at sec.gov. Information regarding how the Fund voted proxies relating to portfolio securities during the most recent 12-month period ended June 30 is available without charge on the Fund’s website at wellsfargoadvantagefunds.com or by visiting the SEC website at sec.gov.
PORTFOLIO HOLDINGS INFORMATION
The complete portfolio holdings for the Fund are publicly available on the Fund’s website (wellsfargoadvantagefunds.com) on a monthly, 30-day or more delayed basis. In addition, top ten holdings information for the Fund is publicly available on the Fund’s website on a monthly, seven-day or more delayed basis. The Fund files its complete schedule of portfolio holdings with the SEC for the first and third quarters of each fiscal year on Form N-Q, which is available without charge by visiting the SEC website at sec.gov. In addition, the Fund’s Form N-Q may be reviewed and copied at the SEC’s Public Reference Room in Washington, DC, and at regional offices in New York City, at 233 Broadway, and in Chicago, at 175 West Jackson Boulevard, Suite 900. Information about the Public Reference Room may be obtained by calling 1-800-SEC-0330.
Table of Contents
| Other information (unaudited) | Wells Fargo Advantage VT Index Asset Allocation Fund | 37 |
BOARD OF TRUSTEES AND OFFICERS
Each of the Trustees and Officers listed in the table below acts in identical capacities for each fund in the Wells Fargo Advantage family of funds, which consists of 132 mutual funds1 comprising the Wells Fargo Funds Trust, Wells Fargo Variable Trust, Wells Fargo Master Trust and four closed-end funds (collectively the “Fund Complex”). This table should be read in conjunction with the Prospectus and the Statement of Additional Information2. All of the Trustees are also Members of the Audit and Governance Committees of each Trust in the Fund Complex. The mailing address of each Trustee and Officer is 525 Market Street, 12th Floor, San Francisco, CA 94105. Each Trustee and Officer serves an indefinite term, however, each Trustee serves such term until reaching the mandatory retirement age established by the Trustees.
Independent Trustees
Name and year of birth | Position held and length of service* | Principal occupations during past five years | Other directorships during | |||
| Peter G. Gordon (Born 1942) | Trustee, since 1998; Chairman, since 2005 | Co-Founder, Retired Chairman, President and CEO of Crystal Geyser Water Company. Trustee Emeritus, Colby College. | Asset Allocation Trust | |||
| Isaiah Harris, Jr. (Born 1952) | Trustee, since 2009 | Retired. Prior thereto, President and CEO of BellSouth Advertising and Publishing Corp. from 2005 to 2007, President and CEO of BellSouth Enterprises from 2004 to 2005 and President of BellSouth Consumer Services from 2000 to 2003. Emeritus member of the Iowa State University Foundation Board of Governors. Emeritus Member of the Advisory Board of Iowa State University School of Business. Advisory Board Member, Palm Harbor Academy (charter school). Mr. Harris is a certified public accountant. | CIGNA Corporation; Deluxe Corporation; Asset Allocation Trust | |||
| Judith M. Johnson (Born 1949) | Trustee, since 2008; Audit Committee Chairman, since 2008 | Retired. Prior thereto, Chief Executive Officer and Chief Investment Officer of Minneapolis Employees Retirement Fund from 1996 to 2008. Ms. Johnson is an attorney, certified public accountant and a certified managerial accountant. | Asset Allocation Trust | |||
| Leroy Keith, Jr. (Born 1939) | Trustee, since 2010 | Chairman, Bloc Global Services (development and construction). Trustee of the Evergreen Funds from 1983 to 2010. Former Managing Director, Almanac Capital Management (commodities firm), former Partner, Stonington Partners, Inc. (private equity fund), former Director, Obagi Medical Products 12/16/13); Asset Co. and former Director, Lincoln Educational Services. | Trustee, Virtus Fund Complex (consisting of 50 portfolios as of Allocation Trust | |||
| David F. Larcker (Born 1950) | Trustee, since 2009 | James Irvin Miller Professor of Accounting at the Graduate School of Business, Stanford University, Morgan Stanley Director of the Center for Leadership Development and Research and Senior Faculty of The Rock Center for Corporate Governance since 2006. From 2005 to 2008, Professor of Accounting at the Graduate School of Business, Stanford University. Prior thereto, Ernst & Young Professor of Accounting at The Wharton School, University of Pennsylvania from 1985 to 2005. | Asset Allocation Trust | |||
| Olivia S. Mitchell (Born 1953) | Trustee, since 2006 | International Foundation of Employee Benefit Plans Professor, Wharton School of the University of Pennsylvania since 1993. Director of Wharton’s Pension Research Council and Boettner Center on Pensions & Retirement Research, and Research Associate at the National Bureau of Economic Research. Previously, Cornell University Professor from 1978 to 1993. | Asset Allocation Trust | |||
| Timothy J. Penny (Born 1951) | Trustee, since 1996 | President and CEO of Southern Minnesota Initiative Foundation, a non-profit organization, since 2007 and Senior Fellow at the Humphrey Institute Policy Forum at the University of Minnesota since 1995. Member of the Board of Trustees of NorthStar Education Finance, Inc., a non-profit organization, since 2007. | Asset Allocation Trust |
Table of Contents
| 38 | Wells Fargo Advantage VT Index Asset Allocation Fund | Other information (unaudited) |
Name and year of birth | Position held and length of service* | Principal occupations during past five years | Other directorships during | |||
| Michael S. Scofield (Born 1943) | Trustee, since 2010 | Served on the Investment Company Institute’s Board of Governors and Executive Committee from 2008-2011 as well the Governing Council of the Independent Directors Council from 2006-2011 and the Independent Directors Council Executive Committee from 2008-2011. Chairman of the IDC from 2008-2010. Institutional Investor (Fund Directions) Trustee of Year in 2007. Trustee of the Evergreen Funds (and its predecessors) from 1984 to 2010. Chairman of the Evergreen Funds from 2000-2010. Former Trustee of the Mentor Funds. Retired Attorney, Law Offices of Michael S. Scofield. | Asset Allocation Trust | |||
| Donald C. Willeke (Born 1940) | Trustee, since 1996 | Principal of the law firm of Willeke & Daniels. General Counsel of the Minneapolis Employees Retirement Fund from 1984 until its consolidation into the Minnesota Public Employees Retirement Association on June 30, 2010. Director and Vice Chair of The Tree Trust (non-profit corporation). Director of the American Chestnut Foundation (non-profit corporation). | Asset Allocation Trust |
| * | Length of service dates reflect the Trustee’s commencement of service with the Trust’s predecessor entities, where applicable. |
Officers
Name and year of birth | Position held and length of service | Principal occupations during past five years | ||||
| Karla M. Rabusch (Born 1959) | President, since 2003 | Executive Vice President of Wells Fargo Bank, N.A. and President of Wells Fargo Funds Management, LLC since 2003. | ||||
| Jeremy DePalma1 (Born 1974) | Treasurer, since 2012 | Senior Vice President of Wells Fargo Funds Management, LLC since 2009. Senior Vice President of Evergreen Investment Management Company, LLC from 2008 to 2010. Vice President, Evergreen Investment Services, Inc. from 2004 to 2007. Head of the Fund Reporting and Control Team within Fund Administration from 2005 to 2010. | ||||
| C. David Messman (Born 1960) | Secretary, since 2000; Chief Legal Officer, since 2003 | Senior Vice President and Secretary of Wells Fargo Funds Management, LLC since 2001. Vice President and Managing Counsel of Wells Fargo Bank, N.A. since 1996. | ||||
Debra Ann Early (Born 1964) | Chief Compliance Officer, since 2007 | Chief Compliance Officer of Wells Fargo Funds Management, LLC since 2007. Chief Compliance Officer of Parnassus Investments from 2005 to 2007. Chief Financial Officer of Parnassus Investments from 2004 to 2007. | ||||
David Berardi (Born 1975) | Assistant Treasurer, since 2009 | Vice President of Wells Fargo Funds Management, LLC since 2009. Vice President of Evergreen Investment Management Company, LLC from 2008 to 2010. Assistant Vice President of Evergreen Investment Services, Inc. from 2004 to 2008. Manager of Fund Reporting and Control for Evergreen Investment Management Company, LLC from 2004 to 2010. |
| 1. | Jeremy DePalma acts as Treasurer of 59 funds and Assistant Treasurer of 73 funds in the Fund Complex. |
| 2. | The Statement of Additional Information includes additional information about the Trustees and is available, without charge, upon request, by calling 1-800-222-8222 or by visiting the website at wellsfargoadvantagefunds.com. |
Table of Contents
| List of abbreviations | Wells Fargo Advantage VT Index Asset Allocation Fund | 39 |
The following is a list of common abbreviations for terms and entities that may have appeared in this report.
| ACA | — ACA Financial Guaranty Corporation |
| ADR | — American depositary receipt |
| ADS | — American depositary shares |
| AGC | — Assured Guaranty Corporation |
| AGM | — Assured Guaranty Municipal |
| Ambac | — Ambac Financial Group Incorporated |
| AMT | — Alternative minimum tax |
| AUD | — Australian dollar |
| BAN | — Bond anticipation notes |
| BHAC | — Berkshire Hathaway Assurance Corporation |
| BRL | — Brazilian real |
| CAB | — Capital appreciation bond |
| CAD | — Canadian dollar |
| CCAB | — Convertible capital appreciation bond |
| CDA | — Community Development Authority |
| CDO | — Collateralized debt obligation |
| CHF | — Swiss franc |
| COP | — Certificate of participation |
| DKK | — Danish krone |
| DRIVER | — Derivative inverse tax-exempt receipts |
| DW&P | — Department of Water & Power |
| DWR | — Department of Water Resources |
| ECFA | — Educational & Cultural Facilities Authority |
| EDA | — Economic Development Authority |
| EDFA | — Economic Development Finance Authority |
| ETF | — Exchange-traded fund |
| EUR | — Euro |
| FDIC | — Federal Deposit Insurance Corporation |
| FFCB | — Federal Farm Credit Banks |
| FGIC | — Financial Guaranty Insurance Corporation |
| FHA | — Federal Housing Administration |
| FHLB | — Federal Home Loan Bank |
| FHLMC | — Federal Home Loan Mortgage Corporation |
| FICO | — The Financing Corporation |
| FNMA | — Federal National Mortgage Association |
| FSA | — Farm Service Agency |
| GBP | — Great British pound |
| GDR | — Global depositary receipt |
| GNMA | — Government National Mortgage Association |
| GO | — General obligation |
| HCFR | — Healthcare facilities revenue |
| HEFA | — Health & Educational Facilities Authority |
| HEFAR | — Higher education facilities authority revenue |
| HFA | — Housing Finance Authority |
| HFFA | — Health Facilities Financing Authority |
| HKD | — Hong Kong dollar |
| HUD | — Department of Housing and Urban Development |
| HUF | — Hungarian forint |
| IDA | — Industrial Development Authority |
| IDAG | — Industrial Development Agency |
| IDR | — Industrial development revenue |
| IEP | — Irish pound |
| JPY | — Japanese yen |
| KRW | — Republic of Korea won |
| LIBOR | — London Interbank Offered Rate |
| LIQ | — Liquidity agreement |
| LLC | — Limited liability company |
| LLP | — Limited liability partnership |
| LOC | — Letter of credit |
| LP | — Limited partnership |
| MBIA | — Municipal Bond Insurance Association |
| MFHR | — Multifamily housing revenue |
| MSTR | — Municipal securities trust receipts |
| MTN | — Medium-term note |
| MUD | — Municipal Utility District |
| MXN | — Mexican peso |
| MYR | — Malaysian ringgit |
| National | — National Public Finance Guarantee Corporation |
| NGN | — Nigerian naira |
| NOK | — Norwegian krone |
| NZD | — New Zealand dollar |
| PCFA | — Pollution Control Financing Authority |
| PCL | — Public Company Limited |
| PCR | — Pollution control revenue |
| PFA | — Public Finance Authority |
| PFFA | — Public Facilities Financing Authority |
| PFOTER | — Puttable floating option tax-exempt receipts |
| plc | — Public limited company |
| PLN | — Polish zloty |
| PUTTER | — Puttable tax-exempt receipts |
| R&D | — Research & development |
| Radian | — Radian Asset Assurance |
| RAN | — Revenue anticipation notes |
| RDA | — Redevelopment Authority |
| RDFA | — Redevelopment Finance Authority |
| REIT | — Real estate investment trust |
| ROC | — Reset option certificates |
| RON | — Romanian lei |
| RUB | — Russian ruble |
| SAVRS | — Select auction variable rate securities |
| SBA | — Small Business Authority |
| SEK | — Swedish krona |
| SFHR | — Single-family housing revenue |
| SFMR | — Single-family mortgage revenue |
| SGD | — Singapore dollar |
| SKK | — Slovakian koruna |
| SPA | — Standby purchase agreement |
| SPDR | — Standard & Poor’s Depositary Receipts |
| STRIPS | — Separate trading of registered interest and principal securities |
| TAN | — Tax anticipation notes |
| TBA | — To be announced |
| THB | — Thai baht |
| TIPS | — Treasury inflation-protected securities |
| TRAN | — Tax revenue anticipation notes |
| TRY | — Turkish lira |
| TTFA | — Transportation Trust Fund Authority |
| TVA | — Tennessee Valley Authority |
| ZAR | — South African rand |
Table of Contents
This page is intentionally left blank.
Table of Contents


For more information
More information about Wells Fargo Advantage Funds is available free upon request. To obtain literature, please write, email, visit the Fund’s website, or call:
Wells Fargo Advantage Funds
P.O. Box 8266
Boston, MA 02266-8266
Email: wfaf@wellsfargo.com
Website: wellsfargoadvantagefunds.com
Individual investors: 1-800-222-8222
Retail investment professionals: 1-888-877-9275
Institutional investment professionals: 1-866-765-0778
This report and the financial statements contained herein are submitted for the general information of the shareholders of Wells Fargo Advantage Funds. If this report is used for promotional purposes, distribution of the report must be accompanied or preceded by a current prospectus. For a current prospectus and, if available, a summary prospectus containing more complete information, including charges and expenses, call 1-800-222-8222 or visit the Fund’s website at wellsfargoadvantagefunds.com . Please consider the investment objectives, risks, charges, and expenses of the investment carefully before investing. This and other information about Wells Fargo Advantage Funds can be found in the current prospectus. Read the prospectus carefully before you invest or send money.
Wells Fargo Funds Management, LLC, a wholly owned subsidiary of Wells Fargo & Company, provides investment advisory and administrative services for Wells Fargo Advantage Funds. Other affiliates of Wells Fargo & Company provide subadvisory and other services for the Funds. The Funds are distributed by Wells Fargo Funds Distributor, LLC, Member FINRA/SIPC, an affiliate of Wells Fargo & Company.
NOT FDIC INSURED ¡ NO BANK GUARANTEE ¡ MAY LOSE VALUE
© 2014 Wells Fargo Funds Management, LLC. All rights reserved.
222093 02-14 AVT2/AR148 12-13 |
Table of Contents

Wells Fargo Advantage
VT International Equity Fund

Annual Report
December 31, 2013

Table of Contents
Reduce clutter. Save trees.
Sign up for electronic delivery of prospectuses and shareholder reports at wellsfargo.com/advantagedelivery
| 2 | ||||
| 4 | ||||
| 8 | ||||
| 9 | ||||
| 12 | ||||
| 13 | ||||
| 14 | ||||
| 15 | ||||
| 17 | ||||
| 23 | ||||
| 24 | ||||
| 27 | ||||
The views expressed and any forward-looking statements are as of December 31, 2013, unless otherwise noted, and are those of the Fund managers and/or Wells Fargo Funds Management, LLC. Discussions of individual securities, or the markets generally, or any Wells Fargo Advantage Fund are not intended as individual recommendations. Future events or results may vary significantly from those expressed in any forward-looking statements; the views expressed are subject to change at any time in response to changing circumstances in the market. Wells Fargo Funds Management, LLC and the Fund disclaim any obligation to publicly update or revise any views expressed or forward-looking statements.
NOT FDIC INSURED ¡ NO BANK GUARANTEE ¡ MAY LOSE VALUE
Table of Contents
| 2 | Wells Fargo Advantage VT International Equity Fund | Letter to shareholders (unaudited) |

Karla M. Rabusch
President
Wells Fargo Advantage Funds
Major central banks continued to inject liquidity into the banks and the markets through various quantitative easing policies.
European stock markets generally benefited from reduced uncertainty about a possible breakup of the eurozone.
Dear Valued Shareholder:
We are pleased to offer you this annual report for the Wells Fargo Advantage VT International Equity Fund for the 12-month period that ended December 31, 2013. Much of the period was marked by monetary easing by global central banks. Despite near-term volatility caused by a shutdown of the U.S. government, increased confidence that the U.S. economy was staging a fragile recovery combined with resilience in European economies and encouraging news out of Japan fueled double-digit returns for major developed stock market indexes during the 12-month reporting period. Emerging markets lagged their developed counterparts, though.
Central banks continued to provide stimulus.
Major central banks continued to inject liquidity into the banks and the markets through various quantitative easing policies. Throughout the reporting period, the Federal Open Market Committee (FOMC)—the Federal Reserve’s (Fed’s) monetary policymaking body—kept its key interest rate near zero in order to support the economy and the financial system. Entering the reporting period, the FOMC had committed to purchase $40 billion per month in mortgage-backed securities to support the housing market and $45 billion per month in long-term U.S. Treasuries to keep interest rates low. Because the markets benefited from the FOMC’s liquidity, both stocks and bonds initially sold off after the FOMC indicated in May 2013 that it might reduce (or taper) its bond-buying program. In mid-December 2013, the FOMC announced that it would reduce its bond-buying program by $10 billion per month beginning in January 2014. The tapering was less aggressive than some investors had feared, and the markets ended 2013 strongly.
European markets continued to benefit from the European Central Bank’s (ECB’s) September 2012 announcement that it would purchase an unlimited amount of one- to three-year sovereign debt from countries that had formally applied for a bailout. As a result, when the tiny eurozone nation of Cyprus was forced to implement capital controls and impose losses on uninsured bank depositors in March 2013, global stock markets remained resilient despite short-term volatility. In May 2013, the ECB cut its key rate to a then-historic low of 0.5%. The ECB’s aggressive actions helped ease investor worries about a eurozone sovereign debt default. Given the substantial ties between the U.S. and Europe, the improved sentiment about the eurozone helped provide a tailwind for U.S. markets.
Finally, in a bid to fight Japan’s ongoing deflation, the Bank of Japan announced an aggressive bond-buying program aimed at achieving a 2% annual inflation rate.
Developed markets stocks gained on relatively good news.
For most of the period, U.S. economic data remained moderately positive, gaining strength as the period progressed. Reported gross domestic product growth came in at a solid 1.1% annualized rate in the first quarter of 2013, a 2.5% annualized rate in the second quarter, a 4.1% annualized rate in the third quarter, and a 3.2% annualized rate (an advance estimate as of January 31, 2014) in the fourth quarter. The most significant negative effect was the ongoing fight in Washington, D.C., over the federal budget and debt limit, a dispute that was temporarily resolved only toward the end of the period.
European stock markets generally benefited from reduced uncertainty about a possible breakup of the eurozone. Later in the period, signs emerged that the eurozone was exiting its long-lived recession, further boosting European stock markets. In late September 2013, Germany’s federal election returned German Chancellor Angela Merkel to power as her party won a plurality of seats in the lower house of parliament. The election seemed to signal that there would not be significant changes in Europe’s most significant economy. In Japan, Prime Minister Shinzo Abe’s efforts to rejuvenate the economy showed early success, as Japan’s GDP increased for three quarters in a row beginning in the first quarter of 2013, and Japan’s stock market rallied for most of the period.
Table of Contents
| Letter to shareholders (unaudited) | Wells Fargo Advantage VT International Equity Fund | 3 |
Even though developed equity markets soared during the 12-month period, emerging markets languished. Much of the difference between developed and emerging markets equity returns came after the FOMC indicated in May 2013 that it might reduce (or taper) its bond-buying program. The potential end of the Fed’s quantitative easing program, a significant source of global liquidity, had a more significant effect on emerging markets than on developed markets. In addition, slower economic growth numbers from China and a combination of slower growth and higher inflation in India caused investors to worry about the prospects of larger emerging economies. Smaller markets, such as the Philippines and Taiwan, delivered strong returns for the full reporting period, even though investor worries about their reliance on external funding caused these markets to lag in the final months.
Don’t let short-term uncertainty derail long-term investment goals.
While periods of uncertainty can present challenges, they can also create opportunities, and experience has taught us that maintaining long-term investment goals can be an effective way to plan for the future. Although diversification cannot guarantee an investment profit or prevent losses, we believe it can be an effective way to manage investment risk and potentially smooth out overall portfolio performance. We encourage investors to know their investments and to understand that appropriate levels of risk-taking may unlock opportunities.
Thank you for choosing to invest with Wells Fargo Advantage Funds. We appreciate your confidence in us and remain committed to helping you meet your financial needs. For current information about your fund investments, contact your investment professional, visit our website at wellsfargoadvantagefunds.com, or call us directly at 1-800-222-8222. We are available 24 hours a day, 7 days a week.
Sincerely,

Karla M. Rabusch
President
Wells Fargo Advantage Funds
Notice to shareholders
The Fund and Funds Management, LLC (“Funds Management”) have received an exemptive order from the SEC that permits Funds Management, subject to the approval of the Board of Trustees of the Fund, to select or replace certain subadvisers to manage all or a portion of the Fund’s assets and enter into, amend or terminate a sub-advisory agreement with certain subadvisers without obtaining shareholder approval (“Multi-manager Structure”). The Multi-manager Structure applies to subadvisers that are not affiliated with Funds Management or the Fund, except to the extent that affiliation arises solely because such subadvisers provide sub-advisory services to the Fund (“Non-affiliated Subadvisers”), as well as subadvisers that are indirect or direct wholly-owned subsidiaries of Funds Management or of another company that, indirectly or directly, wholly owns Funds Management (“Wholly-owned Subadvisers”).
Pursuant to the SEC order, Funds Management, with the approval of the Board of Trustees, has the discretion to terminate any subadvisers and allocate and reallocate the Fund’s assets among any other Non-affiliated Subadvisers or Wholly-owned Subadvisers. Funds Management, subject to oversight and supervision by the Board of Trustees, has responsibility to continue to oversee any subadvisers to the Fund and to recommend, for approval by the Board of Trustees, the hiring, termination and replacement of subadvisers for the Fund. In the event that a new subadviser is hired pursuant to the Multi-manager Structure, the Fund is required to provide notice to shareholders within 90 days.
Please contact your investment professional or call us directly at 1-800-222-8222 if you have any questions on this Notice to Shareholders.
Table of Contents
| 4 | Wells Fargo Advantage VT International Equity Fund | Performance highlights (unaudited) |
Investment objective
The Fund seeks long-term capital appreciation.
Adviser
Wells Fargo Funds Management, LLC
Subadviser
Wells Capital Management Incorporated
Portfolio managers
Jeffrey Everett, CFA
Dale A. Winner, CFA
Average annual total returns1 (%) as of December 31, 2013
| Expense ratios2 (%) | ||||||||||||||||||||||||
| Inception date | 1 year | 5 year | 10 year | Gross | Net3 | |||||||||||||||||||
| Class 1 | 8-17-1998 | 19.94 | 10.00 | 6.32 | 0.99 | 0.70 | ||||||||||||||||||
| Class 2 | 7-31-2002 | 19.52 | 9.71 | 6.05 | 1.24 | 0.95 | ||||||||||||||||||
| MSCI ACWI ex USA (Net)4 | – | 15.29 | 12.81 | 7.57 | – | – | ||||||||||||||||||
Figures quoted represent past performance, which is no guarantee of future results and do not reflect the deduction of taxes that a shareholder may pay on fund distributions or the redemption of fund shares. Investment return and principal value of an investment will fluctuate so that an investor’s shares, when redeemed, may be worth more or less than their original cost. Current performance may be lower or higher than the performance data quoted, which assumes the reinvestment of dividends and capital gains. Current month-end performance is available by calling 1-800-222-8222. Performance figures of the Fund do not reflect fees charged pursuant to the terms of variable life insurance policies and variable annuity contracts. If fees had been reflected, performance would have been lower.
Index returns do not include transaction costs associated with buying and selling securities, any mutual fund fees or expenses, or any taxes. It is not possible to invest directly in an index.
Stock values fluctuate in response to the activities of individual companies and general market and economic conditions. Foreign investments are especially volatile and can rise or fall dramatically due to differences in the political and economic conditions of the host country. These risks are generally intensified in emerging markets. The use of derivatives may reduce returns and/or increase volatility. Certain investment strategies tend to increase the total risk of an investment (relative to the broader market). The Fund is exposed to smaller-company securities risk. Consult the Fund’s prospectus for additional information on these and other risks.
Please refer to the prospectus provided by your participating insurance company for detailed information describing the separate accounts for information regarding surrender charges, mortality and expense risk fees, and other charges that may be assessed by the participating insurance companies.
Please see footnotes on page 5.
Table of Contents
| Performance highlights (unaudited) | Wells Fargo Advantage VT International Equity Fund | 5 |
| Growth of $10,000 investment5 as of December 31, 2013 |
|
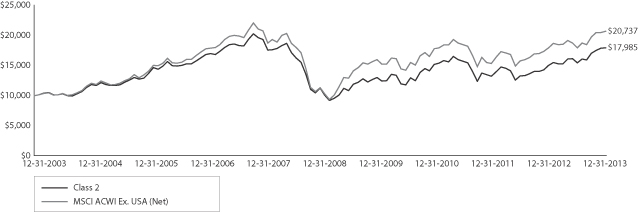
| 1. | Historical performance shown for all classes of the Fund prior to July 19, 2010, is based on the performance of the Fund’s predecessor, Evergreen VA International Equity Fund. Effective July 16, 2010, the Fund changed its name from Wells Fargo Advantage VT International Core Fund to Wells Fargo Advantage VT International Equity Fund. |
| 2. | Reflects the expense ratios as stated in the most recent prospectuses. |
| 3. | The Adviser has committed through April 30, 2014, to waive fees and/or reimburse expenses to the extent necessary to cap the Fund’s Total Annual Fund Operating Expenses After Fee Waiver, excluding certain expenses, at 0.69% for Class 1 and 0.94% for Class 2. Brokerage commissions, stamp duty fees, interest, taxes, acquired fund fees and expenses, and extraordinary expenses are excluded from the cap. Without this cap, the Fund’s returns would have been lower. |
| 4. | The Morgan Stanley Capital International All Country World ex. USA (MSCI ACWI ex. USA) Index (Net) is a free float-adjusted market capitalization weighted index that is designed to measure the equity market performance of developed and emerging markets excluding the United States. You cannot invest directly in an index. Source: MSCI. MSCI makes no express or implied warranties or representations and shall have no liability whatsoever with respect to any MSCI data contained herein. The MSCI data may not be further redistributed or used as a basis for other indexes or any securities or financial products. This report is not approved, reviewed, or produced by MSCI. |
| 5. | The chart compares the performance of Class 2 shares for the most recent ten years with the MSCI ACWI ex. USA (Net). The chart assumes a hypothetical $10,000 investment and reflects all operating expenses of the Fund. Performance figures of the Fund do not reflect fees charged pursuant to the terms of variable life insurance policies and variable annuity contracts. |
| 6. | The ten largest equity holdings are calculated based on the value of the securities divided by total net assets of the Fund. Holdings are subject to change and may have changed since the date specified. |
| 7. | Sector distribution is subject to change and is calculated based on the total long-term investments of the Fund. |
Table of Contents
| 6 | Wells Fargo Advantage VT International Equity Fund | Performance highlights (unaudited) |
MANAGER’S DISCUSSION
Fund highlights
| n | The Fund outperformed its benchmark, the MSCI ACWI ex USA (Net), for the 12-month period that ended December 31, 2013. |
| n | The Fund stands out for its overweight in many leading Japanese companies and rising exposures in undervalued European companies. European holdings generally aided results. Our results in Japan were also favorable, aided by our decision to hedge part of the portfolio’s yen exposure. |
| n | Holdings in the consumer discretionary sector detracted from relative results. |
The Fund generated positive performance in absolute terms and relative to the MSCI ACWI ex USA Index (Net) in 2013. The investment team continued to employ our approach to fundamental research, searching globally for long-term, non-consensus values while maintaining a strong focus on risk management.
| Ten largest equity holdings6 (%) as of December 31, 2013 | ||||
Daiwa Securities Group Incorporated | 3.22 | |||
Toyota Motor Corporation | 3.06 | |||
Zurich Financial Services AG | 3.00 | |||
Valeant Pharmaceuticals International Incorporated | 2.95 | |||
Mitsubishi UFJ Financial Group Incorporated | 2.83 | |||
BP plc | 2.80 | |||
Vodafone Group plc ADR | 2.62 | |||
Metro AG | 2.56 | |||
ENI SpA | 2.52 | |||
Siemens AG | 2.52 | |||
Both stock selection and regional exposures aided results in a favorable year for our investment style.
The Fund stands out for its overweight in many leading Japanese companies and rising exposures to undervalued European companies; both geographic regions generated positive stock-specific and allocation attribution. Results in Japan were aided by our decision to partially hedge the portfolio’s yen exposure, taking a yen overweight down to a benchmark weighting. Our underweight in emerging markets equities and the corresponding underweight in emerging markets currencies also contributed to positive performance during the reporting period. Looking at individual stocks, the top-performing positions included Daiwa Securities Group Incorporated, Valeant Pharmaceuticals International Incorporated, Metro AG, Vodafone Group plc, and Intesa Sanpaolo SpA.
Holdings in the consumer discretionary sector detracted from relative results, with Debenhams plc a notable laggard. Debenhams shares weakened in the latter part of the reporting period after the company said that costs were running higher than expected, putting pressure on its margins. Other poor-performing positions included Barrick Gold Corporation, which we no longer hold, Hengdeli Holdings Limited, China Everbright Limited, and Nitto Denko Corporation.
During the 12-month period, we resized specific equity positions based on their valuations relative to market expectations, which resulted in higher exposures to Japan and to a number of European markets, including the U.K., Germany, Switzerland, and Italy. Valuations of many stocks in both Europe and Japan were among the cheapest of all developed markets at midyear and remain so as of this writing.
We remain overweight in industrial specialty and conglomerates, wireless telecommunications, and department stores, while our bottom-up research process has resulted in an underweight in major banks, pharmaceuticals, and oil and gas equities.
Please see footnotes on page 5.
Table of Contents
| Performance highlights (unaudited) | Wells Fargo Advantage VT International Equity Fund | 7 |
| Sector distribution7 as of December 31, 2013 | ||
| ||
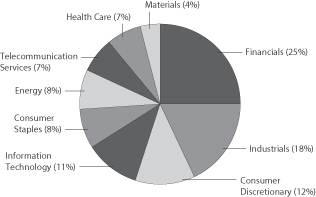
We continue to see opportunities in Europe and Japan.
Given a European environment that we believe will likely experience continued negative pressure on regional economic growth, we are finding a number of highly attractive and undervalued stock ideas, many of which benefit from self-sustaining, self-help, or value-with-catalyst characteristics. We believe that Siemens AG is one such company. A large German industrial conglomerate, Siemens, recently embarked on a firmwide restructuring with a goal of reaching its target of 12% margins over the next five years. Another example is Vodafone, a U.K.-based mobile telecommunications provider undergoing a large-scale restructuring, most recently with the sale of its stake in Verizon Wireless. The sale not only generated proceeds
for shareholders but also left a core business benefiting from an aggressive capital expenditure plan and a valuation discount to its European telecommunications peers.
Our primary Asian investments remain Japanese stocks, many of which are benefiting not just from new economic policies under Prime Minister Shinzo Abe but also from extremely strong earnings growth, low valuations relative to their history and to other global markets, and, perhaps most striking, a general lack of investor interest in Japan—despite the voluminous ink devoted to Prime Minister Abe, the Bank of Japan, and their master plan to rejuvenate the Japanese economy. We have focused on Japanese companies with strong and improving profitability, as we believe that Japan will develop a two-tiered market, with highly profitable companies that possess leading global technologies, products, or competitive positions gaining investment at the expense of highly leveraged, poorly profitable companies. We have identified Japanese investments based on their own merits, but, in many cases, these companies should also benefit from the potential continued reflation in local markets and the steady decline of the yen from its 2012 peak levels.
Looking ahead, we remain particularly watchful of ongoing developments in Europe, Japan, and emerging markets, and in our opinion, the inherent volatility and uncertainty caused by ongoing macroeconomic challenges should provide buying opportunities for fundamentally driven investors. While 2013 proved to be a year when markets rallied strongly in spite of significant investor anxiety, we believe that 2014 is likely to be a year in which reduced investor anxiety helps global growth, which would be a favorable backdrop for global equities.
Please see footnotes on page 5.
Table of Contents
| 8 | Wells Fargo Advantage VT International Equity Fund | Fund expenses (unaudited) |
As a shareholder of the Fund, you incur ongoing costs, including management fees, distribution (12b-1) fees, and other Fund expenses. This example is intended to help you understand your ongoing costs (in dollars) of investing in the Fund and to compare these costs with the ongoing costs of investing in other mutual funds.
The example is based on an investment of $1,000 invested at the beginning of the six-month period and held for the entire period from July 1, 2013 to December 31, 2013.
Actual expenses
The “Actual” line of the table below provides information about actual account values and actual expenses. You may use the information in this line, together with the amount you invested, to estimate the expenses that you paid over the period. Simply divide your account value by $1,000 (for example, an $8,600 account value divided by $1,000 = 8.6), then multiply the result by the number in the “Actual” line under the heading entitled “Expenses Paid During Period” for your applicable class of shares to estimate the expenses you paid on your account during this period.
Hypothetical example for comparison purposes
The “Hypothetical” line of the table below provides information about hypothetical account values and hypothetical expenses based on the Fund’s actual expense ratio and an assumed rate of return of 5% per year before expenses, which is not the Fund’s actual return. The hypothetical account values and expenses may not be used to estimate the actual ending account balance or expenses you paid for the period. You may use this information to compare the ongoing costs of investing in the Fund and other funds. To do so, compare this 5% hypothetical example with the 5% hypothetical examples that appear in the shareholder reports of the other funds.
Please note that the expenses shown in the table are meant to highlight your ongoing costs only and do not reflect any separate account charges assessed by participating insurance companies. Therefore, the “Hypothetical” line of the table is useful in comparing ongoing costs only, and will not help you determine the relative total costs of owning different funds. In addition, if these separate account charges assessed by participating insurance companies were included, your costs would have been higher.
| Beginning account value 7-1-2013 | Ending account value 12-31-2013 | Expenses paid during the period1 | Net annual expense ratio | |||||||||||||
Class 1 | ||||||||||||||||
Actual | $ | 1,000.00 | $ | 1,164.02 | $ | 3.76 | 0.69 | % | ||||||||
Hypothetical (5% return before expenses) | $ | 1,000.00 | $ | 1,021.73 | $ | 3.52 | 0.69 | % | ||||||||
Class 2 | ||||||||||||||||
Actual | $ | 1,000.00 | $ | 1,162.40 | $ | 5.12 | 0.94 | % | ||||||||
Hypothetical (5% return before expenses) | $ | 1,000.00 | $ | 1,020.47 | $ | 4.79 | 0.94 | % | ||||||||
| 1. | Expenses paid is equal to the annualized expense ratio of each class multiplied by the average account value over the period, multiplied by the number of days in the most recent fiscal half-year divided by the number of days in the fiscal year (to reflect the one-half year period). |
Table of Contents
| Portfolio of investments—December 31, 2013 | Wells Fargo Advantage VT International Equity Fund | 9 |
| Security name | Shares | Value | ||||||||||
Common Stocks: 96.51% | ||||||||||||
| Canada: 4.03% | ||||||||||||
Cenovus Energy Incorporated (Energy, Oil, Gas & Consumable Fuels) | 136,171 | $ | 3,901,299 | |||||||||
Valeant Pharmaceuticals International Incorporated (Health Care, Pharmaceuticals) † | 90,967 | 10,679,526 | ||||||||||
| 14,580,825 | ||||||||||||
|
| |||||||||||
| China: 4.48% | ||||||||||||
AutoNavi Holdings Limited ADR (Information Technology, Software) †« | 146,602 | 2,089,079 | ||||||||||
Biostime International Holdings Limited (Consumer Staples, Food Products) | 368,000 | 3,281,689 | ||||||||||
Dongfeng Motor Group Company Limited (Consumer Discretionary, Automobiles) | 1,764,000 | 2,761,688 | ||||||||||
Industrial & Commercial Bank of China Limited Class H (Financials, Commercial Banks) | 6,727,000 | 4,545,798 | ||||||||||
Xtep International Holdings Limited (Consumer Discretionary, Textiles, Apparel & Luxury Goods) | 6,827,453 | 3,521,893 | ||||||||||
| 16,200,147 | ||||||||||||
|
| |||||||||||
| Germany: 8.86% | ||||||||||||
Bayer AG (Health Care, Pharmaceuticals) | 50,081 | 7,023,988 | ||||||||||
Metro AG (Consumer Staples, Food & Staples Retailing) | 191,381 | 9,267,552 | ||||||||||
SAP AG (Information Technology, Software) | 77,607 | 6,652,459 | ||||||||||
Siemens AG (Industrials, Industrial Conglomerates) | 66,587 | 9,095,331 | ||||||||||
| 32,039,330 | ||||||||||||
|
| |||||||||||
| Hong Kong: 5.72% | ||||||||||||
China Everbright Limited (Financials, Capital Markets) | 5,196,000 | 8,215,179 | ||||||||||
China Mobile Limited (Telecommunication Services, Wireless Telecommunication Services) | 646,000 | 6,698,013 | ||||||||||
Hengdeli Holdings Limited (Consumer Discretionary, Specialty Retail) | 24,377,213 | 5,752,976 | ||||||||||
| 20,666,168 | ||||||||||||
|
| |||||||||||
| Italy: 5.29% | ||||||||||||
ENI SpA (Energy, Oil, Gas & Consumable Fuels) | 378,375 | 9,104,074 | ||||||||||
Intesa Sanpaolo SpA (Financials, Commercial Banks) | 3,255,808 | 8,035,349 | ||||||||||
Intesa Sanpaolo SpA - RSP (Financials, Commercial Banks) | 984,020 | 1,980,486 | ||||||||||
| 19,119,909 | ||||||||||||
|
| |||||||||||
| Japan: 24.77% | ||||||||||||
Asahi Glass Company Limited (Industrials, Building Products) | 982,000 | 6,098,452 | ||||||||||
Avex Group Holdings Incorporated (Consumer Discretionary, Media) | 129,400 | 2,776,982 | ||||||||||
Capcom Company Limited (Information Technology, Software) | 372,200 | 6,669,275 | ||||||||||
Daiichikosho Company Limited (Consumer Discretionary, Media) | 64,900 | 1,834,037 | ||||||||||
Daiwa House Industry Company Limited (Financials, Real Estate Management & Development) | 315,000 | 6,087,029 | ||||||||||
Daiwa Securities Group Incorporated (Financials, Capital Markets) | 1,167,000 | 11,635,647 | ||||||||||
Hitachi Limited (Information Technology, Electronic Equipment, Instruments & Components) | 696,000 | 5,260,811 | ||||||||||
Itochu Corporation (Industrials, Trading Companies & Distributors) | 413,500 | 5,100,527 | ||||||||||
Mitsubishi UFJ Financial Group Incorporated (Financials, Commercial Banks) | 1,555,500 | 10,250,850 | ||||||||||
Mitsui Fudosan Company Limited (Financials, Real Estate Management & Development) | 165,000 | 5,930,348 | ||||||||||
Mitsui OSK Lines Limited (Industrials, Marine) | 1,556,000 | 7,003,551 | ||||||||||
Nitto Denko Corporation (Materials, Chemicals) | 150,782 | 6,349,997 | ||||||||||
Sharp Corporation (Consumer Discretionary, Household Durables) † | 1,102,000 | 3,495,091 | ||||||||||
Toyota Motor Corporation (Consumer Discretionary, Automobiles) | 181,500 | 11,064,761 | ||||||||||
| 89,557,358 | ||||||||||||
|
| |||||||||||
The accompanying notes are an integral part of these financial statements.
Table of Contents
| 10 | Wells Fargo Advantage VT International Equity Fund | Portfolio of investments—December 31, 2013 |
| Security name | Shares | Value | ||||||||||
| Netherlands: 2.51% | ||||||||||||
Akzo Nobel NV (Materials, Chemicals) | 117,227 | $ | 9,085,902 | |||||||||
|
| |||||||||||
| Norway: 3.16% | ||||||||||||
Frontline 2012 Limited (Energy, Oil, Gas & Consumable Fuels) †144A | 347,726 | 2,866,519 | ||||||||||
Marine Harvest ASA (Consumer Staples, Food Products) | 7,019,648 | 8,546,997 | ||||||||||
| 11,413,516 | ||||||||||||
|
| |||||||||||
| Russia: 2.42% | ||||||||||||
Mobile Telesystems ADR (Telecommunication Services, Wireless Telecommunication Services) | 192,481 | 4,163,364 | ||||||||||
Sberbank of Russia (Financials, Commercial Banks) (a) | 1,463,209 | 4,591,550 | ||||||||||
| 8,754,914 | ||||||||||||
|
| |||||||||||
| South Korea: 5.22% | ||||||||||||
Hana Financial Group Incorporated (Financials, Commercial Banks) | 151,000 | 6,281,234 | ||||||||||
Samsung Electronics Company Limited GDR (Information Technology, Semiconductors & Semiconductor Equipment) | 10,837 | 7,076,561 | ||||||||||
SK Telecom Company Limited (Telecommunication Services, Wireless Telecommunication Services) | 25,296 | 5,512,939 | ||||||||||
| 18,870,734 | ||||||||||||
|
| |||||||||||
| Sweden: 1.53% | ||||||||||||
Volvo AB Class B (Industrials, Machinery) | 422,568 | 5,548,305 | ||||||||||
|
| |||||||||||
| Switzerland: 8.06% | ||||||||||||
ABB Limited (Industrials, Electrical Equipment) | 324,017 | 8,528,579 | ||||||||||
Novartis AG (Health Care, Pharmaceuticals) | 78,010 | 6,226,458 | ||||||||||
Swatch Group AG Class B (Consumer Discretionary, Textiles, Apparel & Luxury Goods) | 5,341 | 3,529,533 | ||||||||||
Zurich Financial Services AG (Financials, Insurance) | 37,490 | 10,863,926 | ||||||||||
| 29,148,496 | ||||||||||||
|
| |||||||||||
| United Kingdom: 17.16% | ||||||||||||
BP plc (Energy, Oil, Gas & Consumable Fuels) | 1,254,642 | 10,139,845 | ||||||||||
Capita plc (Industrials, Professional Services) | 450,236 | 7,738,999 | ||||||||||
Debenhams plc (Consumer Discretionary, Media) | 5,500,149 | 6,648,819 | ||||||||||
Man Group plc (Financials, Capital Markets) | 6,156,399 | 8,665,485 | ||||||||||
Reckitt Benckiser Group plc (Consumer Staples, Household Products) | 68,661 | 5,449,602 | ||||||||||
Smiths Group plc (Industrials, Industrial Conglomerates) | 226,166 | 5,542,890 | ||||||||||
Vodafone Group plc ADR (Telecommunication Services, Wireless Telecommunication Services) | 241,302 | 9,485,582 | ||||||||||
Wolseley plc (Industrials, Trading Companies & Distributors) | 147,667 | 8,375,124 | ||||||||||
| 62,046,346 | ||||||||||||
|
| |||||||||||
| United States: 3.30% | ||||||||||||
Apple Incorporated (Information Technology, Computers & Peripherals) | 9,285 | 5,209,906 | ||||||||||
QUALCOMM Incorporated (Information Technology, Communications Equipment) | 90,604 | 6,727,344 | ||||||||||
| 11,937,250 | ||||||||||||
|
| |||||||||||
Total Common Stocks (Cost $285,624,399) | 348,969,200 | |||||||||||
|
| |||||||||||
The accompanying notes are an integral part of these financial statements.
Table of Contents
| Portfolio of investments—December 31, 2013 | Wells Fargo Advantage VT International Equity Fund | 11 |
| Security name | Yield | Shares | Value | |||||||||||
Short-Term Investments: 2.33% | ||||||||||||||
| Investment Companies: 2.33% | ||||||||||||||
Wells Fargo Advantage Cash Investment Money Market Fund, Select Class (l)(u) | 0.06 | % | 6,922,771 | $ | 6,922,771 | |||||||||
Wells Fargo Securities Lending Cash Investments, LLC (l)(u)(r)(v) | 0.08 | 1,503,435 | 1,503,435 | |||||||||||
Total Short-Term Investments (Cost $8,426,206) | 8,426,206 | |||||||||||||
|
| |||||||||||||
| Total investments in securities | ||||||||
| (Cost $294,050,605) * | 98.84 | % | 357,395,406 | |||||
Other assets and liabilities, net | 1.16 | 4,189,972 | ||||||
|
|
|
| |||||
| Total net assets | 100.00 | % | $ | 361,585,378 | ||||
|
|
|
|
| † | Non-income-earning security |
| « | All or a portion of this security is on loan. |
| 144A | Security that may be resold to “qualified institutional buyers” under Rule 144A or security offered pursuant to Section 4(2) of the Securities Act of 1933, as amended. |
| (a) | Security is fair valued by the Management Valuation Team, and in certain instances by the Board of Trustees, in accordance with procedures approved by the Board of Trustees. |
| (l) | Investment in an affiliate |
| (u) | Rate shown is the 7-day annualized yield at period end. |
| (r) | The investment company is exempt from registration under Section 3(c)(7) of the Investment Company Act of 1940, as amended. |
| (v) | Security represents investment of cash collateral received from securities on loan. |
| * | Cost for federal income tax purposes is $295,249,219 and unrealized appreciation (depreciation) consists of: |
Gross unrealized appreciation | $ | 73,306,468 | ||
Gross unrealized depreciation | (11,160,281 | ) | ||
|
| |||
Net unrealized appreciation | $ | 62,146,187 |
The accompanying notes are an integral part of these financial statements.
Table of Contents
| 12 | Wells Fargo Advantage VT International Equity Fund | Statement of assets and liabilities—December 31, 2013 |
Assets | ||||
Investments | ||||
In unaffiliated securities (including securities on loan), at value (see cost below) | $ | 348,969,200 | ||
In affiliated securities, at value (see cost below) | 8,426,206 | |||
|
| |||
Total investments, at value (see cost below) | 357,395,406 | |||
Foreign currency, at value (see cost below) | 2,766,654 | |||
Receivable for Fund shares sold | 23,607 | |||
Receivable for dividends | 1,094,622 | |||
Unrealized gains on forward foreign currency contracts | 2,369,398 | |||
Prepaid expenses and other assets | 1,250 | |||
|
| |||
Total assets | 363,650,937 | |||
|
| |||
Liabilities | ||||
Payable for Fund shares redeemed | 182,909 | |||
Payable upon receipt of securities loaned | 1,503,435 | |||
Advisory fee payable | 153,194 | |||
Distribution fees payable | 68,904 | |||
Due to other related parties | 40,536 | |||
Accrued expenses and other liabilities | 116,581 | |||
|
| |||
Total liabilities | 2,065,559 | |||
|
| |||
Total net assets | $ | 361,585,378 | ||
|
| |||
NET ASSETS CONSIST OF | ||||
Paid-in capital | $ | 284,517,618 | ||
Undistributed net investment income | 7,235,405 | |||
Accumulated net realized gains on investments | 4,060,033 | |||
Net unrealized gains on investments | 65,772,322 | |||
|
| |||
Total net assets | $ | 361,585,378 | ||
|
| |||
COMPUTATION OF NET ASSET VALUE PER SHARE1 | ||||
Net assets – Class 1 | $ | 42,020,641 | ||
Shares outstanding – Class 1 | 7,666,397 | |||
Net asset value per share – Class 1 | $5.48 | |||
Net assets – Class 2 | $ | 319,564,737 | ||
Shares outstanding – Class 2 | 58,063,229 | |||
Net asset value per share – Class 2 | $5.50 | |||
Investments in unaffiliated securities (including securities on loan), at cost | $ | 285,624,399 | ||
|
| |||
Investments in affiliated securities, at cost | $ | 8,426,206 | ||
|
| |||
Total investments, at cost | $ | 294,050,605 | ||
|
| |||
Securities on loan, at value | $ | 1,428,263 | ||
|
| |||
Foreign currency, at cost | $ | 2,813,760 | ||
|
| |||
| 1. | The Fund has an unlimited number of authorized shares. |
The accompanying notes are an integral part of these financial statements.
Table of Contents
| Statements of operations—year ended December 31, 2013 | Wells Fargo Advantage VT International Equity Fund | 13 |
Investment income | ||||
Dividends* | $ | 10,054,480 | ||
Securities lending income, net | 398,673 | |||
Income from affiliated securities | 10,711 | |||
|
| |||
Total investment income | 10,463,864 | |||
|
| |||
Expenses | ||||
Advisory fee | 2,592,917 | |||
Administration fees | ||||
Fund level | 172,861 | |||
Class 1 | 33,289 | |||
Class 2 | 243,289 | |||
Distribution fees | ||||
Class 2 | 760,276 | |||
Custody and accounting fees | 103,140 | |||
Professional fees | 45,299 | |||
Shareholder report expenses | 69,316 | |||
Trustees’ fees and expenses | 12,304 | |||
Other fees and expenses | 23,354 | |||
|
| |||
Total expenses | 4,056,045 | |||
Less: Fee waivers and/or expense reimbursements | (910,285 | ) | ||
|
| |||
Net expenses | 3,145,760 | |||
|
| |||
Net investment income | 7,318,104 | |||
|
| |||
REALIZED AND UNREALIZED GAINS (LOSSES) ON INVESTMENTS | ||||
Net realized gains (losses) on: | ||||
Unaffiliated securities | 8,431,966 | |||
Forward foreign currency contract transactions | (20,195 | ) | ||
|
| |||
Net realized gains on investments | 8,411,771 | |||
|
| |||
Net change in unrealized gains (losses) on: | ||||
Unaffiliated securities | 44,776,007 | |||
Forward foreign currency contract transactions | 2,369,398 | |||
|
| |||
Net change in unrealized gains (losses) on investments | 47,145,405 | |||
|
| |||
Net realized and unrealized gains (losses) on investments | 55,557,176 | |||
|
| |||
Net increase in net assets resulting from operations | $ | 62,875,280 | ||
|
| |||
* Net of foreign dividend withholding taxes in the amount of | $762,007 | |||
The accompanying notes are an integral part of these financial statements.
Table of Contents
| 14 | Wells Fargo Advantage VT International Equity Fund | Statement of changes in net assets |
| Year ended December 31, 2013 | Year ended December 31, 2012 | |||||||||||||||
Operations | ||||||||||||||||
Net investment income | $ | 7,318,104 | $ | 7,648,179 | ||||||||||||
Net realized gains on investments | 8,411,771 | 17,673,037 | ||||||||||||||
Net change in unrealized gains (losses) on investments | 47,145,405 | 13,596,141 | ||||||||||||||
|
|
|
|
|
|
|
| |||||||||
Net increase in net assets resulting from operations | 62,875,280 | 38,917,357 | ||||||||||||||
|
|
|
|
|
|
|
| |||||||||
Distributions to shareholders from | ||||||||||||||||
Net investment income | ||||||||||||||||
Class 1 | (975,031 | ) | (710,713 | ) | ||||||||||||
Class 2 | (6,448,989 | ) | (3,679,763 | ) | ||||||||||||
Net realized gains | ||||||||||||||||
Class 1 | (2,022,711 | ) | (2,880,130 | ) | ||||||||||||
Class 2 | (14,996,715 | ) | (18,350,536 | ) | ||||||||||||
|
|
|
|
|
|
|
| |||||||||
Total distributions to shareholders | (24,443,446 | ) | (25,621,142 | ) | ||||||||||||
|
|
|
|
|
|
|
| |||||||||
| Shares | Shares | |||||||||||||||
Capital share transactions | ||||||||||||||||
Proceeds from shares sold | ||||||||||||||||
Class 1 | 886,423 | 4,581,525 | 523,466 | 2,529,203 | ||||||||||||
Class 2 | 2,050,177 | 10,408,251 | 12,377,052 | 61,174,208 | ||||||||||||
|
|
|
|
|
|
|
| |||||||||
| 14,989,776 | 63,703,411 | |||||||||||||||
|
|
|
|
|
|
|
| |||||||||
Reinvestment of distributions | ||||||||||||||||
Class 1 | 610,538 | 2,997,742 | 850,911 | 3,590,843 | ||||||||||||
Class 2 | 4,341,236 | 21,445,704 | 5,195,825 | 22,030,299 | ||||||||||||
|
|
|
|
|
|
|
| |||||||||
| 24,443,446 | 25,621,142 | |||||||||||||||
|
|
|
|
|
|
|
| |||||||||
Payment for shares redeemed | ||||||||||||||||
Class 1 | (2,556,446 | ) | (13,206,020 | ) | (2,295,613 | ) | (10,998,255 | ) | ||||||||
Class 2 | (8,200,329 | ) | (42,867,613 | ) | (5,325,814 | ) | (25,537,835 | ) | ||||||||
|
|
|
|
|
|
|
| |||||||||
| (56,073,633 | ) | (36,536,090 | ) | |||||||||||||
|
|
|
|
|
|
|
| |||||||||
Net increase (decrease) in net assets resulting from capital share transactions | (16,640,411 | ) | 52,788,463 | |||||||||||||
|
|
|
|
|
|
|
| |||||||||
Total increase in net assets | 21,791,423 | 66,084,678 | ||||||||||||||
|
|
|
|
|
|
|
| |||||||||
Net assets | ||||||||||||||||
Beginning of period | 339,793,955 | 273,709,277 | ||||||||||||||
|
|
|
|
|
|
|
| |||||||||
End of period | $ | 361,585,378 | $ | 339,793,955 | ||||||||||||
|
|
|
|
|
|
|
| |||||||||
Undistributed net investment income | $ | 7,235,405 | $ | 7,413,514 | ||||||||||||
|
|
|
|
|
|
|
| |||||||||
The accompanying notes are an integral part of these financial statements.
Table of Contents
| Financial highlights | Wells Fargo Advantage VT International Equity Fund | 15 |
(For a share outstanding throughout each period)
| Year ended December 31 | ||||||||||||||||||||
| CLASS 1 | 2013 | 2012 | 2011 | 20101 | 20091 | |||||||||||||||
Net asset value, beginning of period | $ | 4.94 | $ | 4.77 | $ | 5.75 | $ | 5.15 | $ | 4.64 | ||||||||||
Net investment income | 0.12 | 2 | 0.13 | 2 | 0.11 | 2 | 0.05 | 2 | 0.11 | 2 | ||||||||||
Net realized and unrealized gains (losses) on investments | 0.82 | 0.45 | (0.80 | ) | 0.78 | 0.55 | ||||||||||||||
|
|
|
|
|
|
|
|
|
| |||||||||||
Total from investment operations | 0.94 | 0.58 | (0.69 | ) | 0.83 | 0.66 | ||||||||||||||
Distributions to shareholders from | ||||||||||||||||||||
Net investment income | (0.13 | ) | (0.08 | ) | (0.04 | ) | (0.05 | ) | (0.15 | ) | ||||||||||
Net realized gains | (0.27 | ) | (0.33 | ) | (0.25 | ) | (0.18 | ) | 0.00 | |||||||||||
|
|
|
|
|
|
|
|
|
| |||||||||||
Total distributions to shareholders | (0.40 | ) | (0.41 | ) | (0.29 | ) | (0.23 | ) | (0.15 | ) | ||||||||||
Net asset value, end of period | $ | 5.48 | $ | 4.94 | $ | 4.77 | $ | 5.75 | $ | 5.15 | ||||||||||
Total return | 19.94 | % | 13.68 | % | (12.79 | )% | 16.79 | % | 15.95 | % | ||||||||||
Ratios to average net assets (annualized) | ||||||||||||||||||||
Gross expenses | 0.95 | % | 0.98 | % | 0.97 | % | 0.85 | % | 0.68 | % | ||||||||||
Net expenses | 0.69 | % | 0.69 | % | 0.69 | % | 0.66 | % | 0.68 | % | ||||||||||
Net investment income | 2.36 | % | 2.68 | % | 2.06 | % | 1.04 | % | 2.31 | % | ||||||||||
Supplemental data | ||||||||||||||||||||
Portfolio turnover rate | 32 | % | 140 | % | 66 | % | 60 | % | 205 | % | ||||||||||
Net assets, end of period (000s omitted) | $42,021 | $43,089 | $46,017 | $67,659 | $69,407 | |||||||||||||||
| 1. | After the close of business on July 16, 2010, the Fund acquired the net assets of Evergreen VA International Equity Fund which became the accounting and performance survivor in the transaction. The information for the periods prior to July 19, 2010 is that of Class 1 of Evergreen VA International Equity Fund. The per share information has been adjusted to give effect to this transaction. |
| 2. | Calculated based upon average shares outstanding |
The accompanying notes are an integral part of these financial statements.
Table of Contents
| 16 | Wells Fargo Advantage VT International Equity Fund | Financial highlights |
(For a share outstanding throughout each period)
| Year ended December 31 | ||||||||||||||||||||
| CLASS 2 | 2013 | 2012 | 2011 | 20101 | 20091 | |||||||||||||||
Net asset value, beginning of period | $ | 4.96 | $ | 4.78 | $ | 5.74 | $ | 5.15 | $ | 4.64 | ||||||||||
Net investment income | 0.11 | 2 | 0.11 | 0.09 | 2 | 0.06 | 2 | 0.04 | 2 | |||||||||||
Net realized and unrealized gains (losses) on investments | 0.82 | 0.47 | (0.79 | ) | 0.75 | 0.62 | ||||||||||||||
|
|
|
|
|
|
|
|
|
| |||||||||||
Total from investment operations | 0.93 | 0.58 | (0.70 | ) | 0.81 | 0.66 | ||||||||||||||
Distributions to shareholders from | ||||||||||||||||||||
Net investment income | (0.12 | ) | (0.07 | ) | (0.01 | ) | (0.04 | ) | (0.15 | ) | ||||||||||
Net realized gains | (0.27 | ) | (0.33 | ) | (0.25 | ) | (0.18 | ) | 0.00 | |||||||||||
|
|
|
|
|
|
|
|
|
| |||||||||||
Total distributions to shareholders | (0.39 | ) | (0.40 | ) | (0.26 | ) | (0.22 | ) | (0.15 | ) | ||||||||||
Net asset value, end of period | $ | 5.50 | $ | 4.96 | $ | 4.78 | $ | 5.74 | $ | 5.15 | ||||||||||
Total return | 19.52 | % | 13.48 | % | (12.91 | )% | 16.50 | % | 15.47 | % | ||||||||||
Ratios to average net assets (annualized) | ||||||||||||||||||||
Gross expenses | 1.20 | % | 1.23 | % | 1.22 | % | 0.97 | % | 0.89 | % | ||||||||||
Net expenses | 0.94 | % | 0.94 | % | 0.94 | % | 0.89 | % | 0.89 | % | ||||||||||
Net investment income | 2.08 | % | 2.41 | % | 1.75 | % | 1.22 | % | 0.70 | % | ||||||||||
Supplemental data | ||||||||||||||||||||
Portfolio turnover rate | 32 | % | 140 | % | 66 | % | 60 | % | 205 | % | ||||||||||
Net assets, end of period (000s omitted) | $319,565 | $296,705 | $227,692 | $218,348 | $891,137 | |||||||||||||||
| 1. | After the close of business on July 16, 2010, the Fund acquired the net assets of Evergreen VA International Equity Fund which became the accounting and performance survivor in the transaction. The information for the periods prior to July 19, 2010 is that of Class 2 of Evergreen VA International Equity Fund. The per share information has been adjusted to give effect to this transaction. |
| 2. | Calculated based upon average shares outstanding |
The accompanying notes are an integral part of these financial statements.
Table of Contents
| Notes to financial statements | Wells Fargo Advantage VT International Equity Fund | 17 |
1. ORGANIZATION
Wells Fargo Variable Trust (the “Trust”), a Delaware statutory trust organized on March 10, 1999, is an open-end management investment company registered under the Investment Company Act of 1940, as amended (the “1940 Act”). These financial statements report on the Wells Fargo Advantage VT International Equity Fund (the “Fund”) which is a diversified series of the Trust.
2. SIGNIFICANT ACCOUNTING POLICIES
The following significant accounting policies, which are consistently followed in the preparation of the financial statements of the Fund, are in conformity with U.S. generally accepted accounting principles which require management to make estimates and assumptions that affect the reported amounts of assets and liabilities, disclosure of contingent assets and liabilities at the date of the financial statements, and the reported amounts of revenues and expenses during the reporting period. Actual results could differ from those estimates.
Securities valuation
All investments are valued each business day as of the close of regular trading on the New York Stock Exchange (generally 4 p.m. Eastern Time).
Equity securities that are listed on a foreign or domestic exchange or market are valued at the official closing price or, if none, the last sales price. If no sale occurs on the primary exchange or market for the security that day, the prior day’s price will be deemed “stale” and fair values will be determined in accordance with the Fund’s Valuation Procedures.
The values of securities denominated in foreign currencies will be converted to U.S. dollars at rates provided by an independent foreign currency pricing source at a time each business day specified by the Management Valuation Team of Wells Fargo Funds Management, LLC (“Funds Management”).
Many securities markets and exchanges outside the U.S. close prior to the close of the New York Stock Exchange and therefore may not fully reflect trading or events that occur after the close of the principal exchange in which the foreign securities are traded, but before the close of the New York Stock Exchange. If such trading or events are expected to materially affect the value of such securities, then fair value pricing procedures approved by the Board of Trustees of the Fund are applied. These procedures take into account multiple factors including movements in U.S. securities markets after foreign exchanges close. Foreign securities that are fair valued under these procedures are categorized as Level 2 and the application of these procedures may result in transfers between Level 1 and Level 2. Depending on market activity, such fair valuations may be frequent. Such fair value pricing may result in NAVs that are higher or lower than NAVs based on the last reported sales price or latest quoted bid price. On December 31, 2013, such fair value pricing was not used in pricing foreign securities.
Investments in registered open-end investment companies are valued at net asset value. Non-registered investment vehicles are fair valued at net asset value.
Investments which are not valued using any of the methods discussed above are valued at their fair value, as determined in good faith by the Board of Trustees. The Board of Trustees has established a Valuation Committee comprised of the Trustees and has delegated to it the authority to take any actions regarding the valuation of portfolio securities that the Valuation Committee deems necessary or appropriate, including determining the fair value of portfolio securities, unless the determination has been delegated to the Management Valuation Team. The Board of Trustees retains the authority to make or ratify any valuation decisions or approve any changes to the Valuation Procedures as it deems appropriate. On a quarterly basis, the Board of Trustees receives reports on any valuation actions taken by the Valuation Committee or the Management Valuation Team which may include items for ratification.
Valuations of fair valued securities are compared to the next actual sales price when available, or other appropriate market values, to assess the continued appropriateness of the fair valuation methodologies used. These securities are fair valued on a day-to-day basis, taking into consideration changes to appropriate market information and any significant changes to the inputs considered in the valuation process until there is a readily available price provided on an exchange or by an independent pricing service. Valuations received from an independent pricing service or independent broker-dealer quotes are periodically validated by comparisons to most recent trades and valuations provided by other independent pricing services in addition to the review of prices by the adviser and/or subadviser. Unobservable inputs used in determining fair valuations are identified based on the type of security, taking into consideration factors utilized by market participants in valuing the investment, knowledge about the issuer and the current market environment.
Table of Contents
| 18 | Wells Fargo Advantage VT International Equity Fund | Notes to financial statements |
Foreign currency translation
The accounting records of the Fund are maintained in U.S. dollars. The values of other assets and liabilities denominated in foreign currencies will be converted to U.S. dollars at rates provided by an independent foreign currency pricing source at a time each business day specified by the Management Valuation Team. Purchases and sales of securities, and income and expenses are converted at the rate of exchange on the respective dates of such transactions. Reported net realized foreign exchange gains or losses arise from sales of foreign currencies, currency gains or losses realized between the trade and settlement dates on securities transactions, and the difference between the amounts of dividends, interest and foreign withholding taxes recorded and the U.S. dollar equivalent of the amounts actually paid or received. Net unrealized foreign exchange gains and losses arise from changes in the fair value of assets and liabilities other than investments in securities resulting from changes in exchange rates.
The changes in net assets arising from changes in exchange rates and the changes in net assets resulting from changes in market prices of securities are not separately presented. Such changes are recorded with net realized and unrealized gains or losses from investments. Gains and losses from certain foreign currency transactions are treated as ordinary income for U.S. federal income tax purposes.
Forward foreign currency contracts
The Fund may be subject to foreign currency exchange rate risk in the normal course of pursuing its investment objectives. A forward foreign currency contract is an agreement between two parties to purchase or sell a specific currency for an agreed-upon price at a future date. The Fund enters into forward foreign currency contracts to facilitate transactions in foreign-denominated securities and to attempt to minimize the risk to the Fund from adverse changes in the relationship between currencies. Forward foreign currency contracts are recorded at the forward rate and marked-to-market daily. When the contracts are closed, realized gains and losses arising from such transactions are recorded as realized gains or losses on forward foreign currency contract transactions. The Fund could be exposed to risks if the counterparties to the contracts are unable to meet the terms of their contracts or if the value of the foreign currency changes unfavorably. The Fund’s maximum risk of loss from counterparty credit risk is the unrealized gains on the contracts. This risk may be mitigated if there is a master netting arrangement between the Fund and the counterparty.
Security loans
The Fund may lend its securities from time to time in order to earn additional income in the form of fees or interest on securities received as collateral or the investment of any cash received as collateral. The Fund continues to receive interest or dividends on the securities loaned. The Fund receives collateral in the form of cash or securities with a value at least equal to the value of the securities on loan. The value of the loaned securities is determined at the close of each business day and any additional required collateral is delivered to the Fund on the next business day. In a securities lending transaction, the net asset value of the Fund will be affected by an increase or decrease in the value of the securities loaned and by an increase or decrease in the value of the instrument in which collateral is invested. The amount of securities lending activity undertaken by the Fund fluctuates from time to time. In the event of default or bankruptcy by the borrower, the Fund may be prevented from recovering the loaned securities or gaining access to the collateral or may experience delays or costs in doing so. In addition, the investment of any cash collateral received may lose all or part of its value. The Fund has the right under the lending agreement to recover the securities from the borrower on demand.
The Fund lends its securities through an unaffiliated securities lending agent. Cash collateral received in connection with its securities lending transactions is invested in Wells Fargo Securities Lending Cash Investments, LLC (the “Securities Lending Fund”). The Securities Lending Fund is exempt from registration under Section 3(c)(7) of the 1940 Act and is managed by Funds Management and is subadvised by Wells Capital Management Incorporated (“WellsCap”). Funds Management receives an advisory fee starting at 0.05% and declining to 0.01% as the average daily net assets of the Securities Lending Fund increase. All of the fees received by Funds Management are paid to WellsCap for its services as subadviser. The Securities Lending Fund seeks to provide a positive return compared to the daily Fed Funds Open rate by investing in high-quality, U.S. dollar-denominated short-term money market instruments. Securities Lending Fund investments are fair valued based upon the amortized cost valuation technique. Income earned from investment in the Securities Lending Fund is included in securities lending income on the Statement of Operations.
Security transactions and income recognition
Securities transactions are recorded on a trade date basis. Realized gains or losses are recorded on the basis of identified cost.
Dividend income is recognized on the ex-dividend date, except for certain dividends from foreign securities, which are recorded as soon as the Fund is informed of the ex-dividend date. Dividend income from foreign securities is recorded net of foreign taxes withheld where recovery of such taxes is not assured.
Table of Contents
| Notes to financial statements | Wells Fargo Advantage VT International Equity Fund | 19 |
Distributions to shareholders
Distributions to shareholders from net investment income and net realized gains, if any, are recorded on the ex-dividend date. Such distributions are determined in conformity with federal income tax regulations, which may differ in amount or character from net investment income and realized gains recognized for purposes of U.S. generally accepted accounting principles.
Federal and other taxes
The Fund intends to continue to qualify as a regulated investment company by distributing substantially all of its investment company taxable income and any net realized capital gains (after reduction for capital loss carryforwards) sufficient to relieve it from all, or substantially all, federal income taxes. Accordingly, no provision for federal income taxes was required.
The Fund’s income and federal excise tax returns and all financial records supporting those returns for the prior three fiscal years are subject to examination by the federal and Delaware revenue authorities. Management has analyzed the Fund’s tax positions taken on federal, state, and foreign tax returns for all open tax years and does not believe that there are any uncertain tax positions that require recognition of a tax liability.
Reclassifications are made to the Fund’s capital accounts for permanent tax differences to reflect income and gains available for distribution (or available capital loss carryforwards) under federal income tax regulations. U.S. generally accepted accounting principles requires that certain components of net assets be adjusted to reflect permanent differences between financial and tax reporting. These reclassifications have no effect on net assets or net asset values per share. At December 31, 2013, as a result of permanent book-to-tax differences, the following reclassification adjustments were made on the Statement of Assets and Liabilities:
| Undistributed net investment income | Accumulated net realized gains on investments | |
| $(72,193) | $72,193 |
As of December 31, 2013, the Fund had capital loss carryforwards available to offset future net realized capital gains in the amount of $2,669,056 expiring in 2017.
Class allocations
The separate classes of shares offered by the Fund differ principally in distribution fees. Shareholders of each class bear certain expenses that pertain to that particular class. All shareholders bear the common expenses of the Fund, earn income from the portfolio, and are allocated any unrealized gains and losses pro rata based on the average daily net assets of each class, without distinction between share classes. Dividends are determined separately for each class based on income and expenses allocable to each class. Realized gains and losses are allocated to each class pro rata based upon the net assets of each class on the date realized. Differences in per share dividend rates generally result from the relative weightings of pro rata income and realized gain allocations and from differences in separate class expenses, including distribution fees.
3. FAIR VALUATION MEASUREMENTS
Fair value measurements of investments are determined within a framework that has established a fair value hierarchy based upon the various data inputs utilized in determining the value of the Fund’s investments. The three-level hierarchy gives the highest priority to unadjusted quoted prices in active markets for identical assets or liabilities (Level 1) and the lowest priority to significant unobservable inputs (Level 3). The Fund’s investments are classified within the fair value hierarchy based on the lowest level of input that is significant to the fair value measurement. The inputs are summarized into three broad levels as follows:
| n | Level 1 – quoted prices in active markets for identical securities |
| n | Level 2 – other significant observable inputs (including quoted prices for similar securities, interest rates, prepayment speeds, credit risk, use of amortized cost, etc.) |
| n | Level 3 – significant unobservable inputs (including the Fund’s own assumptions in determining the fair value of investments) |
The inputs or methodologies used for valuing investments in securities are not necessarily an indication of the risk associated with investing in those securities.
Table of Contents
| 20 | Wells Fargo Advantage VT International Equity Fund | Notes to financial statements |
As of December 31, 2013, the inputs used in valuing investments in securities were as follows:
| Investments in securities | Quoted prices (Level 1) | Other significant (Level 2) | Significant unobservable inputs (Level 3) | Total | ||||||||||||
Equity securities | ||||||||||||||||
Common stocks | $ | 344,377,650 | $ | 4,591,550 | $ | 0 | $ | 348,969,200 | ||||||||
Short-term investments | ||||||||||||||||
Investment companies | 6,922,771 | 1,503,435 | 0 | 8,426,206 | ||||||||||||
| $ | 351,300,421 | $ | 6,094,985 | $ | 0 | $ | 357,395,406 | |||||||||
As of December 31, 2013, the inputs used in valuing the Fund’s other financial instruments were as follows:
| Other financial instruments | Quoted prices (Level 1) | Other significant (Level 2) | Significant unobservable inputs (Level 3) | Total | ||||||||||||
Forward foreign currency contracts | $ | 0 | $ | 2,369,398 | * | $ | 0 | $ | 2,369,398 | |||||||
| * | Amount represents the net unrealized gains. |
Transfers in and transfers out are recognized at the end of the reporting period. For the year ended December 31, 2013, the Fund did not have any transfers into/out of Level 1, Level 2, or Level 3.
4. TRANSACTIONS WITH AFFILIATES AND OTHER EXPENSES
Advisory fee
The Trust has entered into an advisory contract with Funds Management, an indirect wholly owned subsidiary of Wells Fargo & Company (“Wells Fargo”). The adviser is responsible for implementing investment policies and guidelines and for supervising the subadviser, who is responsible for day-to-day portfolio management of the Fund.
Pursuant to the contract, Funds Management is entitled to receive an annual advisory fee starting at 0.75% and declining to 0.60% as the average daily net assets of the Fund increase. For the year ended December 31, 2013, the advisory fee was equivalent to an annual rate of 0.75% of the Fund’s average daily net assets.
Funds Management has retained the services of a subadviser to provide daily portfolio management to the Fund. The fee for subadvisory services is borne by Funds Management. WellsCap, an affiliate of Funds Management and an indirect, wholly owned subsidiary of Wells Fargo, is the subadviser to the Fund and is entitled to receive a fee from Funds Management at an annual rate starting at 0.45% and declining to 0.40% as the average daily net assets of the Fund increase.
Administration and transfer agent fees
The Trust has entered into an administration agreement with Funds Management. Under this agreement, for providing administrative services, which includes paying fees and expenses for services provided by the transfer agent, sub-transfer agents, omnibus account servicers and record-keepers, Funds Management is entitled to receive from the Fund an annual fund level administration fee starting at 0.05% and declining to 0.03% as the average daily net assets of the Fund increase and a class level administration fee of 0.08% which is calculated based on the average daily net assets of each class.
Funds Management has contractually waived and/or reimbursed advisory and administration fees to the extent necessary to maintain certain net operating expense ratios for the Fund. Waiver of fees and/or reimbursement of expenses by Funds Management were made first from fund level expenses on a proportionate basis and then from class specific expenses. Funds Management has committed through April 30, 2014 to waive fees and/or reimburse expenses to the extent necessary to cap the Fund’s expenses at 0.69% for Class 1 shares and 0.94% for Class 2 shares.
Distribution fees
The Trust has adopted a Distribution Plan for Class 2 shares of the Fund pursuant to Rule 12b-1 under the 1940 Act. Distribution fees are charged to Class 2 shares and paid to Wells Fargo Funds Distributor, LLC, the principal underwriter, at an annual rate of 0.25% of the average daily net assets of Class 2 shares.
5. INVESTMENT PORTFOLIO TRANSACTIONS
Purchases and sales of investments, excluding U.S. government obligations (if any) and short-term securities, for the year ended December 31, 2013 were $104,126,678 and $130,953,999, respectively.
Table of Contents
| Notes to financial statements | Wells Fargo Advantage VT International Equity Fund | 21 |
6. DERIVATIVE TRANSACTIONS
During the year ended December 31, 2013, the Fund entered into forward foreign currency contracts for economic hedging purposes.
At December 31, 2013, the Fund had forward foreign currency contracts outstanding as follows:
Forward foreign currency contracts to sell:
| Exchange date | Counterparty | Contracts to deliver | U.S. value at December 31, 2013 | In exchange for U.S. $ | Unrealized gains | |||||||||||||
| 1-7-2014 | Barclays | 607,282,000 | JPY | $ | 5,766,613 | $ | 6,208,984 | $ | 442,371 | |||||||||
| 1-7-2014 | Barclays | 1,186,893,500 | JPY | 11,270,473 | 12,214,609 | 944,136 | ||||||||||||
| 1-7-2014 | Barclays | 726,519,000 | JPY | 6,898,861 | 7,163,271 | 264,410 | ||||||||||||
| 1-7-2014 | Barclays | 104,429,000 | JPY | 991,634 | 1,059,758 | 68,124 | ||||||||||||
| 1-7-2014 | Barclays | 788,215,000 | JPY | 7,484,712 | 8,135,069 | 650,357 | ||||||||||||
The Fund had average contract amounts of $818,831 and $21,885,314 in forward foreign currency contracts to buy and forward foreign currency contracts to sell, respectively, during the year ended December 31, 2013.
The fair value, realized gains or losses and change in unrealized gains or losses, if any, on derivative instruments are reflected in the appropriate financial statements.
For certain types of derivative transactions, the Fund has entered into International Swaps and Derivatives Association, Inc. master agreements (“ISDA Master Agreements”) or similar agreements with approved counterparties. The ISDA Master Agreements or similar agreements may have requirements to deliver/deposit securities or cash to/with an exchange or broker-dealer as collateral and allows the Fund to offset, with each counterparty, certain derivative financial instrument’s assets and/or liabilities with collateral held or pledged. Collateral requirements differ by type of derivative. Collateral or margin requirements are set by the broker or exchange clearing house for exchange traded derivatives while collateral terms are contract specific for over-the-counter traded. Cash collateral that has been pledged to cover obligations of the Fund under derivative contracts, if any, will be reported separately in the Statement of Assets and Liabilities. Securities pledged as collateral, if any, for the same purpose are noted in the Portfolio of Investments. With respect to balance sheet offsetting, absent an event of default by the counterparty or a termination of the agreement, the reported amounts of financial assets and financial liabilities in the Statement of Assets and Liabilities are not offset across transactions between the Fund and the applicable counterparty. A reconciliation of the gross amounts on the Statement of Assets and Liabilities to the net amounts by derivative type, including any collateral exposure, is as follows:
| Investment type | Counterparty | Gross amounts of assets in the Statement of Assets and Liabilities | Amounts subject to netting agreements | Collateral received | Net amount (not less than $0) | |||||||||||
| Forward foreign currency contracts | Barclays | $2,369,398* | $ | 0 | $ | 0 | $ | 2,369,398 | ||||||||
| * | Amount represents net unrealized gains. |
7. BANK BORROWINGS
The Trust and Wells Fargo Funds Trust (excluding the money market funds and certain other funds) are parties to a $150,000,000 revolving credit agreement with State Street Bank and Trust Company, whereby the Fund is permitted to use bank borrowings for temporary or emergency purposes, such as to fund shareholder redemption requests. Interest under the credit agreement is charged to the Fund based on a borrowing rate equal to the higher of the Federal Funds rate in effect on that day plus 1.25% or the overnight LIBOR rate in effect on that day plus 1.25%. In addition, an annual commitment fee equal to 0.10% of the unused balance is allocated to each participating fund. For the year ended December 31, 2013, the Fund paid $706 in commitment fees.
For the year ended December 31, 2013, there were no borrowings by the Fund under the agreement.
Table of Contents
| 22 | Wells Fargo Advantage VT International Equity Fund | Notes to financial statements |
8. DISTRIBUTIONS TO SHAREHOLDERS
The tax character of distributions paid during the years ended December 31, 2013 and December 31, 2012 were as follows:
| Year ended December 31 | ||||
| 2013 | 2012 | |||
Ordinary income | $7,424,020 | $4,390,476 | ||
Long-term capital gain | 17,019,426 | 21,230,666 | ||
As of December 31, 2013, the components of distributable earnings on a tax basis were as follows:
| Undistributed ordinary income | Undistributed long-term gain | Unrealized gains | Capital loss carryforward | |||
$9,614,241 | $7,927,704 | $62,204,310 | $(2,669,056) |
9. INDEMNIFICATION
Under the Trust’s organizational documents, the officers and directors are indemnified against certain liabilities that may arise out of performance of their duties to the Trust. Additionally, in the normal course of business, the Trust may enter into contracts with service providers that contain a variety of indemnification clauses. The Trust’s maximum exposure under these arrangements is dependent on future claims that may be made against the Fund and, therefore, cannot be estimated.
Table of Contents
| Report of independent registered public accounting firm | Wells Fargo Advantage VT International Equity Fund | 23 |
BOARD OF TRUSTEES AND SHAREHOLDERS OF WELLS FARGO VARIABLE TRUST:
We have audited the accompanying statement of assets and liabilities, including the portfolio of investments, of the Wells Fargo Advantage VT International Equity Fund (the “Fund”), one of the funds constituting the Wells Fargo Variable Trust, as of December 31, 2013, and the related statement of operations for the year then ended, statements of changes in net assets for each of the years in the two-year period then ended, and the financial highlights for each of the years in the five-year period then ended. These financial statements and financial highlights are the responsibility of the Fund’s management. Our responsibility is to express an opinion on these financial statements and financial highlights based on our audits.
We conducted our audits in accordance with the standards of the Public Company Accounting Oversight Board (United States). Those standards require that we plan and perform the audit to obtain reasonable assurance about whether the financial statements and financial highlights are free of material misstatement. An audit includes examining, on a test basis, evidence supporting the amounts and disclosures in the financial statements. Our procedures included confirmation of securities owned as of December 31, 2013, by correspondence with the custodian and brokers or by other appropriate auditing procedures. An audit also includes assessing the accounting principles used and significant estimates made by management, as well as evaluating the overall financial statement presentation. We believe that our audits provide a reasonable basis for our opinion.
In our opinion, the financial statements and financial highlights referred to above present fairly, in all material respects, the financial position of the Wells Fargo Advantage VT International Equity Fund as of December 31, 2013, the results of its operations for the year then ended, the changes in its net assets for each of the years in the two-year period then ended, and the financial highlights for each of the years in the five-year period then ended, in conformity with U.S. generally accepted accounting principles.

Boston, Massachusetts
February 27, 2014
Table of Contents
| 24 | Wells Fargo Advantage VT International Equity Fund | Other information (unaudited) |
TAX INFORMATION
Pursuant to Section 852 of the Internal Revenue Code, $17,019,426 was designated as long-term capital gain distributions for the fiscal year ended December 31, 2013.
Pursuant to Section 853 of the Internal Revenue Code, the following amounts have been designated as foreign taxes paid for the fiscal year ended December 31, 2013. These amounts may be less than the actual foreign taxes paid for financial statement purposes. Foreign taxes paid or withheld should be included in taxable income with an offsetting deduction from gross income or as a credit for taxes paid to foreign governments. None of the income was derived from ineligible foreign sources as defined under Section 901 (j) of the Internal Revenue Code.
Creditable foreign taxes paid | Per share amount | Foreign income as % of ordinary income | ||
| $362,620 | $0.0036 | 76.28% |
PROXY VOTING INFORMATION
A description of the policies and procedures that the Fund uses to determine how to vote proxies relating to portfolio securities is available without charge, upon request, by calling 1-800-222-8222, visiting our website at wellsfargoadvantagefunds.com, or visiting the SEC website at sec.gov. Information regarding how the Fund voted proxies relating to portfolio securities during the most recent 12-month period ended June 30 is available without charge on the Fund’s website at wellsfargoadvantagefunds.com or by visiting the SEC website at sec.gov.
PORTFOLIO HOLDINGS INFORMATION
The complete portfolio holdings for the Fund are publicly available on the Fund’s website (wellsfargoadvantagefunds.com) on a monthly, 30-day or more delayed basis. In addition, top ten holdings information for the Fund is publicly available on the Fund’s website on a monthly, seven-day or more delayed basis. The Fund files its complete schedule of portfolio holdings with the SEC for the first and third quarters of each fiscal year on Form N-Q, which is available without charge by visiting the SEC website at sec.gov. In addition, the Fund’s Form N-Q may be reviewed and copied at the SEC’s Public Reference Room in Washington, DC, and at regional offices in New York City, at 233 Broadway, and in Chicago, at 175 West Jackson Boulevard, Suite 900. Information about the Public Reference Room may be obtained by calling 1-800-SEC-0330.
Table of Contents
| Other information (unaudited) | Wells Fargo Advantage VT International Equity Fund | 25 |
BOARD OF TRUSTEES AND OFFICERS
Each of the Trustees and Officers listed in the table below acts in identical capacities for each fund in the Wells Fargo Advantage family of funds, which consists of 132 mutual funds1 comprising the Wells Fargo Funds Trust, Wells Fargo Variable Trust, Wells Fargo Master Trust and four closed-end funds (collectively the “Fund Complex”). This table should be read in conjunction with the Prospectus and the Statement of Additional Information2. All of the Trustees are also Members of the Audit and Governance Committees of each Trust in the Fund Complex. The mailing address of each Trustee and Officer is 525 Market Street, 12th Floor, San Francisco, CA 94105. Each Trustee and Officer serves an indefinite term, however, each Trustee serves such term until reaching the mandatory retirement age established by the Trustees.
Independent Trustees
Name and year of birth | Position held and length of service* | Principal occupations during past five years | Other directorships during | |||
| Peter G. Gordon (Born 1942) | Trustee, since 1998; Chairman, since 2005 | Co-Founder, Retired Chairman, President and CEO of Crystal Geyser Water Company. Trustee Emeritus, Colby College. | Asset Allocation Trust | |||
| Isaiah Harris, Jr. (Born 1952) | Trustee, since 2009 | Retired. Prior thereto, President and CEO of BellSouth Advertising and Publishing Corp. from 2005 to 2007, President and CEO of BellSouth Enterprises from 2004 to 2005 and President of BellSouth Consumer Services from 2000 to 2003. Emeritus member of the Iowa State University Foundation Board of Governors. Emeritus Member of the Advisory Board of Iowa State University School of Business. Advisory Board Member, Palm Harbor Academy (charter school). Mr. Harris is a certified public accountant. | CIGNA Corporation; Deluxe Corporation; Asset Allocation Trust | |||
| Judith M. Johnson (Born 1949) | Trustee, since 2008; Audit Committee Chairman, since 2008 | Retired. Prior thereto, Chief Executive Officer and Chief Investment Officer of Minneapolis Employees Retirement Fund from 1996 to 2008. Ms. Johnson is an attorney, certified public accountant and a certified managerial accountant. | Asset Allocation Trust | |||
| Leroy Keith, Jr. (Born 1939) | Trustee, since 2010 | Chairman, Bloc Global Services (development and construction). Trustee of the Evergreen Funds from 1983 to 2010. Former Managing Director, Almanac Capital Management (commodities firm), former Partner, Stonington Partners, Inc. (private equity fund), former Director, Obagi Medical Products Co. and former Director, Lincoln Educational Services. | Trustee, Virtus Fund Complex (consisting of 50 portfolios as of 12/16/2013); Asset Allocation Trust | |||
| David F. Larcker (Born 1950) | Trustee, since 2009 | James Irvin Miller Professor of Accounting at the Graduate School of Business, Stanford University, Morgan Stanley Director of the Center for Leadership Development and Research and Senior Faculty of The Rock Center for Corporate Governance since 2006. From 2005 to 2008, Professor of Accounting at the Graduate School of Business, Stanford University. Prior thereto, Ernst & Young Professor of Accounting at The Wharton School, University of Pennsylvania from 1985 to 2005. | Asset Allocation Trust | |||
| Olivia S. Mitchell (Born 1953) | Trustee, since 2006 | International Foundation of Employee Benefit Plans Professor, Wharton School of the University of Pennsylvania since 1993. Director of Wharton’s Pension Research Council and Boettner Center on Pensions & Retirement Research, and Research Associate at the National Bureau of Economic Research. Previously, Cornell University Professor from 1978 to 1993. | Asset Allocation Trust | |||
| Timothy J. Penny (Born 1951) | Trustee, since 1996 | President and CEO of Southern Minnesota Initiative Foundation, a non-profit organization, since 2007 and Senior Fellow at the Humphrey Institute Policy Forum at the University of Minnesota since 1995. Member of the Board of Trustees of NorthStar Education Finance, Inc., a non-profit organization, since 2007. | Asset Allocation Trust |
Table of Contents
| 26 | Wells Fargo Advantage VT International Equity Fund | Other information (unaudited) |
Name and year of birth | Position held and length of service* | Principal occupations during past five years | Other directorships during | |||
| Michael S. Scofield (Born 1943) | Trustee, since 2010 | Served on the Investment Company Institute’s Board of Governors and Executive Committee from 2008-2011 as well the Governing Council of the Independent Directors Council from 2006-2011 and the Independent Directors Council Executive Committee from 2008-2011. Chairman of the IDC from 2008-2010. Institutional Investor (Fund Directions) Trustee of Year in 2007. Trustee of the Evergreen Funds (and its predecessors) from 1984 to 2010. Chairman of the Evergreen Funds from 2000-2010. Former Trustee of the Mentor Funds. Retired Attorney, Law Offices of Michael S. Scofield. | Asset Allocation Trust | |||
| Donald C. Willeke (Born 1940) | Trustee, since 1996 | Principal of the law firm of Willeke & Daniels. General Counsel of the Minneapolis Employees Retirement Fund from 1984 until its consolidation into the Minnesota Public Employees Retirement Association on June 30, 2010. Director and Vice Chair of The Tree Trust (non-profit corporation). Director of the American Chestnut Foundation (non-profit corporation). | Asset Allocation Trust |
| * | Length of service dates reflect the Trustee’s commencement of service with the Trust’s predecessor entities, where applicable. |
Officers
Name and year of birth | Position held and length of service | Principal occupations during past five years | ||||
| Karla M. Rabusch (Born 1959) | President, since 2003 | Executive Vice President of Wells Fargo Bank, N.A. and President of Wells Fargo Funds Management, LLC since 2003. | ||||
| Jeremy DePalma1 (Born 1974) | Treasurer, since 2012 | Senior Vice President of Wells Fargo Funds Management, LLC since 2009. Senior Vice President of Evergreen Investment Management Company, LLC from 2008 to 2010. Vice President, Evergreen Investment Services, Inc. from 2004 to 2007. Head of the Fund Reporting and Control Team within Fund Administration from 2005 to 2010. | ||||
| C. David Messman (Born 1960) | Secretary, since 2000; Chief Legal Officer, since 2003 | Senior Vice President and Secretary of Wells Fargo Funds Management, LLC since 2001. Vice President and Managing Counsel of Wells Fargo Bank, N.A. since 1996. | ||||
| Debra Ann Early (Born 1964) | Chief Compliance Officer, since 2007 | Chief Compliance Officer of Wells Fargo Funds Management, LLC since 2007. Chief Compliance Officer of Parnassus Investments from 2005 to 2007. Chief Financial Officer of Parnassus Investments from 2004 to 2007. | ||||
| David Berardi (Born 1975) | Assistant Treasurer, since 2009 | Vice President of Wells Fargo Funds Management, LLC since 2009. Vice President of Evergreen Investment Management Company, LLC from 2008 to 2010. Assistant Vice President of Evergreen Investment Services, Inc. from 2004 to 2008. Manager of Fund Reporting and Control for Evergreen Investment Management Company, LLC from 2004 to 2010. |
| 1. | Jeremy DePalma acts as Treasurer of 59 funds and Assistant Treasurer of 73 funds in the Fund Complex. |
| 2. | The Statement of Additional Information includes additional information about the Trustees and is available, without charge, upon request, by calling 1-800-222-8222 or by visiting the website at wellsfargoadvantagefunds.com. |
Table of Contents
| List of abbreviations | Wells Fargo Advantage VT International Equity Fund | 27 |
The following is a list of common abbreviations for terms and entities that may have appeared in this report.
| ACA | — ACA Financial Guaranty Corporation |
| ADR | — American depositary receipt |
| ADS | — American depositary shares |
| AGC | — Assured Guaranty Corporation |
| AGM | — Assured Guaranty Municipal |
| Ambac | — Ambac Financial Group Incorporated |
| AMT | — Alternative minimum tax |
| AUD | — Australian dollar |
| BAN | — Bond anticipation notes |
| BHAC | — Berkshire Hathaway Assurance Corporation |
| BRL | — Brazilian real |
| CAB | — Capital appreciation bond |
| CAD | — Canadian dollar |
| CCAB | — Convertible capital appreciation bond |
| CDA | — Community Development Authority |
| CDO | — Collateralized debt obligation |
| CHF | — Swiss franc |
| COP | — Certificate of participation |
| DKK | — Danish krone |
| DRIVER | — Derivative inverse tax-exempt receipts |
| DW&P | — Department of Water & Power |
| DWR | — Department of Water Resources |
| ECFA | — Educational & Cultural Facilities Authority |
| EDA | — Economic Development Authority |
| EDFA | — Economic Development Finance Authority |
| ETF | — Exchange-traded fund |
| EUR | — Euro |
| FDIC | — Federal Deposit Insurance Corporation |
| FFCB | — Federal Farm Credit Banks |
| FGIC | — Financial Guaranty Insurance Corporation |
| FHA | — Federal Housing Administration |
| FHLB | — Federal Home Loan Bank |
| FHLMC | — Federal Home Loan Mortgage Corporation |
| FICO | — The Financing Corporation |
| FNMA | — Federal National Mortgage Association |
| FSA | — Farm Service Agency |
| GBP | — Great British pound |
| GDR | — Global depositary receipt |
| GNMA | — Government National Mortgage Association |
| GO | — General obligation |
| HCFR | — Healthcare facilities revenue |
| HEFA | — Health & Educational Facilities Authority |
| HEFAR | — Higher education facilities authority revenue |
| HFA | — Housing Finance Authority |
| HFFA | — Health Facilities Financing Authority |
| HKD | — Hong Kong dollar |
| HUD | — Department of Housing and Urban Development |
| HUF | — Hungarian forint |
| IDA | — Industrial Development Authority |
| IDAG | — Industrial Development Agency |
| IDR | — Industrial development revenue |
| IEP | — Irish pound |
| JPY | — Japanese yen |
| KRW | — Republic of Korea won |
| LIBOR | — London Interbank Offered Rate |
| LIQ | — Liquidity agreement |
| LLC | — Limited liability company |
| LLP | — Limited liability partnership |
| LOC | — Letter of credit |
| LP | — Limited partnership |
| MBIA | — Municipal Bond Insurance Association |
| MFHR | — Multifamily housing revenue |
| MSTR | — Municipal securities trust receipts |
| MTN | — Medium-term note |
| MUD | — Municipal Utility District |
| MXN | — Mexican peso |
| MYR | — Malaysian ringgit |
| National | — National Public Finance Guarantee Corporation |
| NGN | — Nigerian naira |
| NOK | — Norwegian krone |
| NZD | — New Zealand dollar |
| PCFA | — Pollution Control Financing Authority |
| PCL | — Public Company Limited |
| PCR | — Pollution control revenue |
| PFA | — Public Finance Authority |
| PFFA | — Public Facilities Financing Authority |
| PFOTER | — Puttable floating option tax-exempt receipts |
| plc | — Public limited company |
| PLN | — Polish zloty |
| PUTTER | — Puttable tax-exempt receipts |
| R&D | — Research & development |
| Radian | — Radian Asset Assurance |
| RAN | — Revenue anticipation notes |
| RDA | — Redevelopment Authority |
| RDFA | — Redevelopment Finance Authority |
| REIT | — Real estate investment trust |
| ROC | — Reset option certificates |
| RON | — Romanian lei |
| RUB | — Russian ruble |
| SAVRS | — Select auction variable rate securities |
| SBA | — Small Business Authority |
| SEK | — Swedish krona |
| SFHR | — Single-family housing revenue |
| SFMR | — Single-family mortgage revenue |
| SGD | — Singapore dollar |
| SKK | — Slovakian koruna |
| SPA | — Standby purchase agreement |
| SPDR | — Standard & Poor’s Depositary Receipts |
| STRIPS | — Separate trading of registered interest and principal securities |
| TAN | — Tax anticipation notes |
| TBA | — To be announced |
| THB | — Thai baht |
| TIPS | — Treasury inflation-protected securities |
| TRAN | — Tax revenue anticipation notes |
| TRY | — Turkish lira |
| TTFA | — Transportation Trust Fund Authority |
| TVA | — Tennessee Valley Authority |
| ZAR | — South African rand |
Table of Contents
This page is intentionally left blank.
Table of Contents


For more information
More information about Wells Fargo Advantage Funds is available free upon request. To obtain literature, please write, email, visit the Fund’s website, or call:
Wells Fargo Advantage Funds
P.O. Box 8266
Boston, MA 02266-8266
Email: wfaf@wellsfargo.com
Website: wellsfargoadvantagefunds.com
Individual investors: 1-800-222-8222
Retail investment professionals: 1-888-877-9275
Institutional investment professionals: 1-866-765-0778
This report and the financial statements contained herein are submitted for the general information of the shareholders of Wells Fargo Advantage Funds. If this report is used for promotional purposes, distribution of the report must be accompanied or preceded by a current prospectus. For a current prospectus and, if available, a summary prospectus containing more complete information, including charges and expenses, call 1-800-222-8222 or visit the Fund’s website at wellsfargoadvantagefunds.com . Please consider the investment objectives, risks, charges, and expenses of the investment carefully before investing. This and other information about Wells Fargo Advantage Funds can be found in the current prospectus. Read the prospectus carefully before you invest or send money.
Wells Fargo Funds Management, LLC, a wholly owned subsidiary of Wells Fargo & Company, provides investment advisory and administrative services for Wells Fargo Advantage Funds. Other affiliates of Wells Fargo & Company provide subadvisory and other services for the Funds. The Funds are distributed by Wells Fargo Funds Distributor, LLC, Member FINRA/SIPC, an affiliate of Wells Fargo & Company.
NOT FDIC INSURED ¡ NO BANK GUARANTEE ¡ MAY LOSE VALUE
© 2014 Wells Fargo Funds Management, LLC. All rights reserved.
222094 02-14 AVT3/AR149 12-13 |
Table of Contents

Wells Fargo Advantage VT Intrinsic Value Fund

Annual Report
December 31, 2013

Table of Contents
Reduce clutter. Save trees.
Sign up for electronic delivery of prospectuses and shareholder reports at wellsfargo.com/advantagedelivery
| 2 | ||||
| 4 | ||||
| 8 | ||||
| 9 | ||||
Financial statements | ||||
| 12 | ||||
| 13 | ||||
| 14 | ||||
| 15 | ||||
| 16 | ||||
| 20 | ||||
| 21 | ||||
| 24 | ||||
The views expressed and any forward-looking statements are as of December 31, 2013, unless otherwise noted, and are those of the Fund managers and/or Wells Fargo Funds Management, LLC. Discussions of individual securities, or the markets generally, or any Wells Fargo Advantage Fund are not intended as individual recommendations. Future events or results may vary significantly from those expressed in any forward-looking statements; the views expressed are subject to change at any time in response to changing circumstances in the market. Wells Fargo Funds Management, LLC and the Fund disclaim any obligation to publicly update or revise any views expressed or forward-looking statements.
NOT FDIC INSURED ¡ NO BANK GUARANTEE ¡ MAY LOSE VALUE
Table of Contents
| 2 | Wells Fargo Advantage VT Intrinsic Value Fund | Letter to shareholders (unaudited) |

Karla M. Rabusch
President
Wells Fargo Advantage Funds
Major central banks continued to inject liquidity into the banks and the markets through various quantitative easing policies.
Dear Valued Shareholder:
We are pleased to offer you this annual report for the Wells Fargo Advantage VT Intrinsic Value Fund for the 12-month period that ended December 31, 2013. Much of the period was marked by monetary easing by global central banks. During the period, investor concerns that the U.S. Federal Reserve (Fed) would end its bond-buying program initially led to higher interest rates, resulting in losses for bond indexes and volatility for global stock indexes. These fears dissipated in late September 2013 and ended altogether in mid-December 2013 when the Fed announced a tapering timeline that was far more moderate than some had feared. Growing confidence that the U.S. economy was staging a fragile recovery resulted in double-digit returns for domestic stock market indexes for the 12-month reporting period.
Central banks continued to provide stimulus.
Major central banks continued to inject liquidity into the banks and the markets through various quantitative easing policies. Throughout the reporting period, the Federal Open Market Committee (FOMC)—the Fed’s monetary policymaking body—kept its key interest rate near zero in order to support the economy and the financial system. Entering the reporting period, the FOMC had committed to purchase $40 billion per month in mortgage-backed securities to support the housing market and $45 billion per month in long-term U.S. Treasuries to keep interest rates low. Because the markets benefited from the FOMC’s liquidity, the prices of both stocks and bonds initially fell after the FOMC indicated in May 2013 that it might reduce (or taper) its bond-buying program. In mid-December 2013, the FOMC announced that it would reduce its bond-buying program by $10 billion per month beginning in January 2014. The tapering was less aggressive than some investors had feared, and the markets ended 2013 strongly.
European markets continued to benefit from the European Central Bank’s (ECB’s) September 2012 announcement that it would purchase an unlimited amount of one- to three-year sovereign debt from countries that had formally applied for a bailout. As a result, when the tiny eurozone nation of Cyprus was forced to implement capital controls and impose losses on uninsured bank depositors in March 2013, global stock markets remained resilient despite short-term volatility. In May 2013, the ECB cut its key rate to a then-historic low of 0.5%. The ECB’s aggressive actions helped ease investor worries about a eurozone sovereign debt default. Given the substantial ties between the U.S. and Europe, the improved sentiment about the eurozone helped provide a tailwind for U.S. markets.
U.S. stock markets gained on relatively good news.
For most of the period, U.S. economic data remained moderately positive, gaining strength as the period progressed. Reported gross domestic product growth came in at a solid 1.1% annualized rate in the first quarter of 2013, a 2.5% annualized rate in the second quarter, a 4.1% annualized rate in the third quarter, and a 3.2% annualized rate (an advance estimate as of January 31, 2014) in the fourth quarter.
The most significant negative effect was the ongoing fight in Washington, D.C., over the federal budget and debt limit. The Budget Control Act of 2011, which was passed to resolve a previous fight over the federal debt ceiling, mandated budget sequestration that took effect on March 1, 2013, and was an overhang on economic growth throughout the remainder of the reporting period. Most recently, Congress was unable to pass a resolution to continue to fund the federal government, and thus, the federal government underwent a partial shutdown from September 30, 2013, through October 16, 2013. The government reopened after the president and Congress reached a deal that funded the government through January 15, 2014, and raised the debt limit through February 7, 2014. In December 2013, Congress passed the Ryan-Murray budget agreement, which funded the government through fiscal 2015, lessening the near-term prospect of another shutdown.
Table of Contents
| Letter to shareholders (unaudited) | Wells Fargo Advantage VT Intrinsic Value Fund | 3 |
Despite political headwinds, the relatively positive outlook for the U.S. economy contributed to a strong domestic stock market for most of the reporting period. Economically sensitive sectors, such as industrials and consumer discretionary, outperformed. Dividend-paying stocks led the market earlier in 2013 as investors sought yield in a historically low-yielding environment, but rising interest rates later in the period dampened their relative performance. Judging by various Russell indexes, small-cap stocks outperformed large-cap stocks, and growth stocks outperformed value stocks.
Don’t let short-term uncertainty derail long-term investment goals.
While periods of uncertainty can present challenges, they can also create opportunities, and experience has taught us that maintaining long-term investment goals can be an effective way to plan for the future. Although diversification cannot guarantee an investment profit or prevent losses, we believe it can be an effective way to manage investment risk and potentially smooth out overall portfolio performance. We encourage investors to know their investments and to understand that appropriate levels of risk-taking may unlock opportunities.
Thank you for choosing to invest with Wells Fargo Advantage Funds. We appreciate your confidence in us and remain committed to helping you meet your financial needs. For current information about your fund investments, contact your investment professional, visit our website at wellsfargoadvantagefunds.com, or call us directly at 1-800-222-8222. We are available 24 hours a day, 7 days a week.
Sincerely,

Karla M. Rabusch
President
Wells Fargo Advantage Funds
Despite political headwinds, the relatively positive outlook for the U.S. economy contributed to a strong domestic stock market for most of the reporting period.
Notice to shareholders
The Fund and Funds Management, LLC (“Funds Management”) have received an exemptive order from the SEC that permits Funds Management, subject to the approval of the Board of Trustees of the Fund, to select or replace certain subadvisers to manage all or a portion of the Fund’s assets and enter into, amend or terminate a sub-advisory agreement with certain subadvisers without obtaining shareholder approval (“Multi-manager Structure”). The Multi-manager Structure applies to subadvisers that are not affiliated with Funds Management or the Fund, except to the extent that affiliation arises solely because such subadvisers provide sub-advisory services to the Fund (“Non-affiliated Subadvisers”), as well as subadvisers that are indirect or direct wholly-owned subsidiaries of Funds Management or of another company that, indirectly or directly, wholly owns Funds Management (“Wholly-owned Subadvisers”).
Pursuant to the SEC order, Funds Management, with the approval of the Board of Trustees, has the discretion to terminate any subadvisers and allocate and reallocate the Fund’s assets among any other Non-affiliated Subadvisers or Wholly-owned Subadvisers. Funds Management, subject to oversight and supervision by the Board of Trustees, has responsibility to continue to oversee any subadvisers to the Fund and to recommend, for approval by the Board of Trustees, the hiring, termination and replacement of subadvisers for the Fund. In the event that a new subadviser is hired pursuant to the Multi-manager Structure, the Fund is required to provide notice to shareholders within 90 days.
Please contact your investment professional or call us directly at 1-800-222-8222 if you have any questions on this Notice to Shareholders.
Table of Contents
| 4 | Wells Fargo Advantage VT Intrinsic Value Fund | Performance highlights (unaudited) |
Investment objective
The Fund seeks long-term capital appreciation.
Adviser
Wells Fargo Funds Management, LLC
Subadviser
Metropolitan West Capital Management, LLC
Portfolio managers
Miguel E. Giaconi, CFA
Jean-Baptiste Nadal, CFA
Jeffrey Peck
Average annual total returns1 (%) as of December 31, 2013
| Expense ratios2 (%) | |||||||||||||||||||||||
| Inception date | 1 year | 5 year | 10 year | Gross | Net3 | |||||||||||||||||||
| Class 2 | 5-6-1996 | 30.30 | 15.17 | 6.27 | 1.15 | 1.01 | ||||||||||||||||||
| Russell 1000® Value Index4 | – | 32.53 | 16.67 | 7.58 | – | – | ||||||||||||||||||
Figures quoted represent past performance, which is no guarantee of future results and do not reflect the deduction of taxes that a shareholder may pay on fund distributions or the redemption of fund shares. Investment return and principal value of an investment will fluctuate so that an investor’s shares, when redeemed, may be worth more or less than their original cost. Current performance may be lower or higher than the performance data quoted, which assumes the reinvestment of dividends and capital gains. Current month-end performance is available by calling 1-800-222-8222. Performance figures of the Fund do not reflect fees charged pursuant to the terms of variable life insurance policies and variable annuity contracts. If fees had been reflected, performance would have been lower.
Index returns do not include transaction costs associated with buying and selling securities, any mutual fund fees or expenses, or any taxes. It is not possible to invest directly in an index.
Please keep in mind that high double-digit returns were primarily achieved during favorable market conditions. You should not expect that such favorable returns can be consistently achieved. A Fund’s performance, especially for very short time periods, should not be the sole factor in making your investment decision.
Stock values fluctuate in response to the activities of individual companies and general market and economic conditions. Certain investment strategies tend to increase the total risk of an investment (relative to the broader market). The Fund is exposed to foreign investment risk. Consult the Fund’s prospectus for additional information on these and other risks.
Please refer to the prospectus provided by your participating insurance company for detailed information describing the separate accounts for information regarding surrender charges, mortality and expense risk fees, and other charges that may be assessed by the participating insurance companies.
Please see footnotes on page 5.
Table of Contents
| Performance highlights (unaudited) | Wells Fargo Advantage VT Intrinsic Value Fund | 5 |
| Growth of $10,000 investment5 as of December 31, 2013 | ||
| ||
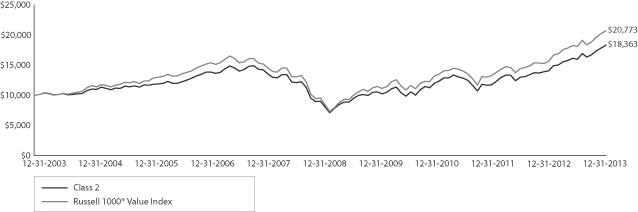
| 1. | Historical performance shown for Class 2 of the Fund prior to July 19, 2010, is based on the performance of the Fund’s predecessor, Wells Fargo Advantage VT Equity Income Fund. |
| 2. | Reflects the expense ratios as stated in the most recent prospectus. |
| 3. | The Adviser has committed through April 30, 2014, to waive fees and/or reimburse expenses to the extent necessary to cap the Fund’s Total Annual Fund Operating Expenses After FeeWaiver, excluding certain expenses, at 1.00% for Class 2. Brokerage commissions, stamp duty fees, interest, taxes, acquired fund fees and expenses, and extraordinary expenses are excluded from the cap. Without this cap, the Fund’s returns would have been lower. |
| 4. | The Russell 1000® Value Index measures the performance of those Russell 1000 companies with lower price-to-book ratios and lower forecasted growth values. You cannot invest directly in an index. |
| 5. | The chart compares the performance of Class 2 shares for the most recent ten years with the Russell 1000 Value Index. The chart assumes a hypothetical $10,000 investment and reflects all operating expenses of the Fund. Performance figures of the Fund do not reflect fees charged pursuant to the terms of variable life insurance policies and variable annuity contracts |
| 6. | The ten largest equity holdings are calculated based on the value of the securities divided by total net assets of the Fund. Holdings are subject to change and may have changed since the date specified. |
| 7. | Sector distribution is subject to change and is calculated based on the total long-term investments of the Fund. |
Table of Contents
| 6 | Wells Fargo Advantage VT Intrinsic Value Fund | Performance highlights (unaudited) |
MANAGER’S DISCUSSION
Fund highlights
| n | The Fund underperformed its benchmark, the Russell 1000 Value Index, for the 12-month period that ended December 31, 2013. |
| n | Stock selection accounted for all of the Fund’s underperformance. Relative sector weightings, which are a by-product of our bottom-up security selection process, were net contributors during the period. |
| n | Security selection in the information technology (IT) and consumer staples sectors detracted from relative return. However, the negative effect was partially offset by an overweight in the IT sector, which was the best-performing sector in the index. Stock selection in the energy and financials sectors, as well as an underweight in the weak-performing energy sector, enhanced relative performance. |
Stock selection was the primary source of underperformance during the 12-month period.
During the period, stock selection in the IT and consumer staples sectors subtracted value from relative return. However, the negative effect was partially offset by an overweight in the IT sector, which was the best-performing sector in the index. (Sector weights are purely the result of our bottom-up stock selection process.) Primary detractors included technology solutions provider International Business Machines Corporation (IBM) in the IT sector and consumer goods provider Unilever NV in the consumer staples sector.
| Ten largest equity holdings6 (%) as of December 31, 2013 | ||||
Zions Bancorporation | 3.17 | |||
The Boeing Company | 3.14 | |||
Walt Disney Company | 2.98 | |||
NextEra Energy Incorporated | 2.88 | |||
Goldman Sachs Group Incorporated | 2.81 | |||
TRW Automotive Holdings Corporation | 2.72 | |||
Honeywell International Incorporated | 2.62 | |||
PepsiCo Incorporated | 2.59 | |||
Time Warner Incorporated | 2.57 | |||
E.I. du Pont de Nemours & Company | 2.56 | |||
On the positive side, security selection in the energy and financials sectors, as well as an underweight in the weak-performing energy sector, enhanced relative performance. Top contributors across the portfolio included integrated energy company, Hess Corporation, in the energy sector and broker/dealer, Charles Schwab Corporation, in the financials sector.
The Fund’s non-U.S. holdings detracted value relative to the Russell 1000 Value Index during the past 12 months. However, we continue to maintain our global research perspective, which we believe allows us to better understand the companies in which we invest by providing context on their worldwide competitors, suppliers, and customers.
| Sector distribution7 as of December 31, 2013 | ||
| ||
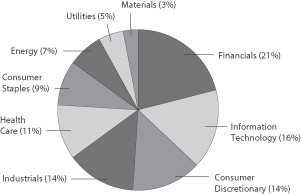
During the past 12 months, we added a few high-quality investments to the Fund’s holdings and divested a few positions according to our disciplined sell process.
Consistent with our long-term investment perspective, annual portfolio turnover remained less than 25%, and the Fund’s positioning relative to the benchmark shifted only moderately. The Fund’s overweight in the consumer discretionary sector increased with a new investment in Paris-based retailer Kering (formerly known as PPR S.A.). With the announced acquisition and then subsequent sale of food products manufacturer H. J. Heinz Company, the Fund’s overweight in the consumer staples sector declined. Additionally, the Fund’s significant overweight in the IT sector narrowed with the
divestment of the world’s largest online marketplace, eBay Incorporated, and reductions to existing positions in IBM and technology products and service provider EMC Corporation. Both investments were reduced to moderate the Fund’s
Please see footnotes on page 5.
Table of Contents
| Performance highlights (unaudited) | Wells Fargo Advantage VT Intrinsic Value Fund | 7 |
exposure to corporate IT spending. The Fund’s underweight in the materials sector was reduced with the recent purchase of chemical and agriculture company E. I. du Pont de Nemours and Company. Lastly, the Fund’s underweight in the financials sector was reduced by our purchases of global financial services firms UBS AG and Goldman Sachs Group Incorporated, but the purchases were partially offset by the sale of regional bank M&T Bank Corporation. Meanwhile, the Fund remained noticeably overweight in industrials and meaningfully underweight in energy.
We believe individual company fundamentals will ultimately determine security performance.
The past year brought a plethora of events for investors to digest, and the market moved in unison with major news releases. In the short run, market participants often failed to reward high-quality businesses. In certain sectors, low-quality businesses outperformed. Amid the market euphoria, we continued adhering to our disciplined investment process. We remained focused on individual companies rather than on broad, top-down macroeconomic or sector forecasts. Although the unprecedented level of accommodative monetary policies by world central banks created a more challenging investment landscape for fundamental investors, our investment team was still able to find new investment candidates for the Fund.
While we cannot accurately foretell the final outcome of the Federal Reserve’s (Fed’s) monumental monetary stimulus program, signs are emerging that quantitative easing may be finally trickling down to the real economy. As the Fed proceeds with tapering, we anticipate that company-specific fundamentals will come back into play—which may create a more favorable environment for bottom-up, company-focused investment philosophies such as ours.
Please see footnotes on page 5.
Table of Contents
| 8 | Wells Fargo Advantage VT Intrinsic Value Fund | Fund expenses (unaudited) |
As a shareholder of the Fund, you incur ongoing costs, including management fees, distribution (12b-1) fees, and other Fund expenses. This example is intended to help you understand your ongoing costs (in dollars) of investing in the Fund and to compare these costs with the ongoing costs of investing in other mutual funds.
The example is based on an investment of $1,000 invested at the beginning of the six-month period and held for the entire period from July 1, 2013 to December 31, 2013.
Actual expenses
The “Actual” line of the table below provides information about actual account values and actual expenses. You may use the information in this line, together with the amount you invested, to estimate the expenses that you paid over the period. Simply divide your account value by $1,000 (for example, an $8,600 account value divided by $1,000 = 8.6), then multiply the result by the number in the “Actual” line under the heading entitled “Expenses Paid During Period” for your applicable class of shares to estimate the expenses you paid on your account during this period.
Hypothetical example for comparison purposes
The “Hypothetical” line of the table below provides information about hypothetical account values and hypothetical expenses based on the Fund’s actual expense ratio and an assumed rate of return of 5% per year before expenses, which is not the Fund’s actual return. The hypothetical account values and expenses may not be used to estimate the actual ending account balance or expenses you paid for the period. You may use this information to compare the ongoing costs of investing in the Fund and other funds. To do so, compare this 5% hypothetical example with the 5% hypothetical examples that appear in the shareholder reports of the other funds.
Please note that the expenses shown in the table are meant to highlight your ongoing costs only and do not reflect any separate account charges assessed by participating insurance companies. Therefore, the “Hypothetical” line of the table is useful in comparing ongoing costs only, and will not help you determine the relative total costs of owning different funds. In addition, if these separate account charges assessed by participating insurance companies were included, your costs would have been higher.
| Beginning account value 7-1-2013 | Ending account value 12-31-2013 | Expenses paid during the period1 | Net annual expense ratio | |||||||||||||
Class 2 | ||||||||||||||||
Actual | $ | 1,000.00 | $ | 1,147.00 | $ | 5.41 | 1.00 | % | ||||||||
Hypothetical (5% return before expenses) | $ | 1,000.00 | $ | 1,020.16 | $ | 5.09 | 1.00 | % | ||||||||
| 1. | Expenses paid is equal to the annualized expense ratio multiplied by the average account value over the period, multiplied by the number of days in the most recent fiscal half-year divided by the number of days in the fiscal year (to reflect the one-half year period). |
Table of Contents
| Portfolio of investments—December 31, 2013 | Wells Fargo Advantage VT Intrinsic Value Fund | 9 |
| Security name | Shares | Value | ||||||||||
Common Stocks: 94.18% | ||||||||||||
Consumer Discretionary: 13.52% | ||||||||||||
| Auto Components: 2.72% | ||||||||||||
TRW Automotive Holdings Corporation † | 18,800 | $ | 1,398,532 | |||||||||
|
| |||||||||||
| Media: 5.55% | ||||||||||||
Time Warner Incorporated | 18,898 | 1,317,569 | ||||||||||
Walt Disney Company | 20,020 | 1,529,528 | ||||||||||
| 2,847,097 | ||||||||||||
|
| |||||||||||
| Specialty Retail: 3.45% | ||||||||||||
Home Depot Incorporated | 13,400 | 1,103,356 | ||||||||||
Tiffany & Company | 7,200 | 668,016 | ||||||||||
| 1,771,372 | ||||||||||||
|
| |||||||||||
| Textiles, Apparel & Luxury Goods: 1.80% | ||||||||||||
Kering Unsponsored ADR | 43,639 | 923,929 | ||||||||||
|
| |||||||||||
Consumer Staples: 8.89% | ||||||||||||
| Beverages: 4.48% | ||||||||||||
Diageo plc ADR | 7,350 | 973,287 | ||||||||||
PepsiCo Incorporated | 16,017 | 1,328,450 | ||||||||||
| 2,301,737 | ||||||||||||
|
| |||||||||||
| Food Products: 4.41% | ||||||||||||
The Hershey Company | 11,900 | 1,157,037 | ||||||||||
Unilever NV ADR | 27,508 | 1,106,647 | ||||||||||
| 2,263,684 | ||||||||||||
|
| |||||||||||
Energy: 6.78% | ||||||||||||
| Energy Equipment & Services: 3.21% | ||||||||||||
FMC Technologies Incorporated † | 12,545 | 654,974 | ||||||||||
Schlumberger Limited | 11,000 | 991,210 | ||||||||||
| 1,646,184 | ||||||||||||
|
| |||||||||||
| Oil, Gas & Consumable Fuels: 3.57% | ||||||||||||
Hess Corporation | 6,050 | 502,150 | ||||||||||
Occidental Petroleum Corporation | 13,490 | 1,282,899 | ||||||||||
QEP Resources Incorporated | 1,573 | 48,212 | ||||||||||
| 1,833,261 | ||||||||||||
|
| |||||||||||
Financials: 19.63% | ||||||||||||
| Capital Markets: 11.65% | ||||||||||||
Charles Schwab Corporation | 42,891 | 1,115,166 | ||||||||||
Franklin Resources Incorporated | 19,800 | 1,143,054 | ||||||||||
Goldman Sachs Group Incorporated | 8,149 | 1,444,492 | ||||||||||
Northern Trust Corporation | 19,300 | 1,194,477 | ||||||||||
UBS AG | 56,466 | 1,086,971 | ||||||||||
| 5,984,160 | ||||||||||||
|
| |||||||||||
The accompanying notes are an integral part of these financial statements.
Table of Contents
| 10 | Wells Fargo Advantage VT Intrinsic Value Fund | Portfolio of investments—December 31, 2013 |
| Security name | Shares | Value | ||||||||||
| Commercial Banks: 5.46% | ||||||||||||
SunTrust Banks Incorporated | 31,885 | $ | 1,173,687 | |||||||||
Zions Bancorporation | 54,400 | 1,629,824 | ||||||||||
| 2,803,511 | ||||||||||||
|
| |||||||||||
| Diversified Financial Services: 2.52% | ||||||||||||
JPMorgan Chase & Company | 22,136 | 1,294,513 | ||||||||||
|
| |||||||||||
Health Care: 10.39% | ||||||||||||
| Health Care Equipment & Supplies: 4.44% | ||||||||||||
Abbott Laboratories | 32,267 | 1,236,794 | ||||||||||
Baxter International Incorporated | 15,000 | 1,043,250 | ||||||||||
| 2,280,044 | ||||||||||||
|
| |||||||||||
| Health Care Providers & Services: 4.73% | ||||||||||||
Cigna Corporation | 14,933 | 1,306,339 | ||||||||||
Express Scripts Holding Company † | 16,000 | 1,123,840 | ||||||||||
| 2,430,179 | ||||||||||||
|
| |||||||||||
| Pharmaceuticals: 1.22% | ||||||||||||
Abbvie Incorporated | 11,800 | 623,158 | ||||||||||
|
| |||||||||||
Industrials: 13.27% | ||||||||||||
| Aerospace & Defense: 7.34% | ||||||||||||
Honeywell International Incorporated | 14,715 | 1,344,510 | ||||||||||
Huntington Ingalls Industries Incorporated | 9,000 | 810,090 | ||||||||||
The Boeing Company | 11,824 | 1,613,858 | ||||||||||
| 3,768,458 | ||||||||||||
|
| |||||||||||
| Air Freight & Logistics: 2.50% | ||||||||||||
United Parcel Service Incorporated Class B | 12,221 | 1,284,183 | ||||||||||
|
| |||||||||||
| Electrical Equipment: 1.64% | ||||||||||||
Sensata Technologies Holdings NV † | 21,733 | 842,588 | ||||||||||
|
| |||||||||||
| Machinery: 1.79% | ||||||||||||
Deere & Company | 10,065 | 919,236 | ||||||||||
|
| |||||||||||
Information Technology: 14.55% | ||||||||||||
| Communications Equipment: 2.47% | ||||||||||||
QUALCOMM Incorporated | 17,104 | 1,269,972 | ||||||||||
|
| |||||||||||
| Computers & Peripherals: 3.87% | ||||||||||||
Apple Incorporated | 1,830 | 1,026,831 | ||||||||||
EMC Corporation | 38,176 | 960,126 | ||||||||||
| 1,986,957 | ||||||||||||
|
| |||||||||||
| IT Services: 1.44% | ||||||||||||
International Business Machines Corporation | 3,941 | 739,213 | ||||||||||
|
| |||||||||||
The accompanying notes are an integral part of these financial statements.
Table of Contents
| Portfolio of investments—December 31, 2013 | Wells Fargo Advantage VT Intrinsic Value Fund | 11 |
| Security name | Shares | Value | ||||||||||||
| Semiconductors & Semiconductor Equipment: 1.92% | ||||||||||||||
Texas Instruments Incorporated | 22,474 | $ | 986,833 | |||||||||||
|
| |||||||||||||
| Software: 4.85% | ||||||||||||||
Intuit Incorporated | 16,678 | 1,272,865 | ||||||||||||
Oracle Corporation | 31,737 | 1,214,258 | ||||||||||||
| 2,487,123 | ||||||||||||||
|
| |||||||||||||
Materials: 2.56% | ||||||||||||||
| Chemicals: 2.56% | ||||||||||||||
E.I. du Pont de Nemours & Company | 20,254 | 1,315,902 | ||||||||||||
|
| |||||||||||||
Utilities: 4.59% | ||||||||||||||
| Electric Utilities: 4.59% | ||||||||||||||
NextEra Energy Incorporated | 17,300 | 1,481,227 | ||||||||||||
Northeast Utilities | 20,690 | 877,049 | ||||||||||||
| 2,358,276 | ||||||||||||||
|
| |||||||||||||
Total Common Stocks (Cost $32,987,428) | 48,360,102 | |||||||||||||
|
| |||||||||||||
| Yield | ||||||||||||||
Short-Term Investments: 6.31% | ||||||||||||||
| Investment Companies: 6.31% | ||||||||||||||
Wells Fargo Advantage Cash Investment Money Market Fund, Select Class (l)(u) | 0.06 | % | 3,239,684 | 3,239,684 | ||||||||||
|
| |||||||||||||
Total Short-Term Investments (Cost $3,239,684) | 3,239,684 | |||||||||||||
|
| |||||||||||||
| Total investments in securities | ||||||||
| (Cost $36,227,112) * | 100.49 | % | 51,599,786 | |||||
Other assets and liabilities, net | (0.49 | ) | (254,108 | ) | ||||
|
|
|
| |||||
| Total net assets | 100.00 | % | $ | 51,345,678 | ||||
|
|
|
|
| † | Non-income-earning security |
| (l) | Investment in an affiliate |
| (u) | Rate shown is the 7-day annualized yield at period end. |
| * | Cost for federal income tax purposes is $36,229,834 and unrealized appreciation (depreciation) consists of: |
Gross unrealized appreciation | $ | 15,396,814 | ||
Gross unrealized depreciation | (26,862 | ) | ||
|
| |||
Net unrealized appreciation | $ | 15,369,952 |
The accompanying notes are an integral part of these financial statements.
Table of Contents
| 12 | Wells Fargo Advantage VT Intrinsic Value Fund | Statement of assets and liabilities—December 31, 2013 |
Assets | ||||
Investments | ||||
In unaffiliated securities, at value (see cost below) | $ | 48,360,102 | ||
In affiliated securities, at value (see cost below) | 3,239,684 | |||
|
| |||
Total investments, at value (see cost below) | 51,599,786 | |||
Receivable for investments sold | 60,248 | |||
Receivable for Fund shares sold | 138,951 | |||
Receivable for dividends | 64,073 | |||
Receivable for securities lending income | 79 | |||
Prepaid expenses and other assets | 594 | |||
|
| |||
Total assets | 51,863,731 | |||
|
| |||
Liabilities | ||||
Payable for investments purchased | 343,076 | |||
Payable for Fund shares redeemed | 71,984 | |||
Advisory fee payable | 18,956 | |||
Distribution fees payable | 11,027 | |||
Due to other related parties | 5,734 | |||
Shareholder report expenses payable | 26,305 | |||
Professional fees payable | 37,246 | |||
Accrued expenses and other liabilities | 3,725 | |||
|
| |||
Total liabilities | 518,053 | |||
|
| |||
Total net assets | $ | 51,345,678 | ||
|
| |||
NET ASSETS CONSIST OF | ||||
Paid-in capital | $ | 36,508,123 | ||
Undistributed net investment income | 367,806 | |||
Accumulated net realized losses on investments | (902,925 | ) | ||
Net unrealized gains on investments | 15,372,674 | |||
|
| |||
Total net assets | $ | 51,345,678 | ||
|
| |||
COMPUTATION OF NET ASSET VALUE PER SHARE1 | ||||
Net assets – Class 2 | $ | 51,345,678 | ||
Shares outstanding – Class 2 | 2,721,548 | |||
Net asset value per share – Class 2 | $18.87 | |||
Investments in unaffiliated securities, at cost | $ | 32,987,428 | ||
|
| |||
Investments in affiliated securities, at cost | $ | 3,239,684 | ||
|
| |||
Total investments, at cost | $ | 36,227,112 | ||
|
| |||
| 1. | The Fund has an unlimited number of authorized shares. |
The accompanying notes are an integral part of these financial statements.
Table of Contents
| Statement of operations—year ended December 31, 2013 | Wells Fargo Advantage VT Intrinsic Value Fund | 13 |
Investment income | ||||
Dividends * | $ | 856,402 | ||
Securities lending income, net | 7,448 | |||
Income from affiliated securities | 1,494 | |||
|
| |||
Total investment income | 865,344 | |||
|
| |||
Expenses | ||||
Advisory fee | 273,639 | |||
Administration fees | ||||
Fund level | 24,876 | |||
Class 2 | 39,802 | |||
Distribution fees | ||||
Class 2 | 124,381 | |||
Custody and accounting fees | 9,224 | |||
Professional fees | 44,332 | |||
Shareholder report expenses | 25,331 | |||
Trustees’ fees and expenses | 12,505 | |||
Other fees and expenses | 3,987 | |||
|
| |||
Total expenses | 558,077 | |||
Less: Fee waivers and/or expense reimbursements | (60,551 | ) | ||
|
| |||
Net expenses | 497,526 | |||
|
| |||
Net investment income | 367,818 | |||
|
| |||
REALIZED AND UNREALIZED GAINS (LOSSES) ON INVESTMENTS | ||||
Net realized gains on investments | 5,759,618 | |||
Net change in unrealized gains (losses) on investments | 6,914,033 | |||
|
| |||
Net realized and unrealized gains (losses) on investments | 12,673,651 | |||
|
| |||
Net increase in net assets resulting from operations | $ | 13,041,469 | ||
|
| |||
* Net of foreign dividend withholding taxes in the amount of | $10,216 | |||
The accompanying notes are an integral part of these financial statements.
Table of Contents
| 14 | Wells Fargo Advantage VT Intrinsic Value Fund | Statement of changes in net assets |
| Year ended December 31, 2013 | Year ended December 31, 2012 | |||||||||||||||
Operations | ||||||||||||||||
Net investment income | $ | 367,818 | $ | 509,082 | ||||||||||||
Net realized gains on investments | 5,759,618 | 4,170,986 | ||||||||||||||
Net change in unrealized gains (losses) on investments | 6,914,033 | 3,804,036 | ||||||||||||||
|
|
|
|
|
|
|
| |||||||||
Net increase in net assets resulting from operations | 13,041,469 | 8,484,104 | ||||||||||||||
|
|
|
|
|
|
|
| |||||||||
Distributions to shareholders from | ||||||||||||||||
Net investment income – Class 2 | (511,372 | ) | (637,443 | ) | ||||||||||||
|
|
|
|
|
|
|
| |||||||||
| Shares | Shares | |||||||||||||||
Capital share transactions | ||||||||||||||||
Proceeds from shares sold – Class 2 | 224,079 | 3,709,143 | 137,805 | 1,899,069 | ||||||||||||
Reinvestment of distributions – Class 2 | 29,800 | 511,372 | 48,255 | 637,443 | ||||||||||||
Payment for shares redeemed – Class 2 | (714,028 | ) | (11,967,978 | ) | (730,691 | ) | (10,104,674 | ) | ||||||||
|
|
|
|
|
|
|
| |||||||||
Net decrease in net assets resulting from capital share transactions | (7,747,463 | ) | (7,568,162 | ) | ||||||||||||
|
|
|
|
|
|
|
| |||||||||
Total increase in net assets | 4,782,634 | 278,499 | ||||||||||||||
|
|
|
|
|
|
|
| |||||||||
Net assets | ||||||||||||||||
Beginning of period | 46,563,044 | 46,284,545 | ||||||||||||||
|
|
|
|
|
|
|
| |||||||||
End of period | $ | 51,345,678 | $ | 46,563,044 | ||||||||||||
|
|
|
|
|
|
|
| |||||||||
Undistributed net investment income | $ | 367,806 | $ | 510,501 | ||||||||||||
|
|
|
|
|
|
|
| |||||||||
The accompanying notes are an integral part of these financial statements.
Table of Contents
| Financial highlights | Wells Fargo Advantage VT Intrinsic Value Fund | 15 |
(For a share outstanding throughout each period)
| Year ended December 31 | ||||||||||||||||||||
| CLASS 2 | 2013 | 2012 | 2011 | 20101,2 | 20092 | |||||||||||||||
Net asset value, beginning of period | $ | 14.63 | $ | 12.42 | $ | 12.76 | $ | 11.31 | $ | 9.88 | ||||||||||
Net investment income | 0.15 | 0.18 | 0.18 | 0.16 | 0.19 | |||||||||||||||
Net realized and unrealized gains (losses) on investments | 4.27 | 2.22 | (0.45 | ) | 1.39 | 1.44 | ||||||||||||||
|
|
|
|
|
|
|
|
|
| |||||||||||
Total from investment operations | 4.42 | 2.40 | (0.27 | ) | 1.55 | 1.63 | ||||||||||||||
Distributions to shareholders from | ||||||||||||||||||||
Net investment income | (0.18 | ) | (0.19 | ) | (0.07 | ) | (0.10 | ) | (0.20 | ) | ||||||||||
Net asset value, end of period | $ | 18.87 | $ | 14.63 | $ | 12.42 | $ | 12.76 | $ | 11.31 | ||||||||||
Total return | 30.30 | % | 19.47 | % | (2.15 | )% | 13.83 | % | 16.86 | % | ||||||||||
Ratios to average net assets (annualized) | ||||||||||||||||||||
Gross expenses | 1.12 | % | 1.14 | % | 1.17 | % | 1.10 | % | 1.18 | % | ||||||||||
Net expenses | 1.00 | % | 1.00 | % | 1.00 | % | 1.00 | % | 1.00 | % | ||||||||||
Net investment income | 0.74 | % | 1.07 | % | 1.17 | % | 1.29 | % | 1.94 | % | ||||||||||
Supplemental data | ||||||||||||||||||||
Portfolio turnover rate | 22 | % | 22 | % | 26 | % | 72 | % | 16 | % | ||||||||||
Net assets, end of period (000s omitted) | $51,346 | $46,563 | $46,285 | $58,832 | $54,441 | |||||||||||||||
| 1. | After the close of business on July 16, 2010, existing shares of Wells Fargo Advantage VT Equity Income Fund were renamed Class 2 shares. |
| 2. | After the close of business on July 16, 2010, the Fund acquired the net assets of Wells Fargo Advantage VT Equity Income Fund and Wells Fargo Advantage VT C&B Large Cap Value Fund. Wells Fargo Advantage VT Equity Income Fund became the accounting and performance survivor in the transaction. The information for the periods prior to July 19, 2010 is that of Wells Fargo Advantage VT Equity Income Fund. |
The accompanying notes are an integral part of these financial statements.
Table of Contents
| 16 | Wells Fargo Advantage VT Intrinsic Value Fund | Notes to financial statements |
1. ORGANIZATION
Wells Fargo Variable Trust (the “Trust”), a Delaware statutory trust organized on March 10, 1999, is an open-end management investment company registered under the Investment Company Act of 1940, as amended (the “1940 Act”). These financial statements report on the Wells Fargo Advantage VT Intrinsic Value Fund (the “Fund”) which is a diversified series of the Trust.
2. SIGNIFICANT ACCOUNTING POLICIES
The following significant accounting policies, which are consistently followed in the preparation of the financial statements of the Fund, are in conformity with U.S. generally accepted accounting principles which require management to make estimates and assumptions that affect the reported amounts of assets and liabilities, disclosure of contingent assets and liabilities at the date of the financial statements, and the reported amounts of revenues and expenses during the reporting period. Actual results could differ from those estimates.
Securities valuation
All investments are valued each business day as of the close of regular trading on the New York Stock Exchange (generally 4 p.m. Eastern Time).
Equity securities that are listed on a foreign or domestic exchange or market are valued at the official closing price or, if none, the last sales price. If no sale occurs on the primary exchange or market for the security that day, the prior day’s price will be deemed “stale” and fair values will be determined in accordance with the Fund’s Valuation Procedures.
Investments in registered open-end investment companies are valued at net asset value. Non-registered investment vehicles are fair valued at net asset value.
Investments which are not valued using any of the methods discussed above are valued at their fair value, as determined in good faith by the Board of Trustees of the Fund. The Board of Trustees has established a Valuation Committee comprised of the Trustees and has delegated to it the authority to take any actions regarding the valuation of portfolio securities that the Valuation Committee deems necessary or appropriate, including determining the fair value of portfolio securities, unless the determination has been delegated to the Management Valuation Team of Wells Fargo Funds Management, LLC (“Funds Management”). The Board of Trustees retains the authority to make or ratify any valuation decisions or approve any changes to the Valuation Procedures as it deems appropriate. On a quarterly basis, the Board of Trustees receives reports on any valuation actions taken by the Valuation Committee or the Management Valuation Team which may include items for ratification.
Valuations of fair valued securities are compared to the next actual sales price when available, or other appropriate market values, to assess the continued appropriateness of the fair valuation methodologies used. These securities are fair valued on a day-to-day basis, taking into consideration changes to appropriate market information and any significant changes to the inputs considered in the valuation process until there is a readily available price provided on an exchange or by an independent pricing service. Valuations received from an independent pricing service or independent broker-dealer quotes are periodically validated by comparisons to most recent trades and valuations provided by other independent pricing services in addition to the review of prices by the adviser and/or subadviser. Unobservable inputs used in determining fair valuations are identified based on the type of security, taking into consideration factors utilized by market participants in valuing the investment, knowledge about the issuer and the current market environment.
Security loans
The Fund may lend its securities from time to time in order to earn additional income in the form of fees or interest on securities received as collateral or the investment of any cash received as collateral. The Fund continues to receive interest or dividends on the securities loaned. The Fund receives collateral in the form of cash or securities with a value at least equal to the value of the securities on loan. The value of the loaned securities is determined at the close of each business day and any additional required collateral is delivered to the Fund on the next business day. In a securities lending transaction, the net asset value of the Fund will be affected by an increase or decrease in the value of the securities loaned and by an increase or decrease in the value of the instrument in which collateral is invested. The amount of securities lending activity undertaken by the Fund fluctuates from time to time. In the event of default or bankruptcy by the borrower, the Fund may be prevented from recovering the loaned securities or gaining access to the collateral or may experience delays or costs in doing so. In addition, the investment of any cash collateral received may lose all or part of its value. The Fund has the right under the lending agreement to recover the securities from the borrower on demand.
The Fund lends its securities through an unaffiliated securities lending agent. Cash collateral received in connection with its securities lending transactions is invested in Wells Fargo Securities Lending Cash Investments, LLC (the “Securities
Table of Contents
| Notes to financial statements | Wells Fargo Advantage VT Intrinsic Value Fund | 17 |
Lending Fund”). The Securities Lending Fund is exempt from registration under Section 3(c)(7) of the 1940 Act and is managed by Funds Management and is subadvised by Wells Capital Management Incorporated (“WellsCap”). Funds Management receives an advisory fee starting at 0.05% and declining to 0.01% as the average daily net assets of the Securities Lending Fund increase. All of the fees received by Funds Management are paid to WellsCap for its services as subadviser. The Securities Lending Fund seeks to provide a positive return compared to the daily Fed Funds Open rate by investing in high-quality, U.S. dollar-denominated short-term money market instruments. Securities Lending Fund investments are fair valued based upon the amortized cost valuation technique. Income earned from investment in the Securities Lending Fund is included in securities lending income on the Statement of Operations.
Security transactions and income recognition
Securities transactions are recorded on a trade date basis. Realized gains or losses are recorded on the basis of identified cost.
Dividend income is recognized on the ex-dividend date. Dividend income is recorded net of foreign taxes withheld where recovery of such taxes is not assured.
Distributions to shareholders
Distributions to shareholders from net investment income and net realized gains, if any, are recorded on the ex-dividend date. Such distributions are determined in conformity with federal income tax regulations, which may differ in amount or character from net investment income and realized gains recognized for purposes of U.S. generally accepted accounting principles.
Federal and other taxes
The Fund intends to continue to qualify as a regulated investment company by distributing substantially all of its investment company taxable income and any net realized capital gains (after reduction for capital loss carryforwards) sufficient to relieve it from all, or substantially all, federal income taxes. Accordingly, no provision for federal income taxes was required.
The Fund’s income and federal excise tax returns and all financial records supporting those returns for the prior three fiscal years are subject to examination by the federal and Delaware revenue authorities. Management has analyzed the Fund’s tax positions taken on federal, state, and foreign tax returns for all open tax years and does not believe that there are any uncertain tax positions that require recognition of a tax liability.
Reclassifications are made to the Fund’s capital accounts for permanent tax differences to reflect income and gains available for distribution (or available capital loss carryforwards) under federal income tax regulations. U.S. generally accepted accounting principles requires that certain components of net assets be adjusted to reflect permanent differences between financial and tax reporting. These reclassifications have no effect on net assets or net asset values per share. At December 31, 2013, as a result of permanent book-to-tax differences, the following reclassification adjustments were made on the Statement of Assets and Liabilities:
| Paid-in capital | Undistributed net investment income | Accumulated net realized losses on investments | ||
| $6 | $859 | $(865) |
As of December 31, 2013, the Fund had capital loss carryforwards available to offset future net realized capital gains in the amount of $900,203 expiring in 2017.
3. FAIR VALUATION MEASUREMENTS
Fair value measurements of investments are determined within a framework that has established a fair value hierarchy based upon the various data inputs utilized in determining the value of the Fund’s investments. The three-level hierarchy gives the highest priority to unadjusted quoted prices in active markets for identical assets or liabilities (Level 1) and the lowest priority to significant unobservable inputs (Level 3). The Fund’s investments are classified within the fair value hierarchy based on the lowest level of input that is significant to the fair value measurement. The inputs are summarized into three broad levels as follows:
| n | Level 1 – quoted prices in active markets for identical securities |
| n | Level 2 – other significant observable inputs (including quoted prices for similar securities, interest rates, prepayment speeds, credit risk, use of amortized cost, etc.) |
| n | Level 3 – significant unobservable inputs (including the Fund’s own assumptions in determining the fair value of investments) |
Table of Contents
| 18 | Wells Fargo Advantage VT Intrinsic Value Fund | Notes to financial statements |
The inputs or methodologies used for valuing investments in securities are not necessarily an indication of the risk associated with investing in those securities.
As of December 31, 2013, the inputs used in valuing investments in securities were as follows:
| Investments in securities | Quoted prices (Level 1) | Other significant (Level 2) | Significant unobservable inputs (Level 3) | Total | ||||||||||||
Equity securities | ||||||||||||||||
Common stocks | $ | 47,436,173 | $ | 923,929 | $ | 0 | $ | 48,360,102 | ||||||||
Short-term investments | ||||||||||||||||
Investment companies | 3,239,684 | 0 | 0 | 3,239,684 | ||||||||||||
| $ | 50,675,857 | $ | 923,929 | $ | 0 | $ | 51,599,786 | |||||||||
Transfers in and transfers out are recognized at the end of the reporting period. For the year ended December 31, 2013, the Fund did not have any transfers into/out of Level 1, Level 2, or Level 3.
4. TRANSACTIONS WITH AFFILIATES AND OTHER EXPENSES
Advisory fee
The Trust has entered into an advisory contract with Funds Management, an indirect wholly owned subsidiary of Wells Fargo & Company (“Wells Fargo”). The adviser is responsible for implementing investment policies and guidelines and for supervising the subadviser, who is responsible for day-to-day portfolio management of the Fund.
Pursuant to the contract, Funds Management is entitled to receive an annual advisory fee starting at 0.55% and declining to 0.40% as the average daily net assets of the Fund increase. For the year ended December 31, 2013, the advisory fee was equivalent to an annual rate of 0.55% of the Fund’s average daily net assets.
Funds Management has retained the services of a subadviser to provide daily portfolio management to the Fund. The fee for subadvisory services is borne by Funds Management. Metropolitan West Capital Management, LLC, an affiliate of Funds Management and an indirect, wholly owned subsidiary of Wells Fargo, is the subadviser to the Fund and is entitled to receive a fee from Funds Management at an annual rate starting at 0.35% and declining to 0.25% as the average daily net assets of the Fund increase.
Administration and transfer agent fees
The Trust has entered into an administration agreement with Funds Management. Under this agreement, for providing administrative services, which includes paying fees and expenses for services provided by the transfer agent, sub-transfer agents, omnibus account servicers and record-keepers, Funds Management is entitled to receive from the Fund an annual fund level administration fee starting at 0.05% and declining to 0.03% as the average daily net assets of the Fund increase and for Class 2 shares, a class level administration fee of 0.08% which is calculated based on its average daily net assets.
Funds Management has contractually waived and/or reimbursed advisory and administration fees to the extent necessary to maintain certain net operating expense ratios for the Fund. Waiver of fees and/or reimbursement of expenses by Funds Management were made first from fund level expenses on a proportionate basis and then from class specific expenses. Funds Management has committed through April 30, 2014 to waive fees and/or reimburse expenses to the extent necessary to cap the Fund’s expenses at 1.00% for Class 2 shares.
Distribution fees
The Trust has adopted a Distribution Plan for Class 2 shares of the Fund pursuant to Rule 12b-1 under the 1940 Act. Distribution fees are charged to Class 2 shares and paid to Wells Fargo Funds Distributor, LLC, the principal underwriter, at an annual rate of 0.25% of its average daily net assets.
5. INVESTMENT PORTFOLIO TRANSACTIONS
Purchases and sales of investments, excluding U.S. government obligations (if any) and short-term securities, for the year ended December 31, 2013 were $10,673,720 and $19,612,539, respectively.
Table of Contents
| Notes to financial statements | Wells Fargo Advantage VT Intrinsic Value Fund | 19 |
6. BANK BORROWINGS
The Trust and Wells Fargo Funds Trust (excluding the money market funds and certain other funds) are parties to a $150,000,000 revolving credit agreement with State Street Bank and Trust Company, whereby the Fund is permitted to use bank borrowings for temporary or emergency purposes, such as to fund shareholder redemption requests. Interest under the credit agreement is charged to the Fund based on a borrowing rate equal to the higher of the Federal Funds rate in effect on that day plus 1.25% or the overnight LIBOR rate in effect on that day plus 1.25%. In addition, an annual commitment fee equal to 0.10% of the unused balance is allocated to each participating fund. For the year ended December 31, 2013, the Fund paid $82 in commitment fees.
For the year ended December 31, 2013, there were no borrowings by the Fund under the agreement.
7. DISTRIBUTIONS TO SHAREHOLDERS
The tax character of distributions paid was $511,372 and $637,443 of ordinary income for the years ended December 31, 2013 and December 31, 2012, respectively.
As of December 31, 2013, the components of distributable earnings on a tax basis were as follows:
Undistributed ordinary income | Unrealized gains | Capital loss carryforward | ||
| $367,806 | $15,369,952 | $(900,203) |
8. INDEMNIFICATION
Under the Trust’s organizational documents, the officers and directors are indemnified against certain liabilities that may arise out of performance of their duties to the Trust. Additionally, in the normal course of business, the Trust may enter into contracts with service providers that contain a variety of indemnification clauses. The Trust’s maximum exposure under these arrangements is dependent on future claims that may be made against the Fund and, therefore, cannot be estimated.
Table of Contents
| 20 | Wells Fargo Advantage VT Intrinsic Value Fund | Report of independent registered public accounting firm |
BOARD OF TRUSTEES AND SHAREHOLDERS OF WELLS FARGO VARIABLE TRUST:
We have audited the accompanying statement of assets and liabilities, including the portfolio of investments, of the Wells Fargo Advantage VT Intrinsic Value Fund (the “Fund”), one of the funds constituting the Wells Fargo Variable Trust, as of December 31, 2013, and the related statement of operations for the year then ended, statements of changes in net assets for each of the years in the two-year period then ended, and the financial highlights for each of the years in the five-year period then ended. These financial statements and financial highlights are the responsibility of the Fund’s management. Our responsibility is to express an opinion on these financial statements and financial highlights based on our audits.
We conducted our audits in accordance with the standards of the Public Company Accounting Oversight Board (United States). Those standards require that we plan and perform the audit to obtain reasonable assurance about whether the financial statements and financial highlights are free of material misstatement. An audit includes examining, on a test basis, evidence supporting the amounts and disclosures in the financial statements. Our procedures included confirmation of securities owned as of December 31, 2013, by correspondence with the custodian and brokers or by other appropriate auditing procedures. An audit also includes assessing the accounting principles used and significant estimates made by management, as well as evaluating the overall financial statement presentation. We believe that our audits provide a reasonable basis for our opinion.
In our opinion, the financial statements and financial highlights referred to above present fairly, in all material respects, the financial position of the Wells Fargo Advantage VT Intrinsic Value Fund as of December 31, 2013, the results of its operations for the year then ended, the changes in its net assets for each of the years in the two-year period then ended, and the financial highlights for each of the years in the five-year period then ended, in conformity with U.S. generally accepted accounting principles.

Boston, Massachusetts
February 27, 2014
Table of Contents
| Other information (unaudited) | Wells Fargo Advantage VT Intrinsic Value Fund | 21 |
TAX INFORMATION
For corporate shareholders, pursuant to Section 854 of the Internal Revenue Code, 100% of ordinary income dividends qualify for the corporate dividends-received deduction for the fiscal year ended December 31, 2013.
PROXY VOTING INFORMATION
A description of the policies and procedures that the Fund uses to determine how to vote proxies relating to portfolio securities is available without charge, upon request, by calling 1-800-222-8222, visiting our website at wellsfargoadvantagefunds.com, or visiting the SEC website at sec.gov. Information regarding how the Fund voted proxies relating to portfolio securities during the most recent 12-month period ended June 30 is available without charge on the Fund’s website at wellsfargoadvantagefunds.com or by visiting the SEC website at sec.gov.
PORTFOLIO HOLDINGS INFORMATION
The complete portfolio holdings for the Fund are publicly available on the Fund’s website (wellsfargoadvantagefunds.com) on a monthly, 30-day or more delayed basis. In addition, top ten holdings information for the Fund is publicly available on the Fund’s website on a monthly, seven-day or more delayed basis. The Fund files its complete schedule of portfolio holdings with the SEC for the first and third quarters of each fiscal year on Form N-Q, which is available without charge by visiting the SEC website at sec.gov. In addition, the Fund’s Form N-Q may be reviewed and copied at the SEC’s Public Reference Room in Washington, DC, and at regional offices in New York City, at 233 Broadway, and in Chicago, at 175 West Jackson Boulevard, Suite 900. Information about the Public Reference Room may be obtained by calling 1-800-SEC-0330.
Table of Contents
| 22 | Wells Fargo Advantage VT Intrinsic Value Fund | Other information (unaudited) |
BOARD OF TRUSTEES AND OFFICERS
Each of the Trustees and Officers listed in the table below acts in identical capacities for each fund in the Wells Fargo Advantage family of funds, which consists of 132 mutual funds1 comprising the Wells Fargo Funds Trust, Wells Fargo Variable Trust, Wells Fargo Master Trust and four closed-end funds (collectively the “Fund Complex”). This table should be read in conjunction with the Prospectus and the Statement of Additional Information2. All of the Trustees are also Members of the Audit and Governance Committees of each Trust in the Fund Complex. The mailing address of each Trustee and Officer is 525 Market Street, 12th Floor, San Francisco, CA 94105. Each Trustee and Officer serves an indefinite term, however, each Trustee serves such term until reaching the mandatory retirement age established by the Trustees.
Independent Trustees
| Name and year of birth | Position held and length of service* | Principal occupations during past five years | Other directorships during past five years | |||
| Peter G. Gordon (Born 1942) | Trustee, since 1998; Chairman, since 2005 | Co-Founder, Retired Chairman, President and CEO of Crystal Geyser Water Company. Trustee Emeritus, Colby College. | Asset Allocation Trust | |||
| Isaiah Harris, Jr. (Born 1952) | Trustee, since 2009 | Retired. Prior thereto, President and CEO of BellSouth Advertising and Publishing Corp. from 2005 to 2007, President and CEO of BellSouth Enterprises from 2004 to 2005 and President of BellSouth Consumer Services from 2000 to 2003. Emeritus member of the Iowa State University Foundation Board of Governors. Emeritus Member of the Advisory Board of Iowa State University School of Business. Advisory Board Member, Palm Harbor Academy (charter school). Mr. Harris is a certified public accountant. | CIGNA Corporation; Deluxe Corporation; Asset Allocation Trust | |||
| Judith M. Johnson (Born 1949) | Trustee, since 2008; Audit Committee Chairman, since 2008 | Retired. Prior thereto, Chief Executive Officer and Chief Investment Officer of Minneapolis Employees Retirement Fund from 1996 to 2008. Ms. Johnson is an attorney, certified public accountant and a certified managerial accountant. | Asset Allocation Trust | |||
| Leroy Keith, Jr. (Born 1939) | Trustee, since 2010 | Chairman, Bloc Global Services (development and construction). Trustee of the Evergreen Funds from 1983 to 2010. Former Managing Director, Almanac Capital Management (commodities firm), former Partner, Stonington Partners, Inc. (private equity fund), former Director, Obagi Medical Products Co. and former Director, Lincoln Educational Services. | Trustee, Virtus Fund Complex (consisting of 50 portfolios as of 12/16/2013); Asset Allocation Trust | |||
| David F. Larcker (Born 1950) | Trustee, since 2009 | James Irvin Miller Professor of Accounting at the Graduate School of Business, Stanford University, Morgan Stanley Director of the Center for Leadership Development and Research and Senior Faculty of The Rock Center for Corporate Governance since 2006. From 2005 to 2008, Professor of Accounting at the Graduate School of Business, Stanford University. Prior thereto, Ernst & Young Professor of Accounting at The Wharton School, University of Pennsylvania from 1985 to 2005. | Asset Allocation Trust | |||
| Olivia S. Mitchell (Born 1953) | Trustee, since 2006 | International Foundation of Employee Benefit Plans Professor, Wharton School of the University of Pennsylvania since 1993. Director of Wharton’s Pension Research Council and Boettner Center on Pensions & Retirement Research, and Research Associate at the National Bureau of Economic Research. Previously, Cornell University Professor from 1978 to 1993. | Asset Allocation Trust | |||
| Timothy J. Penny (Born 1951) | Trustee, since 1996 | President and CEO of Southern Minnesota Initiative Foundation, a non-profit organization, since 2007 and Senior Fellow at the Humphrey Institute Policy Forum at the University of Minnesota since 1995. Member of the Board of Trustees of NorthStar Education Finance, Inc., a non-profit organization, since 2007. | Asset Allocation Trust |
Table of Contents
| Other information (unaudited) | Wells Fargo Advantage VT Intrinsic Value Fund | 23 |
| Name and year of birth | Position held and length of service* | Principal occupations during past five years | Other directorships during past five years | |||
| Michael S. Scofield (Born 1943) | Trustee, since 2010 | Served on the Investment Company Institute’s Board of Governors and Executive Committee from 2008-2011 as well the Governing Council of the Independent Directors Council from 2006-2011 and the Independent Directors Council Executive Committee from 2008-2011. Chairman of the IDC from 2008-2010. Institutional Investor (Fund Directions) Trustee of Year in 2007. Trustee of the Evergreen Funds (and its predecessors) from 1984 to 2010. Chairman of the Evergreen Funds from 2000-2010. Former Trustee of the Mentor Funds. Retired Attorney, Law Offices of Michael S. Scofield. | Asset Allocation Trust | |||
| Donald C. Willeke (Born 1940) | Trustee, since 1996 | Principal of the law firm of Willeke & Daniels. General Counsel of the Minneapolis Employees Retirement Fund from 1984 until its consolidation into the Minnesota Public Employees Retirement Association on June 30, 2010. Director and Vice Chair of The Tree Trust (non-profit corporation). Director of the American Chestnut Foundation (non-profit corporation). | Asset Allocation Trust |
| * | Length of service dates reflect the Trustee’s commencement of service with the Trust’s predecessor entities, where applicable. |
Officers
| Name and year of birth | Position held and length of service | Principal occupations during past five years | ||||
| Karla M. Rabusch (Born 1959) | President, since 2003 | Executive Vice President of Wells Fargo Bank, N.A. and President of Wells Fargo Funds Management, LLC since 2003. | ||||
| Jeremy DePalma1 (Born 1974) | Treasurer, since 2012 | Senior Vice President of Wells Fargo Funds Management, LLC since 2009. Senior Vice President of Evergreen Investment Management Company, LLC from 2008 to 2010. Vice President, Evergreen Investment Services, Inc. from 2004 to 2007. Head of the Fund Reporting and Control Team within Fund Administration from 2005 to 2010. | ||||
| C. David Messman (Born 1960) | Secretary, since 2000; Chief Legal Officer, since 2003 | Senior Vice President and Secretary of Wells Fargo Funds Management, LLC since 2001. Vice President and Managing Counsel of Wells Fargo Bank, N.A. since 1996. | ||||
| Debra Ann Early (Born 1964) | Chief Compliance Officer, since 2007 | Chief Compliance Officer of Wells Fargo Funds Management, LLC since 2007. Chief Compliance Officer of Parnassus Investments from 2005 to 2007. Chief Financial Officer of Parnassus Investments from 2004 to 2007. | ||||
| David Berardi (Born 1975) | Assistant Treasurer, since 2009 | Vice President of Wells Fargo Funds Management, LLC since 2009. Vice President of Evergreen Investment Management Company, LLC from 2008 to 2010. Assistant Vice President of Evergreen Investment Services, Inc. from 2004 to 2008. Manager of Fund Reporting and Control for Evergreen Investment Management Company, LLC from 2004 to 2010. |
| 1. | Jeremy DePalma acts as Treasurer of 59 funds and Assistant Treasurer of 73 funds in the Fund Complex. |
| 2. | The Statement of Additional Information includes additional information about the Trustees and is available, without charge, upon request, by calling 1-800-222-8222 or by visiting the website at wellsfargoadvantagefunds.com. |
Table of Contents
| 24 | Wells Fargo Advantage VT Intrinsic Value Fund | List of abbreviations |
The following is a list of common abbreviations for terms and entities that may have appeared in this report.
| ACA | — ACA Financial Guaranty Corporation |
| ADR | — American depositary receipt |
| ADS | — American depositary shares |
| AGC | — Assured Guaranty Corporation |
| AGM | — Assured Guaranty Municipal |
| Ambac | — Ambac Financial Group Incorporated |
| AMT | — Alternative minimum tax |
| AUD | — Australian dollar |
| BAN | — Bond anticipation notes |
| BHAC | — Berkshire Hathaway Assurance Corporation |
| BRL | — Brazilian real |
| CAB | — Capital appreciation bond |
| CAD | — Canadian dollar |
| CCAB | — Convertible capital appreciation bond |
| CDA | — Community Development Authority |
| CDO | — Collateralized debt obligation |
| CHF | — Swiss franc |
| COP | — Certificate of participation |
| DKK | — Danish krone |
| DRIVER | — Derivative inverse tax-exempt receipts |
| DW&P | — Department of Water & Power |
| DWR | — Department of Water Resources |
| ECFA | — Educational & Cultural Facilities Authority |
| EDA | — Economic Development Authority |
| EDFA | — Economic Development Finance Authority |
| ETF | — Exchange-traded fund |
| EUR | — Euro |
| FDIC | — Federal Deposit Insurance Corporation |
| FFCB | — Federal Farm Credit Banks |
| FGIC | — Financial Guaranty Insurance Corporation |
| FHA | — Federal Housing Administration |
| FHLB | — Federal Home Loan Bank |
| FHLMC | — Federal Home Loan Mortgage Corporation |
| FICO | — The Financing Corporation |
| FNMA | — Federal National Mortgage Association |
| FSA | — Farm Service Agency |
| GBP | — Great British pound |
| GDR | — Global depositary receipt |
| GNMA | — Government National Mortgage Association |
| GO | — General obligation |
| HCFR | — Healthcare facilities revenue |
| HEFA | — Health & Educational Facilities Authority |
| HEFAR | — Higher education facilities authority revenue |
| HFA | — Housing Finance Authority |
| HFFA | — Health Facilities Financing Authority |
| HKD | — Hong Kong dollar |
| HUD | — Department of Housing and Urban Development |
| HUF | — Hungarian forint |
| IDA | — Industrial Development Authority |
| IDAG | — Industrial Development Agency |
| IDR | — Industrial development revenue |
| IEP | — Irish pound |
| JPY | — Japanese yen |
| KRW | — Republic of Korea won |
| LIBOR | — London Interbank Offered Rate |
| LIQ | — Liquidity agreement |
| LLC | — Limited liability company |
| LLP | — Limited liability partnership |
| LOC | — Letter of credit |
| LP | — Limited partnership |
| MBIA | — Municipal Bond Insurance Association |
| MFHR | — Multifamily housing revenue |
| MSTR | — Municipal securities trust receipts |
| MTN | — Medium-term note |
| MUD | — Municipal Utility District |
| MXN | — Mexican peso |
| MYR | — Malaysian ringgit |
| National | — National Public Finance Guarantee Corporation |
| NGN | — Nigerian naira |
| NOK | — Norwegian krone |
| NZD | — New Zealand dollar |
| PCFA | — Pollution Control Financing Authority |
| PCL | — Public Company Limited |
| PCR | — Pollution control revenue |
| PFA | — Public Finance Authority |
| PFFA | — Public Facilities Financing Authority |
| PFOTER | — Puttable floating option tax-exempt receipts |
| plc | — Public limited company |
| PLN | — Polish zloty |
| PUTTER | — Puttable tax-exempt receipts |
| R&D | — Research & development |
| Radian | — Radian Asset Assurance |
| RAN | — Revenue anticipation notes |
| RDA | — Redevelopment Authority |
| RDFA | — Redevelopment Finance Authority |
| REIT | — Real estate investment trust |
| ROC | — Reset option certificates |
| RON | — Romanian lei |
| RUB | — Russian ruble |
| SAVRS | — Select auction variable rate securities |
| SBA | — Small Business Authority |
| SEK | — Swedish krona |
| SFHR | — Single-family housing revenue |
| SFMR | — Single-family mortgage revenue |
| SGD | — Singapore dollar |
| SKK | — Slovakian koruna |
| SPA | — Standby purchase agreement |
| SPDR | — Standard & Poor’s Depositary Receipts |
| STRIPS | — Separate trading of registered interest and principal securities |
| TAN | — Tax anticipation notes |
| TBA | — To be announced |
| THB | — Thai baht |
| TIPS | — Treasury inflation-protected securities |
| TRAN | — Tax revenue anticipation notes |
| TRY | — Turkish lira |
| TTFA | — Transportation Trust Fund Authority |
| TVA | — Tennessee Valley Authority |
| ZAR | — South African rand |
Table of Contents


For more information
More information about Wells Fargo Advantage Funds is available free upon request. To obtain literature, please write, email, visit the Fund’s website, or call:
Wells Fargo Advantage Funds
P.O. Box 8266
Boston, MA 02266-8266
Email: wfaf@wellsfargo.com
Website: wellsfargoadvantagefunds.com
Individual investors: 1-800-222-8222
Retail investment professionals: 1-888-877-9275
Institutional investment professionals: 1-866-765-0778
This report and the financial statements contained herein are submitted for the general information of the shareholders of Wells Fargo Advantage Funds. If this report is used for promotional purposes, distribution of the report must be accompanied or preceded by a current prospectus. For a current prospectus and, if available, a summary prospectus containing more complete information, including charges and expenses, call 1-800-222-8222 or visit the Fund’s website at wellsfargoadvantagefunds.com . Please consider the investment objectives, risks, charges, and expenses of the investment carefully before investing. This and other information about Wells Fargo Advantage Funds can be found in the current prospectus. Read the prospectus carefully before you invest or send money.
Wells Fargo Funds Management, LLC, a wholly owned subsidiary of Wells Fargo & Company, provides investment advisory and administrative services for Wells Fargo Advantage Funds. Other affiliates of Wells Fargo & Company provide subadvisory and other services for the Funds. The Funds are distributed by Wells Fargo Funds Distributor, LLC, Member FINRA/SIPC, an affiliate of Wells Fargo & Company.
NOT FDIC INSURED ¡ NO BANK GUARANTEE ¡ MAY LOSE VALUE
© 2014 Wells Fargo Funds Management, LLC. All rights reserved.
222095 02-14 AVT4/AR150 12-13 |
Table of Contents

Wells Fargo Advantage VT Omega Growth Fund

Annual Report
December 31, 2013

Table of Contents
Reduce clutter. Save trees.
Sign up for electronic delivery of prospectuses and shareholder reports at wellsfargo.com/advantagedelivery
| 2 | ||||
| 4 | ||||
| 8 | ||||
| 9 | ||||
Financial statements | ||||
| 13 | ||||
| 14 | ||||
| 15 | ||||
| 16 | ||||
| 18 | ||||
| 22 | ||||
| 23 | ||||
| 26 | ||||
The views expressed and any forward-looking statements are as of December 31, 2013, unless otherwise noted, and are those of the Fund managers and/or Wells Fargo Funds Management, LLC. Discussions of individual securities, or the markets generally, or any Wells Fargo Advantage Fund are not intended as individual recommendations. Future events or results may vary significantly from those expressed in any forward-looking statements; the views expressed are subject to change at any time in response to changing circumstances in the market. Wells Fargo Funds Management, LLC and the Fund disclaim any obligation to publicly update or revise any views expressed or forward-looking statements.
NOT FDIC INSURED ¡ NO BANK GUARANTEE ¡ MAY LOSE VALUE
Table of Contents
| 2 | Wells Fargo Advantage VT Omega Growth Fund | Letter to shareholders (unaudited) |

Karla M. Rabusch
President
Wells Fargo Advantage Funds
Major central banks continued to inject liquidity into the banks and the markets through various quantitative easing policies.
Dear Valued Shareholder:
We are pleased to offer you this annual report for the Wells Fargo Advantage VT Omega Growth Fund for the 12-month period that ended December 31, 2013. Much of the period was marked by monetary easing by global central banks. During the period, investor concerns that the U.S. Federal Reserve (Fed) would end its bond-buying program initially led to higher interest rates, resulting in losses for bond indexes and volatility for global stock indexes. These fears dissipated in late September 2013 and ended altogether in mid-December 2013 when the Fed announced a tapering timeline that was far more moderate than some had feared. Growing confidence that the U.S. economy was staging a fragile recovery resulted in double-digit returns for domestic stock market indexes for the 12-month reporting period.
Central banks continued to provide stimulus.
Major central banks continued to inject liquidity into the banks and the markets through various quantitative easing policies. Throughout the reporting period, the Federal Open Market Committee (FOMC)—the Fed’s monetary policymaking body—kept its key interest rate near zero in order to support the economy and the financial system. Entering the reporting period, the FOMC had committed to purchase $40 billion per month in mortgage-backed securities to support the housing market and $45 billion per month in long-term U.S. Treasuries to keep interest rates low. Because the markets benefited from the FOMC’s liquidity, the prices of both stocks and bonds initially fell after the FOMC indicated in May 2013 that it might reduce (or taper) its bond-buying program. In mid-December 2013, the FOMC announced that it would reduce its bond-buying program by $10 billion per month beginning in January 2014. The tapering was less aggressive than some investors had feared, and the markets ended 2013 strongly.
European markets continued to benefit from the European Central Bank’s (ECB’s) September 2012 announcement that it would purchase an unlimited amount of one- to three-year sovereign debt from countries that had formally applied for a bailout. As a result, when the tiny eurozone nation of Cyprus was forced to implement capital controls and impose losses on uninsured bank depositors in March 2013, global stock markets remained resilient despite short-term volatility. In May 2013, the ECB cut its key rate to a then-historic low of 0.5%. The ECB’s aggressive actions helped ease investor worries about a eurozone sovereign debt default. Given the substantial ties between the U.S. and Europe, the improved sentiment about the eurozone helped provide a tailwind for U.S. markets.
U.S. stock markets gained on relatively good news.
For most of the period, U.S. economic data remained moderately positive, gaining strength as the period progressed. Reported gross domestic product growth came in at a solid 1.1% annualized rate in the first quarter of 2013, a 2.5% annualized rate in the second quarter, a 4.1% annualized rate in the third quarter, and a 3.2% annualized rate (an advance estimate as of January 31, 2014) in the fourth quarter.
The most significant negative effect was the ongoing fight in Washington, D.C., over the federal budget and debt limit. The Budget Control Act of 2011, which was passed to resolve a previous fight over the federal debt ceiling, mandated budget sequestration that took effect on March 1, 2013, and was an overhang on economic growth throughout the remainder of the reporting period. Most recently, Congress was unable to pass a resolution to continue to fund the federal government, and thus, the federal government underwent a partial shutdown from September 30, 2013, through October 16, 2013. The government reopened after the president and Congress reached a deal that funded the government through January 15, 2014, and raised the debt limit through February 7, 2014. In December 2013, Congress passed the Ryan-Murray budget agreement, which funded the government through fiscal 2015, lessening the near-term prospect of another shutdown.
Table of Contents
| Letter to shareholders (unaudited) | Wells Fargo Advantage VT Omega Growth Fund | 3 |
Despite political headwinds, the relatively positive outlook for the U.S. economy contributed to a strong domestic stock market for most of the reporting period. Economically sensitive sectors, such as industrials and consumer discretionary, outperformed. Dividend-paying stocks led the market earlier in 2013 as investors sought yield in a historically low-yielding environment, but rising interest rates later in the period dampened their relative performance. Judging by various Russell indexes, small-cap stocks outperformed large-cap stocks, and growth stocks outperformed value stocks.
Don’t let short-term uncertainty derail long-term investment goals.
While periods of uncertainty can present challenges, they can also create opportunities, and experience has taught us that maintaining long-term investment goals can be an effective way to plan for the future. Although diversification cannot guarantee an investment profit or prevent losses, we believe it can be an effective way to manage investment risk and potentially smooth out overall portfolio performance. We encourage investors to know their investments and to understand that appropriate levels of risk-taking may unlock opportunities.
Thank you for choosing to invest with Wells Fargo Advantage Funds. We appreciate your confidence in us and remain committed to helping you meet your financial needs. For current information about your fund investments, contact your investment professional, visit our website at wellsfargoadvantagefunds.com, or call us directly at 1-800-222-8222. We are available 24 hours a day, 7 days a week.
Sincerely,

Karla M. Rabusch
President
Wells Fargo Advantage Funds
Despite political headwinds, the relatively positive outlook for the U.S. economy contributed to a strong domestic stock market for most of the reporting period.
Notice to shareholders
The Fund and Funds Management, LLC (“Funds Management”) have received an exemptive order from the SEC that permits Funds Management, subject to the approval of the Board of Trustees of the Fund, to select or replace certain subadvisers to manage all or a portion of the Fund’s assets and enter into, amend or terminate a sub-advisory agreement with certain subadvisers without obtaining shareholder approval (“Multi-manager Structure”). The Multi-manager Structure applies to subadvisers that are not affiliated with Funds Management or the Fund, except to the extent that affiliation arises solely because such subadvisers provide sub-advisory services to the Fund (“Non-affiliated Subadvisers”), as well as subadvisers that are indirect or direct wholly-owned subsidiaries of Funds Management or of another company that, indirectly or directly, wholly owns Funds Management (“Wholly-owned Subadvisers”).
Pursuant to the SEC order, Funds Management, with the approval of the Board of Trustees, has the discretion to terminate any subadvisers and allocate and reallocate the Fund’s assets among any other Non-affiliated Subadvisers or Wholly-owned Subadvisers. Funds Management, subject to oversight and supervision by the Board of Trustees, has responsibility to continue to oversee any subadvisers to the Fund and to recommend, for approval by the Board of Trustees, the hiring, termination and replacement of subadvisers for the Fund. In the event that a new subadviser is hired pursuant to the Multi-manager Structure, the Fund is required to provide notice to shareholders within 90 days.
Please contact your investment professional or call us directly at 1-800-222-85222 if you have any questions on this Notice to Shareholders.
Table of Contents
| 4 | Wells Fargo Advantage VT Omega Growth Fund | Performance highlights (unaudited) |
Investment objective
The Fund seeks long-term capital appreciation.
Adviser
Wells Fargo Funds Management, LLC
Subadviser
Wells Capital Management Incorporated
Portfolio managers
Thomas J. Pence, CFA
Michael T. Smith, CFA
Average annual total returns1 (%) as of December 31, 2013
| Expense ratios2 (%) | ||||||||||||||||||||||
| Inception date | 1 year | 5 year | 10 year | Gross | Net3 | |||||||||||||||||
| Class 1 | 3-6-1997 | 40.22 | 22.55 | 10.27 | 0.80 | 0.75 | ||||||||||||||||
| Class 2 | 7-21-2002 | 39.88 | 22.24 | 9.99 | 1.05 | 1.00 | ||||||||||||||||
| Russell 3000® Growth Index4 | – | 34.23 | 20.56 | 7.95 | – | – | ||||||||||||||||
Figures quoted represent past performance, which is no guarantee of future results and do not reflect the deduction of taxes that a shareholder may pay on fund distributions or the redemption of fund shares. Investment return and principal value of an investment will fluctuate so that an investor’s shares, when redeemed, may be worth more or less than their original cost. Current performance may be lower or higher than the performance data quoted, which assumes the reinvestment of dividends and capital gains. Current month-end performance is available by calling 1-800-222-8222. Performance figures of the Fund do not reflect fees charged pursuant to the terms of variable life insurance policies and variable annuity contracts. If fees had been reflected, performance would have been lower.
Index returns do not include transaction costs associated with buying and selling securities, any mutual fund fees or expenses, or any taxes. It is not possible to invest directly in an index.
Please keep in mind that high double-digit returns were primarily achieved during favorable market conditions. You should not expect that such favorable returns can be consistently achieved. A Fund’s performance, especially for very short time periods, should not be the sole factor in making your investment decision.
Stock values fluctuate in response to the activities of individual companies and general market and economic conditions. Certain investment strategies tend to increase the total risk of an investment (relative to the broader market). The Fund is exposed to smaller-company securities risk. Consult the Fund’s prospectus for additional information on these and other risks.
Please refer to the prospectus provided by your participating insurance company for detailed information describing the separate accounts for information regarding surrender charges, mortality and expense risk fees, and other charges that may be assessed by the participating insurance companies.
Please see footnotes on page 5.
Table of Contents
| Performance highlights (unaudited) | Wells Fargo Advantage VT Omega Growth Fund | 5 |
| Growth of $10,000 investment5 as of December 31, 2013 | ||
| ||
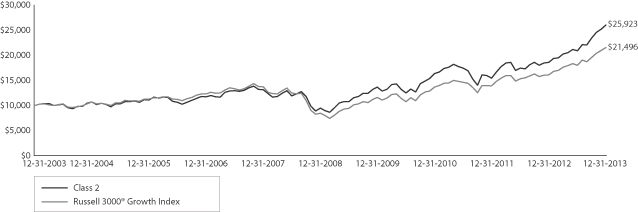
| 1. | Historical performance shown for all classes of the Fund prior to July 19, 2010, is based on the performance of the Fund’s predecessor, Evergreen VA Omega Fund. |
| 2. | Reflects the expense ratios as stated in the most recent prospectuses. |
| 3. | The Adviser has committed through April 30, 2014, to waive fees and/or reimburse expenses to the extent necessary to cap the Fund’s Total Annual Fund Operating Expenses After Fee Waiver, excluding certain expenses, at the amounts shown. Brokerage commissions, stamp duty fees, interest, taxes, acquired fund fees and expenses, and extraordinary expenses are excluded from the cap. Without this cap, the Fund’s returns would have been lower. |
| 4. | The Russell 3000® Growth Index measures the performance of those Russell 3000 Index companies with higher price-to-book ratios and higher forecasted growth values. You cannot invest directly in an index. |
| 5. | The chart compares the performance of Class 2 shares for the most recent ten years with the Russell 3000 Growth Index. The chart assumes a hypothetical $10,000 investment and reflects all operating expenses of the Fund. Performance figures of the Fund do not reflect fees charged pursuant to the terms of variable life insurance policies and variable annuity contracts. |
| 6. | The ten largest equity holdings are calculated based on the value of the securities divided by total net assets of the Fund. Holdings are subject to change and may have changed since the date specified. |
| 7. | Sector distribution is subject to change and is calculated based on the total long-term investments of the Fund. |
Table of Contents
| 6 | Wells Fargo Advantage VT Omega Growth Fund | Performance highlights (unaudited) |
MANAGER’S DISCUSSION
Fund highlights
| n | The Fund outperformed its benchmark, the Russell 3000 Growth Index, for the 12-month period that ended December 31, 2013. |
| n | Stock selection in the information technology (IT) and consumer staples sectors was additive to performance during the period. Stock selection in the pharmaceuticals industry provided a significant headwind for relative performance. |
| n | The U.S. equity market delivered strong performance in 2013 despite some volatility along the way. |
| n | We view the stock market appreciation during 2013 as a correction from overly pessimistic valuations in prior years and not indicative of an overvalued market. Superior earnings growth profiles have yet to be fully valued, and we continue to see upside into 2014 for many of our investment themes. |
2013 asset class overview
The 2013 U.S. equity market was much like a long road trip. The drive clearly was successful and enjoyable for investors, but the trip was not without its share of speed bumps, congestion, and detours. The journey started on a high note in the first quarter; investors looked beyond geopolitical events and government gridlock, focusing instead on significant policy stimulus from global central bankers and clear signs of improving housing and employment markets. In the second quarter, however, two speed bumps surfaced. A series of mixed U.S. economic data, coupled with the Federal Reserve’s (Fed’s) discussion about eventually tapering its quantitative easing program, triggered significant investor concern. But pleasant driving conditions returned in the third quarter as investors shifted gears, abandoned their defensive bias, and displayed a clear preference for risk assets. Valuation multiples expanded, fundamentals were rewarded, and the more cyclical sectors of the equity market enjoyed a strong rally. A bit of winter fog early in the fourth quarter slowed driving once again, but a surprise budget compromise and strong U.S. economic data improved visibility, and the pace picked back up. Over the course of 2013, foreign investors came to realize that the U.S. offers the best road conditions for investing because the U.S. economy is in significantly better shape than the economies of other developed markets. As 2013 ended, capital flowed into U.S. stocks in a broad-based rally, capping an impressive year for U.S. equity investors.
| Ten largest equity holdings6 (%) as of December 31, 2013 | ||||
Google Incorporated Class A | 3.94 | |||
Amazon.com Incorporated | 3.19 | |||
Apple Incorporated | 2.82 | |||
Visa Incorporated Class A | 2.43 | |||
Kansas City Southern | 2.39 | |||
Alliance Data Systems Corporation | 2.32 | |||
IntercontinentalExchange Group Incorporated | 2.17 | |||
SBA Communications Corporation Class A | 2.13 | |||
Gilead Sciences Incorporated | 2.10 | |||
Facebook Incorporated Class A | 2.09 | |||
We believe that, in any market environment, a portfolio’s construction must balance risk and return. We strive to provide this balance through a portfolio composed of three distinct types of growth companies. Core growth holdings, which represent 40%–50% of assets, are companies with stable growth records, proven management teams, and relatively low volatility. Developing situations, which also represent 40%–50% of the portfolio, are firms we believe are entering a period of accelerated growth driven by a new product, business plan, or management team. Developing situations are characterized by an attractive valuation level and average volatility. The remainder of the portfolio (5%–10% of assets) is dedicated to valuation opportunities—holdings we believe carry above-average growth potential and relatively high volatility.
Our conviction level always drives each stock’s relative weight in the portfolio. This direct relationship helps us position our highest-conviction ideas to potentially make a significant impact on performance.
Effective security selection enabled the Fund to outperform its benchmark.
Security selection in the IT sector contributed significantly to returns in 2013. Results from credit card-related IT services firms were strong—especially Alliance Data Systems Corporation, which rose sharply after it posted better-than-expected earnings growth and its Canadian loyalty business enjoyed improved business trends. Electronic payment processors also delivered a strong year, especially MasterCard Incorporated, and Vantiv Incorporated. Our IT positioning consistently has
Please see footnotes on page 5.
Table of Contents
| Performance highlights (unaudited) | Wells Fargo Advantage VT Omega Growth Fund | 7 |
favored companies with exposure to secular growth themes. Facebook Incorporated was up sharply because investors rewarded the company’s efforts to monetize advertising through its enhanced mobile application. LinkedIn Corporation also contributed, reporting stronger-than-estimated revenue and earnings growth.
Although many firms in the consumer staples sector lack the attributes we require, we identified select companies that, in our opinion, had strong growth profiles and the ability to improve margins and gain market share. One such firm, Constellation Brands Incorporated, delivered a large contribution to the portfolio’s annual returns. We purchased the stock with the thesis that Constellation’s acquisition of the U.S. distribution rights and production facilities of beer brands owned by Groupo Modelo materially improved the company’s growth profile.
Security selection within the health care sector yielded mixed results in 2013. Although strength was visible among biotechnology and health care providers/services companies, selection within the pharmaceutical industry weighed on performance—particularly Allergan Incorporated which suffered an unexpected delay of approval for a key drug that could expand the company in the fast-growing macular degeneration market.
| Sector distribution7 as of December 31, 2013 | ||
| ||
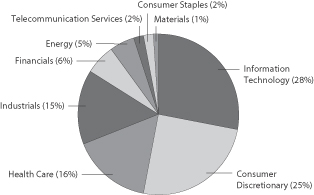
2014 outlook
As we move into 2014, many investors question the durability of the U.S. equities rally. They wonder whether the market has become overvalued and are concerned about the economy’s ability to thrive as the Fed winds down quantitative easing. We acknowledge that several constructive developments—a resurgence of U.S. manufacturing, strength in durable goods, a stronger housing market—have been factored into equity valuations. As a result, 2013 was a year of rising multiples for a broad swath of industries. However, we view the stock market appreciation as a correction of overly pessimistic valuations in previous years, not as overvaluation, and believe U.S. stocks remain reasonably priced.
Even as our view remains optimistic for U.S. equities, we maintain a steady balance in the portfolio. We believe the portfolio’s superior earnings growth profile has not been fully valued and stands to benefit as the market shifts into a more discerning phase. We see continued upside in portfolio themes such as internet commerce, U.S. manufacturing and energy production, credit card-transaction growth, and innovations in biotechnology and generic drugs. And, we remain confident in our disciplined investment process, through which we dig deep to develop edge and construct portfolios one stock at time, based on a bottom-up conviction. Unwavering dedication to our proven process enabled the Fund to outperform in 2013.
Please see footnotes on page 5.
Table of Contents
| 8 | Wells Fargo Advantage VT Omega Growth Fund | Fund expenses (unaudited) |
As a shareholder of the Fund, you incur ongoing costs, including management fees, distribution (12b-1) fees, and other Fund expenses. This example is intended to help you understand your ongoing costs (in dollars) of investing in the Fund and to compare these costs with the ongoing costs of investing in other mutual funds.
The example is based on an investment of $1,000 invested at the beginning of the six-month period and held for the entire period from July 1, 2013 to December 31, 2013.
Actual expenses
The “Actual” line of the table below provides information about actual account values and actual expenses. You may use the information in this line, together with the amount you invested, to estimate the expenses that you paid over the period. Simply divide your account value by $1,000 (for example, an $8,600 account value divided by $1,000 = 8.6), then multiply the result by the number in the “Actual” line under the heading entitled “Expenses Paid During Period” for your applicable class of shares to estimate the expenses you paid on your account during this period.
Hypothetical example for comparison purposes
The “Hypothetical” line of the table below provides information about hypothetical account values and hypothetical expenses based on the Fund’s actual expense ratio and an assumed rate of return of 5% per year before expenses, which is not the Fund’s actual return. The hypothetical account values and expenses may not be used to estimate the actual ending account balance or expenses you paid for the period. You may use this information to compare the ongoing costs of investing in the Fund and other funds. To do so, compare this 5% hypothetical example with the 5% hypothetical examples that appear in the shareholder reports of the other funds.
Please note that the expenses shown in the table are meant to highlight your ongoing costs only and do not reflect any separate account charges assessed by participating insurance companies. Therefore, the “Hypothetical” line of the table is useful in comparing ongoing costs only, and will not help you determine the relative total costs of owning different funds. In addition, if these separate account charges assessed by participating insurance companies were included, your costs would have been higher.
| Beginning account value 7-1-2013 | Ending account value 12-31-2013 | Expenses paid during the period1 | Net annual expense ratio | |||||||||||||
Class 1 | ||||||||||||||||
Actual | $ | 1,000.00 | $ | 1,247.44 | $ | 4.25 | 0.75 | % | ||||||||
Hypothetical (5% return before expenses) | $ | 1,000.00 | $ | 1,021.42 | $ | 3.82 | 0.75 | % | ||||||||
Class 2 | ||||||||||||||||
Actual | $ | 1,000.00 | $ | 1,246.08 | $ | 5.66 | 1.00 | % | ||||||||
Hypothetical (5% return before expenses) | $ | 1,000.00 | $ | 1,020.16 | $ | 5.09 | 1.00 | % | ||||||||
| 1. | Expenses paid is equal to the annualized expense ratio of each class multiplied by the average account value over the period, multiplied by the number of days in the most recent fiscal half-year divided by the number of days in the fiscal year (to reflect the one-half year period). |
Table of Contents
| Portfolio of investments—December 31, 2013 | Wells Fargo Advantage VT Omega Growth Fund | 9 |
| Security name | Shares | Value | ||||||||||
Common Stocks: 99.31% | ||||||||||||
Consumer Discretionary: 24.80% | ||||||||||||
| Auto Components: 1.13% | ||||||||||||
Delphi Automotive plc | 23,330 | $ | 1,402,832 | |||||||||
|
| |||||||||||
| Distributors: 1.31% | ||||||||||||
LKQ Corporation † | 49,770 | 1,637,433 | ||||||||||
|
| |||||||||||
| Hotels, Restaurants & Leisure: 1.76% | ||||||||||||
Starbucks Corporation | 27,887 | 2,186,062 | ||||||||||
|
| |||||||||||
| Internet & Catalog Retail: 6.50% | ||||||||||||
Amazon.com Incorporated † | 9,950 | 3,967,961 | ||||||||||
Netflix Incorporated † | 4,900 | 1,804,033 | ||||||||||
Priceline.com Incorporated † | 2,000 | 2,324,800 | ||||||||||
| 8,096,794 | ||||||||||||
|
| |||||||||||
| Media: 6.04% | ||||||||||||
AMC Networks Incorporated Class A † | 26,280 | 1,789,931 | ||||||||||
Discovery Communications Incorporated † | 22,259 | 1,866,640 | ||||||||||
Liberty Global plc Class A † | 8,864 | 788,807 | ||||||||||
Liberty Global plc Class C † | 21,179 | 1,785,813 | ||||||||||
Sirius XM Holdings Incorporated | 370,670 | 1,293,638 | ||||||||||
| 7,524,829 | ||||||||||||
|
| |||||||||||
| Specialty Retail: 6.11% | ||||||||||||
AutoNation Incorporated † | 30,820 | 1,531,446 | ||||||||||
Best Buy Company Incorporated | 40,140 | 1,600,783 | ||||||||||
Home Depot Incorporated | 17,200 | 1,416,248 | ||||||||||
Restoration Hardware Holdings Incorporated † | 18,544 | 1,248,011 | ||||||||||
TJX Companies Incorporated | 28,350 | 1,806,746 | ||||||||||
| 7,603,234 | ||||||||||||
|
| |||||||||||
| Textiles, Apparel & Luxury Goods: 1.95% | ||||||||||||
Michael Kors Holdings Limited † | 17,200 | 1,396,468 | ||||||||||
Under Armour Incorporated Class A † | 11,830 | 1,032,759 | ||||||||||
| 2,429,227 | ||||||||||||
|
| |||||||||||
Consumer Staples: 2.03% | ||||||||||||
| Beverages: 2.03% | ||||||||||||
Constellation Brands Incorporated Class A † | 35,860 | 2,523,827 | ||||||||||
|
| |||||||||||
Energy: 4.51% | ||||||||||||
| Oil, Gas & Consumable Fuels: 4.51% | ||||||||||||
Antero Resources Corporation † | 16,749 | 1,062,557 | ||||||||||
Concho Resources Incorporated † | 8,120 | 876,960 | ||||||||||
Gulfport Energy Corporation † | 15,530 | 980,720 | ||||||||||
Marathon Petroleum Corporation | 10,600 | 972,338 | ||||||||||
Pioneer Natural Resources Company | 9,342 | 1,719,582 | ||||||||||
| 5,612,157 | ||||||||||||
|
| |||||||||||
The accompanying notes are an integral part of these financial statements.
Table of Contents
| 10 | Wells Fargo Advantage VT Omega Growth Fund | Portfolio of investments—December 31, 2013 |
| Security name | Shares | Value | ||||||||||
Financials: 5.69% | ||||||||||||
| Capital Markets: 1.56% | ||||||||||||
Affiliated Managers Group Incorporated † | 8,939 | $ | 1,938,690 | |||||||||
|
| |||||||||||
| Consumer Finance: 1.32% | ||||||||||||
American Express Company | 18,100 | 1,642,213 | ||||||||||
|
| |||||||||||
| Diversified Financial Services: 2.17% | ||||||||||||
IntercontinentalExchange Group Incorporated | 12,000 | 2,699,040 | ||||||||||
|
| |||||||||||
| Insurance : 0.64% | ||||||||||||
eHealth Incorporated † | 17,290 | 803,812 | ||||||||||
|
| |||||||||||
Health Care: 15.82% | ||||||||||||
| Biotechnology: 6.88% | ||||||||||||
Alexion Pharmaceuticals Incorporated † | 16,492 | 2,194,426 | ||||||||||
Biogen IDEC Incorporated † | 5,970 | 1,670,108 | ||||||||||
Celgene Corporation † | 12,340 | 2,084,966 | ||||||||||
Gilead Sciences Incorporated † | 34,880 | 2,621,232 | ||||||||||
| 8,570,732 | ||||||||||||
|
| |||||||||||
| Health Care Equipment & Supplies: 1.28% | ||||||||||||
Boston Scientific Corporation † | 131,990 | 1,586,520 | ||||||||||
|
| |||||||||||
| Health Care Providers & Services: 3.28% | ||||||||||||
Cardinal Health Incorporated | 12,740 | 851,159 | ||||||||||
Envision Healthcare Holdings Incorporated † | 33,929 | 1,205,158 | ||||||||||
McKesson Corporation | 8,360 | 1,349,304 | ||||||||||
Team Health Holdings Incorporated † | 14,965 | 681,656 | ||||||||||
| 4,087,277 | ||||||||||||
|
| |||||||||||
| Pharmaceuticals: 4.38% | ||||||||||||
Abbvie Incorporated | 22,800 | 1,204,068 | ||||||||||
Actavis plc † | 9,650 | 1,621,200 | ||||||||||
Bristol-Myers Squibb Company | 31,810 | 1,690,702 | ||||||||||
Shire plc ADR | 6,610 | 933,927 | ||||||||||
| 5,449,897 | ||||||||||||
|
| |||||||||||
Industrials: 14.54% | ||||||||||||
| Aerospace & Defense : 3.02% | ||||||||||||
B/E Aerospace Incorporated † | 22,460 | 1,954,694 | ||||||||||
Precision Castparts Corporation | 6,700 | 1,804,310 | ||||||||||
| 3,759,004 | ||||||||||||
|
| |||||||||||
| Airlines: 3.11% | ||||||||||||
Copa Holdings SA Class A | 11,700 | 1,873,287 | ||||||||||
Delta Air Lines Incorporated | 72,890 | 2,002,288 | ||||||||||
| 3,875,575 | ||||||||||||
|
| |||||||||||
The accompanying notes are an integral part of these financial statements.
Table of Contents
| Portfolio of investments—December 31, 2013 | Wells Fargo Advantage VT Omega Growth Fund | 11 |
| Security name | Shares | Value | ||||||||||
| Building Products: 1.30% | ||||||||||||
Fortune Brands Home & Security Incorporated | 35,439 | $ | 1,619,562 | |||||||||
|
| |||||||||||
| Construction & Engineering: 0.76% | ||||||||||||
Quanta Services Incorporated † | 30,120 | 950,587 | ||||||||||
|
| |||||||||||
| Electrical Equipment: 1.52% | ||||||||||||
Eaton Corporation plc | 24,800 | 1,887,776 | ||||||||||
|
| |||||||||||
| Professional Services: 1.17% | ||||||||||||
Advisory Board Company † | 17,520 | 1,115,498 | ||||||||||
Verisk Analytics Incorporated Class A † | 5,209 | 342,335 | ||||||||||
| 1,457,833 | ||||||||||||
|
| |||||||||||
| Road & Rail: 2.40% | ||||||||||||
Kansas City Southern | 24,075 | 2,981,207 | ||||||||||
|
| |||||||||||
| Trading Companies & Distributors: 1.26% | ||||||||||||
United Rentals Incorporated † | 20,150 | 1,570,693 | ||||||||||
|
| |||||||||||
Information Technology: 28.30% | ||||||||||||
| Computers & Peripherals: 3.92% | ||||||||||||
Apple Incorporated | 6,260 | 3,512,549 | ||||||||||
Stratasys Limited † | 10,139 | 1,365,723 | ||||||||||
| 4,878,272 | ||||||||||||
|
| |||||||||||
| Electronic Equipment, Instruments & Components: 0.70% | ||||||||||||
Cognex Corporation | 22,700 | 866,686 | ||||||||||
|
| |||||||||||
| Internet Software & Services: 7.33% | ||||||||||||
Facebook Incorporated Class A † | 47,705 | 2,607,555 | ||||||||||
Google Incorporated Class A † | 4,380 | 4,908,710 | ||||||||||
LinkedIn Corporation Class A † | 7,240 | 1,569,849 | ||||||||||
Twitter Incorporated Ǡ | 728 | 46,337 | ||||||||||
| 9,132,451 | ||||||||||||
|
| |||||||||||
| IT Services: 8.06% | ||||||||||||
Alliance Data Systems Corporation † | 10,990 | 2,889,601 | ||||||||||
MasterCard Incorporated Class A | 2,196 | 1,834,670 | ||||||||||
Vantiv Incorporated Class A † | 70,318 | 2,293,070 | ||||||||||
Visa Incorporated Class A | 13,586 | 3,025,330 | ||||||||||
| 10,042,671 | ||||||||||||
|
| |||||||||||
| Semiconductors & Semiconductor Equipment: 2.93% | ||||||||||||
ARM Holdings plc | 32,570 | 1,782,882 | ||||||||||
ASML Holding NV | 19,900 | 1,864,630 | ||||||||||
| 3,647,512 | ||||||||||||
|
| |||||||||||
The accompanying notes are an integral part of these financial statements.
Table of Contents
| 12 | Wells Fargo Advantage VT Omega Growth Fund | Portfolio of investments—December 31, 2013 |
| Security name | Shares | Value | ||||||||||||
| Software: 5.36% | ||||||||||||||
CommVault Systems Incorporated † | 25,325 | $ | 1,896,336 | |||||||||||
Fleetmatics Group plc Ǡ | 16,320 | 705,840 | ||||||||||||
Guidewire Software Incorporated † | 13,325 | 653,858 | ||||||||||||
Salesforce.com Incorporated † | 36,520 | 2,015,539 | ||||||||||||
ServiceNow Incorporated † | 25,080 | 1,404,731 | ||||||||||||
| 6,676,304 | ||||||||||||||
|
| |||||||||||||
Materials: 1.50% | ||||||||||||||
| Chemicals: 1.50% | ||||||||||||||
Monsanto Company | 16,085 | 1,874,707 | ||||||||||||
|
| |||||||||||||
Telecommunication Services: 2.12% | ||||||||||||||
| Wireless Telecommunication Services: 2.12% | ||||||||||||||
SBA Communications Corporation Class A † | 29,460 | 2,646,686 | ||||||||||||
|
| |||||||||||||
Total Common Stocks (Cost $86,236,966) | 123,662,102 | |||||||||||||
|
| |||||||||||||
| Yield | ||||||||||||||
| Short-Term Investments: 1.87% | ||||||||||||||
| Investment Companies: 1.87% | ||||||||||||||
Wells Fargo Advantage Cash Investment Money Market Fund, Select Class (l)(u) | 0.06 | % | 1,556,578 | 1,556,578 | ||||||||||
Wells Fargo Securities Lending Cash Investments, LLC (l)(r)(u)(v) | 0.08 | 772,400 | 772,400 | |||||||||||
Total Short-Term Investments (Cost $2,328,978) | 2,328,978 | |||||||||||||
|
| |||||||||||||
| Total investments in securities | ||||||||
| (Cost $88,565,944) * | 101.18 | % | 125,991,080 | |||||
Other assets and liabilities, net | (1.18 | ) | (1,466,391 | ) | ||||
|
|
|
| |||||
| Total net assets | 100.00 | % | $ | 124,524,689 | ||||
|
|
|
|
| † | Non-income-earning security |
| « | All or a portion of this security is on loan. |
| (l) | Investment in an affiliate |
| (u) | Rate shown is the 7-day annualized yield at period end. |
| (r) | The investment company is exempt from registration under Section 3(c)(7) of the Investment Company Act of 1940, as amended. |
| (v) | Security represents investment of cash collateral received from securities on loan. |
| * | Cost for federal income tax purposes is $88,682,859 and unrealized appreciation (depreciation) consists of: |
Gross unrealized appreciation | $ | 37,485,974 | ||
Gross unrealized depreciation | (177,753 | ) | ||
|
| |||
Net unrealized appreciation | $ | 37,308,221 |
The accompanying notes are an integral part of these financial statements.
Table of Contents
| Statement of assets and liabilities—December 31, 2013 | Wells Fargo Advantage VT Omega Growth Fund | 13 |
Assets | ||||
Investments | ||||
In unaffiliated securities (including securities on loan), at value (see cost below) | $ | 123,662,102 | ||
In affiliated securities, at value (see cost below) | 2,328,978 | |||
|
| |||
Total investments, at value (see cost below) | 125,991,080 | |||
Receivable for investments sold | 1,955,698 | |||
Receivable for Fund shares sold | 11,962 | |||
Receivable for dividends | 24,661 | |||
Receivable for securities lending income | 552 | |||
Prepaid expenses and other assets | 1,625 | |||
|
| |||
Total assets | 127,985,578 | |||
|
| |||
Liabilities | ||||
Payable for investments purchased | 2,379,371 | |||
Payable for Fund shares redeemed | 130,247 | |||
Payable upon receipt of securities loaned | 772,400 | |||
Advisory fee payable | 55,908 | |||
Distribution fees payable | 14,790 | |||
Due to other related parties | 13,930 | |||
Accrued expenses and other liabilities | 94,243 | |||
|
| |||
Total liabilities | 3,460,889 | |||
|
| |||
Total net assets | $ | 124,524,689 | ||
|
| |||
NET ASSETS CONSIST OF | ||||
Paid-in capital | $ | 70,659,879 | ||
Accumulated net investment loss | (2,191 | ) | ||
Accumulated net realized gains on investments | 16,441,865 | |||
Net unrealized gains on investments | 37,425,136 | |||
|
| |||
Total net assets | $ | 124,524,689 | ||
|
| |||
COMPUTATION OF NET ASSET VALUE PER SHARE1 | ||||
Net assets – Class 1 | $ | 55,867,024 | ||
Shares outstanding – Class 1 | 1,704,408 | |||
Net asset value per share – Class 1 | $32.78 | |||
Net assets – Class 2 | $ | 68,657,665 | ||
Shares outstanding – Class 2 | 2,132,912 | |||
Net asset value per share – Class 2 | $32.19 | |||
Investments in unaffiliated securities (including securities on loan), at cost | $ | 86,236,966 | ||
|
| |||
Investments in affiliated securities, at cost | $ | 2,328,978 | ||
|
| |||
Total investments, at cost | $ | 88,565,944 | ||
|
| |||
Securities on loan, at value | $ | 725,865 | ||
|
| |||
| 1. | The Fund has an unlimited number of authorized shares. |
The accompanying notes are an integral part of these financial statements.
Table of Contents
| 14 | Wells Fargo Advantage VT Omega Growth Fund | Statement of operations—year ended December 31, 2013 |
Investment income | ||||
Dividends* | $ | 663,729 | ||
Securities lending income, net | 71,361 | |||
Income from affiliated securities | 930 | |||
|
| |||
Total investment income | 736,020 | |||
|
| |||
Expenses | ||||
Advisory fee | 639,421 | |||
Administration fees | ||||
Fund level | 58,129 | |||
Class 1 | 41,182 | |||
Class 2 | 51,825 | |||
Distribution fees | ||||
Class 2 | 161,953 | |||
Custody and accounting fees | 17,010 | |||
Professional fees | 49,098 | |||
Shareholder report expenses | 38,119 | |||
Trustees’ fees and expenses | 13,903 | |||
Other fees and expenses | 4,445 | |||
|
| |||
Total expenses | 1,075,085 | |||
Less: Fee waivers and/or expense reimbursements | (41,195 | ) | ||
|
| |||
Net expenses | 1,033,890 | |||
|
| |||
Net investment loss | (297,870 | ) | ||
|
| |||
REALIZED AND UNREALIZED GAINS (LOSSES) ON INVESTMENTS | ||||
Net realized gains on investments | 24,911,776 | |||
Net change in unrealized gains (losses) on investments | 14,652,681 | |||
|
| |||
Net realized and unrealized gains (losses) on investments | 39,564,457 | |||
|
| |||
Net increase in net assets resulting from operations | $ | 39,266,587 | ||
|
| |||
* Net of foreign dividend withholding taxes in the amount of | $7,613 | |||
The accompanying notes are an integral part of these financial statements.
Table of Contents
| Statement of changes in net assets | Wells Fargo Advantage VT Omega Growth Fund | 15 |
Year ended December 31, 2013 | Year ended December 31, 2012 | |||||||||||||||
Operations | ||||||||||||||||
Net investment income (loss) | $ | (297,870 | ) | $ | 279,052 | |||||||||||
Net realized gains on investments | 24,911,776 | 11,580,769 | ||||||||||||||
Net change in unrealized gains (losses) on investments | 14,652,681 | 10,238,012 | ||||||||||||||
|
|
|
|
|
|
|
| |||||||||
Net increase in net assets resulting from operations | 39,266,587 | 22,097,833 | ||||||||||||||
|
|
|
|
|
|
|
| |||||||||
Distributions to shareholders from | ||||||||||||||||
Net investment income | ||||||||||||||||
Class 1 | (204,541 | ) | 0 | |||||||||||||
Class 2 | (87,333 | ) | 0 | |||||||||||||
Net realized gains | ||||||||||||||||
Class 1 | (4,218,654 | ) | (3,345,101 | ) | ||||||||||||
Class 2 | (5,377,169 | ) | (4,403,530 | ) | ||||||||||||
|
|
|
|
|
|
|
| |||||||||
Total distributions to shareholders | (9,887,697 | ) | (7,748,631 | ) | ||||||||||||
|
|
|
|
|
|
|
| |||||||||
| Shares | Shares | |||||||||||||||
Capital share transactions | ||||||||||||||||
Proceeds from shares sold | ||||||||||||||||
Class 1 | 249,132 | 7,209,887 | 365,607 | 9,240,721 | ||||||||||||
Class 2 | 110,803 | 3,160,430 | 230,521 | 5,691,316 | ||||||||||||
|
|
|
|
|
|
|
| |||||||||
| 10,370,317 | 14,932,037 | |||||||||||||||
|
|
|
|
|
|
|
| |||||||||
Reinvestment of distributions | ||||||||||||||||
Class 1 | 159,971 | 4,423,195 | 143,752 | 3,345,101 | ||||||||||||
Class 2 | 201,049 | 5,464,502 | 192,210 | 4,403,530 | ||||||||||||
|
|
|
|
|
|
|
| |||||||||
| 9,887,697 | 7,748,631 | |||||||||||||||
|
|
|
|
|
|
|
| |||||||||
Payment for shares redeemed | ||||||||||||||||
Class 1 | (576,458 | ) | (16,662,911 | ) | (626,300 | ) | (15,863,600 | ) | ||||||||
Class 2 | (669,579 | ) | (18,890,390 | ) | (902,122 | ) | (22,774,558 | ) | ||||||||
|
|
|
|
|
|
|
| |||||||||
| (35,553,301 | ) | (38,638,158 | ) | |||||||||||||
|
|
|
|
|
|
|
| |||||||||
Net decrease in net assets resulting from capital share transactions | (15,295,287 | ) | (15,957,490 | ) | ||||||||||||
|
|
|
|
|
|
|
| |||||||||
Total increase (decrease) in net assets | 14,083,603 | (1,608,288 | ) | |||||||||||||
|
|
|
|
|
|
|
| |||||||||
Net assets | ||||||||||||||||
Beginning of period | 110,441,086 | 112,049,374 | ||||||||||||||
|
|
|
|
|
|
|
| |||||||||
End of period | $ | 124,524,689 | $ | 110,441,086 | ||||||||||||
|
|
|
|
|
|
|
| |||||||||
Undistributed (accumulated) net investment income (loss) | $ | (2,191 | ) | $ | 284,645 | |||||||||||
|
|
|
|
|
|
|
| |||||||||
The accompanying notes are an integral part of these financial statements.
Table of Contents
| 16 | Wells Fargo Advantage VT Omega Growth Fund | Financial highlights |
(For a share outstanding throughout each period)
| Year ended December 31 | ||||||||||||||||||||
| CLASS 1 | 2013 | 2012 | 2011 | 20101 | 20091 | |||||||||||||||
Net asset value, beginning of period | $ | 25.56 | $ | 22.78 | $ | 24.26 | $ | 20.42 | $ | 14.43 | ||||||||||
Net investment income (loss) | (0.01 | ) | 0.11 | (0.06 | ) | 0.03 | 0.13 | |||||||||||||
Net realized and unrealized gains (losses) on investments | 9.81 | 4.43 | (1.21 | ) | 3.98 | 6.09 | ||||||||||||||
|
|
|
|
|
|
|
|
|
| |||||||||||
Total from investment operations | 9.80 | 4.54 | (1.27 | ) | 4.01 | 6.22 | ||||||||||||||
Distributions to shareholders from | ||||||||||||||||||||
Net investment income | (0.12 | ) | 0.00 | 0.00 | (0.17 | ) | (0.23 | ) | ||||||||||||
Net realized gains | (2.46 | ) | (1.76 | ) | (0.21 | ) | 0.00 | 0.00 | ||||||||||||
|
|
|
|
|
|
|
|
|
| |||||||||||
Total distributions to shareholders | (2.58 | ) | (1.76 | ) | (0.21 | ) | (0.17 | ) | (0.23 | ) | ||||||||||
Net asset value, end of period | $ | 32.78 | $ | 25.56 | $ | 22.78 | $ | 24.26 | $ | 20.42 | ||||||||||
Total return | 40.22 | % | 20.76 | % | (5.36 | )% | 19.79 | % | 43.97 | % | ||||||||||
Ratios to average net assets (annualized) | ||||||||||||||||||||
Gross expenses | 0.79 | % | 0.80 | % | 0.80 | % | 0.75 | % | 0.76 | % | ||||||||||
Net expenses | 0.75 | % | 0.75 | % | 0.75 | % | 0.74 | % | 0.76 | % | ||||||||||
Net investment income (loss) | (0.12 | )% | 0.40 | % | (0.27 | )% | 0.01 | % | 0.86 | % | ||||||||||
Supplemental data | ||||||||||||||||||||
Portfolio turnover rate | 95 | % | 93 | % | 110 | % | 160 | % | 28 | % | ||||||||||
Net assets, end of period (000s omitted) | $55,867 | $47,842 | $45,293 | $54,246 | $59,807 | |||||||||||||||
| 1. | After the close of business on July 16, 2010, the Fund acquired the net assets of Evergreen VA Omega Fund and Wells Fargo Advantage VT Large Company Growth Fund. Evergreen VA Omega Fund became the accounting and performance survivor in the transaction. The information for the periods prior to July 19, 2010 is that of Class 1 of Evergreen VA Omega Fund. |
The accompanying notes are an integral part of these financial statements.
Table of Contents
| Financial highlights | Wells Fargo Advantage VT Omega Growth Fund | 17 |
(For a share outstanding throughout each period)
| Year ended December 31 | ||||||||||||||||||||
| CLASS 2 | 2013 | 2012 | 2011 | 20101 | 20091 | |||||||||||||||
Net asset value, beginning of period | $ | 25.13 | $ | 22.48 | $ | 24.00 | $ | 20.19 | $ | 14.25 | ||||||||||
Net investment income (loss) | (0.12 | ) | 0.02 | (0.14 | ) | (0.07 | )2 | 0.11 | ||||||||||||
Net realized and unrealized gains (losses) on investments | 9.68 | 4.39 | (1.17 | ) | 3.99 | 6.00 | ||||||||||||||
|
|
|
|
|
|
|
|
|
| |||||||||||
Total from investment operations | 9.56 | 4.41 | (1.31 | ) | 3.92 | 6.11 | ||||||||||||||
Distributions to shareholders from | ||||||||||||||||||||
Net investment income | (0.04 | ) | 0.00 | 0.00 | (0.11 | ) | (0.17 | ) | ||||||||||||
Net realized gains | (2.46 | ) | (1.76 | ) | (0.21 | ) | 0.00 | 0.00 | ||||||||||||
|
|
|
|
|
|
|
|
|
| |||||||||||
Total distributions to shareholders | (2.50 | ) | (1.76 | ) | (0.21 | ) | (0.11 | ) | (0.17 | ) | ||||||||||
Net asset value, end of period | $ | 32.19 | $ | 25.13 | $ | 22.48 | $ | 24.00 | $ | 20.19 | ||||||||||
Total return | 39.88 | % | 20.39 | % | (5.54 | )% | 19.48 | % | 43.58 | % | ||||||||||
Ratios to average net assets (annualized) | ||||||||||||||||||||
Gross expenses | 1.04 | % | 1.05 | % | 1.05 | % | 1.01 | % | 1.00 | % | ||||||||||
Net expenses | 1.00 | % | 1.00 | % | 1.00 | % | 1.00 | % | 1.00 | % | ||||||||||
Net investment income (loss) | (0.37 | )% | 0.12 | % | (0.52 | )% | (0.34 | )% | 0.63 | % | ||||||||||
Supplemental data | ||||||||||||||||||||
Portfolio turnover rate | 95 | % | 93 | % | 110 | % | 160 | % | 28 | % | ||||||||||
Net assets, end of period (000s omitted) | $68,658 | $62,599 | $66,756 | $83,224 | $33,196 | |||||||||||||||
| 1. | After the close of business on July 16, 2010, the Fund acquired the net assets of Evergreen VA Omega Fund and Wells Fargo Advantage VT Large Company Growth Fund. Evergreen VA Omega Fund became the accounting and performance survivor in the transaction. The information for the periods prior to July 19, 2010 is that of Class 2 of Evergreen VA Omega Fund. |
| 2. | Calculated based upon average shares outstanding |
The accompanying notes are an integral part of these financial statements.
Table of Contents
| 18 | Wells Fargo Advantage VT Omega Growth Fund | Notes to financial statements |
1. ORGANIZATION
Wells Fargo Variable Trust (the “Trust”), a Delaware statutory trust organized on March 10, 1999, is an open-end management investment company registered under the Investment Company Act of 1940, as amended (the “1940 Act”). These financial statements report on the Wells Fargo Advantage VT Omega Growth Fund (the “Fund”) which is a diversified series of the Trust.
2. SIGNIFICANT ACCOUNTING POLICIES
The following significant accounting policies, which are consistently followed in the preparation of the financial statements of the Fund, are in conformity with U.S. generally accepted accounting principles which require management to make estimates and assumptions that affect the reported amounts of assets and liabilities, disclosure of contingent assets and liabilities at the date of the financial statements, and the reported amounts of revenues and expenses during the reporting period. Actual results could differ from those estimates.
Securities valuation
All investments are valued each business day as of the close of regular trading on the New York Stock Exchange (generally 4 p.m. Eastern Time).
Equity securities that are listed on a foreign or domestic exchange or market are valued at the official closing price or, if none, the last sales price. If no sale occurs on the primary exchange or market for the security that day, the prior day’s price will be deemed “stale” and fair values will be determined in accordance with the Fund’s Valuation Procedures.
Investments in registered open-end investment companies are valued at net asset value. Non-registered investment vehicles are fair valued at net asset value.
Investments which are not valued using any of the methods discussed above are valued at their fair value, as determined in good faith by the Board of Trustees of the Fund. The Board of Trustees has established a Valuation Committee comprised of the Trustees and has delegated to it the authority to take any actions regarding the valuation of portfolio securities that the Valuation Committee deems necessary or appropriate, including determining the fair value of portfolio securities, unless the determination has been delegated to the Management Valuation Team of Wells Fargo Funds Management, LLC (“Funds Management”). The Board of Trustees retains the authority to make or ratify any valuation decisions or approve any changes to the Valuation Procedures as it deems appropriate. On a quarterly basis, the Board of Trustees receives reports on any valuation actions taken by the Valuation Committee or the Management Valuation Team which may include items for ratification.
Valuations of fair valued securities are compared to the next actual sales price when available, or other appropriate market values, to assess the continued appropriateness of the fair valuation methodologies used. These securities are fair valued on a day-to-day basis, taking into consideration changes to appropriate market information and any significant changes to the inputs considered in the valuation process until there is a readily available price provided on an exchange or by an independent pricing service. Valuations received from an independent pricing service or independent broker-dealer quotes are periodically validated by comparisons to most recent trades and valuations provided by other independent pricing services in addition to the review of prices by the adviser and/or subadviser. Unobservable inputs used in determining fair valuations are identified based on the type of security, taking into consideration factors utilized by market participants in valuing the investment, knowledge about the issuer and the current market environment.
Security loans
The Fund may lend its securities from time to time in order to earn additional income in the form of fees or interest on securities received as collateral or the investment of any cash received as collateral. The Fund continues to receive interest or dividends on the securities loaned. The Fund receives collateral in the form of cash or securities with a value at least equal to the value of the securities on loan. The value of the loaned securities is determined at the close of each business day and any additional required collateral is delivered to the Fund on the next business day. In a securities lending transaction, the net asset value of the Fund will be affected by an increase or decrease in the value of the securities loaned and by an increase or decrease in the value of the instrument in which collateral is invested. The amount of securities lending activity undertaken by the Fund fluctuates from time to time. In the event of default or bankruptcy by the borrower, the Fund may be prevented from recovering the loaned securities or gaining access to the collateral or may experience delays or costs in doing so. In addition, the investment of any cash collateral received may lose all or part of its value. The Fund has the right under the lending agreement to recover the securities from the borrower on demand.
The Fund lends its securities through an unaffiliated securities lending agent. Cash collateral received in connection with its securities lending transactions is invested in Wells Fargo Securities Lending Cash Investments, LLC (the “Securities
Table of Contents
| Notes to financial statements | Wells Fargo Advantage VT Omega Growth Fund | 19 |
Lending Fund”). The Securities Lending Fund is exempt from registration under Section 3(c)(7) of the 1940 Act and is managed by Funds Management and is subadvised by Wells Capital Management Incorporated (“WellsCap”). Funds Management receives an advisory fee starting at 0.05% and declining to 0.01% as the average daily net assets of the Securities Lending Fund increase. All of the fees received by Funds Management are paid to WellsCap for its services as subadviser. The Securities Lending Fund seeks to provide a positive return compared to the daily Fed Funds Open rate by investing in high-quality, U.S. dollar-denominated short-term money market instruments. Securities Lending Fund investments are fair valued based upon the amortized cost valuation technique. Income earned from investment in the Securities Lending Fund is included in securities lending income on the Statement of Operations.
Security transactions and income recognition
Securities transactions are recorded on a trade date basis. Realized gains or losses are recorded on the basis of identified cost.
Dividend income is recognized on the ex-dividend date. Dividend income is recorded net of foreign taxes withheld where recovery of such taxes is not assured.
Distributions to shareholders
Distributions to shareholders from net investment income and net realized gains, if any, are recorded on the ex-dividend date. Such distributions are determined in conformity with federal income tax regulations, which may differ in amount or character from net investment income and realized gains recognized for purposes of U.S. generally accepted accounting principles.
Federal and other taxes
The Fund intends to continue to qualify as a regulated investment company by distributing substantially all of its investment company taxable income and any net realized capital gains (after reduction for capital loss carryforwards) sufficient to relieve it from all, or substantially all, federal income taxes. Accordingly, no provision for federal income taxes was required.
The Fund’s income and federal excise tax returns and all financial records supporting those returns for the prior three fiscal years are subject to examination by the federal and Delaware revenue authorities. Management has analyzed the Fund’s tax positions taken on federal, state, and foreign tax returns for all open tax years and does not believe that there are any uncertain tax positions that require recognition of a tax liability.
Reclassifications are made to the Fund’s capital accounts for permanent tax differences to reflect income and gains available for distribution (or available capital loss carryforwards) under federal income tax regulations. U.S. generally accepted accounting principles requires that certain components of net assets be adjusted to reflect permanent differences between financial and tax reporting. These reclassifications have no effect on net assets or net asset values per share. The primary permanent difference causing such reclassifications is due to net operating losses. At December 31, 2013, as a result of permanent book-to-tax differences, the following reclassification adjustments were made on the Statement of Assets and Liabilities:
Accumulated net investment loss | Accumulated net realized gains on investments | |
| $302,908 | $(302,908) |
As of December 31, 2013, capital loss carryforwards available to offset future net realized capital gains were as follows through the indicated expiration dates:
| 2015 | 2016 | 2017 | ||
| $2,930,118 | $2,303,740 | $771,379 |
Class allocations
The separate classes of shares offered by the Fund differ principally in distribution fees. Shareholders of each class bear certain expenses that pertain to that particular class. All shareholders bear the common expenses of the Fund, earn income from the portfolio, and are allocated any unrealized gains and losses pro rata based on the average daily net assets of each class, without distinction between share classes. Dividends are determined separately for each class based on income and expenses allocable to each class. Realized gains and losses are allocated to each class pro rata based upon
Table of Contents
| 20 | Wells Fargo Advantage VT Omega Growth Fund | Notes to financial statements |
the net assets of each class on the date realized. Differences in per share dividend rates generally result from the relative weightings of pro rata income and realized gain allocations and from differences in separate class expenses, including distribution fees.
3. FAIR VALUATION MEASUREMENTS
Fair value measurements of investments are determined within a framework that has established a fair value hierarchy based upon the various data inputs utilized in determining the value of the Fund’s investments. The three-level hierarchy gives the highest priority to unadjusted quoted prices in active markets for identical assets or liabilities (Level 1) and the lowest priority to significant unobservable inputs (Level 3). The Fund’s investments are classified within the fair value hierarchy based on the lowest level of input that is significant to the fair value measurement. The inputs are summarized into three broad levels as follows:
| n | Level 1 – quoted prices in active markets for identical securities |
| n | Level 2 – other significant observable inputs (including quoted prices for similar securities, interest rates, prepayment speeds, credit risk, use of amortized cost, etc.) |
| n | Level 3 – significant unobservable inputs (including the Fund’s own assumptions in determining the fair value of investments) |
The inputs or methodologies used for valuing investments in securities are not necessarily an indication of the risk associated with investing in those securities.
As of December 31, 2013, the inputs used in valuing investments in securities were as follows:
| Investments in securities | Quoted prices (Level 1) | Other significant (Level 2) | Significant unobservable inputs (Level 3) | Total | ||||||||||||
Equity securities | ||||||||||||||||
Common stocks | $ | 123,662,102 | $ | 0 | $ | 0 | $ | 123,662,102 | ||||||||
Short-term investments | ||||||||||||||||
Investment companies | 1,556,578 | 772,400 | 0 | 2,328,978 | ||||||||||||
| $ | 125,218,680 | $ | 772,400 | $ | 0 | $ | 125,991,080 | |||||||||
Transfers in and transfers out are recognized at the end of the reporting period. For the year ended December 31, 2013, the Fund did not have any transfers into/out of Level 1, Level 2, or Level 3.
4. TRANSACTIONS WITH AFFILIATES AND OTHER EXPENSES
Advisory fee
The Trust has entered into an advisory contract with Funds Management, an indirect wholly owned subsidiary of Wells Fargo & Company (“Wells Fargo”). The adviser is responsible for implementing investment policies and guidelines and for supervising the subadviser, who is responsible for day-to-day portfolio management of the Fund.
Pursuant to the contract, Funds Management is entitled to receive an annual advisory fee starting at 0.55% and declining to 0.40% as the average daily net assets of the Fund increase. For the year ended December 31, 2013, the advisory fee was equivalent to an annual rate of 0.55% of the Fund’s average daily net assets.
Funds Management has retained the services of a subadviser to provide daily portfolio management to the Fund. The fee for subadvisory services is borne by Funds Management. WellsCap, an affiliate of Funds Management and an indirect, wholly owned subsidiary of Wells Fargo, is the subadviser to the Fund and is entitled to receive a fee from Funds Management at an annual rate starting at 0.45% and declining to 0.30% as the average daily net assets of the Fund increase. Prior to May 1, 2013, Wells Cap was entitled to receive a fee at an annual rate which started at 0.45% and declined to 0.20% as the average daily net assets of the Fund increased.
Administration and transfer agent fees
The Trust has entered into an administration agreement with Funds Management. Under this agreement, for providing administrative services, which includes paying fees and expenses for services provided by the transfer agent, sub-transfer agents, omnibus account servicers and record-keepers, Funds Management is entitled to receive from the Fund an annual
Table of Contents
| Notes to financial statements | Wells Fargo Advantage VT Omega Growth Fund | 21 |
fund level administration fee starting at 0.05% and declining to 0.03% as the average daily net assets of the Fund increase and a class level administration fee of 0.08% which is calculated based on the average daily net assets of each class.
Funds Management has contractually waived and/or reimbursed advisory and administration fees to the extent necessary to maintain certain net operating expense ratios for the Fund. Waiver of fees and/or reimbursement of expenses by Funds Management were made first from fund level expenses on a proportionate basis and then from class specific expenses. Funds Management has committed through April 30, 2014 to waive fees and/or reimburse expenses to the extent necessary to cap the Fund’s expenses at 0.75% for Class 1 shares and 1.00% for Class 2 shares.
Distribution fees
The Trust has adopted a Distribution Plan for Class 2 shares of the Fund pursuant to Rule 12b-1 under the 1940 Act. Distribution fees are charged to Class 2 shares and paid to Wells Fargo Funds Distributor, LLC, the principal underwriter, at an annual rate of 0.25% of the average daily net assets of Class 2.
5. INVESTMENT PORTFOLIO TRANSACTIONS
Purchases and sales of investments, excluding U.S. government obligations (if any) and short-term securities, for the year ended December 31, 2013 were $109,672,099 and $136,022,371, respectively.
6. BANK BORROWINGS
The Trust and Wells Fargo Funds Trust (excluding the money market funds and certain other funds) are parties to a $150,000,000 revolving credit agreement with State Street Bank and Trust Company, whereby the Fund is permitted to use bank borrowings for temporary or emergency purposes, such as to fund shareholder redemption requests. Interest under the credit agreement is charged to the Fund based on a borrowing rate equal to the higher of the Federal Funds rate in effect on that day plus 1.25% or the overnight LIBOR rate in effect on that day plus 1.25%. In addition, an annual commitment fee equal to 0.10% of the unused balance is allocated to each participating fund. For the year ended December 31, 2013, the Fund paid $192 in commitment fees.
For the year ended December 31, 2013, there were no borrowings by the Fund under the agreement.
7. DISTRIBUTIONS TO SHAREHOLDERS
The tax character of distributions paid during the years ended December 31, 2013 and December 31, 2012 were as follows:
| Year ended December 31 | ||||
| 2013 | 2012 | |||
Ordinary income | $291,874 | $2,432,943 | ||
Long-term capital gain | 9,595,823 | 5,315,688 | ||
As of December 31, 2013, the components of distributable earnings on a tax basis were as follows:
Undistributed ordinary income | Undistributed long-term gain | Unrealized gains | Capital loss carryforward | |||
| $3,838,034 | $18,725,983 | $37,308,221 | $(6,005,237) |
8. CONCENTRATION RISK
Concentration risks result from exposure to a limited number of sectors. Funds that invest a substantial portion of their assets in any sector may be more affected by changes in that sector than would be a fund whose investments are not heavily weighted in any sector.
9. INDEMNIFICATION
Under the Trust’s organizational documents, the officers and directors are indemnified against certain liabilities that may arise out of performance of their duties to the Trust. Additionally, in the normal course of business, the Trust may enter into contracts with service providers that contain a variety of indemnification clauses. The Trust’s maximum exposure under these arrangements is dependent on future claims that may be made against the Fund and, therefore, cannot be estimated.
Table of Contents
| 22 | Wells Fargo Advantage VT Omega Growth Fund | Report of independent registered public accounting firm |
BOARD OF TRUSTEES AND SHAREHOLDERS OF WELLS FARGO VARIABLE TRUST:
We have audited the accompanying statement of assets and liabilities, including the portfolio of investments, of the Wells Fargo Advantage VT Omega Growth Fund (the “Fund”), one of the funds constituting the Wells Fargo Variable Trust, as of December 31, 2013, and the related statement of operations for the year then ended, statements of changes in net assets for each of the years in the two-year period then ended, and the financial highlights for each of the years in the five-year period then ended. These financial statements and financial highlights are the responsibility of the Fund’s management. Our responsibility is to express an opinion on these financial statements and financial highlights based on our audits.
We conducted our audits in accordance with the standards of the Public Company Accounting Oversight Board (United States). Those standards require that we plan and perform the audit to obtain reasonable assurance about whether the financial statements and financial highlights are free of material misstatement. An audit includes examining, on a test basis, evidence supporting the amounts and disclosures in the financial statements. Our procedures included confirmation of securities owned as of December 31, 2013, by correspondence with the custodian and brokers or by other appropriate auditing procedures. An audit also includes assessing the accounting principles used and significant estimates made by management, as well as evaluating the overall financial statement presentation. We believe that our audits provide a reasonable basis for our opinion.
In our opinion, the financial statements and financial highlights referred to above present fairly, in all material respects, the financial position of the Wells Fargo Advantage VT Omega Growth Fund as of December 31, 2013, the results of its operations for the year then ended, the changes in its net assets for each of the years in the two-year period then ended, and the financial highlights for each of the years in the five-year period then ended, in conformity with U.S. generally accepted accounting principles.

Boston, Massachusetts
February 27, 2014
Table of Contents
| Other information (unaudited) | Wells Fargo Advantage VT Omega Growth Fund | 23 |
TAX INFORMATION
For corporate shareholders, pursuant to Section 854 of the Internal Revenue Code, 100% of ordinary income dividends qualify for the corporate dividends-received deduction for the fiscal year ended December 31, 2013.
Pursuant to Section 852 of the Internal Revenue Code, $9,595,823 was designated as long-term capital gain distributions for the fiscal year ended December 31, 2013.
PROXY VOTING INFORMATION
A description of the policies and procedures that the Fund uses to determine how to vote proxies relating to portfolio securities is available without charge, upon request, by calling 1-800-222-8222, visiting our website at wellsfargoadvantagefunds.com, or visiting the SEC website at sec.gov. Information regarding how the Fund voted proxies relating to portfolio securities during the most recent 12-month period ended June 30 is available without charge on the Fund’s website at wellsfargoadvantagefunds.com or by visiting the SEC website at sec.gov.
PORTFOLIO HOLDINGS INFORMATION
The complete portfolio holdings for the Fund are publicly available on the Fund’s website (wellsfargoadvantagefunds.com) on a monthly, 30-day or more delayed basis. In addition, top ten holdings information for the Fund is publicly available on the Fund’s website on a monthly, seven-day or more delayed basis. The Fund files its complete schedule of portfolio holdings with the SEC for the first and third quarters of each fiscal year on Form N-Q, which is available without charge by visiting the SEC website at sec.gov. In addition, the Fund’s Form N-Q may be reviewed and copied at the SEC’s Public Reference Room in Washington, DC, and at regional offices in New York City, at 233 Broadway, and in Chicago, at 175 West Jackson Boulevard, Suite 900. Information about the Public Reference Room may be obtained by calling 1-800-SEC-0330.
Table of Contents
| 24 | Wells Fargo Advantage VT Omega Growth Fund | Other information (unaudited) |
BOARD OF TRUSTEES AND OFFICERS
Each of the Trustees and Officers listed in the table below acts in identical capacities for each fund in the Wells Fargo Advantage family of funds, which consists of 132 mutual funds1 comprising the Wells Fargo Funds Trust, Wells Fargo Variable Trust, Wells Fargo Master Trust and four closed-end funds (collectively the “Fund Complex”). This table should be read in conjunction with the Prospectus and the Statement of Additional Information2. All of the Trustees are also Members of the Audit and Governance Committees of each Trust in the Fund Complex. The mailing address of each Trustee and Officer is 525 Market Street, 12th Floor, San Francisco, CA 94105. Each Trustee and Officer serves an indefinite term, however, each Trustee serves such term until reaching the mandatory retirement age established by the Trustees.
Independent Trustees
Name and year of birth | Position held and length of service* | Principal occupations during past five years | Other directorships during | |||
| Peter G. Gordon (Born 1942) | Trustee, since 1998; Chairman, since 2005 | Co-Founder, Retired Chairman, President and CEO of Crystal Geyser Water Company. Trustee Emeritus, Colby College. | Asset Allocation Trust | |||
| Isaiah Harris, Jr. (Born 1952) | Trustee, since 2009 | Retired. Prior thereto, President and CEO of BellSouth Advertising and Publishing Corp. from 2005 to 2007, President and CEO of BellSouth Enterprises from 2004 to 2005 and President of BellSouth Consumer Services from 2000 to 2003. Emeritus member of the Iowa State University Foundation Board of Governors. Emeritus Member of the Advisory Board of Iowa State University School of Business. Advisory Board Member, Palm Harbor Academy (charter school). Mr. Harris is a certified public accountant. | CIGNA Corporation; Deluxe Corporation; Asset Allocation Trust | |||
| Judith M. Johnson (Born 1949) | Trustee, since 2008; Audit Committee Chairman, since 2008 | Retired. Prior thereto, Chief Executive Officer and Chief Investment Officer of Minneapolis Employees Retirement Fund from 1996 to 2008. Ms. Johnson is an attorney, certified public accountant and a certified managerial accountant. | Asset Allocation Trust | |||
| Leroy Keith, Jr. (Born 1939) | Trustee, since 2010 | Chairman, Bloc Global Services (development and construction). Trustee of the Evergreen Funds from 1983 to 2010. Former Managing Director, Almanac Capital Management (commodities firm), former Partner, Stonington Partners, Inc. (private equity fund), former Director, Obagi Medical Products Co. and former Director, Lincoln Educational Services. | Trustee, Virtus Fund Complex (consisting of 50 portfolios as of 12/16/2013); Asset Allocation Trust | |||
| David F. Larcker (Born 1950) | Trustee, since 2009 | James Irvin Miller Professor of Accounting at the Graduate School of Business, Stanford University, Morgan Stanley Director of the Center for Leadership Development and Research and Senior Faculty of The Rock Center for Corporate Governance since 2006. From 2005 to 2008, Professor of Accounting at the Graduate School of Business, Stanford University. Prior thereto, Ernst & Young Professor of Accounting at The Wharton School, University of Pennsylvania from 1985 to 2005. | Asset Allocation Trust | |||
| Olivia S. Mitchell (Born 1953) | Trustee, since 2006 | International Foundation of Employee Benefit Plans Professor, Wharton School of the University of Pennsylvania since 1993. Director of Wharton’s Pension Research Council and Boettner Center on Pensions & Retirement Research, and Research Associate at the National Bureau of Economic Research. Previously, Cornell University Professor from 1978 to 1993. | Asset Allocation Trust | |||
| Timothy J. Penny (Born 1951) | Trustee, since 1996 | President and CEO of Southern Minnesota Initiative Foundation, a non-profit organization, since 2007 and Senior Fellow at the Humphrey Institute Policy Forum at the University of Minnesota since 1995. Member of the Board of Trustees of NorthStar Education Finance, Inc., a non-profit organization, since 2007. | Asset Allocation Trust |
Table of Contents
| Other information (unaudited) | Wells Fargo Advantage VT Omega Growth Fund | 25 |
Name and year of birth | Position held and length of service* | Principal occupations during past five years | Other directorships during | |||
| Michael S. Scofield (Born 1943) | Trustee, since 2010 | Served on the Investment Company Institute’s Board of Governors and Executive Committee from 2008-2011 as well the Governing Council of the Independent Directors Council from 2006-2011 and the Independent Directors Council Executive Committee from 2008-2011. Chairman of the IDC from 2008-2010. Institutional Investor (Fund Directions) Trustee of Year in 2007. Trustee of the Evergreen Funds (and its predecessors) from 1984 to 2010. Chairman of the Evergreen Funds from 2000-2010. Former Trustee of the Mentor Funds. Retired Attorney, Law Offices of Michael S. Scofield. | Asset Allocation Trust | |||
| Donald C. Willeke (Born 1940) | Trustee, since 1996 | Principal of the law firm of Willeke & Daniels. General Counsel of the Minneapolis Employees Retirement Fund from 1984 until its consolidation into the Minnesota Public Employees Retirement Association on June 30, 2010. Director and Vice Chair of The Tree Trust (non-profit corporation). Director of the American Chestnut Foundation (non-profit corporation). | Asset Allocation Trust |
| * | Length of service dates reflect the Trustee’s commencement of service with the Trust’s predecessor entities, where applicable. |
Officers
Name and year of birth | Position held and length of service | Principal occupations during past five years | ||||
| Karla M. Rabusch (Born 1959) | President, since 2003 | Executive Vice President of Wells Fargo Bank, N.A. and President of Wells Fargo Funds Management, LLC since 2003. | ||||
| Jeremy DePalma1 (Born 1974) | Treasurer, since 2012 | Senior Vice President of Wells Fargo Funds Management, LLC since 2009. Senior Vice President of Evergreen Investment Management Company, LLC from 2008 to 2010. Vice President, Evergreen Investment Services, Inc. from 2004 to 2007. Head of the Fund Reporting and Control Team within Fund Administration from 2005 to 2010. | ||||
| C. David Messman (Born 1960) | Secretary, since 2000; Chief Legal Officer, since 2003 | Senior Vice President and Secretary of Wells Fargo Funds Management, LLC since 2001. Vice President and Managing Counsel of Wells Fargo Bank, N.A. since 1996. | ||||
| Debra Ann Early (Born 1964) | Chief Compliance Officer, since 2007 | Chief Compliance Officer of Wells Fargo Funds Management, LLC since 2007. Chief Compliance Officer of Parnassus Investments from 2005 to 2007. Chief Financial Officer of Parnassus Investments from 2004 to 2007. | ||||
| David Berardi (Born 1975) | Assistant Treasurer, since 2009 | Vice President of Wells Fargo Funds Management, LLC since 2009. Vice President of Evergreen Investment Management Company, LLC from 2008 to 2010. Assistant Vice President of Evergreen Investment Services, Inc. from 2004 to 2008. Manager of Fund Reporting and Control for Evergreen Investment Management Company, LLC from 2004 to 2010. |
| 1. | Jeremy DePalma acts as Treasurer of 59 funds and Assistant Treasurer of 73 funds in the Fund Complex. |
| 2. | The Statement of Additional Information includes additional information about the Trustees and is available, without charge, upon request, by calling 1-800-222-8222 or by visiting the website at wellsfargoadvantagefunds.com. |
Table of Contents
| 26 | Wells Fargo Advantage VT Omega Growth Fund | List of abbreviations |
The following is a list of common abbreviations for terms and entities that may have appeared in this report.
| ACA | — ACA Financial Guaranty Corporation |
| ADR | — American depositary receipt |
| ADS | — American depositary shares |
| AGC | — Assured Guaranty Corporation |
| AGM | — Assured Guaranty Municipal |
| Ambac | — Ambac Financial Group Incorporated |
| AMT | — Alternative minimum tax |
| AUD | — Australian dollar |
| BAN | — Bond anticipation notes |
| BHAC | — Berkshire Hathaway Assurance Corporation |
| BRL | — Brazilian real |
| CAB | — Capital appreciation bond |
| CAD | — Canadian dollar |
| CCAB | — Convertible capital appreciation bond |
| CDA | — Community Development Authority |
| CDO | — Collateralized debt obligation |
| CHF | — Swiss franc |
| COP | — Certificate of participation |
| DKK | — Danish krone |
| DRIVER | — Derivative inverse tax-exempt receipts |
| DW&P | — Department of Water & Power |
| DWR | — Department of Water Resources |
| ECFA | — Educational & Cultural Facilities Authority |
| EDA | — Economic Development Authority |
| EDFA | — Economic Development Finance Authority |
| ETF | — Exchange-traded fund |
| EUR | — Euro |
| FDIC | — Federal Deposit Insurance Corporation |
| FFCB | — Federal Farm Credit Banks |
| FGIC | — Financial Guaranty Insurance Corporation |
| FHA | — Federal Housing Administration |
| FHLB | — Federal Home Loan Bank |
| FHLMC | — Federal Home Loan Mortgage Corporation |
| FICO | — The Financing Corporation |
| FNMA | — Federal National Mortgage Association |
| FSA | — Farm Service Agency |
| GBP | — Great British pound |
| GDR | — Global depositary receipt |
| GNMA | — Government National Mortgage Association |
| GO | — General obligation |
| HCFR | — Healthcare facilities revenue |
| HEFA | — Health & Educational Facilities Authority |
| HEFAR | — Higher education facilities authority revenue |
| HFA | — Housing Finance Authority |
| HFFA | — Health Facilities Financing Authority |
| HKD | — Hong Kong dollar |
| HUD | — Department of Housing and Urban Development |
| HUF | — Hungarian forint |
| IDA | — Industrial Development Authority |
| IDAG | — Industrial Development Agency |
| IDR | — Industrial development revenue |
| IEP | — Irish pound |
| JPY | — Japanese yen |
| KRW | — Republic of Korea won |
| LIBOR | — London Interbank Offered Rate |
| LIQ | — Liquidity agreement |
| LLC | — Limited liability company |
| LLP | — Limited liability partnership |
| LOC | — Letter of credit |
| LP | — Limited partnership |
| MBIA | — Municipal Bond Insurance Association |
| MFHR | — Multifamily housing revenue |
| MSTR | — Municipal securities trust receipts |
| MTN | — Medium-term note |
| MUD | — Municipal Utility District |
| MXN | — Mexican peso |
| MYR | — Malaysian ringgit |
| National | — National Public Finance Guarantee Corporation |
| NGN | — Nigerian naira |
| NOK | — Norwegian krone |
| NZD | — New Zealand dollar |
| PCFA | — Pollution Control Financing Authority |
| PCL | — Public Company Limited |
| PCR | — Pollution control revenue |
| PFA | — Public Finance Authority |
| PFFA | — Public Facilities Financing Authority |
| PFOTER | — Puttable floating option tax-exempt receipts |
| plc | — Public limited company |
| PLN | — Polish zloty |
| PUTTER | — Puttable tax-exempt receipts |
| R&D | — Research & development |
| Radian | — Radian Asset Assurance |
| RAN | — Revenue anticipation notes |
| RDA | — Redevelopment Authority |
| RDFA | — Redevelopment Finance Authority |
| REIT | — Real estate investment trust |
| ROC | — Reset option certificates |
| RON | — Romanian lei |
| RUB | — Russian ruble |
| SAVRS | — Select auction variable rate securities |
| SBA | — Small Business Authority |
| SEK | — Swedish krona |
| SFHR | — Single-family housing revenue |
| SFMR | — Single-family mortgage revenue |
| SGD | — Singapore dollar |
| SKK | — Slovakian koruna |
| SPA | — Standby purchase agreement |
| SPDR | — Standard & Poor’s Depositary Receipts |
| STRIPS | — Separate trading of registered interest and principal securities |
| TAN | — Tax anticipation notes |
| TBA | — To be announced |
| THB | — Thai baht |
| TIPS | — Treasury inflation-protected securities |
| TRAN | — Tax revenue anticipation notes |
| TRY | — Turkish lira |
| TTFA | — Transportation Trust Fund Authority |
| TVA | — Tennessee Valley Authority |
| ZAR | — South African rand |
Table of Contents
This page is intentionally left blank.
Table of Contents
This page is intentionally left blank.
Table of Contents


For more information
More information about Wells Fargo Advantage Funds is available free upon request. To obtain literature, please write, email, visit the Fund’s website, or call:
Wells Fargo Advantage Funds
P.O. Box 8266
Boston, MA 02266-8266
Email: wfaf@wellsfargo.com
Website: wellsfargoadvantagefunds.com
Individual investors: 1-800-222-8222
Retail investment professionals: 1-888-877-9275
Institutional investment professionals: 1-866-765-0778
This report and the financial statements contained herein are submitted for the general information of the shareholders of Wells Fargo Advantage Funds. If this report is used for promotional purposes, distribution of the report must be accompanied or preceded by a current prospectus. For a current prospectus and, if available, a summary prospectus containing more complete information, including charges and expenses, call 1-800-222-8222 or visit the Fund’s website at wellsfargoadvantagefunds.com . Please consider the investment objectives, risks, charges, and expenses of the investment carefully before investing. This and other information about Wells Fargo Advantage Funds can be found in the current prospectus. Read the prospectus carefully before you invest or send money.
Wells Fargo Funds Management, LLC, a wholly owned subsidiary of Wells Fargo & Company, provides investment advisory and administrative services for Wells Fargo Advantage Funds. Other affiliates of Wells Fargo & Company provide subadvisory and other services for the Funds. The Funds are distributed by Wells Fargo Funds Distributor, LLC, Member FINRA/SIPC, an affiliate of Wells Fargo & Company.
NOT FDIC INSURED ¡ NO BANK GUARANTEE ¡ MAY LOSE VALUE
© 2014 Wells Fargo Funds Management, LLC. All rights reserved.
222096 02-14 AVT5/AR151 12-13 |
Table of Contents

Wells Fargo Advantage VT Opportunity FundSM

Annual Report
December 31, 2013
Table of Contents
Reduce clutter. Save trees.
Sign up for electronic delivery of prospectuses and shareholder reports at wellsfargo.com/advantagedelivery
| 2 | ||||
| 4 | ||||
| 8 | ||||
| 9 | ||||
Financial statements | ||||
| 14 | ||||
| 15 | ||||
| 16 | ||||
| 17 | ||||
| 19 | ||||
| 23 | ||||
| 24 | ||||
| 27 | ||||
The views expressed and any forward-looking statements are as of December 31, 2013, unless otherwise noted, and are those of the Fund managers and/or Wells Fargo Funds Management, LLC. Discussions of individual securities, or the markets generally, or any Wells Fargo Advantage Fund are not intended as individual recommendations. Future events or results may vary significantly from those expressed in any forward-looking statements; the views expressed are subject to change at any time in response to changing circumstances in the market. Wells Fargo Funds Management, LLC and the Fund disclaim any obligation to publicly update or revise any views expressed or forward-looking statements.
NOT FDIC INSURED ¡ NO BANK GUARANTEE ¡ MAY LOSE VALUE
Table of Contents
| 2 | Wells Fargo Advantage VT Opportunity Fund | Letter to shareholders (unaudited) |

Karla M. Rabusch
President
Wells Fargo Advantage Funds
Major central banks continued to inject liquidity into the banks and the markets through various quantitative easing policies.
Dear Valued Shareholder:
We are pleased to offer you this annual report for the Wells Fargo Advantage VT Opportunity Fund for the 12-month period that ended December 31, 2013. Much of the period was marked by monetary easing by global central banks. During the period, investor concerns that the U.S. Federal Reserve (Fed) would end its bond-buying program initially led to higher interest rates, resulting in losses for bond indexes and volatility for global stock indexes. These fears dissipated in late September 2013 and ended altogether in mid-December 2013 when the Fed announced a tapering timeline that was far more moderate than some had feared. Growing confidence that the U.S. economy was staging a fragile recovery resulted in double-digit returns for domestic stock market indexes for the 12-month reporting period.
Central banks continued to provide stimulus.
Major central banks continued to inject liquidity into the banks and the markets through various quantitative easing policies. Throughout the reporting period, the Federal Open Market Committee (FOMC)—the Fed’s monetary policymaking body—kept its key interest rate near zero in order to support the economy and the financial system. Entering the reporting period, the FOMC had committed to purchase $40 billion per month in mortgage-backed securities to support the housing market and $45 billion per month in long-term U.S. Treasuries to keep interest rates low. Because the markets benefited from the FOMC’s liquidity, the prices of both stocks and bonds initially fell after the FOMC indicated in May 2013 that it might reduce (or taper) its bond-buying program. In mid-December 2013, the FOMC announced that it would reduce its bond-buying program by $10 billion per month beginning in January 2014. The tapering was less aggressive than some investors had feared, and the markets ended 2013 strongly.
European markets continued to benefit from the European Central Bank’s (ECB’s) September 2012 announcement that it would purchase an unlimited amount of one- to three-year sovereign debt from countries that had formally applied for a bailout. As a result, when the tiny eurozone nation of Cyprus was forced to implement capital controls and impose losses on uninsured bank depositors in March 2013, global stock markets remained resilient despite short-term volatility. In May 2013, the ECB cut its key rate to a then-historic low of 0.5%. The ECB’s aggressive actions helped ease investor worries about a eurozone sovereign debt default. Given the substantial ties between the U.S. and Europe, the improved sentiment about the eurozone helped provide a tailwind for U.S. markets.
U.S. stock markets gained on relatively good news.
For most of the period, U.S. economic data remained moderately positive, gaining strength as the period progressed. Reported gross domestic product growth came in at a solid 1.1% annualized rate in the first quarter of 2013, a 2.5% annualized rate in the second quarter, a 4.1% annualized rate in the third quarter, and a 3.2% annualized rate (an advance estimate as of January 31, 2014) in the fourth quarter.
The most significant negative effect was the ongoing fight in Washington, D.C., over the federal budget and debt limit. The Budget Control Act of 2011, which was passed to resolve a previous fight over the federal debt ceiling, mandated budget sequestration that took effect on March 1, 2013, and was an overhang on economic growth throughout the remainder of the reporting period. Most recently, Congress was unable to pass a resolution to continue to fund the federal government, and thus, the federal government underwent a partial shutdown from September 30, 2013, through October 16, 2013. The government reopened after the president and Congress reached a deal that funded the government through January 15, 2014, and raised the debt limit through February 7, 2014. In December 2013, Congress passed the Ryan-Murray budget agreement, which funded the government through fiscal 2015, lessening the near-term prospect of another shutdown.
Table of Contents
| Letter to shareholders (unaudited) | Wells Fargo Advantage VT Opportunity Fund | 3 |
Despite political headwinds, the relatively positive outlook for the U.S. economy contributed to a strong domestic stock market for most of the reporting period. Economically sensitive sectors, such as industrials and consumer discretionary, outperformed. Dividend-paying stocks led the market earlier in 2013 as investors sought yield in a historically low-yielding environment, but rising interest rates later in the period dampened their relative performance. Judging by various Russell indexes, small-cap stocks outperformed large-cap stocks, and growth stocks outperformed value stocks.
Don’t let short-term uncertainty derail long-term investment goals.
While periods of uncertainty can present challenges, they can also create opportunities, and experience has taught us that maintaining long-term investment goals can be an effective way to plan for the future. Although diversification cannot guarantee an investment profit or prevent losses, we believe it can be an effective way to manage investment risk and potentially smooth out overall portfolio performance. We encourage investors to know their investments and to understand that appropriate levels of risk-taking may unlock opportunities.
Thank you for choosing to invest with Wells Fargo Advantage Funds. We appreciate your confidence in us and remain committed to helping you meet your financial needs. For current information about your fund investments, contact your investment professional, visit our website at wellsfargoadvantagefunds.com, or call us directly at 1-800-222-8222. We are available 24 hours a day, 7 days a week.
Sincerely,

Karla M. Rabusch
President
Wells Fargo Advantage Funds
Despite political headwinds, the relatively positive outlook for the U.S. economy contributed to a strong domestic stock market for most of the reporting period.
Notice to shareholders
The Fund and Funds Management, LLC (“Funds Management”) have received an exemptive order from the SEC that permits Funds Management, subject to the approval of the Board of Trustees of the Fund, to select or replace certain subadvisers to manage all or a portion of the Fund’s assets and enter into, amend or terminate a sub-advisory agreement with certain subadvisers without obtaining shareholder approval (“Multi-manager Structure”). The Multi-manager Structure applies to subadvisers that are not affiliated with Funds Management or the Fund, except to the extent that affiliation arises solely because such subadvisers provide sub-advisory services to the Fund (“Non-affiliated Subadvisers”), as well as subadvisers that are indirect or direct wholly-owned subsidiaries of Funds Management or of another company that, indirectly or directly, wholly owns Funds Management (“Wholly-owned Subadvisers”).
Pursuant to the SEC order, Funds Management, with the approval of the Board of Trustees, has the discretion to terminate any subadvisers and allocate and reallocate the Fund’s assets among any other Non-affiliated Subadvisers or Wholly-owned Subadvisers. Funds Management, subject to oversight and supervision by the Board of Trustees, has responsibility to continue to oversee any subadvisers to the Fund and to recommend, for approval by the Board of Trustees, the hiring, termination and replacement of subadvisers for the Fund. In the event that a new subadviser is hired pursuant to the Multi-manager Structure, the Fund is required to provide notice to shareholders within 90 days.
Please contact your investment professional or call us directly at 1-800-222-8222 if you have any questions on this Notice to Shareholders
Table of Contents
| 4 | Wells Fargo Advantage VT Opportunity Fund | Performance highlights (unaudited) |
Investment objective
The Fund seeks long-term capital appreciation.
Adviser
Wells Fargo Funds Management, LLC
Subadviser
Wells Capital Management Incorporated
Portfolio manager
Ann M. Miletti
Average annual total returns1 (%) as of December 31, 2013
| Expense ratios2 (%) | ||||||||||||||||||||||||
| Inception date | 1 year | 5 year | 10 year | Gross | Net3 | |||||||||||||||||||
| Class 1 | 8-26-2011 | 30.99 | 21.28 | 9.14 | 0.86 | 0.76 | ||||||||||||||||||
| Class 2 | 5-8-1992 | 30.68 | 21.13 | 9.08 | 1.11 | 1.01 | ||||||||||||||||||
| Russell Midcap® Index4,6 | – | 34.76 | 22.36 | 10.22 | – | – | ||||||||||||||||||
| Russell 3000® Index5,6 | – | 33.55 | 18.71 | 7.88 | – | – | ||||||||||||||||||
Figures quoted represent past performance, which is no guarantee of future results and do not reflect the deduction of taxes that a shareholder may pay on fund distributions or the redemption of fund shares. Investment return and principal value of an investment will fluctuate so that an investor’s shares, when redeemed, may be worth more or less than their original cost. Current performance may be lower or higher than the performance data quoted, which assumes the reinvestment of dividends and capital gains. Current month-end performance is available by calling 1-800-222-8222. Performance figures of the Fund do not reflect fees charged pursuant to the terms of variable life insurance policies and variable annuity contracts. If fees had been reflected, performance would have been lower.
Index returns do not include transaction costs associated with buying and selling securities, any mutual fund fees or expenses, or any taxes. It is not possible to invest directly in an index.
Please keep in mind that high double-digit returns were primarily achieved during favorable market conditions. You should not expect that such favorable returns can be consistently achieved. A Fund’s performance, especially for very short time periods, should not be the sole factor in making your investment decision.
Stock values fluctuate in response to the activities of individual companies and general market and economic conditions. Smaller-company stocks tend to be more volatile and less liquid than those of larger companies. Certain investment strategies tend to increase the total risk of an investment (relative to the broader market). The Fund is exposed to foreign investment risk. Consult the Fund’s prospectus for additional information on these and other risks.
Please refer to the prospectus provided by your participating insurance company for detailed information describing the separate accounts for information regarding surrender charges, mortality and expense risk fees, and other charges that may be assessed by the participating insurance companies.
Please see footnotes on page 5.
Table of Contents
| Performance highlights (unaudited) | Wells Fargo Advantage VT Opportunity Fund | 5 |
| Growth of $10,000 investment7 as of December 31, 2013 | ||
| ||
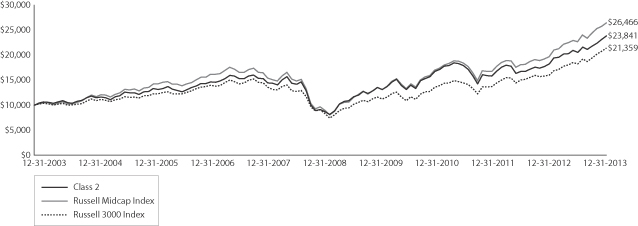
| 1. | Historical performance shown for Class 1 shares prior to their inception reflects the performance of Class 2 shares, and includes the higher expenses applicable to Class 2 shares. If these expenses had not been included, returns would be higher. |
| 2. | Reflects the expense ratios as stated in the most recent prospectuses. |
| 3. | The Adviser has committed through April 30, 2014, to waive fees and/or reimburse expenses to the extent necessary to cap the Fund’s Total Annual Fund Operating Expenses After Fee Waiver, excluding certain expenses, at 0.75% for Class 1 and 1.00% for Class 2. Brokerage commissions, stamp duty fees, interest, taxes, acquired fund fees and expenses, and extraordinary expenses are excluded from the cap. Without this cap, the Fund’s returns would have been lower. |
| 4. | The Russell Midcap® Index measures the performance of the 800 smallest companies in the Russell 1000® Index, which represent approximately 25% of the total market capitalization of the Russell 1000 Index. You cannot invest directly in an index. |
| 5. | The Russell 3000® Index measures the performance of the 3,000 largest U.S. companies based on total market capitalization, which represents approximately 98% of the investable U.S. equity market. You cannot invest directly in an index. |
| 6. | Effective January 1, 2013, the Fund changed its benchmark from the Russell Midcap Index to the Russell 3000 Index to better align with its new strategy to invest in equity securities of companies of all market capitalizations. |
| 7. | The chart compares the performance of Class 2 shares for the most recent ten years with the Russell 3000 Index and the Russell Midcap Index. The chart assumes a hypothetical $10,000 investment and reflects all operating expenses of the Fund. Performance figures of the Fund do not reflect fees charged pursuant to the terms of variable life insurance policies and variable annuity contracts. |
| 8. | The ten largest equity holdings are calculated based on the value of the securities divided by total net assets of the Fund. Holdings are subject to change and may have changed since the date specified. |
| 9. | Sector distribution is subject to change and is calculated based on the total long-term investments of the Fund. |
Table of Contents
| 6 | Wells Fargo Advantage VT Opportunity Fund | Performance highlights (unaudited) |
MANAGER’S DISCUSSION
Fund highlights
| n | The Fund underperformed both of its benchmarks, the Russell 3000 Index and the Russell MidCap Index, for the 12-month period that ended December 31, 2013. |
| n | Stock selection in the energy and information technology (IT) sectors detracted from performance. |
| n | Significant contributions came from the consumer staples and financials sectors. An overweight in the consumer discretionary sector was also beneficial. To a lesser extent, stock selection in the health care and industrials sectors aided results relative to the benchmark. |
Stock selection detracted from the Fund’s investment results, but sector weights modestly contributed
Our IT holdings with earnings growth tied to capital spending projects tended to lag the broader sector. Large capital expenditures have been postponed, but we believe that spending cannot be delayed much longer. In addition, holdings such as Citrix Systems Incorporated, Teradata Corporation, and NetApp Incorporated faced headwinds toward the end of the period due to cutbacks in government spending. However, we anticipate stock price improvement as government spending normalizes and internal catalysts spur future growth.
| Ten largest equity holdings8 (%) as of December 31, 2013 | ||||
Agilent Technologies Incorporated | 1.86 | |||
Global Payments Incorporated | 1.83 | |||
Harman International Industries Incorporated | 1.77 | |||
Check Point Software Technologies Limited | 1.69 | |||
Red Hat Incorporated | 1.65 | |||
Praxair Incorporated | 1.65 | |||
American Tower Corporation | 1.65 | |||
B/E Aerospace Incorporated | 1.59 | |||
ACE Limited | 1.59 | |||
PNC Financial Services Group Incorporated | 1.54 | |||
The energy sector comprised only 9% of portfolio assets but was a notable detractor as firms worked through business model transitions. For example, Newfield Exploration Company has been challenged as it repositions its portfolio from an emphasis on gas to an increase in exposure to oil. The slow transition has been disappointing, and we are reevaluating our long-term assessment of the company. The Fund’s investment in Peabody Energy Corporation declined 34% during 2013 as slower growth in China reduced demand for coal. As a result, the position was sold.
Looking ahead, we remain positive on parts of the energy sector, including well-positioned, deep water equipment companies such as holding McDermott International Incorporated, which stands to benefit as economic growth helps boost overall energy demand.
An overweight in the consumer discretionary sector aided overall results. Retail holdings such as Macy’s Incorporated (up 40%), benefited from improving consumer confidence readings. Whirlpool Corporation was another bright spot in the consumer discretionary space, returning 57% as a nascent recovery in the housing market spurred appliance sales.
Select health care holdings, particularly those in areas related to the emerging trends of life sciences, biopharmaceuticals, and health care equipment aided results. In the industrials sector, steady yet modest economic growth supported a number of our holdings. Hertz Global Holdings Incorporated returned 76% in 2013 as the market continued to recognize the company’s growing business of renting equipment for new construction. Many firms liquidated their equipment inventories during the last economic downturn and are not yet ready to commit long-term capital for repurchases. Airlines also performed well, with Fund holdings Delta Air Lines Incorporated and United Continental Holdings Incorporated rallying because enhanced efficiencies and industry consolidation led to greater profitability for both companies.
Our methodology of buying stocks that are selling at a discount to their private market prices (PMPs) and selling stocks that approach their PMPs continues.
The PMP is the price we believe that a private investor would be willing to pay for the entire company. Our discipline allows us to be patient with stocks that are out of favor with the market. When we entered 2013, we believed that we would see an improving economic environment and that the market would appreciate individual companies that could grow revenues and improve earnings. That scenario played out largely as we had hoped it would.
Please see footnotes on page 5.
Table of Contents
| Performance highlights (unaudited) | Wells Fargo Advantage VT Opportunity Fund | 7 |
| Sector distribution9 as of December 31, 2013 | ||
 | ||
Uncertainty remains, but we believe that opportunities remain as well.
Looking ahead, we remain cautiously optimistic. We look forward to 2014 with the knowledge that the Fund’s holdings contain companies with attractive balance sheets, solid earnings, improved cost structures, and solid PMPs. Last year, 2013, was the first year in the past seven years in which the economy was not threatened by imminent financial contagion, and stock markets responded positively. We continue to look for well-positioned companies with solid business models, strong management teams, and favorable trends that trade at attractive discounts to our estimated PMP discipline.
Market volatility was relatively low at the end of the year but could rise at any time, given the general increase in market prices. Nevertheless, we believe that the Fund’s holdings are attractively valued, and if earnings results continue their positive growth trend, the Fund should benefit. Based on our 2014 assessment of PMPs for the companies we own, we believe that the Fund is well positioned.
Please see footnotes on page 5.
Table of Contents
| 8 | Wells Fargo Advantage VT Opportunity Fund | Fund expenses (unaudited) |
As a shareholder of the Fund, you incur ongoing costs, including management fees, distribution (12b-1) fees, and other Fund expenses. This example is intended to help you understand your ongoing costs (in dollars) of investing in the Fund and to compare these costs with the ongoing costs of investing in other mutual funds.
The example is based on an investment of $1,000 invested at the beginning of the six-month period and held for the entire period from July 1, 2013 to December 31, 2013.
Actual expenses
The “Actual” line of the table below provides information about actual account values and actual expenses. You may use the information in this line, together with the amount you invested, to estimate the expenses that you paid over the period. Simply divide your account value by $1,000 (for example, an $8,600 account value divided by $1,000 = 8.6), then multiply the result by the number in the “Actual” line under the heading entitled “Expenses Paid During Period” for your applicable class of shares to estimate the expenses you paid on your account during this period.
Hypothetical example for comparison purposes
The “Hypothetical” line of the table below provides information about hypothetical account values and hypothetical expenses based on the Fund’s actual expense ratio and an assumed rate of return of 5% per year before expenses, which is not the Fund’s actual return. The hypothetical account values and expenses may not be used to estimate the actual ending account balance or expenses you paid for the period. You may use this information to compare the ongoing costs of investing in the Fund and other funds. To do so, compare this 5% hypothetical example with the 5% hypothetical examples that appear in the shareholder reports of the other funds.
Please note that the expenses shown in the table are meant to highlight your ongoing costs only and do not reflect any separate account charges assessed by participating insurance companies. Therefore, the “Hypothetical” line of the table is useful in comparing ongoing costs only, and will not help you determine the relative total costs of owning different funds. In addition, if these separate account charges assessed by participating insurance companies were included, your costs would have been higher.
| Beginning account value 7-1-2013 | Ending account value 12-31-2013 | Expenses paid during the period1 | Net annual expense ratio | |||||||||||||
Class 1 | ||||||||||||||||
Actual | $ | 1,000.00 | $ | 1,162.95 | $ | 4.09 | 0.75 | % | ||||||||
Hypothetical (5% return before expenses) | $ | 1,000.00 | $ | 1,021.42 | $ | 3.82 | 0.75 | % | ||||||||
Class 2 | ||||||||||||||||
Actual | $ | 1,000.00 | $ | 1,161.39 | $ | 5.45 | 1.00 | % | ||||||||
Hypothetical (5% return before expenses) | $ | 1,000.00 | $ | 1,020.16 | $ | 5.09 | 1.00 | % | ||||||||
| 1. | Expenses paid is equal to the annualized expense ratio of each class multiplied by the average account value over the period, multiplied by the number of days in the most recent fiscal half-year divided by the number of days in the fiscal year (to reflect the one-half year period). |
Table of Contents
| Portfolio of investments—December 31, 2013 | Wells Fargo Advantage VT Opportunity Fund | 9 |
| Security name | Shares | Value | ||||||||||
Common Stocks: 96.81% | ||||||||||||
Consumer Discretionary: 21.01% | ||||||||||||
| Auto Components: 1.45% | ||||||||||||
Johnson Controls Incorporated | 72,202 | $ | 3,703,963 | |||||||||
|
| |||||||||||
| Diversified Consumer Services: 1.49% | ||||||||||||
Bridgepoint Education Incorporated Ǡ | 34,944 | 618,858 | ||||||||||
K12 Incorporated † | 146,171 | 3,179,219 | ||||||||||
| 3,798,077 | ||||||||||||
|
| |||||||||||
| Hotels, Restaurants & Leisure: 1.43% | ||||||||||||
Carnival Corporation | 91,001 | 3,655,510 | ||||||||||
|
| |||||||||||
| Household Durables: 2.92% | ||||||||||||
Harman International Industries Incorporated | 55,210 | 4,518,939 | ||||||||||
Whirlpool Corporation | 18,850 | 2,956,811 | ||||||||||
| 7,475,750 | ||||||||||||
|
| |||||||||||
| Media: 4.59% | ||||||||||||
Cablevision Systems Corporation New York Group Class A | 55,042 | 986,903 | ||||||||||
Comcast Corporation Class A | 47,764 | 2,382,468 | ||||||||||
Discovery Communications Incorporated † | 30,986 | 2,598,486 | ||||||||||
Liberty Global plc Class A † | 30,080 | 2,676,819 | ||||||||||
Omnicom Group Incorporated | 41,538 | 3,089,181 | ||||||||||
| 11,733,857 | ||||||||||||
|
| |||||||||||
| Multiline Retail: 4.80% | ||||||||||||
Dollar General Corporation † | 35,843 | 2,162,050 | ||||||||||
Kohl’s Corporation | 56,124 | 3,185,037 | ||||||||||
Macy’s Incorporated | 63,555 | 3,393,837 | ||||||||||
Nordstrom Incorporated | 57,274 | 3,539,533 | ||||||||||
| 12,280,457 | ||||||||||||
|
| |||||||||||
| Specialty Retail: 3.78% | ||||||||||||
CarMax Incorporated † | 40,874 | 1,921,895 | ||||||||||
Chico’s FAS Incorporated | 106,984 | 2,015,579 | ||||||||||
Dick’s Sporting Goods Incorporated | 65,549 | 3,808,397 | ||||||||||
Express Incorporated † | 102,266 | 1,909,306 | ||||||||||
| 9,655,177 | ||||||||||||
|
| |||||||||||
| Textiles, Apparel & Luxury Goods: 0.55% | ||||||||||||
Coach Incorporated | 25,223 | 1,415,767 | ||||||||||
|
| |||||||||||
Consumer Staples: 4.23% | ||||||||||||
| Food & Staples Retailing: 1.03% | ||||||||||||
The Kroger Company | 66,716 | 2,637,283 | ||||||||||
|
| |||||||||||
| Food Products: 2.27% | ||||||||||||
General Mills Incorporated | 54,664 | 2,728,280 | ||||||||||
Mead Johnson Nutrition Company | 36,599 | 3,065,532 | ||||||||||
| 5,793,812 | ||||||||||||
|
| |||||||||||
The accompanying notes are an integral part of these financial statements.
Table of Contents
| 10 | Wells Fargo Advantage VT Opportunity Fund | Portfolio of investments—December 31, 2013 |
| Security name | Shares | Value | ||||||||||
| Household Products: 0.93% | ||||||||||||
Church & Dwight Company Incorporated | 35,989 | $ | 2,385,351 | |||||||||
|
| |||||||||||
Energy: 8.52% | ||||||||||||
| Energy Equipment & Services: 4.84% | ||||||||||||
McDermott International Incorporated † | 361,935 | 3,315,325 | ||||||||||
National Oilwell Varco Incorporated | 44,111 | 3,508,148 | ||||||||||
Superior Energy Services Incorporated † | 112,027 | 2,981,038 | ||||||||||
Weatherford International Limited † | 166,556 | 2,579,952 | ||||||||||
| 12,384,463 | ||||||||||||
|
| |||||||||||
| Oil, Gas & Consumable Fuels: 3.68% | ||||||||||||
Denbury Resources Incorporated † | 202,736 | 3,330,952 | ||||||||||
Newfield Exploration Company † | 108,019 | 2,660,508 | ||||||||||
Range Resources Corporation | 40,485 | 3,413,290 | ||||||||||
| 9,404,750 | ||||||||||||
|
| |||||||||||
Financials: 13.22% | ||||||||||||
| Capital Markets: 2.66% | ||||||||||||
Invesco Limited | 93,409 | 3,400,088 | ||||||||||
TD Ameritrade Holding Corporation | 110,836 | 3,396,015 | ||||||||||
| 6,796,103 | ||||||||||||
|
| |||||||||||
| Commercial Banks: 3.72% | ||||||||||||
Branch Banking & Trust Corporation | 55,889 | 2,085,777 | ||||||||||
Fifth Third Bancorp | 165,577 | 3,482,084 | ||||||||||
PNC Financial Services Group Incorporated | 50,837 | 3,943,934 | ||||||||||
| 9,511,795 | ||||||||||||
|
| |||||||||||
| Diversified Financial Services: 1.33% | ||||||||||||
IntercontinentalExchange Group Incorporated | 15,192 | 3,416,985 | ||||||||||
|
| |||||||||||
| Insurance: 3.86% | ||||||||||||
ACE Limited | 39,371 | 4,076,080 | ||||||||||
American International Group Incorporated | 64,013 | 3,267,864 | ||||||||||
RenaissanceRe Holdings Limited | 26,017 | 2,532,495 | ||||||||||
| 9,876,439 | ||||||||||||
|
| |||||||||||
| REITs: 1.65% | ||||||||||||
American Tower Corporation | 52,744 | 4,210,026 | ||||||||||
|
| |||||||||||
Health Care: 11.05% | ||||||||||||
| Health Care Equipment & Supplies: 3.57% | ||||||||||||
C.R. Bard Incorporated | 21,445 | 2,872,343 | ||||||||||
Covidien plc | 46,517 | 3,167,808 | ||||||||||
Zimmer Holdings Incorporated | 33,309 | 3,104,066 | ||||||||||
| 9,144,217 | ||||||||||||
|
| |||||||||||
The accompanying notes are an integral part of these financial statements.
Table of Contents
| Portfolio of investments—December 31, 2013 | Wells Fargo Advantage VT Opportunity Fund | 11 |
| Security name | Shares | Value | ||||||||||
| Health Care Providers & Services: 0.65% | ||||||||||||
Patterson Companies Incorporated | 40,218 | $ | 1,656,982 | |||||||||
|
| |||||||||||
| Life Sciences Tools & Services: 5.44% | ||||||||||||
Agilent Technologies Incorporated | 83,110 | 4,753,061 | ||||||||||
Covance Incorporated † | 34,480 | 3,036,309 | ||||||||||
Thermo Fisher Scientific Incorporated | 32,805 | 3,652,837 | ||||||||||
Waters Corporation † | 24,629 | 2,462,900 | ||||||||||
| 13,905,107 | ||||||||||||
|
| |||||||||||
| Pharmaceuticals: 1.39% | ||||||||||||
Shire plc ADR | 25,149 | 3,553,302 | ||||||||||
|
| |||||||||||
Industrials: 12.00% | ||||||||||||
| Aerospace & Defense: 1.60% | ||||||||||||
B/E Aerospace Incorporated † | 46,846 | 4,077,007 | ||||||||||
|
| |||||||||||
| Airlines: 1.72% | ||||||||||||
Delta Air Lines Incorporated | 87,293 | 2,397,939 | ||||||||||
United Continental Holdings Incorporated † | 52,495 | 1,985,886 | ||||||||||
| 4,383,825 | ||||||||||||
|
| |||||||||||
| Commercial Services & Supplies: 1.38% | ||||||||||||
Republic Services Incorporated | 106,457 | 3,534,372 | ||||||||||
|
| |||||||||||
| Electrical Equipment: 3.11% | ||||||||||||
AMETEK Incorporated | 36,252 | 1,909,393 | ||||||||||
Babcock & Wilcox Company | 111,947 | 3,827,468 | ||||||||||
Regal-Beloit Corporation | 30,015 | 2,212,706 | ||||||||||
| 7,949,567 | ||||||||||||
|
| |||||||||||
| Machinery: 1.06% | ||||||||||||
Joy Global Incorporated « | 46,410 | 2,714,521 | ||||||||||
|
| |||||||||||
| Road & Rail: 3.13% | ||||||||||||
Canadian Pacific Railway Limited « | 9,965 | 1,507,904 | ||||||||||
Hertz Global Holdings Incorporated † | 130,343 | 3,730,417 | ||||||||||
J.B. Hunt Transport Services Incorporated | 35,913 | 2,776,075 | ||||||||||
| 8,014,396 | ||||||||||||
|
| |||||||||||
Information Technology: 19.43% | ||||||||||||
| Communications Equipment: 1.49% | ||||||||||||
Riverbed Technology Incorporated † | 211,351 | 3,821,226 | ||||||||||
|
| |||||||||||
| Computers & Peripherals: 1.44% | ||||||||||||
NetApp Incorporated | 89,653 | 3,688,324 | ||||||||||
|
| |||||||||||
| Electronic Equipment, Instruments & Components: 1.29% | ||||||||||||
Amphenol Corporation Class A | 36,994 | 3,299,125 | ||||||||||
|
| |||||||||||
The accompanying notes are an integral part of these financial statements.
Table of Contents
| 12 | Wells Fargo Advantage VT Opportunity Fund | Portfolio of investments—December 31, 2013 |
| Security name | Shares | Value | ||||||||||||
| IT Services: 3.88% | ||||||||||||||
Alliance Data Systems Corporation † | 6,318 | $ | 1,661,192 | |||||||||||
Global Payments Incorporated | 72,139 | 4,688,314 | ||||||||||||
Teradata Corporation † | 78,228 | 3,558,592 | ||||||||||||
| 9,908,098 | ||||||||||||||
|
| |||||||||||||
| Semiconductors & Semiconductor Equipment: 5.24% | ||||||||||||||
Altera Corporation | 109,053 | 3,547,494 | ||||||||||||
ARM Holdings plc | 131,320 | 2,389,878 | ||||||||||||
Avago Technologies Limited | 67,477 | 3,568,859 | ||||||||||||
ON Semiconductor Corporation † | 473,836 | 3,904,409 | ||||||||||||
| 13,410,640 | ||||||||||||||
|
| |||||||||||||
| Software: 6.09% | ||||||||||||||
Autodesk Incorporated † | 61,176 | 3,078,988 | ||||||||||||
Check Point Software Technologies Limited † | 67,068 | 4,327,227 | ||||||||||||
Citrix Systems Incorporated † | 62,340 | 3,943,005 | ||||||||||||
Red Hat Incorporated † | 75,175 | 4,212,807 | ||||||||||||
| 15,562,027 | ||||||||||||||
|
| |||||||||||||
Materials: 7.35% | ||||||||||||||
| Chemicals: 2.91% | ||||||||||||||
Cytec Industries Incorporated | 26,542 | 2,472,653 | ||||||||||||
Huntsman Corporation | 30,924 | 760,730 | ||||||||||||
Praxair Incorporated | 32,384 | 4,210,892 | ||||||||||||
| 7,444,275 | ||||||||||||||
|
| |||||||||||||
| Containers & Packaging: 3.56% | ||||||||||||||
Bemis Company Incorporated | 62,784 | 2,571,633 | ||||||||||||
Crown Holdings Incorporated † | 68,278 | 3,043,150 | ||||||||||||
Owens-Illinois Incorporated † | 97,145 | 3,475,848 | ||||||||||||
| 9,090,631 | ||||||||||||||
|
| |||||||||||||
| Metals & Mining: 0.88% | ||||||||||||||
Royal Gold Incorporated | 49,054 | 2,259,917 | ||||||||||||
|
| |||||||||||||
Total Common Stocks (Cost $178,529,936) | 247,553,124 | |||||||||||||
|
| |||||||||||||
| Yield | ||||||||||||||
| Short-Term Investments: 4.88% | ||||||||||||||
| Investment Companies: 4.88% | ||||||||||||||
Wells Fargo Advantage Cash Investment Money Market Fund, Select Class (l)(u) | 0.06 | % | 7,907,270 | 7,907,270 | ||||||||||
Wells Fargo Securities Lending Cash Investments, LLC (l)(r)(u)(v) | 0.08 | 4,566,423 | 4,566,423 | |||||||||||
Total Short-Term Investments (Cost $12,473,693) | 12,473,693 | |||||||||||||
|
| |||||||||||||
| Total investments in securities | ||||||||
| (Cost $191,003,629)* | 101.69 | % | 260,026,817 | |||||
Other assets and liabilities, net | (1.69 | ) | (4,313,835 | ) | ||||
|
|
|
| |||||
| Total net assets | 100.00 | % | $ | 255,712,982 | ||||
|
|
|
|
The accompanying notes are an integral part of these financial statements.
Table of Contents
| Portfolio of investments—December 31, 2013 | Wells Fargo Advantage VT Opportunity Fund | 13 |
| « | All or a portion of this security is on loan. |
| † | Non-income-earning security |
| (l) | Investment in an affiliate |
| (u) | Rate shown is the 7-day annualized yield at period end. |
| (r) | The investment company is exempt from registration under Section 3(c)(7) of the Investment Company Act of 1940, as amended. |
| (v) | Security represents investment of cash collateral received from securities on loan. |
| * | Cost for federal income tax purposes is $191,881,842 and unrealized appreciation (depreciation) consists of: |
Gross unrealized appreciation | $ | 70,445,355 | ||
Gross unrealized depreciation | (2,300,380 | ) | ||
|
| |||
Net unrealized appreciation | $ | 68,144,975 |
The accompanying notes are an integral part of these financial statements.
Table of Contents
| 14 | Wells Fargo Advantage VT Opportunity Fund | Statement of assets and liabilities—December 31, 2013 |
Assets | ||||
Investments | ||||
In unaffiliated securities (including securities on loan), at value (see cost below) | $ | 247,553,124 | ||
In affiliated securities, at value (see cost below) | 12,473,693 | |||
|
| |||
Total investments, at value (see cost below) | 260,026,817 | |||
Receivable for investments sold | 581,813 | |||
Receivable for Fund shares sold | 32,805 | |||
Receivable for dividends | 179,517 | |||
Receivable for securities lending income | 685 | |||
Prepaid expenses and other assets | 1,497 | |||
|
| |||
Total assets | 260,823,134 | |||
|
| |||
Liabilities | ||||
Payable for Fund shares redeemed | 250,109 | |||
Payable upon receipt of securities loaned | 4,566,423 | |||
Advisory fee payable | 123,643 | |||
Distribution fees payable | 45,241 | |||
Due to other related parties | 28,510 | |||
Accrued expenses and other liabilities | 96,226 | |||
|
| |||
Total liabilities | 5,110,152 | |||
|
| |||
Total net assets | $ | 255,712,982 | ||
|
| |||
NET ASSETS CONSIST OF | ||||
Paid-in capital | $ | 200,292,887 | ||
Undistributed net investment income | 181,809 | |||
Accumulated net realized losses on investments | �� | (13,784,901 | ) | |
Net unrealized gains on investments | 69,023,187 | |||
|
| |||
Total net assets | $ | 255,712,982 | ||
|
| |||
COMPUTATION OF NET ASSET VALUE PER SHARE1 | ||||
Net assets – Class 1 | $ | 44,636,207 | ||
Shares outstanding – Class 1 | 1,709,738 | |||
Net asset value per share – Class 1 | $26.11 | |||
Net assets – Class 2 | $ | 211,076,775 | ||
Shares outstanding – Class 2 | 8,071,895 | |||
Net asset value per share – Class 2 | $26.15 | |||
Investments in unaffiliated securities (including securities on loan), at cost | $ | 178,529,936 | ||
|
| |||
Investments in affiliated securities, at cost | $ | 12,473,693 | ||
|
| |||
Total investments, at cost | $ | 191,003,629 | ||
|
| |||
Securities on loan, at value | $ | 4,493,583 | ||
|
| |||
| 1. | The Fund has an unlimited number of authorized shares. |
The accompanying notes are an integral part of these financial statements.
Table of Contents
| Statement of operations—year ended December 31, 2013 | Wells Fargo Advantage VT Opportunity Fund | 15 |
Investment income | ||||
Dividends * | $ | 2,564,571 | ||
Securities lending income, net | 30,999 | |||
Income from affiliated securities | 12,858 | |||
|
| |||
Total investment income | 2,608,428 | |||
|
| |||
Expenses | ||||
Advisory fee | 1,583,167 | |||
Administration fees | ||||
Fund level | 121,782 | |||
Class 1 | 34,350 | |||
Class 2 | 160,501 | |||
Distribution fees | ||||
Class 2 | 501,566 | |||
Custody and accounting fees | 22,281 | |||
Professional fees | 46,574 | |||
Shareholder report expenses | 52,678 | |||
Trustees’ fees and expenses | 15,050 | |||
Other fees and expenses | 6,391 | |||
|
| |||
Total expenses | 2,544,340 | |||
Less: Fee waivers and/or expense reimbursements | (216,044 | ) | ||
|
| |||
Net expenses | 2,328,296 | |||
|
| |||
Net investment income | 280,132 | |||
|
| |||
REALIZED AND UNREALIZED GAINS (LOSSES) ON INVESTMENTS | ||||
Net realized gains on investments | 18,919,587 | |||
Net change in unrealized gains (losses) on investments | 45,915,119 | |||
|
| |||
Net realized and unrealized gains (losses) on investments | 64,834,706 | |||
|
| |||
Net increase in net assets resulting from operations | $ | 65,114,838 | ||
|
| |||
* Net of foreign dividend withholding taxes in the amount of | $8,710 | |||
The accompanying notes are an integral part of these financial statements.
Table of Contents
| 16 | Wells Fargo Advantage VT Opportunity Fund | Statement of changes in net assets |
| Year ended December 31, 2013 | Year ended December 31, 2012 | |||||||||||||||
Operations | ||||||||||||||||
Net investment income | $ | 280,132 | $ | 612,874 | ||||||||||||
Net realized gains on investments | 18,919,587 | 23,332,288 | ||||||||||||||
Net change in unrealized gains (losses) on investments | 45,915,119 | 10,878,070 | ||||||||||||||
|
|
|
|
|
|
|
| |||||||||
Net increase in net assets resulting from operations | 65,114,838 | 34,823,232 | ||||||||||||||
|
|
|
|
|
|
|
| |||||||||
Distributions to shareholders from | ||||||||||||||||
Net investment income | ||||||||||||||||
Class 1 | (190,708 | ) | (242,059 | ) | ||||||||||||
Class 2 | (396,735 | ) | (185,335 | ) | ||||||||||||
Net realized gains | ||||||||||||||||
Class 1 | 0 | (14,605 | ) | |||||||||||||
Class 2 | 0 | (67,973 | ) | |||||||||||||
|
|
|
|
|
|
|
| |||||||||
Total distributions to shareholders | (587,443 | ) | (509,972 | ) | ||||||||||||
|
|
|
|
|
|
|
| |||||||||
Capital share transactions | Shares | Shares | ||||||||||||||
Proceeds from shares sold | ||||||||||||||||
Class 1 | 29,750 | 698,335 | 47,802 | 900,770 | ||||||||||||
Class 2 | 306,606 | 6,934,870 | 360,780 | 6,908,697 | ||||||||||||
|
|
|
|
|
|
|
| |||||||||
| 7,633,205 | 7,809,467 | |||||||||||||||
|
|
|
|
|
|
|
| |||||||||
Reinvestment of distributions | ||||||||||||||||
Class 1 | 8,108 | 190,708 | 13,970 | 256,664 | ||||||||||||
Class 2 | 16,818 | 396,735 | 14,191 | 253,308 | ||||||||||||
|
|
|
|
|
|
|
| |||||||||
| 587,443 | 509,972 | |||||||||||||||
|
|
|
|
|
|
|
| |||||||||
Payment for shares redeemed | ||||||||||||||||
Class 1 | (373,971 | ) | (8,585,638 | ) | (436,470 | ) | (8,299,876 | ) | ||||||||
Class 2 | (1,643,579 | ) | (37,712,206 | ) | (2,575,878 | ) | (48,721,763 | ) | ||||||||
|
|
|
|
|
|
|
| |||||||||
| (46,297,844 | ) | (57,021,639 | ) | |||||||||||||
|
|
|
|
|
|
|
| |||||||||
Net decrease in net assets resulting from capital share transactions | (38,077,196 | ) | (48,702,200 | ) | ||||||||||||
|
|
|
|
|
|
|
| |||||||||
Total increase (decrease) in net assets | 26,450,199 | (14,388,940 | ) | |||||||||||||
|
|
|
|
|
|
|
| |||||||||
Net assets | ||||||||||||||||
Beginning of period | 229,262,783 | 243,651,723 | ||||||||||||||
|
|
|
|
|
|
|
| |||||||||
End of period | $ | 255,712,982 | $ | 229,262,783 | ||||||||||||
|
|
|
|
|
|
|
| |||||||||
Undistributed net investment income | $ | 181,809 | $ | 525,265 | ||||||||||||
|
|
|
|
|
|
|
| |||||||||
The accompanying notes are an integral part of these financial statements.
Table of Contents
| Financial highlights | Wells Fargo Advantage VT Opportunity Fund | 17 |
(For a share outstanding throughout each period)
| Year ended December 31 | ||||||||||||
| CLASS 1 | 2013 | 2012 | 20111 | |||||||||
Net asset value, beginning of period | $ | 20.02 | $ | 17.40 | $ | 16.52 | ||||||
Net investment income | 0.08 | 0.10 | 0.04 | |||||||||
Net realized and unrealized gains (losses) on investments | 6.11 | 2.64 | 0.84 | |||||||||
|
|
|
|
|
| |||||||
Total from investment operations | 6.19 | 2.74 | 0.88 | |||||||||
Distributions to shareholders from | ||||||||||||
Net investment income | (0.10 | ) | (0.11 | ) | 0.00 | |||||||
Net realized gains | 0.00 | (0.01 | ) | 0.00 | ||||||||
|
|
|
|
|
| |||||||
Total distributions to shareholders | (0.10 | ) | (0.12 | ) | 0.00 | |||||||
Net asset value, end of period | $ | 26.11 | $ | 20.02 | $ | 17.40 | ||||||
Total return2 | 30.99 | % | 15.80 | % | 5.33 | % | ||||||
Ratios to average net assets (annualized) | ||||||||||||
Gross expenses | 0.84 | % | 0.86 | % | 0.83 | % | ||||||
Net expenses | 0.75 | % | 0.75 | % | 0.75 | % | ||||||
Net investment income | 0.32 | % | 0.46 | % | 0.61 | % | ||||||
Supplemental data | ||||||||||||
Portfolio turnover rate | 26 | % | 36 | % | 35 | % | ||||||
Net assets, end of period (000s omitted) | $44,636 | $40,950 | $42,116 | |||||||||
| 1. | For the period from August 26, 2011 (commencement of class operations) to December 31, 2011 |
| 2. | Returns for periods of less than one year are not annualized. |
The accompanying notes are an integral part of these financial statements.
Table of Contents
| 18 | Wells Fargo Advantage VT Opportunity Fund | Financial highlights |
(For a share outstanding throughout each period)
| Year ended December 31 | ||||||||||||||||||||
| CLASS 2 | 2013 | 2012 | 2011 | 20101 | 2009 | |||||||||||||||
Net asset value, beginning of period | $ | 20.05 | $ | 17.38 | $ | 18.42 | $ | 15.01 | $ | 10.16 | ||||||||||
Net investment income | 0.02 | 0.05 | 0.03 | 0.02 | 0.11 | |||||||||||||||
Net realized and unrealized gains (losses) on investments | 6.13 | 2.65 | (1.04 | ) | 3.51 | 4.74 | ||||||||||||||
|
|
|
|
|
|
|
|
|
| |||||||||||
Total from investment operations | 6.15 | 2.70 | (1.01 | ) | 3.53 | 4.85 | ||||||||||||||
Distributions to shareholders from | ||||||||||||||||||||
Net investment income | (0.05 | ) | (0.02 | ) | (0.03 | ) | (0.12 | ) | 0.00 | |||||||||||
Net realized gains | 0.00 | (0.01 | ) | 0.00 | 0.00 | 0.00 | ||||||||||||||
|
|
|
|
|
|
|
|
|
| |||||||||||
Total distributions to shareholders | (0.05 | ) | (0.03 | ) | (0.03 | ) | (0.12 | ) | 0.00 | |||||||||||
Net asset value, end of period | $ | 26.15 | $ | 20.05 | $ | 17.38 | $ | 18.42 | $ | 15.01 | ||||||||||
Total return | 30.68 | % | 15.52 | % | (5.52 | )% | 23.76 | % | 47.74 | % | ||||||||||
Ratios to average net assets (annualized) | ||||||||||||||||||||
Gross expenses | 1.09 | % | 1.10 | % | 1.07 | % | 1.18 | % | 1.32 | % | ||||||||||
Net expenses | 1.00 | % | 1.00 | % | 1.04 | % | 1.07 | % | 1.07 | % | ||||||||||
Net investment income | 0.07 | % | 0.21 | % | 0.18 | % | 0.08 | % | 0.39 | % | ||||||||||
Supplemental data | ||||||||||||||||||||
Portfolio turnover rate | 26 | % | 36 | % | 35 | % | 40 | % | 50 | % | ||||||||||
Net assets, end of period (000s omitted) | $211,077 | $188,313 | $201,535 | $168,307 | $154,782 | |||||||||||||||
| 1. | After the close of business on July 16, 2010, existing shares of the Fund were renamed Class 2 shares. |
The accompanying notes are an integral part of these financial statements.
Table of Contents
| Notes to financial statements | Wells Fargo Advantage VT Opportunity Fund | 19 |
1. ORGANIZATION
Wells Fargo Variable Trust (the “Trust”), a Delaware statutory trust organized on March 10, 1999, is an open-end management investment company registered under the Investment Company Act of 1940, as amended (the “1940 Act”). These financial statements report on the Wells Fargo Advantage VT Opportunity Fund (the “Fund”) which is a diversified series of the Trust.
2. SIGNIFICANT ACCOUNTING POLICIES
The following significant accounting policies, which are consistently followed in the preparation of the financial statements of the Fund, are in conformity with U.S. generally accepted accounting principles which require management to make estimates and assumptions that affect the reported amounts of assets and liabilities, disclosure of contingent assets and liabilities at the date of the financial statements, and the reported amounts of revenues and expenses during the reporting period. Actual results could differ from those estimates.
Securities valuation
All investments are valued each business day as of the close of regular trading on the New York Stock Exchange (generally 4 p.m. Eastern Time).
Equity securities that are listed on a foreign or domestic exchange or market are valued at the official closing price or, if none, the last sales price. If no sale occurs on the primary exchange or market for the security that day, the prior day’s price will be deemed “stale” and fair values will be determined in accordance with the Fund’s Valuation Procedures.
The values of securities denominated in foreign currencies will be converted to U.S. dollars at rates provided by an independent foreign currency pricing source at a time each business day specified by the Management Valuation Team of Wells Fargo Funds Management, LLC (“Funds Management”).
Many securities markets and exchanges outside the U.S. close prior to the close of the New York Stock Exchange and therefore may not fully reflect trading or events that occur after the close of the principal exchange in which the foreign securities are traded, but before the close of the New York Stock Exchange. If such trading or events are expected to materially affect the value of such securities, then fair value pricing procedures approved by the Board of Trustees of the Fund are applied. These procedures take into account multiple factors including movements in U.S. securities markets after foreign exchanges close. Foreign securities that are fair valued under these procedures are categorized as Level 2 and the application of these procedures may result in transfers between Level 1 and Level 2. Depending on market activity, such fair valuations may be frequent. Such fair value pricing may result in NAVs that are higher or lower than NAVs based on the last reported sales price or latest quoted bid price. On December 31, 2013, such fair value pricing was not used in pricing foreign securities.
Investments in registered open-end investment companies are valued at net asset value. Non-registered investment vehicles are fair valued at net asset value.
Investments which are not valued using any of the methods discussed above are valued at their fair value, as determined in good faith by the Board of Trustees. The Board of Trustees has established a Valuation Committee comprised of the Trustees and has delegated to it the authority to take any actions regarding the valuation of portfolio securities that the Valuation Committee deems necessary or appropriate, including determining the fair value of portfolio securities, unless the determination has been delegated to the Management Valuation Team. The Board of Trustees retains the authority to make or ratify any valuation decisions or approve any changes to the Valuation Procedures as it deems appropriate. On a quarterly basis, the Board of Trustees receives reports on any valuation actions taken by the Valuation Committee or the Management Valuation Team which may include items for ratification.
Valuations of fair valued securities are compared to the next actual sales price when available, or other appropriate market values, to assess the continued appropriateness of the fair valuation methodologies used. These securities are fair valued on a day-to-day basis, taking into consideration changes to appropriate market information and any significant changes to the inputs considered in the valuation process until there is a readily available price provided on an exchange or by an independent pricing service. Valuations received from an independent pricing service or independent broker-dealer quotes are periodically validated by comparisons to most recent trades and valuations provided by other independent pricing services in addition to the review of prices by the adviser and/or subadviser. Unobservable inputs used in determining fair valuations are identified based on the type of security, taking into consideration factors utilized by market participants in valuing the investment, knowledge about the issuer and the current market environment.
Foreign currency translation
The accounting records of the Fund are maintained in U.S. dollars. The values of other assets and liabilities denominated in foreign currencies will be converted to U.S. dollars at rates provided by an independent foreign currency pricing source
Table of Contents
| 20 | Wells Fargo Advantage VT Opportunity Fund | Notes to financial statements |
at a time each business day specified by the Management Valuation Team. Purchases and sales of securities, and income and expenses are converted at the rate of exchange on the respective dates of such transactions. Reported net realized foreign exchange gains or losses arise from sales of foreign currencies, currency gains or losses realized between the trade and settlement dates on securities transactions, and the difference between the amounts of dividends, interest and foreign withholding taxes recorded and the U.S. dollar equivalent of the amounts actually paid or received. Net unrealized foreign exchange gains and losses arise from changes in the fair value of assets and liabilities other than investments in securities resulting from changes in exchange rates.
The changes in net assets arising from changes in exchange rates and the changes in net assets resulting from changes in market prices of securities are not separately presented. Such changes are recorded with net realized and unrealized gains or losses from investments. Gains and losses from certain foreign currency transactions are treated as ordinary income for U.S. federal income tax purposes.
Security loans
The Fund may lend its securities from time to time in order to earn additional income in the form of fees or interest on securities received as collateral or the investment of any cash received as collateral. The Fund continues to receive interest or dividends on the securities loaned. The Fund receives collateral in the form of cash or securities with a value at least equal to the value of the securities on loan. The value of the loaned securities is determined at the close of each business day and any additional required collateral is delivered to the Fund on the next business day. In a securities lending transaction, the net asset value of the Fund will be affected by an increase or decrease in the value of the securities loaned and by an increase or decrease in the value of the instrument in which collateral is invested. The amount of securities lending activity undertaken by the Fund fluctuates from time to time. In the event of default or bankruptcy by the borrower, the Fund may be prevented from recovering the loaned securities or gaining access to the collateral or may experience delays or costs in doing so. In addition, the investment of any cash collateral received may lose all or part of its value. The Fund has the right under the lending agreement to recover the securities from the borrower on demand.
The Fund lends its securities through an unaffiliated securities lending agent. Cash collateral received in connection with its securities lending transactions is invested in Wells Fargo Securities Lending Cash Investments, LLC (the “Securities Lending Fund”). The Securities Lending Fund is exempt from registration under Section 3(c)(7) of the 1940 Act and is managed by Funds Management and is subadvised by Wells Capital Management Incorporated (“WellsCap”). Funds Management receives an advisory fee starting at 0.05% and declining to 0.01% as the average daily net assets of the Securities Lending Fund increase. All of the fees received by Funds Management are paid to WellsCap for its services as subadviser. The Securities Lending Fund seeks to provide a positive return compared to the daily Fed Funds Open rate by investing in high-quality, U.S. dollar-denominated short-term money market instruments. Securities Lending Fund investments are fair valued based upon the amortized cost valuation technique. Income earned from investment in the Securities Lending Fund is included in securities lending income on the Statement of Operations.
Security transactions and income recognition
Securities transactions are recorded on a trade date basis. Realized gains or losses are recorded on the basis of identified cost.
Dividend income is recognized on the ex-dividend date, except for certain dividends from foreign securities, which are recorded as soon as the Fund is informed of the ex-dividend date. Dividend income from foreign securities is recorded net of foreign taxes withheld where recovery of such taxes is not assured.
Distributions to shareholders
Distributions to shareholders from net investment income and net realized gains, if any, are recorded on the ex-dividend date. Such distributions are determined in conformity with federal income tax regulations, which may differ in amount or character from net investment income and realized gains recognized for purposes of U.S. generally accepted accounting principles.
Federal and other taxes
The Fund intends to continue to qualify as a regulated investment company by distributing substantially all of its investment company taxable income and any net realized capital gains (after reduction for capital loss carryforwards) sufficient to relieve it from all, or substantially all, federal income taxes. Accordingly, no provision for federal income taxes was required.
The Fund’s income and federal excise tax returns and all financial records supporting those returns for the prior three fiscal years are subject to examination by the federal and Delaware revenue authorities. Management has analyzed the Fund’s tax positions taken on federal, state, and foreign tax returns for all open tax years and does not believe that there are any uncertain tax positions that require recognition of a tax liability.
Reclassifications are made to the Fund’s capital accounts for permanent tax differences to reflect income and gains available for distribution (or available capital loss carryforwards) under federal income tax regulations. U.S. generally accepted accounting principles requires that certain components of net assets be adjusted to reflect permanent
Table of Contents
| Notes to financial statements | Wells Fargo Advantage VT Opportunity Fund | 21 |
differences between financial and tax reporting. These reclassifications have no effect on net assets or net asset values per share. At December 31, 2013, as a result of permanent book-to-tax differences, the following reclassification adjustments were made on the Statement of Assets and Liabilities:
| Undistributed net investment income | Accumulated net on investments | |
| $(36,145) | $36,145 |
At December 31, 2013, capital loss carryforwards available to offset future net realized capital gains were as follows through the indicated expiration dates:
| 2015 | 2016 | 2017 | ||
| $721,350 | $360,675 | $11,824,665 |
Class allocations
The separate classes of shares offered by the Fund differ principally in distribution fees. Shareholders of each class bear certain expenses that pertain to that particular class. All shareholders bear the common expenses of the Fund, earn income from the portfolio, and are allocated any unrealized gains and losses pro rata based on the average daily net assets of each class, without distinction between share classes. Dividends are determined separately for each class based on income and expenses allocable to each class. Realized gains and losses are allocated to each class pro rata based upon the net assets of each class on the date realized. Differences in per share dividend rates generally result from the relative weightings of pro rata income and realized gain allocations and from differences in separate class expenses, including distribution fees.
3. FAIR VALUATION MEASUREMENTS
Fair value measurements of investments are determined within a framework that has established a fair value hierarchy based upon the various data inputs utilized in determining the value of the Fund’s investments. The three-level hierarchy gives the highest priority to unadjusted quoted prices in active markets for identical assets or liabilities (Level 1) and the lowest priority to significant unobservable inputs (Level 3). The Fund’s investments are classified within the fair value hierarchy based on the lowest level of input that is significant to the fair value measurement. The inputs are summarized into three broad levels as follows:
| n | Level 1 – quoted prices in active markets for identical securities |
| n | Level 2 – other significant observable inputs (including quoted prices for similar securities, interest rates, prepayment speeds, credit risk, use of amortized cost, etc.) |
| n | Level 3 – significant unobservable inputs (including the Fund’s own assumptions in determining the fair value of investments) |
The inputs or methodologies used for valuing investments in securities are not necessarily an indication of the risk associated with investing in those securities.
As of December 31, 2013, the inputs used in valuing investments in securities were as follows:
| Investments in securities | Quoted prices (Level 1) | Other significant (Level 2) | Significant unobservable inputs (Level 3) | Total | ||||||||||||
Equity securities | ||||||||||||||||
Common stocks | $ | 247,553,124 | $ | 0 | $ | 0 | $ | 247,553,124 | ||||||||
Short-term investments | ||||||||||||||||
Investment companies | 7,907,270 | 4,566,423 | 0 | 12,473,693 | ||||||||||||
| $ | 255,460,394 | $ | 4,566,423 | $ | 0 | $ | 260,026,817 | |||||||||
Transfers in and transfers out are recognized at the end of the reporting period. For the year ended December 31, 2013, the Fund did not have any transfers into/out of Level 1, Level 2, or Level 3.
4. TRANSACTIONS WITH AFFILIATES AND OTHER EXPENSES
Advisory fee
The Trust has entered into an advisory contract with Funds Management, an indirect wholly owned subsidiary of Wells Fargo & Company (“Wells Fargo”). The adviser is responsible for implementing investment policies and guidelines and for supervising the subadviser, who is responsible for day-to-day portfolio management of the Fund.
Table of Contents
| 22 | Wells Fargo Advantage VT Opportunity Fund | Notes to financial statements |
Pursuant to the contract, Funds Management is entitled to receive an annual advisory fee starting at 0.65% and declining to 0.55% as the average daily net assets of the Fund increase. For the year ended December 31, 2013, the advisory fee was equivalent to an annual rate of 0.65% of the Fund’s average daily net assets.
Funds Management has retained the services of a subadviser to provide daily portfolio management to the Fund. The fee for subadvisory services is borne by Funds Management. WellsCap, an affiliate of Funds Management and an indirect, wholly owned subsidiary of Wells Fargo, is the subadviser to the Fund and is entitled to receive a fee from Funds Management at an annual rate starting at 0.45% and declining to 0.30% as the average daily net assets of the Fund increase.
Administration and transfer agent fees
The Trust has entered into an administration agreement with Funds Management. Under this agreement, for providing administrative services, which includes paying fees and expenses for services provided by the transfer agent, sub-transfer agents, omnibus account servicers and record-keepers, FundsManagement is entitled to receive from the Fund an annual fund level administration fee starting at 0.05% and declining to 0.03% as the average daily net assets of the Fund increase and a class level administration fee of 0.08% which is calculated based on the average daily net assets of each class.
Funds Management has contractually waived and/or reimbursed advisory and administration fees to the extent necessary to maintain certain net operating expense ratios for the Fund. Waiver of fees and/or reimbursement of expenses by Funds Management were made first from fund level expenses on a proportionate basis and then from class specific expenses. Funds Management has committed through April 30, 2014 to waive fees and/or reimburse expenses to the extent necessary to cap the Fund’s expenses at 0.75% for Class 1 shares and 1.00% for Class 2 shares.
Distribution fees
The Trust has adopted a Distribution Plan for Class 2 shares of the Fund pursuant to Rule 12b-1 under the 1940 Act. Distribution fees are charged to Class 2 shares and paid to Wells Fargo Funds Distributor, LLC, the principal underwriter, at an annual rate of 0.25% of the average daily net assets of Class 2 shares.
5. INVESTMENT PORTFOLIO TRANSACTIONS
Purchases and sales of investments, excluding U.S. government obligations (if any) and short-term securities, for the year ended December 31, 2013 were $59,023,872 and $92,807,302, respectively.
6. BANK BORROWINGS
The Trust and Wells Fargo Funds Trust (excluding the money market funds and certain other funds) are parties to a $150,000,000 revolving credit agreement with State Street Bank and Trust Company, whereby the Fund is permitted to use bank borrowings for temporary or emergency purposes, such as to fund shareholder redemption requests. Interest under the credit agreement is charged to the Fund based on a borrowing rate equal to the higher of the Federal Funds rate in effect on that day plus 1.25% or the overnight LIBOR rate in effect on that day plus 1.25%. In addition, an annual commitment fee equal to 0.10% of the unused balance is allocated to each participating fund. For the year ended December 31, 2013, the Fund paid $400 in commitment fees.
For the year ended December 31, 2013, there were no borrowings by the Fund under the agreement.
7. DISTRIBUTIONS TO SHAREHOLDERS
The tax character of distributions paid was $587,443 and $509,972 of ordinary income for the years ended December 31, 2013 and December 31, 2012, respectively.
As of December 31, 2013, the components of distributable earnings on a tax basis were as follows:
Undistributed ordinary income | Unrealized gains | Capital loss carryforward | ||
| $190,766 | $68,144,975 | $(12,906,690) |
8. INDEMNIFICATION
Under the Trust’s organizational documents, the officers and directors are indemnified against certain liabilities that may arise out of performance of their duties to the Trust. Additionally, in the normal course of business, the Trust may enter into contracts with service providers that contain a variety of indemnification clauses. The Trust’s maximum exposure under these arrangements is dependent on future claims that may be made against the Fund and, therefore, cannot be estimated.
Table of Contents
| Report of independent registered public accounting firm | Wells Fargo Advantage VT Opportunity Fund | 23 |
BOARD OF TRUSTEES AND SHAREHOLDERS OF WELLS FARGO VARIABLE TRUST:
We have audited the accompanying statement of assets and liabilities, including the portfolio of investments, of the Wells Fargo Advantage VT Opportunity Fund (the “Fund”), one of the funds constituting the Wells Fargo Variable Trust, as of December 31, 2013, and the related statement of operations for the year then ended, statements of changes in net assets for each of the years in the two-year period then ended, and the financial highlights for each of the years or periods in the five-year period then ended. These financial statements and financial highlights are the responsibility of the Fund’s management. Our responsibility is to express an opinion on these financial statements and financial highlights based on our audits.
We conducted our audits in accordance with the standards of the Public Company Accounting Oversight Board (United States). Those standards require that we plan and perform the audit to obtain reasonable assurance about whether the financial statements and financial highlights are free of material misstatement. An audit includes examining, on a test basis, evidence supporting the amounts and disclosures in the financial statements. Our procedures included confirmation of securities owned as of December 31, 2013, by correspondence with the custodian and brokers or by other appropriate auditing procedures. An audit also includes assessing the accounting principles used and significant estimates made by management, as well as evaluating the overall financial statement presentation. We believe that our audits provide a reasonable basis for our opinion.
In our opinion, the financial statements and financial highlights referred to above present fairly, in all material respects, the financial position of the Wells Fargo Advantage VT Opportunity Fund as of December 31, 2013, the results of its operations for the year then ended, the changes in its net assets for each of the years in the two-year period then ended, and the financial highlights for each of the years or periods in the five-year period then ended, in conformity with U.S. generally accepted accounting principles.

Boston, Massachusetts
February 27, 2014
Table of Contents
| 24 | Wells Fargo Advantage VT Opportunity Fund | Other information (unaudited) |
TAX INFORMATION
For corporate shareholders, pursuant to Section 854 of the Internal Revenue Code, 100% of ordinary income dividends qualify for the corporate dividends-received deduction for the fiscal year ended December 31, 2013.
PROXY VOTING INFORMATION
A description of the policies and procedures that the Fund uses to determine how to vote proxies relating to portfolio securities is available without charge, upon request, by calling 1-800-222-8222, visiting our website at wellsfargoadvantagefunds.com, or visiting the SEC website at sec.gov. Information regarding how the Fund voted proxies relating to portfolio securities during the most recent 12-month period ended June 30 is available without charge on the Fund’s website at wellsfargoadvantagefunds.com or by visiting the SEC website at sec.gov.
PORTFOLIO HOLDINGS INFORMATION
The complete portfolio holdings for the Fund are publicly available on the Fund’s website (wellsfargoadvantagefunds.com) on a monthly, 30-day or more delayed basis. In addition, top ten holdings information for the Fund is publicly available on the Fund’s website on a monthly, seven-day or more delayed basis. The Fund files its complete schedule of portfolio holdings with the SEC for the first and third quarters of each fiscal year on Form N-Q, which is available without charge by visiting the SEC website at sec.gov. In addition, the Fund’s Form N-Q may be reviewed and copied at the SEC’s Public Reference Room in Washington, DC, and at regional offices in New York City, at 233 Broadway, and in Chicago, at 175 West Jackson Boulevard, Suite 900. Information about the Public Reference Room may be obtained by calling 1-800-SEC-0330.
Table of Contents
| Other information (unaudited) | Wells Fargo Advantage VT Opportunity Fund | 25 |
BOARD OF TRUSTEES AND OFFICERS
Each of the Trustees and Officers listed in the table below acts in identical capacities for each fund in the Wells Fargo Advantage family of funds, which consists of 132 mutual funds1 comprising the Wells Fargo Funds Trust, Wells Fargo Variable Trust, Wells Fargo Master Trust and four closed-end funds (collectively the “Fund Complex”). This table should be read in conjunction with the Prospectus and the Statement of Additional Information2. All of the Trustees are also Members of the Audit and Governance Committees of each Trust in the Fund Complex. The mailing address of each Trustee and Officer is 525 Market Street, 12th Floor, San Francisco, CA 94105. Each Trustee and Officer serves an indefinite term, however, each Trustee serves such term until reaching the mandatory retirement age established by the Trustees.
Independent Trustees
| Name and year of birth | Position held and length of service* | Principal occupations during past five years | Other directorships during past five years | |||
| Peter G. Gordon (Born 1942) | Trustee, since 1998; Chairman, since 2005 | Co-Founder, Retired Chairman, President and CEO of Crystal Geyser Water Company. Trustee Emeritus, Colby College. | Asset Allocation Trust | |||
| Isaiah Harris, Jr. (Born 1952) | Trustee, since 2009 | Retired. Prior thereto, President and CEO of BellSouth Advertising and Publishing Corp. from 2005 to 2007, President and CEO of BellSouth Enterprises from 2004 to 2005 and President of BellSouth Consumer Services from 2000 to 2003. Emeritus member of the Iowa State University Foundation Board of Governors. Emeritus Member of the Advisory Board of Iowa State University School of Business. Advisory Board Member, Palm Harbor Academy (charter school). Mr. Harris is a certified public accountant. | CIGNA Corporation; Deluxe Corporation; Asset Allocation Trust | |||
| Judith M. Johnson (Born 1949) | Trustee, since 2008; Audit Committee Chairman, since 2008 | Retired. Prior thereto, Chief Executive Officer and Chief Investment Officer of Minneapolis Employees Retirement Fund from 1996 to 2008. Ms. Johnson is an attorney, certified public accountant and a certified managerial accountant. | Asset Allocation Trust | |||
| Leroy Keith, Jr. (Born 1939) | Trustee, since 2010 | Chairman, Bloc Global Services (development and construction). Trustee of the Evergreen Funds from 1983 to 2010. Former Managing Director, Almanac Capital Management (commodities firm), former Partner, Stonington Partners, Inc. (private equity fund), former Director, Obagi Medical Products Co. and former Director, Lincoln Educational Services. | Trustee, Virtus Fund Complex (consisting of 50 portfolios as of 12/16/2013); Asset Allocation Trust | |||
| David F. Larcker (Born 1950) | Trustee, since 2009 | James Irvin Miller Professor of Accounting at the Graduate School of Business, Stanford University, Morgan Stanley Director of the Center for Leadership Development and Research and Senior Faculty of The Rock Center for Corporate Governance since 2006. From 2005 to 2008, Professor of Accounting at the Graduate School of Business, Stanford University. Prior thereto, Ernst & Young Professor of Accounting at The Wharton School, University of Pennsylvania from 1985 to 2005. | Asset Allocation Trust | |||
| Olivia S. Mitchell (Born 1953) | Trustee, since 2006 | International Foundation of Employee Benefit Plans Professor, Wharton School of the University of Pennsylvania since 1993. Director of Wharton’s Pension Research Council and Boettner Center on Pensions & Retirement Research, and Research Associate at the National Bureau of Economic Research. Previously, Cornell University Professor from 1978 to 1993. | Asset Allocation Trust |
Table of Contents
| 26 | Wells Fargo Advantage VT Opportunity Fund | Other information (unaudited) |
| Name and year of birth | Position held and length of service* | Principal occupations during past five years | Other directorships during past five years | |||
| Timothy J. Penny (Born 1951) | Trustee, since 1996 | President and CEO of Southern Minnesota Initiative Foundation, a non-profit organization, since 2007 and Senior Fellow at the Humphrey Institute Policy Forum at the University of Minnesota since 1995. Member of the Board of Trustees of NorthStar Education Finance, Inc., a non-profit organization, since 2007. | Asset Allocation Trust | |||
| Michael S. Scofield (Born 1943) | Trustee, since 2010 | Served on the Investment Company Institute’s Board of Governors and Executive Committee from 2008-2011 as well the Governing Council of the Independent Directors Council from 2006-2011 and the Independent Directors Council Executive Committee from 2008-2011. Chairman of the IDC from 2008-2010. Institutional Investor (Fund Directions) Trustee of Year in 2007. Trustee of the Evergreen Funds (and its predecessors) from 1984 to 2010. Chairman of the Evergreen Funds from 2000-2010. Former Trustee of the Mentor Funds. Retired Attorney, Law Offices of Michael S. Scofield. | Asset Allocation Trust | |||
| Donald C. Willeke (Born 1940) | Trustee, since 1996 | Principal of the law firm of Willeke & Daniels. General Counsel of the Minneapolis Employees Retirement Fund from 1984 until its consolidation into the Minnesota Public Employees Retirement Association on June 30, 2010. Director and Vice Chair of The Tree Trust (non-profit corporation). Director of the American Chestnut Foundation (non-profit corporation). | Asset Allocation Trust |
| * | Length of service dates reflect the Trustee’s commencement of service with the Trust’s predecessor entities, where applicable. |
Officers
| Name and year of birth | Position held and length of service | Principal occupations during past five years | ||||
| Karla M. Rabusch (Born 1959) | President, since 2003 | Executive Vice President of Wells Fargo Bank, N.A. and President of Wells Fargo Funds Management, LLC since 2003. | ||||
| Jeremy DePalma1 (Born 1974) | Treasurer, since 2012 | Senior Vice President of Wells Fargo Funds Management, LLC since 2009. Senior Vice President of Evergreen Investment Management Company, LLC from 2008 to 2010. Vice President, Evergreen Investment Services, Inc. from 2004 to 2007. Head of the Fund Reporting and Control Team within Fund Administration from 2005 to 2010. | ||||
| C. David Messman (Born 1960) | Secretary, since 2000; Chief Legal Officer, since 2003 | Senior Vice President and Secretary of Wells Fargo Funds Management, LLC since 2001. Vice President and Managing Counsel of Wells Fargo Bank, N.A. since 1996. | ||||
| Debra Ann Early (Born 1964) | Chief Compliance Officer, since 2007 | Chief Compliance Officer of Wells Fargo Funds Management, LLC since 2007. Chief Compliance Officer of Parnassus Investments from 2005 to 2007. Chief Financial Officer of Parnassus Investments from 2004 to 2007. | ||||
| David Berardi (Born 1975) | Assistant Treasurer, since 2009 | Vice President of Wells Fargo Funds Management, LLC since 2009. Vice President of Evergreen Investment Management Company, LLC from 2008 to 2010. Assistant Vice President of Evergreen Investment Services, Inc. from 2004 to 2008. Manager of Fund Reporting and Control for Evergreen Investment Management Company, LLC from 2004 to 2010. |
| 1. | Jeremy DePalma acts as Treasurer of 59 funds and Assistant Treasurer of 73 funds in the Fund Complex. |
| 2. | The Statement of Additional Information includes additional information about the Trustees and is available, without charge, upon request, by calling 1-800-222-8222 or by visiting the website at wellsfargoadvantagefunds.com. |
Table of Contents
| List of abbreviations | Wells Fargo Advantage VT Opportunity Fund | 27 |
The following is a list of common abbreviations for terms and entities that may have appeared in this report.
| ACA | — ACA Financial Guaranty Corporation |
| ADR | — American depositary receipt |
| ADS | — American depositary shares |
| AGC | — Assured Guaranty Corporation |
| AGM | — Assured Guaranty Municipal |
| Ambac | — Ambac Financial Group Incorporated |
| AMT | — Alternative minimum tax |
| AUD | — Australian dollar |
| BAN | — Bond anticipation notes |
| BHAC | — Berkshire Hathaway Assurance Corporation |
| BRL | — Brazilian real |
| CAB | — Capital appreciation bond |
| CAD | — Canadian dollar |
| CCAB | — Convertible capital appreciation bond |
| CDA | — Community Development Authority |
| CDO | — Collateralized debt obligation |
| CHF | — Swiss franc |
| COP | — Certificate of participation |
| DKK | — Danish krone |
| DRIVER | — Derivative inverse tax-exempt receipts |
| DW&P | — Department of Water & Power |
| DWR | — Department of Water Resources |
| ECFA | — Educational & Cultural Facilities Authority |
| EDA | — Economic Development Authority |
| EDFA | — Economic Development Finance Authority |
| ETF | — Exchange-traded fund |
| EUR | — Euro |
| FDIC | — Federal Deposit Insurance Corporation |
| FFCB | — Federal Farm Credit Banks |
| FGIC | — Financial Guaranty Insurance Corporation |
| FHA | — Federal Housing Administration |
| FHLB | — Federal Home Loan Bank |
| FHLMC | — Federal Home Loan Mortgage Corporation |
| FICO | — The Financing Corporation |
| FNMA | — Federal National Mortgage Association |
| FSA | — Farm Service Agency |
| GBP | — Great British pound |
| GDR | — Global depositary receipt |
| GNMA | — Government National Mortgage Association |
| GO | — General obligation |
| HCFR | — Healthcare facilities revenue |
| HEFA | — Health & Educational Facilities Authority |
| HEFAR | — Higher education facilities authority revenue |
| HFA | — Housing Finance Authority |
| HFFA | — Health Facilities Financing Authority |
| HKD | — Hong Kong dollar |
| HUD | — Department of Housing and Urban Development |
| HUF | — Hungarian forint |
| IDA | — Industrial Development Authority |
| IDAG | — Industrial Development Agency |
| IDR | — Industrial development revenue |
| IEP | — Irish pound |
| JPY | — Japanese yen |
| KRW | — Republic of Korea won |
| LIBOR | — London Interbank Offered Rate |
| LIQ | — Liquidity agreement |
| LLC | — Limited liability company |
| LLP | — Limited liability partnership |
| LOC | — Letter of credit |
| LP | — Limited partnership |
| MBIA | — Municipal Bond Insurance Association |
| MFHR | — Multifamily housing revenue |
| MSTR | — Municipal securities trust receipts |
| MTN | — Medium-term note |
| MUD | — Municipal Utility District |
| MXN | — Mexican peso |
| MYR | — Malaysian ringgit |
| National | — National Public Finance Guarantee Corporation |
| NGN | — Nigerian naira |
| NOK | — Norwegian krone |
| NZD | — New Zealand dollar |
| PCFA | — Pollution Control Financing Authority |
| PCL | — Public Company Limited |
| PCR | — Pollution control revenue |
| PFA | — Public Finance Authority |
| PFFA | — Public Facilities Financing Authority |
| PFOTER | — Puttable floating option tax-exempt receipts |
| plc | — Public limited company |
| PLN | — Polish zloty |
| PUTTER | — Puttable tax-exempt receipts |
| R&D | — Research & development |
| Radian | — Radian Asset Assurance |
| RAN | — Revenue anticipation notes |
| RDA | — Redevelopment Authority |
| RDFA | — Redevelopment Finance Authority |
| REIT | — Real estate investment trust |
| ROC | — Reset option certificates |
| RON | — Romanian lei |
| RUB | — Russian ruble |
| SAVRS | — Select auction variable rate securities |
| SBA | — Small Business Authority |
| SEK | — Swedish krona |
| SFHR | — Single-family housing revenue |
| SFMR | — Single-family mortgage revenue |
| SGD | — Singapore dollar |
| SKK | — Slovakian koruna |
| SPA | — Standby purchase agreement |
| SPDR | — Standard & Poor’s Depositary Receipts |
| STRIPS | — Separate trading of registered interest and principal securities |
| TAN | — Tax anticipation notes |
| TBA | — To be announced |
| THB | — Thai baht |
| TIPS | — Treasury inflation-protected securities |
| TRAN | — Tax revenue anticipation notes |
| TRY | — Turkish lira |
| TTFA | — Transportation Trust Fund Authority |
| TVA | — Tennessee Valley Authority |
| ZAR | — South African rand |
Table of Contents
This page is intentionally left blank.
Table of Contents


For more information
More information about Wells Fargo Advantage Funds is available free upon request. To obtain literature, please write, email, visit the Fund’s website, or call:
Wells Fargo Advantage Funds
P.O. Box 8266
Boston, MA 02266-8266
Email: wfaf@wellsfargo.com
Website: wellsfargoadvantagefunds.com
Individual investors: 1-800-222-8222
Retail investment professionals: 1-888-877-9275
Institutional investment professionals: 1-866-765-0778
This report and the financial statements contained herein are submitted for the general information of the shareholders of Wells Fargo Advantage Funds. If this report is used for promotional purposes, distribution of the report must be accompanied or preceded by a current prospectus. For a current prospectus and, if available, a summary prospectus containing more complete information, including charges and expenses, call 1-800-222-8222 or visit the Fund’s website at wellsfargoadvantagefunds.com . Please consider the investment objectives, risks, charges, and expenses of the investment carefully before investing. This and other information about Wells Fargo Advantage Funds can be found in the current prospectus. Read the prospectus carefully before you invest or send money.
Wells Fargo Funds Management, LLC, a wholly owned subsidiary of Wells Fargo & Company, provides investment advisory and administrative services for Wells Fargo Advantage Funds. Other affiliates of Wells Fargo & Company provide subadvisory and other services for the Funds. The Funds are distributed by Wells Fargo Funds Distributor, LLC, Member FINRA/SIPC, an affiliate of Wells Fargo & Company.
NOT FDIC INSURED ¡ NO BANK GUARANTEE ¡ MAY LOSE VALUE
© 2014 Wells Fargo Funds Management, LLC. All rights reserved.
222097 02-14 AVT6/AR152 12-13 |
Table of Contents

Wells Fargo Advantage
VT Small Cap Growth Fund

Annual Report
December 31, 2013

Table of Contents
Reduce clutter. Save trees.
Sign up for electronic delivery of prospectuses and shareholder reports at wellsfargo.com/advantagedelivery
| 2 | ||||
| 6 | ||||
| 10 | ||||
| 11 | ||||
Financial statements | ||||
| 16 | ||||
| 17 | ||||
| 18 | ||||
| 19 | ||||
| 21 | ||||
| 25 | ||||
| 26 | ||||
| 29 | ||||
The views expressed and any forward-looking statements are as of December 31, 2013, unless otherwise noted, and are those of the Fund managers and/or Wells Fargo Funds Management, LLC. Discussions of individual securities, or the markets generally, or any Wells Fargo Advantage Fund are not intended as individual recommendations. Future events or results may vary significantly from those expressed in any forward-looking statements; the views expressed are subject to change at any time in response to changing circumstances in the market. Wells Fargo Funds Management, LLC and the Fund disclaim any obligation to publicly update or revise any views expressed or forward-looking statements.
NOT FDIC INSURED ¡ NO BANK GUARANTEE ¡ MAY LOSE VALUE
Table of Contents
| 2 | Wells Fargo Advantage VT Small Cap Growth Fund | Letter to shareholders (unaudited) |

Karla M. Rabusch
President
Wells Fargo Advantage Funds
Major central banks continued to inject liquidity into the banks and the markets through various quantitative easing policies.
Dear Valued Shareholder:
We are pleased to offer you this annual report for the Wells Fargo Advantage VT Small Cap Growth Fund for the 12-month period that ended December 31, 2013. Much of the period was marked by monetary easing by global central banks. During the period, investor concerns that the U.S. Federal Reserve (Fed) would end its bond-buying program initially led to higher interest rates, resulting in losses for bond indexes and volatility for global stock indexes. These fears dissipated in late September 2013 and ended altogether in mid-December 2013 when the Fed announced a tapering timeline that was far more moderate than some had feared. Growing confidence that the U.S. economy was staging a fragile recovery resulted in double-digit returns for domestic stock market indexes for the 12-month reporting period.
Central banks continued to provide stimulus.
Major central banks continued to inject liquidity into the banks and the markets through various quantitative easing policies. Throughout the reporting period, the Federal Open Market Committee (FOMC)—the Fed’s monetary policymaking body—kept its key interest rate near zero in order to support the economy and the financial system. Entering the reporting period, the FOMC had committed to purchase $40 billion per month in mortgage-backed securities to support the housing market and $45 billion per month in long-term U.S. Treasuries to keep interest rates low. Because the markets benefited from the FOMC’s liquidity, both stocks and bonds initially sold off after the FOMC indicated in May 2013 that it might reduce (or taper) its bond-buying program. In mid-December 2013, the FOMC announced that it would reduce its bond-buying program by $10 billion per month beginning in January 2014. The tapering was less aggressive than some investors had feared, and the markets ended 2013 strongly.
European markets continued to benefit from the European Central Bank’s (ECB’s) September 2012 announcement that it would purchase an unlimited amount of one- to three-year sovereign debt from countries that had formally applied for a bailout. As a result, when the tiny eurozone nation of Cyprus was forced to implement capital controls and impose losses on uninsured bank depositors in March 2013, global stock markets remained resilient despite short-term volatility. In May 2013, the ECB cut its key rate to a then-historic low of 0.5%. The ECB’s aggressive actions helped ease investor worries about a eurozone sovereign debt default. Given the substantial ties between the U.S. and Europe, the improved sentiment about the eurozone helped provide a tailwind for U.S. markets.
U.S. stock markets gained on relatively good news.
For most of the period, U.S. economic data remained moderately positive, gaining strength as the period progressed. Reported gross domestic product growth came in at a solid 1.1% annualized rate in the first quarter of 2013, a 2.5% annualized rate in the second quarter, a 4.1% annualized rate in the third quarter, and a 3.2% annualized rate (an advance estimate as of January 31, 2014) in the fourth quarter.
The most significant negative effect was the ongoing fight in Washington, D.C., over the federal budget and debt limit. The Budget Control Act of 2011, which was passed to resolve a previous fight over the federal debt ceiling, mandated budget sequestration that took effect on March 1, 2013, and was an overhang on economic growth throughout the remainder of the reporting period. Most recently, Congress was unable to pass a resolution to continue to fund the federal government, and thus, the federal government underwent a partial shutdown from September 30, 2013, through October 16, 2013. The government reopened after the president and Congress reached a deal that funded the government
Table of Contents
| Letter to shareholders (unaudited) | Wells Fargo Advantage VT Small Cap Growth Fund | 3 |
through January 15, 2014, and raised the debt limit through February 7, 2014. In December 2013, Congress passed the Ryan-Murray budget agreement, which funded the government through fiscal 2015, lessening the near-term prospect of another shutdown.
Despite political headwinds, the relatively positive outlook for the U.S. economy contributed to a strong domestic stock market for most of the reporting period. Economically sensitive sectors, such as industrials and consumer discretionary, outperformed. Dividend-paying stocks led the market earlier in 2013 as investors sought yield in a historically low-yielding environment, but rising interest rates later in the period dampened their relative performance. Judging by various Russell indexes, small-cap stocks outperformed large-cap stocks, and growth stocks outperformed value stocks.
Don’t let short-term uncertainty derail long-term investment goals.
While periods of uncertainty can present challenges, they can also create opportunities, and experience has taught us that maintaining long-term investment goals can be an effective way to plan for the future. Although diversification cannot guarantee an investment profit or prevent losses, we believe it can be an effective way to manage investment risk and potentially smooth out overall portfolio performance. We encourage investors to know their investments and to understand that appropriate levels of risk-taking may unlock opportunities.
Thank you for choosing to invest with Wells Fargo Advantage Funds. We appreciate your confidence in us and remain committed to helping you meet your financial needs. For current information about your fund investments, contact your investment professional, visit our website at wellsfargoadvantagefunds.com, or call us directly at 1-800-222-8222. We are available 24 hours a day, 7 days a week.
Sincerely,

Karla M. Rabusch
President
Wells Fargo Advantage Funds
Despite political headwinds, the relatively positive outlook for the U.S. economy contributed to a strong domestic stock market for most of the reporting period.
Table of Contents
| 4 | Wells Fargo Advantage VT Small Cap Growth Fund | Letter to shareholders (unaudited) |
Notice to shareholders
| n | At its November 18-20, 2013 meeting, the Board of Trustees unanimously approved a change to the Fund’s definition of small-capitalization companies. Effective April 1, 2014, the Fund will consider small-capitalization companies to be those with market capitalizations within the range of the Russell 2000® Index1. |
| n | The Fund and Funds Management, LLC (“Funds Management”) have received an exemptive order from the SEC that permits Funds Management, subject to the approval of the Board of Trustees of the Fund, to select or replace certain subadvisers to manage all or a portion of the Fund’s assets and enter into, amend or terminate a sub-advisory agreement with certain subadvisers without obtaining shareholder approval (“Multi-manager Structure”). The Multi-manager Structure applies to subadvisers that are not affiliated with Funds Management or the Fund, except to the extent that affiliation arises solely because such subadvisers provide sub-advisory services to the Fund (“Non-affiliated Subadvisers”), as well as subadvisers that are indirect or direct wholly-owned subsidiaries of Funds Management or of another company that, indirectly or directly, wholly owns Funds Management (“Wholly-owned Subadvisers”). |
Pursuant to the SEC order, Funds Management, with the approval of the Board of Trustees, has the discretion to terminate any subadvisers and allocate and reallocate the Fund’s assets among any other Non-affiliated Subadvisers or Wholly-owned Subadvisers. Funds Management, subject to oversight and supervision by the Board of Trustees, has responsibility to continue to oversee any subadvisers to the Fund and to recommend, for approval by the Board of Trustees, the hiring, termination and replacement of subadvisers for the Fund. In the event that a new subadviser is hired pursuant to the Multi-manager structure, the Fund is required to provide notice to shareholders within 90 days.
Please contact your investment professional or call us directly at 1-800-222-8222 if you have any questions on this Notice to Shareholders.
| 1. | The Russell 2000® Index measures the performance of the 2,000 smallest companies in the Russell 3000® Index, which represents approximately 8% of the total market capitalization of the Russell 3000 Index. You cannot invest directly in an index. |
Table of Contents
This page is intentionally left blank.
Table of Contents
| 6 | Wells Fargo Advantage VT Small Cap Growth Fund | Performance highlights (unaudited) |
The Fund is currently closed to new investors1.
Investment objective
The Fund seeks long-term capital appreciation.
Adviser
Wells Fargo Funds Management, LLC
Subadviser
Wells Capital Management Incorporated
Portfolio managers
Joseph M. Eberhardy, CFA, CFP
Thomas C. Ognar, CFA
Bruce C. Olson, CFA
Average annual total returns2 (%) as of December 31, 2013
| Expense ratios3 (%) | |||||||||||||||||||||||
| Inception date | 1 year | 5 year | 10 year | Gross | Net4 | |||||||||||||||||||
| Class 1 | 7-16-2010 | 50.55 | 24.71 | 11.55 | 0.95 | 0.95 | ||||||||||||||||||
| Class 2 | 5-1-1995 | 50.23 | 24.50 | 11.46 | 1.20 | 1.20 | ||||||||||||||||||
| Russell 2000® Growth Index5 | – | 43.30 | 22.58 | 9.41 | – | – | ||||||||||||||||||
Figures quoted represent past performance, which is no guarantee of future results and do not reflect the deduction of taxes that a shareholder may pay on fund distributions or the redemption of fund shares. Investment return and principal value of an investment will fluctuate so that an investor’s shares, when redeemed, may be worth more or less than their original cost. Current performance may be lower or higher than the performance data quoted, which assumes the reinvestment of dividends and capital gains. Current month-end performance is available by calling 1-800-222-8222. Performance figures of the Fund do not reflect fees charged pursuant to the terms of variable life insurance policies and variable annuity contracts. If fees had been reflected, performance would have been lower.
Index returns do not include transaction costs associated with buying and selling securities, any mutual fund fees or expenses, or any taxes. It is not possible to invest directly in an index.
Please keep in mind that high double-digit returns were primarily achieved during favorable market conditions. You should not expect that such favorable returns can be consistently achieved. A Fund’s performance, especially for very short time periods, should not be the sole factor in making your investment decision.
Stock values fluctuate in response to the activities of individual companies and general market and economic conditions. Smaller-company stocks tend to be more volatile and less liquid than those of larger companies. Consult the Fund’s prospectus for additional information on these and other risks.
Please refer to the prospectus provided by your participating insurance company for detailed information describing the separate accounts for information regarding surrender charges, mortality and expense risk fees, and other charges that may be assessed by the participating insurance companies.
Please see footnotes on page 7.
Table of Contents
| Performance highlights (unaudited) | Wells Fargo Advantage VT Small Cap Growth Fund | 7 |
| Growth of $10,000 investment6 as of December 31, 2013 | ||
| ||
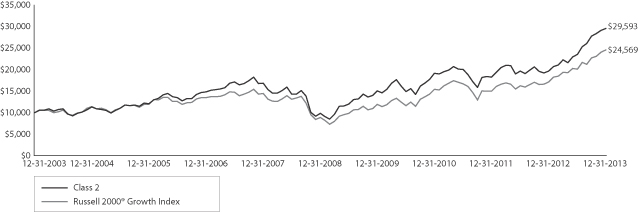
| 1. | Please see the Fund’s current Statement of Additional Information for further details. |
| 2. | Historical performance shown for Class 1 shares prior to their inception reflects the performance of Class 2 shares, and includes the higher expenses applicable to Class 2 shares. If these expenses had not been included, returns would be higher. |
| 3. | Reflects the expense ratios as stated in the most recent prospectuses. |
| 4. | The Adviser has committed through April 30, 2014, to waive fees and/or reimburse expenses to the extent necessary to cap the Fund’s Total Annual Fund Operating Expenses After Fee Waiver, excluding certain expenses, at 0.95% for Class 1 and 1.20% for Class 2. Brokerage commissions, stamp duty fees, interest, taxes, acquired fund fees and expenses, and extraordinary expenses are excluded from the cap. Without this cap, the Fund’s returns would have been lower. |
| 5. | Russell 2000® Growth Index measures the performance of those Russell 2000 companies with higher price-to-book ratios and higher forecasted growth values. You cannot invest directly in an index. |
| 6. | The chart compares the performance of Class 2 shares for the most recent ten years with the Russell 2000 Growth Index. The chart assumes a hypothetical $10,000 investment and reflects all operating expenses of the Fund. Performance figures of the Fund do not reflect fees charged pursuant to the terms of variable life insurance policies and variable annuity contracts. |
| 7. | The ten largest equity holdings are calculated based on the value of the securities divided by total net assets of the Fund. Holdings are subject to change and may have changed since the date specified. |
| 8. | Sector distribution is subject to change and is calculated based on the total long-term investments of the Fund. |
Table of Contents
| 8 | Wells Fargo Advantage VT Small Cap Growth Fund | Performance highlights (unaudited) |
MANAGER’S DISCUSSION
Fund highlights
| n | The Fund outperformed its benchmark, the Russell 2000® Growth Index, for the 12-month period that ended December 31, 2013. |
| n | Positive stock selection, primarily in the financials, industrials, and health care sectors, aided relative performance in 2013. |
| n | Within the Fund, stock selection in the consumer staples and information technology sectors constrained relative performance. |
2013 was a solid year for small-cap growth investors.
Small-cap growth stocks achieved strong gains in 2013 with the support of continued improvement in corporate earnings, signs of incremental improvement in the domestic economy, and accommodative policy by the Federal Reserve.
Similar to recent years, global and domestic events threatened to shake investor confidence during 2013. Key headline events during the year—including a haircut (reduction in value) on bank deposits in Cyprus, a humanitarian crisis in Syria that threatened to broaden U.S. involvement, a temporary shutdown of the U.S. government, and JPMorgan Chase & Company’s record $13 billion settlement with federal authorities—did little to derail equity markets. Against a backdrop of rising equity prices, our focus on rapidly growing companies was rewarded, especially during periods when investors focused on corporate fundamentals rather than on macroeconomic data or central bank policy.
Regardless of the market environment, we strive to add value for shareholders by continuing to capitalize on opportunities where other investors have underappreciated the longer-term growth potential of select companies.
| Ten largest equity holdings7 (%) as of December 31, 2013 | ||||
MarketAxess Holdings Incorporated | 2.70 | |||
Financial Engines Incorporated | 2.62 | |||
SPS Commerce Incorporated | 2.46 | |||
Medidata Solutions Incorporated | 2.43 | |||
On Assignment Incorporated | 2.36 | |||
Acadia Healthcare Company Incorporated | 2.25 | |||
DexCom Incorporated | 2.16 | |||
Fleetmatics Group plc | 2.09 | |||
Portfolio Recovery Associates Incorporated | 2.07 | |||
The Middleby Corporation | 2.02 | |||
The Fund outperformed in a majority of market sectors.
Security selection in the financials sector contributed significantly to returns in 2013. Within the sector, capital markets holding Financial Engines Incorporated benefited performance the most. The company’s growth was driven by higher market-based fees due to the rising stock market, and robust growth in new-client assets. Financial Engines’ continued efforts to increase market share relative to competitors has positioned the firm to further penetrate the self-directed retirement market. MarketAxess Holdings Incorporated—a provider of electronic bond-trading services—also delivered solid results. We believe the company will continue to benefit from the shift toward higher-fee products, such as high-yield and emerging markets bonds, and will see increased market share as fixed-income markets and traditional over-the-counter products move toward electronic trading.
Security selection within the industrials sector also proved beneficial to performance. DXP Enterprises Incorporated—a distributor of industrial products and pumping solutions—appreciated due to robust revenue growth and solid demand from its chemical end markets. Innovative Pumping Solutions®, one of the firm’s businesses, has continued to grow organically, and DXP is positioned to expand its niche within the production segment of the energy market. Professional staffing firm On Assignment Incorporated, also added value; investors responded positively to the firm’s higher revenues from its information technology (IT) segment. On Assignment has strengthened its emphasis on IT staffing, which has positioned the firm to benefit as companies increasingly seek to control costs by using temporary IT help rather than internal resources or consulting firms.
Within the health care sector, security selection was strong in a variety of industries. Biotechnology holding NPS Pharmaceuticals Incorporated was one of the sector’s top performers. The company generated strong revenue from its drug Gattex (used to treat short bowel syndrome, a condition in which nutrients are not properly absorbed). This drug, along with other pipeline drugs that predominantly treat central nervous system ailments, provide NPS with significant
Please see footnotes on page 7.
Table of Contents
| Performance highlights (unaudited) | Wells Fargo Advantage VT Small Cap Growth Fund | 9 |
future growth potential. In addition, health care technology firm Medidata Solutions Incorporated, which provides software for pharmaceutical and biotechnology companies, generated strong revenue growth, driven by its demonstrated efficiency in helping companies bring drugs to market.
| Sector distribution8 as of December 31, 2013 | ||
| ||

The consumer staples sector delivered the weakest relative results during 2013. The Fresh Market Incorporated—a natural and organic foods retailer—suffered from decelerating same-store sales trends, due mainly to increased costs associated with new-store growth. Nevertheless, we believe the firm possesses robust same-store sales growth potential, has an expanding footprint, and benefits from a secular trend of growing demand for healthier food options.
We are confident in our companies’ growth prospects for 2014.
Looking ahead, we believe the positive trends for growth stocks in 2013 can continue into 2014. In our view, a modestly growing U.S. economy with accommodative monetary policy can continue to produce favorable conditions for specific rapidly growing companies to outperform the market.
Since May 2013, investors have stepped in to drive stock prices higher for select high-revenue-growth companies that have been successful in differentiating themselves. We believe this trend can continue. We also believe that our investment style—seeking robust growth companies with sustainable business models that are underappreciated by other investors—positions us well to identify and invest in select high-growth opportunities. As always, we remain focused on bottom-up analysis and have not wavered from our discipline. Dedication to our proven process enabled the fund to outperform in 2013.
Please see footnotes on page 7.
Table of Contents
| 10 | Wells Fargo Advantage VT Small Cap Growth Fund | Fund expenses (unaudited) |
As a shareholder of the Fund, you incur ongoing costs, including management fees, distribution (12b-1) fees, and other Fund expenses. This example is intended to help you understand your ongoing costs (in dollars) of investing in the Fund and to compare these costs with the ongoing costs of investing in other mutual funds.
The example is based on an investment of $1,000 invested at the beginning of the six-month period and held for the entire period from July 1, 2013 to December 31, 2013.
Actual expenses
The “Actual” line of the table below provides information about actual account values and actual expenses. You may use the information in this line, together with the amount you invested, to estimate the expenses that you paid over the period. Simply divide your account value by $1,000 (for example, an $8,600 account value divided by $1,000 = 8.6), then multiply the result by the number in the “Actual” line under the heading entitled “Expenses Paid During Period” for your applicable class of shares to estimate the expenses you paid on your account during this period.
Hypothetical example for comparison purposes
The “Hypothetical” line of the table below provides information about hypothetical account values and hypothetical expenses based on the Fund’s actual expense ratio and an assumed rate of return of 5% per year before expenses, which is not the Fund’s actual return. The hypothetical account values and expenses may not be used to estimate the actual ending account balance or expenses you paid for the period. You may use this information to compare the ongoing costs of investing in the Fund and other funds. To do so, compare this 5% hypothetical example with the 5% hypothetical examples that appear in the shareholder reports of the other funds.
Please note that the expenses shown in the table are meant to highlight your ongoing costs only and do not reflect any separate account charges assessed by participating insurance companies. Therefore, the “Hypothetical” line of the table is useful in comparing ongoing costs only, and will not help you determine the relative total costs of owning different funds. In addition, if these separate account charges assessed by participating insurance companies were included, your costs would have been higher.
Beginning account value 7-1-2013 | Ending account value 12-31-2013 | Expenses paid during the period1 | Net annual expense ratio | |||||||||||||
Class 1 | ||||||||||||||||
Actual | $ | 1,000.00 | $ | 1,258.05 | $ | 5.24 | 0.92 | % | ||||||||
Hypothetical (5% return before expenses) | $ | 1,000.00 | $ | 1,020.57 | $ | 4.69 | 0.92 | % | ||||||||
Class 2 | ||||||||||||||||
Actual | $ | 1,000.00 | $ | 1,256.69 | $ | 6.66 | 1.17 | % | ||||||||
Hypothetical (5% return before expenses) | $ | 1,000.00 | $ | 1,019.31 | $ | 5.96 | 1.17 | % | ||||||||
| 1. | Expenses paid is equal to the annualized expense ratio of each class multiplied by the average account value over the period, multiplied by the number of days in the most recent fiscal half-year divided by the number of days in the fiscal year (to reflect the one-half year period). |
Table of Contents
| Portfolio of investments—December 31, 2013 | Wells Fargo Advantage VT Small Cap Growth Fund | 11 |
| Security name | Shares | Value | ||||||||||
Common Stocks: 98.74% | ||||||||||||
Consumer Discretionary: 15.54% | ||||||||||||
| Auto Components: 0.37% | ||||||||||||
Fox Factory Holding Corporation † | 60,000 | $ | 1,057,200 | |||||||||
|
| |||||||||||
| Diversified Consumer Services: 1.78% | ||||||||||||
Grand Canyon Education Incorporated † | 62,000 | 2,703,200 | ||||||||||
LifeLock Incorporated † | 144,700 | 2,374,527 | ||||||||||
| 5,077,727 | ||||||||||||
|
| |||||||||||
| Hotels, Restaurants & Leisure: 3.13% | ||||||||||||
Fiesta Restaurant Group Incorporated † | 91,976 | 4,804,826 | ||||||||||
Multimedia Games Holding Company † | 132,000 | 4,139,520 | ||||||||||
| 8,944,346 | ||||||||||||
|
| |||||||||||
| Internet & Catalog Retail: 4.12% | ||||||||||||
HomeAway Incorporated † | 115,754 | 4,732,024 | ||||||||||
RetailMeNot Incorporated † | 45,763 | 1,317,517 | ||||||||||
Shutterfly Incorporated † | 112,553 | 5,732,324 | ||||||||||
| 11,781,865 | ||||||||||||
|
| |||||||||||
| Media: 1.98% | ||||||||||||
IMAX Corporation Ǡ | 191,600 | 5,648,368 | ||||||||||
|
| |||||||||||
| Specialty Retail: 3.86% | ||||||||||||
Asbury Automotive Group Incorporated † | 30,000 | 1,612,200 | ||||||||||
Conn’s Incorporated † | 18,200 | 1,433,978 | ||||||||||
DSW Incorporated Class A | 125,400 | 5,358,342 | ||||||||||
Five Below Incorporated Ǡ | 60,778 | 2,625,610 | ||||||||||
| 11,030,130 | ||||||||||||
|
| |||||||||||
| Textiles, Apparel & Luxury Goods: 0.30% | ||||||||||||
Oxford Industries Incorporated | 10,700 | 863,169 | ||||||||||
|
| |||||||||||
Consumer Staples: 2.89% | ||||||||||||
| Food & Staples Retailing: 1.49% | ||||||||||||
The Fresh Market Incorporated † | 52,000 | 2,106,000 | ||||||||||
United Natural Foods Incorporated † | 28,700 | 2,163,693 | ||||||||||
| 4,269,693 | ||||||||||||
|
| |||||||||||
| Food Products: 1.40% | ||||||||||||
Annie’s Incorporated † | 92,900 | 3,998,416 | ||||||||||
|
| |||||||||||
Energy: 5.52% | ||||||||||||
| Oil, Gas & Consumable Fuels: 5.52% | ||||||||||||
Athlon Energy Incorporated † | 37,244 | 1,126,631 | ||||||||||
Bonanza Creek Energy Incorporated † | 91,300 | 3,968,811 | ||||||||||
Diamondback Energy Incorporated † | 68,887 | 3,641,367 | ||||||||||
Kodiak Oil & Gas Corporation † | 105,500 | 1,182,655 | ||||||||||
The accompanying notes are an integral part of these financial statements.
Table of Contents
| 12 | Wells Fargo Advantage VT Small Cap Growth Fund | Portfolio of investments—December 31, 2013 |
| Security name | Shares | Value | ||||||||||
| Oil, Gas & Consumable Fuels (continued) | ||||||||||||
Laredo Petroleum Holdings Incorporated † | 80,059 | $ | 2,216,834 | |||||||||
Oasis Petroleum Incorporated † | 77,400 | 3,635,478 | ||||||||||
| 15,771,776 | ||||||||||||
|
| |||||||||||
Financials: 7.81% | ||||||||||||
| Capital Markets: 2.62% | ||||||||||||
Financial Engines Incorporated | 107,800 | 7,489,944 | ||||||||||
|
| |||||||||||
| Consumer Finance: 2.49% | ||||||||||||
Encore Capital Group Incorporated † | 23,700 | 1,191,162 | ||||||||||
Portfolio Recovery Associates Incorporated † | 112,095 | 5,923,100 | ||||||||||
| 7,114,262 | ||||||||||||
|
| |||||||||||
| Diversified Financial Services: 2.70% | ||||||||||||
MarketAxess Holdings Incorporated | 115,178 | 7,701,953 | ||||||||||
|
| |||||||||||
Health Care: 23.24% | ||||||||||||
| Biotechnology: 2.41% | ||||||||||||
Exact Sciences Corporation † | 76,562 | 895,010 | ||||||||||
Hyperion Therapeutics Incorporated † | 33,220 | 671,708 | ||||||||||
Ligand Pharmaceuticals Incorporated Ǡ | 24,700 | 1,299,220 | ||||||||||
NPS Pharmaceuticals Incorporated † | 117,000 | 3,552,120 | ||||||||||
Onconova Therapeutics Incorporated Ǡ | 41,439 | 475,720 | ||||||||||
| 6,893,778 | ||||||||||||
|
| |||||||||||
| Health Care Equipment & Supplies: 10.24% | ||||||||||||
Align Technology Incorporated † | 33,400 | 1,908,810 | ||||||||||
Cardiovascular Systems Incorporated † | 73,855 | 2,532,488 | ||||||||||
Cynosure Incorporated Class A † | 167,077 | 4,457,614 | ||||||||||
DexCom Incorporated † | 174,300 | 6,171,963 | ||||||||||
Endologix Incorporated † | 262,045 | 4,570,065 | ||||||||||
Novadaq Technologies Incorporated † | 54,017 | 890,740 | ||||||||||
NxStage Medical Incorporated † | 125,620 | 1,256,200 | ||||||||||
Spectranetics Corporation † | 146,213 | 3,655,325 | ||||||||||
Tandem Diabetes Care Incorporated Ǡ | 65,548 | 1,689,172 | ||||||||||
TearLab Corporation Ǡ | 106,675 | 996,345 | ||||||||||
Veracyte Incorporated † | 76,937 | 1,115,587 | ||||||||||
| 29,244,309 | ||||||||||||
|
| |||||||||||
| Health Care Providers & Services: 4.43% | ||||||||||||
Acadia Healthcare Company Incorporated † | 135,700 | 6,422,681 | ||||||||||
ExamWorks Group Incorporated † | 33,100 | 988,697 | ||||||||||
MWI Veterinary Supply Incorporated † | 13,300 | 2,268,847 | ||||||||||
Team Health Holdings Incorporated † | 65,500 | 2,983,525 | ||||||||||
| 12,663,750 | ||||||||||||
|
| |||||||||||
| Health Care Technology: 2.43% | ||||||||||||
Medidata Solutions Incorporated † | 114,600 | 6,941,322 | ||||||||||
|
| |||||||||||
The accompanying notes are an integral part of these financial statements.
Table of Contents
| Portfolio of investments—December 31, 2013 | Wells Fargo Advantage VT Small Cap Growth Fund | 13 |
| Security name | Shares | Value | ||||||||||
| Life Sciences Tools & Services: 1.15% | ||||||||||||
Cambrex Corporation † | 50,200 | $ | 895,066 | |||||||||
ICON plc ADR † | 58,700 | 2,372,067 | ||||||||||
| 3,267,133 | ||||||||||||
|
| |||||||||||
| Pharmaceuticals: 2.58% | ||||||||||||
AcelRx Pharmaceuticals Incorporated Ǡ | 130,978 | 1,481,361 | ||||||||||
Akorn Incorporated † | 195,915 | 4,825,386 | ||||||||||
Lannett Company Incorporated † | 32,200 | 1,065,820 | ||||||||||
| 7,372,567 | ||||||||||||
|
| |||||||||||
Industrials: 14.20% | ||||||||||||
| Building Products: 1.22% | ||||||||||||
A.O. Smith Corporation | 64,400 | 3,473,736 | ||||||||||
|
| |||||||||||
| Commercial Services & Supplies: 0.05% | ||||||||||||
Barrett Business Services Incorporated | 1,600 | 148,384 | ||||||||||
|
| |||||||||||
| Electrical Equipment: 0.85% | ||||||||||||
Power Solutions International Incorporated † | 17,859 | 1,341,211 | ||||||||||
Powersecure International Incorporated † | 62,800 | 1,078,276 | ||||||||||
| 2,419,487 | ||||||||||||
|
| |||||||||||
| Machinery: 4.36% | ||||||||||||
Chart Industries Incorporated † | 38,792 | 3,710,067 | ||||||||||
Proto Labs Incorporated † | 36,855 | 2,623,339 | ||||||||||
The ExOne Company Ǡ | 5,800 | 350,668 | ||||||||||
The Middleby Corporation † | 23,999 | 5,759,040 | ||||||||||
| 12,443,114 | ||||||||||||
|
| |||||||||||
| Professional Services: 4.71% | ||||||||||||
Corporate Executive Board Company | 55,200 | 4,274,136 | ||||||||||
On Assignment Incorporated † | 192,781 | 6,731,913 | ||||||||||
Wageworks Incorporated † | 41,328 | 2,456,536 | ||||||||||
| 13,462,585 | ||||||||||||
|
| |||||||||||
| Road & Rail: 1.01% | ||||||||||||
Roadrunner Transportation Systems Incorporated † | 107,000 | 2,883,650 | ||||||||||
|
| |||||||||||
| Trading Companies & Distributors: 2.00% | ||||||||||||
DXP Enterprises Incorporated † | 49,697 | 5,725,094 | ||||||||||
|
| |||||||||||
Information Technology: 29.54% | ||||||||||||
| Computers & Peripherals: 0.32% | ||||||||||||
Stratasys Limited † | 6,700 | 902,490 | ||||||||||
|
| |||||||||||
| Electronic Equipment, Instruments & Components: 0.93% | ||||||||||||
Cognex Corporation | 20,400 | 778,872 | ||||||||||
Methode Electronics Incorporated | 54,499 | 1,863,321 | ||||||||||
| 2,642,193 | ||||||||||||
|
| |||||||||||
The accompanying notes are an integral part of these financial statements.
Table of Contents
| 14 | Wells Fargo Advantage VT Small Cap Growth Fund | Portfolio of investments—December 31, 2013 |
| Security name | Shares | Value | ||||||||||||
| Internet Software & Services: 9.17% | ||||||||||||||
CoStar Group Incorporated † | 19,400 | $ | 3,580,852 | |||||||||||
Demandware Incorporated † | 55,200 | 3,539,424 | ||||||||||||
Envestnet Incorporated † | 142,641 | 5,748,432 | ||||||||||||
MercadoLibre Incorporated « | 6,000 | 646,740 | ||||||||||||
OpenTable Incorporated † | 30,200 | 2,396,974 | ||||||||||||
SciQuest Incorporated † | 114,954 | 3,273,890 | ||||||||||||
SPS Commerce Incorporated † | 107,471 | 7,017,856 | ||||||||||||
| 26,204,168 | ||||||||||||||
|
| |||||||||||||
| IT Services: 3.12% | ||||||||||||||
InterXion Holding NV † | 134,200 | 3,168,462 | ||||||||||||
Maximus Incorporated | 65,500 | 2,881,345 | ||||||||||||
Wex Incorporated † | 28,794 | 2,851,470 | ||||||||||||
| 8,901,277 | ||||||||||||||
|
| |||||||||||||
| Semiconductors & Semiconductor Equipment: 0.38% | ||||||||||||||
Cavium Incorporated † | 31,700 | 1,093,967 | ||||||||||||
|
| |||||||||||||
| Software: 15.62% | ||||||||||||||
Aspen Technology Incorporated † | 81,200 | 3,394,160 | ||||||||||||
Ellie Mae Incorporated † | 117,400 | 3,154,538 | ||||||||||||
Fleetmatics Group plc Ǡ | 138,009 | 5,968,889 | ||||||||||||
Fortinet Incorporated † | 20,000 | 382,600 | ||||||||||||
Guidewire Software Incorporated † | 69,600 | 3,415,272 | ||||||||||||
Imperva Incorporated † | 109,636 | 5,276,781 | ||||||||||||
Infoblox Incorporated † | 118,300 | 3,906,266 | ||||||||||||
Proofpoint Incorporated † | 145,400 | �� | 4,822,918 | |||||||||||
PROS Holdings Incorporated † | 90,727 | 3,620,007 | ||||||||||||
Synchronoss Technologies Incorporated † | 100,258 | 3,115,016 | ||||||||||||
Tyler Technologies Incorporated † | 37,970 | 3,877,876 | ||||||||||||
Ultimate Software Group Incorporated † | 24,100 | 3,692,601 | ||||||||||||
| 44,626,924 | ||||||||||||||
|
| |||||||||||||
Total Common Stocks (Cost $190,335,029) | 282,058,777 | |||||||||||||
|
| |||||||||||||
| Yield | ||||||||||||||
| Short-Term Investments: 8.33% | ||||||||||||||
| Investment Companies: 8.33% | ||||||||||||||
Wells Fargo Advantage Cash Investment Money Market Fund, Select Class (l)(u) | 0.06 | % | 4,438,402 | 4,438,402 | ||||||||||
Wells Fargo Securities Lending Cash Investments, LLC (l)(r)(u)(v) | 0.08 | 19,369,300 | 19,369,300 | |||||||||||
Total Short-Term Investments (Cost $23,807,702) | 23,807,702 | |||||||||||||
|
| |||||||||||||
Total investments in securities (Cost $214,142,731) * | 107.07 | % | 305,866,479 | |||||
Other assets and liabilities, net | (7.07 | ) | (20,201,083 | ) | ||||
|
|
|
| |||||
| Total net assets | 100.00 | % | $ | 285,665,396 | ||||
|
|
|
|
The accompanying notes are an integral part of these financial statements.
Table of Contents
| Portfolio of investments—December 31, 2013 | Wells Fargo Advantage VT Small Cap Growth Fund | 15 |
| † | Non-income-earning security |
| « | All or a portion of this security is on loan. |
| (l) | Investment in an affiliate |
| (u) | Rate shown is the 7-day annualized yield at period end. |
| (r) | The investment company is exempt from registration under Section 3(c)(7) of the Investment Company Act of 1940, as amended. |
| (v) | Security represents investment of cash collateral received from securities on loan. |
| * | Cost for federal income tax purposes is $214,358,547 and unrealized appreciation (depreciation) consists of: |
Gross unrealized appreciation | $ | 94,151,822 | ||
Gross unrealized depreciation | (2,643,890 | ) | ||
|
| |||
Net unrealized appreciation | $ | 91,507,932 |
The accompanying notes are an integral part of these financial statements.
Table of Contents
| 16 | Wells Fargo Advantage VT Small Cap Growth Fund | Statements of assets and liabilities—December 31, 2013 |
Assets | ||||
Investments | ||||
In unaffiliated securities (including securities on loan), at value (see cost below) | $ | 282,058,777 | ||
In affiliated securities, at value (see cost below) | 23,807,702 | |||
|
| |||
Total investments, at value (see cost below) | 305,866,479 | |||
Receivable for Fund shares sold | 264,068 | |||
Receivable for dividends | 6,510 | |||
Receivable for securities lending income | 20,501 | |||
Prepaid expenses and other assets | 1,025 | |||
|
| |||
Total assets | 306,158,583 | |||
|
| |||
Liabilities | ||||
Payable for investments purchased | 713,025 | |||
Payable for Fund shares redeemed | 76,325 | |||
Payable upon receipt of securities loaned | 19,369,300 | |||
Advisory fee payable | 182,324 | |||
Distribution fees payable | 53,251 | |||
Due to other related parties | 31,603 | |||
Accrued expenses and other liabilities | 67,359 | |||
|
| |||
Total liabilities | 20,493,187 | |||
|
| |||
Total net assets | $ | 285,665,396 | ||
|
| |||
NET ASSETS CONSIST OF | ||||
Paid-in capital | $ | 170,110,612 | ||
Accumulated net investment loss | (1,447 | ) | ||
Accumulated net realized gains on investments | 23,832,483 | |||
Net unrealized gains on investments | 91,723,748 | |||
|
| |||
Total net assets | $ | 285,665,396 | ||
|
| |||
COMPUTATION OF NET ASSET VALUE PER SHARE1 | ||||
Net assets – Class 1 | $ | 35,192,006 | ||
Shares outstanding – Class 1 | 3,107,895 | |||
Net asset value per share – Class 1 | $11.32 | |||
Net assets – Class 2 | $ | 250,473,390 | ||
Shares outstanding – Class 2 | 22,316,564 | |||
Net asset value per share – Class 2 | $11.22 | |||
Investments in unaffiliated securities (including securities on loan), at cost | $ | 190,335,029 | ||
|
| |||
Investments in affiliated securities, at cost | $ | 23,807,702 | ||
|
| |||
Total investments, at cost | $ | 214,142,731 | ||
|
| |||
Securities on loan, at value | $ | 19,164,857 | ||
|
| |||
| 1. | The Fund has an unlimited number of authorized shares. |
The accompanying notes are an integral part of these financial statements.
Table of Contents
| Statements of operations—year ended December 31, 2013 | Wells Fargo Advantage VT Small Cap Growth Fund | 17 |
Investment income | ||||
Dividends | $ | 255,735 | ||
Securities lending income, net | 208,777 | |||
Income from affiliated securities | 3,401 | |||
|
| |||
Total investment income | 467,913 | |||
|
| |||
Expenses | ||||
Advisory fee | 1,813,634 | |||
Administration fees | ||||
Fund level | 120,909 | |||
Class 1 | 23,819 | |||
Class 2 | 169,635 | |||
Distribution fees | ||||
Class 2 | 530,111 | |||
Custody and accounting fees | 25,709 | |||
Professional fees | 34,755 | |||
Shareholder report expenses | 28,981 | |||
Trustees’ fees and expenses | 12,936 | |||
Other fees and expenses | 7,084 | |||
|
| |||
Total expenses | 2,767,573 | |||
|
| |||
Net investment loss | (2,299,660 | ) | ||
|
| |||
REALIZED AND UNREALIZED GAINS (LOSSES) ON INVESTMENTS | ||||
Net realized gains on investments | 27,485,921 | |||
Net change in unrealized gains (losses) on investments | 72,423,741 | |||
|
| |||
Net realized and unrealized gains (losses) on investments | 99,909,662 | |||
|
| |||
Net increase in net assets resulting from operations | $ | 97,610,002 | ||
|
| |||
The accompanying notes are an integral part of these financial statements.
Table of Contents
| 18 | Wells Fargo Advantage VT Small Cap Growth Fund | Statements of changes in net assets |
Year ended December 31, 2013 | Year ended December 31, 2012 | |||||||||||||||
Operations | ||||||||||||||||
Net investment loss | $ | (2,299,660 | ) | $ | (1,797,052 | ) | ||||||||||
Net realized gains on investments | 27,485,921 | 14,377,310 | ||||||||||||||
Net change in unrealized gains (losses) on investments | 72,423,741 | 5,912,918 | ||||||||||||||
|
|
|
|
|
|
|
| |||||||||
Net increase in net assets resulting from operations | 97,610,002 | 18,493,176 | ||||||||||||||
|
|
|
|
|
|
|
| |||||||||
Distributions to shareholders from | ||||||||||||||||
Net realized gains | ||||||||||||||||
Class 1 | (1,493,636 | ) | (1,349,821 | ) | ||||||||||||
Class 2 | (10,871,521 | ) | (9,513,837 | ) | ||||||||||||
|
|
|
|
|
|
|
| |||||||||
Total distributions to shareholders | (12,365,157 | ) | (10,863,658 | ) | ||||||||||||
|
|
|
|
|
|
|
| |||||||||
Capital share transactions | Shares | Shares | ||||||||||||||
Proceeds from shares sold | ||||||||||||||||
Class 1 | 493,809 | 4,960,510 | 270,958 | 2,233,411 | ||||||||||||
Class 2 | 3,159,002 | 31,346,859 | 1,774,193 | 14,784,083 | ||||||||||||
|
|
|
|
|
|
|
| |||||||||
| 36,307,369 | 17,017,494 | |||||||||||||||
|
|
|
|
|
|
|
| |||||||||
Reinvestment of distributions | ||||||||||||||||
Class 1 | 158,392 | 1,493,636 | 175,758 | 1,349,821 | ||||||||||||
Class 2 | 1,161,487 | 10,871,521 | 1,243,639 | 9,513,837 | ||||||||||||
|
|
|
|
|
|
|
| |||||||||
| 12,365,157 | 10,863,658 | |||||||||||||||
|
|
|
|
|
|
|
| |||||||||
Payment for shares redeemed | ||||||||||||||||
Class 1 | (785,107 | ) | (7,514,839 | ) | (1,014,442 | ) | (8,307,110 | ) | ||||||||
Class 2 | (5,119,124 | ) | (48,649,167 | ) | (6,374,673 | ) | (51,990,507 | ) | ||||||||
|
|
|
|
|
|
|
| |||||||||
| (56,164,006 | ) | (60,297,617 | ) | |||||||||||||
|
|
|
|
|
|
|
| |||||||||
Net decrease in net assets resulting from capital share transactions | (7,491,480 | ) | (32,416,465 | ) | ||||||||||||
|
|
|
|
|
|
|
| |||||||||
Total increase (decrease) in net assets | 77,753,365 | (24,786,947 | ) | |||||||||||||
|
|
|
|
|
|
|
| |||||||||
Net assets | ||||||||||||||||
Beginning of period | 207,912,031 | 232,698,978 | ||||||||||||||
|
|
|
|
|
|
|
| |||||||||
End of period | $285,665,396 | $207,912,031 | ||||||||||||||
|
|
|
|
|
|
|
| |||||||||
Accumulated net investment loss | $ | (1,447 | ) | $ | (1,481 | ) | ||||||||||
|
|
|
|
|
|
|
| |||||||||
The accompanying notes are an integral part of these financial statements.
Table of Contents
| Financial highlights (unaudited) | Wells Fargo Advantage VT Small Cap Growth Fund | 19 |
(For a share outstanding throughout each period)
| Year ended December 31 | ||||||||||||||||
| CLASS 1 | 2013 | 2012 | 2011 | 20101 | ||||||||||||
Net asset value, beginning of period | $ | 7.93 | $ | 7.71 | $ | 8.06 | $ | 6.26 | ||||||||
Net investment loss | (0.07 | ) | (0.04 | ) | (0.06 | ) | (0.02 | ) | ||||||||
Net realized and unrealized gains (losses) on investments | 3.98 | 0.65 | (0.29 | ) | 1.82 | |||||||||||
|
|
|
|
|
|
|
| |||||||||
Total from investment operations | 3.91 | 0.61 | (0.35 | ) | 1.80 | |||||||||||
Distributions to shareholders from | ||||||||||||||||
Net realized gains | (0.52 | ) | (0.39 | ) | 0.00 | 0.00 | ||||||||||
Net asset value, end of period | $ | 11.32 | $ | 7.93 | $ | 7.71 | $ | 8.06 | ||||||||
Total return2 | 50.55 | % | 8.11 | % | (4.34 | )% | 26.93 | % | ||||||||
Ratios to average net assets (annualized) | ||||||||||||||||
Gross expenses | 0.93 | % | 0.94 | % | 0.94 | % | 0.95 | % | ||||||||
Net expenses | 0.93 | % | 0.94 | % | 0.94 | % | 0.95 | % | ||||||||
Net investment loss | (0.73 | )% | (0.56 | )% | (0.73 | )% | (0.58 | )% | ||||||||
Supplemental data | �� | |||||||||||||||
Portfolio turnover rate | 67 | % | 65 | % | 118 | % | 71 | % | ||||||||
Net assets, end of period (000s omitted) | $ | 35,192 | $ | 25,699 | $ | 29,351 | $ | 42,434 | ||||||||
| 1. | For the period from July 16, 2010 (commencement of class operations) to December 31, 2010 |
| 2. | Returns for periods of less than one year are not annualized. |
The accompanying notes are an integral part of these financial statements.
Table of Contents
| 20 | Wells Fargo Advantage VT Small Cap Growth Fund | Financial highlights (unaudited) |
(For a share outstanding throughout each period)
| Year ended December 31 | ||||||||||||||||||||
| CLASS 2 | 2013 | 2012 | 2011 | 20101 | 2009 | |||||||||||||||
Net asset value, beginning of period | $ | 7.88 | $ | 7.68 | $ | 8.05 | $ | 6.35 | $ | 4.16 | ||||||||||
Net investment loss | (0.09 | ) | (0.07 | ) | (0.09 | ) | (0.06 | ) | (0.03 | ) | ||||||||||
Net realized and unrealized gains (losses) on investments | 3.95 | 0.66 | (0.28 | ) | 1.76 | 2.22 | ||||||||||||||
|
|
|
|
|
|
|
|
|
| |||||||||||
Total from investment operations | 3.86 | 0.59 | (0.37 | ) | 1.70 | 2.19 | ||||||||||||||
Distributions to shareholders from | ||||||||||||||||||||
Net realized gains | (0.52 | ) | (0.39 | ) | 0.00 | 0.00 | 0.00 | |||||||||||||
Net asset value, end of period | $ | 11.22 | $ | 7.88 | $ | 7.68 | $ | 8.05 | $ | 6.35 | ||||||||||
Total return | 50.23 | % | 7.87 | % | (4.60 | )% | 26.77 | % | 52.64 | % | ||||||||||
Ratios to average net assets (annualized) | ||||||||||||||||||||
Gross expenses | 1.18 | % | 1.19 | % | 1.20 | % | 1.22 | % | 1.26 | % | ||||||||||
Net expenses | 1.18 | % | 1.19 | % | 1.19 | % | 1.20 | % | 1.20 | % | ||||||||||
Net investment loss | (0.98 | )% | (0.81 | )% | (0.98 | )% | (0.82 | )% | (0.69 | )% | ||||||||||
Supplemental data | ||||||||||||||||||||
Portfolio turnover rate | 67 | % | 65 | % | 118 | % | 71 | % | 75 | % | ||||||||||
Net assets, end of period (000s omitted) | $ | 250,473 | $ | 182,213 | $ | 203,348 | $ | 247,246 | $ | 185,345 | ||||||||||
| 1. | After the close of business on July 16, 2010, existing shares of the Fund were renamed Class 2 shares. |
The accompanying notes are an integral part of these financial statements.
Table of Contents
| Notes to financial statements | Wells Fargo Advantage VT Small Cap Growth Fund | 21 |
1. ORGANIZATION
Wells Fargo Variable Trust (the “Trust”), a Delaware statutory trust organized on March 10, 1999, is an open-end management investment company registered under the Investment Company Act of 1940, as amended (the “1940 Act”). These financial statements report on the Wells Fargo Advantage VT Small Cap Growth Fund (the “Fund”) which is a diversified series of the Trust.
2. SIGNIFICANT ACCOUNTING POLICIES
The following significant accounting policies, which are consistently followed in the preparation of the financial statements of the Fund, are in conformity with U.S. generally accepted accounting principles which require management to make estimates and assumptions that affect the reported amounts of assets and liabilities, disclosure of contingent assets and liabilities at the date of the financial statements, and the reported amounts of revenues and expenses during the reporting period. Actual results could differ from those estimates.
Securities valuation
All investments are valued each business day as of the close of regular trading on the New York Stock Exchange (generally 4 p.m. Eastern Time).
Equity securities that are listed on a foreign or domestic exchange or market are valued at the official closing price or, if none, the last sales price. If no sale occurs on the primary exchange or market for the security that day, the prior day’s price will be deemed “stale” and fair values will be determined in accordance with the Fund’s Valuation Procedures.
Investments in registered open-end investment companies are valued at net asset value. Non-registered investment vehicles are fair valued at net asset value.
Investments which are not valued using any of the methods discussed above are valued at their fair value, as determined in good faith by the Board of Trustees of the Fund. The Board of Trustees has established a Valuation Committee comprised of the Trustees and has delegated to it the authority to take any actions regarding the valuation of portfolio securities that the Valuation Committee deems necessary or appropriate, including determining the fair value of portfolio securities, unless the determination has been delegated to the Management Valuation Team of Wells Fargo Funds Management, LLC (“Funds Management”). The Board of Trustees retains the authority to make or ratify any valuation decisions or approve any changes to the Valuation Procedures as it deems appropriate. On a quarterly basis, the Board of Trustees receives reports on any valuation actions taken by the Valuation Committee or the Management Valuation Team which may include items for ratification.
Valuations of fair valued securities are compared to the next actual sales price when available, or other appropriate market values, to assess the continued appropriateness of the fair valuation methodologies used. These securities are fair valued on a day-to-day basis, taking into consideration changes to appropriate market information and any significant changes to the inputs considered in the valuation process until there is a readily available price provided on an exchange or by an independent pricing service. Valuations received from an independent pricing service or independent broker-dealer quotes are periodically validated by comparisons to most recent trades and valuations provided by other independent pricing services in addition to the review of prices by the adviser and/or subadviser. Unobservable inputs used in determining fair valuations are identified based on the type of security, taking into consideration factors utilized by market participants in valuing the investment, knowledge about the issuer and the current market environment.
Security loans
The Fund may lend its securities from time to time in order to earn additional income in the form of fees or interest on securities received as collateral or the investment of any cash received as collateral. The Fund continues to receive interest or dividends on the securities loaned. The Fund receives collateral in the form of cash or securities with a value at least equal to the value of the securities on loan. The value of the loaned securities is determined at the close of each business day and any additional required collateral is delivered to the Fund on the next business day. In a securities lending transaction, the net asset value of the Fund will be affected by an increase or decrease in the value of the securities loaned and by an increase or decrease in the value of the instrument in which collateral is invested. The amount of securities lending activity undertaken by the Fund fluctuates from time to time. In the event of default or bankruptcy by the borrower, the Fund may be prevented from recovering the loaned securities or gaining access to the collateral or may experience delays or costs in doing so. In addition, the investment of any cash collateral received may lose all or part of its value. The Fund has the right under the lending agreement to recover the securities from the borrower on demand.
The Fund lends its securities through an unaffiliated securities lending agent. Cash collateral received in connection with its securities lending transactions is invested in Wells Fargo Securities Lending Cash Investments, LLC (the “Securities
Table of Contents
| 22 | Wells Fargo Advantage VT Small Cap Growth Fund | Notes to financial statements |
Lending Fund”). The Securities Lending Fund is exempt from registration under Section 3(c)(7) of the 1940 Act and is managed by Funds Management and is subadvised by Wells Capital Management Incorporated (“WellsCap”). Funds Management receives an advisory fee starting at 0.05% and declining to 0.01% as the average daily net assets of the Securities Lending Fund increase. All of the fees received by Funds Management are paid to WellsCap for its services as subadviser. The Securities Lending Fund seeks to provide a positive return compared to the daily Fed Funds Open rate by investing in high-quality, U.S. dollar-denominated short-term money market instruments. Securities Lending Fund investments are fair valued based upon the amortized cost valuation technique. Income earned from investment in the Securities Lending Fund is included in securities lending income on the Statement of Operations.
Security transactions and income recognition
Securities transactions are recorded on a trade date basis. Realized gains or losses are recorded on the basis of identified cost.
Dividend income is recognized on the ex-dividend date.
Distributions to shareholders
Distributions to shareholders from net investment income and net realized gains, if any, are recorded on the ex-dividend date. Such distributions are determined in conformity with federal income tax regulations, which may differ in amount or character from net investment income and realized gains recognized for purposes of U.S. generally accepted accounting principles.
Federal and other taxes
The Fund intends to continue to qualify as a regulated investment company by distributing substantially all of its investment company taxable income and any net realized capital gains (after reduction for capital loss carryforwards) sufficient to relieve it from all, or substantially all, federal income taxes. Accordingly, no provision for federal income taxes was required.
The Fund’s income and federal excise tax returns and all financial records supporting those returns for the prior three fiscal years are subject to examination by the federal and Delaware revenue authorities. Management has analyzed the Fund’s tax positions taken on federal, state, and foreign tax returns for all open tax years and does not believe that there are any uncertain tax positions that require recognition of a tax liability.
Reclassifications are made to the Fund’s capital accounts for permanent tax differences to reflect income and gains available for distribution (or available capital loss carryforwards) under federal income tax regulations. U.S. generally accepted accounting principles requires that certain components of net assets be adjusted to reflect permanent differences between financial and tax reporting. These reclassifications have no effect on net assets or net asset values per share. The primary permanent differences causing such reclassifications are due to net operating losses. At December 31, 2013, as a result of permanent book-to-tax differences, the following reclassification adjustments were made on the Statement of Assets and Liabilities:
| Paid-in capital | Accumulated net investment loss | Accumulated net realized gains on investments | ||
| $22,912 | $2,299,694 | $(2,322,606) |
Class allocations
The separate classes of shares offered by the Fund differ principally in distribution fees. Shareholders of each class bear certain expenses that pertain to that particular class. All shareholders bear the common expenses of the Fund, earn income from the portfolio, and are allocated any unrealized gains and losses pro rata based on the average daily net assets of each class, without distinction between share classes. Dividends are determined separately for each class based on income and expenses allocable to each class. Realized gains and losses are allocated to each class pro rata based upon the net assets of each class on the date realized. Differences in per share dividend rates generally result from the relative weightings of pro rata income and realized gain allocations and from differences in separate class expenses, including distribution fees.
3. FAIR VALUATION MEASUREMENTS
Fair value measurements of investments are determined within a framework that has established a fair value hierarchy based upon the various data inputs utilized in determining the value of the Fund’s investments. The three-level hierarchy gives the highest priority to unadjusted quoted prices in active markets for identical assets or liabilities (Level 1) and the
Table of Contents
| Notes to financial statements | Wells Fargo Advantage VT Small Cap Growth Fund | 23 |
lowest priority to significant unobservable inputs (Level 3). The Fund’s investments are classified within the fair value hierarchy based on the lowest level of input that is significant to the fair value measurement. The inputs are summarized into three broad levels as follows:
| n | Level 1 – quoted prices in active markets for identical securities |
| n | Level 2 – other significant observable inputs (including quoted prices for similar securities, interest rates, prepayment speeds, credit risk, use of amortized cost, etc.) |
| n | Level 3 – significant unobservable inputs (including the Fund’s own assumptions in determining the fair value of investments) |
The inputs or methodologies used for valuing investments in securities are not necessarily an indication of the risk associated with investing in those securities.
As of December 31, 2013, the inputs used in valuing investments in securities were as follows:
| Investments in securities | Quoted prices (Level 1) | Other significant (Level 2) | Significant unobservable inputs (Level 3) | Total | ||||||||||||
Equity securities | ||||||||||||||||
Common stocks | $ | 282,058,777 | $ | 0 | $ | 0 | $ | 282,058,777 | ||||||||
Short-term investments | ||||||||||||||||
Investment companies | 4,438,402 | 19,369,300 | 0 | 23,807,702 | ||||||||||||
| $ | 286,497,179 | $ | 19,369,300 | $ | 0 | $ | 305,866,479 | |||||||||
Transfers in and transfers out are recognized at the end of the reporting period. For the year ended December 31, 2013, the Fund did not have any transfers into/out of Level 1, Level 2, or Level 3.
4. TRANSACTIONS WITH AFFILIATES AND OTHER EXPENSES
Advisory fee
The Trust has entered into an advisory contract with Funds Management, an indirect wholly owned subsidiary of Wells Fargo & Company (“Wells Fargo”). The adviser is responsible for implementing investment policies and guidelines and for supervising the subadviser, who is responsible for day-to-day portfolio management of the Fund.
Pursuant to the contract, Funds Management is entitled to receive an annual advisory fee starting at 0.75% and declining to 0.60% as the average daily net assets of the Fund increase. For the year ended December 31, 2013, the advisory fee was equivalent to an annual rate of 0.75% of the Fund’s average daily net assets.
Funds Management has retained the services of a subadviser to provide daily portfolio management to the Fund. The fee for subadvisory services is borne by Funds Management. WellsCap, an affiliate of Funds Management and an indirect, wholly owned subsidiary of Wells Fargo, is the subadviser to the Fund and is entitled to receive a fee from Funds Management at an annual rate starting at 0.55% and declining to 0.40% as the average daily net assets of the Fund increase.
Administration and transfer agent fees
The Trust has entered into an administration agreement with Funds Management. Under this agreement, for providing administrative services, which includes paying fees and expenses for services provided by the transfer agent, sub-transfer agents, omnibus account servicers and record-keepers, Funds Management is entitled to receive from the Fund an annual fund level administration fee starting at 0.05% and declining to 0.03% as the average daily net assets of the Fund increase and a class level administration fee of 0.08% of the average daily net assets of each class.
Funds Management has contractually waived and/or reimbursed advisory and administration fees to the extent necessary to maintain certain net operating expense ratios for the Fund. Waiver of fees and/or reimbursement of expenses by Funds Management were made first from fund level expenses on a proportionate basis and then from class specific expenses. Funds Management has committed through April 30, 2014 to waive fees and/or reimburse expenses to the extent necessary to cap the Fund’s expenses at 0.95% for Class 1 shares and 1.20% for Class 2 shares.
Table of Contents
| 24 | Wells Fargo Advantage VT Small Cap Growth Fund | Notes to financial statements |
Distribution fees
The Trust has adopted a Distribution Plan for Class 2 shares of the Fund pursuant to Rule 12b-1 under the 1940 Act. Distribution fees are charged to Class 2 shares and paid to Wells Fargo Funds Distributor, LLC, the principal underwriter, at an annual rate of 0.25% of the average daily net assets of Class 2 shares.
5. INVESTMENT PORTFOLIO TRANSACTIONS
Purchases and sales of investments, excluding U.S. government obligations (if any) and short-term securities, for the year ended December 31, 2013 were $160,068,225 and $184,700,815, respectively.
6. BANK BORROWINGS
The Trust and Wells Fargo Funds Trust (excluding the money market funds and certain other funds) are parties to a $150,000,000 revolving credit agreement with State Street Bank and Trust Company, whereby the Fund is permitted to use bank borrowings for temporary or emergency purposes, such as to fund shareholder redemption requests. Interest under the credit agreement is charged to the Fund based on a borrowing rate equal to the higher of the Federal Funds rate in effect on that day plus 1.25% or the overnight LIBOR rate in effect on that day plus 1.25%. In addition, an annual commitment fee equal to 0.10% of the unused balance is allocated to each participating fund. For the year ended December 31, 2013, the Fund paid $473 in commitment fees.
For the year ended December 31, 2013, there were no borrowings by the Fund under the agreement.
7. DISTRIBUTIONS TO SHAREHOLDERS
The tax character of distributions paid was $12,365,157 and $10,863,658 of long-term capital gains for the years ended December 31, 2013 and December 31, 2012, respectively.
As of December 31, 2013, the components of distributable earnings on a tax basis were as follows:
Undistributed ordinary income | Undistributed long-term gain | Unrealized gains | ||
| $3,203,906 | $20,844,393 | $91,507,932 |
8. CONCENTRATION RISK
Concentration risks result from exposure to a limited number of sectors. Funds that invest a substantial portion of their assets in any sector may be more affected by changes in that sector than would be a fund whose investments are not heavily weighted in any sector.
9. INDEMNIFICATION
Under the Trust’s organizational documents, the officers and directors are indemnified against certain liabilities that may arise out of performance of their duties to the Trust. Additionally, in the normal course of business, the Trust may enter into contracts with service providers that contain a variety of indemnification clauses. The Trust’s maximum exposure under these arrangements is dependent on future claims that may be made against the Fund and, therefore, cannot be estimated.
Table of Contents
| Report of independent registered public accounting firm | Wells Fargo Advantage VT Small Cap Growth Fund | 25 |
BOARD OF TRUSTEES AND SHAREHOLDERS OF WELLS FARGO VARIABLE TRUST:
We have audited the accompanying statement of assets and liabilities, including the portfolio of investments, of the Wells Fargo Advantage VT Small Cap Growth Fund (the “Fund”), one of the funds constituting the Wells Fargo Variable Trust, as of December 31, 2013, and the related statement of operations for the year then ended, statements of changes in net assets for each of the years in the two-year period then ended, and the financial highlights for each of the years or periods in the five-year period then ended. These financial statements and financial highlights are the responsibility of the Fund’s management. Our responsibility is to express an opinion on these financial statements and financial highlights based on our audits.
We conducted our audits in accordance with the standards of the Public Company Accounting Oversight Board (United States). Those standards require that we plan and perform the audit to obtain reasonable assurance about whether the financial statements and financial highlights are free of material misstatement. An audit includes examining, on a test basis, evidence supporting the amounts and disclosures in the financial statements. Our procedures included confirmation of securities owned as of December 31, 2013, by correspondence with the custodian and brokers or by other appropriate auditing procedures. An audit also includes assessing the accounting principles used and significant estimates made by management, as well as evaluating the overall financial statement presentation. We believe that our audits provide a reasonable basis for our opinion.
In our opinion, the financial statements and financial highlights referred to above present fairly, in all material respects, the financial position of the Wells Fargo Advantage VT Small Cap Growth Fund as of December 31, 2013, the results of its operations for the year then ended, the changes in its net assets for each of the years in the two-year period then ended, and the financial highlights for each of the years or periods in the five-year period then ended, in conformity with U.S. generally accepted accounting principles.

Boston, Massachusetts
February 27, 2014
Table of Contents
| 26 | Wells Fargo Advantage VT Small Cap Growth Fund | Other information (unaudited) |
TAX INFORMATION
Pursuant to Section 852 of the Internal Revenue Code, $12,365,157 was designated as long-term capital gain distributions for the fiscal year ended December 31, 2013.
PROXY VOTING INFORMATION
A description of the policies and procedures that the Fund uses to determine how to vote proxies relating to portfolio securities is available without charge, upon request, by calling 1-800-222-8222, visiting our website at wellsfargoadvantagefunds.com, or visiting the SEC website at sec.gov. Information regarding how the Fund voted proxies relating to portfolio securities during the most recent 12-month period ended June 30 is available without charge on the Fund’s website at wellsfargoadvantagefunds.com or by visiting the SEC website at sec.gov.
PORTFOLIO HOLDINGS INFORMATION
The complete portfolio holdings for the Fund are publicly available on the Fund’s website (wellsfargoadvantagefunds.com) on a monthly, 30-day or more delayed basis. In addition, top ten holdings information for the Fund is publicly available on the Fund’s website on a monthly, seven-day or more delayed basis. The Fund files its complete schedule of portfolio holdings with the SEC for the first and third quarters of each fiscal year on Form N-Q, which is available without charge by visiting the SEC website at sec.gov. In addition, the Fund’s Form N-Q may be reviewed and copied at the SEC’s Public Reference Room in Washington, DC, and at regional offices in New York City, at 233 Broadway, and in Chicago, at 175 West Jackson Boulevard, Suite 900. Information about the Public Reference Room may be obtained by calling 1-800-SEC-0330.
Table of Contents
| Other information (unaudited) | Wells Fargo Advantage VT Small Cap Growth Fund | 27 |
BOARD OF TRUSTEES AND OFFICERS
Each of the Trustees and Officers listed in the table below acts in identical capacities for each fund in the Wells Fargo Advantage family of funds, which consists of 132 mutual funds1 comprising the Wells Fargo Funds Trust, Wells Fargo Variable Trust, Wells Fargo Master Trust and four closed-end funds (collectively the “Fund Complex”). This table should be read in conjunction with the Prospectus and the Statement of Additional Information2. All of the Trustees are also Members of the Audit and Governance Committees of each Trust in the Fund Complex. The mailing address of each Trustee and Officer is 525 Market Street, 12th Floor, San Francisco, CA 94105. Each Trustee and Officer serves an indefinite term, however, each Trustee serves such term until reaching the mandatory retirement age established by the Trustees.
Independent Trustees
Name and year of birth | Position held and length of service* | Principal occupations during past five years | Other directorships during past five years | |||
Peter G. Gordon (Born 1942) | Trustee, since 1998; Chairman, since 2005 | Co-Founder, Retired Chairman, President and CEO of Crystal Geyser Water Company. Trustee Emeritus, Colby College. | Asset Allocation Trust | |||
Isaiah Harris, Jr. (Born 1952) | Trustee, since 2009 | Retired. Prior thereto, President and CEO of BellSouth Advertising and Publishing Corp. from 2005 to 2007, President and CEO of BellSouth Enterprises from 2004 to 2005 and President of BellSouth Consumer Services from 2000 to 2003. Emeritus member of the Iowa State University Foundation Board of Governors. Emeritus Member of the Advisory Board of Iowa State University School of Business. Advisory Board Member, Palm Harbor Academy (charter school). Mr. Harris is a certified public accountant. | CIGNA Corporation; Deluxe Corporation; Asset Allocation Trust | |||
Judith M. Johnson (Born 1949) | Trustee, since 2008; Audit Committee Chairman, since 2008 | Retired. Prior thereto, Chief Executive Officer and Chief Investment Officer of Minneapolis Employees Retirement Fund from 1996 to 2008. Ms. Johnson is an attorney, certified public accountant and a certified managerial accountant. | Asset Allocation Trust | |||
Leroy Keith, Jr. (Born 1939) | Trustee, since 2010 | Chairman, Bloc Global Services (development and construction). Trustee of the Evergreen Funds from 1983 to 2010. Former Managing Director, Almanac Capital Management (commodities firm), former Partner, Stonington Partners, Inc. (private equity fund), former Director, Obagi Medical Products Co. and former Director, Lincoln Educational Services. | Trustee, Virtus Fund Complex (consisting of 50 portfolios as of 12/16/2013); Asset Allocation Trust | |||
David F. Larcker (Born 1950) | Trustee, since 2009 | James Irvin Miller Professor of Accounting at the Graduate School of Business, Stanford University, Morgan Stanley Director of the Center for Leadership Development and Research and Senior Faculty of The Rock Center for Corporate Governance since 2006. From 2005 to 2008, Professor of Accounting at the Graduate School of Business, Stanford University. Prior thereto, Ernst & Young Professor of Accounting at The Wharton School, University of Pennsylvania from 1985 to 2005. | Asset Allocation Trust | |||
Olivia S. Mitchell (Born 1953) | Trustee, since 2006 | International Foundation of Employee Benefit Plans Professor, Wharton School of the University of Pennsylvania since 1993. Director of Wharton’s Pension Research Council and Boettner Center on Pensions & Retirement Research, and Research Associate at the National Bureau of Economic Research. Previously, Cornell University Professor from 1978 to 1993. | Asset Allocation Trust | |||
Timothy J. Penny (Born 1951) | Trustee, since 1996 | President and CEO of Southern Minnesota Initiative Foundation, a non-profit organization, since 2007 and Senior Fellow at the Humphrey Institute Policy Forum at the University of Minnesota since 1995. Member of the Board of Trustees of NorthStar Education Finance, Inc., a non-profit organization, since 2007. | Asset Allocation Trust |
Table of Contents
| 28 | Wells Fargo Advantage VT Small Cap Growth Fund | Other information (unaudited) |
Name and year of birth | Position held and length of service* | Principal occupations during past five years | Other directorships during past five years | |||
Michael S. Scofield (Born 1943) | Trustee, since 2010 | Served on the Investment Company Institute’s Board of Governors and Executive Committee from 2008-2011 as well the Governing Council of the Independent Directors Council from 2006-2011 and the Independent Directors Council Executive Committee from 2008-2011. Chairman of the IDC from 2008-2010. Institutional Investor (Fund Directions) Trustee of Year in 2007. Trustee of the Evergreen Funds (and its predecessors) from 1984 to 2010. Chairman of the Evergreen Funds from 2000-2010. Former Trustee of the Mentor Funds. Retired Attorney, Law Offices of Michael S. Scofield. | Asset Allocation Trust | |||
Donald C. Willeke (Born 1940) | Trustee, since 1996 | Principal of the law firm of Willeke & Daniels. General Counsel of the Minneapolis Employees Retirement Fund from 1984 until its consolidation into the Minnesota Public Employees Retirement Association on June 30, 2010. Director and Vice Chair of The Tree Trust (non-profit corporation). Director of the American Chestnut Foundation (non-profit corporation). | Asset Allocation Trust |
| * | Length of service dates reflect the Trustee’s commencement of service with the Trust’s predecessor entities, where applicable. |
Officers
Name and year of birth | Position held and length of service | Principal occupations during past five years | ||||
Karla M. Rabusch (Born 1959) | President, since 2003 | Executive Vice President of Wells Fargo Bank, N.A. and President of Wells Fargo Funds Management, LLC since 2003. | ||||
Jeremy DePalma1 (Born 1974) | Treasurer, since 2012 | Senior Vice President of Wells Fargo Funds Management, LLC since 2009. Senior Vice President of Evergreen Investment Management Company, LLC from 2008 to 2010. Vice President, Evergreen Investment Services, Inc. from 2004 to 2007. Head of the Fund Reporting and Control Team within Fund Administration from 2005 to 2010. | ||||
C. David Messman (Born 1960) | Secretary, since 2000; Chief Legal Officer, since 2003 | Senior Vice President and Secretary of Wells Fargo Funds Management, LLC since 2001. Vice President and Managing Counsel of Wells Fargo Bank, N.A. since 1996. | ||||
Debra Ann Early (Born 1964) | Chief Compliance Officer, since 2007 | Chief Compliance Officer of Wells Fargo Funds Management, LLC since 2007. Chief Compliance Officer of Parnassus Investments from 2005 to 2007. Chief Financial Officer of Parnassus Investments from 2004 to 2007. | ||||
David Berardi (Born 1975) | Assistant Treasurer, since 2009 | Vice President of Wells Fargo Funds Management, LLC since 2009. Vice President of Evergreen Investment Management Company, LLC from 2008 to 2010. Assistant Vice President of Evergreen Investment Services, Inc. from 2004 to 2008. Manager of Fund Reporting and Control for Evergreen Investment Management Company, LLC from 2004 to 2010. |
| 1. | Jeremy DePalma acts as Treasurer of 59 funds and Assistant Treasurer of 73 funds in the Fund Complex. |
| 2. | The Statement of Additional Information includes additional information about the Trustees and is available, without charge, upon request, by calling 1-800-222-8222 or by visiting the website at wellsfargoadvantagefunds.com. |
Table of Contents
| List of abbreviations | Wells Fargo Advantage VT Small Cap Growth Fund | 29 |
The following is a list of common abbreviations for terms and entities that may have appeared in this report.
| ACA | — ACA Financial Guaranty Corporation |
| ADR | — American depositary receipt |
| ADS | — American depositary shares |
| AGC | — Assured Guaranty Corporation |
| AGM | — Assured Guaranty Municipal |
| Ambac | — Ambac Financial Group Incorporated |
| AMT | — Alternative minimum tax |
| AUD | — Australian dollar |
| BAN | — Bond anticipation notes |
| BHAC | — Berkshire Hathaway Assurance Corporation |
| BRL | — Brazilian real |
| CAB | — Capital appreciation bond |
| CAD | — Canadian dollar |
| CCAB | — Convertible capital appreciation bond |
| CDA | — Community Development Authority |
| CDO | — Collateralized debt obligation |
| CHF | — Swiss franc |
| COP | — Certificate of participation |
| DKK | — Danish krone |
| DRIVER | — Derivative inverse tax-exempt receipts |
| DW&P | — Department of Water & Power |
| DWR | — Department of Water Resources |
| ECFA | — Educational & Cultural Facilities Authority |
| EDA | — Economic Development Authority |
| EDFA | — Economic Development Finance Authority |
| ETF | — Exchange-traded fund |
| EUR | — Euro |
| FDIC | — Federal Deposit Insurance Corporation |
| FFCB | — Federal Farm Credit Banks |
| FGIC | — Financial Guaranty Insurance Corporation |
| FHA | — Federal Housing Administration |
| FHLB | — Federal Home Loan Bank |
| FHLMC | — Federal Home Loan Mortgage Corporation |
| FICO | — The Financing Corporation |
| FNMA | — Federal National Mortgage Association |
| FSA | — Farm Service Agency |
| GBP | — Great British pound |
| GDR | — Global depositary receipt |
| GNMA | — Government National Mortgage Association |
| GO | — General obligation |
| HCFR | — Healthcare facilities revenue |
| HEFA | — Health & Educational Facilities Authority |
| HEFAR | — Higher education facilities authority revenue |
| HFA | — Housing Finance Authority |
| HFFA | — Health Facilities Financing Authority |
| HKD | — Hong Kong dollar |
| HUD | — Department of Housing and Urban Development |
| HUF | — Hungarian forint |
| IDA | — Industrial Development Authority |
| IDAG | — Industrial Development Agency |
| IDR | — Industrial development revenue |
| IEP | — Irish pound |
| JPY | — Japanese yen |
| KRW | — Republic of Korea won |
| LIBOR | — London Interbank Offered Rate |
| LIQ | — Liquidity agreement |
| LLC | — Limited liability company |
| LLP | — Limited liability partnership |
| LOC | — Letter of credit |
| LP | — Limited partnership |
| MBIA | — Municipal Bond Insurance Association |
| MFHR | — Multifamily housing revenue |
| MSTR | — Municipal securities trust receipts |
| MTN | — Medium-term note |
| MUD | — Municipal Utility District |
| MXN | — Mexican peso |
| MYR | — Malaysian ringgit |
| National | — National Public Finance Guarantee Corporation |
| NGN | — Nigerian naira |
| NOK | — Norwegian krone |
| NZD | — New Zealand dollar |
| PCFA | — Pollution Control Financing Authority |
| PCL | — Public Company Limited |
| PCR | — Pollution control revenue |
| PFA | — Public Finance Authority |
| PFFA | — Public Facilities Financing Authority |
| PFOTER | — Puttable floating option tax-exempt receipts |
| plc | — Public limited company |
| PLN | — Polish zloty |
| PUTTER | — Puttable tax-exempt receipts |
| R&D | — Research & development |
| Radian | — Radian Asset Assurance |
| RAN | — Revenue anticipation notes |
| RDA | — Redevelopment Authority |
| RDFA | — Redevelopment Finance Authority |
| REIT | — Real estate investment trust |
| ROC | — Reset option certificates |
| RON | — Romanian lei |
| RUB | — Russian ruble |
| SAVRS | — Select auction variable rate securities |
| SBA | — Small Business Authority |
| SEK | — Swedish krona |
| SFHR | — Single-family housing revenue |
| SFMR | — Single-family mortgage revenue |
| SGD | — Singapore dollar |
| SKK | — Slovakian koruna |
| SPA | — Standby purchase agreement |
| SPDR | — Standard & Poor’s Depositary Receipts |
| STRIPS | — Separate trading of registered interest and principal securities |
| TAN | — Tax anticipation notes |
| TBA | — To be announced |
| THB | — Thai baht |
| TIPS | — Treasury inflation-protected securities |
| TRAN | — Tax revenue anticipation notes |
| TRY | — Turkish lira |
| TTFA | — Transportation Trust Fund Authority |
| TVA | — Tennessee Valley Authority |
| ZAR | — South African rand |
Table of Contents
This page is intentionally left blank.
Table of Contents
This page is intentionally left blank.
Table of Contents
This page is intentionally left blank.
Table of Contents


For more information
More information about Wells Fargo Advantage Funds is available free upon request. To obtain literature, please write, email, visit the Fund’s website, or call:
Wells Fargo Advantage Funds
P.O. Box 8266
Boston, MA 02266-8266
Email: wfaf@wellsfargo.com
Website: wellsfargoadvantagefunds.com
Individual investors: 1-800-222-8222
Retail investment professionals: 1-888-877-9275
Institutional investment professionals: 1-866-765-0778
This report and the financial statements contained herein are submitted for the general information of the shareholders of Wells Fargo Advantage Funds. If this report is used for promotional purposes, distribution of the report must be accompanied or preceded by a current prospectus. For a current prospectus and, if available, a summary prospectus containing more complete information, including charges and expenses, call 1-800-222-8222 or visit the Fund’s website at wellsfargoadvantagefunds.com . Please consider the investment objectives, risks, charges, and expenses of the investment carefully before investing. This and other information about Wells Fargo Advantage Funds can be found in the current prospectus. Read the prospectus carefully before you invest or send money.
Wells Fargo Funds Management, LLC, a wholly owned subsidiary of Wells Fargo & Company, provides investment advisory and administrative services for Wells Fargo Advantage Funds. Other affiliates of Wells Fargo & Company provide subadvisory and other services for the Funds. The Funds are distributed by Wells Fargo Funds Distributor, LLC, Member FINRA/SIPC, an affiliate of Wells Fargo & Company.
NOT FDIC INSURED ¡ NO BANK GUARANTEE ¡ MAY LOSE VALUE
© 2014 Wells Fargo Funds Management, LLC. All rights reserved.
222098 02-14 AVT7/AR153 12-13 |
Table of Contents

Wells Fargo Advantage VT Small Cap Value Fund

Annual Report
December 31, 2013

Table of Contents
Reduce clutter. Save trees.
Sign up for electronic delivery of prospectuses and shareholder reports at wellsfargo.com/advantagedelivery
| 2 | ||||
| 4 | ||||
| 8 | ||||
| 9 | ||||
Financial statements | ||||
| 14 | ||||
| 15 | ||||
| 16 | ||||
| 17 | ||||
| 19 | ||||
| 24 | ||||
| 25 | ||||
| 28 | ||||
The views expressed and any forward-looking statements are as of December 31, 2013, unless otherwise noted, and are those of the Fund managers and/or Wells Fargo Funds Management, LLC. Discussions of individual securities, or the markets generally, or any Wells Fargo Advantage Fund are not intended as individual recommendations. Future events or results may vary significantly from those expressed in any forward-looking statements; the views expressed are subject to change at any time in response to changing circumstances in the market. Wells Fargo Funds Management, LLC and the Fund disclaim any obligation to publicly update or revise any views expressed or forward-looking statements.
NOT FDIC INSURED ¡ NO BANK GUARANTEE ¡ MAY LOSE VALUE
Table of Contents
| 2 | Wells Fargo Advantage VT Small Cap Value Fund | Letter to shareholders (unaudited) |

Karla M. Rabusch
President
Wells Fargo Advantage Funds
Major central banks continued to inject liquidity into the banks and the markets through various quantitative easing policies.
Dear Valued Shareholder:
We are pleased to offer you this annual report for the Wells Fargo Advantage VT Small Cap Value Fund for the 12-month period that ended December 31, 2013. Much of the period was marked by monetary easing by global central banks. During the period, investor concerns that the U.S. Federal Reserve (Fed) would end its bond-buying program initially led to higher interest rates, resulting in losses for bond indexes and volatility for global stock indexes. These fears dissipated in late September 2013 and ended altogether in mid-December 2013 when the Fed announced a tapering timeline that was far more moderate than some had feared. Growing confidence that the U.S. economy was staging a fragile recovery resulted in double-digit returns for domestic stock market indexes for the 12-month reporting period.
Central banks continued to provide stimulus.
Major central banks continued to inject liquidity into the banks and the markets through various quantitative easing policies. Throughout the reporting period, the Federal Open Market Committee (FOMC)—the Fed’s monetary policymaking body—kept its key interest rate near zero in order to support the economy and the financial system. Entering the reporting period, the FOMC had committed to purchase $40 billion per month in mortgage-backed securities to support the housing market and $45 billion per month in long-term U.S. Treasuries to keep interest rates low. Because the markets benefited from the FOMC’s liquidity, the prices of both stocks and bonds initially fell after the FOMC indicated in May 2013 that it might reduce (or taper) its bond-buying program. In mid-December 2013, the FOMC announced that it would reduce its bond-buying program by $10 billion per month beginning in January 2014. The tapering was less aggressive than some investors had feared, and the markets ended 2013 strongly.
European markets continued to benefit from the European Central Bank’s (ECB’s) September 2012 announcement that it would purchase an unlimited amount of one- to three-year sovereign debt from countries that had formally applied for a bailout. As a result, when the tiny eurozone nation of Cyprus was forced to implement capital controls and impose losses on uninsured bank depositors in March 2013, global stock markets remained resilient despite short-term volatility. In May 2013, the ECB cut its key rate to a then-historic low of 0.5%. The ECB’s aggressive actions helped ease investor worries about a eurozone sovereign debt default. Given the substantial ties between the U.S. and Europe, the improved sentiment about the eurozone helped provide a tailwind for U.S. markets.
U.S. stock markets gained on relatively good news.
For most of the period, U.S. economic data remained moderately positive, gaining strength as the period progressed. Reported gross domestic product growth came in at a solid 1.1% annualized rate in the first quarter of 2013, a 2.5% annualized rate in the second quarter, a 4.1% annualized rate in the third quarter, and a 3.2% annualized rate (an advance estimate as of January 31, 2014) in the fourth quarter.
The most significant negative effect was the ongoing fight in Washington, D.C., over the federal budget and debt limit. The Budget Control Act of 2011, which was passed to resolve a previous fight over the federal debt ceiling, mandated budget sequestration that took effect on March 1, 2013, and was an overhang on economic growth throughout the remainder of the reporting period. Most recently, Congress was unable to pass a resolution to continue to fund the federal government, and thus, the federal government underwent a partial shutdown from September 30, 2013, through October 16, 2013. The government reopened after the president and Congress reached a deal that funded the government through January 15, 2014, and raised the debt limit through February 7, 2014. In December 2013, Congress passed the Ryan-Murray budget agreement, which funded the government through fiscal 2015, lessening the near-term prospect of another shutdown.
Table of Contents
| Letter to shareholders (unaudited) | Wells Fargo Advantage VT Small Cap Value Fund | 3 |
Despite political headwinds, the relatively positive outlook for the U.S. economy contributed to a strong domestic stock market for most of the reporting period. Economically sensitive sectors, such as industrials and consumer discretionary, outperformed. Dividend-paying stocks led the market earlier in 2013 as investors sought yield in a historically low-yielding environment, but rising interest rates later in the period dampened their relative performance. Judging by various Russell indexes, small-cap stocks outperformed large-cap stocks, and growth stocks outperformed value stocks.
Don’t let short-term uncertainty derail long-term investment goals.
While periods of uncertainty can present challenges, they can also create opportunities, and experience has taught us that maintaining long-term investment goals can be an effective way to plan for the future. Although diversification cannot guarantee an investment profit or prevent losses, we believe it can be an effective way to manage investment risk and potentially smooth out overall portfolio performance. We encourage investors to know their investments and to understand that appropriate levels of risk-taking may unlock opportunities.
Thank you for choosing to invest with Wells Fargo Advantage Funds. We appreciate your confidence in us and remain committed to helping you meet your financial needs. For current information about your fund investments, contact your investment professional, visit our website at wellsfargoadvantagefunds.com, or call us directly at 1-800-222-8222. We are available 24 hours a day, 7 days a week.
Sincerely,

Karla M. Rabusch
President
Wells Fargo Advantage Funds
Despite political headwinds, the relatively positive outlook for the U.S. economy contributed to a strong domestic stock market for most of the reporting period.
Notice to shareholders
The Fund and Funds Management, LLC (“Funds Management”) have received an exemptive order from the SEC that permits Funds Management, subject to the approval of the Board of Trustees of the Fund, to select or replace certain subadvisers to manage all or a portion of the Fund’s assets and enter into, amend or terminate a sub-advisory agreement with certain subadvisers without obtaining shareholder approval (“Multi-manager Structure”). The Multi-manager Structure applies to subadvisers that are not affiliated with Funds Management or the Fund, except to the extent that affiliation arises solely because such subadvisers provide sub-advisory services to the Fund (“Non-affiliated Subadvisers”), as well as subadvisers that are indirect or direct wholly-owned subsidiaries of Funds Management or of another company that, indirectly or directly, wholly owns Funds Management (“Wholly-owned Subadvisers”).
Pursuant to the SEC order, Funds Management, with the approval of the Board of Trustees, has the discretion to terminate any subadvisers and allocate and reallocate the Fund’s assets among any other Non-affiliated Subadvisers or Wholly-owned Subadvisers. Funds Management, subject to oversight and supervision by the Board of Trustees, has responsibility to continue to oversee any subadvisers to the Fund and to recommend, for approval by the Board of Trustees, the hiring, termination and replacement of subadvisers for the Fund. In the event that a new subadviser is hired pursuant to the Multi-manager Structure, the Fund is required to provide notice to shareholders within 90 days.
Please contact your investment professional or call us directly at 1-800-222-8222 if you have any questions on this Notice to Shareholders.
Table of Contents
| 4 | Wells Fargo Advantage VT Small Cap Value Fund | Performance highlights (unaudited) |
Investment objective
The Fund seeks long-term capital appreciation.
Adviser
Wells Fargo Funds Management, LLC
Subadviser
Wells Capital Management Incorporated
Portfolio managers
Erik C. Astheimer
I. Charles Rinaldi
Michael Schneider, CFA
Average annual total returns1 (%) as of December 31, 2013
| Expense ratios2 (%) | ||||||||||||||||||||||
| Inception date | 1 year | 5 year | 10 year | Gross | Net3 | |||||||||||||||||
| Class 1 | 7-16-2010 | 15.03 | 18.11 | 7.14 | 1.10 | 0.90 | ||||||||||||||||
| Class 2 | 10-10-1997 | 14.75 | 17.90 | 7.04 | 1.35 | 1.15 | ||||||||||||||||
| Russell 2000® Value Index4 | – | 34.52 | 17.64 | 8.61 | – | – | ||||||||||||||||
Figures quoted represent past performance, which is no guarantee of future results and do not reflect the deduction of taxes that a shareholder may pay on fund distributions or the redemption of fund shares. Investment return and principal value of an investment will fluctuate so that an investor’s shares, when redeemed, may be worth more or less than their original cost. Current performance may be lower or higher than the performance data quoted, which assumes the reinvestment of dividends and capital gains. Current month-end performance is available by calling 1-800-222-8222. Performance figures of the Fund do not reflect fees charged pursuant to the terms of variable life insurance policies and variable annuity contracts. If fees had been reflected, performance would have been lower.
Index returns do not include transaction costs associated with buying and selling securities, any mutual fund fees or expenses, or any taxes. It is not possible to invest directly in an index.
Stock values fluctuate in response to the activities of individual companies and general market and economic conditions. Smaller-company stocks tend to be more volatile and less liquid than those of larger companies. The use of derivatives may reduce returns and/or increase volatility. Certain investment strategies tend to increase the total risk of an investment (relative to the broader market). The Fund is exposed to foreign investment risk. Consult the Fund’s prospectus for additional information on these and other risks.
Please refer to the prospectus provided by your participating insurance company for detailed information describing the separate accounts for information regarding surrender charges, mortality and expense risk fees, and other charges that may be assessed by the participating insurance companies.
Please see footnotes on page 5.
Table of Contents
| Performance highlights (unaudited) | Wells Fargo Advantage VT Small Cap Value Fund | 5 |
| Growth of $10,000 investment5 as of December 31, 2013 | ||
| ||
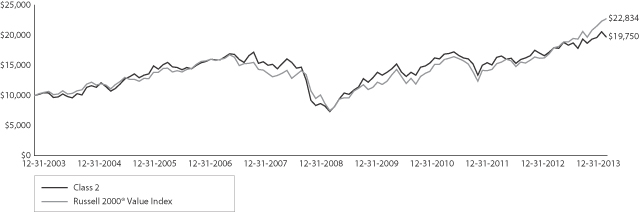
| 1. | Historical performance shown for Class 1 shares prior to their inception reflects the performance of Class 2 shares, and includes the higher expenses applicable to Class 2 shares. If these expenses had not been included, returns would be higher. |
| 2. | Reflects the expense ratios as stated in the most recent prospectuses. |
| 3. | The Adviser has committed through April 30, 2014, to waive fees and/or reimburse expenses to the extent necessary to cap the Fund’s Total Annual Fund Operating Expenses After Fee Waiver, excluding certain expenses, at 0.89% for Class 1 and 1.14% for Class 2. Brokerage commissions, stamp duty fees, interest, taxes, acquired fund fees and expenses, and extraordinary expenses are excluded from the cap. Without this cap, the Fund’s returns would have been lower. |
| 4. | The Russell 2000® Value Index measures the performance of those Russell 2000 companies with lower price-to-book ratios and lower forecasted growth values. You cannot invest directly in an index. |
| 5. | The chart compares the performance of Class 2 shares for the most recent ten years with the Russell 2000 Value Index. The chart assumes a hypothetical $10,000 investment and reflects all operating expenses of the Fund. Performance figures of the Fund do not reflect fees charged pursuant to the terms of variable life insurance policies and variable annuity contracts. |
| 6. | The ten largest equity holdings are calculated based on the value of the securities divided by total net assets of the Fund. Holdings are subject to change and may have changed since the date specified. |
| 7. | Sector distribution is subject to change and is calculated based on the total long-term investments of the Fund. |
| 8. | Diversification does not assure or guarantee better performance and cannot eliminate the risk of investment losses. |
Table of Contents
| 6 | Wells Fargo Advantage VT Small Cap Value Fund | Performance highlights (unaudited) |
MANAGER’S DISCUSSION
Fund highlights
| n | The Fund underperformed its benchmark, the Russell 2000 Value Index, for the 12-month period that ended December 31, 2013. |
| n | The Fund’s overweight in metals and mining companies (which comprised approximately 12% of the portfolio) was the primary detractor as mining stocks declined sharply during the period in stark contrast to a surging equity market. |
| n | Strong stock selection in industrials and an underweight in financials, a relative underperformer during the period, provided some offset from underperforming mining stocks. |
Our position in mining stocks caused the Fund to lag a strong stock market.
The equity market rose sharply during the period, fueled by the Federal Reserve’s (Fed’s) bond-buying program, which helped spark a housing recovery and improved corporate profits. Given the lack of superior investment alternatives, investors rotated into U.S. stocks and pushed prices toward all-time highs.
While the Fund did have strong performance in certain sectors, its approximately 12% investment in mining stocks—with an emphasis on gold miners—was by far the most significant detractor for the period. After appreciating for 12 consecutive years, gold slumped badly and declined 28% during 2013. Gold-mining stocks turned in an even worse performance. While it is frustrating to sit through this correction, we don’t believe the long-term fundamentals for gold have changed. Gold’s appreciation in recent years has been closely correlated with a sharp rise in investment demand, which we believe will continue as massive monetary easing by global central banks should eventually make fiat (or paper) currency less appealing. We believe that gold, the historical hard currency, remains the most logical investment alternative. Moreover, as a result of gold’s recent decline, gold-mining companies are cutting budgets and controlling costs to adjust to the current environment, which should translate into lower industry output.
| Ten largest equity holdings6 (%) as of December 31, 2013 | ||||
InterOil Corporation | 7.28 | |||
Randgold Resources Limited ADR | 6.14 | |||
Chimera Investment Corporation | 4.60 | |||
United Continental Holdings Incorporated | 2.95 | |||
Delta Air Lines Incorporated | 2.80 | |||
Argo Group International Holdings Limited | 2.61 | |||
Newpark Resources Incorporated | 2.58 | |||
Range Resources Corporation | 2.34 | |||
Cray Incorporated | 2.32 | |||
Trilogy Energy Corporation | 2.16 | |||
While we are positive on gold, our approach has always been company-specific and expressed through investment in mining stocks rather than the actual metal. The rationale for investing in miners is our belief that in a rising market, stocks should provide greater upside through production growth and new discoveries, cost efficiencies, and potential mergers and acquisitions; such factors do not come into play if one simply owns the metal. The Fund has had investments in gold miners going back more than a decade, and the group has historically been a key driver of outperformance.
While we view current valuations as attractive, we are not actively increasing our weighting given that we already have a sizable overweight relative to our benchmark,
which has minimal exposure to the group. Capital appreciation potential aside, we believe this allocation is prudent as gold-mining stocks generally had lower correlation to other equity assets and thus helped temper the Fund’s overall risk profile.
We maintained our emphasis on bottom-up stock selection.
Consistent with our stock-picking approach, the majority of our precious metals weight is in Randgold Resources Limited, a high-quality miner that we’ve owned since 2004. The company has maintained more cash than debt on its balance sheet, and we believe that Randgold Resources is well positioned to deliver profitable production growth and strong cash flow in the next several years. In our view, the company’s management is the best in the industry. We believe that Randgold Resources should be able to thrive even in the current market environment.
Top holding InterOil Corporation declined 7% during the 12-month period, resulting in underperformance from the portfolio’s energy holdings. The company is a special situation investment unrelated to the North America energy market. InterOil owns licenses in Papua New Guinea covering 3.9 million acres and has drilled several wells with promising results.
Please see footnotes on page 5.
Table of Contents
| Performance highlights (unaudited) | Wells Fargo Advantage VT Small Cap Value Fund | 7 |
As a result of the exploration success, the company announced a transaction in December with Total SA whereby it could sell a 61.3% gross interest (upon certain approvals) in its most advanced field covered by a specific license. While the stock performed poorly on this announcement, we believe the deal’s valuation is not accurately reflected in the stock. More important, we believe the deal paves the way for the company to advance activity on its other drilling prospects and sets up additional catalysts for the stock.
The Fund’s holdings in the industrials sector are headlined by United Continental Holdings Incorporated and Delta Air Lines Incorporated. The stocks rose 133% and 62%, respectively, during the period. United and Delta are both operating with a good tailwind as airline mergers have resulted in a gradual reduction in industry capacity and thus firmer pricing. The companies are finding new sources of increased revenue, specifically via ancillary services (such as baggage fees) and upsells (such as inducing passengers to pay for a higher service tier). The companies’ greater emphasis on profitability was evidenced by strong earnings during the period.
| Sector distribution7 as of December 31, 2013 | ||
| ||
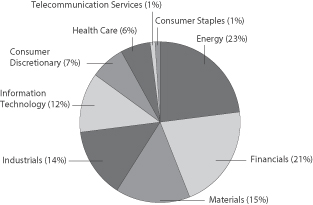
We continue to follow our investment process, which has served us well over time.
While we are disappointed that the Fund’s performance lagged the broad market and our benchmark during the period, we are sticking to our conviction and are focused on broadening the diversification8 of the portfolio. We believe that considerable market risks remain, including political gridlock, tepid economic growth, the end of the Fed’s bond-buying program, and higher stock price valuations. In this environment, we believe the prudent approach is to maintain broad diversification and follow our proven investment process. Although we are not satisfied with our recent results, we remain disciplined in our investment process—a process that has served our clients well over the past 16 years.
Please see footnotes on page 5.
Table of Contents
| 8 | Wells Fargo Advantage VT Small Cap Value Fund | Fund expenses (unaudited) |
As a shareholder of the Fund, you incur ongoing costs, including management fees, distribution (12b-1) fees, and other Fund expenses. This example is intended to help you understand your ongoing costs (in dollars) of investing in the Fund and to compare these costs with the ongoing costs of investing in other mutual funds.
The example is based on an investment of $1,000 invested at the beginning of the six-month period and held for the entire period from July 1, 2013 to December 31, 2013.
Actual expenses
The “Actual” line of the table below provides information about actual account values and actual expenses. You may use the information in this line, together with the amount you invested, to estimate the expenses that you paid over the period. Simply divide your account value by $1,000 (for example, an $8,600 account value divided by $1,000 = 8.6), then multiply the result by the number in the “Actual” line under the heading entitled “Expenses Paid During Period” for your applicable class of shares to estimate the expenses you paid on your account during this period.
Hypothetical example for comparison purposes
The “Hypothetical” line of the table below provides information about hypothetical account values and hypothetical expenses based on the Fund’s actual expense ratio and an assumed rate of return of 5% per year before expenses, which is not the Fund’s actual return. The hypothetical account values and expenses may not be used to estimate the actual ending account balance or expenses you paid for the period. You may use this information to compare the ongoing costs of investing in the Fund and other funds. To do so, compare this 5% hypothetical example with the 5% hypothetical examples that appear in the shareholder reports of the other funds.
Please note that the expenses shown in the table are meant to highlight your ongoing costs only and do not reflect any separate account charges assessed by participating insurance companies. Therefore, the “Hypothetical” line of the table is useful in comparing ongoing costs only, and will not help you determine the relative total costs of owning different funds. In addition, if these separate account charges assessed by participating insurance companies were included, your costs would have been higher.
| Beginning account value 7-1-2013 | Ending account value 12-31-2013 | Expenses paid during the period1 | Net annual expense ratio | |||||||||||||
Class 1 | ||||||||||||||||
Actual | $ | 1,000.00 | $ | 1,105.66 | $ | 4.72 | 0.89 | % | ||||||||
Hypothetical (5% return before expenses) | $ | 1,000.00 | $ | 1,020.72 | $ | 4.53 | 0.89 | % | ||||||||
Class 2 | ||||||||||||||||
Actual | $ | 1,000.00 | $ | 1,104.07 | $ | 6.05 | 1.14 | % | ||||||||
Hypothetical (5% return before expenses) | $ | 1,000.00 | $ | 1,019.46 | $ | 5.80 | 1.14 | % | ||||||||
| 1. | Expenses paid is equal to the annualized expense ratio of each class multiplied by the average account value over the period, multiplied by the number of days in the most recent fiscal half-year divided by the number of days in the fiscal year (to reflect the one-half year period). |
Table of Contents
| Portfolio of investments—December 31, 2013 | Wells Fargo Advantage VT Small Cap Value Fund | 9 |
| Security name | Shares | Value | ||||||||||
Common Stocks: 95.10% | ||||||||||||
Consumer Discretionary: 6.66% | ||||||||||||
| Auto Components: 0.64% | ||||||||||||
Fox Factory Holding Corporation † | 1,900 | $ | 33,478 | |||||||||
Gentex Corporation | 8,800 | 290,312 | ||||||||||
| 323,790 | ||||||||||||
|
| |||||||||||
| Diversified Consumer Services: 0.81% | ||||||||||||
Corinthian Colleges Incorporated † | 141,500 | 251,870 | ||||||||||
Strayer Education Incorporated † | 4,600 | 158,562 | ||||||||||
| 410,432 | ||||||||||||
|
| |||||||||||
| Hotels, Restaurants & Leisure: 2.32% | ||||||||||||
Denny’s Corporation † | 47,300 | 340,087 | ||||||||||
Scientific Games Corporation Class A † | 9,600 | 162,528 | ||||||||||
The Wendy’s Company | 77,400 | 674,928 | ||||||||||
| 1,177,543 | ||||||||||||
|
| |||||||||||
| Household Durables: 2.29% | ||||||||||||
Cavco Industries Incorporated † | 12,400 | 851,880 | ||||||||||
Harman International Industries Incorporated | 2,600 | 212,810 | ||||||||||
KB Home Incorporated | 5,500 | 100,540 | ||||||||||
| 1,165,230 | ||||||||||||
|
| |||||||||||
| Specialty Retail: 0.60% | ||||||||||||
Stage Stores Incorporated | 6,000 | 133,320 | ||||||||||
Vitamin Shoppe Incorporated † | 3,300 | 171,633 | ||||||||||
| 304,953 | ||||||||||||
|
| |||||||||||
Consumer Staples: 0.72% | ||||||||||||
| Personal Products: 0.72% | ||||||||||||
Prestige Brands Holdings Incorporated † | 10,200 | 365,160 | ||||||||||
|
| |||||||||||
Energy: 22.08% | ||||||||||||
| Energy Equipment & Services: 9.74% | ||||||||||||
Ensco plc Class A | 2,000 | 114,360 | ||||||||||
Helix Energy Solutions Group Incorporated † | 23,000 | 533,140 | ||||||||||
Helmerich & Payne Incorporated | 7,500 | 630,600 | ||||||||||
ION Geophysical Corporation † | 99,000 | 326,700 | ||||||||||
Key Energy Services Incorporated † | 44,200 | 349,180 | ||||||||||
Newpark Resources Incorporated † | 106,400 | 1,307,656 | ||||||||||
Oceaneering International Incorporated | 4,800 | 378,624 | ||||||||||
Parker Drilling Company † | 46,100 | 374,793 | ||||||||||
PHI Incorporated (non-voting) † | 9,000 | 390,600 | ||||||||||
PHI Incorporated (voting) † | 900 | 35,757 | ||||||||||
Vantage Drilling Company † | 58,000 | 106,720 | ||||||||||
Willbros Group Incorporated † | 41,700 | 392,814 | ||||||||||
| 4,940,944 | ||||||||||||
|
| |||||||||||
The accompanying notes are an integral part of these financial statements.
Table of Contents
| 10 | Wells Fargo Advantage VT Small Cap Value Fund | Portfolio of investments—December 31, 2013 |
| Security name | Shares | Value | ||||||||||
| Oil, Gas & Consumable Fuels: 12.34% | ||||||||||||
Clean Energy Fuels Corporation † | 4,300 | $ | 55,384 | |||||||||
InterOil Corporation † | 71,700 | 3,691,833 | ||||||||||
Newfield Exploration Company † | 9,300 | 229,059 | ||||||||||
Range Resources Corporation | 14,100 | 1,188,771 | ||||||||||
Trilogy Energy Corporation | 43,200 | 1,094,010 | ||||||||||
| 6,259,057 | ||||||||||||
|
| |||||||||||
Financials: 19.89% | ||||||||||||
| Commercial Banks: 4.06% | ||||||||||||
Ameris Bancorp † | 1,800 | 37,998 | ||||||||||
Bancorp Incorporated † | 19,000 | 340,290 | ||||||||||
BBCN Bancorp Incorporated | 8,788 | 145,793 | ||||||||||
CenterState Banks Incorporated | 17,900 | 181,685 | ||||||||||
City National Corporation | 2,400 | 190,128 | ||||||||||
First Horizon National Corporation | 24,300 | 283,095 | ||||||||||
First Niagara Financial Group Incorporated | 30,200 | 320,724 | ||||||||||
IBERIABANK Corporation | 4,200 | 263,970 | ||||||||||
National Bank Holdings Corporation Class A | 8,800 | 188,320 | ||||||||||
Park Sterling Corporation | 14,900 | 106,386 | ||||||||||
| 2,058,389 | ||||||||||||
|
| |||||||||||
| Consumer Finance: 0.61% | ||||||||||||
Cash America International Incorporated | 8,100 | 310,230 | ||||||||||
|
| |||||||||||
| Insurance: 4.11% | ||||||||||||
Argo Group International Holdings Limited | 28,500 | 1,324,965 | ||||||||||
Hilltop Holdings Incorporated † | 11,700 | 270,621 | ||||||||||
Mercury General Corporation | 4,700 | 233,637 | ||||||||||
OneBeacon Insurance Group Limited | 16,200 | 256,284 | ||||||||||
| 2,085,507 | ||||||||||||
|
| |||||||||||
| REITs: 10.96% | ||||||||||||
Anworth Mortgage Asset Corporation | 27,500 | 115,775 | ||||||||||
Capstead Mortgage Corporation | 34,300 | 414,344 | ||||||||||
Chimera Investment Corporation | 752,700 | 2,333,370 | ||||||||||
GEO Group Incorporated | 7,000 | 225,540 | ||||||||||
Hatteras Financial Corporation | 12,400 | 202,616 | ||||||||||
Invesco Mortgage Capital Incorporated | 46,600 | 684,088 | ||||||||||
MFA Mortgage Investments Incorporated | 76,700 | 541,502 | ||||||||||
Redwood Trust Incorporated | 29,600 | 573,352 | ||||||||||
Sun Communities Incorporated | 11,000 | 469,040 | ||||||||||
| 5,559,627 | ||||||||||||
|
| |||||||||||
| Thrifts & Mortgage Finance: 0.15% | ||||||||||||
Northwest Bancshares Incorporated | 5,100 | 75,378 | ||||||||||
|
| |||||||||||
The accompanying notes are an integral part of these financial statements.
Table of Contents
| Portfolio of investments—December 31, 2013 | Wells Fargo Advantage VT Small Cap Value Fund | 11 |
| Security name | Shares | Value | ||||||||||
Health Care: 5.97% | ||||||||||||
| Health Care Equipment & Supplies: 2.08% | ||||||||||||
Hologic Incorporated † | 10,700 | $ | 239,145 | |||||||||
OraSure Technologies Incorporated † | 100,900 | 634,661 | ||||||||||
Thoratec Corporation † | 3,000 | 109,800 | ||||||||||
Varian Medical Systems Incorporated † | 900 | 69,921 | ||||||||||
| 1,053,527 | ||||||||||||
|
| |||||||||||
| Health Care Providers & Services: 2.80% | ||||||||||||
Air Methods Corporation | 1,800 | 104,994 | ||||||||||
Amedisys Incorporated † | 14,500 | 212,135 | ||||||||||
Cross Country Healthcare Incorporated † | 37,537 | 374,619 | ||||||||||
Gentiva Health Services Incorporated † | 36,200 | 449,242 | ||||||||||
Healthways Incorporated † | 18,400 | 282,440 | ||||||||||
| 1,423,430 | ||||||||||||
|
| |||||||||||
| Health Care Technology: 0.54% | ||||||||||||
Allscripts Healthcare Solutions Incorporated † | 16,900 | 261,274 | ||||||||||
Medidata Solutions Incorporated † | 200 | 12,114 | ||||||||||
| 273,388 | ||||||||||||
|
| |||||||||||
| Life Sciences Tools & Services: 0.55% | ||||||||||||
Nordion Incorporated † | 23,200 | 196,968 | ||||||||||
Parexel International Corporation † | 1,800 | 81,324 | ||||||||||
| 278,292 | ||||||||||||
|
| |||||||||||
Industrials: 13.12% | ||||||||||||
| Airlines: 7.05% | ||||||||||||
American Airlines Group Incorporated † | 17,100 | 431,775 | ||||||||||
Delta Air Lines Incorporated | 51,700 | 1,420,199 | ||||||||||
LATAM Airlines Group SP ADR | 13,795 | 224,996 | ||||||||||
United Continental Holdings Incorporated † | 39,600 | 1,498,068 | ||||||||||
| 3,575,038 | ||||||||||||
|
| |||||||||||
| Commercial Services & Supplies: 3.01% | ||||||||||||
ABM Industries Incorporated | 24,500 | 700,455 | ||||||||||
ACCO Brands Corporation † | 90,500 | 608,160 | ||||||||||
Healthcare Services Group Incorporated | 7,800 | 221,286 | ||||||||||
| 1,529,901 | ||||||||||||
|
| |||||||||||
| Construction & Engineering: 0.86% | ||||||||||||
Primoris Services Corporation | 14,030 | 436,754 | ||||||||||
|
| |||||||||||
| Electrical Equipment: 0.95% | ||||||||||||
GrafTech International Limited † | 42,800 | 480,644 | ||||||||||
|
| |||||||||||
| Professional Services: 0.59% | ||||||||||||
Hill International Incorporated † | 44,800 | 176,960 | ||||||||||
Kforce Incorporated | 5,900 | 120,714 | ||||||||||
| 297,674 | ||||||||||||
|
| |||||||||||
The accompanying notes are an integral part of these financial statements.
Table of Contents
| 12 | Wells Fargo Advantage VT Small Cap Value Fund | Portfolio of investments—December 31, 2013 |
| Security name | Shares | Value | ||||||||||
| Road & Rail: 0.35% | ||||||||||||
Covenant Transport Incorporated Class A † | 21,700 | $ | 178,157 | |||||||||
|
| |||||||||||
| Trading Companies & Distributors: 0.31% | ||||||||||||
Applied Industrial Technologies Incorporated | 3,200 | 157,088 | ||||||||||
|
| |||||||||||
Information Technology: 11.31% | ||||||||||||
| Communications Equipment: 1.64% | ||||||||||||
Alcatel-Lucent SA ADR | 23,200 | 102,080 | ||||||||||
Brocade Communications Systems Incorporated † | 52,300 | 463,901 | ||||||||||
Harmonic Incorporated † | 35,950 | 265,311 | ||||||||||
| 831,292 | ||||||||||||
|
| |||||||||||
| Computers & Peripherals: 2.66% | ||||||||||||
Cray Incorporated † | 42,900 | 1,178,034 | ||||||||||
Quantum Corporation † | 106,100 | 127,320 | ||||||||||
Silicon Graphics International Corporation † | 3,400 | 45,594 | ||||||||||
| 1,350,948 | ||||||||||||
|
| |||||||||||
| Electronic Equipment, Instruments & Components: 5.53% | ||||||||||||
Checkpoint Systems Incorporated † | 23,600 | 372,172 | ||||||||||
Cognex Corporation | 17,400 | 664,332 | ||||||||||
Coherent Incorporated | 11,700 | 870,363 | ||||||||||
OSI Systems Incorporated † | 16,900 | 897,559 | ||||||||||
| 2,804,426 | ||||||||||||
|
| |||||||||||
| Internet Software & Services: 0.65% | ||||||||||||
Gogo Incorporated †# | 8,700 | 215,847 | ||||||||||
Monster Worldwide Incorporated † | 15,700 | 111,941 | ||||||||||
| 327,788 | ||||||||||||
|
| |||||||||||
| Semiconductors & Semiconductor Equipment: 0.31% | ||||||||||||
Kulicke & Soffa Industries Incorporated † | 12,000 | 159,600 | ||||||||||
|
| |||||||||||
| Software: 0.52% | ||||||||||||
Accelrys Incorporated † | 27,500 | 262,350 | ||||||||||
|
| |||||||||||
Materials: 14.14% | ||||||||||||
| Chemicals: 0.50% | ||||||||||||
Calgon Carbon Corporation † | 12,200 | 250,954 | ||||||||||
|
| |||||||||||
| Containers & Packaging: 0.40% | ||||||||||||
Intertape Polymer Group Incorporated | 15,400 | 203,126 | ||||||||||
|
| |||||||||||
| Metals & Mining: 12.79% | ||||||||||||
Agnico-Eagle Mines Limited | 12,600 | 332,388 | ||||||||||
Carpenter Technology Corporation | 9,700 | 603,340 | ||||||||||
Dominion Diamond Corporation † | 8,600 | 123,496 | ||||||||||
NovaGold Resources Incorporated † | 53,500 | 135,890 | ||||||||||
Osisko Mining Corporation † | 9,400 | 41,642 | ||||||||||
The accompanying notes are an integral part of these financial statements.
Table of Contents
| Portfolio of investments—December 31, 2013 | Wells Fargo Advantage VT Small Cap Value Fund | 13 |
| Security name | Shares | Value | ||||||||||||
| Metals & Mining (continued) | ||||||||||||||
Randgold Resources Limited ADR | 49,600 | $ | 3,115,376 | |||||||||||
Royal Gold Incorporated | 12,100 | 557,447 | ||||||||||||
Sandstorm Gold Limited - Canadian Exchange Traded Shares † | 32,950 | 140,697 | ||||||||||||
Sandstorm Gold Limited - Legend Shares † | 18,050 | 77,994 | ||||||||||||
Silver Standard Resources Incorporated † | 44,900 | 312,504 | ||||||||||||
Steel Dynamics Incorporated | 31,700 | 619,418 | ||||||||||||
United States Steel Corporation | 8,900 | 262,550 | ||||||||||||
Webco Industries Incorporated †(a)(i) | 1,400 | 165,200 | ||||||||||||
| 6,487,942 | ||||||||||||||
|
| |||||||||||||
| Paper & Forest Products: 0.45% | ||||||||||||||
Wausau Paper Corporation | 18,100 | 229,508 | ||||||||||||
|
| |||||||||||||
Telecommunication Services: 1.21% | ||||||||||||||
| Diversified Telecommunication Services: 1.21% | ||||||||||||||
Cincinnati Bell Incorporated † | 172,600 | 614,456 | ||||||||||||
|
| |||||||||||||
Total Common Stocks (Cost $39,306,150) | 48,242,523 | |||||||||||||
|
| |||||||||||||
Investment Companies: 1.15% | ||||||||||||||
KBW Regional Banking ETF | 2,026 | 82,276 | ||||||||||||
Market Vectors Gold Miners ETF | 15,918 | 336,188 | ||||||||||||
Market Vectors Junior Gold Miners ETF | 360,951 | 163,571 | ||||||||||||
Total Investment Companies (Cost $1,085,336) | 582,035 | |||||||||||||
|
| |||||||||||||
| Yield | ||||||||||||||
| Short-Term Investments: 2.58% | ||||||||||||||
| Investment Companies: 2.58% | ||||||||||||||
Wells Fargo Advantage Cash Investment Money Market Fund, Select Class (l)(u) | 0.06 | % | 1,310,257 | 1,310,257 | ||||||||||
|
| |||||||||||||
Total Short-Term Investments (Cost $1,310,257) | 1,310,257 | |||||||||||||
|
| |||||||||||||
| Total investments in securities | ||||||||
| (Cost $41,701,743) * | 98.83 | % | 50,134,815 | |||||
Other assets and liabilities, net | 1.17 | 591,807 | ||||||
|
|
|
| |||||
| Total net assets | 100.00 | % | $ | 50,726,622 | ||||
|
|
|
|
| † | Non-income-earning security |
| # | All or a portion of this security is segregated as collateral for investments in derivative instruments. |
| (a) | Security is fair valued by the Management Valuation Team, and in certain instances by the Board of Trustees, in accordance with procedures approved by the Board of Trustees. |
| (i) | Illiquid security for which the designation as illiquid is unaudited |
| (l) | Investment in an affiliate |
| (u) | Rate shown is the 7-day annualized yield at period end. |
| * | Cost for federal income tax purposes is $41,931,226 and unrealized appreciation (depreciation) consists of: |
Gross unrealized appreciation | $ | 12,523,394 | ||
Gross unrealized depreciation | (4,319,805 | ) | ||
|
| |||
Net unrealized appreciation | $ | 8,203,589 |
The accompanying notes are an integral part of these financial statements.
Table of Contents
| 14 | Wells Fargo Advantage VT Small Cap Value Fund | Statement of assets and liabilities—December 31, 2013 |
Assets | ||||
Investments | ||||
In unaffiliated securities, at value (see cost below) | $ | 48,824,558 | ||
In affiliated securities, at value (see cost below) | 1,310,257 | |||
|
| |||
Total investments, at value (see cost below) | 50,134,815 | |||
Foreign currency, at value (see cost below) | 29,738 | |||
Receivable for investments sold | 883,314 | |||
Receivable for Fund shares sold | 19,624 | |||
Receivable for dividends | 146,874 | |||
Prepaid expenses and other assets | 1,407 | |||
|
| |||
Total assets | 51,215,772 | |||
|
| |||
Liabilities | ||||
Payable for investments purchased | 365,898 | |||
Payable for Fund shares redeemed | 28,866 | |||
Written options, at value | 2,640 | |||
Advisory fee payable | 22,880 | |||
Distribution fees payable | 3,258 | |||
Due to other related parties | 5,806 | |||
Professional fees payable | 33,309 | |||
Accrued expenses and other liabilities | 26,493 | |||
|
| |||
Total liabilities | 489,150 | |||
|
| |||
Total net assets | $ | 50,726,622 | ||
|
| |||
NET ASSETS CONSIST OF | ||||
Paid-in capital | $ | 50,895,389 | ||
Undistributed net investment income | 264,798 | |||
Accumulated net realized losses on investments | (8,870,808 | ) | ||
Net unrealized gains on investments | 8,437,243 | |||
|
| |||
Total net assets | $ | 50,726,622 | ||
|
| |||
COMPUTATION OF NET ASSET VALUE PER SHARE1 | ||||
Net assets – Class 1 | $ | 35,900,221 | ||
Shares outstanding – Class 1 | 3,349,188 | |||
Net asset value per share – Class 1 | $10.72 | |||
Net assets – Class 2 | $ | 14,826,401 | ||
Shares outstanding – Class 2 | 1,384,257 | |||
Net asset value per share – Class 2 | $10.71 | |||
Investments in unaffiliated securities, at cost | $ | 40,391,486 | ||
|
| |||
Investments in affiliated securities, at cost | $ | 1,310,257 | ||
|
| |||
Total investments, at cost | $ | 41,701,743 | ||
|
| |||
Foreign currency, at cost | $ | 30,626 | ||
|
| |||
Premiums received on written options | $ | 7,691 | ||
|
| |||
| 1. | The Fund has an unlimited number of authorized shares. |
The accompanying notes are an integral part of these financial statements.
Table of Contents
| Statement of operations—year ended December 31, 2013 | Wells Fargo Advantage VT Small Cap Value Fund | 15 |
Investment income | ||||
Dividends* | $ | 919,612 | ||
Income from affiliated securities | 2,152 | |||
|
| |||
Total investment income | 921,764 | |||
|
| |||
Expenses | ||||
Advisory fee | 408,242 | |||
Administration fees | ||||
Fund level | 27,216 | |||
Class 1 | 30,465 | |||
Class 2 | 13,081 | |||
Distribution fees | ||||
Class 2 | 40,879 | |||
Custody and accounting fees | 27,624 | |||
Professional fees | 43,877 | |||
Shareholder report expenses | 30,285 | |||
Trustees’ fees and expenses | 13,514 | |||
Other fees and expenses | 5,717 | |||
|
| |||
Total expenses | 640,900 | |||
Less: Fee waivers and/or expense reimbursements | (115,573 | ) | ||
|
| |||
Net expenses | 525,327 | |||
|
| |||
Net investment income | 396,437 | |||
|
| |||
REALIZED AND UNREALIZED GAINS (LOSSES) ON INVESTMENTS | ||||
Net realized gains (losses) on: | ||||
Unaffiliated securities | 4,425,158 | |||
Written options | (18,920 | ) | ||
|
| |||
Net realized gains on investments | 4,406,238 | |||
|
| |||
Net change in unrealized gains (losses) on: | ||||
Unaffiliated securities | 2,948,190 | |||
Written options | 4,573 | |||
|
| |||
Net change in unrealized gains (losses) on investments | 2,952,763 | |||
|
| |||
Net realized and unrealized gains (losses) on investments | 7,359,001 | |||
|
| |||
Net increase in net assets resulting from operations | $ | 7,755,438 | ||
|
| |||
* Net of foreign dividend withholding taxes in the amount of | $5,545 | |||
The accompanying notes are an integral part of these financial statements.
Table of Contents
| 16 | Wells Fargo Advantage VT Small Cap Value Fund | Statement of changes in net assets |
Year ended December 31, 2013 | Year ended December 31, 2012 | |||||||||||||||
Operations | ||||||||||||||||
Net investment income | $ | 396,437 | $ | 594,500 | ||||||||||||
Net realized gains on investments | 4,406,238 | 4,300,231 | ||||||||||||||
Net change in unrealized gains (losses) on investments | 2,952,763 | 2,732,349 | ||||||||||||||
|
|
|
|
|
|
|
| |||||||||
Net increase in net assets resulting from operations | 7,755,438 | 7,627,080 | ||||||||||||||
|
|
|
|
|
|
|
| |||||||||
Distributions to shareholders from | ||||||||||||||||
Net investment income | ||||||||||||||||
Class 1 | (363,474 | ) | (471,550 | ) | ||||||||||||
Class 2 | (114,530 | ) | (129,769 | ) | ||||||||||||
|
|
|
|
|
|
|
| |||||||||
Total distributions to shareholders | (478,004 | ) | (601,319 | ) | ||||||||||||
|
|
|
|
|
|
|
| |||||||||
| Shares | Shares | |||||||||||||||
Capital share transactions | ||||||||||||||||
Proceeds from shares sold | ||||||||||||||||
Class 1 | 103,741 | 1,045,325 | 95,290 | 840,792 | ||||||||||||
Class 2 | 242,058 | 2,440,592 | 461,355 | 4,135,688 | ||||||||||||
|
|
|
|
|
|
|
| |||||||||
| 3,485,917 | 4,976,480 | |||||||||||||||
|
|
|
|
|
|
|
| |||||||||
Reinvestment of distributions | ||||||||||||||||
Class 1 | 36,203 | 363,474 | 54,578 | 471,550 | ||||||||||||
Class 2 | 11,408 | 114,530 | 15,020 | 129,769 | ||||||||||||
|
|
|
|
|
|
|
| |||||||||
| 478,004 | 601,319 | |||||||||||||||
|
|
|
|
|
|
|
| |||||||||
Payment for shares redeemed | ||||||||||||||||
Class 1 | (842,800 | ) | (8,678,358 | ) | (1,277,277 | ) | (11,503,307 | ) | ||||||||
Class 2 | (597,766 | ) | (6,193,805 | ) | (512,519 | ) | (4,578,968 | ) | ||||||||
|
|
|
|
|
|
|
| |||||||||
| (14,872,163 | ) | (16,082,275 | ) | |||||||||||||
|
|
|
|
|
|
|
| |||||||||
Net decrease in net assets resulting from capital share transactions | (10,908,242 | ) | (10,504,476 | ) | ||||||||||||
|
|
|
|
|
|
|
| |||||||||
Total decrease in net assets | (3,630,808 | ) | (3,478,715 | ) | ||||||||||||
|
|
|
|
|
|
|
| |||||||||
Net assets | ||||||||||||||||
Beginning of period | 54,357,430 | 57,836,145 | ||||||||||||||
|
|
|
|
|
|
|
| |||||||||
End of period | $50,726,622 | $54,357,430 | ||||||||||||||
|
|
|
|
|
|
|
| |||||||||
Undistributed net investment income | $ | 264,798 | $ | 456,843 | ||||||||||||
|
|
|
|
|
|
|
| |||||||||
The accompanying notes are an integral part of these financial statements.
Table of Contents
| Financial highlights | Wells Fargo Advantage VT Small Cap Value Fund | 17 |
(For a share outstanding throughout each period)
| Year ended December 31 | ||||||||||||||||
| CLASS 1 | 2013 | 2012 | 2011 | 20101 | ||||||||||||
Net asset value, beginning of period | $ | 9.41 | $ | 8.33 | $ | 9.04 | $ | 7.36 | ||||||||
Net investment income | 0.10 | 0.12 | 0.11 | 0.05 | 2 | |||||||||||
Net realized and unrealized gains (losses) on investments | 1.31 | 1.06 | (0.74 | ) | 1.63 | |||||||||||
|
|
|
|
|
|
|
| |||||||||
Total from investment operations | 1.41 | 1.18 | (0.63 | ) | 1.68 | |||||||||||
Distributions to shareholders from | ||||||||||||||||
Net investment income | (0.10 | ) | (0.10 | ) | (0.08 | ) | 0.00 | |||||||||
Net asset value, end of period | $ | 10.72 | $ | 9.41 | $ | 8.33 | $ | 9.04 | ||||||||
Total return3 | 15.03 | % | 14.33 | % | (7.06 | )% | 22.83 | % | ||||||||
Ratios to average net assets (annualized) | ||||||||||||||||
Gross expenses | 1.10 | % | 1.09 | % | 1.14 | % | 0.96 | % | ||||||||
Net expenses | 0.89 | % | 0.89 | % | 0.89 | % | 0.89 | % | ||||||||
Net investment income | 0.81 | % | 1.10 | % | 1.07 | % | 1.43 | % | ||||||||
Supplemental data | ||||||||||||||||
Portfolio turnover rate | 18 | % | 17 | % | 16 | % | 61 | % | ||||||||
Net assets, end of period (000s omitted) | $35,900 | $38,113 | $43,155 | $58,255 | ||||||||||||
| 1. | For the period from July 16, 2010 (commencement of class operations) to December 31, 2010 |
| 2. | Calculated based upon average shares outstanding |
| 3. | Returns for periods of less than one year are not annualized. |
The accompanying notes are an integral part of these financial statements.
Table of Contents
| 18 | Wells Fargo Advantage VT Small Cap Value Fund | Financial highlights |
(For a share outstanding throughout each period)
| Year ended December 31 | ||||||||||||||||||||
| CLASS 2 | 2013 | 2012 | 2011 | 20101 | 2009 | |||||||||||||||
Net asset value, beginning of period | $ | 9.40 | $ | 8.32 | $ | 9.03 | $ | 7.83 | $ | 4.95 | ||||||||||
Net investment income | 0.07 | 0.09 | 0.09 | 0.12 | 0.08 | |||||||||||||||
Net realized and unrealized gains (losses) on investments | 1.31 | 1.07 | (0.74 | ) | 1.20 | 2.87 | ||||||||||||||
|
|
|
|
|
|
|
|
|
| |||||||||||
Total from investment operations | 1.38 | 1.16 | (0.65 | ) | 1.32 | 2.95 | ||||||||||||||
Distributions to shareholders from | ||||||||||||||||||||
Net investment income | (0.07 | ) | (0.08 | ) | (0.06 | ) | (0.12 | ) | (0.07 | ) | ||||||||||
Net asset value, end of period | $ | 10.71 | $ | 9.40 | $ | 8.32 | $ | 9.03 | $ | 7.83 | ||||||||||
Total return | 14.75 | % | 14.00 | % | (7.26 | )% | 17.25 | % | 60.18 | % | ||||||||||
Ratios to average net assets (annualized) | ||||||||||||||||||||
Gross expenses | 1.35 | % | 1.34 | % | 1.39 | % | 1.52 | % | 2.56 | % | ||||||||||
Net expenses | 1.14 | % | 1.14 | % | 1.14 | % | 1.14 | % | 1.14 | % | ||||||||||
Net investment income | 0.55 | % | 0.90 | % | 0.82 | % | 1.06 | % | 1.39 | % | ||||||||||
Supplemental data | ||||||||||||||||||||
Portfolio turnover rate | 18 | % | 17 | % | 16 | % | 61 | % | 45 | % | ||||||||||
Net assets, end of period (000s omitted) | $14,826 | $16,245 | $14,681 | $19,606 | $12,018 | |||||||||||||||
| 1. | After the close of business on July 16, 2010, existing shares of the Fund were renamed Class 2 shares. |
| 2. | Calculated based upon average shares outstanding |
The accompanying notes are an integral part of these financial statements.
Table of Contents
| Notes to financial statements | Wells Fargo Advantage VT Small Cap Value Fund | 19 |
1. ORGANIZATION
Wells Fargo Variable Trust (the “Trust”), a Delaware statutory trust organized on March 10, 1999, is an open-end management investment company registered under the Investment Company Act of 1940, as amended (the “1940 Act”). These financial statements report on the Wells Fargo Advantage VT Small Cap Value Fund (the “Fund”) which is a diversified series of the Trust.
2. SIGNIFICANT ACCOUNTING POLICIES
The following significant accounting policies, which are consistently followed in the preparation of the financial statements of the Fund, are in conformity with U.S. generally accepted accounting principles which require management to make estimates and assumptions that affect the reported amounts of assets and liabilities, disclosure of contingent assets and liabilities at the date of the financial statements, and the reported amounts of revenues and expenses during the reporting period. Actual results could differ from those estimates.
Securities valuation
All investments are valued each business day as of the close of regular trading on the New York Stock Exchange (generally 4 p.m. Eastern Time).
Equity securities and options that are listed on a foreign or domestic exchange or market are valued at the official closing price or, if none, the last sales price. If no sale occurs on the primary exchange or market for the security that day, the prior day’s price will be deemed “stale” and fair values will be determined in accordance with the Fund’s Valuation Procedures.
The values of securities denominated in foreign currencies will be converted to U.S. dollars at rates provided by an independent foreign currency pricing source at a time each business day specified by the Management Valuation Team of Wells Fargo Funds Management, LLC (“Funds Management”).
Many securities markets and exchanges outside the U.S. close prior to the close of the New York Stock Exchange and therefore may not fully reflect trading or events that occur after the close of the principal exchange in which the foreign securities are traded, but before the close of the New York Stock Exchange. If such trading or events are expected to materially affect the value of such securities, then fair value pricing procedures approved by the Board of Trustees of the Fund are applied. These procedures take into account multiple factors including movements in U.S. securities markets after foreign exchanges close. Foreign securities that are fair valued under these procedures are categorized as Level 2 and the application of these procedures may result in transfers between Level 1 and Level 2. Depending on market activity, such fair valuations may be frequent. Such fair value pricing may result in NAVs that are higher or lower than NAVs based on the last reported sales price or latest quoted bid price. On December 31, 2013, such fair value pricing was not used in pricing foreign securities.
Investments in registered open-end investment companies are valued at net asset value.
Investments which are not valued using any of the methods discussed above are valued at their fair value, as determined in good faith by the Board of Trustees. The Board of Trustees has established a Valuation Committee comprised of the Trustees and has delegated to it the authority to take any actions regarding the valuation of portfolio securities that the Valuation Committee deems necessary or appropriate, including determining the fair value of portfolio securities, unless the determination has been delegated to the Management Valuation Team. The Board of Trustees retains the authority to make or ratify any valuation decisions or approve any changes to the Valuation Procedures as it deems appropriate. On a quarterly basis, the Board of Trustees receives reports on any valuation actions taken by the Valuation Committee or the Management Valuation Team which may include items for ratification.
Valuations of fair valued securities are compared to the next actual sales price when available, or other appropriate market values, to assess the continued appropriateness of the fair valuation methodologies used. These securities are fair valued on a day-to-day basis, taking into consideration changes to appropriate market information and any significant changes to the inputs considered in the valuation process until there is a readily available price provided on an exchange or by an independent pricing service. Valuations received from an independent pricing service or independent broker-dealer quotes are periodically validated by comparisons to most recent trades and valuations provided by other independent pricing services in addition to the review of prices by the adviser and/or subadviser. Unobservable inputs used in determining fair valuations are identified based on the type of security, taking into consideration factors utilized by market participants in valuing the investment, knowledge about the issuer and the current market environment.
Foreign currency translation
The accounting records of the Fund are maintained in U.S. dollars. The values of other assets and liabilities denominated in foreign currencies will be converted to U.S. dollars at rates provided by an independent foreign currency pricing source
Table of Contents
| 20 | Wells Fargo Advantage VT Small Cap Value Fund | Notes to financial statements |
at a time each business day specified by the Management Valuation Team. Purchases and sales of securities, and income and expenses are converted at the rate of exchange on the respective dates of such transactions. Reported net realized foreign exchange gains or losses arise from sales of foreign currencies, currency gains or losses realized between the trade and settlement dates on securities transactions, and the difference between the amounts of dividends, interest and foreign withholding taxes recorded and the U.S. dollar equivalent of the amounts actually paid or received. Net unrealized foreign exchange gains and losses arise from changes in the fair value of assets and liabilities other than investments in securities resulting from changes in exchange rates.
The changes in net assets arising from changes in exchange rates and the changes in net assets resulting from changes in market prices of securities are not separately presented. Such changes are recorded with net realized and unrealized gains or losses from investments. Gains and losses from certain foreign currency transactions are treated as ordinary income for U.S. federal income tax purposes.
Options
The Fund may be subject to equity price risk in the normal course of pursuing its investment objectives. The Fund may write covered call options or secured put options on individual securities and/or indexes. When the Fund writes an option, an amount equal to the premium received is recorded as a liability and is subsequently adjusted to the current market value of the written option. Premiums received from written options that expire unexercised are recognized as realized gains on the expiration date. For exercised options, the difference between the premium received and the amount paid on effecting a closing purchase transaction, including brokerage commissions, is treated as a realized gain or loss. If a call option is exercised, the premium is added to the proceeds from the sale of the underlying security in calculating the realized gain or loss on the sale. If a put option is exercised, the premium reduces the cost of the security purchased. The Fund, as a writer of an option, bears the market risk of an unfavorable change in the price of the security and/or index underlying the written option.
The Fund may also purchase call or put options. The premium is included in the Statement of Assets and Liabilities as an investment, the value of which is subsequently adjusted based on the current market value of the option. Premiums paid for purchased options that expire are recognized as realized losses on the expiration date. Premiums paid for purchased options that are exercised or closed are added to the amount paid or offset against the proceeds received for the underlying security to determine the realized gain or loss. The risk of loss associated with purchased options is limited to the premium paid.
Options traded on an exchange are regulated and terms of the options are standardized. Purchased options traded over the counter expose the Fund to counterparty risk in the event the counterparty does not perform. This risk is mitigated by having a master netting arrangement between the Fund and the counterparty and by having the counterparty post collateral to cover the Fund’s exposure to the counterparty.
Security transactions and income recognition
Securities transactions are recorded on a trade date basis. Realized gains or losses are recorded on the basis of identified cost.
Dividend income is recognized on the ex-dividend date, except for certain dividends from foreign securities, which are recorded as soon as the Fund is informed of the ex-dividend date. Dividend income from foreign securities is recorded net of foreign taxes withheld where recovery of such taxes is not assured.
Distributions to shareholders
Distributions to shareholders from net investment income and net realized gains, if any, are recorded on the ex-dividend date. Such distributions are determined in conformity with federal income tax regulations, which may differ in amount or character from net investment income and realized gains recognized for purposes of U.S. generally accepted accounting principles.
Federal and other taxes
The Fund intends to continue to qualify as a regulated investment company by distributing substantially all of its investment company taxable income and any net realized capital gains (after reduction for capital loss carryforwards) sufficient to relieve it from all, or substantially all, federal income taxes. Accordingly, no provision for federal income taxes was required.
The Fund’s income and federal excise tax returns and all financial records supporting those returns for the prior three fiscal years are subject to examination by the federal and Delaware revenue authorities. Management has analyzed the Fund’s tax positions taken on federal, state, and foreign tax returns for all open tax years and does not believe that there are any uncertain tax positions that require recognition of a tax liability.
Table of Contents
| Notes to financial statements | Wells Fargo Advantage VT Small Cap Value Fund | 21 |
Reclassifications are made to the Fund’s capital accounts for permanent tax differences to reflect income and gains available for distribution (or available capital loss carryforwards) under federal income tax regulations. U.S. generally accepted accounting principles requires that certain components of net assets be adjusted to reflect permanent differences between financial and tax reporting. These reclassifications have no effect on net assets or net asset values per share. The primary permanent differences causing such reclassifications are due to dividends from certain securities and passive foreign investment companies. At December 31, 2013, as a result of permanent book-to-tax differences, the following reclassification adjustments were made on the Statement of Assets and Liabilities:
Undistributed net investment income | Accumulated net realized losses on investments | |
| $(110,478) | $110,478 |
As of December 31, 2013, the Fund had capital loss carryforwards available to offset future net realized capital gains in the amount of $8,642,152 expiring in 2017.
Class allocations
The separate classes of shares offered by the Fund differ principally in distribution fees. Shareholders of each class bear certain expenses that pertain to that particular class. All shareholders bear the common expenses of the Fund, earn income from the portfolio, and are allocated any unrealized gains and losses pro rata based on the average daily net assets of each class, without distinction between share classes. Dividends are determined separately for each class based on income and expenses allocable to each class. Realized gains and losses are allocated to each class pro rata based
upon the net assets of each class on the date realized. Differences in per share dividend rates generally result from the relative weightings of pro rata income and realized gain allocations and from differences in separate class expenses, including distribution fees.
3. FAIR VALUATION MEASUREMENTS
Fair value measurements of investments are determined within a framework that has established a fair value hierarchy based upon the various data inputs utilized in determining the value of the Fund’s investments. The three-level hierarchy gives the highest priority to unadjusted quoted prices in active markets for identical assets or liabilities (Level 1) and the lowest priority to significant unobservable inputs (Level 3). The Fund’s investments are classified within the fair value hierarchy based on the lowest level of input that is significant to the fair value measurement. The inputs are summarized into three broad levels as follows:
Level 1 – quoted prices in active markets for identical securities
Level 2 – other significant observable inputs (including quoted prices for similar securities, interest rates, prepayment speeds, credit risk, use of amortized cost, etc.)
Level 3 – significant unobservable inputs (including the Fund’s own assumptions in determining the fair value of investments)
The inputs or methodologies used for valuing investments in securities are not necessarily an indication of the risk associated with investing in those securities.
As of December 31, 2013, the inputs used in valuing investments in securities were as follows:
| Investments in securities | Quoted prices (Level 1) | Other significant (Level 2) | Significant unobservable inputs (Level 3) | Total | ||||||||||||
Equity securities | ||||||||||||||||
Common stocks | $ | 48,077,323 | $ | 165,200 | $ | 0 | $ | 48,242,523 | ||||||||
Investment companies | 582,035 | 0 | 0 | 582,035 | ||||||||||||
Short-term investments | ||||||||||||||||
Investment companies | 1,310,257 | 0 | 0 | 1,310,257 | ||||||||||||
| $ | 49,969,615 | $ | 165,200 | $ | 0 | $ | 50,134,815 | |||||||||
Table of Contents
| 22 | Wells Fargo Advantage VT Small Cap Value Fund | Notes to financial statements |
As of December 31, 2013, the inputs used in valuing the Fund’s other financial instruments were as follows:
| Other financial instruments | Quoted prices (Level 1) | Other significant (Level 2) | Significant unobservable inputs (Level 3) | Total | ||||||||||||
Written options | $ | 0 | $ | (2,640 | ) | $ | 0 | $ | (2,640 | ) | ||||||
Transfers in and transfers out are recognized at the end of the reporting period. For the year ended December 31, 2013, the Fund did not have any transfers into/out of Level 1, Level 2, or Level 3.
4. TRANSACTIONS WITH AFFILIATES AND OTHER EXPENSES
Advisory fee
The Trust has entered into an advisory contract with Funds Management, an indirect wholly owned subsidiary of Wells Fargo & Company (“Wells Fargo”). The adviser is responsible for implementing investment policies and guidelines and for supervising the subadviser, who is responsible for day-to-day portfolio management of the Fund.
Pursuant to the contract, Funds Management is entitled to receive an annual advisory fee starting at 0.75% and declining to 0.60% as the average daily net assets of the Fund increase. For the year ended December 31, 2013, the advisory fee was equivalent to an annual rate of 0.75% of the Fund’s average daily net assets.
Funds Management has retained the services of a subadviser to provide daily portfolio management to the Fund. The fee for subadvisory services is borne by Funds Management. Wells Capital Management Incorporated, an affiliate of Funds Management and an indirect, wholly owned subsidiary of Wells Fargo, is the subadviser to the Fund and is entitled to receive a fee from Funds Management at an annual rate starting at 0.55% and declining to 0.40% as the average daily net assets of the Fund increase.
Administration and transfer agent fees
The Trust has entered into an administration agreement with Funds Management. Under this agreement, for providing administrative services, which includes paying fees and expenses for services provided by the transfer agent, sub-transfer agents, omnibus account servicers and record-keepers, Funds Management is entitled to receive from the Fund an annual fund level administration fee starting at 0.05% and declining to 0.03% as the average daily net assets of the Fund increase and a class level administration fee of 0.08% of the average daily net assets of each class.
Funds Management has contractually waived and/or reimbursed advisory and administration fees to the extent necessary to maintain certain net operating expense ratios for the Fund. Waiver of fees and/or reimbursement of expenses by Funds Management were made first from fund level expenses on a proportionate basis and then from class specific expenses. Funds Management has committed through April 30, 2014 to waive fees and/or reimburse expenses to the extent necessary to cap the Fund’s expenses at 0.89% for Class 1 shares and 1.14% for Class 2 shares.
Distribution fees
The Trust has adopted a Distribution Plan for Class 2 shares of the Fund pursuant to Rule 12b-1 under the 1940 Act. Distribution fees are charged to Class 2 shares and paid to Wells Fargo Funds Distributor, LLC, the principal underwriter, at an annual rate of 0.25% of the average daily net assets of Class 2 shares.
5. INVESTMENT PORTFOLIO TRANSACTIONS
Purchases and sales of investments, excluding U.S. government obligations (if any) and short-term securities, for the year ended December 31, 2013 were $9,244,747 and $18,591,574, respectively.
6. DERIVATIVE TRANSACTIONS
During the year ended December 31, 2013, the Fund entered into written options for economic hedging purposes.
During the year ended December 31, 2013, the Fund had written call option activities as follows:
| Number of contracts | Premiums received | |||||||
Options outstanding at December 31, 2012 | 60 | $ | 7,812 | |||||
Options written | 367 | 92,287 | ||||||
Options expired | (72 | ) | (9,651 | ) | ||||
Options closed | (329 | ) | (82,369 | ) | ||||
Options exercised | (4 | ) | (388 | ) | ||||
Options outstanding at December 31, 2013 | 22 | $ | 7,691 | |||||
Table of Contents
| Notes to financial statements | Wells Fargo Advantage VT Small Cap Value Fund | 23 |
Open call options written at December 31, 2013 were as follow for the Fund:
| Expiration date | Counterparty | Number of contracts | Strike price | Value | ||||||||||
2-22-2014 | Susquehanna Financial Group, LLLP | Gogo Incorporated | 6 | $ | 40.00 | $ | (312 | ) | ||||||
5-17-2014 | Susquehanna Financial Group, LLLP | Gogo Incorporated | 6 | 40.00 | (978 | ) | ||||||||
5-17-2014 | Susquehanna Financial Group, LLLP | Gogo Incorporated | 10 | 41.00 | (1,350 | ) | ||||||||
The Fund had an average of 38 written option contracts during the year ended December 31, 2013.
The fair value, realized gains or losses and change in unrealized gains or losses, if any, on derivative instruments are reflected in the appropriate financial statements.
For certain types of derivative transactions, the Fund has entered into International Swaps and Derivatives Association, Inc. master agreements (“ISDA Master Agreements”) or similar agreements with approved counterparties. The ISDA Master Agreements or similar agreements may have requirements to deliver/deposit securities or cash to/with an exchange or broker-dealer as collateral and allows the Fund to offset, with each counterparty, certain derivative financial instrument’s assets and/or liabilities with collateral held or pledged. Collateral requirements differ by type of derivative. Collateral or margin requirements are set by the broker or exchange clearing house for exchange traded derivatives while collateral terms are contract specific for over-the-counter traded. Cash collateral that has been pledged to cover obligations of the Fund under derivative contracts, if any, will be reported separately in the Statement of Assets and Liabilities. Securities pledged as collateral, if any, for the same purpose are noted in the Portfolio of Investments. With respect to balance sheet offsetting, absent an event of default by the counterparty or a termination of the agreement, the reported amounts of financial assets and financial liabilities in the Statement of Assets and Liabilities are not offset across transactions between the Fund and the applicable counterparty. A reconciliation of the gross amounts on the Statement of Assets and Liabilities to the net amounts by derivative type, including any collateral exposure, is as follows:
| Investment type | Counterparty | Gross amounts of liabilities in the Statement of Assets and Liabilities | Amounts subject to netting agreements | Collateral pledged | Net amount (not less than $0) | |||||||||||||
Written options | Susquehanna Financial Group, LLLP | $ | 2,640 | $ | 0 | $ | 2,640 | $ | 0 | |||||||||
7. BANK BORROWINGS
The Trust and Wells Fargo Funds Trust (excluding the money market funds and certain other funds) are parties to a $150,000,000 revolving credit agreement with State Street Bank and Trust Company, whereby the Fund is permitted to use bank borrowings for temporary or emergency purposes, such as to fund shareholder redemption requests. Interest under the credit agreement is charged to the Fund based on a borrowing rate equal to the higher of the Federal Funds rate in effect on that day plus 1.25% or the overnight LIBOR rate in effect on that day plus 1.25%. In addition, an annual commitment fee equal to 0.10% of the unused balance is allocated to each participating fund. For the year ended December 31, 2013, the Fund paid $116 in commitment fees.
For the year ended December 31, 2013, there were no borrowings by the Fund under the agreement.
8. DISTRIBUTIONS TO SHAREHOLDERS
The tax character of distributions paid was $478,004 and $601,319 of ordinary income for the years ended December 31, 2013 and December 31, 2012, respectively.
As of December 31, 2013, the components of distributable earnings on a tax basis were as follows:
Undistributed ordinary income | Unrealized gains | Capital loss carryforward | ||
| $267,514 | $8,207,758 | $(8,642,152) |
9. INDEMNIFICATION
Under the Trust’s organizational documents, the officers and directors are indemnified against certain liabilities that may arise out of performance of their duties to the Trust. Additionally, in the normal course of business, the Trust may enter into contracts with service providers that contain a variety of indemnification clauses. The Trust’s maximum exposure under these arrangements is dependent on future claims that may be made against the Fund and, therefore, cannot be estimated.
Table of Contents
| 24 | Wells Fargo Advantage VT Small Cap Value Fund | Report of independent registered public accounting firm |
BOARD OF TRUSTEES AND SHAREHOLDERS OF WELLS FARGO VARIABLE TRUST:
We have audited the accompanying statement of assets and liabilities, including the portfolio of investments, of the Wells Fargo Advantage VT Small Cap Value Fund (the “Fund”), one of the funds constituting the Wells Fargo Variable Trust, as of December 31, 2013, and the related statement of operations for the year then ended, statements of changes in net assets for each of the years in the two-year period then ended, and the financial highlights for each of the years or periods in the five-year period then ended. These financial statements and financial highlights are the responsibility of the Fund’s management. Our responsibility is to express an opinion on these financial statements and financial highlights based on our audits.
We conducted our audits in accordance with the standards of the Public Company Accounting Oversight Board (United States). Those standards require that we plan and perform the audit to obtain reasonable assurance about whether the financial statements and financial highlights are free of material misstatement. An audit includes examining, on a test basis, evidence supporting the amounts and disclosures in the financial statements. Our procedures included confirmation of securities owned as of December 31, 2013, by correspondence with the custodian and brokers or by other appropriate auditing procedures. An audit also includes assessing the accounting principles used and significant estimates made by management, as well as evaluating the overall financial statement presentation. We believe that our audits provide a reasonable basis for our opinion.
In our opinion, the financial statements and financial highlights referred to above present fairly, in all material respects, the financial position of the Wells Fargo Advantage VT Small Cap Value Fund as of December 31, 2013, the results of its operations for the year then ended, the changes in its net assets for each of the years in the two-year period then ended, and the financial highlights for each of the years or periods in the five-year period then ended, in conformity with U.S. generally accepted accounting principles.

Boston, Massachusetts
February 27, 2014
Table of Contents
| Other information (unaudited) | Wells Fargo Advantage VT Small Cap Value Fund | 25 |
TAX INFORMATION
For corporate shareholders, pursuant to Section 854 of the Internal Revenue Code, 71.44% of ordinary income dividends qualify for the corporate dividends-received deduction for the fiscal year ended December 31, 2013.
PROXY VOTING INFORMATION
A description of the policies and procedures that the Fund uses to determine how to vote proxies relating to portfolio securities is available without charge, upon request, by calling 1-800-222-8222, visiting our website at wellsfargoadvantagefunds.com, or visiting the SEC website at sec.gov. Information regarding how the Fund voted proxies relating to portfolio securities during the most recent 12-month period ended June 30 is available without charge on the Fund’s website at wellsfargoadvantagefunds.com or by visiting the SEC website at sec.gov.
PORTFOLIO HOLDINGS INFORMATION
The complete portfolio holdings for the Fund are publicly available on the Fund’s website (wellsfargoadvantagefunds.com) on a monthly, 30-day or more delayed basis. In addition, top ten holdings information for the Fund is publicly available on the Fund’s website on a monthly, seven-day or more delayed basis. The Fund files its complete schedule of portfolio holdings with the SEC for the first and third quarters of each fiscal year on Form N-Q, which is available without charge by visiting the SEC website at sec.gov. In addition, the Fund’s Form N-Q may be reviewed and copied at the SEC’s Public Reference Room in Washington, DC, and at regional offices in New York City, at 233 Broadway, and in Chicago, at 175 West Jackson Boulevard, Suite 900. Information about the Public Reference Room may be obtained by calling 1-800-SEC-0330.
Table of Contents
| 26 | Wells Fargo Advantage VT Small Cap Value Fund | Other information (unaudited) |
BOARD OF TRUSTEES AND OFFICERS
Each of the Trustees and Officers listed in the table below acts in identical capacities for each fund in the Wells Fargo Advantage family of funds, which consists of 132 mutual funds1 comprising the Wells Fargo Funds Trust, Wells Fargo Variable Trust, Wells Fargo Master Trust and four closed-end funds (collectively the “Fund Complex”). This table should be read in conjunction with the Prospectus and the Statement of Additional Information2. All of the Trustees are also Members of the Audit and Governance Committees of each Trust in the Fund Complex. The mailing address of each Trustee and Officer is 525 Market Street, 12th Floor, San Francisco, CA 94105. Each Trustee and Officer serves an indefinite term, however, each Trustee serves such term until reaching the mandatory retirement age established by the Trustees.
Independent Trustees
| Name and year of birth | Position held and length of service* | Principal occupations during past five years | Other directorships during past five years | |||
| Peter G. Gordon (Born 1942) | Trustee, since 1998; Chairman, since 2005 | Co-Founder, Retired Chairman, President and CEO of Crystal Geyser Water Company. Trustee Emeritus, Colby College. | Asset Allocation Trust | |||
| Isaiah Harris, Jr. (Born 1952) | Trustee, since 2009 | Retired. Prior thereto, President and CEO of BellSouth Advertising and Publishing Corp. from 2005 to 2007, President and CEO of BellSouth Enterprises from 2004 to 2005 and President of BellSouth Consumer Services from 2000 to 2003. Emeritus member of the Iowa State University Foundation Board of Governors. Emeritus Member of the Advisory Board of Iowa State University School of Business. Advisory Board Member, Palm Harbor Academy (charter school). Mr. Harris is a certified public accountant. | CIGNA Corporation; Deluxe Corporation; Asset Allocation Trust | |||
| Judith M. Johnson (Born 1949) | Trustee, since 2008; Audit Committee Chairman, since 2008 | Retired. Prior thereto, Chief Executive Officer and Chief Investment Officer of Minneapolis Employees Retirement Fund from 1996 to 2008. Ms. Johnson is an attorney, certified public accountant and a certified managerial accountant. | Asset Allocation Trust | |||
| Leroy Keith, Jr. (Born 1939) | Trustee, since 2010 | Chairman, Bloc Global Services (development and construction). Trustee of the Evergreen Funds from 1983 to 2010. Former Managing Director, Almanac Capital Management (commodities firm), former Partner, Stonington Partners, Inc. (private equity fund), former Director, Obagi Medical Products Co. and former Director, Lincoln Educational Services. | Trustee, Virtus Fund Complex (consisting of 50 portfolios as of 12/16/2013); Asset Allocation Trust | |||
| David F. Larcker (Born 1950) | Trustee, since 2009 | James Irvin Miller Professor of Accounting at the Graduate School of Business, Stanford University, Morgan Stanley Director of the Center for Leadership Development and Research and Senior Faculty of The Rock Center for Corporate Governance since 2006. From 2005 to 2008, Professor of Accounting at the Graduate School of Business, Stanford University. Prior thereto, Ernst & Young Professor of Accounting at The Wharton School, University of Pennsylvania from 1985 to 2005. | Asset Allocation Trust | |||
| Olivia S. Mitchell (Born 1953) | Trustee, since 2006 | International Foundation of Employee Benefit Plans Professor, Wharton School of the University of Pennsylvania since 1993. Director of Wharton’s Pension Research Council and Boettner Center on Pensions & Retirement Research, and Research Associate at the National Bureau of Economic Research. Previously, Cornell University Professor from 1978 to 1993. | Asset Allocation Trust | |||
| Timothy J. Penny (Born 1951) | Trustee, since 1996 | President and CEO of Southern Minnesota Initiative Foundation, a non-profit organization, since 2007 and Senior Fellow at the Humphrey Institute Policy Forum at the University of Minnesota since 1995. Member of the Board of Trustees of NorthStar Education Finance, Inc., a non-profit organization, since 2007. | Asset Allocation Trust |
Table of Contents
| Other information (unaudited) | Wells Fargo Advantage VT Small Cap Value Fund | 27 |
| Name and year of birth | Position held and length of service* | Principal occupations during past five years | Other directorships during past five years | |||
| Michael S. Scofield (Born 1943) | Trustee, since 2010 | Served on the Investment Company Institute’s Board of Governors and Executive Committee from 2008-2011 as well the Governing Council of the Independent Directors Council from 2006-2011 and the Independent Directors Council Executive Committee from 2008-2011. Chairman of the IDC from 2008-2010. Institutional Investor (Fund Directions) Trustee of Year in 2007. Trustee of the Evergreen Funds (and its predecessors) from 1984 to 2010. Chairman of the Evergreen Funds from 2000-2010. Former Trustee of the Mentor Funds. Retired Attorney, Law Offices of Michael S. Scofield. | Asset Allocation Trust | |||
| Donald C. Willeke (Born 1940) | Trustee, since 1996 | Principal of the law firm of Willeke & Daniels. General Counsel of the Minneapolis Employees Retirement Fund from 1984 until its consolidation into the Minnesota Public Employees Retirement Association on June 30, 2010. Director and Vice Chair of The Tree Trust (non-profit corporation). Director of the American Chestnut Foundation (non-profit corporation). | Asset Allocation Trust |
| * | Length of service dates reflect the Trustee’s commencement of service with the Trust’s predecessor entities, where applicable. |
Officers
| Name and year of birth | Position held and length of service | Principal occupations during past five years | ||||
| Karla M. Rabusch (Born 1959) | President, since 2003 | Executive Vice President of Wells Fargo Bank, N.A. and President of Wells Fargo Funds Management, LLC since 2003. | ||||
| Jeremy DePalma1 (Born 1974) | Treasurer, since 2012 | Senior Vice President of Wells Fargo Funds Management, LLC since 2009. Senior Vice President of Evergreen Investment Management Company, LLC from 2008 to 2010. Vice President, Evergreen Investment Services, Inc. from 2004 to 2007. Head of the Fund Reporting and Control Team within Fund Administration from 2005 to 2010. | ||||
| C. David Messman (Born 1960) | Secretary, since 2000; Chief Legal Officer, since 2003 | Senior Vice President and Secretary of Wells Fargo Funds Management, LLC since 2001. Vice President and Managing Counsel of Wells Fargo Bank, N.A. since 1996. | ||||
| Debra Ann Early (Born 1964) | Chief Compliance Officer, since 2007 | Chief Compliance Officer of Wells Fargo Funds Management, LLC since 2007. Chief Compliance Officer of Parnassus Investments from 2005 to 2007. Chief Financial Officer of Parnassus Investments from 2004 to 2007. | ||||
| David Berardi (Born 1975) | Assistant Treasurer, since 2009 | Vice President of Wells Fargo Funds Management, LLC since 2009. Vice President of Evergreen Investment Management Company, LLC from 2008 to 2010. Assistant Vice President of Evergreen Investment Services, Inc. from 2004 to 2008. Manager of Fund Reporting and Control for Evergreen Investment Management Company, LLC from 2004 to 2010. |
| 1. | Jeremy DePalma acts as Treasurer of 59 funds and Assistant Treasurer of 73 funds in the Fund Complex. |
| 2. | The Statement of Additional Information includes additional information about the Trustees and is available, without charge, upon request, by calling 1-800-222-8222 or by visiting the website at wellsfargoadvantagefunds.com. |
Table of Contents
| 28 | Wells Fargo Advantage VT Small Cap Value Fund | List of abbreviations |
The following is a list of common abbreviations for terms and entities that may have appeared in this report.
| ACA | — ACA Financial Guaranty Corporation |
| ADR | — American depositary receipt |
| ADS | — American depositary shares |
| AGC | — Assured Guaranty Corporation |
| AGM | — Assured Guaranty Municipal |
| Ambac | — Ambac Financial Group Incorporated |
| AMT | — Alternative minimum tax |
| AUD | — Australian dollar |
| BAN | — Bond anticipation notes |
| BHAC | — Berkshire Hathaway Assurance Corporation |
| BRL | — Brazilian real |
| CAB | — Capital appreciation bond |
| CAD | — Canadian dollar |
| CCAB | — Convertible capital appreciation bond |
| CDA | — Community Development Authority |
| CDO | — Collateralized debt obligation |
| CHF | — Swiss franc |
| COP | — Certificate of participation |
| DKK | — Danish krone |
| DRIVER | — Derivative inverse tax-exempt receipts |
| DW&P | — Department of Water & Power |
| DWR | — Department of Water Resources |
| ECFA | — Educational & Cultural Facilities Authority |
| EDA | — Economic Development Authority |
| EDFA | — Economic Development Finance Authority |
| ETF | — Exchange-traded fund |
| EUR | — Euro |
| FDIC | — Federal Deposit Insurance Corporation |
| FFCB | — Federal Farm Credit Banks |
| FGIC | — Financial Guaranty Insurance Corporation |
| FHA | — Federal Housing Administration |
| FHLB | — Federal Home Loan Bank |
| FHLMC | — Federal Home Loan Mortgage Corporation |
| FICO | — The Financing Corporation |
| FNMA | — Federal National Mortgage Association |
| FSA | — Farm Service Agency |
| GBP | — Great British pound |
| GDR | — Global depositary receipt |
| GNMA | — Government National Mortgage Association |
| GO | — General obligation |
| HCFR | — Healthcare facilities revenue |
| HEFA | — Health & Educational Facilities Authority |
| HEFAR | — Higher education facilities authority revenue |
| HFA | — Housing Finance Authority |
| HFFA | — Health Facilities Financing Authority |
| HKD | — Hong Kong dollar |
| HUD | — Department of Housing and Urban Development |
| HUF | — Hungarian forint |
| IDA | — Industrial Development Authority |
| IDAG | — Industrial Development Agency |
| IDR | — Industrial development revenue |
| IEP | — Irish pound |
| JPY | — Japanese yen |
| KRW | — Republic of Korea won |
| LIBOR | — London Interbank Offered Rate |
| LIQ | — Liquidity agreement |
| LLC | — Limited liability company |
| LLLP | — Limited liability limited partnership |
| LLP | — Limited liability partnership |
| LOC | — Letter of credit |
| LP | — Limited partnership |
| MBIA | — Municipal Bond Insurance Association |
| MFHR | — Multifamily housing revenue |
| MSTR | — Municipal securities trust receipts |
| MTN | — Medium-term note |
| MUD | — Municipal Utility District |
| MXN | — Mexican peso |
| MYR | — Malaysian ringgit |
| National | — National Public Finance Guarantee Corporation |
| NGN | — Nigerian naira |
| NOK | — Norwegian krone |
| NZD | — New Zealand dollar |
| PCFA | — Pollution Control Financing Authority |
| PCL | — Public Company Limited |
| PCR | — Pollution control revenue |
| PFA | — Public Finance Authority |
| PFFA | — Public Facilities Financing Authority |
| PFOTER | — Puttable floating option tax-exempt receipts |
| plc | — Public limited company |
| PLN | — Polish zloty |
| PUTTER | — Puttable tax-exempt receipts |
| R&D | — Research & development |
| Radian | — Radian Asset Assurance |
| RAN | — Revenue anticipation notes |
| RDA | — Redevelopment Authority |
| RDFA | — Redevelopment Finance Authority |
| REIT | — Real estate investment trust |
| ROC | — Reset option certificates |
| RON | — Romanian lei |
| RUB | — Russian ruble |
| SAVRS | — Select auction variable rate securities |
| SBA | — Small Business Authority |
| SEK | — Swedish krona |
| SFHR | — Single-family housing revenue |
| SFMR | — Single-family mortgage revenue |
| SGD | — Singapore dollar |
| SKK | — Slovakian koruna |
| SPA | — Standby purchase agreement |
| SPDR | — Standard & Poor’s Depositary Receipts |
| STRIPS | — Separate trading of registered interest and principal securities |
| TAN | — Tax anticipation notes |
| TBA | — To be announced |
| THB | — Thai baht |
| TIPS | — Treasury inflation-protected securities |
| TRAN | — Tax revenue anticipation notes |
| TRY | — Turkish lira |
| TTFA | — Transportation Trust Fund Authority |
| TVA | — Tennessee Valley Authority |
| ZAR | — South African rand |
Table of Contents


For more information
More information about Wells Fargo Advantage Funds is available free upon request. To obtain literature, please write, email, visit the Fund’s website, or call:
Wells Fargo Advantage Funds
P.O. Box 8266
Boston, MA 02266-8266
Email: wfaf@wellsfargo.com
Website: wellsfargoadvantagefunds.com
Individual investors: 1-800-222-8222
Retail investment professionals: 1-888-877-9275
Institutional investment professionals: 1-866-765-0778
This report and the financial statements contained herein are submitted for the general information of the shareholders of Wells Fargo Advantage Funds. If this report is used for promotional purposes, distribution of the report must be accompanied or preceded by a current prospectus. For a current prospectus and, if available, a summary prospectus containing more complete information, including charges and expenses, call 1-800-222-8222 or visit the Fund’s website at wellsfargoadvantagefunds.com . Please consider the investment objectives, risks, charges, and expenses of the investment carefully before investing. This and other information about Wells Fargo Advantage Funds can be found in the current prospectus. Read the prospectus carefully before you invest or send money.
Wells Fargo Funds Management, LLC, a wholly owned subsidiary of Wells Fargo & Company, provides investment advisory and administrative services for Wells Fargo Advantage Funds. Other affiliates of Wells Fargo & Company provide subadvisory and other services for the Funds. The Funds are distributed by Wells Fargo Funds Distributor, LLC, Member FINRA/SIPC, an affiliate of Wells Fargo & Company.
NOT FDIC INSURED ¡ NO BANK GUARANTEE ¡ MAY LOSE VALUE
© 2014 Wells Fargo Funds Management, LLC. All rights reserved.
222099 02-14 AVT8/AR154 12-13 |
Table of Contents

Wells Fargo Advantage
VT Total Return Bond Fund

Annual Report
December 31, 2013

Table of Contents
Reduce clutter. Save trees.
Sign up for electronic delivery of prospectuses and shareholder reports at wellsfargo.com/advantagedelivery
Contents
| 2 | ||||
| 4 | ||||
| 8 | ||||
| 9 | ||||
Financial statements | ||||
| 25 | ||||
| 26 | ||||
| 27 | ||||
| 28 | ||||
| 29 | ||||
| 34 | ||||
| 35 | ||||
| 38 | ||||
The views expressed and any forward-looking statements are as of December 31, 2013, unless otherwise noted, and are those of the Fund managers and/or Wells Fargo Funds Management, LLC. Discussions of individual securities, or the markets generally, or any Wells Fargo Advantage Fund are not intended as individual recommendations. Future events or results may vary significantly from those expressed in any forward-looking statements; the views expressed are subject to change at any time in response to changing circumstances in the market. Wells Fargo Funds Management, LLC and the Fund disclaim any obligation to publicly update or revise any views expressed or forward-looking statements.
NOT FDIC INSURED ¡ NO BANK GUARANTEE ¡ MAY LOSE VALUE
Table of Contents
| 2 | Wells Fargo Advantage VT Total Return Bond Fund | Letter to shareholders (unaudited) |

Karla M. Rabusch
President
Wells Fargo Advantage Funds
Fixed-income markets shifted significantly during the period as economic optimism surged in the opening months of 2013, spurring a rally in equities but also a rise in U.S. Treasury yields.
Dear Valued Shareholder:
We are pleased to offer you this annual report for the Wells Fargo Advantage VT Total Return Bond Fund for the 12-month period that ended December 31, 2013. Fixed-income markets shifted significantly during the period as economic optimism surged in the opening months of 2013, spurring a rally in equities but also a rise in U.S. Treasury yields. Investment-grade bond sectors correspondingly experienced periods of price declines and rising yields during 2013. Below-investment-grade securities tended to perform better as their higher-yield spreads cushioned some of the yield increases in the Treasury markets. Structured products also generally protected their pricing better than Treasuries, particularly U.S. commercial mortgage-backed securities. But, high-yield corporate securities performed better than investment-grade sectors over the full breadth of the period, generating positive returns despite significant price corrections across the full fixed-income market in June 2013.
The return of economic optimism in 2013 led to declines in bond prices as yields rose higher.
In the opening weeks of 2013, U.S. Treasury yields began to rise higher on optimistic expectations for a strengthening U.S. economy. Consequently, fixed-income security yields shifted higher and prices declined across much of the U.S. investment-grade bond sectors. U.S. Treasury prices significantly declined in January 2013, most notably in the longer-maturity ranges, as investors began to reprice bond yields for potential interest-rate increases in upcoming years.
In February and March 2013, investment-grade fixed-income markets rebounded when equity market exuberance was reined in by some sobering signs of caution from mixed economic indicators. Investors again returned to the U.S. Treasury market, driving yields lower and bond prices higher. These appreciating trends strengthened during the volatile month of April 2013, which was rattled by geopolitical events, domestic terrorism in Boston, and uncertain global economic conditions. U.S. Treasury prices increased sharply, temporarily erasing all of the price losses endured in January 2013 and, in fact, crossing over into positive gains.
U.S. equity markets rallied in the spring, leading to a sharp decline in bond prices.
Unfortunately for the core bond investment-grade markets, the February through April recovery in bond prices only proved temporary. The month of May 2013 unleashed a massive rally in the U.S. equity markets; consequently, U.S. Treasury prices declined again, while investment-grade corporate bonds and structured products correspondingly also declined in price. These market moves resulted in the largest monthly losses across the investment-grade bond markets in nearly five years.
The depreciating trends for bonds deepened in mid-June 2013 on comments from Federal Reserve (Fed) Chairman Bernanke that tapering of the Fed’s bond-buying programs may begin later in the year and that the programs may end completely around mid-2014. For the last two weeks of June 2013, that debate appeared to play out daily, as volatility buffeted both the equity and bond markets, finally capitulating to yet another sustained rally in equities and a modest retreat in bond prices. Both investment-grade corporate bonds and high-yield corporate bonds posted their worst monthly returns of the year in June 2013—in general, investment-grade securities had their largest quarterly decline in nine years during the second quarter.
The Fed postponed tapering its bond-buying program until January 2014.
In July and August 2013, equity exuberance quieted a bit, and fixed-income markets stabilized. Returns were more mixed, with slightly negative returns in the highest-quality securities to modestly positive the lower down the credit tiers. In September and October 2013, investment-grade and high-yield bond markets began generating positive returns yet again, as the Fed backtracked on its intentions to taper quantitative easing, postponing it until 2014 at the earliest. This temporary rally lasted until around November 20, when notes were released from the Fed’s October
Table of Contents
| Letter to shareholders (unaudited) | Wells Fargo Advantage VT Total Return Bond Fund | 3 |
meeting that indicated tapering of the bond-buying programs would in fact begin in January 2014. Consequently, long-term Treasury yields and mortgage rates ratcheted higher, leading to declines in pricing across much of the core fixed-income markets.
On the whole, the declines in bond prices during May, June, August, and December 2013 culminated in slightly negative returns across the investment-grade markets for the full period. The U.S. Treasury, corporate bond, and mortgage-backed security sectors declined in value while commercial mortgage-backed securities generated positive returns. Thus, the theme for the period was a persistent increase in U.S. Treasury yields that intermittently pressured fixed-income security prices.
Don’t let short-term uncertainty derail long-term investment goals.
While periods of uncertainty can present challenges, they can also create opportunities, and experience has taught us that maintaining long-term investment goals can be an effective way to plan for the future. To help you create a sound strategy based on your personal goals and risk tolerance, Wells Fargo Advantage Funds offers more than 100 mutual funds and other investments spanning a wide range of asset classes and investment styles. Although diversification cannot guarantee an investment profit or prevent losses, we believe it can be an effective way to manage investment risk and potentially smooth out overall portfolio performance. We encourage investors to know their investments and to understand that appropriate levels of risk-taking may unlock opportunities.
Thank you for choosing to invest with Wells Fargo Advantage Funds. We appreciate your confidence in us and remain committed to helping you meet your financial needs. For current information about your fund investments, contact your investment professional, visit our website at wellsfargoadvantagefunds.com, or call us directly at 1-800-222-8222. We are available 24 hours a day, 7 days a week.
Sincerely,

Karla M. Rabusch
President
Wells Fargo Advantage Funds
The theme for the period was a persistent increase in U.S. Treasury yields that intermittently pressured fixed-income security prices.
Notice to shareholders
The Fund and Funds Management, LLC (“Funds Management”) have received an exemptive order from the SEC that permits Funds Management, subject to the approval of the Board of Trustees of the Fund, to select or replace certain subadvisers to manage all or a portion of the Fund’s assets and enter into, amend or terminate a sub-advisory agreement with certain subadvisers without obtaining shareholder approval (“Multi-manager Structure”). The Multi-manager Structure applies to subadvisers that are not affiliated with Funds Management or the Fund, except to the extent that affiliation arises solely because such subadvisers provide sub-advisory services to the Fund (“Non-affiliated Subadvisers”), as well as subadvisers that are indirect or direct wholly-owned subsidiaries of Funds Management or of another company that, indirectly or directly, wholly owns Funds Management (“Wholly-owned Subadvisers”).
Pursuant to the SEC order, Funds Management, with the approval of the Board of Trustees, has the discretion to terminate any subadvisers and allocate and reallocate the Fund’s assets among any other Non-affiliated Subadvisers or Wholly-owned Subadvisers. Funds Management, subject to oversight and supervision by the Board of Trustees, has responsibility to continue to oversee any subadvisers to the Fund and to recommend, for approval by the Board of Trustees, the hiring, termination and replacement of subadvisers for the Fund. In the event that a new subadviser is hired pursuant to the Multi-manager Structure, the Fund is required to provide notice to shareholders within 90 days.
Please contact your investment professional or call us directly at 1-800-222-8222 if you have any questions on this Notice to Shareholders.
Table of Contents
| 4 | Wells Fargo Advantage VT Total Return Bond Fund | Performance highlights (unaudited) |
Investment objective
The Fund seeks total return, consisting of income and capital appreciation.
Adviser
Wells Fargo Funds Management, LLC
Subadviser
Wells Capital Management Incorporated
Portfolio managers
Troy Ludgood
Thomas O’Connor, CFA
Average annual total returns (%) as of December 31, 2013
| Expense ratios1 (%) | ||||||||||||||||||||||
| Inception date | 1 year | 5 year | 10 year | Gross | Net2 | |||||||||||||||||
| Class 2 | 9-20-1999 | (2.43 | ) | 6.09 | 4.90 | 0.95 | 0.91 | |||||||||||||||
| Barclays U.S. Aggregate Bond Index3 | – | (2.02 | ) | 4.44 | 4.55 | – | – | |||||||||||||||
Figures quoted represent past performance, which is no guarantee of future results and do not reflect the deduction of taxes that a shareholder may pay on fund distributions or the redemption of fund shares. Investment return and principal value of an investment will fluctuate so that an investor’s shares, when redeemed, may be worth more or less than their original cost. Current performance may be lower or higher than the performance data quoted, which assumes the reinvestment of dividends and capital gains. Current month-end performance is available by calling 1-800-222-8222. Performance figures of the Fund do not reflect fees charged pursuant to the terms of variable life insurance policies and variable annuity contracts. If fees had been reflected, performance would have been lower.
Index returns do not include transaction costs associated with buying and selling securities, any mutual fund fees or expenses, or any taxes. It is not possible to invest directly in an index.
Bond values fluctuate in response to the financial condition of individual issuers, general market and economic conditions, and changes in interest rates. In general, when interest rates rise, bond values fall and investors may lose principal value. The use of derivatives may reduce returns and/or increase volatility. Certain investment strategies tend to increase the total risk of an investment (relative to the broader market). The Fund is exposed to foreign investment risk and mortgage- and asset-backed securities risk. Consult the Fund’s prospectus for additional information on these and other risks.
Please refer to the prospectus provided by your participating insurance company for detailed information describing the separate accounts for information regarding surrender charges, mortality and expense risk fees, and other charges that may be assessed by the participating insurance companies.
Please see footnotes on page 5.
Table of Contents
| Performance highlights (unaudited) | Wells Fargo Advantage VT Total Return Bond Fund | 5 |
| Growth of $10,000 investment4 as of December 31, 2013 |
|

| 1. | Reflects the expense ratios as stated in the most recent prospectus. |
| 2. | The Adviser has committed through April 30, 2014, to waive fees and/or reimburse expenses to the extent necessary to cap the Fund’s Total Annual Fund Operating Expenses After Fee Waiver, excluding certain expenses, at 0.90% for Class 2. Brokerage commissions, stamp duty fees, interest, taxes, acquired fund fees and expenses, and extraordinary expenses are excluded from the cap. Without this cap, the Fund’s returns would have been lower. |
| 3. | The Barclays U.S. Aggregate Bond Index is a broad-based benchmark that measures the investment grade, U.S. dollar-denominated, fixed-rate taxable bond market, including Treasuries, government-related and corporate securities, MBS (agency fixed-rate and hybrid ARM passthroughs), ABS, and CMBS. You cannot invest directly in an index. |
| 4. | The chart compares the performance of Class 2 shares for the most recent ten years with the Barclays U.S. Aggregate Bond Index. The chart assumes a hypothetical $10,000 investment and reflects all operating expenses of the Fund. Performance figures of the Fund do not reflect fees charged pursuant to the terms of variable life insurance policies and variable annuity contracts. |
| 5. | The ten largest long-term holdings are calculated based on the value of the securities divided by total net assets of the Fund. Holdings are subject to change and may have changed since the date specified. |
| 6. | Portfolio allocation is subject to change and is calculated based on the total long-term investments of the Fund. |
Table of Contents
| 6 | Wells Fargo Advantage VT Total Return Bond Fund | Performance highlights (unaudited) |
MANAGER’S DISCUSSION
Fund highlights
| n | The Fund underperformed the Barclays U.S. Aggregate Bond Index for the 12-month period that ended December 31, 2013, primarily due to our emphasis on mortgages. Specific lower-coupon mortgage-backed securities that we held underperformed, most notably during the summer months. |
| n | Several specific corporate security selections within telecommunication services, finance, and utilities notably contributed to performance. Detractors were concentrated in energy, transportation, and basic industry. |
| n | Sector overweights and relative-value trading in the asset-backed securities (ABS) and commercial mortgage-backed securities (CMBS) sectors contributed to performance during the year. Security selection in ABS, including an overweight in five- to eight-year average life Federal Family Education Loan Program (FFELP) bonds, private student loans, auto dealer floorplans, and rental car ABS also contributed. |
| n | The Fund’s overweight in the 10-year range of the curve modestly detracted from performance during the period as yields rose higher. |
| Ten largest long-term holdings5 (%) as of December 31, 2013 | ||||
U.S. Treasury Note, 1.25%, 11-30-2018 | 3.19 | |||
U.S. Treasury Note, 0.38%, 8-31-2015 | 2.92 | |||
U.S. Treasury Note, 0.63%, 12-15-2016 | 2.38 | |||
GNMA, 4.00%, 12-1-2044 | 2.30 | |||
U.S. Treasury Note, 0.25%, 7-31-2015 | 2.27 | |||
U.S. Treasury Note, 3.13%, 4-30-2017 | 2.19 | |||
U.S. Treasury Note, 0.63%, 10-15-2016 | 1.83 | |||
FNMA, 3.50%, 12-1-2044 | 1.76 | |||
U.S. Treasury Note, 0.25%, 10-15-2015 | 1.42 | |||
U.S. Treasury Note, 2.75%, 11-15-2023 | 1.38 | |||
Fixed-income yields shifted higher throughout the course of the year.
The full year of 2013 was a transition for fixed income. Bond markets finally moved past the specters of government and fiscal dysfunction in the U.S., the eurozone, and Japan. We saw growth expectations consolidate and stabilize in China; geopolitical headlines from Syria, Egypt, North Korea, and Iran; and a resurgence of strategic activity in corporate boardrooms. Markets navigated a shift higher in Treasury yields and factored in the Federal Reserve’s (Fed’s) eventual exit from quantitative easing (QE) just as growth and unemployment in the U.S. demonstrated meaningful improvement.
Fixed-income markets began the year with a strong rally,
driven by a midnight-hour U.S. government compromise on the fiscal cliff. European authorities continued to dampen fears of a eurozone breakup and yields in the region narrowed markedly. Dell leveraged buyout rumors kicked off what proved to be a busy year for corporate deal makers, eventually culminating in Verizon’s $130 billion acquisition of Vodafone’s stake. As the year progressed, we saw renewed turmoil in the eurozone following a deadlocked election in Italy and a financial panic and debt restructuring in Cyprus. Fortunately, fears of a eurozone breakup did not ultimately reignite. In the spring, Japan dominated market headlines as Prime Minister Abe and Central Bank Governor Kuroda’s launch of Abenomics rerated economic growth expectations.
In May, as economic data began to slowly improve, Fed Chairman Ben Bernanke opened the door to QE tapering in public remarks, prompting a broad-based sell-off in fixed-income markets, increased rates, and a steepened yield curve, with notable volatility/underperformance in mortgages and capital outflows from emerging markets. Following the summer’s taper tantrum, markets remained focused on Bernanke’s every word and gesture and parsed economic data through the prism of their impact on the timing of Fed tapering.
In September, markets rallied on the Fed’s surprise decision not to taper, Janet Yellen’s reemergence as Bernanke’s dovish successor, and a last-minute chemical weapons deal with Syria. The rally in risk assets paused briefly in October in the wake of the government shutdown and debt ceiling hostage crisis but continued a strong performance thereafter into year-end, driven by continued improvements in economic data—notably unemployment dropping below 7% and third-quarter gross domestic product growth above 4%—and markets were able to smoothly digest the announcement in December that the long-awaited Fed tapering would finally begin in January 2014.
Please see footnotes on page 5.
Table of Contents
| Performance highlights (unaudited) | Wells Fargo Advantage VT Total Return Bond Fund | 7 |
| Portfolio allocation6 as of December 31, 2013 | ||
| ||

U.S. and European economic growth has been improving, while the U.S. tapers QE.
While we have seen plenty of false dawns over the past few years, it appears that growth projections for the U.S. and Europe are now finally on the rise. Near-term fiscal adjustments are now largely complete, suggesting potentially lower fiscal headwinds going forward, with attention (hopefully) turning at long last to longer-term issues such as entitlement reform. Additional tailwinds are provided by the lagged effects of highly accommodative monetary policy, increased policy clarity, and pent-up demand in several sectors. One key area of potential risk remains emerging markets—while there are signs that the near-term impact of recent market volatility has been less than feared, there remain question marks as to whether rising imbalances are being effectively addressed.
Now that the Fed’s framework for tapering and, ultimately, exiting asset purchases has been announced, market participants should focus on the uncertain impact on U.S. rates and supply/demand dynamics in global financial markets. As an important mitigating factor to the impacts of exiting QE, muted inflation trends provide the Fed additional confidence in its projections within the balanced approach to monetary policy that short-term rates can remain near zero well into 2015.
A steeper and higher yield curve combined with a stampeding equity market may also prompt selective rebalancing into fixed income given dramatic improvements in asset/liability positions and more favorable pricing of fixed income’s insurance value against disinflation risks. Consistent with our bottom-up process, at the end of the period, we maintained a neutral duration. Guided by specific security selection opportunities, we also maintained modest overweights in CMBS/ABS, credit, and agency mortgages with a focus on higher-quality collateral. We remain nimble and continue to execute our strategy focused on security selection combined with relative-value trading and strong risk controls.
Please see footnotes on page 5.
Table of Contents
| 8 | Wells Fargo Advantage VT Total Return Bond Fund | Fund expenses (unaudited) |
As a shareholder of the Fund, you incur ongoing costs, including management fees, distribution (12b-1) fees, and other Fund expenses. This example is intended to help you understand your ongoing costs (in dollars) of investing in the Fund and to compare these costs with the ongoing costs of investing in other mutual funds.
The example is based on an investment of $1,000 invested at the beginning of the six-month period and held for the entire period from July 1, 2013 to December 31, 2013.
Actual expenses
The “Actual” line of the table below provides information about actual account values and actual expenses. You may use the information in this line, together with the amount you invested, to estimate the expenses that you paid over the period. Simply divide your account value by $1,000 (for example, an $8,600 account value divided by $1,000 = 8.6), then multiply the result by the number in the “Actual” line under the heading entitled “Expenses Paid During Period” for your applicable class of shares to estimate the expenses you paid on your account during this period.
Hypothetical example for comparison purposes
The “Hypothetical” line of the table below provides information about hypothetical account values and hypothetical expenses based on the Fund’s actual expense ratio and an assumed rate of return of 5% per year before expenses, which is not the Fund’s actual return. The hypothetical account values and expenses may not be used to estimate the actual ending account balance or expenses you paid for the period. You may use this information to compare the ongoing costs of investing in the Fund and other funds. To do so, compare this 5% hypothetical example with the 5% hypothetical examples that appear in the shareholder reports of the other funds.
Please note that the expenses shown in the table are meant to highlight your ongoing costs only and do not reflect any separate account charges assessed by participating insurance companies. Therefore, the “Hypothetical” line of the table is useful in comparing ongoing costs only, and will not help you determine the relative total costs of owning different funds. In addition, if these separate account charges assessed by participating insurance companies were included, your costs would have been higher.
| Beginning account value 7-1-2013 | Ending account value 12-31-2013 | Expenses paid during | Net annual expense ratio | |||||||||||||
Class 2 | ||||||||||||||||
Actual | $ | 1,000.00 | $ | 1,005.48 | $ | 4.55 | 0.90 | % | ||||||||
Hypothetical (5% return before expenses) | $ | 1,000.00 | $ | 1,020.67 | $ | 4.58 | 0.90 | % | ||||||||
| 1. | Expenses paid is equal to the annualized expense ratio multiplied by the average account value over the period, multiplied by the number of days in the most recent fiscal half-year divided by the number of days in the fiscal year (to reflect the one-half year period). |
Table of Contents
| Portfolio of investments—December 31, 2013 | Wells Fargo Advantage VT Total Return Bond Fund | 9 |
| Security name | Interest rate | Maturity date | Principal | Value | ||||||||||||
Agency Securities: 33.49% | ||||||||||||||||
FHLMC ± | 2.12 | % | 2-1-2043 | $ | 50,528 | $ | 50,554 | |||||||||
FHLMC ± | 2.24 | 7-1-2043 | 687,652 | 687,086 | ||||||||||||
FHLMC ± | 2.26 | 10-1-2042 | 129,123 | 129,910 | ||||||||||||
FHLMC ± | 2.37 | 2-1-2043 | 52,143 | 52,579 | ||||||||||||
FHLMC | 2.50 | 5-1-2028 | 287,924 | 285,611 | ||||||||||||
FHLMC ± | 2.86 | 5-1-2042 | 134,587 | 135,266 | ||||||||||||
FHLMC | 3.00 | 7-1-2032 | 38,826 | 37,668 | ||||||||||||
FHLMC | 3.00 | 12-1-2032 | 25,280 | 24,527 | ||||||||||||
FHLMC | 3.00 | 1-1-2033 | 76,569 | 74,288 | ||||||||||||
FHLMC | 3.00 | 2-1-2033 | 40,701 | 39,487 | ||||||||||||
FHLMC | 3.00 | 7-1-2033 | 35,419 | 34,362 | ||||||||||||
FHLMC | 3.00 | 7-1-2033 | 29,515 | 28,633 | ||||||||||||
FHLMC | 3.00 | 8-1-2042 | 72,928 | 68,264 | ||||||||||||
FHLMC | 3.00 | 10-1-2042 | 28,325 | 26,513 | ||||||||||||
FHLMC | 3.00 | 12-1-2042 | 34,275 | 32,090 | ||||||||||||
FHLMC | 3.00 | 2-1-2043 | 32,429 | 30,354 | ||||||||||||
FHLMC | 3.00 | 4-1-2043 | 114,438 | 107,113 | ||||||||||||
FHLMC | 3.00 | 8-1-2043 | 369,350 | 345,728 | ||||||||||||
FHLMC ± | 3.16 | 2-1-2042 | 195,562 | 199,036 | ||||||||||||
FHLMC | 3.50 | 3-1-2033 | 24,338 | 24,460 | ||||||||||||
FHLMC | 3.50 | 3-1-2033 | 33,070 | 33,236 | ||||||||||||
FHLMC | 3.50 | 3-1-2033 | 90,260 | 90,713 | ||||||||||||
FHLMC | 3.50 | 6-1-2033 | 95,299 | 95,780 | ||||||||||||
FHLMC | 3.50 | 7-1-2033 | 52,799 | 53,065 | ||||||||||||
FHLMC | 3.50 | 11-1-2042 | 79,868 | 78,465 | ||||||||||||
FHLMC | 3.50 | 11-1-2042 | 47,859 | 47,020 | ||||||||||||
FHLMC | 3.50 | 3-1-2043 | 119,964 | 117,857 | ||||||||||||
FHLMC | 3.50 | 3-1-2043 | 73,946 | 72,646 | ||||||||||||
FHLMC | 3.50 | 3-1-2043 | 82,617 | 81,163 | ||||||||||||
FHLMC | 3.50 | 4-1-2043 | 46,388 | 45,573 | ||||||||||||
FHLMC | 3.50 | 4-1-2043 | 33,558 | 32,969 | ||||||||||||
FHLMC | 3.50 | 4-1-2043 | 259,109 | 254,558 | ||||||||||||
FHLMC | 3.50 | 4-1-2043 | 60,205 | 59,147 | ||||||||||||
FHLMC | 3.50 | 4-1-2043 | 81,903 | 80,463 | ||||||||||||
FHLMC | 3.50 | 4-1-2043 | 78,950 | 77,562 | ||||||||||||
FHLMC | 3.50 | 5-1-2043 | 267,908 | 263,213 | ||||||||||||
FHLMC | 3.50 | 5-1-2043 | 98,833 | 97,095 | ||||||||||||
FHLMC | 3.50 | 8-1-2043 | 45,692 | 44,886 | ||||||||||||
FHLMC | 4.00 | 7-1-2026 | 194,261 | 205,315 | ||||||||||||
FHLMC | 4.00 | 6-1-2033 | 24,514 | 25,271 | ||||||||||||
FHLMC | 4.00 | 11-1-2033 | 28,865 | 30,209 | ||||||||||||
FHLMC | 4.50 | 9-1-2042 | 82,488 | 88,234 | ||||||||||||
FHLMC | 5.00 | 8-1-2039 | 423,988 | 467,389 | ||||||||||||
FHLMC | 5.00 | 2-15-2040 | 217,295 | 238,510 | ||||||||||||
FHLMC | 5.00 | 4-1-2041 | 65,885 | 72,023 | ||||||||||||
FHLMC | 5.00 | 5-1-2041 | 58,395 | 63,545 | ||||||||||||
FHLMC | 5.00 | 8-1-2041 | 506,458 | 553,694 | ||||||||||||
FHLMC | 5.00 | 4-1-2042 | 61,045 | 67,297 | ||||||||||||
FHLMC | 5.50 | 7-1-2038 | 171,536 | 191,420 | ||||||||||||
FHLMC | 6.00 | 3-1-2034 | 24,833 | 27,821 | ||||||||||||
The accompanying notes are an integral part of these financial statements.
Table of Contents
| 10 | Wells Fargo Advantage VT Total Return Bond Fund | Portfolio of investments—December 31, 2013 |
| Security name | Interest rate | Maturity date | Principal | Value | ||||||||||||
Agency Securities (continued) | ||||||||||||||||
FHLMC Series 2980 Class QA | 6.00 | % | 5-15-2035 | $ | 413,940 | $ | 463,791 | |||||||||
FHLMC Series 3529 Class AG | 6.50 | 4-15-2039 | 152,228 | 169,491 | ||||||||||||
FHLMC Series 3622 Class WA | 5.50 | 9-15-2039 | 180,359 | 200,145 | ||||||||||||
FHLMC Series 3664 Class DA | 4.00 | 11-15-2037 | 69,018 | 74,183 | ||||||||||||
FHLMC Series 3876 Class NB | 5.00 | 8-15-2038 | 132,749 | 145,538 | ||||||||||||
FHLMC Series K003 Class AAB | 4.77 | 5-25-2018 | 151,000 | 162,710 | ||||||||||||
FHLMC Series T-48 Class 1A3 ± | 5.78 | 7-25-2033 | 2,511 | 2,835 | ||||||||||||
FHLMC Series T-57 Class 1A2 | 7.00 | 7-25-2043 | 411 | 469 | ||||||||||||
FHLMC Series T-57 Class 1A3 | 7.50 | 7-25-2043 | 26,717 | 31,693 | ||||||||||||
FHLMC Series T-59 Class 1A3 | 7.50 | 10-25-2043 | 36,475 | 42,731 | ||||||||||||
FHLMC Series T-60 Class 1A3 | 7.50 | 3-25-2044 | 38,289 | 45,293 | ||||||||||||
FNMA ± | 1.99 | 4-1-2043 | 281,393 | 280,237 | ||||||||||||
FNMA ± | 2.01 | 1-1-2043 | 33,288 | 33,180 | ||||||||||||
FNMA ± | 2.04 | 7-1-2043 | 53,895 | 51,508 | ||||||||||||
FNMA ± | 2.04 | 6-1-2043 | 137,751 | 137,233 | ||||||||||||
FNMA ± | 2.06 | 6-1-2043 | 204,555 | 203,775 | ||||||||||||
FNMA ± | 2.10 | 1-1-2043 | 82,155 | 82,136 | ||||||||||||
FNMA ± | 2.11 | 4-1-2043 | 37,424 | 37,298 | ||||||||||||
FNMA ± | 2.13 | 1-1-2043 | 84,868 | 85,093 | ||||||||||||
FNMA ± | 2.15 | 5-1-2043 | 499,699 | 499,626 | ||||||||||||
FNMA ± | 2.21 | 7-1-2043 | 99,870 | 99,533 | ||||||||||||
FNMA ± | 2.39 | 1-1-2036 | 48,822 | 51,743 | ||||||||||||
FNMA ± | 2.47 | 9-1-2043 | 122,197 | 123,151 | ||||||||||||
FNMA | 2.50 | 7-1-2027 | 278,309 | 276,395 | ||||||||||||
FNMA | 2.50 | 10-1-2027 | 374,776 | 372,190 | ||||||||||||
FNMA | 2.50 | 11-1-2027 | 267,658 | 265,811 | ||||||||||||
FNMA | 2.50 | 11-1-2027 | 602,992 | 600,339 | ||||||||||||
FNMA | 2.50 | 12-1-2027 | 186,814 | 185,524 | ||||||||||||
FNMA | 2.50 | 12-1-2027 | 109,746 | 108,988 | ||||||||||||
FNMA (a)%% | 2.50 | 2-25-2044 | 102,000 | 104,137 | ||||||||||||
FNMA ± | 2.50 | 11-1-2042 | 99,641 | 101,260 | ||||||||||||
FNMA ± | 2.63 | 9-1-2043 | 112,423 | 110,545 | ||||||||||||
FNMA | 3.00 | 2-1-2033 | 52,429 | 51,140 | ||||||||||||
FNMA | 3.00 | 3-1-2033 | 24,193 | 23,599 | ||||||||||||
FNMA | 3.00 | 3-1-2033 | 37,945 | 37,013 | ||||||||||||
FNMA | 3.00 | 7-1-2033 | 67,800 | 66,139 | ||||||||||||
FNMA | 3.00 | 12-1-2037 | 68,031 | 63,683 | ||||||||||||
FNMA | 3.00 | 10-1-2042 | 91,680 | 85,823 | ||||||||||||
FNMA | 3.00 | 11-1-2042 | 144,546 | 135,314 | ||||||||||||
FNMA | 3.00 | 1-1-2043 | 401,426 | 375,762 | ||||||||||||
FNMA | 3.00 | 1-1-2043 | 136,738 | 128,003 | ||||||||||||
FNMA | 3.00 | 1-1-2043 | 89,383 | 83,673 | ||||||||||||
FNMA | 3.00 | 2-1-2043 | 334,681 | 313,279 | ||||||||||||
FNMA | 3.00 | 2-1-2043 | 51,658 | 48,368 | ||||||||||||
FNMA | 3.00 | 2-1-2043 | 226,143 | 211,682 | ||||||||||||
FNMA | 3.00 | 3-1-2043 | 407,872 | 381,790 | ||||||||||||
FNMA | 3.00 | 5-1-2043 | 231,193 | 216,492 | ||||||||||||
FNMA %% | 3.00 | 4-25-2027 | 900,000 | 916,348 | ||||||||||||
FNMA %% | 3.00 | 5-25-2027 | 800,000 | 812,281 | ||||||||||||
FNMA %% | 3.00 | 9-25-2042 | 900,000 | 854,367 | ||||||||||||
The accompanying notes are an integral part of these financial statements.
Table of Contents
| Portfolio of investments—December 31, 2013 | Wells Fargo Advantage VT Total Return Bond Fund | 11 |
| Security name | Interest rate | Maturity date | Principal | Value | ||||||||||||
Agency Securities (continued) | ||||||||||||||||
FNMA ± | 3.03 | % | 3-1-2042 | $ | 78,295 | $ | 79,288 | |||||||||
FNMA | 3.50 | 7-1-2032 | 207,284 | 207,958 | ||||||||||||
FNMA | 3.50 | 3-1-2033 | 24,367 | 24,447 | ||||||||||||
FNMA | 3.50 | 5-1-2033 | 24,426 | 24,508 | ||||||||||||
FNMA | 3.50 | 7-1-2033 | 40,405 | 40,539 | ||||||||||||
FNMA | 3.50 | 8-1-2042 | 130,299 | 127,872 | ||||||||||||
FNMA | 3.50 | 9-1-2042 | 887,686 | 871,149 | ||||||||||||
FNMA | 3.50 | 2-1-2043 | 312,471 | 306,655 | ||||||||||||
FNMA %% | 3.50 | 3-25-2042 | 1,600,000 | 1,589,375 | ||||||||||||
FNMA %% | 3.50 | 6-25-2026 | 100,000 | 104,012 | ||||||||||||
FNMA | 4.00 | 9-1-2033 | 49,468 | 51,105 | ||||||||||||
FNMA | 4.00 | 10-1-2033 | 24,875 | 25,583 | ||||||||||||
FNMA | 4.00 | 11-1-2033 | 26,920 | 27,807 | ||||||||||||
FNMA | 4.00 | 11-1-2033 | 90,300 | 94,702 | ||||||||||||
FNMA | 4.00 | 11-1-2033 | 93,747 | 98,302 | ||||||||||||
FNMA %% | 4.00 | 6-25-2041 | 700,000 | 720,562 | ||||||||||||
FNMA %% | 4.00 | 4-25-2024 | 100,000 | 105,961 | ||||||||||||
FNMA %% | 4.00 | 7-25-2041 | 1,000,000 | 1,026,250 | ||||||||||||
FNMA %% | 4.50 | 11-25-2039 | 300,000 | 316,887 | ||||||||||||
FNMA | 5.00 | 3-1-2041 | 19,644 | 21,423 | ||||||||||||
FNMA | 5.00 | 6-1-2041 | 79,740 | 87,638 | ||||||||||||
FNMA | 5.00 | 7-1-2041 | 688,071 | 763,702 | ||||||||||||
FNMA | 5.00 | 8-1-2041 | 92,273 | 101,437 | ||||||||||||
FNMA | 5.00 | 8-1-2041 | 254,603 | 280,272 | ||||||||||||
FNMA | 5.00 | 8-1-2041 | 49,541 | 54,744 | ||||||||||||
FNMA | 5.00 | 9-1-2041 | 64,422 | 70,752 | ||||||||||||
FNMA | 5.50 | 9-1-2034 | 33,917 | 36,947 | ||||||||||||
FNMA | 5.50 | 4-1-2036 | 25,328 | 27,825 | ||||||||||||
FNMA | 5.50 | 7-1-2039 | 40,026 | 44,908 | ||||||||||||
FNMA | 5.50 | 4-1-2040 | 130,736 | 148,495 | ||||||||||||
FNMA | 6.00 | 3-1-2034 | 212,862 | 238,917 | ||||||||||||
FNMA | 6.00 | 8-1-2034 | 23,480 | 26,355 | ||||||||||||
FNMA | 6.00 | 8-1-2034 | 39,305 | 44,113 | ||||||||||||
FNMA | 6.00 | 11-1-2034 | 34,616 | 38,844 | ||||||||||||
FNMA | 6.00 | 4-1-2035 | 11,386 | 12,777 | ||||||||||||
FNMA | 6.00 | 4-1-2035 | 12,008 | 13,475 | ||||||||||||
FNMA | 6.00 | 11-1-2035 | 84,251 | 94,564 | ||||||||||||
FNMA | 6.00 | 12-1-2035 | 86,586 | 97,243 | ||||||||||||
FNMA | 6.00 | 7-1-2037 | 213,271 | 239,365 | ||||||||||||
FNMA | 6.00 | 7-1-2037 | 35,615 | 39,977 | ||||||||||||
FNMA Series 2002-33 Class A2 | 7.50 | 6-25-2032 | 28,783 | 33,942 | ||||||||||||
FNMA Series 2002-95 Class DB | 6.00 | 1-25-2033 | 109,914 | 123,777 | ||||||||||||
FNMA Series 2003-W17 Class 1A7 | 5.75 | 8-25-2033 | 86,000 | 93,146 | ||||||||||||
FNMA Series 2005-5 Class PA | 5.00 | 1-25-2035 | 35,191 | 37,968 | ||||||||||||
FNMA Series 2006-56 Class CA | 6.00 | 7-25-2036 | 20,141 | 22,061 | ||||||||||||
FNMA Series 2009-20 Class DT | 4.50 | 4-25-2039 | 116,868 | 125,462 | ||||||||||||
FNMA Series 2011-58 Class AT | 4.00 | 7-25-2041 | 156,068 | 165,308 | ||||||||||||
FNMA Series 2012-130 Class DC | 3.00 | 12-25-2042 | 1,037,118 | 968,903 | ||||||||||||
FNMA Series 2012-133 Class JP | 2.50 | 7-25-2042 | 277,216 | 266,451 | ||||||||||||
FNMA Series 2012-134 Class LC | 3.00 | 12-25-2042 | 85,636 | 82,564 | ||||||||||||
The accompanying notes are an integral part of these financial statements.
Table of Contents
| 12 | Wells Fargo Advantage VT Total Return Bond Fund | Portfolio of investments—December 31, 2013 |
| Security name | Interest rate | Maturity date | Principal | Value | ||||||||||||
Agency Securities (continued) | ||||||||||||||||
FNMA Series 2013-121 Class LB | 3.00 | % | 12-25-2043 | $ | 417,014 | $ | 426,094 | |||||||||
FNMA Series 2013-41 Class WG | 2.50 | 11-25-2042 | 82,679 | 80,462 | ||||||||||||
FNMA Series 416 Class A350 | 3.50 | 11-25-2042 | 409,146 | 409,236 | ||||||||||||
GNMA %% | 4.00 | 1-20-2042 | 2,000,000 | 2,079,453 | ||||||||||||
GNMA %% | 4.50 | 6-15-2039 | 800,000 | 853,562 | ||||||||||||
GNMA Series 2013-44 Class NA | 2.50 | 2-20-2043 | 141,081 | 137,301 | ||||||||||||
Total Agency Securities (Cost $30,647,756) | 30,255,430 | |||||||||||||||
|
| |||||||||||||||
Asset-Backed Securities: 13.95% | ||||||||||||||||
Ally Auto Receivables Trust Series 2010-2 Class A4 | 2.09 | 5-15-2015 | 11,242 | 11,263 | ||||||||||||
Ally Auto Receivables Trust Series 2010-4 Class A4 | 1.35 | 12-15-2015 | 130,516 | 130,893 | ||||||||||||
Ally Auto Receivables Trust Series 2010-5 Class A4 | 1.75 | 3-15-2016 | 175,712 | 176,615 | ||||||||||||
Ally Auto Receivables Trust Series 2011-1 Class A4 | 2.23 | 3-15-2016 | 226,459 | 228,209 | ||||||||||||
Ally Auto Receivables Trust Series 2012-1 Class A3 | 0.93 | 2-16-2016 | 33,884 | 33,976 | ||||||||||||
Ally Auto Receivables Trust Series 2012-2 Class A3 | 0.74 | 4-15-2016 | 138,348 | 138,586 | ||||||||||||
Ally Auto Receivables Trust Series 2013-1 Class A4 | 0.84 | 2-15-2018 | 180,000 | 178,931 | ||||||||||||
Ally Master Owner Trust Series 2011-1 Class A2 | 2.15 | 1-15-2016 | 168,000 | 168,099 | ||||||||||||
Ally Master Owner Trust Series 2011-4 Class A1 ± | 0.97 | 9-15-2016 | 101,000 | 101,291 | ||||||||||||
American Express Issuance Trust II Series 2013-1 Class A ± | 0.45 | 2-15-2019 | 232,000 | 231,315 | ||||||||||||
American Express Issuance Trust II Series 2013-2 Class A ± | 0.60 | 8-15-2019 | 280,000 | 280,793 | ||||||||||||
AmeriCredit Automobile Receivables Trust Series 2012-4 Class A2 | 0.49 | 4-8-2016 | 51,107 | 51,092 | ||||||||||||
AmeriCredit Automobile Receivables Trust Series 2012-4 Class A3 | 0.67 | 6-8-2017 | 102,000 | 101,960 | ||||||||||||
AmeriCredit Automobile Receivables Trust Series 2013-2 Class A2 | 0.53 | 11-8-2016 | 45,162 | 45,151 | ||||||||||||
AmeriCredit Automobile Receivables Trust Series 2013-3 Class A2 | 0.68 | 10-11-2016 | 335,000 | 335,139 | ||||||||||||
Bank of America Credit Card Trust Series 2007-A10 Class A10 ± | 0.24 | 12-15-2016 | 256,000 | 255,986 | ||||||||||||
Capital Auto Receivables Asset Trust Series 2013-1 Class A3 | 0.79 | 6-20-2017 | 284,000 | 283,635 | ||||||||||||
Capital Auto Receivables Asset Trust Series 2013-2 Class A2 | 0.92 | 9-20-2016 | 148,000 | 148,284 | ||||||||||||
Capital Auto Receivables Asset Trust Series 2013-2 Class A4 | 1.56 | 7-20-2018 | 79,000 | 79,524 | ||||||||||||
Capital Auto Receivables Asset Trust Series 2013-3 Class A2 | 1.04 | 11-21-2016 | 98,000 | 98,308 | ||||||||||||
Capital Auto Receivables Asset Trust Series 2013-3 Class A4 | 1.68 | 4-20-2018 | 97,000 | 97,743 | ||||||||||||
Capital Auto Receivables Asset Trust Series 2013-4 Class A3 | 1.09 | 3-20-2018 | 127,000 | 126,519 | ||||||||||||
Capital Auto Receivables Asset Trust Series 2013-4 Class A4 | 1.47 | 7-20-2018 | 172,000 | 171,053 | ||||||||||||
Chase Issuance Trust Series 2013-A3 Class A3 ± | 0.45 | 4-15-2020 | 100,000 | 99,633 | ||||||||||||
Citibank Credit Card Issuance Trust Series 2013-A6 Class A6 | 1.32 | 9-7-2018 | 557,000 | 560,775 | ||||||||||||
Citibank Credit Card Issuance Trust Series 2013-A7 Class A7 ± | 0.60 | 9-10-2020 | 397,000 | 397,701 | ||||||||||||
Developers Diversified Realty Corporation Trust Series 2009-DDR1 Class A 144A | 3.81 | 10-14-2022 | 124,414 | 126,535 | ||||||||||||
Discover Card Execution Note Trust Series 2013-A5 Class A5 | 1.04 | 4-15-2019 | 253,000 | 252,746 | ||||||||||||
GE Capital Credit Card Master Note Trust Series 2011-1 Class A ± | 0.72 | 1-15-2017 | 100,000 | 100,018 | ||||||||||||
Honda Auto Receivables Owner Trust Series 2012-3 Class A2 | 0.46 | 12-15-2014 | 13,476 | 13,477 | ||||||||||||
Honda Auto Receivables Owner Trust Series 2013-2 Class A3 | 0.53 | 2-16-2017 | 112,000 | 111,955 | ||||||||||||
Honda Auto Receivables Owner Trust Series 2013-3 Class A2 | 0.54 | 1-15-2016 | 215,000 | 215,217 | ||||||||||||
MMCA Automobile Trust Series 2011-A Class A4 144A | 2.02 | 10-17-2016 | 84,078 | 84,558 | ||||||||||||
Nelnet Student Loan Trust Series 2004-5 Class A5 ± | 0.42 | 10-27-2036 | 152,000 | 148,553 | ||||||||||||
Nelnet Student Loan Trust Series 2005-1 Class A5 ± | 0.35 | 10-25-2033 | 293,000 | 276,571 | ||||||||||||
Nelnet Student Loan Trust Series 2005-2 Class A5 ± | 0.35 | 3-23-2037 | 237,000 | 227,962 | ||||||||||||
Nelnet Student Loan Trust Series 2006-1 Class A4 ± | 0.33 | 11-23-2022 | 299,147 | 298,115 | ||||||||||||
Nelnet Student Loan Trust Series 2006-2 Class A4 ± | 0.32 | 10-26-2026 | 287,167 | 286,578 | ||||||||||||
Nelnet Student Loan Trust Series 2007-1 Class A1 ± | 0.25 | 11-27-2018 | 55,845 | 55,736 | ||||||||||||
Nelnet Student Loan Trust Series 2007-2A Class A3L ±144A | 0.60 | 3-25-2026 | 526,000 | 519,847 | ||||||||||||
Nelnet Student Loan Trust Series 2010-4A Class A ±144A | 0.97 | 4-25-2046 | 74,426 | 75,090 | ||||||||||||
The accompanying notes are an integral part of these financial statements.
Table of Contents
| Portfolio of investments—December 31, 2013 | Wells Fargo Advantage VT Total Return Bond Fund | 13 |
| Security name | Interest rate | Maturity date | Principal | Value | ||||||||||||
Asset-Backed Securities (continued) | ||||||||||||||||
Nissan Auto Receivables Owner Trust Series 2011-A Class A3 | 1.18 | % | 2-16-2015 | $ | 4,535 | $ | 4,536 | |||||||||
Nissan Auto Receivables Owner Trust Series 2012-B Class A2 | 0.39 | 4-15-2015 | 16,453 | 16,455 | ||||||||||||
Santander Drive Auto Receivables Trust Series 2012-5 Class A2 | 0.57 | 12-15-2015 | 14,801 | 14,802 | ||||||||||||
Santander Drive Auto Receivables Trust Series 2012-5 Class A3 | 0.83 | 12-15-2016 | 51,000 | 51,010 | ||||||||||||
Santander Drive Auto Receivables Trust Series 2012-6 Class A3 | 0.62 | 7-15-2016 | 56,000 | 56,029 | ||||||||||||
Santander Drive Auto Receivables Trust Series 2013-2 Class A3 | 0.70 | 9-15-2017 | 306,000 | 306,067 | ||||||||||||
Santander Drive Auto Receivables Trust Series 2013-3 Class A2 | 0.55 | 9-15-2016 | 255,519 | 255,435 | ||||||||||||
SLM Student Loan Trust Series 2004-5A Class A5 ±144A | 0.84 | 10-25-2023 | 250,000 | 250,934 | ||||||||||||
SLM Student Loan Trust Series 2004-8A Class A5 ±144A | 0.74 | 4-25-2024 | 250,749 | 251,213 | ||||||||||||
SLM Student Loan Trust Series 2005-6 Class A5 ± | 1.44 | 7-27-2026 | 87,274 | 88,596 | ||||||||||||
SLM Student Loan Trust Series 2005-9 Class A4 ± | 0.34 | 1-25-2023 | 21,808 | 21,807 | ||||||||||||
SLM Student Loan Trust Series 2007-2 Class A2 ± | 0.64 | 5-15-2028 | 87,466 | 87,316 | ||||||||||||
SLM Student Loan Trust Series 2007-2 Class B ± | 0.41 | 7-25-2025 | 100,000 | 86,329 | ||||||||||||
SLM Student Loan Trust Series 2010-1 Class A ± | 0.57 | 3-25-2025 | 153,311 | 152,816 | ||||||||||||
SLM Student Loan Trust Series 2010-A Class 2A ±144A | 3.42 | 5-16-2044 | 147,755 | 156,596 | ||||||||||||
SLM Student Loan Trust Series 2011-C Class A1 ±144A | 1.57 | 12-15-2023 | 147,820 | 148,851 | ||||||||||||
SLM Student Loan Trust Series 2012-6 Class B ± | 1.17 | 4-27-2043 | 100,000 | 91,095 | ||||||||||||
SLM Student Loan Trust Series 2012-A Class A1 ±144A | 1.57 | 8-15-2025 | 220,108 | 222,222 | ||||||||||||
SLM Student Loan Trust Series 2012-B Class A1 ±144A | 1.27 | 12-15-2021 | 178,990 | 179,818 | ||||||||||||
SLM Student Loan Trust Series 2012-C Class A1 ±144A | 1.27 | 8-15-2023 | 166,244 | 167,184 | ||||||||||||
SLM Student Loan Trust Series 2012-E Class A1 ±144A | 0.92 | 10-16-2023 | 236,366 | 236,515 | ||||||||||||
SLM Student Loan Trust Series 2012-E Class A2 ±144A | 1.92 | 6-15-2045 | 233,000 | 237,360 | ||||||||||||
SLM Student Loan Trust Series 2013-1 Class A2 ± | 0.42 | 9-25-2019 | 105,000 | 104,570 | ||||||||||||
SLM Student Loan Trust Series 2013-1 Class B ± | 1.97 | 11-25-2043 | 100,000 | 96,948 | ||||||||||||
SLM Student Loan Trust Series 2013-3 Class A2 ± | 0.47 | 5-26-2020 | 106,000 | 105,626 | ||||||||||||
SLM Student Loan Trust Series 2013-5 Class A2 ± | 0.56 | 10-26-2020 | 100,000 | 99,992 | ||||||||||||
SLM Student Loan Trust Series 2013-6 Class A2 ± | 0.67 | 2-25-2021 | 124,000 | 124,003 | ||||||||||||
SLM Student Loan Trust Series 2013-A Class A1 ±144A | 0.77 | 8-15-2022 | 176,314 | 176,045 | ||||||||||||
SLM Student Loan Trust Series 2013-B Class A1 ±144A | 0.82 | 7-15-2022 | 125,571 | 125,508 | ||||||||||||
SLM Student Loan Trust Series 2013-B Class A2A 144A | 1.85 | 6-17-2030 | 350,000 | 337,388 | ||||||||||||
SLM Student Loan Trust Series 2013-C Class A1 ±144A | 1.02 | 2-15-2022 | 167,899 | 168,361 | ||||||||||||
SLM Student Loan Trust Series 2013-C Class A2A 144A | 2.94 | 10-15-2031 | 163,000 | 164,654 | ||||||||||||
SMS Student Loan Trust Series 2000-A Class A2 ± | 0.43 | 10-28-2028 | 74,015 | 73,694 | ||||||||||||
SMS Student Loan Trust Series 2000-B Class A2 ± | 0.44 | 4-28-2029 | 70,516 | 70,233 | ||||||||||||
Trade Maps Limited Series 2013-1A Class A ±144A | 0.87 | 12-10-2018 | 268,000 | 268,493 | ||||||||||||
Volkswagen Auto Loan Enhanced Trust Series 2012-2 Class A2 | 0.33 | 7-20-2015 | 47,124 | 47,110 | ||||||||||||
World Financial Network Credit Card Master Trust Series 2013-B Class A | 0.91 | 3-16-2020 | 239,000 | 237,466 | ||||||||||||
Total Asset-Backed Securities (Cost $12,576,209) | 12,608,509 | |||||||||||||||
|
| |||||||||||||||
Corporate Bonds and Notes: 19.39% | ||||||||||||||||
Consumer Discretionary: 2.29% | ||||||||||||||||
| Auto Components: 0.13% | ||||||||||||||||
TRW Automotive Incorporated 144A | 4.45 | 12-1-2023 | 120,000 | 116,400 | ||||||||||||
|
| |||||||||||||||
| Automobiles: 1.29% | ||||||||||||||||
Daimler Finance North America LLC 144A | 1.45 | 8-1-2016 | 185,000 | 186,089 | ||||||||||||
Daimler Finance North America LLC 144A | 1.88 | 9-15-2014 | 150,000 | 151,298 | ||||||||||||
Daimler Finance North America LLC 144A | 1.88 | 1-11-2018 | 150,000 | 147,691 | ||||||||||||
Daimler Finance North America LLC 144A | 2.38 | 8-1-2018 | 150,000 | 149,594 | ||||||||||||
The accompanying notes are an integral part of these financial statements.
Table of Contents
| 14 | Wells Fargo Advantage VT Total Return Bond Fund | Portfolio of investments—December 31, 2013 |
| Security name | Interest rate | Maturity date | Principal | Value | ||||||||||||
| Automobiles (continued) | ||||||||||||||||
Ford Motor Credit Company LLC | 4.38 | % | 8-6-2023 | $ | 205,000 | $ | 205,770 | |||||||||
General Motors Corporation 144A | 3.50 | 10-2-2018 | 200,000 | 204,500 | ||||||||||||
General Motors Corporation 144A | 4.88 | 10-2-2023 | 80,000 | 81,000 | ||||||||||||
General Motors Corporation 144A | 6.25 | 10-2-2043 | 40,000 | 41,550 | ||||||||||||
| 1,167,492 | ||||||||||||||||
|
| |||||||||||||||
| Hotels, Restaurants & Leisure: 0.04% | ||||||||||||||||
Yum! Brands Incorporated | 5.35 | 11-1-2043 | 40,000 | 38,733 | ||||||||||||
|
| |||||||||||||||
| Media: 0.64% | ||||||||||||||||
Comcast Corporation | 4.25 | 1-15-2033 | 45,000 | 41,677 | ||||||||||||
DIRECTV Holdings LLC | 3.80 | 3-15-2022 | 45,000 | 43,167 | ||||||||||||
NBCUniversal Enterprise Company 144A | 1.97 | 4-15-2019 | 100,000 | 97,762 | ||||||||||||
Thomson Reuters Corporation | 1.30 | 2-23-2017 | 85,000 | 84,618 | ||||||||||||
Thomson Reuters Corporation | 5.65 | 11-23-2043 | 25,000 | 25,367 | ||||||||||||
Viacom Incorporated | 2.50 | 9-1-2018 | 55,000 | 55,415 | ||||||||||||
Viacom Incorporated | 4.25 | 9-1-2023 | 110,000 | 109,594 | ||||||||||||
Viacom Incorporated | 5.85 | 9-1-2043 | 110,000 | 115,248 | ||||||||||||
| 572,848 | ||||||||||||||||
|
| |||||||||||||||
| Specialty Retail: 0.19% | ||||||||||||||||
Home Depot Incorporated | 3.75 | 2-15-2024 | 170,000 | 168,917 | ||||||||||||
|
| |||||||||||||||
Consumer Staples: 1.22% | ||||||||||||||||
| Beverages: 0.29% | ||||||||||||||||
Anheuser-Busch InBev Worldwide Incorporated | 7.75 | 1-15-2019 | 70,000 | 87,363 | ||||||||||||
PepsiCo Incorporated | 2.25 | 1-7-2019 | 170,000 | 170,414 | ||||||||||||
| 257,777 | ||||||||||||||||
|
| |||||||||||||||
| Food & Staples Retailing: 0.19% | ||||||||||||||||
CVS Caremark Corporation | 2.25 | 12-5-2018 | 85,000 | 84,930 | ||||||||||||
CVS Caremark Corporation | 4.00 | 12-5-2023 | 55,000 | 54,792 | ||||||||||||
CVS Caremark Corporation | 5.30 | 12-5-2043 | 35,000 | 36,068 | ||||||||||||
| 175,790 | ||||||||||||||||
|
| |||||||||||||||
| Food Products: 0.65% | ||||||||||||||||
ConAgra Foods Incorporated | 1.30 | 1-25-2016 | 75,000 | 75,126 | ||||||||||||
Kraft Foods Group Incorporated | 6.50 | 2-9-2040 | 75,000 | 87,189 | ||||||||||||
Tyson Foods Incorporated | 4.50 | 6-15-2022 | 105,000 | 106,758 | ||||||||||||
WM Wrigley Jr Company 144A | 2.00 | 10-20-2017 | 40,000 | 39,872 | ||||||||||||
WM Wrigley Jr Company 144A | 2.40 | 10-21-2018 | 55,000 | 54,634 | ||||||||||||
WM Wrigley Jr Company 144A | 2.90 | 10-21-2019 | 112,000 | 111,006 | ||||||||||||
WM Wrigley Jr Company 144A | 3.38 | 10-21-2020 | 115,000 | 113,545 | ||||||||||||
| 588,130 | ||||||||||||||||
|
| |||||||||||||||
| Tobacco: 0.09% | ||||||||||||||||
Altria Group Incorporated | 4.00 | 1-31-2024 | 45,000 | 43,910 | ||||||||||||
Altria Group Incorporated | 5.38 | 1-31-2044 | 40,000 | 40,026 | ||||||||||||
| 83,936 | ||||||||||||||||
|
| |||||||||||||||
The accompanying notes are an integral part of these financial statements.
Table of Contents
| Portfolio of investments—December 31, 2013 | Wells Fargo Advantage VT Total Return Bond Fund | 15 |
| Security name | Interest rate | Maturity date | Principal | Value | ||||||||||||
Energy: 1.87% | ||||||||||||||||
| Energy Equipment & Services: 0.24% | ||||||||||||||||
Diamond Offshore Drilling Incorporated | 4.88 | % | 11-1-2043 | $ | 80,000 | $ | 78,231 | |||||||||
Halliburton Company | 2.00 | 8-1-2018 | 135,000 | 133,901 | ||||||||||||
| 212,132 | ||||||||||||||||
|
| |||||||||||||||
| Oil, Gas & Consumable Fuels: 1.63% | ||||||||||||||||
Buckeye Partners LP | 5.85 | 11-15-2043 | 50,000 | 49,176 | ||||||||||||
DCP Midstream Operating Company | 4.95 | 4-1-2022 | 74,000 | 75,013 | ||||||||||||
Devon Energy Corporation | 1.20 | 12-15-2016 | 145,000 | 144,928 | ||||||||||||
Devon Energy Corporation | 2.25 | 12-15-2018 | 140,000 | 138,459 | ||||||||||||
Dominion Gas Holdings LLC 144A | 4.80 | 11-1-2043 | 45,000 | 43,350 | ||||||||||||
El Paso Pipeline Partners Operating LLC | 4.10 | 11-15-2015 | 105,000 | 110,436 | ||||||||||||
Energen Corporation | 4.63 | 9-1-2021 | 110,000 | 107,556 | ||||||||||||
Energy Transfer Partners LP | 5.15 | 2-1-2043 | 30,000 | 27,320 | ||||||||||||
Energy Transfer Partners LP | 5.95 | 10-1-2043 | 15,000 | 15,168 | ||||||||||||
Energy Transfer Partners LP | 6.50 | 2-1-2042 | 43,000 | 46,071 | ||||||||||||
Kerr-McGee Corporation | 6.95 | 7-1-2024 | 150,000 | 173,975 | ||||||||||||
Kinder Morgan Energy Partners LP | 4.15 | 2-1-2024 | 75,000 | 72,440 | ||||||||||||
Kinder Morgan Energy Partners LP | 5.00 | 3-1-2043 | 40,000 | 36,791 | ||||||||||||
Murphy Oil Corporation | 3.70 | 12-1-2022 | 130,000 | 119,937 | ||||||||||||
Rowan Companies Incorporated | 5.40 | 12-1-2042 | 54,000 | 49,794 | ||||||||||||
Spectra Energy Partners LP | 2.95 | 9-25-2018 | 55,000 | 55,721 | ||||||||||||
Spectra Energy Partners LP | 5.95 | 9-25-2043 | 35,000 | 37,291 | ||||||||||||
TC Pipelines LP | 4.65 | 6-15-2021 | 68,000 | 68,722 | ||||||||||||
Western Gas Partners | 5.38 | 6-1-2021 | 30,000 | 32,100 | ||||||||||||
WPX Energy Incorporated | 6.00 | 1-15-2022 | 70,000 | 70,000 | ||||||||||||
| 1,474,248 | ||||||||||||||||
|
| |||||||||||||||
Financials: 7.72% | ||||||||||||||||
| Capital Markets: 1.05% | ||||||||||||||||
Five Corners Funding Trust 144A | 4.42 | 11-15-2023 | 220,000 | 216,507 | ||||||||||||
Goldman Sachs Group Incorporated | 6.25 | 2-1-2041 | 45,000 | 51,689 | ||||||||||||
Goldman Sachs Group Incorporated | 6.75 | 10-1-2037 | 45,000 | 49,920 | ||||||||||||
Lazard Group LLC | 4.25 | 11-14-2020 | 110,000 | 109,634 | ||||||||||||
Lazard Group LLC | 6.85 | 6-15-2017 | 215,000 | 242,327 | ||||||||||||
Morgan Stanley | 5.00 | 11-24-2025 | 90,000 | 90,104 | ||||||||||||
Morgan Stanley | 5.38 | 10-15-2015 | 100,000 | 107,557 | ||||||||||||
Morgan Stanley | 5.50 | 7-28-2021 | 76,000 | 84,818 | ||||||||||||
| 952,556 | ||||||||||||||||
|
| |||||||||||||||
| Commercial Banks: 0.45% | ||||||||||||||||
HSBC USA Incorporated | 2.38 | 2-13-2015 | 140,000 | 142,851 | ||||||||||||
HSBC USA Incorporated | 2.63 | 9-24-2018 | 170,000 | 172,781 | ||||||||||||
Inter-American Development Bank Series EMTN | 3.88 | 10-28-2041 | 100,000 | 89,574 | ||||||||||||
| 405,206 | ||||||||||||||||
|
| |||||||||||||||
The accompanying notes are an integral part of these financial statements.
Table of Contents
| 16 | Wells Fargo Advantage VT Total Return Bond Fund | Portfolio of investments—December 31, 2013 |
| Security name | Interest rate | Maturity date | Principal | Value | ||||||||||||
| Consumer Finance: 0.44% | ||||||||||||||||
American Express Credit Corporation | 1.75 | % | 6-12-2015 | $ | 230,000 | $ | 233,712 | |||||||||
ERAC USA Finance LLC 144A | 5.63 | 3-15-2042 | 117,000 | 119,101 | ||||||||||||
Toyota Motor Credit Corporation | 3.40 | 9-15-2021 | 50,000 | 50,689 | ||||||||||||
| 403,502 | ||||||||||||||||
|
| |||||||||||||||
| Diversified Financial Services: 3.31% | ||||||||||||||||
Bank of America Corporation | 1.13 | 11-14-2016 | 375,000 | 375,398 | ||||||||||||
Bank of America Corporation | 1.50 | 10-9-2015 | 365,000 | 368,675 | ||||||||||||
Bank of America Corporation | 2.60 | 1-15-2019 | 250,000 | 250,968 | ||||||||||||
Bank of America Corporation | 4.10 | 7-24-2023 | 320,000 | 320,840 | ||||||||||||
Bank of America Corporation | 6.00 | 9-1-2017 | 125,000 | 142,669 | ||||||||||||
Citigroup Incorporated | 1.70 | 7-25-2016 | 125,000 | 126,169 | ||||||||||||
Citigroup Incorporated | 2.65 | 3-2-2015 | 74,000 | 75,501 | ||||||||||||
Citigroup Incorporated | 3.88 | 10-25-2023 | 125,000 | 122,679 | ||||||||||||
Citigroup Incorporated | 4.45 | 1-10-2017 | 146,000 | 158,183 | ||||||||||||
General Electric Capital Corporation | 5.88 | 1-14-2038 | 120,000 | 136,261 | ||||||||||||
Glencore Funding LLC 144A | 2.50 | 1-15-2019 | 70,000 | 67,746 | ||||||||||||
ING US Incorporated | 5.50 | 7-15-2022 | 75,000 | 81,447 | ||||||||||||
JPMorgan Chase & Company | 3.20 | 1-25-2023 | 120,000 | 113,582 | ||||||||||||
JPMorgan Chase & Company | 3.38 | 5-1-2023 | 80,000 | 74,440 | ||||||||||||
JPMorgan Chase & Company | 6.00 | 10-1-2017 | 250,000 | 285,917 | ||||||||||||
Murray Street Investment Trust I | 4.65 | 3-9-2017 | 198,000 | 213,150 | ||||||||||||
National Rural Utilities Cooperative Finance Corporation | 3.40 | 11-15-2023 | 75,000 | 72,450 | ||||||||||||
| 2,986,075 | ||||||||||||||||
|
| |||||||||||||||
| Insurance: 1.26% | ||||||||||||||||
American International Group Incorporated | 6.40 | 12-15-2020 | 70,000 | 82,633 | ||||||||||||
American International Group Incorporated ± | 8.18 | 5-15-2068 | 25,000 | 30,250 | ||||||||||||
American International Group Incorporated | 8.25 | 8-15-2018 | 100,000 | 125,031 | ||||||||||||
Assurant Incorporated | 2.50 | 3-15-2018 | 110,000 | 107,427 | ||||||||||||
Berkshire Hathaway Financial Incorporated | 2.90 | 10-15-2020 | 165,000 | 163,513 | ||||||||||||
Liberty Mutual Group Incorporated 144A | 4.25 | 6-15-2023 | 130,000 | 125,322 | ||||||||||||
Liberty Mutual Group Incorporated 144A | 6.50 | 5-1-2042 | 61,000 | 66,733 | ||||||||||||
Markel Corporation | 3.63 | 3-30-2023 | 45,000 | 42,287 | ||||||||||||
Markel Corporation | 4.90 | 7-1-2022 | 65,000 | 67,627 | ||||||||||||
MetLife Incorporated | 4.37 | 9-15-2023 | 90,000 | 91,731 | ||||||||||||
MetlLife Incorporated | 4.88 | 11-13-2043 | 110,000 | 107,567 | ||||||||||||
Prudential Financial Incorporated | 2.30 | 8-15-2018 | 75,000 | 74,518 | ||||||||||||
W.R. Berkley Corporation | 4.63 | 3-15-2022 | 56,000 | 56,563 | ||||||||||||
| 1,141,202 | ||||||||||||||||
|
| |||||||||||||||
| REITs: 1.21% | ||||||||||||||||
American Tower Corporation | 3.50 | 1-31-2023 | 91,000 | 82,839 | ||||||||||||
American Tower Corporation | 4.50 | 1-15-2018 | 98,000 | 104,939 | ||||||||||||
American Tower Corporation | 5.05 | 9-1-2020 | 73,000 | 77,106 | ||||||||||||
AvalonBay Communities Incorporated | 3.63 | 10-1-2020 | 35,000 | 35,342 | ||||||||||||
Boston Properties LP | 3.13 | 9-1-2023 | 55,000 | 50,152 | ||||||||||||
Boston Properties LP | 3.80 | 2-1-2024 | 85,000 | 81,374 | ||||||||||||
DDR Corporation | 3.38 | 5-15-2023 | 125,000 | 113,660 | ||||||||||||
DDR Corporation | 4.63 | 7-15-2022 | 130,000 | 132,411 | ||||||||||||
The accompanying notes are an integral part of these financial statements.
Table of Contents
| Portfolio of investments—December 31, 2013 | Wells Fargo Advantage VT Total Return Bond Fund | 17 |
| Security name | Interest rate | Maturity date | Principal | Value | ||||||||||||
| REITs (continued) | ||||||||||||||||
Equity One Incorporated | 3.75 | % | 11-15-2022 | $ | 21,000 | $ | 19,673 | |||||||||
Federal Realty Investment Trust | 3.00 | 8-1-2022 | 105,000 | 97,973 | ||||||||||||
Federal Realty Investment Trust | 3.95 | 1-15-2024 | 60,000 | 59,231 | ||||||||||||
Mid America Apartments LP | 4.30 | 10-15-2023 | 85,000 | 82,507 | ||||||||||||
Prologis LP | 4.25 | 8-15-2023 | 100,000 | 98,627 | ||||||||||||
Tanger Properties LP | 3.88 | 12-1-2023 | 55,000 | 52,928 | ||||||||||||
| 1,088,762 | ||||||||||||||||
|
| |||||||||||||||
Health Care: 1.49% | ||||||||||||||||
| Biotechnology: 0.34% | ||||||||||||||||
Amgen Incorporated | 5.38 | 5-15-2043 | 150,000 | 153,476 | ||||||||||||
Celgene Corporation | 2.30 | 8-15-2018 | 75,000 | 74,551 | ||||||||||||
Celgene Corporation | 5.25 | 8-15-2043 | 75,000 | 75,351 | ||||||||||||
| 303,378 | ||||||||||||||||
|
| |||||||||||||||
| Health Care Equipment & Supplies: 0.13% | ||||||||||||||||
St. Jude Medical Incorporated | 3.25 | 4-15-2023 | 125,000 | 116,435 | ||||||||||||
|
| |||||||||||||||
| Health Care Providers & Services: 0.35% | ||||||||||||||||
Express Scripts Holding Company | 2.10 | 2-12-2015 | 150,000 | 152,174 | ||||||||||||
WellPoint Incorporated | 3.13 | 5-15-2022 | 132,000 | 123,616 | ||||||||||||
Wellpoint Incorporated | 5.10 | 1-15-2044 | 40,000 | 39,525 | ||||||||||||
| 315,315 | ||||||||||||||||
|
| |||||||||||||||
| Life Sciences Tools & Services: 0.27% | ||||||||||||||||
Thermo Fisher Scientific Incorporated | 1.30 | 2-1-2017 | 125,000 | 124,447 | ||||||||||||
Thermo Fisher Scientific Incorporated | 2.40 | 2-1-2019 | 50,000 | 49,507 | ||||||||||||
Thermo Fisher Scientific Incorporated | 4.15 | 2-1-2024 | 50,000 | 49,442 | ||||||||||||
Thermo Fisher Scientific Incorporated | 5.30 | 2-1-2044 | 25,000 | 25,190 | ||||||||||||
| 248,586 | ||||||||||||||||
|
| |||||||||||||||
| Pharmaceuticals: 0.40% | ||||||||||||||||
Merck & Company Incorporated | 1.30 | 5-18-2018 | 120,000 | 116,656 | ||||||||||||
Merck & Company Incorporated | 2.80 | 5-18-2023 | 90,000 | 83,182 | ||||||||||||
Mylan Incorporated | 5.40 | 11-29-2043 | 35,000 | 35,161 | ||||||||||||
Pfizer Incorporated | 3.00 | 6-15-2023 | 70,000 | 65,661 | ||||||||||||
Teva Pharmaceutical Finance LLC | 2.25 | 3-18-2020 | 68,000 | 64,586 | ||||||||||||
| 365,246 | ||||||||||||||||
|
| |||||||||||||||
Industrials: 0.36% | ||||||||||||||||
| Aerospace & Defense: 0.26% | ||||||||||||||||
Northrop Grumman Corporation | 3.25 | 8-1-2023 | 140,000 | 130,369 | ||||||||||||
Northrop Grumman Corporation | 4.75 | 6-1-2043 | 105,000 | 99,148 | ||||||||||||
| 229,517 | ||||||||||||||||
|
| |||||||||||||||
| Machinery: 0.10% | ||||||||||||||||
Crane Company | 2.75 | 12-15-2018 | 40,000 | 39,784 | ||||||||||||
Crane Company | 4.45 | 12-15-2023 | 50,000 | 49,341 | ||||||||||||
| 89,125 | ||||||||||||||||
|
| |||||||||||||||
The accompanying notes are an integral part of these financial statements.
Table of Contents
| 18 | Wells Fargo Advantage VT Total Return Bond Fund | Portfolio of investments—December 31, 2013 |
| Security name | Interest rate | Maturity date | Principal | Value | ||||||||||||
Information Technology: 0.96% | ||||||||||||||||
| Computers & Peripherals: 0.16% | ||||||||||||||||
IBM Corporation | 1.63 | % | 5-15-2020 | $ | 160,000 | $ | 149,853 | |||||||||
|
| |||||||||||||||
| Semiconductors & Semiconductor Equipment: 0.08% | ||||||||||||||||
Intel Corporation | 4.00 | 12-15-2032 | 75,000 | 68,917 | ||||||||||||
|
| |||||||||||||||
| Software: 0.72% | ||||||||||||||||
Microsoft Corporation | 3.63 | 12-15-2023 | 230,000 | 229,969 | ||||||||||||
Microsoft Corporation | 4.88 | 12-15-2043 | 60,000 | 61,100 | ||||||||||||
Oracle Corporation | 2.38 | 1-15-2019 | 275,000 | 277,311 | ||||||||||||
Oracle Corporation | 3.63 | 7-15-2023 | 80,000 | 79,227 | ||||||||||||
| 647,607 | ||||||||||||||||
|
| |||||||||||||||
Materials: 0.08% | ||||||||||||||||
| Chemicals: 0.08% | ||||||||||||||||
Mosaic Company | 5.45 | 11-15-2033 | 35,000 | 35,559 | ||||||||||||
Mosaic Company | 5.63 | 11-15-2043 | 40,000 | 40,442 | ||||||||||||
| 76,001 | ||||||||||||||||
|
| |||||||||||||||
Telecommunication Services: 1.37% | ||||||||||||||||
| Diversified Telecommunication Services: 1.37% | ||||||||||||||||
AT&T Incorporated | 1.60 | 2-15-2017 | 140,000 | 139,755 | ||||||||||||
AT&T Incorporated | 4.30 | 12-15-2042 | 35,000 | 29,582 | ||||||||||||
Verizon Communications Incorporated | 2.50 | 9-15-2016 | 255,000 | 263,661 | ||||||||||||
Verizon Communications Incorporated | 3.65 | 9-14-2018 | 192,000 | 203,143 | ||||||||||||
Verizon Communications Incorporated | 4.50 | 9-15-2020 | 65,000 | 69,508 | ||||||||||||
Verizon Communications Incorporated | 5.15 | 9-15-2023 | 175,000 | 187,600 | ||||||||||||
Verizon Communications Incorporated | 6.40 | 9-15-2033 | 187,000 | 214,482 | ||||||||||||
Verizon Communications Incorporated | 6.55 | 9-15-2043 | 110,000 | 128,269 | ||||||||||||
| 1,236,000 | ||||||||||||||||
|
| |||||||||||||||
Utilities: 2.03% | ||||||||||||||||
| Electric Utilities: 1.12% | ||||||||||||||||
Ameren Corporation | 8.88 | 5-15-2014 | 108,000 | 111,097 | ||||||||||||
American Electric Power Company | 1.65 | 12-15-2017 | 135,000 | 132,217 | ||||||||||||
Duke Energy Corporation | 1.63 | 8-15-2017 | 65,000 | 64,563 | ||||||||||||
Duke Energy Corporation | 3.95 | 10-15-2023 | 50,000 | 49,932 | ||||||||||||
Duke Energy Ohio Incorporated | 3.80 | 9-1-2023 | 55,000 | 54,882 | ||||||||||||
Kentucky Utilities Company | 4.65 | 11-15-2043 | 35,000 | 34,728 | ||||||||||||
MidAmerican Energy Holdings Company | 2.40 | 3-15-2019 | 90,000 | 90,580 | ||||||||||||
MidAmerican Energy Holdings Company | 4.80 | 9-15-2043 | 5,000 | 5,065 | ||||||||||||
MidAmerican Energy Holdings Company 144A | 5.15 | 11-15-2043 | 140,000 | 140,664 | ||||||||||||
PPL Capital Funding Incorporated | 3.40 | 6-1-2023 | 60,000 | 55,739 | ||||||||||||
PPL Capital Funding Incorporated | 4.70 | 6-1-2043 | 55,000 | 49,368 | ||||||||||||
Southern Company | 2.45 | 9-1-2018 | 99,000 | 100,451 | ||||||||||||
The accompanying notes are an integral part of these financial statements.
Table of Contents
| Portfolio of investments—December 31, 2013 | Wells Fargo Advantage VT Total Return Bond Fund | 19 |
| Security name | Interest rate | Maturity date | Principal | Value | ||||||||||||
| Electric Utilities (continued) | ||||||||||||||||
Southwestern Electric Power Company | 3.55 | % | 2-15-2022 | $ | 45,000 | $ | 43,893 | |||||||||
Wisconsin Public Service Corporation | 4.75 | 11-1-2044 | 75,000 | 75,407 | ||||||||||||
| 1,008,586 | ||||||||||||||||
|
| |||||||||||||||
| Gas Utilities: 0.24% | ||||||||||||||||
ONEOK Partners LP | 2.00 | 10-1-2017 | 85,000 | 84,550 | ||||||||||||
ONEOK Partners LP | 3.20 | 9-15-2018 | 75,000 | 76,651 | ||||||||||||
ONEOK Partners LP | 6.20 | 9-15-2043 | 55,000 | 59,172 | ||||||||||||
| 220,373 | ||||||||||||||||
|
| |||||||||||||||
| Multi-Utilities: 0.67% | ||||||||||||||||
Dominion Resources Incorporated | 8.88 | 1-15-2019 | 115,000 | 146,050 | ||||||||||||
Louisville Gas & Electric Company | 4.65 | 11-15-2043 | 30,000 | 29,672 | ||||||||||||
Pacific Gas & Electric Corporation | 3.25 | 6-15-2023 | 130,000 | 123,113 | ||||||||||||
Pacific Gas & Electric Corporation | 5.13 | 11-15-2043 | 85,000 | 87,459 | ||||||||||||
Puget Energy Incorporated | 6.00 | 9-1-2021 | 150,000 | 167,530 | ||||||||||||
Sempra Energy | 4.05 | 12-1-2023 | 55,000 | 54,219 | ||||||||||||
| 608,043 | ||||||||||||||||
|
| |||||||||||||||
Total Corporate Bonds and Notes (Cost $17,549,472) | 17,516,688 | |||||||||||||||
|
| |||||||||||||||
Municipal Obligations: 0.97% | ||||||||||||||||
| California: 0.25% | ||||||||||||||||
California Build America Bonds (GO) | 7.60 | 11-1-2040 | 80,000 | 105,617 | ||||||||||||
Los Angeles CA Community College District Build America Bonds (GO) | 6.75 | 8-1-2049 | 95,000 | 119,979 | ||||||||||||
| 225,596 | ||||||||||||||||
|
| |||||||||||||||
| Illinois: 0.12% | ||||||||||||||||
Illinois Finance Authority (GO) | 5.37 | 3-1-2017 | 55,000 | 59,286 | ||||||||||||
Illinois Finance Authority (GO) | 5.88 | 3-1-2019 | 45,000 | 48,978 | ||||||||||||
| 108,264 | ||||||||||||||||
|
| |||||||||||||||
| Nevada: 0.14% | ||||||||||||||||
Clark County NV Airport Authority (Airport Revenue) | 6.82 | 7-1-2045 | 100,000 | 124,605 | ||||||||||||
|
| |||||||||||||||
| New Jersey: 0.17% | ||||||||||||||||
New Jersey Turnpike Authority (Transportation Revenue) | 7.10 | 1-1-2041 | 119,000 | 152,375 | ||||||||||||
|
| |||||||||||||||
| New York: 0.12% | ||||||||||||||||
Port Authority of New York & New Jersey Consolidated Bonds Series 174 (Airport Revenue) | 4.46 | 10-1-2062 | 125,000 | 105,980 | ||||||||||||
|
| |||||||||||||||
| Ohio: 0.03% | ||||||||||||||||
Ohio State University General Receipts Taxable Series A (Education Revenue) | 4.80 | 6-1-2111 | 36,000 | 31,326 | ||||||||||||
|
| |||||||||||||||
| Texas: 0.14% | ||||||||||||||||
North Texas Tollway Authority (Transportation Revenue) | 6.72 | 1-1-2049 | 109,000 | 132,480 | ||||||||||||
|
| |||||||||||||||
Total Municipal Obligations (Cost $804,445) | 880,626 | |||||||||||||||
|
| |||||||||||||||
The accompanying notes are an integral part of these financial statements.
Table of Contents
| 20 | Wells Fargo Advantage VT Total Return Bond Fund | Portfolio of investments—December 31, 2013 |
| Security name | Interest rate | Maturity date | Principal | Value | ||||||||||||
Non-Agency Mortgage Backed Securities: 6.82% | ||||||||||||||||
Bank of America Commercial Mortgage Trust Series 2004-6 Class A3 | 4.51 | % | 12-10-2042 | $ | 1,345 | $ | 1,347 | |||||||||
Bear Stearns Commercial Mortgage Securities Incorporated Series 2005-PWR7 Class A | 4.95 | 2-11-2041 | 4,151 | 4,151 | ||||||||||||
CFCRE Commercial Mortgage Trust Series 2011-C1 Series A4 ±144A | 4.96 | 4-15-2044 | 100,000 | 107,561 | ||||||||||||
Commercial Mortgage Pass-Through Certificate Series 2010-CL Class A3 144A | 4.21 | 7-10-2046 | 138,000 | 146,081 | ||||||||||||
Commercial Mortgage Pass-Through Certificate Series 2012-LC4 Class A3 | 3.07 | 12-10-2044 | 60,000 | 60,933 | ||||||||||||
Commercial Mortgage Pass-Through Certificate Series 2013-CR9 Class A1 | 1.34 | 7-10-2045 | 90,895 | 91,100 | ||||||||||||
Commercial Mortgage Pass-Through Certificate Series 2013-CR9 Class ASB | 3.83 | 7-10-2045 | 125,000 | 129,082 | ||||||||||||
Commercial Mortgage Trust Series 2013-CR11 Class A1 | 1.47 | 10-10-2046 | 49,006 | 49,002 | ||||||||||||
Commercial Mortgage Trust Series 2013-CR11 Class A4 | 4.26 | 10-10-2046 | 176,000 | 180,541 | ||||||||||||
Commercial Mortgage Trust Series 2013-CR12 Class A1 | 1.30 | 10-10-2046 | 56,358 | 56,302 | ||||||||||||
Commercial Mortgage Trust Series 2013-CR12 Class A4 | 4.05 | 10-10-2046 | 96,000 | 96,732 | ||||||||||||
Commercial Mortgage Trust Series 2013-CR12 Class ASB | 3.62 | 10-10-2046 | 126,000 | 127,931 | ||||||||||||
Credit Suisse First Boston Mortgage Securities Corporation Series 2004-C5 Class A4 | 4.83 | 11-15-2037 | 23,000 | 23,510 | ||||||||||||
Credit Suisse First Boston Mortgage Securities Corporation Series 2005-C5 Class A4 ± | 5.10 | 8-15-2038 | 70,000 | 73,479 | ||||||||||||
Credit Suisse Mortgage Capital Certificates Series 2006-C5 Class A3 | 5.31 | 12-15-2039 | 132,000 | 142,966 | ||||||||||||
Deutsche Bank UBS Securities Mortgage Trust Series 2011-LC1A Class A1 144A | 3.74 | 11-10-2046 | 93,006 | 97,736 | ||||||||||||
Deutsche Bank UBS Securities Mortgage Trust Series 2011-LC1A Class A3 144A | 5.00 | 11-10-2046 | 100,000 | 110,192 | ||||||||||||
Deutsche Bank UBS Securities Mortgage Trust Series 2011-LC2A Class A4 144A | 4.54 | 7-10-2044 | 111,000 | 118,801 | ||||||||||||
Greenwich Capital Commercial Funding Corporation Series 2004-GG1 Class A7 ± | 5.32 | 6-10-2036 | 27,855 | 28,001 | ||||||||||||
Greenwich Capital Commercial Funding Corporation Series 2005-GG5 Class A5 ± | 5.22 | 4-10-2037 | 117,000 | 123,376 | ||||||||||||
GS Mortgage Securities Corporation II Series 2005-GG4 Class A4 | 4.75 | 7-10-2039 | 131,281 | 135,995 | ||||||||||||
GS Mortgage Securities Trust Series 2007-GG10 Class A4 ± | 5.80 | 8-10-2045 | 104,000 | 114,186 | ||||||||||||
GS Mortgage Securities Trust Series 2013-GC16 Class A3 | 4.24 | 11-10-2046 | 123,000 | 125,883 | ||||||||||||
GS Mortgage Securities Trust Series 2013-GC16 Class AAB | 3.81 | 11-10-2046 | 165,000 | 169,346 | ||||||||||||
Impact Funding LLC Series 2010-1 Class A1 144A | 5.31 | 1-25-2051 | 342,008 | 375,848 | ||||||||||||
JPMBB Commercial Mortgage Securities Trust Series 2013-C15 Class A4 | 4.10 | 11-15-2045 | 127,000 | 128,934 | ||||||||||||
JPMBB Commercial Mortgage Securities Trust Series 2013-C17 Class A4 | 4.20 | 1-15-2047 | 127,000 | 129,394 | ||||||||||||
JPMorgan Chase Commercial Mortgage Securities Corporation Series 2004-LN2 Class A2 | 5.12 | 7-15-2041 | 76,467 | 77,284 | ||||||||||||
JPMorgan Chase Commercial Mortgage Securities Corporation Series 2006 Class A4 ± | 5.48 | 12-12-2044 | 56,000 | 59,753 | ||||||||||||
JPMorgan Chase Commercial Mortgage Securities Corporation Series 2006-CB17 Class A4 | 5.43 | 12-12-2043 | 175,000 | 189,391 | ||||||||||||
JPMorgan Chase Commercial Mortgage Securities Corporation Series 2006-LDP9 Class A2 | 5.13 | 5-15-2047 | 18,422 | 18,619 | ||||||||||||
JPMorgan Chase Commercial Mortgage Securities Corporation Series 2007-C1 Class A4 | 5.72 | 2-15-2051 | 91,000 | 99,848 | ||||||||||||
JPMorgan Chase Commercial Mortgage Securities Corporation Series 2010-C2 Class A3 144A | 4.07 | 11-15-2043 | 266,000 | 277,710 | ||||||||||||
JPMorgan Chase Commercial Mortgage Securities Corporation Series 2010-CNTR Class A1 144A | 3.30 | 8-5-2032 | 73,855 | 77,067 | ||||||||||||
JPMorgan Chase Commercial Mortgage Securities Corporation Series 2011-C4 Class A4 144A | 4.39 | 7-15-2046 | 112,000 | 118,584 | ||||||||||||
JPMorgan Chase Commercial Mortgage Securities Corporation Series 2012-C8 Class ASB | 2.38 | 10-15-2045 | 80,000 | 76,997 | ||||||||||||
JPMorgan Chase Commercial Mortgage Securities Corporation Series 2013 Class C14 ± | 3.76 | 8-15-2046 | 121,000 | 124,294 | ||||||||||||
JPMorgan Chase Commercial Mortgage Securities Corporation Series 2013-C12 Class A1 | 1.08 | 7-15-2045 | 85,106 | 84,814 | ||||||||||||
JPMorgan Chase Commercial Mortgage Securities Corporation Series 2013-C13 Class A1 | 1.30 | 1-15-2046 | 38,412 | 38,541 | ||||||||||||
JPMorgan Chase Commercial Mortgage Securities Corporation Series 2013-C13 Class A2 | 2.67 | 1-15-2046 | 144,000 | 145,975 | ||||||||||||
JPMorgan Chase Commercial Mortgage Securities Corporation Series 2013-C13 Class ASB | 3.41 | 1-15-2046 | 31,000 | 31,408 | ||||||||||||
JPMorgan Chase Commercial Mortgage Securities Corporation Series 2013-C14 Class A2 | 3.02 | 8-15-2046 | 170,000 | 174,491 | ||||||||||||
Lehman Brothers UBS Commercial Mortgage Trust Series 2004-C8 Class A6 ± | 4.80 | 12-15-2029 | 18,256 | 18,565 | ||||||||||||
Lehman Brothers UBS Commercial Mortgage Trust Series 2007-C3 Class A3 ± | 5.87 | 7-15-2044 | 53,000 | 53,666 | ||||||||||||
Merrill Lynch Mortgage Trust Series 2005-CIP1 Class A3A ± | 4.95 | 7-12-2038 | 76,000 | 77,090 | ||||||||||||
Morgan Stanley Bank of America Merrill Lynch Trust Series 2013-C10 Class A1 | 1.39 | 7-15-2046 | 173,157 | 173,664 | ||||||||||||
Morgan Stanley Bank of America Merrill Lynch Trust Series 2013-C10 Class ASB ± | 3.91 | 7-15-2046 | 24,000 | 24,954 | ||||||||||||
The accompanying notes are an integral part of these financial statements.
Table of Contents
| Portfolio of investments—December 31, 2013 | Wells Fargo Advantage VT Total Return Bond Fund | 21 |
| Security name | Interest rate | Maturity date | Principal | Value | ||||||||||||
Non-Agency Mortgage Backed Securities (continued) | ||||||||||||||||
Morgan Stanley Bank of America Merrill Lynch Trust Series 2013-C11 Class A2 | 3.09 | % | 8-15-2046 | $ | 243,000 | $ | 249,962 | |||||||||
Morgan Stanley Bank Trust Series 2012-C5 Class A3 | 2.83 | 8-15-2045 | 90,000 | 88,314 | ||||||||||||
Morgan Stanley Bank Trust Series 2012-C6 Class A3 | 2.51 | 11-15-2045 | 229,000 | 220,913 | ||||||||||||
Morgan Stanley Bank Trust Series 2013-C7 Class AAB | 2.47 | 2-15-2046 | 69,000 | 66,213 | ||||||||||||
Morgan Stanley Capital I Series 2004-HQ4 Class A7 | 4.97 | 4-14-2040 | 73,054 | 73,947 | ||||||||||||
Morgan Stanley Mortgage Loan Trust Series 2007-6XS Class 2A1S ± | 0.28 | 2-25-2047 | 8,556 | 7,644 | ||||||||||||
Motel 6 Trust Series 2012-MTL6 Class A2 144A | 1.95 | 10-5-2025 | 191,000 | 189,038 | ||||||||||||
Sequoia Mortgage Trust Series 2011-1 Class A1 ± | 4.13 | 2-25-2041 | 5,816 | 5,813 | ||||||||||||
UBS Barclays Commercial Mortgage Trust Series 2012-C2 Class A4 | 3.53 | 5-10-2063 | 58,000 | 57,249 | ||||||||||||
UBS Barclays Commercial Mortgage Trust Series 2012-C3 Class A3 | 2.73 | 8-10-2049 | 96,000 | 94,321 | ||||||||||||
UBS Barclays Commercial Mortgage Trust Series 2013-C5 Class A4 | 3.18 | 3-10-2046 | 37,000 | 35,255 | ||||||||||||
UBS Barclays Commercial Mortgage Trust Series 2013-C6 Class ASB | 2.79 | 4-10-2046 | 185,000 | 180,416 | ||||||||||||
Total Non-Agency Mortgage Backed Securities (Cost $6,192,626) | 6,160,210 | |||||||||||||||
|
| |||||||||||||||
U.S. Treasury Securities: 26.05% | ||||||||||||||||
U.S. Treasury Bond | 2.75 | 11-15-2042 | 156,000 | 122,801 | ||||||||||||
U.S. Treasury Bond | 3.13 | 11-15-2041 | 412,000 | 354,384 | ||||||||||||
U.S. Treasury Bond | 3.13 | 2-15-2043 | 291,000 | 248,078 | ||||||||||||
U.S. Treasury Bond | 3.63 | 8-15-2043 | 1,157,000 | 1,088,123 | ||||||||||||
U.S. Treasury Bond | 3.75 | 11-15-2043 | 380,000 | 365,809 | ||||||||||||
U.S. Treasury Note | 0.25 | 7-31-2015 | 2,047,000 | 2,046,840 | ||||||||||||
U.S. Treasury Note | 0.25 | 9-30-2015 | 479,000 | 478,551 | ||||||||||||
U.S. Treasury Note | 0.25 | 10-15-2015 | 1,285,000 | 1,283,294 | ||||||||||||
U.S. Treasury Note | 0.25 | 10-31-2015 | 379,000 | 378,467 | ||||||||||||
U.S. Treasury Note | 0.25 | 11-30-2015 | 300,000 | 299,402 | ||||||||||||
U.S. Treasury Note | 0.25 | 12-31-2015 | 513,000 | 511,659 | ||||||||||||
U.S. Treasury Note ## | 0.38 | 8-31-2015 | 2,630,000 | 2,633,903 | ||||||||||||
U.S. Treasury Note | 0.63 | 8-15-2016 | 1,033,000 | 1,033,081 | ||||||||||||
U.S. Treasury Note | 0.63 | 10-15-2016 | 1,659,000 | 1,655,889 | ||||||||||||
U.S. Treasury Note ## | 0.63 | 12-15-2016 | 2,163,000 | 2,154,043 | ||||||||||||
U.S. Treasury Note ## | 1.25 | 11-30-2018 | 2,948,000 | 2,883,283 | ||||||||||||
U.S. Treasury Note | 1.38 | 11-30-2015 | 1,046,000 | 1,066,225 | ||||||||||||
U.S. Treasury Note | 1.50 | 12-31-2018 | 233,000 | 230,251 | ||||||||||||
U.S. Treasury Note | 2.00 | 11-30-2020 | 973,000 | 946,015 | ||||||||||||
U.S. Treasury Note | 2.38 | 12-31-2020 | 531,000 | 528,969 | ||||||||||||
U.S. Treasury Note | 2.75 | 11-15-2023 | 1,276,000 | 1,246,093 | ||||||||||||
U.S. Treasury Note | 3.13 | 4-30-2017 | 1,848,000 | 1,978,083 | ||||||||||||
Total U.S. Treasury Securities (Cost $23,746,433) | 23,533,243 | |||||||||||||||
|
| |||||||||||||||
Yankee Corporate Bonds and Notes: 5.11% | ||||||||||||||||
Consumer Discretionary: 0.18% | ||||||||||||||||
| Textiles, Apparel & Luxury Goods: 0.18% | ||||||||||||||||
LVMH Moet Hennessy Louis 144A | 1.63 | 6-29-2017 | 163,000 | 162,326 | ||||||||||||
|
| |||||||||||||||
Consumer Staples: 0.12% | ||||||||||||||||
| Beverages: 0.12% | ||||||||||||||||
Diageo Capital plc | 1.13 | 4-29-2018 | 115,000 | 110,817 | ||||||||||||
|
| |||||||||||||||
The accompanying notes are an integral part of these financial statements.
Table of Contents
| 22 | Wells Fargo Advantage VT Total Return Bond Fund | Portfolio of investments—December 31, 2013 |
| Security name | Interest rate | Maturity date | Principal | Value | ||||||||||||
Energy: 1.25% | ||||||||||||||||
| Energy Equipment & Services: 0.09% | ||||||||||||||||
Weatherford International Limited | 4.50 | % | 4-15-2022 | $ | 60,000 | $ | 60,295 | |||||||||
Weatherford International Limited | 5.95 | 4-15-2042 | 25,000 | 24,969 | ||||||||||||
| 85,264 | ||||||||||||||||
|
| |||||||||||||||
| Oil, Gas & Consumable Fuels: 1.16% | ||||||||||||||||
Canadian Oil Sands Trust Limited 144A | 4.50 | 4-1-2022 | 60,000 | 60,340 | ||||||||||||
Canadian Oil Sands Trust Limited 144A | 6.00 | 4-1-2042 | 55,000 | 56,064 | ||||||||||||
Ecopetrol SA | 7.38 | 9-18-2043 | 120,000 | 130,080 | ||||||||||||
Husky Energy Incorporated | 7.25 | 12-15-2019 | 57,000 | 68,738 | ||||||||||||
Petrobras Global Finance Company | 3.00 | 1-15-2019 | 225,000 | 210,451 | ||||||||||||
Petroleos Mexicanos Company ± | 2.27 | 7-18-2018 | 50,000 | 51,500 | ||||||||||||
Petroleos Mexicanos Company | 4.88 | 1-18-2024 | 50,000 | 50,000 | ||||||||||||
Petroleos Mexicanos Company | 5.50 | 6-27-2044 | 70,000 | 63,875 | ||||||||||||
Statoil ASA | 2.90 | 11-8-2020 | 100,000 | 99,226 | ||||||||||||
Statoil ASA | 3.70 | 3-1-2024 | 75,000 | 74,334 | ||||||||||||
Talisman Energy Incorporated | 3.75 | 2-1-2021 | 50,000 | 48,347 | ||||||||||||
Transocean Incorporated | 6.38 | 12-15-2021 | 120,000 | 134,671 | ||||||||||||
| 1,047,626 | ||||||||||||||||
|
| |||||||||||||||
Financials: 1.87% | ||||||||||||||||
| Commercial Banks: 1.36% | ||||||||||||||||
HSBC Holdings plc | 4.00 | 3-30-2022 | 65,000 | 66,714 | ||||||||||||
ING Bank NV 144A | 5.80 | 9-25-2023 | 90,000 | 93,960 | ||||||||||||
Norddeutsche Landesbank Pfandbriefe 144A | 2.00 | 2-5-2019 | 400,000 | 394,000 | ||||||||||||
Rabobank Nederland NV | 3.88 | 2-8-2022 | 95,000 | 95,383 | ||||||||||||
Royal Bank of Scotland Group plc | 6.00 | 12-19-2023 | 300,000 | 302,136 | ||||||||||||
Skandinaviska Enskilda 144A | 2.38 | 11-20-2018 | 280,000 | 278,177 | ||||||||||||
| 1,230,370 | ||||||||||||||||
|
| |||||||||||||||
| Diversified Financial Services: 0.45% | ||||||||||||||||
Volkswagen International Finance NV 144A | 1.13 | 11-18-2016 | 210,000 | 209,454 | ||||||||||||
Volkswagen International Finance NV 144A | 2.13 | 11-20-2018 | 200,000 | 197,500 | ||||||||||||
| 406,954 | ||||||||||||||||
|
| |||||||||||||||
| Insurance: 0.06% | ||||||||||||||||
XLIT Limited | 5.25 | 12-15-2043 | 55,000 | 55,173 | ||||||||||||
|
| |||||||||||||||
Health Care: 0.24% | ||||||||||||||||
| Health Care Equipment & Supplies: 0.14% | ||||||||||||||||
Mallinckrodt International Finance SA 144A | 4.75 | 4-15-2023 | 140,000 | 129,017 | ||||||||||||
|
| |||||||||||||||
| Pharmaceuticals: 0.10% | ||||||||||||||||
Perrigo Company 144A | 4.00 | 11-15-2023 | 90,000 | 88,153 | ||||||||||||
|
| |||||||||||||||
Materials: 0.59% | ||||||||||||||||
| Chemicals: 0.10% | ||||||||||||||||
LyondellBasell International Finance BV | 4.00 | 7-15-2023 | 55,000 | 54,201 | ||||||||||||
LyondellBasell International Finance BV | 5.25 | 7-15-2043 | 35,000 | 35,060 | ||||||||||||
| 89,261 | ||||||||||||||||
|
| |||||||||||||||
The accompanying notes are an integral part of these financial statements.
Table of Contents
| Portfolio of investments—December 31, 2013 | Wells Fargo Advantage VT Total Return Bond Fund | 23 |
| Security name | Interest rate | Maturity date | Principal | Value | ||||||||||||
| Metals & Mining: 0.49% | ||||||||||||||||
Barrick Gold Corporation | 4.10 | % | 5-1-2023 | $ | 95,000 | $ | 85,737 | |||||||||
BHP Billiton Finance USA Limited | 3.85 | 9-30-2023 | 125,000 | 125,335 | ||||||||||||
BHP Billiton Finance USA Limited | 5.00 | 9-30-2043 | 95,000 | 96,240 | ||||||||||||
Vale SA | 5.63 | 9-11-2042 | 69,000 | 62,440 | ||||||||||||
Xstrata Finance Canada 144A | 2.05 | 10-23-2015 | 71,000 | 71,904 | ||||||||||||
| 441,656 | ||||||||||||||||
|
| |||||||||||||||
Telecommunication Services: 0.74% | ||||||||||||||||
| Diversified Telecommunication Services: 0.08% | ||||||||||||||||
Telefonica Emisiones SAU | 4.57 | 4-27-2023 | 70,000 | 68,920 | ||||||||||||
|
| |||||||||||||||
| Wireless Telecommunication Services: 0.66% | ||||||||||||||||
America Movil SAB de CV | 3.13 | 7-16-2022 | 235,000 | 216,612 | ||||||||||||
Vodafone Group plc | 0.90 | 2-19-2016 | 225,000 | 225,788 | ||||||||||||
Vodafone Group plc | 1.50 | 2-19-2018 | 160,000 | 155,926 | ||||||||||||
| 598,326 | ||||||||||||||||
|
| |||||||||||||||
Utilities: 0.12% | ||||||||||||||||
| Electric Utilities: 0.12% | ||||||||||||||||
Comision Federal de Electricidad 144A | 4.88 | 1-15-2024 | 65,000 | 64,513 | ||||||||||||
Electricite de France SA 144A | 4.60 | 1-27-2020 | 40,000 | 43,234 | ||||||||||||
| 107,747 | ||||||||||||||||
|
| |||||||||||||||
Total Yankee Corporate Bonds and Notes (Cost $4,710,836) | 4,621,610 | |||||||||||||||
|
| |||||||||||||||
| Yankee Government Bonds: 1.50% | ||||||||||||||||
Federal Republic of Brazil | 4.25 | 1-27-2025 | 165,000 | 157,163 | ||||||||||||
Japan Bank for International Cooperation | 1.75 | 7-31-2018 | 220,000 | 218,104 | ||||||||||||
Province of Quebec | 2.63 | 2-13-2023 | 130,000 | 119,411 | ||||||||||||
Republic of Slovenia 144A | 4.75 | 5-10-2018 | 200,000 | 205,000 | ||||||||||||
Slovak Republic 144A | 4.38 | 5-21-2022 | 375,000 | 386,970 | ||||||||||||
United Mexican States | 5.75 | 10-12-2110 | 290,000 | 268,250 | ||||||||||||
Total Yankee Government Bonds (Cost $1,402,297) | 1,354,898 | |||||||||||||||
|
| |||||||||||||||
| Yield | Shares | |||||||||||||||
| Short-Term Investments: 3.00% | ||||||||||||||||
| Investment Companies: 3.00% | ||||||||||||||||
Wells Fargo Advantage Cash Investment Money Market Fund, Select Class ##(l)(u) | 0.06 | % | 2,706,651 | 2,706,651 | ||||||||||||
|
| |||||||||||||||
Total Short-Term Investments (Cost $2,706,651) | 2,706,651 | |||||||||||||||
|
| |||||||||||||||
| Total investments in securities | ||||||||
| (Cost $100,336,725) * | 110.28 | % | 99,637,865 | |||||
Other assets and liabilities, net | (10.28 | ) | (9,285,138 | ) | ||||
|
|
|
| |||||
| Total net assets | 100.00 | % | $ | 90,352,727 | ||||
|
|
|
|
The accompanying notes are an integral part of these financial statements.
Table of Contents
| 24 | Wells Fargo Advantage VT Total Return Bond Fund | Portfolio of investments—December 31, 2013 |
| ± | Variable rate investment. The rate shown is the rate in effect at period end. |
| (a) | Security is fair valued by the Management Valuation Team, and in certain instances by the Board of Trustees, in accordance with procedures approved by the Board of Trustees. |
| %% | Security issued on a when-issued basis. |
| 144A | Security that may be resold to “qualified institutional buyers” under Rule 144A or security offered pursuant to Section 4(2) of the Securities Act of 1933, as amended. |
| ## | All or a portion of this security has been segregated for when-issued securities. |
| (l) | Investment in an affiliate |
| (u) | Rate shown is the 7-day annualized yield at period end. |
| * | Cost for federal income tax purposes is $100,468,443 and unrealized appreciation (depreciation) consists of: |
Gross unrealized appreciation (depreciation) | $ | 715,461 | ||
Gross unrealized depreciation | (1,546,039 | ) | ||
|
| |||
Net unrealized depreciation | $ | (830,578 | ) |
The accompanying notes are an integral part of these financial statements.
Table of Contents
| Statement of assets and liabilities—December 31, 2013 | Wells Fargo Advantage VT Total Return Bond Fund | 25 |
Assets | ||||
Investments | ||||
In unaffiliated securities, at value (see cost below) | $ | 96,931,214 | ||
In affiliated securities, at value (see cost below) | 2,706,651 | |||
|
| |||
Total investments, at value (see cost below) | 99,637,865 | |||
Receivable for investments sold | 10,761,271 | |||
Principal paydown receivable | 10,331 | |||
Receivable for Fund shares sold | 107,991 | |||
Receivable for interest | 403,937 | |||
Prepaid expenses and other assets | 742 | |||
|
| |||
Total assets | 110,922,137 | |||
|
| |||
Liabilities | ||||
Dividends payable | 3,351 | |||
Payable for investments purchased | 20,276,247 | |||
Payable for Fund shares redeemed | 148,941 | |||
Due to custodian bank | 15 | |||
Advisory fee payable | 29,050 | |||
Distribution fees payable | 19,849 | |||
Due to other related parties | 10,322 | |||
Accrued expenses and other liabilities | 81,635 | |||
|
| |||
Total liabilities | 20,569,410 | |||
|
| |||
Total net assets | $ | 90,352,727 | ||
|
| |||
NET ASSETS CONSIST OF | ||||
Paid-in capital | $ | 96,156,343 | ||
Undistributed net investment income | 62,381 | |||
Accumulated net realized losses on investments | (5,167,137 | ) | ||
Net unrealized losses on investments | (698,860 | ) | ||
|
| |||
Total net assets | $ | 90,352,727 | ||
|
| |||
COMPUTATION OF NET ASSET VALUE PER SHARE1 | ||||
Net assets – Class 2 | $ | 90,352,727 | ||
Shares outstanding – Class 2 | 8,954,477 | |||
Net asset value per share – Class 2 | $10.09 | |||
Investments in unaffiliated securities, at cost | $ | 97,630,074 | ||
|
| |||
Investments in affiliated securities, at cost | $ | 2,706,651 | ||
|
| |||
Total investments, at cost | $ | 100,336,725 | ||
|
| |||
| 1. | The Fund has an unlimited number of authorized shares. |
The accompanying notes are an integral part of these financial statements.
Table of Contents
| 26 | Wells Fargo Advantage VT Total Return Bond Fund | Statement of operations—year ended December 31, 2013 |
Investment income | ||||
Interest** | $ | 1,900,125 | ||
Income from affiliated securities | 4,811 | |||
Securities lending income, net | 452 | |||
|
| |||
Total investment income | 1,905,388 | |||
|
| |||
Expenses | ||||
Advisory fee | 364,604 | |||
Administration fees | ||||
Fund level | 45,575 | |||
Class 2 | 72,921 | |||
Distribution fees | ||||
Class 2 | 227,877 | |||
Custody and accounting fees | 47,028 | |||
Professional fees | 51,721 | |||
Shareholder report expenses | 25,286 | |||
Trustees’ fees and expenses | 12,395 | |||
Other fees and expenses | 4,131 | |||
|
| |||
Total expenses | 851,538 | |||
Less: Fee waivers and/or expense reimbursements | (31,182 | ) | ||
|
| |||
Net expenses | 820,356 | |||
|
| |||
Net investment income | 1,085,032 | |||
|
| |||
REALIZED AND UNREALIZED GAINS (LOSSES) ON INVESTMENTS | ||||
Net realized gains (losses) on: | ||||
Unaffiliated securities | (697,990 | ) | ||
TBA sale commitments | 1,293 | |||
|
| |||
Net realized losses on investments | (696,697 | ) | ||
|
| |||
Net change in unrealized gains (losses) on investments | (2,680,209 | ) | ||
|
| |||
Net realized and unrealized gains (losses) on investments | (3,376,906 | ) | ||
|
| |||
Net decrease in net assets resulting from operations | $ | (2,291,874 | ) | |
|
| |||
** Net of foreign interest withholding taxes in the amount of | $687 | |||
The accompanying notes are an integral part of these financial statements.
Table of Contents
| Statement of changes in net assets | Wells Fargo Advantage VT Total Return Bond Fund | 27 |
| Year ended December 31, 2013 | Year ended December 31, 2012 | |||||||||||||||
Operations | ||||||||||||||||
Net investment income | $ | 1,085,032 | $ | 1,239,324 | ||||||||||||
Net realized gains (losses) on investments | (696,697 | ) | 4,215,772 | |||||||||||||
Net change in unrealized gains (losses) on investments | (2,680,209 | ) | (44,633 | ) | ||||||||||||
|
|
|
|
|
|
|
| |||||||||
Net increase (decrease) in net assets resulting from operations | (2,291,874 | ) | 5,410,463 | |||||||||||||
|
|
|
|
|
|
|
| |||||||||
Distributions to shareholders from | ||||||||||||||||
Net investment income – Class 2 | (1,136,906 | ) | (1,303,386 | ) | ||||||||||||
Net realized gains – Class 2 | (2,908,485 | ) | (1,654,708 | ) | ||||||||||||
|
|
|
|
|
|
|
| |||||||||
Total distributions to shareholders | (4,045,391 | ) | (2,958,094 | ) | ||||||||||||
|
|
|
|
|
|
|
| |||||||||
| Shares | Shares | |||||||||||||||
Capital share transactions | ||||||||||||||||
Proceeds from shares sold – Class 2 | 1,865,149 | 19,545,659 | 1,636,835 | 17,513,595 | ||||||||||||
Reinvestment of distributions – Class 2 | 398,039 | 4,045,391 | 276,984 | 2,958,094 | ||||||||||||
Payment for shares redeemed – Class 2 | (1,796,392 | ) | (18,758,567 | ) | (1,696,755 | ) | (18,204,327 | ) | ||||||||
|
|
|
|
|
|
|
| |||||||||
Net increase in net assets resulting from capital share transactions | 4,832,483 | 2,267,362 | ||||||||||||||
|
|
|
|
|
|
|
| |||||||||
Total increase (decrease) in net assets | (1,504,782 | ) | 4,719,731 | |||||||||||||
|
|
|
|
|
|
|
| |||||||||
Net assets | ||||||||||||||||
Beginning of period | 91,857,509 | 87,137,778 | ||||||||||||||
|
|
|
|
|
|
|
| |||||||||
End of period | $ | 90,352,727 | $ | 91,857,509 | ||||||||||||
|
|
|
|
|
|
|
| |||||||||
Undistributed net investment income | $ | 62,381 | $ | 53,377 | ||||||||||||
|
|
|
|
|
|
|
| |||||||||
The accompanying notes are an integral part of these financial statements.
Table of Contents
| 28 | Wells Fargo Advantage VT Total Return Bond Fund | Financial highlights |
(For a share outstanding throughout each period)
| Year ended December 31 | ||||||||||||||||||||
| CLASS 2 | 2013 | 2012 | 2011 | 20101 | 2009 | |||||||||||||||
Net asset value, beginning of period | $ | 10.82 | $ | 10.54 | $ | 10.41 | $ | 10.34 | $ | 9.70 | ||||||||||
Net investment income | 0.12 | 0.15 | 0.22 | 0.29 | 0.42 | |||||||||||||||
Net realized and unrealized gains (losses) on investments | (0.38 | ) | 0.48 | 0.62 | 0.43 | 0.72 | ||||||||||||||
|
|
|
|
|
|
|
|
|
| |||||||||||
Total from investment operations | (0.26 | ) | 0.63 | 0.84 | 0.72 | 1.14 | ||||||||||||||
Distributions to shareholders from | ||||||||||||||||||||
Net investment income | (0.13 | ) | (0.15 | ) | (0.28 | ) | (0.36 | ) | (0.46 | ) | ||||||||||
Net realized gains | (0.34 | ) | (0.20 | ) | (0.43 | ) | (0.29 | ) | (0.04 | ) | ||||||||||
|
|
|
|
|
|
|
|
|
| |||||||||||
Total distributions to shareholders | (0.47 | ) | (0.35 | ) | (0.71 | ) | (0.65 | ) | (0.50 | ) | ||||||||||
Net asset value, end of period | $ | 10.09 | $ | 10.82 | $ | 10.54 | $ | 10.41 | $ | 10.34 | ||||||||||
Total return | (2.43 | )% | 6.10 | % | 8.31 | % | 7.04 | % | 11.99 | % | ||||||||||
Ratios to average net assets (annualized) | ||||||||||||||||||||
Gross expenses | 0.93 | % | 0.94 | % | 0.91 | % | 0.91 | % | 1.20 | % | ||||||||||
Net expenses | 0.90 | % | 0.90 | % | 0.88 | % | 0.86 | % | 0.85 | % | ||||||||||
Net investment income | 1.19 | % | 1.37 | % | 2.09 | % | 2.76 | % | 4.07 | % | ||||||||||
Supplemental data | ||||||||||||||||||||
Portfolio turnover rate | 613 | % | 574 | % | 843 | % | 838 | % | 580 | % | ||||||||||
Net assets, end of period (000s omitted) | $90,353 | $91,858 | $87,138 | $85,416 | $95,134 | |||||||||||||||
| 1. | After the close of business on July 16, 2010, existing shares of the Fund were renamed Class 2 shares. |
The accompanying notes are an integral part of these financial statements.
Table of Contents
| Notes to financial statements | Wells Fargo Advantage VT Total Return Bond Fund | 29 |
1. ORGANIZATION
Wells Fargo Variable Trust (the “Trust”), a Delaware statutory trust organized on March 10, 1999, is an open-end management investment company registered under the Investment Company Act of 1940, as amended (the “1940 Act”). These financial statements report on the Wells Fargo Advantage VT Total Return Bond Fund (the “Fund”) which is a diversified series of the Trust.
2. SIGNIFICANT ACCOUNTING POLICIES
The following significant accounting policies, which are consistently followed in the preparation of the financial statements of the Fund, are in conformity with U.S. generally accepted accounting principles which require management to make estimates and assumptions that affect the reported amounts of assets and liabilities, disclosure of contingent assets and liabilities at the date of the financial statements, and the reported amounts of revenues and expenses during the reporting period. Actual results could differ from those estimates.
Securities valuation
All investments are valued each business day as of the close of regular trading on the New York Stock Exchange (generally 4 p.m. Eastern Time).
Fixed income securities acquired with maturities exceeding 60 days are valued based on evaluated bid prices provided by an independent pricing service which may utilize both transaction data and market information such as yield, quality, coupon rate, maturity, type of issue, trading characteristics and other market data. If prices are not available from the independent pricing service or prices received are deemed not representative of market value, prices will be obtained from an independent broker-dealer or otherwise determined based on the Fund’s Valuation Procedures.
Short-term securities, with maturities of 60 days or less at time of purchase, generally are valued at amortized cost which approximates fair value. The amortized cost method involves valuing a security at its cost, plus accretion of discount or minus amortization of premium over the period until maturity.
Investments in registered open-end investment companies are valued at net asset value. Non-registered investment vehicles are fair valued at net asset value.
Investments which are not valued using any of the methods discussed above are valued at their fair value, as determined in good faith by the Board of Trustees of the Fund. The Board of Trustees has established a Valuation Committee comprised of the Trustees and has delegated to it the authority to take any actions regarding the valuation of portfolio securities that the Valuation Committee deems necessary or appropriate, including determining the fair value of portfolio securities, unless the determination has been delegated to the Management Valuation Team of Wells Fargo Funds Management, LLC (“Funds Management”). The Board of Trustees retains the authority to make or ratify any valuation decisions or approve any changes to the Valuation Procedures as it deems appropriate. On a quarterly basis, the Board of Trustees receives reports on any valuation actions taken by the Valuation Committee or the Management Valuation Team which may include items for ratification.
Valuations of fair valued securities are compared to the next actual sales price when available, or other appropriate market values, to assess the continued appropriateness of the fair valuation methodologies used. These securities are fair valued on a day-to-day basis, taking into consideration changes to appropriate market information and any significant changes to the inputs considered in the valuation process until there is a readily available price provided on an exchange or by an independent pricing service. Valuations received from an independent pricing service or independent broker-dealer quotes are periodically validated by comparisons to most recent trades and valuations provided by other independent pricing services in addition to the review of prices by the adviser and/or subadviser. Unobservable inputs used in determining fair valuations are identified based on the type of security, taking into consideration factors utilized by market participants in valuing the investment, knowledge about the issuer and the current market environment.
Security loans
The Fund may lend its securities from time to time in order to earn additional income in the form of fees or interest on securities received as collateral or the investment of any cash received as collateral. The Fund continues to receive interest or dividends on the securities loaned. The Fund receives collateral in the form of cash or securities with a value at least equal to the value of the securities on loan. The value of the loaned securities is determined at the close of each business day and any additional required collateral is delivered to the Fund on the next business day. In a securities lending transaction, the net asset value of the Fund will be affected by an increase or decrease in the value of the securities loaned and by an increase or decrease in the value of the instrument in which collateral is invested. The amount of securities lending activity undertaken by the Fund fluctuates from time to time. In the event of default or bankruptcy by the borrower, the Fund may be prevented from recovering the loaned securities or gaining access to the collateral or
Table of Contents
| 30 | Wells Fargo Advantage VT Total Return Bond Fund | Notes to financial statements |
may experience delays or costs in doing so. In addition, the investment of any cash collateral received may lose all or part of its value. The Fund has the right under the lending agreement to recover the securities from the borrower on demand.
The Fund lends its securities through an unaffiliated securities lending agent. Cash collateral received in connection with its securities lending transactions is invested in Wells Fargo Securities Lending Cash Investments, LLC (the “Securities Lending Fund”). The Securities Lending Fund is exempt from registration under Section 3(c)(7) of the 1940 Act and is managed by Funds Management and is subadvised by Wells Capital Management Incorporated (“WellsCap”). Funds Management receives an advisory fee starting at 0.05% and declining to 0.01% as the average daily net assets of the Securities Lending Fund increase. All of the fees received by Funds Management are paid to WellsCap for its services as subadviser. The Securities Lending Fund seeks to provide a positive return compared to the daily Fed Funds Open rate by investing in high-quality, U.S. dollar-denominated short-term money market instruments. Securities Lending Fund investments are fair valued based upon the amortized cost valuation technique. Income earned from investment in the Securities Lending Fund is included in securities lending income on the Statement of Operations.
When-issued transactions
The Fund may purchase securities on a forward commitment or when-issued basis. The Fund records a when-issued transaction on the trade date and will segregate assets in an amount at least equal in value to the Fund’s commitment to purchase when-issued securities. Securities purchased on a when-issued basis are marked-to-market daily and the Fund begins earning interest on the settlement date. Losses may arise due to changes in the market value of the underlying securities or if the counterparty does not perform under the contract.
TBA sale commitments
The Fund may enter into To Be Announced (“TBA”) sale commitments to hedge its portfolio positions or to sell mortgage-backed securities it owns under delayed delivery arrangements. Proceeds of TBA sale commitments are not received until the contractual settlement date. During the time a TBA sale commitment is outstanding, equivalent deliverable securities or offsetting TBA purchase commitments, which are deliverable on or before the sale commitment date, are held as “cover” for the transaction. Unsettled TBA sale commitments are valued at the current market value of the underlying securities, according to the procedures described under “Securities valuation”. The contract is marked-to-market daily and the change in market value is recorded by the Fund as an unrealized gain or loss. If the TBA sale commitment is closed through the acquisition of an offsetting purchase commitment, the Fund realizes a gain or loss. If the Fund delivers securities under the commitment, the Fund realizes a gain or a loss from the sale of the securities based upon the unit price established at the date the commitment was entered into.
Mortgage dollar roll transactions
The Fund may engage in mortgage dollar roll transactions through TBA mortgage-backed securities issued by Government National Mortgage Association (GNMA), Federal National Mortgage Association (FNMA) and Federal Home Loan Mortgage Corporation (FHLMC). In a mortgage dollar roll transaction, the Fund sells a mortgage-backed security to a financial institution, such as a bank or broker-dealer and simultaneously agrees to repurchase a substantially similar security from the institution at a later date at an agreed upon price. The mortgage-backed securities that are repurchased will bear the same interest rate as those sold, but generally will be collateralized by different pools of mortgages with different pre-payment histories. During the roll period, the Fund foregoes principal and interest paid on the securities. The Fund is compensated by the difference between the current sales price and the forward price for the future purchase as well as by the earnings on the cash proceeds of the initial sale. Mortgage dollar rolls may be renewed without physical delivery of the securities subject to the contract. The Fund accounts for TBA dollar roll transactions as purchases and sales.
Security transactions and income recognition
Securities transactions are recorded on a trade date basis. Realized gains or losses are recorded on the basis of identified cost.
Interest income is accrued daily and bond discounts are accreted and premiums are amortized daily based on the effective interest method. To the extent debt obligations are placed on non-accrual status, any related interest income may be reduced by writing off interest receivables when the collection of all or a portion of interest has become doubtful based on consistently applied procedures. If the issuer subsequently resumes interest payments or when the collectability of interest is reasonably assured, the debt obligation is removed from non-accrual status.
Income from foreign securities is recorded net of foreign taxes withheld where recovery of such taxes is not assured.
Distributions to shareholders
Distributions to shareholders from net investment income are accrued daily and paid monthly. Distributions from net realized gains, if any, are recorded on the ex-dividend date. Such distributions are determined in conformity with federal income tax regulations, which may differ in amount or character from net investment income and realized gains recognized for purposes of U.S. generally accepted accounting principles.
Table of Contents
| Notes to financial statements | Wells Fargo Advantage VT Total Return Bond Fund | 31 |
Federal and other taxes
The Fund intends to continue to qualify as a regulated investment company by distributing substantially all of its investment company taxable income and any net realized capital gains (after reduction for capital loss carryforwards) sufficient to relieve it from all, or substantially all, federal income taxes. Accordingly, no provision for federal income taxes was required.
The Fund’s income and federal excise tax returns and all financial records supporting those returns for the prior three fiscal years are subject to examination by the federal and Delaware revenue authorities. Management has analyzed the Fund’s tax positions taken on federal, state, and foreign tax returns for all open tax years and does not believe that there are any uncertain tax positions that require recognition of a tax liability.
Reclassifications are made to the Fund’s capital accounts for permanent tax differences to reflect income and gains available for distribution (or available capital loss carryforwards) under federal income tax regulations. U.S. generally accepted accounting principles requires that certain components of net assets be adjusted to reflect permanent differences between financial and tax reporting. These reclassifications have no effect on net assets or net asset values per share. The primary permanent difference causing such reclassifications is due to mortgage dollar roll transactions. At December 31, 2013, as a result of permanent book-to-tax differences, the following reclassification adjustments were made on the Statement of Assets and Liabilities:
| Paid-in capital | Undistributed net investment income | Accumulated net realized losses on investments | ||
| $12 | $60,878 | $(60,890) |
As of December 31, 2013, capital loss carryforwards available to offset future net realized capital gains were as follows through the indicated expiration date:
2016 | No Expiration | |
| Short-term | ||
| $4,157,782 | $877,635 |
3. FAIR VALUATION MEASUREMENTS
Fair value measurements of investments are determined within a framework that has established a fair value hierarchy based upon the various data inputs utilized in determining the value of the Fund’s investments. The three-level hierarchy gives the highest priority to unadjusted quoted prices in active markets for identical assets or liabilities (Level 1) and the lowest priority to significant unobservable inputs (Level 3). The Fund’s investments are classified within the fair value hierarchy based on the lowest level of input that is significant to the fair value measurement. The inputs are summarized into three broad levels as follows:
| n | Level 1 – quoted prices in active markets for identical securities |
| n | Level 2 – other significant observable inputs (including quoted prices for similar securities, interest rates, prepayment speeds, credit risk, use of amortized cost, etc.) |
| n | Level 3 – significant unobservable inputs (including the Fund’s own assumptions in determining the fair value of investments) |
The inputs or methodologies used for valuing investments in securities are not necessarily an indication of the risk associated with investing in those securities.
Table of Contents
| 32 | Wells Fargo Advantage VT Total Return Bond Fund | Notes to financial statements |
As of December 31, 2013, the inputs used in valuing investments in securities were as follows:
| Investments in securities | Quoted prices (Level 1) | Other significant (Level 2) | Significant unobservable inputs (Level 3) | Total | ||||||||||||
Agency securities | $ | 0 | $ | 30,255,430 | $ | 0 | $ | 30,255,430 | ||||||||
Asset-backed securities | 0 | 12,608,509 | 0 | 12,608,509 | ||||||||||||
Corporate bonds and notes | 0 | 17,516,688 | 0 | 17,516,688 | ||||||||||||
Municipal obligations | 0 | 880,626 | 0 | 880,626 | ||||||||||||
Non-agency mortgage-backed securities | 0 | 6,160,210 | 0 | 6,160,210 | ||||||||||||
U.S. Treasury securities | 23,533,243 | 0 | 0 | 23,533,243 | ||||||||||||
Yankee corporate bonds and notes | 0 | 4,621,610 | 0 | 4,621,610 | ||||||||||||
Yankee government bonds | 0 | 1,354,898 | 1,354,898 | |||||||||||||
Short-term investments | ||||||||||||||||
Investment companies | 2,706,651 | 0 | 0 | 2,706,651 | ||||||||||||
| $ | 26,239,894 | $ | 73,397,971 | $ | 0 | $ | 99,637,865 | |||||||||
Transfers in and transfers out are recognized at the end of the reporting period. For the year ended December 31, 2013, the Fund did not have any transfers into/out of Level 1, Level 2, or Level 3.
4. TRANSACTIONS WITH AFFILIATES AND OTHER EXPENSES
Advisory fee
The Trust has entered into an advisory contract with Funds Management, an indirect wholly owned subsidiary of Wells Fargo & Company (“Wells Fargo”). The adviser is responsible for implementing investment policies and guidelines and for supervising the subadviser, who is responsible for day-to-day portfolio management of the Fund.
Pursuant to the contract, Funds Management is entitled to receive an annual advisory fee starting at 0.40% and declining to 0.30% as the average daily net assets of the Fund increase. For the year ended December 31, 2013, the advisory fee was equivalent to an annual rate of 0.40% of the Fund’s average daily net assets.
Funds Management has retained the services of a subadviser to provide daily portfolio management to the Fund. The fee for subadvisory services is borne by Funds Management. WellsCap, an affiliate of Funds Management and an indirect, wholly owned subsidiary of Wells Fargo, is the subadviser to the Fund and is entitled to receive a fee from Funds Management at an annual rate starting at 0.20% and declining to 0.10% as the average daily net assets of the Fund increase.
Administration and transfer agent fees
The Trust has entered into an administration agreement with Funds Management. Under this agreement, for providing administrative services, which includes paying fees and expenses for services provided by the transfer agent, sub-transfer agents, omnibus account servicers and record-keepers, Funds Management is entitled to receive from the Fund an annual fund level administration fee starting at 0.05% and declining to 0.03% as the average daily net assets of the Fund increase and for Class 2 shares, a class level administration fee of 0.08% of its average daily net assets.
Funds Management has contractually waived and/or reimbursed advisory and administration fees to the extent necessary to maintain certain net operating expense ratios for the Fund. Waiver of fees and/or reimbursement of expenses by Funds Management were made first from fund level expenses on a proportionate basis and then from class specific expenses. Funds Management has committed through April 30, 2014 to waive fees and/or reimburse expenses to the extent necessary to cap the Fund’s expenses at 0.90% for Class 2 shares.
Distribution fees
The Trust has adopted a Distribution Plan for Class 2 shares of the Fund pursuant to Rule 12b-1 under the 1940 Act. Distribution fees are charged to Class 2 shares and paid to Wells Fargo Funds Distributor, LLC, the principal underwriter, at an annual rate of 0.25% of the average daily net assets of Class 2 shares.
Table of Contents
| Notes to financial statements | Wells Fargo Advantage VT Total Return Bond Fund | 33 |
5. INVESTMENT PORTFOLIO TRANSACTIONS
Purchases and sales of investments, excluding short-term securities, for the year ended December 31, 2013 were as follows:
Purchases at cost | Sales proceeds | |||||
| U.S. government | Non-U.S. government | U.S. government | Non-U.S. government | |||
| $520,274,502 | $76,251,925 | $511,575,431 | $73,738,921 | |||
6. BANK BORROWINGS
The Trust and Wells Fargo Funds Trust (excluding the money market funds and certain other funds) are parties to a $150,000,000 revolving credit agreement with State Street Bank and Trust Company, whereby the Fund is permitted to use bank borrowings for temporary or emergency purposes, such as to fund shareholder redemption requests. Interest under the credit agreement is charged to the Fund based on a borrowing rate equal to the higher of the Federal Funds rate in effect on that day plus 1.25% or the overnight LIBOR rate in effect on that day plus 1.25%. In addition, an annual commitment fee equal to 0.10% of the unused balance is allocated to each participating fund. For the year ended December 31, 2013, the Fund paid $116 in commitment fees.
For the year ended December 31, 2013, there were no borrowings by the Fund under the agreement.
7. DISTRIBUTIONS TO SHAREHOLDERS
The tax character of distributions paid during the years ended December 31, 2013 and December 31, 2012 were as follows:
| Year ended December 31 | ||||
| 2013 | 2012 | |||
Ordinary income | $2,927,256 | $2,000,489 | ||
Long-term capital gain | 1,118,135 | 957,605 | ||
As of December 31, 2013, the components of distributable earnings on a tax basis were as follows:
| Undistributed ordinary income | Unrealized losses | Capital loss carryforward | ||
| $66,628 | $(830,578) | $(5,035,417) |
8. INDEMNIFICATION
Under the Trust’s organizational documents, the officers and directors are indemnified against certain liabilities that may arise out of performance of their duties to the Trust. Additionally, in the normal course of business, the Trust may enter into contracts with service providers that contain a variety of indemnification clauses. The Trust’s maximum exposure under these arrangements is dependent on future claims that may be made against the Fund and, therefore, cannot be estimated.
Table of Contents
| 34 | Wells Fargo Advantage VT Total Return Bond Fund | Report of independent registered public accounting firm |
BOARD OF TRUSTEES AND SHAREHOLDERS OF WELLS FARGO VARIABLE TRUST:
We have audited the accompanying statement of assets and liabilities, including the portfolio of investments, of the Wells Fargo Advantage VT Total Return Bond Fund (the “Fund”), one of the funds constituting the Wells Fargo Variable Trust, as of December 31, 2013, and the related statement of operations for the year then ended, statements of changes in net assets for each of the years in the two-year period then ended, and the financial highlights for each of the years in the five-year period then ended. These financial statements and financial highlights are the responsibility of the Fund’s management. Our responsibility is to express an opinion on these financial statements and financial highlights based on our audits.
We conducted our audits in accordance with the standards of the Public Company Accounting Oversight Board (United States). Those standards require that we plan and perform the audit to obtain reasonable assurance about whether the financial statements and financial highlights are free of material misstatement. An audit includes examining, on a test basis, evidence supporting the amounts and disclosures in the financial statements. Our procedures included confirmation of securities owned as of December 31, 2013, by correspondence with the custodian and brokers or by other appropriate auditing procedures. An audit also includes assessing the accounting principles used and significant estimates made by management, as well as evaluating the overall financial statement presentation. We believe that our audits provide a reasonable basis for our opinion.
In our opinion, the financial statements and financial highlights referred to above present fairly, in all material respects, the financial position of the Wells Fargo Advantage VT Total Return Bond Fund as of December 31, 2013, the results of its operations for the year then ended, the changes in its net assets for each of the years in the two-year period then ended, and the financial highlights for each of the years in the five-year period then ended, in conformity with U.S. generally accepted accounting principles.

Boston, Massachusetts
February 27, 2014
Table of Contents
| Other information (unaudited) | Wells Fargo Advantage VT Total Return Bond Fund | 35 |
TAX INFORMATION
Pursuant to Section 852 of the Internal Revenue Code, $1,118,135 was designated as long-term capital gain distributions for the fiscal year ended December 31, 2013.
PROXY VOTING INFORMATION
A description of the policies and procedures that the Fund uses to determine how to vote proxies relating to portfolio securities is available without charge, upon request, by calling 1-800-222-8222, visiting our website at wellsfargoadvantagefunds.com, or visiting the SEC website at sec.gov. Information regarding how the Fund voted proxies relating to portfolio securities during the most recent 12-month period ended June 30 is available without charge on the Fund’s website at wellsfargoadvantagefunds.com or by visiting the SEC website at sec.gov.
PORTFOLIO HOLDINGS INFORMATION
The complete portfolio holdings for the Fund are publicly available on the Fund’s website (wellsfargoadvantagefunds.com) on a monthly, 30-day or more delayed basis. In addition, top ten holdings information for the Fund is publicly available on the Fund’s website on a monthly, seven-day or more delayed basis. The Fund files its complete schedule of portfolio holdings with the SEC for the first and third quarters of each fiscal year on Form N-Q, which is available without charge by visiting the SEC website at sec.gov. In addition, the Fund’s Form N-Q may be reviewed and copied at the SEC’s Public Reference Room in Washington, DC, and at regional offices in New York City, at 233 Broadway, and in Chicago, at 175 West Jackson Boulevard, Suite 900. Information about the Public Reference Room may be obtained by calling 1-800-SEC-0330.
Table of Contents
| 36 | Wells Fargo Advantage VT Total Return Bond Fund | Other information (unaudited) |
BOARD OF TRUSTEES AND OFFICERS
Each of the Trustees and Officers listed in the table below acts in identical capacities for each fund in the Wells Fargo Advantage family of funds, which consists of 132 mutual funds1 comprising the Wells Fargo Funds Trust, Wells Fargo Variable Trust, Wells Fargo Master Trust and four closed-end funds (collectively the “Fund Complex”). This table should be read in conjunction with the Prospectus and the Statement of Additional Information2. All of the Trustees are also Members of the Audit and Governance Committees of each Trust in the Fund Complex. The mailing address of each Trustee and Officer is 525 Market Street, 12th Floor, San Francisco, CA 94105. Each Trustee and Officer serves an indefinite term, however, each Trustee serves such term until reaching the mandatory retirement age established by the Trustees.
Independent Trustees
| Name and year of birth | Position held and length of service* | Principal occupations during past five years | Other directorships during past five years | |||
| Peter G. Gordon (Born 1942) | Trustee, since 1998; Chairman, since 2005 | Co-Founder, Retired Chairman, President and CEO of Crystal Geyser Water Company. Trustee Emeritus, Colby College. | Asset Allocation Trust | |||
| Isaiah Harris, Jr. (Born 1952) | Trustee, since 2009 | Retired. Prior thereto, President and CEO of BellSouth Advertising and Publishing Corp. from 2005 to 2007, President and CEO of BellSouth Enterprises from 2004 to 2005 and President of BellSouth Consumer Services from 2000 to 2003. Emeritus member of the Iowa State University Foundation Board of Governors. Emeritus Member of the Advisory Board of Iowa State University School of Business. Advisory Board Member, Palm Harbor Academy (charter school). Mr. Harris is a certified public accountant. | CIGNA Corporation; Deluxe Corporation; Asset Allocation Trust | |||
| Judith M. Johnson (Born 1949) | Trustee, since 2008; Audit Committee Chairman, since 2008 | Retired. Prior thereto, Chief Executive Officer and Chief Investment Officer of Minneapolis Employees Retirement Fund from 1996 to 2008. Ms. Johnson is an attorney, certified public accountant and a certified managerial accountant. | Asset Allocation Trust | |||
| Leroy Keith, Jr. (Born 1939) | Trustee, since 2010 | Chairman, Bloc Global Services (development and construction). Trustee of the Evergreen Funds from 1983 to 2010. Former Managing Director, Almanac Capital Management (commodities firm), former Partner, Stonington Partners, Inc. (private equity fund), former Director, Obagi Medical Products Co. and former Director, Lincoln Educational Services. | Trustee, Virtus Fund Complex (consisting of 50 portfolios as of 12/16/2013); Asset Allocation Trust | |||
| David F. Larcker (Born 1950) | Trustee, since 2009 | James Irvin Miller Professor of Accounting at the Graduate School of Business, Stanford University, Morgan Stanley Director of the Center for Leadership Development and Research and Senior Faculty of The Rock Center for Corporate Governance since 2006. From 2005 to 2008, Professor of Accounting at the Graduate School of Business, Stanford University. Prior thereto, Ernst & Young Professor of Accounting at The Wharton School, University of Pennsylvania from 1985 to 2005. | Asset Allocation Trust | |||
| Olivia S. Mitchell (Born 1953) | Trustee, since 2006 | International Foundation of Employee Benefit Plans Professor, Wharton School of the University of Pennsylvania since 1993. Director of Wharton’s Pension Research Council and Boettner Center on Pensions & Retirement Research, and Research Associate at the National Bureau of Economic Research. Previously, Cornell University Professor from 1978 to 1993. | Asset Allocation Trust | |||
| Timothy J. Penny (Born 1951) | Trustee, since 1996 | President and CEO of Southern Minnesota Initiative Foundation, a non-profit organization, since 2007 and Senior Fellow at the Humphrey Institute Policy Forum at the University of Minnesota since 1995. Member of the Board of Trustees of NorthStar Education Finance, Inc., a non-profit organization, since 2007. | Asset Allocation Trust |
Table of Contents
| Other information (unaudited) | Wells Fargo Advantage VT Total Return Bond Fund | 37 |
| Name and year of birth | Position held and length of service* | Principal occupations during past five years | Other directorships during past five years | |||
| Michael S. Scofield (Born 1943) | Trustee, since 2010 | Served on the Investment Company Institute’s Board of Governors and Executive Committee from 2008-2011 as well the Governing Council of the Independent Directors Council from 2006-2011 and the Independent Directors Council Executive Committee from 2008-2011. Chairman of the IDC from 2008-2010. Institutional Investor (Fund Directions) Trustee of Year in 2007. Trustee of the Evergreen Funds (and its predecessors) from 1984 to 2010. Chairman of the Evergreen Funds from 2000-2010. Former Trustee of the Mentor Funds. Retired Attorney, Law Offices of Michael S. Scofield. | Asset Allocation Trust | |||
| Donald C. Willeke (Born 1940) | Trustee, since 1996 | Principal of the law firm of Willeke & Daniels. General Counsel of the Minneapolis Employees Retirement Fund from 1984 until its consolidation into the Minnesota Public Employees Retirement Association on June 30, 2010. Director and Vice Chair of The Tree Trust (non-profit corporation). Director of the American Chestnut Foundation (non-profit corporation). | Asset Allocation Trust |
| * | Length of service dates reflect the Trustee’s commencement of service with the Trust’s predecessor entities, where applicable. |
Officers
| Name and year of birth | Position held and length of service | Principal occupations during past five years | ||||
| Karla M. Rabusch (Born 1959) | President, since 2003 | Executive Vice President of Wells Fargo Bank, N.A. and President of Wells Fargo Funds Management, LLC since 2003. | ||||
| Jeremy DePalma1 (Born 1974) | Treasurer, since 2012 | Senior Vice President of Wells Fargo Funds Management, LLC since 2009. Senior Vice President of Evergreen Investment Management Company, LLC from 2008 to 2010. Vice President, Evergreen Investment Services, Inc. from 2004 to 2007. Head of the Fund Reporting and Control Team within Fund Administration from 2005 to 2010. | ||||
| C. David Messman (Born 1960) | Secretary, since 2000; Chief Legal Officer, since 2003 | Senior Vice President and Secretary of Wells Fargo Funds Management, LLC since 2001. Vice President and Managing Counsel of Wells Fargo Bank, N.A. since 1996. | ||||
| Debra Ann Early (Born 1964) | Chief Compliance Officer, since 2007 | Chief Compliance Officer of Wells Fargo Funds Management, LLC since 2007. Chief Compliance Officer of Parnassus Investments from 2005 to 2007. Chief Financial Officer of Parnassus Investments from 2004 to 2007. | ||||
| David Berardi (Born 1975) | Assistant Treasurer, since 2009 | Vice President of Wells Fargo Funds Management, LLC since 2009. Vice President of Evergreen Investment Management Company, LLC from 2008 to 2010. Assistant Vice President of Evergreen Investment Services, Inc. from 2004 to 2008. Manager of Fund Reporting and Control for Evergreen Investment Management Company, LLC from 2004 to 2010. |
| 1. | Jeremy DePalma acts as Treasurer of 59 funds and Assistant Treasurer of 73 funds in the Fund Complex. |
| 2. | The Statement of Additional Information includes additional information about the Trustees and is available, without charge, upon request, by calling 1-800-222-8222 or by visiting the website at wellsfargoadvantagefunds.com. |
Table of Contents
| 38 | Wells Fargo Advantage VT Total Return Bond Fund | List of abbreviations |
The following is a list of common abbreviations for terms and entities that may have appeared in this report.
| ACA | — ACA Financial Guaranty Corporation |
| ADR | — American depositary receipt |
| ADS | — American depositary shares |
| AGC | — Assured Guaranty Corporation |
| AGM | — Assured Guaranty Municipal |
| Ambac | — Ambac Financial Group Incorporated |
| AMT | — Alternative minimum tax |
| AUD | — Australian dollar |
| BAN | — Bond anticipation notes |
| BHAC | — Berkshire Hathaway Assurance Corporation |
| BRL | — Brazilian real |
| CAB | — Capital appreciation bond |
| CAD | — Canadian dollar |
| CCAB | — Convertible capital appreciation bond |
| CDA | — Community Development Authority |
| CDO | — Collateralized debt obligation |
| CHF | — Swiss franc |
| COP | — Certificate of participation |
| DKK | — Danish krone |
| DRIVER | — Derivative inverse tax-exempt receipts |
| DW&P | — Department of Water & Power |
| DWR | — Department of Water Resources |
| ECFA | — Educational & Cultural Facilities Authority |
| EDA | — Economic Development Authority |
| EDFA | — Economic Development Finance Authority |
| ETF | — Exchange-traded fund |
| EUR | — Euro |
| FDIC | — Federal Deposit Insurance Corporation |
| FFCB | — Federal Farm Credit Banks |
| FGIC | — Financial Guaranty Insurance Corporation |
| FHA | — Federal Housing Administration |
| FHLB | — Federal Home Loan Bank |
| FHLMC | — Federal Home Loan Mortgage Corporation |
| FICO | — The Financing Corporation |
| FNMA | — Federal National Mortgage Association |
| FSA | — Farm Service Agency |
| GBP | — Great British pound |
| GDR | — Global depositary receipt |
| GNMA | — Government National Mortgage Association |
| GO | — General obligation |
| HCFR | — Healthcare facilities revenue |
| HEFA | — Health & Educational Facilities Authority |
| HEFAR | — Higher education facilities authority revenue |
| HFA | — Housing Finance Authority |
| HFFA | — Health Facilities Financing Authority |
| HKD | — Hong Kong dollar |
| HUD | — Department of Housing and Urban Development |
| HUF | — Hungarian forint |
| IDA | — Industrial Development Authority |
| IDAG | — Industrial Development Agency |
| IDR | — Industrial development revenue |
| IEP | — Irish pound |
| JPY | — Japanese yen |
| KRW | — Republic of Korea won |
| LIBOR | — London Interbank Offered Rate |
| LIQ | — Liquidity agreement |
| LLC | — Limited liability company |
| LLP | — Limited liability partnership |
| LOC | — Letter of credit |
| LP | — Limited partnership |
| MBIA | — Municipal Bond Insurance Association |
| MFHR | — Multifamily housing revenue |
| MSTR | — Municipal securities trust receipts |
| MTN | — Medium-term note |
| MUD | — Municipal Utility District |
| MXN | — Mexican peso |
| MYR | — Malaysian ringgit |
| National | — National Public Finance Guarantee Corporation |
| NGN | — Nigerian naira |
| NOK | — Norwegian krone |
| NZD | — New Zealand dollar |
| PCFA | — Pollution Control Financing Authority |
| PCL | — Public Company Limited |
| PCR | — Pollution control revenue |
| PFA | — Public Finance Authority |
| PFFA | — Public Facilities Financing Authority |
| PFOTER | — Puttable floating option tax-exempt receipts |
| plc | — Public limited company |
| PLN | — Polish zloty |
| PUTTER | — Puttable tax-exempt receipts |
| R&D | — Research & development |
| Radian | — Radian Asset Assurance |
| RAN | — Revenue anticipation notes |
| RDA | — Redevelopment Authority |
| RDFA | — Redevelopment Finance Authority |
| REIT | — Real estate investment trust |
| ROC | — Reset option certificates |
| RON | — Romanian lei |
| RUB | — Russian ruble |
| SAVRS | — Select auction variable rate securities |
| SBA | — Small Business Authority |
| SEK | — Swedish krona |
| SFHR | — Single-family housing revenue |
| SFMR | — Single-family mortgage revenue |
| SGD | — Singapore dollar |
| SKK | — Slovakian koruna |
| SPA | — Standby purchase agreement |
| SPDR | — Standard & Poor’s Depositary Receipts |
| STRIPS | — Separate trading of registered interest and principal securities |
| TAN | — Tax anticipation notes |
| TBA | — To be announced |
| THB | — Thai baht |
| TIPS | — Treasury inflation-protected securities |
| TRAN | — Tax revenue anticipation notes |
| TRY | — Turkish lira |
| TTFA | — Transportation Trust Fund Authority |
| TVA | — Tennessee Valley Authority |
| ZAR | — South African rand |
Table of Contents
This page is intentionally left blank.
Table of Contents
This page is intentionally left blank.
Table of Contents


For more information
More information about Wells Fargo Advantage Funds is available free upon request. To obtain literature, please write, email, visit the Fund’s website, or call:
Wells Fargo Advantage Funds
P.O. Box 8266
Boston, MA 02266-8266
Email: wfaf@wellsfargo.com
Website: wellsfargoadvantagefunds.com
Individual investors: 1-800-222-8222
Retail investment professionals: 1-888-877-9275
Institutional investment professionals: 1-866-765-0778
This report and the financial statements contained herein are submitted for the general information of the shareholders of Wells Fargo Advantage Funds. If this report is used for promotional purposes, distribution of the report must be accompanied or preceded by a current prospectus. For a current prospectus and, if available, a summary prospectus containing more complete information, including charges and expenses, call 1-800-222-8222 or visit the Fund’s website at wellsfargoadvantagefunds.com . Please consider the investment objectives, risks, charges, and expenses of the investment carefully before investing. This and other information about Wells Fargo Advantage Funds can be found in the current prospectus. Read the prospectus carefully before you invest or send money.
Wells Fargo Funds Management, LLC, a wholly owned subsidiary of Wells Fargo & Company, provides investment advisory and administrative services for Wells Fargo Advantage Funds. Other affiliates of Wells Fargo & Company provide subadvisory and other services for the Funds. The Funds are distributed by Wells Fargo Funds Distributor, LLC, Member FINRA/SIPC, an affiliate of Wells Fargo & Company.
NOT FDIC INSURED ¡ NO BANK GUARANTEE ¡ MAY LOSE VALUE
© 2014 Wells Fargo Funds Management, LLC. All rights reserved.
222100 02-14 AVT9/AR155 12-13 |
Table of Contents
ITEM 2. CODE OF ETHICS
(a) As of the end of the period, covered by the report, Variable Trust has adopted a code of ethics that applies to its President and Treasurer. A copy of the code of ethics is filed as an exhibit to this Form N-CSR.
(c) During the period covered by this report, there were no amendments to the provisions of the code of ethics adopted in Item 2(a) above.
(d) During the period covered by this report, there were no implicit or explicit waivers to the provisions of the code of ethics adopted in Item 2(a) above.
ITEM 3. AUDIT COMMITTEE FINANCIAL EXPERT
The Board of Trustees of Wells Fargo Variable Trust has determined that Judith Johnson is an audit committee financial expert, as defined in Item 3 of Form N-CSR. Mrs. Johnson is independent for purposes of Item 3 of Form N-CSR.
ITEM 4. PRINCIPAL ACCOUNTANT FEES AND SERVICES
(a), (b), (c), (d) The following table presents aggregate fees billed in each of the last two fiscal years for services rendered to the Registrant by the Registrant’s principal accountant. These fees were billed to the registrant and were approved by the Registrant’s audit committee.
| Fiscal year ended December 31, 2013 | Fiscal year ended December 31, 2012 | |||||||
Audit fees | $ | 261,710 | $ | 257,280 | ||||
Audit-related fees | — | — | ||||||
Tax fees (1) | 20,600 | 20,110 | ||||||
All other fees | — | — | ||||||
|
|
|
| |||||
| $ | 282,310 | $ | 277,390 | |||||
|
|
|
| |||||
| (1) | Tax fees consist of fees for tax compliance, tax advice and tax planning. |
(e) The Chairman of the Audit Committees is authorized to pre-approve: (1) audit services to the mutual funds of Wells Fargo Variable Trust; (2) non-audit tax or compliance consulting or training services provided to the Funds by the independent auditors (“Auditors”) if the fees for any particular engagement are not anticipated to exceed $50,000; and (3) non-audit tax or compliance consulting or training services provided by the Auditors to a Fund’s investment adviser and its controlling entities (where pre-approval is required because the engagement relates directly to the operations and financial reporting of the Fund) if the fee to the Auditors for any particular engagement is not anticipated to exceed $50,000. For any such pre-approval sought from the Chairman, Management shall prepare a brief description of the proposed services. If the Chairman approves of such service, he or she shall sign the statement prepared by Management. Such written statement shall be presented to the full Committees at their next regularly scheduled meetings.
(f) Not applicable
(g) Not applicable
Table of Contents
| (h) Not applicable |
ITEM 5. AUDIT COMMITTEE OF LISTED REGISTRANTS
Not applicable.
ITEM 6. INVESTMENTS
The Portfolio of investments is included as part of the report to shareholders filed under Item 1 of this Form.
ITEM 7. DISCLOSURE OF PROXY VOTING POLICIES AND PROCEDURES FOR CLOSED-END MANAGEMENT INVESTMENT COMPANIES
Not applicable.
ITEM 8. PORTFOLIO MANAGERS OF CLOSED-END MANAGEMENT INVESTMENT COMPANIES
Not applicable.
ITEM 9. PURCHASES OF EQUITY SECURITIES BY CLOSED-END MANAGEMENT INVESTMENT COMPANY AND AFFILIATED PURCHASERS
Not applicable.
ITEM 10. SUBMISSION OF MATTERS TO A VOTE OF SECURITY HOLDERS
There have been no material changes to the procedures by which shareholders may recommend nominees to the Registrant’s board of trustees that have been implemented since the Registrant’s last provided disclosure in response to the requirements of this Item.
ITEM 11. CONTROLS AND PROCEDURES
(a) The President and Treasurer have concluded that the Wells Fargo Variable Trust (the “Trust”) disclosure controls and procedures (as defined in Rule 30a-3(c) under the Investment Company Act of 1940) provide reasonable assurances that material information relating to the Trust is made known to them by the appropriate persons based on their evaluation of these controls and procedures as of a date within 90 days of the filing of this report.
(b) There were no significant changes in the Trust’s internal controls over financial reporting (as defined in Rule 30a-3(d) under the Investment Company Act of 1940) that occurred during the second fiscal quarter of the period covered by this report that materially affected, or is reasonably likely to materially affect, the registrant’s internal control over financial reporting.
ITEM 12. EXHIBITS
(a)(1) Code of Ethics pursuant to Item 2 of Form N-CSR is filed and attached hereto as Exhibit 10a.
Table of Contents
(a)(2) Certification pursuant to Rule 30a-2(a) under the Investment Company Act of 1940 (17 CFR 270.30a-2(a)) is filed and attached hereto as Exhibit 99.CERT.
(a)(3) Not applicable.
(b) Certification pursuant to Rule 30a-2(b) under the Investment Company Act of 1940 (17 CFR 270.30a-2(b)) is filed and attached hereto as Exhibit 99.906CERT.
Table of Contents
SIGNATURES
Pursuant to the requirements of the Securities Exchange Act of 1934 and the Investment Company Act of 1940, the registrant has duly caused this report to be signed on its behalf by the undersigned, thereunto duly authorized.
| Wells Fargo Variable Trust | ||
| By: | ||
| /s/ Karla M. Rabusch | ||
Karla M. Rabusch President | ||
| Date: February 27, 2014 | ||
Pursuant to the requirements of the Securities Exchange Act of 1934 and the Investment Company Act of 1940, this report has been signed below by the following persons on behalf of the registrant and in the capacities and on the date indicated.
| Wells Fargo Variable Trust | ||
| By: | ||
| /s/ Karla M. Rabusch | ||
Karla M. Rabusch President | ||
Date: February 27, 2014 | ||
By: | ||
| /s/ Jeremy DePalma | ||
Jeremy DePalma Treasurer | ||
Date: | February 27, 2014 | |