
UNITED STATES
SECURITIES AND EXCHANGE COMMISSION
Washington, D.C. 20549
FORM N-CSR
CERTIFIED SHAREHOLDER REPORT OF REGISTERED
MANAGEMENT INVESTMENT COMPANIES
Investment Company Act file number: 811-09255
Wells Fargo Variable Trust
(Exact name of registrant as specified in charter)
525 Market St., San Francisco, CA 94105
(Address of principal executive offices) (Zip code)
C. David Messman
Wells Fargo Funds Management, LLC
525 Market St., San Francisco, CA 94105
(Name and address of agent for service)
Registrant’s telephone number, including area code: 800-222-8222
Date of fiscal year end: December 31
Registrant is making a filing for 6 of its series:
Wells Fargo VT Discovery Fund, Wells Fargo VT Index Asset Allocation Fund, Wells Fargo VT International Equity Fund, Wells Fargo VT Omega Growth Fund, Wells Fargo VT Opportunity Fund, and Wells Fargo VT Small Cap Growth Fund.
Date of reporting period: December 31, 2016
ITEM 1. REPORT TO STOCKHOLDERS
Annual Report
December 31, 2016

Wells Fargo VT Discovery Fund


Reduce clutter. Save trees.
Sign up for electronic delivery of prospectuses and shareholder reports at wellsfargo.com/advantagedelivery
Contents
The views expressed and any forward-looking statements are as of December 31, 2016, unless otherwise noted, and are those of the Fund managers and/or Wells Fargo Funds Management, LLC. Discussions of individual securities, or the markets generally, or any Wells Fargo Fund are not intended as individual recommendations. Future events or results may vary significantly from those expressed in any forward-looking statements. The views expressed are subject to change at any time in response to changing circumstances in the market. Wells Fargo Funds Management, LLC and the Fund disclaim any obligation to publicly update or revise any views expressed or forward-looking statements.
NOT FDIC INSURED ◾ NO BANK GUARANTEE ◾ MAY LOSE VALUE
| | | | |
| 2 | | Wells Fargo VT Discovery Fund | | Letter to shareholders (unaudited) |

Andrew Owen
President
Wells Fargo Funds
U.S. small-, mid-, and large-cap stocks returned 21.31%, 13.80%, and 12.05% for the twelve-month period, respectively.
During the fourth quarter of 2016, the Fed hiked the short-term interest rate by 0.25% to reach a target range of 0.50% to 0.75%.
Dear Shareholder:
As the new president of Wells Fargo Funds now that Karla Rabusch is retiring from that position after nearly 14 years, I am pleased to offer you this annual report for the Wells Fargo VT Discovery Fund for the 12-month period that ended December 31, 2016. The U.S. economy ticked up as the year progressed. As expected, the Federal Reserve (Fed) raised the federal funds rate in December by 0.25%. U.S. small-, mid-, and large-cap stocks returned 21.31%, 13.80%, and 12.05% for the twelve-month period, respectively, as measured by the Russell 2000® Index,1 the Russell Midcap® Index,2 and the Russell 1000® Index.3
U.S. stocks showed gains in 2016, primarily after the U.S. presidential election.
The year began with a precipitous drop in U.S. stocks in January as crude oil prices tumbled and concerns about China’s economy increased; a mostly steady trajectory continued in the U.S. stock market after that inflection point. However, stocks rose significantly immediately following the U.S. presidential election. The promise of pro-growth policies by the incoming administration—lower tax rates, less regulation, investments in infrastructure, better trade deals—set the momentum for this surge.
The types of companies leading the rally leaned toward ones that have done well in a rising-rate environment, such as banks, and businesses that have benefited from infrastructure spending and reduced regulations. Sectors that could be negatively affected by rising interest rates, such as utilities, delivered weaker results. Consumer confidence hit prerecession levels for the first time in November and increased again in December.
Stronger economic indicators drove U.S. monetary policy.
During the fourth quarter of 2016, the Fed hiked the short-term interest rate by 0.25% to reach a target range of 0.50% to 0.75%. This was the second rate increase in more than 10 years, with the Fed citing job gains and lower-than-expected unemployment of 4.6%, down 0.3% from October. The Fed confirmed the continuation of an accommodative monetary policy to support a stronger labor market and reiterated its long-term objective of a 2% inflation rate, which increased slightly during the quarter but fell short of the benchmark. The Fed expressed confidence in the economy’s progress during the quarter and expects this positive trajectory to continue. Both of these sentiments helped to bolster the Fed’s expectation of three additional rate increases during 2017.
U.S. economic data released during the fourth quarter showed that U.S. real gross domestic product increased at an annual rate of 3.5% in the third quarter, the largest increase since mid-2014. Business investment by U.S. companies was mixed, with a 12.0% increase in structures and 4.5% decrease in equipment over the prior quarter on an annualized basis. Consumer spending slowed somewhat from the prior quarter, but late-December estimates from retail-research firms suggest that sales growth during the 2016 holiday season may outpace that of recent years.
| 1 | The Russell 2000® Index measures the performance of the 2,000 smallest companies in the Russell 3000® Index, which represents approximately 8% of the total market capitalization of the Russell 3000® Index. You cannot invest directly in an index. |
| 2 | The Russell Midcap® Index measures the performance of the 800 smallest companies in the Russell 1000® Index, which represent approximately 25% of the total market capitalization of the Russell 1000® Index. You cannot invest directly in an index. |
| 3 | The Russell 1000® Index measures the performance of the 1,000 largest companies in the Russell 3000® Index, which represents approximately 92% of the total market capitalization of the Russell 3000® Index. You cannot invest directly in an index. |
| | | | | | |
| Letter to shareholders (unaudited) | | Wells Fargo VT Discovery Fund | | | 3 | |
Central banks continued with stimulus programs during 2016.
In January, the Bank of Japan put in place a negative interest rate and in September announced an interest-rate target for 10-year government bonds—keeping the yield at zero—as it struggled to accelerate economic growth. The eurozone fell into deflation in February; in response, the European Central Bank (ECB) announced an expansion of its stimulus program. In December, the ECB stated that it will extend its quantitative-easing program and continue purchasing eurozone corporate and government debt each month through December 2017. In June, voters in the U.K. approved a referendum to leave the European Union; the Bank of England lowered its interest rate in August to 0.25% and continued its quantitative-easing program.
Don’t let short-term uncertainty derail long-term investment goals.
Periods of uncertainty can present challenges, but experience has taught us that maintaining long-term investment goals can be an effective way to plan for the future. To help you create a sound strategy based on your personal goals and risk tolerance, Wells Fargo Funds offers more than 100 mutual funds spanning a wide range of asset classes and investment styles. Although diversification cannot guarantee an investment profit or prevent losses, we believe it can be an effective way to manage investment risk and potentially smooth out overall portfolio performance. We encourage investors to know their investments and to understand that appropriate levels of risk-taking may unlock opportunities.
Thank you for choosing to invest in Wells Fargo Funds. We appreciate your confidence in us and remain committed to helping you meet your financial needs.
Sincerely,

Andrew Owen
President
Wells Fargo Funds
For further information about your Fund, contact your investment professional, visit our website at wellsfargofunds.com, or call us directly at 1-800-260-5969. We are available 24 hours a day, 7 days a week.
| | | | |
| 4 | | Wells Fargo VT Discovery Fund | | Performance highlights (unaudited) |
Investment objective
The Fund seeks long-term capital appreciation.
Manager
Wells Fargo Funds Management, LLC
Subadviser
Wells Capital Management Incorporated
Portfolio managers
Michael T. Smith, CFA®
Christopher J. Warner, CFA®
Average annual total returns (%) as of December 31, 2016
| | | | | | | | | | | | | | | | | | | | | | |
| | | | | | | | Expense ratios1 (%) | |
| | | Inception date | | 1 year | | | 5 year | | | 10 year | | | Gross | | | Net2 | |
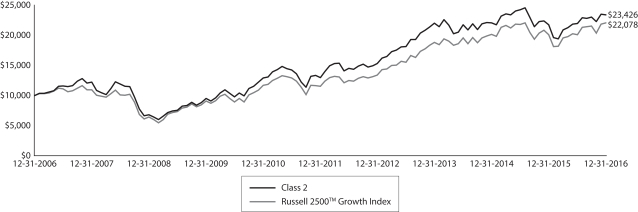
| Class 2 | | 5-8-1992 | | | 7.65 | | | | 12.50 | | | | 8.89 | | | | 1.17 | | | | 1.15 | |
| Russell 2500TM Growth Index3 | | – | | | 9.73 | | | | 13.88 | | | | 8.24 | | | | – | | | | – | |
Figures quoted represent past performance, which is no guarantee of future results. Investment return and principal value of an investment will fluctuate so that an investor’s shares, when redeemed, may be worth more or less than their original cost. Current performance may be lower or higher than the performance data quoted and assumes the reinvestment of dividends and capital gains. Current month-end performance is available by calling 1-800-260-5969. Performance figures of the Fund do not reflect fees charged pursuant to the terms of variable life insurance policies and variable annuity contracts. If sales loads or charges had been reflected, performance would have been lower.
Index returns do not include transaction costs associated with buying and selling securities, any mutual fund fees or expenses, or any taxes. It is not possible to invest directly in an index.
Stock values fluctuate in response to the activities of individual companies and general market and economic conditions. Smaller-company stocks tend to be more volatile and less liquid than those of larger companies. Certain investment strategies tend to increase the total risk of an investment (relative to the broader market). The Fund is exposed to foreign investment risk. Consult the Fund’s prospectus for additional information on these and other risks.
Please refer to the prospectus provided by your participating insurance company for detailed information describing the separate accounts for information regarding surrender charges, mortality and expense risk fees, and other charges that may be assessed by the participating insurance companies.
Please see footnotes on page 5.
| | | | | | |
| Performance highlights (unaudited) | | Wells Fargo VT Discovery Fund | | | 5 | |
|
| Growth of $10,000 investment as of December 31, 20164 |
|
 |
| 1 | Reflects the expense ratios as stated in the most recent prospectus. The expense ratios shown are subject to change and may differ from the annualized expense ratios shown in the financial highlights of this report. |
| 2 | The manager has contractually committed through April 30, 2017, to waive fees and/or reimburse expenses to the extent necessary to cap the Fund’s Total Annual Fund Operating Expenses After Fee Waiver at the amount shown. After this time, the cap may be increased or the commitment to maintain the cap may be terminated only with the approval of the Board of Trustees. Brokerage commissions, stamp duty fees, interest, taxes, acquired fund fees and expenses, and extraordinary expenses are excluded from the expense cap. Without this cap, the Fund’s returns would have been lower. |
| 3 | The Russell 2500TM Growth Index measures the performance of those Russell 2500 companies with higher price/book ratios and higher forecasted growth values. You cannot invest directly in an index. |
| 4 | The chart compares the performance of Class 2 shares for the most recent ten years with the Russell 2500TM Growth Index. The chart assumes a hypothetical $10,000 investment and reflects all operating expenses of the Fund. Performance does not reflect fees charged pursuant to the terms of variable life insurance policies and variable annuity contracts. |
| 5 | The ten largest holdings, excluding cash and cash equivalents, are calculated based on the value of the investments divided by total net assets of the Fund. Holdings are subject to change and may have changed since the date specified. |
| 6 | Amounts are calculated based on the total long-term investments of the Fund. These amounts are subject to change and may have changed since the date specified. |
| | | | |
| 6 | | Wells Fargo VT Discovery Fund | | Performance highlights (unaudited) |
MANAGER’S DISCUSSION
Fund highlights
| ∎ | | The Fund underperformed its benchmark, the Russell 2500TM Growth Index, for the 12-month period that ended December 31, 2016. |
| ∎ | | The Fund’s relative performance was most challenged by positioning in the information technology (IT) sector. |
| ∎ | | Effective stock selection in the health care sector contributed positively to the Fund’s results. |
Three distinct environments were visible within the U.S. stock market in 2016.
The year began with a decidedly risk-averse tone to the market as investor concern mounted over the economic slowdown in China. The continued weakness in commodity prices and the ultimate path of U.S. monetary policy also weighed on investors’ risk tolerance. These factors combined to send the yield on the U.S. 10-year Treasury to near-record lows while $10 trillion in worldwide sovereign debt traded at negative yields. Not surprisingly, stock-market leadership during this period was centered on defensive stocks and those seen as bond proxies (those that pay dividends and those viewed as relatively less volatile).
The tone of the market changed abruptly, however, in mid-February as investors began to look past the issues described above. China began to show signs of stabilization, commodities recovered, and corporate earnings were better than feared. This environment, which lasted through the summer and well into the fall, was marked by a closer relationship between company-specific fundamentals and stock-price movements.
The final stock-market environment of 2016 was triggered by the presidential-election results. The market did not appear to foresee a Trump victory, and the outcome sparked a rapid recalibration of expectations for many economic variables. Aided by Republican majorities in both branches of Congress, the new political regime caused investors’ focus to shift dramatically toward the prospects for pro-growth policies. After years of subpar U.S. economic growth, the combination of potentially lower taxes, fewer regulations, and enhanced fiscal stimulus appeared to produce a sense of euphoria among investors. The election led to a significant change in the outlooks for inflation, economic growth, monetary policy, and interest rates. Within the stock market, the election was the catalyst for improvement in investors’ willingness to take on more risk. Lower-quality, more cyclically exposed stocks assumed a market leadership position while higher-quality stocks with more visible and sustainable earnings and cash flow lagged.
| | | | |
| Ten largest holdings (%) as of December 31, 20165 | |
Waste Connections Incorporated | | | 2.46 | |
HD Supply Holdings Incorporated | | | 2.20 | |
Zayo Group Holdings Incorporated | | | 2.04 | |
Berry Plastics Group Incorporated | | | 2.02 | |
WEX Incorporated | | | 1.96 | |
Integra LifeSciences Holdings Corporation | | | 1.95 | |
VCA Incorporated | | | 1.90 | |
Allegion plc | | | 1.90 | |
Bright Horizons Family Solutions Incorporated | | | 1.82 | |
Spirit Airlines Incorporated | | | 1.81 | |
Portfolio construction is focused on three types of growth companies.
We believe that, in any market environment, a portfolio’s construction must balance risk and return. We strive to provide this balance through a portfolio composed of three distinct types of growth companies. Core growth holdings (typically 40%–50% of assets) are companies that we believe have stable growth records, proven management teams, and relatively low volatility. Developing situations (typically 40%–50% of assets) are firms we believe are entering a period of accelerated growth driven by a new product, business plan, or management team. The remainder of the portfolio (typically 5%–10% of assets) is dedicated to valuation
opportunities—holdings we believe carry above-average growth potential and relatively high volatility. Our conviction level drives each stock’s relative weight in the portfolio. This direct relationship helps us position our highest-conviction ideas to potentially make a significant impact on performance.
Positioning in the IT sector weighed on the Fund’s relative performance.
Within the IT sector, specific weakness was visible in the software industry as company-specific issues and concerns over enterprise spending pressured portfolio holdings. Early in 2016, Tableau Software Incorporated, a data-visualization software company, reported disappointing quarterly results driven by an unexpected decline in licensing revenue. As a
Please see footnotes on page 5.
| | | | | | |
| Performance highlights (unaudited) | | Wells Fargo VT Discovery Fund | | | 7 | |
result, shares of Tableau declined sharply. Further weighing on the stock were concerns regarding increased competition and the company’s ability to transition its business model to large, enterprise-level customers. Also among software holdings, the Fund’s position in Tyler Technologies, Incorporated, detracted from annual returns. Tyler Technologies is a leading provider of software and services for state and local governments, offering a broad suite of solutions. The company has benefited from government investments to make the switch from legacy systems to a new software-as-a-service infrastructure. Although Tyler reported strong fourth-quarter 2016 earnings, management modestly lowered revenue expectations going forward. While the revenue decline likely will be offset by cost cuts, investors became concerned that the company’s growth rate could slow given the rapid adoption of Tyler’s products over the past few years. As a result, Tyler’s shares came under pressure late in 2016.
Holdings in the health care sector contributed positively to results.
After weighing on returns for much of 2015, positioning in the health care sector was the largest contributor to 2016’s annual returns. This reversal was clearly visible via the Fund’s positon in medical diagnostic-test manufacturer Alere Incorporated. Despite no material change to company fundamentals, the Fund’s position in Alere detracted from returns in 2015. With our thesis still intact, we maintained the position and were rewarded as shares soared after the company received an acquisition bid by Abbott Laboratories early in 2016. Consistent with our valuation discipline, we sold the stock in favor of other opportunities. Within the innovative medical-equipment industry, Nevro Corporation was a standout holding in 2016. The pain-management company saw sales of its Senza system, which uses high-frequency spinal-cord stimulation to manage leg and back pain, ramp up much faster than originally anticipated. The system’s strong effectiveness has helped Nevro quickly gain market share in the pain-management field and has delivered results that exceeded even the most bullish estimates as both topline revenue and gross margins were well ahead of expectations.
|
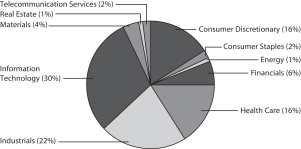
| Sector distribution as of December 31, 20166 |
|
 |
We look forward to 2017.
A return to a slower-growth sentiment could be favorable for our investing style. We have thrived when stock prices have been driven by earnings and have struggled when stock movements have been largely dictated by macroeconomic data. As investors recognize that the U.S. economy, though healthy, may not be imminently accelerating, capital likely may rotate back toward a growth leadership. In that environment, the scarcity premium of companies with secular growth, which has been out of favor since the election, may again be a key factor driving stock prices. Many high-quality companies
with superior earnings growth have been left behind in the postelection market rally. For example, the fastest-growing companies within the software industry, with excellent future prospects, were among the biggest laggards in 2016. These types of companies potentially are like beach balls being held underwater; once the macro pressures ease up, they float back to the top. We remain upbeat about the Fund’s portfolio as it has what we view as an attractive combination: durable fundamentals, reasonable valuations, and the ability to potentially grow earnings through various economic scenarios. This could be a favorable set-up going into 2017.
Please see footnotes on page 5.
| | | | |
| 8 | | Wells Fargo VT Discovery Fund | | Fund expenses (unaudited) |
As a shareholder of the Fund, you incur ongoing costs, including management fees, distribution (12b-1) fees, and other Fund expenses. This example is intended to help you understand your ongoing costs (in dollars) of investing in the Fund and to compare these costs with the ongoing costs of investing in other mutual funds.
The example is based on an investment of $1,000 invested at the beginning of the six-month period and held for the entire period from July 1, 2016 to December 31, 2016.
Actual expenses
The “Actual” line of the table below provides information about actual account values and actual expenses. You may use the information in this line, together with the amount you invested, to estimate the expenses that you paid over the period. Simply divide your account value by $1,000 (for example, an $8,600 account value divided by $1,000 = 8.6), then multiply the result by the number in the “Actual” line under the heading entitled “Expenses Paid During Period” for your applicable class of shares to estimate the expenses you paid on your account during this period.
Hypothetical example for comparison purposes
The “Hypothetical” line of the table below provides information about hypothetical account values and hypothetical expenses based on the Fund’s actual expense ratio and an assumed rate of return of 5% per year before expenses, which is not the Fund’s actual return. The hypothetical account values and expenses may not be used to estimate the actual ending account balance or expenses you paid for the period. You may use this information to compare the ongoing costs of investing in the Fund and other funds. To do so, compare this 5% hypothetical example with the 5% hypothetical examples that appear in the shareholder reports of the other funds.
Please note that the expenses shown in the table are meant to highlight your ongoing costs only and do not reflect any separate account charges assessed by participating insurance companies. Therefore, the “Hypothetical” line of the table is useful in comparing ongoing costs only, and will not help you determine the relative total costs of owning different funds. In addition, if these separate account charges assessed by participating insurance companies were included, your costs would have been higher.
| | | | | | | | | | | | | | | | |
| | | Beginning account value 7-1-2016 | | | Ending account value 12-31-2016 | | | Expenses paid during the period¹ | | | Annualized net expense ratio | |
Class 2 | | | | | | | | | | | | | | | | |
Actual | | $ | 1,000.00 | | | $ | 1,067.42 | | | $ | 5.98 | | | | 1.15 | % |
Hypothetical (5% return before expenses) | | $ | 1,000.00 | | | $ | 1,019.36 | | | $ | 5.84 | | | | 1.15 | % |
| 1 | Expenses paid is equal to the annualized net expense ratio multiplied by the average account value over the period, multiplied by the number of days in the most recent fiscal half-year divided by the number of days in the fiscal year (to reflect the one-half year period). |
| | | | | | |
| Portfolio of investments—December 31, 2016 | | Wells Fargo VT Discovery Fund | | | 9 | |
| | | | | | | | | | | | | | | | |
| Security name | | | | | | | | Shares | | | Value | |
| | | | |
Common Stocks: 97.13% | | | | | | | | | | | | | | | | |
| | | | |
Consumer Discretionary: 15.43% | | | | | | | | | | | | | | | | |
| | | | |
| Automobiles: 1.39% | | | | | | | | | | | | | | | | |
Thor Industries Incorporated | | | | | | | | | | | 16,700 | | | $ | 1,670,835 | |
| | | | | | | | | | | | | | | | |
| | | | |
| Distributors: 1.31% | | | | | | | | | | | | | | | | |
Pool Corporation | | | | | | | | | | | 15,100 | | | | 1,575,534 | |
| | | | | | | | | | | | | | | | |
| | | | |
| Diversified Consumer Services: 1.82% | | | | | | | | | | | | | | | | |
Bright Horizons Family Solutions Incorporated † | | | | | | | | | | | 31,100 | | | | 2,177,622 | |
| | | | | | | | | | | | | | | | |
| | | | |
| Hotels, Restaurants & Leisure: 7.17% | | | | | | | | | | | | | | | | |
Aramark Corporation | | | | | | | | | | | 54,416 | | | | 1,943,740 | |
Dave & Buster’s Entertainment Incorporated † | | | | | | | | | | | 27,651 | | | | 1,556,751 | |
Six Flags Entertainment Corporation | | | | | | | | | | | 33,892 | | | | 2,032,164 | |
Vail Resorts Incorporated | | | | | | | | | | | 11,800 | | | | 1,903,458 | |
Wingstop Incorporated « | | | | | | | | | | | 39,085 | | | | 1,156,525 | |
| | | | |
| | | | | | | | | | | | | | | 8,592,638 | |
| | | | | | | | | | | | | | | | |
| | | | |
| Media: 1.59% | | | | | | | | | | | | | | | | |
Cinemark Holdings Incorporated | | | | | | | | | | | 49,774 | | | | 1,909,331 | |
| | | | | | | | | | | | | | | | |
| | | | |
| Specialty Retail: 1.45% | | | | | | | | | | | | | | | | |
Burlington Stores Incorporated † | | | | | | | | | | | 20,516 | | | | 1,738,731 | |
| | | | | | | | | | | | | | | | |
| | | | |
| Textiles, Apparel & Luxury Goods: 0.70% | | | | | | | | | | | | | | | | |
Columbia Sportswear Company | | | | | | | | | | | 14,276 | | | | 832,291 | |
| | | | | | | | | | | | | | | | |
| | | | |
Consumer Staples: 1.86% | | | | | | | | | | | | | | | | |
| | | | |
| Beverages: 1.17% | | | | | | | | | | | | | | | | |
Constellation Brands Incorporated Class A | | | | | | | | | | | 9,200 | | | | 1,410,452 | |
| | | | | | | | | | | | | | | | |
| | | | |
| Food Products: 0.69% | | | | | | | | | | | | | | | | |
TreeHouse Foods Incorporated † | | | | | | | | | | | 11,400 | | | | 822,966 | |
| | | | | | | | | | | | | | | | |
| | | | |
Energy: 0.95% | | | | | | | | | | | | | | | | |
| | | | |
| Oil, Gas & Consumable Fuels: 0.95% | | | | | | | | | | | | | | | | |
Diamondback Energy Incorporated † | | | | | | | | | | | 11,300 | | | | 1,141,978 | |
| | | | | | | | | | | | | | | | |
| | | | |
Financials: 5.68% | | | | | | | | | | | | | | | | |
| | | | |
| Capital Markets: 3.67% | | | | | | | | | | | | | | | | |
Evercore Partners Incorporated Class A | | | | | | | | | | | 19,700 | | | | 1,353,390 | |
Raymond James Financial Incorporated | | | | | | | | | | | 16,700 | | | | 1,156,809 | |
SEI Investments Company | | | | | | | | | | | 38,400 | | | | 1,895,424 | |
| | | | |
| | | | | | | | | | | | | | | 4,405,623 | |
| | | | | | | | | | | | | | | | |
| | | | |
| Consumer Finance: 1.28% | | | | | | | | | | | | | | | | |
SLM Corporation † | | | | | | | | | | | 138,900 | | | | 1,530,678 | |
| | | | | | | | | | | | | | | | |
The accompanying notes are an integral part of these financial statements.
| | | | |
| 10 | | Wells Fargo VT Discovery Fund | | Portfolio of investments—December 31, 2016 |
| | | | | | | | | | | | | | | | |
| Security name | | | | | | | | Shares | | | Value | |
| | | | |
| Thrifts & Mortgage Finance: 0.73% | | | | | | | | | | | | | | | | |
LendingTree Incorporated †« | | | | | | | | | | | 600 | | | $ | 60,810 | |
Radian Group Incorporated | | | | | | | | | | | 45,100 | | | | 810,898 | |
| | | | |
| | | | | | | | | | | | | | | 871,708 | |
| | | | | | | | | | | | | | | | |
| | | | |
Health Care: 15.36% | | | | | | | | | | | | | | | | |
| | | | |
| Biotechnology: 1.66% | | | | | | | | | | | | | | | | |
bluebird bio Incorporated †« | | | | | | | | | | | 9,200 | | | | 567,640 | |
Ligand Pharmaceuticals Incorporated †« | | | | | | | | | | | 9,921 | | | | 1,008,073 | |
Prothena Corporation plc †« | | | | | | | | | | | 8,441 | | | | 415,213 | |
| | | | |
| | | | | | | | | | | | | | | 1,990,926 | |
| | | | | | | | | | | | | | | | |
| | | | |
| Health Care Equipment & Supplies: 4.73% | | | | | | | | | | | | | | | | |
Cantel Medical Corporation | | | | | | | | | | | 18,358 | | | | 1,445,693 | |
DexCom Incorporated † | | | | | | | | | | | 21,763 | | | | 1,299,251 | |
ICU Medical Incorporated † | | | | | | | | | | | 4,000 | | | | 589,400 | |
Integra LifeSciences Holdings Corporation † | | | | | | | | | | | 27,200 | | | | 2,333,488 | |
| | | | |
| | | | | | | | | | | | | | | 5,667,832 | |
| | | | | | | | | | | | | | | | |
| | | | |
| Health Care Providers & Services: 5.88% | | | | | | | | | | | | | | | | |
Amedisys Incorporated † | | | | | | | | | | | 31,822 | | | | 1,356,572 | |
HealthEquity Incorporated † | | | | | | | | | | | 17,440 | | | | 706,669 | |
Healthways Incorporated † | | | | | | | | | | | 53,729 | | | | 1,222,335 | |
Surgical Care Affiliates Incorporated † | | | | | | | | | | | 32,095 | | | | 1,485,036 | |
VCA Incorporated † | | | | | | | | | | | 33,200 | | | | 2,279,180 | |
| | | | |
| | | | | | | | | | | | | | | 7,049,792 | |
| | | | | | | | | | | | | | | | |
| | | | |
| Life Sciences Tools & Services: 2.55% | | | | | | | | | | | | | | | | |
Cambrex Corporation † | | | | | | | | | | | 33,534 | | | | 1,809,159 | |
VWR Corporation † | | | | | | | | | | | 49,916 | | | | 1,249,397 | |
| | | | |
| | | | | | | | | | | | | | | 3,058,556 | |
| | | | | | | | | | | | | | | | |
| | | | |
| Pharmaceuticals: 0.54% | | | | | | | | | | | | | | | | |
The Medicines Company †« | | | | | | | | | | | 19,200 | | | | 651,648 | |
| | | | | | | | | | | | | | | | |
| | | | |
Industrials: 20.99% | | | | | | | | | | | | | | | | |
| | | | |
| Aerospace & Defense: 1.16% | | | | | | | | | | | | | | | | |
Orbital ATK Incorporated | | | | | | | | | | | 15,900 | | | | 1,394,907 | |
| | | | | | | | | | | | | | | | |
| | | | |
| Airlines: 1.82% | | | | | | | | | | | | | | | | |
Spirit Airlines Incorporated † | | | | | | | | | | | 37,600 | | | | 2,175,536 | |
| | | | | | | | | | | | | | | | |
| | | | |
| Building Products: 4.80% | | | | | | | | | | | | | | | | |
A.O. Smith Corporation | | | | | | | | | | | 34,400 | | | | 1,628,840 | |
Allegion plc | | | | | | | | | | | 35,600 | | | | 2,278,400 | |
Masonite International Corporation † | | | | | | | | | | | 28,100 | | | | 1,848,980 | |
| | | | |
| | | | | | | | | | | | | | | 5,756,220 | |
| | | | | | | | | | | | | | | | |
The accompanying notes are an integral part of these financial statements.
| | | | | | |
| Portfolio of investments—December 31, 2016 | | Wells Fargo VT Discovery Fund | | | 11 | |
| | | | | | | | | | | | | | | | |
| Security name | | | | | | | | Shares | | | Value | |
| | | | |
| Commercial Services & Supplies: 4.05% | | | | | | | | | | | | | | | | |
KAR Auction Services Incorporated | | | | | | | | | | | 44,615 | | | $ | 1,901,491 | |
Waste Connections Incorporated | | | | | | | | | | | 37,529 | | | | 2,949,404 | |
| | | | |
| | | | | | | | | | | | | | | 4,850,895 | |
| | | | | | | | | | | | | | | | |
| | | | |
| Electrical Equipment: 1.04% | | | | | | | | | | | | | | | | |
Acuity Brands Incorporated | | | | | | | | | | | 5,419 | | | | 1,251,030 | |
| | | | | | | | | | | | | | | | |
| | | | |
| Industrial Conglomerates: 1.06% | | | | | | | | | | | | | | | | |
Carlisle Companies Incorporated | | | | | | | | | | | 11,557 | | | | 1,274,622 | |
| | | | | | | | | | | | | | | | |
| | | | |
| Machinery: 1.97% | | | | | | | | | | | | | | | | |
Energy Recovery Incorporated †« | | | | | | | | | | | 42,201 | | | | 436,780 | |
John Bean Technologies Corporation | | | | | | | | | | | 22,414 | | | | 1,926,483 | |
| | | | |
| | | | | | | | | | | | | | | 2,363,263 | |
| | | | | | | | | | | | | | | | |
| | | | |
| Professional Services: 1.39% | | | | | | | | | | | | | | | | |
TransUnion † | | | | | | | | | | | 53,750 | | | | 1,662,488 | |
| | | | | | | | | | | | | | | | |
| | | | |
| Road & Rail: 1.02% | | | | | | | | | | | | | | | | |
Kansas City Southern | | | | | | | | | | | 14,400 | | | | 1,221,840 | |
| | | | | | | | | | | | | | | | |
| | | | |
| Trading Companies & Distributors: 2.68% | | | | | | | | | | | | | | | | |
HD Supply Holdings Incorporated † | | | | | | | | | | | 61,939 | | | | 2,633,027 | |
Univar Incorporated † | | | | | | | | | | | 20,500 | | | | 581,585 | |
| | | | |
| | | | | | | | | | | | | | | 3,214,612 | |
| | | | | | | | | | | | | | | | |
| | | | |
Information Technology: 29.64% | | | | | | | | | | | | | | | | |
| | | | |
| Communications Equipment: 2.36% | | | | | | | | | | | | | | | | |
Finisar Corporation † | | | | | | | | | | | 40,416 | | | | 1,223,392 | |
Harris Corporation | | | | | | | | | | | 15,700 | | | | 1,608,779 | |
| | | | |
| | | | | | | | | | | | | | | 2,832,171 | |
| | | | | | | | | | | | | | | | |
| | | | |
| Electronic Equipment, Instruments & Components: 5.00% | | | | | | | | | | | | | | | | |
Cognex Corporation | | | | | | | | | | | 21,376 | | | | 1,359,941 | |
FLIR Systems Incorporated | | | | | | | | | | | 41,000 | | | | 1,483,790 | |
Littelfuse Incorporated | | | | | | | | | | | 12,057 | | | | 1,829,891 | |
Universal Display Corporation † | | | | | | | | | | | 23,500 | | | | 1,323,050 | |
| | | | |
| | | | | | | | | | | | | | | 5,996,672 | |
| | | | | | | | | | | | | | | | |
| | | | |
| Internet Software & Services: 5.60% | | | | | | | | | | | | | | | | |
CoStar Group Incorporated † | | | | | | | | | | | 9,919 | | | | 1,869,632 | |
MercadoLibre Incorporated | | | | | | | | | | | 9,960 | | | | 1,555,154 | |
Q2 Holdings Incorporated † | | | | | | | | | | | 51,800 | | | | 1,494,430 | |
Shopify Incorporated Class A † | | | | | | | | | | | 19,100 | | | | 818,817 | |
Yandex NV Class A † | | | | | | | | | | | 48,500 | | | | 976,305 | |
| | | | |
| | | | | | | | | | | | | | | 6,714,338 | |
| | | | | | | | | | | | | | | | |
The accompanying notes are an integral part of these financial statements.
| | | | |
| 12 | | Wells Fargo VT Discovery Fund | | Portfolio of investments—December 31, 2016 |
| | | | | | | | | | | | | | | | |
| Security name | | | | | | | | Shares | | | Value | |
| | | | |
| IT Services: 8.70% | | | | | | | | | | | | | | | | |
Acxiom Corporation † | | | | | | | | | | | 64,342 | | | $ | 1,724,366 | |
EPAM Systems Incorporated † | | | | | | | | | | | 27,519 | | | | 1,769,747 | |
Euronet Worldwide Incorporated † | | | | | | | | | | | 21,893 | | | | 1,585,710 | |
Gartner Incorporated † | | | | | | | | | | | 11,324 | | | | 1,144,517 | |
Total System Services Incorporated | | | | | | | | | | | 37,700 | | | | 1,848,431 | |
WEX Incorporated † | | | | | | | | | | | 21,100 | | | | 2,354,760 | |
| | | | |
| | | | | | | | | | | | | | | 10,427,531 | |
| | | | | | | | | | | | | | | | |
| | | | |
| Software: 7.44% | | | | | | | | | | | | | | | | |
Ellie Mae Incorporated † | | | | | | | | | | | 12,748 | | | | 1,066,753 | |
Guidewire Software Incorporated † | | | | | | | | | | | 37,291 | | | | 1,839,565 | |
PTC Incorporated † | | | | | | | | | | | 33,300 | | | | 1,540,791 | |
Secureworks Corporation Class A † | | | | | | | | | | | 23,175 | | | | 245,423 | |
Take-Two Interactive Software Incorporated † | | | | | | | | | | | 42,200 | | | | 2,080,038 | |
Ultimate Software Group Incorporated † | | | | | | | | | | | 11,800 | | | | 2,151,730 | |
| | | | |
| | | | | | | | | | | | | | | 8,924,300 | |
| | | | | | | | | | | | | | | | |
| | | | |
| Technology Hardware, Storage & Peripherals: 0.54% | | | | | | | | | | | | | | | | |
3D Systems Corporation †« | | | | | | | | | | | 48,700 | | | | 647,223 | |
| | | | | | | | | | | | | | | | |
| | | | |
Materials: 3.90% | | | | | | | | | | | | | | | | |
| | | | |
| Chemicals: 0.58% | | | | | | | | | | | | | | | | |
Albemarle Corporation | | | | | | | | | | | 8,100 | | | | 697,248 | |
| | | | | | | | | | | | | | | | |
| | | | |
| Construction Materials: 1.30% | | | | | | | | | | | | | | | | |
Vulcan Materials Company | | | | | | | | | | | 12,400 | | | | 1,551,860 | |
| | | | | | | | | | | | | | | | |
| | | | |
| Containers & Packaging: 2.02% | | | | | | | | | | | | | | | | |
Berry Plastics Group Incorporated † | | | | | | | | | | | 49,800 | | | | 2,426,754 | |
| | | | | | | | | | | | | | | | |
| | | | |
Real Estate: 1.28% | | | | | | | | | | | | | | | | |
| | | | |
| Real Estate Management & Development: 1.28% | | | | | | | | | | | | | | | | |
CBRE Group Incorporated Class A † | | | | | | | | | | | 48,900 | | | | 1,539,861 | |
| | | | | | | | | | | | | | | | |
| | | | |
Telecommunication Services: 2.04% | | | | | | | | | | | | | | | | |
| | | | |
| Diversified Telecommunication Services: 2.04% | | | | | | | | | | | | | | | | |
Zayo Group Holdings Incorporated † | | | | | | | | | | | 74,512 | | | | 2,448,463 | |
| | | | | | | | | | | | | | | | |
| | | | |
Total Common Stocks (Cost $102,430,289) | | | | | | | | | | | | | | | 116,470,975 | |
| | | | | | | | | | | | | | | | |
| | | | |
| | | Yield | | | | | | | | | | |
| Short-Term Investments: 6.69% | | | | | | | | | | | | | | | | |
| | | | |
| Investment Companies: 6.69% | | | | | | | | | | | | | | | | |
Securities Lending Cash Investment LLC (l)(r)(u) | | | 0.83 | % | | | | | | | 4,994,580 | | | | 4,995,080 | |
Wells Fargo Government Money Market Fund Select Class (l)(u) | | | 0.43 | | | | | | | | 3,032,149 | | | | 3,032,149 | |
| | | | |
Total Short-Term Investments (Cost $8,026,969) | | | | | | | | | | | | | | | 8,027,229 | |
| | | | | | | | | | | | | | | | |
| | | | | | | | |
| Total investments in securities (Cost $110,457,258) * | | | 103.82 | % | | | 124,498,204 | |
Other assets and liabilities, net | | | (3.82 | ) | | | (4,578,732 | ) |
| | | | | | | | |
| Total net assets | | | 100.00 | % | | $ | 119,919,472 | |
| | | | | | | | |
The accompanying notes are an integral part of these financial statements.
| | | | | | |
| Portfolio of investments—December 31, 2016 | | Wells Fargo VT Discovery Fund | | | 13 | |
| † | Non-income-earning security |
| « | All or a portion of this security is on loan. |
| (l) | The issuer of the security is an affiliated person of the Fund as defined in the Investment Company Act of 1940. |
| (r) | The investment is a non-registered investment vehicle purchased with cash collateral received from securities on loan. |
| (u) | The rate represents the 7-day annualized yield at period end. |
| * | Cost for federal income tax purposes is $110,625,631 and unrealized gains (losses) consists of: |
| | | | |
Gross unrealized gains | | $ | 16,733,729 | |
Gross unrealized losses | | | (2,861,156 | ) |
| | | | |
Net unrealized gains | | $ | 13,872,573 | |
The accompanying notes are an integral part of these financial statements.
| | | | |
| 14 | | Wells Fargo VT Discovery Fund | | Statement of assets and liabilities—December 31, 2016 |
| | | | |
| | | | |
| |
Assets | | | | |
Investments | | | | |
In unaffiliated securities (including $4,860,899 of securities loaned), at value (cost $102,430,289) | | $ | 116,470,975 | |
In affiliated securities, at value (cost $8,026,969) | | | 8,027,229 | |
| | | | |
Total investments, at value (cost $110,457,258) | | | 124,498,204 | |
Receivable for investments sold | | | 1,463,162 | |
Receivable for Fund shares sold | | | 76,742 | |
Receivable for dividends | | | 55,748 | |
Receivable for securities lending income | | | 4,902 | |
Prepaid expenses and other assets | | | 2,872 | |
| | | | |
Total assets | | | 126,101,630 | |
| | | | |
| |
Liabilities | | | | |
Payable for investments purchased | | | 965,624 | |
Payable for Fund shares redeemed | | | 81,773 | |
Payable upon receipt of securities loaned | | | 4,994,700 | |
Management fee payable | | | 79,240 | |
Distribution fee payable | | | 27,265 | |
Administration fee payable | | | 8,725 | |
Accrued expenses and other liabilities | | | 24,831 | |
| | | | |
Total liabilities | | | 6,182,158 | |
| | | | |
Total net assets | | $ | 119,919,472 | |
| | | | |
| |
NET ASSETS CONSIST OF | | | | |
Paid-in capital | | $ | 98,957,790 | |
Accumulated net realized gains on investments | | | 6,920,736 | |
Net unrealized gains on investments | | | 14,040,946 | |
| | | | |
Total net assets | | $ | 119,919,472 | |
| | | | |
| |
COMPUTATION OF NET ASSET VALUE PER SHARE | | | | |
Net assets – Class 2 | | $ | 119,919,472 | |
Shares outstanding – Class 21 | | | 4,629,132 | |
Net asset value per share – Class 2 | | | $25.91 | |
| 1 | The Fund has an unlimited number of authorized shares. |
The accompanying notes are an integral part of these financial statements.
| | | | | | |
| Statement of operations—year ended December 31, 2016 | | Wells Fargo VT Discovery Fund | | | 15 | |
| | | | |
| | | | |
| |
Investment income | | | | |
Dividends (net of foreign withholding taxes of $1,596) | | $ | 660,287 | |
Securities lending income, net | | | 70,150 | |
Income from affiliated securities | | | 6,329 | |
| | | | |
Total investment income | | | 736,766 | |
| | | | |
| |
Expenses | | | | |
Management fee | | | 882,969 | |
Administration fee | |
Class 2 | | | 94,183 | |
Distribution fee | |
Class 2 | | | 294,323 | |
Custody and accounting fees | | | 26,154 | |
Professional fees | | | 36,223 | |
Shareholder report expenses | | | 30,686 | |
Trustees’ fees and expenses | | | 14,987 | |
Other fees and expenses | | | 4,537 | |
| | | | |
Total expenses | | | 1,384,062 | |
Less: Fee waivers and/or expense reimbursements | | | (30,176 | ) |
| | | | |
Net expenses | | | 1,353,886 | |
| | | | |
Net investment loss | | | (617,120 | ) |
| | | | |
| |
REALIZED AND UNREALIZED GAINS (LOSSES) ON INVESTMENTS | | | | |
|
Net realized gains on: | |
Unaffiliated securities | | | 6,984,074 | |
Affiliated securities | | | 120 | |
| | | | |
Net realized gains on investments | | | 6,984,194 | |
| | | | |
|
Net change in unrealized gains (losses) on: | |
Unaffiliated securities | | | 1,943,225 | |
Affiliated securities | | | 260 | |
| | | | |
Net change in unrealized gains (losses) on investments | | | 1,943,485 | |
| | | | |
Net realized and unrealized gains (losses) on investments | | | 8,927,679 | |
| | | | |
Net increase in net assets resulting from operations | | $ | 8,310,559 | |
| | | | |
The accompanying notes are an integral part of these financial statements.
| | | | |
| 16 | | Wells Fargo VT Discovery Fund | | Statement of changes in net assets |
| | | | | | | | | | | | | | | | |
| | | Year ended
December 31, 2016 | | | Year ended
December 31, 2015 | |
| |
Operations | | | | | |
Net investment loss | | | | | | $ | (617,120 | ) | | | | | | $ | (1,004,481 | ) |
Net realized gains on investments | | | | | | | 6,984,194 | | | | | | | | 9,025,317 | |
Net change in unrealized gains (losses) on investments | | | | | | | 1,943,485 | | | | | | | | (9,495,134 | ) |
| | | | |
Net increase (decrease) in net assets resulting from operations | | | | | | | 8,310,559 | | | | | | | | (1,474,298 | ) |
| | | | |
| |
Distributions to shareholders from | | | | | |
Net realized gains – Class 2 | | | | | | | (8,810,379 | ) | | | | | | | (20,334,034 | ) |
| | | | |
| | | | |
Capital share transactions | | | Shares | | | | | | | | Shares | | | | | |
Proceeds from shares sold – Class 2 | | | 326,229 | | | | 8,069,688 | | | | 505,503 | | | | 14,950,495 | |
Reinvestment of distributions – Class 2 | | | 361,229 | | | | 8,810,379 | | | | 708,256 | | | | 20,334,034 | |
Payment for shares redeemed – Class 2 | | | (938,572 | ) | | | (23,299,476 | ) | | | (843,307 | ) | | | (25,127,064 | ) |
| | | | |
Net increase (decrease) in net assets resulting from capital share transactions | | | | | | | (6,419,409 | ) | | | | | | | 10,157,465 | |
| | | | |
Total decrease in net assets | | | | | | | (6,919,229 | ) | | | | | | | (11,650,867 | ) |
| | | | |
| | |
Net assets | | | | | | | | |
Beginning of period | | | | | | | 126,838,701 | | | | | | | | 138,489,568 | |
| | | | |
End of period | | | | | | $ | 119,919,472 | | | | | | | $ | 126,838,701 | |
| | | | |
Undistributed net investment income | | | | | | $ | 0 | | | | | | | $ | 0 | |
| | | | |
The accompanying notes are an integral part of these financial statements.
| | | | | | |
| Financial highlights | | Wells Fargo VT Discovery Fund | | | 17 | |
(For a share outstanding throughout each period)
| | | | | | | | | | | | | | | | | | | | |
| | | Year ended December 31 | |
| CLASS 2 | | 2016 | | | 2015 | | | 2014 | | | 2013 | | | 2012 | |
Net asset value, beginning of period | | | $25.99 | | | | $30.71 | | | | $35.20 | | | | $25.16 | | | | $21.37 | |
Net investment loss | | | (0.13 | ) | | | (0.21 | ) | | | (0.22 | ) | | | (0.17 | ) | | | (0.01 | ) |
Net realized and unrealized gains (losses) on investments | | | 2.00 | | | | 0.21 | | | | 0.16 | | | | 11.06 | | | | 3.80 | |
| | | | | | | | | | | | | | | | | | | | |
Total from investment operations | | | 1.87 | | | | 0.00 | | | | (0.06 | ) | | | 10.89 | | | | 3.79 | |
Distributions to shareholders from | | | | | | | | | | | | | | | | | | | | |
Net investment income | | | 0.00 | | | | 0.00 | | | | 0.00 | | | | (0.00 | )1 | | | 0.00 | |
Net realized gains | | | (1.95 | ) | | | (4.72 | ) | | | (4.43 | ) | | | (0.85 | ) | | | 0.00 | |
| | | | | | | | | | | | | | | | | | | | |
Total distributions to shareholders | | | (1.95 | ) | | | (4.72 | ) | | | (4.43 | ) | | | (0.85 | ) | | | 0.00 | |
Net asset value, end of period | | | $25.91 | | | | $25.99 | | | | $30.71 | | | | $35.20 | | | | $25.16 | |
Total return | | | 7.65 | % | | | (1.46 | )% | | | 0.36 | % | | | 43.80 | % | | | 17.74 | % |
Ratios to average net assets (annualized) | | | | | | | | | | | | | | | | | | | | |
Gross expenses | | | 1.18 | % | | | 1.17 | % | | | 1.14 | % | | | 1.16 | % | | | 1.21 | % |
Net expenses | | | 1.15 | % | | | 1.15 | % | | | 1.14 | % | | | 1.15 | % | | | 1.15 | % |
Net investment loss | | | (0.52 | )% | | | (0.72 | )% | | | (0.68 | )% | | | (0.56 | )% | | | (0.03 | )% |
Supplemental data | | | | | | | | | | | | | | | | | | | | |
Portfolio turnover rate | | | 85 | % | | | 90 | % | | | 79 | % | | | 88 | % | | | 98 | % |
Net assets, end of period (000s omitted) | | | $119,919 | | | | $126,839 | | | | $138,490 | | | | $158,451 | | | | $111,458 | |
| 1 | Amount is less than $0.005. |
The accompanying notes are an integral part of these financial statements.
| | | | |
| 18 | | Wells Fargo VT Discovery Fund | | Notes to financial statements |
1. ORGANIZATION
Wells Fargo Variable Trust (the “Trust”), a Delaware statutory trust organized on March 10, 1999, is an open-end management investment company registered under the Investment Company Act of 1940, as amended (the “1940 Act”). As an investment company, the Trust follows the accounting and reporting guidance in Financial Accounting Standards Board (“FASB”) Accounting Standards Codification Topic 946, Financial Services – Investment Companies. These financial statements report on the Wells Fargo VT Discovery Fund (the “Fund”) which is a diversified series of the Trust.
2. SIGNIFICANT ACCOUNTING POLICIES
The following significant accounting policies, which are consistently followed in the preparation of the financial statements of the Fund, are in conformity with U.S. generally accepted accounting principles which require management to make estimates and assumptions that affect the reported amounts of assets and liabilities, disclosure of contingent assets and liabilities at the date of the financial statements, and the reported amounts of revenues and expenses during the reporting period. Actual results could differ from those estimates.
Securities valuation
All investments are valued each business day as of the close of regular trading on the New York Stock Exchange (generally 4 p.m. Eastern Time), although the Fund may deviate from this calculation time under unusual or unexpected circumstances.
Equity securities that are listed on a foreign or domestic exchange or market are valued at the official closing price or, if none, the last sales price. If no sale occurs on the principal exchange or market that day, the prior day’s price will be deemed “stale” and a fair value price will be determined in accordance with the Fund’s Valuation Procedures.
Investments in registered open-end investment companies are valued at net asset value. Interests in non-registered investment vehicles that are redeemable at net asset value are fair valued normally at net asset value.
Investments which are not valued using any of the methods discussed above are valued at their fair value, as determined in good faith by the Board of Trustees of the Fund. The Board of Trustees has established a Valuation Committee comprised of the Trustees and has delegated to it the authority to take any actions regarding the valuation of portfolio securities that the Valuation Committee deems necessary or appropriate, including determining the fair value of portfolio securities, unless the determination has been delegated to the Management Valuation Team of Wells Fargo Funds Management, LLC (“Funds Management”). The Board of Trustees retains the authority to make or ratify any valuation decisions or approve any changes to the Valuation Procedures as it deems appropriate. On a quarterly basis, the Board of Trustees receives reports on any valuation actions taken by the Valuation Committee or the Management Valuation Team which may include items for ratification.
Valuations of fair valued securities are compared to the next actual sales price when available, or other appropriate market values, to assess the continued appropriateness of the fair valuation methodologies used. These securities are fair valued on a day-to-day basis, taking into consideration changes to appropriate market information and any significant changes to the inputs considered in the valuation process until there is a readily available price provided on an exchange or by an independent pricing service. Valuations received from an independent pricing service or independent broker-dealer quotes are periodically validated by comparisons to most recent trades and valuations provided by other independent pricing services in addition to the review of prices by the manager and/or subadviser. Unobservable inputs used in determining fair valuations are identified based on the type of security, taking into consideration factors utilized by market participants in valuing the investment, knowledge about the issuer and the current market environment.
Security loans
The Fund may lend its securities from time to time in order to earn additional income in the form of fees or interest on securities received as collateral or the investment of any cash received as collateral. The Fund continues to receive interest or dividends on the securities loaned. The Fund receives collateral in the form of cash or securities with a value at least equal to the value of the securities on loan. The value of the loaned securities is determined at the close of each business day and any additional required collateral is delivered to the Fund on the next business day. In a securities lending transaction, the net asset value of the Fund will be affected by an increase or decrease in the value of the securities loaned and by an increase or decrease in the value of the instrument in which collateral is invested. The amount of securities lending activity undertaken by the Fund fluctuates from time to time. In the event of default or bankruptcy by the borrower, the Fund may be prevented from recovering the loaned securities or gaining access to the collateral or may experience delays or costs in doing so. In addition, the investment of any cash collateral received may lose all or part of its value. The Fund has the right under the lending agreement to recover the securities from the borrower on demand.
| | | | | | |
| Notes to financial statements | | Wells Fargo VT Discovery Fund | | | 19 | |
The Fund lends its securities through an unaffiliated securities lending agent. Cash collateral received in connection with its securities lending transactions is invested in Securities Lending Cash Investments, LLC (the “Securities Lending Fund”). The Securities Lending Fund is exempt from registration under Section 3(c)(7) of the 1940 Act and is managed by Funds Management and is subadvised by Wells Capital Management Incorporated (“WellsCap”), an affiliate of Funds Management and an indirect wholly owned subsidiary of Wells Fargo & Company (“Wells Fargo”). Funds Management receives an advisory fee starting at 0.05% and declining to 0.01% as the average daily net assets of the Securities Lending Fund increase. All of the fees received by Funds Management are paid to WellsCap for its services as subadviser. The Securities Lending Fund seeks to provide a positive return compared to the daily Fed Funds Open Rate by investing in high-quality, U.S. dollar-denominated short-term money market instruments. Securities Lending Fund investments are valued at the evaluated bid price provided by an independent pricing service. Income earned from investment in the Securities Lending Fund is included in securities lending income on the Statement of Operations.
Security transactions and income recognition
Securities transactions are recorded on a trade date basis. Realized gains or losses are recorded on the basis of identified cost.
Dividend income is recognized on the ex-dividend date. Dividend income is recorded net of foreign taxes withheld where recovery of such taxes is not assured.
Distributions to shareholders
Distributions to shareholders from net investment income and net realized gains, if any, are recorded on the ex-dividend date. Such distributions are determined in conformity with federal income tax regulations, which may differ in amount or character from net investment income and realized gains recognized for purposes of U.S. generally accepted accounting principles.
Federal and other taxes
The Fund intends to continue to qualify as a regulated investment company by distributing substantially all of its investment company taxable income and any net realized capital gains (after reduction for capital loss carryforwards) sufficient to relieve it from all, or substantially all, federal income taxes. Accordingly, no provision for federal income taxes was required.
The Fund’s income and federal excise tax returns and all financial records supporting those returns for the prior three fiscal years are subject to examination by the federal and Delaware revenue authorities. Management has analyzed the Fund’s tax positions taken on federal, state, and foreign tax returns for all open tax years and does not believe that there are any uncertain tax positions that require recognition of a tax liability.
Reclassifications are made to the Fund’s capital accounts for permanent tax differences to reflect income and gains available for distribution (or available capital loss carryforwards) under federal income tax regulations. U.S. generally accepted accounting principles require that certain components of net assets be adjusted to reflect permanent differences between financial and tax reporting. These reclassifications have no effect on net assets or net asset values per share. The primary permanent difference causing such reclassifications is due to net operating losses. At December 31, 2016, as a result of permanent book-to-tax differences, the following reclassification adjustments were made on the Statement of Assets and Liabilities:
| | |
| Paid-in capital | | Accumulated net investment loss |
$(617,120) | | $617,120 |
3. FAIR VALUATION MEASUREMENTS
Fair value measurements of investments are determined within a framework that has established a fair value hierarchy based upon the various data inputs utilized in determining the value of the Fund’s investments. The three-level hierarchy gives the highest priority to unadjusted quoted prices in active markets for identical assets or liabilities (Level 1) and the lowest priority to significant unobservable inputs (Level 3). The Fund’s investments are classified within the fair value hierarchy based on the lowest level of input that is significant to the fair value measurement. The inputs are summarized into three broad levels as follows:
| | | | |
| 20 | | Wells Fargo VT Discovery Fund | | Notes to financial statements |
| ∎ | | Level 1 – quoted prices in active markets for identical securities |
| ∎ | | Level 2 – other significant observable inputs (including quoted prices for similar securities, interest rates, prepayment speeds, credit risk, use of amortized cost, etc.) |
| ∎ | | Level 3 – significant unobservable inputs (including the Fund’s own assumptions in determining the fair value of investments) |
The inputs or methodologies used for valuing investments in securities are not necessarily an indication of the risk associated with investing in those securities.
The following is a summary of the inputs used in valuing the Fund’s assets and liabilities as of December 31, 2016:
| | | | | | | | | | | | | | | | |
| | | Quoted prices (Level 1) | | | Other significant observable inputs (Level 2) | | | Significant unobservable inputs (Level 3) | | | Total | |
Assets | | | | | | | | | | | | | | | | |
Investments in: | | | | | | | | | | | | | | | | |
| | | | |
Common stocks | | | | | | | | | | | | | | | | |
Consumer discretionary | | $ | 18,496,982 | | | $ | 0 | | | $ | 0 | | | $ | 18,496,982 | |
Consumer staples | | | 2,233,418 | | | | 0 | | | | 0 | | | | 2,233,418 | |
Energy | | | 1,141,978 | | | | 0 | | | | 0 | | | | 1,141,978 | |
Financials | | | 6,808,009 | | | | 0 | | | | 0 | | | | 6,808,009 | |
Health care | | | 18,418,754 | | | | 0 | | | | 0 | | | | 18,418,754 | |
Industrials | | | 25,165,413 | | | | 0 | | | | 0 | | | | 25,165,413 | |
Information technology | | | 35,542,235 | | | | 0 | | | | 0 | | | | 35,542,235 | |
Materials | | | 4,675,862 | | | | 0 | | | | 0 | | | | 4,675,862 | |
Real estate | | | 1,539,861 | | | | 0 | | | | 0 | | | | 1,539,861 | |
Telecommunication services | | | 2,448,463 | | | | 0 | | | | 0 | | | | 2,448,463 | |
| | | | |
Short-term investments | | | | | | | | | | | | | | | | |
Investment companies | | | 3,032,149 | | | | 0 | | | | 0 | | | | 3,032,149 | |
Investments measured at net asset value* | | | | | | | | | | | | | | | 4,995,080 | |
Total assets | | $ | 119,503,124 | | | $ | 0 | | | $ | 0 | | | $ | 124,498,204 | |
| * | Investments that are measured at fair value using the net asset value per share (or its equivalent) as a practical expedient have not been categorized in the fair value hierarchy. The fair value amount presented in the table is intended to permit reconciliation of the fair value hierarchy to the amounts presented in the Statement of Assets and Liabilities. The Fund’s investment in Securities Lending Cash Investments, LLC valued at $4,995,080 does not have a redemption period notice, can be redeemed daily and does not have any unfunded commitments. |
The Fund recognizes transfers between levels within the fair value hierarchy at the end of the reporting period. At December 31, 2016, the Fund did not have any transfers into/out of Level 1, Level 2, or Level 3.
4. TRANSACTIONS WITH AFFILIATES AND OTHER EXPENSES
Management fee
Funds Management, an indirect wholly owned subsidiary of Wells Fargo, is the manager of the Fund and provides advisory and fund-level administrative services under an investment management agreement. Under the investment management agreement, Funds Management is responsible for, among other services, implementing the investment objectives and strategies of the Fund, supervising the subadviser, providing fund-level administrative services in connection with the Fund’s operations, and providing any other fund-level administrative services reasonably necessary for the operation of the Fund. As compensation for its services under the investment management agreement, Funds Management is entitled to receive an annual management fee starting at 0.75% and declining to 0.58% as the average daily net assets of the Fund increase. For the year ended December 31, 2016, the management fee was equivalent to an annual rate of 0.75% of the Fund’s average daily net assets.
Funds Management has retained the services of a subadviser to provide daily portfolio management to the Fund. The fee for subadvisory services is borne by Funds Management. WellsCap is the subadviser to the Fund and is entitled to receive a fee from Funds Management at an annual rate starting at 0.45% and declining to 0.35% as the average daily net assets of the Fund increase.
| | | | | | |
| Notes to financial statements | | Wells Fargo VT Discovery Fund | | | 21 | |
Administration fee
Under a class-level administration agreement, Funds Management provides class-level administrative services to the Fund, which includes paying fees and expenses for services provided by the transfer agent, sub-transfer agents, omnibus account servicers and record-keepers. As compensation for its services under the class-level administration agreement, Funds Management receives a class level administration fee of 0.08% which is calculated based on the average daily net assets of Class 2 shares.
Funds Management has contractually waived and/or reimbursed management and administration fees to the extent necessary to maintain certain net operating expense ratios for the Fund. Waiver of fees and/or reimbursement of expenses by Funds Management were made first from fund level expenses on a proportionate basis and then from class specific expenses. Funds Management has committed through April 30, 2017 to waive fees and/or reimburse expenses to the extent necessary to cap the Fund’s expenses at 1.15% for Class 2 shares. After this time, the cap may be increased or the commitment to maintain the cap may be terminated only with the approval of the Board of Trustees.
During the year ended December 31, 2016, State Street Bank and Trust Company, the Fund’s custodian, reimbursed the Fund $477 for certain out-of-pocket expenses that were billed to the Fund in error from 1998-2015. This amount is included in dividend income on the Statement of Operations. In addition, Funds Management was also reimbursed $2,419 for waivers/reimbursements it made to the Fund during the period the Fund was erroneously billed.
Distribution fee
The Trust has adopted a distribution plan for Class 2 shares of the Fund pursuant to Rule 12b-1 under the 1940 Act. A distribution fee is charged to Class 2 shares and paid to Wells Fargo Funds Distributor, LLC, the principal underwriter, at an annual rate of 0.25% of the average daily net assets of Class 2 shares.
5. INVESTMENT PORTFOLIO TRANSACTIONS
Purchases and sales of investments, excluding U.S. government obligations (if any) and short-term securities, for the year ended December 31, 2016 were $100,548,998 and $112,710,209, respectively.
The Fund may purchase or sell investment securities to other Wells Fargo funds under procedures adopted by the Board of Trustees. The procedures have been designed to ensure that these interfund transactions, which generally do not incur broker commissions, are effected at current market prices. Interfund trades are included within the respective purchases and sales amounts shown.
6. BANK BORROWINGS
The Trust and Wells Fargo Funds Trust (excluding the money market funds and certain other funds) are parties to a $250,000,000 revolving credit agreement whereby the Fund is permitted to use bank borrowings for temporary or emergency purposes, such as to fund shareholder redemption requests. Interest under the credit agreement is charged to the Fund based on a borrowing rate equal to the higher of the Federal Funds rate in effect on that day plus 1.25% or the overnight LIBOR rate in effect on that day plus 1.25%. In addition, an annual commitment fee equal to 0.25% of the unused balance is allocated to each participating fund. Prior to August 30, 2016, the revolving credit agreement amount was $200,000,000 and the annual commitment fee was equal to 0.20% of the unused balance which was allocated to each participating fund.
For the year ended December 31, 2016, there were no borrowings by the Fund under the agreement.
7. DISTRIBUTIONS TO SHAREHOLDERS
The tax character of distributions paid was $8,810,379 and $20,334,034 of long-term capital gain for the years ended December 31, 2016 and December 31, 2015, respectively.
As of December 31, 2016, the components of distributable earnings on a tax basis were as follows:
| | |
Undistributed long-term gain | | Unrealized gains |
| $7,089,109 | | $13,872,573 |
| | | | |
| 22 | | Wells Fargo VT Discovery Fund | | Notes to financial statements |
8. CONCENTRATION RISK
Concentration risks result from exposure to a limited number of sectors. A fund that invests a substantial portion of its assets in any sector may be more affected by changes in that sector than would be a fund whose investments are not heavily weighted in any sector.
9. INDEMNIFICATION
Under the Trust’s organizational documents, the officers and Trustees have been granted certain indemnification rights against certain liabilities that may arise out of performance of their duties to the Trust. Additionally, in the normal course of business, the Trust may enter into contracts with service providers that contain a variety of indemnification clauses. The Trust’s maximum exposure under these arrangements is dependent on future claims that may be made against the Fund and, therefore, cannot be estimated.
10. REGULATORY CHANGES
In October 2016, the Securities and Exchange Commission (“SEC”) adopted new rules and forms and amended existing rules and forms (together, “final rules”) intended to modernize and enhance the reporting and disclosure of information by registered investment companies and to enhance liquidity risk management by open-end mutual funds and exchange-traded funds. The final rules will enhance the quality of information available to investors and will allow the SEC to more effectively collect and use data reported by funds. In part, the final rules amend Regulation S-X and require standardized, enhanced disclosure about derivatives in the Fund’s financial statements, as well as other amendments. The compliance date for the amendments to Regulation S-X is August 1, 2017 while the compliance date for the new form types is June 1, 2018 and the compliance date for the liquidity risk management program requirements is December 1, 2018. Management is currently assessing the potential impact of these enhancements and their impact on the financial statement disclosures and reporting requirements.
| | | | | | |
| Report of independent registered public accounting firm | | Wells Fargo VT Discovery Fund | | | 23 | |
BOARD OF TRUSTEES AND SHAREHOLDERS OF WELLS FARGO VARIABLE TRUST:
We have audited the accompanying statement of assets and liabilities, including the portfolio of investments, of the Wells Fargo VT Discovery Fund (the “Fund”), one of the funds constituting the Wells Fargo Variable Trust, as of December 31, 2016, and the related statement of operations for the year then ended, the statements of changes in net assets for each of the years in the two-year period then ended, and the financial highlights for each of the years in the five-year period then ended. These financial statements and financial highlights are the responsibility of the Fund’s management. Our responsibility is to express an opinion on these financial statements and financial highlights based on our audits.
We conducted our audits in accordance with the standards of the Public Company Accounting Oversight Board (United States). Those standards require that we plan and perform the audit to obtain reasonable assurance about whether the financial statements and financial highlights are free of material misstatement. An audit includes examining, on a test basis, evidence supporting the amounts and disclosures in the financial statements. Our procedures included confirmation of securities owned as of December 31, 2016, by correspondence with the custodian and brokers, or by other appropriate auditing procedures. An audit also includes assessing the accounting principles used and significant estimates made by management, as well as evaluating the overall financial statement presentation. We believe that our audits provide a reasonable basis for our opinion.
In our opinion, the financial statements and financial highlights referred to above present fairly, in all material respects, the financial position of the Wells Fargo VT Discovery Fund as of December 31, 2016, the results of its operations for the year then ended, the changes in its net assets for each of the years in the two-year period then ended, and the financial highlights for each of the years in the five-year period then ended, in conformity with U.S. generally accepted accounting principles.

Boston, Massachusetts
February 23, 2017
| | | | |
| 24 | | Wells Fargo VT Discovery Fund | | Other information (unaudited) |
TAX INFORMATION
Pursuant to Section 852 of the Internal Revenue Code, $8,810,379 was designated as a 20% rate gain distribution for the fiscal year ended December 31, 2016.
PROXY VOTING INFORMATION
A description of the policies and procedures that the Fund uses to determine how to vote proxies relating to portfolio securities is available, upon request, by calling 1-800-260-5969, visiting our website at wellsfargofunds.com, or visiting the SEC website at sec.gov. Information regarding how the Fund voted proxies relating to portfolio securities during the most recent 12-month period ended June 30 is available on the Fund’s website at wellsfargofunds.com or by visiting the SEC website at sec.gov.
PORTFOLIO HOLDINGS INFORMATION
The complete portfolio holdings for the Fund are publicly available monthly on the Fund’s website (wellsfargofunds.com), on a one-month delayed basis. In addition, top ten holdings information (excluding derivative positions) for the Fund is publicly available on the Fund’s website on a monthly, seven-day or more delayed basis. The Fund files its complete schedule of portfolio holdings with the SEC for the first and third quarters of each fiscal year on Form N-Q, which is available by visiting the SEC website at sec.gov. In addition, the Fund’s Form N-Q may be reviewed and copied at the SEC’s Public Reference Room in Washington, DC, and at regional offices in New York City, at 233 Broadway, and in Chicago, at 175 West Jackson Boulevard, Suite 900. Information about the Public Reference Room may be obtained by calling 1-800-SEC-0330.
| | | | | | |
| Other information (unaudited) | | Wells Fargo VT Discovery Fund | | | 25 | |
BOARD OF TRUSTEES AND OFFICERS
Each of the Trustees and Officers1 listed in the table below acts in identical capacities for each fund in the Wells Fargo family of funds, which consists of 139 mutual funds comprising the Wells Fargo Funds Trust, Wells Fargo Variable Trust, Wells Fargo Master Trust and four closed-end funds (collectively the “Fund Complex”). This table should be read in conjunction with the Prospectus and the Statement of Additional Information2. The mailing address of each Trustee and Officer is 525 Market Street, 12th Floor, San Francisco, CA 94105. Each Trustee and Officer serves an indefinite term, however, each Trustee serves such term until reaching the mandatory retirement age established by the Trustees.
Independent Trustees
| | | | | | |
Name and year of birth | | Position held and length of service* | | Principal occupations during past five years or longer | | Current other public company or investment company directorships |
William R. Ebsworth (Born 1957) | | Trustee, since 2015 | | Retired. From 1984 to 2013, equities analyst, portfolio manager, research director and chief financial officer at Fidelity Management and Research Company in Boston, Tokyo, and Hong Kong and retired in 2013 as Chief Investment Officer of Fidelity Strategic Advisers, Inc. where he lead a team of investment professionals managing client assets. Prior thereto, Board member of Hong Kong Securities Clearing Co., Hong Kong Options Clearing Corp., the Thailand International Fund, Ltd., Fidelity Investments Life Insurance Company, and Empire Fidelity Investments Life Insurance Company. Board member of the Fonté Foundation (non-profit organization) and the Vincent Memorial Hospital Endowment (non-profit organization), where he serves on the Investment Committee and as a Chair of the Audit Committee. Mr. Ebsworth is a CFA® charterholder and an Adjunct Lecturer, Finance, at Babson College. | | Asset Allocation Trust |
Jane A. Freeman (Born 1953) | | Trustee, since 2015 | | Retired. From 2012 to 2014 and 1999 to 2008, Chief Financial Officer of Scientific Learning Corporation. From 2008 to 2012, Ms. Freeman provided consulting services related to strategic business projects. Prior to 1999, Portfolio Manager at Rockefeller & Co. and Scudder, Stevens & Clark. Board member of the Harding Loevner Funds from 1996 to 2014, serving as both Lead Independent Director and chair of the Audit Committee. Board member of the Russell Exchange Traded Funds Trust from 2011 to 2012 and the chair of the Audit Committee. Ms. Freeman is Chair of Taproot Foundation (non-profit organization), a Board Member of Ruth Bancroft Garden (non-profit organization) and an inactive chartered financial analyst. | | Asset Allocation Trust |
Peter G. Gordon** (Born 1942) | | Trustee, since 1998; Chairman, since 2005 | | Co-Founder, Retired Chairman, President and CEO of Crystal Geyser Water Company. Trustee Emeritus, Colby College. | | Asset Allocation Trust |
Isaiah Harris, Jr. (Born 1952) | | Trustee, since 2009 | | Retired. Chairman of the Board of CIGNA Corporation since 2009, and Director since 2005. From 2003 to 2011, Director of Deluxe Corporation. Prior thereto, President and CEO of BellSouth Advertising and Publishing Corp. from 2005 to 2007, President and CEO of BellSouth Enterprises from 2004 to 2005 and President of BellSouth Consumer Services from 2000 to 2003. Emeritus member of the Iowa State University Foundation Board of Governors. Emeritus Member of the Advisory Board of Iowa State University School of Business. Advisory Board Member, Palm Harbor Academy (charter school). Advisory Board Member, Child Evangelism Fellowship (non-profit). Mr. Harris is a certified public accountant (inactive status). | | CIGNA Corporation; Asset Allocation Trust |
Judith M. Johnson (Born 1949) | | Trustee, since 2008; Audit Committee Chairman, since 2008 | | Retired. Prior thereto, Chief Executive Officer and Chief Investment Officer of Minneapolis Employees Retirement Fund from 1996 to 2008. Ms. Johnson is an attorney, certified public accountant and a certified managerial accountant. | | Asset Allocation Trust |
David F. Larcker (Born 1950) | | Trustee, since 2009 | | James Irvin Miller Professor of Accounting at the Graduate School of Business, Stanford University, Director of the Corporate Governance Research Initiative and Senior Faculty of The Rock Center for Corporate Governance since 2006. From 2005 to 2008, Professor of Accounting at the Graduate School of Business, Stanford University. Prior thereto, Ernst & Young Professor of Accounting at The Wharton School, University of Pennsylvania from 1985 to 2005. | | Asset Allocation Trust |
| | | | |
| 26 | | Wells Fargo VT Discovery Fund | | Other information (unaudited) |
| | | | | | |
Name and year of birth | | Position held and length of service* | | Principal occupations during past five years or longer | | Current other public company or investment company directorships |
Olivia S. Mitchell (Born 1953) | | Trustee, since 2006 | | International Foundation of Employee Benefit Plans Professor, Wharton School of the University of Pennsylvania since 1993. Director of Wharton’s Pension Research Council and Boettner Center on Pensions & Retirement Research, and Research Associate at the National Bureau of Economic Research. Previously, Cornell University Professor from 1978 to 1993. | | Asset Allocation Trust |
Timothy J. Penny (Born 1951) | | Trustee, since 1996 | | President and Chief Executive Officer of Southern Minnesota Initiative Foundation, a non-profit organization, since 2007 and Senior Fellow at the Humphrey Institute Policy Forum at the University of Minnesota since 1995. Member of the Board of Trustees of NorthStar Education Finance, Inc., a non-profit organization, since 2007. | | Asset Allocation Trust |
Michael S. Scofield (Born 1943) | | Trustee, since 2010 | | Served on the Investment Company Institute’s Board of Governors and Executive Committee from 2008-2011 as well the Governing Council of the Independent Directors Council from 2006-2011 and the Independent Directors Council Executive Committee from 2008-2011. Chairman of the IDC from 2008-2010. Institutional Investor (Fund Directions) Trustee of Year in 2007. Trustee of the Evergreen Funds complex (and its predecessors) from 1984 to 2010. Chairman of the Evergreen Funds from 2000-2010. Former Trustee of the Mentor Funds. Retired Attorney, Law Offices of Michael S. Scofield. | | Asset Allocation Trust |
| * | Length of service dates reflect the Trustee’s commencement of service with the Trust’s predecessor entities, where applicable. |
| ** | Peter Gordon is expected to retire on December 31, 2017. |
Officers
| | | | | | |
Name and year of birth | | Position held and length of service | | Principal occupations during past five years or longer | | |
Andrew Owen3 (Born 1960) | | President, since 2017 | | Executive Vice President of Wells Fargo Bank, N.A. and President of Wells Fargo & Company and Head of Affiliated Managaers, Wells Fargo Asset Management, since 2014. Executive Vice President responsible for marketing, investments and product development for Wells Fargo Funds Management, LLC, from 2009 to 2014. | | |
Jeremy DePalma1 (Born 1974) | | Treasurer, since 2012 | | Senior Vice President of Wells Fargo Funds Management, LLC since 2009. Senior Vice President of Evergreen Investment Management Company, LLC from 2008 to 2010 and head of the Fund Reporting and Control Team within Fund Administration from 2005 to 2010. | | |
C. David Messman (Born 1960) | | Secretary, since 2000; Chief Legal Officer, since 2003 | | Senior Vice President and Secretary of Wells Fargo Funds Management, LLC since 2001. Assistant General Counsel of Wells Fargo Bank, N.A. since 2013 and Vice President and Managing Counsel of Wells Fargo Bank, N.A. from 1996 to 2013. | | |
Michael Whitaker (Born 1967) | | Chief Compliance Officer, since 2016 | | Executive Vice President of Wells Fargo Funds Management, LLC since 2016. Chief Compliance Officer of Fidelity’s Fixed Income Funds and Asset Allocation Funds from 2008 to 2016, Compliance Officer of FMR Co., Inc. from 2014 to 2016, Fidelity Investments Money Management, Inc. from 2014 to 2016, Fidelity Investments from 2007 to 2016. | | |
David Berardi (Born 1975) | | Assistant Treasurer, since 2009 | | Vice President of Wells Fargo Funds Management, LLC since 2009. Vice President of Evergreen Investment Management Company, LLC from 2008 to 2010. Manager of Fund Reporting and Control for Evergreen Investment Management Company, LLC from 2004 to 2010. | | |
| 1 | Jeremy DePalma acts as Treasurer of 69 funds and Assistant Treasurer of 70 funds in the Fund Complex. |
| 2 | The Statement of Additional Information includes additional information about the Trustees and is available, without charge, upon request, by calling
1-800-260-5969 or by visiting the website at wellsfargofunds.com. |
| 3 | Andrew Owen became President on January 1, 2017. |
| | | | | | |
| List of abbreviations | | Wells Fargo VT Discovery Fund | | | 27 | |
The following is a list of common abbreviations for terms and entities that may have appeared in this report.
| ACA | — ACA Financial Guaranty Corporation |
| ADR | — American depositary receipt |
| ADS | — American depositary shares |
| AGC | — Assured Guaranty Corporation |
| AGM | — Assured Guaranty Municipal |
| Ambac | — Ambac Financial Group Incorporated |
| AMT | — Alternative minimum tax |
| BAN | — Bond anticipation notes |
| BHAC | — Berkshire Hathaway Assurance Corporation |
| CAB | — Capital appreciation bond |
| CCAB | — Convertible capital appreciation bond |
| CDA | — Community Development Authority |
| CDO | — Collateralized debt obligation |
| DRIVER | — Derivative inverse tax-exempt receipts |
| DW&P | — Department of Water & Power |
| DWR | — Department of Water Resources |
| ECFA | — Educational & Cultural Facilities Authority |
| EDA | — Economic Development Authority |
| EDFA | — Economic Development Finance Authority |
| ETF | — Exchange-traded fund |
| FDIC | — Federal Deposit Insurance Corporation |
| FFCB | — Federal Farm Credit Banks |
| FGIC | — Financial Guaranty Insurance Corporation |
| FHA | — Federal Housing Administration |
| FHLB | — Federal Home Loan Bank |
| FHLMC | — Federal Home Loan Mortgage Corporation |
| FICO | — The Financing Corporation |
| FNMA | — Federal National Mortgage Association |
| GDR | — Global depositary receipt |
| GNMA | — Government National Mortgage Association |
| HCFR | — Healthcare facilities revenue |
| HEFA | — Health & Educational Facilities Authority |
| HEFAR | — Higher education facilities authority revenue |
| HFA | — Housing Finance Authority |
| HFFA | — Health Facilities Financing Authority |
| HUD | — Department of Housing and Urban Development |
| IDA | — Industrial Development Authority |
| IDAG | — Industrial Development Agency |
| KRW | — Republic of Korea won |
| LIBOR | — London Interbank Offered Rate |
| LIFER | — Long Inverse Floating Exempt Receipts |
| LLC | — Limited liability company |
| LLLP | — Limited liability limited partnership |
| LLP | — Limited liability partnership |
| MBIA | — Municipal Bond Insurance Association |
| MFHR | — Multifamily housing revenue |
| MSTR | — Municipal securities trust receipts |
| MUD | — Municipal Utility District |
| National | — National Public Finance Guarantee Corporation |
| PCFA | — Pollution Control Financing Authority |
| PCL | — Public Company Limited |
| PCR | — Pollution control revenue |
| PFA | — Public Finance Authority |
| PFFA | — Public Facilities Financing Authority |
| PFOTER | — Puttable floating option tax-exempt receipts |
| plc | — Public limited company |
| PUTTER | — Puttable tax-exempt receipts |
| R&D | — Research & development |
| Radian | — Radian Asset Assurance |
| RAN | — Revenue anticipation notes |
| RDA | — Redevelopment Authority |
| RDFA | — Redevelopment Finance Authority |
| REIT | — Real estate investment trust |
| ROC | — Reset option certificates |
| SAVRS | — Select auction variable rate securities |
| SBA | — Small Business Authority |
| SDR | — Swedish depositary receipt |
| SFHR | — Single-family housing revenue |
| SFMR | — Single-family mortgage revenue |
| SPA | — Standby purchase agreement |
| SPDR | — Standard & Poor’s Depositary Receipts |
| SPEAR | — Short Puttable Exempt Adjustable Receipts |
| STRIPS | — Separate trading of registered interest and |
| TAN | — Tax anticipation notes |
| TIPS | — Treasury inflation-protected securities |
| TRAN | — Tax revenue anticipation notes |
| TTFA | — Transportation Trust Fund Authority |
| TVA | — Tennessee Valley Authority |
This page is intentionally left blank.

For more information
More information about Wells Fargo Funds is available free upon request. To obtain literature, please write, email, visit the Fund’s website, or call:
Wells Fargo Funds
P.O. Box 8266
Boston, MA 02266-8266
Email: fundservice@wellsfargo.com
Website: wellsfargofunds.com
Individual investors: 1-800-222-8222
Retail investment professionals: 1-888-877-9275
Institutional investment professionals: 1-866-765-0778
This report and the financial statements contained herein are submitted for the general information of the shareholders of the Fund. If this report is used for promotional purposes, distribution of the report must be accompanied or preceded by a current prospectus. Before investing, please consider the investment objectives, risks, charges, and expenses of the investment. For a current prospectus and, if available, a summary prospectus, containing this information, call 1-800-260-5969 or visit the Fund’s website at wellsfargofunds.com. Read the prospectus carefully before you invest or send money.
Wells Fargo Asset Management (WFAM) is a trade name used by the asset management businesses of Wells Fargo & Company. Wells Fargo Funds Management, LLC, a wholly owned subsidiary of Wells Fargo & Company, provides investment advisory and administrative services for Wells Fargo Funds. Other affiliates of Wells Fargo & Company provide subadvisory and other services for the funds. The funds are distributed by Wells Fargo Funds Distributor, LLC, Member FINRA, an affiliate of Wells Fargo & Company. Neither Wells Fargo Funds Management nor Wells Fargo Funds Distributor has Fund customer accounts/assets, and neither provides investment advice/recommendations or acts as an investment advice fiduciary to any investor.
NOT FDIC INSURED ◾ NO BANK GUARANTEE ◾ MAY LOSE VALUE
© 2016 Wells Fargo Funds Management, LLC. All rights reserved.
| | |
| | 300468 02-17 AVT1/AR147 12-16 |
Annual Report
December 31, 2016

Wells Fargo VT Index Asset Allocation Fund


Reduce clutter. Save trees.
Sign up for electronic delivery of prospectuses and shareholder reports at wellsfargo.com/advantagedelivery
Contents
The views expressed and any forward-looking statements are as of December 31, 2016, unless otherwise noted, and are those of the Fund managers and/or Wells Fargo Funds Management, LLC. Discussions of individual securities, or the markets generally, or any Wells Fargo Fund are not intended as individual recommendations. Future events or results may vary significantly from those expressed in any forward-looking statements. The views expressed are subject to change at any time in response to changing circumstances in the market. Wells Fargo Funds Management, LLC and the Fund disclaim any obligation to publicly update or revise any views expressed or forward-looking statements.
NOT FDIC INSURED ◾ NO BANK GUARANTEE ◾ MAY LOSE VALUE
| | | | |
| 2 | | Wells Fargo VT Index Asset Allocation Fund | | Letter to shareholders (unaudited) |

Andrew Owen
President
Wells Fargo Funds
During much of the period, positive economic data influenced global stock, bond, and commodity markets.
Throughout the period, economic and business data, while often uneven, appeared to be strengthening overall.
Dear Shareholder:
As the new president of Wells Fargo Funds now that Karla Rabusch is retiring from that position after nearly 14 years, I am pleased to offer you this annual report for the Wells Fargo VT Index Asset Allocation Fund for the 12-month period that ended December 31, 2016. During much of the period, positive economic data influenced global stock, bond, and commodity markets. Late in the period, stocks in the U.S. moved higher while they drifted lower in many international markets in reaction to events including the U.S. presidential election, production-cut agreements among Organization of Petroleum Exporting Countries (OPEC) members intended to support higher oil prices, and a December interest-rate increase by the U.S. Federal Reserve (Fed). Bond values fell while interest rates increased and currency values diverged, with the U.S. dollar growing stronger relative to other currencies.
The surprise Brexit vote rattled markets briefly before stocks rebounded.
Following the Fed’s decision to increase interest rates in December 2015, global investment markets opened 2016 with losses that reached historical levels in several markets as investors also grew concerned about slowing growth in China and falling commodity prices. The Fed indicated it would be cautious about additional interest rate increases during 2016, which reassured investors. By mid-February, equity markets had recovered and moderated through the spring. A new round of volatility and losses followed the end-of-June Brexit vote in the U.K. to leave the European Union (E.U.). The equity sell-off proved temporary. During July, better-than-expected corporate earnings, economic data, consumer confidence, and industrial output all sent stocks higher.
Stocks drifted somewhat lower in the fall as the U.S. presidential campaign wore on toward the election. At the same time, political circumstances in countries outside of the U.S. challenged investor sentiment. U.S. economic data released during the fourth quarter showed a 3.5% increase in U.S. real gross domestic product on an annualized basis in the third quarter, which was the largest increase since mid-2014. Business investment by U.S. companies was mixed, with a 12.0% increase in structures and 4.5% decrease in equipment over the prior quarter on an annualized basis. Consumer spending slowed somewhat from the prior quarter, and November showed slight decreases in wages and housing starts.
Investors received improving economic and business data as the period advanced.
Throughout the period, economic and business data, while often uneven, appeared to be strengthening overall. After generating concern early in 2016, China’s economic growth demonstrated strength. The prime minister’s re-election in Japan offered the potential for new economic stimulus. India appointed a new central bank governor who many expected would continue the outgoing governor’s policies, which were considered effective. OPEC members agreed to production cuts intended to support increased prices for oil, which could benefit commodities markets that are economically important to many international developed and emerging markets. In the U.S., the S&P 500 Index1 recorded a return of almost 12% for the 12-month period that ended on December 31, 2016. Developed international markets as measured by the Morgan Stanley Capital International (MSCI) Europe, Australasia, Far East (EAFE) Index (Net)2 ended the
| 1 | The S&P 500 Index consists of 500 stocks chosen for market size, liquidity, and industry group representation. It is a market-value-weighted index with each stock’s weight in the index proportionate to its market value. You cannot invest directly in an index. |
| 2 | The Morgan Stanley Capital International (MSCI) Europe, Australasia, Far East (EAFE) Index (Net) is a free-float-adjusted market-capitalization-weighted index that is designed to measure the equity market performance of developed markets, excluding the United States and Canada. The MSCI EAFE Index (Net) consists of the following 21 developed markets country indexes: Australia, Austria, Belgium, Denmark, Finland, France, Germany, Hong Kong, Ireland, Israel, Italy, Japan, the Netherlands, New Zealand, Norway, Portugal, Singapore, Spain, Sweden, Switzerland, and the United Kingdom. Source: MSCI. MSCI makes no express or implied warranties or representations and shall have no liability whatsoever with respect to any MSCI data contained herein. The MSCI data may not be further redistributed or used as a basis for other indexes or any securities or financial products. This report is not approved, reviewed, or produced by MSCI. You cannot invest directly in an index. |
| | | | | | |
| Letter to shareholders (unaudited) | | Wells Fargo VT Index Asset Allocation Fund | | | 3 | |
period 1.0% higher. Stocks in emerging markets delivered an 11.2% gain for the period as measured by the MSCI Emerging Markets Index (Net).3
Fixed-income markets were volatile before the U.S. election and declined post-election.
Global fixed-income markets were volatile during the period, particularly following the U.S. election. Investors appeared to be anticipating U.S. interest-rate increases and waiting for clarity from central bank policymakers outside of the U.S. Also, currency values in several European and Asian countries fell relative to the U.S. dollar during the period, restraining investor interest in foreign bond markets. While the Bloomberg Barclays U.S. Aggregate Bond Index4 gained 2.7% during the period, a 1.5% loss for the Bloomberg Barclays Global Aggregate ex U.S. Dollar Bond Index5 reflected relatively more difficult conditions for bonds outside of the U.S.
Don’t let short-term uncertainty derail long-term investment goals.
Periods of investment uncertainty can present challenges, but experience has taught us that maintaining long-term investment goals can be an effective way to plan for the future. To help you create a sound strategy based on your personal goals and risk tolerance, Wells Fargo Funds offers more than 100 mutual funds spanning a wide range of asset classes and investment styles. Although diversification cannot guarantee an investment profit or prevent losses, we believe it can be an effective way to manage investment risk and potentially smooth out overall portfolio performance. We encourage investors to know their investments and to understand that appropriate levels of risk-taking may unlock opportunities.
Thank you for choosing to invest with Wells Fargo Funds. We appreciate your confidence in us and remain committed to helping you meet your financial needs.
Sincerely,

Andrew Owen
President
Wells Fargo Funds
For further information about your Fund, contact your investment professional, visit our website at wellsfargofunds.com, or call us directly at 1-800-260-5969. We are available 24 hours a day, 7 days a week.
| 3 | The MSCI Emerging Markets (EM) Index (Net) is a free-float-adjusted market-capitalization-weighted index that is designed to measure the equity market performance of emerging markets. The MSCI EM Index (Net) consists of the following 23 emerging markets country indexes: Brazil, Chile, China, Colombia, Czech Republic, Egypt, Greece, Hungary, India, Indonesia, Korea, Malaysia, Mexico, Peru, the Philippines, Poland, Qatar, Russia, South Africa, Taiwan, Thailand, Turkey, and United Arab Emirates. You cannot invest directly in an index. |
| 4 | The Bloomberg Barclays U.S. Aggregate Bond Index (formerly known as Barclays U.S. Aggregate Bond Index) is a broad-based benchmark that measures the investment-grade, U.S. dollar–denominated, fixed-rate taxable bond market, including Treasuries, government-related and corporate securities, mortgage-backed securities (agency fixed-rate and hybrid adjustable-rate mortgage pass-throughs), asset-backed securities, and commercial mortgage-backed securities. You cannot invest directly in an index. |
| 5 | The Bloomberg Barclays Global Aggregate ex-U.S. Dollar Bond Index (formerly known as Barclays Global Aggregate ex-U.S. Dollar Bond Index) tracks an international basket of government, corporate, agency, and mortgage-related bonds. You cannot invest directly in an index. |
| | | | |
| 4 | | Wells Fargo VT Index Asset Allocation Fund | | Performance highlights (unaudited) |
Investment objective
The Fund seeks long-term total return, consisting of capital appreciation and current income.
Manager
Wells Fargo Funds Management, LLC
Subadviser
Wells Capital Management Incorporated
Portfolio managers
Kandarp Acharya, CFA®, FRM
Christian L. Chan, CFA®
Average annual total returns (%) as of December 31, 2016
| | | | | | | | | | | | | | | | | | | | | | |
| | | | Expense ratios1 (%) | |
| | | Inception date | | 1 year | | | 5 year | | | 10 year | | | Gross | | | Net2 | |
| Class 2 | | 4-15-1994 | | | 7.67 | | | | 11.72 | | | | 6.34 | | | | 1.10 | | | | 1.00 | |
| Index Asset Allocation Blended Index3 | | – | | | 7.66 | | | | 10.43 | | | | 7.75 | | | | – | | | | – | |
| Bloomberg Barclays U.S. Treasury Index4 | | – | | | 1.04 | | | | 1.21 | | | | 3.97 | | | | – | | | | – | |
| S&P 500 Index5 | | – | | | 11.96 | | | | 14.66 | | | | 6.95 | | | | – | | | | – | |
Figures quoted represent past performance, which is no guarantee of future results. Investment return and principal value of an investment will fluctuate so that an investor’s shares, when redeemed, may be worth more or less than their original cost. Current performance may be lower or higher than the performance data quoted and assumes the reinvestment of dividends and capital gains. Current month-end performance is available by calling 1-800-260-5969. Performance figures of the Fund do not reflect fees charged pursuant to the terms of variable life insurance policies and variable annuity contracts. If sales loads or charges had been reflected, performance would have been lower.
Index returns do not include transaction costs associated with buying and selling securities, any mutual fund fees or expenses, or any taxes. It is not possible to invest directly in an index.
Balanced funds may invest in stocks and bonds. Stock values fluctuate in response to the activities of individual companies and general market and economic conditions. Bond values fluctuate in response to the financial condition of individual issuers, general market and economic conditions, and changes in interest rates. Changes in market conditions and government policies may lead to periods of heightened volatility in the bond market and reduced liquidity for certain bonds held by the Fund. In general, when interest rates rise, bond values fall and investors may lose principal value. Interest-rate changes and their impact on the Fund and its share price can be sudden and unpredictable. The use of derivatives may reduce returns and/or increase volatility. Consult the Fund’s prospectus for additional information on these and other risks.
Please refer to the prospectus provided by your participating insurance company for detailed information describing the separate accounts for information regarding surrender charges, mortality and expense risk fees, and other charges that may be assessed by the participating insurance companies.
Please see footnotes on page 5.
| | | | | | |
| Performance highlights (unaudited) | | Wells Fargo VT Index Asset Allocation Fund | | | 5 | |
|
| Growth of $10,000 investment as of December 31, 20166 |
|
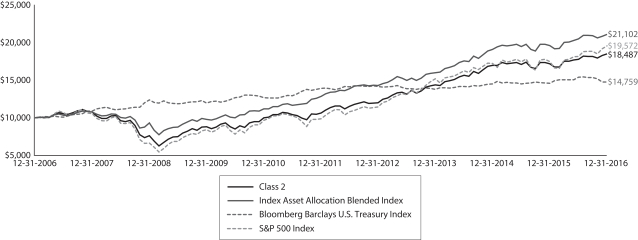 |
| 1 | Reflects the expense ratios as stated in the most recent prospectus. The expense ratios shown are subject to change and may differ from the annualized expense ratios shown in the financial highlights of this report. |
| 2 | The manager has contractually committed through April 30, 2017, to waive fees and/or reimburse expenses to the extent necessary to cap the Fund’s Total Annual Fund Operating Expenses After Fee Waiver at the amount shown. After this time, the cap may be increased or the commitment to maintain the cap may be terminated only with the approval of the Board of Trustees. Brokerage commissions, stamp duty fees, interest, taxes, acquired fund fees and expenses, and extraordinary expenses are excluded from the expense cap. Without this cap, the Fund’s returns would have been lower. |
| 3 | Source: Wells Fargo Funds Management, LLC. The Index Asset Allocation Blended Index is weighted 60% in the S&P 500 Index and 40% in the Bloomberg Barclays U.S. Treasury Index (formerly known as Barclays U.S. Treasury Index). You cannot invest directly in an index. |
| 4 | The Bloomberg Barclays U.S. Treasury Index is an unmanaged index of prices of U.S. Treasury bonds with maturities of 1 to 30 years. You cannot invest directly in an index. |
| 5 | The S&P 500 Index consists of 500 stocks chosen for market size, liquidity, and industry group representation. It is a market-value-weighted index with each stock’s weight in the index proportionate to its market value. You cannot invest directly in an index. |
| 6 | The chart compares the performance of Class 2 shares for the most recent ten years with the Index Asset Allocation Blended Index, Bloomberg Barclays U.S. Treasury Index, and S&P 500 Index. The chart assumes a hypothetical $10,000 investment and reflects all operating expenses of the Fund. Performance does not reflect fees charged pursuant to the terms of variable life insurance policies and variable annuity contracts. |
| 7 | The Morgan Stanley Capital International (MSCI) Europe, Australasia, Far East (EAFE) Index (Net) is a free-float-adjusted market-capitalization-weighted index that is designed to measure the equity market performance of developed markets, excluding the United States and Canada. The MSCI EAFE Index (Net) consists of the following 21 developed markets country indexes: Australia, Austria, Belgium, Denmark, Finland, France, Germany, Hong Kong, Ireland, Israel, Italy, Japan, the Netherlands, New Zealand, Norway, Portugal, Singapore, Spain, Sweden, Switzerland, and the United Kingdom. Source: MSCI. MSCI makes no representations and shall have no liability whatsoever with respect to any MSCI data contained herein. The MSCI data may not be further redistributed or used as a basis for other indexes or any securities or financial products. This report is not approved, reviewed, or produced by MSCI. You cannot invest directly in an index. |
| 8 | The MSCI Emerging Markets (EM) Index (Net) is a free-float-adjusted market-capitalization-weighted index that is designed to measure the equity market performance of emerging markets. The MSCI EM Index (Net) consists of the following 23 emerging markets country indexes: Brazil, Chile, China, Colombia, Czech Republic, Egypt, Greece, Hungary, India, Indonesia, Korea, Malaysia, Mexico, Peru, the Philippines, Poland, Qatar, Russia, South Africa, Taiwan, Thailand, Turkey, and United Arab Emirates. You cannot invest directly in an index. |
| 9 | The ten largest holdings, excluding cash and cash equivalents, are calculated based on the value of the investments divided by total net assets of the Fund. Holdings are subject to change and may have changed since the date specified. |
| 10 | Amounts are calculated based on the total long-term investments of the Fund. These amounts are subject to change and may have changed since the date specified. |
| 11 | Current target allocation includes the effect of any tactical futures overlay that may be in place. These amounts are subject to change and may have changed since the date specified. |
| | | | |
| 6 | | Wells Fargo VT Index Asset Allocation Fund | | Performance highlights (unaudited) |
MANAGER’S DISCUSSION
Fund highlights
| ∎ | | The Fund performed in line with its benchmark, the Index Asset Allocation Blended Index for the 12-month period that ended December 31, 2016. |
| ∎ | | The Fund’s tactical asset allocation shifts between stocks and bonds contributed positively to relative performance. |
| ∎ | | A lower duration relative to the Treasury benchmark through late 2016 added to performance during the period. |
The 12-month period was volatile for stocks and bonds.
The past 12 months featured large swings in the equity and fixed income markets. The market correction in early 2016 left markets in a period of heightened volatility. The U.S. Federal Reserve increased rates for the first time in more than a decade in December 2015. Although the widely anticipated move was largely priced into markets, it did raise investor concern about the pace of future rate hikes. Early in 2016, between falling oil prices and lowered gross domestic product numbers from China, market fears came to a head and equity prices fell. The resultant flight to less risky assets put government bond yields well below historical averages. The mix of low global interest rates and weak first quarter 2016 equity performance further pushed yields to new lows. These were not the lowest yields for the period.
In June 2016, the U.K. voted to leave the European Union, a decision popularly known as Brexit. The vote to leave the E.U. was viewed as unlikely, and the shock of the referendum’s passage caused a short-term sell-off of U.K. equities and currency. Investors fled to perceived safe havens, including the U.S. government bond market. As the threat of Brexit-induced instability waned, Treasury yields recovered. In the fourth quarter, amidst more uncertainty with the U.S. election and future government policies, domestic stock markets rallied after Donald Trump was elected president. For the period as a whole, the S&P 500 Index posted a return of 11.96%. Other segments of the global equity market displayed mixed performance. Developed non-U.S. markets, as measured by the Morgan Stanley Capital International (MSCI) Europe, Australasia, Far East (EAFE) Index (Net),7 returned 1.00%. Emerging markets as measured by the MSCI Emerging Markets Index (Net)8 posted an 11.19% return, underperforming the S&P 500 Index.
Government bond prices rose and fell during the period as yields across the curve changed through the year. The Bloomberg Barclays U.S. Treasury Index, a broad measure of U.S. Treasury notes and bonds, gained 1.04% during the 12-month period.
| | | | |
| Ten largest holdings (%) as of December 31, 20169 | |
Apple Incorporated | | | 1.92 | |
Microsoft Corporation | | | 1.50 | |
Exxon Mobil Corporation | | | 1.16 | |
Johnson & Johnson | | | 0.97 | |
Berkshire Hathaway Incorporated Class B | | | 0.96 | |
JPMorgan Chase & Company | | | 0.96 | |
Amazon.com Incorporated | | | 0.92 | |
General Electric Company | | | 0.87 | |
Facebook Incorporated Class A | | | 0.84 | |
AT&T Incorporated | | | 0.81 | |
Tactical shifts between stocks and bonds contributed positively, while a lower duration detracted from performance.
The Fund’s stock holdings seek to replicate the holdings of the S&P 500 Index, and its bond holdings seek to replicate the holdings of the Bloomberg Barclays U.S. Treasury Index. The Fund’s neutral target allocation is 60.0% stocks and 40.0% bonds. As of year-end, the Fund had an effective allocation of 60.0% stocks and 40.0% bonds.
The portfolio began the period with a neutral allocation to stocks and bonds. The team saw an opportunity to implement tactical trades in its futures overlay during the January 2016 correction. Specifically, as equities sold off
and yields trended lower, the team initiated long positions in equity futures and short positions in U.S. Treasury futures. After equity prices recovered, the higher effective equity allocation added value. Though the Fund returned to a neutral equity allocation in March, the team maintained a short exposure to Treasury futures until the fourth quarter, when they were unwound at a profit.
As Treasury yields fell to historical lows in early July, the portfolio management team lowered the duration of its underlying bond portfolio. The reduced exposure to longer-term bonds added value to the Fund. The team continues to view this as a prudent measure in what is widely anticipated to be a rising interest-rate environment.
Please see footnotes on page 5.
| | | | | | |
| Performance highlights (unaudited) | | Wells Fargo VT Index Asset Allocation Fund | | | 7 | |
|
| Equity sector distribution as of December 31, 201610 |
|
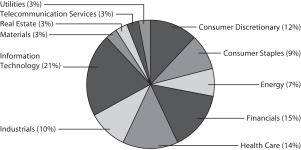 |
|
| Neutral target allocation |
|
 |
|
| Current target allocation as of December 31, 201611 |
|
 |
Relative to its benchmark, the Fund maintained a neutral allocation between stocks and bonds and lower bond duration at the close of the period.
The Fund’s effective allocation is determined by a combination of inputs from multiple quantitative and qualitative factors. As of the close of the period, the Fund maintained a neutral allocation between stocks and bonds and a slightly lower duration relative to its Bloomberg Barclays U.S. Treasury Index benchmark. All of the changes to the effective allocation were implemented with liquid futures contracts.
Please see footnotes on page 5.
| | | | |
| 8 | | Wells Fargo VT Index Asset Allocation Fund | | Fund expenses (unaudited) |
As a shareholder of the Fund, you incur ongoing costs, including management fees, distribution (12b-1) fees, and other Fund expenses. This example is intended to help you understand your ongoing costs (in dollars) of investing in the Fund and to compare these costs with the ongoing costs of investing in other mutual funds.
The example is based on an investment of $1,000 invested at the beginning of the six-month period and held for the entire period from July 1, 2016 to December 31, 2016.
Actual expenses
The “Actual” line of the table below provides information about actual account values and actual expenses. You may use the information in this line, together with the amount you invested, to estimate the expenses that you paid over the period. Simply divide your account value by $1,000 (for example, an $8,600 account value divided by $1,000 = 8.6), then multiply the result by the number in the “Actual” line under the heading entitled “Expenses Paid During Period” for your applicable class of shares to estimate the expenses you paid on your account during this period.
Hypothetical example for comparison purposes
The “Hypothetical” line of the table below provides information about hypothetical account values and hypothetical expenses based on the Fund’s actual expense ratio and an assumed rate of return of 5% per year before expenses, which is not the Fund’s actual return. The hypothetical account values and expenses may not be used to estimate the actual ending account balance or expenses you paid for the period. You may use this information to compare the ongoing costs of investing in the Fund and other funds. To do so, compare this 5% hypothetical example with the 5% hypothetical examples that appear in the shareholder reports of the other funds.
Please note that the expenses shown in the table are meant to highlight your ongoing costs only and do not reflect any separate account charges assessed by participating insurance companies. Therefore, the “Hypothetical” line of the table is useful in comparing ongoing costs only, and will not help you determine the relative total costs of owning different funds. In addition, if these separate account charges assessed by participating insurance companies were included, your costs would have been higher.
| | | | | | | | | | | | | | | | |
| | | Beginning
account value
7-1-2016 | | | Ending
account value
12-31-2016 | | | Expenses
paid during
the period¹ | | | Annualized net
expense ratio | |
Class 2 | | | | | | | | | | | | | | | | |
Actual | | $ | 1,000.00 | | | $ | 1,039.00 | | | $ | 5.13 | | | | 1.00 | % |
Hypothetical (5% return before expenses) | | $ | 1,000.00 | | | $ | 1,020.11 | | | $ | 5.08 | | | | 1.00 | % |
| 1 | Expenses paid is equal to the annualized net expense ratio multiplied by the average account value over the period, multiplied by the number of days in the most recent fiscal half-year divided by the number of days in the fiscal year (to reflect the one-half year period). |
| | | | | | |
| Portfolio of investments—December 31, 2016 | | Wells Fargo VT Index Asset Allocation Fund | | | 9 | |
| | | | | | | | | | | | | | | | |
| Security name | | | | | | | | Shares | | | Value | |
| | | | |
Common Stocks: 59.79% | | | | | | | | | | | | | | | | |
| | | | |
Consumer Discretionary: 7.19% | | | | | | | | | | | | | | | | |
| | | | |
| Auto Components: 0.11% | | | | | | | | | | | | | | | | |
BorgWarner Incorporated | | | | | | | | | | | 506 | | | $ | 19,957 | |
Delphi Automotive plc | | | | | | | | | | | 685 | | | | 46,135 | |
The Goodyear Tire & Rubber Company | | | | | | | | | | | 660 | | | | 20,374 | |
| | | | |
| | | | | | | | | | | | | | | 86,466 | |
| | | | | | | | | | | | | | | | |
| | | | |
| Automobiles: 0.33% | | | | | | | | | | | | | | | | |
Ford Motor Company | | | | | | | | | | | 9,877 | | | | 119,808 | |
General Motors Company | | | | | | | | | | | 3,510 | | | | 122,288 | |
Harley-Davidson Incorporated | | | | | | | | | | | 446 | | | | 26,020 | |
| | | | |
| | | | | | | | | | | | | | | 268,116 | �� |
| | | | | | | | | | | | | | | | |
| | | | |
| Distributors: 0.07% | | | | | | | | | | | | | | | | |
Genuine Parts Company | | | | | | | | | | | 376 | | | | 35,923 | |
LKQ Corporation † | | | | | | | | | | | 778 | | | | 23,846 | |
| | | | |
| | | | | | | | | | | | | | | 59,769 | |
| | | | | | | | | | | | | | | | |
| | | | |
| Diversified Consumer Services: 0.02% | | | | | | | | | | | | | | | | |
H&R Block Incorporated | | | | | | | | | | | 554 | | | | 12,736 | |
| | | | | | | | | | | | | | | | |
| | | | |
| Hotels, Restaurants & Leisure: 0.93% | | | | | | | | | | | | | | | | |
Carnival Corporation | | | | | | | | | | | 1,061 | | | | 55,236 | |
Chipotle Mexican Grill Incorporated † | | | | | | | | | | | 72 | | | | 27,167 | |
Darden Restaurants Incorporated | | | | | | | | | | | 310 | | | | 22,543 | |
Marriott International Incorporated Class A | | | | | | | | | | | 810 | | | | 66,971 | |
McDonald’s Corporation | | | | | | | | | | | 2,101 | | | | 255,734 | |
Royal Caribbean Cruises Limited | | | | | | | | | | | 423 | | | | 34,703 | |
Starbucks Corporation | | | | | | | | | | | 3,683 | | | | 204,480 | |
Wyndham Worldwide Corporation | | | | | | | | | | | 272 | | | | 20,773 | |
Wynn Resorts Limited | | | | | | | | | | | 200 | | | | 17,302 | |
Yum! Brands Incorporated | | | | | | | | | | | 883 | | | | 55,920 | |
| | | | |
| | | | | | | | | | | | | | | 760,829 | |
| | | | | | | | | | | | | | | | |
| | | | |
| Household Durables: 0.28% | | | | | | | | | | | | | | | | |
D.R. Horton Incorporated | | | | | | | | | | | 859 | | | | 23,476 | |
Garmin Limited | | | | | | | | | | | 291 | | | | 14,111 | |
Harman International Industries Incorporated | | | | | | | | | | | 175 | | | | 19,453 | |
Leggett & Platt Incorporated | | | | | | | | | | | 337 | | | | 16,473 | |
Lennar Corporation Class A | | | | | | | | | | | 497 | | | | 21,336 | |
Mohawk Industries Incorporated † | | | | | | | | | | | 158 | | | | 31,549 | |
Newell Rubbermaid Incorporated | | | | | | | | | | | 1,221 | | | | 54,518 | |
PulteGroup Incorporated | | | | | | | | | | | 753 | | | | 13,840 | |
Whirlpool Corporation | | | | | | | | | | | 189 | | | | 34,355 | |
| | | | |
| | | | | | | | | | | | | | | 229,111 | |
| | | | | | | | | | | | | | | | |
| | | | |
| Internet & Direct Marketing Retail: 1.36% | | | | | | | | | | | | | | | | |
Amazon.com Incorporated † | | | | | | | | | | | 998 | | | | 748,370 | |
Expedia Incorporated | | | | | | | | | | | 304 | | | | 34,437 | |
The accompanying notes are an integral part of these financial statements.
| | | | |
| 10 | | Wells Fargo VT Index Asset Allocation Fund | | Portfolio of investments—December 31, 2016 |
| | | | | | | | | | | | | | | | |
| Security name | | | | | | | | Shares | | | Value | |
| | | | |
| Internet & Direct Marketing Retail (continued) | | | | | | | | | | | | | | | | |
Netflix Incorporated † | | | | | | | | | | | 1,086 | | | $ | 134,447 | |
The Priceline Group Incorporated † | | | | | | | | | | | 124 | | | | 181,791 | |
TripAdvisor Incorporated † | | | | | | | | | | | 289 | | | | 13,401 | |
| | | | |
| | | | | | | | | | | | | | | 1,112,446 | |
| | | | | | | | | | | | | | | | |
| | | | |
| Leisure Products: 0.06% | | | | | | | | | | | | | | | | |
Hasbro Incorporated | | | | | | | | | | | 284 | | | | 22,092 | |
Mattel Incorporated | | | | | | | | | | | 865 | | | | 23,831 | |
| | | | |
| | | | | | | | | | | | | | | 45,923 | |
| | | | | | | | | | | | | | | | |
| | | | |
| Media: 1.83% | | | | | | | | | | | | | | | | |
CBS Corporation Class B | | | | | | | | | | | 991 | | | | 63,047 | |
Charter Communications Incorporated Class A † | | | | | | | | | | | 548 | | | | 157,780 | |
Comcast Corporation Class A | | | | | | | | | | | 6,031 | | | | 416,441 | |
Discovery Communications Incorporated Class A † | | | | | | | | | | | 384 | | | | 10,525 | |
Discovery Communications Incorporated Class C † | | | | | | | | | | | 558 | | | | 14,943 | |
Interpublic Group of Companies Incorporated | | | | | | | | | | | 1,004 | | | | 23,504 | |
News Corporation Class A | | | | | | | | | | | 966 | | | | 11,070 | |
News Corporation Class B | | | | | | | | | | | 302 | | | | 3,564 | |
Omnicom Group Incorporated | | | | | | | | | | | 596 | | | | 50,726 | |
Scripps Networks Interactive Incorporated Class A | | | | | | | | | | | 240 | | | | 17,129 | |
Tegna Incorporated | | | | | | | | | | | 542 | | | | 11,593 | |
The Walt Disney Company | | | | | | | | | | | 3,705 | | | | 386,135 | |
Time Warner Incorporated | | | | | | | | | | | 1,951 | | | | 188,330 | |
Twenty-First Century Fox Incorporated Class A | | | | | | | | | | | 2,679 | | | | 75,119 | |
Twenty-First Century Fox Incorporated Class B | | | | | | | | | | | 1,233 | | | | 33,599 | |
Viacom Incorporated Class B | | | | | | | | | | | 879 | | | | 30,853 | |
| | | | |
| | | | | | | | | | | | | | | 1,494,358 | |
| | | | | | | | | | | | | | | | |
| | | | |
| Multiline Retail: 0.32% | | | | | | | | | | | | | | | | |
Dollar General Corporation | | | | | | | | | | | 643 | | | | 47,627 | |
Dollar Tree Incorporated † | | | | | | | | | | | 596 | | | | 45,999 | |
Kohl’s Corporation | | | | | | | | | | | 445 | | | | 21,974 | |
Macy’s Incorporated | | | | | | | | | | | 773 | | | | 27,681 | |
Nordstrom Incorporated | | | | | | | | | | | 294 | | | | 14,091 | |
Target Corporation | | | | | | | | | | | 1,421 | | | | 102,639 | |
| | | | |
| | | | | | | | | | | | | | | 260,011 | |
| | | | | | | | | | | | | | | | |
| | | | |
| Specialty Retail: 1.47% | | | | | | | | | | | | | | | | |
Advance Auto Parts Incorporated | | | | | | | | | | | 185 | | | | 31,287 | |
AutoNation Incorporated † | | | | | | | | | | | 165 | | | | 8,027 | |
AutoZone Incorporated † | | | | | | | | | | | 72 | | | | 56,865 | |
Bed Bath & Beyond Incorporated | | | | | | | | | | | 384 | | | | 15,606 | |
Best Buy Company Incorporated | | | | | | | | | | | 691 | | | | 29,485 | |
CarMax Incorporated † | | | | | | | | | | | 481 | | | | 30,972 | |
Foot Locker Incorporated | | | | | | | | | | | 343 | | | | 24,315 | |
L Brands Incorporated | | | | | | | | | | | 607 | | | | 39,965 | |
Lowe’s Companies Incorporated | | | | | | | | | | | 2,201 | | | | 156,535 | |
O’Reilly Automotive Incorporated † | | | | | | | | | | | 238 | | | | 66,262 | |
The accompanying notes are an integral part of these financial statements.
| | | | | | |
| Portfolio of investments—December 31, 2016 | | Wells Fargo VT Index Asset Allocation Fund | | | 11 | |
| | | | | | | | | | | | | | | | |
| Security name | | | | | | | | Shares | | | Value | |
| | | | |
| Specialty Retail (continued) | | | | | | | | | | | | | | | | |
Ross Stores Incorporated | | | | | | | | | | | 1,004 | | | $ | 65,862 | |
Signet Jewelers Limited | | | | | | | | | | | 175 | | | | 16,496 | |
Staples Incorporated | | | | | | | | | | | 1,646 | | | | 14,896 | |
The Gap Incorporated | | | | | | | | | | | 555 | | | | 12,454 | |
The Home Depot Incorporated | | | | | | | | | | | 3,082 | | | | 413,235 | |
The TJX Companies Incorporated | | | | | | | | | | | 1,649 | | | | 123,889 | |
Tiffany & Company | | | | | | | | | | | 270 | | | | 20,906 | |
Tractor Supply Company | | | | | | | | | | | 331 | | | | 25,093 | |
ULTA Salon Cosmetics & Fragrance Incorporated † | | | | | | | | | | | 147 | | | | 37,476 | |
Urban Outfitters Incorporated † | | | | | | | | | | | 223 | | | | 6,351 | |
| | | | |
| | | | | | | | | | | | | | | 1,195,977 | |
| | | | | | | | | | | | | | | | |
| | | | |
| Textiles, Apparel & Luxury Goods: 0.41% | | | | | | | | | | | | | | | | |
Coach Incorporated | | | | | | | | | | | 709 | | | | 24,829 | |
HanesBrands Incorporated | | | | | | | | | | | 956 | | | | 20,621 | |
Michael Kors Holdings Limited † | | | | | | | | | | | 415 | | | | 17,837 | |
Nike Incorporated Class B | | | | | | | | | | | 3,381 | | | | 171,856 | |
PVH Corporation | | | | | | | | | | | 200 | | | | 18,048 | |
Ralph Lauren Corporation | | | | | | | | | | | 142 | | | | 12,825 | |
Under Armour Incorporated Class A | | | | | | | | | | | 464 | | | | 13,479 | |
Under Armour Incorporated Class C † | | | | | | | | | | | 467 | | | | 11,754 | |
VF Corporation | | | | | | | | | | | 837 | | | | 44,654 | |
| | | | |
| | | | | | | | | | | | | | | 335,903 | |
| | | | | | | | | | | | | | | | |
| | | | |
Consumer Staples: 5.60% | | | | | | | | | | | | | | | | |
| | | | |
| Beverages: 1.24% | | | | | | | | | | | | | | | | |
Brown-Forman Corporation Class B | | | | | | | | | | | 461 | | | | 20,708 | |
Constellation Brands Incorporated Class A | | | | | | | | | | | 449 | | | | 68,836 | |
Dr Pepper Snapple Group Incorporated | | | | | | | | | | | 464 | | | | 42,071 | |
Molson Coors Brewing Company Class B | | | | | | | | | | | 465 | | | | 45,249 | |
Monster Beverage Corporation † | | | | | | | | | | | 1,026 | | | | 45,493 | |
PepsiCo Incorporated | | | | | | | | | | | 3,629 | | | | 379,702 | |
The Coca-Cola Company | | | | | | | | | | | 9,822 | | | | 407,220 | |
| | | | |
| | | | | | | | | | | | | | | 1,009,279 | |
| | | | | | | | | | | | | | | | |
| | | | |
| Food & Staples Retailing: 1.24% | | | | | | | | | | | | | | | | |
Costco Wholesale Corporation | | | | | | | | | | | 1,106 | | | | 177,082 | |
CVS Health Corporation | | | | | | | | | | | 2,699 | | | | 212,978 | |
Sysco Corporation | | | | | | | | | | | 1,273 | | | | 70,486 | |
The Kroger Company | | | | | | | | | | | 2,389 | | | | 82,444 | |
Wal-Mart Stores Incorporated | | | | | | | | | | | 3,810 | | | | 263,347 | |
Walgreens Boots Alliance Incorporated | | | | | | | | | | | 2,166 | | | | 179,258 | |
Whole Foods Market Incorporated | | | | | | | | | | | 805 | | | | 24,762 | |
| | | | |
| | | | | | | | | | | | | | | 1,010,357 | |
| | | | | | | | | | | | | | | | |
| | | | |
| Food Products: 0.96% | | | | | | | | | | | | | | | | |
Archer Daniels Midland Company | | | | | | | | | | | 1,456 | | | | 66,466 | |
Campbell Soup Company | | | | | | | | | | | 490 | | | | 29,630 | |
The accompanying notes are an integral part of these financial statements.
| | | | |
| 12 | | Wells Fargo VT Index Asset Allocation Fund | | Portfolio of investments—December 31, 2016 |
| | | | | | | | | | | | | | | | |
| Security name | | | | | | | | Shares | | | Value | |
| | | | |
| Food Products (continued) | | | | | | | | | | | | | | | | |
ConAgra Foods Incorporated | | | | | | | | | | | 1,052 | | | $ | 41,607 | |
General Mills Incorporated | | | | | | | | | | | 1,496 | | | | 92,408 | |
Hormel Foods Corporation | | | | | | | | | | | 683 | | | | 23,775 | |
Kellogg Company | | | | | | | | | | | 639 | | | | 47,101 | |
McCormick & Company Incorporated | | | | | | | | | | | 290 | | | | 27,066 | |
Mead Johnson Nutrition Company | | | | | | | | | | | 468 | | | | 33,116 | |
Mondelez International Incorporated Class A | | | | | | | | | | | 3,908 | | | | 173,242 | |
The Hershey Company | | | | | | | | | | | 352 | | | | 36,407 | |
The J.M. Smucker Company | | | | | | | | | | | 294 | | | | 37,650 | |
The Kraft Heinz Company | | | | | | | | | | | 1,509 | | | | 131,766 | |
Tyson Foods Incorporated Class A | | | | | | | | | | | 734 | | | | 45,273 | |
| | | | |
| | | | | | | | | | | | | | | 785,507 | |
| | | | | | | | | | | | | | | | |
| | | | |
| Household Products: 1.09% | | | | | | | | | | | | | | | | |
Church & Dwight Company Incorporated | | | | | | | | | | | 654 | | | | 28,900 | |
Colgate-Palmolive Company | | | | | | | | | | | 2,249 | | | | 147,175 | |
Kimberly-Clark Corporation | | | | | | | | | | | 906 | | | | 103,393 | |
The Clorox Company | | | | | | | | | | | 325 | | | | 39,007 | |
The Procter & Gamble Company | | | | | | | | | | | 6,772 | | | | 569,390 | |
| | | | |
| | | | | | | | | | | | | | | 887,865 | |
| | | | | | | | | | | | | | | | |
| | | | |
| Personal Products: 0.08% | | | | | | | | | | | | | | | | |
Coty Incorporated Class A | | | | | | | | | | | 1,189 | | | | 21,771 | |
The Estee Lauder Companies Incorporated Class A | | | | | | | | | | | 562 | | | | 42,987 | |
| | | | |
| | | | | | | | | | | | | | | 64,758 | |
| | | | | | | | | | | | | | | | |
| | | | |
| Tobacco: 0.99% | | | | | | | | | | | | | | | | |
Altria Group Incorporated | | | | | | | | | | | 4,936 | | | | 333,772 | |
Philip Morris International | | | | | | | | | | | 3,925 | | | | 359,098 | |
Reynolds American Incorporated | | | | | | | | | | | 2,093 | | | | 117,292 | |
| | | | |
| | | | | | | | | | | | | | | 810,162 | |
| | | | | | | | | | | | | | | | |
| | | | |
Energy: 4.52% | | | | | | | | | | | | | | | | |
| | | | |
| Energy Equipment & Services: 0.71% | | | | | | | | | | | | | | | | |
Baker Hughes Incorporated | | | | | | | | | | | 1,070 | | | | 69,518 | |
FMC Technologies Incorporated † | | | | | | | | | | | 571 | | | | 20,288 | |
Halliburton Company | | | | | | | | | | | 2,188 | | | | 118,349 | |
Helmerich & Payne Incorporated | | | | | | | | | | | 273 | | | | 21,130 | |
National Oilwell Varco Incorporated | | | | | | | | | | | 956 | | | | 35,793 | |
Schlumberger Limited | | | | | | | | | | | 3,521 | | | | 295,588 | |
Transocean Limited † | | | | | | | | | | | 984 | | | | 14,504 | |
| | | | |
| | | | | | | | | | | | | | | 575,170 | |
| | | | | | | | | | | | | | | | |
| | | | |
| Oil, Gas & Consumable Fuels: 3.81% | | | | | | | | | | | | | | | | |
Anadarko Petroleum Corporation | | | | | | | | | | | 1,414 | | | | 98,598 | |
Apache Corporation | | | | | | | | | | | 960 | | | | 60,931 | |
Cabot Oil & Gas Corporation | | | | | | | | | | | 1,178 | | | | 27,518 | |
Chesapeake Energy Corporation † | | | | | | | | | | | 1,886 | | | | 13,240 | |
The accompanying notes are an integral part of these financial statements.
| | | | | | |
| Portfolio of investments—December 31, 2016 | | Wells Fargo VT Index Asset Allocation Fund | | | 13 | |
| | | | | | | | | | | | | | | | |
| Security name | | | | | | | | Shares | | | Value | |
| | | | |
| Oil, Gas & Consumable Fuels (continued) | | | | | | | | | | | | | | | | |
Chevron Corporation | | | | | | | | | | | 4,777 | | | $ | 562,253 | |
Cimarex Energy Company | | | | | | | | | | | 240 | | | | 32,616 | |
Concho Resources Incorporated † | | | | | | | | | | | 369 | | | | 48,929 | |
ConocoPhillips | | | | | | | | | | | 3,136 | | | | 157,239 | |
Devon Energy Corporation | | | | | | | | | | | 1,325 | | | | 60,513 | |
EOG Resources Incorporated | | | | | | | | | | | 1,458 | | | | 147,404 | |
EQT Corporation | | | | | | | | | | | 437 | | | | 28,580 | |
Exxon Mobil Corporation | | | | | | | | | | | 10,493 | | | | 947,098 | |
Hess Corporation | | | | | | | | | | | 674 | | | | 41,983 | |
Kinder Morgan Incorporated | | | | | | | | | | | 4,858 | | | | 100,609 | |
Marathon Oil Corporation | | | | | | | | | | | 2,144 | | | | 37,113 | |
Marathon Petroleum Corporation | | | | | | | | | | | 1,335 | | | | 67,217 | |
Murphy Oil Corporation | | | | | | | | | | | 409 | | | | 12,732 | |
Newfield Exploration Company † | | | | | | | | | | | 498 | | | | 20,169 | |
Noble Energy Incorporated | | | | | | | | | | | 1,085 | | | | 41,295 | |
Occidental Petroleum Corporation | | | | | | | | | | | 1,934 | | | | 137,759 | |
ONEOK Incorporated | | | | | | | | | | | 532 | | | | 30,542 | |
Phillips 66 Company | | | | | | | | | | | 1,119 | | | | 96,693 | |
Pioneer Natural Resources Company | | | | | | | | | | | 429 | | | | 77,250 | |
Range Resources Corporation | | | | | | | | | | | 474 | | | | 16,287 | |
Southwestern Energy Company † | | | | | | | | | | | 1,242 | | | | 13,438 | |
Spectra Energy Corporation | | | | | | | | | | | 1,775 | | | | 72,935 | |
Tesoro Corporation | | | | | | | | | | | 296 | | | | 25,885 | |
The Williams Companies Incorporated | | | | | | | | | | | 1,729 | | | | 53,841 | |
Valero Energy Corporation | | | | | | | | | | | 1,145 | | | | 78,226 | |
| | | | |
| | | | | | | | | | | | | | | 3,108,893 | |
| | | | | | | | | | | | | | | | |
| | | | |
Financials: 8.86% | | | | | | | | | | | | | | | | |
| | | | |
| Banks: 4.02% | | | | | | | | | | | | | | | | |
Bank of America Corporation | | | | | | | | | | | 25,572 | | | | 565,141 | |
BB&T Corporation | | | | | | | | | | | 2,053 | | | | 96,532 | |
Citigroup Incorporated | | | | | | | | | | | 7,211 | | | | 428,550 | |
Citizens Financial Group Incorporated | | | | | | | | | | | 1,295 | | | | 46,141 | |
Comerica Incorporated | | | | | | | | | | | 436 | | | | 29,696 | |
Fifth Third Bancorp | | | | | | | | | | | 1,911 | | | | 51,540 | |
Huntington Bancshares Incorporated | | | | | | | | | | | 2,746 | | | | 36,302 | |
JPMorgan Chase & Company | | | | | | | | | | | 9,055 | | | | 781,356 | |
KeyCorp | | | | | | | | | | | 2,735 | | | | 49,968 | |
M&T Bank Corporation | | | | | | | | | | | 392 | | | | 61,321 | |
People’s United Financial Incorporated | | | | | | | | | | | 788 | | | | 15,256 | |
PNC Financial Services Group Incorporated | | | | | | | | | | | 1,231 | | | | 143,978 | |
Regions Financial Corporation | | | | | | | | | | | 3,114 | | | | 44,717 | |
SunTrust Banks Incorporated | | | | | | | | | | | 1,242 | | | | 68,124 | |
US Bancorp | | | | | | | | | | | 4,043 | | | | 207,689 | |
Wells Fargo & Company (l) | | | | | | | | | | | 11,438 | | | | 630,348 | |
Zions Bancorporation | | | | | | | | | | | 515 | | | | 22,166 | |
| | | | |
| | | | | | | | | | | | | | | 3,278,825 | |
| | | | | | | | | | | | | | | | |
The accompanying notes are an integral part of these financial statements.
| | | | |
| 14 | | Wells Fargo VT Index Asset Allocation Fund | | Portfolio of investments—December 31, 2016 |
| | | | | | | | | | | | | | | | |
| Security name | | | | | | | | Shares | | | Value | |
| | | | |
| Capital Markets: 1.69% | | | | | | | | | | | | | | | | |
Affiliated Managers Group Incorporated † | | | | | | | | | | | 138 | | | $ | 20,051 | |
Ameriprise Financial Incorporated | | | | | | | | | | | 400 | | | | 44,376 | |
Bank of New York Mellon Corporation | | | | | | | | | | | 2,676 | | | | 126,789 | |
BlackRock Incorporated | | | | | | | | | | | 306 | | | | 116,445 | |
CME Group Incorporated | | | | | | | | | | | 859 | | | | 99,086 | |
E*TRADE Financial Corporation † | | | | | | | | | | | 693 | | | | 24,012 | |
Franklin Resources Incorporated | | | | | | | | | | | 877 | | | | 34,712 | |
Goldman Sachs Group Incorporated | | | | | | | | | | | 936 | | | | 224,125 | |
Intercontinental Exchange Incorporated | | | | | | | | | | | 1,507 | | | | 85,025 | |
Invesco Limited | | | | | | | | | | | 1,033 | | | | 31,341 | |
Moody’s Corporation | | | | | | | | | | | 421 | | | | 39,688 | |
Morgan Stanley | | | | | | | | | | | 3,649 | | | | 154,170 | |
Northern Trust Corporation | | | | | | | | | | | 538 | | | | 47,909 | |
S&P Global Incorporated | | | | | | | | | | | 655 | | | | 70,439 | |
State Street Corporation | | | | | | | | | | | 917 | | | | 71,269 | |
T. Rowe Price Group Incorporated | | | | | | | | | | | 615 | | | | 46,285 | |
The Charles Schwab Corporation | | | | | | | | | | | 3,053 | | | | 120,502 | |
The NASDAQ OMX Group Incorporated | | | | | | | | | | | 288 | | | | 19,331 | |
| | | | |
| | | | | | | | | | | | | | | 1,375,555 | |
| | | | | | | | | | | | | | | | |
| | | | |
| Consumer Finance: 0.50% | | | | | | | | | | | | | | | | |
American Express Company | | | | | | | | | | | 1,945 | | | | 144,086 | |
Capital One Financial Corporation | | | | | | | | | | | 1,220 | | | | 106,433 | |
Discover Financial Services | | | | | | | | | | | 997 | | | | 71,874 | |
Navient Corporation | | | | | | | | | | | 766 | | | | 12,585 | |
Synchrony Financial | | | | | | | | | | | 1,984 | | | | 71,960 | |
| | | | |
| | | | | | | | | | | | | | | 406,938 | |
| | | | | | | | | | | | | | | | |
| | | | |
| Diversified Financial Services: 0.99% | | | | | | | | | | | | | | | | |
Berkshire Hathaway Incorporated Class B † | | | | | | | | | | | 4,805 | | | | 783,119 | |
Leucadia National Corporation | | | | | | | | | | | 820 | | | | 19,065 | |
| | | | |
| | | | | | | | | | | | | | | 802,184 | |
| | | | | | | | | | | | | | | | |
| | | | |
| Insurance: 1.66% | | | | | | | | | | | | | | | | |
AFLAC Incorporated | | | | | | | | | | | 1,032 | | | | 71,827 | |
American International Group Incorporated | | | | | | | | | | | 2,469 | | | | 161,250 | |
Aon plc | | | | | | | | | | | 665 | | | | 74,167 | |
Arthur J. Gallagher & Company | | | | | | | | | | | 449 | | | | 23,330 | |
Assurant Incorporated | | | | | | | | | | | 144 | | | | 13,372 | |
Chubb Limited | | | | | | | | | | | 1,178 | | | | 155,637 | |
Cincinnati Financial Corporation | | | | | | | | | | | 379 | | | | 28,709 | |
Lincoln National Corporation | | | | | | | | | | | 578 | | | | 38,304 | |
Loews Corporation | | | | | | | | | | | 699 | | | | 32,734 | |
Marsh & McLennan Companies Incorporated | | | | | | | | | | | 1,304 | | | | 88,137 | |
MetLife Incorporated | | | | | | | | | | | 2,781 | | | | 149,868 | |
Principal Financial Group Incorporated | | | | | | | | | | | 677 | | | | 39,171 | |
Prudential Financial Incorporated | | | | | | | | | | | 1,088 | | | | 113,217 | |
The Allstate Corporation | | | | | | | | | | | 932 | | | | 69,080 | |
The Hartford Financial Services Group Incorporated | | | | | | | | | | | 956 | | | | 45,553 | |
The accompanying notes are an integral part of these financial statements.
| | | | | | |
| Portfolio of investments—December 31, 2016 | | Wells Fargo VT Index Asset Allocation Fund | | | 15 | |
| | | | | | | | | | | | | | | | |
| Security name | | | | | | | | Shares | | | Value | |
| | | | |
| Insurance (continued) | | | | | | | | | | | | | | | | |
The Progressive Corporation | | | | | | | | | | | 1,468 | | | $ | 52,114 | |
The Travelers Companies Incorporated | | | | | | | | | | | 719 | | | | 88,020 | |
Torchmark Corporation | | | | | | | | | | | 279 | | | | 20,579 | |
UnumProvident Corporation | | | | | | | | | | | 587 | | | | 25,787 | |
Willis Towers Watson plc | | | | | | | | | | | 324 | | | | 39,619 | |
XL Group Limited | | | | | | | | | | | 681 | | | | 25,374 | |
| | | | |
| | | | | | | | | | | | | | | 1,355,849 | |
| | | | | | | | | | | | | | | | |
| | | | |
Health Care: 8.15% | | | | | | | | | | | | | | | | |
| | | | |
| Biotechnology: 1.64% | | | | | | | | | | | | | | | | |
AbbVie Incorporated | | | | | | | | | | | 4,112 | | | | 257,493 | |
Alexion Pharmaceuticals Incorporated † | | | | | | | | | | | 567 | | | | 69,372 | |
Amgen Incorporated | | | | | | | | | | | 1,882 | | | | 275,167 | |
Biogen Incorporated † | | | | | | | | | | | 550 | | | | 155,969 | |
Celgene Corporation † | | | | | | | | | | | 1,962 | | | | 227,102 | |
Gilead Sciences Incorporated | | | | | | | | | | | 3,334 | | | | 238,748 | |
Regeneron Pharmaceuticals Incorporated † | | | | | | | | | | | 190 | | | | 69,747 | |
Vertex Pharmaceuticals Incorporated † | | | | | | | | | | | 627 | | | | 46,191 | |
| | | | |
| | | | | | | | | | | | | | | 1,339,789 | |
| | | | | | | | | | | | | | | | |
| | | | |
| Health Care Equipment & Supplies: 1.46% | | | | | | | | | | | | | | | | |
Abbott Laboratories | | | | | | | | | | | 3,726 | | | | 143,116 | |
Baxter International Incorporated | | | | | | | | | | | 1,239 | | | | 54,937 | |
Becton Dickinson & Company | | | | | | | | | | | 537 | | | | 88,900 | |
Boston Scientific Corporation † | | | | | | | | | | | 3,446 | | | | 74,537 | |
C.R. Bard Incorporated | | | | | | | | | | | 185 | | | | 41,562 | |
Danaher Corporation | | | | | | | | | | | 1,541 | | | | 119,951 | |
Dentsply Sirona Incorporated | | | | | | | | | | | 584 | | | | 33,714 | |
Edwards Lifesciences Corporation † | | | | | | | | | | | 541 | | | | 50,692 | |
Hologic Incorporated † | | | | | | | | | | | 704 | | | | 28,244 | |
Intuitive Surgical Incorporated † | | | | | | | | | | | 97 | | | | 61,514 | |
Medtronic plc | | | | | | | | | | | 3,474 | | | | 247,453 | |
St. Jude Medical Incorporated | | | | | | | | | | | 723 | | | | 57,977 | |
Stryker Corporation | | | | | | | | | | | 786 | | | | 94,171 | |
The Cooper Companies Incorporated | | | | | | | | | | | 123 | | | | 21,516 | |
Varian Medical Systems Incorporated † | | | | | �� | | | | | | 236 | | | | 21,188 | |
Zimmer Biomet Holdings Incorporated | | | | | | | | | | | 506 | | | | 52,219 | |
| | | | |
| | | | | | | | | | | | | | | 1,191,691 | |
| | | | | | | | | | | | | | | | |
| | | | |
| Health Care Providers & Services: 1.58% | | | | | | | | | | | | | | | | |
Aetna Incorporated | | | | | | | | | | | 888 | | | | 110,121 | |
AmerisourceBergen Corporation | | | | | | | | | | | 423 | | | | 33,074 | |
Anthem Incorporated | | | | | | | | | | | 666 | | | | 95,751 | |
Cardinal Health Incorporated | | | | | | | | | | | 810 | | | | 58,296 | |
Centene Corporation † | | | | | | | | | | | 432 | | | | 24,412 | |
Cigna Corporation | | | | | | | | | | | 649 | | | | 86,570 | |
DaVita HealthCare Partners Incorporated † | | | | | | | | | | | 399 | | | | 25,616 | |
Envision Healthcare Corporation † | | | | | | | | | | | 296 | | | | 18,734 | |
Express Scripts Holding Company † | | | | | | | | | | | 1,560 | | | | 107,312 | |
The accompanying notes are an integral part of these financial statements.
| | | | |
| 16 | | Wells Fargo VT Index Asset Allocation Fund | | Portfolio of investments—December 31, 2016 |
| | | | | | | | | | | | | | | | |
| Security name | | | | | | | | Shares | | | Value | |
| | | | |
| Health Care Providers & Services (continued) | | | | | | | | | | | | | | | | |
HCA Holdings Incorporated † | | | | | | | | | | | 739 | | | $ | 54,701 | |
Henry Schein Incorporated † | | | | | | | | | | | 203 | | | | 30,797 | |
Humana Incorporated | | | | | | | | | | | 377 | | | | 76,919 | |
Laboratory Corporation of America Holdings † | | | | | | | | | | | 260 | | | | 33,379 | |
McKesson Corporation | | | | | | | | | | | 572 | | | | 80,337 | |
Patterson Companies Incorporated | | | | | | | | | | | 210 | | | | 8,616 | |
Quest Diagnostics Incorporated | | | | | | | | | | | 350 | | | | 32,165 | |
UnitedHealth Group Incorporated | | | | | | | | | | | 2,409 | | | | 385,536 | |
Universal Health Services Incorporated Class B | | | | | | | | | | | 226 | | | | 24,042 | |
| | | | |
| | | | | | | | | | | | | | | 1,286,378 | |
| | | | | | | | | | | | | | | | |
| | | | |
| Health Care Technology: 0.05% | | | | | | | | | | | | | | | | |
Cerner Corporation † | | | | | | | | | | | 764 | | | | 36,191 | |
| | | | | | | | | | | | | | | | |
| | | | |
| Life Sciences Tools & Services: 0.36% | | | | | | | | | | | | | | | | |
Agilent Technologies Incorporated | | | | | | | | | | | 821 | | | | 37,405 | |
Illumina Incorporated † | | | | | | | | | | | 371 | | | | 47,503 | |
Mettler-Toledo International Incorporated † | | | | | | | | | | | 65 | | | | 27,206 | |
PerkinElmer Incorporated | | | | | | | | | | | 277 | | | | 14,446 | |
Thermo Fisher Scientific Incorporated | | | | | | | | | | | 1,000 | | | | 141,100 | |
Waters Corporation † | | | | | | | | | | | 203 | | | | 27,281 | |
| | | | |
| | | | | | | | | | | | | | | 294,941 | |
| | | | | | | | | | | | | | | | |
| | | | |
| Pharmaceuticals: 3.06% | | | | | | | | | | | | | | | | |
Allergan plc | | | | | | | | | | | 949 | | | | 199,299 | |
Bristol-Myers Squibb Company | | | | | | | | | | | 4,229 | | | | 247,143 | |
Eli Lilly & Company | | | | | | | | | | | 2,459 | | | | 180,859 | |
Endo International plc † | | | | | | | | | | | 501 | | | | 8,251 | |
Johnson & Johnson | | | | | | | | | | | 6,884 | | | | 793,106 | |
Mallinckrodt plc † | | | | | | | | | | | 267 | | | | 13,302 | |
Merck & Company Incorporated | | | | | | | | | | | 6,977 | | | | 410,736 | |
Mylan NV † | | | | | | | | | | | 1,165 | | | | 44,445 | |
Perrigo Company plc | | | | | | | | | | | 362 | | | | 30,129 | |
Pfizer Incorporated | | | | | | | | | | | 15,356 | | | | 498,763 | |
Zoetis Incorporated | | | | | | | | | | | 1,250 | | | | 66,913 | |
| | | | |
| | | | | | | | | | | | | | | 2,492,946 | |
| | | | | | | | | | | | | | | | |
| | | | |
Industrials: 6.14% | | | | | | | | | | | | | | | | |
| | | | |
| Aerospace & Defense: 1.32% | | | | | | | | | | | | | | | | |
Arconic Incorporated | | | | | | | | | | | 1,110 | | | | 20,579 | |
General Dynamics Corporation | | | | | | | | | | | 723 | | | | 124,833 | |
L3 Technologies Incorporated | | | | | | | | | | | 195 | | | | 29,661 | |
Lockheed Martin Corporation | | | | | | | | | | | 637 | | | | 159,212 | |
Northrop Grumman Corporation | | | | | | | | | | | 445 | | | | 103,498 | |
Raytheon Company | | | | | | | | | | | 742 | | | | 105,364 | |
Rockwell Collins Incorporated | | | | | | | | | | | 330 | | | | 30,611 | |
Textron Incorporated | | | | | | | | | | | 684 | | | | 33,215 | |
The Boeing Company | | | | | | | | | | | 1,452 | | | | 226,047 | |
The accompanying notes are an integral part of these financial statements.
| | | | | | |
| Portfolio of investments—December 31, 2016 | | Wells Fargo VT Index Asset Allocation Fund | | | 17 | |
| | | | | | | | | | | | | | | | |
| Security name | | | | | | | | Shares | | | Value | |
| | | | |
| Aerospace & Defense (continued) | | | | | | | | | | | | | | | | |
TransDigm Group Incorporated | | | | | | | | | | | 126 | | | $ | 31,369 | |
United Technologies Corporation | | | | | | | | | | | 1,937 | | | | 212,334 | |
| | | | |
| | | | | | | | | | | | | | | 1,076,723 | |
| | | | | | | | | | | | | | | | |
| | | | |
| Air Freight & Logistics: 0.45% | | | | | | | | | | | | | | | | |
C.H. Robinson Worldwide Incorporated | | | | | | | | | | | 358 | | | | 26,227 | |
Expeditors International of Washington Incorporated | | | | | | | | | | | 455 | | | | 24,097 | |
FedEx Corporation | | | | | | | | | | | 618 | | | | 115,072 | |
United Parcel Service Incorporated Class B | | | | | | | | | | | 1,744 | | | | 199,932 | |
| | | | |
| | | | | | | | | | | | | | | 365,328 | |
| | | | | | | | | | | | | | | | |
| | | | |
| Airlines: 0.38% | | | | | | | | | | | | | | | | |
Alaska Air Group Incorporated | | | | | | | | | | | 311 | | | | 27,595 | |
American Airlines Group Incorporated | | | | | | | | | | | 1,311 | | | | 61,211 | |
Delta Air Lines Incorporated | | | | | | | | | | | 1,863 | | | | 91,641 | |
Southwest Airlines Company | | | | | | | | | | | 1,557 | | | | 77,601 | |
United Continental Holdings Incorporated † | | | | | | | | | | | 730 | | | | 53,202 | |
| | | | |
| | | | | | | | | | | | | | | 311,250 | |
| | | | | | | | | | | | | | | | |
| | | | |
| Building Products: 0.20% | | | | | | | | | | | | | | | | |
Allegion plc | | | | | | | | | | | 242 | | | | 15,488 | |
Fortune Brands Home & Security Incorporated | | | | | | | | | | | 391 | | | | 20,903 | |
Johnson Controls International plc | | | | | | | | | | | 2,370 | | | | 97,620 | |
Masco Corporation | | | | | | | | | | | 831 | | | | 26,276 | |
| | | | |
| | | | | | | | | | | | | | | 160,287 | |
| | | | | | | | | | | | | | | | |
| | | | |
| Commercial Services & Supplies: 0.19% | | | | | | | | | | | | | | | | |
Cintas Corporation | | | | | | | | | | | 217 | | | | 25,077 | |
Pitney Bowes Incorporated | | | | | | | | | | | 469 | | | | 7,124 | |
Republic Services Incorporated | | | | | | | | | | | 585 | | | | 33,374 | |
Stericycle Incorporated † | | | | | | | | | | | 214 | | | | 16,487 | |
Waste Management Incorporated | | | | | | | | | | | 1,029 | | | | 72,966 | |
| | | | |
| | | | | | | | | | | | | | | 155,028 | |
| | | | | | | | | | | | | | | | |
| | | | |
| Construction & Engineering: 0.06% | | | | | | | | | | | | | | | | |
Fluor Corporation | | | | | | | | | | | 353 | | | | 18,540 | |
Jacobs Engineering Group Incorporated † | | | | | | | | | | | 304 | | | | 17,328 | |
Quanta Services Incorporated † | | | | | | | | | | | 382 | | | | 13,313 | |
| | | | |
| | | | | | | | | | | | | | | 49,181 | |
| | | | | | | | | | | | | | | | |
| | | | |
| Electrical Equipment: 0.33% | | | | | | | | | | | | | | | | |
Acuity Brands Incorporated | | | | | | | | | | | 111 | | | | 25,625 | |
AMETEK Incorporated | | | | | | | | | | | 586 | | | | 28,480 | |
Eaton Corporation plc | | | | | | | | | | | 1,142 | | | | 76,617 | |
Emerson Electric Company | | | | | | | | | | | 1,627 | | | | 90,705 | |
Rockwell Automation Incorporated | | | | | | | | | | | 323 | | | | 43,411 | |
| | | | |
| | | | | | | | | | | | | | | 264,838 | |
| | | | | | | | | | | | | | | | |
The accompanying notes are an integral part of these financial statements.
| | | | |
| 18 | | Wells Fargo VT Index Asset Allocation Fund | | Portfolio of investments—December 31, 2016 |
| | | | | | | | | | | | | | | | |
| Security name | | | | | | | | Shares | | | Value | |
| | | | |
| Industrial Conglomerates: 1.53% | | | | | | | | | | | | | | | | |
3M Company | | | | | | | | | | | 1,521 | | | $ | 271,605 | |
General Electric Company | | | | | | | | | | | 22,386 | | | | 707,398 | |
Honeywell International Incorporated | | | | | | | | | | | 1,929 | | | | 223,475 | |
Roper Industries Incorporated | | | | | | | | | | | 256 | | | | 46,868 | |
| | | | |
| | | | | | | | | | | | | | | 1,249,346 | |
| | | | | | | | | | | | | | | | |
| | | | |
| Machinery: 0.88% | | | | | | | | | | | | | | | | |
Caterpillar Incorporated | | | | | | | | | | | 1,480 | | | | 137,255 | |
Cummins Incorporated | | | | | | | | | | | 390 | | | | 53,301 | |
Deere & Company | | | | | | | | | | | 732 | | | | 75,425 | |
Dover Corporation | | | | | | | | | | | 393 | | | | 29,447 | |
Flowserve Corporation | | | | | | | | | | | 329 | | | | 15,808 | |
Fortive Corporation | | | | | | | | | | | 761 | | | | 40,812 | |
Illinois Tool Works Incorporated | | | | | | | | | | | 799 | | | | 97,846 | |
Ingersoll-Rand plc | | | | | | | | | | | 653 | | | | 49,001 | |
Paccar Incorporated | | | | | | | | | | | 887 | | | | 56,679 | |
Parker-Hannifin Corporation | | | | | | | | | | | 337 | | | | 47,180 | |
Pentair plc | | | | | | | | | | | 423 | | | | 23,718 | |
Snap-on Incorporated | | | | | | | | | | | 146 | | | | 25,005 | |
Stanley Black & Decker Incorporated | | | | | | | | | | | 382 | | | | 43,812 | |
Xylem Incorporated | | | | | | | | | | | 453 | | | | 22,433 | |
| | | | |
| | | | | | | | | | | | | | | 717,722 | |
| | | | | | | | | | | | | | | | |
| | | | |
| Professional Services: 0.16% | | | | | | | | | | | | | | | | |
Dun & Bradstreet Corporation | | | | | | | | | | | 92 | | | | 11,161 | |
Equifax Incorporated | | | | | | | | | | | 302 | | | | 35,705 | |
Nielsen Holdings plc | | | | | | | | | | | 850 | | | | 35,658 | |
Robert Half International Incorporated | | | | | | | | | | | 325 | | | | 15,854 | |
Verisk Analytics Incorporated † | | | | | | | | | | | 394 | | | | 31,981 | |
| | | | |
| | | | | | | | | | | | | | | 130,359 | |
| | | | | | | | | | | | | | | | |
| | | | |
| Road & Rail: 0.53% | | | | | | | | | | | | | | | | |
CSX Corporation | | | | | | | | | | | 2,370 | | | | 85,154 | |
J.B. Hunt Transport Services Incorporated | | | | | | | | | | | 221 | | | | 21,452 | |
Kansas City Southern | | | | | | | | | | | 272 | | | | 23,079 | |
Norfolk Southern Corporation | | | | | | | | | | | 738 | | | | 79,756 | |
Ryder System Incorporated | | | | | | | | | | | 135 | | | | 10,049 | |
Union Pacific Corporation | | | | | | | | | | | 2,085 | | | | 216,173 | |
| | | | |
| | | | | | | | | | | | | | | 435,663 | |
| | | | | | | | | | | | | | | | |
| | | | |
| Trading Companies & Distributors: 0.11% | | | | | | | | | | | | | | | | |
Fastenal Company | | | | | | | | | | | 732 | | | | 34,389 | |
United Rentals Incorporated † | | | | | | | | | | | 212 | | | | 22,383 | |
W.W. Grainger Incorporated | | | | | | | | | | | 138 | | | | 32,051 | |
| | | | |
| | | | | | | | | | | | | | | 88,823 | |
| | | | | | | | | | | | | | | | |
| | | | |
Information Technology: 12.42% | | | | | | | | | | | | | | | | |
| | | | |
| Communications Equipment: 0.62% | | | | | | | | | | | | | | | | |
Cisco Systems Incorporated | | | | | | | | | | | 12,703 | | | | 383,885 | |
F5 Networks Incorporated † | | | | | | | | | | | 164 | | | | 23,734 | |
The accompanying notes are an integral part of these financial statements.
| | | | | | |
| Portfolio of investments—December 31, 2016 | | Wells Fargo VT Index Asset Allocation Fund | | | 19 | |
| | | | | | | | | | | | | | | | |
| Security name | | | | | | | | Shares | | | Value | |
| | | | |
| Communications Equipment (continued) | | | | | | | | | | | | | | | | |
Harris Corporation | | | | | | | | | | | 313 | | | $ | 32,073 | |
Juniper Networks Incorporated | | | | | | | | | | | 962 | | | | 27,186 | |
Motorola Solutions Incorporated | | | | | | | | | | | 420 | | | | 34,814 | |
| | | | |
| | | | | | | | | | | | | | | 501,692 | |
| | | | | | | | | | | | | | | | |
| | | | |
| Electronic Equipment, Instruments & Components: 0.23% | | | | | | | | | | | | | | | | |
Amphenol Corporation Class A | | | | | | | | | | | 780 | | | | 52,416 | |
Corning Incorporated | | | | | | | | | | | 2,407 | | | | 58,418 | |
FLIR Systems Incorporated | | | | | | | | | | | 344 | | | | 12,449 | |
TE Connectivity Limited | | | | | | | | | | | 899 | | | | 62,283 | |
| | | | |
| | | | | | | | | | | | | | | 185,566 | |
| | | | | | | | | | | | | | | | |
| | | | |
| Internet Software & Services: 2.53% | | | | | | | | | | | | | | | | |
Akamai Technologies Incorporated † | | | | | | | | | | | 438 | | | | 29,206 | |
Alphabet Incorporated Class A † | | | | | | | | | | | 749 | | | | 593,545 | |
Alphabet Incorporated Class C † | | | | | | | | | | | 751 | | | | 579,637 | |
eBay Incorporated † | | | | | | | | | | | 2,631 | | | | 78,114 | |
Facebook Incorporated Class A † | | | | | | | | | | | 5,923 | | | | 681,441 | |
VeriSign Incorporated † | | | | | | | | | | | 229 | | | | 17,420 | |
Yahoo! Incorporated † | | | | | | | | | | | 2,222 | | | | 85,925 | |
| | | | |
| | | | | | | | | | | | | | | 2,065,288 | |
| | | | | | | | | | | | | | | | |
| | | | |
| IT Services: 2.21% | | | | | | | | | | | | | | | | |
Accenture plc Class A | | | | | | | | | | | 1,569 | | | | 183,777 | |
Alliance Data Systems Corporation | | | | | | | | | | | 146 | | | | 33,361 | |
Automatic Data Processing Incorporated | | | | | | | | | | | 1,141 | | | | 117,272 | |
Cognizant Technology Solutions Corporation Class A † | | | | | | | | | | | 1,536 | | | | 86,062 | |
CSRA Incorporated | | | | | | | | | | | 367 | | | | 11,685 | |
Fidelity National Information Services Incorporated | | | | | | | | | | | 830 | | | | 62,781 | |
Fiserv Incorporated † | | | | | | | | | | | 549 | | | | 58,348 | |
Global Payments Incorporated | | | | | | | | | | | 388 | | | | 26,931 | |
International Business Machines Corporation | | | | | | | | | | | 2,189 | | | | 363,352 | |
MasterCard Incorporated Class A | | | | | | | | | | | 2,409 | | | | 248,729 | |
Paychex Incorporated | | | | | | | | | | | 814 | | | | 49,556 | |
PayPal Holdings Incorporated † | | | | | | | | | | | 2,840 | | | | 112,095 | |
Teradata Corporation † | | | | | | | | | | | 328 | | | | 8,912 | |
The Western Union Company | | | | | | | | | | | 1,227 | | | | 26,650 | |
Total System Services Incorporated | | | | | | | | | | | 418 | | | | 20,495 | |
Visa Incorporated Class A | | | | | | | | | | | 4,726 | | | | 368,723 | |
Xerox Corporation | | | | | | | | | | | 2,155 | | | | 18,813 | |
| | | | |
| | | | | | | | | | | | | | | 1,797,542 | |
| | | | | | | | | | | | | | | | |
| | | | |
| Semiconductors & Semiconductor Equipment: 2.00% | | | | | | | | | | | | | | | | |
Analog Devices Incorporated | | | | | | | | | | | 780 | | | | 56,644 | |
Applied Materials Incorporated | | | | | | | | | | | 2,736 | | | | 88,291 | |
Broadcom Limited | | | | | | | | | | | 1,005 | | | | 177,654 | |
First Solar Incorporated † | | | | | | | | | | | 196 | | | | 6,290 | |
Intel Corporation | | | | | | | | | | | 11,993 | | | | 434,986 | |
KLA-Tencor Corporation | | | | | | | | | | | 395 | | | | 31,079 | |
The accompanying notes are an integral part of these financial statements.
| | | | |
| 20 | | Wells Fargo VT Index Asset Allocation Fund | | Portfolio of investments—December 31, 2016 |
| | | | | | | | | | | | | | | | |
| Security name | | | | | | | | Shares | | | Value | |
| | | | |
| Semiconductors & Semiconductor Equipment (continued) | | | | | | | | | | | | | | | | |
Lam Research Corporation | | | | | | | | | | | 412 | | | $ | 43,561 | |
Linear Technology Corporation | | | | | | | | | | | 608 | | | | 37,909 | |
Microchip Technology Incorporated | | | | | | | | | | | 546 | | | | 35,026 | |
Micron Technology Incorporated † | | | | | | | | | | | 2,635 | | | | 57,759 | |
NVIDIA Corporation | | | | | | | | | | | 1,364 | | | | 145,593 | |
Qorvo Incorporated † | | | | | | | | | | | 322 | | | | 16,979 | |
QUALCOMM Incorporated | | | | | | | | | | | 3,737 | | | | 243,652 | |
Skyworks Solutions Incorporated | | | | | | | | | | | 469 | | | | 35,016 | |
Texas Instruments Incorporated | | | | | | | | | | | 2,529 | | | | 184,541 | |
Xilinx Incorporated | | | | | | | | | | | 638 | | | | 38,516 | |
| | | | |
| | | | | | | | | | | | | | | 1,633,496 | |
| | | | | | | | | | | | | | | | |
| | | | |
| Software: 2.59% | | | | | | | | | | | | | | | | |
Activision Blizzard Incorporated | | | | | | | | | | | 1,730 | | | | 62,470 | |
Adobe Systems Incorporated † | | | | | | | | | | | 1,258 | | | | 129,511 | |
Autodesk Incorporated † | | | | | | | | | | | 495 | | | | 36,635 | |
CA Incorporated | | | | | | | | | | | 793 | | | | 25,194 | |
Citrix Systems Incorporated † | | | | | | | | | | | 394 | | | | 35,188 | |
Electronic Arts Incorporated † | | | | | | | | | | | 764 | | | | 60,173 | |
Intuit Incorporated | | | | | | | | | | | 616 | | | | 70,600 | |
Microsoft Corporation | | | | | | | | | | | 19,676 | | | | 1,222,667 | |
Oracle Corporation | | | | | | | | | | | 7,584 | | | | 291,605 | |
Red Hat Incorporated † | | | | | | | | | | | 453 | | | | 31,574 | |
Salesforce.com Incorporated † | | | | | | | | | | | 1,615 | | | | 110,563 | |
Symantec Corporation | | | | | | | | | | | 1,577 | | | | 37,675 | |
| | | | |
| | | | | | | | | | | | | | | 2,113,855 | |
| | | | | | | | | | | | | | | | |
| | | | |
| Technology Hardware, Storage & Peripherals: 2.24% | | | | | | | | | | | | | | | | |
Apple Incorporated | | | | | | | | | | | 13,494 | | | | 1,562,875 | |
Hewlett Packard Enterprise Company | | | | | | | | | | | 4,216 | | | | 97,558 | |
HP Incorporated | | | | | | | | | | | 4,329 | | | | 64,242 | |
NetApp Incorporated | | | | | | | | | | | 697 | | | | 24,583 | |
Seagate Technology plc | | | | | | | | | | | 745 | | | | 28,437 | |
Western Digital Corporation | | | | | | | | | | | 722 | | | | 49,060 | |
| | | | |
| | | | | | | | | | | | | | | 1,826,755 | |
| | | | | | | | | | | | | | | | |
| | | | |
Materials: 1.70% | | | | | | | | | | | | | | | | |
| | | | |
| Chemicals: 1.24% | | | | | | | | | | | | | | | | |
Air Products & Chemicals Incorporated | | | | | | | | | | | 550 | | | | 79,101 | |
Albemarle Corporation | | | | | | | | | | | 284 | | | | 24,447 | |
CF Industries Holdings Incorporated | | | | | | | | | | | 590 | | | | 18,573 | |
Dow Chemical Company | | | | | | | | | | | 2,837 | | | | 162,333 | |
E.I. du Pont de Nemours & Company | | | | | | | | | | | 2,199 | | | | 161,407 | |
Eastman Chemical Company | | | | | | | | | | | 371 | | | | 27,903 | |
Ecolab Incorporated | | | | | | | | | | | 664 | | | | 77,834 | |
FMC Corporation | | | | | | | | | | | 338 | | | | 19,117 | |
International Flavors & Fragrances Incorporated | | | | | | | | | | | 200 | | | | 23,566 | |
LyondellBasell Industries NV Class A | | | | | | | | | | | 846 | | | | 72,570 | |
Monsanto Company | | | | | | | | | | | 1,108 | | | | 116,573 | |
The accompanying notes are an integral part of these financial statements.
| | | | | | |
| Portfolio of investments—December 31, 2016 | | Wells Fargo VT Index Asset Allocation Fund | | | 21 | |
| | | | | | | | | | | | | | | | |
| Security name | | | | | | | | Shares | | | Value | |
| | | | |
| Chemicals (continued) | | | | | | | | | | | | | | | | |
PPG Industries Incorporated | | | | | | | | | | | 668 | | | $ | 63,300 | |
Praxair Incorporated | | | | | | | | | | | 722 | | | | 84,611 | |
The Mosaic Company | | | | | | | | | | | 887 | | | | 26,016 | |
The Sherwin-Williams Company | | | | | | | | | | | 204 | | | | 54,823 | |
| | | | |
| | | | | | | | | | | | | | | 1,012,174 | |
| | | | | | | | | | | | | | | | |
| | | | |
| Construction Materials: 0.10% | | | | | | | | | | | | | | | | |
Martin Marietta Materials Incorporated | | | | | | | | | | | 159 | | | | 35,223 | |
Vulcan Materials Company | | | | | | | | | | | 334 | | | | 41,800 | |
| | | | |
| | | | | | | | | | | | | | | 77,023 | |
| | | | | | | | | | | | | | | | |
| | | | |
| Containers & Packaging: 0.19% | | | | | | | | | | | | | | | | |
Avery Dennison Corporation | | | | | | | | | | | 224 | | | | 15,729 | |
Ball Corporation | | | | | | | | | | | 442 | | | | 33,181 | |
International Paper Company | | | | | | | | | | | 1,040 | | | | 55,182 | |
Sealed Air Corporation | | | | | | | | | | | 488 | | | | 22,126 | |
WestRock Company | | | | | | | | | | | 635 | | | | 32,239 | |
| | | | |
| | | | | | | | | | | | | | | 158,457 | |
| | | | | | | | | | | | | | | | |
| | | | |
| Metals & Mining: 0.17% | | | | | | | | | | | | | | | | |
Freeport-McMoRan Incorporated † | | | | | | | | | | | 3,170 | | | | 41,812 | |
Newmont Mining Corporation | | | | | | | | | | | 1,343 | | | | 45,756 | |
Nucor Corporation | | | | | | | | | | | 806 | | | | 47,973 | |
| | | | |
| | | | | | | | | | | | | | | 135,541 | |
| | | | | | | | | | | | | | | | |
| | | | |
Real Estate: 1.72% | | | | | | | | | | | | | | | | |
| | | | |
| Equity REITs: 1.69% | | | | | | | | | | | | | | | | |
American Tower Corporation | | | | | | | | | | | 1,077 | | | | 113,817 | |
Apartment Investment & Management Company Class A | | | | | | | | | | | 397 | | | | 18,044 | |
AvalonBay Communities Incorporated | | | | | | | | | | | 347 | | | | 61,471 | |
Boston Properties Incorporated | | | | | | | | | | | 390 | | | | 49,054 | |
Crown Castle International Corporation | | | | | | | | | | | 912 | | | | 79,134 | |
Digital Realty Trust Incorporated | | | | | | | | | | | 402 | | | | 39,501 | |
Equinix Incorporated | | | | | | | | | | | 180 | | | | 64,334 | |
Equity Residential | | | | | | | | | | | 925 | | | | 59,533 | |
Essex Property Trust Incorporated | | | | | | | | | | | 165 | | | | 38,363 | |
Extra Space Storage Incorporated | | | | | | | | | | | 317 | | | | 24,485 | |
Federal Realty Investment Trust | | | | | | | | | | | 181 | | | | 25,722 | |
General Growth Properties Incorporated | | | | | | | | | | | 1,477 | | | | 36,895 | |
HCP Incorporated | | | | | | | | | | | 1,183 | | | | 35,159 | |
Host Hotels & Resorts Incorporated | | | | | | | | | | | 1,872 | | | | 35,268 | |
Iron Mountain Incorporated | | | | | | | | | | | 619 | | | | 20,105 | |
Kimco Realty Corporation | | | | | | | | | | | 1,075 | | | | 27,047 | |
Mid-America Apartment Communities Incorporated | | | | | | | | | | | 287 | | | | 28,103 | |
Prologis Incorporated | | | | | | | | | | | 1,337 | | | | 70,580 | |
Public Storage Incorporated | | | | | | | | | | | 377 | | | | 84,260 | |
Realty Income Corporation | | | | | | | | | | | 654 | | | | 37,592 | |
Simon Property Group Incorporated | | | | | | | | | | | 795 | | | | 141,248 | |
The accompanying notes are an integral part of these financial statements.
| | | | |
| 22 | | Wells Fargo VT Index Asset Allocation Fund | | Portfolio of investments—December 31, 2016 |
| | | | | | | | | | | | | | | | |
| Security name | | | | | | | | Shares | | | Value | |
| | | | |
| Equity REITs (continued) | | | | | | | | | | | | | | | | |
SL Green Realty Corporation | | | | | | | | | | | 256 | | | | 27,533 | |
The Macerich Company | | | | | | | | | | | 304 | | | | 21,535 | |
UDR Incorporated | | | | | | | | | | | 676 | | | | 24,660 | |
Ventas Incorporated | | | | | | | | | | | 895 | | | | 55,955 | |
Vornado Realty Trust | | | | | | | | | | | 435 | | | | 45,401 | |
Welltower Incorporated | | | | | | | | | | | 917 | | | | 61,375 | |
Weyerhaeuser Company | | | | | | | | | | | 1,893 | | | | 56,960 | |
| | | | |
| | | | | | | | | | | | | | | 1,383,134 | |
| | | | | | | | | | | | | | | | |
| | | | |
| Real Estate Management & Development: 0.03% | | | | | | | | | | | | | | | | |
CBRE Group Incorporated Class A † | | | | | | | | | | | 759 | | | | 23,901 | |
| | | | | | | | | | | | | | | | |
| | | | |
Telecommunication Services: 1.59% | | | | | | | | | | | | | | | | |
| | | | |
| Diversified Telecommunication Services: 1.59% | | | | | | | | | | | | | | | | |
AT&T Incorporated | | | | | | | | | | | 15,541 | | | | 660,959 | |
CenturyLink Incorporated | | | | | | | | | | | 1,384 | | | | 32,912 | |
Frontier Communications Corporation | | | | | | | | | | | 2,968 | | | | 10,032 | |
Level 3 Communications Incorporated † | | | | | | | | | | | 738 | | | | 41,594 | |
Verizon Communications Incorporated | | | | | | | | | | | 10,317 | | | | 550,721 | |
| | | | |
| | | | | | | | | | | | | | | 1,296,218 | |
| | | | | | | | | | | | | | | | |
| | | | |
Utilities: 1.90% | | | | | | | | | | | | | | | | |
| | | | |
| Electric Utilities: 1.18% | | | | | | | | | | | | | | | | |
Alliant Energy Corporation | | | | | | | | | | | 576 | | | | 21,825 | |
American Electric Power Company Incorporated | | | | | | | | | | | 1,244 | | | | 78,322 | |
Duke Energy Corporation | | | | | | | | | | | 1,743 | | | | 135,292 | |
Edison International | | | | | | | | | | | 824 | | | | 59,320 | |
Entergy Corporation | | | | | | | | | | | 452 | | | | 33,208 | |
Eversource Energy | | | | | | | | | | | 802 | | | | 44,294 | |
Exelon Corporation | | | | | | | | | | | 2,337 | | | | 82,940 | |
FirstEnergy Corporation | | | | | | | | | | | 1,077 | | | | 33,355 | |
NextEra Energy Incorporated | | | | | | | | | | | 1,182 | | | | 141,202 | |
PG&E Corporation | | | | | | | | | | | 1,279 | | | | 77,725 | |
Pinnacle West Capital Corporation | | | | | | | | | | | 281 | | | | 21,926 | |
PPL Corporation | | | | | | | | | | | 1,720 | | | | 58,566 | |
The Southern Company | | | | | | | | | | | 2,480 | | | | 121,991 | |
Xcel Energy Incorporated | | | | | | | | | | | 1,286 | | | | 52,340 | |
| | | | |
| | | | | | | | | | | | | | | 962,306 | |
| | | | | | | | | | | | | | | | |
| | | | |
| Independent Power & Renewable Electricity Producers: 0.04% | | | | | | | | | | | | | | | | |
AES Corporation | | | | | | | | | | | 1,668 | | | | 19,382 | |
NRG Energy Incorporated | | | | | | | | | | | 798 | | | | 9,783 | |
| | | | |
| | | | | | | | | | | | | | | 29,165 | |
| | | | | | | | | | | | | | | | |
| | | | |
| Multi-Utilities: 0.64% | | | | | | | | | | | | | | | | |
Ameren Corporation | | | | | | | | | | | 613 | | | | 32,158 | |
CenterPoint Energy Incorporated | | | | | | | | | | | 1,090 | | | | 26,858 | |
CMS Energy Corporation | | | | | | | | | | | 706 | | | | 29,384 | |
The accompanying notes are an integral part of these financial statements.
| | | | | | |
| Portfolio of investments—December 31, 2016 | | Wells Fargo VT Index Asset Allocation Fund | | | 23 | |
| | | | | | | | | | | | | | | | |
| Security name | | | | | | | | Shares | | | Value | |
| | | | |
| Multi-Utilities (continued) | | | | | | | | | | | | | | | | |
Consolidated Edison Incorporated | | | | | | | | | | | 771 | | | $ | 56,807 | |
Dominion Resources Incorporated | | | | | | | | | | | 1,586 | | | | 121,472 | |
DTE Energy Company | | | | | | | | | | | 453 | | | | 44,625 | |
NiSource Incorporated | | | | | | | | | | | 816 | | | | 18,066 | |
Public Service Enterprise Group Incorporated | | | | | | | | | | | 1,281 | | | | 56,210 | |
SCANA Corporation | | | | | | | | | | | 361 | | | | 26,454 | |
Sempra Energy | | | | | | | | | | | 632 | | | | 63,604 | |
WEC Energy Group Incorporated | | | | | | | | | | | 798 | | | | 46,803 | |
| | | | |
| | | | | | | | | | | | | | | 522,441 | |
| | | | | | | | | | | | | | | | |
| | | | |
| Water Utilities: 0.04% | | | | | | | | | | | | | | | | |
American Water Works Company Incorporated | | | | | | | | | | | 449 | | | | 32,490 | |
| | | | | | | | | | | | | | | | |
| | | | |
Total Common Stocks (Cost $27,827,986) | | | | | | | | | | | | | | | 48,736,515 | |
| | | | | | | | | | | | | | | | |
| | | | |
| | | | | | Expiration date | | | | | | | |
| Rights: 0.00% | | | | | | | | | | | | | | | | |
| | | | |
Consumer Staples: 0.00% | | | | | | | | | | | | | | | | |
| | | | |
| Food & Staples Retailing: 0.00% | | | | | | | | | | | | | | | | |
Safeway Casa Ley Contingent Value Rights (a)(i)† | | | | | | | 1-30-2019 | | | | 684 | | | | 0 | |
Safeway PDC LLC Contingent Value Rights (a)(i)† | | | | | | | 1-30-2017 | | | | 684 | | | | 0 | |
| | | | |
Total Rights (Cost $725) | | | | | | | | | | | | | | | 0 | |
| | | | | | | | | | | | | | | | |
| | | | |
| | | Interest rate | | | Maturity date | | | Principal | | | | |
| U.S. Treasury Securities: 38.03% | | | | | | | | | | | | | | | | |
U.S. Treasury Bond | | | 2.75 | % | | | 8-15-2042 | | | $ | 126,000 | | | | 118,784 | |
U.S. Treasury Bond | | | 2.75 | | | | 11-15-2042 | | | | 126,000 | | | | 118,762 | |
U.S. Treasury Bond | | | 2.88 | | | | 5-15-2043 | | | | 182,000 | | | | 175,416 | |
U.S. Treasury Bond | | | 3.00 | | | | 5-15-2042 | | | | 84,000 | | | | 83,126 | |
U.S. Treasury Bond | | | 3.13 | | | | 11-15-2041 | | | | 66,000 | | | | 66,848 | |
U.S. Treasury Bond | | | 3.13 | | | | 2-15-2042 | | | | 87,000 | | | | 88,102 | |
U.S. Treasury Bond | | | 3.13 | | | | 2-15-2043 | | | | 129,000 | | | | 130,434 | |
U.S. Treasury Bond | | | 3.50 | | | | 2-15-2039 | | | | 61,000 | | | | 66,586 | |
U.S. Treasury Bond | | | 3.63 | | | | 8-15-2043 | | | | 156,000 | | | | 172,514 | |
U.S. Treasury Bond | | | 3.75 | | | | 8-15-2041 | | | | 68,000 | | | | 76,440 | |
U.S. Treasury Bond | | | 3.88 | | | | 8-15-2040 | | | | 71,000 | | | | 81,367 | |
U.S. Treasury Bond | | | 4.25 | | | | 5-15-2039 | | | | 57,000 | | | | 69,080 | |
U.S. Treasury Bond | | | 4.25 | | | | 11-15-2040 | | | | 74,000 | | | | 89,675 | |
U.S. Treasury Bond | | | 4.38 | | | | 2-15-2038 | | | | 32,000 | | | | 39,695 | |
U.S. Treasury Bond | | | 4.38 | | | | 11-15-2039 | | | | 57,000 | | | | 70,237 | |
U.S. Treasury Bond | | | 4.38 | | | | 5-15-2040 | | | | 83,000 | | | | 102,361 | |
U.S. Treasury Bond | | | 4.38 | | | | 5-15-2041 | | | | 65,000 | | | | 80,275 | |
U.S. Treasury Bond | | | 4.50 | | | | 2-15-2036 | | | | 70,000 | | | | 88,416 | |
U.S. Treasury Bond | | | 4.50 | | | | 5-15-2038 | | | | 36,000 | | | | 45,390 | |
U.S. Treasury Bond | | | 4.50 | | | | 8-15-2039 | | | | 59,000 | | | | 73,959 | |
U.S. Treasury Bond | | | 4.63 | | | | 2-15-2040 | | | | 102,000 | | | | 130,120 | |
U.S. Treasury Bond | | | 4.75 | | | | 2-15-2037 | | | | 24,000 | | | | 31,182 | |
U.S. Treasury Bond | | | 4.75 | | | | 2-15-2041 | | | | 88,000 | | | | 114,521 | |
The accompanying notes are an integral part of these financial statements.
| | | | |
| 24 | | Wells Fargo VT Index Asset Allocation Fund | | Portfolio of investments—December 31, 2016 |
| | | | | | | | | | | | | | | | |
| | | Interest rate | | | Maturity date | | | Principal | | | Value | |
| | | | |
U.S. Treasury Securities (continued) | | | | | | | | | | | | | | | | |
U.S. Treasury Bond | | | 5.00 | % | | | 5-15-2037 | | | $ | 29,000 | | | $ | 38,871 | |
U.S. Treasury Bond | | | 5.25 | | | | 11-15-2028 | | | | 45,000 | | | | 57,194 | |
U.S. Treasury Bond | | | 5.25 | | | | 2-15-2029 | | | | 33,000 | | | | 42,111 | |
U.S. Treasury Bond | | | 5.38 | | | | 2-15-2031 | | | | 70,000 | | | | 93,070 | |
U.S. Treasury Bond | | | 5.50 | | | | 8-15-2028 | | | | 35,000 | | | | 45,241 | |
U.S. Treasury Bond | | | 6.00 | | | | 2-15-2026 | | | | 42,000 | | | | 54,237 | |
U.S. Treasury Bond | | | 6.13 | | | | 11-15-2027 | | | | 49,000 | | | | 65,660 | |
U.S. Treasury Bond | | | 6.13 | | | | 8-15-2029 | | | | 25,000 | | | | 34,483 | |
U.S. Treasury Bond | | | 6.25 | | | | 5-15-2030 | | | | 45,000 | | | | 63,557 | |
U.S. Treasury Bond | | | 6.38 | | | | 8-15-2027 | | | | 21,000 | | | | 28,546 | |
U.S. Treasury Bond | | | 6.63 | | | | 2-15-2027 | | | | 18,000 | | | | 24,673 | |
U.S. Treasury Note | | | 0.63 | | | | 11-30-2017 | | | | 153,000 | | | | 152,635 | |
U.S. Treasury Note | | | 0.63 | | | | 4-30-2018 | | | | 164,000 | | | | 163,183 | |
U.S. Treasury Note | | | 0.63 | | | | 6-30-2018 | | | | 117,000 | | | | 116,250 | |
U.S. Treasury Note | | | 0.75 | | | | 12-31-2017 | | | | 163,000 | | | | 162,724 | |
U.S. Treasury Note | | | 0.75 | | | | 1-31-2018 | | | | 116,000 | | | | 115,748 | |
U.S. Treasury Note | | | 0.75 | | | | 2-28-2018 | | | | 153,000 | | | | 152,629 | |
U.S. Treasury Note | | | 0.75 | | | | 3-31-2018 | | | | 133,000 | | | | 132,604 | |
U.S. Treasury Note | | | 0.75 | | | | 4-15-2018 | | | | 127,000 | | | | 126,597 | |
U.S. Treasury Note | | | 0.75 | | | | 4-30-2018 | | | | 119,000 | | | | 118,598 | |
U.S. Treasury Note | | | 0.75 | | | | 7-31-2018 | | | | 117,000 | | | | 116,358 | |
U.S. Treasury Note | | | 0.75 | | | | 8-31-2018 | | | | 118,000 | | | | 117,254 | |
U.S. Treasury Note « | | | 0.75 | | | | 9-30-2018 | | | | 118,000 | | | | 117,183 | |
U.S. Treasury Note | | | 0.75 | | | | 10-31-2018 | | | | 118,000 | | | | 117,130 | |
U.S. Treasury Note | | | 0.75 | | | | 2-15-2019 | | | | 107,000 | | | | 105,907 | |
U.S. Treasury Note | | | 0.75 | | | | 7-15-2019 | | | | 108,000 | | | | 106,391 | |
U.S. Treasury Note | | | 0.75 | | | | 8-15-2019 | | | | 108,000 | | | | 106,295 | |
U.S. Treasury Note | | | 0.88 | | | | 11-30-2017 | | | | 115,000 | | | | 115,004 | |
U.S. Treasury Note | | | 0.88 | | | | 1-15-2018 | | | | 125,000 | | | | 124,934 | |
U.S. Treasury Note | | | 0.88 | | | | 1-31-2018 | | | | 115,000 | | | | 114,908 | |
U.S. Treasury Note | | | 0.88 | | | | 3-31-2018 | | | | 118,000 | | | | 117,838 | |
U.S. Treasury Note | | | 0.88 | | | | 5-31-2018 | | | | 119,000 | | | | 118,755 | |
U.S. Treasury Note | | | 0.88 | | | | 7-15-2018 | | | | 117,000 | | | | 116,610 | |
U.S. Treasury Note | | | 0.88 | | | | 10-15-2018 | | | | 106,000 | | | | 105,468 | |
U.S. Treasury Note | | | 0.88 | | | | 4-15-2019 | | | | 109,000 | | | | 107,988 | |
U.S. Treasury Note | | | 0.88 | | | | 5-15-2019 | | | | 110,000 | | | | 108,912 | |
U.S. Treasury Note | | | 0.88 | | | | 6-15-2019 | | | | 108,000 | | | | 106,832 | |
U.S. Treasury Note | | | 0.88 | | | | 7-31-2019 | | | | 76,000 | | | | 75,089 | |
U.S. Treasury Note | | | 0.88 | | | | 9-15-2019 | | | | 106,000 | | | | 104,568 | |
U.S. Treasury Note | | | 1.00 | | | | 12-15-2017 | | | | 132,000 | | | | 132,133 | |
U.S. Treasury Note | | | 1.00 | | | | 12-31-2017 | | | | 115,000 | | | | 115,084 | |
U.S. Treasury Note | | | 1.00 | | | | 2-15-2018 | | | | 125,000 | | | | 125,036 | |
U.S. Treasury Note | | | 1.00 | | | | 3-15-2018 | | | | 125,000 | | | | 125,049 | |
U.S. Treasury Note | | | 1.00 | | | | 5-15-2018 | | | | 124,000 | | | | 123,944 | |
U.S. Treasury Note | | | 1.00 | | | | 5-31-2018 | | | | 152,000 | | | | 151,924 | |
U.S. Treasury Note | | | 1.00 | | | | 8-15-2018 | | | | 117,000 | | | | 116,827 | |
U.S. Treasury Note | | | 1.00 | | | | 9-15-2018 | | | | 117,000 | | | | 116,734 | |
U.S. Treasury Note | | | 1.00 | | | | 11-30-2018 | | | | 103,000 | | | | 102,649 | |
U.S. Treasury Note | | | 1.00 | | | | 3-15-2019 | | | | 107,000 | | | | 106,402 | |
U.S. Treasury Note | | | 1.00 | | | | 6-30-2019 | | | | 58,000 | | | | 57,526 | |
U.S. Treasury Note | | | 1.00 | | | | 8-31-2019 | | | | 79,000 | | | | 78,224 | |
The accompanying notes are an integral part of these financial statements.
| | | | | | |
| Portfolio of investments—December 31, 2016 | | Wells Fargo VT Index Asset Allocation Fund | | | 25 | |
| | | | | | | | | | | | | | | | |
| | | Interest rate | | | Maturity date | | | Principal | | | Value | |
| | | | |
U.S. Treasury Securities (continued) | | | | | | | | | | | | | | | | |
U.S. Treasury Note | | | 1.00 | % | | | 9-30-2019 | | | $ | 148,000 | | | $ | 146,392 | |
U.S. Treasury Note | | | 1.00 | | | | 10-15-2019 | | | | 109,000 | | | | 107,784 | |
U.S. Treasury Note | | | 1.00 | | | | 11-15-2019 | | | | 96,000 | | | | 94,799 | |
U.S. Treasury Note | | | 1.00 | | | | 11-30-2019 | | | | 142,000 | | | | 140,221 | |
U.S. Treasury Note | | | 1.13 | | | | 6-15-2018 | | | | 124,000 | | | | 124,107 | |
U.S. Treasury Note | | | 1.13 | | | | 1-15-2019 | | | | 106,000 | | | | 105,772 | |
U.S. Treasury Note | | | 1.13 | | | | 5-31-2019 | | | | 65,000 | | | | 64,714 | |
U.S. Treasury Note | | | 1.13 | | | | 12-31-2019 | | | | 95,000 | | | | 94,026 | |
U.S. Treasury Note | | | 1.13 | | | | 3-31-2020 | | | | 93,000 | | | | 91,743 | |
U.S. Treasury Note | | | 1.13 | | | | 4-30-2020 | | | | 104,000 | | | | 102,502 | |
U.S. Treasury Note | | | 1.13 | | | | 2-28-2021 | | | | 226,000 | | | | 219,710 | |
U.S. Treasury Note | | | 1.13 | | | | 6-30-2021 | | | | 228,000 | | | | 220,465 | |
U.S. Treasury Note | | | 1.13 | | | | 7-31-2021 | | | | 153,000 | | | | 147,756 | |
U.S. Treasury Note | | | 1.13 | | | | 8-31-2021 | | | | 153,000 | | | | 147,688 | |
U.S. Treasury Note | | | 1.13 | | | | 9-30-2021 | | | | 152,000 | | | | 146,471 | |
U.S. Treasury Note | | | 1.25 | | | | 10-31-2018 | | | | 165,000 | | | | 165,233 | |
U.S. Treasury Note | | | 1.25 | | | | 11-15-2018 | | | | 108,000 | | | | 108,143 | |
U.S. Treasury Note | | | 1.25 | | | | 11-30-2018 | | | | 155,000 | | | | 155,192 | |
U.S. Treasury Note | | | 1.25 | | | | 12-15-2018 | | | | 108,000 | | | | 108,095 | |
U.S. Treasury Note | | | 1.25 | | | | 1-31-2019 | | | | 125,000 | | | | 125,042 | |
U.S. Treasury Note | | | 1.25 | | | | 4-30-2019 | | | | 51,000 | | | | 50,954 | |
U.S. Treasury Note | | | 1.25 | | | | 10-31-2019 | | | | 75,000 | | | | 74,646 | |
U.S. Treasury Note | | | 1.25 | | | | 1-31-2020 | | | | 225,000 | | | | 223,224 | |
U.S. Treasury Note | | | 1.25 | | | | 2-29-2020 | | | | 152,000 | | | | 150,702 | |
U.S. Treasury Note | | | 1.25 | | | | 3-31-2021 | | | | 226,000 | | | | 220,589 | |
U.S. Treasury Note | | | 1.25 | | | | 10-31-2021 | | | | 151,000 | | | | 146,277 | |
U.S. Treasury Note | | | 1.25 | | | | 7-31-2023 | | | | 125,000 | | | | 117,532 | |
U.S. Treasury Note | | | 1.38 | | | | 6-30-2018 | | | | 127,000 | | | | 127,580 | |
U.S. Treasury Note | | | 1.38 | | | | 7-31-2018 | | | | 151,000 | | | | 151,651 | |
U.S. Treasury Note | | | 1.38 | | | | 9-30-2018 | | | | 208,000 | | | | 208,745 | |
U.S. Treasury Note | | | 1.38 | | | | 11-30-2018 | | | | 74,000 | | | | 74,254 | |
U.S. Treasury Note | | | 1.38 | | | | 12-31-2018 | | | | 91,000 | | | | 91,274 | |
U.S. Treasury Note | | | 1.38 | | | | 2-28-2019 | | | | 121,000 | | | | 121,308 | |
U.S. Treasury Note | | | 1.38 | | | | 1-31-2020 | | | | 101,000 | | | | 100,562 | |
U.S. Treasury Note | | | 1.38 | | | | 2-29-2020 | | | | 228,000 | | | | 226,783 | |
U.S. Treasury Note | | | 1.38 | | | | 3-31-2020 | | | | 226,000 | | | | 224,683 | |
U.S. Treasury Note | | | 1.38 | | | | 4-30-2020 | | | | 226,000 | | | | 224,404 | |
U.S. Treasury Note | | | 1.38 | | | | 5-31-2020 | | | | 106,000 | | | | 105,261 | |
U.S. Treasury Note | | | 1.38 | | | | 8-31-2020 | | | | 256,000 | | | | 253,158 | |
U.S. Treasury Note | | | 1.38 | | | | 9-30-2020 | | | | 256,000 | | | | 252,911 | |
U.S. Treasury Note | | | 1.38 | | | | 10-31-2020 | | | | 232,000 | | | | 228,977 | |
U.S. Treasury Note | | | 1.38 | | | | 1-31-2021 | | | | 232,000 | | | | 228,101 | |
U.S. Treasury Note | | | 1.38 | | | | 4-30-2021 | | | | 226,000 | | | | 221,503 | |
U.S. Treasury Note | | | 1.38 | | | | 5-31-2021 | | | | 226,000 | | | | 221,305 | |
U.S. Treasury Note | | | 1.38 | | | | 6-30-2023 | | | | 126,000 | | | | 119,545 | |
U.S. Treasury Note | | | 1.38 | | | | 8-31-2023 | | | | 124,000 | | | | 117,341 | |
U.S. Treasury Note | | | 1.38 | | | | 9-30-2023 | | | | 90,000 | | | | 85,124 | |
U.S. Treasury Note | | | 1.50 | | | | 8-31-2018 | | | | 200,000 | | | | 201,221 | |
U.S. Treasury Note | | | 1.50 | | | | 12-31-2018 | | | | 144,000 | | | | 144,805 | |
U.S. Treasury Note | | | 1.50 | | | | 1-31-2019 | | | | 161,000 | | | | 161,834 | |
U.S. Treasury Note | | | 1.50 | | | | 2-28-2019 | | | | 147,000 | | | | 147,765 | |
The accompanying notes are an integral part of these financial statements.
| | | | |
| 26 | | Wells Fargo VT Index Asset Allocation Fund | | Portfolio of investments—December 31, 2016 |
| | | | | | | | | | | | | | | | |
| | | Interest rate | | | Maturity date | | | Principal | | | Value | |
| | | | |
U.S. Treasury Securities (continued) | | | | | | | | | | | | | | | | |
U.S. Treasury Note | | | 1.50 | % | | | 3-31-2019 | | | $ | 60,000 | | | $ | 60,290 | |
U.S. Treasury Note | | | 1.50 | | | | 5-31-2019 | | | | 158,000 | | | | 158,675 | |
U.S. Treasury Note | | | 1.50 | | | | 10-31-2019 | | | | 225,000 | | | | 225,439 | |
U.S. Treasury Note | | | 1.50 | | | | 11-30-2019 | | | | 226,000 | | | | 226,355 | |
U.S. Treasury Note | | | 1.50 | | | | 5-31-2020 | | | | 226,000 | | | | 225,166 | |
U.S. Treasury Note | | | 1.50 | | | | 1-31-2022 | | | | 128,000 | | | | 124,981 | |
U.S. Treasury Note | | | 1.50 | | | | 2-28-2023 | | | | 126,000 | | | | 121,044 | |
U.S. Treasury Note | | | 1.50 | | | | 3-31-2023 | | | | 126,000 | | | | 120,925 | |
U.S. Treasury Note | | | 1.50 | | | | 8-15-2026 | | | | 102,000 | | | | 93,660 | |
U.S. Treasury Note | | | 1.63 | | | | 3-31-2019 | | | | 154,000 | | | | 155,176 | |
U.S. Treasury Note | | | 1.63 | | | | 4-30-2019 | | | | 159,000 | | | | 160,192 | |
U.S. Treasury Note | | | 1.63 | | | | 6-30-2019 | | | | 157,000 | | | | 158,114 | |
U.S. Treasury Note | | | 1.63 | | | | 7-31-2019 | | | | 155,000 | | | | 156,023 | |
U.S. Treasury Note | | | 1.63 | | | | 8-31-2019 | | | | 229,000 | | | | 230,488 | |
U.S. Treasury Note | | | 1.63 | | | | 12-31-2019 | | | | 225,000 | | | | 225,988 | |
U.S. Treasury Note | | | 1.63 | | | | 6-30-2020 | | | | 225,000 | | | | 224,955 | |
U.S. Treasury Note | | | 1.63 | | | | 7-31-2020 | | | | 253,000 | | | | 252,657 | |
U.S. Treasury Note | | | 1.63 | | | | 11-30-2020 | | | | 155,000 | | | | 154,254 | |
U.S. Treasury Note | | | 1.63 | | | | 8-15-2022 | | | | 117,000 | | | | 113,977 | |
U.S. Treasury Note | | | 1.63 | | | | 11-15-2022 | | | | 150,000 | | | | 145,815 | |
U.S. Treasury Note | | | 1.63 | | | | 4-30-2023 | | | | 128,000 | | | | 123,653 | |
U.S. Treasury Note | | | 1.63 | | | | 5-31-2023 | | | | 128,000 | | | | 123,507 | |
U.S. Treasury Note | | | 1.63 | | | | 10-31-2023 | | | | 90,000 | | | | 86,479 | |
U.S. Treasury Note | | | 1.63 | | | | 2-15-2026 | | | | 102,000 | | | | 95,160 | |
U.S. Treasury Note | | | 1.63 | | | | 5-15-2026 | | | | 105,000 | | | | 97,759 | |
U.S. Treasury Note | | | 1.75 | | | | 10-31-2018 | | | | 66,000 | | | | 66,691 | |
U.S. Treasury Note | | | 1.75 | | | | 9-30-2019 | | | | 228,000 | | | | 230,143 | |
U.S. Treasury Note | | | 1.75 | | | | 10-31-2020 | | | | 148,000 | | | | 148,181 | |
U.S. Treasury Note | | | 1.75 | | | | 12-31-2020 | | | | 232,000 | | | | 231,737 | |
U.S. Treasury Note | | | 1.75 | | | | 11-30-2021 | | | | 134,000 | | | | 132,867 | |
U.S. Treasury Note | | | 1.75 | | | | 2-28-2022 | | | | 129,000 | | | | 127,326 | |
U.S. Treasury Note | | | 1.75 | | | | 3-31-2022 | | | | 128,000 | | | | 126,162 | |
U.S. Treasury Note | | | 1.75 | | | | 4-30-2022 | | | | 126,000 | | | | 124,121 | |
U.S. Treasury Note | | | 1.75 | | | | 5-15-2022 | | | | 111,000 | | | | 109,253 | |
U.S. Treasury Note | | | 1.75 | | | | 9-30-2022 | | | | 144,000 | | | | 141,114 | |
U.S. Treasury Note | | | 1.75 | | | | 1-31-2023 | | | | 129,000 | | | | 125,881 | |
U.S. Treasury Note | | | 1.75 | | | | 5-15-2023 | | | | 226,000 | | | | 219,859 | |
U.S. Treasury Note | | | 1.88 | | | | 6-30-2020 | | | | 86,000 | | | | 86,772 | |
U.S. Treasury Note | | | 1.88 | | | | 11-30-2021 | | | | 128,000 | | | | 127,528 | |
U.S. Treasury Note | | | 1.88 | | | | 5-31-2022 | | | | 128,000 | | | | 126,834 | |
U.S. Treasury Note | | | 1.88 | | | | 8-31-2022 | | | | 142,000 | | | | 140,192 | |
U.S. Treasury Note | | | 1.88 | | | | 10-31-2022 | | | | 143,000 | | | | 140,943 | |
U.S. Treasury Note | | | 2.00 | | | | 7-31-2020 | | | | 101,000 | | | | 102,235 | |
U.S. Treasury Note | | | 2.00 | | | | 9-30-2020 | | | | 106,000 | | | | 107,122 | |
U.S. Treasury Note | | | 2.00 | | | | 11-30-2020 | | | | 122,000 | | | | 123,165 | |
U.S. Treasury Note | | | 2.00 | | | | 2-28-2021 | | | | 136,000 | | | | 136,967 | |
U.S. Treasury Note | | | 2.00 | | | | 5-31-2021 | | | | 146,000 | | | | 146,763 | |
U.S. Treasury Note | | | 2.00 | | | | 8-31-2021 | | | | 127,000 | | | | 127,385 | |
U.S. Treasury Note | | | 2.00 | | | | 10-31-2021 | | | | 126,000 | | | | 126,240 | |
U.S. Treasury Note | | | 2.00 | | | | 11-15-2021 | | | | 178,000 | | | | 178,317 | |
The accompanying notes are an integral part of these financial statements.
| | | | | | |
| Portfolio of investments—December 31, 2016 | | Wells Fargo VT Index Asset Allocation Fund | | | 27 | |
| | | | | | | | | | | | | | | | |
| | | Interest rate | | | Maturity date | | | Principal | | | Value | |
| | | | |
U.S. Treasury Securities (continued) | | | | | | | | | | | | | | | | |
U.S. Treasury Note | | | 2.00 | % | | | 2-15-2022 | | | $ | 133,000 | | | $ | 133,071 | |
U.S. Treasury Note | | | 2.00 | | | | 7-31-2022 | | | | 144,000 | | | | 143,315 | |
U.S. Treasury Note | | | 2.00 | | | | 11-30-2022 | | | | 129,000 | | | | 127,984 | |
U.S. Treasury Note | | | 2.00 | | | | 2-15-2023 | | | | 220,000 | | | | 217,935 | |
U.S. Treasury Note | | | 2.00 | | | | 2-15-2025 | | | | 289,000 | | | | 280,892 | |
U.S. Treasury Note | | | 2.00 | | | | 8-15-2025 | | | | 220,000 | | | | 212,800 | |
U.S. Treasury Note | | | 2.00 | | | | 11-15-2026 | | | | 170,000 | | | | 163,300 | |
U.S. Treasury Note | | | 2.13 | | | | 8-31-2020 | | | | 138,000 | | | | 140,132 | |
U.S. Treasury Note | | | 2.13 | | | | 1-31-2021 | | | | 132,000 | | | | 133,647 | |
U.S. Treasury Note | | | 2.13 | | | | 6-30-2021 | | | | 142,000 | | | | 143,400 | |
U.S. Treasury Note | | | 2.13 | | | | 8-15-2021 | | | | 178,000 | | | | 179,521 | |
U.S. Treasury Note | | | 2.13 | | | | 9-30-2021 | | | | 128,000 | | | | 129,011 | |
U.S. Treasury Note | | | 2.13 | | | | 12-31-2021 | | | | 126,000 | | | | 126,950 | |
U.S. Treasury Note | | | 2.13 | | | | 6-30-2022 | | | | 126,000 | | | | 126,307 | |
U.S. Treasury Note | | | 2.13 | | | | 12-31-2022 | | | | 129,000 | | | | 128,783 | |
U.S. Treasury Note | | | 2.13 | | | | 11-30-2023 | | | | 110,000 | | | | 109,136 | |
U.S. Treasury Note | | | 2.13 | | | | 5-15-2025 | | | | 234,000 | | | | 229,071 | |
U.S. Treasury Note | | | 2.25 | | | | 11-30-2017 | | | | 117,000 | | | | 118,430 | |
U.S. Treasury Note | | | 2.25 | | | | 7-31-2018 | | | | 49,000 | | | | 49,875 | |
U.S. Treasury Note | | | 2.25 | | | | 3-31-2021 | | | | 135,000 | | | | 137,323 | |
U.S. Treasury Note | | | 2.25 | | | | 4-30-2021 | | | | 142,000 | | | | 144,364 | |
U.S. Treasury Note | | | 2.25 | | | | 7-31-2021 | | | | 194,000 | | | | 196,856 | |
U.S. Treasury Note | | | 2.25 | | | | 11-15-2024 | | | | 290,000 | | | | 287,838 | |
U.S. Treasury Note | | | 2.25 | | | | 11-15-2025 | | | | 219,000 | | | | 215,878 | |
U.S. Treasury Note | | | 2.38 | | | | 5-31-2018 | | | | 58,000 | | | | 59,074 | |
U.S. Treasury Note | | | 2.38 | | | | 6-30-2018 | | | | 74,000 | | | | 75,422 | |
U.S. Treasury Note | | | 2.38 | | | | 12-31-2020 | | | | 123,000 | | | | 125,900 | |
U.S. Treasury Note | | | 2.38 | | | | 8-15-2024 | | | | 289,000 | | | | 289,966 | |
U.S. Treasury Note | | | 2.50 | | | | 8-15-2023 | | | | 190,000 | | | | 193,140 | |
U.S. Treasury Note | | | 2.50 | | | | 5-15-2024 | | | | 281,000 | | | | 284,843 | |
U.S. Treasury Note | | | 2.63 | | | | 1-31-2018 | | | | 81,000 | | | | 82,435 | |
U.S. Treasury Note | | | 2.63 | | | | 4-30-2018 | | | | 62,000 | | | | 63,309 | |
U.S. Treasury Note | | | 2.63 | | | | 8-15-2020 | | | | 220,000 | | | | 227,318 | |
U.S. Treasury Note | | | 2.63 | | | | 11-15-2020 | | | | 355,000 | | | | 366,643 | |
U.S. Treasury Note | | | 2.75 | | | | 12-31-2017 | | | | 90,000 | | | | 91,616 | |
U.S. Treasury Note | | | 2.75 | | | | 2-28-2018 | | | | 71,000 | | | | 72,418 | |
U.S. Treasury Note | | | 2.75 | | | | 2-15-2019 | | | | 128,000 | | | | 131,986 | |
U.S. Treasury Note | | | 2.75 | | | | 11-15-2023 | | | | 251,000 | | | | 258,963 | |
U.S. Treasury Note | | | 2.75 | | | | 2-15-2024 | | | | 217,000 | | | | 223,845 | |
U.S. Treasury Note | | | 2.88 | | | | 3-31-2018 | | | | 80,000 | | | | 81,871 | |
U.S. Treasury Note | | | 3.13 | | | | 5-15-2019 | | | | 142,000 | | | | 148,004 | |
U.S. Treasury Note | | | 3.13 | | | | 5-15-2021 | | | | 155,000 | | | | 163,195 | |
U.S. Treasury Note | | | 3.38 | | | | 11-15-2019 | | | | 159,000 | | | | 167,672 | |
U.S. Treasury Note | | | 3.50 | | | | 2-15-2018 | | | | 120,000 | | | | 123,357 | |
U.S. Treasury Note | | | 3.50 | | | | 5-15-2020 | | | | 138,000 | | | | 146,594 | |
U.S. Treasury Note | | | 3.63 | | | | 8-15-2019 | | | | 145,000 | | | | 153,436 | |
U.S. Treasury Note | | | 3.63 | | | | 2-15-2020 | | | | 191,000 | | | | 203,132 | |
U.S. Treasury Note | | | 3.63 | | | | 2-15-2021 | | | | 199,000 | | | | 213,439 | |
U.S. Treasury Note | | | 3.75 | | | | 11-15-2018 | | | | 141,000 | | | | 147,696 | |
U.S. Treasury Note | | | 3.88 | | | | 5-15-2018 | | | | 65,000 | | | | 67,530 | |
U.S. Treasury Note | | | 4.00 | | | | 8-15-2018 | | | | 74,000 | | | | 77,478 | |
The accompanying notes are an integral part of these financial statements.
| | | | |
| 28 | | Wells Fargo VT Index Asset Allocation Fund | | Portfolio of investments—December 31, 2016 |
| | | | | | | | | | | | | | | | |
| | | Interest rate | | | Maturity date | | | Principal | | | Value | |
| | | | |
U.S. Treasury Securities (continued) | | | | | | | | | | | | | | | | |
U.S. Treasury Note | | | 6.25 | % | | | 8-15-2023 | | | $ | 35,000 | | | $ | 43,705 | |
U.S. Treasury Note | | | 6.50 | | | | 11-15-2026 | | | | 28,000 | | | | 37,866 | |
U.S. Treasury Note | | | 6.75 | | | | 8-15-2026 | | | | 21,000 | | | | 28,718 | |
U.S. Treasury Note | | | 6.88 | | | | 8-15-2025 | | | | 21,000 | | | | 28,376 | |
U.S. Treasury Note | | | 7.13 | | | | 2-15-2023 | | | | 24,000 | | | | 30,874 | |
U.S. Treasury Note | | | 7.25 | | | | 8-15-2022 | | | | 24,000 | | | | 30,582 | |
U.S. Treasury Note | | | 7.50 | | | | 11-15-2024 | | | | 22,000 | | | | 30,237 | |
U.S. Treasury Note | | | 7.63 | | | | 11-15-2022 | | | | 12,000 | | | | 15,658 | |
U.S. Treasury Note | | | 7.63 | | | | 2-15-2025 | | | | 20,000 | | | | 27,846 | |
U.S. Treasury Note | | | 7.88 | | | | 2-15-2021 | | | | 15,000 | | | | 18,594 | |
U.S. Treasury Note | | | 8.00 | | | | 11-15-2021 | | | | 48,000 | | | | 61,422 | |
U.S. Treasury Note | | | 8.13 | | | | 8-15-2019 | | | | 29,000 | | | | 34,002 | |
U.S. Treasury Note | | | 8.13 | | | | 5-15-2021 | | | | 17,000 | | | | 21,437 | |
U.S. Treasury Note | | | 8.13 | | | | 8-15-2021 | | | | 15,000 | | | | 19,087 | |
U.S. Treasury Note | | | 8.50 | | | | 2-15-2020 | | | | 15,000 | | | | 18,180 | |
U.S. Treasury Note | | | 8.75 | | | | 5-15-2020 | | | | 12,000 | | | | 14,799 | |
U.S. Treasury Note | | | 8.75 | | | | 8-15-2020 | | | | 27,000 | | | | 33,696 | |
U.S. Treasury Note | | | 8.88 | | | | 2-15-2019 | | | | 29,000 | | | | 33,682 | |
U.S. Treasury Note | | | 9.00 | | | | 11-15-2018 | | | | 18,000 | | | | 20,601 | |
U.S. Treasury Note | | | 9.13 | | | | 5-15-2018 | | | | 16,000 | | | | 17,750 | |
| | | | |
Total U.S. Treasury Securities (Cost $31,208,834) | | | | | | | | | | | | | | | 30,994,474 | |
| | | | | | | | | | | | | | | | |
| | | | |
| | | Yield | | | | | | Shares | | | | |
| Short-Term Investments: 2.17% | | | | | | | | | | | | | | | | |
| | | | |
| Investment Companies: 2.15% | | | | | | | | | | | | | | | | |
Securities Lending Cash Investment LLC (l)(r)(u) | | | 0.83 | | | | | | | | 113,422 | | | | 113,434 | |
Wells Fargo Government Money Market Fund Select Class (l)(u) | | | 0.43 | | | | | | | | 1,639,441 | | | | 1,639,441 | |
| | | | |
| | | | | | | | | | | | | | | 1,752,875 | |
| | | | | | | | | | | | | | | | |
| | | | |
| | | | | | | | | Principal | | | | |
| U.S. Treasury Securities: 0.02% | | | | | | | | | | | | | | | | |
Treasury Bill #(z) | | | 0.48 | | | | 3-30-2017 | | | $ | 17,000 | | | | 16,980 | |
| | | | | | | | | | | | | | | | |
| | | | |
Total Short-Term Investments (Cost $1,769,855) | | | | | | | | | | | | | | | 1,769,855 | |
| | | | | | | | | | | | | | | | |
| | | | | | | | |
| Total investments in securities (Cost $60,807,400) * | | | 99.99 | % | | | 81,500,844 | |
Other assets and liabilities, net | | | 0.01 | | | | 4,636 | |
| | | | | | | | |
| Total net assets | | | 100.00 | % | | $ | 81,505,480 | |
| | | | | | | | |
| † | Non-income-earning security |
| (l) | The issuer of the security is an affiliated person of the Fund as defined in the Investment Company Act of 1940. |
| (a) | The security is fair valued in accordance with procedures approved by the Board of Trustees. |
| (i) | Illiquid security for which the designation as illiquid is unaudited. |
| « | All or a portion of this security is on loan. |
| (r) | The investment is a non-registered investment vehicle purchased with cash collateral received from securities on loan. |
| (u) | The rate represents the 7-day annualized yield at period end. |
| # | All or a portion of this security is segregated as collateral for investments in derivative instruments. |
| (z) | Zero coupon security. The rate represents the current yield to maturity. |
| * | Cost for federal income tax purposes is $62,300,018 and unrealized gains (losses) consists of: |
| | | | |
Gross unrealized gains | | $ | 21,891,015 | |
Gross unrealized losses | | | (2,690,189 | ) |
| | | | |
Net unrealized gains | | $ | 19,200,826 | |
The accompanying notes are an integral part of these financial statements.
| | | | | | |
| Statement of assets and liabilities—December 31, 2016 | | Wells Fargo VT Index Asset Allocation Fund | | | 29 | |
| | | | |
| | | | |
| |
Assets | | | | |
Investments | | | | |
In unaffiliated securities (including $111,243 of securities loaned), at value (cost $58,721,284) | | $ | 79,117,621 | |
In affiliated securities, at value (cost $2,086,116) | | | 2,383,223 | |
| | | | |
Total investments, at value (cost $60,807,400) | | | 81,500,844 | |
Cash | | | 314 | |
Receivable for investments sold | | | 202,123 | |
Receivable for Fund shares sold | | | 199 | |
Receivable for dividends and interest | | | 231,124 | |
Receivable for daily variation margin on open futures contracts | | | 2,133 | |
Receivable for securities lending income | | | 18 | |
Prepaid expenses and other assets | | | 10,629 | |
| | | | |
Total assets | | | 81,947,384 | |
| | | | |
| |
Liabilities | | | | |
Payable for investments purchased | | | 174,681 | |
Payable for Fund shares redeemed | | | 76,550 | |
Payable upon receipt of securities loaned | | | 113,434 | |
Payable for daily variation margin on open futures contracts | | | 445 | |
Management fee payable | | | 31,810 | |
Distribution fee payable | | | 18,343 | |
Administration fee payable | | | 5,869 | |
Accrued expenses and other liabilities | | | 20,772 | |
| | | | |
Total liabilities | | | 441,904 | |
| | | | |
Total net assets | | $ | 81,505,480 | |
| | | | |
| |
NET ASSETS CONSIST OF | | | | |
Paid-in capital | | $ | 58,981,443 | |
Undistributed net investment income | | | 2,500 | |
Accumulated net realized gains on investments | | | 1,826,040 | |
Net unrealized gains on investments | | | 20,695,497 | |
| | | | |
Total net assets | | $ | 81,505,480 | |
| | | | |
| |
COMPUTATION OF NET ASSET VALUE PER SHARE | | | | |
Net assets – Class 2 | | $ | 81,505,480 | |
Shares outstanding – Class 21 | | | 4,255,018 | |
Net asset value per share – Class 2 | | | $19.16 | |
| 1 | The Fund has an unlimited number of authorized shares. |
The accompanying notes are an integral part of these financial statements.
| | | | |
| 30 | | Wells Fargo VT Index Asset Allocation Fund | | Statement of operations—year ended December 31, 2016 |
| | | | |
| | | | |
| |
Investment income | | | | |
Dividends | | $ | 1,085,700 | |
Interest | | | 443,559 | |
Income from affiliated securities | | | 23,881 | |
Securities lending income, net | | | 1,816 | |
| | | | |
Total investment income | | | 1,554,956 | |
| | | | |
| |
Expenses | | | | |
Management fee | | | 483,454 | |
Administration fee | | | | |
Class 2 | | | 64,461 | |
Distribution fee | | | | |
Class 2 | | | 201,439 | |
Custody and accounting fees | | | 36,342 | |
Professional fees | | | 43,179 | |
Shareholder report expenses | | | 19,912 | |
Trustees’ fees and expenses | | | 21,969 | |
Other fees and expenses | | | 16,903 | |
| | | | |
Total expenses | | | 887,659 | |
Less: Fee waivers and/or expense reimbursements | | | (81,903 | ) |
| | | | |
Net expenses | | | 805,756 | |
| | | | |
Net investment income | | | 749,200 | |
| | | | |
| |
REALIZED AND UNREALIZED GAINS (LOSSES) ON INVESTMENTS | | | | |
| |
Net realized gains on: | | | | |
Unaffiliated securities | | | 2,928,784 | |
Affiliated securities | | | 22,470 | |
Futures transactions | | | 565,338 | |
| | | | |
Net realized gains on investments | | | 3,516,592 | |
| | | | |
| |
Net change in unrealized gains (losses) on: | | | | |
Unaffiliated securities | | | 1,701,259 | |
Affiliated securities | | | (21,225 | ) |
Futures transactions | | | 11,546 | |
| | | | |
Net change in unrealized gains (losses) on investments | | | 1,691,580 | |
| | | | |
Net realized and unrealized gains (losses) on investments | | | 5,208,172 | |
| | | | |
Net increase in net assets resulting from operations | | $ | 5,957,372 | |
| | | | |
The accompanying notes are an integral part of these financial statements.
| | | | | | |
| Statement of changes in net assets | | Wells Fargo VT Index Asset Allocation Fund | | | 31 | |
| | | | | | | | | | | | | | | | |
| | | Year ended
December 31, 2016 | | | Year ended
December 31, 2015 | |
| | | | |
Operations | | | | | | | | | | | | | | | | |
Net investment income | | | | | | $ | 749,200 | | | | | | | $ | 837,040 | |
Net realized gains on investments | | | | | | | 3,516,592 | | | | | | | | 9,821,765 | |
Net change in unrealized gains (losses) on investments | | | | | | | 1,691,580 | | | | | | | | (9,533,114 | ) |
| | | | |
Net increase in net assets resulting from operations | | | | | | | 5,957,372 | | | | | | | | 1,125,691 | |
| | | | |
| | | | |
Distributions to shareholders from | | | | | | | | | | | | | | | | |
Net investment income – Class 2 | | | | | | | (720,605 | ) | | | | | | | (897,884 | ) |
Net realized gains – Class 2 | | | | | | | (2,289,129 | ) | | | | | | | 0 | |
| | | | |
Total distributions to shareholders | | | | | | | (3,009,734 | ) | | | | | | | (897,884 | ) |
| | | | |
| | | | |
Capital share transactions | | | Shares | | | | | | | | Shares | | | | | |
Proceeds from shares sold – Class 2 | | | 333,800 | | | | 6,245,984 | | | | 198,509 | | | | 3,701,571 | |
Reinvestment of distributions – Class 2 | | | 162,349 | | | | 3,009,734 | | | | 48,466 | | | | 897,884 | |
Payment for shares redeemed – Class 2 | | | (653,618 | ) | | | (12,192,875 | ) | | | (834,694 | ) | | | (15,478,408 | ) |
| | | | |
Net decrease in net assets resulting from capital share transactions | | | | | | | (2,937,157 | ) | | | | | | | (10,878,953 | ) |
| | | | |
Total increase (decrease) in net assets | | | | | | | 10,481 | | | | | | | | (10,651,146 | ) |
| | | | |
| | | | |
Net assets | | | | | | | | | | | | | | | | |
Beginning of period | | | | | | | 81,494,999 | | | | | | | | 92,146,145 | |
| | | | |
End of period | | | | | | $ | 81,505,480 | | | | | | | $ | 81,494,999 | |
| | | | |
Undistributed net investment income | | | | | | $ | 2,500 | | | | | | | $ | 12,657 | |
| | | | |
The accompanying notes are an integral part of these financial statements.
| | | | |
| 32 | | Wells Fargo VT Index Asset Allocation Fund | | Financial highlights |
(For a share outstanding throughout each period)
| | | | | | | | | | | | | | | | | | | | |
| | | Year ended December 31 | |
| CLASS 2 | | 2016 | | | 2015 | | | 2014 | | | 2013 | | | 2012 | |
Net asset value, beginning of period | | | $18.47 | | | | $18.43 | | | | $15.85 | | | | $13.47 | | | | $12.09 | |
Net investment income | | | 0.17 | | | | 0.18 | | | | 0.27 | | | | 0.24 | | | | 0.21 | |
Net realized and unrealized gains on investments | | | 1.22 | | | | 0.05 | | | | 2.57 | | | | 2.39 | | | | 1.36 | |
| | | | | | | | | | | | | | | | | | | | |
Total from investment operations | | | 1.39 | | | | 0.23 | | | | 2.84 | | | | 2.63 | | | | 1.57 | |
Distributions to shareholders from | | | | | | | | | | | | | | | | | | | | |
Net investment income | | | (0.17 | ) | | | (0.19 | ) | | | (0.26 | ) | | | (0.25 | ) | | | (0.19 | ) |
Net realized gains | | | (0.53 | ) | | | 0.00 | | | | 0.00 | | | | 0.00 | | | | 0.00 | |
| | | | | | | | | | | | | | | | | | | | |
Total distributions to shareholders | | | (0.70 | ) | | | (0.19 | ) | | | (0.26 | ) | | | (0.25 | ) | | | (0.19 | ) |
Net asset value, end of period | | | $19.16 | | | | $18.47 | | | | $18.43 | | | | $15.85 | | | | $13.47 | |
Total return | | | 7.67 | % | | | 1.25 | % | | | 18.06 | % | | | 19.63 | % | | | 13.03 | % |
Ratios to average net assets (annualized) | | | | | | | | | | | | | | | | | | | | |
Gross expenses | | | 1.10 | % | | | 1.10 | % | | | 1.02 | % | | | 1.11 | % | | | 1.13 | % |
Net expenses | | | 1.00 | % | | | 1.00 | % | | | 0.99 | % | | | 1.00 | % | | | 1.00 | % |
Net investment income | | | 0.93 | % | | | 0.95 | % | | | 1.58 | % | | | 1.57 | % | | | 1.58 | % |
Supplemental data | | | | | | | | | | | | | | | | | | | | |
Portfolio turnover rate | | | 15 | % | | | 44 | % | | | 3 | % | | | 11 | % | | | 8 | % |
Net assets, end of period (000s omitted) | | | $81,505 | | | | $81,495 | | | | $92,146 | | | | $86,935 | | | | $84,791 | |
The accompanying notes are an integral part of these financial statements.
| | | | | | |
| Notes to financial statements | | Wells Fargo VT Index Asset Allocation Fund | | | 33 | |
1. ORGANIZATION
Wells Fargo Variable Trust (the “Trust”), a Delaware statutory trust organized on March 10, 1999, is an open-end management investment company registered under the Investment Company Act of 1940, as amended (the “1940 Act”). As an investment company, the Trust follows the accounting and reporting guidance in Financial Accounting Standards Board (“FASB”) Accounting Standards Codification Topic 946, Financial Services – Investment Companies. These financial statements report on the Wells Fargo VT Index Asset Allocation Fund (the “Fund”) which is a diversified series of the Trust.
2. SIGNIFICANT ACCOUNTING POLICIES
The following significant accounting policies, which are consistently followed in the preparation of the financial statements of the Fund, are in conformity with U.S. generally accepted accounting principles which require management to make estimates and assumptions that affect the reported amounts of assets and liabilities, disclosure of contingent assets and liabilities at the date of the financial statements, and the reported amounts of revenues and expenses during the reporting period. Actual results could differ from those estimates.
Securities valuation
All investments are valued each business day as of the close of regular trading on the New York Stock Exchange (generally 4 p.m. Eastern Time), although the Fund may deviate from this calculation time under unusual or unexpected circumstances.
Equity securities and futures that are listed on a foreign or domestic exchange or market are valued at the official closing price or, if none, the last sales price. If no sale occurs on the principal exchange or market that day, the prior day’s price will be deemed “stale” and a fair value price will be determined in accordance with the Fund’s Valuation Procedures.
Debt securities are valued at the evaluated bid price provided by an independent pricing service or, if a reliable price is not available, the quoted bid price from an independent broker-dealer.
Investments in registered open-end investment companies are valued at net asset value. Interests in non-registered investment vehicles that are redeemable at net asset value are fair valued normally at net asset value.
Investments which are not valued using any of the methods discussed above are valued at their fair value, as determined in good faith by the Board of Trustees of the Fund. The Board of Trustees has established a Valuation Committee comprised of the Trustees and has delegated to it the authority to take any actions regarding the valuation of portfolio securities that the Valuation Committee deems necessary or appropriate, including determining the fair value of portfolio securities, unless the determination has been delegated to the Management Valuation Team of Wells Fargo Funds Management, LLC (“Funds Management”). The Board of Trustees retains the authority to make or ratify any valuation decisions or approve any changes to the Valuation Procedures as it deems appropriate. On a quarterly basis, the Board of Trustees receives reports on any valuation actions taken by the Valuation Committee or the Management Valuation Team which may include items for ratification.
Valuations of fair valued securities are compared to the next actual sales price when available, or other appropriate market values, to assess the continued appropriateness of the fair valuation methodologies used. These securities are fair valued on a day-to-day basis, taking into consideration changes to appropriate market information and any significant changes to the inputs considered in the valuation process until there is a readily available price provided on an exchange or by an independent pricing service. Valuations received from an independent pricing service or independent broker-dealer quotes are periodically validated by comparisons to most recent trades and valuations provided by other independent pricing services in addition to the review of prices by the manager and/or subadviser. Unobservable inputs used in determining fair valuations are identified based on the type of security, taking into consideration factors utilized by market participants in valuing the investment, knowledge about the issuer and the current market environment.
Security loans
The Fund may lend its securities from time to time in order to earn additional income in the form of fees or interest on securities received as collateral or the investment of any cash received as collateral. The Fund continues to receive interest or dividends on the securities loaned. The Fund receives collateral in the form of cash or securities with a value at least equal to the value of the securities on loan. The value of the loaned securities is determined at the close of each business day and any additional required collateral is delivered to the Fund on the next business day. In a securities lending transaction, the net asset value of the Fund will be affected by an increase or decrease in the value of the securities loaned and by an increase or decrease in the value of the instrument in which collateral is invested. The amount of securities lending activity undertaken by the Fund fluctuates from time to time. In the event of default or bankruptcy by the borrower, the Fund may be prevented from recovering the loaned securities or gaining access to the collateral or may experience delays or costs in doing so. In addition, the investment of any cash collateral received may lose all or part of its value. The Fund has the right under the lending agreement to recover the securities from the borrower on demand.
The Fund lends its securities through an unaffiliated securities lending agent. Cash collateral received in connection with its securities lending transactions is invested in Securities Lending Cash Investments, LLC (the “Securities Lending Fund”).
| | | | |
| 34 | | Wells Fargo VT Index Asset Allocation Fund | | Notes to financial statements |
The Securities Lending Fund is exempt from registration under Section 3(c)(7) of the 1940 Act and is managed by Funds Management and is subadvised by Wells Capital Management Incorporated (“WellsCap”), an affiliate of Funds Management and an indirect wholly owned subsidiary of Wells Fargo & Company (“Wells Fargo”). Funds Management receives an advisory fee starting at 0.05% and declining to 0.01% as the average daily net assets of the Securities Lending Fund increase. All of the fees received by Funds Management are paid to WellsCap for its services as subadviser. The Securities Lending Fund seeks to provide a positive return compared to the daily Fed Funds Open Rate by investing in high-quality, U.S. dollar-denominated short-term money market instruments. Securities Lending Fund investments are valued at the evaluated bid price provided by an independent pricing service. Income earned from investment in the Securities Lending Fund is included in securities lending income on the Statement of Operations.
Futures contracts
The Fund is subject to interest rate risk and equity price risk in the normal course of pursuing its investment objectives. The Fund may buy and sell futures contracts in order to gain exposure to, or protect against, changes in security values and interest rates. The primary risks associated with the use of futures contracts are the imperfect correlation between changes in market values of securities held by the Fund and the prices of futures contracts, and the possibility of an illiquid market.
The aggregate principal amounts of the contracts are not recorded in the financial statements. Fluctuations in the value of the contracts are recorded in the Statement of Assets and Liabilities as an asset or liability and in the Statement of Operations as unrealized gains or losses until the contracts are closed, at which point they are recorded as net realized gains or losses on futures contracts. With futures contracts, there is minimal counterparty risk to the Fund since futures are exchange traded and the exchange’s clearinghouse, as counterparty to all exchange traded futures, guarantees the futures against default.
Security transactions and income recognition
Securities transactions are recorded on a trade date basis. Realized gains or losses are recorded on the basis of identified cost.
Dividend income is recognized on the ex-dividend date.
Interest income is accrued daily and bond discounts are accreted and premiums are amortized daily based on the effective interest method. To the extent debt obligations are placed on non-accrual status, any related interest income may be reduced by writing off interest receivables when the collection of all or a portion of interest has become doubtful based on consistently applied procedures. If the issuer subsequently resumes interest payments or when the collectability of interest is reasonably assured, the debt obligation is removed from non-accrual status.
Distributions to shareholders
Distributions to shareholders from net investment income and net realized gains, if any, are recorded on the ex-dividend date. Such distributions are determined in conformity with federal income tax regulations, which may differ in amount or character from net investment income and realized gains recognized for purposes of U.S. generally accepted accounting principles.
Federal and other taxes
The Fund intends to continue to qualify as a regulated investment company by distributing substantially all of its investment company taxable income and any net realized capital gains (after reduction for capital loss carryforwards) sufficient to relieve it from all, or substantially all, federal income taxes. Accordingly, no provision for federal income taxes was required.
The Fund’s income and federal excise tax returns and all financial records supporting those returns for the prior three fiscal years are subject to examination by the federal and Delaware revenue authorities. Management has analyzed the Fund’s tax positions taken on federal, state, and foreign tax returns for all open tax years and does not believe that there are any uncertain tax positions that require recognition of a tax liability.
Reclassifications are made to the Fund’s capital accounts for permanent tax differences to reflect income and gains available for distribution (or available capital loss carryforwards) under federal income tax regulations. U.S. generally accepted accounting principles require that certain components of net assets be adjusted to reflect permanent differences between financial and tax reporting. These reclassifications have no effect on net assets or net asset values per share. The primary permanent difference causing such reclassifications is due to dividends from certain securities. At December 31, 2016, as a result of permanent book-to-tax differences, the following reclassification adjustments were made on the Statement of Assets and Liabilities:
| | |
Undistributed net
investment income | | Accumulated net
realized gains
on investments |
| $(38,752) | | $38,752 |
| | | | | | |
| Notes to financial statements | | Wells Fargo VT Index Asset Allocation Fund | | | 35 | |
3. FAIR VALUATION MEASUREMENTS
Fair value measurements of investments are determined within a framework that has established a fair value hierarchy based upon the various data inputs utilized in determining the value of the Fund’s investments. The three-level hierarchy gives the highest priority to unadjusted quoted prices in active markets for identical assets or liabilities (Level 1) and the lowest priority to significant unobservable inputs (Level 3). The Fund’s investments are classified within the fair value hierarchy based on the lowest level of input that is significant to the fair value measurement. The inputs are summarized into three broad levels as follows:
| ∎ | | Level 1 – quoted prices in active markets for identical securities |
| ∎ | | Level 2 – other significant observable inputs (including quoted prices for similar securities, interest rates, prepayment speeds, credit risk, use of amortized cost, etc.) |
| ∎ | | Level 3 – significant unobservable inputs (including the Fund’s own assumptions in determining the fair value of investments) |
The inputs or methodologies used for valuing investments in securities are not necessarily an indication of the risk associated with investing in those securities.
The following is a summary of the inputs used in valuing the Fund’s assets and liabilities as of December 31, 2016:
| | | | | | | | | | | | | | | | |
| | | Quoted prices
(Level 1) | | | Other significant
observable inputs
(Level 2) | | | Significant
unobservable inputs (Level 3) | | | Total | |
Assets | | | | | | | | | | | | | | | | |
Investments in: | | | | | | | | | | | | | | | | |
Consumer discretionary | | $ | 5,861,645 | | | $ | 0 | | | $ | 0 | | | $ | 5,861,645 | |
Consumer staples | | | 4,567,928 | | | | 0 | | | | 0 | | | | 4,567,928 | |
Energy | | | 3,684,063 | | | | 0 | | | | 0 | | | | 3,684,063 | |
Financials | | | 7,219,351 | | | | 0 | | | | 0 | | | | 7,219,351 | |
Health care | | | 6,641,936 | | | | 0 | | | | 0 | | | | 6,641,936 | |
Industrials | | | 5,004,548 | | | | 0 | | | | 0 | | | | 5,004,548 | |
Information technology | | | 10,124,194 | | | | 0 | | | | 0 | | | | 10,124,194 | |
Materials | | | 1,383,195 | | | | 0 | | | | 0 | | | | 1,383,195 | |
Real estate | | | 1,407,035 | | | | 0 | | | | 0 | | | | 1,407,035 | |
Telecommunication services | | | 1,296,218 | | | | 0 | | | | 0 | | | | 1,296,218 | |
Utilities | | | 1,546,402 | | | | 0 | | | | 0 | | | | 1,546,402 | |
| | | | |
U.S. Treasury securities | | | 30,994,474 | | | | 0 | | | | 0 | | | | 30,994,474 | |
| | | | |
Short-term investments | | | | | | | | | | | | | | | | |
Investment companies | | | 1,639,441 | | | | 0 | | | | 0 | | | | 1,639,441 | |
U.S. Treasury securities | | | 16,980 | | | | 0 | | | | 0 | | | | 16,980 | |
Investments measured at net asset value* | | | | | | | | | | | | | | | 113,434 | |
| | | 81,387,410 | | | | 0 | | | | 0 | | | | 81,500,844 | |
Futures contracts | | | 2,133 | | | | 0 | | | | 0 | | | | 2,133 | |
Total assets | | $ | 81,389,543 | | | $ | 0 | | | $ | 0 | | | $ | 81,502,977 | |
Liabilities | | | | | | | | | | | | | | | | |
Futures contracts | | $ | 445 | | | | 0 | | | | 0 | | | $ | 445 | |
Total liabilities | | $ | 445 | | | $ | 0 | | | $ | 0 | | | $ | 445 | |
| * | Investments that are measured at fair value using the net asset value per share (or its equivalent) as a practical expedient have not been categorized in the fair value hierarchy. The fair value amount presented in the table is intended to permit reconciliation of the fair value hierarchy to the amounts presented in the Statement of Assets and Liabilities. The Fund’s investment in Securities Lending Cash Investments, LLC valued at $113,434 does not have a redemption period notice, can be redeemed daily and does not have any unfunded commitments. |
Futures contracts are reported at their variation margin at measurement date, which represents the amount due to/from the Fund at that date. All other assets and liabilities are reported at their market value at measurement date.
| | | | |
| 36 | | Wells Fargo VT Index Asset Allocation Fund | | Notes to financial statements |
The Fund recognizes transfers between levels within the fair value hierarchy at the end of the reporting period. At December 31, 2016, the Fund did not have any transfers into/out of Level 1, Level 2, or Level 3.
4. TRANSACTIONS WITH AFFILIATES AND OTHER EXPENSES
Management fee
Funds Management, an indirect wholly owned subsidiary of Wells Fargo, is the manager of the Fund and provides advisory and fund-level administrative services under an investment management agreement. Under the investment management agreement, Funds Management is responsible for, among other services, implementing the investment objectives and strategies of the Fund, supervising the subadviser, providing fund-level administrative services in connection with the Fund’s operations, and providing any other fund-level administrative services reasonably necessary for the operation of the Fund. As compensation for its services under the investment management agreement, Funds Management is entitled to receive an annual management fee starting at 0.60% and declining to 0.43% as the average daily net assets of the Fund increase. For the year ended December 31, 2016, the management fee was equivalent to an annual rate of 0.60% of the Fund’s average daily net assets.
Funds Management has retained the services of a subadviser to provide daily portfolio management to the Fund. The fee for subadvisory services is borne by Funds Management. WellsCap is the subadviser to the Fund and is entitled to receive a fee from Funds Management at an annual rate starting at 0.15% and declining to 0.10% as the average daily net assets of the Fund increase.
Administration fee
Under a class-level administration agreement, Funds Management provides class-level administrative services to the Fund, which includes paying fees and expenses for services provided by the transfer agent, sub-transfer agents, omnibus account servicers and record-keepers. As compensation for its services under the class-level administration agreement, Funds Management receives a class level administration fee of 0.08% which is calculated based on the average daily net assets of Class 2 shares.
Funds Management has contractually waived and/or reimbursed management and administration fees to the extent necessary to maintain certain net operating expense ratios for the Fund. Waiver of fees and/or reimbursement of expenses by Funds Management were made first from fund level expenses on a proportionate basis and then from class specific expenses. Funds Management has committed through April 30, 2017 to waive fees and/or reimburse expenses to the extent necessary to cap the Fund’s expenses at 1.00% for Class 2 shares. After this time, the cap may be increased or the commitment to maintain the cap may be terminated only with the approval of the Board of Trustees.
During the year ended December 31, 2016, State Street Bank and Trust Company, the Fund’s custodian, reimbursed the Fund $7 for certain out-of-pocket expenses that were billed to the Fund in error from 1998-2015. This amount is included in dividend income on the Statement of Operations. In addition, Funds Management was also reimbursed $3,113 for waivers/reimbursements it made to the Fund during the period the Fund was erroneously billed.
Distribution fee
The Trust has adopted a distribution plan for Class 2 shares of the Fund pursuant to Rule 12b-1 under the 1940 Act. A distribution fee is charged to Class 2 shares and paid to Wells Fargo Funds Distributor, LLC, the principal underwriter, at an annual rate of 0.25% of the average daily net assets of Class 2 shares.
5. INVESTMENT PORTFOLIO TRANSACTIONS
Purchases and sales of investments, excluding short-term securities, for the year ended December 31, 2016 were as follows:
| | | | | | |
Purchases at cost | | Sales proceeds |
U.S.
government | | Non-U.S.
government | | U.S.
government | | Non-U.S.
government |
| $9,465,207 | | $2,573,420 | | $10,570,292 | | $5,606,888 |
The Fund may purchase or sell investment securities to other Wells Fargo funds under procedures adopted by the Board of Trustees. The procedures have been designed to ensure that these interfund transactions, which generally do not incur broker commissions, are effected at current market prices. Interfund trades are included within the respective purchases and sales amounts shown.
| | | | | | |
| Notes to financial statements | | Wells Fargo VT Index Asset Allocation Fund | | | 37 | |
6. INVESTMENTS IN AFFILIATES
An affiliated investment is a company in which the Fund has ownership of at least 5% of the outstanding voting shares. The following is a summary of transactions in issuers that were either affiliates of the Fund at the beginning of the period or the end of the period.
| | | | | | | | | | | | | | | | | | | | | | | | |
| | | Shares,
beginning
of period | | Shares
purchased | | Shares
sold | | | Shares, end of period | | | Value, end of period | | | Income from
affiliated securities | | | Realized gains | |
Wells Fargo & Company | | 12,512 | | 151 | | | 1,225 | | | | 11,438 | | | $ | 630,348 | | | $ | 4,413 | | | $ | 22,470 | |
7. DERIVATIVE TRANSACTIONS
During the year ended December 31, 2016, the Fund entered into futures contracts to gain market exposure to certain asset classes consistent with an active asset allocation strategy.
At December 31, 2016, the Fund had long futures contracts outstanding as follows:
| | | | | | | | | | | | | | |
| Expiration date | | Counterparty | | Contracts | | Type | | Contract
value at
12/31/2016 | | | Unrealized
gains
(losses) | |
3-17-2017 | | Goldman Sachs | | 1 Long | | S&P 500 E-Mini Index | | $ | 111,810 | | | $ | (845 | ) |
3-31-2017 | | Goldman Sachs | | 13 Long | | 5-Year U.S. Treasury Notes | | | 1,529,633 | | | | 2,898 | |
The Fund had an average notional amount of $2,751,539 and $10,723,512 in long and short futures contracts, respectively, during the year ended December 31, 2016.
A summary of derivative instruments by primary risk exposure is outlined in the following tables.
The fair value of derivative instruments as of December 31, 2016 was as follows for the Fund:
| | | | | | | | | | | | |
| | | Asset derivatives | | | Liability derivatives | |
| | | Statement of Assets and
Liabilities location | | Fair value | | | Statement of Assets and
Liabilities location | | Fair value | |
Interest rate risk | | Receivable for daily variation margin on open futures contracts | | $ | 2,133 | * | | Payable for daily variation margin on open futures contracts | | $ | 0 | * |
Equity risk | | Receivable for daily variation margin on open futures contracts | | $ | 0 | * | | Payable for daily variation margin on open futures contracts | | $ | 445 | * |
| | | | | $ | 2,133 | | | | | $ | 445 | |
| * | Only the current day’s variation margin as of December 31, 2016 is reported separately on the Statement of Assets and Liabilities. |
The effect of derivative instruments on the Statement of Operations for the year ended December 31, 2016 was as follows for the Fund:
| | | | | | | | |
| | | Amount of realized
gains (losses) on
derivatives | | | Change in unrealized
gains (losses) on
derivatives | |
Equity risk | | $ | 645,456 | | | $ | 1,678 | |
Interest rate risk | | | (80,118 | ) | | | 9,868 | |
| | | $ | 565,338 | | | $ | 11,546 | |
For certain types of derivative transactions, the Fund has entered into International Swaps and Derivatives Association, Inc. master agreements (“ISDA Master Agreements”) or similar agreements with approved counterparties. The ISDA Master Agreements or similar agreements may have requirements to deliver/deposit securities or cash to/with an exchange or broker-dealer as collateral and allows the Fund to offset, with each counterparty, certain derivative financial instrument’s assets and/or liabilities with collateral held or pledged. Collateral requirements differ by type of derivative. Collateral or margin requirements are set by the broker or exchange clearing house for exchange traded derivatives while
| | | | |
| 38 | | Wells Fargo VT Index Asset Allocation Fund | | Notes to financial statements |
collateral terms are contract specific for over-the-counter traded derivatives. Cash collateral that has been pledged to cover obligations of the Fund under ISDA Master Agreements or similar agreements, if any, are reported separately in the Statement of Assets and Liabilities. Securities pledged as collateral, if any, are noted in the Portfolio of Investments. With respect to balance sheet offsetting, absent an event of default by the counterparty or a termination of the agreement, the reported amounts of financial assets and financial liabilities in the Statement of Assets and Liabilities are not offset across transactions between the Fund and the applicable counterparty. A reconciliation of the gross amounts on the Statement of Assets and Liabilities to the net amounts by derivative type, including any collateral exposure, is as follows:
| | | | | | | | | | | | | | | | |
| Derivative type | | Counterparty | | Gross amounts
of assets in the
Statement of
Assets and
Liabilities | | Amounts
subject to
netting
agreements | | | Collateral
received | | | Net amount
of assets | |
Futures – variation margin | | Goldman Sachs | | $2,133 | | $ | (445 | ) | | $ | 0 | | | $ | 1,688 | |
| | | | | | | | | | | | | | | | |
| Derivative type | | Counterparty | | Gross amounts
of liabilities in the
Statement of
Assets and
Liabilities | | Amounts
subject to
netting
agreements | | | Collateral
pledged | | | Net amount
of liabilities | |
Futures – variation margin | | Goldman Sachs | | $445 | | $ | (445 | ) | | $ | 0 | | | $ | 0 | |
8. BANK BORROWINGS
The Trust and Wells Fargo Funds Trust (excluding the money market funds and certain other funds) are parties to a $250,000,000 revolving credit agreement whereby the Fund is permitted to use bank borrowings for temporary or emergency purposes, such as to fund shareholder redemption requests. Interest under the credit agreement is charged to the Fund based on a borrowing rate equal to the higher of the Federal Funds rate in effect on that day plus 1.25% or the overnight LIBOR rate in effect on that day plus 1.25%. In addition, an annual commitment fee equal to 0.25% of the unused balance is allocated to each participating fund. Prior to August 30, 2016, the revolving credit agreement amount was $200,000,000 and the annual commitment fee was equal to 0.20% of the unused balance which was allocated to each participating fund.
For the year ended December 31, 2016, there were no borrowings by the Fund under the agreement.
9. DISTRIBUTIONS TO SHAREHOLDERS
The tax character of distributions paid during the years ended December 31, 2016 and December 31, 2015 were as follows:
| | | | | | | | |
| | | Year ended December 31 | |
| | | 2016 | | | 2015 | |
Ordinary income | | $ | 720,605 | | | $ | 897,884 | |
Long-term capital gain | | | 2,289,129 | | | | 0 | |
As of December 31, 2016, the components of distributable earnings on a tax basis were as follows:
| | | | |
Undistributed
ordinary
income | | Undistributed
long-term
gain | | Unrealized
gains |
| $429,976 | | $3,022,954 | | $19,071,107 |
10. INDEMNIFICATION
Under the Trust’s organizational documents, the officers and Trustees have been granted certain indemnification rights against certain liabilities that may arise out of performance of their duties to the Trust. Additionally, in the normal course of business, the Trust may enter into contracts with service providers that contain a variety of indemnification clauses. The Trust’s maximum exposure under these arrangements is dependent on future claims that may be made against the Fund and, therefore, cannot be estimated.
| | | | | | |
| Notes to financial statements | | Wells Fargo VT Index Asset Allocation Fund | | | 39 | |
11. REGULATORY CHANGES
In October 2016, the Securities and Exchange Commission (“SEC”) adopted new rules and forms and amended existing rules and forms (together, “final rules”) intended to modernize and enhance the reporting and disclosure of information by registered investment companies and to enhance liquidity risk management by open-end mutual funds and exchange-traded funds. The final rules will enhance the quality of information available to investors and will allow the SEC to more effectively collect and use data reported by funds. In part, the final rules amend Regulation S-X and require standardized, enhanced disclosure about derivatives in the Fund’s financial statements, as well as other amendments. The compliance date for the amendments to Regulation S-X is August 1, 2017 while the compliance date for the new form types is June 1, 2018 and the compliance date for the liquidity risk management program requirements is December 1, 2018. Management is currently assessing the potential impact of these enhancements and their impact on the financial statement disclosures and reporting requirements.
| | | | |
| 40 | | Wells Fargo VT Index Asset Allocation Fund | | Report of independent registered public accounting firm |
BOARD OF TRUSTEES AND SHAREHOLDERS OF WELLS FARGO VARIABLE TRUST:
We have audited the accompanying statement of assets and liabilities, including the portfolio of investments, of the Wells Fargo VT Index Asset Allocation Fund (the “Fund”), one of the funds constituting the Wells Fargo Variable Trust, as of December 31, 2016, and the related statement of operations for the year then ended, the statements of changes in net assets for each of the years in the two-year period then ended, and the financial highlights for each of the years in the five-year period then ended. These financial statements and financial highlights are the responsibility of the Fund’s management. Our responsibility is to express an opinion on these financial statements and financial highlights based on our audits.
We conducted our audits in accordance with the standards of the Public Company Accounting Oversight Board (United States). Those standards require that we plan and perform the audit to obtain reasonable assurance about whether the financial statements and financial highlights are free of material misstatement. An audit includes examining, on a test basis, evidence supporting the amounts and disclosures in the financial statements. Our procedures included confirmation of securities owned as of December 31, 2016, by correspondence with the custodian and brokers, or by other appropriate auditing procedures. An audit also includes assessing the accounting principles used and significant estimates made by management, as well as evaluating the overall financial statement presentation. We believe that our audits provide a reasonable basis for our opinion.
In our opinion, the financial statements and financial highlights referred to above present fairly, in all material respects, the financial position of the Wells Fargo VT Index Asset Allocation Fund as of December 31, 2016, the results of its operations for the year then ended, the changes in its net assets for each of the years in the two-year period then ended, and the financial highlights for each of the years in the five-year period then ended, in conformity with U.S. generally accepted accounting principles.

Boston, Massachusetts
February 23, 2017
| | | | | | |
| Other information (unaudited) | | Wells Fargo VT Index Asset Allocation Fund | | | 41 | |
TAX INFORMATION
For corporate shareholders, pursuant to Section 854 of the Internal Revenue Code, 84.79% of ordinary income dividends qualify for the corporate dividends-received deduction for the fiscal year ended December 31, 2016.
For the fiscal year ended December 31, 2016, $2,289,129 has been designated as a 20% rate gain distribution pursuant to Section 852 of the Internal Revenue Code.
For the fiscal year ended December 31, 2016, 30.45% of the ordinary income distributed was derived from interest on U.S. government securities.
PROXY VOTING INFORMATION
A description of the policies and procedures that the Fund uses to determine how to vote proxies relating to portfolio securities is available, upon request, by calling 1-800-260-5969, visiting our website at wellsfargofunds.com, or visiting the SEC website at sec.gov. Information regarding how the Fund voted proxies relating to portfolio securities during the most recent 12-month period ended June 30 is available on the Fund’s website at wellsfargofunds.com or by visiting the SEC website at sec.gov.
PORTFOLIO HOLDINGS INFORMATION
The complete portfolio holdings for the Fund are publicly available monthly on the Fund’s website (wellsfargofunds.com), on a one-month delayed basis. In addition, top ten holdings information (excluding derivative positions) for the Fund is publicly available on the Fund’s website on a monthly, seven-day or more delayed basis. The Fund files its complete schedule of portfolio holdings with the SEC for the first and third quarters of each fiscal year on Form N-Q, which is available by visiting the SEC website at sec.gov. In addition, the Fund’s Form N-Q may be reviewed and copied at the SEC’s Public Reference Room in Washington, DC, and at regional offices in New York City, at 233 Broadway, and in Chicago, at 175 West Jackson Boulevard, Suite 900. Information about the Public Reference Room may be obtained by calling 1-800-SEC-0330.
| | | | |
| 42 | | Wells Fargo VT Index Asset Allocation Fund | | Other information (unaudited) |
BOARD OF TRUSTEES AND OFFICERS
Each of the Trustees and Officers1 listed in the table below acts in identical capacities for each fund in the Wells Fargo family of funds, which consists of 139 mutual funds comprising the Wells Fargo Funds Trust, Wells Fargo Variable Trust, Wells Fargo Master Trust and four closed-end funds (collectively the “Fund Complex”). This table should be read in conjunction with the Prospectus and the Statement of Additional Information2. The mailing address of each Trustee and Officer is 525 Market Street, 12th Floor, San Francisco, CA 94105. Each Trustee and Officer serves an indefinite term, however, each Trustee serves such term until reaching the mandatory retirement age established by the Trustees.
Independent Trustees
| | | | | | |
Name and
year of birth | | Position held and
length of service* | | Principal occupations during past five years or longer | | Current other
public company or
investment company
directorships |
William R. Ebsworth
(Born 1957) | | Trustee, since 2015 | | Retired. From 1984 to 2013, equities analyst, portfolio manager, research director and chief financial officer at Fidelity Management and Research Company in Boston, Tokyo, and Hong Kong and retired in 2013 as Chief Investment Officer of Fidelity Strategic Advisers, Inc. where he lead a team of investment professionals managing client assets. Prior thereto, Board member of Hong Kong Securities Clearing Co., Hong Kong Options Clearing Corp., the Thailand International Fund, Ltd., Fidelity Investments Life Insurance Company, and Empire Fidelity Investments Life Insurance Company. Board member of the Fonté Foundation (non-profit organization) and the Vincent Memorial Hospital Endowment (non-profit organization), where he serves on the Investment Committee and as a Chair of the Audit Committee. Mr. Ebsworth is a CFA® charterholder and an Adjunct Lecturer, Finance, at Babson College. | | Asset Allocation Trust |
Jane A. Freeman
(Born 1953) | | Trustee, since 2015 | | Retired. From 2012 to 2014 and 1999 to 2008, Chief Financial Officer of Scientific Learning Corporation. From 2008 to 2012, Ms. Freeman provided consulting services related to strategic business projects. Prior to 1999, Portfolio Manager at Rockefeller & Co. and Scudder, Stevens & Clark. Board member of the Harding Loevner Funds from 1996 to 2014, serving as both Lead Independent Director and chair of the Audit Committee. Board member of the Russell Exchange Traded Funds Trust from 2011 to 2012 and the chair of the Audit Committee. Ms. Freeman is Chair of Taproot Foundation (non-profit organization), a Board Member of Ruth Bancroft Garden (non-profit organization) and an inactive chartered financial analyst. | | Asset Allocation Trust |
Peter G. Gordon**
(Born 1942) | | Trustee, since 1998; Chairman, since 2005 | | Co-Founder, Retired Chairman, President and CEO of Crystal Geyser Water Company. Trustee Emeritus, Colby College. | | Asset Allocation Trust |
Isaiah Harris, Jr.
(Born 1952) | | Trustee, since 2009 | | Retired. Chairman of the Board of CIGNA Corporation since 2009, and Director since 2005. From 2003 to 2011, Director of Deluxe Corporation. Prior thereto, President and CEO of BellSouth Advertising and Publishing Corp. from 2005 to 2007, President and CEO of BellSouth Enterprises from 2004 to 2005 and President of BellSouth Consumer Services from 2000 to 2003. Emeritus member of the Iowa State University Foundation Board of Governors. Emeritus Member of the Advisory Board of Iowa State University School of Business. Advisory Board Member, Palm Harbor Academy (charter school). Advisory Board Member, Child Evangelism Fellowship (non-profit). Mr. Harris is a certified public accountant (inactive status). | | CIGNA Corporation; Asset Allocation Trust |
Judith M. Johnson
(Born 1949) | | Trustee, since 2008; Audit Committee Chairman, since 2008 | | Retired. Prior thereto, Chief Executive Officer and Chief Investment Officer of Minneapolis Employees Retirement Fund from 1996 to 2008. Ms. Johnson is an attorney, certified public accountant and a certified managerial accountant. | | Asset Allocation Trust |
David F. Larcker
(Born 1950) | | Trustee, since 2009 | | James Irvin Miller Professor of Accounting at the Graduate School of Business, Stanford University, Director of the Corporate Governance Research Initiative and Senior Faculty of The Rock Center for Corporate Governance since 2006. From 2005 to 2008, Professor of Accounting at the Graduate School of Business, Stanford University. Prior thereto, Ernst & Young Professor of Accounting at The Wharton School, University of Pennsylvania from 1985 to 2005. | | Asset Allocation Trust |
| | | | | | |
| Other information (unaudited) | | Wells Fargo VT Index Asset Allocation Fund | | | 43 | |
| | | | | | |
Name and
year of birth | | Position held and
length of service* | | Principal occupations during past five years or longer | | Current other
public company or
investment company
directorships |
Olivia S. Mitchell
(Born 1953) | | Trustee, since 2006 | | International Foundation of Employee Benefit Plans Professor, Wharton School of the University of Pennsylvania since 1993. Director of Wharton’s Pension Research Council and Boettner Center on Pensions & Retirement Research, and Research Associate at the National Bureau of Economic Research. Previously, Cornell University Professor from 1978 to 1993. | | Asset Allocation Trust |
Timothy J. Penny
(Born 1951) | | Trustee, since 1996 | | President and Chief Executive Officer of Southern Minnesota Initiative Foundation, a non-profit organization, since 2007 and Senior Fellow at the Humphrey Institute Policy Forum at the University of Minnesota since 1995. Member of the Board of Trustees of NorthStar Education Finance, Inc., a non-profit organization, since 2007. | | Asset Allocation Trust |
Michael S. Scofield
(Born 1943) | | Trustee, since 2010 | | Served on the Investment Company Institute’s Board of Governors and Executive Committee from 2008-2011 as well the Governing Council of the Independent Directors Council from 2006-2011 and the Independent Directors Council Executive Committee from 2008-2011. Chairman of the IDC from 2008-2010. Institutional Investor (Fund Directions) Trustee of Year in 2007. Trustee of the Evergreen Funds complex (and its predecessors) from 1984 to 2010. Chairman of the Evergreen Funds from 2000-2010. Former Trustee of the Mentor Funds. Retired Attorney, Law Offices of Michael S. Scofield. | | Asset Allocation Trust |
| * | Length of service dates reflect the Trustee’s commencement of service with the Trust’s predecessor entities, where applicable. |
| ** | Peter Gordon is expected to retire on December 31, 2017. |
Officers
| | | | | | |
Name and
year of birth | | Position held and
length of service | | Principal occupations during past five years or longer | | |
Andrew Owen3
(Born 1960) | | President, since 2017 | | Executive Vice President of Wells Fargo Bank, N.A. and President of Wells Fargo & Company and Head of Affiliated Managaers, Wells Fargo Asset Management, since 2014. Executive Vice President responsible for marketing, investments and product development for Wells Fargo Funds Management, LLC, from 2009 to 2014. | | |
Jeremy DePalma1
(Born 1974) | | Treasurer, since 2012 | | Senior Vice President of Wells Fargo Funds Management, LLC since 2009. Senior Vice President of Evergreen Investment Management Company, LLC from 2008 to 2010 and head of the Fund Reporting and Control Team within Fund Administration from 2005 to 2010. | | |
C. David Messman
(Born 1960) | | Secretary, since 2000; Chief Legal Officer, since 2003 | | Senior Vice President and Secretary of Wells Fargo Funds Management, LLC since 2001. Assistant General Counsel of Wells Fargo Bank, N.A. since 2013 and Vice President and Managing Counsel of Wells Fargo Bank, N.A. from 1996 to 2013. | | |
Michael Whitaker
(Born 1967) | | Chief Compliance Officer, since 2016 | | Executive Vice President of Wells Fargo Funds Management, LLC since 2016. Chief Compliance Officer of Fidelity’s Fixed Income Funds and Asset Allocation Funds from 2008 to 2016, Compliance Officer of FMR Co., Inc. from 2014 to 2016, Fidelity Investments Money Management, Inc. from 2014 to 2016, Fidelity Investments from 2007 to 2016. | | |
David Berardi
(Born 1975) | | Assistant Treasurer, since 2009 | | Vice President of Wells Fargo Funds Management, LLC since 2009. Vice President of Evergreen Investment Management Company, LLC from 2008 to 2010. Manager of Fund Reporting and Control for Evergreen Investment Management Company, LLC from 2004 to 2010. | | |
| 1 | Jeremy DePalma acts as Treasurer of 69 funds and Assistant Treasurer of 70 funds in the Fund Complex. |
| 2 | The Statement of Additional Information includes additional information about the Trustees and is available, without charge, upon request, by calling
1-800-260-5969 or by visiting the website at wellsfargofunds.com. |
| 3 | Andrew Owen became President on January 1, 2017. |
| | | | |
| 44 | | Wells Fargo VT Index Asset Allocation Fund | | List of abbreviations |
The following is a list of common abbreviations for terms and entities that may have appeared in this report.
| ACA | — ACA Financial Guaranty Corporation |
| ADR | — American depositary receipt |
| ADS | — American depositary shares |
| AGC | — Assured Guaranty Corporation |
| AGM | — Assured Guaranty Municipal |
| Ambac | — Ambac Financial Group Incorporated |
| AMT | — Alternative minimum tax |
| BAN | — Bond anticipation notes |
| BHAC | — Berkshire Hathaway Assurance Corporation |
| CAB | — Capital appreciation bond |
| CCAB | — Convertible capital appreciation bond |
| CDA | — Community Development Authority |
| CDO | — Collateralized debt obligation |
| DRIVER | — Derivative inverse tax-exempt receipts |
| DW&P | — Department of Water & Power |
| DWR | — Department of Water Resources |
| ECFA | — Educational & Cultural Facilities Authority |
| EDA | — Economic Development Authority |
| EDFA | — Economic Development Finance Authority |
| ETF | — Exchange-traded fund |
| FDIC | — Federal Deposit Insurance Corporation |
| FFCB | — Federal Farm Credit Banks |
| FGIC | — Financial Guaranty Insurance Corporation |
| FHA | — Federal Housing Administration |
| FHLB | — Federal Home Loan Bank |
| FHLMC | — Federal Home Loan Mortgage Corporation |
| FICO | — The Financing Corporation |
| FNMA | — Federal National Mortgage Association |
| GDR | — Global depositary receipt |
| GNMA | — Government National Mortgage Association |
| HCFR | — Healthcare facilities revenue |
| HEFA | — Health & Educational Facilities Authority |
| HEFAR | — Higher education facilities authority revenue |
| HFA | — Housing Finance Authority |
| HFFA | — Health Facilities Financing Authority |
| HUD | — Department of Housing and Urban Development |
| IDA | — Industrial Development Authority |
| IDAG | — Industrial Development Agency |
| KRW | — Republic of Korea won |
| LIBOR | — London Interbank Offered Rate |
| LIFER | — Long Inverse Floating Exempt Receipts |
| LLC | — Limited liability company |
| LLLP | — Limited liability limited partnership |
| LLP | — Limited liability partnership |
| MBIA | — Municipal Bond Insurance Association |
| MFHR | — Multifamily housing revenue |
| MSTR | — Municipal securities trust receipts |
| MUD | — Municipal Utility District |
| National | — National Public Finance Guarantee Corporation |
| PCFA | — Pollution Control Financing Authority |
| PCL | — Public Company Limited |
| PCR | — Pollution control revenue |
| PFA | — Public Finance Authority |
| PFFA | — Public Facilities Financing Authority |
| PFOTER | — Puttable floating option tax-exempt receipts |
| plc | — Public limited company |
| PUTTER | — Puttable tax-exempt receipts |
| R&D | — Research & development |
| Radian | — Radian Asset Assurance |
| RAN | — Revenue anticipation notes |
| RDA | — Redevelopment Authority |
| RDFA | — Redevelopment Finance Authority |
| REIT | — Real estate investment trust |
| ROC | — Reset option certificates |
| SAVRS | — Select auction variable rate securities |
| SBA | — Small Business Authority |
| SDR | — Swedish depositary receipt |
| SFHR | — Single-family housing revenue |
| SFMR | — Single-family mortgage revenue |
| SPA | — Standby purchase agreement |
| SPDR | — Standard & Poor’s Depositary Receipts |
| SPEAR | — Short Puttable Exempt Adjustable Receipts |
| STRIPS | — Separate trading of registered interest and |
| TAN | — Tax anticipation notes |
| TIPS | — Treasury inflation-protected securities |
| TRAN | — Tax revenue anticipation notes |
| TTFA | — Transportation Trust Fund Authority |
| TVA | — Tennessee Valley Authority |

For more information
More information about Wells Fargo Funds is available free upon request. To obtain literature, please write, email, visit the Fund’s website, or call:
Wells Fargo Funds
P.O. Box 8266
Boston, MA 02266-8266
Email: fundservice@wellsfargo.com
Website: wellsfargofunds.com
Individual investors: 1-800-222-8222
Retail investment professionals: 1-888-877-9275
Institutional investment professionals: 1-866-765-0778
This report and the financial statements contained herein are submitted for the general information of the shareholders of the Fund. If this report is used for promotional purposes, distribution of the report must be accompanied or preceded by a current prospectus. Before investing, please consider the investment objectives, risks, charges, and expenses of the investment. For a current prospectus and, if available, a summary prospectus, containing this information, call 1-800-260-5969 or visit the Fund’s website at wellsfargofunds.com. Read the prospectus carefully before you invest or send money.
Wells Fargo Asset Management (WFAM) is a trade name used by the asset management businesses of Wells Fargo & Company. Wells Fargo Funds Management, LLC, a wholly owned subsidiary of Wells Fargo & Company, provides investment advisory and administrative services for Wells Fargo Funds. Other affiliates of Wells Fargo & Company provide subadvisory and other services for the funds. The funds are distributed by Wells Fargo Funds Distributor, LLC, Member FINRA, an affiliate of Wells Fargo & Company. Neither Wells Fargo Funds Management nor Wells Fargo Funds Distributor has Fund customer accounts/assets, and neither provides investment advice/recommendations or acts as an investment advice fiduciary to any investor.
NOT FDIC INSURED ◾ NO BANK GUARANTEE ◾ MAY LOSE VALUE
© 2016 Wells Fargo Funds Management, LLC. All rights reserved.
| | |
| | 300469 02-17 AVT2/AR148 12-16 |
Annual Report
December 31, 2016

Wells Fargo VT International Equity Fund


Reduce clutter. Save trees.
Sign up for electronic delivery of prospectuses and shareholder reports at wellsfargo.com/advantagedelivery
Contents
The views expressed and any forward-looking statements are as of December 31, 2016, unless otherwise noted, and are those of the Fund managers and/or Wells Fargo Funds Management, LLC. Discussions of individual securities, or the markets generally, or any Wells Fargo Fund are not intended as individual recommendations. Future events or results may vary significantly from those expressed in any forward-looking statements. The views expressed are subject to change at any time in response to changing circumstances in the market. Wells Fargo Funds Management, LLC and the Fund disclaim any obligation to publicly update or revise any views expressed or forward-looking statements.
NOT FDIC INSURED ◾ NO BANK GUARANTEE ◾ MAY LOSE VALUE
| | | | |
| 2 | | Wells Fargo VT International Equity Fund | | Letter to shareholders (unaudited) |

Andrew Owen
President
Wells Fargo Funds
International equity investors entered the period confronting concerns about slowing economic growth, particularly in China.
Dear Shareholder:
As the new president of Wells Fargo Funds now that Karla Rabusch is retiring from that position after nearly 14 years, I am pleased to offer you this annual report for the Wells Fargo VT International Equity Fund for the 12-month period that ended December 31, 2016. Early in the period, global equity market volatility appeared to be driven by a focus on macrolevel economic issues such as recessionary fears and geopolitical concerns rather than fundamental company and business characteristics. As economic data in several markets improved, equity performance also improved. The performance contrast in each half of the reporting period, as measured by key benchmark indexes, shows the improving investment environment.
| | | | |
| | | January 1 through
June 30, 2016 (%) | | July 1 through
December 31, 2016 (%) |
Morgan Stanley Capital International (MSCI) Europe, Australasia, Far East (EAFE) Index (Net)1 | | (4.42) | | 5.67 |
MSCI World Index (Net)2 | | 0.66 | | 6.81 |
MSCI All Country World Index (ACWI) ex USA Index (Net)3 | | (1.02) | | 5.57 |
S&P Developed SmallCap Index4 | | 1.75 | | 9.67 |
Past performance is no guarantee of future results.
Central-bank policies demonstrated resolve to reignite global economic growth.
International equity investors entered the period confronting concerns about slowing economic growth, particularly in China. They also were concerned about the abilities of governments and central banks to address recessionary concerns and to spark business activity through monetary and fiscal policy. Throughout the period, the U.S. dollar tended to gain strength, which helped exporters in other countries but pressured importers who paid higher prices for goods and services.
The U.S. Federal Reserve backed off of its intentions stated at the end of 2015 to implement additional interest-rate increases during 2016, waiting until December 2016 to increase a key interest rate by 0.25%. Other central banks also remained accommodative. The European Central Bank (ECB) pushed the interest rate it pays on deposits further into negative territory. The Bank of Japan followed the ECB’s lead by setting a negative deposit rate. During the period, the People’s Bank of China guided its currency’s value lower relative to a basket of foreign currencies to enhance exports. Investors viewed the actions of major central banks as consistent with efforts to encourage lending and business activity.
| 1 | The Morgan Stanley Capital International (MSCI) Europe, Australasia, Far East (EAFE) Index (Net) is a free-float-adjusted market-capitalization weighted index that is designed to measure the equity market performance of developed markets, excluding the U.S. and Canada. The MSCI EAFE Index (Net) consists of the following 21 developed markets country indexes: Australia, Austria, Belgium, Denmark, Finland, France, Germany, Hong Kong, Ireland, Israel, Italy, Japan, the Netherlands, New Zealand, Norway, Portugal, Singapore, Spain, Sweden, Switzerland, and the United Kingdom. Source: MSCI. MSCI makes no express or implied warranties or representations and shall have no liability whatsoever with respect to any MSCI data contained herein. The MSCI data may not be further redistributed or used as a basis for other indexes or any securities or financial products. This report is not approved, reviewed, or produced by MSCI. You cannot invest directly in an index. |
| 2 | The MSCI World Index (Net) is a free-float-adjusted market-capitalization-weighted index that is designed to measure the equity market performance of developed markets. The MSCI World Index (Net) consists of the following 23 developed markets country indexes: Australia, Austria, Belgium, Canada, Denmark, Finland, France, Germany, Hong Kong, Ireland, Israel, Italy, Japan, the Netherlands, New Zealand, Norway, Portugal, Singapore, Spain, Sweden, Switzerland, the United Kingdom, and the United States. You cannot invest directly in an index. |
| 3 | The MSCI All Country World Index (ACWI) ex USA Index (Net) is a free-float-adjusted market-capitalization-weighted index that is designed to measure the equity market performance of developed markets, excluding the United States and Canada. You cannot invest directly in an index. |
| 4 | The S&P Developed SmallCap Index is a free-float-adjusted market-capitalization-weighted index designed to measure the equity market performance of small-capitalization companies located in developed markets. The index is composed of companies within the bottom 15% of the cumulative market capitalization in developed markets. The index covers all publicly listed equities with float-adjusted market values of U.S. $100 million or more and annual dollar value traded of at least U.S. $50 million in all included countries. You cannot invest directly in an index. |
| | | | | | |
| Letter to shareholders (unaudited) | | Wells Fargo VT International Equity Fund | | | 3 | |
Investors closely watched changing sentiment in global markets during the period.
In the second quarter of 2016, equity market volatility declined and remained relatively low until the end of June, when voters in the United Kingdom surprised market participants and approved the Brexit referendum to leave the European Union. Investors reacted to the news negatively and fled to assets such as precious metals and U.S. Treasury bonds. As a result, bond yields fell in several markets, and equity markets declined across the globe. In the weeks that follow, signs of resilience in major markets worldwide offset concerns stemming from the Brexit referendum.
Throughout the period, economic and business data, while often uneven, appeared to be strengthening overall. After generating concern early in 2016, China’s economic growth demonstrated strength. The prime minister’s reelection in Japan offered the potential for new economic stimulus. India appointed a new central-bank governor who many expected would continue the outgoing governor’s policies, which were considered effective. Members of the Organization of the Petroleum Exporting Countries agreed to production cuts intended to support increased prices for oil, which could benefit commodities markets that are economically important to many international developed and emerging markets.
Investors’ sentiments improved during the third quarter of 2016, which led to more favorable returns across global equity markets. On an improved perception of business health, economically sensitive sectors such as consumer discretionary, materials, financials, and industrials gained while traditionally defensive sectors (utilities, telecommunication services, health care, and consumer staples) benefited less during the market rally. Stocks drifted somewhat lower in the fourth quarter as the U.S. presidential campaign wore on toward the election. Following the November election, investors concerned about future trade and policy initiatives sold international market equities.
Don’t let short-term uncertainty derail long-term investment goals.
Periods of investment uncertainty can present challenges, but experience has taught us that maintaining long-term investment goals can be an effective way to plan for the future. To help you create a sound strategy based on your personal goals and risk tolerance, Wells Fargo Funds offers more than 100 mutual funds spanning a wide range of asset classes and investment styles. Although diversification cannot guarantee an investment profit or prevent losses, we believe it can be an effective way to manage investment risk and potentially smooth out overall portfolio performance. We encourage investors to know their investments and to understand that appropriate levels of risk-taking may unlock opportunities.
Thank you for choosing to invest with Wells Fargo Funds. We appreciate your confidence in us and remain committed to helping you meet your financial needs.
Sincerely,

Andrew Owen
President
Wells Fargo Funds
Throughout the period, economic and business data, while often uneven, appeared to be strengthening overall.
For further information about your Fund, contact your investment professional, visit our website at wellsfargofunds.com, or call us directly at 1-800-260-5969. We are available 24 hours a day, 7 days a week.
| | | | |
| 4 | | Wells Fargo VT International Equity Fund | | Performance highlights (unaudited) |
Investment objective
The Fund seeks long-term capital appreciation.
Manager
Wells Fargo Funds Management, LLC
Subadviser
Wells Capital Management Incorporated
Portfolio manager
Dale A. Winner, CFA®
Average annual total returns (%) as of December 31, 20161
| | | | | | | | | | | | | | | | | | | | | | |
| | | | | | | | Expense ratios2 (%) | |
| | | Inception date | | 1 year | | | 5 year | | | 10 year | | | Gross | | | Net3 | |
| Class 1 | | 8-17-1998 | | | 3.25 | | | | 6.40 | | | | 0.81 | | | | 0.95 | | | | 0.69 | |
| Class 2 | | 7-31-2002 | | | 3.30 | | | | 6.18 | | | | 0.58 | | | | 1.20 | | | | 0.94 | |
| MSCI ACWI ex USA Index (Net)4 | | – | | | 4.50 | | | | 5.00 | | | | 0.96 | | | | – | | | | – | |
Figures quoted represent past performance, which is no guarantee of future results. Investment return and principal value of an investment will fluctuate so that an investor’s shares, when redeemed, may be worth more or less than their original cost. Current performance may be lower or higher than the performance data quoted and assumes the reinvestment of dividends and capital gains. Current month-end performance is available by calling 1-800-260-5969. Performance figures of the Fund do not reflect fees charged pursuant to the terms of variable life insurance policies and variable annuity contracts. If sales loads or charges had been reflected, performance would have been lower.
Index returns do not include transaction costs associated with buying and selling securities, any mutual fund fees or expenses, or any taxes. It is not possible to invest directly in an index.
Stock values fluctuate in response to the activities of individual companies and general market and economic conditions. Foreign investments are especially volatile and can rise or fall dramatically due to differences in the political and economic conditions of the host country. These risks are generally intensified in emerging markets. The use of derivatives may reduce returns and/or increase volatility. Certain investment strategies tend to increase the total risk of an investment (relative to the broader market). The Fund is exposed to smaller-company securities risk. Consult the Fund’s prospectus for additional information on these and other risks.
Please refer to the prospectus provided by your participating insurance company for detailed information describing the separate accounts for information regarding surrender charges, mortality and expense risk fees, and other charges that may be assessed by the participating insurance companies.
Please see footnotes on page 5.
| | | | | | |
| Performance highlights (unaudited) | | Wells Fargo VT International Equity Fund | | | 5 | |
|
| Growth of $10,000 investment as of December 31, 20165 |
|
 |
| 1 | Historical performance shown for all classes of the Fund prior to July 19, 2010, is based on the performance of the Fund’s predecessor, Evergreen VA International Equity Fund. |
| 2 | Reflects the expense ratios as stated in the most recent prospectuses. The expense ratios shown are subject to change and may differ from the annualized expense ratios shown in the financial highlights of this report. |
| 3 | The manager has contractually committed through April 30, 2017, to waive fees and/or reimburse expenses to the extent necessary to cap the Fund’s Total Annual Fund Operating Expenses After Fee Waiver at the amounts shown. After this time, the cap may be increased or the commitment to maintain the cap may be terminated only with the approval of the Board of Trustees. Brokerage commissions, stamp duty fees, interest, taxes, acquired fund fees and expenses, and extraordinary expenses are excluded from the expense cap. Without this cap, the Fund’s returns would have been lower. |
| 4 | The Morgan Stanley Capital International (MSCI) All Country World Index (ACWI) ex USA Index (Net) is a free-float-adjusted market-capitalization-weighted index that is designed to measure the equity market performance of developed markets, excluding the United States and Canada. Source: MSCI. MSCI makes no express or implied warranties or representations and shall have no liability whatsoever with respect to any MSCI data contained herein. The MSCI data may not be further redistributed or used as a basis for other indexes or any securities or financial products. This report is not approved, reviewed, or produced by MSCI. You cannot invest directly in an index. |
| 5 | The chart compares the performance of Class 2 shares for the most recent ten years with the MSCI ACWI ex USA Index (Net). The chart assumes a hypothetical $10,000 investment and reflects all operating expenses of the Fund. Performance does not reflect fees charged pursuant to the terms of variable life insurance policies and variable annuity contracts. |
| 6 | The ten largest holdings, excluding cash and cash equivalents, are calculated based on the value of the investments divided by total net assets of the Fund. Holdings are subject to change and may have changed since the date specified. |
| 7 | Amounts are calculated based on the total long-term investments of the Fund. These amounts are subject to change and may have changed since the date specified. |
| | | | |
| 6 | | Wells Fargo VT International Equity Fund | | Performance highlights (unaudited) |
MANAGER’S DISCUSSION
Fund highlights
| ∎ | | The Fund underperformed its benchmark, the MSCI ACWI ex USA Index (Net), for the 12-month period that ended December 31, 2016. |
| ∎ | | For the one-year period, notable sector performance contributors included investments in producer manufacturing, electronic technology, and consumer nondurables. |
| ∎ | | The Fund had its largest country weights in German, Japanese, Swiss, U.K., Hong Kong, U.S., Dutch, and South Korean companies, where the management team believed it uncovered undervalued investments. Currency hedges of European exchange rate risk also added to performance. |
Stock selection drove fund performance amid volatility.
Notable detractors included investments in financials, consumer durables, and health technology. Despite sustained market volatility throughout the year, the investment team continued to employ an approach to fundamental research that has served us well in the past: searching for nonconsensus values around the globe; maintaining a focus on overall investment risk management; and rebalancing infrequently, doing so only to capture unusual stock market or company-specific price movements for investors’ potential benefit as we married fundamental stock-picking with macro and risk research. Largest sector allocations include financials, industrials, and telecommunication services, with notable underweights in materials, consumer discretionary, and utilities stocks.
During the period, selected stocks detracted from portfolio performance including ANIMA Holding S.p.A., HUGO BOSS AG, Cameco Corporation, Value Partners Group Limited, Vodafone Plc, Dongfeng Motor Group Company, Limited, and Hitachi, Limited. While the losses associated with these and other investments caused the performance of the portfolio to trail that of the benchmark, the investment team generated positive absolute and relative returns in regions and countries globally, with performance rebounding in the third and fourth quarter. Some of the best stock performances came from stocks such as Lundin Mining Corporation, Smiths Group plc, Coca-Cola East Japan Company, Limited, Siemens AG, Hana Financial Incorporated, Prysmian S.p.A., and Samsung Electronics Company, Limited. The resurgence of value stocks relative to more momentum-oriented growth stocks in the last several months of the year, coincident with growing signs of global economic leading indicators, inflationary expectations, sovereign yields, and yield curves was notable.
Regionally, divergent and compelling investment opportunities are emerging.
In Europe, opportunities arose based on stock-specific fundamentals largely improving from self-help restructuring and continued indications of a cyclical economic recovery. Companies engaged in business portfolio reshaping and earnings normalization through the implementation of operational efficiencies such as careful investment, cost-cutting, and profit maximization which can include dedicating additional resources to profitable businesses or divestment of unprofitable businesses. Companies that undertaking these initiatives are set to bolster their profitability and benefit from the additional impetus of targeted industrial and structural reforms and a continent-wide cyclical recovery. Our larger position weights include investments such as Eni S.p.A., Novartis AG, METRO AG, Compagnie de Saint-Gobain S.A., Zurich Insurance Group Limited, and Koninklijke Philips N.V. in continental Europe, as well as Wolseley plc and Vodafone in the U.K. The European Central Bank retained a watchful eye over Europe’s deleveraging, remaining intent on its quantitative easing and extending the duration of expected asset purchases.
In Japan, the distinctions between corporate new Japan and old Japan continued to widen in an unusually volatile year for the country’s capital markets beginning with negative volatility in the first several months of the year and concluding with a return of fundamental investor interest in Japanese equities. Top portfolio holdings include Daiwa Securities Group Incorporated, Coca-Cola East Japan, Hitachi, Mitsubishi UFJ Financial Group, Incorporated, and Nomura Holdings, Incorporated. Abenomics, the economic policies of Japan's Prime Minister Shinzō Abe, this year stood out for encouraging an increasing number of companies to embrace more shareholder friendly actions with a backdrop of a watchful and active Bank of Japan and significant fiscal stimulus to add to reflationary public policies.
The portfolio remains invested in selected stocks considered to represent value in emerging markets sidestepping those deemed emerging markets value traps. Investments in Hong Kong/China represented the most significant emerging markets exposure, specifically in undervalued stocks benefiting from the gradual transition to a more consumer-oriented society—for
Please see footnotes on page 5.
| | | | | | |
| Performance highlights (unaudited) | | Wells Fargo VT International Equity Fund | | | 7 | |
example, China Mobile Limited, Kweichow Moutai Company, Limited, and Xinyi Glass Holdings, Limited. South Korean holdings include SK Telecom Company, Limited, Hana Financial, and Samsung Electronics. In addition, the Fund owns holdings in Brazil (Cosan S.A.) and Russia (recently initiated Mobile TeleSystems OJSC) and remains underweight in emerging markets with more untenable macro imbalances and therefore weaker resilience to domestic and external pressures.
We continue to adhere to our investment process while remaining mindful of risks.
We expect that the equity and currency volatility across developed and emerging markets that was evident in years past will persist during 2017 as economies, central banks, and other public policy officials attempt to adjust from long-term deleveraging and economic imbalances. We partially hedged overweight exposures in European currencies. We remain mindful of these risks globally in 2017 and look forward to adapting our portfolio as opportunities arise in quarters to come.
| | | | |
| Ten largest holdings (%) as of December 31, 20166 | |
Eni SpA | | | 3.59 | |
Novartis AG | | | 3.47 | |
Metro AG | | | 3.24 | |
Compagnie de Saint-Gobain SA | | | 3.18 | |
SK Telecom Company Limited | | | 3.09 | |
Wolseley plc | | | 3.06 | |
Zurich Insurance Group AG | | | 3.04 | |
Koninklijke Philips NV | | | 2.97 | |
China Mobile Limited | | | 2.91 | |
Daiwa Securities Group Incorporated | | | 2.91 | |
|
| Sector distribution as of December 31, 20167 |
|
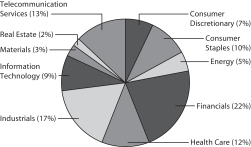 |
|
| Country allocation as of December 31, 20167 |
|
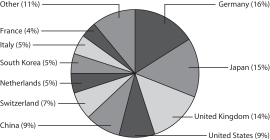 |
Please see footnotes on page 5.
| | | | |
| 8 | | Wells Fargo VT International Equity Fund | | Fund expenses (unaudited) |
As a shareholder of the Fund, you incur ongoing costs, including management fees, distribution (12b-1) fees, and other Fund expenses. This example is intended to help you understand your ongoing costs (in dollars) of investing in the Fund and to compare these costs with the ongoing costs of investing in other mutual funds.
The example is based on an investment of $1,000 invested at the beginning of the six-month period and held for the entire period from July 1, 2016 to December 31, 2016.
Actual expenses
The “Actual” line of the table below provides information about actual account values and actual expenses. You may use the information in this line, together with the amount you invested, to estimate the expenses that you paid over the period. Simply divide your account value by $1,000 (for example, an $8,600 account value divided by $1,000 = 8.6), then multiply the result by the number in the “Actual” line under the heading entitled “Expenses Paid During Period” for your applicable class of shares to estimate the expenses you paid on your account during this period.
Hypothetical example for comparison purposes
The “Hypothetical” line of the table below provides information about hypothetical account values and hypothetical expenses based on the Fund’s actual expense ratio and an assumed rate of return of 5% per year before expenses, which is not the Fund’s actual return. The hypothetical account values and expenses may not be used to estimate the actual ending account balance or expenses you paid for the period. You may use this information to compare the ongoing costs of investing in the Fund and other funds. To do so, compare this 5% hypothetical example with the 5% hypothetical examples that appear in the shareholder reports of the other funds.
Please note that the expenses shown in the table are meant to highlight your ongoing costs only and do not reflect any separate account charges assessed by participating insurance companies. Therefore, the “Hypothetical” line of the table is useful in comparing ongoing costs only, and will not help you determine the relative total costs of owning different funds. In addition, if these separate account charges assessed by participating insurance companies were included, your costs would have been higher.
| | | | | | | | | | | | | | | | |
| | | Beginning
account value
7-1-2016 | | | Ending
account value
12-31-2016 | | | Expenses
paid during
the period¹ | | | Annualized net
expense ratio | |
Class 1 | | | | | | | | | | | | | | | | |
Actual | | $ | 1,000.00 | | | $ | 1,098.64 | | | $ | 3.64 | | | | 0.69 | % |
Hypothetical (5% return before expenses) | | $ | 1,000.00 | | | $ | 1,021.67 | | | $ | 3.51 | | | | 0.69 | % |
Class 2 | | | | | | | | | | | | | | | | |
Actual | | $ | 1,000.00 | | | $ | 1,098.80 | | | $ | 4.96 | | | | 0.94 | % |
Hypothetical (5% return before expenses) | | $ | 1,000.00 | | | $ | 1,020.41 | | | $ | 4.77 | | | | 0.94 | % |
| 1 | Expenses paid is equal to the annualized net expense ratio of each class multiplied by the average account value over the period, multiplied by the number of days in the most recent fiscal half-year divided by the number of days in the fiscal year (to reflect the one-half year period). |
| | | | | | |
| Portfolio of investments—December 31, 2016 | | Wells Fargo VT International Equity Fund | | | 9 | |
| | | | | | | | | | | | | | | | |
| Security name | | | | | | | | Shares | | | Value | |
| | | | | | | | | | | | | | | | |
| | | | |
Common Stocks: 84.54% | | | | | | | | | | | | | | | | |
| | | | |
| Brazil: 0.16% | | | | | | | | | | | | | | | | |
Cosan Limited Class A (Energy, Oil, Gas & Consumable Fuels) | | | | | | | | | | | 65,456 | | | $ | 491,575 | |
| | | | | | | | | | | | | | | | |
| | | | |
| Canada: 2.42% | | | | | | | | | | | | | | | | |
Lundin Mining Corporation (Materials, Metals & Mining) † | | | | | | | | | | | 1,590,775 | | | | 7,582,736 | |
| | | | | | | | | | | | | | | | |
| | | | |
| China: 6.33% | | | | | | | | | | | | | | | | |
China Everbright Limited (Financials, Capital Markets) | | | | | | | | | | | 1,654,000 | | | | 3,148,242 | |
China Mobile Limited (Telecommunication Services, Wireless Telecommunication Services) | | | | | | | | | | | 861,500 | | | | 9,132,156 | |
Industrial & Commercial Bank of China Limited H Shares (Financials, Banks) | | | | | | | | | | | 1,543,000 | | | | 925,263 | |
Shanghai Pharmaceuticals Holding Company Limited H Shares (Health Care, Health Care Providers & Services) | | | | | | | | | | | 1,466,100 | | | | 3,361,565 | |
Xinyi Solar Holdings Limited (Information Technology, Semiconductors & Semiconductor Equipment) « | | | | | | | | | | | 4,722,000 | | | | 1,534,521 | |
Xtep International Holdings Limited (Consumer Discretionary, Textiles, Apparel & Luxury Goods) | | | | | | | | | | | 4,162,179 | | | | 1,749,784 | |
| | | | |
| | | | | | | | | | | | | | | 19,851,531 | |
| | | | | | | | | | | | | | | | |
| | | | |
| Denmark: 0.88% | | | | | | | | | | | | | | | | |
Novo Nordisk AS Class B (Health Care, Pharmaceuticals) | | | | | | | | | | | 76,511 | | | | 2,759,271 | |
| | | | | | | | | | | | | | | | |
| | | | |
| France: 3.18% | | | | | | | | | | | | | | | | |
Compagnie de Saint-Gobain SA (Industrials, Building Products) | | | | | | | | | | | 213,983 | | | | 9,968,408 | |
| | | | | | | | | | | | | | | | |
| | | | |
| Germany: 13.55% | | | | | | | | | | | | | | | | |
Bayer AG (Health Care, Pharmaceuticals) | | | | | | | | | | | 83,279 | | | | 8,690,100 | |
Metro AG (Consumer Staples, Food & Staples Retailing) | | | | | | | | | | | 305,316 | | | | 10,151,135 | |
Muenchener Rueckversicherungs Gesellschaft AG (Financials, Insurance) | | | | | | | | | | | 41,602 | | | | 7,867,298 | |
Rheinmetall AG (Industrials, Industrial Conglomerates) | | | | | | | | | | | 67,241 | | | | 4,522,923 | |
SAP SE (Information Technology, Software) | | | | | | | | | | | 72,828 | | | | 6,348,415 | |
Siemens AG (Industrials, Industrial Conglomerates) | | | | | | | | | | | 40,159 | | | | 4,937,532 | |
| | | | |
| | | | | | | | | | | | | | | 42,517,403 | |
| | | | | | | | | | | | | | | | |
| | | | |
| Hong Kong: 1.39% | | | | | | | | | | | | | | | | |
Xinyi Automobile Glass Hong Kong Enterprises Limited (Consumer Discretionary, Auto Components) † | | | | | | | | | | | 649,250 | | | | 125,588 | |
Xinyi Glass Holdings Limited (Consumer Discretionary, Auto Components) | | | | | | | | | | | 5,194,000 | | | | 4,246,561 | |
| | | | |
| | | | | | | | | | | | | | | 4,372,149 | |
| | | | | | | | | | | | | | | | |
| | | | |
| Italy: 4.33% | | | | | | | | | | | | | | | | |
Eni SpA (Energy, Oil, Gas & Consumable Fuels) | | | | | | | | | | | 691,618 | | | | 11,262,655 | |
Prysmian SpA (Industrials, Electrical Equipment) | | | | | | | | | | | 90,348 | | | | 2,320,559 | |
| | | | |
| | | | | | | | | | | | | | | 13,583,214 | |
| | | | | | | | | | | | | | | | |
| | | | |
| Japan: 13.34% | | | | | | | | | | | | | | | | |
Coca-Cola East Japan Company Limited (Consumer Staples, Beverages) | | | | | | | | | | | 389,700 | | | | 8,589,238 | |
Daiwa Securities Group Incorporated (Financials, Capital Markets) | | | | | | | | | | | 1,479,000 | | | | 9,115,069 | |
Hitachi Limited (Information Technology, Electronic Equipment, Instruments & Components) | | | | | | | | | | | 1,461,000 | | | | 7,900,338 | |
Mitsubishi UFJ Financial Group Incorporated (Financials, Banks) | | | | | | | | | | | 1,114,700 | | | | 6,868,936 | |
Mitsui Fudosan Company Limited (Real Estate, Real Estate Management & Development) | | | | | | | | | | | 152,000 | | | | 3,517,947 | |
Nomura Holdings Incorporated (Financials, Capital Markets) | | | | | | | | | | | 996,500 | | | | 5,875,407 | |
| | | | |
| | | | | | | | | | | | | | | 41,866,935 | |
| | | | | | | | | | | | | | | | |
The accompanying notes are an integral part of these financial statements.
| | | | |
| 10 | | Wells Fargo VT International Equity Fund | | Portfolio of investments—December 31, 2016 |
| | | | | | | | | | | | | | | | |
| Security name | | | | | | | | Shares | | | Value | |
| | | | | | | | | | | | | | | | |
| | | | |
| Netherlands: 4.72% | | | | | | | | | | | | | | | | |
Koninklijke Philips NV (Industrials, Industrial Conglomerates) « | | | | | | | | | | | 305,586 | | | $ | 9,328,582 | |
NN Group NV (Financials, Insurance) | | | | | | | | | | | 161,969 | | | | 5,489,142 | |
| | | | |
| | | | | | | | | | | | | | | 14,817,724 | |
| | | | | | | | | | | | | | | | |
| | | | |
| Norway: 1.20% | | | | | | | | | | | | | | | | |
Frontline Limited (Energy, Oil, Gas & Consumable Fuels) « | | | | | | | | | | | 166,872 | | | | 1,198,106 | |
Marine Harvest ASA (Consumer Staples, Food Products) | | | | | | | | | | | 142,488 | | | | 2,569,135 | |
| | | | |
| | | | | | | | | | | | | | | 3,767,241 | |
| | | | | | | | | | | | | | | | |
| | | | |
| Russia: 2.83% | | | | | | | | | | | | | | | | |
Mobile Telesystems ADR (Telecommunication Services, Wireless Telecommunication Services) | | | | | | | | | | | 976,055 | | | | 8,891,861 | |
| | | | | | | | | | | | | | | | |
| | | | |
| South Korea: 4.50% | | | | | | | | | | | | | | | | |
Hana Financial Group Incorporated (Financials, Banks) | | | | | | | | | | | 110,123 | | | | 2,849,266 | |
Samsung Electronics Company Limited GDR (Information Technology, Technology Hardware, Storage & Peripherals) 144A | | | | | | | | | | | 2,126 | | | | 1,588,122 | |
SK Telecom Company Limited (Telecommunication Services, Wireless Telecommunication Services) | | | | | | | | | | | 52,237 | | | | 9,687,935 | |
| | | | |
| | | | | | | | | | | | | | | 14,125,323 | |
| | | | | | | | | | | | | | | | |
| | | | |
| Switzerland: 6.51% | | | | | | | | | | | | | | | | |
Novartis AG (Health Care, Pharmaceuticals) | | | | | | | | | | | 149,464 | | | | 10,876,247 | |
Zurich Insurance Group AG (Financials, Insurance) | | | | | | | | | | | 34,622 | | | | 9,533,545 | |
| | | | |
| | | | | | | | | | | | | | | 20,409,792 | |
| | | | | | | | | | | | | | | | |
| | | | |
| United Kingdom: 12.03% | | | | | | | | | | | | | | | | |
Man Group plc (Financials, Capital Markets) | | | | | | | | | | | 5,308,395 | | | | 7,739,263 | |
Smiths Group plc (Industrials, Industrial Conglomerates) | | | | | | | | | | | 408,599 | | | | 7,130,372 | |
United Business Media plc (Consumer Discretionary, Media) | | | | | | | | | | | 536,920 | | | | 4,840,336 | |
Vodafone Group plc (Telecommunication Services, Wireless Telecommunication Services) | | | | | | | | | | | 3,428,495 | | | | 8,444,215 | |
Wolseley plc (Industrials, Trading Companies & Distributors) | | | | | | | | | | | 156,818 | | | | 9,589,684 | |
| | | | |
| | | | | | | | | | | | | | | 37,743,870 | |
| | | | | | | | | | | | | | | | |
| | | | |
| United States: 7.17% | | | | | | | | | | | | | | | | |
Apple Incorporated (Information Technology, Technology Hardware, Storage & Peripherals) | | | | | | | | | | | 69,349 | | | | 8,032,001 | |
Coach Incorporated (Consumer Discretionary, Textiles, Apparel & Luxury Goods) | | | | | | | | | | | 212,284 | | | | 7,434,186 | |
Pfizer Incorporated (Health Care, Pharmaceuticals) | | | | | | | | | | | 216,666 | | | | 7,037,310 | |
| | | | |
| | | | | | | | | | | | | | | 22,503,497 | |
| | | | | | | | | | | | | | | | |
| | | | |
Total Common Stocks (Cost $251,978,858) | | | | | | | | | | | | | | | 265,252,530 | |
| | | | | | | | | | | | | | | | |
| | | | |
Exchange-Traded Funds: 1.10% | | | | | | | | | | | | | | | | |
| | | | |
| United States: 1.10% | | | | | | | | | | | | | | | | |
iShares MSCI ACWI ex US ETF « | | | | | | | | | | | 85,862 | | | | 3,457,663 | |
| | | | | | | | | | | | | | | | |
| | | | |
Total Exchange-Traded Funds (Cost $3,421,716) | | | | | | | | | | | | | | | 3,457,663 | |
| | | | | | | | | | | | | | | | |
The accompanying notes are an integral part of these financial statements.
| | | | | | |
| Portfolio of investments—December 31, 2016 | | Wells Fargo VT International Equity Fund | | | 11 | |
| | | | | | | | | | | | | | | | |
| Security name | | | | | Maturity date | | | Shares | | | Value | |
| | | | | | | | | | | | | | | | |
| | | | |
Participation Notes: 1.74% | | | | | | | | | | | | | | | | |
| | | | |
| China: 1.74% | | | | | | | | | | | | | | | | |
HSBC Bank plc (Kweichow Moutai Company Limited Class A) (Consumer Staples, Beverages) † | | | | | | | 2-19-2019 | | | | 113,208 | | | $ | 5,447,646 | |
| | | | |
Total Participation Notes (Cost $3,366,557) | | | | | | | | | | | | | | | 5,447,646 | |
| | | | | | | | | | | | | | | | |
| | | | |
| | | Yield | | | | | | | | | | |
Short-Term Investments: 13.07% | | | | | | | | | | | | | | | | |
| | | | |
| Investment Companies: 13.07% | | | | | | | | | | | | | | | | |
Securities Lending Cash Investment LLC (l)(r)(u) | | | 0.83 | % | | | | | | | 5,277,239 | | | | 5,277,767 | |
Wells Fargo Government Money Market Fund Select Class (l)(u) | | | 0.43 | | | | | | | | 35,731,501 | | | | 35,731,501 | |
| | | | |
Total Short-Term Investments (Cost $41,009,087) | | | | | | | | | | | | | | | 41,009,268 | |
| | | | | | | | | | | | | | | | |
| | | | | | | | |
| Total investments in securities (Cost $299,776,218) * | | | 100.45 | % | | | 315,167,107 | |
Other assets and liabilities, net | | | (0.45 | ) | | | (1,402,363 | ) |
| | | | | | | | |
| Total net assets | | | 100.00 | % | | $ | 313,764,744 | |
| | | | | | | | |
| † | Non-income-earning security |
| « | All or a portion of this security is on loan. |
| 144A | The security may be resold in transactions exempt from registration, normally to qualified institutional buyers, pursuant to Rule 144A under the Securities Act of 1933. |
| (l) | The issuer of the security is an affiliated person of the Fund as defined in the Investment Company Act of 1940. |
| (r) | The investment is a non-registered investment vehicle purchased with cash collateral received from securities on loan. |
| (u) | The rate represents the 7-day annualized yield at period end. |
| * | Cost for federal income tax purposes is $300,419,179 and unrealized gains (losses) consists of: |
| | | | |
Gross unrealized gains | | $ | 25,993,973 | |
Gross unrealized losses | | | (11,246,045 | ) |
| | | | |
Net unrealized gains | | $ | 14,747,928 | |
The accompanying notes are an integral part of these financial statements.
| | | | |
| 12 | | Wells Fargo VT International Equity Fund | | Statement of assets and liabilities—December 31, 2016 |
| | | | |
| | | | |
| |
Assets | | | | |
Investments | | | | |
In unaffiliated securities (including $5,093,783 of securities loaned), at value (cost $258,767,131) | | $ | 274,157,839 | |
In affiliated securities, at value (cost $41,009,087) | | | 41,009,268 | |
| | | | |
Total investments, at value (cost $299,776,218) | | | 315,167,107 | |
Foreign currency, at value (cost $2,691,951) | | | 2,446,120 | |
Receivable for investments sold | | | 1,261,089 | |
Receivable for Fund shares sold | | | 43,188 | |
Receivable for dividends | | | 1,083,045 | |
Receivable for securities lending income | | | 20,171 | |
Unrealized gains on forward foreign currency contracts | | | 675,880 | |
Prepaid expenses and other assets | | | 4,399 | |
| | | | |
Total assets | | | 320,700,999 | |
| | | | |
| |
Liabilities | | | | |
Payable for Fund shares redeemed | | | 145,818 | |
Cash collateral due to broker | | | 1,230,000 | |
Payable upon receipt of securities loaned | | | 5,277,530 | |
Management fee payable | | | 152,758 | |
Distribution fee payable | | | 65,101 | |
Administration fees payable | | | 22,644 | |
Accrued expenses and other liabilities | | | 42,404 | |
| | | | |
Total liabilities | | | 6,936,255 | |
| | | | |
Total net assets | | $ | 313,764,744 | |
| | | | |
| |
NET ASSETS CONSIST OF | | | | |
Paid-in capital | | $ | 299,904,634 | |
Undistributed net investment income | | | 8,685,137 | |
Accumulated net realized losses on investments | | | (10,654,593 | ) |
Net unrealized gains on investments | | | 15,829,566 | |
| | | | |
Total net assets | | $ | 313,764,744 | |
| | | | |
| |
COMPUTATION OF NET ASSET VALUE PER SHARE | | | | |
Net assets – Class 1 | | $ | 25,136,799 | |
Shares outstanding – Class 11 | | | 5,694,839 | |
Net asset value per share – Class 1 | | | $4.41 | |
Net assets – Class 2 | | $ | 288,627,945 | |
Shares outstanding – Class 21 | | | 64,932,730 | |
Net asset value per share – Class 2 | | | $4.45 | |
| 1 | The Fund has an unlimited number of authorized shares. |
The accompanying notes are an integral part of these financial statements.
| | | | | | |
| Statement of operations—year ended December 31, 2016 | | Wells Fargo VT International Equity Fund | | | 13 | |
| | | | |
| | | | |
| |
Investment income | | | | |
Dividends (net of foreign withholding taxes of $708,711) | | $ | 9,629,158 | |
Securities lending income, net | | | 175,183 | |
Income from affiliated securities | | | 83,350 | |
| | | | |
Total investment income | | | 9,887,691 | |
| | | | |
| |
Expenses | | | | |
Management fee | | | 2,482,781 | |
Administration fees | | | | |
Class 1 | | | 20,399 | |
Class 2 | | | 227,879 | |
Distribution fee | | | | |
Class 2 | | | 712,121 | |
Custody and accounting fees | | | 93,719 | |
Professional fees | | | 44,789 | |
Shareholder report expenses | | | 42,417 | |
Trustees’ fees and expenses | | | 21,977 | |
Other fees and expenses | | | 17,133 | |
| | | | |
Total expenses | | | 3,663,215 | |
Less: Fee waivers and/or expense reimbursements | | | (809,695 | ) |
| | | | |
Net expenses | | | 2,853,520 | |
| | | | |
Net investment income | | | 7,034,171 | |
| | | | |
| |
REALIZED AND UNREALIZED GAINS (LOSSES) ON INVESTMENTS | | | | |
|
Net realized gains (losses) on: | |
Unaffiliated securities | | | (8,763,709 | ) |
Affiliated securities | | | 56 | |
Forward foreign currency contract transactions | | | 2,481,648 | |
| | | | |
Net realized losses on investments | | | (6,282,005 | ) |
| | | | |
| |
Net change in unrealized gains (losses) on: | | | | |
Unaffiliated securities | | | 9,296,885 | |
Affiliated securities | | | 181 | |
Forward foreign currency contract transactions | | | (134,167 | ) |
| | | | |
Net change in unrealized gains (losses) on investments | | | 9,162,899 | |
| | | | |
Net realized and unrealized gains (losses) on investments | | | 2,880,894 | |
| | | | |
Net increase in net assets resulting from operations | | $ | 9,915,065 | |
| | | | |
The accompanying notes are an integral part of these financial statements.
| | | | |
| 14 | | Wells Fargo VT International Equity Fund | | Statement of changes in net assets |
| | | | | | | | | | | | | | | | |
| | | Year ended
December 31, 2016 | | | Year ended
December 31, 2015 | |
| | | | |
Operations | | | | | | | | | | | | | | | | |
Net investment income | | | | | | $ | 7,034,171 | | | | | | | $ | 6,247,038 | |
Net realized gains (losses) on investments | | | | | | | (6,282,005 | ) | | | | | | | 30,216,711 | |
Net change in unrealized gains (losses) on investments | | | | | | | 9,162,899 | | | | | | | | (27,072,622 | ) |
| | | | |
Net increase in net assets resulting from operations | | | | | | | 9,915,065 | | | | | | | | 9,391,127 | |
| | | | |
| | | | |
Distributions to shareholders from | | | | | | | | | | | | | | | | |
Net investment income | | | | | | | | | | | | | | | | |
Class 1 | | | | | | | (793,355 | ) | | | | | | | (1,411,647 | ) |
Class 2 | | | | | | | (8,065,124 | ) | | | | | | | (11,944,889 | ) |
Net realized gains | | | | | | | | | | | | | | | | |
Class 1 | | | | | | | (1,930,040 | ) | | | | | | | 0 | |
Class 2 | | | | | | | (21,828,958 | ) | | | | | | | 0 | |
| | | | |
Total distributions to shareholders | | | | | | | (32,617,477 | ) | | | | | | | (13,356,536 | ) |
| | | | |
| | | | |
Capital share transactions | | | Shares | | | | | | | | Shares | | | | | |
Proceeds from shares sold | | | | | | | | | | | | | | | | |
Class 1 | | | 428,691 | | | | 1,873,330 | | | | 1,225,746 | | | | 6,328,345 | |
Class 2 | | | 3,816,908 | | | | 16,773,542 | | | | 4,763,141 | | | | 24,649,508 | |
| | | | |
| | | | | | | 18,646,872 | | | | | | | | 30,977,853 | |
| | | | |
Reinvestment of distributions | | | | | | | | | | | | | | | | |
Class 1 | | | 694,743 | | | | 2,723,395 | | | | 274,639 | | | | 1,411,647 | |
Class 2 | | | 7,549,011 | | | | 29,894,082 | | | | 2,310,423 | | | | 11,944,889 | |
| | | | |
| | | | | | | 32,617,477 | | | | | | | | 13,356,536 | |
| | | | |
Payment for shares redeemed | | | | | | | | | | | | | | | | |
Class 1 | | | (1,710,735 | ) | | | (7,542,633 | ) | | | (1,838,812 | ) | | | (9,547,629 | ) |
Class 2 | | | (7,426,109 | ) | | | (32,722,984 | ) | | | (8,932,752 | ) | | | (48,861,658 | ) |
| | | | |
| | | | | | | (40,265,617 | ) | | | | | | | (58,409,287 | ) |
| | | | |
Net increase (decrease) in net assets resulting from capital share transactions | | | | | | | 10,998,732 | | | | | | | | (14,074,898 | ) |
| | | | |
Total decrease in net assets | | | | | | | (11,703,680 | ) | | | | | | | (18,040,307 | ) |
| | | | |
| | | | |
Net assets | | | | | | | | | | | | | | | | |
Beginning of period | | | | | | | 325,468,424 | | | | | | | | 343,508,731 | |
| | | | |
End of period | | | | | | $ | 313,764,744 | | | | | | | $ | 325,468,424 | |
| | | | |
Undistributed net investment income | | | | | | $ | 8,685,137 | | | | | | | $ | 8,040,861 | |
| | | | |
The accompanying notes are an integral part of these financial statements.
| | | | | | |
| Financial highlights | | Wells Fargo VT International Equity Fund | | | 15 | |
(For a share outstanding throughout each period)
| | | | | | | | | | | | | | | | | | | | |
| | | Year ended December 31 | |
| CLASS 1 | | 2016 | | | 2015 | | | 2014 | | | 2013 | | | 2012 | |
Net asset value, beginning of period | | | $4.82 | | | | $4.92 | | | | $5.48 | | | | $4.94 | | | | $4.77 | |
Net investment income | | | 0.11 | 1 | | | 0.11 | 1 | | | 0.18 | 1 | | | 0.12 | 1 | | | 0.13 | 1 |
Net realized and unrealized gains (losses) on investments | | | (0.01 | ) | | | 0.02 | | | | (0.46 | ) | | | 0.82 | | | | 0.45 | |
| | | | | | | | | | | | | | | | | | | | |
Total from investment operations | | | 0.10 | | | | 0.13 | | | | (0.28 | ) | | | 0.94 | | | | 0.58 | |
Distributions to shareholders from | | | | | | | | | | | | | | | | | | | | |
Net investment income | | | (0.15 | ) | | | (0.23 | ) | | | (0.16 | ) | | | (0.13 | ) | | | (0.08 | ) |
Net realized gains | | | (0.36 | ) | | | 0.00 | | | | (0.12 | ) | | | (0.27 | ) | | | (0.33 | ) |
| | | | | | | | | | | | | | | | | | | | |
Total distributions to shareholders | | | (0.51 | ) | | | (0.23 | ) | | | (0.28 | ) | | | (0.40 | ) | | | (0.41 | ) |
Net asset value, end of period | | | $4.41 | | | | $4.82 | | | | $4.92 | | | | $5.48 | | | | $4.94 | |
Total return | | | 3.25 | % | | | 2.30 | % | | | (5.30 | )% | | | 19.94 | % | | | 13.68 | % |
Ratios to average net assets (annualized) | | | | | | | | | | | | | | | | | | | | |
Gross expenses | | | 0.95 | % | | | 0.95 | % | | | 0.94 | % | | | 0.95 | % | | | 0.98 | % |
Net expenses | | | 0.69 | % | | | 0.69 | % | | | 0.69 | % | | | 0.69 | % | | | 0.69 | % |
Net investment income | | | 2.49 | % | | | 2.04 | % | | | 3.44 | % | | | 2.36 | % | | | 2.68 | % |
Supplemental data | | | | | | | | | | | | | | | | | | | | |
Portfolio turnover rate | | | 77 | % | | | 34 | % | | | 39 | % | | | 32 | % | | | 140 | % |
Net assets, end of period (000s omitted) | | | $25,137 | | | | $30,254 | | | | $32,599 | | | | $42,021 | | | | $43,089 | |
| 1 | Calculated based upon average shares outstanding |
The accompanying notes are an integral part of these financial statements.
| | | | |
| 16 | | Wells Fargo VT International Equity Fund | | Financial highlights |
(For a share outstanding throughout each period)
| | | | | | | | | | | | | | | | | | | | |
| | | Year ended December 31 | |
| CLASS 2 | | 2016 | | | 2015 | | | 2014 | | | 2013 | | | 2012 | |
Net asset value, beginning of period | | | $4.84 | | | | $4.95 | | | | $5.50 | | | | $4.96 | | | | $4.78 | |
Net investment income | | | 0.10 | | | | 0.09 | 1 | | | 0.16 | | | | 0.11 | 1 | | | 0.11 | |
Net realized and unrealized gains (losses) on investments | | | 0.00 | | | | 0.01 | | | | (0.45 | ) | | | 0.82 | | | | 0.47 | |
| | | | | | | | | | | | | | | | | | | | |
Total from investment operations | | | 0.10 | | | | 0.10 | | | | (0.29 | ) | | | 0.93 | | | | 0.58 | |
Distributions to shareholders from | | | | | | | | | | | | | | | | | | | | |
Net investment income | | | (0.13 | ) | | | (0.21 | ) | | | (0.14 | ) | | | (0.12 | ) | | | (0.07 | ) |
Net realized gains | | | (0.36 | ) | | | 0.00 | | | | (0.12 | ) | | | (0.27 | ) | | | (0.33 | ) |
| | | | | | | | | | | | | | | | | | | | |
Total distributions to shareholders | | | (0.49 | ) | | | (0.21 | ) | | | (0.26 | ) | | | (0.39 | ) | | | (0.40 | ) |
Net asset value, end of period | | | $4.45 | | | | $4.84 | | | | $4.95 | | | | $5.50 | | | | $4.96 | |
Total return | | | 3.30 | % | | | 1.80 | % | | | (5.35 | )% | | | 19.52 | % | | | 13.48 | % |
Ratios to average net assets (annualized) | | | | | | | | | | | | | | | | | | | | |
Gross expenses | | | 1.20 | % | | | 1.20 | % | | | 1.20 | % | | | 1.20 | % | | | 1.23 | % |
Net expenses | | | 0.94 | % | | | 0.94 | % | | | 0.94 | % | | | 0.94 | % | | | 0.94 | % |
Net investment income | | | 2.25 | % | | | 1.77 | % | | | 3.07 | % | | | 2.08 | % | | | 2.41 | % |
Supplemental data | | | | | | | | | | | | | | | | | | | | |
Portfolio turnover rate | | | 77 | % | | | 34 | % | | | 39 | % | | | 32 | % | | | 140 | % |
Net assets, end of period (000s omitted) | | | $288,628 | | | | $295,215 | | | | $310,909 | | | | $319,565 | | | | $296,705 | |
| 1 | Calculated based upon average shares outstanding |
The accompanying notes are an integral part of these financial statements.
| | | | | | |
| Notes to financial statements | | Wells Fargo VT International Equity Fund | | | 17 | |
1. ORGANIZATION
Wells Fargo Variable Trust (the “Trust”), a Delaware statutory trust organized on March 10, 1999, is an open-end management investment company registered under the Investment Company Act of 1940, as amended (the “1940 Act”). As an investment company, the Trust follows the accounting and reporting guidance in Financial Accounting Standards Board (“FASB”) Accounting Standards Codification Topic 946, Financial Services – Investment Companies. These financial statements report on the Wells Fargo VT International Equity Fund (the “Fund”) which is a diversified series of the Trust.
2. SIGNIFICANT ACCOUNTING POLICIES
The following significant accounting policies, which are consistently followed in the preparation of the financial statements of the Fund, are in conformity with U.S. generally accepted accounting principles which require management to make estimates and assumptions that affect the reported amounts of assets and liabilities, disclosure of contingent assets and liabilities at the date of the financial statements, and the reported amounts of revenues and expenses during the reporting period. Actual results could differ from those estimates.
Securities valuation
All investments are valued each business day as of the close of regular trading on the New York Stock Exchange (generally 4 p.m. Eastern Time), although the Fund may deviate from this calculation time under unusual or unexpected circumstances.
Equity securities that are listed on a foreign or domestic exchange or market are valued at the official closing price or, if none, the last sales price. If no sale occurs on the principal exchange or market that day, the prior day’s price will be deemed “stale” and a fair value price will be determined in accordance with the Fund’s Valuation Procedures.
The values of securities denominated in foreign currencies are translated into U.S. dollars at rates provided by an independent foreign currency pricing source at a time each business day specified by the Management Valuation Team of Wells Fargo Funds Management, LLC (“Funds Management”).
Many securities markets and exchanges outside the U.S. close prior to the close of the New York Stock Exchange and therefore may not fully reflect trading or events that occur after the close of the principal exchange in which the foreign securities are traded, but before the close of the New York Stock Exchange. If such trading or events are expected to materially affect the value of such securities, then fair value pricing procedures approved by the Board of Trustees of the Fund are applied. These procedures take into account multiple factors including movements in U.S. securities markets after foreign exchanges close. Foreign securities that are fair valued under these procedures are categorized as Level 2 and the application of these procedures may result in transfers between Level 1 and Level 2. Depending on market activity, such fair valuations may be frequent. Such fair value pricing may result in net asset values that are higher or lower than net asset values based on the last reported sales price or latest quoted bid price. On December 31, 2016, such fair value pricing was not used in pricing foreign securities.
Investments in registered open-end investment companies are valued at net asset value. Interests in non-registered investment vehicles that are redeemable at net asset value are fair valued normally at net asset value.
Investments which are not valued using any of the methods discussed above are valued at their fair value, as determined in good faith by the Board of Trustees of the Fund. The Board of Trustees has established a Valuation Committee comprised of the Trustees and has delegated to it the authority to take any actions regarding the valuation of portfolio securities that the Valuation Committee deems necessary or appropriate, including determining the fair value of portfolio securities, unless the determination has been delegated to the Management Valuation Team. The Board of Trustees retains the authority to make or ratify any valuation decisions or approve any changes to the Valuation Procedures as it deems appropriate. On a quarterly basis, the Board of Trustees receives reports on any valuation actions taken by the Valuation Committee or the Management Valuation Team which may include items for ratification.
Valuations of fair valued securities are compared to the next actual sales price when available, or other appropriate market values, to assess the continued appropriateness of the fair valuation methodologies used. These securities are fair valued on a day-to-day basis, taking into consideration changes to appropriate market information and any significant changes to the inputs considered in the valuation process until there is a readily available price provided on an exchange or by an independent pricing service. Valuations received from an independent pricing service or independent broker-dealer quotes are periodically validated by comparisons to most recent trades and valuations provided by other independent pricing services in addition to the review of prices by the manager and/or subadviser. Unobservable inputs used in determining fair valuations are identified based on the type of security, taking into consideration factors utilized by market participants in valuing the investment, knowledge about the issuer and the current market environment.
| | | | |
| 18 | | Wells Fargo VT International Equity Fund | | Notes to financial statements |
Foreign currency translation
The accounting records of the Fund are maintained in U.S. dollars. The values of other assets and liabilities denominated in foreign currencies are translated into U.S. dollars at rates provided by an independent foreign currency pricing source at a time each business day specified by the Management Valuation Team. Purchases and sales of securities, and income and expenses are converted at the rate of exchange on the respective dates of such transactions. Net realized foreign exchange gains or losses arise from sales of foreign currencies, currency gains or losses realized between the trade and settlement dates on securities transactions, and the difference between the amounts of dividends, interest and foreign withholding taxes recorded and the U.S. dollar equivalent of the amounts actually paid or received. Net unrealized foreign exchange gains and losses arise from changes in the fair value of assets and liabilities other than investments in securities resulting from changes in exchange rates. The changes in net assets arising from changes in exchange rates and the changes in net assets resulting from changes in market prices of securities are not separately presented. Such changes are included in net realized and unrealized gains or losses from investments.
Participation notes
The Fund may invest in participation notes to gain exposure to securities in certain foreign markets. Participation notes are issued by banks or broker-dealers and are designed to offer a return linked to a particular underlying foreign security. Participation notes involve transaction costs, which may be higher than those applicable to the underlying foreign security. The holder of the participation note is entitled to receive from the bank or broker-dealer, an amount equal to the dividend paid by the issuer of the underlying foreign security; however, the holder is not entitled to the same rights (i.e. dividends, voting rights) as an owner of the underlying foreign security. Investments in participation notes involve risks beyond those normally associated with a direct investment in an underlying security. The Fund has no rights against the issuer of the underlying foreign security and participation notes expose the Fund to counterparty risk in the event the counterparty does not perform. There is also no assurance there will be a secondary trading market for the participation note or that the trading price of the participation note will equal the underlying value of the foreign security that it seeks to replicate.
Forward foreign currency contracts
The Fund is subject to foreign currency risk in the normal course of pursuing its investment objectives. A forward foreign currency contract is an agreement between two parties to purchase or sell a specific currency for an agreed-upon price at a future date. The Fund enters into forward foreign currency contracts to facilitate transactions in foreign-denominated securities and to attempt to minimize the risk to the Fund from adverse changes in the relationship between currencies. Forward foreign currency contracts are recorded at the forward rate and marked-to-market daily. When the contracts are closed, realized gains and losses arising from such transactions are recorded as realized gains or losses on forward foreign currency contract transactions. The Fund could be exposed to risks if the counterparties to the contracts are unable to meet the terms of their contracts or if the value of the foreign currency changes unfavorably. The Fund’s maximum risk of loss from counterparty credit risk is the unrealized gains on the contracts. This risk may be mitigated if there is a master netting arrangement between the Fund and the counterparty.
Security loans
The Fund may lend its securities from time to time in order to earn additional income in the form of fees or interest on securities received as collateral or the investment of any cash received as collateral. The Fund continues to receive interest or dividends on the securities loaned. The Fund receives collateral in the form of cash or securities with a value at least equal to the value of the securities on loan. The value of the loaned securities is determined at the close of each business day and any additional required collateral is delivered to the Fund on the next business day. In a securities lending transaction, the net asset value of the Fund will be affected by an increase or decrease in the value of the securities loaned and by an increase or decrease in the value of the instrument in which collateral is invested. The amount of securities lending activity undertaken by the Fund fluctuates from time to time. In the event of default or bankruptcy by the borrower, the Fund may be prevented from recovering the loaned securities or gaining access to the collateral or may experience delays or costs in doing so. In addition, the investment of any cash collateral received may lose all or part of its value. The Fund has the right under the lending agreement to recover the securities from the borrower on demand.
The Fund lends its securities through an unaffiliated securities lending agent. Cash collateral received in connection with its securities lending transactions is invested in Securities Lending Cash Investments, LLC (the “Securities Lending Fund”). The Securities Lending Fund is exempt from registration under Section 3(c)(7) of the 1940 Act and is managed by Funds Management and is subadvised by Wells Capital Management Incorporated (“WellsCap”), an affiliate of Funds Management and an indirect wholly owned subsidiary of Wells Fargo & Company (“Wells Fargo”). Funds Management receives an advisory fee starting at 0.05% and declining to 0.01% as the average daily net assets of the Securities Lending
| | | | | | |
| Notes to financial statements | | Wells Fargo VT International Equity Fund | | | 19 | |
Fund increase. All of the fees received by Funds Management are paid to WellsCap for its services as subadviser. The Securities Lending Fund seeks to provide a positive return compared to the daily Fed Funds Open Rate by investing in high-quality, U.S. dollar-denominated short-term money market instruments. Securities Lending Fund investments are valued at the evaluated bid price provided by an independent pricing service. Income earned from investment in the Securities Lending Fund is included in securities lending income on the Statement of Operations.
Security transactions and income recognition
Securities transactions are recorded on a trade date basis. Realized gains or losses are recorded on the basis of identified cost.
Dividend income is recognized on the ex-dividend date, except for certain dividends from foreign securities, which are recorded as soon as the custodian verifies the ex-dividend date. Dividend income from foreign securities is recorded net of foreign taxes withheld where recovery of such taxes is not assured.
Distributions to shareholders
Distributions to shareholders from net investment income and net realized gains, if any, are recorded on the ex-dividend date. Such distributions are determined in conformity with federal income tax regulations, which may differ in amount or character from net investment income and realized gains recognized for purposes of U.S. generally accepted accounting principles.
Federal and other taxes
The Fund intends to continue to qualify as a regulated investment company by distributing substantially all of its investment company taxable income and any net realized capital gains (after reduction for capital loss carryforwards) sufficient to relieve it from all, or substantially all, federal income taxes. Accordingly, no provision for federal income taxes was required.
The Fund’s income and federal excise tax returns and all financial records supporting those returns for the prior three fiscal years are subject to examination by the federal and Delaware revenue authorities. Management has analyzed the Fund’s tax positions taken on federal, state, and foreign tax returns for all open tax years and does not believe that there are any uncertain tax positions that require recognition of a tax liability.
Reclassifications are made to the Fund’s capital accounts for permanent tax differences to reflect income and gains available for distribution (or available capital loss carryforwards) under federal income tax regulations. U.S. generally accepted accounting principles require that certain components of net assets be adjusted to reflect permanent differences between financial and tax reporting. These reclassifications have no effect on net assets or net asset values per share. The primary permanent difference causing such reclassification is due to foreign currency transactions. At December 31, 2016, as a result of permanent book-to-tax differences, the following reclassification adjustments were made on the Statement of Assets and Liabilities:
| | |
Undistributed net
investment income | | Accumulated net
realized losses
on investments |
| $2,468,584 | | $(2,468,584) |
Capital loss carryforwards that do not expire are required to be utilized prior to capital loss carryforwards that expire. As of December 31, 2016, capital loss carryforwards available to offset future net realized capital gains were as follows through the indicated expiration dates:
| | |
| | | No expiration |
| 2017 | | Short-term |
| $1,334,528 | | $8,677,104 |
Class allocations
The separate classes of shares offered by the Fund differ principally in distribution fees. Class specific expenses are charged directly to that share class. Investment income, common expenses, and realized and unrealized gains (losses) on investments are allocated daily to each class of shares based on the relative proportion of net assets of each class.
| | | | |
| 20 | | Wells Fargo VT International Equity Fund | | Notes to financial statements |
3. FAIR VALUATION MEASUREMENTS
Fair value measurements of investments are determined within a framework that has established a fair value hierarchy based upon the various data inputs utilized in determining the value of the Fund’s investments. The three-level hierarchy gives the highest priority to unadjusted quoted prices in active markets for identical assets or liabilities (Level 1) and the lowest priority to significant unobservable inputs (Level 3). The Fund’s investments are classified within the fair value hierarchy based on the lowest level of input that is significant to the fair value measurement. The inputs are summarized into three broad levels as follows:
| ∎ | | Level 1 – quoted prices in active markets for identical securities |
| ∎ | | Level 2 – other significant observable inputs (including quoted prices for similar securities, interest rates, prepayment speeds, credit risk, use of amortized cost, etc.) |
| ∎ | | Level 3 – significant unobservable inputs (including the Fund’s own assumptions in determining the fair value of investments) |
The inputs or methodologies used for valuing investments in securities are not necessarily an indication of the risk associated with investing in those securities.
The following is a summary of the inputs used in valuing the Fund’s assets and liabilities as of December 31, 2016:
| | | | | | | | | | | | | | | | |
| | | Quoted prices
(Level 1) | | | Other significant
observable inputs
(Level 2) | | | Significant
unobservable inputs (Level 3) | | | Total | |
Assets | | | | | | | | | | | | | | | | |
Investments in: | | | | | | | | | | | | | | | | |
| | | | |
Common stocks | | | | | | | | | | | | | | | | |
Brazil | | $ | 491,575 | | | $ | 0 | | | $ | 0 | | | $ | 491,575 | |
Canada | | | 7,582,736 | | | | 0 | | | | 0 | | | | 7,582,736 | |
China | | | 19,851,531 | | | | 0 | | | | 0 | | | | 19,851,531 | |
Denmark | | | 2,759,271 | | | | 0 | | | | 0 | | | | 2,759,271 | |
France | | | 9,968,408 | | | | 0 | | | | 0 | | | | 9,968,408 | |
Germany | | | 42,517,403 | | | | 0 | | | | 0 | | | | 42,517,403 | |
Hong Kong | | | 4,372,149 | | | | 0 | | | | 0 | | | | 4,372,149 | |
Italy | | | 13,583,214 | | | | 0 | | | | 0 | | | | 13,583,214 | |
Japan | | | 41,866,935 | | | | 0 | | | | 0 | | | | 41,866,935 | |
Netherlands | | | 14,817,724 | | | | 0 | | | | 0 | | | | 14,817,724 | |
Norway | | | 3,767,241 | | | | 0 | | | | 0 | | | | 3,767,241 | |
Russia | | | 8,891,861 | | | | 0 | | | | 0 | | | | 8,891,861 | |
South Korea | | | 14,125,323 | | | | 0 | | | | 0 | | | | 14,125,323 | |
Switzerland | | | 20,409,792 | | | | 0 | | | | 0 | | | | 20,409,792 | |
United Kingdom | | | 37,743,870 | | | | 0 | | | | 0 | | | | 37,743,870 | |
United States | | | 22,503,497 | | | | 0 | | | | 0 | | | | 22,503,497 | |
| | | | |
Exchange-traded funds | | | | | | | | | | | | | | | | |
United States | | | 3,457,663 | | | | 0 | | | | 0 | | | | 3,457,663 | |
| | | | |
Participation notes | | | | | | | | | | | | | | | | |
China | | | 0 | | | | 5,447,646 | | | | 0 | | | | 5,447,646 | |
| | | | |
Short-term investments | | | | | | | | | | | | | | | | |
Investment companies | | | 35,731,501 | | | | 0 | | | | 0 | | | | 35,731,501 | |
Investments measured at net asset value* | | | | | | | | | | | | | | | 5,277,767 | |
| | | 304,441,694 | | | | 5,447,646 | | | | 0 | | | | 315,167,107 | |
Forward foreign currency contracts | | | 0 | | | | 675,880 | | | | 0 | | | | 675,880 | |
Total assets | | $ | 304,441,694 | | | $ | 6,123,526 | | | $ | 0 | | | $ | 315,842,987 | |
| * | Investments that are measured at fair value using the net asset value per share (or its equivalent) as a practical expedient have not been categorized in the fair value hierarchy. The fair value amount presented in the table is intended to permit reconciliation of the fair value hierarchy to the amounts presented in the Statement of Assets and Liabilities. The Fund’s investment in Securities Lending Cash Investments, LLC valued at $5,277,767 does not have a redemption period notice, can be redeemed daily and does not have any unfunded commitments. |
| | | | | | |
| Notes to financial statements | | Wells Fargo VT International Equity Fund | | | 21 | |
Forward foreign currency contracts are reported at their unrealized gains at measurement date, which represents the change in the contract’s value from trade date. All other assets and liabilities are reported at their market value at measurement date.
The Fund recognizes transfers between levels within the fair value hierarchy at the end of the reporting period. Fair value pricing that was used in pricing certain foreign securities at the previous period end was not used at December 31, 2016. As a result, common stocks valued at $194,174,538 were transferred from Level 2 to Level 1 within the fair value hierarchy. The Fund did not have any transfers into/out of Level 3.
4. TRANSACTIONS WITH AFFILIATES AND OTHER EXPENSES
Management fee
Funds Management, an indirect wholly owned subsidiary of Wells Fargo, is the manager of the Fund and provides advisory and fund-level administrative services under an investment management agreement. Under the investment management agreement, Funds Management is responsible for, among other services, implementing the investment objectives and strategies of the Fund, supervising the subadviser, providing fund-level administrative services in connection with the Fund’s operations, and providing any other fund-level administrative services reasonably necessary for the operation of the Fund. As compensation for its services under the investment management agreement, Funds Management is entitled to receive an annual management fee starting at 0.80% and declining to 0.63% as the average daily net assets of the Fund increase. For the year ended December 31, 2016, the management fee was equivalent to an annual rate of 0.80% of the Fund’s average daily net assets.
Funds Management has retained the services of a subadviser to provide daily portfolio management to the Fund. The fee for subadvisory services is borne by Funds Management. WellsCap is the subadviser to the Fund and is entitled to receive a fee from Funds Management at an annual rate starting at 0.45% and declining to 0.40% as the average daily net assets of the Fund increase.
Administration fees
Under a class-level administration agreement, Funds Management provides class-level administrative services to the Fund, which includes paying fees and expenses for services provided by the transfer agent, sub-transfer agents, omnibus account servicers and record-keepers. As compensation for its services under the class-level administration agreement, Funds Management receives a class administration fee of 0.08% which is calculated based on the average daily net assets of each class.
Funds Management has contractually waived and/or reimbursed management and administration fees to the extent necessary to maintain certain net operating expense ratios for the Fund. Waiver of fees and/or reimbursement of expenses by Funds Management were made first from fund level expenses on a proportionate basis and then from class specific expenses. Funds Management has committed through April 30, 2017 to waive fees and/or reimburse expenses to the extent necessary to cap the Fund’s expenses at 0.69% for Class 1 shares and 0.94% for Class 2 shares. After this time, the cap may be increased or the commitment to maintain the cap may be terminated only with the approval of the Board of Trustees.
During the year ended December 31, 2016, State Street Bank and Trust Company, the Fund’s custodian, reimbursed the Fund $112,578 for certain out-of-pocket expenses that were billed to the Fund in error from 1998-2015. This amount is included in dividend income on the Statement of Operations. In addition, Funds Management was also reimbursed $4,468 for waivers/reimbursements it made to the Fund during the period the Fund was erroneously billed.
Distribution fee
The Trust has adopted a distribution plan for Class 2 shares of the Fund pursuant to Rule 12b-1 under the 1940 Act. A distribution fee is charged to Class 2 shares and paid to Wells Fargo Funds Distributor, LLC, the principal underwriter, at an annual rate of 0.25% of the average daily net assets of Class 2 shares.
5. INVESTMENT PORTFOLIO TRANSACTIONS
Purchases and sales of investments, excluding U.S. government obligations (if any) and short-term securities, for the year ended December 31, 2016 were $220,275,791 and $246,769,466, respectively.
The Fund may purchase or sell investment securities to other Wells Fargo funds under procedures adopted by the Board of Trustees. The procedures have been designed to ensure that these interfund transactions, which generally do not incur broker commissions, are effected at current market prices. Interfund trades are included within the respective purchases and sales amounts shown.
| | | | |
| 22 | | Wells Fargo VT International Equity Fund | | Notes to financial statements |
6. DERIVATIVE TRANSACTIONS
During the year ended December 31, 2016, the Fund entered into forward foreign currency contracts for economic hedging purposes.
At December 31, 2016, the Fund had forward foreign currency contracts outstanding as follows:
Forward foreign currency contracts to sell:
| | | | | | | | | | | | | | | | | | |
| Exchange date | | Counterparty | | Contracts to deliver | | | U.S. value at December 31, 2016 | | | In exchange for U.S. $ | | | Unrealized
gains | |
| 1/13/2017 | | Credit Suisse | | | 4,000,000 | EUR | | $ | 4,213,167 | | | $ | 4,453,920 | | | $ | 240,753 | |
| 2/28/2017 | | Barclays | | | 14,825,000 | EUR | | | 15,647,059 | | | | 15,761,970 | | | | 114,911 | |
| 3/15/2017 | | Barclays | | | 24,602,000 | EUR | | | 25,987,510 | | | | 26,288,171 | | | | 300,661 | |
| 3/22/2017 | | Morgan Stanley | | | 5,171,000 | GBP | | | 6,385,065 | | | | 6,404,620 | | | | 19,555 | |
The Fund had average contract amounts of $4,630,400 and $46,111,787 in forward foreign currency contracts to buy and forward foreign currency contracts to sell, respectively, during the year ended December 31, 2016. As of December 31, 2016, the Fund had received $1,230,000 as cash collateral for open forward foreign currency contracts.
The fair value, realized gains or losses and change in unrealized gains or losses, if any, on derivative instruments are reflected in the appropriate financial statements.
For certain types of derivative transactions, the Fund has entered into International Swaps and Derivatives Association, Inc. master agreements (“ISDA Master Agreements”) or similar agreements with approved counterparties. The ISDA Master Agreements or similar agreements may have requirements to deliver/deposit securities or cash to/with an exchange or broker-dealer as collateral and allows the Fund to offset, with each counterparty, certain derivative financial instrument’s assets and/or liabilities with collateral held or pledged. Collateral requirements differ by type of derivative. Collateral or margin requirements are set by the broker or exchange clearing house for exchange traded derivatives while collateral terms are contract specific for over-the-counter traded derivatives. Cash collateral that has been pledged to cover obligations of the Fund under ISDA Master Agreements or similar agreements, if any, are reported separately in the Statement of Assets and Liabilities. Securities pledged as collateral, if any, are noted in the Portfolio of Investments. With respect to balance sheet offsetting, absent an event of default by the counterparty or a termination of the agreement, the reported amounts of financial assets and financial liabilities in the Statement of Assets and Liabilities are not offset across transactions between the Fund and the applicable counterparty. A reconciliation of the gross amounts on the Statement of Assets and Liabilities to the net amounts by derivative type, including any collateral exposure, is as follows:
| | | | | | | | | | | | | | | | | | |
| Derivative type | | Counterparty | | Gross amounts of assets in the Statement of Assets and Liabilities | | | Amounts subject to netting agreements | | | Collateral received | | | Net amount of assets | |
Forward foreign currency contracts | | Barclays | | $ | 415,572 | * | | $ | 0 | | | $ | (415,572 | ) | | $ | 0 | |
| | Credit Suisse | | | 240,753 | * | | | 0 | | | | (240,753 | ) | | | 0 | |
| | Morgan Stanley | | | 19,555 | * | | | 0 | | | | (19,555 | ) | | | 0 | |
| | * | Amount represents net unrealized gains. | |
7. BANK BORROWINGS
The Trust and Wells Fargo Funds Trust (excluding the money market funds and certain other funds) are parties to a $250,000,000 revolving credit agreement whereby the Fund is permitted to use bank borrowings for temporary or emergency purposes, such as to fund shareholder redemption requests. Interest under the credit agreement is charged to the Fund based on a borrowing rate equal to the higher of the Federal Funds rate in effect on that day plus 1.25% or the overnight LIBOR rate in effect on that day plus 1.25%. In addition, an annual commitment fee equal to 0.25% of the unused balance is allocated to each participating fund. Prior to August 30, 2016, the revolving credit agreement amount was $200,000,000 and the annual commitment fee was equal to 0.20% of the unused balance which was allocated to each participating fund.
For the year ended December 31, 2016, there were no borrowings by the Fund under the agreement.
| | | | | | |
| Notes to financial statements | | Wells Fargo VT International Equity Fund | | | 23 | |
8. DISTRIBUTIONS TO SHAREHOLDERS
The tax character of distributions paid during the years ended December 31, 2016 and December 31, 2015 were as follows:
| | | | | | | | |
| | | Year ended December 31 | |
| | | 2016 | | | 2015 | |
Ordinary income | | $ | 9,315,372 | | | $ | 13,356,536 | |
Long-term capital gain | | | 23,302,105 | | | | 0 | |
As of December 31, 2016, the components of distributable earnings on a tax basis were as follows:
| | | | |
Undistributed ordinary income | | Unrealized gains | | Capital loss carryforward |
| $9,367,569 | | $14,510,725 | | $(10,011,632) |
9. INDEMNIFICATION
Under the Trust’s organizational documents, the officers and Trustees have been granted certain indemnification rights against certain liabilities that may arise out of performance of their duties to the Trust. Additionally, in the normal course of business, the Trust may enter into contracts with service providers that contain a variety of indemnification clauses. The Trust’s maximum exposure under these arrangements is dependent on future claims that may be made against the Fund and, therefore, cannot be estimated.
10. REGULATORY CHANGES
In October 2016, the Securities and Exchange Commission (“SEC”) adopted new rules and forms and amended existing rules and forms (together, “final rules”) intended to modernize and enhance the reporting and disclosure of information by registered investment companies and to enhance liquidity risk management by open-end mutual funds and exchange-traded funds. The final rules will enhance the quality of information available to investors and will allow the SEC to more effectively collect and use data reported by funds. In part, the final rules amend Regulation S-X and require standardized, enhanced disclosure about derivatives in the Fund’s financial statements, as well as other amendments. The compliance date for the amendments to Regulation S-X is August 1, 2017 while the compliance date for the new form types is June 1, 2018 and the compliance date for the liquidity risk management program requirements is December 1, 2018. Management is currently assessing the potential impact of these enhancements and their impact on the financial statement disclosures and reporting requirements.
| | | | |
| 24 | | Wells Fargo VT International Equity Fund | | Report of independent registered public accounting firm |
BOARD OF TRUSTEES AND SHAREHOLDERS OF WELLS FARGO VARIABLE TRUST:
We have audited the accompanying statement of assets and liabilities, including the portfolio of investments, of the Wells Fargo VT International Equity Fund (the “Fund”), one of the funds constituting the Wells Fargo Variable Trust, as of December 31, 2016, and the related statement of operations for the year then ended, the statements of changes in net assets for each of the years in the two-year period then ended, and the financial highlights for each of the years in the five-year period then ended. These financial statements and financial highlights are the responsibility of the Fund’s management. Our responsibility is to express an opinion on these financial statements and financial highlights based on our audits.
We conducted our audits in accordance with the standards of the Public Company Accounting Oversight Board (United States). Those standards require that we plan and perform the audit to obtain reasonable assurance about whether the financial statements and financial highlights are free of material misstatement. An audit includes examining, on a test basis, evidence supporting the amounts and disclosures in the financial statements. Our procedures included confirmation of securities owned as of December 31, 2016, by correspondence with the custodian, or by other appropriate auditing procedures. An audit also includes assessing the accounting principles used and significant estimates made by management, as well as evaluating the overall financial statement presentation. We believe that our audits provide a reasonable basis for our opinion.
In our opinion, the financial statements and financial highlights referred to above present fairly, in all material respects, the financial position of the Wells Fargo VT International Equity Fund as of December 31, 2016, the results of its operations for the year then ended, the changes in its net assets for each of the years in the two-year period then ended, and the financial highlights for each of the years in the five-year period then ended, in conformity with U.S. generally accepted accounting principles.

Boston, Massachusetts
February 23, 2017
| | | | | | |
| Other information (unaudited) | | Wells Fargo VT International Equity Fund | | | 25 | |
TAX INFORMATION
Pursuant to Section 852 of the Internal Revenue Code, $23,302,105 was designated as a 20% rate gain distribution for the fiscal year ended December 31, 2016.
Pursuant to Section 853 of the Internal Revenue Code, the following amounts have been designated as foreign taxes paid for the fiscal year ended December 31, 2016. These amounts may be less than the actual foreign taxes paid for financial statement purposes. Foreign taxes paid or withheld should be included in taxable income with an offsetting deduction from gross income or as a credit for taxes paid to foreign governments. None of the income was derived from ineligible foreign sources as defined under Section 901(j) of the Internal Revenue Code.
| | | | |
Creditable foreign taxes
paid | | Per share amount | | Foreign income as % of ordinary income distributions |
| $574,738 | | $0.0081 | | 75.68% |
PROXY VOTING INFORMATION
A description of the policies and procedures that the Fund uses to determine how to vote proxies relating to portfolio securities is available, upon request, by calling 1-800-260-5969, visiting our website at wellsfargofunds.com, or visiting the SEC website at sec.gov. Information regarding how the Fund voted proxies relating to portfolio securities during the most recent 12-month period ended June 30 is available on the Fund’s website at wellsfargofunds.com or by visiting the SEC website at sec.gov.
PORTFOLIO HOLDINGS INFORMATION
The complete portfolio holdings for the Fund are publicly available monthly on the Fund’s website (wellsfargofunds.com), on a one-month delayed basis. In addition, top ten holdings information (excluding derivative positions) for the Fund is publicly available on the Fund’s website on a monthly, seven-day or more delayed basis. The Fund files its complete schedule of portfolio holdings with the SEC for the first and third quarters of each fiscal year on Form N-Q, which is available by visiting the SEC website at sec.gov. In addition, the Fund’s Form N-Q may be reviewed and copied at the SEC’s Public Reference Room in Washington, DC, and at regional offices in New York City, at 233 Broadway, and in Chicago, at 175 West Jackson Boulevard, Suite 900. Information about the Public Reference Room may be obtained by calling 1-800-SEC-0330.
| | | | |
| 26 | | Wells Fargo VT International Equity Fund | | Other information (unaudited) |
BOARD OF TRUSTEES AND OFFICERS
Each of the Trustees and Officers1 listed in the table below acts in identical capacities for each fund in the Wells Fargo family of funds, which consists of 139 mutual funds comprising the Wells Fargo Funds Trust, Wells Fargo Variable Trust, Wells Fargo Master Trust and four closed-end funds (collectively the “Fund Complex”). This table should be read in conjunction with the Prospectus and the Statement of Additional Information2. The mailing address of each Trustee and Officer is 525 Market Street, 12th Floor, San Francisco, CA 94105. Each Trustee and Officer serves an indefinite term, however, each Trustee serves such term until reaching the mandatory retirement age established by the Trustees.
Independent Trustees
| | | | | | |
Name and year of birth | | Position held and length of service* | | Principal occupations during past five years or longer | | Current other public company or
investment company
directorships |
William R. Ebsworth (Born 1957) | | Trustee, since 2015 | | Retired. From 1984 to 2013, equities analyst, portfolio manager, research director and chief financial officer at Fidelity Management and Research Company in Boston, Tokyo, and Hong Kong and retired in 2013 as Chief Investment Officer of Fidelity Strategic Advisers, Inc. where he lead a team of investment professionals managing client assets. Prior thereto, Board member of Hong Kong Securities Clearing Co., Hong Kong Options Clearing Corp., the Thailand International Fund, Ltd., Fidelity Investments Life Insurance Company, and Empire Fidelity Investments Life Insurance Company. Board member of the Forté Foundation (non-profit organization) and the Vincent Memorial Hospital Endowment (non-profit organization), where he serves on the Investment Committee and as Chair of the Audit Committee. Mr. Ebsworth is a CFA® charterholder and an Adjunct Lecturer, Finance, at Babson College. | | Asset Allocation Trust |
Jane A. Freeman (Born 1953) | | Trustee, since 2015 | | Retired. From 2012 to 2014 and 1999 to 2008, Chief Financial Officer of Scientific Learning Corporation. From 2008 to 2012, Ms. Freeman provided consulting services related to strategic business projects. Prior to 1999, Portfolio Manager at Rockefeller & Co. and Scudder, Stevens & Clark. Board member of the Harding Loevner Funds from 1996 to 2014, serving as both Lead Independent Director and chair of the Audit Committee. Board member of the Russell Exchange Traded Funds Trust from 2011 to 2012 and the chair of the Audit Committee. Ms. Freeman is Chair of Taproot Foundation (non-profit organization), a Board Member of Ruth Bancroft Garden (non-profit organization) and an inactive chartered financial analyst. | | Asset Allocation Trust |
Peter G. Gordon** (Born 1942) | | Trustee, since 1998; Chairman, since 2005 | | Co-Founder, Retired Chairman, President and CEO of Crystal Geyser Water Company. Trustee Emeritus, Colby College. | | Asset Allocation Trust |
Isaiah Harris, Jr. (Born 1952) | | Trustee, since 2009 | | Retired. Chairman of the Board of CIGNA Corporation since 2009, and Director since 2005. From 2003 to 2011, Director of Deluxe Corporation. Prior thereto, President and CEO of BellSouth Advertising and Publishing Corp. from 2005 to 2007, President and CEO of BellSouth Enterprises from 2004 to 2005 and President of BellSouth Consumer Services from 2000 to 2003. Emeritus member of the Iowa State University Foundation Board of Governors. Emeritus Member of the Advisory Board of Iowa State University School of Business. Advisory Board Member, Palm Harbor Academy (charter school). Advisory Board Member, Child Evangelism Fellowship (non-profit). Mr. Harris is a certified public accountant (inactive status). | | CIGNA Corporation; Asset Allocation Trust |
Judith M. Johnson (Born 1949) | | Trustee, since 2008; Audit Committee Chairman, since 2008 | | Retired. Prior thereto, Chief Executive Officer and Chief Investment Officer of Minneapolis Employees Retirement Fund from 1996 to 2008. Ms. Johnson is an attorney, certified public accountant and a certified managerial accountant. | | Asset Allocation Trust |
David F. Larcker (Born 1950) | | Trustee, since 2009 | | James Irvin Miller Professor of Accounting at the Graduate School of Business, Stanford University, Director of the Corporate Governance Research Initiative and Senior Faculty of The Rock Center for Corporate Governance since 2006. From 2005 to 2008, Professor of Accounting at the Graduate School of Business, Stanford University. Prior thereto, Ernst & Young Professor of Accounting at The Wharton School, University of Pennsylvania from 1985 to 2005. | | Asset Allocation Trust |
| | | | | | |
| Other information (unaudited) | | Wells Fargo VT International Equity Fund | | | 27 | |
| | | | | | |
Name and year of birth | | Position held and length of service* | | Principal occupations during past five years or longer | | Current other public company or
investment company
directorships |
Olivia S. Mitchell (Born 1953) | | Trustee, since 2006 | | International Foundation of Employee Benefit Plans Professor, Wharton School of the University of Pennsylvania since 1993. Director of Wharton’s Pension Research Council and Boettner Center on Pensions & Retirement Research, and Research Associate at the National Bureau of Economic Research. Previously, Cornell University Professor from 1978 to 1993. | | Asset Allocation Trust |
Timothy J. Penny (Born 1951) | | Trustee, since 1996 | | President and Chief Executive Officer of Southern Minnesota Initiative Foundation, a non-profit organization, since 2007 and Senior Fellow at the Humphrey Institute Policy Forum at the University of Minnesota since 1995. Member of the Board of Trustees of NorthStar Education Finance, Inc., a non-profit organization, since 2007. | | Asset Allocation Trust |
Michael S. Scofield (Born 1943) | | Trustee, since 2010 | | Served on the Investment Company Institute’s Board of Governors and Executive Committee from 2008-2011 as well the Governing Council of the Independent Directors Council from 2006-2011 and the Independent Directors Council Executive Committee from 2008-2011. Chairman of the IDC from 2008-2010. Institutional Investor (Fund Directions) Trustee of Year in 2007. Trustee of the Evergreen Funds complex (and its predecessors) from 1984 to 2010. Chairman of the Evergreen Funds from 2000-2010. Former Trustee of the Mentor Funds. Retired Attorney, Law Offices of Michael S. Scofield. | | Asset Allocation Trust |
| * | Length of service dates reflect the Trustee’s commencement of service with the Trust’s predecessor entities, where applicable. |
| ** | Peter Gordon is expected to retire on December 31, 2017. |
Officers
| | | | | | |
Name and year of birth | | Position held and length of service | | Principal occupations during past five years or longer | | |
Andrew Owen3 (Born 1960) | | President, since 2017 | | Executive Vice President of Wells Fargo Bank, N.A. and President of Wells Fargo & Company and Head of Affiliated Managaers, Wells Fargo Asset Management, since 2014. Executive Vice President responsible for marketing, investments and product development for Wells Fargo Funds Management, LLC, from 2009 to 2014. | | |
Jeremy DePalma1 (Born 1974) | | Treasurer, since 2012 | | Senior Vice President of Wells Fargo Funds Management, LLC since 2009. Senior Vice President of Evergreen Investment Management Company, LLC from 2008 to 2010 and head of the Fund Reporting and Control Team within Fund Administration from 2005 to 2010. | | |
C. David Messman (Born 1960) | | Secretary, since 2000; Chief Legal Officer, since 2003 | | Senior Vice President and Secretary of Wells Fargo Funds Management, LLC since 2001. Assistant General Counsel of Wells Fargo Bank, N.A. since 2013 and Vice President and Managing Counsel of Wells Fargo Bank, N.A. from 1996 to 2013. | | |
Michael Whitaker (Born 1967) | | Chief Compliance Officer, since 2016 | | Executive Vice President of Wells Fargo Funds Management, LLC since 2016. Chief Compliance Officer of Fidelity’s Fixed Income Funds and Asset Allocation Funds from 2008 to 2016, Compliance Officer of FMR Co., Inc. from 2014 to 2016, Fidelity Investments Money Management, Inc. from 2014 to 2016, Fidelity Investments from 2007 to 2016. | | |
David Berardi (Born 1975) | | Assistant Treasurer, since 2009 | | Vice President of Wells Fargo Funds Management, LLC since 2009. Vice President of Evergreen Investment Management Company, LLC from 2008 to 2010. Manager of Fund Reporting and Control for Evergreen Investment Management Company, LLC from 2004 to 2010. | | |
| 1 | Jeremy DePalma acts as Treasurer of 69 funds and Assistant Treasurer of 70 funds in the Fund Complex. |
| 2 | The Statement of Additional Information includes additional information about the Trustees and is available, without charge, upon request, by calling 1-800-260-5969 or by visiting the website at wellsfargofunds.com. |
| 3 | Andrew Owen became President on January 1, 2017. |
| | | | |
| 28 | | Wells Fargo VT International Equity Fund | | List of abbreviations |
The following is a list of common abbreviations for terms and entities that may have appeared in this report.
| ACA | — ACA Financial Guaranty Corporation |
| ADR | — American depositary receipt |
| ADS | — American depositary shares |
| AGC | — Assured Guaranty Corporation |
| AGM | — Assured Guaranty Municipal |
| Ambac | — Ambac Financial Group Incorporated |
| AMT | — Alternative minimum tax |
| BAN | — Bond anticipation notes |
| BHAC | — Berkshire Hathaway Assurance Corporation |
| CAB | — Capital appreciation bond |
| CCAB | — Convertible capital appreciation bond |
| CDA | — Community Development Authority |
| CDO | — Collateralized debt obligation |
| DRIVER | — Derivative inverse tax-exempt receipts |
| DW&P | — Department of Water & Power |
| DWR | — Department of Water Resources |
| ECFA | — Educational & Cultural Facilities Authority |
| EDA | — Economic Development Authority |
| EDFA | — Economic Development Finance Authority |
| ETF | — Exchange-traded fund |
| FDIC | — Federal Deposit Insurance Corporation |
| FFCB | — Federal Farm Credit Banks |
| FGIC | — Financial Guaranty Insurance Corporation |
| FHA | — Federal Housing Administration |
| FHLB | — Federal Home Loan Bank |
| FHLMC | — Federal Home Loan Mortgage Corporation |
| FICO | — The Financing Corporation |
| FNMA | — Federal National Mortgage Association |
| GDR | — Global depositary receipt |
| GNMA | — Government National Mortgage Association |
| HCFR | — Healthcare facilities revenue |
| HEFA | — Health & Educational Facilities Authority |
| HEFAR | — Higher education facilities authority revenue |
| HFA | — Housing Finance Authority |
| HFFA | — Health Facilities Financing Authority |
| HUD | — Department of Housing and Urban Development |
| IDA | — Industrial Development Authority |
| IDAG | — Industrial Development Agency |
| KRW | — Republic of Korea won |
| LIBOR | — London Interbank Offered Rate |
| LIFER | — Long Inverse Floating Exempt Receipts |
| LLC | — Limited liability company |
| LLLP | — Limited liability limited partnership |
| LLP | — Limited liability partnership |
| MBIA | — Municipal Bond Insurance Association |
| MFHR | — Multifamily housing revenue |
| MSTR | — Municipal securities trust receipts |
| MUD | — Municipal Utility District |
| National | — National Public Finance Guarantee Corporation |
| PCFA | — Pollution Control Financing Authority |
| PCL | — Public Company Limited |
| PCR | — Pollution control revenue |
| PFA | — Public Finance Authority |
| PFFA | — Public Facilities Financing Authority |
| PFOTER | — Puttable floating option tax-exempt receipts |
| plc | — Public limited company |
| PUTTER | — Puttable tax-exempt receipts |
| R&D | — Research & development |
| Radian | — Radian Asset Assurance |
| RAN | — Revenue anticipation notes |
| RDA | — Redevelopment Authority |
| RDFA | — Redevelopment Finance Authority |
| REIT | — Real estate investment trust |
| ROC | — Reset option certificates |
| SAVRS | — Select auction variable rate securities |
| SBA | — Small Business Authority |
| SDR | — Swedish depositary receipt |
| SFHR | — Single-family housing revenue |
| SFMR | — Single-family mortgage revenue |
| SPA | — Standby purchase agreement |
| SPDR | — Standard & Poor’s Depositary Receipts |
| SPEAR | — Short Puttable Exempt Adjustable Receipts |
| STRIPS | — Separate trading of registered interest and |
| TAN | — Tax anticipation notes |
| TIPS | — Treasury inflation-protected securities |
| TRAN | — Tax revenue anticipation notes |
| TTFA | — Transportation Trust Fund Authority |
| TVA | — Tennessee Valley Authority |

For more information
More information about Wells Fargo Funds is available free upon request. To obtain literature, please write, email, visit the Fund’s website, or call:
Wells Fargo Funds
P.O. Box 8266
Boston, MA 02266-8266
Email: fundservice@wellsfargo.com
Website: wellsfargofunds.com
Individual investors: 1-800-222-8222
Retail investment professionals: 1-888-877-9275
Institutional investment professionals: 1-866-765-0778
This report and the financial statements contained herein are submitted for the general information of the shareholders of the Fund. If this report is used for promotional purposes, distribution of the report must be accompanied or preceded by a current prospectus. Before investing, please consider the investment objectives, risks, charges, and expenses of the investment. For a current prospectus and, if available, a summary prospectus, containing this information, call 1-800-260-5969 or visit the Fund’s website at wellsfargofunds.com. Read the prospectus carefully before you invest or send money.
Wells Fargo Asset Management (WFAM) is a trade name used by the asset management businesses of Wells Fargo & Company. Wells Fargo Funds Management, LLC, a wholly owned subsidiary of Wells Fargo & Company, provides investment advisory and administrative services for Wells Fargo Funds. Other affiliates of Wells Fargo & Company provide subadvisory and other services for the funds. The funds are distributed by Wells Fargo Funds Distributor, LLC, Member FINRA, an affiliate of Wells Fargo & Company. Neither Wells Fargo Funds Management nor Wells Fargo Funds Distributor has Fund customer accounts/assets, and neither provides investment advice/recommendations or acts as an investment advice fiduciary to any investor.
NOT FDIC INSURED ◾ NO BANK GUARANTEE ◾ MAY LOSE VALUE
© 2016 Wells Fargo Funds Management, LLC. All rights reserved.
| | |
| | 300470 02-17 AVT3/AR149 12-16 |
Annual Report
December 31, 2016

Wells Fargo VT Omega Growth Fund


Reduce clutter. Save trees.
Sign up for electronic delivery of prospectuses and shareholder reports at wellsfargo.com/advantagedelivery
Contents
The views expressed and any forward-looking statements are as of December 31, 2016, unless otherwise noted, and are those of the Fund managers and/or Wells Fargo Funds Management, LLC. Discussions of individual securities, or the markets generally, or any Wells Fargo Fund are not intended as individual recommendations. Future events or results may vary significantly from those expressed in any forward-looking statements. The views expressed are subject to change at any time in response to changing circumstances in the market. Wells Fargo Funds Management, LLC and the Fund disclaim any obligation to publicly update or revise any views expressed or forward-looking statements.
NOT FDIC INSURED ◾ NO BANK GUARANTEE ◾ MAY LOSE VALUE
| | | | |
| 2 | | Wells Fargo VT Omega Growth Fund | | Letter to shareholders (unaudited) |

Andrew Owen
President
Wells Fargo Funds
U.S. small-, mid-, and large-cap stocks returned 21.31%, 13.80%, and 12.05% for the twelve-month period, respectively.
During the fourth quarter of 2016, the Fed hiked the short-term interest rate by 0.25% to reach a target range of 0.50% to 0.75%.
Dear Shareholder:
As the new president of Wells Fargo Funds now that Karla Rabusch is retiring from that position after nearly 14 years, I am pleased to offer you this annual report for the Wells Fargo VT Omega Growth Fund for the 12-month period that ended December 31, 2016. The U.S. economy ticked up as the year progressed. As expected, the Federal Reserve (Fed) raised the federal funds rate in December by 0.25%. U.S. small-, mid-, and large-cap stocks returned 21.31%, 13.80%, and 12.05% for the twelve-month period, respectively, as measured by the Russell 2000® Index,1 the Russell Midcap® Index,2 and the Russell 1000® Index.3
U.S. stocks showed gains in 2016, primarily after the U.S. presidential election.
The year began with a precipitous drop in U.S. stocks in January as crude oil prices tumbled and concerns about China’s economy increased; a mostly steady trajectory continued in the U.S. stock market after that inflection point. However, stocks rose significantly immediately following the U.S. presidential election. The promise of pro-growth policies by the incoming administration—lower tax rates, less regulation, investments in infrastructure, better trade deals—set the momentum for this surge.
The types of companies leading the rally leaned toward ones that have done well in a rising-rate environment, such as banks, and businesses which have benefited from infrastructure spending and reduced regulations. Sectors that could be negatively affected by rising interest rates, such as utilities, delivered weaker results. Consumer confidence hit prerecession levels for the first time in November and increased again in December.
Stronger economic indicators drove U.S. monetary policy.
During the fourth quarter of 2016, the Fed hiked the short-term interest rate by 0.25% to reach a target range of 0.50% to 0.75%. This was the second rate increase in more than 10 years, with the Fed citing job gains and lower-than-expected unemployment of 4.6%, down 0.3% from October. The Fed confirmed the continuation of an accommodative monetary policy to support a stronger labor market and reiterated its long-term objective of a 2% inflation rate, which increased slightly during the quarter but fell short of the benchmark. The Fed expressed confidence in the economy’s progress during the quarter and expects this positive trajectory to continue. Both of these sentiments helped to bolster the Fed’s expectation of three additional rate increases during 2017.
U.S. economic data released during the fourth quarter showed that U.S. real gross domestic product increased at an annual rate of 3.5% in the third quarter, the largest increase since mid-2014. Business investment by U.S. companies was mixed, with a 12.0% increase in structures and 4.5% decrease in equipment over the prior quarter on an annualized basis. Consumer spending slowed somewhat from the prior quarter, but late-December estimates from retail-research firms suggest that sales growth during the 2016 holiday season may outpace that of recent years.
| 1 | The Russell 2000® Index measures the performance of the 2,000 smallest companies in the Russell 3000® Index, which represents approximately 8% of the total market capitalization of the Russell 3000® Index. You cannot invest directly in an index. |
| 2 | The Russell Midcap® Index measures the performance of the 800 smallest companies in the Russell 1000® Index, which represent approximately 25% of the total market capitalization of the Russell 1000® Index. You cannot invest directly in an index. |
| 3 | The Russell 1000® Index measures the performance of the 1,000 largest companies in the Russell 3000® Index, which represents approximately 92% of the total market capitalization of the Russell 3000® Index. You cannot invest directly in an index. |
| | | | | | |
| Letter to shareholders (unaudited) | | Wells Fargo VT Omega Growth Fund | | | 3 | |
Central banks continued with stimulus programs during 2016.
In January, the Bank of Japan put in place a negative interest rate and in September announced an interest-rate target for 10-year government bonds—keeping the yield at zero—as it struggled to accelerate economic growth. The eurozone fell into deflation in February; in response, the European Central Bank (ECB) announced an expansion of its stimulus program. In December, the ECB stated that it will extend its quantitative-easing program and continue purchasing eurozone corporate and government debt each month through December 2017. In June, voters in the U.K. approved a referendum to leave the European Union; the Bank of England lowered its interest rate in August to 0.25% and continued its quantitative-easing program.
Don’t let short-term uncertainty derail long-term investment goals.
Periods of uncertainty can present challenges, but experience has taught us that maintaining long-term investment goals can be an effective way to plan for the future. To help you create a sound strategy based on your personal goals and risk tolerance, Wells Fargo Funds offers more than 100 mutual funds spanning a wide range of asset classes and investment styles. Although diversification cannot guarantee an investment profit or prevent losses, we believe it can be an effective way to manage investment risk and potentially smooth out overall portfolio performance. We encourage investors to know their investments and to understand that appropriate levels of risk-taking may unlock opportunities.
Thank you for choosing to invest in Wells Fargo Funds. We appreciate your confidence in us and remain committed to helping you meet your financial needs.
Sincerely,

Andrew Owen
President
Wells Fargo Funds
For further information about your Fund, contact your investment professional, visit our website at wellsfargofunds.com, or call us directly at 1-800-260-5969. We are available 24 hours a day, 7 days a week.
| | | | |
| 4 | | Wells Fargo VT Omega Growth Fund | | Performance highlights (unaudited) |
Investment objective
The Fund seeks long-term capital appreciation.
Manager
Wells Fargo Funds Management, LLC
Subadviser
Wells Capital Management Incorporated
Portfolio managers
Michael T. Smith, CFA®
Christopher J. Warner, CFA®
Average annual total returns (%) as of December 31, 2016
| | | | | | | | | | | | | | | | | | | | | | |
| | | | | | | | Expense ratios1 (%) | |
| | | Inception date | | 1 year | | | 5 year | | | 10 year | | | Gross | | | Net2 | |
| Class 1 | | 3-6-1997 | | | 0.77 | | | | 12.53 | | | | 9.15 | | | | 0.79 | | | | 0.75 | |
| Class 2 | | 7-31-2002 | | | 0.52 | | | | 12.25 | | | | 8.88 | | | | 1.04 | | | | 1.00 | |
| Russell 3000® Growth Index3 | | – | | | 7.39 | | | | 14.44 | | | | 8.28 | | | | – | | | | – | |
Figures quoted represent past performance, which is no guarantee of future results. Investment return and principal value of an investment will fluctuate so that an investor’s shares, when redeemed, may be worth more or less than their original cost. Current performance may be lower or higher than the performance data quoted and assumes the reinvestment of dividends and capital gains. Current month-end performance is available by calling 1-800-260-5969. Performance figures of the Fund do not reflect fees charged pursuant to the terms of variable life insurance policies and variable annuity contracts. If sales loads or charges had been reflected, performance would have been lower.
Index returns do not include transaction costs associated with buying and selling securities, any mutual fund fees or expenses, or any taxes. It is not possible to invest directly in an index.
Stock values fluctuate in response to the activities of individual companies and general market and economic conditions. Certain investment strategies tend to increase the total risk of an investment (relative to the broader market). Foreign investments are especially volatile and can rise or fall dramatically due to differences in the political and economic conditions of the host country. These risks are generally intensified in emerging markets. The Fund is exposed to smaller company securities risk. Consult the Fund’s prospectus for additional information on these and other risks.
Please refer to the prospectus provided by your participating insurance company for detailed information describing the separate accounts for information regarding surrender charges, mortality and expense risk fees, and other charges that may be assessed by the participating insurance companies.
Please see footnotes on page 5.
| | | | | | |
| Performance highlights (unaudited) | | Wells Fargo VT Omega Growth Fund | | | 5 | |
|
| Growth of $10,000 investment as of December 31, 20164 |
|
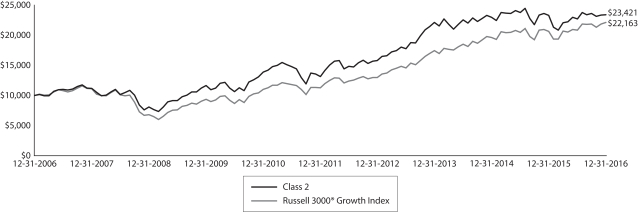 |
| 1 | Reflects the expense ratios as stated in the most recent prospectuses. The expense ratios shown are subject to change and may differ from the annualized expense ratios shown in the financial highlights of this report. |
| 2 | The manager has contractually committed through April 30, 2017, to waive fees and/or reimburse expenses to the extent necessary to cap the Fund’s Total Annual Fund Operating Expenses After Fee Waiver at the amounts shown. After this time, the cap may be increased or the commitment to maintain the cap may be terminated only with the approval of the Board of Trustees. Brokerage commissions, stamp duty fees, interest, taxes, acquired fund fees and expenses, and extraordinary expenses are excluded from the expense cap. Without this cap, the Fund’s returns would have been lower. |
| 3 | The Russell 3000® Growth Index measures the performance of those Russell 3000® Index companies with higher price/book ratios and higher forecasted growth values. You cannot invest directly in an index. |
| 4 | The chart compares the performance of Class 2 shares for the most recent ten years with the Russell 3000® Growth Index. The chart assumes a hypothetical $10,000 investment and reflects all operating expenses of the Fund. Performance does not reflect fees charged pursuant to the terms of variable life insurance policies and variable annuity contracts. |
| 5 | The ten largest holdings, excluding cash and cash equivalents, are calculated based on the value of the investments divided by total net assets of the Fund. Holdings are subject to change and may have changed since the date specified. |
| 6 | Amounts are calculated based on the total long-term investments of the Fund. These amounts are subject to change and may have changed since the date specified. |
| * | This security was not held in the Fund at the end of the reporting period. |
| | | | |
| 6 | | Wells Fargo VT Omega Growth Fund | | Performance highlights (unaudited) |
MANAGER’S DISCUSSION
Fund highlights
| ∎ | | The Fund underperformed its benchmark, the Russell 3000® Growth Index, for the 12-month period that ended December 31, 2016. |
| ∎ | | Stock selection in the information technology (IT) and industrials sectors detracted from the Fund’s results. |
| ∎ | | Stock selection in the health care and financials sectors aided relative performance. |
Three distinct environments were visible within the U.S. stock market in 2016.
The year began with a decidedly risk-averse tone to the market as investor concern mounted over the economic slowdown in China and the potential effectiveness of the Chinese government’s response. The continued weakness in commodity prices and the ultimate path of U.S. monetary policy also weighed on investors’ risk tolerance. These factors combined to send the yield on the U.S. 10-year Treasury to near-record lows while $10 trillion in worldwide sovereign debt traded at negative yields. Not surprisingly, stock-market leadership during this period was centered on defensive stocks and those seen as bond proxies (those that pay dividends and those viewed as relatively less volatile).
The tone of the market changed abruptly, however, in mid-February as investors began to look past the issues described above. China began to show signs of stabilization, commodities recovered, and corporate earnings were better than feared. This environment, which lasted through the summer and well into the fall, was marked by a closer relationship between company-specific fundamentals and stock-price movements.
The final stock-market environment of 2016 was triggered by the presidential-election results. The market did not appear to foresee a Trump victory, and the outcome sparked a rapid recalibration of expectations for many economic variables. Aided by Republican majorities in both branches of Congress, the new political regime caused investors’ focus to shift dramatically toward the prospects for pro-growth policies. After years of subpar U.S. economic growth, the combination of potentially lower taxes, fewer regulations, and enhanced fiscal stimulus appeared to produce a sense of euphoria among investors. The election led to a significant change in the outlooks for inflation, economic growth, monetary policy, and interest rates. Within the stock market, the election was the catalyst for returning to a risk-on environment. Lower-quality, more cyclically exposed stocks assumed a market leadership position while higher-quality stocks with more visible and sustainable earnings and cash flow lagged.
| | | | |
| Ten largest holdings (%) as of December 31, 20165 | |
Amazon.com Incorporated | | | 5.03 | |
Alphabet Incorporated Class A | | | 3.52 | |
Visa Incorporated Class A | | | 3.24 | |
UnitedHealth Group Incorporated | | | 3.05 | |
Waste Connections Incorporated | | | 2.85 | |
The Home Depot Incorporated | | | 2.73 | |
Alphabet Incorporated Class C | | | 2.53 | |
Microsoft Corporation | | | 2.52 | |
Intercontinental Exchange Incorporated | | | 2.47 | |
Celgene Corporation | | | 2.35 | |
Portfolio construction is focused on three types of growth companies.
We believe that, in any market environment, a portfolio’s construction must balance risk and return. We strive to provide this balance through a portfolio composed of three distinct types of growth companies. Core growth holdings (typically 40%–50% of assets) are companies that we believe have stable growth records, proven management teams, and relatively low volatility. Developing situations (typically 40%–50% of assets) are firms we believe are entering a period of accelerated growth driven by a new product, business plan, or management team. The remainder of the portfolio (typically 5%–10% of assets) is dedicated to valuation opportunities—holdings we believe carry above-average
growth potential and relatively high volatility. Our conviction level drives each stock’s relative weight in the portfolio. This direct relationship helps us position our highest-conviction ideas to potentially make a significant impact on performance.
Stock selection in the IT and industrials sectors weighed on the Fund’s relative performance.
Within the IT sector, specific weakness was visible in the software industry as company-specific issues and concerns over enterprise spending pressured portfolio holdings. Early in 2016, Tableau Software Incorporated*, a data-visualization
Please see footnotes on page 5.
| | | | | | |
| Performance highlights (unaudited) | | Wells Fargo VT Omega Growth Fund | | | 7 | |
software company, reported disappointing quarterly results driven by an unexpected decline in licensing revenue. As a result, shares of Tableau declined sharply. Further weighing on the stock were concerns regarding increased competition and the company’s ability to transition its business model to large enterprise-level customers.
Within the industrials sector, growing uncertainty derailed the outlook for Kansas City Southern. Given that roughly 30% of the railroad operator’s revenues are tied to cross-border shipping, the results of the presidential election caused uncertainty around the company’s intermediate-term growth opportunities. Possible changes to trade agreements such as NAFTA and the potential for increased tariff rates on U.S.-Mexico trade produced considerable investor concern. Additionally, the potential benefits of corporate-tax reform for Kansas City Southern are less than those of its railroad peers. As a result, many investors sold their Kansas City Southern holdings to fund the purchase of other transportation companies. These factors led shares to decline late in 2016.
Stock selection in the health care and financials sectors proved additive to annual returns.
After weighing on returns in 2015, stock selection in the health care sector proved to be the largest contributor to relative returns in 2016. UnitedHealth Group Incorporated is a prime example of why this was the case. UnitedHealth, the largest managed-care company, reported results that were above consensus expectations and raised earnings guidance during 2016. The company has been benefiting on several fronts as its steady revenue growth is the result of both growth in members—especially in Medicare Advantage and Medicaid plans—and increasing prices. United’s Optum division, which handles pharmacy benefits and health services, continues to be its fastest-growing asset.
Within the financials sector, the shares of SLM Corporation (also known as SALLIE MAE) surged on investor optimism over potential deregulation and corporate-tax reform. SALLIE MAE, the nation’s largest private student-loan originator, enjoys a dominant market share driven by its long history with many colleges and universities. Given rising enrollment and tuition trends, we believe the student loan market, and SALLIE MAE specifically, represent a strong secular-growth opportunity. SALLIE MAE shares have soared since the presidential election as uncertainty over additional government regulation of the student-loan industry likely may be off the table. Also, investors became more confident that the company may benefit from a corporate-tax cut from its current tax rate of approximately 40%.
|
| Sector distribution as of December 31, 20166 |
|
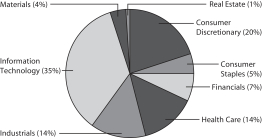 |
We look forward to 2017.
A return to a slower-growth sentiment could be favorable for our investing style. We have thrived when stock prices have been driven by earnings and have struggled when stock movements have been largely dictated by macroeconomic data. As investors recognize that the U.S. economy, though healthy, may not be imminently accelerating, capital likely may rotate back toward a growth leadership. In that environment, the scarcity premium of companies with secular growth, which has been out of favor since the election, may again be a key
factor driving stock prices. Many high-quality companies with superior earnings growth have been left behind in the postelection market rally. For example, the fastest-growing companies within the software industry, with excellent future prospects, were among the biggest laggards in 2016. These types of companies potentially are like beach balls being held underwater; once the macro pressures ease up, they float back to the top. We remain upbeat about the Fund’s portfolio as it has what we view as an attractive combination: durable fundamentals, reasonable valuations, and the ability to potentially grow earnings through various economic scenarios. This could be a favorable set-up going into 2017.
Please see footnotes on page 5.
| | | | |
| 8 | | Wells Fargo VT Omega Growth Fund | | Fund expenses (unaudited) |
As a shareholder of the Fund, you incur ongoing costs, including management fees, distribution (12b-1) fees, and other Fund expenses. This example is intended to help you understand your ongoing costs (in dollars) of investing in the Fund and to compare these costs with the ongoing costs of investing in other mutual funds.
The example is based on an investment of $1,000 invested at the beginning of the six-month period and held for the entire period from July 1, 2016 to December 31, 2016.
Actual expenses
The “Actual” line of the table below provides information about actual account values and actual expenses. You may use the information in this line, together with the amount you invested, to estimate the expenses that you paid over the period. Simply divide your account value by $1,000 (for example, an $8,600 account value divided by $1,000 = 8.6), then multiply the result by the number in the “Actual” line under the heading entitled “Expenses Paid During Period” for your applicable class of shares to estimate the expenses you paid on your account during this period.
Hypothetical example for comparison purposes
The “Hypothetical” line of the table below provides information about hypothetical account values and hypothetical expenses based on the Fund’s actual expense ratio and an assumed rate of return of 5% per year before expenses, which is not the Fund’s actual return. The hypothetical account values and expenses may not be used to estimate the actual ending account balance or expenses you paid for the period. You may use this information to compare the ongoing costs of investing in the Fund and other funds. To do so, compare this 5% hypothetical example with the 5% hypothetical examples that appear in the shareholder reports of the other funds.
Please note that the expenses shown in the table are meant to highlight your ongoing costs only and do not reflect any separate account charges assessed by participating insurance companies. Therefore, the “Hypothetical” line of the table is useful in comparing ongoing costs only, and will not help you determine the relative total costs of owning different funds. In addition, if these separate account charges assessed by participating insurance companies were included, your costs would have been higher.
| | | | | | | | | | | | | | | | |
| | | Beginning
account value
7-1-2016 | | | Ending
account value
12-31-2016 | | | Expenses
paid during
the period¹ | | | Annualized net
expense ratio | |
Class 1 | | | | | | | | | | | | | | | | |
Actual | | $ | 1,000.00 | | | $ | 1,031.12 | | | $ | 3.83 | | | | 0.75 | % |
Hypothetical (5% return before expenses) | | $ | 1,000.00 | | | $ | 1,021.37 | | | $ | 3.81 | | | | 0.75 | % |
Class 2 | | | | | | | | | | | | | | | | |
Actual | | $ | 1,000.00 | | | $ | 1,029.85 | | | $ | 5.10 | | | | 1.00 | % |
Hypothetical (5% return before expenses) | | $ | 1,000.00 | | | $ | 1,020.11 | | | $ | 5.08 | | | | 1.00 | % |
| 1 | Expenses paid is equal to the annualized net expense ratio of each class multiplied by the average account value over the period, multiplied by the number of days in the most recent fiscal half-year divided by the number of days in the fiscal year (to reflect the one-half year period). |
| | | | | | |
| Portfolio of investments—December 31, 2016 | | Wells Fargo VT Omega Growth Fund | | | 9 | |
| | | | | | | | | | | | | | | | |
| Security name | | | | | | | | Shares | | | Value | |
| | | | |
Common Stocks: 98.73% | | | | | | | | | | | | | | | | |
| | | | |
Consumer Discretionary: 19.35% | | | | | | | | | | | | | | | | |
| | | | |
| Hotels, Restaurants & Leisure: 6.62% | | | | | | | | | | | | | | | | |
Six Flags Entertainment Corporation | | | | | | | | | | | 18,300 | | | $ | 1,097,268 | |
Starbucks Corporation | | | | | | | | | | | 23,900 | | | | 1,326,928 | |
Vail Resorts Incorporated | | | | | | | | | | | 6,400 | | | | 1,032,384 | |
Wingstop Incorporated « | | | | | | | | | | | 19,436 | | | | 575,111 | |
Yum! Brands Incorporated | | | | | | | | | | | 15,900 | | | | 1,006,947 | |
| | | | |
| | | | | | | | | | | | | | | 5,038,638 | |
| | | | | | | | | | | | | | | | |
| | | | |
| Internet & Direct Marketing Retail: 5.03% | | | | | | | | | | | | | | | | |
Amazon.com Incorporated † | | | | | | | | | | | 5,100 | | | | 3,824,337 | |
| | | | | | | | | | | | | | | | |
| | | | |
| Media: 3.72% | | | | | | | | | | | | | | | | |
Charter Communications Incorporated Class A † | | | | | | | | | | | 5,700 | | | | 1,641,144 | |
Cinemark Holdings Incorporated | | | | | | | | | | | 30,899 | | | | 1,185,286 | |
| | | | |
| | | | | | | | | | | | | | | 2,826,430 | |
| | | | | | | | | | | | | | | | |
| | | | |
| Specialty Retail: 3.98% | | | | | | | | | | | | | | | | |
O’Reilly Automotive Incorporated † | | | | | | | | | | | 3,400 | | | | 946,594 | |
The Home Depot Incorporated | | | | | | | | | | | 15,500 | | | | 2,078,240 | |
| | | | |
| | | | | | | | | | | | | | | 3,024,834 | |
| | | | | | | | | | | | | | | | |
| | | | |
Consumer Staples: 4.44% | | | | | | | | | | | | | | | | |
| | | | |
| Beverages: 2.87% | | | | | | | | | | | | | | | | |
Constellation Brands Incorporated Class A | | | | | | | | | | | 7,160 | | | | 1,097,700 | |
Monster Beverage Corporation † | | | | | | | | | | | 24,500 | | | | 1,086,330 | |
| | | | |
| | | | | | | | | | | | | | | 2,184,030 | |
| | | | | | | | | | | | | | | | |
| | | | |
| Tobacco: 1.57% | | | | | | | | | | | | | | | | |
Reynolds American Incorporated | | | | | | | | | | | 21,300 | | | | 1,193,652 | |
| | | | | | | | | | | | | | | | |
| | | | |
Financials: 6.87% | | | | | | | | | | | | | | | | |
| | | | |
| Capital Markets: 4.84% | | | | | | | | | | | | | | | | |
Intercontinental Exchange Incorporated | | | | | | | | | | | 33,300 | | | | 1,878,786 | |
Raymond James Financial Incorporated | | | | | | | | | | | 13,106 | | | | 907,853 | |
SEI Investments Company | | | | | | | | | | | 18,100 | | | | 893,416 | |
| | | | |
| | | | | | | | | | | | | | | 3,680,055 | |
| | | | | | | | | | | | | | | | |
| | | | |
| Consumer Finance: 1.28% | | | | | | | | | | | | | | | | |
SLM Corporation † | | | | | | | | | | | 88,500 | | | | 975,270 | |
| | | | | | | | | | | | | | | | |
| | | | |
| Thrifts & Mortgage Finance: 0.75% | | | | | | | | | | | | | | | | |
Radian Group Incorporated | | | | | | | | | | | 31,800 | | | | 571,764 | |
| | | | | | | | | | | | | | | | |
| | | | |
Health Care: 14.27% | | | | | | | | | | | | | | | | |
| | | | |
| Biotechnology: 2.35% | | | | | | | | | | | | | | | | |
Celgene Corporation † | | | | | | | | | | | 15,466 | | | | 1,790,190 | |
| | | | | | | | | | | | | | | | |
The accompanying notes are an integral part of these financial statements.
| | | | |
| 10 | | Wells Fargo VT Omega Growth Fund | | Portfolio of investments—December 31, 2016 |
| | | | | | | | | | | | | | | | |
| Security name | | | | | | | | Shares | | | Value | |
| | | | |
| Health Care Equipment & Supplies: 4.86% | | | | | | | | | | | | | | | | |
Baxter International Incorporated | | | | | | | | | | | 20,100 | | | $ | 891,234 | |
DexCom Incorporated † | | | | | | | | | | | 10,205 | | | | 609,239 | |
Integra LifeSciences Holdings Corporation † | | | | | | | | | | | 15,000 | | | | 1,286,850 | |
Intuitive Surgical Incorporated † | | | | | | | | | | | 1,434 | | | | 909,400 | |
| | | | |
| | | | | | | | | | | | | | | 3,696,723 | |
| | | | | | | | | | | | | | | | |
| | | | |
| Health Care Providers & Services: 7.06% | | | | | | | | | | | | | | | | |
Amedisys Incorporated † | | | | | | | | | | | 19,166 | | | | 817,047 | |
Surgical Care Affiliates Incorporated † | | | | | | | | | | | 20,277 | | | | 938,217 | |
UnitedHealth Group Incorporated | | | | | | | | | | | 14,500 | | | | 2,320,580 | |
VCA Incorporated † | | | | | | | | | | | 18,800 | | | | 1,290,620 | |
| | | | |
| | | | | | | | | | | | | | | 5,366,464 | |
| | | | | | | | | | | | | | | | |
| | | | |
Industrials: 13.31% | | | | | | | | | | | | | | | | |
| | | | |
| Aerospace & Defense: 0.89% | | | | | | | | | | | | | | | | |
Orbital ATK Incorporated | | | | | | | | | | | 7,700 | | | | 675,521 | |
| | | | | | | | | | | | | | | | |
| | | | |
| Airlines: 0.76% | | | | | | | | | | | | | | | | |
Spirit Airlines Incorporated † | | | | | | | | | | | 10,000 | | | | 578,600 | |
| | | | | | | | | | | | | | | | |
| | | | |
| Building Products: 1.54% | | | | | | | | | | | | | | | | |
Johnson Controls International plc | | | | | | | | | | | 28,446 | | | | 1,171,691 | |
| | | | | | | | | | | | | | | | |
| | | | |
| Commercial Services & Supplies: 4.01% | | | | | | | | | | | | | | | | |
KAR Auction Services Incorporated | | | | | | | | | | | 20,600 | | | | 877,972 | |
Waste Connections Incorporated | | | | | | | | | | | 27,600 | | | | 2,169,084 | |
| | | | |
| | | | | | | | | | | | | | | 3,047,056 | |
| | | | | | | | | | | | | | | | |
| | | | |
| Electrical Equipment: 1.03% | | | | | | | | | | | | | | | | |
Acuity Brands Incorporated | | | | | | | | | | | 3,400 | | | | 784,924 | |
| | | | | | | | | | | | | | | | |
| | | | |
| Industrial Conglomerates: 1.29% | | | | | | | | | | | | | | | | |
Carlisle Companies Incorporated | | | | | | | | | | | 8,900 | | | | 981,581 | |
| | | | | | | | | | | | | | | | |
| | | | |
| Professional Services: 1.15% | | | | | | | | | | | | | | | | |
TransUnion † | | | | | | | | | | | 28,200 | | | | 872,226 | |
| | | | | | | | | | | | | | | | |
| | | | |
| Road & Rail: 1.03% | | | | | | | | | | | | | | | | |
Kansas City Southern | | | | | | | | | | | 9,200 | | | | 780,620 | |
| | | | | | | | | | | | | | | | |
| | | | |
| Trading Companies & Distributors: 1.61% | | | | | | | | | | | | | | | | |
HD Supply Holdings Incorporated † | | | | | | | | | | | 28,908 | | | | 1,228,879 | |
| | | | | | | | | | | | | | | | |
| | | | |
Information Technology: 34.98% | | | | | | | | | | | | | | | | |
| | | | |
| Communications Equipment: 1.51% | | | | | | | | | | | | | | | | |
Harris Corporation | | | | | | | | | | | 11,200 | | | | 1,147,664 | |
| | | | | | | | | | | | | | | | |
| | | | |
| Internet Software & Services: 10.64% | | | | | | | | | | | | | | | | |
Alphabet Incorporated Class A † | | | | | | | | | | | 3,380 | | | | 2,678,481 | |
Alphabet Incorporated Class C † | | | | | | | | | | | 2,489 | | | | 1,921,060 | |
The accompanying notes are an integral part of these financial statements.
| | | | | | |
| Portfolio of investments—December 31, 2016 | | Wells Fargo VT Omega Growth Fund | | | 11 | |
| | | | | | | | | | | | | | | | |
| Security name | | | | | | | | Shares | | | Value | |
| | | | |
| Internet Software & Services (continued) | | | | | | | | | | | | | | | | |
CoStar Group Incorporated † | | | | | | | | | | | 4,100 | | | $ | 772,809 | |
Facebook Incorporated Class A † | | | | | | | | | | | 15,005 | | | | 1,726,325 | |
Tencent Holdings Limited ADR | | | | | | | | | | | 41,200 | | | | 997,864 | |
| | | | |
| | | | | | | | | | | | | | | 8,096,539 | |
| | | | | | | | | | | | | | | | |
| | | | |
| IT Services: 10.01% | | | | | | | | | | | | | | | | |
Acxiom Corporation † | | | | | | | | | | | 36,314 | | | | 973,215 | |
EPAM Systems Incorporated † | | | | | | | | | | | 12,515 | | | | 804,840 | |
Fidelity National Information Services Incorporated | | | | | | | | | | | 11,300 | | | | 854,732 | |
PayPal Holdings Incorporated † | | | | | | | | | | | 32,400 | | | | 1,278,828 | |
Visa Incorporated Class A | | | | | | | | | | | 31,544 | | | | 2,461,063 | |
WEX Incorporated † | | | | | | | | | | | 11,143 | | | | 1,243,559 | |
| | | | |
| | | | | | | | | | | | | | | 7,616,237 | |
| | | | | | | | | | | | | | | | |
| | | | |
| Semiconductors & Semiconductor Equipment: 1.58% | | | | | | | | | | | | | | | | |
Broadcom Limited | | | | | | | | | | | 6,800 | | | | 1,202,036 | |
| | | | | | | | | | | | | | | | |
| | | | |
| Software: 11.24% | | | | | | | | | | | | | | | | |
Adobe Systems Incorporated † | | | | | | | | | | | 10,600 | | | | 1,091,270 | |
Microsoft Corporation | | | | | | | | | | | 30,800 | | | | 1,913,912 | |
Nintendo Company Limited « | | | | | | | | | | | 31,600 | | | | 820,020 | |
Salesforce.com Incorporated † | | | | | | | | | | | 14,800 | | | | 1,013,208 | |
ServiceNow Incorporated † | | | | | | | | | | | 7,650 | | | | 568,701 | |
Symantec Corporation | | | | | | | | | | | 51,400 | | | | 1,227,946 | |
Take-Two Interactive Software Incorporated † | | | | | | | | | | | 23,600 | | | | 1,163,244 | |
Ultimate Software Group Incorporated † | | | | | | | | | | | 4,100 | | | | 747,635 | |
| | | | |
| | | | | | | | | | | | | | | 8,545,936 | |
| | | | | | | | | | | | | | | | |
| | | | |
Materials: 4.29% | | | | | | | | | | | | | | | | |
| | | | |
| Chemicals: 1.17% | | | | | | | | | | | | | | | | |
The Sherwin-Williams Company | | | | | | | | | | | 3,300 | | | | 886,842 | |
| | | | | | | | | | | | | | | | |
| | | | |
| Construction Materials: 1.45% | | | | | | | | | | | | | | | | |
Vulcan Materials Company | | | | | | | | | | | 8,800 | | | | 1,101,320 | |
| | | | | | | | | | | | | | | | |
| | | | |
| Containers & Packaging: 1.67% | | | | | | | | | | | | | | | | |
Berry Plastics Group Incorporated † | | | | | | | | | | | 26,100 | | | | 1,271,853 | |
| | | | | | | | | | | | | | | | |
| | | | |
Real Estate: 1.22% | | | | | | | | | | | | | | | | |
| | | | |
| Real Estate Management & Development: 1.22% | | | | | | | | | | | | | | | | |
CBRE Group Incorporated Class A † | | | | | | | | | | | 29,400 | | | | 925,803 | |
| | | | | | | | | | | | | | | | |
| | | | |
Total Common Stocks (Cost $61,250,316) | | | | | | | | | | | | | | | 75,087,715 | |
| | | | | | | | | | | | | | | | |
| | | | |
| | | Yield | | | | | | | | | | |
| Short-Term Investments: 3.18% | | | | | | | | | | | | | | | | |
| | | | |
| Investment Companies: 3.18% | | | | | | | | | | | | | | | | |
Securities Lending Cash Investment LLC (l)(r)(u) | | | 0.83 | % | | | | | | | 1,178,682 | | | | 1,178,800 | |
Wells Fargo Government Money Market Fund Select Class (l)(u) | | | 0.43 | | | | | | | | 1,242,926 | | | | 1,242,926 | |
| | | | |
Total Short-Term Investments (Cost $2,421,726) | | | | | | | | | | | | | | | 2,421,726 | |
| | | | | | | | | | | | | | | | |
The accompanying notes are an integral part of these financial statements.
| | | | |
| 12 | | Wells Fargo VT Omega Growth Fund | | Portfolio of investments—December 31, 2016 |
| | | | | | | | |
| | | | | | Value | |
| Total investments in securities (Cost $63,672,042) * | | | 101.91 | % | | $ | 77,509,441 | |
Other assets and liabilities, net | | | (1.91 | ) | | | (1,452,440 | ) |
| | | | | | | | |
| Total net assets | | | 100.00 | % | | $ | 76,057,001 | |
| | | | | | | | |
| « | All or a portion of this security is on loan. |
| † | Non-income-earning security |
| (l) | The issuer of the security is an affiliated person of the Fund as defined in the Investment Company Act of 1940. |
| (r) | The investment is a non-registered investment vehicle purchased with cash collateral received from securities on loan. |
| (u) | The rate represents the 7-day annualized yield at period end. |
| * | Cost for federal income tax purposes is $63,789,363 and unrealized gains (losses) consists of: |
| | | | |
Gross unrealized gains | | $ | 14,966,539 | |
Gross unrealized losses | | | (1,246,461 | ) |
| | | | |
Net unrealized gains | | $ | 13,720,078 | |
The accompanying notes are an integral part of these financial statements.
| | | | | | |
| Statement of assets and liabilities—December 31, 2016 | | Wells Fargo VT Omega Growth Fund | | | 13 | |
| | | | |
| | | | |
| |
Assets | | | | |
Investments | | | | |
In unaffiliated securities (including $1,151,984 of securities loaned), at value (cost $61,250,316) | | $ | 75,087,715 | |
In affiliated securities, at value (cost $2,421,726) | | | 2,421,726 | |
| | | | |
Total investments, at value (cost $63,672,042) | | | 77,509,441 | |
Receivable for investments sold | | | 532,834 | |
Receivable for Fund shares sold | | | 22,714 | |
Receivable for dividends | | | 43,785 | |
Receivable for securities lending income | | | 498 | |
Prepaid expenses and other assets | | | 2,275 | |
| | | | |
Total assets | | | 78,111,547 | |
| | | | |
| |
Liabilities | | | | |
Payable for investments purchased | | | 691,526 | |
Payable for Fund shares redeemed | | | 111,544 | |
Payable upon receipt of securities loaned | | | 1,178,800 | |
Management fee payable | | | 35,879 | |
Distribution fee payable | | | 9,756 | |
Administration fees payable | | | 5,561 | |
Accrued expenses and other liabilities | | | 21,480 | |
| | | | |
Total liabilities | | | 2,054,546 | |
| | | | |
Total net assets | | $ | 76,057,001 | |
| | | | |
| |
NET ASSETS CONSIST OF | | | | |
Paid-in capital | | $ | 59,838,535 | |
Undistributed net investment income | | | 93,586 | |
Accumulated net realized gains on investments | | | 2,287,481 | |
Net unrealized gains on investments | | | 13,837,399 | |
| | | | |
Total net assets | | $ | 76,057,001 | |
| | | | |
| |
COMPUTATION OF NET ASSET VALUE PER SHARE | | | | |
Net assets – Class 1 | | $ | 33,373,465 | |
Shares outstanding – Class 11 | | | 1,503,094 | |
Net asset value per share – Class 1 | | | $22.20 | |
Net assets – Class 2 | | $ | 42,683,536 | |
Shares outstanding – Class 21 | | | 1,996,427 | |
Net asset value per share – Class 2 | | | $21.38 | |
| 1 | The Fund has an unlimited number of authorized shares. |
The accompanying notes are an integral part of these financial statements.
| | | | |
| 14 | | Wells Fargo VT Omega Growth Fund | | Statement of operations—year ended December 31, 2016 |
| | | | |
| | | | |
| |
Investment income | | | | |
Dividends (net of foreign withholding taxes of $2,807) | | $ | 796,793 | |
Securities lending income, net | | | 4,360 | |
Income from affiliated securities | | | 3,942 | |
| | | | |
Total investment income | | | 805,095 | |
| | | | |
| |
Expenses | | | | |
Management fee | | | 479,337 | |
Administration fees | |
Class 1 | | | 28,464 | |
Class 2 | | | 35,448 | |
Distribution fee | |
Class 2 | | | 110,774 | |
Custody and accounting fees | | | 18,810 | |
Professional fees | | | 51,926 | |
Shareholder report expenses | | | 14,621 | |
Trustees’ fees and expenses | | | 23,406 | |
Other fees and expenses | | | 4,664 | |
| | | | |
Total expenses | | | 767,450 | |
Less: Fee waivers and/or expense reimbursements | | | (57,505 | ) |
| | | | |
Net expenses | | | 709,945 | |
| | | | |
Net investment income | | | 95,150 | |
| | | | |
| |
REALIZED AND UNREALIZED GAINS (LOSSES) ON INVESTMENTS | | | | |
Net realized gains on investments | | | 4,552,241 | |
Net change in unrealized gains (losses) on investments | | | (4,610,891 | ) |
| | | | |
Net realized and unrealized gains (losses) on investments | | | (58,650 | ) |
| | | | |
Net increase in net assets resulting from operations | | $ | 36,500 | |
| | | | |
The accompanying notes are an integral part of these financial statements.
| | | | | | |
| Statement of changes in net assets | | Wells Fargo VT Omega Growth Fund | | | 15 | |
| | | | | | | | | | | | | | | | |
| | | Year ended
December 31, 2016 | | | Year ended
December 31, 2015 | |
| | | |
Operations | | | | | | | | | | | | |
Net investment income (loss) | | | | | | $ | 95,150 | | | | | | | $ | (244,546 | ) |
Net realized gains on investments | | | | | | | 4,552,241 | | | | | | | | 6,494,195 | |
Net change in unrealized gains (losses) on investments | | | | | | | (4,610,891 | ) | | | | | | | (4,579,099 | ) |
| | | | |
Net increase in net assets resulting from operations | | | | | | | 36,500 | | | | | | | | 1,670,550 | |
| | | | |
| | | |
Distributions to shareholders from | | | | | | | | | | | | |
Net realized gains | |
Class 1 | | | | | | | (1,928,811 | ) | | | | | | | (7,419,706 | ) |
Class 2 | | | | | | | (2,495,195 | ) | | | | | | | (9,347,294 | ) |
| | | | |
Total distributions to shareholders | | | | | | | (4,424,006 | ) | | | | | | | (16,767,000 | ) |
| | | | |
| | | | |
Capital share transactions | | | Shares | | | | | | | | Shares | | | | | |
Proceeds from shares sold | |
Class 1 | | | 88,558 | | | | 1,932,932 | | | | 72,950 | | | | 1,869,588 | |
Class 2 | | | 73,250 | | | | 1,553,214 | | | | 123,489 | | | | 3,149,327 | |
| | | | |
| | | | | | | 3,486,146 | | | | | | | | 5,018,915 | |
| | | | |
Reinvestment of distributions | |
Class 1 | | | 89,214 | | | | 1,928,811 | | | | 315,732 | | | | 7,419,706 | |
Class 2 | | | 119,674 | | | | 2,495,195 | | | | 410,690 | | | | 9,347,294 | |
| | | | |
| | | | | | | 4,424,006 | | | | | | | | 16,767,000 | |
| | | | |
Payment for shares redeemed | |
Class 1 | | | (406,707 | ) | | | (8,978,003 | ) | | | (368,743 | ) | | | (9,447,612 | ) |
Class 2 | | | (413,059 | ) | | | (8,813,207 | ) | | | (513,389 | ) | | | (13,161,588 | ) |
| | | | |
| | | | | | | (17,791,210 | ) | | | | | | | (22,609,200 | ) |
| | | | |
Net decrease in net assets resulting from capital share transactions | | | | | | | (9,881,058 | ) | | | | | | | (823,285 | ) |
| | | | |
Total decrease in net assets | | | | | | | (14,268,564 | ) | | | | | | | (15,919,735 | ) |
| | | | |
| | |
Net assets | | | | | | | | |
Beginning of period | | | | | | | 90,325,565 | | | | | | | | 106,245,300 | |
| | | | |
End of period | | | | | | $ | 76,057,001 | | | | | | | $ | 90,325,565 | |
| | | | |
Undistributed (accumulated) net investment income (loss) | | | | | | $ | 93,586 | | | | | | | $ | (1,564 | ) |
| | | | |
The accompanying notes are an integral part of these financial statements.
| | | | |
| 16 | | Wells Fargo VT Omega Growth Fund | | Financial highlights |
(For a share outstanding throughout each period)
| | | | | | | | | | | | | | | | | | | | |
| | | Year ended December 31 | |
| CLASS 1 | | 2016 | | | 2015 | | | 2014 | | | 2013 | | | 2012 | |
Net asset value, beginning of period | | | $23.30 | | | | $27.57 | | | | $32.78 | | | | $25.56 | | | | $22.78 | |
Net investment income (loss) | | | 0.10 | | | | (0.03 | ) | | | (0.03 | ) | | | (0.01 | ) | | | 0.11 | |
Net realized and unrealized gains (losses) on investments | | | 0.05 | | | | 0.52 | | | | 1.22 | | | | 9.81 | | | | 4.43 | |
| | | | | | | | | | | | | | | | | | | | |
Total from investment operations | | | 0.15 | | | | 0.49 | | | | 1.19 | | | | 9.80 | | | | 4.54 | |
Distributions to shareholders from | | | | | | | | | | | | | | | | | | | | |
Net investment income | | | 0.00 | | | | 0.00 | | | | 0.00 | | | | (0.12 | ) | | | 0.00 | |
Net realized gains | | | (1.25 | ) | | | (4.76 | ) | | | (6.40 | ) | | | (2.46 | ) | | | (1.76 | ) |
| | | | | | | | | | | | | | | | | | | | |
Total distributions to shareholders | | | (1.25 | ) | | | (4.76 | ) | | | (6.40 | ) | | | (2.58 | ) | | | (1.76 | ) |
Net asset value, end of period | | | $22.20 | | | | $23.30 | | | | $27.57 | | | | $32.78 | | | | $25.56 | |
Total return | | | 0.77 | % | | | 1.62 | % | | | 4.09 | % | | | 40.22 | % | | | 20.76 | % |
Ratios to average net assets (annualized) | | | | | | | | | | | | | | | | | | | | |
Gross expenses | | | 0.82 | % | | | 0.79 | % | | | 0.75 | % | | | 0.79 | % | | | 0.80 | % |
Net expenses | | | 0.75 | % | | | 0.75 | % | | | 0.75 | % | | | 0.75 | % | | | 0.75 | % |
Net investment income (loss) | | | 0.26 | % | | | (0.11 | )% | | | (0.10 | )% | | | (0.12 | )% | | | 0.40 | % |
Supplemental data | | | | | | | | | | | | | | | | | | | | |
Portfolio turnover rate | | | 90 | % | | | 101 | % | | | 88 | % | | | 95 | % | | | 93 | % |
Net assets, end of period (000s omitted) | | | $33,373 | | | | $40,362 | | | | $47,210 | | | | $55,867 | | | | $47,842 | |
The accompanying notes are an integral part of these financial statements.
| | | | | | |
| Financial highlights | | Wells Fargo VT Omega Growth Fund | | | 17 | |
(For a share outstanding throughout each period)
| | | | | | | | | | | | | | | | | | | | |
| | | Year ended December 31 | |
| CLASS 2 | | 2016 | | | 2015 | | | 2014 | | | 2013 | | | 2012 | |
Net asset value, beginning of period | | | $22.54 | | | | $26.89 | | | | $32.19 | | | | $25.13 | | | | $22.48 | |
Net investment income (loss) | | | 0.00 | 1,2 | | | (0.09 | ) | | | (0.10 | ) | | | (0.12 | ) | | | 0.02 | |
Net realized and unrealized gains (losses) on investments | | | 0.09 | | | | 0.50 | | | | 1.20 | | | | 9.68 | | | | 4.39 | |
| | | | | | | | | | | | | | | | | | | | |
Total from investment operations | | | 0.09 | | | | 0.41 | | | | 1.10 | | | | 9.56 | | | | 4.41 | |
Distributions to shareholders from | | | | | | | | | | | | | | | | | | | | |
Net investment income | | | 0.00 | | | | 0.00 | | | | 0.00 | | | | (0.04 | ) | | | 0.00 | |
Net realized gains | | | (1.25 | ) | | | (4.76 | ) | | | (6.40 | ) | | | (2.46 | ) | | | (1.76 | ) |
| | | | | | | | | | | | | | | | | | | | |
Total distributions to shareholders | | | (1.25 | ) | | | (4.76 | ) | | | (6.40 | ) | | | (2.50 | ) | | | (1.76 | ) |
Net asset value, end of period | | | $21.38 | | | | $22.54 | | | | $26.89 | | | | $32.19 | | | | $25.13 | |
Total return | | | 0.52 | % | | | 1.34 | % | | | 3.86 | % | | | 39.88 | % | | | 20.39 | % |
Ratios to average net assets (annualized) | | | | | | | | | | | | | | | | | | | | |
Gross expenses | | | 1.07 | % | | | 1.04 | % | | | 1.00 | % | | | 1.04 | % | | | 1.05 | % |
Net expenses | | | 1.00 | % | | | 1.00 | % | | | 1.00 | % | | | 1.00 | % | | | 1.00 | % |
Net investment income (loss) | | | 0.01 | % | | | (0.36 | )% | | | (0.35 | )% | | | (0.37 | )% | | | 0.12 | % |
Supplemental data | | | | | | | | | | | | | | | | | | | | |
Portfolio turnover rate | | | 90 | % | | | 101 | % | | | 88 | % | | | 95 | % | | | 93 | % |
Net assets, end of period (000s omitted) | | | $42,684 | | | | $49,963 | | | | $59,035 | | | | $68,658 | | | | $62,599 | |
| 1 | Calculated based upon average shares outstanding |
| 2 | Amount is less than $0.005. |
The accompanying notes are an integral part of these financial statements.
| | | | |
| 18 | | Wells Fargo VT Omega Growth Fund | | Notes to financial statements |
1. ORGANIZATION
Wells Fargo Variable Trust (the “Trust”), a Delaware statutory trust organized on March 10, 1999, is an open-end management investment company registered under the Investment Company Act of 1940, as amended (the “1940 Act”). As an investment company, the Trust follows the accounting and reporting guidance in Financial Accounting Standards Board (“FASB”) Accounting Standards Codification Topic 946, Financial Services – Investment Companies. These financial statements report on the Wells Fargo VT Omega Growth Fund (the “Fund”) which is a diversified series of the Trust.
2. SIGNIFICANT ACCOUNTING POLICIES
The following significant accounting policies, which are consistently followed in the preparation of the financial statements of the Fund, are in conformity with U.S. generally accepted accounting principles which require management to make estimates and assumptions that affect the reported amounts of assets and liabilities, disclosure of contingent assets and liabilities at the date of the financial statements, and the reported amounts of revenues and expenses during the reporting period. Actual results could differ from those estimates.
Securities valuation
All investments are valued each business day as of the close of regular trading on the New York Stock Exchange (generally 4 p.m. Eastern Time), although the Fund may deviate from this calculation time under unusual or unexpected circumstances.
Equity securities that are listed on a foreign or domestic exchange or market are valued at the official closing price or, if none, the last sales price. If no sale occurs on the principal exchange or market that day, the prior day’s price will be deemed “stale” and a fair value price will be determined in accordance with the Fund’s Valuation Procedures.
Investments in registered open-end investment companies are valued at net asset value. Interests in non-registered investment vehicles that are redeemable at net asset value are fair valued normally at net asset value.
Investments which are not valued using any of the methods discussed above are valued at their fair value, as determined in good faith by the Board of Trustees of the Fund. The Board of Trustees has established a Valuation Committee comprised of the Trustees and has delegated to it the authority to take any actions regarding the valuation of portfolio securities that the Valuation Committee deems necessary or appropriate, including determining the fair value of portfolio securities, unless the determination has been delegated to the Management Valuation Team of Wells Fargo Funds Management, LLC (“Funds Management”). The Board of Trustees retains the authority to make or ratify any valuation decisions or approve any changes to the Valuation Procedures as it deems appropriate. On a quarterly basis, the Board of Trustees receives reports on any valuation actions taken by the Valuation Committee or the Management Valuation Team which may include items for ratification.
Valuations of fair valued securities are compared to the next actual sales price when available, or other appropriate market values, to assess the continued appropriateness of the fair valuation methodologies used. These securities are fair valued on a day-to-day basis, taking into consideration changes to appropriate market information and any significant changes to the inputs considered in the valuation process until there is a readily available price provided on an exchange or by an independent pricing service. Valuations received from an independent pricing service or independent broker-dealer quotes are periodically validated by comparisons to most recent trades and valuations provided by other independent pricing services in addition to the review of prices by the manager and/or subadviser. Unobservable inputs used in determining fair valuations are identified based on the type of security, taking into consideration factors utilized by market participants in valuing the investment, knowledge about the issuer and the current market environment.
Security loans
The Fund may lend its securities from time to time in order to earn additional income in the form of fees or interest on securities received as collateral or the investment of any cash received as collateral. The Fund continues to receive interest or dividends on the securities loaned. The Fund receives collateral in the form of cash or securities with a value at least equal to the value of the securities on loan. The value of the loaned securities is determined at the close of each business day and any additional required collateral is delivered to the Fund on the next business day. In a securities lending transaction, the net asset value of the Fund will be affected by an increase or decrease in the value of the securities loaned and by an increase or decrease in the value of the instrument in which collateral is invested. The amount of securities lending activity undertaken by the Fund fluctuates from time to time. In the event of default or bankruptcy by the borrower, the Fund may be prevented from recovering the loaned securities or gaining access to the collateral or may experience delays or costs in doing so. In addition, the investment of any cash collateral received may lose all or part of its value. The Fund has the right under the lending agreement to recover the securities from the borrower on demand.
| | | | | | |
| Notes to financial statements | | Wells Fargo VT Omega Growth Fund | | | 19 | |
The Fund lends its securities through an unaffiliated securities lending agent. Cash collateral received in connection with its securities lending transactions is invested in Securities Lending Cash Investments, LLC (the “Securities Lending Fund”). The Securities Lending Fund is exempt from registration under Section 3(c)(7) of the 1940 Act and is managed by Funds Management and is subadvised by Wells Capital Management Incorporated (“WellsCap”), an affiliate of Funds Management and an indirect wholly owned subsidiary of Wells Fargo & Company (“Wells Fargo”). Funds Management receives an advisory fee starting at 0.05% and declining to 0.01% as the average daily net assets of the Securities Lending Fund increase. All of the fees received by Funds Management are paid to WellsCap for its services as subadviser. The Securities Lending Fund seeks to provide a positive return compared to the daily Fed Funds Open Rate by investing in high-quality, U.S. dollar-denominated short-term money market instruments. Securities Lending Fund investments are valued at the evaluated bid price provided by an independent pricing service. Income earned from investment in the Securities Lending Fund is included in securities lending income on the Statement of Operations.
Security transactions and income recognition
Securities transactions are recorded on a trade date basis. Realized gains or losses are recorded on the basis of identified cost.
Dividend income is recognized on the ex-dividend date. Dividend income is recorded net of foreign taxes withheld where recovery of such taxes is not assured.
Distributions to shareholders
Distributions to shareholders from net investment income and net realized gains, if any, are recorded on the ex-dividend date. Such distributions are determined in conformity with federal income tax regulations, which may differ in amount or character from net investment income and realized gains recognized for purposes of U.S. generally accepted accounting principles.
Federal and other taxes
The Fund intends to continue to qualify as a regulated investment company by distributing substantially all of its investment company taxable income and any net realized capital gains (after reduction for capital loss carryforwards) sufficient to relieve it from all, or substantially all, federal income taxes. Accordingly, no provision for federal income taxes was required.
The Fund’s income and federal excise tax returns and all financial records supporting those returns for the prior three fiscal years are subject to examination by the federal and Delaware revenue authorities. Management has analyzed the Fund’s tax positions taken on federal, state, and foreign tax returns for all open tax years and does not believe that there are any uncertain tax positions that require recognition of a tax liability.
As of December 31, 2016, the Fund had capital loss carryforwards available to offset future net realized capital gains in the amount of $162,398 expiring in 2017.
Class allocations
The separate classes of shares offered by the Fund differ principally in distribution fees. Class specific expenses are charged directly to that share class. Investment income, common expenses and realized and unrealized gains (losses) on investments are allocated daily to each class of shares based on the relative proportion of net assets of each class.
3. FAIR VALUATION MEASUREMENTS
Fair value measurements of investments are determined within a framework that has established a fair value hierarchy based upon the various data inputs utilized in determining the value of the Fund’s investments. The three-level hierarchy gives the highest priority to unadjusted quoted prices in active markets for identical assets or liabilities (Level 1) and the lowest priority to significant unobservable inputs (Level 3). The Fund’s investments are classified within the fair value hierarchy based on the lowest level of input that is significant to the fair value measurement. The inputs are summarized into three broad levels as follows:
| ∎ | | Level 1 – quoted prices in active markets for identical securities |
| ∎ | | Level 2 – other significant observable inputs (including quoted prices for similar securities, interest rates, prepayment speeds, credit risk, use of amortized cost, etc.) |
| ∎ | | Level 3 – significant unobservable inputs (including the Fund’s own assumptions in determining the fair value of investments) |
| | | | |
| 20 | | Wells Fargo VT Omega Growth Fund | | Notes to financial statements |
The inputs or methodologies used for valuing investments in securities are not necessarily an indication of the risk associated with investing in those securities.
The following is a summary of the inputs used in valuing the Fund’s assets and liabilities as of December 31, 2016:
| | | | | | | | | | | | | | | | |
| | | Quoted prices
(Level 1) | | | Other significant
observable inputs
(Level 2) | | | Significant
unobservable inputs (Level 3) | | | Total | |
Assets | | | | | | | | | | | | | | | | |
Investments in: | | | | | | | | | | | | | | | | |
| | | | |
Common stocks | | | | | | | | | | | | | | | | |
Consumer discretionary | | $ | 14,714,239 | | | $ | 0 | | | $ | 0 | | | $ | 14,714,239 | |
Consumer staples | | | 3,377,682 | | | | 0 | | | | 0 | | | | 3,377,682 | |
Financials | | | 5,227,089 | | | | 0 | | | | 0 | | | | 5,227,089 | |
Health care | | | 10,853,377 | | | | 0 | | | | 0 | | | | 10,853,377 | |
Industrials | | | 10,121,098 | | | | 0 | | | | 0 | | | | 10,121,098 | |
Information technology | | | 26,608,412 | | | | 0 | | | | 0 | | | | 26,608,412 | |
Materials | | | 3,260,015 | | | | 0 | | | | 0 | | | | 3,260,015 | |
Real estate | | | 925,803 | | | | 0 | | | | 0 | | | | 925,803 | |
| | | | |
Short-term investments | | | | | | | | | | | | | | | | |
Investment companies | | | 1,242,926 | | | | 0 | | | | 0 | | | | 1,242,926 | |
Investments measured at net asset value* | | | | | | | | | | | | | | | 1,178,800 | |
Total assets | | $ | 76,330,641 | | | $ | 0 | | | $ | 0 | | | $ | 77,509,441 | |
| * | Investments that are measured at fair value using the net asset value per share (or its equivalent) as a practical expedient have not been categorized in the fair value hierarchy. The fair value amount presented in the table is intended to permit reconciliation of the fair value hierarchy to the amounts presented in the Statement of Assets and Liabilities. The Fund’s investment in Securities Lending Cash Investments, LLC valued at $1,178,800 does not have a redemption period notice, can be redeemed daily and does not have any unfunded commitments. |
The Fund recognizes transfers between levels within the fair value hierarchy at the end of the reporting period. At December 31, 2016 common stocks with a market value of $997,864 were transferred from Level 2 to Level 1 because of an increase in the market activity of these securities. The Fund did not have any transfers into/out of Level 3.
4. TRANSACTIONS WITH AFFILIATES AND OTHER EXPENSES
Management fee
Funds Management, an indirect wholly owned subsidiary of Wells Fargo, is the manager of the Fund and provides advisory and fund-level administrative services under an investment management agreement. Under the investment management agreement, Funds Management is responsible for, among other services, implementing the investment objectives and strategies of the Fund, supervising the subadviser, providing fund-level administrative services in connection with the Fund’s operations, and providing any other fund-level administrative services reasonably necessary for the operation of the Fund. As compensation for its services under the investment management agreement, Funds Management is entitled to receive an annual management fee starting at 0.60% and declining to 0.43% as the average daily net assets of the Fund increase. For the year ended December 31, 2016, the management fee was equivalent to an annual rate of 0.60% of the Fund’s average daily net assets.
Funds Management has retained the services of a subadviser to provide daily portfolio management to the Fund. The fee for subadvisory services is borne by Funds Management. WellsCap is the subadviser to the Fund and is entitled to receive a fee from Funds Management at an annual rate starting at 0.45% and declining to 0.30% as the average daily net assets of the Fund increase.
Administration fees
Under a class-level administration agreement, Funds Management provides class-level administrative services to the Fund, which includes paying fees and expenses for services provided by the transfer agent, sub-transfer agents, omnibus account servicers and record-keepers. As compensation for its services under the class-level administration agreement, Funds Management receives a class level administration fee of 0.08% which is calculated based on the average daily net assets of each class.
| | | | | | |
| Notes to financial statements | | Wells Fargo VT Omega Growth Fund | | | 21 | |
Funds Management has contractually waived and/or reimbursed management and administration fees to the extent necessary to maintain certain net operating expense ratios for the Fund. Waiver of fees and/or reimbursement of expenses by Funds Management were made first from fund level expenses on a proportionate basis and then from class specific expenses. Funds Management has committed through April 30, 2017 to waive fees and/or reimburse expenses to the extent necessary to cap the Fund’s expenses at 0.75% for Class 1 shares and 1.00% for Class 2 shares. After this time, the cap may be increased or the commitment to maintain the cap may be terminated only with the approval of the Board of Trustees.
During the year ended December 31, 2016, State Street Bank and Trust Company, the Fund’s custodian, reimbursed the Fund $6,552 for certain out-of-pocket expenses that were billed to the Fund in error from 1998-2015. This amount is included in dividend income on the Statement of Operations. In addition, Funds Management was also reimbursed $4,699 for waivers/reimbursements it made to the Fund during the period the Fund was erroneously billed.
Distribution fee
The Trust has adopted a distribution plan for Class 2 shares of the Fund pursuant to Rule 12b-1 under the 1940 Act. A distribution fee is charged to Class 2 shares and paid to Wells Fargo Funds Distributor, LLC, the principal underwriter, at an annual rate of 0.25% of the average daily net assets of Class 2 shares.
5. INVESTMENT PORTFOLIO TRANSACTIONS
Purchases and sales of investments, excluding U.S. government obligations (if any) and short-term securities, for the year ended December 31, 2016 were $72,469,015 and $86,327,322, respectively.
The Fund may purchase or sell investment securities to other Wells Fargo funds under procedures adopted by the Board of Trustees. The procedures have been designed to ensure that these interfund transactions, which generally do not incur broker commissions, are effected at current market prices. Interfund trades are included within the respective purchases and sales amounts shown.
6. BANK BORROWINGS
The Trust and Wells Fargo Funds Trust (excluding the money market funds and certain other funds) are parties to a $250,000,000 revolving credit agreement whereby the Fund is permitted to use bank borrowings for temporary or emergency purposes, such as to fund shareholder redemption requests. Interest under the credit agreement is charged to the Fund based on a borrowing rate equal to the higher of the Federal Funds rate in effect on that day plus 1.25% or the overnight LIBOR rate in effect on that day plus 1.25%. In addition, an annual commitment fee equal to 0.25% of the unused balance is allocated to each participating fund. Prior to August 30, 2016, the revolving credit agreement amount was $200,000,000 and the annual commitment fee was equal to 0.20% of the unused balance which was allocated to each participating fund.
For the year ended December 31, 2016, there were no borrowings by the Fund under the agreement.
7. DISTRIBUTIONS TO SHAREHOLDERS
The tax character of distributions paid during the years ended December 31, 2016 and December 31, 2015 were as follows:
| | | | | | | | |
| | | Year ended December 31 | |
| | | 2016 | | | 2015 | |
Ordinary income | | $ | 0 | | | $ | 819,439 | |
Long-term capital gain | | | 4,424,006 | | | | 15,947,561 | |
As of December 31, 2016, the components of distributable earnings on a tax basis were as follows:
| | | | | | |
Undistributed ordinary income | | Undistributed long-term gain | | Unrealized gains | | Capital loss carryforward |
| $95,107 | | $2,567,201 | | $13,720,078 | | $(162,398) |
| | | | |
| 22 | | Wells Fargo VT Omega Growth Fund | | Notes to financial statements |
8. CONCENTRATION RISK
Concentration risks result from exposure to a limited number of sectors. A fund that invests a substantial portion of its assets in any sector may be more affected by changes in that sector than would be a fund whose investments are not heavily weighted in any sector.
9. INDEMNIFICATION
Under the Trust’s organizational documents, the officers and Trustees have been granted certain indemnification rights against certain liabilities that may arise out of performance of their duties to the Trust. Additionally, in the normal course of business, the Trust may enter into contracts with service providers that contain a variety of indemnification clauses. The Trust’s maximum exposure under these arrangements is dependent on future claims that may be made against the Fund and, therefore, cannot be estimated.
10. REGULATORY CHANGES
In October 2016, the Securities and Exchange Commission (“SEC”) adopted new rules and forms and amended existing rules and forms (together, “final rules”) intended to modernize and enhance the reporting and disclosure of information by registered investment companies and to enhance liquidity risk management by open-end mutual funds and exchange-traded funds. The final rules will enhance the quality of information available to investors and will allow the SEC to more effectively collect and use data reported by funds. In part, the final rules amend Regulation S-X and require standardized, enhanced disclosure about derivatives in the Fund’s financial statements, as well as other amendments. The compliance date for the amendments to Regulation S-X is August 1, 2017 while the compliance date for the new form types is June 1, 2018 and the compliance date for the liquidity risk management program requirements is December 1, 2018. Management is currently assessing the potential impact of these enhancements and their impact on the financial statement disclosures and reporting requirements.
| | | | | | |
| Report of independent registered public accounting firm | | Wells Fargo VT Omega Growth Fund | | | 23 | |
BOARD OF TRUSTEES AND SHAREHOLDERS OF WELLS FARGO VARIABLE TRUST:
We have audited the accompanying statement of assets and liabilities, including the portfolio of investments, of the Wells Fargo VT Omega Growth Fund (the “Fund”), one of the funds constituting the Wells Fargo Variable Trust, as of December 31, 2016, and the related statement of operations for the year then ended, the statements of changes in net assets for each of the years in the two-year period then ended, and the financial highlights for each of the years in the five-year period then ended. These financial statements and financial highlights are the responsibility of the Fund’s management. Our responsibility is to express an opinion on these financial statements and financial highlights based on our audits.
We conducted our audits in accordance with the standards of the Public Company Accounting Oversight Board (United States). Those standards require that we plan and perform the audit to obtain reasonable assurance about whether the financial statements and financial highlights are free of material misstatement. An audit includes examining, on a test basis, evidence supporting the amounts and disclosures in the financial statements. Our procedures included confirmation of securities owned as of December 31, 2016, by correspondence with the custodian and brokers, or by other appropriate auditing procedures. An audit also includes assessing the accounting principles used and significant estimates made by management, as well as evaluating the overall financial statement presentation. We believe that our audits provide a reasonable basis for our opinion.
In our opinion, the financial statements and financial highlights referred to above present fairly, in all material respects, the financial position of the Wells Fargo VT Omega Growth Fund as of December 31, 2016, the results of its operations for the year then ended, the changes in its net assets for each of the years in the two-year period then ended, and the financial highlights for each of the years in the five-year period then ended, in conformity with U.S. generally accepted accounting principles.

Boston, Massachusetts
February 23, 2017
| | | | |
| 24 | | Wells Fargo VT Omega Growth Fund | | Other information (unaudited) |
TAX INFORMATION
Pursuant to Section 852 of the Internal Revenue Code, $4,424,006 was designated as a 20% rate gain distribution for the fiscal year ended December 31, 2016.
PROXY VOTING INFORMATION
A description of the policies and procedures that the Fund uses to determine how to vote proxies relating to portfolio securities is available, upon request, by calling 1-800-260-5969, visiting our website at wellsfargofunds.com, or visiting the SEC website at sec.gov. Information regarding how the Fund voted proxies relating to portfolio securities during the most recent 12-month period ended June 30 is available on the Fund’s website at wellsfargofunds.com or by visiting the SEC website at sec.gov.
PORTFOLIO HOLDINGS INFORMATION
The complete portfolio holdings for the Fund are publicly available monthly on the Fund’s website (wellsfargofunds.com), on a one-month delayed basis. In addition, top ten holdings information (excluding derivative positions) for the Fund is publicly available on the Fund’s website on a monthly, seven-day or more delayed basis. The Fund files its complete schedule of portfolio holdings with the SEC for the first and third quarters of each fiscal year on Form N-Q, which is available by visiting the SEC website at sec.gov. In addition, the Fund’s Form N-Q may be reviewed and copied at the SEC’s Public Reference Room in Washington, DC, and at regional offices in New York City, at 233 Broadway, and in Chicago, at 175 West Jackson Boulevard, Suite 900. Information about the Public Reference Room may be obtained by calling 1-800-SEC-0330.
| | | | | | |
| Other information (unaudited) | | Wells Fargo VT Omega Growth Fund | | | 25 | |
BOARD OF TRUSTEES AND OFFICERS
Each of the Trustees and Officers1 listed in the table below acts in identical capacities for each fund in the Wells Fargo family of funds, which consists of 139 mutual funds comprising the Wells Fargo Funds Trust, Wells Fargo Variable Trust, Wells Fargo Master Trust and four closed-end funds (collectively the “Fund Complex”). This table should be read in conjunction with the Prospectus and the Statement of Additional Information2. The mailing address of each Trustee and Officer is 525 Market Street, 12th Floor, San Francisco, CA 94105. Each Trustee and Officer serves an indefinite term, however, each Trustee serves such term until reaching the mandatory retirement age established by the Trustees.
Independent Trustees
| | | | | | |
Name and
year of birth | | Position held and
length of service* | | Principal occupations during past five years or longer | | Current other
public company or
investment company
directorships |
William R. Ebsworth (Born 1957) | | Trustee, since 2015 | | Retired. From 1984 to 2013, equities analyst, portfolio manager, research director and chief financial officer at Fidelity Management and Research Company in Boston, Tokyo, and Hong Kong and retired in 2013 as Chief Investment Officer of Fidelity Strategic Advisers, Inc. where he lead a team of investment professionals managing client assets. Prior thereto, Board member of Hong Kong Securities Clearing Co., Hong Kong Options Clearing Corp., the Thailand International Fund, Ltd., Fidelity Investments Life Insurance Company, and Empire Fidelity Investments Life Insurance Company. Board member of the Fonté Foundation (non-profit organization) and the Vincent Memorial Hospital Endowment (non-profit organization), where he serves on the Investment Committee and as a Chair of the Audit Committee. Mr. Ebsworth is a CFA® charterholder and an Adjunct Lecturer, Finance, at Babson College. | | Asset Allocation Trust |
Jane A. Freeman (Born 1953) | | Trustee, since 2015 | | Retired. From 2012 to 2014 and 1999 to 2008, Chief Financial Officer of Scientific Learning Corporation. From 2008 to 2012, Ms. Freeman provided consulting services related to strategic business projects. Prior to 1999, Portfolio Manager at Rockefeller & Co. and Scudder, Stevens & Clark. Board member of the Harding Loevner Funds from 1996 to 2014, serving as both Lead Independent Director and chair of the Audit Committee. Board member of the Russell Exchange Traded Funds Trust from 2011 to 2012 and the chair of the Audit Committee. Ms. Freeman is Chair of Taproot Foundation (non-profit organization), a Board Member of Ruth Bancroft Garden (non-profit organization) and an inactive chartered financial analyst. | | Asset Allocation Trust |
Peter G. Gordon** (Born 1942) | | Trustee, since 1998; Chairman, since 2005 | | Co-Founder, Retired Chairman, President and CEO of Crystal Geyser Water Company. Trustee Emeritus, Colby College. | | Asset Allocation Trust |
Isaiah Harris, Jr. (Born 1952) | | Trustee, since 2009 | | Retired. Chairman of the Board of CIGNA Corporation since 2009, and Director since 2005. From 2003 to 2011, Director of Deluxe Corporation. Prior thereto, President and CEO of BellSouth Advertising and Publishing Corp. from 2005 to 2007, President and CEO of BellSouth Enterprises from 2004 to 2005 and President of BellSouth Consumer Services from 2000 to 2003. Emeritus member of the Iowa State University Foundation Board of Governors. Emeritus Member of the Advisory Board of Iowa State University School of Business. Advisory Board Member, Palm Harbor Academy (charter school). Advisory Board Member, Child Evangelism Fellowship (non-profit). Mr. Harris is a certified public accountant (inactive status). | | CIGNA Corporation; Asset Allocation Trust |
Judith M. Johnson (Born 1949) | | Trustee, since 2008;
Audit Committee Chairman, since 2008 | | Retired. Prior thereto, Chief Executive Officer and Chief Investment Officer of Minneapolis Employees Retirement Fund from 1996 to 2008. Ms. Johnson is an attorney, certified public accountant and a certified managerial accountant. | | Asset Allocation Trust |
David F. Larcker (Born 1950) | | Trustee, since 2009 | | James Irvin Miller Professor of Accounting at the Graduate School of Business, Stanford University, Director of the Corporate Governance Research Initiative and Senior Faculty of The Rock Center for Corporate Governance since 2006. From 2005 to 2008, Professor of Accounting at the Graduate School of Business, Stanford University. Prior thereto, Ernst & Young Professor of Accounting at The Wharton School, University of Pennsylvania from 1985 to 2005. | | Asset Allocation Trust |
| | | | |
| 26 | | Wells Fargo VT Omega Growth Fund | | Other information (unaudited) |
| | | | | | |
Name and
year of birth | | Position held and
length of service* | | Principal occupations during past five years or longer | | Current other
public company or
investment company
directorships |
| Olivia S. Mitchell (Born 1953) | | Trustee, since 2006 | | International Foundation of Employee Benefit Plans Professor, Wharton School of the University of Pennsylvania since 1993. Director of Wharton’s Pension Research Council and Boettner Center on Pensions & Retirement Research, and Research Associate at the National Bureau of Economic Research. Previously, Cornell University Professor from 1978 to 1993. | | Asset Allocation Trust |
Timothy J. Penny (Born 1951) | | Trustee, since 1996 | | President and Chief Executive Officer of Southern Minnesota Initiative Foundation, a non-profit organization, since 2007 and Senior Fellow at the Humphrey Institute Policy Forum at the University of Minnesota since 1995. Member of the Board of Trustees of NorthStar Education Finance, Inc., a non-profit organization, since 2007. | | Asset Allocation Trust |
Michael S. Scofield (Born 1943) | | Trustee, since 2010 | | Served on the Investment Company Institute’s Board of Governors and Executive Committee from 2008-2011 as well the Governing Council of the Independent Directors Council from 2006-2011 and the Independent Directors Council Executive Committee from 2008-2011. Chairman of the IDC from 2008-2010. Institutional Investor (Fund Directions) Trustee of Year in 2007. Trustee of the Evergreen Funds complex (and its predecessors) from 1984 to 2010. Chairman of the Evergreen Funds from 2000-2010. Former Trustee of the Mentor Funds. Retired Attorney, Law Offices of Michael S. Scofield. | | Asset Allocation Trust |
| * | Length of service dates reflect the Trustee’s commencement of service with the Trust’s predecessor entities, where applicable. |
| ** | Peter Gordon is expected to retire on December 31, 2017. |
Officers
| | | | | | |
Name and
year of birth | | Position held and
length of service | | Principal occupations during past five years or longer | | |
Andrew Owen3 (Born 1960) | | President, since 2017 | | Executive Vice President of Wells Fargo Bank, N.A. and President of Wells Fargo & Company and Head of Affiliated Managaers, Wells Fargo Asset Management, since 2014. Executive Vice President responsible for marketing, investments and product development for Wells Fargo Funds Management, LLC, from 2009 to 2014. | | |
Jeremy DePalma1 (Born 1974) | | Treasurer, since 2012 | | Senior Vice President of Wells Fargo Funds Management, LLC since 2009. Senior Vice President of Evergreen Investment Management Company, LLC from 2008 to 2010 and head of the Fund Reporting and Control Team within Fund Administration from 2005 to 2010. | | |
C. David Messman (Born 1960) | | Secretary, since 2000; Chief Legal Officer, since 2003 | | Senior Vice President and Secretary of Wells Fargo Funds Management, LLC since 2001. Assistant General Counsel of Wells Fargo Bank, N.A. since 2013 and Vice President and Managing Counsel of Wells Fargo Bank, N.A. from 1996 to 2013. | | |
Michael Whitaker (Born 1967) | | Chief Compliance Officer, since 2016 | | Executive Vice President of Wells Fargo Funds Management, LLC since 2016. Chief Compliance Officer of Fidelity’s Fixed Income Funds and Asset Allocation Funds from 2008 to 2016, Compliance Officer of FMR Co., Inc. from 2014 to 2016, Fidelity Investments Money Management, Inc. from 2014 to 2016, Fidelity Investments from 2007 to 2016. | | |
David Berardi (Born 1975) | | Assistant Treasurer, since 2009 | | Vice President of Wells Fargo Funds Management, LLC since 2009. Vice President of Evergreen Investment Management Company, LLC from 2008 to 2010. Manager of Fund Reporting and Control for Evergreen Investment Management Company, LLC from 2004 to 2010. | | |
| 1 | Jeremy DePalma acts as Treasurer of 69 funds and Assistant Treasurer of 70 funds in the Fund Complex. |
| 2 | The Statement of Additional Information includes additional information about the Trustees and is available, without charge, upon request, by calling 1-800-260-5969 or by visiting the website at wellsfargofunds.com. |
| 3 | Andrew Owen became President on January 1, 2017. |
| | | | | | |
| List of abbreviations | | Wells Fargo VT Omega Growth Fund | | | 27 | |
The following is a list of common abbreviations for terms and entities that may have appeared in this report.
| ACA | — ACA Financial Guaranty Corporation |
| ADR | — American depositary receipt |
| ADS | — American depositary shares |
| AGC | — Assured Guaranty Corporation |
| AGM | — Assured Guaranty Municipal |
| Ambac | — Ambac Financial Group Incorporated |
| AMT | — Alternative minimum tax |
| BAN | — Bond anticipation notes |
| BHAC | — Berkshire Hathaway Assurance Corporation |
| CAB | — Capital appreciation bond |
| CCAB | — Convertible capital appreciation bond |
| CDA | — Community Development Authority |
| CDO | — Collateralized debt obligation |
| DRIVER | — Derivative inverse tax-exempt receipts |
| DW&P | — Department of Water & Power |
| DWR | — Department of Water Resources |
| ECFA | — Educational & Cultural Facilities Authority |
| EDA | — Economic Development Authority |
| EDFA | — Economic Development Finance Authority |
| ETF | — Exchange-traded fund |
| FDIC | — Federal Deposit Insurance Corporation |
| FFCB | — Federal Farm Credit Banks |
| FGIC | — Financial Guaranty Insurance Corporation |
| FHA | — Federal Housing Administration |
| FHLB | — Federal Home Loan Bank |
| FHLMC | — Federal Home Loan Mortgage Corporation |
| FICO | — The Financing Corporation |
| FNMA | — Federal National Mortgage Association |
| GDR | — Global depositary receipt |
| GNMA | — Government National Mortgage Association |
| HCFR | — Healthcare facilities revenue |
| HEFA | — Health & Educational Facilities Authority |
| HEFAR | — Higher education facilities authority revenue |
| HFA | — Housing Finance Authority |
| HFFA | — Health Facilities Financing Authority |
| HUD | — Department of Housing and Urban Development |
| IDA | — Industrial Development Authority |
| IDAG | — Industrial Development Agency |
| KRW | — Republic of Korea won |
| LIBOR | — London Interbank Offered Rate |
| LIFER | — Long Inverse Floating Exempt Receipts |
| LLC | — Limited liability company |
| LLLP | — Limited liability limited partnership |
| LLP | — Limited liability partnership |
| MBIA | — Municipal Bond Insurance Association |
| MFHR | — Multifamily housing revenue |
| MSTR | — Municipal securities trust receipts |
| MUD | — Municipal Utility District |
| National | — National Public Finance Guarantee Corporation |
| PCFA | — Pollution Control Financing Authority |
| PCL | — Public Company Limited |
| PCR | — Pollution control revenue |
| PFA | — Public Finance Authority |
| PFFA | — Public Facilities Financing Authority |
| PFOTER | — Puttable floating option tax-exempt receipts |
| plc | — Public limited company |
| PUTTER | — Puttable tax-exempt receipts |
| R&D | ��� Research & development |
| Radian | — Radian Asset Assurance |
| RAN | — Revenue anticipation notes |
| RDA | — Redevelopment Authority |
| RDFA | — Redevelopment Finance Authority |
| REIT | — Real estate investment trust |
| ROC | — Reset option certificates |
| SAVRS | — Select auction variable rate securities |
| SBA | — Small Business Authority |
| SDR | — Swedish depositary receipt |
| SFHR | — Single-family housing revenue |
| SFMR | — Single-family mortgage revenue |
| SPA | — Standby purchase agreement |
| SPDR | — Standard & Poor’s Depositary Receipts |
| SPEAR | — Short Puttable Exempt Adjustable Receipts |
| STRIPS | — Separate trading of registered interest and |
| TAN | — Tax anticipation notes |
| TIPS | — Treasury inflation-protected securities |
| TRAN | — Tax revenue anticipation notes |
| TTFA | — Transportation Trust Fund Authority |
| TVA | — Tennessee Valley Authority |
This page is intentionally left blank.

For more information
More information about Wells Fargo Funds is available free upon request. To obtain literature, please write, email, visit the Fund’s website, or call:
Wells Fargo Funds
P.O. Box 8266
Boston, MA 02266-8266
Email: fundservice@wellsfargo.com
Website: wellsfargofunds.com
Individual investors: 1-800-222-8222
Retail investment professionals: 1-888-877-9275
Institutional investment professionals:
1-866-765-0778
This report and the financial statements contained herein are submitted for the general information of the shareholders of the Fund. If this report is used for promotional purposes, distribution of the report must be accompanied or preceded by a current prospectus. Before investing, please consider the investment objectives, risks, charges, and expenses of the investment. For a current prospectus and, if available, a summary prospectus, containing this information, call 1-800-260-5969 or visit the Fund’s website at wellsfargofunds.com. Read the prospectus carefully before you invest or send money.
Wells Fargo Asset Management (WFAM) is a trade name used by the asset management businesses of Wells Fargo & Company. Wells Fargo Funds Management, LLC, a wholly owned subsidiary of Wells Fargo & Company, provides investment advisory and administrative services for Wells Fargo Funds. Other affiliates of Wells Fargo & Company provide subadvisory and other services for the funds. The funds are distributed by Wells Fargo Funds Distributor, LLC, Member FINRA, an affiliate of Wells Fargo & Company. Neither Wells Fargo Funds Management nor Wells Fargo Funds Distributor has Fund customer accounts/assets, and neither provides investment advice/recommendations or acts as an investment advice fiduciary to any investor.
NOT FDIC INSURED ◾ NO BANK GUARANTEE ◾ MAY LOSE VALUE
© 2016 Wells Fargo Funds Management, LLC. All rights reserved.
| | |
| | 300471 02-17 AVT5/AR151 12-16 |
Annual Report
December 31, 2016

Wells Fargo VT Opportunity Fund


Reduce clutter. Save trees.
Sign up for electronic delivery of prospectuses and shareholder reports at wellsfargo.com/advantagedelivery
Contents
The views expressed and any forward-looking statements are as of December 31, 2016, unless otherwise noted, and are those of the Fund managers and/or Wells Fargo Funds Management, LLC. Discussions of individual securities, or the markets generally, or any Wells Fargo Fund are not intended as individual recommendations. Future events or results may vary significantly from those expressed in any forward-looking statements. The views expressed are subject to change at any time in response to changing circumstances in the market. Wells Fargo Funds Management, LLC and the Fund disclaim any obligation to publicly update or revise any views expressed or forward-looking statements.
NOT FDIC INSURED ◾ NO BANK GUARANTEE ◾ MAY LOSE VALUE
| | | | |
| 2 | | Wells Fargo VT Opportunity Fund | | Letter to shareholders (unaudited) |

Andrew Owen
President
Wells Fargo Funds
U.S. small-, mid-, and large-cap stocks returned 21.31%, 13.80%, and 12.05% for the twelve-month period, respectively.
During the fourth quarter of 2016, the Fed hiked the short-term interest rate by 0.25% to reach a target range of 0.50% to 0.75%.
Dear Valued Shareholder:
As the new president of Wells Fargo Funds now that Karla Rabusch is retiring from that position after nearly 14 years, I am pleased to offer you this annual report for the Wells Fargo VT Opportunity Fund for the 12-month period that ended December 31, 2016. The U.S. economy ticked up as the year progressed. As expected, the Federal Reserve (Fed) raised the federal funds rate in December by 0.25%. U.S. small-, mid-, and large-cap stocks returned 21.31%, 13.80%, and 12.05% for the twelve-month period, respectively, as measured by the Russell 2000® Index,1 the Russell Midcap® Index,2 and the Russell 1000® Index.3
U.S. stocks showed gains in 2016, primarily after the U.S. presidential election.
The year began with a precipitous drop in U.S. stocks in January as crude oil prices tumbled and concerns about China’s economy increased; a mostly steady trajectory continued in the U.S. stock market after that inflection point. However, stocks rose significantly immediately following the U.S. presidential election. The promise of pro-growth policies by the incoming administration—lower tax rates, less regulation, investments in infrastructure, better trade deals—set the momentum for this surge.
The types of companies leading the rally leaned toward ones that have done well in a rising-rate environment, such as banks, and businesses which have benefited from infrastructure spending and reduced regulations. Sectors that could be negatively affected by rising interest rates, such as utilities, delivered weaker results. Consumer confidence hit prerecession levels for the first time in November and increased again in December.
Stronger economic indicators drove U.S. monetary policy.
During the fourth quarter of 2016, the Fed hiked the short-term interest rate by 0.25% to reach a target range of 0.50% to 0.75%. This was the second rate increase in more than 10 years, with the Fed citing job gains and lower-than-expected unemployment of 4.6%, down 0.3% from October. The Fed confirmed the continuation of an accommodative monetary policy to support a stronger labor market and reiterated its long-term objective of a 2% inflation rate, which increased slightly during the quarter but fell short of the benchmark. The Fed expressed confidence in the economy’s progress during the quarter and expects this positive trajectory to continue. Both of these sentiments helped to bolster the Fed’s expectation of three additional rate increases during 2017.
U.S. economic data released during the fourth quarter showed that U.S. real gross domestic product increased at an annual rate of 3.5% in the third quarter, the largest increase since mid-2014. Business investment by U.S. companies was mixed, with a 12.0% increase in structures and 4.5% decrease in equipment over the prior quarter on an annualized basis. Consumer spending slowed somewhat from the prior quarter, but late-December estimates from retail-research firms suggest that sales growth during the 2016 holiday season may outpace that of recent years.
| 1 | The Russell 2000® Index measures the performance of the 2,000 smallest companies in the Russell 3000® Index, which represents approximately 8% of the total market capitalization of the Russell 3000® Index. You cannot invest directly in an index. |
| 2 | The Russell Midcap® Index measures the performance of the 800 smallest companies in the Russell 1000® Index, which represent approximately 25% of the total market capitalization of the Russell 1000® Index. You cannot invest directly in an index. |
| 3 | The Russell 1000® Index measures the performance of the 1,000 largest companies in the Russell 3000® Index, which represents approximately 92% of the total market capitalization of the Russell 3000® Index. You cannot invest directly in an index. |
| | | | | | |
| Letter to shareholders (unaudited) | | Wells Fargo VT Opportunity Fund | | | 3 | |
Central banks continued with stimulus programs during 2016.
In January, the Bank of Japan put in place a negative interest rate and in September announced an interest-rate target for 10-year government bonds—keeping the yield at zero—as it struggled to accelerate economic growth. The eurozone fell into deflation in February; in response, the European Central Bank (ECB) announced an expansion of its stimulus program. In December, the ECB stated that it will extend its quantitative-easing program and continue purchasing eurozone corporate and government debt each month through December 2017. In June, voters in the U.K. approved a referendum to leave the European Union; the Bank of England lowered its interest rate in August to 0.25% and continued its quantitative-easing program.
Don’t let short-term uncertainty derail long-term investment goals.
Periods of uncertainty can present challenges, but experience has taught us that maintaining long-term investment goals can be an effective way to plan for the future. To help you create a sound strategy based on your personal goals and risk tolerance, Wells Fargo Funds offers more than 100 mutual funds spanning a wide range of asset classes and investment styles. Although diversification cannot guarantee an investment profit or prevent losses, we believe it can be an effective way to manage investment risk and potentially smooth out overall portfolio performance. We encourage investors to know their investments and to understand that appropriate levels of risk-taking may unlock opportunities.
Thank you for choosing to invest in Wells Fargo Funds. We appreciate your confidence in us and remain committed to helping you meet your financial needs.
Sincerely,

Andrew Owen
President
Wells Fargo Funds
For further information about your Fund, contact your investment professional, visit our website at wellsfargofunds.com, or call us directly at 1-800-260-5969. We are available 24 hours a day, 7 days a week.
| | | | |
| 4 | | Wells Fargo VT Opportunity Fund | | Performance highlights (unaudited) |
Investment objective
The Fund seeks long-term capital appreciation.
Manager
Wells Fargo Funds Management, LLC
Subadviser
Wells Capital Management Incorporated
Portfolio manager
Ann M. Miletti
Average annual total returns (%) as of December 31, 20161
| | | | | | | | | | | | | | | | | | | | | | |
| | | | | | | | Expense ratios2 (%) | |
| | | Inception date | | 1 year | | | 5 year | | | 10 year | | | Gross | | | Net3 | |
| Class 1 | | 8-26-2011 | | | 12.52 | | | | 12.92 | | | | 7.33 | | | | 0.84 | | | | 0.75 | |
| Class 2 | | 5-8-1992 | | | 12.23 | | | | 12.64 | | | | 7.18 | | | | 1.09 | | | | 1.00 | |
| Russell 3000® Index4 | | – | | | 12.74 | | | | 14.67 | | | | 7.07 | | | | – | | | | – | |
Figures quoted represent past performance, which is no guarantee of future results. Investment return and principal value of an investment will fluctuate so that an investor’s shares, when redeemed, may be worth more or less than their original cost. Current performance may be lower or higher than the performance data quoted and assumes the reinvestment of dividends and capital gains. Current month-end performance is available by calling 1-800-260-5969. Performance figures of the Fund do not reflect fees charged pursuant to the terms of variable life insurance policies and variable annuity contracts. If sales loads or charges had been reflected, performance would have been lower.
Index returns do not include transaction costs associated with buying and selling securities, any mutual fund fees or expenses, or any taxes. It is not possible to invest directly in an index.
Stock values fluctuate in response to the activities of individual companies and general market and economic conditions. Smaller-company stocks tend to be more volatile and less liquid than those of larger companies. Certain investment strategies tend to increase the total risk of an investment (relative to the broader market). The Fund is exposed to foreign investment risk. Consult the Fund’s prospectus for additional information on these and other risks.
Please refer to the prospectus provided by your participating insurance company for detailed information describing the separate accounts for information regarding surrender charges, mortality and expense risk fees, and other charges that may be assessed by the participating insurance companies.
Please see footnotes on page 5.
| | | | | | |
| Performance highlights (unaudited) | | Wells Fargo VT Opportunity Fund | | | 5 | |
|
| Growth of $10,000 investment as of December 31, 20165 |
|
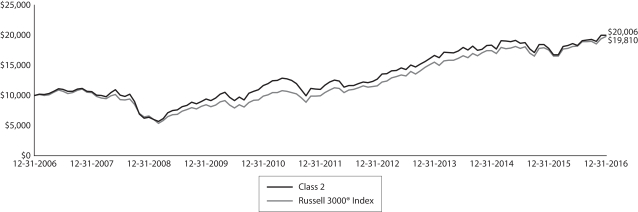
|
| 1 | Historical performance shown for Class 1 shares prior to their inception reflects the performance of Class 2 shares, and includes the higher expenses applicable to Class 2 shares. If these expenses had not been included, returns would be higher. |
| 2 | Reflects the expense ratios as stated in the most recent prospectuses. The expense ratios shown are subject to change and may differ from the annualized expense ratios shown in the financial highlights of this report. |
| 3 | The manager has contractually committed through April 30, 2017, to waive fees and/or reimburse expenses to the extent necessary to cap the Fund’s Total Annual Fund Operating Expenses After Fee Waiver at the amounts shown. After this time, the cap may be increased or the commitment to maintain the cap may be terminated only with the approval of the Board of Trustees. Brokerage commissions, stamp duty fees, interest, taxes, acquired fund fees and expenses, and extraordinary expenses are excluded from the expense cap. Without this cap, the Fund’s returns would have been lower. |
| 4 | The Russell 3000® Index measures the performance of the 3,000 largest U.S. companies based on total market capitalization, which represents approximately 98% of the investable U.S. equity market. You cannot invest directly in an index. |
| 5 | The chart compares the performance of Class 2 shares for the most recent ten years with the Russell 3000® Index. The chart assumes a hypothetical $10,000 investment and reflects all operating expenses of the Fund. Performance does not reflect fees charged pursuant to the terms of variable life insurance policies and variable annuity contracts. |
| 6 | The ten largest holdings, excluding cash and cash equivalents, are calculated based on the value of the investments divided by total net assets of the Fund. Holdings are subject to change and may have changed since the date specified. |
| 7 | Amounts are calculated based on the total long-term investments of the Fund. These amounts are subject to change and may have changed since the date specified. |
| | | | |
| 6 | | Wells Fargo VT Opportunity Fund | | Performance highlights (unaudited) |
MANAGER’S DISCUSSION
Fund highlights
| ∎ | | The Fund underperformed its benchmark, the Russell 3000® Index, for the 12-month period that ended December 31, 2016. |
| ∎ | | The Fund’s holdings within the information technology (IT), industrials, and financials sectors detracted the most from performance for the period. |
| ∎ | | Stock selection in the health care, consumer discretionary, and energy sectors provided the top contributions to Fund performance for the period |
Amid the tumult, 2016 was a banner year for many markets. The broad U.S. stock market, represented by the Russell 3000® Index, declined at the beginning of the year, hitting a low in mid-February. However, the index proceeded to record gains every quarter for the rest of the year, overcoming temporary dips related to specific events. The Russell 3000® Index hit new all-time highs and ended up 12.74% for the year. Energy, telecommunication services, and financials were the best-performing sectors in the index while health care was the only sector with a negative return. Market performance in 2016 tended to be skewed toward value and small-cap stocks. It has been three years since small-cap stocks outperformed large caps and four years since value stocks outperformed growth stocks.
A number of factors affected the U.S stock market during 2016, including energy prices, monetary policy, exchange rates, emerging economies, and geopolitical events. Crude-oil prices fell to their lowest point in a decade in mid-February but ended the year up 45% in the biggest annual increase since the financial crisis. This bolstered energy stocks as well as many commodity- and energy-related industries. At the end of the first quarter of 2016, the U.S. Federal Reserve (Fed) signaled that global uncertainty justified a slower path of interest-rate increases. Then, in December 2016, the Fed raised rates by 0.25% for the first time in a year and for only the second time since the financial crisis. The market was temporarily disrupted at the end of June when the U.K. voted to leave the European Union. Also, fears that China’s economic growth would materially slow down receded as the year rolled on. Meanwhile, the U.S. dollar rose against most major currencies during the period. In November, Donald Trump won the U.S. presidential election, and the Republican Party maintained control of the U.S. House of Representatives as well as the U.S. Senate. The market generally rose from the November elections through the end of the reporting period, and sectors such as financials and industrials, which are expected to potentially benefit from pro-growth policies under the Trump administration, gained the most. The U.S. economy remained resilient during the reporting period, contributing to 10 straight quarters of growth in gross domestic product, and continued to experience favorable trends in employment, wages, disposable income, and housing.
In this environment and with the expectation of tighter U.S. monetary policy to come, we continued to seek well-positioned companies—those with good business models, strong management teams, and healthy cash flows—trading at attractive discounts to their private market values (PMVs). The PMV represents the expected price an investor would pay for the entire company as a stand-alone private entity.
Fund performance was negatively affected by stock selection in the IT, industrials, and financials sectors.
Overall, the Fund’s IT, industrials, and financials holdings did not keep pace with their respective sectors within the Russell 3000® Index. In the IT sector, Alliance Data Systems Corporation and Red Hat, Incorporated, detracted the most from performance. Alliance Data Systems, which offers marketing and customer-loyalty solutions, underperformed due to missed revenue targets and fear over the impact of a possible negative shift in the credit cycle. Red Hat, which provides open-source software solutions, was negatively affected by disappointing revenue results and future billing estimates. In the industrials sector, car-rental company Hertz Global Holdings, Incorporated, detracted the most from performance. Hertz has been under pressure for some time from the financial impacts of increased depreciation of its fleet and high leverage on its balance sheet. Within the financials sector, holdings in the insurance industry, including Willis Towers Watson plc, detracted from performance.
Please see footnotes on page 5.
| | | | | | |
| Performance highlights (unaudited) | | Wells Fargo VT Opportunity Fund | | | 7 | |
| | | | |
| Ten largest holdings (%) as of December 31, 20166 | |
Apple Incorporated | | | 2.90 | |
Johnson Controls International plc | | | 2.70 | |
Alphabet Incorporated Class C | | | 2.57 | |
PNC Financial Services Group Incorporated | | | 2.22 | |
Bio-Rad Laboratories Incorporated Class A | | | 2.19 | |
American International Group Incorporated | | | 1.95 | |
Webster Financial Corporation | | | 1.92 | |
Twenty-First Century Fox Incorporated Class B | | | 1.84 | |
Chubb Limited | | | 1.81 | |
Starbucks Corporation | | | 1.75 | |
Holdings within the health care, consumer discretionary, and energy sectors contributed to the Fund’s performance.
The Fund’s health care holdings outperformed the benchmark due to stock selection in the life sciences industry and an underweight to the biotechnology and pharmaceutical industries as they underwent corrections. Bio-Rad Laboratories Incorporated was the Fund’s best-performing company in this sector. In the consumer discretionary sector, holdings in the specialty and multiline retail industries outperformed the benchmark index. Dick’s Sporting Goods, Incorporated; Macy’s, Incorporated; and Nordstrom, Incorporated, were pressured in 2015, and timely exits from those positions
as they recovered in 2016 aided performance. The Fund’s overweight to the energy sector—the index’s top-performing sector for the period—as well as a notable emphasis on exploration and production (E&P) holdings aided relative performance. The Fund contains some of the higher-quality E&P companies as defined by strong balance sheets, experienced management teams, and low-cost producers in the richest shale zones of the Permian Basin.
|
| Sector distribution as of December 31, 20167 |
|
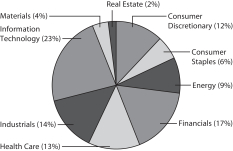 |
Our methodology includes buying stocks at a discount to their estimated PMVs and selling stocks as they approach or exceed 80% of their PMVs. Our disciplined, bottom-up investment process leads us to be overweight or underweight certain sectors. This positioning changes over time based on macroeconomic and industry-specific factors. In recent years, our process has led to Fund overweights to the IT and industrials sectors and underweights to utilities and real estate (due to lower exposure to real estate investment trusts). Through our disciplined investment process, we remain keenly aware of both price and enterprise values on a company-by-company basis. Our
proprietary database of company acquisitions across industries, sectors, and time frames enables us to maintain a steady foundation for assessing the PMVs of companies compared with their public-market stock prices. We strive to take advantage of those price discrepancies for the benefit of Fund shareholders by purchasing stocks when we believe they are selling at a discount to their PMVs.
The generally improving U.S. economic data and postelection optimism for a pro-business environment caused the stock market to surge at year end. This environment may create investment opportunities for us in 2017. In our view, companies with attractive stock prices relative to their PMVs could be identified by our process, which may allow us to add value through our unique, bottom-up research.
Please see footnotes on page 5.
| | | | |
| 8 | | Wells Fargo VT Opportunity Fund | | Fund expenses (unaudited) |
As a shareholder of the Fund, you incur ongoing costs, including management fees, distribution (12b-1) fees, and other Fund expenses. This example is intended to help you understand your ongoing costs (in dollars) of investing in the Fund and to compare these costs with the ongoing costs of investing in other mutual funds.
The example is based on an investment of $1,000 invested at the beginning of the six-month period and held for the entire period from July 1, 2016 to December 31, 2016.
Actual expenses
The “Actual” line of the table below provides information about actual account values and actual expenses. You may use the information in this line, together with the amount you invested, to estimate the expenses that you paid over the period. Simply divide your account value by $1,000 (for example, an $8,600 account value divided by $1,000 = 8.6), then multiply the result by the number in the “Actual” line under the heading entitled “Expenses Paid During Period” for your applicable class of shares to estimate the expenses you paid on your account during this period.
Hypothetical example for comparison purposes
The “Hypothetical” line of the table below provides information about hypothetical account values and hypothetical expenses based on the Fund’s actual expense ratio and an assumed rate of return of 5% per year before expenses, which is not the Fund’s actual return. The hypothetical account values and expenses may not be used to estimate the actual ending account balance or expenses you paid for the period. You may use this information to compare the ongoing costs of investing in the Fund and other funds. To do so, compare this 5% hypothetical example with the 5% hypothetical examples that appear in the shareholder reports of the other funds.
Please note that the expenses shown in the table are meant to highlight your ongoing costs only and do not reflect any separate account charges assessed by participating insurance companies. Therefore, the “Hypothetical��� line of the table is useful in comparing ongoing costs only, and will not help you determine the relative total costs of owning different funds. In addition, if these separate account charges assessed by participating insurance companies were included, your costs would have been higher.
| | | | | | | | | | | | | | | | |
| | | Beginning
account value
7-1-2016 | | | Ending
account value
12-31-2016 | | | Expenses
paid during
the period¹ | | | Annualized net
expense ratio | |
Class 1 | | | | | | | | | | | | | | | | |
Actual | | $ | 1,000.00 | | | $ | 1,093.70 | | | $ | 3.95 | | | | 0.75 | % |
Hypothetical (5% return before expenses) | | $ | 1,000.00 | | | $ | 1,021.36 | | | $ | 3.81 | | | | 0.75 | % |
Class 2 | | | | | | | | | | | | | | | | |
Actual | | $ | 1,000.00 | | | $ | 1,092.20 | | | $ | 5.26 | | | | 1.00 | % |
Hypothetical (5% return before expenses) | | $ | 1,000.00 | | | $ | 1,020.11 | | | $ | 5.08 | | | | 1.00 | % |
| 1 | Expenses paid is equal to the annualized net expense ratio of each class multiplied by the average account value over the period, multiplied by the number of days in the most recent fiscal half-year divided by the number of days in the fiscal year (to reflect the one-half year period). |
| | | | | | |
| Portfolio of investments—December 31, 2016 | | Wells Fargo VT Opportunity Fund | | | 9 | |
| | | | | | | | | | | | | | | | |
| Security name | | | | | | | | Shares | | | Value | |
| | | | |
Common Stocks: 98.63% | | | | | | | | | | | | | | | | |
| | | | |
Consumer Discretionary: 11.75% | | | | | | | | | | | | | | | | |
| | | | |
| Hotels, Restaurants & Leisure: 2.98% | | | | | | | | | | | | | | | | |
Royal Caribbean Cruises Limited | | | | | | | | | | | 28,857 | | | $ | 2,367,428 | |
Starbucks Corporation | | | | | | | | | | | 60,378 | | | | 3,352,187 | |
| |
| | | | 5,719,615 | |
| | | | | | | | | | | | | | | | |
| | | | |
| Media: 3.55% | | | | | | | | | | | | | | | | |
Comcast Corporation Class A | | | | | | | | | | | 47,346 | | | | 3,269,241 | |
Twenty-First Century Fox Incorporated Class B | | | | | | | | | | | 129,692 | | | | 3,534,107 | |
| |
| | | | 6,803,348 | |
| | | | | | | | | | | | | | | | |
| | | | |
| Multiline Retail: 2.84% | | | | | | | | | | | | | | | | |
Dollar General Corporation | | | | | | | | | | | 41,472 | | | | 3,071,831 | |
Target Corporation | | | | | | | | | | | 32,951 | | | | 2,380,051 | |
| |
| | | | 5,451,882 | |
| | | | | | | | | | | | | | | | |
| | | | |
| Specialty Retail: 1.33% | | | | | | | | | | | | | | | | |
Lowe’s Companies Incorporated | | | | | | | | | | | 35,874 | | | | 2,551,359 | |
| | | | | | | | | | | | | | | | |
| | | | |
| Textiles, Apparel & Luxury Goods: 1.05% | | | | | | | | | | | | | | | | |
Ralph Lauren Corporation | | | | | | | | | | | 22,365 | | | | 2,020,007 | |
| | | | | | | | | | | | | | | | |
| | | | |
Consumer Staples: 6.20% | | | | | | | | | | | | | | | | |
| | | | |
| Food & Staples Retailing: 1.70% | | | | | | | | | | | | | | | | |
The Kroger Company | | | | | | | | | | | 94,192 | | | | 3,250,566 | |
| | | | | | | | | | | | | | | | |
| | | | |
| Food Products: 2.13% | | | | | | | | | | | | | | | | |
Mead Johnson Nutrition Company | | | | | | | | | | | 27,952 | | | | 1,977,884 | |
The Hershey Company | | | | | | | | | | | 20,417 | | | | 2,111,730 | |
| |
| | | | 4,089,614 | |
| | | | | | | | | | | | | | | | |
| | | | |
| Household Products: 1.03% | | | | | | | | | | | | | | | | |
Church & Dwight Company Incorporated | | | | | | | | | | | 44,650 | | | | 1,973,084 | |
| | | | | | | | | | | | | | | | |
| | | | |
| Personal Products: 1.34% | | | | | | | | | | | | | | | | |
The Estee Lauder Companies Incorporated Class A | | | | | | | | | | | 33,621 | | | | 2,571,670 | |
| | | | | | | | | | | | | | | | |
| | | | |
Energy: 8.75% | | | | | | | | | | | | | | | | |
| | | | |
| Energy Equipment & Services: 2.02% | | | | | | | | | | | | | | | | |
Halliburton Company | | | | | | | | | | | 47,183 | | | | 2,552,128 | |
Weatherford International plc † | | | | | | | | | | | 263,631 | | | | 1,315,519 | |
| |
| | | | 3,867,647 | |
| | | | | | | | | | | | | | | | |
| | | | |
| Oil, Gas & Consumable Fuels: 6.73% | | | | | | | | | | | | | | | | |
Concho Resources Incorporated † | | | | | | | | | | | 13,520 | | | | 1,792,751 | |
EOG Resources Incorporated | | | | | | | | | | | 28,489 | | | | 2,880,238 | |
Newfield Exploration Company † | | | | | | | | | | | 47,503 | | | | 1,923,872 | |
Pioneer Natural Resources Company | | | | | | | | | | | 13,187 | | | | 2,374,583 | |
The accompanying notes are an integral part of these financial statements.
| | | | |
| 10 | | Wells Fargo VT Opportunity Fund | | Portfolio of investments—December 31, 2016 |
| | | | | | | | | | | | | | | | |
| Security name | | | | | | | | Shares | | | Value | |
| | | | |
| Oil, Gas & Consumable Fuels (continued) | | | | | | | | | | | | | | | | |
Range Resources Corporation | | | | | | | | | | | 43,941 | | | $ | 1,509,813 | |
RSP Permian Incorporated † | | | | | | | | | | | 54,613 | | | | 2,436,832 | |
| |
| | | | 12,918,089 | |
| | | | | | | | | | | | | | | | |
| | | | |
Financials: 17.14% | | | | | | | | | | | | | | | | |
| | | | |
| Banks: 7.08% | | | | | | | | | | | | | | | | |
Bank of the Ozarks Incorporated | | | | | | | | | | | 48,113 | | | | 2,530,263 | |
KeyCorp | | | | | | | | | | | 171,224 | | | | 3,128,262 | |
PNC Financial Services Group Incorporated | | | | | | | | | | | 36,397 | | | | 4,256,993 | |
Webster Financial Corporation | | | | | | | | | | | 67,738 | | | | 3,676,819 | |
| |
| | | | 13,592,337 | |
| | | | | | | | | | | | | | | | |
| | | | |
| Capital Markets: 2.34% | | | | | | | | | | | | | | | | |
E*TRADE Financial Corporation † | | | | | | | | | | | 46,917 | | | | 1,625,674 | |
TD Ameritrade Holding Corporation | | | | | | | | | | | 65,554 | | | | 2,858,154 | |
| |
| | | | 4,483,828 | |
| | | | | | | | | | | | | | | | |
| | | | |
| Insurance: 7.72% | | | | | | | | | | | | | | | | |
American International Group Incorporated | | | | | | | | | | | 57,353 | | | | 3,745,724 | |
Aon plc | | | | | | | | | | | 24,151 | | | | 2,693,561 | |
Chubb Limited | | | | | | | | | | | 26,252 | | | | 3,468,414 | |
The Progressive Corporation | | | | | | | | | | | 75,563 | | | | 2,682,487 | |
Willis Towers Watson plc | | | | | | | | | | | 18,102 | | | | 2,213,513 | |
| |
| | | | 14,803,699 | |
| | | | | | | | | | | | | | | | |
| | | | |
Health Care: 12.67% | | | | | | | | | | | | | | | | |
| | | | |
| Biotechnology: 0.44% | | | | | | | | | | | | | | | | |
Alexion Pharmaceuticals Incorporated † | | | | | | | | | | | 6,829 | | | | 835,528 | |
| | | | | | | | | | | | | | | | |
| | | | |
| Health Care Equipment & Supplies: 2.47% | | | | | | | | | | | | | | | | |
Medtronic plc | | | | | | | | | | | 44,950 | | | | 3,201,789 | |
Zimmer Biomet Holdings Incorporated | | | | | | | | | | | 14,970 | | | | 1,544,904 | |
| |
| | | | 4,746,693 | |
| | | | | | | | | | | | | | | | |
| | | | |
| Health Care Providers & Services: 1.98% | | | | | | | | | | | | | | | | |
Cigna Corporation | | | | | | | | | | | 17,552 | | | | 2,341,261 | |
Patterson Companies Incorporated « | | | | | | | | | | | 35,560 | | | | 1,459,027 | |
| |
| | | | 3,800,288 | |
| | | | | | | | | | | | | | | | |
| | | | |
| Life Sciences Tools & Services: 4.91% | | | | | | | | | | | | | | | | |
Agilent Technologies Incorporated | | | | | | | | | | | 57,414 | | | | 2,615,782 | |
Bio-Rad Laboratories Incorporated Class A † | | | | | | | | | | | 23,067 | | | | 4,204,653 | |
Thermo Fisher Scientific Incorporated | | | | | | | | | | | 18,389 | | | | 2,594,688 | |
| |
| | | | 9,415,123 | |
| | | | | | | | | | | | | | | | |
| | | | |
| Pharmaceuticals: 2.87% | | | | | | | | | | | | | | | | |
Merck & Company Incorporated | | | | | | | | | | | 51,820 | | | | 3,050,643 | |
Novartis AG ADR | | | | | | | | | | | 33,657 | | | | 2,451,576 | |
| |
| | | | 5,502,219 | |
| | | | | | | | | | | | | | | | |
The accompanying notes are an integral part of these financial statements.
| | | | | | |
| Portfolio of investments—December 31, 2016 | | Wells Fargo VT Opportunity Fund | | | 11 | |
| | | | | | | | | | | | | | | | |
| Security name | | | | | | | | Shares | | | Value | |
| | | | |
Industrials: 14.01% | | | | | | | | | | | | | | | | |
| | | | |
| Aerospace & Defense: 2.02% | | | | | | | | | | | | | | | | |
BWX Technologies Incorporated | | | | | | | | | | | 48,533 | | | $ | 1,926,760 | |
Lockheed Martin Corporation | | | | | | | | | | | 7,799 | | | | 1,949,282 | |
| |
| | | | 3,876,042 | |
| | | | | | | | | | | | | | | | |
| | | | |
| Airlines: 1.47% | | | | | | | | | | | | | | | | |
United Continental Holdings Incorporated † | | | | | | | | | | | 38,826 | | | | 2,829,639 | |
| | | | | | | | | | | | | | | | |
| | | | |
| Building Products: 2.70% | | | | | | | | | | | | | | | | |
Johnson Controls International plc | | | | | | | | | | | 125,621 | | | | 5,174,329 | |
| | | | | | | | | | | | | | | | |
| | | | |
| Commercial Services & Supplies: 1.59% | | | | | | | | | | | | | | | | |
Republic Services Incorporated | | | | | | | | | | | 53,544 | | | | 3,054,685 | |
| | | | | | | | | | | | | | | | |
| | | | |
| Electrical Equipment: 2.51% | | | | | | | | | | | | | | | | |
Babcock & Wilcox Enterprises Incorporated † | | | | | | | | | | | 108,413 | | | | 1,798,572 | |
Eaton Corporation plc | | | | | | | | | | | 44,976 | | | | 3,017,440 | |
| |
| | | | 4,816,012 | |
| | | | | | | | | | | | | | | | |
| | | | |
| Machinery: 1.28% | | | | | | | | | | | | | | | | |
Colfax Corporation † | | | | | | | | | | | 68,196 | | | | 2,450,282 | |
| | | | | | | | | | | | | | | | |
| | | | |
| Road & Rail: 2.44% | | | | | | | | | | | | | | | | |
Canadian Pacific Railway Limited | | | | | | | | | | | 7,737 | | | | 1,104,611 | |
Hertz Global Holdings Incorporated | | | | | | | | | | | 53,307 | | | | 1,149,299 | |
J.B. Hunt Transport Services Incorporated | | | | | | | | | | | 24,922 | | | | 2,419,179 | |
| |
| | | | 4,673,089 | |
| | | | | | | | | | | | | | | | |
| | | | |
Information Technology: 22.88% | | | | | | | | | | | | | | | | |
| | | | |
| Electronic Equipment, Instruments & Components: 3.04% | | | | | | | | | | | | | | | | |
Amphenol Corporation Class A | | | | | | | | | | | 39,384 | | | | 2,646,605 | |
TE Connectivity Limited | | | | | | | | | | | 45,992 | | | | 3,186,326 | |
| |
| | | | 5,832,931 | |
| | | | | | | | | | | | | | | | |
| | | | |
| Internet Software & Services: 3.83% | | | | | | | | | | | | | | | | |
Alphabet Incorporated Class C † | | | | | | | | | | | 6,388 | | | | 4,930,386 | |
Facebook Incorporated Class A † | | | | | | | | | | | 21,088 | | | | 2,426,174 | |
| |
| | | | 7,356,560 | |
| | | | | | | | | | | | | | | | |
| | | | |
| IT Services: 4.50% | | | | | | | | | | | | | | | | |
Alliance Data Systems Corporation | | | | | | | | | | | 11,514 | | | | 2,630,949 | |
Fidelity National Information Services Incorporated | | | | | | | | | | | 35,981 | | | | 2,721,603 | |
MasterCard Incorporated Class A | | | | | | | | | | | 31,683 | | | | 3,271,270 | |
| |
| | | | 8,623,822 | |
| | | | | | | | | | | | | | | | |
| | | | |
| Semiconductors & Semiconductor Equipment: 2.97% | | | | | | | | | | | | | | | | |
Broadcom Limited | | | | | | | | | | | 17,063 | | | | 3,016,227 | |
Texas Instruments Incorporated | | | | | | | | | | | 36,751 | | | | 2,681,720 | |
| |
| | | | 5,697,947 | |
| | | | | | | | | | | | | | | | |
The accompanying notes are an integral part of these financial statements.
| | | | |
| 12 | | Wells Fargo VT Opportunity Fund | | Portfolio of investments—December 31, 2016 |
| | | | | | | | | | | | | | | | |
| Security name | | | | | | | | Shares | | | Value | |
| | | | |
| Software: 5.65% | | | | | | | | | | | | | | | | |
Check Point Software Technologies Limited † | | | | | | | | | | | 29,802 | | | $ | 2,517,077 | |
Oracle Corporation | | | | | | | | | | | 67,344 | | | | 2,589,377 | |
Red Hat Incorporated † | | | | | | | | | | | 40,965 | | | | 2,855,261 | |
Salesforce.com Incorporated † | | | | | | | | | | | 41,940 | | | | 2,871,212 | |
| |
| | | | 10,832,927 | |
| | | | | | | | | | | | | | | | |
| | | | |
| Technology Hardware, Storage & Peripherals: 2.89% | | | | | | | | | | | | | | | | |
Apple Incorporated | | | | | | | | | | | 47,954 | | | | 5,554,030 | |
| | | | | | | | | | | | | | | | |
| | | | |
Materials: 3.73% | | | | | | | | | | | | | | | | |
| | | | |
| Chemicals: 1.54% | | | | | | | | | | | | | | | | |
The Sherwin-Williams Company | | | | | | | | | | | 10,984 | | | | 2,951,840 | |
| | | | | | | | | | | | | | | | |
| | | | |
| Containers & Packaging: 1.12% | | | | | | | | | | | | | | | | |
Crown Holdings Incorporated † | | | | | | | | | | | 40,961 | | | | 2,153,320 | |
| | | | | | | | | | | | | | | | |
| | | | |
| Metals & Mining: 1.07% | | | | | | | | | | | | | | | | |
Steel Dynamics Incorporated | | | | | | | | | | | 57,418 | | | | 2,042,932 | |
| | | | | | | | | | | | | | | | |
| | | | |
Real Estate: 1.50% | | | | | | | | | | | | | | | | |
| | | | |
| Equity REITs: 1.50% | | | | | | | | | | | | | | | | |
American Tower Corporation | | | | | | | | | | | 27,192 | | | | 2,873,652 | |
| | | | | | | | | | | | | | | | |
| |
Total Common Stocks (Cost $154,562,292) | | | | 189,190,635 | |
| | | | | | | | | | | | | | | | |
| | | | |
| | | Yield | | | | | | | | | | |
| Short-Term Investments: 2.62% | | | | | | | | | | | | | | | | |
| | | | |
| Investment Companies: 2.62% | | | | | | | | | | | | | | | | |
Securities Lending Cash Investment LLC (l)(r)(u) | | | 0.83 | % | | | | | | | 1,415,259 | | | | 1,415,400 | |
Wells Fargo Government Money Market Fund Select Class (l)(u) | | | 0.43 | | | | | | | | 3,604,061 | | | | 3,604,061 | |
| |
Total Short-Term Investments (Cost $5,019,461) | | | | 5,019,461 | |
| | | | | | | | | | | | | | | | |
| | | | | | | | |
| Total investments in securities (Cost $159,581,753) * | | | 101.25 | % | | | 194,210,096 | |
Other assets and liabilities, net | | | (1.25 | ) | | | (2,391,831 | ) |
| | | | | | | | |
| Total net assets | | | 100.00 | % | | $ | 191,818,265 | |
| | | | | | | | |
| † | Non-income-earning security |
| « | All or a portion of this security is on loan. |
| (l) | The issuer of the security is an affiliated person of the Fund as defined in the Investment Company Act of 1940. |
| (r) | The investment is a non-registered investment vehicle purchased with cash collateral received from securities on loan. |
| (u) | The rate represents the 7-day annualized yield at period end. |
| * | Cost for federal income tax purposes is $160,540,343 and unrealized gains (losses) consists of: |
| | | | |
Gross unrealized gains | | $ | 39,660,094 | |
Gross unrealized losses | | | (5,990,341 | ) |
| | | | |
Net unrealized gains | | $ | 33,669,753 | |
The accompanying notes are an integral part of these financial statements.
| | | | | | |
| Statement of assets and liabilities—December 31, 2016 | | Wells Fargo VT Opportunity Fund | | | 13 | |
| | | | |
| | | | |
| |
Assets | | | | |
Investments | | | | |
In unaffiliated securities (including $1,382,711 of securities loaned), at value (cost $154,562,292) | | $ | 189,190,635 | |
In affiliated securities, at value (cost $5,019,461) | | | 5,019,461 | |
| | | | |
Total investments, at value (cost $159,581,753) | | | 194,210,096 | |
Receivable for investments sold | | | 1,510,833 | |
Receivable for Fund shares sold | | | 73,565 | |
Receivable for dividends | | | 235,960 | |
Receivable for securities lending income | | | 259 | |
Prepaid expenses and other assets | | | 3,074 | |
| | | | |
Total assets | | | 196,033,787 | |
| | | | |
| |
Liabilities | | | | |
Payable for investments purchased | | | 2,368,602 | |
Payable for Fund shares redeemed | | | 259,200 | |
Payable upon receipt of securities loaned | | | 1,415,400 | |
Management fee payable | | | 103,876 | |
Distribution fee payable | | | 36,385 | |
Administration fees payable | | | 14,064 | |
Accrued expenses and other liabilities | | | 17,995 | |
| | | | |
Total liabilities | | | 4,215,522 | |
| | | | |
Total net assets | | $ | 191,818,265 | |
| | | | |
| |
NET ASSETS CONSIST OF | | | | |
Paid-in capital | | $ | 140,991,720 | |
Undistributed net investment income | | | 1,388,525 | |
Accumulated net realized gains on investments | | | 14,809,654 | |
Net unrealized gains on investments | | | 34,628,366 | |
| | | | |
Total net assets | | $ | 191,818,265 | |
| | | | |
| |
COMPUTATION OF NET ASSET VALUE PER SHARE | | | | |
Net assets – Class 1 | | $ | 33,035,040 | |
Shares outstanding – Class 11 | | | 1,342,923 | |
Net asset value per share – Class 1 | | | $24.60 | |
Net assets – Class 2 | | $ | 158,783,225 | |
Shares outstanding – Class 21 | | | 6,435,599 | |
Net asset value per share – Class 2 | | | $24.67 | |
| 1 | The Fund has an unlimited number of authorized shares. |
The accompanying notes are an integral part of these financial statements.
| | | | |
| 14 | | Wells Fargo VT Opportunity Fund | | Statement of operations—year ended December 31, 2016 |
| | | | |
| | | | |
| |
Investment income | | | | |
Dividends (net of foreign withholding taxes of $14,869) | | $ | 2,669,829 | |
Securities lending income, net | | | 27,601 | |
Income from affiliated securities | | | 7,093 | |
| | | | |
Total investment income | | | 2,704,523 | |
| | | | |
| |
Expenses | | | | |
Management fee | | | 1,361,030 | |
Administration fees | | | | |
Class 1 | | | 26,411 | |
Class 2 | | | 129,135 | |
Distribution fee | | | | |
Class 2 | | | 403,547 | |
Custody and accounting fees | | | 21,008 | |
Professional fees | | | 46,486 | |
Shareholder report expenses | | | 31,234 | |
Trustees’ fees and expenses | | | 21,831 | |
Interest expense | | | 260 | |
Other fees and expenses | | | 6,333 | |
| | | | |
Total expenses | | | 2,047,275 | |
Less: Fee waivers and/or expense reimbursements | | | (185,222 | ) |
| | | | |
Net expenses | | | 1,862,053 | |
| | | | |
Net investment income | | | 842,470 | |
| | | | |
| |
REALIZED AND UNREALIZED GAINS (LOSSES) ON INVESTMENTS | | | | |
| |
Net realized gains on: | | | | |
Unaffiliated securities | | | 16,133,317 | |
Affiliated securities | | | 185 | |
| | | | |
Net realized gains on investments | | | 16,133,502 | |
Net change in unrealized gains (losses) on investments | | | 5,589,001 | |
| | | | |
Net realized and unrealized gains (losses) on investments | | | 21,722,503 | |
| | | | |
Net increase in net assets resulting from operations | | $ | 22,564,973 | |
| | | | |
The accompanying notes are an integral part of these financial statements.
| | | | | | |
| Statement of changes in net assets | | Wells Fargo VT Opportunity Fund | | | 15 | |
| | | | | | | | | | | | | | | | |
| | | Year ended December 31, 2016 | | | Year ended December 31, 2015 | |
| | | |
Operations | | | | | | | | | | | | |
Net investment income | | | | | | $ | 842,470 | | | | | | | $ | 4,169,899 | |
Net realized gains on investments | | | | | | | 16,133,502 | | | | | | | | 19,932,472 | |
Net change in unrealized gains (losses) on investments | | | | | | | 5,589,001 | | | | | | | | (27,908,779 | ) |
| | | | |
Net increase (decrease) in net assets resulting from operations | | | | | | | 22,564,973 | | | | | | | | (3,806,408 | ) |
| | | | |
| | | |
Distributions to shareholders from | | | | | | | | | | | | |
Net investment income | | | | | | | | | | | | | | | | |
Class 1 | | | | | | | (757,684 | ) | | | | | | | (155,286 | ) |
Class 2 | | | | | | | (3,341,814 | ) | | | | | | | (243,668 | ) |
Net realized gains | | | | | | | | | | | | | | | | |
Class 1 | | | | | | | (3,290,345 | ) | | | | | | | (3,986,797 | ) |
Class 2 | | | | | | | (16,591,308 | ) | | | | | | | (19,507,701 | ) |
| | | | |
Total distributions to shareholders | | | | | | | (23,981,151 | ) | | | | | | | (23,893,452 | ) |
| | | | |
| | | | |
Capital share transactions | | | Shares | | | | | | | | Shares | | | | | |
Proceeds from shares sold | | | | | | | | | | | | | | | | |
Class 1 | | | 30,809 | | | | 753,075 | | | | 77,816 | | | | 1,613,192 | |
Class 2 | | | 154,196 | | | | 3,770,003 | | | | 261,064 | | | | 5,454,558 | |
| | | | |
| | | | | | | 4,523,078 | | | | | | | | 7,067,750 | |
| | | | |
Reinvestment of distributions | | | | | | | | | | | | | | | | |
Class 1 | | | 180,958 | | | | 4,048,029 | | | | 159,926 | | | | 4,142,083 | |
Class 2 | | | 887,494 | | | | 19,933,122 | | | | 760,253 | | | | 19,751,369 | |
| | | | |
| | | | | | | 23,981,151 | | | | | | | | 23,893,452 | |
| | | | |
Payment for shares redeemed | | | | | | | | | | | | | | | | |
Class 1 | | | (290,336 | ) | | | (7,094,764 | ) | | | (279,846 | ) | | | (7,750,062 | ) |
Class 2 | | | (1,355,584 | ) | | | (32,803,808 | ) | | | (1,248,271 | ) | | | (34,407,074 | ) |
| | | | |
| | | | | | | (39,898,572 | ) | | | | | | | (42,157,136 | ) |
| | | | |
Net decrease in net assets resulting from capital share transactions | | | | | | | (11,394,343 | ) | | | | | | | (11,195,934 | ) |
| | | | |
Total decrease in net assets | | | | | | | (12,810,521 | ) | | | | | | | (38,895,794 | ) |
| | | | |
| | |
Net assets | | | | | | | | |
Beginning of period | | | | | | | 204,628,786 | | | | | | | | 243,524,580 | |
| | | | |
End of period | | | | | | $ | 191,818,265 | | | | | | | $ | 204,628,786 | |
| | | | |
Undistributed net investment income | | | | | | $ | 1,388,525 | | | | | | | $ | 4,092,930 | |
| | | | |
The accompanying notes are an integral part of these financial statements.
| | | | |
| 16 | | Wells Fargo VT Opportunity Fund | | Financial highlights |
(For a share outstanding throughout each period)
| | | | | | | | | | | | | | | | | | | | |
| | | Year ended December 31 | |
| CLASS 1 | | 2016 | | | 2015 | | | 2014 | | | 2013 | | | 2012 | |
Net asset value, beginning of period | | | $25.00 | | | | $28.82 | | | | $26.11 | | | | $20.02 | | | | $17.40 | |
Net investment income | | | 0.22 | | | | 0.57 | | | | 0.10 | | | | 0.08 | | | | 0.10 | |
Net realized and unrealized gains (losses) on investments | | | 2.59 | | | | (1.28 | ) | | | 2.69 | | | | 6.11 | | | | 2.64 | |
| | | | | | | | | | | | | | | | | | | | |
Total from investment operations | | | 2.81 | | | | (0.71 | ) | | | 2.79 | | | | 6.19 | | | | 2.74 | |
Distributions to shareholders from | | | | | | | | | | | | | | | | | | | | |
Net investment income | | | (0.60 | ) | | | (0.12 | ) | | | (0.08 | ) | | | (0.10 | ) | | | (0.11 | ) |
Net realized gains | | | (2.61 | ) | | | (2.99 | ) | | | 0.00 | | | | 0.00 | | | | (0.01 | ) |
| | | | | | | | | | | | | | | | | | | | |
Total distributions to shareholders | | | (3.21 | ) | | | (3.11 | ) | | | (0.08 | ) | | | (0.10 | ) | | | (0.12 | ) |
Net asset value, end of period | | | $24.60 | | | | $25.00 | | | | $28.82 | | | | $26.11 | | | | $20.02 | |
Total return | | | 12.52 | % | | | (2.85 | )% | | | 10.70 | % | | | 30.99 | % | | | 15.80 | % |
Ratios to average net assets (annualized) | | | | | | | | | | | | | | | | | | | | |
Gross expenses | | | 0.85 | % | | | 0.84 | % | | | 0.82 | % | | | 0.84 | % | | | 0.86 | % |
Net expenses | | | 0.75 | % | | | 0.75 | % | | | 0.75 | % | | | 0.75 | % | | | 0.75 | % |
Net investment income | | | 0.65 | % | | | 2.02 | % | | | 0.37 | % | | | 0.32 | % | | | 0.46 | % |
Supplemental data | | | | | | | | | | | | | | | | | | | | |
Portfolio turnover rate | | | 47 | % | | | 41 | % | | | 33 | % | | | 26 | % | | | 36 | % |
Net assets, end of period (000s omitted) | | | $33,035 | | | | $35,539 | | | | $42,178 | | | | $44,636 | | | | $40,950 | |
The accompanying notes are an integral part of these financial statements.
| | | | | | |
| Financial highlights | | Wells Fargo VT Opportunity Fund | | | 17 | |
(For a share outstanding throughout each period)
| | | | | | | | | | | | | | | | | | | | |
| | | Year ended December 31 | |
| CLASS 2 | | 2016 | | | 2015 | | | 2014 | | | 2013 | | | 2012 | |
Net asset value, beginning of period | | | $25.05 | | | | $28.86 | | | | $26.15 | | | | $20.05 | | | | $17.38 | |
Net investment income | | | 0.13 | | | | 0.50 | | | | 0.04 | | | | 0.02 | | | | 0.05 | |
Net realized and unrealized gains (losses) on investments | | | 2.63 | | | | (1.28 | ) | | | 2.69 | | | | 6.13 | | | | 2.65 | |
| | | | | | | | | | | | | | | | | | | | |
Total from investment operations | | | 2.76 | | | | (0.78 | ) | | | 2.73 | | | | 6.15 | | | | 2.70 | |
Distributions to shareholders from | | | | | | | | | | | | | | | | | | | | |
Net investment income | | | (0.53 | ) | | | (0.04 | ) | | | (0.02 | ) | | | (0.05 | ) | | | (0.02 | ) |
Net realized gains | | | (2.61 | ) | | | (2.99 | ) | | | 0.00 | | | | 0.00 | | | | (0.01 | ) |
| | | | | | | | | | | | | | | | | | | | |
Total distributions to shareholders | | | (3.14 | ) | | | (3.03 | ) | | | (0.02 | ) | | | (0.05 | ) | | | (0.03 | ) |
Net asset value, end of period | | | $24.67 | | | | $25.05 | | | | $28.86 | | | | $26.15 | | | | $20.05 | |
Total return | | | 12.23 | % | | | (3.08 | )% | | | 10.42 | % | | | 30.68 | % | | | 15.52 | % |
Ratios to average net assets (annualized) | | | | | | | | | | | | | | | | | | | | |
Gross expenses | | | 1.10 | % | | | 1.09 | % | | | 1.07 | % | | | 1.09 | % | | | 1.10 | % |
Net expenses | | | 1.00 | % | | | 1.00 | % | | | 1.00 | % | | | 1.00 | % | | | 1.00 | % |
Net investment income | | | 0.39 | % | | | 1.76 | % | | | 0.12 | % | | | 0.07 | % | | | 0.21 | % |
Supplemental data | | | | | | | | | | | | | | | | | | | | |
Portfolio turnover rate | | | 47 | % | | | 41 | % | | | 33 | % | | | 26 | % | | | 36 | % |
Net assets, end of period (000s omitted) | | | $158,783 | | | | $169,090 | | | | $201,347 | | | | $211,077 | | | | $188,313 | |
The accompanying notes are an integral part of these financial statements.
| | | | |
| 18 | | Wells Fargo VT Opportunity Fund | | Notes to financial statements |
1. ORGANIZATION
Wells Fargo Variable Trust (the “Trust”), a Delaware statutory trust organized on March 10, 1999, is an open-end management investment company registered under the Investment Company Act of 1940, as amended (the “1940 Act”). As an investment company, the Trust follows the accounting and reporting guidance in Financial Accounting Standards Board (“FASB”) Accounting Standards Codification Topic 946, Financial Services – Investment Companies. These financial statements report on the Wells Fargo VT Opportunity Fund (the “Fund”) which is a diversified series of the Trust.
2. SIGNIFICANT ACCOUNTING POLICIES
The following significant accounting policies, which are consistently followed in the preparation of the financial statements of the Fund, are in conformity with U.S. generally accepted accounting principles which require management to make estimates and assumptions that affect the reported amounts of assets and liabilities, disclosure of contingent assets and liabilities at the date of the financial statements, and the reported amounts of revenues and expenses during the reporting period. Actual results could differ from those estimates.
Securities valuation
All investments are valued each business day as of the close of regular trading on the New York Stock Exchange (generally 4 p.m. Eastern Time), although the Fund may deviate from this calculation time under unusual or unexpected circumstances.
Equity securities that are listed on a foreign or domestic exchange or market are valued at the official closing price or, if none, the last sales price. If no sale occurs on the principal exchange or market that day, the prior day’s price will be deemed “stale” and a fair value price will be determined in accordance with the Fund’s Valuation Procedures.
The values of securities denominated in foreign currencies are translated into U.S. dollars at rates provided by an independent foreign currency pricing source at a time each business day specified by the Management Valuation Team of Wells Fargo Funds Management, LLC (“Funds Management”).
Many securities markets and exchanges outside the U.S. close prior to the close of the New York Stock Exchange and therefore may not fully reflect trading or events that occur after the close of the principal exchange in which the foreign securities are traded, but before the close of the New York Stock Exchange. If such trading or events are expected to materially affect the value of such securities, then fair value pricing procedures approved by the Board of Trustees of the Fund are applied. These procedures take into account multiple factors including movements in U.S. securities markets after foreign exchanges close. Foreign securities that are fair valued under these procedures are categorized as Level 2 and the application of these procedures may result in transfers between Level 1 and Level 2. Depending on market activity, such fair valuations may be frequent. Such fair value pricing may result in net asset values that are higher or lower than net asset values based on the last reported sales price or latest quoted bid price. On December 31, 2016, such fair value pricing was not used in pricing foreign securities.
Investments in registered open-end investment companies are valued at net asset value. Interests in non-registered investment vehicles that are redeemable at net asset value are fair valued normally at net asset value.
Investments which are not valued using any of the methods discussed above are valued at their fair value, as determined in good faith by the Board of Trustees. The Board of Trustees has established a Valuation Committee comprised of the Trustees and has delegated to it the authority to take any actions regarding the valuation of portfolio securities that the Valuation Committee deems necessary or appropriate, including determining the fair value of portfolio securities, unless the determination has been delegated to the Management Valuation Team. The Board of Trustees retains the authority to make or ratify any valuation decisions or approve any changes to the Valuation Procedures as it deems appropriate. On a quarterly basis, the Board of Trustees receives reports on any valuation actions taken by the Valuation Committee or the Management Valuation Team which may include items for ratification.
Valuations of fair valued securities are compared to the next actual sales price when available, or other appropriate market values, to assess the continued appropriateness of the fair valuation methodologies used. These securities are fair valued on a day-to-day basis, taking into consideration changes to appropriate market information and any significant changes to the inputs considered in the valuation process until there is a readily available price provided on an exchange or by an independent pricing service. Valuations received from an independent pricing service or independent broker-dealer quotes are periodically validated by comparisons to most recent trades and valuations provided by other independent pricing services in addition to the review of prices by the manager and/or subadviser. Unobservable inputs used in determining fair valuations are identified based on the type of security, taking into consideration factors utilized by market participants in valuing the investment, knowledge about the issuer and the current market environment.
| | | | | | |
| Notes to financial statements | | Wells Fargo VT Opportunity Fund | | | 19 | |
Foreign currency translation
The accounting records of the Fund are maintained in U.S. dollars. The values of other assets and liabilities denominated in foreign currencies are translated into U.S. dollars at rates provided by an independent foreign currency pricing source at a time each business day specified by the Management Valuation Team. Purchases and sales of securities, and income and expenses are converted at the rate of exchange on the respective dates of such transactions. Net realized foreign exchange gains or losses arise from sales of foreign currencies, currency gains or losses realized between the trade and settlement dates on securities transactions, and the difference between the amounts of dividends, interest and foreign withholding taxes recorded and the U.S. dollar equivalent of the amounts actually paid or received. Net unrealized foreign exchange gains and losses arise from changes in the fair value of assets and liabilities other than investments in securities resulting from changes in exchange rates. The changes in net assets arising from changes in exchange rates and the changes in net assets resulting from changes in market prices of securities are not separately presented. Such changes are included in net realized and unrealized gains or losses from investments.
Security loans
The Fund may lend its securities from time to time in order to earn additional income in the form of fees or interest on securities received as collateral or the investment of any cash received as collateral. The Fund continues to receive interest or dividends on the securities loaned. The Fund receives collateral in the form of cash or securities with a value at least equal to the value of the securities on loan. The value of the loaned securities is determined at the close of each business day and any additional required collateral is delivered to the Fund on the next business day. In a securities lending transaction, the net asset value of the Fund will be affected by an increase or decrease in the value of the securities loaned and by an increase or decrease in the value of the instrument in which collateral is invested. The amount of securities lending activity undertaken by the Fund fluctuates from time to time. In the event of default or bankruptcy by the borrower, the Fund may be prevented from recovering the loaned securities or gaining access to the collateral or may experience delays or costs in doing so. In addition, the investment of any cash collateral received may lose all or part of its value. The Fund has the right under the lending agreement to recover the securities from the borrower on demand.
The Fund lends its securities through an unaffiliated securities lending agent. Cash collateral received in connection with its securities lending transactions is invested in Securities Lending Cash Investments, LLC (the “Securities Lending Fund”). The Securities Lending Fund is exempt from registration under Section 3(c)(7) of the 1940 Act and is managed by Funds Management and is subadvised by Wells Capital Management Incorporated (“WellsCap”), an affiliate of Funds Management and an indirect wholly owned subsidiary of Wells Fargo & Company (“Wells Fargo”). Funds Management receives an advisory fee starting at 0.05% and declining to 0.01% as the average daily net assets of the Securities Lending Fund increase. All of the fees received by Funds Management are paid to WellsCap for its services as subadviser. The Securities Lending Fund seeks to provide a positive return compared to the daily Fed Funds Open Rate by investing in high-quality, U.S. dollar-denominated short-term money market instruments. Securities Lending Fund investments are valued at the evaluated bid price provided by an independent pricing service. Income earned from investment in the Securities Lending Fund is included in securities lending income on the Statement of Operations.
Security transactions and income recognition
Securities transactions are recorded on a trade date basis. Realized gains or losses are recorded on the basis of identified cost.
Dividend income is recognized on the ex-dividend date, except for certain dividends from foreign securities, which are recorded as soon as the custodian verifies the ex-dividend date. Dividend income from foreign securities is recorded net of foreign taxes withheld where recovery of such taxes is not assured.
Distributions to shareholders
Distributions to shareholders from net investment income and net realized gains, if any, are recorded on the ex-dividend date. Such distributions are determined in conformity with federal income tax regulations, which may differ in amount or character from net investment income and realized gains recognized for purposes of U.S. generally accepted accounting principles.
Federal and other taxes
The Fund intends to continue to qualify as a regulated investment company by distributing substantially all of its investment company taxable income and any net realized capital gains (after reduction for capital loss carryforwards) sufficient to relieve it from all, or substantially all, federal income taxes. Accordingly, no provision for federal income taxes was required.
| | | | |
| 20 | | Wells Fargo VT Opportunity Fund | | Notes to financial statements |
The Fund’s income and federal excise tax returns and all financial records supporting those returns for the prior three fiscal years are subject to examination by the federal and Delaware revenue authorities. Management has analyzed the Fund’s tax positions taken on federal, state, and foreign tax returns for all open tax years and does not believe that there are any uncertain tax positions that require recognition of a tax liability.
Reclassifications are made to the Fund’s capital accounts for permanent tax differences to reflect income and gains available for distribution (or available capital loss carryforwards) under federal income tax regulations. U.S. generally accepted accounting principles require that certain components of net assets be adjusted to reflect permanent differences between financial and tax reporting. These reclassifications have no effect on net assets or net asset values per share. The primary permanent difference causing such reclassifications is due to corporate action. At December 31, 2016, as a result of permanent book-to-tax differences, the following reclassification adjustments were made on the Statement of Assets and Liabilities:
| | |
Undistributed net
investment income | | Accumulated net
realized gains
on investments |
| $552,623 | | $(552,623) |
Class allocations
The separate classes of shares offered by the Fund differ principally in distribution fees. Class specific expenses are charged directly to that share class. Investment income, common expenses and realized and unrealized gains (losses) on investments are allocated daily to each class of shares based on the relative proportion of net assets of each class.
3. FAIR VALUATION MEASUREMENTS
Fair value measurements of investments are determined within a framework that has established a fair value hierarchy based upon the various data inputs utilized in determining the value of the Fund’s investments. The three-level hierarchy gives the highest priority to unadjusted quoted prices in active markets for identical assets or liabilities (Level 1) and the lowest priority to significant unobservable inputs (Level 3). The Fund’s investments are classified within the fair value hierarchy based on the lowest level of input that is significant to the fair value measurement. The inputs are summarized into three broad levels as follows:
| ∎ | | Level 1 – quoted prices in active markets for identical securities |
| ∎ | | Level 2 – other significant observable inputs (including quoted prices for similar securities, interest rates, prepayment speeds, credit risk, use of amortized cost, etc.) |
| ∎ | | Level 3 – significant unobservable inputs (including the Fund’s own assumptions in determining the fair value of investments) |
The inputs or methodologies used for valuing investments in securities are not necessarily an indication of the risk associated with investing in those securities.
| | | | | | |
| Notes to financial statements | | Wells Fargo VT Opportunity Fund | | | 21 | |
The following is a summary of the inputs used in valuing the Fund’s assets and liabilities as of December 31, 2016:
| | | | | | | | | | | | | | | | |
| | | Quoted prices
(Level 1) | | | Other significant
observable inputs
(Level 2) | | | Significant
unobservable inputs (Level 3) | | | Total | |
Assets | | | | | | | | | | | | | | | | |
Investments in: | | | | | | | | | | | | | | | | |
| | | | |
Common stocks | | | | | | | | | | | | | | | | |
Consumer discretionary | | $ | 22,546,211 | | | $ | 0 | | | $ | 0 | | | $ | 22,546,211 | |
Consumer staples | | | 11,884,934 | | | | 0 | | | | 0 | | | | 11,884,934 | |
Energy | | | 16,785,736 | | | | 0 | | | | 0 | | | | 16,785,736 | |
Financials | | | 32,879,864 | | | | 0 | | | | 0 | | | | 32,879,864 | |
Health care | | | 24,299,851 | | | | 0 | | | | 0 | | | | 24,299,851 | |
Industrials | | | 26,874,078 | | | | 0 | | | | 0 | | | | 26,874,078 | |
Information technology | | | 43,898,217 | | | | 0 | | | | 0 | | | | 43,898,217 | |
Materials | | | 7,148,092 | | | | 0 | | | | 0 | | | | 7,148,092 | |
Real estate | | | 2,873,652 | | | | 0 | | | | 0 | | | | 2,873,652 | |
| | | | |
Short-term investments | | | | | | | | | | | | | | | | |
Investment companies | | | 3,604,061 | | | | 0 | | | | 0 | | | | 3,604,061 | |
Investments measured at net asset value* | | | | | | | | | | | | | | | 1,415,400 | |
Total assets | | $ | 192,794,696 | | | $ | 0 | | | $ | 0 | | | $ | 194,210,096 | |
| * | Investments that are measured at fair value using the net asset value per share (or its equivalent) as a practical expedient have not been categorized in the fair value hierarchy. The fair value amount presented in the table is intended to permit reconciliation of the fair value hierarchy to the amounts presented in the Statement of Assets and Liabilities. The Fund’s investment in Securities Lending Cash Investments, LLC valued at $1,415,400 does not have a redemption period notice, can be redeemed daily and does not have any unfunded commitments. |
The Fund recognizes transfers between levels within the fair value hierarchy at the end of the reporting period. At December 31, 2016, the Fund did not have any transfers into/out of Level 1, Level 2, or Level 3.
4. TRANSACTIONS WITH AFFILIATES AND OTHER EXPENSES
Management fee
Funds Management, an indirect wholly owned subsidiary of Wells Fargo, is the manager of the Fund and provides advisory and fund-level administrative services under an investment management agreement. Under the investment management agreement, Funds Management is responsible for, among other services, implementing the investment objectives and strategies of the Fund, supervising the subadviser, providing fund-level administrative services in connection with the Fund’s operations, and providing any other fund-level administrative services reasonably necessary for the operation of the Fund. As compensation for its services under the investment management agreement, Funds Management is entitled to receive an annual management fee starting at 0.70% and declining to 0.58% as the average daily net assets of the Fund increase. For the year ended December 31, 2016, the management fee was equivalent to an annual rate of 0.70% of the Fund’s average daily net assets.
Funds Management has retained the services of a subadviser to provide daily portfolio management to the Fund. The fee for subadvisory services is borne by Funds Management. WellsCap is the subadviser to the Fund and is entitled to receive a fee from Funds Management at an annual rate starting at 0.45% and declining to 0.30% as the average daily net assets of the Fund increase.
Administration fees
Under a class-level administration agreement, Funds Management provides class-level administrative services to the Fund, which includes paying fees and expenses for services provided by the transfer agent, sub-transfer agents, omnibus account servicers and record-keepers. As compensation for its services under the class-level administration agreement, Funds Management receives an annual fee of 0.08% which is calculated based on the average daily net assets of each class.
Funds Management has contractually waived and/or reimbursed management and administration fees to the extent necessary to maintain certain net operating expense ratios for the Fund. Waiver of fees and/or reimbursement of expenses by Funds Management were made first from fund level expenses on a proportionate basis and then from class
| | | | |
| 22 | | Wells Fargo VT Opportunity Fund | | Notes to financial statements |
specific expenses. Funds Management has committed through April 30, 2017 to waive fees and/or reimburse expenses to the extent necessary to cap the Fund’s expenses at 0.75% for Class 1 shares and 1.00% for Class 2 shares. After this time, the cap may be increased or the commitment to maintain the cap may be terminated only with the approval of the Board of Trustees.
During the year ended December 31, 2016, State Street Bank and Trust Company, the Fund’s custodian, reimbursed the Fund $6,112 for certain out-of-pocket expenses that were billed to the Fund in error from 1998-2015. This amount is included in dividend income on the Statement of Operations. In addition, Funds Management was also reimbursed $4,683 for waivers/reimbursements it made to the Fund during the period the Fund was erroneously billed.
Distribution fee
The Trust has adopted a distribution plan for Class 2 shares of the Fund pursuant to Rule 12b-1 under the 1940 Act. A distribution fee is charged to Class 2 shares and paid to Wells Fargo Funds Distributor, LLC, the principal underwriter, at an annual rate of 0.25% of the average daily net assets of Class 2 shares.
5. INVESTMENT PORTFOLIO TRANSACTIONS
Purchases and sales of investments, excluding U.S. government obligations (if any) and short-term securities, for the year ended December 31, 2016 were $91,414,178 and $124,397,193, respectively.
The Fund may purchase or sell investment securities to other Wells Fargo funds under procedures adopted by the Board of Trustees. The procedures have been designed to ensure that these interfund transactions, which generally do not incur broker commissions, are effected at current market prices. Interfund trades are included within the respective purchases and sales amounts shown.
6. BANK BORROWINGS
The Trust and Wells Fargo Funds Trust (excluding the money market funds and certain other funds) are parties to a $250,000,000 revolving credit agreement whereby the Fund is permitted to use bank borrowings for temporary or emergency purposes, such as to fund shareholder redemption requests. Interest under the credit agreement is charged to the Fund based on a borrowing rate equal to the higher of the Federal Funds rate in effect on that day plus 1.25% or the overnight LIBOR rate in effect on that day plus 1.25%. In addition, an annual commitment fee equal to 0.25% of the unused balance is allocated to each participating fund. Prior to August 30, 2016, the revolving credit agreement amount was $200,000,000 and the annual commitment fee was equal to 0.20% of the unused balance which was allocated to each participating fund.
During the year ended December 31, 2016, the Fund had average borrowings outstanding of $15,385 (on an annualized basis) at an average rate of 1.69% and paid interest in the amount of $260.
7. DISTRIBUTIONS TO SHAREHOLDERS
The tax character of distributions paid during the years ended December 31, 2016 and December 31, 2015, were as follows:
| | | | | | | | |
| | | Year ended December 31 | |
| | | 2016 | | | 2015 | |
Ordinary income | | $ | 4,099,498 | | | $ | 398,954 | |
Long-term capital gain | | | 19,881,653 | | | | 23,494,498 | |
As of December 31, 2016, the components of distributable earnings on a tax basis were as follows:
| | | | |
Undistributed ordinary income | | Undistributed long-term
gain | | Unrealized gains |
| $3,604,877 | | $13,558,109 | | $33,669,776 |
8. INDEMNIFICATION
Under the Trust’s organizational documents, the officers and Trustees have been granted certain indemnification rights against certain liabilities that may arise out of performance of their duties to the Trust. Additionally, in the normal course
| | | | | | |
| Notes to financial statements | | Wells Fargo VT Opportunity Fund | | | 23 | |
of business, the Trust may enter into contracts with service providers that contain a variety of indemnification clauses. The Trust’s maximum exposure under these arrangements is dependent on future claims that may be made against the Fund and, therefore, cannot be estimated.
9. REGULATORY CHANGES
In October 2016, the Securities and Exchange Commission (“SEC”) adopted new rules and forms and amended existing rules and forms (together, “final rules”) intended to modernize and enhance the reporting and disclosure of information by registered investment companies and to enhance liquidity risk management by open-end mutual funds and exchange-traded funds. The final rules will enhance the quality of information available to investors and will allow the SEC to more effectively collect and use data reported by funds. In part, the final rules amend Regulation S-X and require standardized, enhanced disclosure about derivatives in the Fund’s financial statements, as well as other amendments. The compliance date for the amendments to Regulation S-X is August 1, 2017 while the compliance date for the new form types is June 1, 2018 and the compliance date for the liquidity risk management program requirements is December 1, 2018. Management is currently assessing the potential impact of these enhancements and their impact on the financial statement disclosures and reporting requirements.
| | | | |
| 24 | | Wells Fargo VT Opportunity Fund | | Report of independent registered public accounting firm |
BOARD OF TRUSTEES AND SHAREHOLDERS OF WELLS FARGO VARIABLE TRUST:
We have audited the accompanying statement of assets and liabilities, including the portfolio of investments, of the Wells Fargo VT Opportunity Fund (the “Fund”), one of the funds constituting the Wells Fargo Variable Trust, as of December 31, 2016, and the related statement of operations for the year then ended, the statements of changes in net assets for each of the years in the two-year period then ended, and the financial highlights for each of the years in the five-year period then ended. These financial statements and financial highlights are the responsibility of the Fund’s management. Our responsibility is to express an opinion on these financial statements and financial highlights based on our audits.
We conducted our audits in accordance with the standards of the Public Company Accounting Oversight Board (United States). Those standards require that we plan and perform the audit to obtain reasonable assurance about whether the financial statements and financial highlights are free of material misstatement. An audit includes examining, on a test basis, evidence supporting the amounts and disclosures in the financial statements. Our procedures included confirmation of securities owned as of December 31, 2016, by correspondence with the custodian and brokers, or by other appropriate auditing procedures. An audit also includes assessing the accounting principles used and significant estimates made by management, as well as evaluating the overall financial statement presentation. We believe that our audits provide a reasonable basis for our opinion.
In our opinion, the financial statements and financial highlights referred to above present fairly, in all material respects, the financial position of the Wells Fargo VT Opportunity Fund as of December 31, 2016, the results of its operations for the year then ended, the changes in its net assets for each of the years in the two-year period then ended, and the financial highlights for each of the years in the five-year period then ended, in conformity with U.S. generally accepted accounting principles.

Boston, Massachusetts
February 23, 2017
| | | | | | |
| Other information (unaudited) | | Wells Fargo VT Opportunity Fund | | | 25 | |
TAX INFORMATION
For corporate shareholders, pursuant to Section 854 of the Internal Revenue Code, 99.73% of ordinary income dividends qualify for the corporate dividends-received deduction for the fiscal year ended December 31, 2016.
Pursuant to Section 852 of the Internal Revenue Code, $19,881,653 was designated as a 20% rate gain distribution for the fiscal year ended December 31, 2016.
PROXY VOTING INFORMATION
A description of the policies and procedures that the Fund uses to determine how to vote proxies relating to portfolio securities is available, upon request, by calling 1-800-260-5969, visiting our website at wellsfargofunds.com, or visiting the SEC website at sec.gov. Information regarding how the Fund voted proxies relating to portfolio securities during the most recent 12-month period ended June 30 is available on the Fund’s website at wellsfargofunds.com or by visiting the SEC website at sec.gov.
PORTFOLIO HOLDINGS INFORMATION
The complete portfolio holdings for the Fund are publicly available monthly on the Fund’s website (wellsfargofunds.com), on a one-month delayed basis. In addition, top ten holdings information (excluding derivative positions) for the Fund is publicly available on the Fund’s website on a monthly, seven-day or more delayed basis. The Fund files its complete schedule of portfolio holdings with the SEC for the first and third quarters of each fiscal year on Form N-Q, which is available by visiting the SEC website at sec.gov. In addition, the Fund’s Form N-Q may be reviewed and copied at the SEC’s Public Reference Room in Washington, DC, and at regional offices in New York City, at 233 Broadway, and in Chicago, at 175 West Jackson Boulevard, Suite 900. Information about the Public Reference Room may be obtained by calling 1-800-SEC-0330.
| | | | |
| 26 | | Wells Fargo VT Opportunity Fund | | Other information (unaudited) |
BOARD OF TRUSTEES AND OFFICERS
Each of the Trustees and Officers1 listed in the table below acts in identical capacities for each fund in the Wells Fargo family of funds, which consists of 139 mutual funds comprising the Wells Fargo Funds Trust, Wells Fargo Variable Trust, Wells Fargo Master Trust and four closed-end funds (collectively the “Fund Complex”). This table should be read in conjunction with the Prospectus and the Statement of Additional Information2. The mailing address of each Trustee and Officer is 525 Market Street, 12th Floor, San Francisco, CA 94105. Each Trustee and Officer serves an indefinite term, however, each Trustee serves such term until reaching the mandatory retirement age established by the Trustees.
Independent Trustees
| | | | | | |
Name and
year of birth | | Position held and
length of service* | | Principal occupations during past five years or longer | | Current other
public company or
investment company
directorships |
| William R. Ebsworth (Born 1957) | | Trustee, since 2015 | | Retired. From 1984 to 2013, equities analyst, portfolio manager, research director and chief financial officer at Fidelity Management and Research Company in Boston, Tokyo, and Hong Kong and retired in 2013 as Chief Investment Officer of Fidelity Strategic Advisers, Inc. where he lead a team of investment professionals managing client assets. Prior thereto, Board member of Hong Kong Securities Clearing Co., Hong Kong Options Clearing Corp., the Thailand International Fund, Ltd., Fidelity Investments Life Insurance Company, and Empire Fidelity Investments Life Insurance Company. Board member of the Fonté Foundation (non-profit organization) and the Vincent Memorial Hospital Endowment (non-profit organization), where he serves on the Investment Committee and as a Chair of the Audit Committee. Mr. Ebsworth is a CFA® charterholder and an Adjunct Lecturer, Finance, at Babson College. | | Asset Allocation Trust |
| Jane A. Freeman (Born 1953) | | Trustee, since 2015 | | Retired. From 2012 to 2014 and 1999 to 2008, Chief Financial Officer of Scientific Learning Corporation. From 2008 to 2012, Ms. Freeman provided consulting services related to strategic business projects. Prior to 1999, Portfolio Manager at Rockefeller & Co. and Scudder, Stevens & Clark. Board member of the Harding Loevner Funds from 1996 to 2014, serving as both Lead Independent Director and chair of the Audit Committee. Board member of the Russell Exchange Traded Funds Trust from 2011 to 2012 and the chair of the Audit Committee. Ms. Freeman is Chair of Taproot Foundation (non-profit organization), a Board Member of Ruth Bancroft Garden (non-profit organization) and an inactive chartered financial analyst. | | Asset Allocation Trust |
| Peter G. Gordon** (Born 1942) | | Trustee, since 1998; Chairman, since 2005 | | Co-Founder, Retired Chairman, President and CEO of Crystal Geyser Water Company. Trustee Emeritus, Colby College. | | Asset Allocation Trust |
| Isaiah Harris, Jr. (Born 1952) | | Trustee, since 2009 | | Retired. Chairman of the Board of CIGNA Corporation since 2009, and Director since 2005. From 2003 to 2011, Director of Deluxe Corporation. Prior thereto, President and CEO of BellSouth Advertising and Publishing Corp. from 2005 to 2007, President and CEO of BellSouth Enterprises from 2004 to 2005 and President of BellSouth Consumer Services from 2000 to 2003. Emeritus member of the Iowa State University Foundation Board of Governors. Emeritus Member of the Advisory Board of Iowa State University School of Business. Advisory Board Member, Palm Harbor Academy (charter school). Advisory Board Member, Child Evangelism Fellowship (non-profit). Mr. Harris is a certified public accountant (inactive status). | | CIGNA Corporation; Asset Allocation Trust |
| Judith M. Johnson (Born 1949) | | Trustee, since 2008;
Audit Committee Chairman, since 2008 | | Retired. Prior thereto, Chief Executive Officer and Chief Investment Officer of Minneapolis Employees Retirement Fund from 1996 to 2008. Ms. Johnson is an attorney, certified public accountant and a certified managerial accountant. | | Asset Allocation Trust |
| David F. Larcker (Born 1950) | | Trustee, since 2009 | | James Irvin Miller Professor of Accounting at the Graduate School of Business, Stanford University, Director of the Corporate Governance Research Initiative and Senior Faculty of The Rock Center for Corporate Governance since 2006. From 2005 to 2008, Professor of Accounting at the Graduate School of Business, Stanford University. Prior thereto, Ernst & Young Professor of Accounting at The Wharton School, University of Pennsylvania from 1985 to 2005. | | Asset Allocation Trust |
| | | | | | |
| Other information (unaudited) | | Wells Fargo VT Opportunity Fund | | | 27 | |
| | | | | | |
Name and
year of birth | | Position held and
length of service* | | Principal occupations during past five years or longer | | Current other
public company or
investment company
directorships |
| Olivia S. Mitchell (Born 1953) | | Trustee, since 2006 | | International Foundation of Employee Benefit Plans Professor, Wharton School of the University of Pennsylvania since 1993. Director of Wharton’s Pension Research Council and Boettner Center on Pensions & Retirement Research, and Research Associate at the National Bureau of Economic Research. Previously, Cornell University Professor from 1978 to 1993. | | Asset Allocation Trust |
| Timothy J. Penny (Born 1951) | | Trustee, since 1996 | | President and Chief Executive Officer of Southern Minnesota Initiative Foundation, a non-profit organization, since 2007 and Senior Fellow at the Humphrey Institute Policy Forum at the University of Minnesota since 1995. Member of the Board of Trustees of NorthStar Education Finance, Inc., a non-profit organization, since 2007. | | Asset Allocation Trust |
| Michael S. Scofield (Born 1943) | | Trustee, since 2010 | | Served on the Investment Company Institute’s Board of Governors and Executive Committee from 2008-2011 as well the Governing Council of the Independent Directors Council from 2006-2011 and the Independent Directors Council Executive Committee from 2008-2011. Chairman of the IDC from 2008-2010. Institutional Investor (Fund Directions) Trustee of Year in 2007. Trustee of the Evergreen Funds complex (and its predecessors) from 1984 to 2010. Chairman of the Evergreen Funds from 2000-2010. Former Trustee of the Mentor Funds. Retired Attorney, Law Offices of Michael S. Scofield. | | Asset Allocation Trust |
| * | Length of service dates reflect the Trustee’s commencement of service with the Trust’s predecessor entities, where applicable. |
| ** | Peter Gordon is expected to retire on December 31, 2017. |
Officers
| | | | | | |
Name and
year of birth | | Position held and
length of service | | Principal occupations during past five years or longer | | |
| Andrew Owen3 (Born 1960) | | President, since 2017 | | Executive Vice President of Wells Fargo Bank, N.A. and President of Wells Fargo & Company and Head of Affiliated Managers, Wells Fargo Asset Management, since 2014. Executive Vice President responsible for marketing, investments and product development for Wells Fargo Funds Management, LLC, from 2009 to 2014. | | |
| Jeremy DePalma1 (Born 1974) | | Treasurer, since 2012 | | Senior Vice President of Wells Fargo Funds Management, LLC since 2009. Senior Vice President of Evergreen Investment Management Company, LLC from 2008 to 2010 and head of the Fund Reporting and Control Team within Fund Administration from 2005 to 2010. | | |
| C. David Messman (Born 1960) | | Secretary, since 2000; Chief Legal Officer, since 2003 | | Senior Vice President and Secretary of Wells Fargo Funds Management, LLC since 2001. Assistant General Counsel of Wells Fargo Bank, N.A. since 2013 and Vice President and Managing Counsel of Wells Fargo Bank, N.A. from 1996 to 2013. | | |
| Michael Whitaker (Born 1967) | | Chief Compliance Officer, since 2016 | | Executive Vice President of Wells Fargo Funds Management, LLC since 2016. Chief Compliance Officer of Fidelity’s Fixed Income Funds and Asset Allocation Funds from 2008 to 2016, Compliance Officer of FMR Co., Inc. from 2014 to 2016, Fidelity Investments Money Management, Inc. from 2014 to 2016, Fidelity Investments from 2007 to 2016. | | |
| David Berardi (Born 1975) | | Assistant Treasurer, since 2009 | | Vice President of Wells Fargo Funds Management, LLC since 2009. Vice President of Evergreen Investment Management Company, LLC from 2008 to 2010. Manager of Fund Reporting and Control for Evergreen Investment Management Company, LLC from 2004 to 2010. | | |
| 1 | Jeremy DePalma acts as Treasurer of 69 funds and Assistant Treasurer of 70 funds in the Fund Complex. |
| 2 | The Statement of Additional Information includes additional information about the Trustees and is available, without charge, upon request, by calling 1-800-260-5969 or by visiting the website at wellsfargofunds.com. |
| 3 | Andrew Owen became President on January 1, 2017. |
| | | | |
| 28 | | Wells Fargo VT Opportunity Fund | | List of abbreviations |
The following is a list of common abbreviations for terms and entities that may have appeared in this report.
| ACA | — ACA Financial Guaranty Corporation |
| ADR | — American depositary receipt |
| ADS | — American depositary shares |
| AGC | — Assured Guaranty Corporation |
| AGM | — Assured Guaranty Municipal |
| Ambac | — Ambac Financial Group Incorporated |
| AMT | — Alternative minimum tax |
| BAN | — Bond anticipation notes |
| BHAC | — Berkshire Hathaway Assurance Corporation |
| CAB | — Capital appreciation bond |
| CCAB | — Convertible capital appreciation bond |
| CDA | — Community Development Authority |
| CDO | — Collateralized debt obligation |
| DRIVER | — Derivative inverse tax-exempt receipts |
| DW&P | — Department of Water & Power |
| DWR | — Department of Water Resources |
| ECFA | — Educational & Cultural Facilities Authority |
| EDA | — Economic Development Authority |
| EDFA | — Economic Development Finance Authority |
| ETF | — Exchange-traded fund |
| FDIC | — Federal Deposit Insurance Corporation |
| FFCB | — Federal Farm Credit Banks |
| FGIC | — Financial Guaranty Insurance Corporation |
| FHA | — Federal Housing Administration |
| FHLB | — Federal Home Loan Bank |
| FHLMC | — Federal Home Loan Mortgage Corporation |
| FICO | — The Financing Corporation |
| FNMA | — Federal National Mortgage Association |
| GDR | — Global depositary receipt |
| GNMA | — Government National Mortgage Association |
| HCFR | — Healthcare facilities revenue |
| HEFA | — Health & Educational Facilities Authority |
| HEFAR | — Higher education facilities authority revenue |
| HFA | — Housing Finance Authority |
| HFFA | — Health Facilities Financing Authority |
| HUD | — Department of Housing and Urban Development |
| IDA | — Industrial Development Authority |
| IDAG | — Industrial Development Agency |
| KRW | — Republic of Korea won |
| LIBOR | — London Interbank Offered Rate |
| LIFER | — Long Inverse Floating Exempt Receipts |
| LLC | — Limited liability company |
| LLLP | — Limited liability limited partnership |
| LLP | — Limited liability partnership |
| MBIA | — Municipal Bond Insurance Association |
| MFHR | — Multifamily housing revenue |
| MSTR | — Municipal securities trust receipts |
| MUD | — Municipal Utility District |
| National | — National Public Finance Guarantee Corporation |
| PCFA | — Pollution Control Financing Authority |
| PCL | — Public Company Limited |
| PCR | — Pollution control revenue |
| PFA | — Public Finance Authority |
| PFFA | — Public Facilities Financing Authority |
| PFOTER | — Puttable floating option tax-exempt receipts |
| plc | — Public limited company |
| PUTTER | — Puttable tax-exempt receipts |
| R&D | — Research & development |
| Radian | — Radian Asset Assurance |
| RAN | — Revenue anticipation notes |
| RDA | — Redevelopment Authority |
| RDFA | — Redevelopment Finance Authority |
| REIT | — Real estate investment trust |
| ROC | — Reset option certificates |
| SAVRS | — Select auction variable rate securities |
| SBA | — Small Business Authority |
| SDR | — Swedish depositary receipt |
| SFHR | — Single-family housing revenue |
| SFMR | — Single-family mortgage revenue |
| SPA | — Standby purchase agreement |
| SPDR | — Standard & Poor’s Depositary Receipts |
| SPEAR | — Short Puttable Exempt Adjustable Receipts |
| STRIPS | — Separate trading of registered interest and |
| TAN | — Tax anticipation notes |
| TIPS | — Treasury inflation-protected securities |
| TRAN | — Tax revenue anticipation notes |
| TTFA | — Transportation Trust Fund Authority |
| TVA | — Tennessee Valley Authority |

For more information
More information about Wells Fargo Funds is available free upon request. To obtain literature, please write, email, visit the Fund’s website, or call:
Wells Fargo Funds
P.O. Box 8266
Boston, MA 02266-8266
Email: fundservice@wellsfargo.com
Website: wellsfargofunds.com
Individual investors: 1-800-222-8222
Retail investment professionals: 1-888-877-9275
Institutional investment professionals: 1-866-765-0778
This report and the financial statements contained herein are submitted for the general information of the shareholders of the Fund. If this report is used for promotional purposes, distribution of the report must be accompanied or preceded by a current prospectus. Before investing, please consider the investment objectives, risks, charges, and expenses of the investment. For a current prospectus and, if available, a summary prospectus, containing this information, call 1-800-260-5969 or visit the Fund’s website at wellsfargofunds.com. Read the prospectus carefully before you invest or send money.
Wells Fargo Asset Management (WFAM) is a trade name used by the asset management businesses of Wells Fargo & Company. Wells Fargo Funds Management, LLC, a wholly owned subsidiary of Wells Fargo & Company, provides investment advisory and administrative services for Wells Fargo Funds. Other affiliates of Wells Fargo & Company provide subadvisory and other services for the funds. The funds are distributed by Wells Fargo Funds Distributor, LLC, Member FINRA, an affiliate of Wells Fargo & Company. Neither Wells Fargo Funds Management nor Wells Fargo Funds Distributor has Fund customer accounts/assets, and neither provides investment advice/recommendations or acts as an investment advice fiduciary to any investor.
NOT FDIC INSURED ◾ NO BANK GUARANTEE ◾ MAY LOSE VALUE
© 2016 Wells Fargo Funds Management, LLC. All rights reserved.
| | |
| | 300472 02-17 AVT6/AR152 12-16 |
Annual Report
December 31, 2016

Wells Fargo VT Small Cap Growth Fund


Reduce clutter. Save trees.
Sign up for electronic delivery of prospectuses and shareholder reports at wellsfargo.com/advantagedelivery
Contents
The views expressed and any forward-looking statements are as of December 31, 2016, unless otherwise noted, and are those of the Fund managers and/or Wells Fargo Funds Management, LLC. Discussions of individual securities, or the markets generally, or any Wells Fargo Fund are not intended as individual recommendations. Future events or results may vary significantly from those expressed in any forward-looking statements. The views expressed are subject to change at any time in response to changing circumstances in the market. Wells Fargo Funds Management, LLC and the Fund disclaim any obligation to publicly update or revise any views expressed or forward-looking statements.
NOT FDIC INSURED ◾ NO BANK GUARANTEE ◾ MAY LOSE VALUE
| | | | |
| 2 | | Wells Fargo VT Small Cap Growth Fund | | Letter to shareholders (unaudited) |

Andrew Owen
President
Wells Fargo Funds
U.S. small-, mid-, and large-cap stocks returned 21.31%, 13.80%, and 12.05% for the twelve-month period, respectively.
During the fourth quarter of 2016, the Fed hiked the short-term interest rate by 0.25% to reach a target range of 0.50% to 0.75%.
Dear Shareholder:
As the new president of Wells Fargo Funds now that Karla Rabusch is retiring from that position after nearly 14 years, I am pleased to offer you this annual report for the Wells Fargo VT Small Cap Growth Fund for the 12-month period that ended December 31, 2016. The U.S. economy ticked up as the year progressed. As expected, the Federal Reserve (Fed) raised the federal funds rate in December by 0.25%. U.S. small-, mid-, and large-cap stocks returned 21.31%, 13.80%, and 12.05% for the twelve-month period, respectively, as measured by the Russell 2000® Index,1 the Russell Midcap® Index,2 and the Russell 1000® Index.3
U.S. stocks showed gains in 2016, primarily after the U.S. presidential election.
The year began with a precipitous drop in U.S. stocks in January as crude oil prices tumbled and concerns about China’s economy increased; a mostly steady trajectory continued in the U.S. stock market after that inflection point. However, stocks rose significantly immediately following the U.S. presidential election. The promise of pro-growth policies by the incoming administration—lower tax rates, less regulation, investments in infrastructure, better trade deals—set the momentum for this surge.
The types of companies leading the rally leaned toward ones that have done well in a rising-rate environment, such as banks, and businesses which have benefited from infrastructure spending and reduced regulations. Sectors that could be negatively affected by rising interest rates, such as utilities, delivered weaker results. Consumer confidence hit prerecession levels for the first time in November and increased again in December.
Stronger economic indicators drove U.S. monetary policy.
During the fourth quarter of 2016, the Fed hiked the short-term interest rate by 0.25% to reach a target range of 0.50% to 0.75%. This was the second rate increase in more than 10 years, with the Fed citing job gains and lower-than-expected unemployment of 4.6%, down 0.3% from October. The Fed confirmed the continuation of an accommodative monetary policy to support a stronger labor market and reiterated its long-term objective of a 2% inflation rate, which increased slightly during the quarter but fell short of the benchmark. The Fed expressed confidence in the economy’s progress during the quarter and expects this positive trajectory to continue. Both of these sentiments helped to bolster the Fed’s expectation of three additional rate increases during 2017.
U.S. economic data released during the fourth quarter showed that U.S. real gross domestic product increased at an annual rate of 3.5% in the third quarter, the largest increase since mid-2014. Business investment by U.S. companies was mixed, with a 12.0% increase in structures and 4.5% decrease in equipment over the prior quarter on an annualized basis. Consumer spending slowed somewhat from the prior quarter, but late-December estimates from retail-research firms suggest that sales growth during the 2016 holiday season may outpace that of recent years.
| 1 | The Russell 2000® Index measures the performance of the 2,000 smallest companies in the Russell 3000® Index, which represents approximately 8% of the total market capitalization of the Russell 3000® Index. You cannot invest directly in an index. |
| 2 | The Russell Midcap® Index measures the performance of the 800 smallest companies in the Russell 1000® Index, which represent approximately 25% of the total market capitalization of the Russell 1000® Index. You cannot invest directly in an index. |
| 3 | The Russell 1000® Index measures the performance of the 1,000 largest companies in the Russell 3000® Index, which represents approximately 92% of the total market capitalization of the Russell 3000® Index. You cannot invest directly in an index. |
| | | | | | |
| Letter to shareholders (unaudited) | | Wells Fargo VT Small Cap Growth Fund | | | 3 | |
Central banks continued with stimulus programs during 2016.
In January, the Bank of Japan put in place a negative interest rate and in September announced an interest-rate target for 10-year government bonds—keeping the yield at zero—as it struggled to accelerate economic growth. The eurozone fell into deflation in February; in response, the European Central Bank (ECB) announced an expansion of its stimulus program. In December, the ECB stated that it will extend its quantitative-easing program and continue purchasing eurozone corporate and government debt each month through December 2017. In June, voters in the U.K. approved a referendum to leave the European Union; the Bank of England lowered its interest rate in August to 0.25% and continued its quantitative-easing program.
Don’t let short-term uncertainty derail long-term investment goals.
Periods of uncertainty can present challenges, but experience has taught us that maintaining long-term investment goals can be an effective way to plan for the future. To help you create a sound strategy based on your personal goals and risk tolerance, Wells Fargo Funds offers more than 100 mutual funds spanning a wide range of asset classes and investment styles. Although diversification cannot guarantee an investment profit or prevent losses, we believe it can be an effective way to manage investment risk and potentially smooth out overall portfolio performance. We encourage investors to know their investments and to understand that appropriate levels of risk-taking may unlock opportunities.
Thank you for choosing to invest in Wells Fargo Funds. We appreciate your confidence in us and remain committed to helping you meet your financial needs.
Sincerely,

Andrew Owen
President
Wells Fargo Funds
For further information about your Fund, contact your investment professional, visit our website at wellsfargofunds.com, or call us directly at 1-800-260-5969. We are available 24 hours a day, 7 days a week.
| | | | |
| 4 | | Wells Fargo VT Small Cap Growth Fund | | Performance highlights (unaudited) |
The Fund is currently closed to new insurance companies.1
Investment objective
The Fund seeks long-term capital appreciation.
Manager
Wells Fargo Funds Management, LLC
Subadviser
Wells Capital Management Incorporated
Portfolio managers
Joseph M. Eberhardy, CFA®, CFP
Thomas C. Ognar, CFA®
Bruce C. Olson, CFA®
Average annual total returns (%) as of December 31, 20162
| | | | | | | | | | | | | | | | | | | | | | |
| | | | | | | | | | | | | | Expense ratios3 (%) | |
| | | Inception date | | 1 year | | | 5 year | | | 10 year | | | Gross | | | Net4 | |
| Class 1 | | 7-16-2010 | | | 8.10 | | | | 10.99 | | | | 7.61 | | | | 0.93 | | | | 0.93 | |
| Class 2 | | 5-1-1995 | | | 7.75 | | | | 10.72 | | | | 7.43 | | | | 1.18 | | | | 1.18 | |
| Russell 2000® Growth Index5 | | – | | | 11.32 | | | | 13.74 | | | | 7.76 | | | | – | | | | – | |
Figures quoted represent past performance, which is no guarantee of future results. Investment return and principal value of an investment will fluctuate so that an investor’s shares, when redeemed, may be worth more or less than their original cost. Current performance may be lower or higher than the performance data quoted and assumes the reinvestment of dividends and capital gains. Current month-end performance is available by calling 1-800-260-5969. Performance figures of the Fund do not reflect fees charged pursuant to the terms of variable life insurance policies and variable annuity contracts. If sales loads or charges had been reflected, performance would have been lower.
Index returns do not include transaction costs associated with buying and selling securities, any mutual fund fees or expenses, or any taxes. It is not possible to invest directly in an index.
Stock values fluctuate in response to the activities of individual companies and general market and economic conditions. Smaller-company stocks tend to be more volatile and less liquid than those of larger companies. Consult the Fund’s prospectus for additional information on these and other risks.
Please refer to the prospectus provided by your participating insurance company for detailed information describing the separate accounts for information regarding surrender charges, mortality and expense risk fees, and other charges that may be assessed by the participating insurance companies.
Please see footnotes on page 5.
| | | | | | |
| Performance highlights (unaudited) | | Wells Fargo VT Small Cap Growth Fund | | | 5 | |
|
| Growth of $10,000 investment as of December 31, 20166 |
|
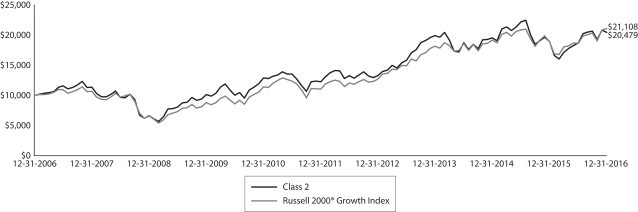 |
| 1 | Please see the Fund’s current Statement of Additional Information for further details. |
| 2 | Historical performance shown for Class 1 shares prior to their inception reflects the performance of Class 2 shares, and includes the higher expenses applicable to Class 2 shares. If these expenses had not been included, returns would be higher. |
| 3 | Reflects the expense ratios as stated in the most recent prospectuses. The expense ratios shown are subject to change and may differ from the annualized expense ratios shown in the financial highlights of this report. |
| 4 | The manager has contractually committed through April 30, 2017, to waive fees and/or reimburse expenses to the extent necessary to cap the Fund’s Total Annual Fund Operating Expenses After Fee Waiver at 0.95% for Class 1 and 1.20% for Class 2. After this time, the cap may be increased or the commitment to maintain the cap may be terminated only with the approval of the Board of Trustees. Brokerage commissions, stamp duty fees, interest, taxes, acquired fund fees and expenses, and extraordinary expenses are excluded from the expense cap. Without this cap, the Fund’s returns would have been lower. |
| 5 | The Russell 2000® Growth Index measures the performance of those Russell 2000 companies with higher price-to-book ratios and higher forecasted growth values. You cannot invest directly in an index. |
| 6 | The chart compares the performance of Class 2 shares for the most recent ten years with the Russell 2000® Growth Index. The chart assumes a hypothetical $10,000 investment and reflects all operating expenses of the Fund. Performance does not reflect fees charged pursuant to the terms of variable life insurance policies and variable annuity contracts. |
| 7 | The Russell 2000® Index measures the performance of the 2,000 smallest companies in the Russell 3000® Index, which represents approximately 8% of the total market capitalization of the Russell 3000® Index. You cannot invest directly in an index. |
| 8 | The Russell 2000® Value Index measures the performance of those Russell 2000 companies with lower price/book ratios and lower forecasted growth values. You cannot invest directly in an index. |
| 9 | The ten largest holdings, excluding cash and cash equivalents, are calculated based on the value of the investments divided by total net assets of the Fund. Holdings are subject to change and may have changed since the date specified. |
| 10 | Amounts are calculated based on the total long-term investments of the Fund. These amounts are subject to change and may have changed since the date specified. |
| | | | |
| 6 | | Wells Fargo VT Small Cap Growth Fund | | Performance highlights (unaudited) |
MANAGER’S DISCUSSION
Fund highlights
| ∎ | | The Fund underperformed its benchmark, the Russell 2000® Growth Index, for the 12-month period that ended December 31, 2016. |
| ∎ | | Stock selection within the information technology (IT) and consumer discretionary sectors detracted from results during the period. |
| ∎ | | Stock selection in the financials, energy, and health care sectors aided relative performance. |
2016 began on a negative note, with small-cap stocks, as measured by the Russell 2000® Index,7 down almost 16% by early February. While the sell-off was widespread, faster-growing stocks were disproportionately punished regardless of the underlying fundamentals. The reversal, which began on February 11 and brought a 34% rally off the lows in small-cap stocks by the end of the first quarter, was primarily fueled by a demand for income through dividend-yielding stocks. This demand for income, fueled by another year of historically low interest rates, persisted for most of 2016 and resulted in investors often paying high multiples for stocks with few-to-no growth opportunities. Shortly after the unexpected victory by Donald Trump in the U.S. presidential election, the market shifted its emphasis from dividend-yielding companies to cyclical companies poised to potentially benefit from changes in economic policies. Faster-growing stocks, especially in the IT and health care sectors, tended to be sold off in favor of stocks from the financials, energy, and industrials sectors. Proof of this challenging dynamic was evident as the Russell 2000® Value Index8 outperformed the Russell 2000® Growth Index by nearly 700 basis points (100 basis points equals 1.00%) from November 9 through December 31, 2016.
| | | | |
| Ten largest holdings (%) as of December 31, 20169 | |
On Assignment Incorporated | | | 3.12 | |
MarketAxess Holdings Incorporated | | | 2.74 | |
SPS Commerce Incorporated | | | 2.51 | |
Proofpoint Incorporated | | | 2.50 | |
WageWorks Incorporated | | | 2.41 | |
Q2 Holdings Incorporated | | | 2.40 | |
Ligand Pharmaceuticals Incorporated | | | 2.32 | |
The Spectranetics Corporation | | | 2.25 | |
NxStage Medical Incorporated | | | 1.92 | |
Envestnet Incorporated | | | 1.91 | |
Stock selection within the consumer discretionary and IT sectors hindered Fund performance.
Stock selection in the consumer discretionary and IT sectors were the largest detractors from the Fund’s relative performance. Within the consumer discretionary sector, holdings of The Habit Restaurants, Incorporated, and Jack in the Box Incorporated detracted from performance on investors’ concerns about increased labor costs and the overall slowdown in traffic and same-store sales in the restaurant industry. Within the specialty-retail industry, Lithia Motors, Incorporated, experienced weakness, partly driven by issues affecting investor sentiment regarding the overall auto industry. Within the IT sector, several cloud-based software holdings suffered
from investors’ fears of slowing corporate spending on technology infrastructure. We believe the Fund’s IT holdings are well positioned for growth as demand rises for innovative technology solutions that may enhance business productivity.
The Fund benefited from strong contributions from holdings in the energy, financials, and health care sectors.
In the energy sector, RSP Permian, Incorporated, which operates as an exploration and production company focused on the Permian basin, delivered the top results. The company benefited from its strong balance sheet and solid productivity gains from its high-rate-of-return acreage. In the financials sector, MarketAxess Holdings Incorporated was rewarded after it expanded its market presence through its electronic bond-trading platform. The Fund’s success in the health care sector was driven by strong gains from several equipment and supplies holdings, including The Spectranetics Corporation and Inogen, Incorporated, which benefited from robust sales of their innovative medical devices.
Please see footnotes on page 5.
| | | | | | |
| Performance highlights (unaudited) | | Wells Fargo VT Small Cap Growth Fund | | | 7 | |
|
| Sector distribution as of December 31, 201610 |
|
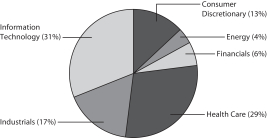 |
We continue to focus on consistently implementing our process.
While recent performance has not met our or our clients’ expectations, we remain optimistic regarding the Fund’s prospects. The market’s recent, apparent fixation on income regardless of fundamentals has led to a significant valuation spike for slower-growing, higher-dividend-paying stocks. When buying a stock, which essentially is purchasing the right to the stock’s future cash flows, it is important to keep in mind that many higher-dividend-paying stocks are now trading at or near
five-year highs from a valuation perspective, with few prospects for growth in revenue, earnings per share (EPS), or free-cash flow. The converse is true for faster-growing stocks: Several faster-growing stocks held in the Fund that may see significant growth in revenue, EPS, or free-cash flow are now trading at or near five-year lows. While we cannot predict when the market will refocus on fundamentals, we believe the Fund is well positioned for potential success when this occurs.
Please see footnotes on page 5.
| | | | |
| 8 | | Wells Fargo VT Small Cap Growth Fund | | Fund expenses (unaudited) |
As a shareholder of the Fund, you incur ongoing costs, including management fees, distribution (12b-1) fees, and other Fund expenses. This example is intended to help you understand your ongoing costs (in dollars) of investing in the Fund and to compare these costs with the ongoing costs of investing in other mutual funds.
The example is based on an investment of $1,000 invested at the beginning of the six-month period and held for the entire period from July 1, 2016 to December 31, 2016.
Actual expenses
The “Actual” line of the table below provides information about actual account values and actual expenses. You may use the information in this line, together with the amount you invested, to estimate the expenses that you paid over the period. Simply divide your account value by $1,000 (for example, an $8,600 account value divided by $1,000 = 8.6), then multiply the result by the number in the “Actual” line under the heading entitled “Expenses Paid During Period” for your applicable class of shares to estimate the expenses you paid on your account during this period.
Hypothetical example for comparison purposes
The “Hypothetical” line of the table below provides information about hypothetical account values and hypothetical expenses based on the Fund’s actual expense ratio and an assumed rate of return of 5% per year before expenses, which is not the Fund’s actual return. The hypothetical account values and expenses may not be used to estimate the actual ending account balance or expenses you paid for the period. You may use this information to compare the ongoing costs of investing in the Fund and other funds. To do so, compare this 5% hypothetical example with the 5% hypothetical examples that appear in the shareholder reports of the other funds.
Please note that the expenses shown in the table are meant to highlight your ongoing costs only and do not reflect any separate account charges assessed by participating insurance companies. Therefore, the “Hypothetical” line of the table is useful in comparing ongoing costs only, and will not help you determine the relative total costs of owning different funds. In addition, if these separate account charges assessed by participating insurance companies were included, your costs would have been higher.
| | | | | | | | | | | | | | | | |
| | | Beginning
account value
7-1-2016 | | | Ending
account value
12-31-2016 | | | Expenses
paid during
the period¹ | | | Annualized net
expense ratio | |
Class 1 | | | | | | | | | | | | | | | | |
Actual | | $ | 1,000.00 | | | $ | 1,094.87 | | | $ | 4.96 | | | | 0.94 | % |
Hypothetical (5% return before expenses) | | $ | 1,000.00 | | | $ | 1,020.40 | | | $ | 4.78 | | | | 0.94 | % |
Class 2 | | | | | | | | | | | | | | | | |
Actual | | $ | 1,000.00 | | | $ | 1,094.08 | | | $ | 6.27 | | | | 1.19 | % |
Hypothetical (5% return before expenses) | | $ | 1,000.00 | | | $ | 1,019.15 | | | $ | 6.05 | | | | 1.19 | % |
| 1 | Expenses paid is equal to the annualized net expense ratio of each class multiplied by the average account value over the period, multiplied by the number of days in the most recent fiscal half-year divided by the number of days in the fiscal year (to reflect the one-half year period). |
| | | | | | |
| Portfolio of investments—December 31, 2016 | | Wells Fargo VT Small Cap Growth Fund | | | 9 | |
| | | | | | | | | | | | | | | | |
| Security name | | | | | | | | Shares | | | Value | |
| | | | | | | | | | | | | | | | |
| | | | |
Common Stocks: 98.50% | | | | | | | | | | | | | | | | |
| | | | |
Consumer Discretionary: 12.57% | | | | | | | | | | | | | | | | |
| | | | |
| Auto Components: 1.14% | | | | | | | | | | | | | | | | |
Cooper-Standard Holdings Incorporated † | | | | | | | | | | | 10,690 | | | $ | 1,105,132 | |
LCI Industries | | | | | | | | | | | 13,420 | | | | 1,446,005 | |
| | | | |
| | | | | | | | | | | | | | | 2,551,137 | |
| | | | | | | | | | | | | | | | |
| | | | |
| Diversified Consumer Services: 1.43% | | | | | | | | | | | | | | | | |
Grand Canyon Education Incorporated † | | | | | | | | | | | 54,820 | | | | 3,204,229 | |
| | | | | | | | | | | | | | | | |
| | | | |
| Hotels, Restaurants & Leisure: 2.92% | | | | | | | | | | | | | | | | |
Planet Fitness Incorporated Class A « | | | | | | | | | | | 97,126 | | | | 1,952,233 | |
The Habit Restaurants Incorporated Class A Ǡ | | | | | | | | | | | 137,748 | | | | 2,376,153 | |
Wingstop Incorporated « | | | | | | | | | | | 74,049 | | | | 2,191,110 | |
| | | | |
| | | | | | | | | | | | | | | 6,519,496 | |
| | | | | | | | | | | | | | | | |
| | | | |
| Household Durables: 0.29% | | | | | | | | | | | | | | | | |
Universal Electronics Incorporated † | | | | | | | | | | | 9,890 | | | | 638,400 | |
| | | | | | | | | | | | | | | | |
| | | | |
| Leisure Products: 1.33% | | | | | | | | | | | | | | | | |
MCBC Holdings Incorporated | | | | | | | | | | | 76,324 | | | | 1,112,804 | |
Nautilus Group Incorporated † | | | | | | | | | | | 99,960 | | | | 1,849,260 | |
| | | | |
| | | | | | | | | | | | | | | 2,962,064 | |
| | | | | | | | | | | | | | | | |
| | | | |
| Media: 1.49% | | | | | | | | | | | | | | | | |
IMAX Corporation † | | | | | | | | | | | 106,110 | | | | 3,331,854 | |
| | | | | | | | | | | | | | | | |
| | | | |
| Multiline Retail: 0.87% | | | | | | | | | | | | | | | | |
Ollie’s Bargain Outlet Holdings Incorporated † | | | | | | | | | | | 68,010 | | | | 1,934,885 | |
| | | | | | | | | | | | | | | | |
| | | | |
| Specialty Retail: 3.10% | | | | | | | | | | | | | | | | |
Camping World Holdings Incorporated Class A « | | | | | | | | | | | 25,420 | | | | 828,438 | |
Five Below Incorporated † | | | | | | | | | | | 32,408 | | | | 1,295,024 | |
Lithia Motors Incorporated Class A | | | | | | | | | | | 34,120 | | | | 3,303,840 | |
Sportsman’s Warehouse Holdings Incorporated † | | | | | | | | | | | 159,094 | | | | 1,493,893 | |
| | | | |
| | | | | | | | | | | | | | | 6,921,195 | |
| | | | | | | | | | | | | | | | |
| | | | |
Energy: 3.75% | | | | | | | | | | | | | | | | |
| | | | |
| Oil, Gas & Consumable Fuels: 3.75% | | | | | | | | | | | | | | | | |
Extraction Oil & Gas Incorporated † | | | | | | | | | | | 16,926 | | | | 339,197 | |
Matador Resources Company † | | | | | | | | | | | 48,563 | | | | 1,250,983 | |
PDC Energy Incorporated † | | | | | | | | | | | 39,700 | | | | 2,881,426 | |
RSP Permian Incorporated † | | | | | | | | | | | 87,521 | | | | 3,905,187 | |
| | | | |
| | | | | | | | | | | | | | | 8,376,793 | |
| | | | | | | | | | | | | | | | |
The accompanying notes are an integral part of these financial statements.
| | | | |
| 10 | | Wells Fargo VT Small Cap Growth Fund | | Portfolio of investments—December 31, 2016 |
| | | | | | | | | | | | | | | | |
| Security name | | | | | | | | Shares | | | Value | |
| | | | | | | | | | | | | | | | |
| | | | |
Financials: 6.46% | | | | | | | | | | | | | | | | |
| | | | |
| Capital Markets: 4.03% | | | | | | | | | | | | | | | | |
Financial Engines Incorporated « | | | | | | | | | | | 78,560 | | | $ | 2,887,080 | |
MarketAxess Holdings Incorporated | | | | | | | | | | | 41,678 | | | | 6,123,332 | |
| | | | |
| | | | | | | | | | | | | | | 9,010,412 | |
| | | | | | | | | | | | | | | | |
| | | | |
| Insurance: 0.63% | | | | | | | | | | | | | | | | |
Kinsale Capital Group Incorporated | | | | | | | | | | | 41,131 | | | | 1,398,865 | |
| | | | | | | | | | | | | | | | |
| | | | |
| Thrifts & Mortgage Finance: 1.80% | | | | | | | | | | | | | | | | |
LendingTree Incorporated Ǡ | | | | | | | | | | | 39,728 | | | | 4,026,433 | |
| | | | | | | | | | | | | | | | |
| | | | |
Health Care: 28.30% | | | | | | | | | | | | | | | | |
| | | | |
| Biotechnology: 5.71% | | | | | | | | | | | | | | | | |
Alder Biopharmaceuticals Incorporated † | | | | | | | | | | | 42,770 | | | | 889,616 | |
Ligand Pharmaceuticals Incorporated Ǡ | | | | | | | | | | | 51,020 | | | | 5,184,142 | |
Radius Health Incorporated Ǡ | | | | | | | | | | | 27,868 | | | | 1,059,820 | |
Repligen Corporation † | | | | | | | | | | | 91,220 | | | | 2,811,400 | |
Spark Therapeutics Incorporated Ǡ | | | | | | | | | | | 24,510 | | | | 1,223,049 | |
Ultragenyx Pharmaceutical Incorporated Ǡ | | | | | | | | | | | 22,482 | | | | 1,580,709 | |
| | | | |
| | | | | | | | | | | | | | | 12,748,736 | |
| | | | | | | | | | | | | | | | |
| | | | |
| Health Care Equipment & Supplies: 15.61% | | | | | | | | | | | | | | | | |
Abiomed Incorporated † | | | | | | | | | | | 6,150 | | | | 692,982 | |
Cerus Corporation Ǡ | | | | | | | | | | | 270,152 | | | | 1,175,161 | |
Cynosure Incorporated Class A † | | | | | | | | | | | 80,637 | | | | 3,677,047 | |
Entellus Medical Incorporated Ǡ | | | | | | | | | | | 57,002 | | | | 1,081,328 | |
Glaukos Corporation † | | | | | | | | | | | 94,378 | | | | 3,237,165 | |
Inogen Incorporated † | | | | | | | | | | | 35,930 | | | | 2,413,418 | |
Integra LifeSciences Holdings Corporation † | | | | | | | | | | | 38,730 | | | | 3,322,647 | |
iRhythm Technologies Incorporated Ǡ | | | | | | | | | | | 44,276 | | | | 1,328,280 | |
Natus Medical Incorporated † | | | | | | | | | | | 43,510 | | | | 1,514,148 | |
Nevro Corporation † | | | | | | | | | | | 42,649 | | | | 3,098,876 | |
NxStage Medical Incorporated † | | | | | | | | | | | 163,250 | | | | 4,278,783 | |
The Spectranetics Corporation † | | | | | | | | | | | 204,607 | | | | 5,012,872 | |
Zeltiq Aesthetics Incorporated Ǡ | | | | | | | | | | | 92,330 | | | | 4,018,202 | |
| | | | |
| | | | | | | | | | | | | | | 34,850,909 | |
| | | | | | | | | | | | | | | | |
| | | | |
| Health Care Providers & Services: 3.84% | | | | | | | | | | | | | | | | |
Acadia Healthcare Company Incorporated Ǡ | | | | | | | | | | | 96,800 | | | | 3,204,080 | |
HealthEquity Incorporated † | | | | | | | | | | | 92,725 | | | | 3,757,217 | |
Surgery Partners Incorporated † | | | | | | | | | | | 43,680 | | | | 692,328 | |
Teladoc Incorporated Ǡ | | | | | | | | | | | 55,446 | | | | 914,859 | |
| | | | |
| | | | | | | | | | | | | | | 8,568,484 | |
| | | | | | | | | | | | | | | | |
| | | | |
| Life Sciences Tools & Services: 2.44% | | | | | | | | | | | | | | | | |
ICON plc ADR † | | | | | | | | | | | 24,840 | | | | 1,867,968 | |
INC Research Holdings Incorporated Class A † | | | | | | | | | | | 68,003 | | | | 3,576,958 | |
| | | | |
| | | | | | | | | | | | | | | 5,444,926 | |
| | | | | | | | | | | | | | | | |
The accompanying notes are an integral part of these financial statements.
| | | | | | |
| Portfolio of investments—December 31, 2016 | | Wells Fargo VT Small Cap Growth Fund | | | 11 | |
| | | | | | | | | | | | | | | | |
| Security name | | | | | | | | Shares | | | Value | |
| | | | | | | | | | | | | | | | |
| | | | |
| Pharmaceuticals: 0.70% | | | | | | | | | | | | | | | | |
Heska Corporation † | | | | | | | | | | | 21,960 | | | $ | 1,572,336 | |
| | | | | | | | | | | | | | | | |
| | | | |
Industrials: 16.56% | | | | | | | | | | | | | | | | |
| | | | |
| Aerospace & Defense: 0.68% | | | | | | | | | | | | | | | | |
HEICO Corporation | | | | | | | | | | | 19,600 | | | | 1,512,140 | |
| | | | | | | | | | | | | | | | |
| | | | |
| Airlines: 0.98% | | | | | | | | | | | | | | | | |
SkyWest Incorporated | | | | | | | | | | | 60,140 | | | | 2,192,103 | |
| | | | | | | | | | | | | | | | |
| | | | |
| Building Products: 1.03% | | | | | | | | | | | | | | | | |
Apogee Enterprises Incorporated | | | | | | | | | | | 43,090 | | | | 2,307,900 | |
| | | | | | | | | | | | | | | | |
| | | | |
| Commercial Services & Supplies: 0.68% | | | | | | | | | | | | | | | | |
Advanced Disposal Services Incorporated † | | | | | | | | | | | 41,115 | | | | 913,575 | |
Multi-Color Corporation | | | | | | | | | | | 7,850 | | | | 609,160 | |
| | | | |
| | | | | | | | | | | | | | | 1,522,735 | |
| | | | | | | | | | | | | | | | |
| | | | |
| Construction & Engineering: 1.62% | | | | | | | | | | | | | | | | |
Dycom Industries Incorporated Ǡ | | | | | | | | | | | 21,210 | | | | 1,702,951 | |
Granite Construction Incorporated | | | | | | | | | | | 34,580 | | | | 1,901,900 | |
| | | | |
| | | | | | | | | | | | | | | 3,604,851 | |
| | | | | | | | | | | | | | | | |
| | | | |
| Machinery: 4.31% | | | | | | | | | | | | | | | | |
John Bean Technologies Corporation | | | | | | | | | | | 42,640 | | | | 3,664,908 | |
Milacron Holdings Corporation † | | | | | | | | | | | 127,557 | | | | 2,376,387 | |
Mueller Water Products Incorporated Class A | | | | | | | | | | | 115,860 | | | | 1,542,097 | |
Rexnord Corporation † | | | | | | | | | | | 104,620 | | | | 2,049,506 | |
| | | | |
| | | | | | | | | | | | | | | 9,632,898 | |
| | | | | | | | | | | | | | | | |
| | | | |
| Professional Services: 5.53% | | | | | | | | | | | | | | | | |
On Assignment Incorporated † | | | | | | | | | | | 157,581 | | | | 6,958,777 | |
WageWorks Incorporated † | | | | | | | | | | | 74,247 | | | | 5,382,908 | |
| | | | |
| | | | | | | | | | | | | | | 12,341,685 | |
| | | | | | | | | | | | | | | | |
| | | | |
| Trading Companies & Distributors: 1.73% | | | | | | | | | | | | | | | | |
Beacon Roofing Supply Incorporated † | | | | | | | | | | | 57,070 | | | | 2,629,215 | |
BMC Stock Holdings Incorporated † | | | | | | | | | | | 63,040 | | | | 1,229,280 | |
| | | | |
| | | | | | | | | | | | | | | 3,858,495 | |
| | | | | | | | | | | | | | | | |
| | | | |
Information Technology: 30.86% | | | | | | | | | | | | | | | | |
| | | | |
| Communications Equipment: 0.35% | | | | | | | | | | | | | | | | |
Quantenna Communications Incorporated † | | | | | | | | | | | 43,463 | | | | 787,984 | |
| | | | | | | | | | | | | | | | |
| | | | |
| Electronic Equipment, Instruments & Components: 0.52% | | | | | | | | | | | | | | | | |
Littelfuse Incorporated | | | | | | | | | | | 4,540 | | | | 689,036 | |
Mercury Computer Systems Incorporated † | | | | | | | | | | | 15,440 | | | | 466,597 | |
| | | | |
| | | | | | | | | | | | | | | 1,155,633 | |
| | | | | | | | | | | | | | | | |
The accompanying notes are an integral part of these financial statements.
| | | | |
| 12 | | Wells Fargo VT Small Cap Growth Fund | | Portfolio of investments—December 31, 2016 |
| | | | | | | | | | | | | | | | |
| Security name | | | | | | | | Shares | | | Value | |
| | | | | | | | | | | | | | | | |
| | | | |
| Internet Software & Services: 11.13% | | | | | | | | | | | | | | | | |
2U Incorporated † | | | | | | | | | | | 62,260 | | | $ | 1,877,139 | |
Coupa Software Incorporated Ǡ | | | | | | | | | | | 28,441 | | | | 711,309 | |
Envestnet Incorporated † | | | | | | | | | | | 121,011 | | | | 4,265,638 | |
Five9 Incorporated † | | | | | | | | | | | 79,590 | | | | 1,129,382 | |
LogMeIn Incorporated | | | | | | | | | | | 42,460 | | | | 4,099,513 | |
Q2 Holdings Incorporated † | | | | | | | | | | | 186,076 | | | | 5,368,293 | |
SPS Commerce Incorporated † | | | | | | | | | | | 80,222 | | | | 5,606,716 | |
Twilio Incorporated Class A Ǡ | | | | | | | | | | | 23,200 | | | | 669,320 | |
Xactly Corporation † | | | | | | | | | | | 102,615 | | | | 1,128,765 | |
| | | | |
| | | | | | | | | | | | | | | 24,856,075 | |
| | | | | | | | | | | | | | | | |
| | | | |
| IT Services: 1.79% | | | | | | | | | | | | | | | | |
InterXion Holding NV † | | | | | | | | | | | 113,690 | | | | 3,987,108 | |
| | | | | | | | | | | | | | | | |
| | | | |
| Semiconductors & Semiconductor Equipment: 5.01% | | | | | | | | | | | | | | | | |
Cavium Incorporated † | | | | | | | | | | | 44,040 | | | | 2,749,854 | |
MaxLinear Incorporated Class A † | | | | | | | | | | | 67,610 | | | | 1,473,898 | |
Microsemi Corporation † | | | | | | | | | | | 63,290 | | | | 3,415,761 | |
Monolithic Power Systems Incorporated | | | | | | | | | | | 43,390 | | | | 3,554,943 | |
| | | | |
| | | | | | | | | | | | | | | 11,194,456 | |
| | | | | | | | | | | | | | | | |
| | | | |
| Software: 12.06% | | | | | | | | | | | | | | | | |
BlackLine Incorporated † | | | | | | | | | | | 8,243 | | | | 227,754 | |
Callidus Software Incorporated † | | | | | | | | | | | 112,294 | | | | 1,886,539 | |
CommVault Systems Incorporated † | | | | | | | | | | | 31,700 | | | | 1,629,380 | |
CyberArk Software Limited † | | | | | | | | | | | 65,590 | | | | 2,984,345 | |
Guidewire Software Incorporated † | | | | | | | | | | | 17,740 | | | | 875,114 | |
HubSpot Incorporated † | | | | | | | | | | | 61,748 | | | | 2,902,156 | |
Paycom Software Incorporated Ǡ | | | | | | | | | | | 65,720 | | | | 2,989,603 | |
Paylocity Holding Corporation Ǡ | | | | | | | | | | | 36,677 | | | | 1,100,677 | |
Proofpoint Incorporated † | | | | | | | | | | | 78,880 | | | | 5,572,872 | |
Ringcentral Incorporated Class A † | | | | | | | | | | | 102,230 | | | | 2,105,938 | |
Synchronoss Technologies Incorporated † | | | | | | | | | | | 63,878 | | | | 2,446,527 | |
Talend SA Ǡ | | | | | | | | | | | 59,228 | | | | 1,314,862 | |
Tyler Technologies Incorporated † | | | | | | | | | | | 6,150 | | | | 878,036 | |
| | | | |
| | | | | | | | | | | | | | | 26,913,803 | |
| | | | | | | | | | | | | | | | |
| | | | |
Total Common Stocks (Cost $183,668,143) | | | | | | | | | | | | | | | 219,929,020 | |
| | | | | | | | | | | | | | | | |
| | | | |
| | | Yield | | | | | | | | | | |
| Short-Term Investments: 16.60% | | | | | | | | | | | | | | | | |
| | | | |
| Investment Companies: 16.60% | | | | | | | | | | | | | | | | |
Securities Lending Cash Investment LLC (l)(r)(u) | | | 0.83 | % | | | | | | | 33,209,347 | | | | 33,212,668 | |
Wells Fargo Government Money Market Fund Select Class (l)(u) | | | 0.43 | | | | | | | | 3,848,343 | | | | 3,848,343 | |
| | | | |
Total Short-Term Investments (Cost $37,057,925) | | | | | | | | | | | | | | | 37,061,011 | |
| | | | | | | | | | | | | | | | |
| | | | | | | | |
| Total investments in securities (Cost $220,726,068) * | | | 115.10 | % | | | 256,990,031 | |
Other assets and liabilities, net | | | (15.10 | ) | | | (33,717,811 | ) |
| | | | | | | | |
| Total net assets | | | 100.00 | % | | $ | 223,272,220 | |
| | | | | | | | |
The accompanying notes are an integral part of these financial statements.
| | | | | | |
| Portfolio of investments—December 31, 2016 | | Wells Fargo VT Small Cap Growth Fund | | | 13 | |
| † | Non-income-earning security |
| « | All or a portion of this security is on loan. |
| (l) | The issuer of the security is an affiliated person of the Fund as defined in the Investment Company Act of 1940. |
| (r) | The investment is a non-registered investment vehicle purchased with cash collateral received from securities on loan. |
| (u) | The rate represents the 7-day annualized yield at period end. |
| * | Cost for federal income tax purposes is $221,561,070 and unrealized gains (losses) consists of: |
| | | | |
Gross unrealized gains | | $ | 42,208,831 | |
Gross unrealized losses | | | (6,779,870 | ) |
| | | | |
Net unrealized gains | | $ | 35,428,961 | |
The accompanying notes are an integral part of these financial statements.
| | | | |
| 14 | | Wells Fargo VT Small Cap Growth Fund | | Statement of assets and liabilities—December 31, 2016 |
| | | | |
| | | | |
| |
Assets | | | | |
Investments | | | | |
In unaffiliated securities (including $32,246,651 of securities loaned), at value (cost $183,668,143) | | $ | 219,929,020 | |
In affiliated securities, at value (cost $37,057,925) | | | 37,061,011 | |
| | | | |
Total investments, at value (cost $220,726,068) | | | 256,990,031 | |
Receivable for investments sold | | | 1,691,963 | |
Receivable for Fund shares sold | | | 85,381 | |
Receivable for dividends | | | 24,852 | |
Receivable for securities lending income | | | 29,422 | |
Prepaid expenses and other assets | | | 2,940 | |
| | | | |
Total assets | | | 258,824,589 | |
| | | | |
| |
Liabilities | | | | |
Payable for investments purchased | | | 1,772,678 | |
Payable for Fund shares redeemed | | | 297,981 | |
Payable upon receipt of securities loaned | | | 33,209,000 | |
Management fee payable | | | 163,668 | |
Distribution fee payable | | | 46,439 | |
Administration fees payable | | | 16,367 | |
Accrued expenses and other liabilities | | | 46,236 | |
| | | | |
Total liabilities | | | 35,552,369 | |
| | | | |
Total net assets | | $ | 223,272,220 | |
| | | | |
| |
NET ASSETS CONSIST OF | | | | |
Paid-in capital | | $ | 180,697,262 | |
Accumulated net investment loss | | | (1,004 | ) |
Accumulated net realized gains on investments | | | 6,311,999 | |
Net unrealized gains on investments | | | 36,263,963 | |
| | | | |
Total net assets | | $ | 223,272,220 | |
| | | | |
| |
COMPUTATION OF NET ASSET VALUE PER SHARE | | | | |
Net assets – Class 1 | | $ | 20,554,468 | |
Shares outstanding – Class 11 | | | 2,415,544 | |
Net asset value per share – Class 1 | | | $8.51 | |
Net assets – Class 2 | | $ | 202,717,752 | |
Shares outstanding – Class 21 | | | 24,328,440 | |
Net asset value per share – Class 2 | | | $8.33 | |
| 1 | The Fund has an unlimited number of authorized shares. |
The accompanying notes are an integral part of these financial statements.
| | | | | | |
| Statement of operations—year ended December 31, 2016 | | Wells Fargo VT Small Cap Growth Fund | | | 15 | |
| | | | |
| | | | |
| |
Investment income | | | | |
Dividends | | $ | 1,103,452 | |
Securities lending income, net | | | 749,878 | |
Income from affiliated securities | | | 13,940 | |
| | | | |
Total investment income | | | 1,867,270 | |
| | | | |
| |
Expenses | | | | |
Management fee | | | 1,772,962 | |
Administration fees | | | | |
Class 1 | | | 16,234 | |
Class 2 | | | 161,062 | |
Distribution fee | | | | |
Class 2 | | | 503,319 | |
Custody and accounting fees | | | 31,160 | |
Professional fees | | | 41,771 | |
Shareholder report expenses | | | 44,245 | |
Trustees’ fees and expenses | | | 20,320 | |
Other fees and expenses | | | 3,445 | |
| | | | |
Total expenses | | | 2,594,518 | |
Less: Fee waivers and/or expense reimbursements | | | (356 | ) |
| | | | |
Net expenses | | | 2,594,162 | |
| | | | |
Net investment loss | | | (726,892 | ) |
| | | | |
| |
REALIZED AND UNREALIZED GAINS (LOSSES) ON INVESTMENTS | | | | |
| |
Net realized gains on: | | | | |
Unaffiliated securities | | | 6,026,244 | |
Affiliated securities | | | 582 | |
| | | | |
Net realized gains on investments | | | 6,026,826 | |
| | | | |
| |
Net change in unrealized gains (losses) on: | | | | |
Unaffiliated securities | | | 9,696,876 | |
Affiliated securities | | | 3,086 | |
| | | | |
Net change in unrealized gains (losses) on investments | | | 9,699,962 | |
| | | | |
Net realized and unrealized gains (losses) on investments | | | 15,726,788 | |
| | | | |
Net increase in net assets resulting from operations | | $ | 14,999,896 | |
| | | | |
The accompanying notes are an integral part of these financial statements.
| | | | |
| 16 | | Wells Fargo VT Small Cap Growth Fund | | Statement of changes in net assets |
| | | | | | | | | | | | | | | | |
| | | Year ended
December 31, 2016 | | | Year ended
December 31, 2015 | |
| | | | |
Operations | | | | | | | | | | | | | | | | |
Net investment loss | | | | | | $ | (726,892 | ) | | | | | | $ | (2,417,468 | ) |
Net realized gains on investments | | | | | | | 6,026,826 | | | | | | | | 21,693,855 | |
Net change in unrealized gains (losses) on investments | | | | | | | 9,699,962 | | | | | | | | (27,525,796 | ) |
| | | | |
Net increase (decrease) in net assets resulting from operations | | | | | | | 14,999,896 | | | | | | | | (8,249,409 | ) |
| | | | |
| | | | |
Distributions to shareholders from | | | | | | | | | | | | | | | | |
Net realized gains | | | | | | | | | | | | | | | | |
Class 1 | | | | | | | (1,952,885 | ) | | | | | | | (3,363,108 | ) |
Class 2 | | | | | | | (19,584,093 | ) | | | | | | | (29,271,572 | ) |
| | | | |
Total distributions to shareholders | | | | | | | (21,536,978 | ) | | | | | | | (32,634,680 | ) |
| | | | |
| | | | |
Capital share transactions | | | Shares | | | | | | | | Shares | | | | | |
Proceeds from shares sold | | | | | | | | | | | | | | | | |
Class 1 | | | 225,807 | | | | 1,843,852 | | | | 359,480 | | | | 3,697,863 | |
Class 2 | | | 1,939,958 | | | | 15,546,526 | | | | 5,605,448 | | | | 55,550,499 | |
| | | | |
| | | | | | | 17,390,378 | | | | | | | | 59,248,362 | |
| | | | |
Reinvestment of distributions | | | | | | | | | | | | | | | | |
Class 1 | | | 248,775 | | | | 1,952,885 | | | | 331,015 | | | | 3,363,108 | |
Class 2 | | | 2,543,389 | | | | 19,584,093 | | | | 2,924,233 | | | | 29,271,572 | |
| | | | |
| | | | | | | 21,536,978 | | | | | | | | 32,634,680 | |
| | | | |
Payment for shares redeemed | | | | | | | | | | | | | | | | |
Class 1 | | | (633,474 | ) | | | (5,195,825 | ) | | | (905,115 | ) | | | (8,809,137 | ) |
Class 2 | | | (6,663,346 | ) | | | (53,191,948 | ) | | | (4,812,770 | ) | | | (48,006,796 | ) |
| | | | |
| | | | | | | (58,387,773 | ) | | | | | | | (56,815,933 | ) |
| | | | |
Net increase (decrease) in net assets resulting from capital share transactions | | | | | | | (19,460,417 | ) | | | | | | | 35,067,109 | |
| | | | |
Total decrease in net assets | | | | | | | (25,997,499 | ) | | | | | | | (5,816,980 | ) |
| | | | |
| | | | |
Net assets | | | | | | | | | | | | | | | | |
Beginning of period | | | | | | | 249,269,719 | | | | | | | | 255,086,699 | |
| | | | |
End of period | | | | | | $ | 223,272,220 | | | | | | | $ | 249,269,719 | |
| | | | |
Accumulated net investment loss | | | | | | $ | (1,004 | ) | | | | | | $ | (1,032 | ) |
| | | | |
The accompanying notes are an integral part of these financial statements.
| | | | | | |
| Financial highlights | | Wells Fargo VT Small Cap Growth Fund | | | 17 | |
(For a share outstanding throughout each period)
| | | | | | | | | | | | | | | | | | | | |
| | | Year ended December 31 | |
| CLASS 1 | | 2016 | | | 2015 | | | 2014 | | | 2013 | | | 2012 | |
Net asset value, beginning of period | | | $8.70 | | | | $10.08 | | | | $11.32 | | | | $7.93 | | | | $7.71 | |
Net investment loss | | | (0.01 | )1 | | | (0.06 | ) | | | (0.07 | ) | | | (0.07 | ) | | | (0.04 | ) |
Net realized and unrealized gains (losses) on investments | | | 0.65 | | | | (0.02 | ) | | | (0.21 | ) | | | 3.98 | | | | 0.65 | |
| | | | | | | | | | | | | | | | | | | | |
Total from investment operations | | | 0.64 | | | | (0.08 | ) | | | (0.28 | ) | | | 3.91 | | | | 0.61 | |
Distributions to shareholders from | | | | | | | | | | | | | | | | | | | | |
Net realized gains | | | (0.83 | ) | | | (1.30 | ) | | | (0.96 | ) | | | (0.52 | ) | | | (0.39 | ) |
Net asset value, end of period | | | $8.51 | | | | $8.70 | | | | $10.08 | | | | $11.32 | | | | $7.93 | |
Total return | | | 8.10 | % | | | (2.63 | )% | | | (1.67 | )% | | | 50.55 | % | | | 8.11 | % |
Ratios to average net assets (annualized) | | | | | | | | | | | | | | | | | | | | |
Gross expenses | | | 0.94 | % | | | 0.93 | % | | | 0.93 | % | | | 0.93 | % | | | 0.94 | % |
Net expenses | | | 0.94 | % | | | 0.93 | % | | | 0.93 | % | | | 0.93 | % | | | 0.94 | % |
Net investment loss | | | (0.10 | )% | | | (0.69 | )% | | | (0.75 | )% | | | (0.73 | )% | | | (0.56 | )% |
Supplemental data | | | | | | | | | | | | | | | | | | | | |
Portfolio turnover rate | | | 89 | % | | | 77 | % | | | 54 | % | | | 67 | % | | | 65 | % |
Net assets, end of period (000s omitted) | | | $20,554 | | | | $22,402 | | | | $28,121 | | | | $35,192 | | | | $25,699 | |
| 1 | Calculated based upon average shares outstanding |
The accompanying notes are an integral part of these financial statements.
| | | | |
| 18 | | Wells Fargo VT Small Cap Growth Fund | | Financial highlights |
(For a share outstanding throughout each period)
| | | | | | | | | | | | | | | | | | | | |
| | | Year ended December 31 | |
| CLASS 2 | | 2016 | | | 2015 | | | 2014 | | | 2013 | | | 2012 | |
Net asset value, beginning of period | | | $8.56 | | | | $9.96 | | | | $11.22 | | | | $7.88 | | | | $7.68 | |
Net investment loss | | | (0.03 | ) | | | (0.08 | ) | | | (0.10 | ) | | | (0.09 | ) | | | (0.07 | ) |
Net realized and unrealized gains (losses) on investments | | | 0.63 | | | | (0.02 | ) | | | (0.20 | ) | | | 3.95 | | | | 0.66 | |
| | | | | | | | | | | | | | | | | | | | |
Total from investment operations | | | 0.60 | | | | (0.10 | ) | | | (0.30 | ) | | | 3.86 | | | | 0.59 | |
Distributions to shareholders from | | | | | | | | | | | | | | | | | | | | |
Net realized gains | | | (0.83 | ) | | | (1.30 | ) | | | (0.96 | ) | | | (0.52 | ) | | | (0.39 | ) |
Net asset value, end of period | | | $8.33 | | | | $8.56 | | | | $9.96 | | | | $11.22 | | | | $7.88 | |
Total return | | | 7.75 | % | | | (2.88 | )% | | | (1.88 | )% | | | 50.23 | % | | | 7.87 | % |
Ratios to average net assets (annualized) | | | | | | | | | | | | | | | | | | | | |
Gross expenses | | | 1.19 | % | | | 1.18 | % | | | 1.18 | % | | | 1.18 | % | | | 1.19 | % |
Net expenses | | | 1.19 | % | | | 1.18 | % | | | 1.18 | % | | | 1.18 | % | | | 1.19 | % |
Net investment loss | | | (0.35 | )% | | | (0.93 | )% | | | (1.00 | )% | | | (0.98 | )% | | | (0.81 | )% |
Supplemental data | | | | | | | | | | | | | | | | | | | | |
Portfolio turnover rate | | | 89 | % | | | 77 | % | | | 54 | % | | | 67 | % | | | 65 | % |
Net assets, end of period (000s omitted) | | | $202,718 | | | | $226,867 | | | | $226,966 | | | | $250,473 | | | | $182,213 | |
The accompanying notes are an integral part of these financial statements.
| | | | | | |
| Notes to financial statements | | Wells Fargo VT Small Cap Growth Fund | | | 19 | |
1. ORGANIZATION
Wells Fargo Variable Trust (the “Trust”), a Delaware statutory trust organized on March 10, 1999, is an open-end management investment company registered under the Investment Company Act of 1940, as amended (the “1940 Act”). As an investment company, the Trust follows the accounting and reporting guidance in Financial Accounting Standards Board (“FASB”) Accounting Standards Codification Topic 946, Financial Services – Investment Companies. These financial statements report on the Wells Fargo VT Small Cap Growth Fund (the “Fund”) which is a diversified series of the Trust.
2. SIGNIFICANT ACCOUNTING POLICIES
The following significant accounting policies, which are consistently followed in the preparation of the financial statements of the Fund, are in conformity with U.S. generally accepted accounting principles which require management to make estimates and assumptions that affect the reported amounts of assets and liabilities, disclosure of contingent assets and liabilities at the date of the financial statements, and the reported amounts of revenues and expenses during the reporting period. Actual results could differ from those estimates.
Securities valuation
All investments are valued each business day as of the close of regular trading on the New York Stock Exchange (generally 4 p.m. Eastern Time), although the Fund may deviate from this calculation time under unusual or unexpected circumstances.
Equity securities that are listed on a foreign or domestic exchange or market are valued at the official closing price or, if none, the last sales price. If no sale occurs on the principal exchange or market that day, the prior day’s price will be deemed “stale” and a fair value price will be determined in accordance with the Fund’s Valuation Procedures.
Investments in registered open-end investment companies are valued at net asset value. Interests in non-registered investment vehicles that are redeemable at net asset value are fair valued normally at net asset value.
Investments which are not valued using any of the methods discussed above are valued at their fair value, as determined in good faith by the Board of Trustees of the Fund. The Board of Trustees has established a Valuation Committee comprised of the Trustees and has delegated to it the authority to take any actions regarding the valuation of portfolio securities that the Valuation Committee deems necessary or appropriate, including determining the fair value of portfolio securities, unless the determination has been delegated to the Management Valuation Team of Wells Fargo Funds Management, LLC (“Funds Management”). The Board of Trustees retains the authority to make or ratify any valuation decisions or approve any changes to the Valuation Procedures as it deems appropriate. On a quarterly basis, the Board of Trustees receives reports on any valuation actions taken by the Valuation Committee or the Management Valuation Team which may include items for ratification.
Valuations of fair valued securities are compared to the next actual sales price when available, or other appropriate market values, to assess the continued appropriateness of the fair valuation methodologies used. These securities are fair valued on a day-to-day basis, taking into consideration changes to appropriate market information and any significant changes to the inputs considered in the valuation process until there is a readily available price provided on an exchange or by an independent pricing service. Valuations received from an independent pricing service or independent broker-dealer quotes are periodically validated by comparisons to most recent trades and valuations provided by other independent pricing services in addition to the review of prices by the manager and/or subadviser. Unobservable inputs used in determining fair valuations are identified based on the type of security, taking into consideration factors utilized by market participants in valuing the investment, knowledge about the issuer and the current market environment.
Security loans
The Fund may lend its securities from time to time in order to earn additional income in the form of fees or interest on securities received as collateral or the investment of any cash received as collateral. The Fund continues to receive interest or dividends on the securities loaned. The Fund receives collateral in the form of cash or securities with a value at least equal to the value of the securities on loan. The value of the loaned securities is determined at the close of each business day and any additional required collateral is delivered to the Fund on the next business day. In a securities lending transaction, the net asset value of the Fund will be affected by an increase or decrease in the value of the securities loaned and by an increase or decrease in the value of the instrument in which collateral is invested. The amount of securities lending activity undertaken by the Fund fluctuates from time to time. In the event of default or bankruptcy by the borrower, the Fund may be prevented from recovering the loaned securities or gaining access to the collateral or may experience delays or costs in doing so. In addition, the investment of any cash collateral received may lose all or part of its value. The Fund has the right under the lending agreement to recover the securities from the borrower on demand.
| | | | |
| 20 | | Wells Fargo VT Small Cap Growth Fund | | Notes to financial statements |
The Fund lends its securities through an unaffiliated securities lending agent. Cash collateral received in connection with its securities lending transactions is invested in Securities Lending Cash Investments, LLC (the “Securities Lending Fund”). The Securities Lending Fund is exempt from registration under Section 3(c)(7) of the 1940 Act and is managed by Funds Management and is subadvised by Wells Capital Management Incorporated (“WellsCap”), an affiliate of Funds Management and an indirect wholly owned subsidiary of Wells Fargo & Company (“Wells Fargo”). Funds Management receives an advisory fee starting at 0.05% and declining to 0.01% as the average daily net assets of the Securities Lending Fund increase. All of the fees received by Funds Management are paid to WellsCap for its services as subadviser. The Securities Lending Fund seeks to provide a positive return compared to the daily Fed Funds Open Rate by investing in high-quality, U.S. dollar-denominated short-term money market instruments. Securities Lending Fund investments are valued at the evaluated bid price provided by an independent pricing service. Income earned from investment in the Securities Lending Fund is included in securities lending income on the Statement of Operations.
Security transactions and income recognition
Securities transactions are recorded on a trade date basis. Realized gains or losses are recorded on the basis of identified cost.
Dividend income is recognized on the ex-dividend date.
Distributions to shareholders
Distributions to shareholders from net investment income and net realized gains, if any, are recorded on the ex-dividend date. Such distributions are determined in conformity with federal income tax regulations, which may differ in amount or character from net investment income and realized gains recognized for purposes of U.S. generally accepted accounting principles.
Federal and other taxes
The Fund intends to continue to qualify as a regulated investment company by distributing substantially all of its investment company taxable income and any net realized capital gains (after reduction for capital loss carryforwards) sufficient to relieve it from all, or substantially all, federal income taxes. Accordingly, no provision for federal income taxes was required.
The Fund’s income and federal excise tax returns and all financial records supporting those returns for the prior three fiscal years are subject to examination by the federal and Delaware revenue authorities. Management has analyzed the Fund’s tax positions taken on federal, state, and foreign tax returns for all open tax years and does not believe that there are any uncertain tax positions that require recognition of a tax liability.
Reclassifications are made to the Fund’s capital accounts for permanent tax differences to reflect income and gains available for distribution (or available capital loss carryforwards) under federal income tax regulations. U.S. generally accepted accounting principles require that certain components of net assets be adjusted to reflect permanent differences between financial and tax reporting. These reclassifications have no effect on net assets or net asset values per share. The primary permanent differences causing such reclassifications are due to dividends from certain securities and net operating losses. At December 31, 2016, as a result of permanent book-to-tax differences, the following reclassification adjustments were made on the Statement of Assets and Liabilities:
| | | | |
| Paid-in capital | | Accumulated net investment loss | | Accumulated net realized gains on investments |
$(1,134,215) | | $726,920 | | $407,295 |
Class allocations
The separate classes of shares offered by the Fund differ principally in distribution fees. Class specific expenses are charged directly to that share class. Investment income, common expenses and realized and unrealized gains (losses) on investments are allocated daily to each class of shares based on the relative proportion of net assets of each class.
3. FAIR VALUATION MEASUREMENTS
Fair value measurements of investments are determined within a framework that has established a fair value hierarchy based upon the various data inputs utilized in determining the value of the Fund’s investments. The three-level hierarchy gives the highest priority to unadjusted quoted prices in active markets for identical assets or liabilities (Level 1) and the
| | | | | | |
| Notes to financial statements | | Wells Fargo VT Small Cap Growth Fund | | | 21 | |
lowest priority to significant unobservable inputs (Level 3). The Fund’s investments are classified within the fair value hierarchy based on the lowest level of input that is significant to the fair value measurement. The inputs are summarized into three broad levels as follows:
| ∎ | | Level 1 – quoted prices in active markets for identical securities |
| ∎ | | Level 2 – other significant observable inputs (including quoted prices for similar securities, interest rates, prepayment speeds, credit risk, use of amortized cost, etc.) |
| ∎ | | Level 3 – significant unobservable inputs (including the Fund’s own assumptions in determining the fair value of investments) |
The inputs or methodologies used for valuing investments in securities are not necessarily an indication of the risk associated with investing in those securities.
The following is a summary of the inputs used in valuing the Fund’s assets and liabilities as of December 31, 2016:
| | | | | | | | | | | | | | | | |
| | | Quoted prices
(Level 1) | | | Other significant
observable inputs
(Level 2) | | | Significant
unobservable inputs (Level 3) | | | Total | |
Assets | | | | | | | | | | | | | | | | |
Investments in: | | | | | | | | | | | | | | | | |
| | | | |
Common stocks | | | | | | | | | | | | | | | | |
Consumer discretionary | | $ | 28,063,260 | | | $ | 0 | | | $ | 0 | | | $ | 28,063,260 | |
Energy | | | 8,376,793 | | | | 0 | | | | 0 | | | | 8,376,793 | |
Financials | | | 14,435,710 | | | | 0 | | | | 0 | | | | 14,435,710 | |
Health care | | | 63,185,391 | | | | 0 | | | | 0 | | | | 63,185,391 | |
Industrials | | | 36,972,807 | | | | 0 | | | | 0 | | | | 36,972,807 | |
Information technology | | | 68,895,059 | | | | 0 | | | | 0 | | | | 68,895,059 | |
| | | | |
Short-term investments | | | | | | | | | | | | | | | | |
Investment companies | | | 3,848,343 | | | | 0 | | | | 0 | | | | 3,848,343 | |
Investments measured at net asset value* | | | | | | | | | | | | | | | 33,212,668 | |
Total assets | | $ | 223,777,363 | | | $ | 0 | | | $ | 0 | | | $ | 256,990,031 | |
| * | Investments that are measured at fair value using the net asset value per share (or its equivalent) as a practical expedient have not been categorized in the fair value hierarchy. The fair value amount presented in the table is intended to permit reconciliation of the fair value hierarchy to the amounts presented in the Statement of Assets and Liabilities. The Fund’s investment in Securities Lending Cash Investments, LLC valued at $33,212,668 does not have a redemption period notice, can be redeemed daily and does not have any unfunded commitments. |
The Fund recognizes transfers between levels within the fair value hierarchy at the end of the reporting period. At December 31, 2016, the Fund did not have any transfers into/out of Level 1, Level 2, or Level 3.
4. TRANSACTIONS WITH AFFILIATES AND OTHER EXPENSES
Management fee
Funds Management, an indirect wholly owned subsidiary of Wells Fargo, is the manager of the Fund and provides advisory and fund-level administrative services under an investment management agreement. Under the investment management agreement, Funds Management is responsible for, among other services, implementing the investment objectives and strategies of the Fund, supervising the subadviser, providing fund-level administrative services in connection with the Fund’s operations, and providing any other fund-level administrative services reasonably necessary for the operation of the Fund. As compensation for its services under the investment management agreement, Funds Management is entitled to receive an annual management fee starting at 0.80% and declining to 0.63% as the average daily net assets of the Fund increase. For the year ended December 31, 2016, the management fee was equivalent to an annual rate of 0.80% of the Fund’s average daily net assets.
Funds Management has retained the services of a subadviser to provide daily portfolio management to the Fund. The fee for subadvisory services is borne by Funds Management. WellsCap is the subadviser to the Fund and is entitled to receive a fee from Funds Management at an annual rate starting at 0.55% and declining to 0.40% as the average daily net assets of the Fund increase.
| | | | |
| 22 | | Wells Fargo VT Small Cap Growth Fund | | Notes to financial statements |
Administration fees
Under a class-level administration agreement, Funds Management provides class-level administrative services to the Fund, which includes paying fees and expenses for services provided by the transfer agent, sub-transfer agents, omnibus account servicers and record-keepers. As compensation for its services under the class-level administration agreement, Funds Management receives a class level administration fee of 0.08% which is calculated based on the average daily net assets of each class.
Funds Management has contractually waived and/or reimbursed management and administration fees to the extent necessary to maintain certain net operating expense ratios for the Fund. Waiver of fees and/or reimbursement of expenses by Funds Management were made first from fund level expenses on a proportionate basis and then from class specific expenses. Funds Management has committed through April 30, 2017 to waive fees and/or reimburse expenses to the extent necessary to cap the Fund’s expenses at 0.95% for Class 1 shares and 1.20% for Class 2 shares. After this time, the cap may be increased or the commitment to maintain the cap may be terminated only with the approval of the Board of Trustees.
During the year ended December 31, 2016, State Street Bank and Trust Company, the Fund’s custodian, reimbursed the Fund $10,118 for certain out-of-pocket expenses that were billed to the Fund in error from 1998-2015. This amount is included in dividend income on the Statement of Operations. In addition, Funds Management was also reimbursed $10,417 for waivers/reimbursements it made to the Fund during the period the Fund was erroneously billed.
Distribution fee
The Trust has adopted a distribution plan for Class 2 shares of the Fund pursuant to Rule 12b-1 under the 1940 Act. A distribution fee is charged to Class 2 shares and paid to Wells Fargo Funds Distributor, LLC, the principal underwriter, at an annual rate of 0.25% of the average daily net assets of Class 2 shares.
5. INVESTMENT PORTFOLIO TRANSACTIONS
Purchases and sales of investments, excluding U.S. government obligations (if any) and short-term securities, for the year ended December 31, 2016 were $206,664,325 and $205,455,484, respectively.
The Fund may purchase or sell investment securities to other Wells Fargo funds under procedures adopted by the Board of Trustees. The procedures have been designed to ensure that these interfund transactions, which generally do not incur broker commissions, are effected at current market prices. Interfund trades are included within the respective purchases and sales amounts shown.
6. BANK BORROWINGS
The Trust and Wells Fargo Funds Trust (excluding the money market funds and certain other funds) are parties to a $250,000,000 revolving credit agreement whereby the Fund is permitted to use bank borrowings for temporary or emergency purposes, such as to fund shareholder redemption requests. Interest under the credit agreement is charged to the Fund based on a borrowing rate equal to the higher of the Federal Funds rate in effect on that day plus 1.25% or the overnight LIBOR rate in effect on that day plus 1.25%. In addition, an annual commitment fee equal to 0.25% of the unused balance is allocated to each participating fund. Prior to August 30, 2016, the revolving credit agreement amount was $200,000,000 and the annual commitment fee was equal to 0.20% of the unused balance which was allocated to each participating fund.
For the year ended December 31, 2016, there were no borrowings by the Fund under the agreement.
7. DISTRIBUTIONS TO SHAREHOLDERS
The tax character of distributions paid was $21,536,978 and $32,634,680 of long-term capital gain for the years ended December 31, 2016 and December 31, 2015, respectively.
As of December 31, 2016, the components of distributable earnings on a tax basis were as follows:
| | |
Undistributed long-term gain | | Unrealized gains |
| $7,147,001 | | $35,428,961 |
| | | | | | |
| Notes to financial statements | | Wells Fargo VT Small Cap Growth Fund | | | 23 | |
8. CONCENTRATION RISK
Concentration risks result from exposure to a limited number of sectors. A fund that invests a substantial portion of its assets in any sector may be more affected by changes in that sector than would be a fund whose investments are not heavily weighted in any sector.
9. INDEMNIFICATION
Under the Trust’s organizational documents, the officers and Trustees have been granted certain indemnification rights against certain liabilities that may arise out of performance of their duties to the Trust. Additionally, in the normal course of business, the Trust may enter into contracts with service providers that contain a variety of indemnification clauses. The Trust’s maximum exposure under these arrangements is dependent on future claims that may be made against the Fund and, therefore, cannot be estimated.
10. REGULATORY CHANGES
In October 2016, the Securities and Exchange Commission (“SEC”) adopted new rules and forms and amended existing rules and forms (together, “final rules”) intended to modernize and enhance the reporting and disclosure of information by registered investment companies and to enhance liquidity risk management by open-end mutual funds and exchange-traded funds. The final rules will enhance the quality of information available to investors and will allow the SEC to more effectively collect and use data reported by funds. In part, the final rules amend Regulation S-X and require standardized, enhanced disclosure about derivatives in the Fund’s financial statements, as well as other amendments. The compliance date for the amendments to Regulation S-X is August 1, 2017 while the compliance date for the new form types is June 1, 2018 and the compliance date for the liquidity risk management program requirements is December 1, 2018. Management is currently assessing the potential impact of these enhancements and their impact on the financial statement disclosures and reporting requirements.
| | | | |
| 24 | | Wells Fargo VT Small Cap Growth Fund | | Report of independent registered public accounting firm |
BOARD OF TRUSTEES AND SHAREHOLDERS OF WELLS FARGO VARIABLE TRUST:
We have audited the accompanying statement of assets and liabilities, including the portfolio of investments, of the Wells Fargo VT Small Cap Growth Fund (the “Fund”), one of the funds constituting the Wells Fargo Variable Trust, as of December 31, 2016, and the related statement of operations for the year then ended, the statements of changes in net assets for each of the years in the two-year period then ended, and the financial highlights for each of the years in the five-year period then ended. These financial statements and financial highlights are the responsibility of the Fund’s management. Our responsibility is to express an opinion on these financial statements and financial highlights based on our audits.
We conducted our audits in accordance with the standards of the Public Company Accounting Oversight Board (United States). Those standards require that we plan and perform the audit to obtain reasonable assurance about whether the financial statements and financial highlights are free of material misstatement. An audit includes examining, on a test basis, evidence supporting the amounts and disclosures in the financial statements. Our procedures included confirmation of securities owned as of December 31, 2016, by correspondence with the custodian and brokers, or by other appropriate auditing procedures. An audit also includes assessing the accounting principles used and significant estimates made by management, as well as evaluating the overall financial statement presentation. We believe that our audits provide a reasonable basis for our opinion.
In our opinion, the financial statements and financial highlights referred to above present fairly, in all material respects, the financial position of the Wells Fargo VT Small Cap Growth Fund as of December 31, 2016, the results of its operations for the year then ended, the changes in its net assets for each of the years in the two-year period then ended, and the financial highlights for each of the years in the five-year period then ended, in conformity with U.S. generally accepted accounting principles.

Boston, Massachusetts
February 23, 2017
| | | | | | |
| Other information (unaudited) | | Wells Fargo VT Small Cap Growth Fund | | | 25 | |
TAX INFORMATION
Pursuant to Section 852 of the Internal Revenue Code, $21,536,978 was designated as a 20% rate gain distribution for the fiscal year ended December 31, 2016.
PROXY VOTING INFORMATION
A description of the policies and procedures that the Fund uses to determine how to vote proxies relating to portfolio securities is available, upon request, by calling 1-800-260-5969, visiting our website at wellsfargofunds.com, or visiting the SEC website at sec.gov. Information regarding how the Fund voted proxies relating to portfolio securities during the most recent 12-month period ended June 30 is available on the Fund’s website at wellsfargofunds.com or by visiting the SEC website at sec.gov.
PORTFOLIO HOLDINGS INFORMATION
The complete portfolio holdings for the Fund are publicly available monthly on the Fund’s website (wellsfargofunds.com), on a one-month delayed basis. In addition, top ten holdings information (excluding derivative positions) for the Fund is publicly available on the Fund’s website on a monthly, seven-day or more delayed basis. The Fund files its complete schedule of portfolio holdings with the SEC for the first and third quarters of each fiscal year on Form N-Q, which is available by visiting the SEC website at sec.gov. In addition, the Fund’s Form N-Q may be reviewed and copied at the SEC’s Public Reference Room in Washington, DC, and at regional offices in New York City, at 233 Broadway, and in Chicago, at 175 West Jackson Boulevard, Suite 900. Information about the Public Reference Room may be obtained by calling 1-800-SEC-0330.
| | | | |
| 26 | | Wells Fargo VT Small Cap Growth Fund | | Other information (unaudited) |
BOARD OF TRUSTEES AND OFFICERS
Each of the Trustees and Officers1 listed in the table below acts in identical capacities for each fund in the Wells Fargo family of funds, which consists of 139 mutual funds comprising the Wells Fargo Funds Trust, Wells Fargo Variable Trust, Wells Fargo Master Trust and four closed-end funds (collectively the “Fund Complex”). This table should be read in conjunction with the Prospectus and the Statement of Additional Information2. The mailing address of each Trustee and Officer is 525 Market Street, 12th Floor, San Francisco, CA 94105. Each Trustee and Officer serves an indefinite term, however, each Trustee serves such term until reaching the mandatory retirement age established by the Trustees.
Independent Trustees
| | | | | | |
Name and
year of birth | | Position held and length of service* | | Principal occupations during past five years or longer | | Current other public company or
investment company
directorships |
| William R. Ebsworth (Born 1957) | | Trustee, since 2015 | | Retired. From 1984 to 2013, equities analyst, portfolio manager, research director and chief financial officer at Fidelity Management and Research Company in Boston, Tokyo, and Hong Kong and retired in 2013 as Chief Investment Officer of Fidelity Strategic Advisers, Inc. where he lead a team of investment professionals managing client assets. Prior thereto, Board member of Hong Kong Securities Clearing Co., Hong Kong Options Clearing Corp., the Thailand International Fund, Ltd., Fidelity Investments Life Insurance Company, and Empire Fidelity Investments Life Insurance Company. Board member of the Fonté Foundation (non-profit organization) and the Vincent Memorial Hospital Endowment (non-profit organization), where he serves on the Investment Committee and as a Chair of the Audit Committee. Mr. Ebsworth is a CFA® charterholder and an Adjunct Lecturer, Finance, at Babson College. | | Asset Allocation Trust |
Jane A. Freeman (Born 1953) | | Trustee, since 2015 | | Retired. From 2012 to 2014 and 1999 to 2008, Chief Financial Officer of Scientific Learning Corporation. From 2008 to 2012, Ms. Freeman provided consulting services related to strategic business projects. Prior to 1999, Portfolio Manager at Rockefeller & Co. and Scudder, Stevens & Clark. Board member of the Harding Loevner Funds from 1996 to 2014, serving as both Lead Independent Director and chair of the Audit Committee. Board member of the Russell Exchange Traded Funds Trust from 2011 to 2012 and the chair of the Audit Committee. Ms. Freeman is Chair of Taproot Foundation (non-profit organization), a Board Member of Ruth Bancroft Garden (non-profit organization) and an inactive chartered financial analyst. | | Asset Allocation Trust |
Peter G. Gordon** (Born 1942) | | Trustee, since 1998; Chairman, since 2005 | | Co-Founder, Retired Chairman, President and CEO of Crystal Geyser Water Company. Trustee Emeritus, Colby College. | | Asset Allocation Trust |
Isaiah Harris, Jr. (Born 1952) | | Trustee, since 2009 | | Retired. Chairman of the Board of CIGNA Corporation since 2009, and Director since 2005. From 2003 to 2011, Director of Deluxe Corporation. Prior thereto, President and CEO of BellSouth Advertising and Publishing Corp. from 2005 to 2007, President and CEO of BellSouth Enterprises from 2004 to 2005 and President of BellSouth Consumer Services from 2000 to 2003. Emeritus member of the Iowa State University Foundation Board of Governors. Emeritus Member of the Advisory Board of Iowa State University School of Business. Advisory Board Member, Palm Harbor Academy (charter school). Advisory Board Member, Child Evangelism Fellowship (non-profit). Mr. Harris is a certified public accountant (inactive status). | | CIGNA Corporation; Asset Allocation Trust |
Judith M. Johnson (Born 1949) | | Trustee, since 2008; Audit Committee Chairman, since 2008 | | Retired. Prior thereto, Chief Executive Officer and Chief Investment Officer of Minneapolis Employees Retirement Fund from 1996 to 2008. Ms. Johnson is an attorney, certified public accountant and a certified managerial accountant. | | Asset Allocation Trust |
David F. Larcker (Born 1950) | | Trustee, since 2009 | | James Irvin Miller Professor of Accounting at the Graduate School of Business, Stanford University, Director of the Corporate Governance Research Initiative and Senior Faculty of The Rock Center for Corporate Governance since 2006. From 2005 to 2008, Professor of Accounting at the Graduate School of Business, Stanford University. Prior thereto, Ernst & Young Professor of Accounting at The Wharton School, University of Pennsylvania from 1985 to 2005. | | Asset Allocation Trust |
| | | | | | |
| Other information (unaudited) | | Wells Fargo VT Small Cap Growth Fund | | | 27 | |
| | | | | | |
Name and
year of birth | | Position held and length of service* | | Principal occupations during past five years or longer | | Current other public company or
investment company
directorships |
Olivia S. Mitchell (Born 1953) | | Trustee, since 2006 | | International Foundation of Employee Benefit Plans Professor, Wharton School of the University of Pennsylvania since 1993. Director of Wharton’s Pension Research Council and Boettner Center on Pensions & Retirement Research, and Research Associate at the National Bureau of Economic Research. Previously, Cornell University Professor from 1978 to 1993. | | Asset Allocation Trust |
Timothy J. Penny (Born 1951) | | Trustee, since 1996 | | President and Chief Executive Officer of Southern Minnesota Initiative Foundation, a non-profit organization, since 2007 and Senior Fellow at the Humphrey Institute Policy Forum at the University of Minnesota since 1995. Member of the Board of Trustees of NorthStar Education Finance, Inc., a non-profit organization, since 2007. | | Asset Allocation Trust |
Michael S. Scofield (Born 1943) | | Trustee, since 2010 | | Served on the Investment Company Institute’s Board of Governors and Executive Committee from 2008-2011 as well the Governing Council of the Independent Directors Council from 2006-2011 and the Independent Directors Council Executive Committee from 2008-2011. Chairman of the IDC from 2008-2010. Institutional Investor (Fund Directions) Trustee of Year in 2007. Trustee of the Evergreen Funds complex (and its predecessors) from 1984 to 2010. Chairman of the Evergreen Funds from 2000-2010. Former Trustee of the Mentor Funds. Retired Attorney, Law Offices of Michael S. Scofield. | | Asset Allocation Trust |
| * | Length of service dates reflect the Trustee’s commencement of service with the Trust’s predecessor entities, where applicable. |
| ** | Peter Gordon is expected to retire on December 31, 2017. |
Officers
| | | | | | |
Name and year of birth | | Position held and length of service | | Principal occupations during past five years or longer | | |
Andrew Owen3 (Born 1960) | | President, since 2017 | | Executive Vice President of Wells Fargo Bank, N.A. and President of Wells Fargo & Company and Head of Affiliated Managaers, Wells Fargo Asset Management, since 2014. Executive Vice President responsible for marketing, investments and product development for Wells Fargo Funds Management, LLC, from 2009 to 2014. | | |
Jeremy DePalma1 (Born 1974) | | Treasurer, since 2012 | | Senior Vice President of Wells Fargo Funds Management, LLC since 2009. Senior Vice President of Evergreen Investment Management Company, LLC from 2008 to 2010 and head of the Fund Reporting and Control Team within Fund Administration from 2005 to 2010. | | |
C. David Messman (Born 1960) | | Secretary, since 2000; Chief Legal Officer, since 2003 | | Senior Vice President and Secretary of Wells Fargo Funds Management, LLC since 2001. Assistant General Counsel of Wells Fargo Bank, N.A. since 2013 and Vice President and Managing Counsel of Wells Fargo Bank, N.A. from 1996 to 2013. | | |
Michael Whitaker (Born 1967) | | Chief Compliance Officer, since 2016 | | Executive Vice President of Wells Fargo Funds Management, LLC since 2016. Chief Compliance Officer of Fidelity’s Fixed Income Funds and Asset Allocation Funds from 2008 to 2016, Compliance Officer of FMR Co., Inc. from 2014 to 2016, Fidelity Investments Money Management, Inc. from 2014 to 2016, Fidelity Investments from 2007 to 2016. | | |
David Berardi (Born 1975) | | Assistant Treasurer, since 2009 | | Vice President of Wells Fargo Funds Management, LLC since 2009. Vice President of Evergreen Investment Management Company, LLC from 2008 to 2010. Manager of Fund Reporting and Control for Evergreen Investment Management Company, LLC from 2004 to 2010. | | |
| 1 | Jeremy DePalma acts as Treasurer of 69 funds and Assistant Treasurer of 70 funds in the Fund Complex. |
| 2 | The Statement of Additional Information includes additional information about the Trustees and is available, without charge, upon request, by calling 1-800-260-5969 or by visiting the website at wellsfargofunds.com. |
| 3 | Andrew Owen became President on January 1, 2017. |
| | | | |
| 28 | | Wells Fargo VT Small Cap Growth Fund | | List of abbreviations |
The following is a list of common abbreviations for terms and entities that may have appeared in this report.
| ACA | — ACA Financial Guaranty Corporation |
| ADR | — American depositary receipt |
| ADS | — American depositary shares |
| AGC | — Assured Guaranty Corporation |
| AGM | — Assured Guaranty Municipal |
| Ambac | — Ambac Financial Group Incorporated |
| AMT | — Alternative minimum tax |
| BAN | — Bond anticipation notes |
| BHAC | — Berkshire Hathaway Assurance Corporation |
| CAB | — Capital appreciation bond |
| CCAB | — Convertible capital appreciation bond |
| CDA | — Community Development Authority |
| CDO | — Collateralized debt obligation |
| DRIVER | — Derivative inverse tax-exempt receipts |
| DW&P | — Department of Water & Power |
| DWR | — Department of Water Resources |
| ECFA | — Educational & Cultural Facilities Authority |
| EDA | — Economic Development Authority |
| EDFA | — Economic Development Finance Authority |
| ETF | — Exchange-traded fund |
| FDIC | — Federal Deposit Insurance Corporation |
| FFCB | — Federal Farm Credit Banks |
| FGIC | — Financial Guaranty Insurance Corporation |
| FHA | — Federal Housing Administration |
| FHLB | — Federal Home Loan Bank |
| FHLMC | — Federal Home Loan Mortgage Corporation |
| FICO | — The Financing Corporation |
| FNMA | — Federal National Mortgage Association |
| GDR | — Global depositary receipt |
| GNMA | — Government National Mortgage Association |
| HCFR | — Healthcare facilities revenue |
| HEFA | — Health & Educational Facilities Authority |
| HEFAR | — Higher education facilities authority revenue |
| HFA | — Housing Finance Authority |
| HFFA | — Health Facilities Financing Authority |
| HUD | — Department of Housing and Urban Development |
| IDA | — Industrial Development Authority |
| IDAG | — Industrial Development Agency |
| KRW | — Republic of Korea won |
| LIBOR | — London Interbank Offered Rate |
| LIFER | — Long Inverse Floating Exempt Receipts |
| LLC | — Limited liability company |
| LLLP | — Limited liability limited partnership |
| LLP | — Limited liability partnership |
| MBIA | — Municipal Bond Insurance Association |
| MFHR | — Multifamily housing revenue |
| MSTR | — Municipal securities trust receipts |
| MUD | — Municipal Utility District |
| National | — National Public Finance Guarantee Corporation |
| PCFA | — Pollution Control Financing Authority |
| PCL | — Public Company Limited |
| PCR | — Pollution control revenue |
| PFA | — Public Finance Authority |
| PFFA | — Public Facilities Financing Authority |
| PFOTER | — Puttable floating option tax-exempt receipts |
| plc | — Public limited company |
| PUTTER | — Puttable tax-exempt receipts |
| R&D | — Research & development |
| Radian | — Radian Asset Assurance |
| RAN | — Revenue anticipation notes |
| RDA | — Redevelopment Authority |
| RDFA | — Redevelopment Finance Authority |
| REIT | — Real estate investment trust |
| ROC | — Reset option certificates |
| SAVRS | — Select auction variable rate securities |
| SBA | — Small Business Authority |
| SDR | — Swedish depositary receipt |
| SFHR | — Single-family housing revenue |
| SFMR | — Single-family mortgage revenue |
| SPA | — Standby purchase agreement |
| SPDR | — Standard & Poor’s Depositary Receipts |
| SPEAR | — Short Puttable Exempt Adjustable Receipts |
| STRIPS | — Separate trading of registered interest and |
| TAN | — Tax anticipation notes |
| TIPS | — Treasury inflation-protected securities |
| TRAN | — Tax revenue anticipation notes |
| TTFA | — Transportation Trust Fund Authority |
| TVA | — Tennessee Valley Authority |

For more information
More information about Wells Fargo Funds is available free upon request. To obtain literature, please write, email, visit the Fund’s website, or call:
Wells Fargo Funds
P.O. Box 8266
Boston, MA 02266-8266
Email: fundservice@wellsfargo.com
Website: wellsfargofunds.com
Individual investors: 1-800-222-8222
Retail investment professionals: 1-888-877-9275
Institutional investment professionals: 1-866-765-0778
This report and the financial statements contained herein are submitted for the general information of the shareholders of the Fund. If this report is used for promotional purposes, distribution of the report must be accompanied or preceded by a current prospectus. Before investing, please consider the investment objectives, risks, charges, and expenses of the investment. For a current prospectus and, if available, a summary prospectus, containing this information, call 1-800-260-5969 or visit the Fund’s website at wellsfargofunds.com. Read the prospectus carefully before you invest or send money.
Wells Fargo Asset Management (WFAM) is a trade name used by the asset management businesses of Wells Fargo & Company. Wells Fargo Funds Management, LLC, a wholly owned subsidiary of Wells Fargo & Company, provides investment advisory and administrative services for Wells Fargo Funds. Other affiliates of Wells Fargo & Company provide subadvisory and other services for the funds. The funds are distributed by Wells Fargo Funds Distributor, LLC, Member FINRA, an affiliate of Wells Fargo & Company. Neither Wells Fargo Funds Management nor Wells Fargo Funds Distributor has Fund customer accounts/assets, and neither provides investment advice/recommendations or acts as an investment advice fiduciary to any investor.
NOT FDIC INSURED ◾ NO BANK GUARANTEE ◾ MAY LOSE VALUE
© 2016 Wells Fargo Funds Management, LLC. All rights reserved.
| | |
| | 300473 02-17 AVT7/AR153 12-16 |
ITEM 2. CODE OF ETHICS
(a) As of the end of the period, covered by the report, Wells Fargo Variable Trust has adopted a code of ethics that applies to its President and Treasurer. A copy of the code of ethics is filed as an exhibit to this Form N-CSR.
(c) During the period covered by this report, there were no amendments to the provisions of the code of ethics adopted in Item 2(a) above.
(d) During the period covered by this report, there were no implicit or explicit waivers to the provisions of the code of ethics adopted in Item 2(a) above.
ITEM 3. AUDIT COMMITTEE FINANCIAL EXPERT
The Board of Trustees of Wells Fargo Variable Trust has determined that Judith Johnson is an audit committee financial expert, as defined in Item 3 of Form N-CSR. Mrs. Johnson is independent for purposes of Item 3 of Form N-CSR.
ITEM 4. PRINCIPAL ACCOUNTANT FEES AND SERVICES
(a), (b), (c), (d) The following table presents aggregate fees billed in each of the last two fiscal years for services rendered to the Registrant by the Registrant’s principal accountant. These fees were billed to the registrant and were approved by the Registrant’s audit committee.
| | | | | | | | |
| | | Fiscal
year ended
December 31, 2016 | | | Fiscal
year ended
December 31, 2015 | |
Audit fees | | $ | 177,761 | | | $ | 268,260 | |
Audit-related fees | | | — | | | | — | |
Tax fees (1) | | | 14,980 | | | | 21,250 | |
All other fees | | | — | | | | — | |
| | | | | | | | |
| | $ | 192,741 | | | $ | 289,510 | |
| | | | | | | | |
| (1) | Tax fees consist of fees for tax compliance, tax advice, tax planning and excise tax. |
(e) The Chairman of the Audit Committees is authorized to pre-approve: (1) audit services to the mutual funds of Wells Fargo Variable Trust; (2) non-audit tax or compliance consulting or training services provided to the Funds by the independent auditors (“Auditors”) if the fees for any particular engagement are not anticipated to exceed $50,000; and (3) non-audit tax or compliance consulting or training services provided by the Auditors to a Fund’s investment adviser and its controlling entities (where pre-approval is required because the engagement relates directly to the operations and financial reporting of the Fund) if the fee to the Auditors for any particular engagement is not anticipated to exceed $50,000. For any such pre-approval sought from the Chairman, Management shall prepare a brief description of the proposed services. If the Chairman approves of such service, he or she shall sign the statement prepared by Management. Such written statement shall be presented to the full Committees at their next regularly scheduled meetings.
(f) Not applicable
(g) Not applicable
(h) Not applicable
ITEM 5. AUDIT COMMITTEE OF LISTED REGISTRANTS
Not applicable.
ITEM 6. INVESTMENTS
A Portfolio of Investments for each series of Wells Fargo Variable Trust is included as part of the report to shareholders filed under Item 1 of this Form.
ITEM 7. DISCLOSURE OF PROXY VOTING POLICIES AND PROCEDURES FOR CLOSED-END MANAGEMENT INVESTMENT COMPANIES
Not applicable.
ITEM 8. PORTFOLIO MANAGERS OF CLOSED-END MANAGEMENT INVESTMENT COMPANIES
Not applicable.
ITEM 9. PURCHASES OF EQUITY SECURITIES BY CLOSED-END MANAGEMENT INVESTMENT COMPANY AND AFFILIATED PURCHASERS
Not applicable.
ITEM 10. SUBMISSION OF MATTERS TO A VOTE OF SECURITY HOLDERS
There have been no material changes to the procedures by which shareholders may recommend nominees to the registrant’s Board of Trustees that have been implemented since the registrant’s last provided disclosure in response to the requirements of this Item.
ITEM 11. CONTROLS AND PROCEDURES
(a) The President and Treasurer have concluded that the Wells Fargo Variable Trust (the “Trust”) disclosure controls and procedures (as defined in Rule 30a-3(c) under the Investment Company Act of 1940) provide reasonable assurances that material information relating to the Trust is made known to them by the appropriate persons based on their evaluation of these controls and procedures as of a date within 90 days of the filing of this report.
(b) There were no significant changes in the Trust’s internal controls over financial reporting (as defined in Rule 30a-3(d) under the Investment Company Act of 1940) that occurred during the second fiscal quarter of the period covered by this report that materially affected, or is reasonably likely to materially affect, the registrant’s internal control over financial reporting.
ITEM 12. EXHIBITS
(a)(1) Code of Ethics pursuant to Item 2 of Form N-CSR is filed and attached hereto as Exhibit COE.
(a)(2) Certification pursuant to Rule 30a-2(a) under the Investment Company Act of 1940 (17 CFR 270.30a-2(a)) is filed and attached hereto as Exhibit 99.CERT.
(a)(3) Not applicable.
(b) Certification pursuant to Rule 30a-2(b) under the Investment Company Act of 1940 (17 CFR 270.30a-2(b)) is filed and attached hereto as Exhibit 99.906CERT.
SIGNATURES
Pursuant to the requirements of the Securities Exchange Act of 1934 and the Investment Company Act of 1940, the registrant has duly caused this report to be signed on its behalf by the undersigned, thereunto duly authorized.
| | |
| Wells Fargo Variable Trust |
| |
| By: | | |
| |
| | /s/ Andrew Owen Andrew Owen President |
| |
| Date: | | February 23, 2017 |
Pursuant to the requirements of the Securities Exchange Act of 1934 and the Investment Company Act of 1940, this report has been signed below by the following persons on behalf of the registrant and in the capacities and on the date indicated.
| | |
| Wells Fargo Variable Trust |
| |
| By: | | |
| |
| | /s/ Andrew Owen Andrew Owen President |
| |
| Date: | | February 23, 2017 |
| |
| By: | | |
| |
| | /s/ Jeremy DePalma Jeremy DePalma Treasurer |
| |
| Date: | | February 23, 2017 |