
UNITED STATES
SECURITIES AND EXCHANGE COMMISSION
Washington, D.C. 20549
FORMN-CSR
CERTIFIED SHAREHOLDER REPORT OF REGISTERED
MANAGEMENT INVESTMENT COMPANIES
Investment Company Act file number:811-09255
Wells Fargo Variable Trust
(Exact name of registrant as specified in charter)
525 Market St., San Francisco, CA 94105
(Address of principal executive offices) (Zip code)
Catherine Kennedy
Wells Fargo Funds Management, LLC
525 Market St., San Francisco, CA 94105
(Name and address of agent for service)
Registrant’s telephone number, including area code:800-222-8222
Date of fiscal year end: December 31
Registrant is making a filing for 6 of its series:
Wells Fargo VT Discovery Fund, Wells Fargo VT Index Asset Allocation Fund, Wells Fargo VT International Equity Fund, Wells Fargo VT Omega Growth Fund, Wells Fargo VT Opportunity Fund, and Wells Fargo VT Small Cap Growth Fund.
Date of reporting period: December 31, 2019
ITEM 1. REPORT TO STOCKHOLDERS
Annual Report
December 31, 2019
Wells Fargo VT Discovery Fund
Beginning on January 1, 2021, as permitted by new regulations adopted by the Securities and Exchange Commission, paper copies of the Wells Fargo Funds’ annual and semi-annual shareholder reports issued after this date will no longer be sent by mail, unless you specifically request paper copies of the reports. Instead, the reports will be made available on the Funds’ website, and you will be notified by mail each time a report is posted and provided with a website address to access the report.
If you already elected to receive shareholder reports electronically, you will not be affected by this change and you need not take any action. You may elect to receive shareholder reports and other communications from the Fund electronically at any time by contacting your financial intermediary (such as a broker-dealer or bank) or, if you are a direct investor, by calling1-800-222-8222 or by enrolling at wellsfargo.com/advantagedelivery.
You may elect to receive all future reports in paper free of charge. If you invest through a financial intermediary, you can contact your financial intermediary to request that you continue to receive paper copies of your shareholder reports; if you invest directly with the Fund, you can call 1-800-222-8222. Your election to receive reports in paper will apply to all Wells Fargo Funds held in your account with your financial intermediary or, if you are a direct investor, to all Wells Fargo Funds that you hold.
|
|
|
Reduce clutter. Save trees. |
Sign up for electronic delivery of prospectuses and shareholder reports atwellsfargo.com/advantagedelivery |
The views expressed and any forward-looking statements are as of December 31, 2019, unless otherwise noted, and are those of the Fund managers and/or Wells Fargo Asset Management. Discussions of individual securities, or the markets generally, or any Wells Fargo Fund are not intended as individual recommendations. Future events or results may vary significantly from those expressed in any forward-looking statements. The views expressed are subject to change at any time in response to changing circumstances in the market. Wells Fargo Asset Management and the Fund disclaim any obligation to publicly update or revise any views expressed or forward-looking statements.
INVESTMENT PRODUCTS: NOT FDIC INSURED ◾ NO BANK GUARANTEE ◾ MAY LOSE VALUE
Wells Fargo VT Discovery Fund | 1
Letter to shareholders (unaudited)

Andrew Owen
President
Wells Fargo Funds
“Financial markets rebounded strongly to open 2019 on a positive note”
Dear Shareholder:
We are pleased to offer you this annual report for the Wells Fargo VT Discovery Fund for the12-month period that ended December 31, 2019. Despite some periods of market volatility, the year was strongly positive for financial markets as supportive central banks more than offset concerns over slowing global economic growth and international trade tensions.
Overall, both fixed-income and equity investors enjoyed healthy annual returns. For the period, U.S. stocks, based on the S&P 500 Index,1 gained 31.49% and international stocks, as measured by the MSCI ACWI ex USA Index (Net),2 returned 21.51%. The MSCI EM Index (Net)3 gained 18.42%. For bond investors, the Bloomberg Barclays U.S. Aggregate Bond Index4 added 8.72%, the Bloomberg Barclays Global Aggregateex-USD Index5 returned 5.09%, the Bloomberg Barclays Municipal Bond Index6 gained 7.54%, and the ICE BofA U.S. High Yield Index7 added 14.41%.
The year began with a strong market rebound.
After a volatile end of 2018 involving sharp losses, financial markets rebounded strongly to open 2019 on a positive note, as investors were encouraged by a sudden pivot by the U.S. Federal Reserve (Fed) to a more accommodative stance after a series of increases to the federal funds rate in 2017 and 2018. The S&P 500 Index gained 8.01% in January, the best monthly performance in 30 years. Returns for the MSCI ACWI ex USA Index (Net), the Bloomberg Barclays U.S. Aggregate Bond Index, and the Bloomberg Barclays Global Aggregateex-USD Index also were positive.
In February 2019, signs of slowing global growth grew more ominous. The Bureau of Economic Analysis announced fourth-quarter 2018 gross domestic product (GDP) grew at an annualized 2.2% rate, down from the levels of the prior two quarters. In a February report, the Bank of England forecast the slowest growth since the financial crisis for 2019. China and the U.S. continued to wrangle over trade issues. By the end of the first quarter of 2019, more accommodative Fed sentiment and steady, if not spectacular, U.S. economic and business metrics encouraged domestic investors.
Early second-quarter 2019 enthusiasm among investors faded.
During April, sustained low inflation, solid employment data, and first-quarter U.S. GDP of an annualized rate of 3.2% supported favorable sentiment. During May, markets
| 1 | The S&P 500 Index consists of 500 stocks chosen for market size, liquidity, and industry group representation. It is a market-value-weighted index with each stock’s weight in the index proportionate to its market value. You cannot invest directly in an index. |
| 2 | The Morgan Stanley Capital International (MSCI) All Country World Index (ACWI) ex USA Index (Net) is a free-float-adjusted market-capitalization-weighted index that is designed to measure the equity market performance of developed markets, excluding the United States. Source: MSCI. MSCI makes no express or implied warranties or representations and shall have no liability whatsoever with respect to any MSCI data contained herein. The MSCI data may not be further redistributed or used as a basis for other indices or any securities or financial products. This report is not approved, reviewed, or produced by MSCI. You cannot invest directly in an index. |
| 3 | The MSCI Emerging Markets (EM) Index (Net) is a free-float-adjusted market-capitalization-weighted index that is designed to measure equity market performance of emerging markets. You cannot invest directly in an index. |
| 4 | The Bloomberg Barclays U.S. Aggregate Bond Index is a broad-based benchmark that measures the investment-grade, U.S. dollar-denominated, fixed-rate taxable bond market, including Treasuries, government-related and corporate securities, mortgage-backed securities (agency fixed-rate and hybrid adjustable-rate mortgage pass-throughs), asset-backed securities, and commercial mortgage-backed securities. You cannot invest directly in an index. |
| 5 | The Bloomberg Barclays Global Aggregateex-USD Index is an unmanaged index that provides a broad-based measure of the global investment-grade fixed-income markets excluding the U.S. dollar-denominated debt market. You cannot invest directly in an index. |
| 6 | The Bloomberg Barclays Municipal Bond Index is an unmanaged index composed of long-termtax-exempt bonds with a minimum credit rating of Baa. You cannot invest directly in an index. |
| 7 | The ICE BofA U.S. High Yield Index is a market-capitalization-weighted index of domestic and Yankee high-yield bonds. The index tracks the performance of high-yield securities traded in the U.S. bond market. You cannot invest directly in an index. Copyright 2020. ICE Data Indices, LLC. All rights reserved. |
2 | Wells Fargo VT Discovery Fund
Letter to shareholders (unaudited)
tumbled on mixed investment signals. In the U.S., partisan wrangling ramped up as Democrats and Republicans set their sights on 2020 presidential politics. The U.K.’s Brexit disagreements caused Prime Minister Theresa May to resign. Boris Johnson succeeded her only to exacerbate uncertainty about Brexit’s resolution ahead of an October 2019 deadline. The European Commission downgraded the 2019 growth forecast to 1.2%. The U.S. increased tariffs on products from China, China responded, and then talks broke down. President Donald Trump threatened to turn his foreign policy tariff tool to Mexico over immigration issues.
Midway through the year, investors regrouped, sentiment turned positive, and U.S. equity markets advanced during June and July. The gains, primarily driven by geopolitical and monetary policy events, pushed equity markets to new highs. European Central Bank President Mario Draghi indicated the bank was ready to cut rates or buy more assets to prop up inflation if needed. President Trump backed off of tariff threats against Mexico and China. In the U.S., the Fed implemented a 0.25% federal funds rate cut in July.
Later in July, the U.S. reversed course and threatened to impose higher tariffs on China’s exports after talks failed. China responded with tariff threats of its own and devalued the renminbi, a move that roiled global markets. Major U.S. stock market indices closed July with the worst weekly results of the year. Bond prices gained as Treasury yields fell to multiyear lows, and the yield curve inverted at multiple points along the30-year arc.
In August, U.S.-China trade tensions continued with no signs of compromise. Evidence of a continued global economic slowdown mounted, and central banks in China, New Zealand, and Thailand cut interest rates. Industrial and manufacturing data declined in China, Canada, Japan, and Germany. Adding to global uncertainty, Italy’s prime minister resigned, many feared a crackdown in Hong Kong as protestors sustained their calls for reform, and Boris Johnson planned to suspend Parliament as Brexit’s deadline neared.
In the U.S., the Fed cut interest rates a second time in September. U.S. manufacturing data disappointed investors. The U.S. Congress announced it would pursue an impeachment investigation of President Trump. Meanwhile, the Brexit impasse showed no signs of resolution. Officials in China said that hitting the country’s economic growth goals for the year would be difficult considering the weight of tariffs and trade restrictions. Although the S&P 500 Index finished the third quarter with the bestyear-to-date returns in more than 20 years, concerns about future returns remained.
The fourth quarter started on a strong note, with U.S.-China trade tensions relaxing in October 2019 along with renewed optimism for a U.K. Brexit deal and positive macroeconomic data. The initial estimate of U.S. third-quarter GDP growth was a resilient 1.9% annualized rate, while the U.S. unemployment rate fell to a50-year low of 3.5% in September. However, despite resilience among U.S. consumers, business confidence declined while manufacturing activity contracted. Concerned with a potential economic slowdown, the Fed lowered interest rates another quarter point in late October, its third rate cut in four months. This helped push the S&P 500 Index to a newall-time high, while emerging market equities rallied and global bonds declined overall, reflecting a broad pickup in risk appetite.
Equity markets continued to rally in November despite ongoing geopolitical risks. Hopes for a U.S.-China trade deal buoyed investor confidence. U.S. business sentiment improved slightly, and manufacturing and services activity picked up. Throughout the month, central bank actions were on hold. With that positive backdrop, developed market equities outpaced those in emerging markets, and U.S. stocks, as reflected by the S&P 500 Index, outperformednon-U.S. stocks overall. While consumer confidence and purchasing manager activity rose in the eurozone, China reported weakening manufacturing and consumer data. Bond yields rose marginally, leading to slightly negative returns for global government and investment-grade corporate bonds.
“Equity markets continued to rally in November despite ongoing geopolitical risks.”
Wells Fargo VT Discovery Fund | 3
Letter to shareholders (unaudited)
Financial markets ended the year on a broadly positive note, with the U.S. and China reaching an accord on a Phase One trade deal, with some details to be worked out. That, along with the landslide win by thepro-Brexit U.K. Conservative Party in a national election and ongoing central bank support, gave investors greater certainty and confidence. U.S. economic indicators were generally positive, with the exception of manufacturing activity and business confidence. However, consumer confidence was resilient, fed by a robust labor market, tame inflation, and lower interest rates, which boosted housing affordability and stimulated homebuyer activity. The impeachment of U.S. President Donald Trump, while historically noteworthy, had little impact on markets. Meanwhile, slowing Chinese economic activity, partly attributable to the trade war, led to further government stimulus atyear-end through lower reserve ratios, allowing banks to lend more money.
Don’t let short-term uncertainty derail long-term investment goals.
Periods of investment uncertainty can present challenges, but experience has taught us that maintaining long-term investment goals can be an effective way to plan for the future. To help you create a sound strategy based on your personal goals and risk tolerance, Wells Fargo Funds offers more than 100 mutual funds spanning a wide range of asset classes and investment styles. Although diversification cannot guarantee an investment profit or prevent losses, we believe it can be an effective way to manage investment risk and potentially smooth out overall portfolio performance. We encourage investors to know their investments and to understand that appropriate levels of risk-taking may unlock opportunities.
Thank you for choosing to invest with Wells Fargo Funds. We appreciate your confidence in us and remain committed to helping you meet your financial needs.
Sincerely,

Andrew Owen
President
Wells Fargo Funds
|
|
|
For further information about your Fund, contact your investment professional, visit our website at wfam.com, or call us directly at1-800-260-5969. |
4 | Wells Fargo VT Discovery Fund
This page is intentionally left blank.
Performance highlights (unaudited)
Investment objective
The Fund seeks long-term capital appreciation.
Manager
Wells Fargo Funds Management, LLC
Subadviser
Wells Capital Management Incorporated
Portfolio managers
Michael T. Smith, CFA®‡
Christopher J. Warner, CFA®‡
Average annual total returns (%) as of December 31, 2019
| | | | | | | | | | | | | | | | | | | | | | |
| | | |
| | | | | | | | Expense ratios1 (%) | |
| | | | | | |
| | | Inception date | | 1 year | | | 5 year | | | 10 year | | | Gross | | | Net2 | |
| | | | | | | |
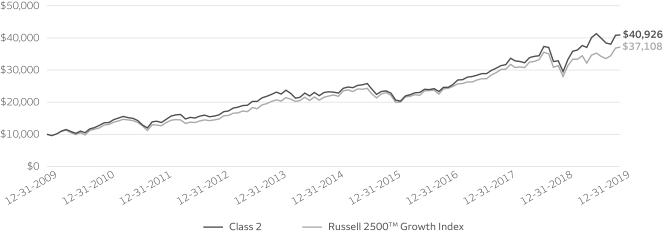
| Class 2 | | 5-8-1992 | | | 39.02 | | | | 12.09 | | | | 15.13 | | | | 1.17 | | | | 1.16 | |
| | | | | | | |
| Russell 2500TM Growth Index3 | | – | | | 32.65 | | | | 10.84 | | | | 14.01 | | | | – | | | | – | |
Figures quoted represent past performance, which is no guarantee of future results. Investment return and principal value of an investment will fluctuate so that an investor’s shares, when redeemed, may be worth more or less than their original cost. Current performance may be lower or higher than the performance data quoted and assumes the reinvestment of dividends and capital gains. Currentmonth-end performance is available by calling1-800-260-5969. Performance figures of the Fund do not reflect fees and expenses charged pursuant to the terms of variable life insurance policies and variable annuity contracts. If these fees and expenses had been reflected, performance would have been lower.
Please keep in mind that high double-digit returns were primarily achieved during favorable market conditions. You should not expect that such favorable returns can be consistently achieved. A fund’s performance, especially for short time periods, should not be the sole factor in making your investment decision.
Shares are sold without afront-end sales charge or contingent deferred sales charge.
Index returns do not include transaction costs associated with buying and selling securities, any mutual fund fees or expenses, or any taxes. It is not possible to invest directly in an index.
Stock values fluctuate in response to the activities of individual companies and general market and economic conditions. Smaller-company stocks tend to be more volatile and less liquid than those of larger companies. Certain investment strategies tend to increase the total risk of an investment (relative to the broader market). The Fund is exposed to foreign investment risk. Consult the Fund’s prospectus for additional information on these and other risks.
Please refer to the prospectus provided by your participating insurance company for detailed information describing the separate accounts for information regarding surrender charges, mortality and expense risk fees, and other charges that may be assessed by the participating insurance companies.
Please see footnotes on page 7.
6 | Wells Fargo VT Discovery Fund
Performance highlights (unaudited)
|
|
| Growth of $10,000 investment as of December 31, 20194 |
|
|
| ‡ | CFA® and Chartered Financial Analyst® are trademarks owned by CFA Institute. |
| 1 | Reflects the expense ratios as stated in the most recent prospectus, which include the impact of 0.01% in acquired fund fees and expenses. The expense ratios shown are subject to change and may differ from the annualized expense ratios shown in the financial highlights of this report, which do not include acquired fund fees and expenses. |
| 2 | The manager has contractually committed through April 30, 2020, to waive fees and/or reimburse expenses to the extent necessary to cap total annual fund operating expenses after fee waivers at 1.15% for Class 2. Brokerage commissions, stamp duty fees, interest, taxes, acquired fund fees and expenses (if any), and extraordinary expenses are excluded from the expense cap. Prior to or after the commitment expiration date, the cap may be increased or the commitment to maintain the cap may be terminated only with the approval of the Board of Trustees. Without this cap, the Fund’s returns would have been lower. The expense ratio paid by an investor is the net expense ratio (the total annual fund operating expenses after fee waivers) as stated in the prospectus. |
| 3 | The Russell 2500TM Growth Index measures the performance of those Russell 2500 companies with higher price/book ratios and higher forecasted growth values. You cannot invest directly in an index. |
| 4 | The chart compares the performance of Class 2 shares for the most recent ten years with the Russell 2500TM Growth Index. The chart assumes a hypothetical $10,000 investment and reflects all operating expenses of the Fund but does not reflect fees and expenses charged pursuant to the terms of variable life insurance policies and variable annuity contracts. |
| 5 | The ten largest holdings, excluding cash, cash equivalents and any money market funds, are calculated based on the value of the investments divided by total net assets of the Fund. Holdings are subject to change and may have changed since the date specified. |
| 6 | Amounts are calculated based on the total long-term investments of the Fund. These amounts are subject to change and may have changed since the date specified. |
| * | The security was no longer held at the end of the reporting period. |
Wells Fargo VT Discovery Fund | 7
Performance highlights (unaudited)
MANAGER’S DISCUSSION
Fund highlights
| ∎ | | The Fund outperformed its benchmark, the Russell 2500®Growth Index, for the12-month period that ended December 31, 2019. |
| ∎ | | Stock selection in the health care and information technology (IT) sectors contributed to the Fund’s results. |
| ∎ | | Detractors from Fund performance were dispersed across sectors. However, select holdings in the consumer discretionary sector and the software industry hindered performance. |
For much of 2019, investors faced a malaise of uncertainty driven by recession risks and global trade fears. However, as is often the case when consensus expectations fall heavily to one side, this fearful mood created a favorable setup as incrementally positive news arrived. Towardyear-end, central bank policy, leading economic data, and trade negotiations all saw positive developments. This sparked a rise in animal spirits and releasedpent-up demand for global risk assets, triggering a steepening of yield curves around the world. Within equities, the year ended with arisk-on rally of near textbook fashion. Cyclical outperformed defensive sectors and emerging markets, small caps, and high-beta (more volatile) stocks were embraced. A notable exception to the beta rally was the continued outperformance of leading growth equities. Many of these innovative, next-generation companies are considered more defensive based on their outlooks for durable and consistent earnings growth. Therefore, it was notable that even during a synchronized global rally, the growth style of investing maintained leadership.
The Fund benefited from stock selection in the health care and information technology sectors.
Within health care, DexCom, Incorporated, positively influenced the Fund’s returns. A manufacturer of continuous blood glucose monitors for patients with diabetes, DexCom has the opportunity to help a very large, untapped patient population. Additionally, due mainly to superior technology, patients are better able to manage their diabetes with DexCom’s products versus competing devices. Better-than-expected sales and earnings drove the shares higher.
Within the IT sector, the Fund’s position in Shopify Incorporated* contributed to returns. Shopify, a provider ofe-commerce solutions fordirect-to-consumer brands, traditionally focused on small andmedium-size businesses but is currently penetrating larger businesses via its Shopify Plus offering. Shopify benefits from its customers’ growth by processing payments for smaller customers and charging a fee on each transaction for larger customers. The company’s two vectors of growth—new customers and—revenue expansion of existing customers—drove higher-than-expected financial results.
| | | | |
|
| Ten largest holdings(%) as of December 31, 20195 | |
| | |
DexCom Incorporated | | | 2.44 | |
| | |
WEX Incorporated | | | 2.18 | |
| | |
Waste Connections Incorporated | | | 2.12 | |
| | |
Exact Sciences Corporation | | | 1.95 | |
| | |
EPAM Systems Incorporated | | | 1.94 | |
| | |
Booz Allen Hamilton Holding Corporation | | | 1.91 | |
| | |
Black Knight Incorporated | | | 1.89 | |
| | |
Euronet Worldwide Incorporated | | | 1.86 | |
| | |
HealthEquity Incorporated | | | 1.80 | |
| | |
WNS Holdings Limited ADR | | | 1.74 | |
Select holdings in the consumer discretionary sector and the software industry weighed on the Fund’s performance.
Within consumer discretionary, shares of Etsy, Incorporated, detracted from performance. Etsy is a leading online marketplace for unique and handmade goods with a large market opportunity. The company is making several key investments to generate strong future growth. However, the heavy spending and long-term nature of those investments contributed to Etsy missing expectations late in 2019. We are monitoring fundamentals closely but believe Etsy’s long-term growth prospects warrant continued patience.
Within software, Pluralsight, Incorporated*, a provider of learning platforms for software developers via software as a service, negatively affected results. The company’s learning platform provides a lower-cost way for employers to train their tech workers, which has become critical due to a shortage of skilled developers. However, the company did not sufficiently invest behind its sales organization to support the rapid growth of the business. This underinvestment resulted in lower-than-expected sales growth and disappointing future guidance.
Please see footnotes on page 7.
8 | Wells Fargo VT Discovery Fund
Performance highlights (unaudited)
|
|
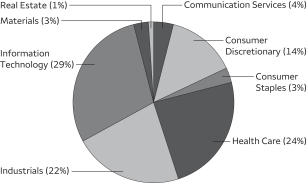
| Sector distribution as of December 31, 20196 |
|
 |
While market volatility will likely continue in 2020, we remain confident in the Fund’s positioning.
Despite the high level of macroeconomic uncertainty, our approach is to remain focused on businesses on the right side of change. We believe the U.S. economy could continue to expand but at weaker levels than many currently expect. This is due mainly to structural forces of weakening population and labor market growth. Simultaneously, we expect the pace of innovation and disruption to accelerate. We expect major industries, including financial services, health care, and transportation, to face significant disruption in the years to come. As new technologies become more pervasive throughout the economy, exciting opportunities
may arise for portfolio managers with skill at navigating change. As we have seen from many leading technology stocks, this disruption can lead to superior profit growth that is extremely valuable in a slow-growth world. We are excited that the scarcity premium for growth stocks appears poised to create a favorable environment for our investment style in 2020.
Please see footnotes on page 7.
Wells Fargo VT Discovery Fund | 9
Fund expenses (unaudited)
As a shareholder of the Fund, you incur ongoing costs, including management fees, distribution(12b-1) fees, and other Fund expenses. This example is intended to help you understand your ongoing costs (in dollars) of investing in the Fund and to compare these costs with the ongoing costs of investing in other mutual funds.
The example is based on an investment of $1,000 invested at the beginning of thesix-month period and held for the entire period from July 1, 2019 to December 31, 2019.
Actual expenses
The “Actual” line of the table below provides information about actual account values and actual expenses. You may use the information in this line, together with the amount you invested, to estimate the expenses that you paid over the period. Simply divide your account value by $1,000 (for example, an $8,600 account value divided by $1,000 = 8.6), then multiply the result by the number in the “Actual” line under the heading entitled “Expenses Paid During Period” for your applicable class of shares to estimate the expenses you paid on your account during this period.
Hypothetical example for comparison purposes
The “Hypothetical” line of the table below provides information about hypothetical account values and hypothetical expenses based on the Fund’s actual expense ratio and an assumed rate of return of 5% per year before expenses, which is not the Fund’s actual return. The hypothetical account values and expenses may not be used to estimate the actual ending account balance or expenses you paid for the period. You may use this information to compare the ongoing costs of investing in the Fund and other funds. To do so, compare this 5% hypothetical example with the 5% hypothetical examples that appear in the shareholder reports of the other funds.
Please note that the expenses shown in the table are meant to highlight your ongoing costs only and do not reflect any separate account charges assessed by participating insurance companies. Therefore, the “Hypothetical” line of the table is useful in comparing ongoing costs only, and will not help you determine the relative total costs of owning different funds. In addition, if these separate account charges assessed by participating insurance companies were included, your costs would have been higher.
| | | | | | | | | | | | | | | | |
| | | Beginning
account value
7-1-2019 | | | Ending
account value
12-31-2019 | | | Expenses
paid during
the period¹ | | | Annualized net
expense ratio | |
| | | | | |
Class 2 | | | | | | | | | | | | | | | | |
| | | | |
Actual | | $ | 1,000.00 | | | $ | 1,020.49 | | | $ | 5.85 | | | | 1.15 | % |
| | | | |
Hypothetical (5% return before expenses) | | $ | 1,000.00 | | | $ | 1,019.41 | | | $ | 5.85 | | | | 1.15 | % |
| 1 | Expenses paid is equal to the annualized net expense ratio multiplied by the average account value over the period, multiplied by the number of days in the most recent fiscal half-year divided by the number of days in the fiscal year (to reflect theone-half year period). |
10 | Wells Fargo VT Discovery Fund
Portfolio of investments—December 31, 2019
| | | | | | | | | | | | | | | | |
| | | | | | | | | Shares | | | Value | |
| Common Stocks: 99.34% | | | | | | | | | | | | | | | | |
| | | | |
Communication Services: 3.98% | | | | | | | | | | | | | | | | |
| | | | |
| Entertainment: 2.67% | | | | | | | | | | | | |
Take-Two Interactive Software Incorporated † | | | | | | | | | | | 20,100 | | | $ | 2,460,843 | |
World Wrestling Entertainment Incorporated Class A « | | | | | | | | | | | 31,400 | | | | 2,036,918 | |
| | | | |
| | | | | | | | | | | | | | | 4,497,761 | |
| | | | | | | | | | | | | | | | |
| | | | |
| Interactive Media & Services: 1.31% | | | | | | | | | | | | |
Match Group Incorporated Ǡ | | | | | | | | | | | 26,800 | | | | 2,200,548 | |
| | | | | | | | | | | | | | | | |
| | | | |
Consumer Discretionary: 13.60% | | | | | | | | | | | | | | | | |
| | | | |
| Diversified Consumer Services: 1.61% | | | | | | | | | | | | |
Bright Horizons Family Solutions Incorporated † | | | | | | | | | | | 18,000 | | | | 2,705,220 | |
| | | | | | | | | | | | | | | | |
| | | | |
| Hotels, Restaurants & Leisure: 4.73% | | | | | | | | | | | | |
Chipotle Mexican Grill Incorporated † | | | | | | | | | | | 2,900 | | | | 2,427,619 | |
Domino’s Pizza Incorporated | | | | | | | | | | | 9,500 | | | | 2,790,910 | |
Vail Resorts Incorporated | | | | | | | | | | | 11,500 | | | | 2,758,045 | |
| | | | |
| | | | | | | | | | | | | | | 7,976,574 | |
| | | | | | | | | | | | | | | | |
| | | | |
| Internet & Direct Marketing Retail: 3.21% | | | | | | | | | | | | |
Chewy Incorporated Ǡ | | | | | | | | | | | 29,300 | | | | 849,700 | |
Etsy Incorporated † | | | | | | | | | | | 39,300 | | | | 1,740,990 | |
MercadoLibre Incorporated † | | | | | | | | | | | 4,941 | | | | 2,825,956 | |
| | | | |
| | | | | | | | | | | | | | | 5,416,646 | |
| | | | | | | | | | | | | | | | |
| | | | |
| Specialty Retail: 4.05% | | | | | | | | | | | | |
Burlington Stores Incorporated † | | | | | | | | | | | 12,716 | | | | 2,899,629 | |
Carvana Corporation † | | | | | | | | | | | 13,300 | | | | 1,224,265 | |
Five Below Incorporated † | | | | | | | | | | | 21,100 | | | | 2,697,846 | |
| | | | |
| | | | | | | | | | | | | | | 6,821,740 | |
| | | | | | | | | | | | | | | | |
| | | | |
Consumer Staples: 2.80% | | | | | | | | | | | | | | | | |
| | | | |
| Food & Staples Retailing: 1.30% | | | | | | | | | | | | |
US Foods Holding Corporation † | | | | | | | | | | | 52,200 | | | | 2,186,658 | |
| | | | | | | | | | | | | | | | |
| | | | |
| Food Products: 1.50% | | | | | | | | | | | | |
Lamb Weston Holdings Incorporated | | | | | | | | | | | 29,300 | | | | 2,520,679 | |
| | | | | | | | | | | | | | | | |
| | | | |
Health Care: 24.01% | | | | | | | | | | | | | | | | |
| | | | |
| Biotechnology: 7.24% | | | | | | | | | | | | |
CRISPR Therapeutics AG † | | | | | | | | | | | 12,127 | | | | 738,595 | |
Deciphera Pharmaceuticals Incorporated † | | | | | | | | | | | 17,219 | | | | 1,071,711 | |
Exact Sciences Corporation † | | | | | | | | | | | 35,600 | | | | 3,292,288 | |
Immunomedics Incorporated † | | | | | | | | | | | 64,600 | | | | 1,366,936 | |
Natera Incorporated † | | | | | | | | | | | 23,990 | | | | 808,223 | |
Sarepta Therapeutics Incorporated † | | | | | | | | | | | 11,203 | | | | 1,445,635 | |
Turning Point Therapeutics Incorporated † | | | | | | | | | | | 19,997 | | | | 1,245,613 | |
Twist Bioscience Corporation † | | | | | | | | | | | 33,710 | | | | 707,910 | |
Zai Lab Limited ADR † | | | | | | | | | | | 25,112 | | | | 1,044,408 | |
Zymeworks Incorporated † | | | | | | | | | | | 10,400 | | | | 472,784 | |
| | | | |
| | | | | | | | | | | | | | | 12,194,103 | |
| | | | | | | | | | | | | | | | |
The accompanying notes are an integral part of these financial statements.
Wells Fargo VT Discovery Fund | 11
Portfolio of investments—December 31, 2019
| | | | | | | | | | | | | | | | |
| | | | | | | | | Shares | | | Value | |
| Health Care Equipment & Supplies: 8.54% | | | | | | | | | | | | |
DexCom Incorporated † | | | | | | | | | | | 18,800 | | | $ | 4,112,312 | |
Haemonetics Corporation † | | | | | | | | | | | 20,000 | | | | 2,298,000 | |
ICU Medical Incorporated † | | | | | | | | | | | 9,500 | | | | 1,777,640 | |
Insulet Corporation † | | | | | | | | | | | 16,299 | | | | 2,790,389 | |
iRhythm Technologies Incorporated † | | | | | | | | | | | 27,900 | | | | 1,899,711 | |
Silk Road Medical Incorporated † | | | | | | | | | | | 37,596 | | | | 1,518,126 | |
| | | | |
| | | | | | | | | | | | | | | 14,396,178 | |
| | | | | | | | | | | | | | | | |
| | | | |
| Health Care Providers & Services: 3.13% | | | | | | | | | | | | |
Amedisys Incorporated † | | | | | | | | | | | 13,400 | | | | 2,236,728 | |
HealthEquity Incorporated † | | | | | | | | | | | 40,900 | | | | 3,029,463 | |
| | | | |
| | | | | | | | | | | | | | | 5,266,191 | |
| | | | | | | | | | | | | | | | |
| | | | |
| Health Care Technology: 1.31% | | | | | | | | | | | | |
Veeva Systems Incorporated Class A † | | | | | | | | | | | 15,700 | | | | 2,208,362 | |
| | | | | | | | | | | | | | | | |
| | | | |
| Life Sciences Tools & Services: 1.34% | | | | | | | | | | | | |
Bio-Rad Laboratories Incorporated Class A † | | | | | | | | | | | 6,100 | | | | 2,257,183 | |
| | | | | | | | | | | | | | | | |
| | | | |
| Pharmaceuticals: 2.45% | | | | | | | | | | | | |
Catalent Incorporated † | | | | | | | | | | | 42,300 | | | | 2,381,490 | |
Elanco Animal Health Incorporated † | | | | | | | | | | | 59,409 | | | | 1,749,595 | |
| | | | |
| | | | | | | | | | | | | | | 4,131,085 | |
| | | | | | | | | | | | | | | | |
| | | | |
Industrials: 22.29% | | | | | | | | | | | | | | | | |
| | | | |
| Aerospace & Defense: 2.64% | | | | | | | | | | | | |
Mercury Computer Systems Incorporated † | | | | | | | | | | | 34,300 | | | | 2,370,473 | |
Teledyne Technologies Incorporated † | | | | | | | | | | | 6,000 | | | | 2,079,240 | |
| | | | |
| | | | | | | | | | | | | | | 4,449,713 | |
| | | | | | | | | | | | | | | | |
| | | | |
| Building Products: 0.98% | | | | | | | | | | | | |
Trex Company Incorporated † | | | | | | | | | | | 18,300 | | | | 1,644,804 | |
| | | | | | | | | | | | | | | | |
| | | | |
| Commercial Services & Supplies: 9.61% | | | | | | | | | | | | |
Casella Waste Systems Incorporated Class A † | | | | | | | | | | | 59,744 | | | | 2,750,016 | |
IAA Incorporated † | | | | | | | | | | | 54,000 | | | | 2,541,240 | |
MSA Safety Incorporated | | | | | | | | | | | 20,300 | | | | 2,565,108 | |
Tetra Tech Incorporated | | | | | | | | | | | 31,300 | | | | 2,696,808 | |
The Brink’s Company | | | | | | | | | | | 22,800 | | | | 2,067,504 | |
Waste Connections Incorporated | | | | | | | | | | | 39,343 | | | | 3,571,951 | |
| | | | |
| | | | | | | | | | | | | | | 16,192,627 | |
| | | | | | | | | | | | | | | | |
| | | | |
| Construction & Engineering: 1.43% | | | | | | | | | | | | |
WillScot Corporation † | | | | | | | | | | | 130,417 | | | | 2,411,410 | |
| | | | | | | | | | | | | | | | |
| | | | |
| Industrial Conglomerates: 1.72% | | | | | | | | | | | | |
Carlisle Companies Incorporated | | | | | | | | | | | 17,900 | | | | 2,896,936 | |
| | | | | | | | | | | | | | | | |
| | | | |
| Machinery: 2.85% | | | | | | | | | | | | |
The Middleby Corporation † | | | | | | | | | | | 18,100 | | | | 1,982,312 | |
Woodward Governor Company | | | | | | | | | | | 23,800 | | | | 2,818,872 | |
| | | | |
| | | | | | | | | | | | | | | 4,801,184 | |
| | | | | | | | | | | | | | | | |
| | | | |
| Professional Services: 0.37% | | | | | | | | | | | | |
Clarivate Analytics plc † | | | | | | | | | | | 37,500 | | | | 630,000 | |
| | | | | | | | | | | | | | | | |
The accompanying notes are an integral part of these financial statements.
12 | Wells Fargo VT Discovery Fund
Portfolio of investments—December 31, 2019
| | | | | | | | | | | | | | | | |
| | | | | | | | | Shares | | | Value | |
| Road & Rail: 1.50% | | | | | | | | | | | | |
Saia Incorporated † | | | | | | | | | | | 27,200 | | | $ | 2,532,864 | |
| | | | | | | | | | | | | | | | |
| | | | |
| Trading Companies & Distributors: 1.19% | | | | | | | | | | | | |
SiteOne Landscape Supply Incorporated † | | | | | | | | | | | 22,050 | | | | 1,998,833 | |
| | | | | | | | | | | | | | | | |
| | | | |
Information Technology: 29.20% | | | | | | | | | | | | | | | | |
| | | | |
| Communications Equipment: 1.24% | | | | | | | | | | | | |
Motorola Solutions Incorporated | | | | | | | | | | | 13,000 | | | | 2,094,820 | |
| | | | | | | | | | | | | | | | |
| | | | |
| Electronic Equipment, Instruments & Components: 2.38% | | | | | | | | | | | | |
Novanta Incorporated † | | | | | | | | | | | 26,200 | | | | 2,317,128 | |
Rogers Corporation † | | | | | | | | | | | 13,580 | | | | 1,693,833 | |
| | | | |
| | | | | | | | | | | | | | | 4,010,961 | |
| | | | | | | | | | | | | | | | |
| | | | |
| IT Services: 15.61% | | | | | | | | | | | | |
Black Knight Incorporated † | | | | | | | | | | | 49,400 | | | | 3,185,312 | |
Booz Allen Hamilton Holding Corporation | | | | | | | | | | | 45,300 | | | | 3,222,189 | |
EPAM Systems Incorporated † | | | | | | | | | | | 15,419 | | | | 3,271,295 | |
Euronet Worldwide Incorporated † | | | | | | | | | | | 19,893 | | | | 3,134,341 | |
MongoDB Incorporated Ǡ | | | | | | | | | | | 18,500 | | | | 2,434,785 | |
Okta Incorporated † | | | | | | | | | | | 19,200 | | | | 2,215,104 | |
Twilio Incorporated Class A † | | | | | | | | | | | 22,900 | | | | 2,250,612 | |
WEX Incorporated † | | | | | | | | | | | 17,500 | | | | 3,665,550 | |
WNS Holdings Limited ADR † | | | | | | | | | | | 44,200 | | | | 2,923,830 | |
| | | | |
| | | | | | | | | | | | | | | 26,303,018 | |
| | | | | | | | | | | | | | | | |
| | | | |
| Semiconductors & Semiconductor Equipment: 1.19% | | | | | | | | | | | | |
Lattice Semiconductor Corporation † | | | | | | | | | | | 104,700 | | | | 2,003,958 | |
| | | | | | | | | | | | | | | | |
| | | | |
| Software: 7.54% | | | | | | | | | | | | |
Avalara Incorporated † | | | | | | | | | | | 26,000 | | | | 1,904,500 | |
Elastic NV † | | | | | | | | | | | 25,400 | | | | 1,633,220 | |
Envestnet Incorporated † | | | | | | | | | | | 26,400 | | | | 1,838,232 | |
Fair Isaac Corporation † | | | | | | | | | | | 6,200 | | | | 2,323,016 | |
Globant SA † | | | | | | | | | | | 21,000 | | | | 2,227,050 | |
Zendesk Incorporated † | | | | | | | | | | | 36,200 | | | | 2,774,006 | |
| | | | |
| | | | | | | | | | | | | | | 12,700,024 | |
| | | | | | | | | | | | | | | | |
| | | | |
| Technology Hardware, Storage & Peripherals: 1.24% | | | | | | | | | | | | |
NCR Corporation † | | | | | | | | | | | 59,400 | | | | 2,088,504 | |
| | | | | | | | | | | | | | | | |
| | | | |
Materials: 2.53% | | | | | | | | | | | | | | | | |
| | | | |
| Chemicals: 1.17% | | | | | | | | | | | | |
Ingevity Corporation † | | | | | | | | | | | 22,500 | | | | 1,966,050 | |
| | | | | | | | | | | | | | | | |
| | | | |
| Containers & Packaging: 1.36% | | | | | | | | | | | | |
AptarGroup Incorporated | | | | | | | | | | | 19,900 | | | | 2,300,838 | |
| | | | | | | | | | | | | | | | |
| | | | |
Real Estate: 0.93% | | | | | | | | | | | | | | | | |
| | | | |
| Equity REITs: 0.93% | | | | | | | | | | | | |
Lexington Corporate Properties Trust | | | | | | | | | | | 147,600 | | | | 1,567,512 | |
| | | | | | | | | | | | | | | | |
| | | | |
Total Common Stocks (Cost $131,017,378) | | | | | | | | | | | | | | | 167,372,984 | |
| | | | | | | | | | | | | | | | |
The accompanying notes are an integral part of these financial statements.
Wells Fargo VT Discovery Fund | 13
Portfolio of investments—December 31, 2019
| | | | | | | | | | | | | | | | |
| | | Yield | | | | | | Shares | | | Value | |
| Short-Term Investments: 3.72% | | | | | | | | | | | | |
| | | | |
| Investment Companies: 3.72% | | | | | | | | | | | | |
Securities Lending Cash Investments LLC (l)(r)(u) | | | 1.73 | % | | | | | | | 4,718,077 | | | $ | 4,718,549 | |
Wells Fargo Government Money Market Fund Select Class (l)(u) | | | 1.55 | | | | | | | | 1,560,143 | | | | 1,560,143 | |
| | | | |
Total Short-Term Investments (Cost $6,278,473) | | | | | | | | | | | | | | | 6,278,692 | |
| | | | | | | | | | | | | | | | |
| | | | | | | | |
| Total investments in securities (Cost $137,295,851) | | | 103.06 | % | | | 173,651,676 | |
| | |
Other assets and liabilities, net | | | (3.06 | ) | | | (5,162,606 | ) |
| | | | | | | | |
| Total net assets | | | 100.00 | % | | $ | 168,489,070 | |
| | | | | | | | |
| † | Non-income-earning security |
| « | All or a portion of this security is on loan. |
| (l) | The issuer of the security is an affiliated person of the Fund as defined in the Investment Company Act of 1940. |
| (r) | The investment is anon-registered investment company purchased with cash collateral received from securities on loan. |
| (u) | The rate represents the7-day annualized yield at period end. |
Abbreviations:
| ADR | American depositary receipt |
Investments in Affiliates
An affiliated investment is an investment in which the Fund owns at least 5% of the outstanding voting shares of the issuer or as a result of other relationships, such as the Fund and the issuer having the same investment manager. Transactions with issuers that were either affiliated persons of the Fund at the beginning of the period or the end of the period were as follows:
| | | | | | | | | | | | | | | | | | | | | | | | | | | | | | | | | | | | |
| | | Shares,
beginning of
period | | | Shares
purchased | | | Shares
sold | | | Shares,
end of
period | | | Net
realized
gains
(losses) | | | Net
change in
unrealized
gains
(losses) | | | Income
from
affiliated
securities | | | Value,
end of
period | | | % of
net
assets | |
| | | | | | | | | |
| Short-Term Investments | | | | | | | | | | | | | | | | | | | | | | | | | | | |
Investment Companies | | | | | | | | | | | | | | | | | | | | | | | | | | | | | | | | | | | | |
Securities Lending Cash Investments LLC | | | 13,299,929 | | | | 96,263,311 | | | | (104,845,163 | ) | | | 4,718,077 | | | $ | 965 | | | $ | (41 | ) | | $ | 212,024 | # | | $ | 4,718,549 | | | | | |
Wells Fargo Government
Money Market Fund
Select Class | | | 4,704,923 | | | | 50,375,633 | | | | (53,520,413 | ) | | | 1,560,143 | | | | 0 | | | | 0 | | | | 65,116 | | | | 1,560,143 | | | | | |
| | | | | | | | | | | | | | | | | | | | | | | | | | | | | | | | | | | | |
| | | | | | | | | | | | | | | | | | $ | 965 | | | $ | (41 | ) | | $ | 277,140 | | | $ | 6,278,692 | | | | 3.72 | % |
| | | | | | | | | | | | | | | | | | | | | | | | | | | | | | | | | | | | |
| # | Amount shown represents income before fees and rebates. |
The accompanying notes are an integral part of these financial statements.
14 | Wells Fargo VT Discovery Fund
Statement of assets and liabilities—December 31, 2019
| | | | |
| | | | |
| |
Assets | | | | |
Investments in unaffiliated securities (including $4,637,474 of securities loaned), at value (cost $131,017,378) | | $ | 167,372,984 | |
Investments in affiliated securities, at value (cost $6,278,473) | | | 6,278,692 | |
Receivable for Fund shares sold | | | 26,235 | |
Receivable for dividends | | | 45,259 | |
Receivable for securities lending income, net | | | 4,763 | |
Prepaid expenses and other assets | | | 1,862 | |
| | | | |
Total assets | | | 173,729,795 | |
| | | | |
| |
Liabilities | | | | |
Payable upon receipt of securities loaned | | | 4,717,715 | |
Payable for investments purchased | | | 280,701 | |
Payable for Fund shares redeemed | | | 62,547 | |
Management fee payable | | | 109,496 | |
Administration fee payable | | | 11,731 | |
Distribution fee payable | | | 36,540 | |
Trustees’ fees and expenses payable | | | 5,904 | |
Accrued expenses and other liabilities | | | 16,091 | |
| | | | |
Total liabilities | | | 5,240,725 | |
| | | | |
Total net assets | | $ | 168,489,070 | |
| | | | |
| |
Net assets consist of | | | | |
Paid-in capital | | $ | 116,143,498 | |
Total distributable earnings | | | 52,345,572 | |
| | | | |
Total net assets | | $ | 168,489,070 | |
| | | | |
| |
Computation of net asset value per share | | | | |
Net assets – Class 2 | | $ | 168,489,070 | |
Shares outstanding – Class 21 | | | 5,128,894 | |
Net asset value per share – Class 2 | | | $32.85 | |
| 1 | The Fund has an unlimited number of authorized shares. |
The accompanying notes are an integral part of these financial statements.
Wells Fargo VT Discovery Fund | 15
Statement of operations—year ended December 31, 2019
| | | | |
| | | | |
| |
Investment income | | | | |
Dividends (net of foreign withholding taxes of $4,408) | | $ | 414,321 | |
Securities lending income from affiliates, net | | | 90,458 | |
Income from affiliated securities | | | 65,116 | |
| | | | |
Total investment income | | | 569,895 | |
| | | | |
| |
Expenses | | | | |
Management fee | | | 1,193,276 | |
Administration fee | |
Class 2 | | | 127,283 | |
Distribution fee | |
Class 2 | | | 397,226 | |
Custody and accounting fees | | | 20,195 | |
Professional fees | | | 39,416 | |
Shareholder report expenses | | | 33,000 | |
Trustees’ fees and expenses | | | 21,652 | |
Other fees and expenses | | | 9,293 | |
| | | | |
Total expenses | | | 1,841,341 | |
Less: Fee waivers and/or expense reimbursements | | | | |
Fund-level | | | (12,092 | ) |
| | | | |
Net expenses | | | 1,829,249 | |
| | | | |
Net investment loss | | | (1,259,354 | ) |
| | | | |
| |
Realized and unrealized gains (losses) on investments | | | | |
Net realized gains on | | | | |
Unaffiliated securities | | | 17,350,341 | |
Affiliated securities | | | 965 | |
| | | | |
Net realized gains on investments | | | 17,351,306 | |
| | | | |
|
Net change in unrealized gains (losses) on | |
Unaffiliated securities | | | 32,290,443 | |
Affiliated securities | | | (41 | ) |
| | | | |
Net change in unrealized gains (losses) on investments | | | 32,290,402 | |
| | | | |
Net realized and unrealized gains (losses) on investments | | | 49,641,708 | |
| | | | |
Net increase in net assets resulting from operations | | $ | 48,382,354 | |
| | | | |
The accompanying notes are an integral part of these financial statements.
16 | Wells Fargo VT Discovery Fund
Statement of changes in net assets
| | | | | | | | | | | | | | | | |
| | | Year ended
December 31, 2019 | | | Year ended
December 31, 2018 | |
| | | | |
Operations | | | | | | | | | | | | | | | | |
Net investment loss | | | | | | $ | (1,259,354 | ) | | | | | | $ | (813,231 | ) |
Net realized gains on investments | | | | | | | 17,351,306 | | | | | | | | 17,962,114 | |
Net change in unrealized gains (losses) on investments | | | | | | | 32,290,402 | | | | | | | | (26,090,173 | ) |
| | | | |
Net increase (decrease) in net assets resulting from operations | | | | | | | 48,382,354 | | | | | | | | (8,941,290 | ) |
| | | | |
| | | | |
Distributions to shareholders from net investment income and net realized gains – Class 2 | | | | | | | (17,124,790) | | | | | | | | (17,790,224) | |
| | | | |
| | | | |
Capital share transactions | | | Shares | | | | | | | | Shares | | | | | |
Proceeds from shares sold – Class 2 | | | 988,344 | | | | 32,962,615 | | | | 285,101 | | | | 9,073,079 | |
Reinvestment of distributions – Class 2 | | | 517,835 | | | | 17,124,790 | | | | 566,207 | | | | 17,790,224 | |
Payment for shares redeemed – Class 2 | | | (1,190,533 | ) | | | (38,661,758 | ) | | | (612,162 | ) | | | (19,500,629 | ) |
| | | | |
Net increase in net assets resulting from capital share transactions | | | | | | | 11,425,647 | | | | | | | | 7,362,674 | |
| | | | |
Total increase (decrease) in net assets | | | | | | | 42,683,211 | | | | | | | | (19,368,840 | ) |
| | | | |
| | | | |
Net assets | | | | | | | | | | | | | | | | |
Beginning of period | | | | | | | 125,805,859 | | | | | | | | 145,174,699 | |
| | | | |
End of period | | | | | | $ | 168,489,070 | | | | | | | $ | 125,805,859 | |
| | | | |
The accompanying notes are an integral part of these financial statements.
Wells Fargo VT Discovery Fund | 17
Financial highlights
(For a share outstanding throughout each period)
| | | | | | | | | | | | | | | | | | | | |
| | | Year ended December 31 | |
| CLASS 2 | | 2019 | | | 2018 | | | 2017 | | | 2016 | | | 2015 | |
Net asset value, beginning of period | | | $26.14 | | | | $31.74 | | | | $25.91 | | | | $25.99 | | | | $30.71 | |
Net investment loss | | | (0.25 | ) | | | (0.17 | ) | | | (0.20 | ) | | | (0.13 | ) | | | (0.21 | ) |
Net realized and unrealized gains (losses) on investments | | | 10.47 | | | | (1.39 | ) | | | 7.60 | | | | 2.00 | | | | 0.21 | |
| | | | | | | | | | | | | | | | | | | | |
Total from investment operations | | | 10.22 | | | | (1.56 | ) | | | 7.40 | | | | 1.87 | | | | 0.00 | |
Distributions to shareholders from | | | | | | | | | | | | | | | | | | | | |
Net realized gains | | | (3.51 | ) | | | (4.04 | ) | | | (1.57 | ) | | | (1.95 | ) | | | (4.72 | ) |
Net asset value, end of period | | | $32.85 | | | | $26.14 | | | | $31.74 | | | | $25.91 | | | | $25.99 | |
Total return1 | | | 39.02 | % | | | (7.06 | )% | | | 29.13 | % | | | 7.65 | % | | | (1.46 | )% |
Ratios to average net assets (annualized) | | | | | | | | | | | | | | | | | | | | |
Gross expenses | | | 1.16 | % | | | 1.16 | % | | | 1.16 | % | | | 1.18 | % | | | 1.17 | % |
Net expenses | | | 1.15 | % | | | 1.15 | % | | | 1.15 | % | | | 1.15 | % | | | 1.15 | % |
Net investment loss | | | (0.79 | )% | | | (0.55 | )% | | | (0.68 | )% | | | (0.52 | )% | | | (0.72 | )% |
Supplemental data | | | | | | | | | | | | | | | | | | | | |
Portfolio turnover rate | | | 71 | % | | | 60 | % | | | 75 | % | | | 85 | % | | | 90 | % |
Net assets, end of period (000s omitted) | | | $168,489 | | | | $125,806 | | | | $145,175 | | | | $119,919 | | | | $126,839 | |
| 1 | Returns do not reflect fees and expenses charged pursuant to the terms of variable life insurance policies and variable annuity contracts. |
The accompanying notes are an integral part of these financial statements.
18 | Wells Fargo VT Discovery Fund
Notes to financial statements
1. ORGANIZATION
Wells Fargo Variable Trust (the “Trust”), a Delaware statutory trust organized on March 10, 1999, is anopen-end management investment company registered under the Investment Company Act of 1940, as amended (the “1940 Act”). As an investment company, the Trust follows the accounting and reporting guidance in Financial Accounting Standards Board (“FASB”)Accounting Standards Codification Topic 946, Financial Services – Investment Companies. These financial statements report on the Wells Fargo VT Discovery Fund (the “Fund”) which is a diversified series of the Trust. The Trust offers shares of the Fund to separate accounts of various life insurance companies as funding vehicles for certain variable annuity contracts and variable life insurance policies.
2. SIGNIFICANT ACCOUNTING POLICIES
The following significant accounting policies, which are consistently followed in the preparation of the financial statements of the Fund, are in conformity with U.S. generally accepted accounting principles which require management to make estimates and assumptions that affect the reported amounts of assets and liabilities, disclosure of contingent assets and liabilities at the date of the financial statements, and the reported amounts of revenues and expenses during the reporting period. Actual results could differ from those estimates.
Securities valuation
All investments are valued each business day as of the close of regular trading on the New York Stock Exchange (generally 4 p.m. Eastern Time), although the Fund may deviate from this calculation time under unusual or unexpected circumstances.
Equity securities that are listed on a foreign or domestic exchange or market are valued at the official closing price or, if none, the last sales price. If no sale occurs on the principal exchange or market that day, a fair value price will be determined in accordance with the Fund’s Valuation Procedures.
Investments in registeredopen-end investment companies are valued at net asset value. Interests innon-registered investment companies that are redeemable at net asset value are fair valued normally at net asset value.
Investments which are not valued using any of the methods discussed above are valued at their fair value, as determined in good faith by the Board of Trustees of the Fund. The Board of Trustees has established a Valuation Committee comprised of the Trustees and has delegated to it the authority to take any actions regarding the valuation of portfolio securities that the Valuation Committee deems necessary or appropriate, including determining the fair value of portfolio securities, unless the determination has been delegated to the Wells Fargo Asset Management Pricing Committee at Wells Fargo Funds Management, LLC (“Funds Management”).The Board of Trustees retains the authority to make or ratify any valuation decisions or approve any changes to the Valuation Procedures as it deems appropriate. On a quarterly basis, the Board of Trustees receives reports on any valuation actions taken by the Valuation Committee or the Wells Fargo Asset Management Pricing Committee which may include items for ratification.
Securities lending
The Fund may lend its securities from time to time in order to earn additional income in the form of fees or interest on securities received as collateral or the investment of any cash received as collateral. When securities are on loan, the Fund receives interest or dividends on those securities. Cash collateral received in connection with its securities lending transactions is invested in Securities Lending Cash Investments, LLC (the “Securities Lending Fund”). Investments in Securities Lending Fund are valued at the evaluated bid price provided by an independent pricing service. Income earned from investment in the Securities Lending Fund, if any, is included in securities lending income from affiliates (net of fees and rebates) on the Statement of Operations.
In a securities lending transaction, the net asset value of the Fund is affected by an increase or decrease in the value of the securities loaned and by an increase or decrease in the value of the instrument in which collateral is invested. The amount of securities lending activity undertaken by the Fund fluctuates from time to time. The Fund has the right under the lending agreement to recover the securities from the borrower on demand. In the event of default or bankruptcy by the borrower, the Fund may be prevented from recovering the loaned securities or gaining access to the collateral or may experience delays or costs in doing so. In such an event, the terms of the agreement allows the unaffiliated securities lending agent to use the collateral to purchase replacement securities on behalf of the Fund or pay the Fund the market value of the loaned securities. The Fund bears the risk of loss with respect to depreciation of its investment of the cash collateral.
Security transactions and income recognition
Securities transactions are recorded on a trade date basis. Realized gains or losses are recorded on the basis of identified cost.
Wells Fargo VT Discovery Fund | 19
Notes to financial statements
Dividend income is recognized on theex-dividend date. Dividend income is recorded net of foreign taxes withheld where recovery of such taxes is not assured.
Distributions to shareholders
Distributions to shareholders from net investment income and any net realized gains are recorded on theex-dividend date and paid at least annually. Such distributions are determined in accordance with income tax regulations and may differ from U.S. generally accepted accounting principles. Dividend sources are estimated at the time of declaration. The tax character of distributions is determined as of the Fund’s fiscal year end. Therefore, a portion of the Fund’s distributions made prior to the Fund’s fiscal year end may be categorized as a tax return of capital at year end.
Federal and other taxes
The Fund intends to continue to qualify as a regulated investment company by distributing substantially all of its investment company taxable income and any net realized capital gains (after reduction for capital loss carryforwards) sufficient to relieve it from all, or substantially all, federal income taxes. Accordingly, no provision for federal income taxes was required.
The Fund’s income and federal excise tax returns and all financial records supporting those returns for the prior three fiscal years are subject to examination by the federal and Delaware revenue authorities. Management has analyzed the Fund’s tax positions taken on federal, state, and foreign tax returns for all open tax years and does not believe that there are any uncertain tax positions that require recognition of a tax liability.
As of December 31, 2019, the aggregate cost of all investments for federal income tax purposes was $137,420,400 and the unrealized gains (losses) consisted of:
| | | | |
| |
Gross unrealized gains | | $ | 40,008,837 | |
| |
Gross unrealized losses | | | (3,777,561 | ) |
| |
Net unrealized gains | | $ | 36,231,276 | |
Reclassifications are made to the Fund’s capital accounts for permanent tax differences to reflect income and gains available for distribution (or available capital loss carryforwards) under federal income tax regulations. U.S. generally accepted accounting principles require that certain components of net assets be adjusted to reflect permanent differences between financial and tax reporting. These reclassifications have no effect on net assets or net asset values per share. At December 31, 2019, as a result of permanent book-to-tax differences, the following reclassification adjustments were made on the Statement of Assets and Liabilities:
| | |
| Paid-in capital | | Total distributable earnings |
| |
| $95 | | $(95) |
3. FAIR VALUATION MEASUREMENTS
Fair value measurements of investments are determined within a framework that has established a fair value hierarchy based upon the various data inputs utilized in determining the value of the Fund’s investments. The three-level hierarchy gives the highest priority to unadjusted quoted prices in active markets for identical assets or liabilities (Level 1) and the lowest priority to unobservable inputs (Level 3). The Fund’s investments are classified within the fair value hierarchy based on the lowest level of input that is significant to the fair value measurement. The inputs are summarized into three broad levels as follows:
| ∎ | | Level 1 – quoted prices in active markets for identical securities |
| ∎ | | Level 2 – other significant observable inputs (including quoted prices for similar securities, interest rates, prepayment speeds, credit risk, etc.) |
| ∎ | | Level 3 – significant unobservable inputs (including the Fund’s own assumptions in determining the fair value of investments) |
The inputs or methodologies used for valuing investments in securities are not necessarily an indication of the risk associated with investing in those securities.
20 | Wells Fargo VT Discovery Fund
Notes to financial statements
The following is a summary of the inputs used in valuing the Fund’s assets and liabilities as of December 31, 2019:
| | | | | | | | | | | | | | | | |
| | | | |
| | | Quoted prices
(Level 1) | | | Other significant
observable inputs
(Level 2) | | | Significant
unobservable inputs (Level 3) | | | Total | |
| | | | |
Assets | | | | | | | | | | | | | | | | |
Investments in: | | | | | | | | | | | | | | | | |
| | | | |
Common stocks | | | | | | | | | | | | | | | | |
| | | | |
Communication services | | $ | 6,698,309 | | | $ | 0 | | | $ | 0 | | | $ | 6,698,309 | |
| | | | |
Consumer discretionary | | | 22,920,180 | | | | 0 | | | | 0 | | | | 22,920,180 | |
| | | | |
Consumer staples | | | 4,707,337 | | | | 0 | | | | 0 | | | | 4,707,337 | |
| | | | |
Health care | | | 40,453,102 | | | | 0 | | | | 0 | | | | 40,453,102 | |
| | | | |
Industrials | | | 37,558,371 | | | | 0 | | | | 0 | | | | 37,558,371 | |
| | | | |
Information technology | | | 49,201,285 | | | | 0 | | | | 0 | | | | 49,201,285 | |
| | | | |
Materials | | | 4,266,888 | | | | 0 | | | | 0 | | | | 4,266,888 | |
| | | | |
Real estate | | | 1,567,512 | | | | 0 | | | | 0 | | | | 1,567,512 | |
| | | | |
Short-term investments | | | | | | | | | | | | | | | | |
| | | | |
Investment companies | | | 6,278,692 | | | | 0 | | | | 0 | | | | 6,278,692 | |
| | | | |
Total assets | | $ | 173,651,676 | | | $ | 0 | | | $ | 0 | | | $ | 173,651,676 | |
Additional sector, industry or geographic detail is included in the Portfolio of Investments.
For the year ended December 31, 2019, the Fund did not have any transfers into/out of Level 3.
4. TRANSACTIONS WITH AFFILIATES
Management fee
Funds Management, an indirect wholly owned subsidiary of Wells Fargo & Company (“Wells Fargo”), is the manager of the Fund and provides advisory and fund-level administrative services under an investment management agreement. Under the investment management agreement, Funds Management is responsible for, among other services, implementing the investment objectives and strategies of the Fund, supervising the subadviser and providing fund-level administrative services in connection with the Fund’s operations. As compensation for its services under the investment management agreement, Funds Management is entitled to receive a management fee at the following annual rate based on the Fund’s average daily net assets:
| | | | |
| |
| Average daily net assets | | Management fee | |
| |
First $500 million | | | 0.750 | % |
| |
Next $500 million | | | 0.700 | |
| |
Next $1 billion | | | 0.650 | |
| |
Next $2 billion | | | 0.625 | |
| |
Next $1 billion | | | 0.600 | |
| |
Next $5 billion | | | 0.590 | |
| |
Over $10 billion | | | 0.580 | |
For the year ended December 31, 2019, the management fee was equivalent to an annual rate of 0.75% of the Fund’s average daily net assets.
Funds Management has retained the services of a subadviser to provide daily portfolio management to the Fund. The fee for subadvisory services is borne by Funds Management. Wells Capital Management Incorporated (“WellsCap”), an affiliate of Funds Management and an indirect wholly owned subsidiary of Wells Fargo, is the subadviser to the Fund and is entitled to receive a fee from Funds Management at an annual rate starting at 0.45% and declining to 0.35% as the average daily net assets of the Fund increase.
Administration fee
Under a class-level administration agreement, Funds Management provides class-level administrative services to the Fund, which includes paying fees and expenses for services provided by the transfer agent,sub-transfer agents, omnibus account
Wells Fargo VT Discovery Fund | 21
Notes to financial statements
servicers and record-keepers. As compensation for its services under the class-level administration agreement, Funds Management receives a class level administration fee of 0.08% which is calculated based on the average daily net assets of Class 2 shares.
Waivers and/or expense reimbursements
Funds Management has contractually waived and/or reimbursed management and administration fees to the extent necessary to maintain certain net operating expense ratios for the Fund. Funds Management has committed through April 30, 2020 to waive fees and/or reimburse expenses to the extent necessary to cap the Fund’s expenses at 1.15% for Class 2 shares. Prior to or after the commitment expiration date, the cap may be increased or the commitment to maintain the cap may be terminated only with the approval of the Board of Trustees.
Distribution fee
The Trust has adopted a distribution plan for Class 2 shares of the Fund pursuant to Rule12b-1 under the 1940 Act. A distribution fee is charged to Class 2 shares and paid to Wells Fargo Funds Distributor, LLC, the principal underwriter, at an annual rate of 0.25% of the average daily net assets of Class 2 shares.
Interfund transactions
The Fund may purchase or sell portfolio investment securities to certain other Wells Fargo affiliates pursuant to Rule17a-7 under the 1940 Act and under procedures adopted by the Board of Trustees. The procedures have been designed to ensure that these interfund transactions, which do not incur broker commissions, are effected at current market prices.
5. INVESTMENT PORTFOLIO TRANSACTIONS
Purchases and sales of investments, excluding U.S. government obligations (if any) and short-term securities, for the year ended December 31, 2019 were $110,535,544 and $113,892,525, respectively.
6. SECURITIES LENDING TRANSACTIONS
The Fund lends its securities through an unaffiliated securities lending agent and receives collateral in the form of cash or securities with a value at least equal to the value of the securities on loan. The value of the loaned securities is determined at the close of each business day and any increases or decreases in the required collateral are exchanged between the Fund and the counterparty on the next business day. Cash collateral received is invested in the Securities Lending Fund which seeks to provide a positive return compared to the daily Fed Funds Open Rate by investing in high-quality, U.S. dollar-denominated short-term money market instruments and is exempt from registration under Section 3(c)(7) of the 1940 Act. Securities Lending Fund is managed by Funds Management and is subadvised by WellsCap. Funds Management receives an advisory fee starting at 0.05% and declining to 0.01% as the average daily net assets of the Securities Lending Fund increase. All of the fees received by Funds Management are paid to WellsCap for its services as subadviser.
In the event of counterparty default or the failure of a borrower to return a loaned security, the Fund has the right to use the collateral to offset any losses incurred. As of December 31, 2019, the Fund had securities lending transactions with the following counterparties which are subject to offset:
| | | | | | | | | | | | |
| | | |
| Counterparty | | Value of
securities on loan | | | Collateral
received1 | | | Net amount | |
| | | |
Barclays Capital Inc. | | $ | 1,067,496 | | | $ | (1,067,496 | ) | | $ | 0 | |
| | | |
Bank of America Securities Inc. | | | 784,927 | | | | (784,927 | ) | | | 0 | |
| | | |
Citigroup Global Markets Inc. | | | 1,978,851 | | | | (1,978,851 | ) | | | 0 | |
| | | |
Morgan Stanley & Co. LLC | | | 806,200 | | | | (806,200 | ) | | | 0 | |
| 1 | Collateral received within this table is limited to the collateral for the net transaction with the counterparty. |
7. BANK BORROWINGS
The Trust, Wells Fargo Master Trust and Wells Fargo Funds Trust (excluding the money market funds) are parties to a $280,000,000 revolving credit agreement whereby the Fund is permitted to use bank borrowings for temporary or emergency purposes, such as to fund shareholder redemption requests. Interest under the credit agreement is charged to the Fund based on a borrowing rate equal to the higher of the Federal Funds rate in effect on that day plus 1.25% or the overnight LIBOR rate in effect on that day plus 1.25%. In addition, an annual commitment fee equal to 0.25% of the unused balance is allocated to each participating fund.
For the year ended December 31, 2019, there were no borrowings by the Fund under the agreement.
22 | Wells Fargo VT Discovery Fund
Notes to financial statements
8. DISTRIBUTIONS TO SHAREHOLDERS
The tax character of distributions paid during the years ended December 31, 2019 and December 31, 2018 were as follows:
| | | | | | | | |
| | | Year ended December 31 | |
| | |
| | | 2019 | | | 2018 | |
| | |
Ordinary income | | $ | 2,914,486 | | | $ | 1,655,802 | |
| | |
Long-term capital gain | | | 14,210,304 | | | | 16,134,422 | |
As of December 31, 2019, the components of distributable earnings on a tax basis were as follows:
| | | | |
Undistributed ordinary income | | Undistributed long-term gain | | Unrealized
gains
|
| | |
| $688,096 | | $15,426,200 | | $36,231,276 |
9. CONCENTRATION RISK
Concentration risks result from exposure to a limited number of sectors. As of the end of the period, the Fund invests a concentration of its portfolio in the information technology sector. A fund that invests a substantial portion of its assets in any sector may be more affected by changes in that sector than would be a fund whose investments are not heavily weighted in any sector.
10. INDEMNIFICATION
Under the Trust’s organizational documents, the officers and Trustees have been granted certain indemnification rights against certain liabilities that may arise out of performance of their duties to the Trust. Additionally, in the normal course of business, the Trust may enter into contracts with service providers that contain a variety of indemnification clauses. The Trust’s maximum exposure under these arrangements is dependent on future claims that may be made against the Fund and, therefore, cannot be estimated.
11. NEW ACCOUNTING PRONOUNCEMENT
In August 2018, FASB issued Accounting Standards Update (“ASU”)No. 2018-13, Fair Value Measurement (Topic 820)Disclosure Framework—Changes to the Disclosure Requirements for Fair Value Measurement. ASU2018-13 updates the disclosure requirements for fair value measurements by modifying or removing certain disclosures and adding certain new disclosures. The amendments are effective for fiscal years, and interim periods within those fiscal years, beginning after December 15, 2019. Early adoption is permitted. Management has adopted the removal and modification of disclosures early, as permitted, and will adopt the additional new disclosures at the effective date.
Wells Fargo VT Discovery Fund | 23
Report of independent registered public accounting firm
TO THE SHAREHOLDERS OF THE FUND AND BOARD OF TRUSTEES OF WELLS FARGO VARIABLE TRUST:
Opinion on the Financial Statements
We have audited the accompanying statement of assets and liabilities of Wells Fargo VT Discovery Fund (the Fund), one of the funds constituting Wells Fargo Variable Trust, including the portfolio of investments, as of December 31, 2019, the related statement of operations for the year then ended, the statements of changes in net assets for each of the years in the two-year period then ended, and the related notes (collectively, the financial statements) and the financial highlights for each of the years in the five-year period then ended. In our opinion, the financial statements and financial highlights present fairly, in all material respects, the financial position of the Fund as of December 31, 2019, the results of its operations for the year then ended, the changes in its net assets for each of the years in the two-year period then ended, and the financial highlights for each of the years in the five-year period then ended, in conformity with U.S. generally accepted accounting principles.
Basis for Opinion
These financial statements and financial highlights are the responsibility of the Fund’s management. Our responsibility is to express an opinion on these financial statements and financial highlights based on our audits. We are a public accounting firm registered with the Public Company Accounting Oversight Board (United States) (PCAOB) and are required to be independent with respect to the Fund in accordance with the U.S. federal securities laws and the applicable rules and regulations of the Securities and Exchange Commission and the PCAOB.
We conducted our audits in accordance with the standards of the PCAOB. Those standards require that we plan and perform the audit to obtain reasonable assurance about whether the financial statements and financial highlights are free of material misstatement, whether due to error or fraud. Our audits included performing procedures to assess the risks of material misstatement of the financial statements and financial highlights, whether due to error or fraud, and performing procedures that respond to those risks. Such procedures included examining, on a test basis, evidence regarding the amounts and disclosures in the financial statements and financial highlights. Such procedures also included confirmation of securities owned as of December 31, 2019, by correspondence with the custodian, transfer agent and brokers, or by other appropriate auditing procedures. Our audits also included evaluating the accounting principles used and significant estimates made by management, as well as evaluating the overall presentation of the financial statements and financial highlights. We believe that our audits provide a reasonable basis for our opinion.

We have not been able to determine the specific year that we began serving as the auditor of one or more Wells Fargo Funds investment companies; however we are aware that we have served as the auditor of one or more Wells Fargo Funds investment companies since at least 1955.
Boston, Massachusetts
February 25, 2020
24 | Wells Fargo VT Discovery Fund
Other information (unaudited)
TAX INFORMATION
For corporate shareholders, pursuant to Section 854 of the Internal Revenue Code, 13.61% of ordinary income dividends qualify for the corporate dividends-received deduction for the fiscal year ended December 31, 2019.
Pursuant to Section 852 of the Internal Revenue Code, $14,210,304 was designated as a 20% rate gain distribution for the fiscal year ended December 31, 2019.
For the fiscal year ended December 31, 2019, $47 has been designated as short-term capital gain dividends for nonresident alien shareholders pursuant to Section 871 of the Internal Revenue Code.
PROXY VOTING INFORMATION
A description of the policies and procedures used to determine how to vote proxies relating to portfolio securities is available, upon request, by calling1-800-260-5969, visiting our website atwfam.com, or visiting the SEC website at sec.gov. Information regarding how the proxies related to portfolio securities were voted during the most recent12-month period ended June 30 is available on the website atwfam.comor by visiting the SEC website at sec.gov.
QUARTERLY PORTFOLIO HOLDINGS INFORMATION
The Fund files its complete schedule of portfolio holdings with the SEC for the first and third quarters of each fiscal year as an exhibit to its reports on FormN-PORT. Shareholders may view the filed FormN-PORT by visiting the SEC website at sec.gov.
Wells Fargo VT Discovery Fund | 25
Other information (unaudited)
BOARD OF TRUSTEES AND OFFICERS
Each of the Trustees and Officers1 listed in the table below acts in identical capacities for each fund in the Wells Fargo family of funds, which consists of 149 mutual funds comprising the Wells Fargo Funds Trust, Wells Fargo Variable Trust, Wells Fargo Master Trust and fourclosed-end funds (collectively the “Fund Complex”). This table should be read in conjunction with the Prospectus and the Statement of Additional Information2. The mailing address of each Trustee and Officer is 525 Market Street, 12th Floor, San Francisco, CA 94105. Each Trustee and Officer serves an indefinite term, however, each Trustee serves such term until reaching the mandatory retirement age established by the Trustees.
Independent Trustees
| | | | | | |
Name and year of birth | | Position held and
length of service* | | Principal occupations during past five years or longer | | Current other
public company or
investment
company
directorships |
| | | |
William R. Ebsworth (Born 1957) | | Trustee, since 2015 | | Retired. From 1984 to 2013, equities analyst, portfolio manager, research director and chief investment officer at Fidelity Management and Research Company in Boston, Tokyo, and Hong Kong, and retired in 2013 as Chief Investment Officer of Fidelity Strategic Advisers, Inc. where he led a team of investment professionals managing client assets. Prior thereto, Board member of Hong Kong Securities Clearing Co., Hong Kong Options Clearing Corp., the Thailand International Fund, Ltd., Fidelity Investments Life Insurance Company, and Empire Fidelity Investments Life Insurance Company. Audit Committee Chair and Investment Committee Chair of the Vincent Memorial Hospital Endowment(non-profit organization). Mr. Ebsworth is a CFA® charterholder. | | N/A |
| | | |
Jane A. Freeman (Born 1953) | | Trustee, since 2015;
Chair Liaison, since 2018 | | Retired. From 2012 to 2014 and 1999 to 2008, Chief Financial Officer of Scientific Learning Corporation. From 2008 to 2012, Ms. Freeman provided consulting services related to strategic business projects. Prior to 1999, Portfolio Manager at Rockefeller & Co. and Scudder, Stevens & Clark. Board member of the Harding Loevner Funds from 1996 to 2014, serving as both Lead Independent Director and chair of the Audit Committee. Board member of the Russell Exchange Traded Funds Trust from 2011 to 2012 and the chair of the Audit Committee. Ms. Freeman is a Board Member of The Ruth Bancroft Garden(non-profit organization). She is also an inactive Chartered Financial Analyst. | | N/A |
| | | |
Isaiah Harris, Jr. (Born 1952) | | Trustee, since 2009;
Audit Committee Chairman, since 2019 | | Retired. Chairman of the Board of CIGNA Corporation since 2009, and Director since 2005. From 2003 to 2011, Director of Deluxe Corporation. Prior thereto, President and CEO of BellSouth Advertising and Publishing Corp. from 2005 to 2007, President and CEO of BellSouth Enterprises from 2004 to 2005 and President of BellSouth Consumer Services from 2000 to 2003. Emeritus member of the Iowa State University Foundation Board of Governors. Emeritus Member of the Advisory Board of Iowa State University School of Business. Advisory Board Member, Palm Harbor Academy (private school). Advisory Board Member, Child Evangelism Fellowship(non-profit). Mr. Harris is a certified public accountant (inactive status). | | CIGNA Corporation |
| | | |
Judith M. Johnson (Born 1949) | | Trustee, since 2008;
Audit Committee Chairman, from 2009 to 2018 | | Retired. Prior thereto, Chief Executive Officer and Chief Investment Officer of Minneapolis Employees Retirement Fund from 1996 to 2008. Ms. Johnson is an attorney, certified public accountant and a certified managerial accountant. | | N/A |
26 | Wells Fargo VT Discovery Fund
Other information (unaudited)
| | | | | | |
Name and year of birth | | Position held and
length of service* | | Principal occupations during past five years or longer | | Current other
public company or
investment
company
directorships |
| | | |
David F. Larcker (Born 1950) | | Trustee, since 2009 | | James Irvin Miller Professor of Accounting at the Graduate School of Business, Stanford University, Director of the Corporate Governance Research Initiative and Senior Faculty of The Rock Center for Corporate Governance since 2006. From 2005 to 2008, Professor of Accounting at the Graduate School of Business, Stanford University. Prior thereto, Ernst & Young Professor of Accounting at The Wharton School, University of Pennsylvania from 1985 to 2005. | | N/A |
| | | |
Olivia S. Mitchell (Born 1953) | | Trustee, since 2006; Nominating and Governance Committee Chair, since 2018 | | International Foundation of Employee Benefit Plans Professor, Wharton School of the University of Pennsylvania since 1993. Director of Wharton’s Pension Research Council and Boettner Center on Pensions & Retirement Research, and Research Associate at the National Bureau of Economic Research. Previously, Cornell University Professor from 1978 to 1993. | | N/A |
| | | |
Timothy J. Penny (Born 1951) | | Trustee, since 1996; Chairman, since 2018 | | President and Chief Executive Officer of Southern Minnesota Initiative Foundation, anon-profit organization, since 2007. Member of the Board of Trustees of NorthStar Education Finance, Inc., anon-profit organization, since 2007. | | N/A |
| | | |
James G. Polisson (Born 1959) | | Trustee, since 2018 | | Retired. Chief Marketing Officer, Source (ETF) UK Services, Ltd, from 2015 to 2017. From 2012 to 2015, Principal of The Polisson Group, LLC, a management consulting, corporate advisory and principal investing company. Chief Executive Officer and Managing Director at Russell Investments, Global Exchange Traded Funds from 2010 to 2012. Managing Director of Barclays Global Investors from 1998 to 2010 and Global Chief Marketing Officer for iShares and Barclays Global Investors from 2000 to 2010. Trustee of the San Francisco Mechanics’ Institute, anon-profit organization, from 2013 to 2015. Board member of the Russell Exchange Traded Fund Trust from 2011 to 2012. Director of Barclays Global Investors Holdings Deutschland GmbH from 2006 to 2009. Mr. Polisson is an attorney and has a retired status with the Massachusetts and District of Columbia Bar Associations. | | N/A |
| | | |
Pamela Wheelock3 (Born 1959) | | Trustee, since January 2020; previously Trustee from January 2018 to July 2019 | | Board member of the Destination Medical Center Economic Development Agency, Rochester, Minnesota since 2019. Acting Commissioner, Minnesota Department of Human Services, July 2019 through September 2019. Human Services Manager (part-time), Minnesota Department of Human Services, October 2019 through December 2019. Chief Operating Officer, Twin Cities Habitat for Humanity from 2017 to 2019. Vice President of University Services, University of Minnesota from 2012 to 2016. Prior thereto, on the Board of Directors, Governance Committee and Finance Committee for the Minnesota Philanthropy Partners (Saint Paul Foundation) from 2012 to 2018, Interim Chief Executive Officer of Blue Cross Blue Shield of Minnesota from 2011 to 2012, Chairman of the Board from 2009 to 2012 and Board Director from 2003 to 2015. Vice President, Leadership and Community Engagement, Bush Foundation, Saint Paul, Minnesota (a private foundation) from 2009 to 2011. Executive Vice President and Chief Financial Officer, Minnesota Sports and Entertainment from 2004 to 2009 and Senior Vice President from 2002 to 2004. Executive Vice President of the Minnesota Wild Foundation from 2004 to 2008. Commissioner of Finance, State of Minnesota, from 1999 to 2002. Currently Board Chair of the Minnesota Wild Foundation since 2010. | | N/A |
| * | Length of service dates reflect the Trustee’s commencement of service with the Trust’s predecessor entities, where applicable. |
Wells Fargo VT Discovery Fund | 27
Other information (unaudited)
Officers
| | | | |
Name and year of birth | | Position held and
length of service | | Principal occupations during past five years or longer |
| | |
Andrew Owen (Born 1960) | | President, since 2017 | | Executive Vice President of Wells Fargo & Company and Head of Affiliated Managers, Wells Fargo Asset Management, since 2014. In addition, Mr. Owen is currently President, Chief Executive Officer and Director of Wells Fargo Funds Management, LLC since 2017. Prior thereto, Executive Vice President responsible for marketing, investments and product development for Wells Fargo Funds Management, LLC, from 2009 to 2014. |
| | |
Jeremy DePalma1 (Born 1974) | | Treasurer, since 2012 | | Senior Vice President of Wells Fargo Funds Management, LLC since 2009. Senior Vice President of Evergreen Investment Management Company, LLC from 2008 to 2010 and head of the Fund Reporting and Control Team within Fund Administration from 2005 to 2010. |
| | |
Michelle Rhee4 (Born 1966) | | Chief Legal Officer, since 2019 | | Secretary of Wells Fargo Funds Management, LLC, Chief Legal Counsel of Wells Fargo Asset Management and Assistant General Counsel of Wells Fargo Bank, N.A. since 2018. Associate General Counsel and Managing Director of Bank of America Corporation from 2004 to 2018. |
| | |
Catherine Kennedy5 (Born 1969) | | Secretary, since 2019 | | Vice President of Wells Fargo Funds Management, LLC and Senior Counsel of the Wells Fargo Legal Department since 2010. Vice President and Senior Counsel of Evergreen Investment Management Company, LLC from 1998 to 2010. |
| | |
Michael H. Whitaker (Born 1967) | | Chief Compliance Officer, since 2016 | | Chief Compliance Officer of Wells Fargo Asset Management since 2016. Senior Vice President and Chief Compliance Officer for Fidelity Investments from 2007 to 2016. |
| | |
David Berardi (Born 1975) | | Assistant Treasurer, since 2009 | | Vice President of Wells Fargo Funds Management, LLC since 2009. Vice President of Evergreen Investment Management Company, LLC from 2008 to 2010. Manager of Fund Reporting and Control for Evergreen Investment Management Company, LLC from 2004 to 2010. |
| 1 | Jeremy DePalma acts as Treasurer of 85 funds and Assistant Treasurer of 64 funds in the Fund Complex. |
| 2 | The Statement of Additional Information includes additional information about the Trustees and is available, without charge, upon request, by calling1-800-260-5969 or by visiting the website atwfam.com. |
| 3 | Pamela Wheelock wasre-appointed to the Board effective January 1, 2020. |
| 4 | Michelle Rhee became Chief Legal Officer effective October 22, 2019. |
| 5 | Catherine Kennedy became Secretary effective October 22, 2019. |
28 | Wells Fargo VT Discovery Fund

For more information
More information about Wells Fargo Funds is available free upon request. To obtain literature, please write, visit the Fund’s website, or call:
Wells Fargo Funds
P.O. Box 219967
Kansas City, MO 64121-9967
Website:wfam.com
Individual investors:1-800-222-8222
Retail investment professionals:1-888-877-9275
Institutional investment professionals:1-866-765-0778

This report and the financial statements contained herein are submitted for the general information of the shareholders of the Fund. If this report is used for promotional purposes, distribution of the report must be accompanied or preceded by a current prospectus. Before investing, please consider the investment objectives, risks, charges, and expenses of the investment. For a current prospectus and, if available, a summary prospectus, containing this information, call1-800-260-5969 or visit the Fund’s website atwfam.com. Read the prospectus carefully before you invest or send money.
Wells Fargo Asset Management (WFAM) is the trade name for certain investment advisory/management firms owned by Wells Fargo & Company. These firms include but are not limited to Wells Capital Management Incorporated and Wells Fargo Funds Management, LLC. Certain products managed by WFAM entities are distributed by Wells Fargo Funds Distributor, LLC (a broker-dealer and Member FINRA).
This material is for general informational and educational purposes only and is NOT intended to provide investment advice or a recommendation of any kind—including a recommendation for any specific investment, strategy, or plan.
INVESTMENT PRODUCTS: NOT FDIC INSURED ◾ NO BANK GUARANTEE ◾ MAY LOSE VALUE
© 2020 Wells Fargo & Company. All rights reserved.
PAR-0120-02370 02-20
AVT1/AR147 12-19
Annual Report
December 31, 2019
Wells Fargo
VT Index Asset Allocation Fund
Beginning on January 1, 2021, as permitted by new regulations adopted by the Securities and Exchange Commission, paper copies of the Wells Fargo Funds’ annual and semi-annual shareholder reports issued after this date will no longer be sent by mail, unless you specifically request paper copies of the reports. Instead, the reports will be made available on the Funds’ website, and you will be notified by mail each time a report is posted and provided with a website address to access the report.
If you already elected to receive shareholder reports electronically, you will not be affected by this change and you need not take any action. You may elect to receive shareholder reports and other communications from the Fund electronically at any time by contacting your financial intermediary (such as a broker-dealer or bank) or, if you are a direct investor, by calling1-800-222-8222 or by enrolling at wellsfargo.com/advantagedelivery.
You may elect to receive all future reports in paper free of charge. If you invest through a financial intermediary, you can contact your financial intermediary to request that you continue to receive paper copies of your shareholder reports; if you invest directly with the Fund, you can call 1-800-222-8222. Your election to receive reports in paper will apply to all Wells Fargo Funds held in your account with your financial intermediary or, if you are a direct investor, to all Wells Fargo Funds that you hold.
|
|
|
Reduce clutter. Save trees. |
Sign up for electronic delivery of prospectuses and shareholder reports atwellsfargo.com/advantagedelivery |
The views expressed and any forward-looking statements are as of December 31, 2019, unless otherwise noted, and are those of the Fund managers and/or Wells Fargo Asset Management. Discussions of individual securities, or the markets generally, or any Wells Fargo Fund are not intended as individual recommendations. Future events or results may vary significantly from those expressed in any forward-looking statements. The views expressed are subject to change at any time in response to changing circumstances in the market. Wells Fargo Asset Management and the Fund disclaim any obligation to publicly update or revise any views expressed or forward-looking statements.
INVESTMENT PRODUCTS: NOT FDIC INSURED ◾ NO BANK GUARANTEE ◾ MAY LOSE VALUE
Wells Fargo VT Index Asset Allocation Fund | 1
Letter to shareholders (unaudited)

Andrew Owen
President
Wells Fargo Funds
“Financial markets rebounded strongly to open 2019 on a positive note”
Dear Shareholder:
We are pleased to offer you this annual report for the Wells Fargo VT Index Asset Allocation Fund for the12-month period that ended December 31, 2019. Despite some periods of market volatility, the year was strongly positive for financial markets as supportive central banks more than offset concerns over slowing global economic growth and international trade tensions.
Overall, both fixed-income and equity investors enjoyed healthy annual returns. For the period, U.S. stocks, based on the S&P 500 Index,1 gained 31.49% and international stocks, as measured by the MSCI ACWI ex USA Index (Net),2 returned 21.51%. The MSCI EM Index (Net)3 gained 18.42%. For bond investors, the Bloomberg Barclays U.S. Aggregate Bond Index4 added 8.72%, the Bloomberg Barclays Global Aggregateex-USD Index5 returned 5.09%, the Bloomberg Barclays Municipal Bond Index6 gained 7.54%, and the ICE BofA U.S. High Yield Index7 added 14.41%.
The year began with a strong market rebound.
After a volatile end of 2018 involving sharp losses, financial markets rebounded strongly to open 2019 on a positive note, as investors were encouraged by a sudden pivot by the U.S. Federal Reserve (Fed) to a more accommodative stance after a series of increases to the federal funds rate in 2017 and 2018. The S&P 500 Index gained 8.01% in January, the best monthly performance in 30 years. Returns for the MSCI ACWI ex USA Index (Net), the Bloomberg Barclays U.S. Aggregate Bond Index, and the Bloomberg Barclays Global Aggregateex-USD Index also were positive.
In February 2019, signs of slowing global growth grew more ominous. The Bureau of Economic Analysis announced fourth-quarter 2018 gross domestic product (GDP) grew at an annualized 2.2% rate, down from the levels of the prior two quarters. In a February report, the Bank of England forecast the slowest growth since the financial crisis for 2019. China and the U.S. continued to wrangle over trade issues. By the end of the first quarter of 2019, more accommodative Fed sentiment and steady, if not spectacular, U.S. economic and business metrics encouraged domestic investors.
Early second-quarter 2019 enthusiasm among investors faded.
During April, sustained low inflation, solid employment data, and first-quarter U.S. GDP of an annualized rate of 3.2% supported favorable sentiment. During May, markets
| 1 | The S&P 500 Index consists of 500 stocks chosen for market size, liquidity, and industry group representation. It is a market-value-weighted index with each stock’s weight in the index proportionate to its market value. You cannot invest directly in an index. |
| 2 | The Morgan Stanley Capital International (MSCI) All Country World Index (ACWI) ex USA Index (Net) is a free-float-adjusted market-capitalization-weighted index that is designed to measure the equity market performance of developed markets, excluding the United States. Source: MSCI. MSCI makes no express or implied warranties or representations and shall have no liability whatsoever with respect to any MSCI data contained herein. The MSCI data may not be further redistributed or used as a basis for other indices or any securities or financial products. This report is not approved, reviewed, or produced by MSCI. You cannot invest directly in an index. |
| 3 | The MSCI Emerging Markets (EM) Index (Net) is a free-float-adjusted market-capitalization-weighted index that is designed to measure equity market performance of emerging markets. You cannot invest directly in an index. |
| 4 | The Bloomberg Barclays U.S. Aggregate Bond Index is a broad-based benchmark that measures the investment-grade, U.S. dollar-denominated, fixed-rate taxable bond market, including Treasuries, government-related and corporate securities, mortgage-backed securities (agency fixed-rate and hybrid adjustable-rate mortgage pass-throughs), asset-backed securities, and commercial mortgage-backed securities. You cannot invest directly in an index. |
| 5 | The Bloomberg Barclays Global Aggregateex-USD Index is an unmanaged index that provides a broad-based measure of the global investment-grade fixed-income markets excluding the U.S. dollar-denominated debt market. You cannot invest directly in an index. |
| 6 | The Bloomberg Barclays Municipal Bond Index is an unmanaged index composed of long-termtax-exempt bonds with a minimum credit rating of Baa. You cannot invest directly in an index. |
| 7 | The ICE BofA U.S. High Yield Index is a market-capitalization-weighted index of domestic and Yankee high-yield bonds. The index tracks the performance of high-yield securities traded in the U.S. bond market. You cannot invest directly in an index. Copyright 2020. ICE Data Indices, LLC. All rights reserved. |
2 | Wells Fargo VT Index Asset Allocation Fund
Letter to shareholders (unaudited)
tumbled on mixed investment signals. In the U.S., partisan wrangling ramped up as Democrats and Republicans set their sights on 2020 presidential politics. The U.K.’s Brexit disagreements caused Prime Minister Theresa May to resign. Boris Johnson succeeded her only to exacerbate uncertainty about Brexit’s resolution ahead of an October 2019 deadline. The European Commission downgraded the 2019 growth forecast to 1.2%. The U.S. increased tariffs on products from China, China responded, and then talks broke down. President Donald Trump threatened to turn his foreign policy tariff tool to Mexico over immigration issues.
Midway through the year, investors regrouped, sentiment turned positive, and U.S. equity markets advanced during June and July. The gains, primarily driven by geopolitical and monetary policy events, pushed equity markets to new highs. European Central Bank President Mario Draghi indicated the bank was ready to cut rates or buy more assets to prop up inflation if needed. President Trump backed off of tariff threats against Mexico and China. In the U.S., the Fed implemented a 0.25% federal funds rate cut in July.
Later in July, the U.S. reversed course and threatened to impose higher tariffs on China’s exports after talks failed. China responded with tariff threats of its own and devalued the renminbi, a move that roiled global markets. Major U.S. stock market indices closed July with the worst weekly results of the year. Bond prices gained as Treasury yields fell to multiyear lows, and the yield curve inverted at multiple points along the30-year arc.
In August, U.S.-China trade tensions continued with no signs of compromise. Evidence of a continued global economic slowdown mounted, and central banks in China, New Zealand, and Thailand cut interest rates. Industrial and manufacturing data declined in China, Canada, Japan, and Germany. Adding to global uncertainty, Italy’s prime minister resigned, many feared a crackdown in Hong Kong as protestors sustained their calls for reform, and Boris Johnson planned to suspend Parliament as Brexit’s deadline neared.
In the U.S., the Fed cut interest rates a second time in September. U.S. manufacturing data disappointed investors. The U.S. Congress announced it would pursue an impeachment investigation of President Trump. Meanwhile, the Brexit impasse showed no signs of resolution. Officials in China said that hitting the country’s economic growth goals for the year would be difficult considering the weight of tariffs and trade restrictions. Although the S&P 500 Index finished the third quarter with the bestyear-to-date returns in more than 20 years, concerns about future returns remained.
The fourth quarter started on a strong note, with U.S.-China trade tensions relaxing in October 2019 along with renewed optimism for a U.K. Brexit deal and positive macroeconomic data. The initial estimate of U.S. third-quarter GDP growth was a resilient 1.9% annualized rate, while the U.S. unemployment rate fell to a50-year low of 3.5% in September. However, despite resilience among U.S. consumers, business confidence declined while manufacturing activity contracted. Concerned with a potential economic slowdown, the Fed lowered interest rates another quarter point in late October, its third rate cut in four months. This helped push the S&P 500 Index to a newall-time high, while emerging market equities rallied and global bonds declined overall, reflecting a broad pickup in risk appetite.
Equity markets continued to rally in November despite ongoing geopolitical risks. Hopes for a U.S.-China trade deal buoyed investor confidence. U.S. business sentiment improved slightly, and manufacturing and services activity picked up. Throughout the month, central bank actions were on hold. With that positive backdrop, developed market equities outpaced those in emerging markets, and U.S. stocks, as reflected by the S&P 500 Index, outperformednon-U.S. stocks overall. While consumer confidence and purchasing manager activity rose in the eurozone, China reported weakening manufacturing and consumer data. Bond yields rose marginally, leading to slightly negative returns for global government and investment-grade corporate bonds.
“Equity markets continued to rally in November despite ongoing geopolitical risks.”
Wells Fargo VT Index Asset Allocation Fund | 3
Letter to shareholders (unaudited)
Financial markets ended the year on a broadly positive note, with the U.S. and China reaching an accord on a Phase One trade deal, with some details to be worked out. That, along with the landslide win by the pro-Brexit U.K. Conservative Party in a national election and ongoing central bank support, gave investors greater certainty and confidence. U.S. economic indicators were generally positive, with the exception of manufacturing activity and business confidence. However, consumer confidence was resilient, fed by a robust labor market, tame inflation, and lower interest rates, which boosted housing affordability and stimulated homebuyer activity. The impeachment of U.S. President Donald Trump, while historically noteworthy, had little impact on markets. Meanwhile, slowing Chinese economic activity, partly attributable to the trade war, led to further government stimulus atyear-end through lower reserve ratios, allowing banks to lend more money.
Don’t let short-term uncertainty derail long-term investment goals.
Periods of investment uncertainty can present challenges, but experience has taught us that maintaining long-term investment goals can be an effective way to plan for the future. To help you create a sound strategy based on your personal goals and risk tolerance, Wells Fargo Funds offers more than 100 mutual funds spanning a wide range of asset classes and investment styles. Although diversification cannot guarantee an investment profit or prevent losses, we believe it can be an effective way to manage investment risk and potentially smooth out overall portfolio performance. We encourage investors to know their investments and to understand that appropriate levels of risk-taking may unlock opportunities.
Thank you for choosing to invest with Wells Fargo Funds. We appreciate your confidence in us and remain committed to helping you meet your financial needs.
Sincerely,

Andrew Owen
President
Wells Fargo Funds
|
|
|
For further information about your Fund, contact your investment professional, visit our website at wfam.com, or call us directly at1-800-260-5969. |
4 | Wells Fargo VT Index Asset Allocation Fund
This page is intentionally left blank.
Performance highlights (unaudited)
Investment objective
The Fund seeks long-term total return, consisting of capital appreciation and current income.
Manager
Wells Fargo Funds Management, LLC
Subadviser
Wells Capital Management Incorporated
Portfolio managers
Kandarp Acharya, CFA®‡, FRM
Petros N. Bocray, CFA®‡, FRM
Christian L. Chan, CFA®‡
Average annual total returns (%) as of December 31, 2019
| | | | | | | | | | | | | | | | | | | | | | |
| | | |
| | | | | | | | Expense ratios1 (%) | |
| | | | | | |
| | | Inception date | | 1 year | | | 5 year | | | 10 year | | | Gross | | | Net2 | |
| | | | | | | |
| Class 2 | | 4-15-1994 | | | 20.16 | | | | 7.38 | | | | 10.64 | | | | 1.05 | | | | 1.00 | |
| | | | | | | |
| Index Asset Allocation Blended Index3 | | – | | | 21.40 | | | | 8.38 | | | | 11.28 | | | | – | | | | – | |
| | | | | | | |
| Bloomberg Barclays U.S. Treasury Index4 | | – | | | 6.86 | | | | 2.36 | | | | 3.13 | | | | – | | | | – | |
| | | | | | | |
| S&P 500 Index5 | | – | | | 31.49 | | | | 11.70 | | | | 13.56 | | | | – | | | | – | |
Figures quoted represent past performance, which is no guarantee of future results. Investment return and principal value of an investment will fluctuate so that an investor’s shares, when redeemed, may be worth more or less than their original cost. Current performance may be lower or higher than the performance data quoted and assumes the reinvestment of dividends and capital gains. Currentmonth-end performance is available by calling1-800-260-5969. Performance figures of the Fund do not reflect fees and expenses charged pursuant to the terms of variable life insurance policies and variable annuity contracts. If these fees and expenses had been reflected, performance would have been lower.
Shares are sold without afront-end sales charge or contingent deferred sales charge.
Index returns do not include transaction costs associated with buying and selling securities, any mutual fund fees or expenses, or any taxes. It is not possible to invest directly in an index.
Balanced funds may invest in stocks and bonds. Stock values fluctuate in response to the activities of individual companies and general market and economic conditions. Bond values fluctuate in response to the financial condition of individual issuers, general market and economic conditions, and changes in interest rates. Changes in market conditions and government policies may lead to periods of heightened volatility in the bond market and reduced liquidity for certain bonds held by the Fund. In general, when interest rates rise, bond values fall and investors may lose principal value. Interest rate changes and their impact on the Fund and its share price can be sudden and unpredictable. The use of derivatives may reduce returns and/or increase volatility. Consult the Fund’s prospectus for additional information on these and other risks.
Please refer to the prospectus provided by your participating insurance company for detailed information describing the separate accounts for information regarding surrender charges, mortality and expense risk fees, and other charges that may be assessed by the participating insurance companies.
Please see footnotes on page 7.
6 | Wells Fargo VT Index Asset Allocation Fund
Performance highlights (unaudited)
|
|
| Growth of $10,000 investment as of December 31, 20196 |
|
|
| ‡ | CFA® and Chartered Financial Analyst® are trademarks owned by CFA Institute. |
| 1 | Reflects the expense ratios as stated in the most recent prospectus. The expense ratios shown are subject to change and may differ from the annualized expense ratios shown in the financial highlights of this report. |
| 2 | The manager has contractually committed through April 30, 2020, to waive fees and/or reimburse expenses to the extent necessary to cap total annual fund operating expenses after fee waivers at 1.00% for Class 2. Brokerage commissions, stamp duty fees, interest, taxes, acquired fund fees and expenses (if any), and extraordinary expenses are excluded from the expense cap. Prior to or after the commitment expiration date, the cap may be increased or the commitment to maintain the cap may be terminated only with the approval of the Board of Trustees. Without this cap, the Fund’s returns would have been lower. The expense ratio paid by an investor is the net expense ratio (the total annual fund operating expenses after fee waivers) as stated in the prospectus. |
| 3 | Source: Wells Fargo Funds Management, LLC. The Index Asset Allocation Blended Index is weighted 60% in the S&P 500 Index and 40% in the Bloomberg Barclays U.S. Treasury Index. You cannot invest directly in an index. |
| 4 | The Bloomberg Barclays U.S. Treasury Index is an unmanaged index of prices of U.S. Treasury bonds with maturities of 1 to 30 years. You cannot invest directly in an index. |
| 5 | The S&P 500 Index consists of 500 stocks chosen for market size, liquidity, and industry group representation. It is a market-value-weighted index with each stock’s weight in the index proportionate to its market value. You cannot invest directly in an index. |
| 6 | The chart compares the performance of Class 2 shares for the most recent ten years with the Index Asset Allocation Blended Index, Bloomberg Barclays U.S. Treasury Index, and the S&P 500 Index. The chart assumes a hypothetical $10,000 investment and reflects all operating expenses of the Fund but does not reflect fees and expenses charged pursuant to the terms of variable life insurance policies and variable annuity contracts. |
| 7 | The Morgan Stanley Capital International (MSCI) Europe, Australasia, Far East (EAFE) Index (Net) is a free-float-adjusted market-capitalization-weighted index that is designed to measure the equity market performance of developed markets, excluding the United States and Canada. Source: MSCI. MSCI makes no express or implied warranties or representations and shall have no liability whatsoever with respect to any MSCI data contained herein. The MSCI data may not be further redistributed or used as a basis for other indices or any securities or financial products. This report is not approved, reviewed, or produced by MSCI. You cannot invest directly in an index. |
| 8 | The MSCI Emerging Markets (EM) Index (Net) is a free-float-adjusted market-capitalization-weighted index that is designed to measure equity market performance of emerging markets. You cannot invest directly in an index. |
| 9 | The Bloomberg Barclays 20+ Year U.S. Treasury Index is an unmanaged index composed of securities in the U.S. Treasury Index with maturities of 20 years or greater. You cannot invest directly in an index. |
| 10 | The ten largest holdings, excluding cash, cash equivalents and any money market funds, are calculated based on the value of the investments divided by total net assets of the Fund. Holdings are subject to change and may have changed since the date specified. |
| 11 | Amounts are calculated based on the total long-term investments of the Fund. These amounts are subject to change and may have changed since the date specified. |
| 12 | Effective allocation includes the effect of any tactical futures overlay that may be in place. Effective cash represents the net offset to such future positions. The amounts are subject to change and may have changed since the date specified. |
Wells Fargo VT Index Asset Allocation Fund | 7
Performance highlights (unaudited)
MANAGER’S DISCUSSION
Fund highlights
| ∎ | | The Fund underperformed its benchmark, the Index Asset Allocation Blended Index, for the12-month period that ended December 31, 2019. |
| ∎ | | Tactical trades in the second half of the year detracted from performance as the team adopted a more conservative posture while markets continued to trend higher. |
| ∎ | | A tactical overweight to equities in the first quarter of 2019 contributed to performance amid a sharp rally in the S&P 500 Index. |
The Fund’s management team rebalances the portfolio to reflect the ongoing changes in the constituents and their weightings within the index. One cannot invest directly in the benchmark, and timing of cash flows and other practical issues affect the Fund’s tracking error, which is a measure of how closely a portfolio tracks the index to which it is benchmarked. The team uses an investment process designed to control trading and implementation costs and reduce tracking error to the benchmark as much as possible.
2019 was marked by trade and U.S. Federal Reserve policy.
Trade developments and actions by the U.S. Federal Reserve (Fed) had a significant impact on markets during the12-month period. Politics seemed to drive markets lower as the issues became more severe, but then they drove markets higher as tensions eased. What happened between the U.S. and China didn’t stay contained to those two countries. China experienced a rather rapid growth slowdown, but the spillover along the global supply chain adversely affected many countries in Asia, such as Korea and Japan, as well as countries in Europe, including Germany. Business capital spending stayed on hold due to trade uncertainty. Manufacturing slipped into a recession, but services—while affected—proved to be more resilient than many feared.
Towardyear-end, the U.S. and China finally reached a Phase One trade agreement, which calmed fears among investors and drove risk markets higher. Markets also responded positively to a reversal in monetary policy by the Fed, which cut rates three times in 2019 in order to stave off fears that weak global growth and a potential trade war might lead to a U.S. recession.
For the period as a whole, the S&P 500 Index rose by 31.5%, its best calendar-year return since 2013. Developednon-U.S. markets, as measured by the MSCI EAFE Index (Net)7, returned 22.01%, while emerging markets, as measured by the MSCI EM Index (Net)8, gained 18.4%. Gains were not limited to equity markets as U.S. government bond prices rose during the period amid a drop in bond yields. The Bloomberg Barclays U.S. Treasury Index rose by 6.9% during the12-month period, while the longest-term bonds, as measured by the Bloomberg Barclays 20+ Year U.S. Treasury Index9, gained 15.1%.
| | | | |
|
| Ten largest holdings (%) as of December 31, 201910 | |
| | |
Apple Incorporated | | | 2.79 | |
| | |
Microsoft Corporation | | | 2.72 | |
| | |
Amazon.com Incorporated | | | 1.74 | |
| | |
Facebook Incorporated Class A | | | 1.11 | |
| | |
Berkshire Hathaway Incorporated Class B | | | 1.00 | |
| | |
JPMorgan Chase & Company | | | 0.99 | |
| | |
Alphabet Incorporated Class A | | | 0.91 | |
| | |
Alphabet Incorporated Class C | | | 0.90 | |
| | |
Johnson & Johnson | | | 0.87 | |
| | |
Visa Incorporated Class A | | | 0.73 | |
As ofyear-end, the Fund maintained an overweight to bonds relative to its benchmark.
The Fund’s effective allocation is determined by a combination of inputs from multiple quantitative and qualitative factors. All of the changes to the effective allocation were implemented with futures contracts.
Tactical shifts between stocks and bonds contributed modestly to performance.
The Fund’s stock holdings seek to replicate the holdings of the S&P 500 Index, and its bond holdings seek to replicate the holdings of the Bloomberg Barclays U.S. Treasury Index. The Fund’s neutral target allocation is 60% stocks and 40%
bonds. As ofyear-end, the Fund had an effective target allocation of 60% in stocks, 47% in bonds, and-7% in effective cash. The effective target allocation reflects the Fund’syear-end long exposure to10-year U.S. Treasury futures, which increased the portfolio’s effective exposure to bonds.
Please see footnotes on page 7.
8 | Wells Fargo VT Index Asset Allocation Fund
Performance highlights (unaudited)
The team started 2019 with a long position in S&P 500 Index futures and a short position in10-year U.S. Treasury futures. As markets rallied in the first quarter of 2019, the team decided to lock in some gains by closing out its long S&P 500 futures position as well as its short position in U.S. Treasury futures. The team adopted a more conservative posture in the second half of the year, which detracted from performance as risk markets continued to trend higher.
|
|
| Equity sector distribution as of December 31, 201911 |
|
 |
| | | | | | | | |
|
| Allocations as of December 31, 2019 | |
| | |
| | | Neutral
allocation | | | Effective
allocation12 | |
| | | |
Stocks | | | 60% | | | | 60% | |
| | | |
Bonds | | | 40% | | | | 47% | |
| | | |
Effective Cash | | | 0% | | | | (7)% | |
Please see footnotes on page 7.
Wells Fargo VT Index Asset Allocation Fund | 9
Fund expenses (unaudited)
As a shareholder of the Fund, you incur ongoing costs, including management fees, distribution(12b-1) fees, and other Fund expenses. This example is intended to help you understand your ongoing costs (in dollars) of investing in the Fund and to compare these costs with the ongoing costs of investing in other mutual funds.
The example is based on an investment of $1,000 invested at the beginning of thesix-month period and held for the entire period from July 1, 2019 to December 31, 2019.
Actual expenses
The “Actual” line of the table below provides information about actual account values and actual expenses. You may use the information in this line, together with the amount you invested, to estimate the expenses that you paid over the period. Simply divide your account value by $1,000 (for example, an $8,600 account value divided by $1,000 = 8.6), then multiply the result by the number in the “Actual” line under the heading entitled “Expenses Paid During Period” for your applicable class of shares to estimate the expenses you paid on your account during this period.
Hypothetical example for comparison purposes
The “Hypothetical” line of the table below provides information about hypothetical account values and hypothetical expenses based on the Fund’s actual expense ratio and an assumed rate of return of 5% per year before expenses, which is not the Fund’s actual return. The hypothetical account values and expenses may not be used to estimate the actual ending account balance or expenses you paid for the period. You may use this information to compare the ongoing costs of investing in the Fund and other funds. To do so, compare this 5% hypothetical example with the 5% hypothetical examples that appear in the shareholder reports of the other funds.
Please note that the expenses shown in the table are meant to highlight your ongoing costs only and do not reflect any separate account charges assessed by participating insurance companies. Therefore, the “Hypothetical” line of the table is useful in comparing ongoing costs only, and will not help you determine the relative total costs of owning different funds. In addition, if these separate account charges assessed by participating insurance companies were included, your costs would have been higher.
| | | | | | | | | | | | | | | | |
| | | Beginning
account value
7-1-2019 | | | Ending
account value
12-31-2019 | | | Expenses
paid during
the period¹ | | | Annualized net
expense ratio | |
| | | | | |
Class 2 | | | | | | | | | | | | | | | | |
| | | | |
Actual | | $ | 1,000.00 | | | $ | 1,060.41 | | | $ | 5.19 | | | | 1.00 | % |
| | | | |
Hypothetical (5% return before expenses) | | $ | 1,000.00 | | | $ | 1,020.17 | | | $ | 5.09 | | | | 1.00 | % |
| 1 | Expenses paid is equal to the annualized net expense ratio multiplied by the average account value over the period, multiplied by the number of days in the most recent fiscal half-year divided by the number of days in the fiscal year (to reflect theone-half year period). |
10 | Wells Fargo VT Index Asset Allocation Fund
Portfolio of investments—December 31, 2019
| | | | | | | | | | | | | | | | |
| | | | | | | | | Shares | | | Value | |
| Common Stocks: 60.49% | | | | | | | | | | | | | | | | |
| | | | |
Communication Services: 6.28% | | | | | | | | | | | | | | | | |
| | | | |
| Diversified Telecommunication Services: 1.25% | | | | | | | | | | | | |
AT&T Incorporated | | | | | | | | | | | 11,932 | | | $ | 466,303 | |
CenturyLink Incorporated | | | | | | | | | | | 1,591 | | | | 21,017 | |
Verizon Communications Incorporated | | | | | | | | | | | 6,755 | | | | 414,757 | |
| | | | |
| | | | | | | | | | | | | | | 902,077 | |
| | | | | | | | | | | | | | | | |
| | | | |
| Entertainment: 1.13% | | | | | | | | | | | | |
Activision Blizzard Incorporated | | | | | | | | | | | 1,254 | | | | 74,513 | |
Electronic Arts Incorporated † | | | | | | | | | | | 476 | | | | 51,175 | |
Live Nation Entertainment Incorporated † | | | | | | | | | | | 229 | | | | 16,367 | |
Netflix Incorporated † | | | | | | | | | | | 711 | | | | 230,058 | |
Take-Two Interactive Software Incorporated † | | | | | | | | | | | 184 | | | | 22,527 | |
The Walt Disney Company | | | | | | | | | | | 2,938 | | | | 424,923 | |
| | | | |
| | | | | | | | | | | | | | | 819,563 | |
| | | | | | | | | | | | | | | | |
| | | | |
| Interactive Media & Services: 2.98% | | | | | | | | | | | | |
Alphabet Incorporated Class A † | | | | | | | | | | | 489 | | | | 654,962 | |
Alphabet Incorporated Class C † | | | | | | | | | | | 488 | | | | 652,466 | |
Facebook Incorporated Class A † | | | | | | | | | | | 3,921 | | | | 804,785 | |
Twitter Incorporated † | | | | | | | | | | | 1,266 | | | | 40,575 | |
| | | | |
| | | | | | | | | | | | | | | 2,152,788 | |
| | | | | | | | | | | | | | | | |
| | | | |
| Media: 0.86% | | | | | | | | | | | | |
Charter Communications Incorporated Class A † | | | | | | | | | | | 256 | | | | 124,180 | |
Comcast Corporation Class A | | | | | | | | | | | 7,419 | | | | 333,632 | |
Discovery Communications Incorporated Class A † | | | | | | | | | | | 256 | | | | 8,381 | |
Discovery Communications Incorporated Class C † | | | | | | | | | | | 545 | | | | 16,617 | |
DISH Network Corporation Class A † | | | | | | | | | | | 416 | | | | 14,756 | |
Fox Corporation Class A | | | | | | | | | | | 578 | | | | 21,426 | |
Fox Corporation Class B | | | | | | | | | | | 264 | | | | 9,610 | |
Interpublic Group of Companies Incorporated | | | | | | | | | | | 634 | | | | 14,645 | |
News Corporation Class A | | | | | | | | | | | 633 | | | | 8,951 | |
News Corporation Class B | | | | | | | | | | | 199 | | | | 2,887 | |
Omnicom Group Incorporated | | | | | | | | | | | 356 | | | | 28,843 | |
ViacomCBS Incorporated Class B | | | | | | | | | | | 880 | | | | 36,934 | |
| | | | |
| | | | | | | | | | | | | | | 620,862 | |
| | | | | | | | | | | | | | | | |
|
| Wireless Telecommunication Services: 0.06% | |
T-Mobile US Incorporated † | | | | | | | | | | | 519 | | | | 40,700 | |
| | | | | | | | | | | | | | | | |
| | | | |
Consumer Discretionary: 5.89% | | | | | | | | | | | | | | | | |
| | | | |
| Auto Components: 0.07% | | | | | | | | | | | | |
Aptiv plc | | | | | | | | | | | 415 | | | | 39,413 | |
BorgWarner Incorporated | | | | | | | | | | | 336 | | | | 14,576 | |
| | | | |
| | | | | | | | | | | | | | | 53,989 | |
| | | | | | | | | | | | | | | | |
| | | | |
| Automobiles: 0.20% | | | | | | | | | | | | |
Ford Motor Company | | | | | | | | | | | 6,338 | | | | 58,943 | |
General Motors Company | | | | | | | | | | | 2,055 | | | | 75,213 | |
Harley-Davidson Incorporated | | | | | | | | | | | 251 | | | | 9,335 | |
| | | | |
| | | | | | | | | | | | | | | 143,491 | |
| | | | | | | | | | | | | | | | |
The accompanying notes are an integral part of these financial statements.
Wells Fargo VT Index Asset Allocation Fund | 11
Portfolio of investments—December 31, 2019
| | | | | | | | | | | | | | | | |
| | | | | | | | | Shares | | | Value | |
| Distributors: 0.06% | | | | | | | | | | | | |
Genuine Parts Company | | | | | | | | | | | 236 | | | $ | 25,070 | |
LKQ Corporation † | | | | | | | | | | | 499 | | | | 17,814 | |
| | | | |
| | | | | | | | | | | | | | | 42,884 | |
| | | | | | | | | | | | | | | | |
|
| Diversified Consumer Services: 0.01% | |
H&R Block Incorporated | | | | | | | | | | | 319 | | | | 7,490 | |
| | | | | | | | | | | | | | | | |
| | | | |
| Hotels, Restaurants & Leisure: 1.13% | | | | | | | | | | | | |
Carnival Corporation | | | | | | | | | | | 652 | | | | 33,141 | |
Chipotle Mexican Grill Incorporated † | | | | | | | | | | | 41 | | | | 34,322 | |
Darden Restaurants Incorporated | | | | | | | | | | | 201 | | | | 21,911 | |
Hilton Worldwide Holdings Incorporated | | | | | | | | | | | 461 | | | | 51,130 | |
Las Vegas Sands Corporation | | | | | | | | | | | 550 | | | | 37,972 | |
Marriott International Incorporated Class A | | | | | | | | | | | 443 | | | | 67,083 | |
McDonald’s Corporation | | | | | | | | | | | 1,232 | | | | 243,456 | |
MGM Resorts International | | | | | | | | | | | 839 | | | | 27,914 | |
Norwegian Cruise Line Holdings Limited † | | | | | | | | | | | 348 | | | | 20,327 | |
Royal Caribbean Cruises Limited | | | | | | | | | | | 281 | | | | 37,516 | |
Starbucks Corporation | | | | | | | | | | | 1,930 | | | | 169,686 | |
Wynn Resorts Limited | | | | | | | | | | | 157 | | | | 21,803 | |
Yum! Brands Incorporated | | | | | | | | | | | 494 | | | | 49,761 | |
| | | | |
| | | | | | | | | | | | | | | 816,022 | |
| | | | | | | | | | | | | | | | |
| | | | |
| Household Durables: 0.23% | | | | | | | | | | | | |
D.R. Horton Incorporated | | | | | | | | | | | 550 | | | | 29,013 | |
Garmin Limited | | | | | | | | | | | 235 | | | | 22,927 | |
Leggett & Platt Incorporated | | | | | | | | | | | 214 | | | | 10,878 | |
Lennar Corporation Class A | | | | | | | | | | | 458 | | | | 25,552 | |
Mohawk Industries Incorporated † | | | | | | | | | | | 96 | | | | 13,092 | |
Newell Rubbermaid Incorporated | | | | | | | | | | | 623 | | | | 11,974 | |
NVR Incorporated † | | | | | | | | | | | 5 | | | | 19,042 | |
Pulte Group Incorporated | | | | | | | | | | | 418 | | | | 16,218 | |
Whirlpool Corporation | | | | | | | | | | | 102 | | | | 15,048 | |
| | | | |
| | | | | | | | | | | | | | | 163,744 | |
| | | | | | | | | | | | | | | | |
| | | | |
| Internet & Direct Marketing Retail: 2.02% | | | | | | | | | | | | |
Amazon.com Incorporated † | | | | | | | | | | | 678 | | | | 1,252,836 | |
Booking Holdings Incorporated † | | | | | | | | | | | 67 | | | | 137,600 | |
eBay Incorporated | | | | | | | | | | | 1,248 | | | | 45,065 | |
Expedia Group Incorporated | | | | | | | | | | | 227 | | | | 24,548 | |
| | | | |
| | | | | | | | | | | | | | | 1,460,049 | |
| | | | | | | | | | | | | | | | |
| | | | |
| Leisure Products: 0.03% | | | | | | | | | | | | |
Hasbro Incorporated | | | | | | | | | | | 207 | | | | 21,861 | |
| | | | | | | | | | | | | | | | |
| | | | |
| Multiline Retail: 0.33% | | | | | | | | | | | | |
Dollar General Corporation | | | | | | | | | | | 417 | | | | 65,044 | |
Dollar Tree Incorporated † | | | | | | | | | | | 388 | | | | 36,491 | |
Kohl’s Corporation | | | | | | | | | | | 255 | | | | 12,992 | |
Macy’s Incorporated | | | | | | | | | | | 505 | | | | 8,585 | |
Nordstrom Incorporated | | | | | | | | | | | 174 | | | | 7,122 | |
Target Corporation | | | | | | | | | | | 825 | | | | 105,773 | |
| | | | |
| | | | | | | | | | | | | | | 236,007 | |
| | | | | | | | | | | | | | | | |
The accompanying notes are an integral part of these financial statements.
12 | Wells Fargo VT Index Asset Allocation Fund
Portfolio of investments—December 31, 2019
| | | | | | | | | | | | | | | | |
| | | | | | | | | Shares | | | Value | |
| Specialty Retail: 1.36% | | | | | | | | | | | | |
Advance Auto Parts Incorporated | | | | | | | | | | | 112 | | | $ | 17,938 | |
AutoZone Incorporated † | | | | | | | | | | | 38 | | | | 45,270 | |
Best Buy Company Incorporated | | | | | | | | | | | 371 | | | | 32,574 | |
CarMax Incorporated † | | | | | | | | | | | 268 | | | | 23,496 | |
L Brands Incorporated | | | | | | | | | | | 378 | | | | 6,849 | |
Lowe’s Companies Incorporated | | | | | | | | | | | 1,254 | | | | 150,179 | |
O’Reilly Automotive Incorporated † | | | | | | | | | | | 123 | | | | 53,906 | |
Ross Stores Incorporated | | | | | | | | | | | 593 | | | | 69,037 | |
The Gap Incorporated | | | | | | | | | | | 347 | | | | 6,135 | |
The Home Depot Incorporated | | | | | | | | | | | 1,780 | | | | 388,716 | |
The TJX Companies Incorporated | | | | | | | | | | | 1,986 | | | | 121,265 | |
Tiffany & Company | | | | | | | | | | | 176 | | | | 23,522 | |
Tractor Supply Company | | | | | | | | | | | 194 | | | | 18,127 | |
ULTA Beauty Incorporated † | | | | | | | | | | | 92 | | | | 23,289 | |
| | | | |
| | | | | | | | | | | | | | | 980,303 | |
| | | | | | | | | | | | | | | | |
| | | | |
| Textiles, Apparel & Luxury Goods: 0.45% | | | | | | | | | | | | |
Capri Holdings Limited † | | | | | | | | | | | 246 | | | | 9,385 | |
HanesBrands Incorporated | | | | | | | | | | | 591 | | | | 8,776 | |
Nike Incorporated Class B | | | | | | | | | | | 2,034 | | | | 206,065 | |
PVH Corporation | | | | | | | | | | | 120 | | | | 12,618 | |
Ralph Lauren Corporation | | | | | | | | | | | 80 | | | | 9,378 | |
Tapestry Incorporated | | | | | | | | | | | 448 | | | | 12,083 | |
Under Armour Incorporated Class A † | | | | | | | | | | | 306 | | | | 6,610 | |
Under Armour Incorporated Class C † | | | | | | | | | | | 316 | | | | 6,061 | |
VF Corporation | | | | | | | | | | | 534 | | | | 53,218 | |
| | | | |
| | | | | | | | | | | | | | | 324,194 | |
| | | | | | | | | | | | | | | | |
|
Consumer Staples: 4.36% | |
|
| Beverages: 1.09% | |
Brown-Forman Corporation Class B | | | | | | | | | | | 297 | | | | 20,077 | |
Constellation Brands Incorporated Class A | | | | | | | | | | | 273 | | | | 51,802 | |
Molson Coors Brewing Company Class B | | | | | | | | | | | 307 | | | | 16,547 | |
Monster Beverage Corporation † | | | | | | | | | | | 623 | | | | 39,592 | |
PepsiCo Incorporated | | | | | | | | | | | 2,277 | | | | 311,198 | |
The Coca-Cola Company | | | | | | | | | | | 6,308 | | | | 349,148 | |
| | | | |
| | | | | | | | | | | | | | | 788,364 | |
| | | | | | | | | | | | | | | | |
| | | | |
| Food & Staples Retailing: 0.93% | | | | | | | | | | | | |
Costco Wholesale Corporation | | | | | | | | | | | 722 | | | | 212,210 | |
Sysco Corporation | | | | | | | | | | | 833 | | | | 71,255 | |
The Kroger Company | | | | | | | | | | | 1,312 | | | | 38,035 | |
Walgreens Boots Alliance Incorporated | | | | | | | | | | | 1,222 | | | | 72,049 | |
Walmart Incorporated | | | | | | | | | | | 2,317 | | | | 275,352 | |
| | | | |
| | | | | | | | | | | | | | | 668,901 | |
| | | | | | | | | | | | | | | | |
| | | | |
| Food Products: 0.69% | | | | | | | | | | | | |
Archer Daniels Midland Company | | | | | | | | | | | 909 | | | | 42,132 | |
Campbell Soup Company | | | | | | | | | | | 275 | | | | 13,591 | |
ConAgra Foods Incorporated | | | | | | | | | | | 795 | | | | 27,221 | |
General Mills Incorporated | | | | | | | | | | | 986 | | | | 52,810 | |
Hormel Foods Corporation | | | | | | | | | | | 453 | | | | 20,435 | |
Kellogg Company | | | | | | | | | | | 406 | | | | 28,079 | |
Lamb Weston Holdings Incorporated | | | | | | | | | | | 238 | | | | 20,475 | |
McCormick & Company Incorporated | | | | | | | | | | | 202 | | | | 34,285 | |
The accompanying notes are an integral part of these financial statements.
Wells Fargo VT Index Asset Allocation Fund | 13
Portfolio of investments—December 31, 2019
| | | | | | | | | | | | | | | | |
| | | | | | | | | Shares | | | Value | |
| | | | |
| Food Products (continued) | | | | | | | | | | | | |
Mondelez International Incorporated Class A | | | | | | | | | | | 2,355 | | | $ | 129,713 | |
The Hershey Company | | | | | | | | | | | 242 | | | | 35,569 | |
The J.M. Smucker Company | | | | | | | | | | | 186 | | | | 19,368 | |
The Kraft Heinz Company | | | | | | | | | | | 1,018 | | | | 32,708 | |
Tyson Foods Incorporated Class A | | | | | | | | | | | 482 | | | | 43,881 | |
| | | | |
| | | | | | | | | | | | | | | 500,267 | |
| | | | | | | | | | | | | | | | |
| | | | |
| Household Products: 1.03% | | | | | | | | | | | | |
Church & Dwight Company Incorporated | | | | | | | | | | | 402 | | | | 28,277 | |
Colgate-Palmolive Company | | | | | | | | | | | 1,400 | | | | 96,376 | |
Kimberly-Clark Corporation | | | | | | | | | | | 560 | | | | 77,028 | |
The Clorox Company | | | | | | | | | | | 205 | | | | 31,476 | |
The Procter & Gamble Company | | | | | | | | | | | 4,070 | | | | 508,343 | |
| | | | |
| | | | | | | | | | | | | | | 741,500 | |
| | | | | | | | | | | | | | | | |
| | | | |
| Personal Products: 0.11% | | | | | | | | | | | | |
Coty Incorporated Class A | | | | | | | | | | | 483 | | | | 5,434 | |
The Estee Lauder Companies Incorporated Class A | | | | | | | | | | | 364 | | | | 75,181 | |
| | | | |
| | | | | | | | | | | | | | | 80,615 | |
| | | | | | | | | | | | | | | | |
| | | | |
| Tobacco: 0.51% | | | | | | | | | | | | |
Altria Group Incorporated | | | | | | | | | | | 3,048 | | | | 152,126 | |
Philip Morris International Incorporated | | | | | | | | | | | 2,537 | | | | 215,873 | |
| | | | |
| | | | | | | | | | | | | | | 367,999 | |
| | | | | | | | | | | | | | | | |
| | | | |
Energy: 2.62% | | | | | | | | | | | | | | | | |
| | | | |
| Energy Equipment & Services: 0.26% | | | | | | | | | | | | |
Baker Hughes Incorporated | | | | | | | | | | | 1,060 | | | | 27,168 | |
Halliburton Company | | | | | | | | | | | 1,426 | | | | 34,894 | |
Helmerich & Payne Incorporated | | | | | | | | | | | 177 | | | | 8,041 | |
National Oilwell Varco Incorporated | | | | | | | | | | | 629 | | | | 15,756 | |
Schlumberger Limited | | | | | | | | | | | 2,262 | | | | 90,932 | |
TechnipFMC plc | | | | | | | | | | | 685 | | | | 14,686 | |
| | | | |
| | | | | | | | | | | | | | | 191,477 | |
| | | | | | | | | | | | | | | | |
| | | | |
| Oil, Gas & Consumable Fuels: 2.36% | | | | | | | | | | | | |
Apache Corporation | | | | | | | | | | | 607 | | | | 15,533 | |
Cabot Oil & Gas Corporation | | | | | | | | | | | 666 | | | | 11,595 | |
Chevron Corporation | | | | | | | | | | | 3,080 | | | | 371,171 | |
Cimarex Energy Company | | | | | | | | | | | 166 | | | | 8,713 | |
Concho Resources Incorporated | | | | | | | | | | | 326 | | | | 28,548 | |
ConocoPhillips | | | | | | | | | | | 1,786 | | | | 116,144 | |
Devon Energy Corporation | | | | | | | | | | | 628 | | | | 16,309 | |
Diamondback Energy Incorporated | | | | | | | | | | | 262 | | | | 24,329 | |
EOG Resources Incorporated | | | | | | | | | | | 946 | | | | 79,237 | |
Exxon Mobil Corporation | | | | | | | | | | | 6,881 | | | | 480,156 | |
Hess Corporation | | | | | | | | | | | 420 | | | | 28,060 | |
HollyFrontier Corporation | | | | | | | | | | | 240 | | | | 12,170 | |
Kinder Morgan Incorporated | | | | | | | | | | | 3,182 | | | | 67,363 | |
Marathon Oil Corporation | | | | | | | | | | | 1,299 | | | | 17,640 | |
Marathon Petroleum Corporation | | | | | | | | | | | 1,054 | | | | 63,504 | |
Noble Energy Incorporated | | | | | | | | | | | 779 | | | | 19,350 | |
Occidental Petroleum Corporation | | | | | | | | | | | 1,455 | | | | 59,961 | |
ONEOK Incorporated | | | | | | | | | | | 674 | | | | 51,002 | |
The accompanying notes are an integral part of these financial statements.
14 | Wells Fargo VT Index Asset Allocation Fund
Portfolio of investments—December 31, 2019
| | | | | | | | | | | | | | | | |
| | | | | | | | | Shares | | | Value | |
| | | | |
| Oil, Gas & Consumable Fuels (continued) | | | | | | | | | | | | |
Phillips 66 | | | | | | | | | | | 725 | | | $ | 80,772 | |
Pioneer Natural Resources Company | | | | | | | | | | | 270 | | | | 40,870 | |
The Williams Companies Incorporated | | | | | | | | | | | 1,973 | | | | 46,800 | |
Valero Energy Corporation | | | | | | | | | | | 669 | | | | 62,652 | |
| | | | |
| | | | | | | | | | | | | | | 1,701,879 | |
| | | | | | | | | | | | | | | | |
| | | | |
Financials: 7.83% | | | | | | | | | | | | | | | | |
| | | | |
| Banks: 3.40% | | | | | | | | | | | | |
Bank of America Corporation | | | | | | | | | | | 13,171 | | | | 463,883 | |
Citigroup Incorporated | | | | | | | | | | | 3,553 | | | | 283,849 | |
Citizens Financial Group Incorporated | | | | | | | | | | | 708 | | | | 28,752 | |
Comerica Incorporated | | | | | | | | | | | 234 | | | | 16,790 | |
Fifth Third Bancorp | | | | | | | | | | | 1,156 | | | | 35,535 | |
First Republic Bank | | | | | | | | | | | 274 | | | | 32,181 | |
Huntington Bancshares Incorporated | | | | | | | | | | | 1,681 | | | | 25,349 | |
JPMorgan Chase & Company | | | | | | | | | | | 5,113 | | | | 712,753 | |
KeyCorp | | | | | | | | | | | 1,603 | | | | 32,445 | |
M&T Bank Corporation | | | | | | | | | | | 215 | | | | 36,496 | |
People’s United Financial Incorporated | | | | | | | | | | | 725 | | | | 12,253 | |
PNC Financial Services Group Incorporated | | | | | | | | | | | 714 | | | | 113,976 | |
Regions Financial Corporation | | | | | | | | | | | 1,571 | | | | 26,958 | |
SVB Financial Group † | | | | | | | | | | | 83 | | | | 20,836 | |
Truist Financial Corporation | | | | | | | | | | | 2,188 | | | | 123,228 | |
US Bancorp | | | | | | | | | | | 2,320 | | | | 137,553 | |
Wells Fargo & Company (l) | | | | | | | | | | | 6,271 | | | | 337,379 | |
Zions Bancorporation | | | | | | | | | | | 278 | | | | 14,434 | |
| | | | |
| | | | | | | | | | | | | | | 2,454,650 | |
| | | | | | | | | | | | | | | | |
| | | | |
| Capital Markets: 1.62% | | | | | | | | | | | | |
Ameriprise Financial Incorporated | | | | | | | | | | | 206 | | | | 34,315 | |
Bank of New York Mellon Corporation | | | | | | | | | | | 1,371 | | | | 69,002 | |
BlackRock Incorporated | | | | | | | | | | | 192 | | | | 96,518 | |
CBOE Holdings Incorporated | | | | | | | | | | | 181 | | | | 21,720 | |
CME Group Incorporated | | | | | | | | | | | 583 | | | | 117,020 | |
E*TRADE Financial Corporation | | | | | | | | | | | 367 | | | | 16,651 | |
Franklin Resources Incorporated | | | | | | | | | | | 454 | | | | 11,795 | |
Intercontinental Exchange Incorporated | | | | | | | | | | | 909 | | | | 84,128 | |
Invesco Limited | | | | | | | | | | | 608 | | | | 10,932 | |
MarketAxess Holdings Incorporated | | | | | | | | | | | 61 | | | | 23,126 | |
Moody’s Corporation | | | | | | | | | | | 265 | | | | 62,914 | |
Morgan Stanley | | | | | | | | | | | 2,007 | | | | 102,598 | |
MSCI Incorporated | | | | | | | | | | | 138 | | | | 35,629 | |
Northern Trust Corporation | | | | | | | | | | | 346 | | | | 36,759 | |
Raymond James Financial Incorporated | | | | | | | | | | | 202 | | | | 18,071 | |
S&P Global Incorporated | | | | | | | | | | | 400 | | | | 109,220 | |
State Street Corporation | | | | | | | | | | | 592 | | | | 46,827 | |
T. Rowe Price Group Incorporated | | | | | | | | | | | 380 | | | | 46,299 | |
The Charles Schwab Corporation | | | | | | | | | | | 1,860 | | | | 88,462 | |
The Goldman Sachs Group Incorporated | | | | | | | | | | | 519 | | | | 119,334 | |
The NASDAQ OMX Group Incorporated | | | | | | | | | | | 187 | | | | 20,028 | |
| | | | |
| | | | | | | | | | | | | | | 1,171,348 | |
| | | | | | | | | | | | | | | | |
| | | | |
| Consumer Finance: 0.41% | | | | | | | | | | | | |
American Express Company | | | | | | | | | | | 1,095 | | | | 136,317 | |
Capital One Financial Corporation | | | | | | | | | | | 759 | | | | 78,109 | |
The accompanying notes are an integral part of these financial statements.
Wells Fargo VT Index Asset Allocation Fund | 15
Portfolio of investments—December 31, 2019
| | | | | | | | | | | | | | | | |
| | | | | | | | | Shares | | | Value | |
| | | | |
| Consumer Finance (continued) | | | | | | | | | | | | |
Discover Financial Services | | | | | | | | | | | 511 | | | $ | 43,343 | |
Synchrony Financial | | | | | | | | | | | 968 | | | | 34,858 | |
| | | | |
| | | | | | | | | | | | | | | 292,627 | |
| | | | | | | | | | | | | | | | |
| | | | |
| Diversified Financial Services: 1.00% | | | | | | | | | | | | |
Berkshire Hathaway Incorporated Class B † | | | | | | | | | | | 3,197 | | | | 724,121 | |
| | | | | | | | | | | | | | | | |
| | | | |
| Insurance: 1.40% | | | | | | | | | | | | |
AFLAC Incorporated | | | | | | | | | | | 1,198 | | | | 63,374 | |
American International Group Incorporated | | | | | | | | | | | 1,420 | | | | 72,889 | |
Aon plc | | | | | | | | | | | 382 | | | | 79,567 | |
Arthur J. Gallagher & Company | | | | | | | | | | | 305 | | | | 29,045 | |
Assurant Incorporated | | | | | | | | | | | 99 | | | | 12,977 | |
Chubb Limited | | | | | | | | | | | 741 | | | | 115,344 | |
Cincinnati Financial Corporation | | | | | | | | | | | 248 | | | | 26,077 | |
Everest Reinsurance Group Limited | | | | | | | | | | | 66 | | | | 18,271 | |
Globe Life Incorporated | | | | | | | | | | | 162 | | | | 17,051 | |
Lincoln National Corporation | | | | | | | | | | | 324 | | | | 19,119 | |
Loews Corporation | | | | | | | | | | | 419 | | | | 21,993 | |
Marsh & McLennan Companies Incorporated | | | | | | | | | | | 826 | | | | 92,025 | |
MetLife Incorporated | | | | | | | | | | | 1,274 | | | | 64,936 | |
Principal Financial Group Incorporated | | | | | | | | | | | 421 | | | | 23,155 | |
Prudential Financial Incorporated | | | | | | | | | | | 656 | | | | 61,493 | |
The Allstate Corporation | | | | | | | | | | | 529 | | | | 59,486 | |
The Hartford Financial Services Group Incorporated | | | | | | | | | | | 589 | | | | 35,794 | |
The Progressive Corporation | | | | | | | | | | | 958 | | | | 69,350 | |
The Travelers Companies Incorporated | | | | | | | | | | | 423 | | | | 57,930 | |
UnumProvident Corporation | | | | | | | | | | | 336 | | | | 9,798 | |
W.R. Berkley Corporation | | | | | | | | | | | 236 | | | | 16,308 | |
Willis Towers Watson plc | | | | | | | | | | | 210 | | | | 42,407 | |
| | | | |
| | | | | | | | | | | | | | | 1,008,389 | |
| | | | | | | | | | | | | | | | |
| | | | |
Health Care: 8.59% | | | | | | | | | | | | | | | | |
| | | | |
| Biotechnology: 1.21% | | | | | | | | | | | | |
AbbVie Incorporated | | | | | | | | | | | 2,410 | | | | 213,381 | |
Alexion Pharmaceuticals Incorporated † | | | | | | | | | | | 361 | | | | 39,042 | |
Amgen Incorporated | | | | | | | | | | | 969 | | | | 233,597 | |
Biogen Incorporated † | | | | | | | | | | | 294 | | | | 87,239 | |
Gilead Sciences Incorporated | | | | | | | | | | | 2,060 | | | | 133,859 | |
Incyte Corporation † | | | | | | | | | | | 291 | | | | 25,410 | |
Regeneron Pharmaceuticals Incorporated † | | | | | | | | | | | 130 | | | | 48,812 | |
Vertex Pharmaceuticals Incorporated † | | | | | | | | | | | 421 | | | | 92,178 | |
| | | | |
| | | | | | | | | | | | | | | 873,518 | |
| | | | | | | | | | | | | | | | |
| | | | |
| Health Care Equipment & Supplies: 2.16% | | | | | | | | | | | | |
Abbott Laboratories | | | | | | | | | | | 2,883 | | | | 250,417 | |
ABIOMED Incorporated † | | | | | | | | | | | 73 | | | | 12,453 | |
Align Technology Incorporated † | | | | | | | | | | | 116 | | | | 32,369 | |
Baxter International Incorporated | | | | | | | | | | | 833 | | | | 69,655 | |
Becton Dickinson & Company | | | | | | | | | | | 441 | | | | 119,939 | |
Boston Scientific Corporation † | | | | | | | | | | | 2,272 | | | | 102,740 | |
Danaher Corporation | | | | | | | | | | | 1,046 | | | | 160,540 | |
Dentsply Sirona Incorporated | | | | | | | | | | | 363 | | | | 20,542 | |
Edwards Lifesciences Corporation † | | | | | | | | | | | 341 | | | | 79,552 | |
Hologic Incorporated † | | | | | | | | | | | 437 | | | | 22,816 | |
The accompanying notes are an integral part of these financial statements.
16 | Wells Fargo VT Index Asset Allocation Fund
Portfolio of investments—December 31, 2019
| | | | | | | | | | | | | | | | |
| | | | | | | | | Shares | | | Value | |
| | | | |
| Health Care Equipment & Supplies (continued) | | | | | | | | | | | | |
IDEXX Laboratories Incorporated † | | | | | | | | | | | 140 | | | $ | 36,558 | |
Intuitive Surgical Incorporated † | | | | | | | | | | | 188 | | | | 111,136 | |
Medtronic plc | | | | | | | | | | | 2,189 | | | | 248,342 | |
ResMed Incorporated | | | | | | | | | | | 234 | | | | 36,263 | |
Steris plc | | | | | | | | | | | 138 | | | | 21,034 | |
Stryker Corporation | | | | | | | | | | | 525 | | | | 110,219 | |
Teleflex Incorporated | | | | | | | | | | | 75 | | | | 28,233 | |
The Cooper Companies Incorporated | | | | | | | | | | | 80 | | | | 25,703 | |
Varian Medical Systems Incorporated † | | | | | | | | | | | 148 | | | | 21,017 | |
Zimmer Biomet Holdings Incorporated | | | | | | | | | | | 336 | | | | 50,292 | |
| | | | |
| | | | | | | | | | | | | | | 1,559,820 | |
| | | | | | | | | | | | | | | | |
| | | | |
| Health Care Providers & Services: 1.74% | | | | | | | | | | | | |
AmerisourceBergen Corporation | | | | | | | | | | | 244 | | | | 20,745 | |
Anthem Incorporated | | | | | | | | | | | 413 | | | | 124,738 | |
Cardinal Health Incorporated | | | | | | | | | | | 477 | | | | 24,127 | |
Centene Corporation † | | | | | | | | | | | 674 | | | | 42,374 | |
Cigna Corporation | | | | | | | | | | | 609 | | | | 124,534 | |
CVS Health Corporation | | | | | | | | | | | 2,118 | | | | 157,346 | |
DaVita HealthCare Partners Incorporated † | | | | | | | | | | | 146 | | | | 10,954 | |
HCA Healthcare Incorporated | | | | | | | | | | | 431 | | | | 63,706 | |
Henry Schein Incorporated | | | | | | | | | | | 239 | | | | 15,946 | |
Humana Incorporated | | | | | | | | | | | 216 | | | | 79,168 | |
Laboratory Corporation of America Holdings † | | | | | | | | | | | 158 | | | | 26,729 | |
McKesson Corporation | | | | | | | | | | | 293 | | | | 40,528 | |
Quest Diagnostics Incorporated | | | | | | | | | | | 219 | | | | 23,387 | |
UnitedHealth Group Incorporated | | | | | | | | | | | 1,545 | | | | 454,199 | |
Universal Health Services Incorporated Class B | | | | | | | | | | | 131 | | | | 18,793 | |
WellCare Health Plans Incorporated † | | | | | | | | | | | 81 | | | | 26,747 | |
| | | | |
| | | | | | | | | | | | | | | 1,254,021 | |
| | | | | | | | | | | | | | | | |
| | | | |
| Health Care Technology: 0.05% | | | | | | | | | | | | |
Cerner Corporation | | | | | | | | | | | 512 | | | | 37,576 | |
| | | | | | | | | | | | | | | | |
| | | | |
| Life Sciences Tools & Services: 0.63% | | | | | | | | | | | | |
Agilent Technologies Incorporated | | | | | | | | | | | 506 | | | | 43,167 | |
Illumina Incorporated † | | | | | | | | | | | 239 | | | | 79,286 | |
IQVIA Holdings Incorporated † | | | | | | | | | | | 295 | | | | 45,580 | |
Mettler-Toledo International Incorporated † | | | | | | | | | | | 39 | | | | 30,938 | |
PerkinElmer Incorporated | | | | | | | | | | | 181 | | | | 17,575 | |
Thermo Fisher Scientific Incorporated | | | | | | | | | | | 656 | | | | 213,115 | |
Waters Corporation † | | | | | | | | | | | 104 | | | | 24,300 | |
| | | | |
| | | | | | | | | | | | | | | 453,961 | |
| | | | | | | | | | | | | | | | |
| | | | |
| Pharmaceuticals: 2.80% | | | | | | | | | | | | |
Allergan plc | | | | | | | | | | | 535 | | | | 102,276 | |
Bristol-Myers Squibb Company | | | | | | | | | | | 3,817 | | | | 245,013 | |
Eli Lilly & Company | | | | | | | | | | | 1,381 | | | | 181,505 | |
Johnson & Johnson | | | | | | | | | | | 4,300 | | | | 627,241 | |
Merck & Company Incorporated | | | | | | | | | | | 4,160 | | | | 378,352 | |
Mylan NV † | | | | | | | | | | | 836 | | | | 16,804 | |
Perrigo Company plc | | | | | | | | | | | 221 | | | | 11,417 | |
Pfizer Incorporated | | | | | | | | | | | 9,017 | | | | 353,286 | |
Zoetis Incorporated | | | | | | | | | | | 778 | | | | 102,968 | |
| | | | |
| | | | | | | | | | | | | | | 2,018,862 | |
| | | | | | | | | | | | | | | | |
The accompanying notes are an integral part of these financial statements.
Wells Fargo VT Index Asset Allocation Fund | 17
Portfolio of investments—December 31, 2019
| | | | | | | | | | | | | | | | |
| | | | | | | | | Shares | | | Value | |
| Industrials: 5.47% | | | | | | | �� | | | | | |
| | | | |
| Aerospace & Defense: 1.47% | | | | | | | | | | | | |
Arconic Incorporated | | | | | | | | | | | 632 | | | $ | 19,447 | |
General Dynamics Corporation | | | | | | | | | | | 381 | | | | 67,189 | |
Huntington Ingalls Industries Incorporated | | | | | | | | | | | 66 | | | | 16,558 | |
L3Harris Technologies | | | | | | | | | | | 362 | | | | 71,629 | |
Lockheed Martin Corporation | | | | | | | | | | | 405 | | | | 157,699 | |
Northrop Grumman Corporation | | | | | | | | | | | 255 | | | | 87,712 | |
Raytheon Company | | | | | | | | | | | 454 | | | | 99,762 | |
Textron Incorporated | | | | | | | | | | | 372 | | | | 16,591 | |
The Boeing Company | | | | | | | | | | | 872 | | | | 284,063 | |
TransDigm Group Incorporated | | | | | | | | | | | 81 | | | | 45,360 | |
United Technologies Corporation | | | | | | | | | | | 1,323 | | | | 198,132 | |
| | | | |
| | | | | | | | | | | | | | | 1,064,142 | |
| | | | | | | | | | | | | | | | |
| | | | |
| Air Freight & Logistics: 0.32% | | | | | | | | | | | | |
C.H. Robinson Worldwide Incorporated | | | | | | | | | | | 220 | | | | 17,204 | |
Expeditors International of Washington Incorporated | | | | | | | | | | | 278 | | | | 21,690 | |
FedEx Corporation | | | | | | | | | | | 390 | | | | 58,972 | |
United Parcel Service Incorporated Class B | | | | | | | | | | | 1,139 | | | | 133,331 | |
| | | | |
| | | | | | | | | | | | | | | 231,197 | |
| | | | | | | | | | | | | | | | |
| | | | |
| Airlines: 0.22% | | | | | | | | | | | | |
Alaska Air Group Incorporated | | | | | | | | | | | 201 | | | | 13,618 | |
American Airlines Group Incorporated | | | | | | | | | | | 637 | | | | 18,269 | |
Delta Air Lines Incorporated | | | | | | | | | | | 941 | | | | 55,030 | |
Southwest Airlines Company | | | | | | | | | | | 773 | | | | 41,727 | |
United Airlines Holdings Incorporated † | | | | | | | | | | | 355 | | | | 31,272 | |
| | | | |
| | | | | | | | | | | | | | | 159,916 | |
| | | | | | | | | | | | | | | | |
| | | | |
| Building Products: 0.16% | | | | | | | | | | | | |
A.O. Smith Corporation | | | | | | | | | | | 223 | | | | 10,624 | |
Allegion plc | | | | | | | | | | | 151 | | | | 18,806 | |
Fortune Brands Home & Security Incorporated | | | | | | | | | | | 226 | | | | 14,767 | |
Johnson Controls International plc | | | | | | | | | | | 1,257 | | | | 51,172 | |
Masco Corporation | | | | | | | | | | | 464 | | | | 22,267 | |
| | | | |
| | | | | | | | | | | | | | | 117,636 | |
| | | | | | | | | | | | | | | | |
| | | | |
| Commercial Services & Supplies: 0.25% | | | | | | | | | | | | |
Cintas Corporation | | | | | | | | | | | 137 | | | | 36,864 | |
Copart Incorporated † | | | | | | | | | | | 335 | | | | 30,465 | |
Republic Services Incorporated | | | | | | | | | | | 344 | | | | 30,833 | |
Rollins Incorporated | | | | | | | | | | | 229 | | | | 7,594 | |
Waste Management Incorporated | | | | | | | | | | | 639 | | | | 72,820 | |
| | | | |
| | | | | | | | | | | | | | | 178,576 | |
| | | | | | | | | | | | | | | | |
| | | | |
| Construction & Engineering: 0.04% | | | | | | | | | | | | |
Jacobs Engineering Group Incorporated | | | | | | | | | | | 220 | | | | 19,763 | |
Quanta Services Incorporated | | | | | | | | | | | 232 | | | | 9,445 | |
| | | | |
| | | | | | | | | | | | | | | 29,208 | |
| | | | | | | | | | | | | | | | |
| | | | |
| Electrical Equipment: 0.30% | | | | | | | | | | | | |
AMETEK Incorporated | | | | | | | | | | | 374 | | | | 37,303 | |
Eaton Corporation plc | | | | | | | | | | | 675 | | | | 63,936 | |
The accompanying notes are an integral part of these financial statements.
18 | Wells Fargo VT Index Asset Allocation Fund
Portfolio of investments—December 31, 2019
| | | | | | | | | | | | | | | | |
| | | | | | | | | Shares | | | Value | |
| | | | |
| Electrical Equipment (continued) | | | | | | | | | | | | |
Emerson Electric Company | | | | | | | | | | | 994 | | | $ | 75,802 | |
Rockwell Automation Incorporated | | | | | | | | | | | 188 | | | | 38,102 | |
| | | | |
| | | | | | | | | | | | | | | 215,143 | |
| | | | | | | | | | | | | | | | |
| | | | |
| Industrial Conglomerates: 0.82% | | | | | | | | | | | | |
3M Company | | | | | | | | | | | 936 | | | | 165,129 | |
General Electric Company | | | | | | | | | | | 14,284 | | | | 159,409 | |
Honeywell International Incorporated | | | | | | | | | | | 1,167 | | | | 206,559 | |
Roper Technologies Incorporated | | | | | | | | | | | 170 | | | | 60,219 | |
| | | | |
| | | | | | | | | | | | | | | 591,316 | |
| | | | | | | | | | | | | | | | |
| | | | |
| Machinery: 0.97% | | | | | | | | | | | | |
Caterpillar Incorporated | | | | | | | | | | | 902 | | | | 133,207 | |
Cummins Incorporated | | | | | | | | | | | 249 | | | | 44,561 | |
Deere & Company | | | | | | | | | | | 513 | | | | 88,882 | |
Dover Corporation | | | | | | | | | | | 236 | | | | 27,201 | |
Flowserve Corporation | | | | | | | | | | | 212 | | | | 10,551 | |
Fortive Corporation | | | | | | | | | | | 483 | | | | 36,896 | |
IDEX Corporation | | | | | | | | | | | 124 | | | | 21,328 | |
Illinois Tool Works Incorporated | | | | | | | | | | | 478 | | | | 85,863 | |
Ingersoll-Rand plc | | | | | | | | | | | 390 | | | | 51,839 | |
PACCAR Incorporated | | | | | | | | | | | 564 | | | | 44,612 | |
Parker-Hannifin Corporation | | | | | | | | | | | 210 | | | | 43,222 | |
Pentair plc | | | | | | | | | | | 274 | | | | 12,568 | |
Snap-on Incorporated | | | | | | | | | | | 89 | | | | 15,077 | |
Stanley Black & Decker Incorporated | | | | | | | | | | | 248 | | | | 41,104 | |
Wabtec Corporation | | | | | | | | | | | 296 | | | | 23,029 | |
Xylem Incorporated | | | | | | | | | | | 293 | | | | 23,085 | |
| | | | |
| | | | | | | | | | | | | | | 703,025 | |
| | | | | | | | | | | | | | | | |
| | | | |
| Professional Services: 0.20% | | | | | | | | | | | | |
Equifax Incorporated | | | | | | | | | | | 198 | | | | 27,744 | |
IHS Markit Limited † | | | | | | | | | | | 655 | | | | 49,354 | |
Nielsen Holdings plc | | | | | | | | | | | 579 | | | | 11,754 | |
Robert Half International Incorporated | | | | | | | | | | | 192 | | | | 12,125 | |
Verisk Analytics Incorporated | | | | | | | | | | | 267 | | | | 39,874 | |
| | | | |
| | | | | | | | | | | | | | | 140,851 | |
| | | | | | | | | | | | | | | | |
| | | | |
| Road & Rail: 0.61% | | | | | | | | | | | | |
CSX Corporation | | | | | | | | | | | 1,269 | | | | 91,825 | |
J.B. Hunt Transport Services Incorporated | | | | | | | | | | | 139 | | | | 16,232 | |
Kansas City Southern | | | | | | | | | | | 161 | | | | 24,659 | |
Norfolk Southern Corporation | | | | | | | | | | | 427 | | | | 82,894 | |
Old Dominion Freight Line Incorporated | | | | | | | | | | | 104 | | | | 19,737 | |
Union Pacific Corporation | | | | | | | | | | | 1,133 | | | | 204,835 | |
| | | | |
| | | | | | | | | | | | | | | 440,182 | |
| | | | | | | | | | | | | | | | |
| | | | |
| Trading Companies & Distributors: 0.11% | | | | | | | | | | | | |
Fastenal Company | | | | | | | | | | | 937 | | | | 34,622 | |
United Rentals Incorporated † | | | | | | | | | | | 122 | | | | 20,346 | |
W.W. Grainger Incorporated | | | | | | | | | | | 70 | | | | 23,696 | |
| | | | |
| | | | | | | | | | | | | | | 78,664 | |
| | | | | | | | | | | | | | | | |
The accompanying notes are an integral part of these financial statements.
Wells Fargo VT Index Asset Allocation Fund | 19
Portfolio of investments—December 31, 2019
| | | | | | | | | | | | | | | | |
| | | | | | | | | Shares | | | Value | |
Information Technology: 14.06% | | | | | | | | | | | | | | | | |
|
| Communications Equipment: 0.59% | |
Arista Networks Incorporated † | | | | | | | | | | | 88 | | | $ | 17,899 | |
Cisco Systems Incorporated | | | | | | | | | | | 6,941 | | | | 332,890 | |
F5 Networks Incorporated † | | | | | | | | | | | 99 | | | | 13,825 | |
Juniper Networks Incorporated | | | | | | | | | | | 546 | | | | 13,448 | |
Motorola Solutions Incorporated | | | | | | | | | | | 280 | | | | 45,119 | |
| | | | |
| | | | | | | | | | | | | | | 423,181 | |
| | | | | | | | | | | | | | | | |
| | | | |
| Electronic Equipment, Instruments & Components: 0.34% | | | | | | | | | | | | |
Amphenol Corporation Class A | | | | | | | | | | | 485 | | | | 52,492 | |
CDW Corporation of Delaware | | | | | | | | | | | 234 | | | | 33,425 | |
Corning Incorporated | | | | | | | | | | | 1,259 | | | | 36,649 | |
FLIR Systems Incorporated | | | | | | | | | | | 218 | | | | 11,351 | |
IPG Photonics Corporation † | | | | | | | | | | | 57 | | | | 8,260 | |
Keysight Technologies Incorporated † | | | | | | | | | | | 307 | | | | 31,507 | |
TE Connectivity Limited | | | | | | | | | | | 547 | | | | 52,424 | |
Zebra Technologies Corporation Class A † | | | | | | | | | | | 87 | | | | 22,223 | |
| | | | |
| | | | | | | | | | | | | | | 248,331 | |
| | | | | | | | | | | | | | | | |
| | | | |
| IT Services: 3.27% | | | | | | | | | | | | |
Accenture plc Class A | | | | | | | | | | | 1,037 | | | | 218,361 | |
Akamai Technologies Incorporated † | | | | | | | | | | | 264 | | | | 22,804 | |
Alliance Data Systems Corporation | | | | | | | | | | | 66 | | | | 7,405 | |
Automatic Data Processing Incorporated | | | | | | | | | | | 707 | | | | 120,544 | |
Broadridge Financial Solutions Incorporated | | | | | | | | | | | 187 | | | | 23,102 | |
Cognizant Technology Solutions Corporation Class A | | | | | | | | | | | 894 | | | | 55,446 | |
DXC Technology Company | | | | | | | | | | | 417 | | | | 15,675 | |
Fidelity National Information Services Incorporated | | | | | | | | | | | 1,004 | | | | 139,646 | |
Fiserv Incorporated † | | | | | | | | | | | 933 | | | | 107,883 | |
FleetCor Technologies Incorporated † | | | | | | | | | | | 141 | | | | 40,569 | |
Gartner Incorporated † | | | | | | | | | | | 146 | | | | 22,499 | |
Global Payments Incorporated | | | | | | | | | | | 491 | | | | 89,637 | |
International Business Machines Corporation | | | | | | | | | | | 1,443 | | | | 193,420 | |
Jack Henry & Associates Incorporated | | | | | | | | | | | 125 | | | | 18,209 | |
Leidos Holdings Incorporated | | | | | | | | | | | 217 | | | | 21,242 | |
MasterCard Incorporated Class A | | | | | | | | | | | 1,453 | | | | 433,851 | |
Paychex Incorporated | | | | | | | | | | | 522 | | | | 44,401 | |
PayPal Holdings Incorporated † | | | | | | | | | | | 1,915 | | | | 207,146 | |
The Western Union Company | | | | | | | | | | | 681 | | | | 18,237 | |
VeriSign Incorporated † | | | | | | | | | | | 169 | | | | 32,563 | |
Visa Incorporated Class A | | | | | | | | | | | 2,797 | | | | 525,556 | |
| | | | |
| | | | | | | | | | | | | | | 2,358,196 | |
| | | | | | | | | | | | | | | | |
| | | | |
| Semiconductors & Semiconductor Equipment: 2.56% | | | | | | | | | | | | |
Advanced Micro Devices Incorporated † | | | | | | | | | | | 1,827 | | | | 83,786 | |
Analog Devices Incorporated | | | | | | | | | | | 602 | | | | 71,542 | |
Applied Materials Incorporated | | | | | | | | | | | 1,512 | | | | 92,292 | |
Broadcom Incorporated | | | | | | | | | | | 647 | | | | 204,465 | |
Intel Corporation | | | | | | | | | | | 7,104 | | | | 425,174 | |
KLA-Tencor Corporation | | | | | | | | | | | 258 | | | | 45,968 | |
Lam Research Corporation | | | | | | | | | | | 237 | | | | 69,299 | |
Maxim Integrated Products Incorporated | | | | | | | | | | | 443 | | | | 27,249 | |
Microchip Technology Incorporated | | | | | | | | | | | 391 | | | | 40,946 | |
Micron Technology Incorporated † | | | | | | | | | | | 1,811 | | | | 97,396 | |
NVIDIA Corporation | | | | | | | | | | | 998 | | | | 234,829 | |
The accompanying notes are an integral part of these financial statements.
20 | Wells Fargo VT Index Asset Allocation Fund
Portfolio of investments—December 31, 2019
| | | | | | | | | | | | | | | | |
| | | | | | | | | Shares | | | Value | |
| | | | |
| Semiconductors & Semiconductor Equipment (continued) | | | | | | | | | | | | |
Qorvo Incorporated † | | | | | | | | | | | 190 | | | $ | 22,084 | |
QUALCOMM Incorporated | | | | | | | | | | | 1,874 | | | | 165,343 | |
Skyworks Solutions Incorporated | | | | | | | | | | | 278 | | | | 33,605 | |
Texas Instruments Incorporated | | | | | | | | | | | 1,529 | | | | 196,155 | |
Xilinx Incorporated | | | | | | | | | | | 412 | | | | 40,281 | |
| | | | |
| | | | | | | | | | | | | | | 1,850,414 | |
| | | | | | | | | | | | | | | | |
| | | | |
| Software: 4.27% | | | | | | | | | | | | |
Adobe Systems Incorporated † | | | | | | | | | | | 792 | | | | 261,210 | |
ANSYS Incorporated † | | | | | | | | | | | 139 | | | | 35,780 | |
Autodesk Incorporated † | | | | | | | | | | | 359 | | | | 65,862 | |
Cadence Design Systems Incorporated † | | | | | | | | | | | 459 | | | | 31,836 | |
Citrix Systems Incorporated | | | | | | | | | | | 200 | | | | 22,180 | |
Fortinet Incorporated † | | | | | | | | | | | 232 | | | | 24,768 | |
Intuit Incorporated | | | | | | | | | | | 423 | | | | 110,796 | |
Microsoft Corporation | | | | | | | | | | | 12,463 | | | | 1,965,415 | |
NortonLifeLock Incorporated | | | | | | | | | | | 936 | | | | 23,887 | |
Oracle Corporation | | | | | | | | | | | 3,530 | | | | 187,019 | |
Salesforce.com Incorporated † | | | | | | | | | | | 1,445 | | | | 235,015 | |
ServiceNow Incorporated † | | | | | | | | | | | 308 | | | | 86,955 | |
Synopsys Incorporated † | | | | | | | | | | | 245 | | | | 34,104 | |
| | | | |
| | | | | | | | | | | | | | | 3,084,827 | |
| | | | | | | | | | | | | | | | |
| | | | |
| Technology Hardware, Storage & Peripherals: 3.03% | | | | | | | | | | | | |
Apple Incorporated | | | | | | | | | | | 6,864 | | | | 2,015,616 | |
Hewlett Packard Enterprise Company | | | | | | | | | | | 2,107 | | | | 33,417 | |
HP Incorporated | | | | | | | | | | | 2,418 | | | | 49,690 | |
NetApp Incorporated | | | | | | | | | | | 372 | | | | 23,157 | |
Seagate Technology plc | | | | | | | | | | | 377 | | | | 22,432 | |
Western Digital Corporation | | | | | | | | | | | 490 | | | | 31,100 | |
Xerox Holdings Corporation | | | | | | | | | | | 303 | | | | 11,172 | |
| | | | |
| | | | | | | | | | | | | | | 2,186,584 | |
| | | | | | | | | | | | | | | | |
| | | | |
Materials: 1.60% | | | | | | | | | | | | | | | | |
| | | | |
| Chemicals: 1.14% | | | | | | | | | | | | |
Air Products & Chemicals Incorporated | | | | | | | | | | | 360 | | | | 84,596 | |
Albemarle Corporation | | | | | | | | | | | 173 | | | | 12,636 | |
Celanese Corporation Series A | | | | | | | | | | | 197 | | | | 24,255 | |
CF Industries Holdings Incorporated | | | | | | | | | | | 355 | | | | 16,948 | |
Corteva Incorporated | | | | | | | | | | | 1,220 | | | | 36,063 | |
Dow Incorporated | | | | | | | | | | | 1,208 | | | | 66,114 | |
DuPont de Nemours Incorporated | | | | | | | | | | | 1,198 | | | | 76,912 | |
Eastman Chemical Company | | | | | | | | | | | 221 | | | | 17,516 | |
Ecolab Incorporated | | | | | | | | | | | 411 | | | | 79,319 | |
FMC Corporation | | | | | | | | | | | 211 | | | | 21,062 | |
International Flavors & Fragrances Incorporated | | | | | | | | | | | 174 | | | | 22,449 | |
Linde plc | | | | | | | | | | | 877 | | | | 186,713 | |
LyondellBasell Industries NV Class A | | | | | | | | | | | 419 | | | | 39,587 | |
PPG Industries Incorporated | | | | | | | | | | | 385 | | | | 51,394 | |
The Mosaic Company | | | | | | | | | | | 569 | | | | 12,313 | |
The Sherwin-Williams Company | | | | | | | | | | | 134 | | | | 78,194 | |
| | | | |
| | | | | | | | | | | | | | | 826,071 | |
| | | | | | | | | | | | | | | | |
The accompanying notes are an integral part of these financial statements.
Wells Fargo VT Index Asset Allocation Fund | 21
Portfolio of investments—December 31, 2019
| | | | | | | | | | | | | | | | |
| | | | | | | | | Shares | | | Value | |
| Construction Materials: 0.08% | | | | | | | | | | | | |
Martin Marietta Materials Incorporated | | | | | | | | | | | 101 | | | $ | 28,244 | |
Vulcan Materials Company | | | | | | | | | | | 215 | | | | 30,958 | |
| | | | |
| | | | | | | | | | | | | | | 59,202 | |
| | | | | | | | | | | | | | | | |
| | | | |
| Containers & Packaging: 0.22% | | | | | | | | | | | | |
Amcor plc | | | | | | | | | | | 2,648 | | | | 28,704 | |
Avery Dennison Corporation | | | | | | | | | | | 136 | | | | 17,792 | |
Ball Corporation | | | | | | | | | | | 533 | | | | 34,469 | |
International Paper Company | | | | | | | | | | | 642 | | | | 29,564 | |
Packaging Corporation of America | | | | | | | | | | | 154 | | | | 17,246 | |
Sealed Air Corporation | | | | | | | | | | | 251 | | | | 9,997 | |
WestRock Company | | | | | | | | | | | 421 | | | | 18,065 | |
| | | | |
| | | | | | | | | | | | | | | 155,837 | |
| | | | | | | | | | | | | | | | |
| | | | |
| Metals & Mining: 0.16% | | | | | | | | | | | | |
Freeport-McMoRan Incorporated | | | | | | | | | | | 2,367 | | | | 31,055 | |
Newmont Goldcorp Corporation | | | | | | | | | | | 1,345 | | | | 58,440 | |
Nucor Corporation | | | | | | | | | | | 495 | | | | 27,859 | |
| | | | |
| | | | | | | | | | | | | | | 117,354 | |
| | | | | | | | | | | | | | | | |
| | | | |
Real Estate: 1.77% | | | | | | | | | | | | | | | | |
| | | | |
| Equity REITs: 1.73% | | | | | | | | | | | | |
Alexandria Real Estate Equities Incorporated | | | | | | | | | | | 188 | | | | 30,377 | |
American Tower Corporation | | | | | | | | | | | 726 | | | | 166,849 | |
Apartment Investment & Management Company Class A | | | | | | | | | | | 243 | | | | 12,551 | |
AvalonBay Communities Incorporated | | | | | | | | | | | 227 | | | | 47,602 | |
Boston Properties Incorporated | | | | | | | | | | | 234 | | | | 32,259 | |
Crown Castle International Corporation | | | | | | | | | | | 682 | | | | 96,946 | |
Digital Realty Trust Incorporated | | | | | | | | | | | 342 | | | | 40,951 | |
Duke Realty Corporation | | | | | | | | | | | 602 | | | | 20,871 | |
Equinix Incorporated | | | | | | | | | | | 139 | | | | 81,134 | |
Equity Residential | | | | | | | | | | | 570 | | | | 46,124 | |
Essex Property Trust Incorporated | | | | | | | | | | | 107 | | | | 32,192 | |
Extra Space Storage Incorporated | | | | | | | | | | | 212 | | | | 22,391 | |
Federal Realty Investment Trust | | | | | | | | | | | 114 | | | | 14,675 | |
Healthpeak Properties Incorpoarated | | | | | | | | | | | 810 | | | | 27,921 | |
Host Hotels & Resorts Incorporated | | | | | | | | | | | 1,171 | | | | 21,722 | |
Iron Mountain Incorporated | | | | | | | | | | | 470 | | | | 14,979 | |
Kimco Realty Corporation | | | | | | | | | | | 692 | | | | 14,331 | |
Mid-America Apartment Communities Incorporated | | | | | | | | | | | 187 | | | | 24,658 | |
Prologis Incorporated | | | | | | | | | | | 1,034 | | | | 92,171 | |
Public Storage Incorporated | | | | | | | | | | | 245 | | | | 52,175 | |
Realty Income Corporation | | | | | | | | | | | 532 | | | | 39,171 | |
Regency Centers Corporation | | | | | | | | | | | 273 | | | | 17,224 | |
SBA Communications Corporation | | | | | | | | | | | 184 | | | | 44,342 | |
Simon Property Group Incorporated | | | | | | | | | | | 502 | | | | 74,778 | |
SL Green Realty Corporation | | | | | | | | | | | 133 | | | | 12,220 | |
UDR Incorporated | | | | | | | | | | | 480 | | | | 22,416 | |
Ventas Incorporated | | | | | | | | | | | 611 | | | | 35,279 | |
Vornado Realty Trust | | | | | | | | | | | 258 | | | | 17,157 | |
Welltower Incorporated | | | | | | | | | | | 663 | | | | 54,220 | |
Weyerhaeuser Company | | | | | | | | | | | 1,219 | | | | 36,814 | |
| | | | |
| | | | | | | | | | | | | | | 1,246,500 | |
| | | | | | | | | | | | | | | | |
The accompanying notes are an integral part of these financial statements.
22 | Wells Fargo VT Index Asset Allocation Fund
Portfolio of investments—December 31, 2019
| | | | | | | | | | | | | | | | |
| | | | | | | | | Shares | | | Value | |
| Real Estate Management & Development: 0.04% | | | | | | | | | | | | |
CBRE Group Incorporated Class A † | | | | | | | | | | | 547 | | | $ | 33,526 | |
| | | | | | | | | | | | | | | | |
| | | | |
Utilities: 2.02% | | | | | | | | | | | | | | | | |
| | | | |
| Electric Utilities: 1.24% | | | | | | | | | | | | |
Alliant Energy Corporation | | | | | | | | | | | 394 | | | | 21,560 | |
American Electric Power Company Incorporated | | | | | | | | | | | 807 | | | | 76,270 | |
Duke Energy Corporation | | | | | | | | | | | 1,192 | | | | 108,722 | |
Edison International | | | | | | | | | | | 588 | | | | 44,341 | |
Entergy Corporation | | | | | | | | | | | 326 | | | | 39,055 | |
Evergy Incorporated | | | | | | | | | | | 373 | | | | 24,279 | |
Eversource Energy | | | | | | | | | | | 531 | | | | 45,172 | |
Exelon Corporation | | | | | | | | | | | 1,588 | | | | 72,397 | |
FirstEnergy Corporation | | | | | | | | | | | 885 | | | | 43,011 | |
NextEra Energy Incorporated | | | | | | | | | | | 800 | | | | 193,728 | |
Pinnacle West Capital Corporation | | | | | | | | | | | 184 | | | | 16,547 | |
PPL Corporation | | | | | | | | | | | 1,184 | | | | 42,482 | |
The Southern Company | | | | | | | | | | | 1,718 | | | | 109,437 | |
Xcel Energy Incorporated | | | | | | | | | | | 860 | | | | 54,601 | |
| | | | |
| | | | | | | | | | | | | | | 891,602 | |
| | | | | | | | | | | | | | | | |
| | | | |
| Gas Utilities: 0.03% | | | | | | | | | | | | |
Atmos Energy Corporation | | | | | | | | | | | 195 | | | | 21,813 | |
| | | | | | | | | | | | | | | | |
| | | | |
| Independent Power & Renewable Electricity Producers: 0.05% | | | | | | | | | | | | |
AES Corporation | | | | | | | | | | | 1,087 | | | | 21,631 | |
NRG Energy Incorporated | | | | | | | | | | | 412 | | | | 16,377 | |
| | | | |
| | | | | | | | | | | | | | | 38,008 | |
| | | | | | | | | | | | | | | | |
| | | | |
| Multi-Utilities: 0.65% | | | | | | | | | | | | |
Ameren Corporation | | | | | | | | | | | 403 | | | | 30,950 | |
CenterPoint Energy Incorporated | | | | | | | | | | | 823 | | | | 22,443 | |
CMS Energy Corporation | | | | | | | | | | | 465 | | | | 29,221 | |
Consolidated Edison Incorporated | | | | | | | | | | | 543 | | | | 49,125 | |
Dominion Energy Incorporated | | | | | | | | | | | 1,347 | | | | 111,559 | |
DTE Energy Company | | | | | | | | | | | 314 | | | | 40,779 | |
NiSource Incorporated | | | | | | | | | | | 612 | | | | 17,038 | |
Public Service Enterprise Group Incorporated | | | | | | | | | | | 828 | | | | 48,893 | |
Sempra Energy | | | | | | | | | | | 461 | | | | 69,832 | |
WEC Energy Group Incorporated | | | | | | | | | | | 515 | | | | 47,498 | |
| | | | |
| | | | | | | | | | | | | | | 467,338 | |
| | | | | | | | | | | | | | | | |
| | | | |
| Water Utilities: 0.05% | | | | | | | | | | | | |
American Water Works Company Incorporated | | | | | | | | | | | 295 | | | | 36,241 | |
| | | | | | | | | | | | | | | | |
| |
Total Common Stocks (Cost $20,762,145) | | | | 43,670,800 | |
| | | | | | | | | | | | | | | | |
| | | | |
| | | | | | | | | | | | | | | | |
| | | Interest
rate | | | Maturity
date | | | Principal | | | | |
| U.S. Treasury Securities: 38.66% | | | | | | | | | | | | |
U.S. Treasury Bond | | | 2.13 | % | | | 9-30-2024 | | | $ | 118,000 | | | | 120,247 | |
U.S. Treasury Bond | | | 2.13 | | | | 11-30-2024 | | | | 119,000 | | | | 121,314 | |
U.S. Treasury Bond | | | 2.25 | | | | 8-15-2046 | | | | 165,000 | | | | 160,148 | |
U.S. Treasury Bond | | | 2.25 | | | | 8-15-2049 | | | | 108,000 | | | | 104,642 | |
U.S. Treasury Bond | | | 2.50 | | | | 2-15-2045 | | | | 182,000 | | | | 185,467 | |
U.S. Treasury Bond | | | 2.50 | | | | 2-15-2046 | | | | 164,000 | | | | 167,231 | |
U.S. Treasury Bond | | | 2.50 | | | | 5-15-2046 | | | | 163,000 | | | | 166,208 | |
U.S. Treasury Bond | | | 2.75 | | | | 8-15-2042 | | | | 126,000 | | | | 134,399 | |
U.S. Treasury Bond | | | 2.75 | | | | 11-15-2042 | | | | 126,000 | | | | 134,303 | |
The accompanying notes are an integral part of these financial statements.
Wells Fargo VT Index Asset Allocation Fund | 23
Portfolio of investments—December 31, 2019
| | | | | | | | | | | | | | | | |
| | | Interest
rate | | | Maturity
date | | | Principal | | | Value | |
| U.S. Treasury Securities (continued) | | | | | | | | | | | | |
U.S. Treasury Bond | | | 2.75 | % | | | 8-15-2047 | | | $ | 160,000 | | | $ | 171,377 | |
U.S. Treasury Bond | | | 2.75 | | | | 11-15-2047 | | | | 161,000 | | | | 172,445 | |
U.S. Treasury Bond | | | 2.88 | | | | 5-15-2028 | | | | 270,000 | | | | 290,426 | |
U.S. Treasury Bond | | | 2.88 | | | | 5-15-2043 | | | | 182,000 | | | | 198,034 | |
U.S. Treasury Bond | | | 2.88 | | | | 8-15-2045 | | | | 174,000 | | | | 189,975 | |
U.S. Treasury Bond | | | 2.88 | | | | 11-15-2046 | | | | 163,000 | | | | 178,583 | |
U.S. Treasury Bond | | | 2.88 | | | | 5-15-2049 | | | | 158,000 | | | | 173,956 | |
U.S. Treasury Bond | | | 3.00 | | | | 5-15-2042 | | | | 84,000 | | | | 93,335 | |
U.S. Treasury Bond | | | 3.00 | | | | 11-15-2044 | | | | 178,000 | | | | 198,172 | |
U.S. Treasury Bond | | | 3.00 | | | | 5-15-2045 | | | | 183,000 | | | | 204,050 | |
U.S. Treasury Bond | | | 3.00 | | | | 11-15-2045 | | | | 175,000 | | | | 195,538 | |
U.S. Treasury Bond | | | 3.00 | | | | 2-15-2047 | | | | 164,000 | | | | 184,046 | |
U.S. Treasury Bond | | | 3.00 | | | | 5-15-2047 | | | | 162,000 | | | | 181,793 | |
U.S. Treasury Bond | | | 3.00 | | | | 2-15-2048 | | | | 174,000 | | | | 195,378 | |
U.S. Treasury Bond | | | 3.00 | | | | 8-15-2048 | | | | 127,000 | | | | 142,861 | |
U.S. Treasury Bond | | | 3.00 | | | | 2-15-2049 | | | | 169,000 | | | | 190,436 | |
U.S. Treasury Bond | | | 3.13 | | | | 11-15-2041 | | | | 66,000 | | | | 74,772 | |
U.S. Treasury Bond | | | 3.13 | | | | 2-15-2042 | | | | 87,000 | | | | 98,567 | |
U.S. Treasury Bond | | | 3.13 | | | | 2-15-2043 | | | | 129,000 | | | | 146,122 | |
U.S. Treasury Bond | | | 3.13 | | | | 8-15-2044 | | | | 181,000 | | | | 205,643 | |
U.S. Treasury Bond | | | 3.13 | | | | 5-15-2048 | | | | 175,000 | | | | 201,271 | |
U.S. Treasury Bond | | | 3.38 | | | | 5-15-2044 | | | | 187,000 | | | | 221,030 | |
U.S. Treasury Bond | | | 3.38 | | | | 11-15-2048 | | | | 183,000 | | | | 220,563 | |
U.S. Treasury Bond | | | 3.50 | | | | 2-15-2039 | | | | 61,000 | | | | 73,019 | |
U.S. Treasury Bond | | | 3.63 | | | | 8-15-2043 | | | | 156,000 | | | | 191,079 | |
U.S. Treasury Bond | | | 3.63 | | | | 2-15-2044 | | | | 218,000 | | | | 267,577 | |
U.S. Treasury Bond | | | 3.75 | | | | 8-15-2041 | | | | 68,000 | | | | 84,320 | |
U.S. Treasury Bond | | | 3.75 | | | | 11-15-2043 | | | | 187,000 | | | | 233,571 | |
U.S. Treasury Bond | | | 3.88 | | | | 8-15-2040 | | | | 71,000 | | | | 89,382 | |
U.S. Treasury Bond | | | 4.25 | | | | 5-15-2039 | | | | 57,000 | | | | 74,927 | |
U.S. Treasury Bond | | | 4.25 | | | | 11-15-2040 | | | | 74,000 | | | | 97,818 | |
U.S. Treasury Bond | | | 4.38 | | | | 2-15-2038 | | | | 32,000 | | | | 42,518 | |
U.S. Treasury Bond | | | 4.38 | | | | 11-15-2039 | | | | 57,000 | | | | 76,196 | |
U.S. Treasury Bond | | | 4.38 | | | | 5-15-2040 | | | | 83,000 | | | | 111,314 | |
U.S. Treasury Bond | | | 4.38 | | | | 5-15-2041 | | | | 65,000 | | | | 87,519 | |
U.S. Treasury Bond | | | 4.50 | | | | 2-15-2036 | | | | 70,000 | | | | 92,722 | |
U.S. Treasury Bond | | | 4.50 | | | | 5-15-2038 | | | | 36,000 | | | | 48,590 | |
U.S. Treasury Bond | | | 4.50 | | | | 8-15-2039 | | | | 59,000 | | | | 79,980 | |
U.S. Treasury Bond | | | 4.63 | | | | 2-15-2040 | | | | 102,000 | | | | 140,860 | |
U.S. Treasury Bond | | | 4.75 | | | | 2-15-2037 | | | | 24,000 | | | | 32,989 | |
U.S. Treasury Bond | | | 4.75 | | | | 2-15-2041 | | | | 88,000 | | | | 123,993 | |
U.S. Treasury Bond | | | 5.00 | | | | 5-15-2037 | | | | 29,000 | | | | 41,005 | |
U.S. Treasury Bond | | | 5.25 | | | | 11-15-2028 | | | | 45,000 | | | | 57,256 | |
U.S. Treasury Bond | | | 5.25 | | | | 2-15-2029 | | | | 33,000 | | | | 42,172 | |
U.S. Treasury Bond | | | 5.38 | | | | 2-15-2031 | | | | 70,000 | | | | 93,873 | |
U.S. Treasury Bond | | | 5.50 | | | | 8-15-2028 | | | | 35,000 | | | | 45,016 | |
U.S. Treasury Bond | | | 6.13 | | | | 11-15-2027 | | | | 49,000 | | | | 64,332 | |
U.S. Treasury Bond | | | 6.13 | | | | 8-15-2029 | | | | 25,000 | | | | 34,247 | |
U.S. Treasury Bond | | | 6.25 | | | | 5-15-2030 | | | | 45,000 | | | | 63,238 | |
U.S. Treasury Bond | | | 6.38 | | | | 8-15-2027 | | | | 21,000 | | | | 27,761 | |
U.S. Treasury Bond | | | 6.88 | | | | 8-15-2025 | | | | 21,000 | | | | 26,767 | |
U.S. Treasury Note | | | 2.88 | | | | 9-30-2023 | | | | 148,000 | | | | 154,460 | |
U.S. Treasury Note | | | 1.13 | | | | 2-28-2021 | | | | 142,000 | | | | 141,151 | |
U.S. Treasury Note | | | 1.13 | | | | 6-30-2021 | | | | 142,000 | | | | 140,979 | |
U.S. Treasury Note | | | 1.13 | | | | 7-31-2021 | | | | 153,000 | | | | 151,825 | |
U.S. Treasury Note | | | 1.13 | | | | 8-31-2021 | | | | 153,000 | | | | 151,786 | |
The accompanying notes are an integral part of these financial statements.
24 | Wells Fargo VT Index Asset Allocation Fund
Portfolio of investments—December 31, 2019
| | | | | | | | | | | | | | | | |
| | | Interest
rate | | | Maturity
date | | | Principal | | | Value | |
| U.S. Treasury Securities (continued) | | | | | | | | | | | | |
U.S. Treasury Note | | | 1.13 | % | | | 9-30-2021 | | | $ | 152,000 | | | $ | 150,737 | |
U.S. Treasury Note | | | 1.25 | | | | 3-31-2021 | | | | 145,000 | | | | 144,318 | |
U.S. Treasury Note | | | 1.25 | | | | 10-31-2021 | | | | 151,000 | | | | 150,049 | |
U.S. Treasury Note | | | 1.25 | | | | 7-31-2023 | | | | 125,000 | | | | 123,233 | |
U.S. Treasury Note | | | 1.38 | | | | 9-15-2020 | | | | 102,000 | | | | 101,810 | |
U.S. Treasury Note | | | 1.38 | | | | 9-30-2020 | | | | 147,000 | | | | 146,697 | |
U.S. Treasury Note | | | 1.38 | | | | 10-31-2020 | | | | 232,000 | | | | 231,454 | |
U.S. Treasury Note | | | 1.38 | | | | 1-31-2021 | | | | 147,000 | | | | 146,577 | |
U.S. Treasury Note | | | 1.38 | | | | 4-30-2021 | | | | 144,000 | | | | 143,540 | |
U.S. Treasury Note | | | 1.38 | | | | 5-31-2021 | | | | 144,000 | | | | 143,537 | |
U.S. Treasury Note | | | 1.38 | | | | 6-30-2023 | | | | 126,000 | | | | 124,812 | |
U.S. Treasury Note | | | 1.38 | | | | 8-31-2023 | | | | 124,000 | | | | 122,763 | |
U.S. Treasury Note | | | 1.38 | | | | 9-30-2023 | | | | 90,000 | | | | 89,034 | |
U.S. Treasury Note | | | 1.50 | | | | 1-31-2022 | | | | 128,000 | | | | 127,766 | |
U.S. Treasury Note | | | 1.50 | | | | 2-28-2023 | | | | 126,000 | | | | 125,482 | |
U.S. Treasury Note | | | 1.50 | | | | 3-31-2023 | | | | 126,000 | | | | 125,460 | |
U.S. Treasury Note | | | 1.50 | | | | 8-15-2026 | | | | 102,000 | | | | 99,908 | |
U.S. Treasury Note | | | 1.63 | | | | 10-15-2020 | | | | 102,000 | | | | 101,984 | |
U.S. Treasury Note | | | 1.63 | | | | 11-30-2020 | | | | 155,000 | | | | 154,953 | |
U.S. Treasury Note | | | 1.63 | | | | 8-15-2022 | | | | 117,000 | | | | 117,053 | |
U.S. Treasury Note | | | 1.63 | | | | 8-31-2022 | | | | 151,000 | | | | 151,049 | |
U.S. Treasury Note | | | 1.63 | | | | 11-15-2022 | | | | 150,000 | | | | 150,028 | |
U.S. Treasury Note | | | 1.63 | | | | 4-30-2023 | | | | 128,000 | | | | 127,904 | |
U.S. Treasury Note | | | 1.63 | | | | 5-31-2023 | | | | 128,000 | | | | 127,916 | |
U.S. Treasury Note | | | 1.63 | | | | 10-31-2023 | | | | 90,000 | | | | 89,848 | |
U.S. Treasury Note | | | 1.63 | | | | 2-15-2026 | | | | 102,000 | | | | 100,989 | |
U.S. Treasury Note | | | 1.63 | | | | 5-15-2026 | | | | 105,000 | | | | 103,817 | |
U.S. Treasury Note | | | 1.63 | | | | 8-15-2029 | | | | 157,000 | | | | 152,827 | |
U.S. Treasury Note | | | 1.75 | | | | 10-31-2020 | | | | 148,000 | | | | 148,114 | |
U.S. Treasury Note | | | 1.75 | | | | 11-15-2020 | | | | 102,000 | | | | 102,082 | |
U.S. Treasury Note | | | 1.75 | | | | 12-31-2020 | | | | 148,000 | | | | 148,126 | |
U.S. Treasury Note | | | 1.75 | | | | 11-30-2021 | | | | 134,000 | | | | 134,374 | |
U.S. Treasury Note | | | 1.75 | | | | 2-28-2022 | | | | 129,000 | | | | 129,438 | |
U.S. Treasury Note | | | 1.75 | | | | 3-31-2022 | | | | 128,000 | | | | 128,432 | |
U.S. Treasury Note | | | 1.75 | | | | 4-30-2022 | | | | 126,000 | | | | 126,422 | |
U.S. Treasury Note | | | 1.75 | | | | 5-15-2022 | | | | 111,000 | | | | 111,362 | |
U.S. Treasury Note | | | 1.75 | | | | 5-31-2022 | | | | 149,000 | | | | 149,519 | |
U.S. Treasury Note | | | 1.75 | | | | 6-30-2022 | | | | 149,000 | | | | 149,551 | |
U.S. Treasury Note | | | 1.75 | | | | 9-30-2022 | | | | 144,000 | | | | 144,505 | |
U.S. Treasury Note | | | 1.75 | | | | 1-31-2023 | | | | 129,000 | | | | 129,455 | |
U.S. Treasury Note | | | 1.75 | | | | 5-15-2023 | | | | 226,000 | | | | 226,720 | |
U.S. Treasury Note | | | 1.88 | | | | 12-15-2020 | | | | 100,000 | | | | 100,211 | |
U.S. Treasury Note | | | 1.88 | | | | 11-30-2021 | | | | 128,000 | | | | 128,708 | |
U.S. Treasury Note | | | 1.88 | | | | 1-31-2022 | | | | 157,000 | | | | 157,867 | |
U.S. Treasury Note | | | 1.88 | | | | 2-28-2022 | | | | 153,000 | | | | 153,884 | |
U.S. Treasury Note | | | 1.88 | | | | 3-31-2022 | | | | 153,000 | | | | 153,917 | |
U.S. Treasury Note | | | 1.88 | | | | 4-30-2022 | | | | 153,000 | | | | 153,931 | |
U.S. Treasury Note | | | 1.88 | | | | 5-31-2022 | | | | 128,000 | | | | 128,826 | |
U.S. Treasury Note | | | 1.88 | | | | 7-31-2022 | | | | 149,000 | | | | 149,984 | |
U.S. Treasury Note | | | 1.88 | | | | 8-31-2022 | | | | 142,000 | | | | 142,973 | |
U.S. Treasury Note | | | 1.88 | | | | 9-30-2022 | | | | 144,000 | | | | 145,023 | |
U.S. Treasury Note | | | 1.88 | | | | 10-31-2022 | | | | 143,000 | | | | 143,990 | |
U.S. Treasury Note | | | 1.88 | | | | 8-31-2024 | | | | 125,000 | | | | 125,961 | |
U.S. Treasury Note | | | 2.00 | | | | 9-30-2020 | | | | 106,000 | | | | 106,270 | |
U.S. Treasury Note | | | 2.00 | | | | 11-30-2020 | | | | 122,000 | | | | 122,387 | |
U.S. Treasury Note | | | 2.00 | | | | 1-15-2021 | | | | 100,000 | | | | 100,362 | |
The accompanying notes are an integral part of these financial statements.
Wells Fargo VT Index Asset Allocation Fund | 25
Portfolio of investments—December 31, 2019
| | | | | | | | | | | | | | | | |
| | | Interest
rate | | | Maturity
date | | | Principal | | | Value | |
| U.S. Treasury Securities (continued) | | | | | | | | | | | | |
U.S. Treasury Note | | | 2.00 | % | | | 2-28-2021 | | | $ | 105,000 | | | $ | 105,418 | |
U.S. Treasury Note | | | 2.00 | | | | 5-31-2021 | | | | 146,000 | | | | 146,780 | |
U.S. Treasury Note | | | 2.00 | | | | 8-31-2021 | | | | 127,000 | | | | 127,811 | |
U.S. Treasury Note | | | 2.00 | | | | 10-31-2021 | | | | 126,000 | | | | 126,907 | |
U.S. Treasury Note | | | 2.00 | | | | 11-15-2021 | | | | 178,000 | | | | 179,356 | |
U.S. Treasury Note | | | 2.00 | | | | 12-31-2021 | | | | 155,000 | | | | 156,193 | |
U.S. Treasury Note | | | 2.00 | | | | 2-15-2022 | | | | 133,000 | | | | 134,087 | |
U.S. Treasury Note | | | 2.00 | | | | 7-31-2022 | | | | 144,000 | | | | 145,418 | |
U.S. Treasury Note | | | 2.00 | | | | 10-31-2022 | | | | 143,000 | | | | 144,493 | |
U.S. Treasury Note | | | 2.00 | | | | 11-30-2022 | | | | 129,000 | | | | 130,384 | |
U.S. Treasury Note | | | 2.00 | | | | 2-15-2023 | | | | 220,000 | | | | 222,442 | |
U.S. Treasury Note | | | 2.00 | | | | 4-30-2024 | | | | 123,000 | | | | 124,577 | |
U.S. Treasury Note | | | 2.00 | | | | 5-31-2024 | | | | 123,000 | | | | 124,595 | |
U.S. Treasury Note | | | 2.00 | | | | 6-30-2024 | | | | 123,000 | | | | 124,593 | |
U.S. Treasury Note | | | 2.00 | | | | 2-15-2025 | | | | 289,000 | | | | 292,885 | |
U.S. Treasury Note | | | 2.00 | | | | 8-15-2025 | | | | 220,000 | | | | 222,781 | |
U.S. Treasury Note | | | 2.00 | | | | 11-15-2026 | | | | 170,000 | | | | 171,767 | |
U.S. Treasury Note | | | 2.13 | | | | 1-31-2021 | | | | 132,000 | | | | 132,677 | |
U.S. Treasury Note | | | 2.13 | | | | 6-30-2021 | | | | 142,000 | | | | 143,096 | |
U.S. Treasury Note | | | 2.13 | | | | 8-15-2021 | | | | 178,000 | | | | 179,452 | |
U.S. Treasury Note | | | 2.13 | | | | 9-30-2021 | | | | 128,000 | | | | 129,115 | |
U.S. Treasury Note | | | 2.13 | | | | 12-31-2021 | | | | 126,000 | | | | 127,285 | |
U.S. Treasury Note | | | 2.13 | | | | 6-30-2022 | | | | 126,000 | | | | 127,609 | |
U.S. Treasury Note | | | 2.13 | | | | 12-31-2022 | | | | 129,000 | | | | 130,890 | |
U.S. Treasury Note | | | 2.13 | | | | 11-30-2023 | | | | 110,000 | | | | 111,870 | |
U.S. Treasury Note | | | 2.13 | | | | 2-29-2024 | | | | 128,000 | | | | 130,265 | |
U.S. Treasury Note | | | 2.13 | | | | 3-31-2024 | | | | 127,000 | | | | 129,250 | |
U.S. Treasury Note | | | 2.13 | | | | 7-31-2024 | | | | 123,000 | | | | 125,278 | |
U.S. Treasury Note | | | 2.13 | | | | 5-15-2025 | | | | 234,000 | | | | 238,583 | |
U.S. Treasury Note | | | 2.25 | | | | 2-15-2021 | | | | 109,000 | | | | 109,720 | |
U.S. Treasury Note | | | 2.25 | | | | 3-31-2021 | | | | 135,000 | | | | 136,013 | |
U.S. Treasury Note | | | 2.25 | | | | 4-30-2021 | | | | 142,000 | | | | 143,179 | |
U.S. Treasury Note | | | 2.25 | | | | 7-31-2021 | | | | 120,000 | | | | 121,186 | |
U.S. Treasury Note | | | 2.25 | | | | 12-31-2023 | | | | 127,000 | | | | 129,786 | |
U.S. Treasury Note | | | 2.25 | | | | 1-31-2024 | | | | 127,000 | | | | 129,834 | |
U.S. Treasury Note | | | 2.25 | | | | 10-31-2024 | | | | 121,000 | | | | 124,050 | |
U.S. Treasury Note | | | 2.25 | | | | 11-15-2024 | | | | 290,000 | | | | 297,319 | |
U.S. Treasury Note | | | 2.25 | | | | 12-31-2024 | | | | 118,000 | | | | 121,026 | |
U.S. Treasury Note | | | 2.25 | | | | 11-15-2025 | | | | 219,000 | | | | 224,722 | |
U.S. Treasury Note | | | 2.25 | | | | 2-15-2027 | | | | 196,000 | | | | 201,262 | |
U.S. Treasury Note | | | 2.25 | | | | 8-15-2027 | | | | 101,000 | | | | 103,753 | |
U.S. Treasury Note | | | 2.25 | | | | 11-15-2027 | | | | 99,000 | | | | 101,684 | |
U.S. Treasury Note | | | 2.38 | | | | 12-31-2020 | | | | 123,000 | | | | 123,859 | |
U.S. Treasury Note | | | 2.38 | | | | 1-31-2023 | | | | 144,000 | | | | 147,181 | |
U.S. Treasury Note | | | 2.38 | | | | 8-15-2024 | | | | 289,000 | | | | 297,580 | |
U.S. Treasury Note | | | 2.38 | | | | 5-15-2027 | | | | 283,000 | | | | 293,197 | |
U.S. Treasury Note | | | 2.38 | | | | 5-15-2029 | | | | 90,000 | | | | 93,472 | |
U.S. Treasury Note | | | 2.50 | | | | 8-15-2023 | | | | 190,000 | | | | 195,553 | |
U.S. Treasury Note | | | 2.50 | | | | 5-15-2024 | | | | 281,000 | | | | 290,507 | |
U.S. Treasury Note | | | 2.50 | | | | 1-31-2025 | | | | 116,000 | | | | 120,433 | |
U.S. Treasury Note | | | 2.63 | | | | 11-15-2020 | | | | 230,000 | | | | 231,918 | |
U.S. Treasury Note | | | 2.63 | | | | 2-28-2023 | | | | 146,000 | | | | 150,427 | |
U.S. Treasury Note | | | 2.63 | | | | 6-30-2023 | | | | 139,000 | | | | 143,605 | |
U.S. Treasury Note | | | 2.63 | | | | 3-31-2025 | | | | 114,000 | | | | 119,115 | |
U.S. Treasury Note | | | 2.63 | | | | 2-15-2029 | | | | 250,000 | | | | 264,758 | |
U.S. Treasury Note | | | 2.75 | | | | 5-31-2023 | | | | 141,000 | | | | 146,104 | |
The accompanying notes are an integral part of these financial statements.
26 | Wells Fargo VT Index Asset Allocation Fund
Portfolio of investments—December 31, 2019
| | | | | | | | | | | | | | | | |
| | | Interest
rate | | | Maturity
date | | | Principal | | | Value | |
| U.S. Treasury Securities (continued) | | | | | | | | | | | | |
U.S. Treasury Note | | | 2.75 | % | | | 7-31-2023 | | | $ | 142,000 | | | $ | 147,356 | |
U.S. Treasury Note | | | 2.75 | | | | 8-31-2023 | | | | 145,000 | | | | 150,568 | |
U.S. Treasury Note | | | 2.75 | | | | 11-15-2023 | | | | 251,000 | | | | 261,046 | |
U.S. Treasury Note | | | 2.75 | | | | 2-15-2024 | | | | 217,000 | | | | 226,165 | |
U.S. Treasury Note | | | 2.75 | | | | 2-28-2025 | | | | 121,000 | | | | 127,135 | |
U.S. Treasury Note | | | 2.75 | | | | 6-30-2025 | | | | 119,000 | | | | 125,224 | |
U.S. Treasury Note | | | 2.75 | | | | 8-31-2025 | | | | 122,000 | | | | 128,483 | |
U.S. Treasury Note | | | 2.75 | | | | 2-15-2028 | | | | 189,000 | | | | 201,239 | |
U.S. Treasury Note | | | 2.88 | | | | 4-30-2025 | | | | 114,000 | | | | 120,601 | |
U.S. Treasury Note | | | 2.88 | | | | 5-31-2025 | | | | 117,000 | | | | 123,810 | |
U.S. Treasury Note | | | 2.88 | | | | 7-31-2025 | | | | 118,000 | | | | 125,004 | |
U.S. Treasury Note | | | 2.88 | | | | 8-15-2028 | | | | 190,000 | | | | 204,642 | |
U.S. Treasury Note | | | 3.00 | | | | 9-30-2025 | | | | 121,000 | | | | 129,120 | |
U.S. Treasury Note | | | 3.13 | | | | 5-15-2021 | | | | 155,000 | | | | 158,142 | |
U.S. Treasury Note | | | 3.63 | | | | 2-15-2021 | | | | 199,000 | | | | 203,331 | |
U.S. Treasury Note | | | 6.00 | | | | 2-15-2026 | | | | 42,000 | | | | 52,247 | |
U.S. Treasury Note | | | 6.25 | | | | 8-15-2023 | | | | 35,000 | | | | 40,634 | |
U.S. Treasury Note | | | 6.50 | | | | 11-15-2026 | | | | 28,000 | | | | 36,475 | |
U.S. Treasury Note | | | 6.63 | | | | 2-15-2027 | | | | 18,000 | | | | 23,761 | |
U.S. Treasury Note | | | 6.75 | | | | 8-15-2026 | | | | 21,000 | | | | 27,479 | |
U.S. Treasury Note | | | 7.13 | | | | 2-15-2023 | | | | 24,000 | | | | 28,029 | |
U.S. Treasury Note | | | 7.25 | | | | 8-15-2022 | | | | 24,000 | | | | 27,459 | |
U.S. Treasury Note | | | 7.50 | | | | 11-15-2024 | | | | 22,000 | | | | 27,920 | |
U.S. Treasury Note | | | 7.63 | | | | 11-15-2022 | | | | 12,000 | | | | 14,021 | |
U.S. Treasury Note | | | 7.63 | | | | 2-15-2025 | | | | 20,000 | | | | 25,764 | |
U.S. Treasury Note | | | 7.88 | | | | 2-15-2021 | | | | 15,000 | | | | 16,022 | |
U.S. Treasury Note | | | 8.00 | | | | 11-15-2021 | | | | 48,000 | | | | 53,596 | |
U.S. Treasury Note | | | 8.13 | | | | 5-15-2021 | | | | 17,000 | | | | 18,499 | |
U.S. Treasury Note | | | 8.13 | | | | 8-15-2021 | | | | 15,000 | | | | 16,561 | |
| |
Total U.S. Treasury Securities (Cost $26,802,235) | | | | 27,911,946 | |
| | | | | | | | | | | | | | | | |
| | | | |
| | | | | | | | | | | | | | | | |
| | | Yield | | | | | | Shares | | | | |
| Short-Term Investments: 0.25% | |
|
| Investment Companies: 0.18% | |
Wells Fargo Government Money Market Fund Select Class (l)(u) | | | 1.55 | | | | | | | | 126,233 | | | | 126,233 | |
| | | | | | | | | | | | | | | | |
| | | | |
| | | | | | | | | | | | | | | | |
| | | | | | | | | Principal | | | | |
| U.S. Treasury Securities: 0.07% | |
U.S. Treasury Bill #(z) | | | 1.50 | | | | 3-12-2020 | | | $ | 52,000 | | | | 51,848 | |
| | | | | | | | | | | | | | | | |
| |
Total Short-Term Investments (Cost $178,078) | | | | 178,081 | |
| | | | | | | | | | | | | | | | |
| | | | | | | | |
| Total investments in securities (Cost $47,742,458) | | | 99.40 | % | | | 71,760,827 | |
| | |
Other assets and liabilities, net | | | 0.60 | | | | 431,769 | |
| | | | | | | | |
| Total net assets | | | 100.00 | % | | $ | 72,192,596 | |
| | | | | | | | |
| † | Non-income-earning security |
| (l) | The issuer of the security is an affiliated person of the Fund as defined in the Investment Company Act of 1940. |
| (u) | The rate represents the7-day annualized yield at period end. |
| # | All or a portion of this security is segregated as collateral for investments in derivative instruments. |
| (z) | Zero coupon security. The rate represents the current yield to maturity. |
Abbreviations:
| REIT | Real estate investment trust |
The accompanying notes are an integral part of these financial statements.
Wells Fargo VT Index Asset Allocation Fund | 27
Portfolio of investments—December 31, 2019
Futures Contracts
| | | | | | | | | | | | | | | | | | | | | | | | |
| Description | | Number of contracts | | | Expiration date | | | Notional cost | | | Notional value | | | Unrealized gains | | | Unrealized losses | |
| | | | | | |
Long | | | | | | | | | | | | | | | | | | | | | | | | |
| | | | | | |
10-Year U.S. Treasury Notes | | | 38 | | | | 3-20-2020 | | | $ | 4,922,594 | | | $ | 4,880,031 | | | $ | 0 | | | $ | (42,563 | ) |
| | | | | | |
5-Year U.S. Treasury Notes | | | 4 | | | | 3-31-2020 | | | | 473,886 | | | | 474,438 | | | | 552 | | | | 0 | |
| | | | | | | | | | | | | | | | | | | | | | | | |
| | | | | | |
| | | | | | | | | | | | | | | | | | $ | 552 | | | $ | (42,563 | ) |
| | | | | | | | | | | | | | | | | | | | | | | | |
Investments in Affiliates
An affiliated investment is an investment in which the Fund owns at least 5% of the outstanding voting shares of the issuer or as a result of other relationships, such as the Fund and the issuer having the same investment manager. Transactions with issuers that were either affiliated persons of the Fund at the beginning of the period or the end of the period were as follows:
| | | | | | | | | | | | | | | | | | | | | | | | | | | | | | | | | | | | |
| | | Shares, beginning of period | | | Shares purchased | | | Shares sold | | | Shares, end of period | | | Net realized gains (losses) | | | Net change in unrealized gains (losses) | | | Income from affiliated securities | | | Value, end of
period | | | % of net assets | |
| | | | | | | | | |
| Common Stocks | | | | | | | | | | | | | | | | | | | | | | | | | | | |
Financials | | | | | | | | | | | | | | | | | | | | | | | | | | | | | | | | | | | | |
Banks | | | | | | | | | | | | | | | | | | | | | | | | | | | | | | | | | | | | |
Wells Fargo & Company | | | 8,176 | | | | 102 | | | | (2,007 | ) | | | 6,271 | | | $ | 44,379 | | | $ | 11,939 | | | $ | 14,149 | | | $ | 337,379 | | | | 0.47 | % |
| | | | | | | | | | | | | | | | | | | | | | | | | | | | | | | | | | | | |
| | | | | | | | | |
| Short-Term Investments | | | | | | | | | | | | | | | | | | | | | | | | | | | |
Investment Companies | | | | | | | | | | | | | | | | | | | | | | | | | | | | | | | | | | | | |
Securities Lending Cash Investments LLC * | | | 0 | | | | 412,684 | | | | (412,684 | ) | | | 0 | | | | 3 | | | | 0 | | | | 486 | # | | | 0 | | | | | |
Wells Fargo Government Money Market Fund Select Class | | | 1,208,555 | | | | 10,519,272 | | | | (11,601,594 | ) | | | 126,233 | | | | 0 | | | | 0 | | | | 16,276 | | | | 126,233 | | | | | |
| | | | | | | | | | | | | | | | | | | | | | | | | | | | | | | 126,233 | | | | 0.18 | |
| | | | | | | | | | | | | | | | | | | | | | | | | | | | | | | | | | | | |
| | | | | | | | | | | | | | | | | | $ | 44,382 | | | $ | 11,939 | | | $ | 30,911 | | | $ | 463,612 | | | | 0.65 | % |
| | | | | | | | | | | | | | | | | | | | | | | | | | | | | | | | | | | | |
| * | No longer held at the end of the period. |
| # | Amount shown represents income before fees and rebates. |
The accompanying notes are an integral part of these financial statements.
28 | Wells Fargo VT Index Asset Allocation Fund
Statement of assets and liabilities—December 31, 2019
| | | | |
| | | | |
| |
Assets | | | | |
Investments in unaffiliated securities, at value (cost $47,423,025) | | $ | 71,297,215 | |
Investments in affiliated securities, at value (cost $319,433) | | | 463,612 | |
Receivable for investments sold | | | 332,670 | |
Receivable for Fund shares sold | | | 678 | |
Receivable for dividends and interest | | | 203,368 | |
Prepaid expenses and other assets | | | 29,521 | |
| | | | |
Total assets | | | 72,327,064 | |
| | | | |
| |
Liabilities | | | | |
Payable for Fund shares redeemed | | | 52,665 | |
Payable for daily variation margin on open futures contracts | | | 4,260 | |
Management fee payable | | | 34,831 | |
Administration fee payable | | | 5,076 | |
Distribution fee payable | | | 15,794 | |
Custody and accounting fees payable | | | 14,772 | |
Trustees’ fees and expenses payable | | | 5,690 | |
Accrued expenses and other liabilities | | | 1,380 | |
| | | | |
Total liabilities | | | 134,468 | |
| | | | |
Total net assets | | $ | 72,192,596 | |
| | | | |
| |
Net assets consist of | | | | |
Paid-in capital | | $ | 43,991,837 | |
Total distributable earnings | | | 28,200,759 | |
| | | | |
Total net assets | | $ | 72,192,596 | |
| | | | |
| |
Computation of net asset value per share | | | | |
Net assets – Class 2 | | $ | 72,192,596 | |
Shares outstanding – Class 21 | | | 3,513,357 | |
Net asset value per share – Class 2 | | | $20.55 | |
| 1 | The Fund has an unlimited number of authorized shares. |
The accompanying notes are an integral part of these financial statements.
Wells Fargo VT Index Asset Allocation Fund | 29
Statement of operations—year ended December 31, 2019
| | | | |
| | | | |
| |
Investment income | | | | |
Dividends | | $ | 873,731 | |
Interest | | | 600,582 | |
Income from affiliated securities | | | 30,480 | |
| | | | |
Total investment income | | | 1,504,793 | |
| | | | |
| |
Expenses | | | | |
Management fee | | | 435,464 | |
Administration fee | | | | |
Class 2 | | | 58,062 | |
Distribution fee | | | | |
Class 2 | | | 180,340 | |
Custody and accounting fees | | | 20,599 | |
Professional fees | | | 36,579 | |
Shareholder report expenses | | | 5,648 | |
Trustees’ fees and expenses | | | 21,041 | |
Other fees and expenses | | | 4,350 | |
| | | | |
Total expenses | | | 762,083 | |
Less: Fee waivers and/or expense reimbursements | | | | |
Fund-level | | | (36,656 | ) |
| | | | |
Net expenses | | | 725,427 | |
| | | | |
Net investment income | | | 779,366 | |
| | | | |
| |
Realized and unrealized gains (losses) on investments | | | | |
Net realized gains (losses) on | | | | |
Unaffiliated securities | | | 5,438,115 | |
Affiliated securities | | | 44,382 | |
Futures contracts | | | (87,409 | ) |
| | | | |
Net realized gains on investments | | | 5,395,088 | |
| | | | |
| |
Net change in unrealized gains (losses) on | | | | |
Unaffiliated securities | | | 6,847,686 | |
Affiiliated securities | | | 11,939 | |
Futures contracts | | | 206,401 | |
| | | | |
Net change in unrealized gains (losses) on investments | | | 7,066,026 | |
| | | | |
Net realized and unrealized gains (losses) on investments | | | 12,461,114 | |
| | | | |
Net increase in net assets resulting from operations | | $ | 13,240,480 | |
| | | | |
The accompanying notes are an integral part of these financial statements.
30 | Wells Fargo VT Index Asset Allocation Fund
Statement of changes in net assets
| | | | | | | | | | | | | | | | |
| | | Year ended
December 31, 2019 | | | Year ended
December 31, 2018 | |
| | | | |
Operations | | | | | | | | | | | | | | | | |
Net investment income | | | | | | $ | 779,366 | | | | | | | $ | 726,669 | |
Net realized gains on investments | | | | | | | 5,395,088 | | | | | | | | 4,915,002 | |
Net change in unrealized gains (losses) on investments | | | | | | | 7,066,026 | | | | | | | | (7,617,016 | ) |
| | | | |
Net increase (decrease) in net assets resulting from operations | | | | | | | 13,240,480 | | | | | | | | (1,975,345 | ) |
| | | | |
| | | | |
Distributions to shareholders from net investment income and net realized gains – Class 2 | | | | | | | (5,335,197) | | | | | | | | (5,678,021) | |
| | | | |
| | | | |
Capital share transactions | | | Shares | | | | | | | | Shares | | | | | |
Proceeds from shares sold – Class 2 | | | 75,995 | | | | 1,504,042 | | | | 94,068 | | | | 1,894,966 | |
Reinvestment of distributions – Class 2 | | | 269,720 | | | | 5,335,197 | | | | 288,313 | | | | 5,678,021 | |
Payment for shares redeemed – Class 2 | | | (570,099 | ) | | | (11,403,024 | ) | | | (652,033 | ) | | | (13,024,489 | ) |
| | | | |
Net decrease in net assets resulting from capital share transactions | | | | | | | (4,563,785 | ) | | | | | | | (5,451,502 | ) |
| | | | |
Total increase (decrease) in net assets | | | | | | | 3,341,498 | | | | | | | | (13,104,868 | ) |
| | | | |
| |
Net assets | | | | |
Beginning of period | | | | | | | 68,851,098 | | | | | | | | 81,955,966 | |
| | | | |
End of period | | | | | | $ | 72,192,596 | | | | | | | $ | 68,851,098 | |
| | | | |
The accompanying notes are an integral part of these financial statements.
Wells Fargo VT Index Asset Allocation Fund | 31
Financial highlights
(For a share outstanding throughout each period)
| | | | | | | | | | | | | | | | | | | | |
| | | Year ended December 31 | |
| CLASS 2 | | 2019 | | | 2018 | | | 2017 | | | 2016 | | | 2015 | |
Net asset value, beginning of period | | | $18.42 | | | | $20.45 | | | | $19.16 | | | | $18.47 | | | | $18.43 | |
Net investment income | | | 0.22 | | | | 0.20 | | | | 0.17 | | | | 0.17 | | | | 0.18 | |
Net realized and unrealized gains (losses) on investments | | | 3.42 | | | | (0.70 | ) | | | 2.12 | | | | 1.22 | | | | 0.05 | |
| | | | | | | | | | | | | | | | | | | | |
Total from investment operations | | | 3.64 | | | | (0.50 | ) | | | 2.29 | | | | 1.39 | | | | 0.23 | |
Distributions to shareholders from | | | | | | | | | | | | | | | | | | | | |
Net investment income | | | (0.22 | ) | | | (0.20 | ) | | | (0.15 | ) | | | (0.17 | ) | | | (0.19 | ) |
Net realized gains | | | (1.29 | ) | | | (1.33 | ) | | | (0.85 | ) | | | (0.53 | ) | | | 0.00 | |
| | | | | | | | | | | | | | | | | | | | |
Total distributions to shareholders | | | (1.51 | ) | | | (1.53 | ) | | | (1.00 | ) | | | (0.70 | ) | | | (0.19 | ) |
Net asset value, end of period | | | $20.55 | | | | $18.42 | | | | $20.45 | | | | $19.16 | | | | $18.47 | |
Total return1 | | | 20.16 | % | | | (2.90 | )% | | | 12.25 | % | | | 7.67 | % | | | 1.25 | % |
Ratios to average net assets (annualized) | | | | | | | | | | | | | | | | | | | | |
Gross expenses | | | 1.05 | % | | | 1.05 | % | | | 1.16 | % | | | 1.10 | % | | | 1.10 | % |
Net expenses | | | 1.00 | % | | | 1.00 | % | | | 1.00 | % | | | 1.00 | % | | | 1.00 | % |
Net investment income | | | 1.07 | % | | | 0.94 | % | | | 0.86 | % | | | 0.93 | % | | | 0.95 | % |
Supplemental data | | | | | | | | | | | | | | | | | | | | |
Portfolio turnover rate | | | 4 | % | | | 10 | % | | | 10 | % | | | 15 | % | | | 44 | % |
Net assets, end of period (000s omitted) | | | $72,193 | | | | $68,851 | | | | $81,956 | | | | $81,505 | | | | $81,495 | |
| 1 | Returns do not reflect fees and expenses charged pursuant to the terms of variable life insurance policies and variable annuity contracts. |
The accompanying notes are an integral part of these financial statements.
32 | Wells Fargo VT Index Asset Allocation Fund
Notes to financial statements
1. ORGANIZATION
Wells Fargo Variable Trust (the “Trust”), a Delaware statutory trust organized on March 10, 1999, is anopen-end management investment company registered under the Investment Company Act of 1940, as amended (the “1940 Act”). As an investment company, the Trust follows the accounting and reporting guidance in Financial Accounting Standards Board (“FASB”)Accounting Standards Codification Topic 946, Financial Services – Investment Companies. These financial statements report on the Wells Fargo VT Index Asset Allocation Fund (the “Fund”) which is a diversified series of the Trust. The Trust offers shares of the Fund to separate accounts of various life insurance companies as funding vehicles for certain variable annuity contracts and variable life insurance policies.
2. SIGNIFICANT ACCOUNTING POLICIES
The following significant accounting policies, which are consistently followed in the preparation of the financial statements of the Fund, are in conformity with U.S. generally accepted accounting principles which require management to make estimates and assumptions that affect the reported amounts of assets and liabilities, disclosure of contingent assets and liabilities at the date of the financial statements, and the reported amounts of revenues and expenses during the reporting period. Actual results could differ from those estimates.
Securities valuation
All investments are valued each business day as of the close of regular trading on the New York Stock Exchange (generally 4 p.m. Eastern Time), although the Fund may deviate from this calculation time under unusual or unexpected circumstances.
Equity securities and futures contracts that are listed on a foreign or domestic exchange or market are valued at the official closing price or, if none, the last sales price. If no sale occurs on the principal exchange or market that day, a fair value price will be determined in accordance with the Fund’s Valuation Procedures.
Debt securities are valued at the evaluated bid price provided by an independent pricing service (e.g. taking into account various factors, including yields, maturities, or credit ratings) or, if a reliable price is not available, the quoted bid price from an independent broker-dealer.
Investments in registeredopen-end investment companies are valued at net asset value. Interests innon-registered investment companies that are redeemable at net asset value are fair valued normally at net asset value.
Investments which are not valued using any of the methods discussed above are valued at their fair value, as determined in good faith by the Board of Trustees of the Fund. The Board of Trustees has established a Valuation Committee comprised of the Trustees and has delegated to it the authority to take any actions regarding the valuation of portfolio securities that the Valuation Committee deems necessary or appropriate, including determining the fair value of portfolio securities, unless the determination has been delegated to the Wells Fargo Asset Management Pricing Committee at Wells Fargo Funds Management, LLC (“Funds Management”). The Board of Trustees retains the authority to make or ratify any valuation decisions or approve any changes to the Valuation Procedures as it deems appropriate. On a quarterly basis, the Board of Trustees receives reports on any valuation actions taken by the Valuation Committee or the Wells Fargo Asset Management Pricing Committee which may include items for ratification.
Securities lending
The Fund may lend its securities from time to time in order to earn additional income in the form of fees or interest on securities received as collateral or the investment of any cash received as collateral. When securities are on loan, the Fund receives interest or dividends on those securities. Cash collateral received in connection with its securities lending transactions is invested in Securities Lending Cash Investments, LLC (the “Securities Lending Fund”). Investments in Securities Lending Fund are valued at the evaluated bid price provided by an independent pricing service. Income earned from investment in the Securities Lending Fund (net of fees and rebates), if any, is included in income from affiliated securities on the Statement of Operations.
In a securities lending transaction, the net asset value of the Fund is affected by an increase or decrease in the value of the securities loaned and by an increase or decrease in the value of the instrument in which collateral is invested. The amount of securities lending activity undertaken by the Fund fluctuates from time to time. The Fund has the right under the lending agreement to recover the securities from the borrower on demand. In the event of default or bankruptcy by the borrower, the Fund may be prevented from recovering the loaned securities or gaining access to the collateral or may experience delays or costs in doing so. In such an event, the terms of the agreement allows the unaffiliated securities lending agent to use the collateral to purchase replacement securities on behalf of the Fund or pay the Fund the market value of the loaned securities. The Fund bears the risk of loss with respect to depreciation of its investment of the cash collateral.
Wells Fargo VT Index Asset Allocation Fund | 33
Notes to financial statements
Futures contracts
Futures contracts are agreements between the Fund and a counterparty to buy or sell a specific amount of a commodity, financial instrument or currency at a specified price and on a specified date. The Fund may buy and sell futures contracts in order to gain exposure to, or protect against, changes in interest rates and security values and is subject to interest rate risk and equity price risk. The primary risks associated with the use of futures contracts are the imperfect correlation between changes in market values of securities held by the Fund and the prices of futures contracts, and the possibility of an illiquid market. Futures contracts are generally entered into on a regulated futures exchange and cleared through a clearinghouse associated with the exchange. With futures contracts, there is minimal counterparty risk to the Fund since futures contracts are exchange traded and the exchange’s clearinghouse, as the counterparty to all exchange traded futures, guarantees the futures contracts against default.
Upon entering into a futures contracts, the Fund is required to deposit either cash or securities (initial margin) with the broker in an amount equal to a certain percentage of the contract value. Subsequent payments (variation margin) are paid to or from the broker each day equal to the daily changes in the contract value. Such payments are recorded as unrealized gains or losses and, if any, shown as variation margin receivable (payable) in the Statement of Assets and Liabilities. Should the Fund fail to make requested variation margin payments, the broker can gain access to the initial margin to satisfy the Fund’s payment obligations. When the contracts are closed, a realized gain or loss is recorded in the Statement of Operations.
Security transactions and income recognition
Securities transactions are recorded on a trade date basis. Realized gains or losses are recorded on the basis of identified cost.
Dividend income is recognized on theex-dividend date.
Interest income is accrued daily and bond discounts are accreted and premiums are amortized daily. To the extent debt obligations are placed onnon-accrual status, any related interest income may be reduced by writing off interest receivables when the collection of all or a portion of interest has been determined to be doubtful based on consistently applied procedures and the fair value has decreased. If the issuer subsequently resumes interest payments or when the collectability of interest is reasonably assured, the debt obligation is removed fromnon-accrual status.
Distributions to shareholders
Distributions to shareholders are recorded on theex-dividend date and paid from net investment income quarterly and any net realized gains are paid at least annually. Such distributions are determined in accordance with income tax regulations and may differ from U.S. generally accepted accounting principles. Dividend sources are estimated at the time of declaration. The tax character of distributions is determined as of the Fund’s fiscal year end. Therefore, a portion of the Fund’s distributions made prior to the Fund’s fiscal year end may be categorized as a tax return of capital at year end.
Federal and other taxes
The Fund intends to continue to qualify as a regulated investment company by distributing substantially all of its investment company taxable income and any net realized capital gains (after reduction for capital loss carryforwards) sufficient to relieve it from all, or substantially all, federal income taxes. Accordingly, no provision for federal income taxes was required.
The Fund’s income and federal excise tax returns and all financial records supporting those returns for the prior three fiscal years are subject to examination by the federal and Delaware revenue authorities. Management has analyzed the Fund’s tax positions taken on federal, state, and foreign tax returns for all open tax years and does not believe that there are any uncertain tax positions that require recognition of a tax liability.
As of December 31, 2019, the aggregate cost of all investments for federal income tax purposes was $49,261,819 and the unrealized gains (losses) consisted of:
| | | | |
| |
Gross unrealized gains | | $ | 23,332,255 | |
| |
Gross unrealized losses | | | (875,258 | ) |
| |
Net unrealized gains | | $ | 22,456,997 | |
3. FAIR VALUATION MEASUREMENTS
Fair value measurements of investments are determined within a framework that has established a fair value hierarchy based upon the various data inputs utilized in determining the value of the Fund’s investments. The three-level hierarchy gives the highest priority to unadjusted quoted prices in active markets for identical assets or liabilities (Level 1) and the lowest priority to
34 | Wells Fargo VT Index Asset Allocation Fund
Notes to financial statements
unobservable inputs (Level 3). The Fund’s investments are classified within the fair value hierarchy based on the lowest level of input that is significant to the fair value measurement. The inputs are summarized into three broad levels as follows:
| ∎ | | Level 1 – quoted prices in active markets for identical securities |
| ∎ | | Level 2 – other significant observable inputs (including quoted prices for similar securities, interest rates, prepayment speeds, credit risk, etc.) |
| ∎ | | Level 3 – significant unobservable inputs (including the Fund’s own assumptions in determining the fair value of investments) |
The inputs or methodologies used for valuing investments in securities are not necessarily an indication of the risk associated with investing in those securities.
The following is a summary of the inputs used in valuing the Fund’s assets and liabilities as of December 31, 2019:
| | | | | | | | | | | | | | | | |
| | | | |
| | | Quoted prices
(Level 1) | | | Other significant
observable inputs
(Level 2) | | | Significant
unobservable inputs (Level 3) | | | Total | |
| | | | |
Assets | | | | | | | | | | | | | | | | |
Investments in: | | | | | | | | | | | | | | | | |
| | | | |
Common stocks | | | | | | | | | | | | | | | | |
| | | | |
Communication services | | $ | 4,535,990 | | | $ | 0 | | | $ | 0 | | | $ | 4,535,990 | |
| | | | |
Consumer discretionary | | | 4,250,034 | | | | 0 | | | | 0 | | | | 4,250,034 | |
| | | | |
Consumer staples | | | 3,147,646 | | | | 0 | | | | 0 | | | | 3,147,646 | |
| | | | |
Energy | | | 1,893,356 | | | | 0 | | | | 0 | | | | 1,893,356 | |
| | | | |
Financials | | | 5,651,135 | | | | 0 | | | | 0 | | | | 5,651,135 | |
| | | | |
Health care | | | 6,197,758 | | | | 0 | | | | 0 | | | | 6,197,758 | |
| | | | |
Industrials | | | 3,949,856 | | | | 0 | | | | 0 | | | | 3,949,856 | |
| | | | |
Information technology | | | 10,151,533 | | | | 0 | | | | 0 | | | | 10,151,533 | |
| | | | |
Materials | | | 1,158,464 | | | | 0 | | | | 0 | | | | 1,158,464 | |
| | | | |
Real estate | | | 1,280,026 | | | | 0 | | | | 0 | | | | 1,280,026 | |
| | | | |
Utilities | | | 1,455,002 | | | | 0 | | | | 0 | | | | 1,455,002 | |
| | | | |
U.S. Treasury securities | | | 27,911,946 | | | | 0 | | | | 0 | | | | 27,911,946 | |
| | | | |
Short-term investments | | | | | | | | | | | | | | | | |
| | | | |
Investment companies | | | 126,233 | | | | 0 | | | | 0 | | | | 126,233 | |
| | | | |
U.S. Treasury securities | | | 51,848 | | | | 0 | | | | 0 | | | | 51,848 | |
| | | | |
| | | 71,760,827 | | | | 0 | | | | 0 | | | | 71,760,827 | |
| | | | |
Futures contracts | | | 552 | | | | 0 | | | | 0 | | | | 552 | |
| | | | |
Total assets | | $ | 71,761,379 | | | $ | 0 | | | $ | 0 | | | $ | 71,761,379 | |
| | | | |
Liabilities | | | | | | | | | | | | | | | | |
| | | | |
Futures contracts | | $ | 42,563 | | | $ | 0 | | | $ | 0 | | | $ | 42,563 | |
| | | | |
Total liabilities | | $ | 42,563 | | | $ | 0 | | | $ | 0 | | | $ | 42,563 | |
Additional sector, industry or geographic detail is included in the Portfolio of Investments.
Futures contracts are reported at their cumulative unrealized gains (losses) at measurement date as reported in the table following the Portfolio of Investments. For futures contracts, the current day’s variation margin is reported on the Statement of Assets and Liabilities. All other assets and liabilities are reported at their market value at measurement date.
For the year ended December 31, 2019, the Fund did not have any transfers into/out of Level 3.
4. TRANSACTIONS WITH AFFILIATES
Management fee
Funds Management, an indirect wholly owned subsidiary of Wells Fargo & Company (“Wells Fargo”), is the manager of the Fund and provides advisory and fund-level administrative services under an investment management agreement. Under the investment management agreement, Funds Management is responsible for, among other services, implementing the
Wells Fargo VT Index Asset Allocation Fund | 35
Notes to financial statements
investment objectives and strategies of the Fund, supervising the subadviser and providing fund-level administrative services in connection with the Fund’s operations. As compensation for its services under the investment management agreement, Funds Management is entitled to receive a management fee at the following annual rate based on the Fund’s average daily net assets:
| | |
| |
| Average daily net assets | | Management fee |
| |
First $500 million | | 0.600% |
| |
Next $500 million | | 0.550 |
| |
Next $2 billion | | 0.500 |
| |
Next $2 billion | | 0.475 |
| |
Next $5 billion | | 0.440 |
| |
Over $10 billion | | 0.430 |
For the year ended December 31, 2019, the management fee was equivalent to an annual rate of 0.60% of the Fund’s average daily net assets.
Funds Management has retained the services of a subadviser to provide daily portfolio management to the Fund. The fee for subadvisory services is borne by Funds Management. Wells Capital Management Incorporated (“WellsCap”), an affiliate of Funds Management and an indirect wholly owned subsidiary of Wells Fargo, is the subadviser to the Fund and is entitled to receive a fee from Funds Management at an annual rate starting at 0.15% and declining to 0.10% as the average daily net assets of the Fund increase.
Administration fee
Under a class-level administration agreement, Funds Management provides class-level administrative services to the Fund, which includes paying fees and expenses for services provided by the transfer agent,sub-transfer agents, omnibus account servicers and record-keepers. As compensation for its services under the class-level administration agreement, Funds Management receives a class level fee of 0.08% which is calculated based on the average daily net assets of Class 2 shares.
Waivers and/or expense reimbursements
Funds Management has contractually waived and/or reimbursed management and administration fees to the extent necessary to maintain certain net operating expense ratios for the Fund. Funds Management has committed through April 30, 2020 to waive fees and/or reimburse expenses to the extent necessary to cap the Fund’s expenses at 1.00% for Class 2 shares. Prior to or after the commitment expiration date, the cap may be increased or the commitment to maintain the cap may be terminated only with the approval of the Board of Trustees.
Distribution fee
The Trust has adopted a distribution plan for Class 2 shares of the Fund pursuant to Rule12b-1 under the 1940 Act. A distribution fee is charged to Class 2 shares and paid to Wells Fargo Funds Distributor, LLC, the principal underwriter, at an annual rate of 0.25% of the average daily net assets of Class 2 shares.
Interfund transactions
The Fund may purchase or sell portfolio investment securities to certain other Wells Fargo affiliates pursuant to Rule17a-7 under the 1940 Act and under procedures adopted by the Board of Trustees. The procedures have been designed to ensure that these interfund transactions, which do not incur broker commissions, are effected at current market prices.
5. INVESTMENT PORTFOLIO TRANSACTIONS
Purchases and sales of investments, excluding short-term securities, for the year ended December 31, 2019 were as follows:
| | | | | | |
Purchases at cost | | Sales proceeds |
U.S.
government | | Non-U.S.
government | | U.S.
government | | Non-U.S.
government |
| $1,171,996 | | $1,756,947 | | $1,510,471 | | $9,525,035 |
6. SECURITIES LENDING TRANSACTIONS
The Fund lends its securities through an unaffiliated securities lending agent and receives collateral in the form of cash or securities with a value at least equal to the value of the securities on loan. The value of the loaned securities is determined at the
36 | Wells Fargo VT Index Asset Allocation Fund
Notes to financial statements
close of each business day and any increases or decreases in the required collateral are exchanged between the Fund and the counterparty on the next business day. Cash collateral received is invested in the Securities Lending Fund which seeks to provide a positive return compared to the daily Fed Funds Open Rate by investing in high-quality, U.S. dollar-denominated short-term money market instruments and is exempt from registration under Section 3(c)(7) of the 1940 Act. Securities Lending Fund is managed by Funds Management and is subadvised by WellsCap. Funds Management receives an advisory fee starting at 0.05% and declining to 0.01% as the average daily net assets of the Securities Lending Fund increase. All of the fees received by Funds Management are paid to WellsCap for its services as subadviser.
In the event of counterparty default or the failure of a borrower to return a loaned security, the Fund has the right to use the collateral to offset any losses incurred. As of December 31, 2019, the Fund did not have any securities on loan.
7. DERIVATIVE TRANSACTIONS
During the year ended December 31, 2019, the Fund entered into futures contracts to gain market exposure to certain asset classes consistent with an active asset allocation strategy. The Fund had an average notional amount of $4,270,970 in long futures contracts and $2,108,223 in short futures contracts during the year ended December 31, 2019.
The cumulative unrealized gains (losses) reported in the table following the Portfolio of Investments represents the fair value of futures contracts at the end of the period. Only the current day’s variation margin as of December 31, 2019 is reported separately on the Statement of Assets and Liabilities.
The effect of derivative instruments on the Statement of Operations for the year ended December 31, 2019 was as follows for the Fund:
| | | | | | | | |
| | |
| | | Amount of realized
gains (losses) on
derivatives | | | Change in unrealized
gains (losses) on
derivatives | |
| | |
Equity risk | | $ | 129,791 | | | $ | 229,995 | |
| | |
Interest rate risk | | | (217,200 | ) | | | (23,594 | ) |
| | |
| | | $ | (87,409 | ) | | $ | 206,401 | |
8. BANK BORROWINGS
The Trust, Wells Fargo Master Trust and Wells Fargo Funds Trust (excluding the money market funds) are parties to a $280,000,000 revolving credit agreement whereby the Fund is permitted to use bank borrowings for temporary or emergency purposes, such as to fund shareholder redemption requests. Interest under the credit agreement is charged to the Fund based on a borrowing rate equal to the higher of the Federal Funds rate in effect on that day plus 1.25% or the overnight LIBOR rate in effect on that day plus 1.25%. In addition, an annual commitment fee equal to 0.25% of the unused balance is allocated to each participating fund.
For the year ended December 31, 2019, there were no borrowings by the Fund under the agreement.
9. DISTRIBUTIONS TO SHAREHOLDERS
The tax character of distributions paid during the years ended December 31, 2019 and December 31, 2018 were as follows:
| | | | | | | | |
| | | Year ended December 31 | |
| | |
| | | 2019 | | | 2018 | |
| | |
Ordinary income | | $ | 801,395 | | | $ | 788,369 | |
| | |
Long-term capital gain | | | 4,533,802 | | | | 4,889,652 | |
As of December 31, 2019, the components of distributable earnings on a tax basis were as follows:
| | | | |
Undistributed ordinary
income | | Undistributed long-term
gain | | Unrealized gains |
| | |
| $198,062 | | $5,545,700 | | $22,456,997 |
Wells Fargo VT Index Asset Allocation Fund | 37
Notes to financial statements
10. INDEMNIFICATION
Under the Trust’s organizational documents, the officers and Trustees have been granted certain indemnification rights against certain liabilities that may arise out of performance of their duties to the Trust. Additionally, in the normal course of business, the Trust may enter into contracts with service providers that contain a variety of indemnification clauses. The Trust’s maximum exposure under these arrangements is dependent on future claims that may be made against the Fund and, therefore, cannot be estimated.
11. NEW ACCOUNTING PRONOUNCEMENTS
In August 2018, FASB issued Accounting Standards Update (“ASU”)No. 2018-13, Fair Value Measurement (Topic 820)Disclosure Framework—Changes to the Disclosure Requirements for Fair Value Measurement. ASU2018-13 updates the disclosure requirements for fair value measurements by modifying or removing certain disclosures and adding certain new disclosures. The amendments are effective for fiscal years, and interim periods within those fiscal years, beginning after December 15, 2019. Early adoption is permitted. Management has adopted the removal and modification of disclosures early, as permitted, and will adopt the additional new disclosures at the effective date.
In March 2017, FASB issued ASU No. 2017-08,Premium Amortization on Purchased Callable Debt Securities. ASU 2017-08 shortens the amortization period for certain callable debt securities held at a premium and requires the premium to be amortized to the earliest call date. The amendments do not require an accounting change for securities held at a discount and discounts will continue to be accreted to the maturity date of the security. ASU 2017-08 is effective for fiscal years beginning after December 15, 2018 and for interim periods within those fiscal years. During the current reporting period, management of the Fund adopted the change in accounting policy which did not have a material impact to the Fund’s financial statements.
38 | Wells Fargo VT Index Asset Allocation Fund
Report of independent registered public accounting firm
TO THE SHAREHOLDERS OF THE FUND AND BOARD OF TRUSTEES OF WELLS FARGO VARIABLE TRUST:
Opinion on the Financial Statements
We have audited the accompanying statement of assets and liabilities of Wells Fargo VT Index Asset Allocation Fund (the Fund), one of the funds constituting Wells Fargo Variable Trust, including the portfolio of investments, as of December 31, 2019, the related statement of operations for the year then ended, the statements of changes in net assets for each of the years in the two-year period then ended, and the related notes (collectively, the financial statements) and the financial highlights for each of the years in the five-year period then ended. In our opinion, the financial statements and financial highlights present fairly, in all material respects, the financial position of the Fund as of December 31, 2019, the results of its operations for the year then ended, the changes in its net assets for each of the years in the two-year period then ended, and the financial highlights for each of the years in the five-year period then ended, in conformity with U.S. generally accepted accounting principles.
Basis for Opinion
These financial statements and financial highlights are the responsibility of the Fund’s management. Our responsibility is to express an opinion on these financial statements and financial highlights based on our audits. We are a public accounting firm registered with the Public Company Accounting Oversight Board (United States) (PCAOB) and are required to be independent with respect to the Fund in accordance with the U.S. federal securities laws and the applicable rules and regulations of the Securities and Exchange Commission and the PCAOB.
We conducted our audits in accordance with the standards of the PCAOB. Those standards require that we plan and perform the audit to obtain reasonable assurance about whether the financial statements and financial highlights are free of material misstatement, whether due to error or fraud. Our audits included performing procedures to assess the risks of material misstatement of the financial statements and financial highlights, whether due to error or fraud, and performing procedures that respond to those risks. Such procedures included examining, on a test basis, evidence regarding the amounts and disclosures in the financial statements and financial highlights. Such procedures also included confirmation of securities owned as of December 31, 2019, by correspondence with the custodian, transfer agent and brokers. Our audits also included evaluating the accounting principles used and significant estimates made by management, as well as evaluating the overall presentation of the financial statements and financial highlights. We believe that our audits provide a reasonable basis for our opinion.

We have not been able to determine the specific year that we began serving as the auditor of one or more Wells Fargo Funds investment companies; however we are aware that we have served as the auditor of one or more Wells Fargo Funds investment companies since at least 1955.
Boston, Massachusetts
February 25, 2020
Wells Fargo VT Index Asset Allocation Fund | 39
Other information (unaudited)
TAX INFORMATION
For corporate shareholders, pursuant to Section 854 of the Internal Revenue Code, 86.51% of ordinary income dividends qualify for the corporate dividends-received deduction for the fiscal year ended December 31, 2019.
Pursuant to Section 852 of the Internal Revenue Code, $4,533,802 was designated as a 20% rate gain distribution for the fiscal year ended December 31, 2019.
For the fiscal year ended December 31, 2019, 39.79% of the ordinary income distributed was derived from interest on U.S. government securities.
PROXY VOTING INFORMATION
A description of the policies and procedures used to determine how to vote proxies relating to portfolio securities is available, upon request, by calling1-800-260-5969, visiting our website atwfam.com, or visiting the SEC website at sec.gov. Information regarding how the proxies related to portfolio securities were voted during the most recent12-month period ended June 30 is available on the website atwfam.comor by visiting the SEC website at sec.gov.
QUARTERLY PORTFOLIO HOLDINGS INFORMATION
The Fund files its complete schedule of portfolio holdings with the SEC for the first and third quarters of each fiscal year as an exhibit to its reports on FormN-PORT. Shareholders may view the filed FormN-PORT by visiting the SEC website at sec.gov.
40 | Wells Fargo VT Index Asset Allocation Fund
Other information (unaudited)
BOARD OF TRUSTEES AND OFFICERS
Each of the Trustees and Officers1 listed in the table below acts in identical capacities for each fund in the Wells Fargo family of funds, which consists of 149 mutual funds comprising the Wells Fargo Funds Trust, Wells Fargo Variable Trust, Wells Fargo Master Trust and fourclosed-end funds (collectively the “Fund Complex”). This table should be read in conjunction with the Prospectus and the Statement of Additional Information2. The mailing address of each Trustee and Officer is 525 Market Street, 12th Floor, San Francisco, CA 94105. Each Trustee and Officer serves an indefinite term, however, each Trustee serves such term until reaching the mandatory retirement age established by the Trustees.
Independent Trustees
| | | | | | |
Name and
year of birth | | Position held and
length of service* | | Principal occupations during past five years or longer | | Current other
public company or
investment
company
directorships |
| | | |
William R. Ebsworth (Born 1957) | | Trustee,
since 2015 | | Retired. From 1984 to 2013, equities analyst, portfolio manager, research director and chief investment officer at Fidelity Management and Research Company in Boston, Tokyo, and Hong Kong, and retired in 2013 as Chief Investment Officer of Fidelity Strategic Advisers, Inc. where he led a team of investment professionals managing client assets. Prior thereto, Board member of Hong Kong Securities Clearing Co., Hong Kong Options Clearing Corp., the Thailand International Fund, Ltd., Fidelity Investments Life Insurance Company, and Empire Fidelity Investments Life Insurance Company. Audit Committee Chair and Investment Committee Chair of the Vincent Memorial Hospital Endowment(non-profit organization). Mr. Ebsworth is a CFA® charterholder. | | N/A |
| | | |
Jane A. Freeman (Born 1953) | | Trustee,
since 2015;
Chair Liaison, since 2018 | | Retired. From 2012 to 2014 and 1999 to 2008, Chief Financial Officer of Scientific Learning Corporation. From 2008 to 2012, Ms. Freeman provided consulting services related to strategic business projects. Prior to 1999, Portfolio Manager at Rockefeller & Co. and Scudder, Stevens & Clark. Board member of the Harding Loevner Funds from 1996 to 2014, serving as both Lead Independent Director and chair of the Audit Committee. Board member of the Russell Exchange Traded Funds Trust from 2011 to 2012 and the chair of the Audit Committee. Ms. Freeman is a Board Member of The Ruth Bancroft Garden(non-profit organization). She is also an inactive Chartered Financial Analyst. | | N/A |
| | | |
Isaiah Harris, Jr. (Born 1952) | | Trustee,
since 2009;
Audit Committee Chairman,
since 2019 | | Retired. Chairman of the Board of CIGNA Corporation since 2009, and Director since 2005. From 2003 to 2011, Director of Deluxe Corporation. Prior thereto, President and CEO of BellSouth Advertising and Publishing Corp. from 2005 to 2007, President and CEO of BellSouth Enterprises from 2004 to 2005 and President of BellSouth Consumer Services from 2000 to 2003. Emeritus member of the Iowa State University Foundation Board of Governors. Emeritus Member of the Advisory Board of Iowa State University School of Business. Advisory Board Member, Palm Harbor Academy (private school). Advisory Board Member, Child Evangelism Fellowship(non-profit). Mr. Harris is a certified public accountant (inactive status). | | CIGNA Corporation |
| | | |
Judith M. Johnson (Born 1949) | | Trustee,
since 2008;
Audit Committee Chairman, from 2009 to 2018 | | Retired. Prior thereto, Chief Executive Officer and Chief Investment Officer of Minneapolis Employees Retirement Fund from 1996 to 2008. Ms. Johnson is an attorney, certified public accountant and a certified managerial accountant. | | N/A |
Wells Fargo VT Index Asset Allocation Fund | 41
Other information (unaudited)
| | | | | | |
Name and
year of birth | | Position held and
length of service* | | Principal occupations during past five years or longer | | Current other
public company or
investment
company
directorships |
| | | |
David F. Larcker (Born 1950) | | Trustee,
since 2009 | | James Irvin Miller Professor of Accounting at the Graduate School of Business, Stanford University, Director of the Corporate Governance Research Initiative and Senior Faculty of The Rock Center for Corporate Governance since 2006. From 2005 to 2008, Professor of Accounting at the Graduate School of Business, Stanford University. Prior thereto, Ernst & Young Professor of Accounting at The Wharton School, University of Pennsylvania from 1985 to 2005. | | N/A |
| | | |
Olivia S. Mitchell (Born 1953) | | Trustee,
since 2006; Nominating and Governance Committee Chair, since 2018 | | International Foundation of Employee Benefit Plans Professor, Wharton School of the University of Pennsylvania since 1993. Director of Wharton’s Pension Research Council and Boettner Center on Pensions & Retirement Research, and Research Associate at the National Bureau of Economic Research. Previously, Cornell University Professor from 1978 to 1993. | | N/A |
| | | |
Timothy J. Penny (Born 1951) | | Trustee,
since 1996; Chairman,
since 2018 | | President and Chief Executive Officer of Southern Minnesota Initiative Foundation, anon-profit organization, since 2007. Member of the Board of Trustees of NorthStar Education Finance, Inc., anon-profit organization, since 2007. | | N/A |
| | | |
James G. Polisson (Born 1959) | | Trustee,
since 2018 | | Retired. Chief Marketing Officer, Source (ETF) UK Services, Ltd, from 2015 to 2017. From 2012 to 2015, Principal of The Polisson Group, LLC, a management consulting, corporate advisory and principal investing company. Chief Executive Officer and Managing Director at Russell Investments, Global Exchange Traded Funds from 2010 to 2012. Managing Director of Barclays Global Investors from 1998 to 2010 and Global Chief Marketing Officer for iShares and Barclays Global Investors from 2000 to 2010. Trustee of the San Francisco Mechanics’ Institute, anon-profit organization, from 2013 to 2015. Board member of the Russell Exchange Traded Fund Trust from 2011 to 2012. Director of Barclays Global Investors Holdings Deutschland GmbH from 2006 to 2009. Mr. Polisson is an attorney and has a retired status with the Massachusetts and District of Columbia Bar Associations. | | N/A |
| | | |
Pamela Wheelock3 (Born 1959) | | Trustee, since January 2020;
previously Trustee from January 2018 to July 2019 | | Board member of the Destination Medical Center Economic Development Agency, Rochester, Minnesota since 2019. Acting Commissioner, Minnesota Department of Human Services, July 2019 through September 2019. Human Services Manager (part-time), Minnesota Department of Human Services, October 2019 through December 2019. Chief Operating Officer, Twin Cities Habitat for Humanity from 2017 to 2019. Vice President of University Services, University of Minnesota from 2012 to 2016. Prior thereto, on the Board of Directors, Governance Committee and Finance Committee for the Minnesota Philanthropy Partners (Saint Paul Foundation) from 2012 to 2018, Interim Chief Executive Officer of Blue Cross Blue Shield of Minnesota from 2011 to 2012, Chairman of the Board from 2009 to 2012 and Board Director from 2003 to 2015. Vice President, Leadership and Community Engagement, Bush Foundation, Saint Paul, Minnesota (a private foundation) from 2009 to 2011. Executive Vice President and Chief Financial Officer, Minnesota Sports and Entertainment from 2004 to 2009 and Senior Vice President from 2002 to 2004. Executive Vice President of the Minnesota Wild Foundation from 2004 to 2008. Commissioner of Finance, State of Minnesota, from 1999 to 2002. Currently Board Chair of the Minnesota Wild Foundation since 2010. | | N/A |
| * | Length of service dates reflect the Trustee’s commencement of service with the Trust’s predecessor entities, where applicable. |
42 | Wells Fargo VT Index Asset Allocation Fund
Other information (unaudited)
Officers
| | | | |
Name and
year of birth | | Position held and
length of service | | Principal occupations during past five years or longer |
| | |
Andrew Owen
(Born 1960) | | President,
since 2017 | | Executive Vice President of Wells Fargo & Company and Head of Affiliated Managers, Wells Fargo Asset Management, since 2014. In addition, Mr. Owen is currently President, Chief Executive Officer and Director of Wells Fargo Funds Management, LLC since 2017. Prior thereto, Executive Vice President responsible for marketing, investments and product development for Wells Fargo Funds Management, LLC, from 2009 to 2014. |
| | |
Jeremy DePalma1 (Born 1974) | | Treasurer,
since 2012 | | Senior Vice President of Wells Fargo Funds Management, LLC since 2009. Senior Vice President of Evergreen Investment Management Company, LLC from 2008 to 2010 and head of the Fund Reporting and Control Team within Fund Administration from 2005 to 2010. |
| | |
Michelle Rhee4 (Born 1966) | | Chief Legal Officer,
since 2019 | | Secretary of Wells Fargo Funds Management, LLC, Chief Legal Counsel of Wells Fargo Asset Management and Assistant General Counsel of Wells Fargo Bank, N.A. since 2018. Associate General Counsel and Managing Director of Bank of America Corporation from 2004 to 2018. |
| | |
Catherine Kennedy5 (Born 1969) | | Secretary,
since 2019 | | Vice President of Wells Fargo Funds Management, LLC and Senior Counsel of the Wells Fargo Legal Department since 2010. Vice President and Senior Counsel of Evergreen Investment Management Company, LLC from 1998 to 2010. |
| | |
Michael H. Whitaker (Born 1967) | | Chief Compliance Officer,
since 2016 | | Chief Compliance Officer of Wells Fargo Asset Management since 2016. Senior Vice President and Chief Compliance Officer for Fidelity Investments from 2007 to 2016. |
| | |
David Berardi (Born 1975) | | Assistant Treasurer,
since 2009 | | Vice President of Wells Fargo Funds Management, LLC since 2009. Vice President of Evergreen Investment Management Company, LLC from 2008 to 2010. Manager of Fund Reporting and Control for Evergreen Investment Management Company, LLC from 2004 to 2010. |
| 1 | Jeremy DePalma acts as Treasurer of 85 funds and Assistant Treasurer of 64 funds in the Fund Complex. |
| 2 | The Statement of Additional Information includes additional information about the Trustees and is available, without charge, upon request, by calling1-800-260-5969 or by visiting the website atwfam.com. |
| 3 | Pamela Wheelock wasre-appointed to the Board effective January 1, 2020. |
| 4 | Michelle Rhee became Chief Legal Officer effective October 22, 2019. |
| 5 | Catherine Kennedy became Secretary effective October 22, 2019. |
Wells Fargo VT Index Asset Allocation Fund | 43
This page is intentionally left blank.

For more information
More information about Wells Fargo Funds is available free upon request. To obtain literature, please write, visit the Fund’s website, or call:
Wells Fargo Funds
P.O. Box 219967
Kansas City, MO 64121-9967
Website:wfam.com
Individual investors:1-800-222-8222
Retail investment professionals:1-888-877-9275
Institutional investment professionals:1-866-765-0778

This report and the financial statements contained herein are submitted for the general information of the shareholders of the Fund. If this report is used for promotional purposes, distribution of the report must be accompanied or preceded by a current prospectus. Before investing, please consider the investment objectives, risks, charges, and expenses of the investment. For a current prospectus and, if available, a summary prospectus, containing this information, call1-800-260-5969 or visit the Fund’s website atwfam.com. Read the prospectus carefully before you invest or send money.
Wells Fargo Asset Management (WFAM) is the trade name for certain investment advisory/management firms owned by Wells Fargo & Company. These firms include but are not limited to Wells Capital Management Incorporated and Wells Fargo Funds Management, LLC. Certain products managed by WFAM entities are distributed by Wells Fargo Funds Distributor, LLC (a broker-dealer and Member FINRA).
This material is for general informational and educational purposes only and is NOT intended to provide investment advice or a recommendation of any kind—including a recommendation for any specific investment, strategy, or plan.
INVESTMENT PRODUCTS: NOT FDIC INSURED ◾ NO BANK GUARANTEE ◾ MAY LOSE VALUE
© 2020 Wells Fargo & Company. All rights reserved.
PAR-0120-02374 02-20
AVT2/AR148 12-19
Annual Report
December 31, 2019
Wells Fargo
VT International Equity Fund
Beginning on January 1, 2021, as permitted by new regulations adopted by the Securities and Exchange Commission, paper copies of the Wells Fargo Funds’ annual and semi-annual shareholder reports issued after this date will no longer be sent by mail, unless you specifically request paper copies of the reports. Instead, the reports will be made available on the Funds’ website, and you will be notified by mail each time a report is posted and provided with a website address to access the report.
If you already elected to receive shareholder reports electronically, you will not be affected by this change and you need not take any action. You may elect to receive shareholder reports and other communications from the Fund electronically at any time by contacting your financial intermediary (such as a broker-dealer or bank) or, if you are a direct investor, by calling1-800-222-8222 or by enrolling at wellsfargo.com/advantagedelivery.
You may elect to receive all future reports in paper free of charge. If you invest through a financial intermediary, you can contact your financial intermediary to request that you continue to receive paper copies of your shareholder reports; if you invest directly with the Fund, you can call 1-800-222-8222. Your election to receive reports in paper will apply to all Wells Fargo Funds held in your account with your financial intermediary or, if you are a direct investor, to all Wells Fargo Funds that you hold.
|
|
|
Reduce clutter. Save trees. |
Sign up for electronic delivery of prospectuses and shareholder reports atwellsfargo.com/advantagedelivery |
The views expressed and any forward-looking statements are as of December 31, 2019, unless otherwise noted, and are those of the Fund managers and/or Wells Fargo Asset Management. Discussions of individual securities, or the markets generally, or any Wells Fargo Fund are not intended as individual recommendations. Future events or results may vary significantly from those expressed in any forward-looking statements. The views expressed are subject to change at any time in response to changing circumstances in the market. Wells Fargo Asset Management and the Fund disclaim any obligation to publicly update or revise any views expressed or forward-looking statements.
INVESTMENT PRODUCTS: NOT FDIC INSURED ◾ NO BANK GUARANTEE ◾ MAY LOSE VALUE
Wells Fargo VT International Equity Fund | 1
Letter to shareholders (unaudited)

Andrew Owen
President
Wells Fargo Funds
“Financial markets rebounded strongly to open 2019 on a positive note”
Dear Shareholder:
We are pleased to offer you this annual report for the Wells Fargo VT International Equity Fund for the12-month period that ended December 31, 2019. Despite some periods of market volatility, the year was strongly positive for financial markets as supportive central banks more than offset concerns over slowing global economic growth and international trade tensions.
Overall, both fixed-income and equity investors enjoyed healthy annual returns. For the period, U.S. stocks, based on the S&P 500 Index,1 gained 31.49% and international stocks, as measured by the MSCI ACWI ex USA Index (Net),2 returned 21.51%. The MSCI EM Index (Net)3 gained 18.42%. For bond investors, the Bloomberg Barclays U.S. Aggregate Bond Index4 added 8.72%, the Bloomberg Barclays Global Aggregateex-USD Index5 returned 5.09%, the Bloomberg Barclays Municipal Bond Index6 gained 7.54%, and the ICE BofA U.S. High Yield Index7 added 14.41%.
The year began with a strong market rebound.
After a volatile end of 2018 involving sharp losses, financial markets rebounded strongly to open 2019 on a positive note, as investors were encouraged by a sudden pivot by the U.S. Federal Reserve (Fed) to a more accommodative stance after a series of increases to the federal funds rate in 2017 and 2018. The S&P 500 Index gained 8.01% in January, the best monthly performance in 30 years. Returns for the MSCI ACWI ex USA Index (Net), the Bloomberg Barclays U.S. Aggregate Bond Index, and the Bloomberg Barclays Global Aggregateex-USD Index also were positive.
In February 2019, signs of slowing global growth grew more ominous. The Bureau of Economic Analysis announced fourth-quarter 2018 gross domestic product (GDP) grew at an annualized 2.2% rate, down from the levels of the prior two quarters. In a February report, the Bank of England forecast the slowest growth since the financial crisis for 2019. China and the U.S. continued to wrangle over trade issues. By the end of the first quarter of 2019, more accommodative Fed sentiment and steady, if not spectacular, U.S. economic and business metrics encouraged domestic investors.
Early second-quarter 2019 enthusiasm among investors faded.
During April, sustained low inflation, solid employment data, and first-quarter U.S. GDP of an annualized rate of 3.2% supported favorable sentiment. During May, markets
| 1 | The S&P 500 Index consists of 500 stocks chosen for market size, liquidity, and industry group representation. It is a market-value-weighted index with each stock’s weight in the index proportionate to its market value. You cannot invest directly in an index. |
| 2 | The Morgan Stanley Capital International (MSCI) All Country World Index (ACWI) ex USA Index (Net) is a free-float-adjusted market-capitalization-weighted index that is designed to measure the equity market performance of developed markets, excluding the United States. Source: MSCI. MSCI makes no express or implied warranties or representations and shall have no liability whatsoever with respect to any MSCI data contained herein. The MSCI data may not be further redistributed or used as a basis for other indices or any securities or financial products. This report is not approved, reviewed, or produced by MSCI. You cannot invest directly in an index. |
| 3 | The MSCI Emerging Markets (EM) Index (Net) is a free-float-adjusted market-capitalization-weighted index that is designed to measure equity market performance of emerging markets. You cannot invest directly in an index. |
| 4 | The Bloomberg Barclays U.S. Aggregate Bond Index is a broad-based benchmark that measures the investment-grade, U.S. dollar-denominated, fixed-rate taxable bond market, including Treasuries, government-related and corporate securities, mortgage-backed securities (agency fixed-rate and hybrid adjustable-rate mortgage pass-throughs), asset-backed securities, and commercial mortgage-backed securities. You cannot invest directly in an index. |
| 5 | The Bloomberg Barclays Global Aggregateex-USD Index is an unmanaged index that provides a broad-based measure of the global investment-grade fixed-income markets excluding the U.S. dollar-denominated debt market. You cannot invest directly in an index. |
| 6 | The Bloomberg Barclays Municipal Bond Index is an unmanaged index composed of long-termtax-exempt bonds with a minimum credit rating of Baa. You cannot invest directly in an index. |
| 7 | The ICE BofA U.S. High Yield Index is a market-capitalization-weighted index of domestic and Yankee high-yield bonds. The index tracks the performance of high-yield securities traded in the U.S. bond market. You cannot invest directly in an index. Copyright 2020. ICE Data Indices, LLC. All rights reserved. |
2 | Wells Fargo VT International Equity Fund
Letter to shareholders (unaudited)
tumbled on mixed investment signals. In the U.S., partisan wrangling ramped up as Democrats and Republicans set their sights on 2020 presidential politics. The U.K.’s Brexit disagreements caused Prime Minister Theresa May to resign. Boris Johnson succeeded her only to exacerbate uncertainty about Brexit’s resolution ahead of an October 2019 deadline. The European Commission downgraded the 2019 growth forecast to 1.2%. The U.S. increased tariffs on products from China, China responded, and then talks broke down. President Donald Trump threatened to turn his foreign policy tariff tool to Mexico over immigration issues.
Midway through the year, investors regrouped, sentiment turned positive, and U.S. equity markets advanced during June and July. The gains, primarily driven by geopolitical and monetary policy events, pushed equity markets to new highs. European Central Bank President Mario Draghi indicated the bank was ready to cut rates or buy more assets to prop up inflation if needed. President Trump backed off of tariff threats against Mexico and China. In the U.S., the Fed implemented a 0.25% federal funds rate cut in July.
Later in July, the U.S. reversed course and threatened to impose higher tariffs on China’s exports after talks failed. China responded with tariff threats of its own and devalued the renminbi, a move that roiled global markets. Major U.S. stock market indices closed July with the worst weekly results of the year. Bond prices gained as Treasury yields fell to multiyear lows, and the yield curve inverted at multiple points along the30-year arc.
In August, U.S.-China trade tensions continued with no signs of compromise. Evidence of a continued global economic slowdown mounted, and central banks in China, New Zealand, and Thailand cut interest rates. Industrial and manufacturing data declined in China, Canada, Japan, and Germany. Adding to global uncertainty, Italy’s prime minister resigned, many feared a crackdown in Hong Kong as protestors sustained their calls for reform, and Boris Johnson planned to suspend Parliament as Brexit’s deadline neared.
In the U.S., the Fed cut interest rates a second time in September. U.S. manufacturing data disappointed investors. The U.S. Congress announced it would pursue an impeachment investigation of President Trump. Meanwhile, the Brexit impasse showed no signs of resolution. Officials in China said that hitting the country’s economic growth goals for the year would be difficult considering the weight of tariffs and trade restrictions. Although the S&P 500 Index finished the third quarter with the bestyear-to-date returns in more than 20 years, concerns about future returns remained.
The fourth quarter started on a strong note, with U.S.-China trade tensions relaxing in October 2019 along with renewed optimism for a U.K. Brexit deal and positive macroeconomic data. The initial estimate of U.S. third-quarter GDP growth was a resilient 1.9% annualized rate, while the U.S. unemployment rate fell to a50-year low of 3.5% in September. However, despite resilience among U.S. consumers, business confidence declined while manufacturing activity contracted. Concerned with a potential economic slowdown, the Fed lowered interest rates another quarter point in late October, its third rate cut in four months. This helped push the S&P 500 Index to a newall-time high, while emerging market equities rallied and global bonds declined overall, reflecting a broad pickup in risk appetite.
Equity markets continued to rally in November despite ongoing geopolitical risks. Hopes for a U.S.-China trade deal buoyed investor confidence. U.S. business sentiment improved slightly, and manufacturing and services activity picked up. Throughout the month, central bank actions were on hold. With that positive backdrop, developed market equities outpaced those in emerging markets, and U.S. stocks, as reflected by the S&P 500 Index, outperformednon-U.S. stocks overall. While consumer confidence and purchasing manager activity rose in the eurozone, China reported weakening manufacturing and consumer data. Bond yields rose marginally, leading to slightly negative returns for global government and investment-grade corporate bonds.
“Equity markets continued to rally in November despite ongoing geopolitical risks.”
Wells Fargo VT International Equity Fund | 3
Letter to shareholders (unaudited)
Financial markets ended the year on a broadly positive note, with the U.S. and China reaching an accord on a Phase One trade deal, with some details to be worked out. That, along with the landslide win by the pro-Brexit U.K. Conservative Party in a national election and ongoing central bank support, gave investors greater certainty and confidence. U.S. economic indicators were generally positive, with the exception of manufacturing activity and business confidence. However, consumer confidence was resilient, fed by a robust labor market, tame inflation, and lower interest rates, which boosted housing affordability and stimulated homebuyer activity. The impeachment of U.S. President Donald Trump, while historically noteworthy, had little impact on markets. Meanwhile, slowing Chinese economic activity, partly attributable to the trade war, led to further government stimulus atyear-end through lower reserve ratios, allowing banks to lend more money.
Don’t let short-term uncertainty derail long-term investment goals.
Periods of investment uncertainty can present challenges, but experience has taught us that maintaining long-term investment goals can be an effective way to plan for the future. To help you create a sound strategy based on your personal goals and risk tolerance, Wells Fargo Funds offers more than 100 mutual funds spanning a wide range of asset classes and investment styles. Although diversification cannot guarantee an investment profit or prevent losses, we believe it can be an effective way to manage investment risk and potentially smooth out overall portfolio performance. We encourage investors to know their investments and to understand that appropriate levels of risk-taking may unlock opportunities.
Thank you for choosing to invest with Wells Fargo Funds. We appreciate your confidence in us and remain committed to helping you meet your financial needs.
Sincerely,

Andrew Owen
President
Wells Fargo Funds
|
|
|
For further information about your Fund, contact your investment professional, visit our website at wfam.com, or call us directly at1-800-260-5969. |
4 | Wells Fargo VT International Equity Fund
This page is intentionally left blank.
Performance highlights (unaudited)
Investment objective
The Fund seeks long-term capital appreciation.
Manager
Wells Fargo Funds Management, LLC
Subadviser
Wells Capital Management Incorporated
Portfolio managers
Venkateshwar (Venk) Lal
Dale A. Winner, CFA®‡
Average annual total returns (%) as of December 31, 20191
| | | | | | | | | | | | | | | | | | | | | | |
| | | | | |
| | | | | | | | | | | | | | Expense ratios2 (%) | |
| | | | | | |
| | | Inception date | | 1 year | | | 5 year | | | 10 year | | | Gross | | | Net3 | |
| | | | | | | |
| Class 1 | | 8-17-1998 | | | 15.50 | * | | | 4.84 | | | | 5.23 | | | | 1.07 | | | | 0.70 | |
| | | | | | | |
| Class 2 | | 7-31-2002 | | | 15.49 | * | | | 4.55 | | | | 4.99 | | | | 1.32 | | | | 0.95 | |
| | | | | | | |
| MSCI ACWI ex USA Index (Net)4 | | – | | | 21.51 | | | | 5.51 | | | | 4.97 | | | | – | | | | – | |
| * | Total return differs from the return in the Financial Highlights in this report. The total return presented is calculated based on the NAV at which the shareholder transactions were processed. The NAV and total return presented in the Financial Highlights reflects certain adjustments made to the net assets of the Fund that are necessary under U.S. generally accepted accounting principles. |
Figures quoted represent past performance, which is no guarantee of future results. Investment return and principal value of an investment will fluctuate so that an investor’s shares, when redeemed, may be worth more or less than their original cost. Current performance may be lower or higher than the performance data quoted and assumes the reinvestment of dividends and capital gains. Currentmonth-end performance is available by calling1-800-260-5969. Performance figures of the Fund do not reflect fees and expenses charged pursuant to the terms of variable life insurance policies and variable annuity contracts. If these fees and expenses had been reflected, performance would have been lower.
Shares are sold without afront-end sales charge or contingent deferred sales charge.
Index returns do not include transaction costs associated with buying and selling securities, any mutual fund fees or expenses, or any taxes. It is not possible to invest directly in an index.
Stock values fluctuate in response to the activities of individual companies and general market and economic conditions. Foreign investments are especially volatile and can rise or fall dramatically due to differences in the political and economic conditions of the host country. These risks are generally intensified in emerging markets. The use of derivatives may reduce returns and/or increase volatility. Certain investment strategies tend to increase the total risk of an investment (relative to the broader market). The Fund is exposed to smaller-company securities risk. Consult the Fund’s prospectus for additional information on these and other risks.
Please refer to the prospectus provided by your participating insurance company for detailed information describing the separate accounts for information regarding surrender charges, mortality and expense risk fees, and other charges that may be assessed by the participating insurance companies.
Please see footnotes on page 7.
6 | Wells Fargo VT International Equity Fund
Performance highlights (unaudited)
|
|
| Growth of $10,000 investment as of December 31, 20195 |
|
|
| ‡ | CFA® and Chartered Financial Analyst® are trademarks owned by CFA Institute. |
| 1 | Historical performance prior to July 19, 2010 is based on the performance of the Fund’s predecessor, Evergreen VA International Equity Fund. |
| 2 | Reflects the expense ratios as stated in the most recent prospectuses, which include the impact of 0.01% in acquired fund fees and expenses. The expense ratios shown are subject to change and may differ from the annualized expense ratios shown in the financial highlights of this report, which do not include acquired fund fees and expenses. |
| 3 | The manager has contractually committed through April 30, 2020, to waive fees and/or reimburse expenses to the extent necessary to cap total annual fund operating expenses after fee waivers at 0.69% for Class 1 and 0.94% for Class 2. Brokerage commissions, stamp duty fees, interest, taxes, acquired fund fees and expenses (if any), and extraordinary expenses are excluded from the expense cap. Prior to or after the commitment expiration date, the cap may be increased or the commitment to maintain the cap may be terminated only with the approval of the Board of Trustees. Without this cap, the Fund’s returns would have been lower. The expense ratio paid by an investor is the net expense ratio (the total annual fund operating expenses after fee waivers) as stated in the prospectuses. |
| 4 | The Morgan Stanley Capital International (MSCI) All Country World Index (ACWI) ex USA Index (Net) is a free-float-adjusted market-capitalization-weighted index that is designed to measure the equity market performance of developed markets, excluding the United States. Source: MSCI. MSCI makes no express or implied warranties or representations and shall have no liability whatsoever with respect to any MSCI data contained herein. The MSCI data may not be further redistributed or used as a basis for other indexes or any securities or financial products. This report is not approved, reviewed, or produced by MSCI. You cannot invest directly in an index. |
| 5 | The chart compares the performance of Class 2 shares for the most recent ten years with the MSCI ACWI ex USA Index (Net). The chart assumes a hypothetical $10,000 investment and reflects all operating expenses of the Fund but does not reflect fees and expenses charged pursuant to the terms of variable life insurance policies and variable annuity contracts. |
| 6 | The ten largest holdings, excluding cash and cash equivalents and any money market funds, are calculated based on the value of the investments divided by total net assets of the Fund. Holdings are subject to change and may have changed since the date specified. |
| 7 | The MSCI World Index (Net) is a free-float-adjusted market-capitalization-weighted index that is designed to measure the equity market performance of developed markets. You cannot invest directly in an index. |
| 8 | The MSCI Emerging Markets (EM) Index (Net) is a free-float-adjusted market-capitalization-weighted index that is designed to measure equity market performance of emerging markets. You cannot invest directly in an index. |
| 9 | The MSCI ACWI ex USA Growth Index measures the equity market performance of the large- andmid-cap securities exhibiting overall growth style characteristics across developed and emerging market countries, excluding the United States. The growth investment style characteristics for index construction are defined using five variables: long-term forwardearnings-per-share (EPS) growth rate, short-term forward EPS growth rate, current internal growth rate, long-term historical EPS growth trend, and long-term historical sales per share growth trend. You cannot invest directly in an index. |
| 10 | The MSCI ACWI ex USA Value Index measures the equity market performance of the large- and mid-cap securities exhibiting overall growth style characteristics across developed and emerging market countries, excluding the United States. The growth investment style characteristics for index construction are defined using five variables: long-term forward earnings-per-share (EPS) growth rate, short-term forward EPS growth rate, current internal growth rate, long-term historical EPS growth trend, and long-term historical sales per share growth trend. You cannot invest directly in an index. |
| 11 | Amounts are calculated based on the total long-term investments of the Fund. These amounts are subject to change and may have changed since the date specified. |
| 12 | The MSCI ACWI Index is a free-float-adjusted market-capitalization-weighted index that is designed to measure the equity market performance of developed and emerging markets. You cannot invest directly in an index. |
| 13 | The Purchasing Managers’ Index (PMI) is an index of the prevailing direction of economic trends in the manufacturing and service sectors. You cannot invest directly in an index. |
Wells Fargo VT International Equity Fund | 7
Performance highlights (unaudited)
MANAGER’S DISCUSSION
Fund highlights
| ∎ | | The Fund underperformed the MSCI ACWI ex USA Index (Net) for the12-month period that ended December 31, 2019. |
| ∎ | | Communication services, financials, and information technology were relative performance laggards. Consumer staples, industrials, and consumer discretionary were notable contributors to performance. |
| ∎ | | The Fund remained overweight Europe, including overweights to the Netherlands, the U.K., and Italy, partly offset by average underweights to France, Spain, and Switzerland. The Fund was underweight Asia on a regional basis, including underweights to Australia, Taiwan, and India, partly offset by overweights to Singapore, Malaysia, and China/Hong Kong. |
| | | | |
|
| Ten largest holdings(%) as of December 31, 20196 | |
| | |
Hitachi Limited | | | 3.39 | |
| | |
Smiths Group plc | | | 3.38 | |
| | |
LafargeHolcim Limited | | | 3.34 | |
| | |
Lundin Mining Corporation | | | 3.25 | |
| | |
Midea Group Company Limited Class A | | | 3.04 | |
| | |
Den Norske Bank ASA | | | 2.97 | |
| | |
Compagnie de Saint-Gobain SA | | | 2.88 | |
| | |
John Wood Group plc | | | 2.85 | |
| | |
Takeda Pharmaceutical Company Limited | | | 2.82 | |
| | |
Daiwa Securities Group Incorporated | | | 2.77 | |
International markets finished the year strongly, with the MSCI ACWI ex USA Index (Net) returning 8.9% in the fourth quarter as fears of an imminent U.S. recession faded and the U.S. and China agreed to details of a Phase One trade deal. Also, a win by the Conservative Party in the U.K. provided more clarity on Brexit. These events among others in 2019, including a stark reversal in U.S. Federal Reserve (Fed) policy and the start of more accommodative global monetary policy, resulted in a full-year index return of 21.5%, more than recouping the 14.2% decline in 2018. In this environment, global purchasing managers’ indices rebounded, potentially signaling the end of a global manufacturing recession as cyclicals outperformed defensive stocks. Developed market equities, represented
by the MSCI World Index (Net)7 returned 26.6%, outperforming emerging markets, represented by the MSCI EM Index (Net)8, which returned 18.4%. Overall, traditional value sectors underperformed growth during the year, illustrated by the MSCI ACWI ex USA Growth Index9, which outpaced the MSCI ACWI ex USA Value Index10 by more than 10 percentage points, 27.3% to 15.7%, the highest calendar-year outperformance for growth versus value since MSCI introduced the subindices in 1997.
Our investment and risk management process of findingnon-consensus undervalued equities, marrying core micro stock picking with macro risk management in each region of the globe, resulted in shifts to sector and country allocations. This included an increase in exposure to consumer discretionary, materials, Japan, and U.S. companies that derive most of their revenue from international markets. We also reduced allocations to financials, energy, Germany, and Brazil. Notable position changes included the addition of LafargeHolcim, a Swiss-based global building materials company, with self-help catalysts from its new CEO and CFO including cost-cutting, targeted portfolio reshaping, and cyclical catalysts, and Midea Group, the world’s largest producer of home appliances, representing undervalued earnings growth supported by dominant market share and strong industry growth. The Fund notably exited Sasol, with its investment thesis—based on the operationalde-risking of the Lake Charles Chemical Project—no longer intact, and trimmed Cosan due to a reduction in thesis conviction, as many tenets of the value-with-catalysts thesis have played out.
|
|
| Sector distribution as of December 31, 201911 |
|
 |
|
|
| Country allocation as of December 31, 201911 |
|
 |
Please see footnotes on page 7.
8 | Wells Fargo VT International Equity Fund
Performance highlights (unaudited)
Weakness in China/Hong Kong, South Africa, and the U.K. offset annual gains. Detractors included China Mobile and China Everbright. China Mobile, anon-consensus, undervalued Chinese telecom offering an attractive yield, reported mixed unaudited third-quarter results with slightly lower revenues and lower-than-expected net profits. However, growth of earnings before interest, taxes, depreciation, and amortization is turning more positive, confirmations of imminent 5G launches are expected to grow revenues, capital expenditure guidance is stable, and the company has committed to a stable dividend. We exited China Everbright, a leading Chinese cross-border investment and asset management company, given a low thesis conviction, poor management transparency, low liquidity, and a lack of Chinese financial stimulus.
Over the past 12 months, contributions to performance were driven largely by stock selection in Canada, Brazil, and Russia. Home Capital, anon-consensus, undervalued Canadian mortgage lender inAlt-A lending, returned excess capital via a stock buyback in an effort to improve its return on equity. It posted strong third-quarter results with all metrics beating expectations. Lundin Mining, anon-consensus, undervalued Canadian miner with a strong balance sheet, beat third-quarter expectations. It had better copper production/grades out of its Candelaria and Chapada mines, and its Eagle East mine was mined at the beginning of September, ahead of schedule and budget.
Our short-term outlook remains neutral. First, we view sentiment as mixed. Relative strength indicators finished the period in overvalued territory for the MSCI ACWI Index12; and cyclical stocks outperformed the overall market after the summer flight to perceived safety in bonds, gold, and quality in what has been a flowless equity rally, with net flows into bonds versus equities. Second, global earnings peaked in March 2019 and earnings revisions turned negative, but the global PMI13 (51.7) reflects that the synchronized global slowdown may have troughed, with the global services PMI(52.1) still hovering in expansionary territory while the global manufacturing PMI (50.1) emerged from a contraction with two consecutive months above 50. Third, we see the potential for easier monetary policy as the Fed ended quantitative tightening in September and cut rates for the third time this year in October while the European Central Bank restarted quantitative easing in November and introduced a third wave of targeted longer-term refinancing operations.
Our longer-term international outlook remains neutral. First, we believe stock valuations are in line to slightly above long-term averages. The price/book ratio for the MSCI ACWI Indexre-rated from 1.2% in 2008 to 2.3% in 2017 and now stands at 2.4%. We believe the index’s dividend yield is relatively attractive, offering 2.4%, versus bond yields ranging from-0.3% on10-year government bonds in Germany to 1.9% in the U.S. Second, global growth is no longer synchronized, as U.S. growth spiked in the first half of 2018 from tax and fiscal stimulus coupled with a global soft patch driven by deliberate deleveraging from China, political risk in Europe, and lingering U.S.-China trade uncertainty. That being said, we believe there is a low risk of a U.S. recession over the next year or two, despite a flat yield curve, given that real rates are negative, consumers are strong, and there is potential for Chinese stimulus and/or a resolution on U.S.-China trade tensions. Third, central banks remain accommodative given theU-turn in Fed policy, negative to zero interest rates in Japan and Europe, a restart of quantitative easing in Europe, and the potential for broad global fiscal stimulus.
Please see footnotes on page 7.
Wells Fargo VT International Equity Fund | 9
Fund expenses (unaudited)
As a shareholder of the Fund, you incur ongoing costs, including management fees, distribution(12b-1) fees, and other Fund expenses. This example is intended to help you understand your ongoing costs (in dollars) of investing in the Fund and to compare these costs with the ongoing costs of investing in other mutual funds.
The example is based on an investment of $1,000 invested at the beginning of thesix-month period and held for the entire period from July 1, 2019 to December 31, 2019.
Actual expenses
The “Actual” line of the table below provides information about actual account values and actual expenses. You may use the information in this line, together with the amount you invested, to estimate the expenses that you paid over the period. Simply divide your account value by $1,000 (for example, an $8,600 account value divided by $1,000 = 8.6), then multiply the result by the number in the “Actual” line under the heading entitled “Expenses Paid During Period” for your applicable class of shares to estimate the expenses you paid on your account during this period.
Hypothetical example for comparison purposes
The “Hypothetical” line of the table below provides information about hypothetical account values and hypothetical expenses based on the Fund’s actual expense ratio and an assumed rate of return of 5% per year before expenses, which is not the Fund’s actual return. The hypothetical account values and expenses may not be used to estimate the actual ending account balance or expenses you paid for the period. You may use this information to compare the ongoing costs of investing in the Fund and other funds. To do so, compare this 5% hypothetical example with the 5% hypothetical examples that appear in the shareholder reports of the other funds.
Please note that the expenses shown in the table are meant to highlight your ongoing costs only and do not reflect any separate account charges assessed by participating insurance companies. Therefore, the “Hypothetical” line of the table is useful in comparing ongoing costs only, and will not help you determine the relative total costs of owning different funds. In addition, if these separate account charges assessed by participating insurance companies were included, your costs would have been higher.
| | | | | | | | | | | | | | | | |
| | | Beginning
account value
7-1-2019 | | | Ending
account value
12-31-2019 | | | Expenses
paid during
the period¹ | | | Annualized net
expense ratio | |
| | | | | |
Class 1 | | | | | | | | | | | | | | | | |
| | | | |
Actual | | $ | 1,000.00 | | | $ | 1,041.71 | | | $ | 3.55 | | | | 0.69 | % |
| | | | |
Hypothetical (5% return before expenses) | | $ | 1,000.00 | | | $ | 1,021.73 | | | $ | 3.51 | | | | 0.69 | % |
| | | | | |
Class 2 | | | | | | | | | | | | | | | | |
| | | | |
Actual | | $ | 1,000.00 | | | $ | 1,039.75 | | | $ | 4.83 | | | | 0.94 | % |
| | | | |
Hypothetical (5% return before expenses) | | $ | 1,000.00 | | | $ | 1,020.47 | | | $ | 4.78 | | | | 0.94 | % |
| 1 | Expenses paid is equal to the annualized net expense ratio of each class multiplied by the average account value over the period, multiplied by the number of days in the most recent fiscal half-year divided by the number of days in the fiscal year (to reflect theone-half year period). |
10 | Wells Fargo VT International Equity Fund
Portfolio of investments—December 31, 2019
| | | | | | | | | | | | | | | | |
| | | | | | | | | Shares | | | Value | |
| Common Stocks: 97.31% | | | | | | | | | | | | | | | | |
| | | | |
Australia: 0.34% | | | | | | | | | | | | | | | | |
Origin Energy Limited (Energy, Oil, Gas & Consumable Fuels) | | | | | | | | | | | 46,430 | | | $ | 275,320 | |
| | | | | | | | | | | | | | | | |
| | | | |
| Brazil: 0.22% | | | | | | | | | | | | |
Cosan Limited Class A (Energy, Oil, Gas & Consumable Fuels) † | | | | | | | | | | | 7,978 | | | | 182,218 | |
| | | | | | | | | | | | | | | | |
| | | | |
| Canada: 4.43% | | | | | | | | | | | | |
Home Capital Group Incorporated (Financials, Thrifts & Mortgage Finance) † | | | | | | | | | | | 38,100 | | | | 967,060 | |
Lundin Mining Corporation (Materials, Metals & Mining) | | | | | | | | | | | 444,251 | | | | 2,654,798 | |
| | | | |
| | | | | | | | | | | | | | | 3,621,858 | |
| | | | | | | | | | | | | | | | |
| | | | |
| China: 9.99% | | | | | | | | | | | | |
Alibaba Group Holding Limited ADR (Consumer Discretionary, Internet & Direct Marketing Retail) † | | | | | | | | | | | 6,641 | | | | 1,408,556 | |
China Mobile Limited (Communication Services, Wireless Telecommunication Services) | | | | | | | | | | | 130,500 | | | | 1,096,948 | |
HollySys Automation Technologies Limited (Information Technology, Electronic Equipment, Instruments & Components) | | | | | | | | | | | 99,724 | | | | 1,636,471 | |
Midea Group Company Limited Class A (Consumer Discretionary, Household Durables) | | | | | | | | | | | 297,398 | | | | 2,486,962 | |
Shanghai Pharmaceuticals Holding Company Limited H Shares (Health Care, Health Care Providers & Services) | | | | | | | | | | | 790,500 | | | | 1,537,926 | |
| | | | |
| | | | | | | | | | | | | | | 8,166,863 | |
| | | | | | | | | | | | | | | | |
| | | | |
| France: 4.28% | | | | | | | | | | | | |
Compagnie de Saint-Gobain SA (Industrials, Building Products) | | | | | | | | | | | 57,394 | | | | 2,349,828 | |
Orange SA (Communication Services, Diversified Telecommunication Services) | | | | | | | | | | | 78,176 | | | | 1,150,493 | |
| | | | |
| | | | | | | | | | | | | | | 3,500,321 | |
| | | | | | | | | | | | | | | | |
| | | | |
| Germany: 4.69% | | | | | | | | | | | | |
Metro AG (Consumer Staples, Food & Staples Retailing) | | | | | | | | | | | 40,605 | | | | 653,382 | |
Muenchener Rueckversicherungs Gesellschaft AG (Financials, Insurance) | | | | | | | | | | | 2,780 | | | | 820,358 | |
Rheinmetall AG (Industrials, Industrial Conglomerates) | | | | | | | | | | | 3,336 | | | | 382,512 | |
SAP SE (Information Technology, Software) | | | | | | | | | | | 7,985 | | | | 1,074,766 | |
Siemens AG (Industrials, Industrial Conglomerates) | | | | | | | | | | | 6,894 | | | | 900,298 | |
| | | | |
| | | | | | | | | | | | | | | 3,831,316 | |
| | | | | | | | | | | | | | | | |
| | | | |
| Hong Kong: 2.13% | | | | | | | | | | | | |
Xinyi Glass Holdings Limited (Consumer Discretionary, Auto Components) | | | | | | | | | | | 1,318,000 | | | | 1,745,539 | |
| | | | | | | | | | | | | | | | |
| | | | |
| India: 1.63% | | | | | | | | | | | | |
Zee Entertainment Enterprises Limited (Communication Services, Media) | | | | | | | | | | | 326,490 | | | | 1,336,549 | |
| | | | | | | | | | | | | | | | |
| | | | |
| Ireland: 1.91% | | | | | | | | | | | | |
Greencore Group plc (Consumer Staples, Food Products) | | | | | | | | | | | 440,342 | | | | 1,562,599 | |
| | | | | | | | | | | | | | | | |
| | | | |
| Israel: 2.59% | | | | | | | | | | | | |
Check Point Software Technologies Limited (Information Technology, Software) † | | | | | | | | | | | 19,053 | | | | 2,114,121 | |
| | | | | | | | | | | | | | | | |
| | | | |
| Italy: 5.41% | | | | | | | | | | | | |
Eni SpA (Energy, Oil, Gas & Consumable Fuels) | | | | | | | | | | | 142,227 | | | | 2,208,960 | |
Prysmian SpA (Industrials, Electrical Equipment) | | | | | | | | | | | 91,846 | | | | 2,217,091 | |
| | | | |
| | | | | | | | | | | | | | | 4,426,051 | |
| | | | | | | | | | | | | | | | |
| | | | |
| Japan: 13.20% | | | | | | | | | | | | |
Alps Electric Company Limited (Information Technology, Electronic Equipment, Instruments & Components) | | | | | | | | | | | 52,700 | | | | 1,196,254 | |
Daiwa Securities Group Incorporated (Financials, Capital Markets) | | | | | | | | | | | 448,000 | | | | 2,261,688 | |
The accompanying notes are an integral part of these financial statements.
Wells Fargo VT International Equity Fund | 11
Portfolio of investments—December 31, 2019
| | | | | | | | | | | | | | | | |
| | | | | | | | | Shares | | | Value | |
| Japan (continued) | |
Hitachi Limited (Information Technology, Electronic Equipment, Instruments & Components) | | | | | | | | | | | 65,700 | | | $ | 2,772,260 | |
Mitsubishi UFJ Financial Group Incorporated (Financials, Banks) | | | | | | | | | | | 418,100 | | | | 2,260,388 | |
Takeda Pharmaceutical Company Limited (Health Care, Pharmaceuticals) | | | | | | | | | | | 58,200 | | | | 2,301,937 | |
| | | | |
| | | | | | | | | | | | | | | 10,792,527 | |
| | | | | | | | | | | | | | | | |
| | | | |
| Malaysia: 2.18% | | | | | | | | | | | | |
CIMB Group Holdings Bhd (Financials, Banks) | | | | | | | | | | | 1,416,504 | | | | 1,783,399 | |
| | | | | | | | | | | | | | | | |
| | | | |
| Netherlands: 5.61% | | | | | | | | | | | | |
Koninklijke Philips NV (Industrials, Industrial Conglomerates) | | | | | | | | | | | 28,899 | | | | 1,410,745 | |
NN Group NV (Financials, Insurance) | | | | | | | | | | | 41,455 | | | | 1,572,632 | |
OCI NV (Materials, Chemicals) † | | | | | | | | | | | 76,216 | | | | 1,602,965 | |
| | | | |
| | | | | | | | | | | | | | | 4,586,342 | |
| | | | | | | | | | | | | | | | |
| | | | |
| Norway: 2.97% | | | | | | | | | | | | |
Den Norske Bank ASA (Financials, Banks) | | | | | | | | | | | 129,846 | | | | 2,429,795 | |
| | | | | | | | | | | | | | | | |
| | | | |
| Russia: 2.14% | | | | | | | | | | | | |
Mobile TeleSystems PJSC ADR (Communication Services, Wireless Telecommunication Services) | | | | | | | | | | | 172,520 | | | | 1,751,078 | |
| | | | | | | | | | | | | | | | |
| | | | |
| Singapore: 2.43% | | | | | | | | | | | | |
Keppel Corporation Limited (Industrials, Industrial Conglomerates) | | | | | | | | | | | 395,200 | | | | 1,989,296 | |
| | | | | | | | | | | | | | | | |
| | | | |
| South Korea: 4.71% | | | | | | | | | | | | |
Hana Financial Group Incorporated (Financials, Banks) | | | | | | | | | | | 16,460 | | | | 523,560 | |
Samsung Electronics Company Limited GDR (Information Technology, Technology Hardware, Storage & Peripherals) 144A | | | | | | | | | | | 1,834 | | | | 2,187,962 | |
SK Telecom Company Limited (Communication Services, Wireless Telecommunication Services) | | | | | | | | | | | 5,532 | | | | 1,139,860 | |
| | | | |
| | | | | | | | | | | | | | | 3,851,382 | |
| | | | | | | | | | | | | | | | |
| | | | |
| Switzerland: 5.08% | | | | | | | | | | | | |
LafargeHolcim Limited (Materials, Construction Materials) | | | | | | | | | | | 49,264 | | | | 2,733,042 | |
Novartis AG (Health Care, Pharmaceuticals) | | | | | | | | | | | 15,012 | | | | 1,421,480 | |
| | | | |
| | | | | | | | | | | | | | | 4,154,522 | |
| | | | | | | | | | | | | | | | |
| | | | |
| Thailand: 2.32% | | | | | | | | | | | | |
Siam Commercial Bank plc (Financials, Banks) | | | | | | | | | | | 464,900 | | | | 1,900,113 | |
| | | | | | | | | | | | | | | | |
| | | | |
| United Kingdom: 14.80% | | | | | | | | | | | | |
BP plc (Energy, Oil, Gas & Consumable Fuels) | | | | | | | | | | | 299,175 | | | | 1,868,890 | |
Fresnillo plc (Materials, Metals & Mining) « | | | | | | | | | | | 76,620 | | | | 649,744 | |
John Wood Group plc (Energy, Energy Equipment & Services) | | | | | | | | | | | 441,519 | | | | 2,330,571 | |
Kingfisher plc (Consumer Discretionary, Specialty Retail) | | | | | | | | | | | 324,564 | | | | 932,921 | |
Man Group plc (Financials, Capital Markets) | | | | | | | | | | | 236,447 | | | | 494,852 | |
Melrose Industries plc (Industrials, Electrical Equipment) | | | | | | | | | | | 628,465 | | | | 1,998,748 | |
Sensata Technologies Holding plc (Industrials, Electrical Equipment) † | | | | | | | | | | | 19,745 | | | | 1,063,663 | |
Smiths Group plc (Industrials, Industrial Conglomerates) | | | | | | | | | | | 123,557 | | | | 2,761,005 | |
| | | | |
| | | | | | | | | | | | | | | 12,100,394 | |
| | | | | | | | | | | | | | | | |
| | | | |
| United States: 4.25% | | | | | | | | | | | | |
Berry Global Group Incorporated (Materials, Containers & Packaging) † | | | | | | | | | | | 42,783 | | | | 2,031,765 | |
Gentex Corporation (Consumer Discretionary, Auto Components) | | | | | | | | | | | 49,852 | | | | 1,444,713 | |
| | | | |
| | | | | | | | | | | | | | | 3,476,478 | |
| | | | | | | | | | | | | | | | |
| |
Total Common Stocks (Cost $78,585,990) | | | | 79,578,081 | |
| | | | | | | | | | | | | | | | |
The accompanying notes are an integral part of these financial statements.
12 | Wells Fargo VT International Equity Fund
Portfolio of investments—December 31, 2019
| | | | | | | | | | | | | | | | |
| | | Yield | | | | | | Shares | | | Value | |
| Short-Term Investments: 2.61% | |
|
| Investment Companies: 2.61% | |
Securities Lending Cash Investments LLC (l)(r)(u) | | | 1.73 | % | | | | | | | 664,243 | | | $ | 664,309 | |
Wells Fargo Government Money Market Fund Select Class (l)(u) | | | 1.55 | | | | | | | | 1,474,228 | | | | 1,474,228 | |
| |
Total Short-Term Investments (Cost $2,138,537) | | | | 2,138,537 | |
| | | | | | | | | | | | | | | | |
| | | | | | | | |
| Total investments in securities (Cost $80,724,527) | | | 99.92 | % | | | 81,716,618 | |
| | |
Other assets and liabilities, net | | | 0.08 | | | | 62,734 | |
| | | | | | | | |
| Total net assets | | | 100.00 | % | | $ | 81,779,352 | |
| | | | | | | | |
| † | Non-income-earning security |
| 144A | The security may be resold in transactions exempt from registration, normally to qualified institutional buyers, pursuant to Rule 144A under the Securities Act of 1933. |
| « | All or a portion of this security is on loan. |
| (l) | The issuer of the security is an affiliated person of the Fund as defined in the Investment Company Act of 1940. |
| (r) | The investment is anon-registered investment company purchased with cash collateral received from securities on loan. |
| (u) | The rate represents the7-day annualized yield at period end. |
Abbreviations:
| ADR | American depositary receipt |
| GDR | Global depositary receipt |
Forward Foreign Currency Contracts
| | | | | | | | | | | | | | |
Currency to be received | | Currency to be delivered | | Counterparty | | Settlement
date | | Unrealized gains | | | Unrealized losses | |
| | | | | |
| 1,130,477 USD | | 1,012,200 EUR | | Credit Suisse | | 3-9-2020 | | $ | 0 | | | $ | (9,592 | ) |
| | | | | |
| 934,692 USD | | 837,500 EUR | | Credit Suisse | | 3-9-2020 | | | 0 | | | | (8,607 | ) |
| | | | | |
| 868,050 GBP | | 1,160,696 USD | | Morgan Stanley | | 3-9-2020 | | | 0 | | | | (8,783 | ) |
| | | | | |
| 1,736,200 GBP | | 2,350,056 USD | | Morgan Stanley | | 3-9-2020 | | | 0 | | | | (46,097 | ) |
| | | | | |
| 868,050 GBP | | 1,142,057 USD | | Morgan Stanley | | 3-9-2020 | | | 9,856 | | | | 0 | |
| | | | | |
| 4,582,763 USD | | 3,472,300 GBP | | Morgan Stanley | | 3-9-2020 | | | 0 | | | | (25,022 | ) |
| | | | | | | | | | | | | | |
| | | | | |
| | | | | | | | $ | 9,856 | | | $ | (98,101 | ) |
| | | | | | | | | | | | | | |
Investments in Affiliates
An affiliated investment is an investment in which the Fund owns at least 5% of the outstanding voting shares of the issuer or as a result of other relationships, such as the Fund and the issuer having the same investment manager. Transactions with issuers that were either affiliated persons of the Fund at the beginning of the period or the end of the period were as follows:
| | | | | | | | | | | | | | | | | | | | | | | | | | | | | | | | | | | | |
| | | Shares, beginning of period | | | Shares purchased | | | Shares sold | | | Shares, end of period | | | Net
realized
gains
(losses) | | | Net
change in unrealized gains (losses) | | | Income from affiliated securities | | | Value, end of
period | | | % of
net
assets | |
| | | | | | | | | |
| Short-Term Investments | | | | | | | | | | | | | | | | | | | | | | | | | | | |
Investment Companies | | | | | | | | | | | | | | | | | | | | | | | | | | | | | | | | | | | | |
Securities Lending Cash Investments LLC | | | 2,226,041 | | | | 20,373,481 | | | | (21,935,279 | ) | | | 664,243 | | | $ | (66 | ) | | $ | 0 | | | $ | 23,777 | # | | $ | 664,309 | | | | | |
Wells Fargo Government Money Market Fund Select Class | | | 1,610,597 | | | | 26,288,774 | | | | (26,425,143 | ) | | | 1,474,228 | | | | 0 | | | | 0 | | | | 33,139 | | | | 1,474,228 | | | | | |
| | | | | | | | | | | | | | | | | | | | | | | | | | | | | | | | | | | | |
| | | | | | | | | | | | | | | | | | $ | (66 | ) | | $ | 0 | | | $ | 56,916 | | | $ | 2,138,537 | | | | 2.61 | % |
| | | | | | | | | | | | | | | | | | | | | | | | | | | | | | | | | | | | |
| # | Amount shown represents income before fees and expenses. |
The accompanying notes are an integral part of these financial statements.
Wells Fargo VT International Equity Fund | 13
Statement of assets and liabilities—December 31, 2019
| | | | |
| | | | |
| |
Assets | | | | |
Investments in unaffiliated securities (including $636,520 of securities loaned), at value (cost $78,585,990) | | $ | 79,578,081 | |
Investments in affiliated securities, at value (cost $2,138,537) | | | 2,138,537 | |
Foreign currency, at value (cost $600,958) | | | 599,355 | |
Receivable for Fund shares sold | | | 941 | |
Receivable for dividends | | | 556,133 | |
Receivable for securities lending income, net | | | 806 | |
Unrealized gains on forward foreign currency contracts | | | 9,856 | |
Prepaid expenses and other assets | | | 562 | |
| | | | |
Total assets | | | 82,884,271 | |
| | | | |
| |
Liabilities | | | | |
Payable upon receipt of securities loaned | | | 662,439 | |
Payable for Fund shares redeemed | | | 83,188 | |
Unrealized losses on forward foreign currency contracts | | | 98,101 | |
Management fee payable | | | 163,403 | |
Administration fees payable | | | 5,647 | |
Distribution fee payable | | | 13,318 | |
Custody and accounting fees payable | | | 30,797 | |
Trustees’ fees and expenses payable | | | 6,417 | |
Accrued expenses and other liabilities | | | 41,609 | |
| | | | |
Total liabilities | | | 1,104,919 | |
| | | | |
Total net assets | | $ | 81,779,352 | |
| | | | |
| |
Net assets consist of | | | | |
Paid-in capital | | $ | 81,018,699 | |
Total distributable earnings | | | 760,653 | |
| | | | |
Total net assets | | $ | 81,779,352 | |
| | | | |
| |
Computation of net asset value per share | | | | |
Net assets – Class 1 | | $ | 19,872,318 | |
Shares outstanding – Class 11 | | | 10,886,254 | |
Net asset value per share – Class 1 | | | $1.83 | |
Net assets – Class 2 | | $ | 61,907,034 | |
Shares outstanding – Class 21 | | | 32,838,136 | |
Net asset value per share – Class 2 | | | $1.89 | |
| 1 | The Fund has an unlimited number of authorized shares. |
The accompanying notes are an integral part of these financial statements.
14 | Wells Fargo VT International Equity Fund
Statement of operations—year ended December 31, 2019
| | | | |
| | | | |
| |
Investment income | | | | |
Dividends (net of foreign withholding taxes of $243,629) | | $ | 2,549,494 | |
Income from affiliated securities | | | 68,468 | |
| | | | |
Total investment income | | | 2,617,962 | |
| | | | |
| |
Expenses | | | | |
Management fee | | | 647,131 | |
Administration fees | | | | |
Class 1 | | | 15,791 | |
Class 2 | | | 48,922 | |
Distribution fee | | | | |
Class 2 | | | 152,782 | |
Custody and accounting fees | | | 40,719 | |
Professional fees | | | 51,133 | |
Shareholder report expenses | | | 57,638 | |
Trustees’ fees and expenses | | | 21,652 | |
Other fees and expenses | | | 32,034 | |
| | | | |
Total expenses | | | 1,067,802 | |
Less: Fee waivers and/or expense reimbursements | | | | |
Fund-level | | | (357,114 | ) |
Class 1 | | | (2 | ) |
| | | | |
Net expenses | | | 710,686 | |
| | | | |
Net investment income | | | 1,907,276 | |
| | | | |
| |
Realized and unrealized gains (losses) on investments | | | | |
Net realized losses on | | | | |
Unaffiliated securities | | | (1,004,639 | ) |
Affiliated securities | | | (66 | ) |
Forward foreign currency contracts | | | (86,082 | ) |
| | | | |
Net realized losses on investments | | | (1,090,787 | ) |
| | | | |
| |
Net change in unrealized gains (losses) on | | | | |
Unaffiliated securities | | | 11,060,367 | |
Forward foreign currency contracts | | | (65,550 | ) |
| | | | |
Net change in unrealized gains (losses) on investments | | | 10,994,817 | |
| | | | |
Net realized and unrealized gains (losses) on investments | | | 9,904,030 | |
| | | | |
Net increase in net assets resulting from operations | | $ | 11,811,306 | |
| | | | |
The accompanying notes are an integral part of these financial statements.
Wells Fargo VT International Equity Fund | 15
Statement of changes in net assets
| | | | | | | | | | | | | | | | |
| | | Year ended
December 31, 2019 | | | Year ended
December 31, 2018 | |
| | | | |
Operations | | | | | | | | | | | | | | | | |
Net investment income | | | | | | $ | 1,907,276 | | | | | | | $ | 3,070,006 | |
Net realized gains (losses) on investments | | | | | | | (1,090,787 | ) | | | | | | | 38,838,067 | |
Net change in unrealized gains (losses) on investments | | | | | | | 10,994,817 | | | | | | | | (59,864,828 | ) |
| | | | |
Net increase (decrease) in net assets resulting from operations | | | | | | | 11,811,306 | | | | | | | | (17,956,755 | ) |
| | | | |
| | | | |
Distributions to shareholders from net investment income and net realized gains | | | | | | | | | | | | | | | | |
Class 1 | | | | | | | (9,077,111 | ) | | | | | | | (8,771,959 | ) |
Class 2 | | | | | | | (27,331,240 | ) | | | | | | | (25,052,585 | ) |
| | | | |
Total distributions to shareholders | | | | | | | (36,408,351 | ) | | | | | | | (33,824,544 | ) |
| | | | |
| | | | |
Capital share transactions | | | Shares | | | | | | | | Shares | | | | | |
Proceeds from shares sold | | | | | | | | | | | | | | | | |
Class 1 | | | 386,051 | | | | 874,936 | | | | 209,637 | | | | 942,178 | |
Class 2 | | | 803,693 | | | | 1,889,549 | | | | 709,948 | | | | 3,066,184 | |
| | | | |
| | | | | | | 2,764,485 | | | | | | | | 4,008,362 | |
| | | | |
Reinvestment of distributions | | | | | | | | | | | | | | | | |
Class 1 | | | 5,186,921 | | | | 9,077,111 | | | | 2,690,835 | | | | 8,771,959 | |
Class 2 | | | 15,100,133 | | | | 27,331,240 | | | | 7,546,109 | | | | 25,052,585 | |
| | | | |
| | | | | | | 36,408,351 | | | | | | | | 33,824,544 | |
| | | | |
Payment for shares redeemed | | | | | | | | | | | | | | | | |
Class 1 | | | (1,474,212 | ) | | | (3,230,199 | ) | | | (1,355,759 | ) | | | (5,459,375 | ) |
Class 2 | | | (3,468,601 | ) | | | (7,885,488 | ) | | | (47,012,701 | ) | | | (248,476,045 | ) |
| | | | |
| | | | | | | (11,115,687 | ) | | | | | | | (253,935,420 | ) |
| | | | |
Net increase (decrease) in net assets resulting from capital share transactions | | | | | | | 28,057,149 | | | | | | | | (216,102,514 | ) |
| | | | |
Total increase (decrease) in net assets | | | | | | | 3,460,104 | | | | | | | | (267,883,813 | ) |
| | | | |
| | | | |
Net assets | | | | | | | | | | | | | | | | |
Beginning of period | | | | | | | 78,319,248 | | | | | | | | 346,203,061 | |
| | | | |
End of period | | | | | | $ | 81,779,352 | | | | | | | $ | 78,319,248 | |
| | | | |
The accompanying notes are an integral part of these financial statements.
16 | Wells Fargo VT International Equity Fund
Financial highlights
(For a share outstanding throughout each period)
| | | | | | | | | | | | | | | | | | | | |
| | | Year ended December 31 | |
| CLASS 1 | | 2019 | | | 2018 | | | 2017 | | | 2016 | | | 2015 | |
Net asset value, beginning of period | | | $2.85 | | | | $5.34 | | | | $4.41 | | | | $4.82 | | | | $4.92 | |
Net investment income | | | 0.06 | 1 | | | 0.10 | 1 | | | 0.12 | 1 | | | 0.11 | 1 | | | 0.11 | 1 |
Net realized and unrealized gains (losses) on investments | | | 0.34 | | | | (0.77 | ) | | | 0.96 | | | | (0.01 | ) | | | 0.02 | |
| | | | | | | | | | | | | | | | | | | | |
Total from investment operations | | | 0.40 | | | | (0.67 | ) | | | 1.08 | | | | 0.10 | | | | 0.13 | |
Distributions to shareholders from | | | | | | | | | | | | | | | | | | | | |
Net investment income | | | (0.13 | ) | | | (0.61 | ) | | | (0.15 | ) | | | (0.15 | ) | | | (0.23 | ) |
Net realized gains | | | (1.29 | ) | | | (1.21 | ) | | | 0.00 | | | | (0.36 | ) | | | 0.00 | |
| | | | | | | | | | | | | | | | | | | | |
Total distributions to shareholders | | | (1.42 | ) | | | (1.82 | ) | | | (0.15 | ) | | | (0.51 | ) | | | (0.23 | ) |
Net asset value, end of period | | | $1.83 | | | | $2.85 | | | | $5.34 | | | | $4.41 | | | | $4.82 | |
Total return2 | | | 16.14 | % | | | (16.86 | )% | | | 24.86 | % | | | 3.25 | % | | | 2.30 | % |
Ratios to average net assets (annualized) | | | | | | | | | | | | | | | | | | | | |
Gross expenses | | | 1.13 | % | | | 1.12 | % | | | 0.95 | % | | | 0.95 | % | | | 0.95 | % |
Net expenses | | | 0.69 | % | | | 0.69 | % | | | 0.69 | % | | | 0.69 | % | | | 0.69 | % |
Net investment income | | | 2.55 | % | | | 2.41 | % | | | 2.41 | % | | | 2.49 | % | | | 2.04 | % |
Supplemental data | | | | | | | | | | | | | | | | | | | | |
Portfolio turnover rate | | | 48 | % | | | 51 | % | | | 55 | % | | | 77 | % | | | 34 | % |
Net assets, end of period (000s omitted) | | | $19,872 | | | | $19,315 | | | | $28,001 | | | | $25,137 | | | | $30,254 | |
| 1 | Calculated based upon average shares outstanding |
| 2 | Returns do not reflect fees and expenses charged pursuant to the terms of variable life insurance policies and variable annuity contracts. |
The accompanying notes are an integral part of these financial statements.
Wells Fargo VT International Equity Fund | 17
Financial highlights
(For a share outstanding throughout each period)
| | | | | | | | | | | | | | | | | | | | |
| | | Year ended December 31 | |
| CLASS 2 | | 2019 | | | 2018 | | | 2017 | | | 2016 | | | 2015 | |
Net asset value, beginning of period | | | $2.89 | | | | $5.38 | | | | $4.45 | | | | $4.84 | | | | $4.95 | |
Net investment income | | | 0.05 | 1 | | | 0.09 | 1 | | | 0.11 | 1 | | | 0.10 | | | | 0.09 | 1 |
Net realized and unrealized gains (losses) on investments | | | 0.36 | | | | (0.78 | ) | | | 0.96 | | | | 0.00 | | | | 0.01 | |
| | | | | | | | | | | | | | | | | | | | |
Total from investment operations | | | 0.41 | | | | (0.69 | ) | | | 1.07 | | | | 0.10 | | | | 0.10 | |
Distributions to shareholders from | | | | | | | | | | | | | | | | | | | | |
Net investment income | | | (0.12 | ) | | | (0.59 | ) | | | (0.14 | ) | | | (0.13 | ) | | | (0.21 | ) |
Net realized gains | | | (1.29 | ) | | | (1.21 | ) | | | 0.00 | | | | (0.36 | ) | | | 0.00 | |
| | | | | | | | | | | | | | | | | | | | |
Total distributions to shareholders | | | (1.41 | ) | | | (1.80 | ) | | | (0.14 | ) | | | (0.49 | ) | | | (0.21 | ) |
Net asset value, end of period | | | $1.89 | | | | $2.89 | | | | $5.38 | | | | $4.45 | | | | $4.84 | |
Total return2 | | | 16.10 | % | | | (17.28 | )% | | | 24.34 | % | | | 3.30 | % | | | 1.80 | % |
Ratios to average net assets (annualized) | | | | | | | | | | | | | | | | | | | | |
Gross expenses | | | 1.38 | % | | | 1.30 | % | | | 1.20 | % | | | 1.20 | % | | | 1.20 | % |
Net expenses | | | 0.94 | % | | | 0.94 | % | | | 0.94 | % | | | 0.94 | % | | | 0.94 | % |
Net investment income | | | 2.30 | % | | | 1.82 | % | | | 2.18 | % | | | 2.25 | % | | | 1.77 | % |
Supplemental data | | | | | | | | | | | | | | | | | | | | |
Portfolio turnover rate | | | 48 | % | | | 51 | % | | | 55 | % | | | 77 | % | | | 34 | % |
Net assets, end of period (000s omitted) | | | $61,907 | | | | $59,004 | | | | $318,202 | | | | $288,628 | | | | $295,215 | |
| 1 | Calculated based upon average shares outstanding |
| 2 | Returns do not reflect fees and expenses charged pursuant to the terms of variable life insurance policies and variable annuity contracts. |
The accompanying notes are an integral part of these financial statements.
18 | Wells Fargo VT International Equity Fund
Notes to financial statements
1. ORGANIZATION
Wells Fargo Variable Trust (the “Trust”), a Delaware statutory trust organized on March 10, 1999, is anopen-end management investment company registered under the Investment Company Act of 1940, as amended (the “1940 Act”). As an investment company, the Trust follows the accounting and reporting guidance in Financial Accounting Standards Board (“FASB”)Accounting Standards Codification Topic 946, Financial Services – Investment Companies. These financial statements report on the Wells Fargo VT International Equity Fund (the “Fund”) which is a diversified series of the Trust. The Trust offers shares of the Fund to separate accounts of various life insurance companies as funding vehicles for certain variable annuity contracts and variable life insurance policies.
2. SIGNIFICANT ACCOUNTING POLICIES
The following significant accounting policies, which are consistently followed in the preparation of the financial statements of the Fund, are in conformity with U.S. generally accepted accounting principles which require management to make estimates and assumptions that affect the reported amounts of assets and liabilities, disclosure of contingent assets and liabilities at the date of the financial statements, and the reported amounts of revenues and expenses during the reporting period. Actual results could differ from those estimates.
Securities valuation
All investments are valued each business day as of the close of regular trading on the New York Stock Exchange (generally 4 p.m. Eastern Time), although the Fund may deviate from this calculation time under unusual or unexpected circumstances.
Equity securities that are listed on a foreign or domestic exchange or market are valued at the official closing price or, if none, the last sales price. If no sale occurs on the principal exchange or market that day, a fair value price will be determined in accordance with the Fund’s Valuation Procedures.
Forward foreign currency contracts are recorded at the forward rate provided by an independent foreign currency pricing source at a time each business day specified by the Wells Fargo Asset Management Pricing Committee at Wells Fargo Funds Management, LLC (“Funds Management”).
The values of securities denominated in foreign currencies are translated into U.S. dollars at rates provided by an independent foreign currency pricing source at a time each business day specified by the Wells Fargo Asset Management Pricing Committee.
Many securities markets and exchanges outside the U.S. close prior to the close of the New York Stock Exchange and therefore may not fully reflect trading or events that occur after the close of the principal exchange in which the foreign securities are traded, but before the close of the New York Stock Exchange. If such trading or events are expected to materially affect the value of such securities, then fair value pricing procedures approved by the Board of Trustees of the Fund are applied. These procedures take into account multiple factors including movements in U.S. securities markets after foreign exchanges close. Foreign securities that are fair valued under these procedures are categorized as Level 2 and the application of these procedures may result in transfers between Level 1 and Level 2. Depending on market activity, such fair valuations may be frequent. Such fair value pricing may result in net asset values that are higher or lower than net asset values based on the last reported sales price or latest quoted bid price. On December 31, 2019, such fair value pricing was used in pricing certain foreign securities.
Investments in registeredopen-end investment companies are valued at net asset value. Interests innon-registered investment companies that are redeemable at net asset value are fair valued normally at net asset value.
Investments which are not valued using any of the methods discussed above are valued at their fair value, as determined in good faith by the Board of Trustees. The Board of Trustees has established a Valuation Committee comprised of the Trustees and has delegated to it the authority to take any actions regarding the valuation of portfolio securities that the Valuation Committee deems necessary or appropriate, including determining the fair value of portfolio securities, unless the determination has been delegated to the Wells Fargo Asset Management Pricing Committee.The Board of Trustees retains the authority to make or ratify any valuation decisions or approve any changes to the Valuation Procedures as it deems appropriate. On a quarterly basis, the Board of Trustees receives reports on any valuation actions taken by the Valuation Committee or the Wells Fargo Asset Management Pricing Committee which may include items for ratification.
Foreign currency translation
The accounting records of the Fund are maintained in U.S. dollars. The values of other assets and liabilities denominated in foreign currencies are translated into U.S. dollars at rates provided by an independent foreign currency pricing source at a time each business day specified by the Wells Fargo Asset Management Pricing Committee. Purchases and sales of securities, and income and expenses are converted at the rate of exchange on the respective dates of such transactions. Net realized foreign exchange gains or losses arise from sales of foreign currencies, currency gains or losses realized between the trade and
Wells Fargo VT International Equity Fund | 19
Notes to financial statements
settlement dates on securities transactions, and the difference between the amounts of dividends, interest and foreign withholding taxes recorded and the U.S. dollar equivalent of the amounts actually paid or received. Net unrealized foreign exchange gains and losses arise from changes in the fair value of assets and liabilities other than investments in securities resulting from changes in exchange rates. The changes in net assets arising from changes in exchange rates of securities and the changes in net assets resulting from changes in market prices of securities are not separately presented. Such changes are included in net realized and unrealized gains or losses from investments.
Forward foreign currency contracts
A forward foreign currency contract is an agreement between two parties to purchase or sell a specific currency for an agreed-upon price at a future date. The Fund enters into forward foreign currency contracts to facilitate transactions in foreign-denominated securities and to attempt to minimize the risk to the Fund from adverse changes in the relationship between currencies. Forward foreign currency contracts are recorded at the forward rate andmarked-to-market daily. When the contracts are closed, realized gains and losses arising from such transactions are recorded as realized gains or losses on forward foreign currency contracts. The Fund is subject to foreign currency risk and may be exposed to risks if the counterparties to the contracts are unable to meet the terms of their contracts or if the value of the foreign currency changes unfavorably. The Fund’s maximum risk of loss from counterparty credit risk is the unrealized gains on the contracts. This risk may be mitigated if there is a master netting arrangement between the Fund and the counterparty.
Securities lending
The Fund may lend its securities from time to time in order to earn additional income in the form of fees or interest on securities received as collateral or the investment of any cash received as collateral. When securities are on loan, the Fund receives interest or dividends on those securities. Cash collateral received in connection with its securities lending transactions is invested in Securities Lending Cash Investments, LLC (the “Securities Lending Fund”). Investments in Securities Lending Fund are valued at the evaluated bid price provided by an independent pricing service. Income earned from investment in the Securities Lending Fund (net of fees and rebates), if any, is included in income from affiliated securities on the Statement of Operations.
In a securities lending transaction, the net asset value of the Fund is affected by an increase or decrease in the value of the securities loaned and by an increase or decrease in the value of the instrument in which collateral is invested. The amount of securities lending activity undertaken by the Fund fluctuates from time to time. The Fund has the right under the lending agreement to recover the securities from the borrower on demand. In the event of default or bankruptcy by the borrower, the Fund may be prevented from recovering the loaned securities or gaining access to the collateral or may experience delays or costs in doing so. In such an event, the terms of the agreement allows the unaffiliated securities lending agent to use the collateral to purchase replacement securities on behalf of the Fund or pay the Fund the market value of the loaned securities. The Fund bears the risk of loss with respect to depreciation of its investment of the cash collateral.
Security transactions and income recognition
Securities transactions are recorded on a trade date basis. Realized gains or losses are recorded on the basis of identified cost.
Dividend income is recognized on theex-dividend date, except for certain dividends from foreign securities, which are recorded as soon as the custodian verifies theex-dividend date. Dividend income from foreign securities is recorded net of foreign taxes withheld where recovery of such taxes is not assured.
Distributions to shareholders
Distributions to shareholders from net investment income and any net realized gains are recorded on theex-dividend date and paid at least annually. Such distributions are determined in accordance with income tax regulations and may differ from U.S. generally accepted accounting principles. Dividend sources are estimated at the time of declaration. The tax character of distributions is determined as of the Fund’s fiscal year end. Therefore, a portion of the Fund’s distributions made prior to the Fund’s fiscal year end may be categorized as a tax return of capital at year end.
Federal and other taxes
The Fund intends to continue to qualify as a regulated investment company by distributing substantially all of its investment company taxable income and any net realized capital gains (after reduction for capital loss carryforwards) sufficient to relieve it from all, or substantially all, federal income taxes. Accordingly, no provision for federal income taxes was required.
The Fund’s income and federal excise tax returns and all financial records supporting those returns for the prior three fiscal years are subject to examination by the federal and Delaware revenue authorities. Management has analyzed the Fund’s tax positions taken on federal, state, and foreign tax returns for all open tax years and does not believe that there are any uncertain tax positions that require recognition of a tax liability.
20 | Wells Fargo VT International Equity Fund
Notes to financial statements
As of December 31, 2019, the aggregate cost of all investments for federal income tax purposes was $81,134,048 and the unrealized gains (losses) consisted of:
| | | | |
| |
Gross unrealized gains | | $ | 6,874,312 | |
| |
Gross unrealized losses | | | (6,379,987 | ) |
| |
Net unrealized gains | | $ | 494,325 | |
As of December 31, 2019, the Fund had current year deferred post-October capital losses consisting of $563,117 in short-term losses and $943,747 in long-term losses which will be recognized on the first day of the following fiscal year.
Class allocations
The separate classes of shares offered by the Fund differ principally in distribution fees. Class specific expenses are charged directly to that share class. Investment income, common fund-level expenses, and realized and unrealized gains (losses) on investments are allocated daily to each class of shares based on the relative proportion of net assets of each class.
3. FAIR VALUATION MEASUREMENTS
Fair value measurements of investments are determined within a framework that has established a fair value hierarchy based upon the various data inputs utilized in determining the value of the Fund’s investments. The three-level hierarchy gives the highest priority to unadjusted quoted prices in active markets for identical assets or liabilities (Level 1) and the lowest priority to unobservable inputs (Level 3). The Fund’s investments are classified within the fair value hierarchy based on the lowest level of input that is significant to the fair value measurement. The inputs are summarized into three broad levels as follows:
| ∎ | | Level 1 – quoted prices in active markets for identical securities |
| ∎ | | Level 2 – other significant observable inputs (including quoted prices for similar securities, interest rates, prepayment speeds, credit risk, etc.) |
| ∎ | | Level 3 – significant unobservable inputs (including the Fund’s own assumptions in determining the fair value of investments) |
The inputs or methodologies used for valuing investments in securities are not necessarily an indication of the risk associated with investing in those securities.
Wells Fargo VT International Equity Fund | 21
Notes to financial statements
The following is a summary of the inputs used in valuing the Fund’s assets and liabilities as of December 31, 2019:
| | | | | | | | | | | | | | | | |
| | | | |
| | | Quoted prices
(Level 1) | | | Other significant
observable inputs
(Level 2) | | | Significant
unobservable inputs (Level 3) | | | Total | |
| | | | |
Assets | | | | | | | | | | | | | | | | |
Investments in: | | | | | | | | | | | | | | | | |
| | | | |
Common stocks | | | | | | | | | | | | | | | | |
| | | | |
Australia | | $ | 275,320 | | | $ | 0 | | | $ | 0 | | | $ | 275,320 | |
| | | | |
Brazil | | | 182,218 | | | | 0 | | | | 0 | | | | 182,218 | |
| | | | |
Canada | | | 3,621,858 | | | | 0 | | | | 0 | | | | 3,621,858 | |
| | | | |
China | | | 8,166,863 | | | | 0 | | | | 0 | | | | 8,166,863 | |
| | | | |
France | | | 3,500,321 | | | | 0 | | | | 0 | | | | 3,500,321 | |
| | | | |
Germany | | | 0 | | | | 3,831,316 | | | | 0 | | | | 3,831,316 | |
| | | | |
Hong Kong | | | 1,745,539 | | | | 0 | | | | 0 | | | | 1,745,539 | |
| | | | |
India | | | 1,336,549 | | | | 0 | | | | 0 | | | | 1,336,549 | |
| | | | |
Ireland | | | 1,562,599 | | | | 0 | | | | 0 | | | | 1,562,599 | |
| | | | |
Israel | | | 2,114,121 | | | | 0 | | | | 0 | | | | 2,114,121 | |
| | | | |
Italy | | | 0 | | | | 4,426,051 | | | | 0 | | | | 4,426,051 | |
| | | | |
Japan | | | 0 | | | | 10,792,527 | | | | 0 | | | | 10,792,527 | |
| | | | |
Malaysia | | | 1,783,399 | | | | 0 | | | | 0 | | | | 1,783,399 | |
| | | | |
Netherlands | | | 4,586,342 | | | | 0 | | | | 0 | | | | 4,586,342 | |
| | | | |
Norway | | | 0 | | | | 2,429,795 | | | | 0 | | | | 2,429,795 | |
| | | | |
Russia | | | 1,751,078 | | | | 0 | | | | 0 | | | | 1,751,078 | |
| | | | |
Singapore | | | 1,989,296 | | | | 0 | | | | 0 | | | | 1,989,296 | |
| | | | |
South Korea | | | 2,187,962 | | | | 1,663,420 | | | | 0 | | | | 3,851,382 | |
| | | | |
Switzerland | | | 0 | | | | 4,154,522 | | | | 0 | | | | 4,154,522 | |
| | | | |
Thailand | | | 0 | | | | 1,900,113 | | | | 0 | | | | 1,900,113 | |
| | | | |
United Kingdom | | | 12,100,394 | | | | 0 | | | | 0 | | | | 12,100,394 | |
| | | | |
United States | | | 3,476,478 | | | | 0 | | | | 0 | | | | 3,476,478 | |
| | | | |
Short-term investments | | | | | | | | | | | | | | | | |
| | | | |
Investment companies | | | 2,138,537 | | | | 0 | | | | 0 | | | | 2,138,537 | |
| | | | |
| | | 52,518,874 | | | | 29,197,744 | | | | 0 | | | | 81,716,618 | |
| | | | |
Forward foreign currency contracts | | | 0 | | | | 9,856 | | | | 0 | | | | 9,856 | |
| | | | |
Total assets | | $ | 52,518,874 | | | $ | 29,207,600 | | | $ | 0 | | | $ | 81,726,474 | |
| | | | |
Liabilities | | | | | | | | | | | | | | | | |
| | | | |
Forward foreign currency contracts | | $ | 0 | | | $ | 98,101 | | | $ | 0 | | | $ | 98,101 | |
| | | | |
Total liabilities | | $ | 0 | | | $ | 98,101 | | | $ | 0 | | | $ | 98,101 | |
Additional sector, industry or geographic detail is included in the Portfolio of Investments.
Forward foreign currency contracts are reported at their cumulative unrealized gains (losses) at measurement date as reported in the table following the Portfolio of Investments. All other assets and liabilities are reported at their market value at measurement date.
For the year ended December 31, 2019, the Fund did not have any transfers into/out of Level 3.
4. TRANSACTIONS WITH AFFILIATES
Management fee
Funds Management, an indirect wholly owned subsidiary of Wells Fargo & Company (“Wells Fargo”), is the manager of the Fund and provides advisory and fund-level administrative services under an investment management agreement. Under the investment management agreement, Funds Management is responsible for, among other services, implementing the
22 | Wells Fargo VT International Equity Fund
Notes to financial statements
investment objectives and strategies of the Fund, supervising the subadviser and providing fund-level administrative services in connection with the Fund’s operations. As compensation for its services under the investment management agreement, Funds Management is entitled to receive a management fee at the following annual rate based on the Fund’s average daily net assets:
| | |
| |
| Average daily net assets | | Management fee |
| |
First $500 million | | 0.800% |
| |
Next $500 million | | 0.750 |
| |
Next $1 billion | | 0.700 |
| |
Next $2 billion | | 0.675 |
| |
Next $1 billion | | 0.650 |
| |
Next $5 billion | | 0.640 |
| |
Over $10 billion | | 0.630 |
For the year ended December 31, 2019, the management fee was equivalent to an annual rate of 0.80% of the Fund’s average daily net assets.
Funds Management has retained the services of a subadviser to provide daily portfolio management to the Fund. The fee for subadvisory services is borne by Funds Management. Wells Capital Management Incorporated (“WellsCap”), an affiliate of Funds Management and an indirect wholly owned subsidiary of Wells Fargo, is the subadviser to the Fund and is entitled to receive a fee from Funds Management at an annual rate starting at 0.45% and declining to 0.40% as the average daily net assets of the Fund increase.
Administration fees
Under a class-level administration agreement, Funds Management provides class-level administrative services to the Fund, which includes paying fees and expenses for services provided by the transfer agent,sub-transfer agents, omnibus account servicers and record-keepers. As compensation for its services under the class-level administration agreement, Funds Management receives a class administration fee of 0.08% which is calculated based on the average daily net assets of each class.
Waivers and/or expense reimbursements
Funds Management has contractually waived and/or reimbursed management and administration fees to the extent necessary to maintain certain net operating expense ratios for the Fund. When each class of the Fund has exceeded its expense cap, Funds Management has waived fees and/or reimbursed expenses from fund-level expenses on a proportionate basis and then from class specific expenses. When only certain classes exceed their expense caps, waivers and/or reimbursements are applied against class specific expenses before fund-level expenses. Funds Management has committed through April 30, 2020 to waive fees and/or reimburse expenses to the extent necessary to cap the Fund’s expenses at 0.69% for Class 1 shares and 0.94% for Class 2 shares. Prior to or after the commitment expiration date, the cap may be increased or the commitment to maintain the cap may be terminated only with the approval of the Board of Trustees.
Distribution fee
The Trust has adopted a distribution plan for Class 2 shares of the Fund pursuant to Rule12b-1 under the 1940 Act. A distribution fee is charged to Class 2 shares and paid to Wells Fargo Funds Distributor, LLC, the principal underwriter, at an annual rate of 0.25% of the average daily net assets of Class 2 shares.
Interfund transactions
The Fund may purchase or sell portfolio investment securities to certain other Wells Fargo affiliates pursuant to Rule17a-7 under the 1940 Act and under procedures adopted by the Board of Trustees. The procedures have been designed to ensure that these interfund transactions, which do not incur broker commissions, are effected at current market prices.
5. INVESTMENT PORTFOLIO TRANSACTIONS
Purchases and sales of investments, excluding U.S. government obligations (if any) and short-term securities, for the year ended December 31, 2019 were $37,004,506 and $42,050,869, respectively.
Wells Fargo VT International Equity Fund | 23
Notes to financial statements
6. SECURITIES LENDING TRANSACTIONS
The Fund lends its securities through an unaffiliated securities lending agent and receives collateral in the form of cash or securities with a value at least equal to the value of the securities on loan. The value of the loaned securities is determined at the close of each business day and any increases or decreases in the required collateral are exchanged between the Fund and the counterparty on the next business day. Cash collateral received is invested in the Securities Lending Fund which seeks to provide a positive return compared to the daily Fed Funds Open Rate by investing in high-quality, U.S. dollar-denominated short-term money market instruments and is exempt from registration under Section 3(c)(7) of the 1940 Act. Securities Lending Fund is managed by Funds Management and is subadvised by WellsCap. Funds Management receives an advisory fee starting at 0.05% and declining to 0.01% as the average daily net assets of the Securities Lending Fund increase. All of the fees received by Funds Management are paid to WellsCap for its services as subadviser.
In the event of counterparty default or the failure of a borrower to return a loaned security, the Fund has the right to use the collateral to offset any losses incurred. As of December 31, 2019, the Fund had securities lending transactions with the following counterparties which are subject to offset:
| | | | | | | | |
| | | |
| Counterparty | | Value of securities on loan | | Collateral
received1 | | Net amount | |
| | | |
Citigroup Global Markets Inc. | | $636,520 | | $(636,520) | | $ | 0 | |
| 1 | Collateral received within this table is limited to the collateral for the net transaction with the counterparty. |
7. DERIVATIVE TRANSACTIONS
During the year ended December 31, 2019, the Fund entered into forward foreign currency contracts for economic hedging purposes. The Fund had average contract amounts of $920,795 and $8,739,762 in forward foreign currency contracts to buy and forward foreign currency contracts to sell, respectively, during the year ended December 31, 2019.
The fair value, realized gains or losses and change in unrealized gains or losses, if any, on derivative instruments are reflected in the corresponding financial statement captions.
For certain types of derivative transactions, the Fund has entered into International Swaps and Derivatives Association, Inc. master agreements (“ISDA Master Agreements”) or similar agreements with approved counterparties. The ISDA Master Agreements or similar agreements may have requirements to deliver/deposit securities or cash to/with an exchange orbroker-dealer as collateral and allows the Fund to offset, with each counterparty, certain derivative financial instrument’s assets and/or liabilities with collateral held or pledged. Collateral requirements differ by type of derivative. Collateral or margin requirements are set by the broker or exchange clearinghouse for exchange traded derivatives while collateral terms are contract specific forover-the-counter traded derivatives. Cash collateral that has been pledged to cover obligations of the Fund under ISDA Master Agreements or similar agreements, if any, are reported separately in the Statement of Assets and Liabilities. Securities pledged as collateral, if any, are noted in the Portfolio of Investments. With respect to balance sheet offsetting, absent an event of default by the counterparty or a termination of the agreement, the reported amounts of financial assets and financial liabilities in the Statement of Assets and Liabilities are not offset across transactions between the Fund and the applicable counterparty. A reconciliation of the gross amounts on the Statement of Assets and Liabilities to the net amounts by counterparty, including any collateral exposure, for OTC derivatives is as follows:
| | | | | | | | | | | | | | | | |
| | | | |
| Counterparty | | Gross amounts of assets in the Statement of Assets and Liabilities | | | Amounts
subject to
netting
agreements | | | Collateral
received | | | Net amount
of assets | |
| | | | |
Morgan Stanley | | $ | 9,856 | | | $ | (9,856 | ) | | $ | 0 | | | $ | 0 | |
| | | | | | | | | | | | | | | | |
| | | | |
| Counterparty | | Gross amounts of liabilities in the Statement of Assets and Liabilities | | | Amounts
subject to
netting
agreements | | | Collateral
pledged | | | Net amount
of liabilities | |
| | | | |
Credit Suisse | | $ | 18,199 | | | $ | 0 | | | $ | 0 | | | $ | 18,199 | |
| | | | |
Morgan Stanley | | | 79,902 | | | | (9,856 | ) | | | 0 | | | | 70,046 | |
24 | Wells Fargo VT International Equity Fund
Notes to financial statements
8. BANK BORROWINGS
The Trust, Wells Fargo Master Trust and Wells Fargo Funds Trust (excluding the money market funds) are parties to a $280,000,000 revolving credit agreement whereby the Fund is permitted to use bank borrowings for temporary or emergency purposes, such as to fund shareholder redemption requests. Interest under the credit agreement is charged to the Fund based on a borrowing rate equal to the higher of the Federal Funds rate in effect on that day plus 1.25% or the overnight LIBOR rate in effect on that day plus 1.25%. In addition, an annual commitment fee equal to 0.25% of the unused balance is allocated to each participating fund.
For the year ended December 31, 2019, there were no borrowings by the Fund under the agreement.
9. DISTRIBUTIONS TO SHAREHOLDERS
The tax character of distributions paid during the years ended December 31, 2019 and December 31, 2018 were as follows:
| | | | | | | | |
| | | Year ended December 31 | |
| | |
| | | 2019 | | | 2018 | |
| | |
Ordinary income | | $ | 9,446,993 | | | $ | 11,126,477 | |
| | |
Long-term capital gain | | | 26,961,358 | | | | 22,698,067 | |
As of December 31, 2019, the components of distributable earnings on a tax basis were as follows:
| | | | |
Undistributed ordinary
income | | Unrealized
gains | | Capital loss carryforward |
| | |
$1,781,189 | | $492,722 | | $(1,506,864) |
10. INDEMNIFICATION
Under the Trust’s organizational documents, the officers and Trustees have been granted certain indemnification rights against certain liabilities that may arise out of performance of their duties to the Trust. Additionally, in the normal course of business, the Trust may enter into contracts with service providers that contain a variety of indemnification clauses. The Trust’s maximum exposure under these arrangements is dependent on future claims that may be made against the Fund and, therefore, cannot be estimated.
11. NEW ACCOUNTING PRONOUNCEMENT
In August 2018, FASB issued Accounting Standards Update (“ASU”)No. 2018-13, Fair Value Measurement (Topic 820)Disclosure Framework—Changes to the Disclosure Requirements for Fair Value Measurement. ASU2018-13 updates the disclosure requirements for fair value measurements by modifying or removing certain disclosures and adding certain new disclosures. The amendments are effective for fiscal years, and interim periods within those fiscal years, beginning after December 15, 2019. Early adoption is permitted. Management has adopted the removal and modification of disclosures early, as permitted, and will adopt the additional new disclosures at the effective date.
Wells Fargo VT International Equity Fund | 25
Report of independent registered public accounting firm
TO THE SHAREHOLDERS OF THE FUND AND BOARD OF TRUSTEES OF WELLS FARGO VARIABLE TRUST:
Opinion on the Financial Statements
We have audited the accompanying statement of assets and liabilities of Wells Fargo VT International Equity Fund (the Fund), one of the funds constituting Wells Fargo Variable Trust, including the portfolio of investments, as of December 31, 2019, the related statement of operations for the year then ended, the statements of changes in net assets for each of the years in the two-year period then ended, and the related notes (collectively, the financial statements) and the financial highlights for each of the years in the five-year period then ended. In our opinion, the financial statements and financial highlights present fairly, in all material respects, the financial position of the Fund as of December 31, 2019, the results of its operations for the year then ended, the changes in its net assets for each of the years in the two-year period then ended, and the financial highlights for each of the years in the five-year period then ended, in conformity with U.S. generally accepted accounting principles.
Basis for Opinion
These financial statements and financial highlights are the responsibility of the Fund’s management. Our responsibility is to express an opinion on these financial statements and financial highlights based on our audits. We are a public accounting firm registered with the Public Company Accounting Oversight Board (United States) (PCAOB) and are required to be independent with respect to the Fund in accordance with the U.S. federal securities laws and the applicable rules and regulations of the Securities and Exchange Commission and the PCAOB.
We conducted our audits in accordance with the standards of the PCAOB. Those standards require that we plan and perform the audit to obtain reasonable assurance about whether the financial statements and financial highlights are free of material misstatement, whether due to error or fraud. Our audits included performing procedures to assess the risks of material misstatement of the financial statements and financial highlights, whether due to error or fraud, and performing procedures that respond to those risks. Such procedures included examining, on a test basis, evidence regarding the amounts and disclosures in the financial statements and financial highlights. Such procedures also included confirmation of securities owned as of December 31, 2019, by correspondence with the custodian, transfer agent and brokers. Our audits also included evaluating the accounting principles used and significant estimates made by management, as well as evaluating the overall presentation of the financial statements and financial highlights. We believe that our audits provide a reasonable basis for our opinion.

We have not been able to determine the specific year that we began serving as the auditor of one or more Wells Fargo Funds investment companies; however we are aware that we have served as the auditor of one or more Wells Fargo Funds investment companies since at least 1955.
Boston, Massachusetts
February 25, 2020
26 | Wells Fargo VT International Equity Fund
Other information (unaudited)
TAX INFORMATION
Pursuant to Section 852 of the Internal Revenue Code, $26,961,358 was designated as a 20% rate gain distribution for the fiscal year ended December 31, 2019.
Pursuant to Section 854 of the Internal Revenue Code, $4,737,527 of income dividends paid during the fiscal year ended December 31, 2019 has been designated as qualified dividend income (QDI).
For the fiscal year ended December 31, 2019, $46,215 has been designated as interest-related dividends for nonresident alien shareholders pursuant to Section 871 of the Internal Revenue Code.
For the fiscal year ended December 31, 2019, $6,376,477 has been designated as short-term capital gain dividends for nonresident alien shareholders pursuant to Section 871 of the Internal Revenue Code.
Pursuant to Section 853 of the Internal Revenue Code, the following amounts have been designated as foreign taxes paid for the fiscal year ended December 31, 2019. These amounts may be less than the actual foreign taxes paid for financial statement purposes. Foreign taxes paid or withheld should be included in taxable income with an offsetting deduction from gross income or as a credit for taxes paid to foreign governments. None of the income was derived from ineligible foreign sources as defined under Section 901(j) of the Internal Revenue Code.
| | | | |
Creditable foreign taxes paid | | Per share amount | | Foreign income as % of ordinary income distributions |
| | |
| $161,025 | | $.00368 | | 100% |
PROXY VOTING INFORMATION
A description of the policies and procedures used to determine how to vote proxies relating to portfolio securities is available, upon request, by calling1-800-260-5969, visiting our website atwfam.com, or visiting the SEC website at sec.gov. Information regarding how the proxies related to portfolio securities were voted during the most recent12-month period ended June 30 is available on the website atwfam.comor by visiting the SEC website at sec.gov.
QUARTERLY PORTFOLIO HOLDINGS INFORMATION
The Fund files its complete schedule of portfolio holdings with the SEC for the first and third quarters of each fiscal year as an exhibit to its reports on FormN-PORT. Shareholders may view the filed FormN-PORT by visiting the SEC website at sec.gov.
Wells Fargo VT International Equity Fund | 27
Other information (unaudited)
BOARD OF TRUSTEES AND OFFICERS
Each of the Trustees and Officers1 listed in the table below acts in identical capacities for each fund in the Wells Fargo family of funds, which consists of 149 mutual funds comprising the Wells Fargo Funds Trust, Wells Fargo Variable Trust, Wells Fargo Master Trust and fourclosed-end funds (collectively the “Fund Complex”). This table should be read in conjunction with the Prospectus and the Statement of Additional Information2. The mailing address of each Trustee and Officer is 525 Market Street, 12th Floor, San Francisco, CA 94105. Each Trustee and Officer serves an indefinite term, however, each Trustee serves such term until reaching the mandatory retirement age established by the Trustees.
Independent Trustees
| | | | | | |
Name and year of birth | | Position held and
length of service* | | Principal occupations during past five years or longer | | Current other
public company or
investment
company
directorships |
| | | |
William R. Ebsworth
(Born 1957) | | Trustee,
since 2015 | | Retired. From 1984 to 2013, equities analyst, portfolio manager, research director and chief investment officer at Fidelity Management and Research Company in Boston, Tokyo, and Hong Kong, and retired in 2013 as Chief Investment Officer of Fidelity Strategic Advisers, Inc. where he led a team of investment professionals managing client assets. Prior thereto, Board member of Hong Kong Securities Clearing Co., Hong Kong Options Clearing Corp., the Thailand International Fund, Ltd., Fidelity Investments Life Insurance Company, and Empire Fidelity Investments Life Insurance Company. Audit Committee Chair and Investment Committee Chair of the Vincent Memorial Hospital Endowment(non-profit organization). Mr. Ebsworth is a CFA® charterholder. | | N/A |
| | | |
Jane A. Freeman
(Born 1953) | | Trustee,
since 2015; Chair Liaison,
since 2018 | | Retired. From 2012 to 2014 and 1999 to 2008, Chief Financial Officer of Scientific Learning Corporation. From 2008 to 2012, Ms. Freeman provided consulting services related to strategic business projects. Prior to 1999, Portfolio Manager at Rockefeller & Co. and Scudder, Stevens & Clark. Board member of the Harding Loevner Funds from 1996 to 2014, serving as both Lead Independent Director and chair of the Audit Committee. Board member of the Russell Exchange Traded Funds Trust from 2011 to 2012 and the chair of the Audit Committee. Ms. Freeman is a Board Member of The Ruth Bancroft Garden(non-profit organization). She is also an inactive Chartered Financial Analyst. | | N/A |
| | | |
Isaiah Harris, Jr.
(Born 1952) | | Trustee,
since 2009;
Audit Committee Chairman,
since 2019 | | Retired. Chairman of the Board of CIGNA Corporation since 2009, and Director since 2005. From 2003 to 2011, Director of Deluxe Corporation. Prior thereto, President and CEO of BellSouth Advertising and Publishing Corp. from 2005 to 2007, President and CEO of BellSouth Enterprises from 2004 to 2005 and President of BellSouth Consumer Services from 2000 to 2003. Emeritus member of the Iowa State University Foundation Board of Governors. Emeritus Member of the Advisory Board of Iowa State University School of Business. Advisory Board Member, Palm Harbor Academy (private school). Advisory Board Member, Child Evangelism Fellowship(non-profit). Mr. Harris is a certified public accountant (inactive status). | | CIGNA Corporation |
| | | |
Judith M. Johnson
(Born 1949) | | Trustee,
since 2008;
Audit Committee Chairman, from 2009 to 2018 | | Retired. Prior thereto, Chief Executive Officer and Chief Investment Officer of Minneapolis Employees Retirement Fund from 1996 to 2008. Ms. Johnson is an attorney, certified public accountant and a certified managerial accountant. | | N/A |
28 | Wells Fargo VT International Equity Fund
Other information (unaudited)
| | | | | | |
Name and year of birth | | Position held and
length of service* | | Principal occupations during past five years or longer | | Current other
public company or
investment
company
directorships |
| | | |
David F. Larcker
(Born 1950) | | Trustee,
since 2009 | | James Irvin Miller Professor of Accounting at the Graduate School of Business, Stanford University, Director of the Corporate Governance Research Initiative and Senior Faculty of The Rock Center for Corporate Governance since 2006. From 2005 to 2008, Professor of Accounting at the Graduate School of Business, Stanford University. Prior thereto, Ernst & Young Professor of Accounting at The Wharton School, University of Pennsylvania from 1985 to 2005. | | N/A |
| | | |
Olivia S. Mitchell
(Born 1953) | | Trustee,
since 2006; Nominating and Governance Committee Chair, since 2018 | | International Foundation of Employee Benefit Plans Professor, Wharton School of the University of Pennsylvania since 1993. Director of Wharton’s Pension Research Council and Boettner Center on Pensions & Retirement Research, and Research Associate at the National Bureau of Economic Research. Previously, Cornell University Professor from 1978 to 1993. | | N/A |
| | | |
Timothy J. Penny
(Born 1951) | | Trustee,
since 1996; Chairman,
since 2018 | | President and Chief Executive Officer of Southern Minnesota Initiative Foundation, anon-profit organization, since 2007. Member of the Board of Trustees of NorthStar Education Finance, Inc., anon-profit organization, since 2007. | | N/A |
| | | |
James G. Polisson
(Born 1959) | | Trustee,
since 2018 | | Retired. Chief Marketing Officer, Source (ETF) UK Services, Ltd, from 2015 to 2017. From 2012 to 2015, Principal of The Polisson Group, LLC, a management consulting, corporate advisory and principal investing company. Chief Executive Officer and Managing Director at Russell Investments, Global Exchange Traded Funds from 2010 to 2012. Managing Director of Barclays Global Investors from 1998 to 2010 and Global Chief Marketing Officer for iShares and Barclays Global Investors from 2000 to 2010. Trustee of the San Francisco Mechanics’ Institute, anon-profit organization, from 2013 to 2015. Board member of the Russell Exchange Traded Fund Trust from 2011 to 2012. Director of Barclays Global Investors Holdings Deutschland GmbH from 2006 to 2009. Mr. Polisson is an attorney and has a retired status with the Massachusetts and District of Columbia Bar Associations. | | N/A |
| | | |
Pamela Wheelock3
(Born 1959) | | Trustee, since January 2020; previously Trustee from January 2018 to July 2019 | | Board member of the Destination Medical Center Economic Development Agency, Rochester, Minnesota since 2019. Acting Commissioner, Minnesota Department of Human Services, July 2019 through September 2019. Human Services Manager (part-time), Minnesota Department of Human Services, October 2019 through December 2019. Chief Operating Officer, Twin Cities Habitat for Humanity from 2017 to 2019. Vice President of University Services, University of Minnesota from 2012 to 2016. Prior thereto, on the Board of Directors, Governance Committee and Finance Committee for the Minnesota Philanthropy Partners (Saint Paul Foundation) from 2012 to 2018, Interim Chief Executive Officer of Blue Cross Blue Shield of Minnesota from 2011 to 2012, Chairman of the Board from 2009 to 2012 and Board Director from 2003 to 2015. Vice President, Leadership and Community Engagement, Bush Foundation, Saint Paul, Minnesota (a private foundation) from 2009 to 2011. Executive Vice President and Chief Financial Officer, Minnesota Sports and Entertainment from 2004 to 2009 and Senior Vice President from 2002 to 2004. Executive Vice President of the Minnesota Wild Foundation from 2004 to 2008. Commissioner of Finance, State of Minnesota, from 1999 to 2002. Currently Board Chair of the Minnesota Wild Foundation since 2010. | | N/A |
| * | Length of service dates reflect the Trustee’s commencement of service with the Trust’s predecessor entities, where applicable. |
Wells Fargo VT International Equity Fund | 29
Other information (unaudited)
Officers
| | | | |
Name and
year of birth | | Position held and
length of service | | Principal occupations during past five years or longer |
| | |
Andrew Owen
(Born 1960) | | President,
since 2017 | | Executive Vice President of Wells Fargo & Company and Head of Affiliated Managers, Wells Fargo Asset Management, since 2014. In addition, Mr. Owen is currently President, Chief Executive Officer and Director of Wells Fargo Funds Management, LLC since 2017. Prior thereto, Executive Vice President responsible for marketing, investments and product development for Wells Fargo Funds Management, LLC, from 2009 to 2014. |
| | |
| Jeremy DePalma1(Born 1974) | | Treasurer,
since 2012 | | Senior Vice President of Wells Fargo Funds Management, LLC since 2009. Senior Vice President of Evergreen Investment Management Company, LLC from 2008 to 2010 and head of the Fund Reporting and Control Team within Fund Administration from 2005 to 2010. |
| | |
Michelle Rhee4
(Born 1966) | | Chief Legal Officer,
since 2019 | | Secretary of Wells Fargo Funds Management, LLC, Chief Legal Counsel of Wells Fargo Asset Management and Assistant General Counsel of Wells Fargo Bank, N.A. since 2018. Associate General Counsel and Managing Director of Bank of America Corporation from 2004 to 2018. |
| | |
| Catherine Kennedy5 (Born 1969) | | Secretary, since 2019 | | Vice President of Wells Fargo Funds Management, LLC and Senior Counsel of the Wells Fargo Legal Department since 2010. Vice President and Senior Counsel of Evergreen Investment Management Company, LLC from 1998 to 2010. |
| | |
| Michael H. Whitaker (Born 1967) | | Chief Compliance Officer, since 2016 | | Chief Compliance Officer of Wells Fargo Asset Management since 2016. Senior Vice President and Chief Compliance Officer for Fidelity Investments from 2007 to 2016. |
| | |
David Berardi
(Born 1975) | | Assistant Treasurer,
since 2009 | | Vice President of Wells Fargo Funds Management, LLC since 2009. Vice President of Evergreen Investment Management Company, LLC from 2008 to 2010. Manager of Fund Reporting and Control for Evergreen Investment Management Company, LLC from 2004 to 2010. |
| 1 | Jeremy DePalma acts as Treasurer of 85 funds and Assistant Treasurer of 64 funds in the Fund Complex. |
| 2 | The Statement of Additional Information includes additional information about the Trustees and is available, without charge, upon request, by calling1-800-260-5969 or by visiting the website atwfam.com. |
| 3 | Pamela Wheelock wasre-appointed to the Board effective January 1, 2020. |
| 4 | Michelle Rhee became Chief Legal Officer effective October 22, 2019. |
| 5 | Catherine Kennedy became Secretary effective October 22, 2019. |
30 | Wells Fargo VT International Equity Fund
This page is intentionally left blank.
This page is intentionally left blank.

For more information
More information about Wells Fargo Funds is available free upon request. To obtain literature, please write, visit the Fund’s website, or call:
Wells Fargo Funds
P.O. Box 219967
Kansas City, MO 64121-9967
Website:wfam.com
Individual investors:1-800-222-8222
Retail investment professionals:1-888-877-9275
Institutional investment professionals:1-866-765-0778

This report and the financial statements contained herein are submitted for the general information of the shareholders of the Fund. If this report is used for promotional purposes, distribution of the report must be accompanied or preceded by a current prospectus. Before investing, please consider the investment objectives, risks, charges, and expenses of the investment. For a current prospectus and, if available, a summary prospectus, containing this information, call1-800-260-5969 or visit the Fund’s website atwfam.com. Read the prospectus carefully before you invest or send money.
Wells Fargo Asset Management (WFAM) is the trade name for certain investment advisory/management firms owned by Wells Fargo & Company. These firms include but are not limited to Wells Capital Management Incorporated and Wells Fargo Funds Management, LLC. Certain products managed by WFAM entities are distributed by Wells Fargo Funds Distributor, LLC (a broker-dealer and Member FINRA).
This material is for general informational and educational purposes only and is NOT intended to provide investment advice or a recommendation of any kind—including a recommendation for any specific investment, strategy, or plan.
INVESTMENT PRODUCTS: NOT FDIC INSURED ◾ NO BANK GUARANTEE ◾ MAY LOSE VALUE
© 2020 Wells Fargo & Company. All rights reserved.
PAR-0120-02377 02-20
AVT3/AR149 12-19
Annual Report
December 31, 2019
Wells Fargo
VT Omega Growth Fund
Beginning on January 1, 2021, as permitted by new regulations adopted by the Securities and Exchange Commission, paper copies of the Wells Fargo Funds’ annual and semi-annual shareholder reports issued after this date will no longer be sent by mail, unless you specifically request paper copies of the reports. Instead, the reports will be made available on the Funds’ website, and you will be notified by mail each time a report is posted and provided with a website address to access the report.
If you already elected to receive shareholder reports electronically, you will not be affected by this change and you need not take any action. You may elect to receive shareholder reports and other communications from the Fund electronically at any time by contacting your financial intermediary (such as a broker-dealer or bank) or, if you are a direct investor, by calling1-800-222-8222 or by enrolling at wellsfargo.com/advantagedelivery.
You may elect to receive all future reports in paper free of charge. If you invest through a financial intermediary, you can contact your financial intermediary to request that you continue to receive paper copies of your shareholder reports; if you invest directly with the Fund, you can call 1-800-222-8222. Your election to receive reports in paper will apply to all Wells Fargo Funds held in your account with your financial intermediary or, if you are a direct investor, to all Wells Fargo Funds that you hold.
|
|
|
Reduce clutter. Save trees. |
Sign up for electronic delivery of prospectuses and shareholder reports atwellsfargo.com/advantagedelivery |
The views expressed and any forward-looking statements are as of December 31, 2019, unless otherwise noted, and are those of the Fund managers and/or Wells Fargo Asset Management. Discussions of individual securities, or the markets generally, or any Wells Fargo Fund are not intended as individual recommendations. Future events or results may vary significantly from those expressed in any forward-looking statements. The views expressed are subject to change at any time in response to changing circumstances in the market. Wells Fargo Asset Management and the Fund disclaim any obligation to publicly update or revise any views expressed or forward-looking statements.
INVESTMENT PRODUCTS: NOT FDIC INSURED ◾ NO BANK GUARANTEE ◾ MAY LOSE VALUE
Wells Fargo VT Omega Growth Fund | 1
Letter to shareholders (unaudited)

Andrew Owen
President
Wells Fargo Funds
“Financial markets rebounded strongly to open 2019 on a positive note”
Dear Shareholder:
We are pleased to offer you this annual report for the Wells Fargo VT Omega Growth Fund for the12-month period that ended December 31, 2019. Despite some periods of market volatility, the year was strongly positive for financial markets as supportive central banks more than offset concerns over slowing global economic growth and international trade tensions.
Overall, both fixed-income and equity investors enjoyed healthy annual returns. For the period, U.S. stocks, based on the S&P 500 Index,1 gained 31.49% and international stocks, as measured by the MSCI ACWI ex USA Index (Net),2 returned 21.51%. The MSCI EM Index (Net)3 gained 18.42%. For bond investors, the Bloomberg Barclays U.S. Aggregate Bond Index4 added 8.72%, the Bloomberg Barclays Global Aggregateex-USD Index5 returned 5.09%, the Bloomberg Barclays Municipal Bond Index6 gained 7.54%, and the ICE BofA U.S. High Yield Index7 added 14.41%.
The year began with a strong market rebound.
After a volatile end of 2018 involving sharp losses, financial markets rebounded strongly to open 2019 on a positive note, as investors were encouraged by a sudden pivot by the U.S. Federal Reserve (Fed) to a more accommodative stance after a series of increases to the federal funds rate in 2017 and 2018. The S&P 500 Index gained 8.01% in January, the best monthly performance in 30 years. Returns for the MSCI ACWI ex USA Index (Net), the Bloomberg Barclays U.S. Aggregate Bond Index, and the Bloomberg Barclays Global Aggregateex-USD Index also were positive.
In February 2019, signs of slowing global growth grew more ominous. The Bureau of Economic Analysis announced fourth-quarter 2018 gross domestic product (GDP) grew at an annualized 2.2% rate, down from the levels of the prior two quarters. In a February report, the Bank of England forecast the slowest growth since the financial crisis for 2019. China and the U.S. continued to wrangle over trade issues. By the end of the first quarter of 2019, more accommodative Fed sentiment and steady, if not spectacular, U.S. economic and business metrics encouraged domestic investors.
Early second-quarter 2019 enthusiasm among investors faded.
During April, sustained low inflation, solid employment data, and first-quarter U.S. GDP of an annualized rate of 3.2% supported favorable sentiment. During May, markets
| 1 | The S&P 500 Index consists of 500 stocks chosen for market size, liquidity, and industry group representation. It is a market-value-weighted index with each stock’s weight in the index proportionate to its market value. You cannot invest directly in an index. |
| 2 | The Morgan Stanley Capital International (MSCI) All Country World Index (ACWI) ex USA Index (Net) is a free-float-adjusted market-capitalization-weighted index that is designed to measure the equity market performance of developed markets, excluding the United States. Source: MSCI. MSCI makes no express or implied warranties or representations and shall have no liability whatsoever with respect to any MSCI data contained herein. The MSCI data may not be further redistributed or used as a basis for other indices or any securities or financial products. This report is not approved, reviewed, or produced by MSCI. You cannot invest directly in an index. |
| 3 | The MSCI Emerging Markets (EM) Index (Net) is a free-float-adjusted market-capitalization-weighted index that is designed to measure equity market performance of emerging markets. You cannot invest directly in an index. |
| 4 | The Bloomberg Barclays U.S. Aggregate Bond Index is a broad-based benchmark that measures the investment-grade, U.S. dollar-denominated, fixed-rate taxable bond market, including Treasuries, government-related and corporate securities, mortgage-backed securities (agency fixed-rate and hybrid adjustable-rate mortgage pass-throughs), asset-backed securities, and commercial mortgage-backed securities. You cannot invest directly in an index. |
| 5 | The Bloomberg Barclays Global Aggregateex-USD Index is an unmanaged index that provides a broad-based measure of the global investment-grade fixed-income markets excluding the U.S. dollar-denominated debt market. You cannot invest directly in an index. |
| 6 | The Bloomberg Barclays Municipal Bond Index is an unmanaged index composed of long-termtax-exempt bonds with a minimum credit rating of Baa. You cannot invest directly in an index. |
| 7 | The ICE BofA U.S. High Yield Index is a market-capitalization-weighted index of domestic and Yankee high-yield bonds. The index tracks the performance of high-yield securities traded in the U.S. bond market. You cannot invest directly in an index. Copyright 2020. ICE Data Indices, LLC. All rights reserved. |
2 | Wells Fargo VT Omega Growth Fund
Letter to shareholders (unaudited)
tumbled on mixed investment signals. In the U.S., partisan wrangling ramped up as Democrats and Republicans set their sights on 2020 presidential politics. The U.K.’s Brexit disagreements caused Prime Minister Theresa May to resign. Boris Johnson succeeded her only to exacerbate uncertainty about Brexit’s resolution ahead of an October 2019 deadline. The European Commission downgraded the 2019 growth forecast to 1.2%. The U.S. increased tariffs on products from China, China responded, and then talks broke down. President Donald Trump threatened to turn his foreign policy tariff tool to Mexico over immigration issues.
Midway through the year, investors regrouped, sentiment turned positive, and U.S. equity markets advanced during June and July. The gains, primarily driven by geopolitical and monetary policy events, pushed equity markets to new highs. European Central Bank President Mario Draghi indicated the bank was ready to cut rates or buy more assets to prop up inflation if needed. President Trump backed off of tariff threats against Mexico and China. In the U.S., the Fed implemented a 0.25% federal funds rate cut in July.
Later in July, the U.S. reversed course and threatened to impose higher tariffs on China’s exports after talks failed. China responded with tariff threats of its own and devalued the renminbi, a move that roiled global markets. Major U.S. stock market indices closed July with the worst weekly results of the year. Bond prices gained as Treasury yields fell to multiyear lows, and the yield curve inverted at multiple points along the30-year arc.
In August, U.S.-China trade tensions continued with no signs of compromise. Evidence of a continued global economic slowdown mounted, and central banks in China, New Zealand, and Thailand cut interest rates. Industrial and manufacturing data declined in China, Canada, Japan, and Germany. Adding to global uncertainty, Italy’s prime minister resigned, many feared a crackdown in Hong Kong as protestors sustained their calls for reform, and Boris Johnson planned to suspend Parliament as Brexit’s deadline neared.
In the U.S., the Fed cut interest rates a second time in September. U.S. manufacturing data disappointed investors. The U.S. Congress announced it would pursue an impeachment investigation of President Trump. Meanwhile, the Brexit impasse showed no signs of resolution. Officials in China said that hitting the country’s economic growth goals for the year would be difficult considering the weight of tariffs and trade restrictions. Although the S&P 500 Index finished the third quarter with the bestyear-to-date returns in more than 20 years, concerns about future returns remained.
The fourth quarter started on a strong note, with U.S.-China trade tensions relaxing in October 2019 along with renewed optimism for a U.K. Brexit deal and positive macroeconomic data. The initial estimate of U.S. third-quarter GDP growth was a resilient 1.9% annualized rate, while the U.S. unemployment rate fell to a50-year low of 3.5% in September. However, despite resilience among U.S. consumers, business confidence declined while manufacturing activity contracted. Concerned with a potential economic slowdown, the Fed lowered interest rates another quarter point in late October, its third rate cut in four months. This helped push the S&P 500 Index to a newall-time high, while emerging market equities rallied and global bonds declined overall, reflecting a broad pickup in risk appetite.
Equity markets continued to rally in November despite ongoing geopolitical risks. Hopes for a U.S.-China trade deal buoyed investor confidence. U.S. business sentiment improved slightly, and manufacturing and services activity picked up. Throughout the month, central bank actions were on hold. With that positive backdrop, developed market equities outpaced those in emerging markets, and U.S. stocks, as reflected by the S&P 500 Index, outperformednon-U.S. stocks overall. While consumer confidence and purchasing manager activity rose in the eurozone, China reported weakening manufacturing and consumer data. Bond yields rose marginally, leading to slightly negative returns for global government and investment-grade corporate bonds.
“Equity markets continued to rally in November despite ongoing geopolitical risks.”
Wells Fargo VT Omega Growth Fund | 3
Letter to shareholders (unaudited)
Financial markets ended the year on a broadly positive note, with the U.S. and China reaching an accord on a Phase One trade deal, with some details to be worked out. That, along with the landslide win by thepro-Brexit U.K. Conservative Party in a national election and ongoing central bank support, gave investors greater certainty and confidence. U.S. economic indicators were generally positive, with the exception of manufacturing activity and business confidence. However, consumer confidence was resilient, fed by a robust labor market, tame inflation, and lower interest rates, which boosted housing affordability and stimulated homebuyer activity. The impeachment of U.S. President Donald Trump, while historically noteworthy, had little impact on markets. Meanwhile, slowing Chinese economic activity, partly attributable to the trade war, led to further government stimulus atyear-end through lower reserve ratios, allowing banks to lend more money.
Don’t let short-term uncertainty derail long-term investment goals.
Periods of investment uncertainty can present challenges, but experience has taught us that maintaining long-term investment goals can be an effective way to plan for the future. To help you create a sound strategy based on your personal goals and risk tolerance, Wells Fargo Funds offers more than 100 mutual funds spanning a wide range of asset classes and investment styles. Although diversification cannot guarantee an investment profit or prevent losses, we believe it can be an effective way to manage investment risk and potentially smooth out overall portfolio performance. We encourage investors to know their investments and to understand that appropriate levels of risk-taking may unlock opportunities.
Thank you for choosing to invest with Wells Fargo Funds. We appreciate your confidence in us and remain committed to helping you meet your financial needs.
Sincerely,

Andrew Owen
President
Wells Fargo Funds
|
|
|
For further information about your Fund, contact your investment professional, visit our website at wfam.com, or call us directly at1-800-260-5969. |
4 | Wells Fargo VT Omega Growth Fund
This page is intentionally left blank.
Performance highlights (unaudited)
Investment objective
The Fund seeks long-term capital appreciation.
Manager
Wells Fargo Funds Management, LLC
Subadviser
Wells Capital Management Incorporated
Portfolio managers
Michael T. Smith, CFA®‡
Christopher J. Warner, CFA®‡
Average annual total returns (%) as of December 31, 20191
| | | | | | | | | | | | | | | | | | | | | | |
| | | | | |
| | | | | | | | | | | | | | Expense ratios2 (%) | |
| | | | | | |
| | | Inception date | | 1 year | | | 5 year | | | 10 year | | | Gross | | | Net3 | |
| | | | | | | |
| Class 1 | | 3-6-1997 | | | 37.39 | | | | 13.80 | | | | 14.32 | | | | 0.81 | | | | 0.75 | |
| | | | | | | |
| Class 2 | | 7-31-2002 | | | 37.04 | | | | 13.51 | | | | 14.04 | | | | 1.06 | | | | 1.00 | |
| | | | | | | |
| Russell 3000® Growth Index4 | | – | | | 35.85 | | | | 14.23 | | | | 15.05 | | | | – | | | | – | |
Figures quoted represent past performance, which is no guarantee of future results. Investment return and principal value of an investment will fluctuate so that an investor’s shares, when redeemed, may be worth more or less than their original cost. Current performance may be lower or higher than the performance data quoted and assumes the reinvestment of dividends and capital gains. Current month-end performance is available by calling 1-800-260-5969. Performance figures of the Fund do not reflect fees and expenses charged pursuant to the terms of variable life insurance policies and variable annuity contracts. If these fees and expenses had been reflected, performance would have been lower.
Please keep in mind that high double-digit returns were primarily achieved during favorable market conditions. You should not expect that such favorable returns can be consistently achieved. A fund’s performance, especially for short time periods, should not be the sole factor in making your investment decision.
Shares are sold without a front-end sales charge or contingent deferred sales charge.
Index returns do not include transaction costs associated with buying and selling securities, any mutual fund fees or expenses, or any taxes. It is not possible to invest directly in an index.
Stock values fluctuate in response to the activities of individual companies and general market and economic conditions. Certain investment strategies tend to increase the total risk of an investment (relative to the broader market). Foreign investments are especially volatile and can rise or fall dramatically due to differences in the political and economic conditions of the host country. These risks are generally intensified in emerging markets. The Fund is exposed to smaller company securities risk. Consult the Fund’s prospectuses for additional information on these and other risks.
Please refer to the prospectuses provided by your participating insurance company for detailed information describing the separate accounts for information regarding surrender charges, mortality and expense risk fees, and other charges that may be assessed by the participating insurance companies.
Please see footnotes on page 7.
6 | Wells Fargo VT Omega Growth Fund
Performance highlights (unaudited)
|
|
| Growth of $10,000 investment as of December 31, 20195 |
|
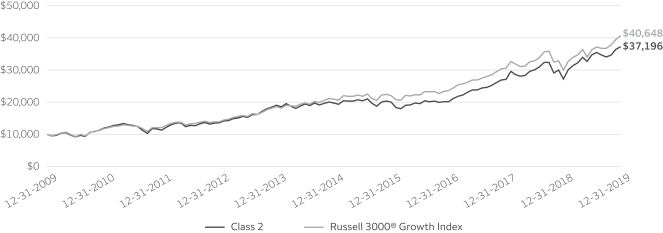
|
| ‡ | CFA® and Chartered Financial Analyst® are trademarks owned by CFA Institute. |
| 1 | Historical performance shown prior to July 19, 2010 is based on the performance of the Fund’s predecessor, Evergreen VA Omega Fund. |
| 2 | Reflects the expense ratios as stated in the most recent prospectuses. The expense ratios shown are subject to change and may differ from the annualized expense ratios shown in the financial highlights of this report. |
| 3 | The manager has contractually committed through April 30, 2020, to waive fees and/or reimburse expenses to the extent necessary to cap total annual fund operating expenses after fee waivers at 0.75% for Class 1 and 1.00% for Class 2. Brokerage commissions, stamp duty fees, interest, taxes, acquired fund fees and expenses (if any), and extraordinary expenses are excluded from the expense cap. Prior to or after the commitment expiration date, the cap may be increased or the commitment to maintain the cap may be terminated only with the approval of the Board of Trustees. Without this cap, the Fund’s returns would have been lower. The expense ratio paid by an investor is the net expense ratio (the total annual fund operating expenses after fee waivers) as stated in the prospectuses. |
| 4 | The Russell 3000® Growth Index measures the performance of those Russell 3000® Index companies with higher price/book ratios and higher forecasted growth values. You cannot invest directly in an index. |
| 5 | The chart compares the performance of Class 2 shares for the most recent ten years with the Russell 3000® Growth Index. The chart assumes a hypothetical $10,000 investment and reflects all operating expenses of the Fund but does not reflect fees and expenses charged pursuant to the terms of variable life insurance policies and variable annuity contracts. |
| 6 | The ten largest holdings, excluding cash, cash equivalents and any money market funds, are calculated based on the value of the investments divided by total net assets of the Fund. Holdings are subject to change and may have changed since the date specified. |
| 7 | Amounts are calculated based on the total long-term investments of the Fund. These amounts are subject to change and may have changed since the date specified. |
Wells Fargo VT Omega Growth Fund | 7
Performance highlights (unaudited)
MANAGER’S DISCUSSION
Fund highlights
| ∎ | | The Fund outperformed its benchmark, the Russell 3000® Growth Index, for the 12-month period that ended December 31, 2019. |
| ∎ | | Stock selection in the consumer discretionary and information technology (IT) sectors contributed to the Fund’s results. |
| ∎ | | Select holdings in the communication services and financials sectors detracted from relative performance. |
For much of 2019, investors faced a malaise of uncertainty driven by recession risks and global trade fears. However, as is often the case when consensus expectations fall heavily to one side, this fearful mood created a favorable setup as incrementally positive news arrived. Toward year-end, central bank policy, leading economic data, and trade negotiations all saw positive developments. This sparked a rise in animal spirits and released pent-up demand for global risk assets, triggering a steepening of yield curves around the world. Within equities, the year ended with a risk-on rally of near textbook fashion. Cyclical outperformed defensive sectors as investors embraced emerging markets, small caps, and high-beta stocks. A notable exception to the beta rally was the continued outperformance of leading growth equities. Many of these innovative, next-generation companies are considered more defensive based on their outlooks for durable and consistent earnings growth. Therefore, it was notable that even during a synchronized global rally, the growth style of investing maintained leadership.
| | | | |
|
| Ten largest holdings (%) as of December 31, 20196 | |
| | |
Microsoft Corporation | | | 9.15 | |
| | |
Amazon.com Incorporated | | | 5.84 | |
| | |
Visa Incorporated Class A | | | 4.19 | |
| | |
Alphabet Incorporated Class A | | | 4.01 | |
| | |
UnitedHealth Group Incorporated | | | 3.69 | |
| | |
Merck & Company Incorporated | | | 2.73 | |
| | |
Waste Connections Incorporated | | | 2.23 | |
| | |
Boston Scientific Corporation | | | 2.12 | |
| | |
The Sherwin-Williams Company | | | 2.12 | |
| | |
ServiceNow Incorporated | | | 2.10 | |
Stock selection benefited the Fund’s relative performance, especially within consumer discretionary and IT.
Within the IT sector, the Fund’s position in Shopify Incorporated contributed to returns. Shopify, a provider of e-commerce solutions for direct-to-consumer brands, traditionally focuses on small and medium-size businesses but is currently penetrating larger businesses via its Shopify Plus offering. Shopify benefits from its customers’ growth by processing payments for smaller customers and charging a fee on each transaction for larger customers. The company’s two vectors of growth—new customers and revenue expansion of existing customers—drove higher-than-expected financial results.
Within consumer discretionary, MercadoLibre, Incorporated, added to returns. MercadoLibre is the dominant Latin Americane-commerce provider and owns MercadoPago, the leading online payment solution in Latin America. Increased e-commerce penetration in MercadoLibre’s key markets, such as Brazil and Argentina, drove higher sales growth. Customers’ use of MercadoPago both on and off MercadoLibre’s e-commerce marketplace drove outperformance for the shares.
|
|
| Sector distribution as of December 31, 20197 |
|
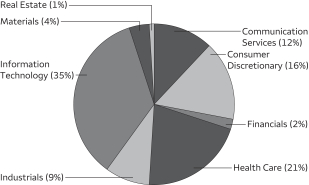 |
Stock selection in the communication services sector negatively affected the Fund’s relative performance.
Within communication services, Take-Two Interactive Software, Incorporated, weighed on relative performance. Take-Two is a video game creator best known for titles such as NBA 2K and Grand Theft Auto. In the first part of the year, fears of competition from Fortnite and concerns about the growth of the live services for the company’s key game franchises hurt sentiment for the shares.
Also within communication services, shares of Tencent Holdings Limited detracted from performance. Tencent Holdings owns the leading social app in China and distributes video games throughout the country. Concerns that a weak Chinese economy and shifting regulations would hurt demand for the company’s services impeded performance of the shares.
Please see footnotes on page 7.
8 | Wells Fargo VT Omega Growth Fund
Performance highlights (unaudited)
While market volatility will likely continue in 2020, we remain confident in the Fund’s positioning.
Despite the high level of macroeconomic uncertainty, our approach is to remain focused on businesses on the right side of change. We believe the U.S. economy may continue to expand but at weaker levels than many currently expect. This is due mainly to structural forces of weakening population and labor market growth. Simultaneously, we expect the pace of innovation and disruption to accelerate. We expect major industries, including financial services, health care, and transportation, to face significant disruption in the years to come. As new technologies become more pervasive throughout the economy, exciting opportunities could arise for portfolio managers with skill at navigating change. As we have seen from many leading technology stocks, this disruption can lead to superior profit growth that is extremely valuable in a slow-growth world. We are excited that the scarcity premium for growth stocks appears poised to create a favorable environment for our investment style in 2020.
Wells Fargo VT Omega Growth Fund | 9
Fund expenses (unaudited)
As a shareholder of the Fund, you incur ongoing costs, including management fees, distribution (12b-1) fees, and other Fund expenses. This example is intended to help you understand your ongoing costs (in dollars) of investing in the Fund and to compare these costs with the ongoing costs of investing in other mutual funds.
The example is based on an investment of $1,000 invested at the beginning of the six-month period and held for the entire period from July 1, 2019 to December 31, 2019.
Actual expenses
The “Actual” line of the table below provides information about actual account values and actual expenses. You may use the information in this line, together with the amount you invested, to estimate the expenses that you paid over the period. Simply divide your account value by $1,000 (for example, an $8,600 account value divided by $1,000 = 8.6), then multiply the result by the number in the “Actual” line under the heading entitled “Expenses Paid During Period” for your applicable class of shares to estimate the expenses you paid on your account during this period.
Hypothetical example for comparison purposes
The “Hypothetical” line of the table below provides information about hypothetical account values and hypothetical expenses based on the Fund’s actual expense ratio and an assumed rate of return of 5% per year before expenses, which is not the Fund’s actual return. The hypothetical account values and expenses may not be used to estimate the actual ending account balance or expenses you paid for the period. You may use this information to compare the ongoing costs of investing in the Fund and other funds. To do so, compare this 5% hypothetical example with the 5% hypothetical examples that appear in the shareholder reports of the other funds.
Please note that the expenses shown in the table are meant to highlight your ongoing costs only and do not reflect any separate account charges assessed by participating insurance companies. Therefore, the “Hypothetical” line of the table is useful in comparing ongoing costs only, and will not help you determine the relative total costs of owning different funds. In addition, if these separate account charges assessed by participating insurance companies were included, your costs would have been higher.
| | | | | | | | | | | | | | | | |
| | | Beginning
account value
7-1-2019 | | | Ending
account value
12-31-2019 | | | Expenses
paid during
the period¹ | | | Annualized net
expense ratio | |
| | | | | |
Class 1 | | | | | | | | | | | | | | | | |
| | | | |
Actual | | $ | 1,000.00 | | | $ | 1,073.25 | | | $ | 3.92 | | | | 0.75 | % |
| | | | |
Hypothetical (5% return before expenses) | | $ | 1,000.00 | | | $ | 1,021.42 | | | $ | 3.82 | | | | 0.75 | % |
| | | | | |
Class 2 | | | | | | | | | | | | | | | | |
| | | | |
Actual | | $ | 1,000.00 | | | $ | 1,071.80 | | | $ | 5.22 | | | | 1.00 | % |
| | | | |
Hypothetical (5% return before expenses) | | $ | 1,000.00 | | | $ | 1,020.17 | | | $ | 5.09 | | | | 1.00 | % |
| 1 | Expenses paid is equal to the annualized net expense ratio of each class multiplied by the average account value over the period, multiplied by the number of days in the most recent fiscal half-year divided by the number of days in the fiscal year (to reflect the one-half year period). |
10 | Wells Fargo VT Omega Growth Fund
Portfolio of investments—December 31, 2019
| | | | | | | | | | | | | | | | |
| | | | | | | | | Shares | | | Value | |
| Common Stocks: 99.41% | | | | | | | | | | | | | | | | |
| | | | |
Communication Services: 11.76% | | | | | | | | | | | | | | | | |
| | | | |
| Entertainment: 3.89% | | | | | | | | | | | | |
Netflix Incorporated † | | | | | | | | | | | 4,000 | | | $ | 1,294,280 | |
Nintendo Company Limited ADR | | | | | | | | | | | 24,500 | | | | 1,222,550 | |
Take-Two Interactive Software Incorporated † | | | | | | | | | | | 8,300 | | | | 1,016,169 | |
| | | | |
| | | | | | | | | | | | | | | 3,532,999 | |
| | | | | | | | | | | | | | | | |
| | | | |
| Interactive Media & Services: 7.87% | | | | | | | | | | | | |
Alphabet Incorporated Class A † | | | | | | | | | | | 2,720 | | | | 3,643,141 | |
Alphabet Incorporated Class C † | | | | | | | | | | | 789 | | | | 1,054,909 | |
IAC Corporation † | | | | | | | | | | | 5,500 | | | | 1,370,105 | |
Tencent Holdings Limited ADR « | | | | | | | | | | | 22,500 | | | | 1,080,225 | |
| | | | |
| | | | | | | | | | | | | | | 7,148,380 | |
| | | | | | | | | | | | | | | | |
| | | | |
Consumer Discretionary: 16.07% | | | | | | | | | | | | | | | | |
| | | | |
| Auto Components: 1.39% | | | | | | | | | | | | |
Aptiv plc | | | | | | | | | | | 13,300 | | | | 1,263,101 | |
| | | | | | | | | | | | | | | | |
| | | | |
| Automobiles: 0.88% | | | | | | | | | | | | |
Ferrari NV | | | | | | | | | | | 4,800 | | | | 794,592 | |
| | | | | | | | | | | | | | | | |
| | | | |
| Diversified Consumer Services: 1.09% | | | | | | | | | | | | |
Bright Horizons Family Solutions Incorporated † | | | | | | | | | | | 6,600 | | | | 991,914 | |
| | | | | | | | | | | | | | | | |
| | | | |
| Hotels, Restaurants & Leisure: 4.26% | | | | | | | | | | | | |
Chipotle Mexican Grill Incorporated † | | | | | | | | | | | 1,700 | | | | 1,423,087 | |
Domino’s Pizza Incorporated | | | | | | | | | | | 4,500 | | | | 1,322,010 | |
Vail Resorts Incorporated | | | | | | | | | | | 4,700 | | | | 1,127,201 | |
| | | | |
| | | | | | | | | | | | | | | 3,872,298 | |
| | | | | | | | | | | | | | | | |
| | | | |
| Internet & Direct Marketing Retail: 7.03% | | | | | | | | | | | | |
Amazon.com Incorporated † | | | | | | | | | | | 2,870 | | | | 5,303,301 | |
MercadoLibre Incorporated † | | | | | | | | | | | 1,900 | | | | 1,086,686 | |
| | | | |
| | | | | | | | | | | | | | | 6,389,987 | |
| | | | | | | | | | | | | | | | |
| | | | |
| Specialty Retail: 1.42% | | | | | | | | | | | | |
The Home Depot Incorporated | | | | | | | | | | | 5,900 | | | | 1,288,442 | |
| | | | | | | | | | | | | | | | |
| | | | |
| Financials: 2.54% | | | | | | | | | | | | |
| | | | |
| Capital Markets: 2.54% | | | | | | | | | | | | |
Intercontinental Exchange Incorporated | | | | | | | | | | | 15,900 | | | | 1,471,545 | |
Raymond James Financial Incorporated | | | | | | | | | | | 9,306 | | | | 832,515 | |
| | | | |
| | | | | | | | | | | | | | | 2,304,060 | |
| | | | | | | | | | | | | | | | |
| | | | |
| Health Care: 20.94% | | | | | | | | | | | | |
| | | | |
| Biotechnology: 1.15% | | | | | | | | | | | | |
Exact Sciences Corporation † | | | | | | | | | | | 7,900 | | | | 730,592 | |
Sarepta Therapeutics Incorporated † | | | | | | | | | | | 2,400 | | | | 309,696 | |
| | | | |
| | | | | | | | | | | | | | | 1,040,288 | |
| | | | | | | | | | | | | | | | |
The accompanying notes are an integral part of these financial statements.
Wells Fargo VT Omega Growth Fund | 11
Portfolio of investments—December 31, 2019
| | | | | | | | | | | | | | | | |
| | | | | | | | | Shares | | | Value | |
| Health Care Equipment & Supplies: 8.96% | | | | | | | | | | | | |
Alcon Incorporated † | | | | | | | | | | | 19,800 | | | $ | 1,120,086 | |
Align Technology Incorporated † | | | | | | | | | | | 3,700 | | | | 1,032,448 | |
Boston Scientific Corporation † | | | | | | | | | | | 42,682 | | | | 1,930,080 | |
DexCom Incorporated † | | | | | | | | | | | 6,700 | | | | 1,465,558 | |
Edwards Lifesciences Corporation † | | | | | | | | | | | 4,400 | | | | 1,026,476 | |
Intuitive Surgical Incorporated † | | | | | | | | | | | 2,650 | | | | 1,566,548 | |
| | | | |
| | | | | | | | | | | | | | | 8,141,196 | |
| | | | | | | | | | | | | | | | |
| | | | |
| Health Care Providers & Services: 4.98% | | | | | | | | | | | | |
HealthEquity Incorporated † | | | | | | | | | | | 15,855 | | | | 1,174,380 | |
UnitedHealth Group Incorporated | | | | | | | | | | | 11,400 | | | | 3,351,372 | |
| | | | |
| | | | | | | | | | | | | | | 4,525,752 | |
| | | | | | | | | | | | | | | | |
| | | | |
| Health Care Technology: 1.11% | | | | | | | | | | | | |
Veeva Systems Incorporated Class A † | | | | | | | | | | | 7,200 | | | | 1,012,752 | |
| | | | | | | | | | | | | | | | |
| | | | |
| Life Sciences Tools & Services: 1.06% | | | | | | | | | | | | |
Illumina Incorporated † | | | | | | | | | | | 2,900 | | | | 962,046 | |
| | | | | | | | | | | | | | | | |
| | | | |
| Pharmaceuticals: 3.68% | | | | | | | | | | | | |
Elanco Animal Health Incorporated † | | | | | | | | | | | 29,192 | | | | 859,704 | |
Eli Lilly & Company | | | | | | | | | | | 1 | | | | 131 | |
Merck & Company Incorporated | | | | | | | | | | | 27,300 | | | | 2,482,935 | |
| | | | |
| | | | | | | | | | | | | | | 3,342,770 | |
| | | | | | | | | | | | | | | | |
| | | | |
Industrials: 8.58% | | | | | | | | | | | | | | | | |
| | | | |
| Commercial Services & Supplies: 3.54% | | | | | | | | | | | | |
Cintas Corporation | | | | | | | | | | | 4,400 | | | | 1,183,952 | |
Waste Connections Incorporated | | | | | | | | | | | 22,346 | | | | 2,028,793 | |
| | | | |
| | | | | | | | | | | | | | | 3,212,745 | |
| | | | | | | | | | | | | | | | |
| | | | |
| Construction & Engineering: 1.25% | | | | | | | | | | | | |
Jacobs Engineering Group Incorporated | | | | | | | | | | | 12,700 | | | | 1,140,841 | |
| | | | | | | | | | | | | | | | |
| | | | |
| Professional Services: 1.78% | | | | | | | | | | | | |
IHS Markit Limited † | | | | | | | | | | | 21,500 | | | | 1,620,025 | |
| | | | | | | | | | | | | | | | |
| | | | |
| Road & Rail: 2.01% | | | | | | | | | | | | |
Union Pacific Corporation | | | | | | | | | | | 10,100 | | | | 1,825,979 | |
| | | | | | | | | | | | | | | | |
| | | | |
Information Technology: 34.63% | | | | | | | | | | | | | | | | |
| | | | |
| Communications Equipment: 1.70% | | | | | | | | | | | | |
Motorola Solutions Incorporated | | | | | | | | | | | 9,600 | | | | 1,546,944 | |
| | | | | | | | | | | | | | | | |
| | | | |
| Electronic Equipment, Instruments & Components: 1.24% | | | | | | | | | | | | |
Zebra Technologies Corporation Class A † | | | | | | | | | | | 4,400 | | | | 1,123,936 | |
| | | | | | | | | | | | | | | | |
| | | | |
| IT Services: 19.01% | | | | | | | | | | | | |
Black Knight Incorporated † | | | | | | | | | | | 23,900 | | | | 1,541,072 | |
EPAM Systems Incorporated † | | | | | | | | | | | 8,115 | | | | 1,721,678 | |
Euronet Worldwide Incorporated † | | | | | | | | | | | 9,900 | | | | 1,559,844 | |
Fiserv Incorporated † | | | | | | | | | | | 14,595 | | | | 1,687,620 | |
Global Payments Incorporated | | | | | | | | | | | 9,271 | | | | 1,692,514 | |
PayPal Holdings Incorporated † | | | | | | | | | | | 17,200 | | | | 1,860,524 | |
Shopify Incorporated Class A † | | | | | | | | | | | 2,600 | | | | 1,033,708 | |
The accompanying notes are an integral part of these financial statements.
12 | Wells Fargo VT Omega Growth Fund
Portfolio of investments—December 31, 2019
| | | | | | | | | | | | | | | | |
| | | | | | | | | Shares | | | Value | |
| | | | |
| IT Services (continued) | | | | | | | | | | | | |
Square Incorporated Class A † | | | | | | | | | | | 13,100 | | | $ | 819,536 | |
Visa Incorporated Class A | | | | | | | | | | | 20,244 | | | | 3,803,848 | |
WEX Incorporated † | | | | | | | | | | | 7,412 | | | | 1,552,518 | |
| | | | |
| | | | | | | | | | | | | | | 17,272,862 | |
| | | | | | | | | | | | | | | | |
| | | | |
| Software: 12.68% | | | | | | | | | | | | |
Autodesk Incorporated † | | | | | | | | | | | 7,100 | | | | 1,302,566 | |
Microsoft Corporation | | | | | | | | | | | 52,700 | | | | 8,310,788 | |
ServiceNow Incorporated † | | | | | | | | | | | 6,750 | | | | 1,905,660 | |
| | | | |
| | | | | | | | | | | | | | | 11,519,014 | |
| | | | | | | | | | | | | | | | |
| | | | |
Materials: 4.33% | | | | | | | | | | | | | | | | |
| | | | |
| Chemicals: 2.95% | | | | | | | | | | | | |
Ingevity Corporation † | | | | | | | | | | | 8,600 | | | | 751,468 | |
The Sherwin-Williams Company | | | | | | | | | | | 3,300 | | | | 1,925,682 | |
| | | | |
| | | | | | | | | | | | | | | 2,677,150 | |
| | | | | | | | | | | | | | | | |
| | | | |
| Construction Materials: 1.38% | | | | | | | | | | | | |
Vulcan Materials Company | | | | | | | | | | | 8,700 | | | | 1,252,713 | |
| | | | | | | | | | | | | | | | |
| | | | |
Real Estate: 0.56% | | | | | | | | | | | | | | | | |
| | | | |
| Equity REITs: 0.56% | | | | | | | | | | | | |
SBA Communications Corporation | | | | | | | | | | | 2,100 | | | | 506,079 | |
| | | | | | | | | | | | | | | | |
| | | | |
Total Common Stocks (Cost $50,214,937) | | | | | | | | | | | | | | | 90,308,865 | |
| | | | | | | | | | | | | | | | |
| | | | |
| | | | | | | | | | | | | | | | |
| | | Yield | | | | | | | | | | |
| Short-Term Investments: 1.77% | | | | | | | | | | | | |
| | | | |
| Investment Companies: 1.77% | | | | | | | | | | | | |
Securities Lending Cash Investments LLC (l)(r)(u) | | | 1.73 | % | | | | | | | 1,089,417 | | | | 1,089,526 | |
Wells Fargo Government Money Market Fund Select Class (l)(u) | | | 1.55 | | | | | | | | 515,647 | | | | 515,647 | |
| | | | |
Total Short-Term Investments (Cost $1,605,173) | | | | | | | | | | | | | | | 1,605,173 | |
| | | | | | | | | | | | | | | | |
| | | | | | | | |
| Total investments in securities (Cost $51,820,110) | | | 101.18 | % | | | 91,914,038 | |
| | |
Other assets and liabilities, net | | | (1.18 | ) | | | (1,070,658 | ) |
| | | | | | | | |
| Total net assets | | | 100.00 | % | | $ | 90,843,380 | |
| | | | | | | | |
| † | Non-income-earning security |
| « | All or a portion of this security is on loan. |
| (l) | The issuer of the security is an affiliated person of the Fund as defined in the Investment Company Act of 1940. |
| (r) | The investment is anon-registered investment company purchased with cash collateral received from securities on loan. |
| (u) | The rate represents the7-day annualized yield at period end. |
Abbreviations:
| ADR | American depositary receipt |
| REIT | Real estate investment trust |
The accompanying notes are an integral part of these financial statements.
Wells Fargo VT Omega Growth Fund | 13
Portfolio of investments—December 31, 2019
Investments in Affiliates
An affiliated investment is an investment in which the Fund owns at least 5% of the outstanding voting shares of the issuer or as a result of other relationships, such as the Fund and the issuer having the same investment manager. Transactions with issuers that were either affiliated persons of the Fund at the beginning of the period or the end of the period were as follows:
| | | | | | | | | | | | | | | | | | | | | | | | | | | | | | | | | | | | |
| | | Shares,
beginning of
period | | | Shares
purchased | | | Shares
sold | | | Shares,
end of
period | | | Net
realized
gains
(losses) | | | Net
change in
unrealized
gains
(losses) | | | Income
from
affiliated
securities | | | Value,
end of
period | | | % of
net
assets | |
| | | | | | | | | |
| Short-Term Investments | | | | | | | | | | | | | | | | | | | | | | | | | | | |
Investment Companies | | | | | | | | | | | | | | | | | | | | | | | | | | | | | | | | | | | | |
Securities Lending Cash Investments LLC | | | 1,407,101 | | | | 10,262,572 | | | | (10,580,256 | ) | | | 1,089,417 | | | $ | 115 | | | $ | 0 | | | $ | 15,901 | # | | $ | 1,089,526 | | | | | |
Wells Fargo Government Money Market Fund Select Class | | | 535,572 | | | | 22,433,830 | | | | (22,453,755 | ) | | | 515,647 | | | | 0 | | | | 0 | | | | 17,875 | | | | 515,647 | | | | | |
| | | | | | | | | | | | | | | | | | | | | | | | | | | | | | | | | | | | |
| | | | | | | | | | | | | | | | | | $ | 115 | | | $ | 0 | | | $ | 33,776 | | | $ | 1,605,173 | | | | 1.77 | % |
| | | | | | | | | | | | | | | | | | | | | | | | | | | | | | | | | | | | |
| # | Amount shown represents income before fees and rebates. |
The accompanying notes are an integral part of these financial statements.
14 | Wells Fargo VT Omega Growth Fund
Statement of assets and liabilities—December 31, 2019
| | | | |
| | | | |
| |
Assets | | | | |
Investments in unaffiliated securities (including $1,055,679 of securities loaned), at value (cost $50,214,937) | | $ | 90,308,865 | |
Investments in affiliated securities, at value (cost $1,605,173) | | | 1,605,173 | |
Receivable for investments sold | | | 304,325 | |
Receivable for Fund shares sold | | | 4,905 | |
Receivable for dividends | | | 37,413 | |
Receivable for securities lending income, net | | | 203 | |
Prepaid expenses and other assets | | | 203 | |
| | | | |
Total assets | | | 92,261,087 | |
| | | | |
| |
Liabilities | | | | |
Payable upon receipt of securities loaned | | | 1,089,410 | |
Payable for investments purchased | | | 186,351 | |
Payable for Fund shares redeemed | | | 56,141 | |
Management fee payable | | | 42,405 | |
Administration fees payable | | | 6,313 | |
Distribution fee payable | | | 10,897 | |
Trustees’ fees and expenses payable | | | 6,393 | |
Accrued expenses and other liabilities | | | 19,797 | |
| | | | |
Total liabilities | | | 1,417,707 | |
| | | | |
Total net assets | | $ | 90,843,380 | |
| | | | |
| |
Net assets consist of | | | | |
Paid-in capital | | $ | 43,521,937 | |
Total distributable earnings | | | 47,321,443 | |
| | | | |
Total net assets | | $ | 90,843,380 | |
| | | | |
| |
Computation of net asset value per share | | | | |
Net assets – Class 1 | | $ | 40,000,770 | |
Shares outstanding – Class 11 | | | 1,254,485 | |
Net asset value per share – Class 1 | | | $31.89 | |
Net assets – Class 2 | | $ | 50,842,610 | |
Shares outstanding – Class 21 | | | 1,664,495 | |
Net asset value per share – Class 2 | | | $30.55 | |
| 1 | The Fund has an unlimited number of authorized shares. |
The accompanying notes are an integral part of these financial statements.
Wells Fargo VT Omega Growth Fund | 15
Statement of operations—year ended December 31, 2019
| | | | |
| | | | |
| |
Investment income | | | | |
Dividends (net of foreign withholding taxes of $8,733) | | $ | 565,587 | |
Income from affiliated securities | | | 29,226 | |
| | | | |
Total investment income | | | 594,813 | |
| | | | |
| |
Expenses | | | | |
Management fee | | | 534,426 | |
Administration fees | | | | |
Class 1 | | | 30,292 | |
Class 2 | | | 40,965 | |
Distribution fee | | | | |
Class 2 | | | 125,233 | |
Custody and accounting fees | | | 10,406 | |
Professional fees | | | 46,851 | |
Shareholder report expenses | | | 35,420 | |
Trustees’ fees and expenses | | | 21,652 | |
Other fees and expenses | | | 6,614 | |
| | | | |
Total expenses | | | 851,859 | |
Less: Fee waivers and/or expense reimbursements | | | | |
Fund-level | | | (53,972 | ) |
Class 1 | | | (2,185 | ) |
| | | | |
Net expenses | | | 795,702 | |
| | | | |
Net investment loss | | | (200,889 | ) |
| | | | |
| |
Realized and unrealized gains (losses) on investments | | | | |
Net realized gains on | | | | |
Unaffiliated securities | | | 7,507,427 | |
Affiliated securities | | | 115 | |
| | | | |
Net realized gains on investments | | | 7,507,542 | |
Net change in unrealized gains (losses) on investments | | | 20,470,814 | |
| | | | |
Net realized and unrealized gains (losses) on investments | | | 27,978,356 | |
| | | | |
Net increase in net assets resulting from operations | | $ | 27,777,467 | |
| | | | |
The accompanying notes are an integral part of these financial statements.
16 | Wells Fargo VT Omega Growth Fund
Statement of changes in net assets
| | | | | | | | | | | | | | | | |
| | | Year ended
December 31, 2019 | | | Year ended
December 31, 2018 | |
| | | |
Operations | | | | | | | | | | | | |
Net investment loss | | | | | | $ | (200,889 | ) | | | | | | $ | (237,527 | ) |
Net realized gains on investments | | | | | | | 7,507,542 | | | | | | | | 11,146,188 | |
Net change in unrealized gains (losses) on investments | | | | | | | 20,470,814 | | | | | | | | (9,518,553 | ) |
| | | | |
Net increase in net assets resulting from operations | | | | | | | 27,777,467 | | | | | | | | 1,390,108 | |
| | | | |
| | | |
Distributions to shareholders from net investment income and net realized gains | | | | | | | | | | | | |
Class 1 | | | | | | | (4,663,133 | ) | | | | | | | (3,962,536 | ) |
Class 2 | | | | | | | (6,195,458 | ) | | | | | | | (5,801,475 | ) |
| | | | |
Total distributions to shareholders | | | | | | | (10,858,591 | ) | | | | | | | (9,764,011 | ) |
| | | | |
| | | | |
Capital share transactions | | | Shares | | | | | | | | Shares | | | | | |
Proceeds from shares sold | | | | | | | | | | | | | | | | |
Class 1 | | | 73,112 | | | | 2,241,178 | | | | 74,692 | | | | 2,307,442 | |
Class 2 | | | 114,807 | | | | 3,406,537 | | | | 189,773 | | | | 5,507,051 | |
| | | | |
| | | | | | | 5,647,715 | | | | | | | | 7,814,493 | |
| | | | |
Reinvestment of distributions | | | | | | | | | | | | | | | | |
Class 1 | | | 152,191 | | | | 4,663,133 | | | | 130,820 | | | | 3,962,536 | |
Class 2 | | | 210,801 | | | | 6,195,458 | | | | 199,226 | | | | 5,801,475 | |
| | | | |
| | | | | | | 10,858,591 | | | | | | | | 9,764,011 | |
| | | | |
Payment for shares redeemed | | | | | | | | | | | | | | | | |
Class 1 | | | (228,659 | ) | | | (6,950,692 | ) | | | (282,285 | ) | | | (8,571,767 | ) |
Class 2 | | | (583,624 | ) | | | (17,173,879 | ) | | | (413,436 | ) | | | (12,110,737 | ) |
| | | | |
| | | | | | | (24,124,571 | ) | | | | | | | (20,682,504 | ) |
| | | | |
Net decrease in net assets resulting from capital share transactions | | | | | | | (7,618,265 | ) | | | | | | | (3,104,000 | ) |
| | | | |
Total increase (decrease) in net assets | | | | | | | 9,300,611 | | | | | | | | (11,477,903 | ) |
| | | | |
| | |
Net assets | | | | | | | | |
Beginning of period | | | | | | | 81,542,769 | | | | | | | | 93,020,672 | |
| | | | |
End of period | | | | | | $ | 90,843,380 | | | | | | | $ | 81,542,769 | |
| | | | |
The accompanying notes are an integral part of these financial statements.
Wells Fargo VT Omega Growth Fund | 17
Financial highlights
(For a share outstanding throughout each period)
| | | | | | | | | | | | | | | | | | | | |
| | | Year ended December 31 | |
| CLASS 1 | | 2019 | | | 2018 | | | 2017 | | | 2016 | | | 2015 | |
Net asset value, beginning of period | | | $26.27 | | | | $28.99 | | | | $22.20 | | | | $23.30 | | | | $27.57 | |
Net investment income (loss) | | | (0.03 | )1 | | | (0.03 | )1 | | | (0.02 | )1 | | | 0.10 | | | | (0.03 | ) |
Net realized and unrealized gains (losses) on investments | | | 9.69 | | | | 0.62 | | | | 7.68 | | | | 0.05 | | | | 0.52 | |
| | | | | | | | | | | | | | | | | | | | |
Total from investment operations | | | 9.66 | | | | 0.59 | | | | 7.66 | | | | 0.15 | | | | 0.49 | |
Distributions to shareholders from | | | | | | | | | | | | | | | | | | | | |
Net investment income | | | 0.00 | | | | 0.00 | | | | (0.06 | ) | | | 0.00 | | | | 0.00 | |
Net realized gains | | | (4.04 | ) | | | (3.31 | ) | | | (0.81 | ) | | | (1.25 | ) | | | (4.76 | ) |
| | | | | | | | | | | | | | | | | | | | |
Total distributions to shareholders | | | (4.04 | ) | | | (3.31 | ) | | | (0.87 | ) | | | (1.25 | ) | | | (4.76 | ) |
Net asset value, end of period | | | $31.89 | | | | $26.27 | | | | $28.99 | | | | $22.20 | | | | $23.30 | |
Total return2 | | | 37.39 | % | | | 0.52 | % | | | 34.95 | % | | | 0.77 | % | | | 1.62 | % |
Ratios to average net assets (annualized) | | | | | | | | | | | | | | | | | | | | |
Gross expenses | | | 0.82 | % | | | 0.81 | % | | | 0.82 | % | | | 0.82 | % | | | 0.79 | % |
Net expenses | | | 0.75 | % | | | 0.75 | % | | | 0.75 | % | | | 0.75 | % | | | 0.75 | % |
Net investment income (loss) | | | (0.08 | )% | | | (0.10 | )% | | | (0.07 | )% | | | 0.26 | % | | | (0.11 | )% |
Supplemental data | | | | | | | | | | | | | | | | | | | | |
Portfolio turnover rate | | | 31 | % | | | 46 | % | | | 67 | % | | | 90 | % | | | 101 | % |
Net assets, end of period (000s omitted) | | | $40,001 | | | | $33,043 | | | | $38,687 | | | | $33,373 | | | | $40,362 | |
| 1 | Calculated based upon average shares outstanding |
| 2 | Returns do not reflect fees and expenses charged pursuant to the terms of variable life insurance policies and variable annuity contracts. |
The accompanying notes are an integral part of these financial statements.
18 | Wells Fargo VT Omega Growth Fund
Financial highlights
(For a share outstanding throughout each period)
| | | | | | | | | | | | | | | | | | | | |
| | | Year ended December 31 | |
| CLASS 2 | | 2019 | | | 2018 | | | 2017 | | | 2016 | | | 2015 | |
Net asset value, beginning of period | | | $25.23 | | | | $27.91 | | | | $21.38 | | | | $22.54 | | | | $26.89 | |
Net investment income (loss) | | | (0.10 | )1 | | | (0.11 | ) | | | (0.08 | ) | | | 0.00 | 1,2 | | | (0.09 | ) |
Net realized and unrealized gains (losses) on investments | | | 9.29 | | | | 0.61 | | | | 7.39 | | | | 0.09 | | | | 0.50 | |
| | | | | | | | | | | | | | | | | | | | |
Total from investment operations | | | 9.19 | | | | 0.50 | | | | 7.31 | | | | 0.09 | | | | 0.41 | |
Distributions to shareholders from | | | | | | | | | | | | | | | | | | | | |
Net investment income | | | 0.00 | | | | 0.00 | | | | (0.00 | )2 | | | 0.00 | | | | 0.00 | |
Net realized gains | | | (3.87 | ) | | | (3.18 | ) | | | (0.78 | ) | | | (1.25 | ) | | | (4.76 | ) |
| | | | | | | | | | | | | | | | | | | | |
Total distributions to shareholders | | | (3.87 | ) | | | (3.18 | ) | | | (0.78 | ) | | | (1.25 | ) | | | (4.76 | ) |
Net asset value, end of period | | | $30.55 | | | | $25.23 | | | | $27.91 | | | | $21.38 | | | | $22.54 | |
Total return3 | | | 37.04 | % | | | 0.28 | % | | | 34.60 | % | | | 0.52 | % | | | 1.34 | % |
Ratios to average net assets (annualized) | | | | | | | | | | | | | | | | | | | | |
Gross expenses | | | 1.06 | % | | | 1.06 | % | | | 1.07 | % | | | 1.07 | % | | | 1.04 | % |
Net expenses | | | 1.00 | % | | | 1.00 | % | | | 1.00 | % | | | 1.00 | % | | | 1.00 | % |
Net investment income (loss) | | | (0.33 | )% | | | (0.35 | )% | | | (0.31 | )% | | | 0.01 | % | | | (0.36 | )% |
Supplemental data | | | | | | | | | | | | | | | | | | | | |
Portfolio turnover rate | | | 31 | % | | | 46 | % | | | 67 | % | | | 90 | % | | | 101 | % |
Net assets, end of period (000s omitted) | | | $50,843 | | | | $48,500 | | | | $54,334 | | | | $42,684 | | | | $49,963 | |
| 1 | Calculated based upon average shares outstanding |
| 2 | Amount is less than $0.005. |
| 3 | Returns do not reflect fees and expenses charged pursuant to the terms of variable life insurance policies and variable annuity contracts. |
The accompanying notes are an integral part of these financial statements.
Wells Fargo VT Omega Growth Fund | 19
Notes to financial statements
1. ORGANIZATION
Wells Fargo Variable Trust (the “Trust”), a Delaware statutory trust organized on March 10, 1999, is anopen-end management investment company registered under the Investment Company Act of 1940, as amended (the “1940 Act”). As an investment company, the Trust follows the accounting and reporting guidance in Financial Accounting Standards Board (“FASB”)Accounting Standards Codification Topic 946, Financial Services – Investment Companies. These financial statements report on the Wells Fargo VT Omega Growth Fund (the “Fund”) which is a diversified series of the Trust. The Trust offers shares of the Fund to separate accounts of various life insurance companies as funding vehicles for certain variable annuity contracts and variable life insurance policies.
2. SIGNIFICANT ACCOUNTING POLICIES
The following significant accounting policies, which are consistently followed in the preparation of the financial statements of the Fund, are in conformity with U.S. generally accepted accounting principles which require management to make estimates and assumptions that affect the reported amounts of assets and liabilities, disclosure of contingent assets and liabilities at the date of the financial statements, and the reported amounts of revenues and expenses during the reporting period. Actual results could differ from those estimates.
Securities valuation
All investments are valued each business day as of the close of regular trading on the New York Stock Exchange (generally 4 p.m. Eastern Time), although the Fund may deviate from this calculation time under unusual or unexpected circumstances.
Equity securities that are listed on a foreign or domestic exchange or market are valued at the official closing price or, if none, the last sales price. If no sale occurs on the principal exchange or market that day, a fair value price will be determined in accordance with the Fund’s Valuation Procedures.
Investments in registeredopen-end investment companies are valued at net asset value. Interests innon-registered investment companies that are redeemable at net asset value are fair valued normally at net asset value.
Investments which are not valued using any of the methods discussed above are valued at their fair value, as determined in good faith by the Board of Trustees of the Fund. The Board of Trustees has established a Valuation Committee comprised of the Trustees and has delegated to it the authority to take any actions regarding the valuation of portfolio securities that the Valuation Committee deems necessary or appropriate, including determining the fair value of portfolio securities, unless the determination has been delegated to the Wells Fargo Asset Management Pricing Committee at Wells Fargo Funds Management, LLC (“Funds Management”). The Board of Trustees retains the authority to make or ratify any valuation decisions or approve any changes to the Valuation Procedures as it deems appropriate. On a quarterly basis, the Board of Trustees receives reports on any valuation actions taken by the Valuation Committee or the Wells Fargo Asset Management Pricing Committee which may include items for ratification.
Securities lending
The Fund may lend its securities from time to time in order to earn additional income in the form of fees or interest on securities received as collateral or the investment of any cash received as collateral. When securities are on loan, the Fund receives interest or dividends on those securities. Cash collateral received in connection with its securities lending transactions is invested in Securities Lending Cash Investments, LLC (the “Securities Lending Fund”). Investments in Securities Lending Fund are valued at the evaluated bid price provided by an independent pricing service. Income earned from investment in the Securities Lending Fund (net of fees and rebates), if any, is included in income from affiliated securities on the Statement of Operations.
In a securities lending transaction, the net asset value of the Fund is affected by an increase or decrease in the value of the securities loaned and by an increase or decrease in the value of the instrument in which collateral is invested. The amount of securities lending activity undertaken by the Fund fluctuates from time to time. The Fund has the right under the lending agreement to recover the securities from the borrower on demand. In the event of default or bankruptcy by the borrower, the Fund may be prevented from recovering the loaned securities or gaining access to the collateral or may experience delays or costs in doing so. In such an event, the terms of the agreement allows the unaffiliated securities lending agent to use the collateral to purchase replacement securities on behalf of the Fund or pay the Fund the market value of the loaned securities. The Fund bears the risk of loss with respect to depreciation of its investment of the cash collateral.
Security transactions and income recognition
Securities transactions are recorded on a trade date basis. Realized gains or losses are recorded on the basis of identified cost.
Dividend income is recognized on theex-dividend date. Dividend income is recorded net of foreign taxes withheld where recovery of such taxes is not assured.
20 | Wells Fargo VT Omega Growth Fund
Notes to financial statements
Distributions to shareholders
Distributions to shareholders from net investment income and any net realized gains are recorded on theex-dividend date and paid at least annually. Such distributions are determined in accordance with income tax regulations and may differ from U.S. generally accepted accounting principles. Dividend sources are estimated at the time of declaration. The tax character of distributions is determined as of the Fund’s fiscal year end. Therefore, a portion of the Fund’s distributions made prior to the Fund’s fiscal year end may be categorized as a tax return of capital at year end.
Federal and other taxes
The Fund intends to continue to qualify as a regulated investment company by distributing substantially all of its investment company taxable income and any net realized capital gains (after reduction for capital loss carryforwards) sufficient to relieve it from all, or substantially all, federal income taxes. Accordingly, no provision for federal income taxes was required.
The Fund’s income and federal excise tax returns and all financial records supporting those returns for the prior three fiscal years are subject to examination by the federal and Delaware revenue authorities. Management has analyzed the Fund’s tax positions taken on federal, state, and foreign tax returns for all open tax years and does not believe that there are any uncertain tax positions that require recognition of a tax liability.
As of December 31, 2019, the aggregate cost of all investments for federal income tax purposes was $51,880,310 and the unrealized gains (losses) consisted of:
| | | | |
| |
Gross unrealized gains | | $ | 40,448,633 | |
| |
Gross unrealized losses | | | (414,905 | ) |
| |
Net unrealized gains | | $ | 40,033,728 | |
Class allocations
The separate classes of shares offered by the Fund differ principally in distribution fees. Class specific expenses are charged directly to that share class. Investment income, common fund-level expenses, and realized and unrealized gains (losses) on investments are allocated daily to each class of shares based on the relative proportion of net assets of each class.
3. FAIR VALUATION MEASUREMENTS
Fair value measurements of investments are determined within a framework that has established a fair value hierarchy based upon the various data inputs utilized in determining the value of the Fund’s investments. The three-level hierarchy gives the highest priority to unadjusted quoted prices in active markets for identical assets or liabilities (Level 1) and the lowest priority to unobservable inputs (Level 3). The Fund’s investments are classified within the fair value hierarchy based on the lowest level of input that is significant to the fair value measurement. The inputs are summarized into three broad levels as follows:
| ∎ | | Level 1 – quoted prices in active markets for identical securities |
| ∎ | | Level 2 – other significant observable inputs (including quoted prices for similar securities, interest rates, prepayment speeds, credit risk, etc.) |
| ∎ | | Level 3 – significant unobservable inputs (including the Fund’s own assumptions in determining the fair value of investments) |
The inputs or methodologies used for valuing investments in securities are not necessarily an indication of the risk associated with investing in those securities.
Wells Fargo VT Omega Growth Fund | 21
Notes to financial statements
The following is a summary of the inputs used in valuing the Fund’s assets and liabilities as of December 31, 2019:
| | | | | | | | | | | | | | | | |
| | | | |
| | | Quoted prices
(Level 1) | | | Other significant
observable inputs
(Level 2) | | | Significant
unobservable inputs
(Level 3) | | | Total | |
| | | | |
Assets | | | | | | | | | | | | | | | | |
Investments in: | | | | | | | | | | | | | | | | |
| | | | |
Common stocks | | | | | | | | | | | | | | | | |
| | | | |
Communication services | | $ | 10,681,379 | | | $ | 0 | | | $ | 0 | | | $ | 10,681,379 | |
| | | | |
Consumer discretionary | | | 14,600,334 | | | | 0 | | | | 0 | | | | 14,600,334 | |
| | | | |
Financials | | | 2,304,060 | | | | 0 | | | | 0 | | | | 2,304,060 | |
| | | | |
Health care | | | 19,024,804 | | | | 0 | | | | 0 | | | | 19,024,804 | |
| | | | |
Industrials | | | 7,799,590 | | | | 0 | | | | 0 | | | | 7,799,590 | |
| | | | |
Information technology | | | 31,462,756 | | | | 0 | | | | 0 | | | | 31,462,756 | |
| | | | |
Materials | | | 3,929,863 | | | | 0 | | | | 0 | | | | 3,929,863 | |
| | | | |
Real estate | | | 506,079 | | | | 0 | | | | 0 | | | | 506,079 | |
| | | | |
Short-term investments | | | | | | | | | | | | | | | | |
| | | | |
Investment companies | | | 1,605,173 | | | | 0 | | | | 0 | | | | 1,605,173 | |
| | | | |
Total assets | | $ | 91,914,038 | | | $ | 0 | | | $ | 0 | | | $ | 91,914,038 | |
Additional sector, industry or geographic detail is included in the Portfolio of Investments.
For the year ended December 31, 2019, the Fund did not have any transfers into/out of Level 3.
4. TRANSACTIONS WITH AFFILIATES
Management fee
Funds Management, an indirect wholly owned subsidiary of Wells Fargo & Company (“Wells Fargo”), is the manager of the Fund and provides advisory and fund-level administrative services under an investment management agreement. Under the investment management agreement, Funds Management is responsible for, among other services, implementing the investment objectives and strategies of the Fund, supervising the subadviser and providing fund-level administrative services in connection with the Fund’s operations. As compensation for its services under the investment management agreement, Funds Management is entitled to receive a management fee at the following annual rate based on the Fund’s average daily net assets:
| | |
| |
| Average daily net assets | | Management fee |
| |
First $500 million | | 0.600% |
| |
Next $500 million | | 0.550 |
| |
Next $1 billion | | 0.500 |
| |
Next $2 billion | | 0.475 |
| |
Next $1 billion | | 0.450 |
| |
Next $5 billion | | 0.440 |
| |
Over $10 billion | | 0.430 |
For the year ended December 31, 2019, the management fee was equivalent to an annual rate of 0.60% of the Fund’s average daily net assets.
Funds Management has retained the services of a subadviser to provide daily portfolio management to the Fund. The fee for subadvisory services is borne by Funds Management. Wells Capital Management Incorporated (“WellsCap”), an affiliate of Funds Management and an indirect wholly owned subsidiary of Wells Fargo, is the subadviser to the Fund and is entitled to receive a fee from Funds Management at an annual rate starting at 0.45% and declining to 0.30% as the average daily net assets of the Fund increase.
22 | Wells Fargo VT Omega Growth Fund
Notes to financial statements
Administration fees
Under a class-level administration agreement, Funds Management provides class-level administrative services to the Fund, which includes paying fees and expenses for services provided by the transfer agent,sub-transfer agents, omnibus account servicers and record-keepers. As compensation for its services under the class-level administration agreement, Funds Management receives an annual fee of 0.08% which is calculated based on the average daily net assets of each class.
Waivers and/or expense reimbursements
Funds Management has contractually waived and/or reimbursed management and administration fees to the extent necessary to maintain certain net operating expense ratios for the Fund. When each class of the Fund has exceeded its expense cap, Funds Management has waived fees and/or reimbursed expenses from fund-level expenses on a proportionate basis and then from class specific expenses. When only certain classes exceed their expense caps, waivers and/or reimbursements are applied against class specific expenses before fund-level expenses. Funds Management has committed through April 30, 2020 to waive fees and/or reimburse expenses to the extent necessary to cap the Fund’s expenses at 0.75% for Class 1 shares and 1.00% for Class 2 shares. Prior to or after the commitment expiration date, the cap may be increased or the commitment to maintain the cap may be terminated only with the approval of the Board of Trustees.
Distribution fee
The Trust has adopted a distribution plan for Class 2 shares of the Fund pursuant to Rule12b-1 under the 1940 Act. A distribution fee is charged to Class 2 shares and paid to Wells Fargo Funds Distributor, LLC, the principal underwriter, at an annual rate of 0.25% of the average daily net assets of Class 2 shares.
Interfund transactions
The Fund may purchase or sell portfolio investment securities to certain other Wells Fargo affiliates pursuant to Rule17a-7 under the 1940 Act and under procedures adopted by the Board of Trustees. The procedures have been designed to ensure that these interfund transactions, which do not incur broker commissions, are effected at current market prices.
5. INVESTMENT PORTFOLIO TRANSACTIONS
Purchases and sales of investments, excluding U.S. government obligations (if any) and short-term securities, for the year ended December 31, 2019 were $27,516,541 and $45,776,227, respectively.
6. SECURITIES LENDING TRANSACTIONS
The Fund lends its securities through an unaffiliated securities lending agent and receives collateral in the form of cash or securities with a value at least equal to the value of the securities on loan. The value of the loaned securities is determined at the close of each business day and any increases or decreases in the required collateral are exchanged between the Fund and the counterparty on the next business day. Cash collateral received is invested in the Securities Lending Fund which seeks to provide a positive return compared to the daily Fed Funds Open Rate by investing in high-quality, U.S. dollar-denominated short-term money market instruments and is exempt from registration under Section 3(c)(7) of the 1940 Act. Securities Lending Fund is managed by Funds Management and is subadvised by WellsCap. Funds Management receives an advisory fee starting at 0.05% and declining to 0.01% as the average daily net assets of the Securities Lending Fund increase. All of the fees received by Funds Management are paid to WellsCap for its services as subadviser.
In the event of counterparty default or the failure of a borrower to return a loaned security, the Fund has the right to use the collateral to offset any losses incurred. As of December 31, 2019, the Fund had securities lending transactions with the following counterparties which are subject to offset:
| | | | | | | | |
| | | |
| Counterparty | | Value of
securities on loan | | Collateral
received1 | | Net amount | |
| | | |
SG Americas Securities LLC | | $1,055,679 | | $(1,055,679) | | $ | 0 | |
| 1 | Collateral received within this table is limited to the collateral for the net transaction with the counterparty. |
7. BANK BORROWINGS
The Trust, Wells Fargo Master Trust and Wells Fargo Funds Trust (excluding the money market funds) are parties to a $280,000,000 revolving credit agreement whereby the Fund is permitted to use bank borrowings for temporary or emergency purposes, such as to fund shareholder redemption requests. Interest under the credit agreement is charged to the Fund based on a borrowing rate equal to the higher of the Federal Funds rate in effect on that day plus 1.25% or the overnight LIBOR rate in effect on that day plus 1.25%. In addition, an annual commitment fee equal to 0.25% of the unused balance is allocated to each participating fund.
Wells Fargo VT Omega Growth Fund | 23
Notes to financial statements
For the year ended December 31, 2019, there were no borrowings by the Fund under the agreement.
8. DISTRIBUTIONS TO SHAREHOLDERS
The tax character of distributions paid during the years ended December 31, 2019 and December 31, 2018 were as follows:
| | | | | | | | |
| | | Year ended December 31 | |
| | |
| | | 2019 | | | 2018 | |
| | |
Ordinary income | | $ | 1,104,228 | | | $ | 2,889,465 | |
| | |
Long-term capital gain | | | 9,754,363 | | | | 6,874,546 | |
As of December 31, 2019, the components of distributable earnings on a tax basis were as follows:
| | | | |
Undistributed ordinary income | | Undistributed long-term gain | | Unrealized gains |
| | |
| $728,820 | | $6,560,380 | | $40,033,728 |
9. CONCENTRATION RISK
Concentration risks result from exposure to a limited number of sectors. As of the end of the period, the Fund invests a concentration of its portfolio in the information technology sector. A fund that invests a substantial portion of its assets in any sector may be more affected by changes in that sector than would be a fund whose investments are not heavily weighted in any sector.
10. INDEMNIFICATION
Under the Trust’s organizational documents, the officers and Trustees have been granted certain indemnification rights against certain liabilities that may arise out of performance of their duties to the Trust. Additionally, in the normal course of business, the Trust may enter into contracts with service providers that contain a variety of indemnification clauses. The Trust’s maximum exposure under these arrangements is dependent on future claims that may be made against the Fund and, therefore, cannot be estimated.
11. NEW ACCOUNTING PRONOUNCEMENT
In August 2018, FASB issued Accounting Standards Update (“ASU”)No. 2018-13, Fair Value Measurement (Topic 820)Disclosure Framework—Changes to the Disclosure Requirements for Fair Value Measurement. ASU2018-13 updates the disclosure requirements for fair value measurements by modifying or removing certain disclosures and adding certain new disclosures. The amendments are effective for fiscal years, and interim periods within those fiscal years, beginning after December 15, 2019. Early adoption is permitted. Management has adopted the removal and modification of disclosures early, as permitted, and will adopt the additional new disclosures at the effective date.
24 | Wells Fargo VT Omega Growth Fund
Report of independent registered public accounting firm
TO THE SHAREHOLDERS OF THE FUND AND BOARD OF TRUSTEES OF WELLS FARGO VARIABLE TRUST:
Opinion on the Financial Statements
We have audited the accompanying statement of assets and liabilities of Wells Fargo VT Omega Growth Fund (the Fund), one of the funds constituting Wells Fargo Variable Trust, including the portfolio of investments, as of December 31, 2019, the related statement of operations for the year then ended, the statements of changes in net assets for each of the years in the two-year period then ended, and the related notes (collectively, the financial statements) and the financial highlights for each of the years in the five-year period then ended. In our opinion, the financial statements and financial highlights present fairly, in all material respects, the financial position of the Fund as of December 31, 2019, the results of its operations for the year then ended, the changes in its net assets for each of the years in the two-year period then ended, and the financial highlights for each of the years in the five-year period then ended, in conformity with U.S. generally accepted accounting principles.
Basis for Opinion
These financial statements and financial highlights are the responsibility of the Fund’s management. Our responsibility is to express an opinion on these financial statements and financial highlights based on our audits. We are a public accounting firm registered with the Public Company Accounting Oversight Board (United States) (PCAOB) and are required to be independent with respect to the Fund in accordance with the U.S. federal securities laws and the applicable rules and regulations of the Securities and Exchange Commission and the PCAOB.
We conducted our audits in accordance with the standards of the PCAOB. Those standards require that we plan and perform the audit to obtain reasonable assurance about whether the financial statements and financial highlights are free of material misstatement, whether due to error or fraud. Our audits included performing procedures to assess the risks of material misstatement of the financial statements and financial highlights, whether due to error or fraud, and performing procedures that respond to those risks. Such procedures included examining, on a test basis, evidence regarding the amounts and disclosures in the financial statements and financial highlights. Such procedures also included confirmation of securities owned as of December 31, 2019, by correspondence with the custodian, transfer agent and brokers, or by other appropriate auditing procedures. Our audits also included evaluating the accounting principles used and significant estimates made by management, as well as evaluating the overall presentation of the financial statements and financial highlights. We believe that our audits provide a reasonable basis for our opinion.

We have not been able to determine the specific year that we began serving as the auditor of one or more Wells Fargo Funds investment companies; however we are aware that we have served as the auditor of one or more Wells Fargo Funds investment companies since at least 1955.
Boston, Massachusetts
February 25, 2020
Wells Fargo VT Omega Growth Fund | 25
Other information (unaudited)
TAX INFORMATION
For corporate shareholders, pursuant to Section 854 of the Internal Revenue Code, 43.42% of ordinary income dividends qualify for the corporate dividends-received deduction for the fiscal year ended December 31, 2019.
Pursuant to Section 852 of the Internal Revenue Code, $9,754,363 was designated as a 20% rate gain distribution for the fiscal year ended December 31, 2019.
PROXY VOTING INFORMATION
A description of the policies and procedures used to determine how to vote proxies relating to portfolio securities is available, upon request, by calling1-800-260-5969, visiting our website atwfam.com, or visiting the SEC website at sec.gov. Information regarding how the proxies related to portfolio securities were voted during the most recent12-month period ended June 30 is available on the website atwfam.com or by visiting the SEC website at sec.gov.
QUARTERLY PORTFOLIO HOLDINGS INFORMATION
The Fund files its complete schedule of portfolio holdings with the SEC for the first and third quarters of each fiscal year as an exhibit to its reports on FormN-PORT. Shareholders may view the filed FormN-PORT by visiting the SEC website at sec.gov.
26 | Wells Fargo VT Omega Growth Fund
Other information (unaudited)
BOARD OF TRUSTEES AND OFFICERS
Each of the Trustees and Officers1 listed in the table below acts in identical capacities for each fund in the Wells Fargo family of funds, which consists of 149 mutual funds comprising the Wells Fargo Funds Trust, Wells Fargo Variable Trust, Wells Fargo Master Trust and fourclosed-end funds (collectively the “Fund Complex”). This table should be read in conjunction with the Prospectus and the Statement of Additional Information2. The mailing address of each Trustee and Officer is 525 Market Street, 12th Floor, San Francisco, CA 94105. Each Trustee and Officer serves an indefinite term, however, each Trustee serves such term until reaching the mandatory retirement age established by the Trustees.
Independent Trustees
| | | | | | |
Name and
year of birth | | Position held and
length of service* | | Principal occupations during past five years or longer | | Current other
public company or
investment
company
directorships |
| | | |
William R. Ebsworth (Born 1957) | | Trustee, since 2015 | | Retired. From 1984 to 2013, equities analyst, portfolio manager, research director and chief investment officer at Fidelity Management and Research Company in Boston, Tokyo, and Hong Kong, and retired in 2013 as Chief Investment Officer of Fidelity Strategic Advisers, Inc. where he led a team of investment professionals managing client assets. Prior thereto, Board member of Hong Kong Securities Clearing Co., Hong Kong Options Clearing Corp., the Thailand International Fund, Ltd., Fidelity Investments Life Insurance Company, and Empire Fidelity Investments Life Insurance Company. Audit Committee Chair and Investment Committee Chair of the Vincent Memorial Hospital Endowment(non-profit organization). Mr. Ebsworth is a CFA® charterholder. | | N/A |
| | | |
Jane A. Freeman (Born 1953) | | Trustee, since 2015; Chair Liaison, since 2018 | | Retired. From 2012 to 2014 and 1999 to 2008, Chief Financial Officer of Scientific Learning Corporation. From 2008 to 2012, Ms. Freeman provided consulting services related to strategic business projects. Prior to 1999, Portfolio Manager at Rockefeller & Co. and Scudder, Stevens & Clark. Board member of the Harding Loevner Funds from 1996 to 2014, serving as both Lead Independent Director and chair of the Audit Committee. Board member of the Russell Exchange Traded Funds Trust from 2011 to 2012 and the chair of the Audit Committee. Ms. Freeman is a Board Member of The Ruth Bancroft Garden(non-profit organization). She is also an inactive Chartered Financial Analyst. | | N/A |
| | | |
Isaiah Harris, Jr. (Born 1952) | | Trustee, since 2009; Audit Committee Chairman, since 2019 | | Retired. Chairman of the Board of CIGNA Corporation since 2009, and Director since 2005. From 2003 to 2011, Director of Deluxe Corporation. Prior thereto, President and CEO of BellSouth Advertising and Publishing Corp. from 2005 to 2007, President and CEO of BellSouth Enterprises from 2004 to 2005 and President of BellSouth Consumer Services from 2000 to 2003. Emeritus member of the Iowa State University Foundation Board of Governors. Emeritus Member of the Advisory Board of Iowa State University School of Business. Advisory Board Member, Palm Harbor Academy (private school). Advisory Board Member, Child Evangelism Fellowship(non-profit). Mr. Harris is a certified public accountant (inactive status). | | CIGNA Corporation |
| | | |
Judith M. Johnson (Born 1949) | | Trustee, since 2008; Audit Committee Chairman, from 2009 to 2018 | | Retired. Prior thereto, Chief Executive Officer and Chief Investment Officer of Minneapolis Employees Retirement Fund from 1996 to 2008. Ms. Johnson is an attorney, certified public accountant and a certified managerial accountant. | | N/A |
Wells Fargo VT Omega Growth Fund | 27
Other information (unaudited)
| | | | | | |
Name and
year of birth | | Position held and
length of service* | | Principal occupations during past five years or longer | | Current other
public company or
investment
company
directorships |
| | | |
David F. Larcker (Born 1950) | | Trustee, since 2009 | | James Irvin Miller Professor of Accounting at the Graduate School of Business, Stanford University, Director of the Corporate Governance Research Initiative and Senior Faculty of The Rock Center for Corporate Governance since 2006. From 2005 to 2008, Professor of Accounting at the Graduate School of Business, Stanford University. Prior thereto, Ernst & Young Professor of Accounting at The Wharton School, University of Pennsylvania from 1985 to 2005. | | N/A |
| | | |
| Olivia S. Mitchell (Born 1953) | | Trustee, since 2006; Nominating and Governance Committee Chair, since 2018 | | International Foundation of Employee Benefit Plans Professor, Wharton School of the University of Pennsylvania since 1993. Director of Wharton’s Pension Research Council and Boettner Center on Pensions & Retirement Research, and Research Associate at the National Bureau of Economic Research. Previously, Cornell University Professor from 1978 to 1993. | | N/A |
| | | |
| Timothy J. Penny (Born 1951) | | Trustee, since 1996; Chairman, since 2018 | | President and Chief Executive Officer of Southern Minnesota Initiative Foundation, anon-profit organization, since 2007. Member of the Board of Trustees of NorthStar Education Finance, Inc., anon-profit organization, since 2007. | | N/A |
| | | |
James G. Polisson (Born 1959) | | Trustee, since 2018 | | Retired. Chief Marketing Officer, Source (ETF) UK Services, Ltd, from 2015 to 2017. From 2012 to 2015, Principal of The Polisson Group, LLC, a management consulting, corporate advisory and principal investing company. Chief Executive Officer and Managing Director at Russell Investments, Global Exchange Traded Funds from 2010 to 2012. Managing Director of Barclays Global Investors from 1998 to 2010 and Global Chief Marketing Officer for iShares and Barclays Global Investors from 2000 to 2010. Trustee of the San Francisco Mechanics’ Institute, anon-profit organization, from 2013 to 2015. Board member of the Russell Exchange Traded Fund Trust from 2011 to 2012. Director of Barclays Global Investors Holdings Deutschland GmbH from 2006 to 2009. Mr. Polisson is an attorney and has a retired status with the Massachusetts and District of Columbia Bar Associations. | | N/A |
| | | |
| Pamela Wheelock3 (Born 1959) | | Trustee, since January 2020; previously Trustee from January 2018 to July 2019 | | Board member of the Destination Medical Center Economic Development Agency, Rochester, Minnesota since 2019. Acting Commissioner, Minnesota Department of Human Services, July 2019 through September 2019. Human Services Manager (part-time), Minnesota Department of Human Services, October 2019 through December 2019. Chief Operating Officer, Twin Cities Habitat for Humanity from 2017 to 2019. Vice President of University Services, University of Minnesota from 2012 to 2016. Prior thereto, on the Board of Directors, Governance Committee and Finance Committee for the Minnesota Philanthropy Partners (Saint Paul Foundation) from 2012 to 2018, Interim Chief Executive Officer of Blue Cross Blue Shield of Minnesota from 2011 to 2012, Chairman of the Board from 2009 to 2012 and Board Director from 2003 to 2015. Vice President, Leadership and Community Engagement, Bush Foundation, Saint Paul, Minnesota (a private foundation) from 2009 to 2011. Executive Vice President and Chief Financial Officer, Minnesota Sports and Entertainment from 2004 to 2009 and Senior Vice President from 2002 to 2004. Executive Vice President of the Minnesota Wild Foundation from 2004 to 2008. Commissioner of Finance, State of Minnesota, from 1999 to 2002. Currently Board Chair of the Minnesota Wild Foundation since 2010. | | N/A |
| * | Length of service dates reflect the Trustee’s commencement of service with the Trust’s predecessor entities, where applicable. |
28 | Wells Fargo VT Omega Growth Fund
Other information (unaudited)
Officers
| | | | |
Name and
year of birth | | Position held and
length of service | | Principal occupations during past five years or longer |
| | |
Andrew Owen (Born 1960) | | President, since 2017 | | Executive Vice President of Wells Fargo & Company and Head of Affiliated Managers, Wells Fargo Asset Management, since 2014. In addition, Mr. Owen is currently President, Chief Executive Officer and Director of Wells Fargo Funds Management, LLC since 2017. Prior thereto, Executive Vice President responsible for marketing, investments and product development for Wells Fargo Funds Management, LLC, from 2009 to 2014. |
| | |
Jeremy DePalma1 (Born 1974) | | Treasurer, since 2012 | | Senior Vice President of Wells Fargo Funds Management, LLC since 2009. Senior Vice President of Evergreen Investment Management Company, LLC from 2008 to 2010 and head of the Fund Reporting and Control Team within Fund Administration from 2005 to 2010. |
| | |
Michelle Rhee4 (Born 1966) | | Chief Legal Officer, since 2019 | | Secretary of Wells Fargo Funds Management, LLC, Chief Legal Counsel of Wells Fargo Asset Management and Assistant General Counsel of Wells Fargo Bank, N.A. since 2018. Associate General Counsel and Managing Director of Bank of America Corporation from 2004 to 2018. |
| | |
Catherine Kennedy5 (Born 1969) | | Secretary, since 2019 | | Vice President of Wells Fargo Funds Management, LLC and Senior Counsel of the Wells Fargo Legal Department since 2010. Vice President and Senior Counsel of Evergreen Investment Management Company, LLC from 1998 to 2010. |
| | |
Michael H. Whitaker (Born 1967) | | Chief Compliance Officer, since 2016 | | Chief Compliance Officer of Wells Fargo Asset Management since 2016. Senior Vice President and Chief Compliance Officer for Fidelity Investments from 2007 to 2016. |
| | |
David Berardi (Born 1975) | | Assistant Treasurer, since 2009 | | Vice President of Wells Fargo Funds Management, LLC since 2009. Vice President of Evergreen Investment Management Company, LLC from 2008 to 2010. Manager of Fund Reporting and Control for Evergreen Investment Management Company, LLC from 2004 to 2010. |
| 1 | Jeremy DePalma acts as Treasurer of 85 funds and Assistant Treasurer of 64 funds in the Fund Complex. |
| 2 | The Statement of Additional Information includes additional information about the Trustees and is available, without charge, upon request, by calling1-800-260-5969 or by visiting the website atwfam.com. |
| 3 | Pamela Wheelock wasre-appointed to the Board effective January 1, 2020. |
| 4 | Michelle Rhee became Chief Legal Officer effective October 22, 2019. |
| 5 | Catherine Kennedy became Secretary effective October 22, 2019. |
Wells Fargo VT Omega Growth Fund | 29
This page is intentionally left blank.
This page is intentionally left blank.
This page is intentionally left blank.

For more information
More information about Wells Fargo Funds is available free upon request. To obtain literature, please write, visit the Fund’s website, or call:
Wells Fargo Funds
P.O. Box 219967
Kansas City, MO 64121-9967
Website:wfam.com
Individual investors:1-800-222-8222
Retail investment professionals:1-888-877-9275
Institutional investment professionals:1-866-765-0778

This report and the financial statements contained herein are submitted for the general information of the shareholders of the Fund. If this report is used for promotional purposes, distribution of the report must be accompanied or preceded by a current prospectus. Before investing, please consider the investment objectives, risks, charges, and expenses of the investment. For a current prospectus and, if available, a summary prospectus, containing this information, call1-800-260-5969 or visit the Fund’s website atwfam.com. Read the prospectus carefully before you invest or send money.
Wells Fargo Asset Management (WFAM) is the trade name for certain investment advisory/management firms owned by Wells Fargo & Company. These firms include but are not limited to Wells Capital Management Incorporated and Wells Fargo Funds Management, LLC. Certain products managed by WFAM entities are distributed by Wells Fargo Funds Distributor, LLC (a broker-dealer and Member FINRA).
This material is for general informational and educational purposes only and is NOT intended to provide investment advice or a recommendation of any kind—including a recommendation for any specific investment, strategy, or plan.
INVESTMENT PRODUCTS: NOT FDIC INSURED ◾ NO BANK GUARANTEE ◾ MAY LOSE VALUE
© 2020 Wells Fargo & Company. All rights reserved.
PAR-0120-02378 02-20
AVT5/AR151 12-19
Annual Report
December 31, 2019
Wells Fargo VT Opportunity Fund
Beginning on January 1, 2021, as permitted by new regulations adopted by the Securities and Exchange Commission, paper copies of the Wells Fargo Funds’ annual and semi-annual shareholder reports issued after this date will no longer be sent by mail, unless you specifically request paper copies of the reports. Instead, the reports will be made available on the Funds’ website, and you will be notified by mail each time a report is posted and provided with a website address to access the report.
If you already elected to receive shareholder reports electronically, you will not be affected by this change and you need not take any action. You may elect to receive shareholder reports and other communications from the Fund electronically at any time by contacting your financial intermediary (such as a broker-dealer or bank) or, if you are a direct investor, by calling1-800-222-8222 or by enrolling at wellsfargo.com/advantagedelivery.
You may elect to receive all future reports in paper free of charge. If you invest through a financial intermediary, you can contact your financial intermediary to request that you continue to receive paper copies of your shareholder reports; if you invest directly with the Fund, you can call 1-800-222-8222. Your election to receive reports in paper will apply to all Wells Fargo Funds held in your account with your financial intermediary or, if you are a direct investor, to all Wells Fargo Funds that you hold.
|
|
|
Reduce clutter. Save trees. |
Sign up for electronic delivery of prospectuses and shareholder reports atwellsfargo.com/advantagedelivery |
The views expressed and any forward-looking statements are as of December 31, 2019, unless otherwise noted, and are those of the Fund managers and/or Wells Fargo Asset Management. Discussions of individual securities, or the markets generally, or any Wells Fargo Fund are not intended as individual recommendations. Future events or results may vary significantly from those expressed in any forward-looking statements. The views expressed are subject to change at any time in response to changing circumstances in the market. Wells Fargo Asset Management and the Fund disclaim any obligation to publicly update or revise any views expressed or forward-looking statements.
INVESTMENT PRODUCTS: NOT FDIC INSURED ◾ NO BANK GUARANTEE ◾ MAY LOSE VALUE
Wells Fargo VT Opportunity Fund | 1
Letter to shareholders (unaudited)

Andrew Owen
President
Wells Fargo Funds
“Financial markets rebounded strongly to open 2019 on a positive note.”
Dear Shareholder:
We are pleased to offer you this annual report for the Wells Fargo VT Opportunity Fund for the12-month period that ended December 31, 2019. Despite some periods of market volatility, the year was strongly positive for financial markets as supportive central banks more than offset concerns over slowing global economic growth and international trade tensions.
Overall, both fixed-income and equity investors enjoyed healthy annual returns. For the period, U.S. stocks, based on the S&P 500 Index,1 gained 31.49% and international stocks, as measured by the MSCI ACWI ex USA Index (Net),2 returned 21.51%. The MSCI EM Index (Net)3 gained 18.42%. For bond investors, the Bloomberg Barclays U.S. Aggregate Bond Index4 added 8.72%, the Bloomberg Barclays Global Aggregateex-USD Index5 returned 5.09%, the Bloomberg Barclays Municipal Bond Index6 gained 7.54%, and the ICE BofA U.S. High Yield Index7 added 14.41%.
The year began with a strong market rebound.
After a volatile end of 2018 involving sharp losses, financial markets rebounded strongly to open 2019 on a positive note, as investors were encouraged by a sudden pivot by the U.S. Federal Reserve (Fed) to a more accommodative stance after a series of increases to the federal funds rate in 2017 and 2018. The S&P 500 Index gained 8.01% in January, the best monthly performance in 30 years. Returns for the MSCI ACWI ex USA Index (Net), the Bloomberg Barclays U.S. Aggregate Bond Index, and the Bloomberg Barclays Global Aggregateex-USD Index also were positive.
In February 2019, signs of slowing global growth grew more ominous. The Bureau of Economic Analysis announced fourth-quarter 2018 gross domestic product (GDP) grew at an annualized 2.2% rate, down from the levels of the prior two quarters. In a February report, the Bank of England forecast the slowest growth since the financial crisis for 2019. China and the U.S. continued to wrangle over trade issues. By the end of the first quarter of 2019, more accommodative Fed sentiment and steady, if not spectacular, U.S. economic and business metrics encouraged domestic investors.
Early second-quarter 2019 enthusiasm among investors faded.
During April, sustained low inflation, solid employment data, and first-quarter U.S. GDP of an annualized rate of 3.2% supported favorable sentiment. During May, markets
| 1 | The S&P 500 Index consists of 500 stocks chosen for market size, liquidity, and industry group representation. It is a market-value-weighted index with each stock’s weight in the index proportionate to its market value. You cannot invest directly in an index. |
| 2 | The Morgan Stanley Capital International (MSCI) All Country World Index (ACWI) ex USA Index (Net) is a free-float-adjusted market-capitalization-weighted index that is designed to measure the equity market performance of developed markets, excluding the United States. Source: MSCI. MSCI makes no express or implied warranties or representations and shall have no liability whatsoever with respect to any MSCI data contained herein. The MSCI data may not be further redistributed or used as a basis for other indices or any securities or financial products. This report is not approved, reviewed, or produced by MSCI. You cannot invest directly in an index. |
| 3 | The MSCI Emerging Markets (EM) Index (Net) is a free-float-adjusted market-capitalization-weighted index that is designed to measure equity market performance of emerging markets. You cannot invest directly in an index. |
| 4 | The Bloomberg Barclays U.S. Aggregate Bond Index is a broad-based benchmark that measures the investment-grade, U.S. dollar-denominated, fixed-rate taxable bond market, including Treasuries, government-related and corporate securities, mortgage-backed securities (agency fixed-rate and hybrid adjustable-rate mortgage pass-throughs), asset-backed securities, and commercial mortgage-backed securities. You cannot invest directly in an index. |
| 5 | The Bloomberg Barclays Global Aggregateex-USD Index is an unmanaged index that provides a broad-based measure of the global investment-grade fixed-income markets excluding the U.S. dollar-denominated debt market. You cannot invest directly in an index. |
| 6 | The Bloomberg Barclays Municipal Bond Index is an unmanaged index composed of long-termtax-exempt bonds with a minimum credit rating of Baa. You cannot invest directly in an index. |
| 7 | The ICE BofA U.S. High Yield Index is a market-capitalization-weighted index of domestic and Yankee high-yield bonds. The index tracks the performance of high-yield securities traded in the U.S. bond market. You cannot invest directly in an index. Copyright 2020. ICE Data Indices, LLC. All rights reserved. |
2 | Wells Fargo VT Opportunity Fund
Letter to shareholders (unaudited)
tumbled on mixed investment signals. In the U.S., partisan wrangling ramped up as Democrats and Republicans set their sights on 2020 presidential politics. The U.K.’s Brexit disagreements caused Prime Minister Theresa May to resign. Boris Johnson succeeded her only to exacerbate uncertainty about Brexit’s resolution ahead of an October 2019 deadline. The European Commission downgraded the 2019 growth forecast to 1.2%. The U.S. increased tariffs on products from China, China responded, and then talks broke down. President Donald Trump threatened to turn his foreign policy tariff tool to Mexico over immigration issues.
Midway through the year, investors regrouped, sentiment turned positive, and U.S. equity markets advanced during June and July. The gains, primarily driven by geopolitical and monetary policy events, pushed equity markets to new highs. European Central Bank President Mario Draghi indicated the bank was ready to cut rates or buy more assets to prop up inflation if needed. President Trump backed off of tariff threats against Mexico and China. In the U.S., the Fed implemented a 0.25% federal funds rate cut in July.
Later in July, the U.S. reversed course and threatened to impose higher tariffs on China’s exports after talks failed. China responded with tariff threats of its own and devalued the renminbi, a move that roiled global markets. Major U.S. stock market indices closed July with the worst weekly results of the year. Bond prices gained as Treasury yields fell to multiyear lows, and the yield curve inverted at multiple points along the30-year arc.
In August, U.S.-China trade tensions continued with no signs of compromise. Evidence of a continued global economic slowdown mounted, and central banks in China, New Zealand, and Thailand cut interest rates. Industrial and manufacturing data declined in China, Canada, Japan, and Germany. Adding to global uncertainty, Italy’s prime minister resigned, many feared a crackdown in Hong Kong as protestors sustained their calls for reform, and Boris Johnson planned to suspend Parliament as Brexit’s deadline neared.
In the U.S., the Fed cut interest rates a second time in September. U.S. manufacturing data disappointed investors. The U.S. Congress announced it would pursue an impeachment investigation of President Trump. Meanwhile, the Brexit impasse showed no signs of resolution. Officials in China said that hitting the country’s economic growth goals for the year would be difficult considering the weight of tariffs and trade restrictions. Although the S&P 500 Index finished the third quarter with the bestyear-to-date returns in more than 20 years, concerns about future returns remained.
The fourth quarter started on a strong note, with U.S.-China trade tensions relaxing in October 2019 along with renewed optimism for a U.K. Brexit deal and positive macroeconomic data. The initial estimate of U.S. third-quarter GDP growth was a resilient 1.9% annualized rate, while the U.S. unemployment rate fell to a50-year low of 3.5% in September. However, despite resilience among U.S. consumers, business confidence declined while manufacturing activity contracted. Concerned with a potential economic slowdown, the Fed lowered interest rates another quarter point in late October, its third rate cut in four months. This helped push the S&P 500 Index to a newall-time high, while emerging market equities rallied and global bonds declined overall, reflecting a broad pickup in risk appetite.
Equity markets continued to rally in November despite ongoing geopolitical risks. Hopes for a U.S.-China trade deal buoyed investor confidence. U.S. business sentiment improved slightly, and manufacturing and services activity picked up. Throughout the month, central bank actions were on hold. With that positive backdrop, developed market equities outpaced those in emerging markets, and U.S. stocks, as reflected by the S&P 500 Index, outperformednon-U.S. stocks overall. While consumer confidence and purchasing manager activity rose in the eurozone, China reported weakening manufacturing and consumer data. Bond yields rose marginally, leading to slightly negative returns for global government and investment-grade corporate bonds.
“Equity markets continued to rally in November despite ongoing geopolitical risks..”
Wells Fargo VT Opportunity Fund | 3
Letter to shareholders (unaudited)
Financial markets ended the year on a broadly positive note, with the U.S. and China reaching an accord on a Phase One trade deal, with some details to be worked out. That, along with the landslide win by thepro-Brexit U.K. Conservative Party in a national election and ongoing central bank support, gave investors greater certainty and confidence. U.S. economic indicators were generally positive, with the exception of manufacturing activity and business confidence. However, consumer confidence was resilient, fed by a robust labor market, tame inflation, and lower interest rates, which boosted housing affordability and stimulated homebuyer activity. The impeachment of U.S. President Donald Trump, while historically noteworthy, had little impact on markets. Meanwhile, slowing Chinese economic activity, partly attributable to the trade war, led to further government stimulus atyear-end through lower reserve ratios, allowing banks to lend more money.
Don’t let short-term uncertainty derail long-term investment goals.
Periods of investment uncertainty can present challenges, but experience has taught us that maintaining long-term investment goals can be an effective way to plan for the future. To help you create a sound strategy based on your personal goals and risk tolerance, Wells Fargo Funds offers more than 100 mutual funds spanning a wide range of asset classes and investment styles. Although diversification cannot guarantee an investment profit or prevent losses, we believe it can be an effective way to manage investment risk and potentially smooth out overall portfolio performance. We encourage investors to know their investments and to understand that appropriate levels of risk-taking may unlock opportunities.
Thank you for choosing to invest with Wells Fargo Funds. We appreciate your confidence in us and remain committed to helping you meet your financial needs.
Sincerely,

Andrew Owen
President
Wells Fargo Funds
|
|
|
For further information about your Fund, contact your investment professional, visit our website at wfam.com, or call us directly at1-800-260-5969. |
4 | Wells Fargo VT Opportunity Fund
This page is intentionally left blank.
Performance highlights (unaudited)
Investment objective
The Fund seeks long-term capital appreciation.
Manager
Wells Fargo Funds Management, LLC
Subadviser
Wells Capital Management Incorporated
Portfolio managers
Kurt Gunderson*
Christopher J. Miller, CFA®‡
Average annual total returns (%) as of December 31, 2019
| | | | | | | | | | | | | | | | | | | | | | |
| | | | | |
| | | | | | | | | | | | | | Expense ratios1 (%) | |
| | | | | | |
| | | Inception date | | 1 year | | | 5 year | | | 10 year | | | Gross | | | Net2 | |
| | | | | | | |
| Class 13 | | 8-26-2011 | | | 31.81 | | | | 10.12 | | | | 12.27 | | | | 0.84 | | | | 0.75 | |
| | | | | | | |
| Class 2 | | 5-8-1992 | | | 31.46 | | | | 9.84 | | | | 12.04 | | | | 1.09 | | | | 1.00 | |
| | | | | | | |
| Russell 3000® Index4 | | – | | | 31.02 | | | | 11.24 | | | | 13.42 | | | | – | | | | – | |
Figures quoted represent past performance, which is no guarantee of future results. Investment return and principal value of an investment will fluctuate so that an investor’s shares, when redeemed, may be worth more or less than their original cost. Current performance may be lower or higher than the performance data quoted and assumes the reinvestment of dividends and capital gains. Currentmonth-end performance is available by calling1-800-260-5969. Performance figures of the Fund do not reflect fees and expenses charged pursuant to the terms of variable life insurance policies and variable annuity contracts. If these fees and expenses had been reflected, performance would have been lower.
Please keep in mind that high double-digit returns were primarily achieved during favorable market conditions. You should not expect that such favorable returns can be consistently achieved. A fund’s performance, especially for short time periods, should not be the sole factor in making your investment decision.
Shares are sold without afront-end sales charge or contingent deferred sales charge.
Index returns do not include transaction costs associated with buying and selling securities, any mutual fund fees or expenses, or any taxes. It is not possible to invest directly in an index.
Stock values fluctuate in response to the activities of individual companies and general market and economic conditions. Smaller-company stocks tend to be more volatile and less liquid than those of larger companies. Certain investment strategies tend to increase the total risk of an investment (relative to the broader market). The Fund is exposed to foreign investment risk. Consult the Fund’s prospectus for additional information on these and other risks.
Please refer to the prospectus provided by your participating insurance company for detailed information describing the separate accounts for information regarding surrender charges, mortality and expense risk fees, and other charges that may be assessed by the participating insurance companies.
Please see footnotes on page 7.
6 | Wells Fargo VT Opportunity Fund
Performance highlights (unaudited)
|
|
| Growth of $10,000 investment as of December 31, 20195 |
|
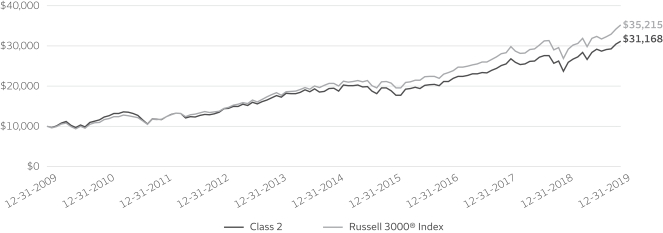
|
| * | Mr. Gunderson became a portfolio manager of the Fund on February 1, 2020. |
| ‡ | CFA® and Chartered Financial Analyst® are trademarks owned by CFA Institute. |
| 1 | Reflects the expense ratios as stated in the most recent prospectuses. The expense ratios shown are subject to change and may differ from the annualized expense ratios shown in the financial highlights of this report. |
| 2 | The manager has contractually committed through April 30, 2020, to waive fees and/or reimburse expenses to the extent necessary to cap total annual fund operating expenses after fee waivers at 0.75% for Class 1 and 1.00% for Class 2. Brokerage commissions, stamp duty fees, interest, taxes, acquired fund fees and expenses (if any), and extraordinary expenses are excluded from the expense cap. Prior to or after the commitment expiration date, the cap may be increased or the commitment to maintain the cap may be terminated only with the approval of the Board of Trustees. Without this cap, the Fund’s returns would have been lower. The expense ratio paid by an investor is the net expense ratio (the total annual fund operating expenses after fee waivers) as stated in the prospectuses. |
| 3 | Historical performance shown for Class 1 shares prior to their inception reflects the performance of Class 2 shares, and includes the higher expenses applicable to Class 2 shares. If these expenses had not been included, returns for Class 1 shares would be higher. |
| 4 | The Russell 3000® Index measures the performance of the 3,000 largest U.S. companies based on total market capitalization, which represents approximately 98% of the investable U.S. equity market. You cannot invest directly in an index. |
| 5 | The chart compares the performance of Class 2 shares for the most recent ten years with the Russell 3000® Index. The chart assumes a hypothetical $10,000 investment and reflects all operating expenses of the Fund but does not reflect fees and expenses charged pursuant to the terms of variable life insurance policies and variable annuity contracts. |
| 6 | The ten largest holdings, excluding cash, cash equivalents and any money market funds, are calculated based on the value of the investments divided by total net assets of the Fund. Holdings are subject to change and may have changed since the date specified. |
| 7 | Amounts are calculated based on the total long-term investments of the Fund. These amounts are subject to change and may have changed since the date specified. |
| ** | This security was no longer held at the end of the reporting period. |
Wells Fargo VT Opportunity Fund | 7
Performance highlights (unaudited)
MANAGER’S DISCUSSION
Fund highlights
| ∎ | | The Fund outperformed its benchmark, the Russell 3000® Index, for the12-month period that ended December 31, 2019. |
| ∎ | | The Fund’s holdings within the industrials and real estate sectors were the largest contributors to relative performance during the period. |
| ∎ | | Individual stocks in the health care and energy sectors were the largest detractors from relative performance. |
A number of factors have been influencing the U.S. stock market, which had turned negative late in 2018 from concerns over inflation, interest rates, trade disputes, and the slowing of global economic growth. However, sentiment changed as we entered 2019 when the U.S. Federal Reserve (Fed) became more dovish and reduced rates three times during the year to end in the range of 1.50% to 1.75%. Lower corporate taxes, less regulation, and otherpro-growth government policies continue to fuel optimism in U.S. businesses. The U.S. equity markets also benefited from the repatriation of cash held overseas, share buybacks, capital spending, and high-profile merger and acquisition activity. Consumers were key to U.S. growth in 2019, backed up by a strong labor market. Global trade tensions eased as the U.S. and China moved closer to a Phase One deal and the U.S.-Mexico-Canada Agreement progressed toward enactment. Byperiod-end, U.S. gross domestic product had increased for the 22nd quarter in a row, marking the longest economic expansion in history, while U.S equities entered the longest bull market in history. However, an aging economic cycle, an unprecedented level of negative-yielding bonds globally, future trade negotiations, and slowing U.S. corporate earnings growth continue to be concerns. Throughout the period, we continued to seek companies with solid business models, strong management teams, and healthy cash flow prospects.
Stock selection in the industrials and real estate sectors were the largest contributors to relative performance.
The industrials sector kept pace with the broader market, benefiting from changing Fed policy, relief from trade tensions, stabilization of commodity prices, and a pause in the appreciation of the U.S. dollar. Fund holdings in machinery, aerospace, and building products within the industrials sector outperformed their peers and produced the greatest returns relative to the benchmark. Airbus SE makes commercial aircraft, helicopters, military transports, satellites, and launch vehicles. Airbus is a global duopoly with The Boeing Company and benefited from an expected increase in free cash flow as two aircraft models matured. The stock rose 55% during the year, and we exited our position nearyear-end.
The real estate sector benefited from lower interest rates as well as strong fundamentals, predictable cash flows, and relatively high dividend rates. Equinix, Incorporated, is the largest data center real estate investment trust, operating in 48 markets, including the Americas, Europe, the Middle East, Africa, and Asia Pacific. The stock rose 69% during the year on recognition of the firm’s global portfolio, which may benefit from growing demand for IT outsourcing and cloud computing. Apple Incorporated makes smartphones, PCs, tablets, and wearables and provides a variety of related services. The stock started the year on a low note after disappointing guidance but then outperformed expectations on all fronts. The stock rose 89% for the year, making it the largest individual contributor to the Fund’s performance.
| | | | |
|
| Ten largest holdings(%) as of December 31, 20196 | |
| | |
Alphabet Incorporated Class C | | | 4.22 | |
| | |
Salesforce.com Incorporated | | | 3.22 | |
| | |
Apple Incorporated | | | 2.91 | |
| | |
Texas Instruments Incorporated | | | 2.58 | |
| | |
MasterCard Incorporated Class A | | | 2.57 | |
| | |
LivaNova plc | | | 2.43 | |
| | |
Amazon.com Incorporated | | | 2.37 | |
| | |
Novartis AG ADR | | | 2.36 | |
| | |
PNC Financial Services Group Incorporated | | | 2.33 | |
| | |
Facebook Incorporated Class A | | | 2.32 | |
Individual stocks in health care and energy were the largest detractors from relative performance.
The largest individual detractors from relative performance were a few holdings in health care and energy. LivaNova PLC is a medical technology company that specializes in neuromodulation, cardiac surgery, and cardiac rhythm management. LivaNova was formed through the merger of Sorin SpA and Cyberonics. The stock fell 18% during the year as investors worried about regulatory setbacks and weak financial performance. Mylan N.V. is a pharmaceutical company developing generic, branded generic, and specialty pharmaceutical products. The stock declined 27% during the year as the company experienced lower-than-expected sales, increased expense from new product launches, and investor skepticism over the merger with Pfizer’s Upjohn division.
Please see footnotes on page 7.
8 | Wells Fargo VT Opportunity Fund
Performance highlights (unaudited)
The energy sector rose 10% during the year, trailing all other sectors. While oil prices traded in a fairly stable range throughout the year, energy stocks lagged the broader market due to global supply/demand issues, lower return on capital for U.S. producers, and weak natural gas prices. The acquisition of Anadarko Petroleum Corporation** bolstered the Fund’s energy sector returns. However, a few other energy holdings underperformed the market. BP p.l.c. is one of the world’s leading oil and gas companies, providing customers with fuel for transportation, energy for heat, lubricants, and petrochemicals. The stock declined 11% during the period as a result of the general sector headwinds, weak natural gas prices, higher leverage than their peers, and a delay in the dividend increase.
|
|
| Sector distribution as of December 31, 20197 |
|
 |
Our focus is constant: to add value by investing in attractively priced holdings.
The private market valuation (PMV) of a company represents the expected price an investor would pay for the entire company as a stand-alone private entity. We seek to buy stocks at a discount to their estimated PMV, and sell them as they reach the upper limits of their PMV range. Our disciplined,bottom-up investment process leads us to be overweight or underweight certain sectors. This positioning changes over time based on macroeconomic and industry-specific factors. During the reporting period, we were overweight the financials, health care, and industrials sectors and underweight consumer staples, energy, and consumer discretionary. Through our disciplined investment process, we remain keenly aware of both price and enterprise values on acompany-by-company basis.
Looking ahead, global trade agreements, U.S. government policies, and interest rates may drive the overall market and the portfolio’s performance. Lower taxes and reduced regulations have already had an impact on the U.S. economy, but a divided U.S. Congress may slow further reform. The Fed is not expected to raise rates in the near future, which is seen as a positive for the stock market. The prospect of a potential U.S. recession is a factor in investor sentiment, along with the possible impact of a slowdown in other major global economies.
Please see footnotes on page 7.
Wells Fargo VT Opportunity Fund | 9
Fund expenses (unaudited)
As a shareholder of the Fund, you incur ongoing costs, including management fees, distribution (12b-1) fees, and other Fund expenses. This example is intended to help you understand your ongoing costs (in dollars) of investing in the Fund and to compare these costs with the ongoing costs of investing in other mutual funds.
The example is based on an investment of $1,000 invested at the beginning of the six-month period and held for the entire period from July 1, 2019 to December 31, 2019.
Actual expenses
The “Actual” line of the table below provides information about actual account values and actual expenses. You may use the information in this line, together with the amount you invested, to estimate the expenses that you paid over the period. Simply divide your account value by $1,000 (for example, an $8,600 account value divided by $1,000 = 8.6), then multiply the result by the number in the “Actual” line under the heading entitled “Expenses Paid During Period” for your applicable class of shares to estimate the expenses you paid on your account during this period.
Hypothetical example for comparison purposes
The “Hypothetical” line of the table below provides information about hypothetical account values and hypothetical expenses based on the Fund’s actual expense ratio and an assumed rate of return of 5% per year before expenses, which is not the Fund’s actual return. The hypothetical account values and expenses may not be used to estimate the actual ending account balance or expenses you paid for the period. You may use this information to compare the ongoing costs of investing in the Fund and other funds. To do so, compare this 5% hypothetical example with the 5% hypothetical examples that appear in the shareholder reports of the other funds.
Please note that the expenses shown in the table are meant to highlight your ongoing costs only and do not reflect any separate account charges assessed by participating insurance companies. Therefore, the “Hypothetical” line of the table is useful in comparing ongoing costs only, and will not help you determine the relative total costs of owning different funds. In addition, if these separate account charges assessed by participating insurance companies were included, your costs would have been higher.
| | | | | | | | | | | | | | | | |
| | | Beginning
account value
7-1-2019 | | | Ending
account value
12-31-2019 | | | Expenses
paid during
the period¹ | | | Annualized net
expense ratio | |
| | | | | |
Class 1 | | | | | | | | | | | | | | | | |
| | | | |
Actual | | $ | 1,000.00 | | | $ | 1,098.09 | | | $ | 3.96 | | | | 0.75 | % |
| | | | |
Hypothetical (5% return before expenses) | | $ | 1,000.00 | | | $ | 1,021.43 | | | $ | 3.82 | | | | 0.75 | % |
| | | | | |
Class 2 | | | | | | | | | | | | | | | | |
| | | | |
Actual | | $ | 1,000.00 | | | $ | 1,096.74 | | | $ | 5.28 | | | | 1.00 | % |
| | | | |
Hypothetical (5% return before expenses) | | $ | 1,000.00 | | | $ | 1,020.17 | | | $ | 5.09 | | | | 1.00 | % |
| 1 | Expenses paid is equal to the annualized net expense ratio of each class multiplied by the average account value over the period, multiplied by the number of days in the most recent fiscal half-year divided by the number of days in the fiscal year (to reflect the one-half year period). |
10 | Wells Fargo VT Opportunity Fund
Portfolio of investments—December 31, 2019
| | | | | | | | | | | | | | | | |
| | | | | | | | | Shares | | | Value | |
| Common Stocks: 99.02% | | | | | | | | | | | | | | | | |
| | | | |
Communication Services: 8.39% | | | | | | | | | | | | | | | | |
| | | | |
| Interactive Media & Services: 6.54% | | | | | | | | | | | | |
Alphabet Incorporated Class C † | | | | | | | | | | | 5,966 | | | $ | 7,976,661 | |
Facebook Incorporated Class A † | | | | | | | | | | | 21,366 | | | | 4,385,372 | |
| | | | |
| | | | | | | | | | | | | | | 12,362,033 | |
| | | | | | | | | | | | | | | | |
| | | | |
| Media: 1.85% | | | | | | | | | | | | |
Comcast Corporation Class A | | | | | | | | | | | 77,742 | | | | 3,496,058 | |
| | | | | | | | | | | | | | | | |
| | | | |
| Consumer Discretionary: 7.12% | | | | | | | | | | | | |
| | | | |
| Automobiles: 2.01% | | | | | | | | | | | | |
General Motors Company | | | | | | | | | | | 103,973 | | | | 3,805,412 | |
| | | | | | | | | | | | | | | | |
| | | | |
| Hotels, Restaurants & Leisure: 0.99% | | | | | | | | | | | | |
Starbucks Corporation | | | | | | | | | | | 21,384 | | | | 1,880,081 | |
| | | | | | | | | | | | | | | | |
| | | | |
| Internet & Direct Marketing Retail: 2.37% | | | | | | | | | | | | |
Amazon.com Incorporated † | | | | | | | | | | | 2,424 | | | | 4,479,165 | |
| | | | | | | | | | | | | | | | |
| | | | |
| Multiline Retail: 1.01% | | | | | | | | | | | | |
Dollar General Corporation | | | | | | | | | | | 12,245 | | | | 1,909,975 | |
| | | | | | | | | | | | | | | | |
| | | | |
| Specialty Retail: 0.74% | | | | | | | | | | | | |
ULTA Beauty Incorporated † | | | | | | | | | | | 5,508 | | | | 1,394,295 | |
| | | | | | | | | | | | | | | | |
| | | | |
| Consumer Staples: 1.05% | | | | | | | | | | | | |
| | | | |
| Household Products: 1.05% | | | | | | | | | | | | |
Church & Dwight Company Incorporated | | | | | | | | | | | 28,302 | | | | 1,990,763 | |
| | | | | | | | | | | | | | | | |
| | | | |
Energy: 3.88% | | | | | | | | | | | | | | | | |
| | | | |
| Oil, Gas & Consumable Fuels: 3.88% | | | | | | | | | | | | |
BP plc | | | | | | | | | | | 96,328 | | | | 3,635,419 | |
EOG Resources Incorporated | | | | | | | | | | | 21,959 | | | | 1,839,286 | |
Noble Energy Incorporated | | | | | | | | | | | 74,859 | | | | 1,859,498 | |
| | | | |
| | | | | | | | | | | | | | | 7,334,203 | |
| | | | | | | | | | | | | | | | |
| | | | |
Financials: 16.77% | | | | | | | | | | | | | | | | |
| | | | |
| Banks: 6.08% | | | | | | | | | | | | |
Pinnacle Financial Partners Incorporated | | | | | | | | | | | 57,015 | | | | 3,648,960 | |
PNC Financial Services Group Incorporated | | | | | | | | | | | 27,625 | | | | 4,409,779 | |
Webster Financial Corporation | | | | | | | | | | | 64,144 | | | | 3,422,724 | |
| | | | |
| | | | | | | | | | | | | | | 11,481,463 | |
| | | | | | | | | | | | | | | | |
| | | | |
| Capital Markets: 5.76% | | | | | | | | | | | | |
E*TRADE Financial Corporation | | | | | | | | | | | 58,952 | | | | 2,674,652 | |
Intercontinental Exchange Incorporated | | | | | | | | | | | 45,413 | | | | 4,202,973 | |
S&P Global Incorporated | | | | | | | | | | | 14,694 | | | | 4,012,197 | |
| | | | |
| | | | | | | | | | | | | | | 10,889,822 | |
| | | | | | | | | | | | | | | | |
| | | | |
| Insurance: 4.93% | | | | | | | | | | | | |
Chubb Limited | | | | | | | | | | | 23,837 | | | | 3,710,467 | |
Marsh & McLennan Companies Incorporated | | | | | | | | | | | 29,546 | | | | 3,291,720 | |
Willis Towers Watson plc | | | | | | | | | | | 11,495 | | | | 2,321,300 | |
| | | | |
| | | | | | | | | | | | | | | 9,323,487 | |
| | | | | | | | | | | | | | | | |
The accompanying notes are an integral part of these financial statements.
Wells Fargo VT Opportunity Fund | 11
Portfolio of investments—December 31, 2019
| | | | | | | | | | | | | | | | |
| | | | | | | | | Shares | | | Value | |
Health Care: 17.69% | | | | | | | | | | | | | | | | |
| | | | |
| Biotechnology: 0.73% | | | | | | | | | | | | |
Alexion Pharmaceuticals Incorporated † | | | | | | | | | | | 12,728 | | | $ | 1,376,533 | |
| | | | | | | | | | | | | | | | |
| | | | |
| Health Care Equipment & Supplies: 5.66% | | | | | | | | | | | | |
LivaNova plc † | | | | | | | | | | | 60,919 | | | | 4,595,120 | |
Medtronic plc | | | | | | | | | | | 34,554 | | | | 3,920,151 | |
Zimmer Biomet Holdings Incorporated | | | | | | | | | | | 14,556 | | | | 2,178,742 | |
| | | | |
| | | | | | | | | | | | | | | 10,694,013 | |
| | | | | | | | | | | | | | | | |
| | | | |
| Health Care Providers & Services: 2.33% | | | | | | | | | | | | |
Cigna Corporation | | | | | | | | | | | 12,363 | | | | 2,528,110 | |
UnitedHealth Group Incorporated | | | | | | | | | | | 6,377 | | | | 1,874,710 | |
| | | | |
| | | | | | | | | | | | | | | 4,402,820 | |
| | | | | | | | | | | | | | | | |
| | | | |
| Life Sciences Tools & Services: 5.77% | | | | | | | | | | | | |
Agilent Technologies Incorporated | | | | | | | | | | | 33,641 | | | | 2,869,914 | |
Bio-Rad Laboratories Incorporated Class A † | | | | | | | | | | | 11,707 | | | | 4,331,941 | |
Thermo Fisher Scientific Incorporated | | | | | | | | | | | 11,406 | | | | 3,705,467 | |
| | | | |
| | | | | | | | | | | | | | | 10,907,322 | |
| | | | | | | | | | | | | | | | |
| | | | |
| Pharmaceuticals: 3.20% | | | | | | | | | | | | |
Mylan NV † | | | | | | | | | | | 79,555 | | | | 1,599,056 | |
Novartis AG ADR | | | | | | | | | | | 47,088 | | | | 4,458,763 | |
| | | | |
| | | | | | | | | | | | | | | 6,057,819 | |
| | | | | | | | | | | | | | | | |
| | | | |
| Industrials: 11.74% | | | | | | | | | | | | |
| | | | |
| Aerospace & Defense: 1.72% | | | | | | | | | | | | |
Safran SA | | | | | | | | | | | 20,998 | | | | 3,242,133 | |
| | | | | | | | | | | | | | | | |
| | | | |
| Airlines: 1.13% | | | | | | | | | | | | |
Delta Air Lines Incorporated | | | | | | | | | | | 36,626 | | | | 2,141,888 | |
| | | | | | | | | | | | | | | | |
| | | | |
| Building Products: 2.38% | | | | | | | | | | | | |
Armstrong World Industries Incorporated | | | | | | | | | | | 30,524 | | | | 2,868,340 | |
Fortune Brands Home & Security Incorporated | | | | | | | | | | | 24,784 | | | | 1,619,387 | |
| | | | |
| | | | | | | | | | | | | | | 4,487,727 | |
| | | | | | | | | | | | | | | | |
| | | | |
| Commercial Services & Supplies: 1.16% | | | | | | | | | | | | |
Republic Services Incorporated | | | | | | | | | | | 24,517 | | | | 2,197,459 | |
| | | | | | | | | | | | | | | | |
| | | | |
| Industrial Conglomerates: 1.02% | | | | | | | | | | | | |
Carlisle Companies Incorporated | | | | | | | | | | | 11,919 | | | | 1,928,971 | |
| | | | | | | | | | | | | | | | |
| | | | |
| Machinery: 3.09% | | | | | | | | | | | | |
Fortive Corporation | | | | | | | | | | | 41,719 | | | | 3,186,914 | |
ITT Incorporated | | | | | | | | | | | 35,939 | | | | 2,656,251 | |
| | | | |
| | | | | | | | | | | | | | | 5,843,165 | |
| | | | | | | | | | | | | | | | |
| | | | |
| Trading Companies & Distributors: 1.24% | | | | | | | | | | | | |
United Rentals Incorporated † | | | | | | | | | | | 14,065 | | | | 2,345,620 | |
| | | | | | | | | | | | | | | | |
| | | | |
| Information Technology: 22.17% | | | | | | | | | | | | |
| | | | |
| Electronic Equipment, Instruments & Components: 1.82% | | | | | | | | | | | | |
Amphenol Corporation Class A | | | | | | | | | | | 31,817 | | | | 3,443,554 | |
| | | | | | | | | | | | | | | | |
The accompanying notes are an integral part of these financial statements.
12 | Wells Fargo VT Opportunity Fund
Portfolio of investments—December 31, 2019
| | | | | | | | | | | | | | | | |
| | | | | | | | | Shares | | | Value | |
| IT Services: 4.00% | | | | | | | | | | | | |
Fidelity National Information Services Incorporated | | | | | | | | | | | 19,401 | | | $ | 2,698,485 | |
MasterCard Incorporated Class A | | | | | | | | | | | 16,269 | | | | 4,857,761 | |
| | | | |
| | | | | | | | | | | | | | | 7,556,246 | |
| | | | | | | | | | | | | | | | |
| | | | |
| Semiconductors & Semiconductor Equipment: 4.20% | | | | | | | | | | | | |
Marvell Technology Group Limited | | | | | | | | | | | 115,698 | | | | 3,072,939 | |
Texas Instruments Incorporated | | | | | | | | | | | 38,027 | | | | 4,878,484 | |
| | | | |
| | | | | | | | | | | | | | | 7,951,423 | |
| | | | | | | | | | | | | | | | |
| | | | |
| Software: 9.24% | | | | | | | | | | | | |
Oracle Corporation | | | | | | | | | | | 44,746 | | | | 2,370,643 | |
Palo Alto Networks Incorporated † | | | | | | | | | | | 10,412 | | | | 2,407,775 | |
Proofpoint Incorporated † | | | | | | | | | | | 16,566 | | | | 1,901,445 | |
RealPage Incorporated † | | | | | | | | | | | 46,246 | | | | 2,485,723 | |
Salesforce.com Incorporated † | | | | | | | | | | | 37,377 | | | | 6,078,995 | |
Workday Incorporated Class A † | | | | | | | | | | | 13,483 | | | | 2,217,279 | |
| | | | |
| | | | | | | | | | | | | | | 17,461,860 | |
| | | | | | | | | | | | | | | | |
| | | | |
| Technology Hardware, Storage & Peripherals: 2.91% | | | | | | | | | | | | |
Apple Incorporated | | | | | | | | | | | 18,750 | | | | 5,505,938 | |
| | | | | | | | | | | | | | | | |
| | | | |
| Materials: 4.62% | | | | | | | | | | | | |
| | | | |
| Chemicals: 2.39% | | | | | | | | | | | | |
Dow Incorporated | | | | | | | | | | | 48,485 | | | | 2,653,584 | |
The Sherwin-Williams Company | | | | | | | | | | | 3,184 | | | | 1,857,991 | |
| | | | |
| | | | | | | | | | | | | | | 4,511,575 | |
| | | | | | | | | | | | | | | | |
| | | | |
| Metals & Mining: 2.23% | | | | | | | | | | | | |
Royal Gold Incorporated | | | | | | | | | | | 14,693 | | | | 1,796,219 | |
Steel Dynamics Incorporated | | | | | | | | | | | 71,050 | | | | 2,418,542 | |
| | | | |
| | | | | | | | | | | | | | | 4,214,761 | |
| | | | | | | | | | | | | | | | |
| | | | |
| Real Estate: 5.59% | | | | | | | | | | | | |
| | | | |
| Equity REITs: 5.59% | | | | | | | | | | | | |
American Tower Corporation | | | | | | | | | | | 12,687 | | | | 2,915,726 | |
Equinix Incorporated | | | | | | | | | | | 7,513 | | | | 4,385,338 | |
VICI Properties Incorporated | | | | | | | | | | | 127,612 | | | | 3,260,487 | |
| | | | |
| | | | | | | | | | | | | | | 10,561,551 | |
| | | | | | | | | | | | | | | | |
| | | | |
Total Common Stocks (Cost $133,154,254) | | | | | | | | | | | | | | | 187,179,135 | |
| | | | | | | | | | | | | | | | |
| | | | |
| | | | | | | | | | | | | | | | |
| | | Yield | | | | | | | | | | |
| Short-Term Investments: 0.98% | | | | | | | | | | | | |
| | | | |
| Investment Companies: 0.98% | | | | | | | | | | | | |
Wells Fargo Government Money Market Fund Select Class (l)(u) | | | 1.55 | % | | | | | | | 1,838,788 | | | | 1,838,788 | |
| | | | | | | | | | | | | | | | |
| | | | |
Total Short-Term Investments (Cost $1,838,788) | | | | | | | | | | | | | | | 1,838,788 | |
| | | | | | | | | | | | | | | | |
| | | | | | | | |
| Total investments in securities (Cost $134,993,042) | | | 100.00 | % | | | 189,017,923 | |
| | |
Other assets and liabilities, net | | | 0.00 | | | | 9,124 | |
| | | | | | | | |
| Total net assets | | | 100.00 | % | | $ | 189,027,047 | |
| | | | | | | | |
The accompanying notes are an integral part of these financial statements.
Wells Fargo VT Opportunity Fund | 13
Portfolio of investments—December 31, 2019
| † | Non-income-earning security |
| (l) | The issuer of the security is an affiliated person of the Fund as defined in the Investment Company Act of 1940. |
| (u) | The rate represents the7-day annualized yield at period end. |
Abbreviations:
| ADR | American depositary receipt |
| REIT | Real estate investment trust |
Investments in Affiliates
An affiliated investment is an investment in which the Fund owns at least 5% of the outstanding voting shares of the issuer or as a result of other relationships, such as the Fund and the issuer having the same investment manager. Transactions with issuers that were either affiliated persons of the Fund at the beginning of the period or the end of the period were as follows:
| | | | | | | | | | | | | | | | | | | | | | | | | | | | | | | | | | | | |
| | | Shares,
beginning of
period | | | Shares
purchased | | | Shares sold | | | Shares, end of
period | | | Net
realized
gains
(losses) | | | Net
change in
unrealized
gains
(losses) | | | Income
from
affiliated
securities | | | Value,
end of
period | | | % of
net
assets | |
Short-Term Investments | | | | | | | | | | | | | | | | | | | | | | | | | | | | | | | | | | | | |
Investment Companies | | | | | | | | | | | | | | | | | | | | | | | | | | | | | | | | | | | | |
Securities Lending Cash Investments LLC * | | | 0 | | | | 18,135,336 | | | | (18,135,336 | ) | | | 0 | | | $ | 0 | | | $ | 0 | | | $ | 5,284 | # | | $ | 0 | | | | | |
Wells Fargo Government Money Market Fund Select Class | | | 2,621,241 | | | | 35,981,309 | | | | (36,763,762 | ) | | | 1,838,788 | | | | 0 | | | | 0 | | | | 64,568 | | | | 1,838,788 | | | | | |
| | | | | | | | | | | | | | | | | | | | | | | | | | | | | | | | | | | | |
| | | | | | | | | | | | | | | | | | $ | 0 | | | $ | 0 | | | $ | 69,852 | | | $ | 1,838,788 | | | | 0.98 | % |
| | | | | | | | | | | | | | | | | | | | | | | | | | | | | | | | | | | | |
| * | No longer held at the end of the period. |
| # | Amount shown represents income before fees and rebates. |
The accompanying notes are an integral part of these financial statements.
14 | Wells Fargo VT Opportunity Fund
Statement of assets and liabilities—December 31, 2019
| | | | |
| | | | |
| |
Assets | | | | |
Investments in unaffiliated securities, at value (cost $133,154,254) | | $ | 187,179,135 | |
Investments in affiliated securities, at value (cost $1,838,788) | | | 1,838,788 | |
Receivable for Fund shares sold | | | 9,077 | |
Receivable for dividends | | | 234,206 | |
Receivable for securities lending income, net | | | 93 | |
Prepaid expenses and other assets | | | 6,218 | |
| | | | |
Total assets | | | 189,267,517 | |
| | | | |
| |
Liabilities | | | | |
Payable for Fund shares redeemed | | | 79,669 | |
Management fee payable | | | 98,940 | |
Administration fees payable | | | 13,128 | |
Distribution fee payable | | | 34,233 | |
Trustees’ fees and expenses payable | | | 6,185 | |
Accrued expenses and other liabilities | | | 8,315 | |
| | | | |
Total liabilities | | | 240,470 | |
| | | | |
Total net assets | | $ | 189,027,047 | |
| | | | |
| |
Net assets consist of | | | | |
Paid-in capital | | $ | 121,209,425 | |
Total distributable earnings | | | 67,817,622 | |
| | | | |
Total net assets | | $ | 189,027,047 | |
| | | | |
| |
Computation of net asset value per share | | | | |
Net assets – Class 1 | | $ | 30,811,196 | |
Shares outstanding – Class 11 | | | 1,160,120 | |
Net asset value per share – Class 1 | | | $26.56 | |
Net assets – Class 2 | | $ | 158,215,851 | |
Shares outstanding – Class 21 | | | 5,930,563 | |
Net asset value per share – Class 2 | | | $26.68 | |
| 1 | The Fund has an unlimited number of authorized shares. |
The accompanying notes are an integral part of these financial statements.
Wells Fargo VT Opportunity Fund | 15
Statement of operations —year ended December 31, 2019
| | | | |
| | | | |
| |
Investment income | | | | |
Dividends (net of foreign withholding taxes of $36,852) | | $ | 2,510,389 | |
Income from affiliated securities | | | 65,388 | |
| | | | |
Total investment income | | | 2,575,777 | |
| | | | |
| |
Expenses | | | | |
Management fee | | | 1,270,029 | |
Administration fees | | | | |
Class 1 | | | 23,857 | |
Class 2 | | | 121,290 | |
Distribution fee | | | | |
Class 2 | | | 378,841 | |
Custody and accounting fees | | | 8,223 | |
Professional fees | | | 49,987 | |
Shareholder report expenses | | | 38,000 | |
Trustees’ fees and expenses | | | 21,652 | |
Other fees and expenses | | | 8,391 | |
| | | | |
Total expenses | | | 1,920,270 | |
Less: Fee waivers and/or expense reimbursements | | | | |
Fund-level | | | (180,823 | ) |
Class 1 | | | (18 | ) |
| | | | |
Net expenses | | | 1,739,429 | |
| | | | |
Net investment income | | | 836,348 | |
| | | | |
| |
Realized and unrealized gains (losses) on investments | | | | |
Net realized gains on investments | | | 13,216,674 | |
Net change in unrealized gains (losses) on investments | | | 34,750,912 | |
| | | | |
Net realized and unrealized gains (losses) on investments | | | 47,967,586 | |
| | | | |
Net increase in net assets resulting from operations | | $ | 48,803,934 | |
| | | | |
The accompanying notes are an integral part of these financial statements.
16 | Wells Fargo VT Opportunity Fund
Statement of changes in net assets
| | | | | | | | | | | | | | | | |
| | | Year ended December 31, 2019 | | | Year ended December 31, 2018 | |
| | | | |
Operations | | | | | | | | | | | | | | | | |
Net investment income | | | | | | $ | 836,348 | | | | | | | $ | 591,419 | |
Net realized gains on investments | | | | | | | 13,216,674 | | | | | | | | 21,042,285 | |
Net change in unrealized gains (losses) on investments | | | | | | | 34,750,912 | | | | | | | | (33,356,075 | ) |
| | | | |
Net increase (decrease) in net assets resulting from operations | | | | | | | 48,803,934 | | | | | | | | (11,722,371 | ) |
| | | | |
| | | | |
Distributions to shareholders from net investment income and net realized gains | | | | | | | | | | | | | | | | |
Class 1 | | | | | | | (3,501,610 | ) | | | | | | | (3,183,122 | ) |
Class 2 | | | | | | | (17,537,462 | ) | | | | | | | (15,162,715 | ) |
| | | | |
Total distributions to shareholders | | | | | | | (21,039,072 | ) | | | | | | | (18,345,837 | ) |
| | | | |
| | | | |
Capital share transactions | | | Shares | | | | | | | | Shares | | | | | |
Proceeds from shares sold | | | | | | | | | | | | | | | | |
Class 1 | | | 16,098 | | | | 390,406 | | | | 16,978 | | | | 449,959 | |
Class 2 | | | 117,672 | | | | 3,032,567 | | | | 93,938 | | | | 2,507,781 | |
| | | | |
| | | | | | | 3,422,973 | | | | | | | | 2,957,740 | |
| | | | |
Reinvestment of distributions | | | | | | | | | | | | | | | | |
Class 1 | | | 141,137 | | | | 3,501,610 | | | | 122,902 | | | | 3,183,122 | |
Class 2 | | | 702,904 | | | | 17,537,462 | | | | 582,519 | | | | 15,162,715 | |
| | | | |
| | | | | | | 21,039,072 | | | | | | | | 18,345,837 | |
| | | | |
Payment for shares redeemed | | | | | | | | | | | | | | | | |
Class 1 | | | (190,606 | ) | | | (4,880,882 | ) | | | (197,598 | ) | | | (5,238,064 | ) |
Class 2 | | | (797,590 | ) | | | (20,455,623 | ) | | | (885,281 | ) | | | (23,695,490 | ) |
| | | | |
| | | | | | | (25,336,505 | ) | | | | | | | (28,933,554 | ) |
| | | | |
Net decrease in net assets resulting from capital share transactions | | | | | | | (874,460 | ) | | | | | | | (7,629,977 | ) |
| | | | |
Total increase (decrease) in net assets | | | | | | | 26,890,402 | | | | | | | | (37,698,185 | ) |
| | | | |
| | | | |
Net assets | | | | | | | | | | | | | | | | |
Beginning of period | | | | | | | 162,136,645 | | | | | | | | 199,834,830 | |
| | | | |
End of period | | | | | | $ | 189,027,047 | | | | | | | $ | 162,136,645 | |
| | | | |
The accompanying notes are an integral part of these financial statements.
Wells Fargo VT Opportunity Fund | 17
Financial highlights
(For a share outstanding throughout each period)
| | | | | | | | | | | | | | | | | | | | |
| | | Year ended December 31 | |
| CLASS 1 | | 2019 | | | 2018 | | | 2017 | | | 2016 | | | 2015 | |
Net asset value, beginning of period | | | $22.76 | | | | $27.05 | | | | $24.60 | | | | $25.00 | | | | $28.82 | |
Net investment income | | | 0.17 | | | | 0.15 | | | | 0.13 | | | | 0.22 | | | | 0.57 | |
Net realized and unrealized gains (losses) on investments | | | 6.84 | | | | (1.69 | ) | | | 4.77 | | | | 2.59 | | | | (1.28 | ) |
| | | | | | | | | | | | | | | | | | | | |
Total from investment operations | | | 7.01 | | | | (1.54 | ) | | | 4.90 | | | | 2.81 | | | | (0.71 | ) |
Distributions to shareholders from | | | | | | | | | | | | | | | | | | | | |
Net investment income | | | (0.15 | ) | | | (0.12 | ) | | | (0.25 | ) | | | (0.60 | ) | | | (0.12 | ) |
Net realized gains | | | (3.06 | ) | | | (2.63 | ) | | | (2.20 | ) | | | (2.61 | ) | | | (2.99 | ) |
| | | | | | | | | | | | | | | | | | | | |
Total distributions to shareholders | | | (3.21 | ) | | | (2.75 | ) | | | (2.45 | ) | | | (3.21 | ) | | | (3.11 | ) |
Net asset value, end of period | | | $26.56 | | | | $22.76 | | | | $27.05 | | | | $24.60 | | | | $25.00 | |
Total return1 | | | 31.81 | % | | | (6.93 | )% | | | 20.72 | % | | | 12.52 | % | | | (2.85 | )% |
Ratios to average net assets (annualized) | | | | | | | | | | | | | | | | | | | | |
Gross expenses | | | 0.85 | % | | | 0.84 | % | | | 0.86 | % | | | 0.85 | % | | | 0.84 | % |
Net expenses | | | 0.75 | % | | | 0.75 | % | | | 0.75 | % | | | 0.75 | % | | | 0.75 | % |
Net investment income | | | 0.67 | % | | | 0.52 | % | | | 0.43 | % | | | 0.65 | % | | | 2.02 | % |
Supplemental data | | | | | | | | | | | | | | | | | | | | |
Portfolio turnover rate | | | 25 | % | | | 31 | % | | | 36 | % | | | 47 | % | | | 41 | % |
Net assets, end of period (000s omitted) | | | $30,811 | | | | $27,165 | | | | $33,843 | | | | $33,035 | | | | $35,539 | |
| 1 | Returns do not reflect fees and expenses charged pursuant to the terms of variable life insurance policies and variable annuity contracts. |
The accompanying notes are an integral part of these financial statements.
18 | Wells Fargo VT Opportunity Fund
Financial highlights
(For a share outstanding throughout each period)
| | | | | | | | | | | | | | | | | | | | |
| | | Year ended December 31 | |
| CLASS 2 | | 2019 | | | 2018 | | | 2017 | | | 2016 | | | 2015 | |
Net asset value, beginning of period | | | $22.85 | | | | $27.14 | | | | $24.67 | | | | $25.05 | | | | $28.86 | |
Net investment income | | | 0.11 | | | | 0.08 | | | | 0.06 | | | | 0.13 | | | | 0.50 | |
Net realized and unrealized gains (losses) on investments | | | 6.86 | | | | (1.69 | ) | | | 4.79 | | | | 2.63 | | | | (1.28 | ) |
| | | | | | | | | | | | | | | | | | | | |
Total from investment operations | | | 6.97 | | | | (1.61 | ) | | | 4.85 | | | | 2.76 | | | | (0.78 | ) |
Distributions to shareholders from | | | | | | | | | | | | | | | | | | | | |
Net investment income | | | (0.08 | ) | | | (0.05 | ) | | | (0.18 | ) | | | (0.53 | ) | | | (0.04 | ) |
Net realized gains | | | (3.06 | ) | | | (2.63 | ) | | | (2.20 | ) | | | (2.61 | ) | | | (2.99 | ) |
| | | | | | | | | | | | | | | | | | | | |
Total distributions to shareholders | | | (3.14 | ) | | | (2.68 | ) | | | (2.38 | ) | | | (3.14 | ) | | | (3.03 | ) |
Net asset value, end of period | | | $26.68 | | | | $22.85 | | | | $27.14 | | | | $24.67 | | | | $25.05 | |
Total return1 | | | 31.46 | % | | | (7.15 | )% | | | 20.44 | % | | | 12.23 | % | | | (3.08 | )% |
Ratios to average net assets (annualized) | | | | | | | | | | | | | | | | | | | | |
Gross expenses | | | 1.10 | % | | | 1.09 | % | | | 1.11 | % | | | 1.10 | % | | | 1.09 | % |
Net expenses | | | 1.00 | % | | | 1.00 | % | | | 1.00 | % | | | 1.00 | % | | | 1.00 | % |
Net investment income | | | 0.42 | % | | | 0.27 | % | | | 0.18 | % | | | 0.39 | % | | | 1.76 | % |
Supplemental data | | | | | | | | | | | | | | | | | | | | |
Portfolio turnover rate | | | 25 | % | | | 31 | % | | | 36 | % | | | 47 | % | | | 41 | % |
Net assets, end of period (000s omitted) | | | $158,216 | | | | $134,972 | | | | $165,992 | | | | $158,783 | | | | $169,090 | |
| 1 | Returns do not reflect fees and expenses charged pursuant to the terms of variable life insurance policies and variable annuity contracts. |
The accompanying notes are an integral part of these financial statements.
Wells Fargo VT Opportunity Fund | 19
Notes to financial statements
1. ORGANIZATION
Wells Fargo Variable Trust (the “Trust”), a Delaware statutory trust organized on March 10, 1999, is anopen-end management investment company registered under the Investment Company Act of 1940, as amended (the “1940 Act”). As an investment company, the Trust follows the accounting and reporting guidance in Financial Accounting Standards Board (“FASB”)Accounting Standards Codification Topic 946, Financial Services – Investment Companies. These financial statements report on the Wells Fargo VT Opportunity Fund (the “Fund”) which is a diversified series of the Trust. The Trust offers shares of the Fund to separate accounts of various life insurance companies as funding vehicles for certain variable annuity contracts and variable life insurance policies.
2. SIGNIFICANT ACCOUNTING POLICIES
The following significant accounting policies, which are consistently followed in the preparation of the financial statements of the Fund, are in conformity with U.S. generally accepted accounting principles which require management to make estimates and assumptions that affect the reported amounts of assets and liabilities, disclosure of contingent assets and liabilities at the date of the financial statements, and the reported amounts of revenues and expenses during the reporting period. Actual results could differ from those estimates.
Securities valuation
All investments are valued each business day as of the close of regular trading on the New York Stock Exchange (generally 4 p.m. Eastern Time), although the Fund may deviate from this calculation time under unusual or unexpected circumstances.
Equity securities that are listed on a foreign or domestic exchange or market are valued at the official closing price or, if none, the last sales price. If no sale occurs on the principal exchange or market that day, a fair value price will be determined in accordance with the Fund’s Valuation Procedures.
The values of securities denominated in foreign currencies are translated into U.S. dollars at rates provided by an independent foreign currency pricing source at a time each business day specified by the Wells Fargo Asset Management Pricing Committee at Wells Fargo Funds Management, LLC (“Funds Management”).
Many securities markets and exchanges outside the U.S. close prior to the close of the New York Stock Exchange and therefore may not fully reflect trading or events that occur after the close of the principal exchange in which the foreign securities are traded, but before the close of the New York Stock Exchange. If such trading or events are expected to materially affect the value of such securities, then fair value pricing procedures approved by the Board of Trustees of the Fund are applied. These procedures take into account multiple factors including movements in U.S. securities markets after foreign exchanges close. Foreign securities that are fair valued under these procedures are categorized as Level 2 and the application of these procedures may result in transfers between Level 1 and Level 2. Depending on market activity, such fair valuations may be frequent. Such fair value pricing may result in net asset values that are higher or lower than net asset values based on the last reported sales price or latest quoted bid price. On December 31, 2019, such fair value pricing was not used in pricing foreign securities.
Investments in registeredopen-end investment companies are valued at net asset value. Interests innon-registered investment companies that are redeemable at net asset value are fair valued normally at net asset value.
Investments which are not valued using any of the methods discussed above are valued at their fair value, as determined in good faith by the Board of Trustees. The Board of Trustees has established a Valuation Committee comprised of the Trustees and has delegated to it the authority to take any actions regarding the valuation of portfolio securities that the Valuation Committee deems necessary or appropriate, including determining the fair value of portfolio securities, unless the determination has been delegated to the Wells Fargo Asset Management Pricing Committee. The Board of Trustees retains the authority to make or ratify any valuation decisions or approve any changes to the Valuation Procedures as it deems appropriate. On a quarterly basis, the Board of Trustees receives reports on any valuation actions taken by the Valuation Committee or the Wells Fargo Asset Management Pricing Committee which may include items for ratification.
Foreign currency translation
The accounting records of the Fund are maintained in U.S. dollars. The values of other assets and liabilities denominated in foreign currencies are translated into U.S. dollars at rates provided by an independent foreign currency pricing source at a time each business day specified by the Wells Fargo Asset Management Pricing Committee. Purchases and sales of securities, and income and expenses are converted at the rate of exchange on the respective dates of such transactions. Net realized foreign exchange gains or losses arise from sales of foreign currencies, currency gains or losses realized between the trade and settlement dates on securities transactions, and the difference between the amounts of dividends, interest and foreign withholding taxes recorded and the U.S. dollar equivalent of the amounts actually paid or received. Net unrealized foreign exchange gains and losses arise from changes in the fair value of assets and liabilities other than investments in securities
20 | Wells Fargo VT Opportunity Fund
Notes to financial statements
resulting from changes in exchange rates. The changes in net assets arising from changes in exchange rates of securities and the changes in net assets resulting from changes in market prices of securities are not separately presented. Such changes are included in net realized and unrealized gains or losses from investments.
Securities lending
The Fund may lend its securities from time to time in order to earn additional income in the form of fees or interest on securities received as collateral or the investment of any cash received as collateral. When securities are on loan, the Fund receives interest or dividends on those securities. Cash collateral received in connection with its securities lending transactions is invested in Securities Lending Cash Investments, LLC (the “Securities Lending Fund”). Investments in Securities Lending Fund are valued at the evaluated bid price provided by an independent pricing service. Income earned from investment in the Securities Lending Fund (net of fees and rebates), if any, is included in income from affiliated securities on the Statement of Operations.
In a securities lending transaction, the net asset value of the Fund is affected by an increase or decrease in the value of the securities loaned and by an increase or decrease in the value of the instrument in which collateral is invested. The amount of securities lending activity undertaken by the Fund fluctuates from time to time. The Fund has the right under the lending agreement to recover the securities from the borrower on demand. In the event of default or bankruptcy by the borrower, the Fund may be prevented from recovering the loaned securities or gaining access to the collateral or may experience delays or costs in doing so. In such an event, the terms of the agreement allows the unaffiliated securities lending agent to use the collateral to purchase replacement securities on behalf of the Fund or pay the Fund the market value of the loaned securities. The Fund bears the risk of loss with respect to depreciation of its investment of the cash collateral.
Security transactions and income recognition
Securities transactions are recorded on a trade date basis. Realized gains or losses are recorded on the basis of identified cost.
Dividend income is recognized on theex-dividend date, except for certain dividends from foreign securities, which are recorded as soon as the custodian verifies theex-dividend date. Dividend income from foreign securities is recorded net of foreign taxes withheld where recovery of such taxes is not assured.
Distributions to shareholders
Distributions to shareholders from net investment income and any net realized gains are recorded on theex-dividend date and paid at least annually. Such distributions are determined in accordance with income tax regulations and may differ from U.S. generally accepted accounting principles. Dividend sources are estimated at the time of declaration. The tax character of distributions is determined as of the Fund’s fiscal year end. Therefore, a portion of the Fund’s distributions made prior to the Fund’s fiscal year end may be categorized as a tax return of capital at year end.
Federal and other taxes
The Fund intends to continue to qualify as a regulated investment company by distributing substantially all of its investment company taxable income and any net realized capital gains (after reduction for capital loss carryforwards) sufficient to relieve it from all, or substantially all, federal income taxes. Accordingly, no provision for federal income taxes was required.
The Fund’s income and federal excise tax returns and all financial records supporting those returns for the prior three fiscal years are subject to examination by the federal and Delaware revenue authorities. Management has analyzed the Fund’s tax positions taken on federal, state, and foreign tax returns for all open tax years and does not believe that there are any uncertain tax positions that require recognition of a tax liability.
As of December 31, 2019, the aggregate cost of all investments for federal income tax purposes was $135,209,656 and the unrealized gains (losses) consisted of:
| | | | |
| |
Gross unrealized gains | | $ | 57,276,965 | |
| |
Gross unrealized losses | | | (3,468,698 | ) |
| |
Net unrealized gains | | $ | 53,808,267 | |
Class allocations
The separate classes of shares offered by the Fund differ principally in distribution fees. Class specific expenses are charged directly to that share class. Investment income, common fund-level expenses, and realized and unrealized gains (losses) on investments are allocated daily to each class of shares based on the relative proportion of net assets of each class.
Wells Fargo VT Opportunity Fund | 21
Notes to financial statements
3. FAIR VALUATION MEASUREMENTS
Fair value measurements of investments are determined within a framework that has established a fair value hierarchy based upon the various data inputs utilized in determining the value of the Fund’s investments. The three-level hierarchy gives the highest priority to unadjusted quoted prices in active markets for identical assets or liabilities (Level 1) and the lowest priority to unobservable inputs (Level 3). The Fund’s investments are classified within the fair value hierarchy based on the lowest level of input that is significant to the fair value measurement. The inputs are summarized into three broad levels as follows:
| ∎ | | Level 1 – quoted prices in active markets for identical securities |
| ∎ | | Level 2 – other significant observable inputs (including quoted prices for similar securities, interest rates, prepayment speeds, credit risk, etc.) |
| ∎ | | Level 3 – significant unobservable inputs (including the Fund’s own assumptions in determining the fair value of investments) |
The inputs or methodologies used for valuing investments in securities are not necessarily an indication of the risk associated with investing in those securities.
The following is a summary of the inputs used in valuing the Fund’s assets and liabilities as of December 31, 2019:
| | | | | | | | | | | | | | | | |
| | | | |
| | | Quoted prices
(Level 1) | | | Other significant
observable inputs
(Level 2) | | | Significant
unobservable inputs (Level 3) | | | Total | |
| | | | |
Assets | | | | | | | | | | | | | | | | |
Investments in: | | | | | | | | | | | | | | | | |
| | | | |
Common stocks | | | | | | | | | | | | | | | | |
| | | | |
Communication services | | $ | 15,858,091 | | | $ | 0 | | | $ | 0 | | | $ | 15,858,091 | |
| | | | |
Consumer discretionary | | | 13,468,928 | | | | 0 | | | | 0 | | | | 13,468,928 | |
| | | | |
Consumer staples | | | 1,990,763 | | | | 0 | | | | 0 | | | | 1,990,763 | |
| | | | |
Energy | | | 7,334,203 | | | | 0 | | | | 0 | | | | 7,334,203 | |
| | | | |
Financials | | | 31,694,772 | | | | 0 | | | | 0 | | | | 31,694,772 | |
| | | | |
Health care | | | 33,438,507 | | | | 0 | | | | 0 | | | | 33,438,507 | |
| | | | |
Industrials | | | 22,186,963 | | | | 0 | | | | 0 | | | | 22,186,963 | |
| | | | |
Information technology | | | 41,919,021 | | | | 0 | | | | 0 | | | | 41,919,021 | |
| | | | |
Materials | | | 8,726,336 | | | | 0 | | | | 0 | | | | 8,726,336 | |
| | | | |
Real estate | | | 10,561,551 | | | | 0 | | | | 0 | | | | 10,561,551 | |
| | | | |
Short-term investments | | | | | | | | | | | | | | | | |
| | | | |
Investment companies | | | 1,838,788 | | | | 0 | | | | 0 | | | | 1,838,788 | |
| | | | |
Total assets | | $ | 189,017,923 | | | $ | 0 | | | $ | 0 | | | $ | 189,017,923 | |
Additional sector, industry or geographic detail is included in the Portfolio of Investments.
For the year ended December 31, 2019, the Fund did not have any transfers into/out of Level 3.
22 | Wells Fargo VT Opportunity Fund
Notes to financial statements
4. TRANSACTIONS WITH AFFILIATES
Management fee
Funds Management, an indirect wholly owned subsidiary of Wells Fargo & Company (“Wells Fargo”), is the manager of the Fund and provides advisory and fund-level administrative services under an investment management agreement. Under the investment management agreement, Funds Management is responsible for, among other services, implementing the investment objectives and strategies of the Fund, supervising the subadviser and providing fund-level administrative services in connection with the Fund’s operations. As compensation for its services under the investment management agreement, Funds Management is entitled to receive a management fee at the following annual rate based on the Fund’s average daily net assets:
| | | | |
| |
| Average daily net assets | | Management fee | |
| |
First $500 million | | | 0.700 | % |
| |
Next $500 million | | | 0.675 | |
| |
Next $1 billion | | | 0.650 | |
| |
Next $2 billion | | | 0.625 | |
| |
Next $1 billion | | | 0.600 | |
| |
Next $5 billion | | | 0.590 | |
| |
Over $10 billion | | | 0.580 | |
For the year ended December 31, 2019, the management fee was equivalent to an annual rate of 0.70% of the Fund’s average daily net assets.
Funds Management has retained the services of a subadviser to provide daily portfolio management to the Fund. The fee for subadvisory services is borne by Funds Management. Wells Capital Management Incorporated (“WellsCap”), an affiliate of Funds Management and an indirect wholly owned subsidiary of Wells Fargo, is the subadviser to the Fund and is entitled to receive a fee from Funds Management at an annual rate starting at 0.45% and declining to 0.30% as the average daily net assets of the Fund increase.
Administration fees
Under a class-level administration agreement, Funds Management provides class-level administrative services to the Fund, which includes paying fees and expenses for services provided by the transfer agent,sub-transfer agents, omnibus account servicers and record-keepers. As compensation for its services under the class-level administration agreement, Funds Management receives an annual fee of 0.08% which is calculated based on the average daily net assets of each class.
Waivers and/or expense reimbursements
Funds Management has contractually waived and/or reimbursed management and administration fees to the extent necessary to maintain certain net operating expense ratios for the Fund. When each class of the Fund has exceeded its expense cap, Funds Management has waived fees and/or reimbursed expenses from fund-level expenses on a proportionate basis and then from class specific expenses. When only certain classes exceed their expense caps, waivers and/or reimbursements are applied against class specific expenses before fund-level expenses. Funds Management has committed through April 30, 2020 to waive fees and/or reimburse expenses to the extent necessary to cap the Fund’s expenses at 0.75% for Class 1 shares and 1.00% for Class 2 shares. Prior to or after the commitment expiration date, the cap may be increased or the commitment to maintain the cap may be terminated only with the approval of the Board of Trustees.
Distribution fee
The Trust has adopted a distribution plan for Class 2 shares of the Fund pursuant to Rule12b-1 under the 1940 Act. A distribution fee is charged to Class 2 shares and paid to Wells Fargo Funds Distributor, LLC, the principal underwriter, at an annual rate of 0.25% of the average daily net assets of Class 2 shares.
Interfund transactions
The Fund may purchase or sell portfolio investment securities to certain other Wells Fargo affiliates pursuant to Rule17a-7 under the 1940 Act and under procedures adopted by the Board of Trustees. The procedures have been designed to ensure that these interfund transactions, which do not incur broker commissions, are effected at current market prices.
5. INVESTMENT PORTFOLIO TRANSACTIONS
Purchases and sales of investments, excluding U.S. government obligations (if any) and short-term securities, for the year ended December 31, 2019 were $44,960,066 and $65,325,100, respectively.
Wells Fargo VT Opportunity Fund | 23
Notes to financial statements
6. SECURITIES LENDING TRANSACTIONS
The Fund lends its securities through an unaffiliated securities lending agent and receives collateral in the form of cash or securities with a value at least equal to the value of the securities on loan. The value of the loaned securities is determined at the close of each business day and any increases or decreases in the required collateral are exchanged between the Fund and the counterparty on the next business day. Cash collateral received is invested in the Securities Lending Fund which seeks to provide a positive return compared to the daily Fed Funds Open Rate by investing in high-quality, U.S. dollar-denominated short-term money market instruments and is exempt from registration under Section 3(c)(7) of the 1940 Act. Securities Lending Fund is managed by Funds Management and is subadvised by WellsCap. Funds Management receives an advisory fee starting at 0.05% and declining to 0.01% as the average daily net assets of the Securities Lending Fund increase. All of the fees received by Funds Management are paid to WellsCap for its services as subadviser.
In the event of counterparty default or the failure of a borrower to return a loaned security, the Fund has the right to use the collateral to offset any losses incurred. As of December 31, 2019, the Fund did not have any securities on loan.
7. BANK BORROWINGS
The Trust, Wells Fargo Master Trust and Wells Fargo Funds Trust (excluding the money market funds) are parties to a $280,000,000 revolving credit agreement whereby the Fund is permitted to use bank borrowings for temporary or emergency purposes, such as to fund shareholder redemption requests. Interest under the credit agreement is charged to the Fund based on a borrowing rate equal to the higher of the Federal Funds rate in effect on that day plus 1.25% or the overnight LIBOR rate in effect on that day plus 1.25%. In addition, an annual commitment fee equal to 0.25% of the unused balance is allocated to each participating fund.
For the year ended December 31, 2019, there were no borrowings by the Fund under the agreement.
8. DISTRIBUTIONS TO SHAREHOLDERS
The tax character of distributions paid during the years ended December 31, 2019 and December 31, 2018 were as follows:
| | | | | | | | |
| | | Year endedDecember | |
| | |
| | | 2019 | | | 2018 | |
| | |
Ordinary income | | $ | 590,956 | | | $ | 2,336,878 | |
| | |
Long-term capital gain | | | 20,448,116 | | | | 16,008,959 | |
As of December 31, 2019, the components of distributable earnings on a tax basis were as follows:
| | | | |
Undistributed ordinary income | | Undistributed long-term gain | | Unrealized gains |
| | |
| $3,149,542 | | $10,865,879 | | $53,808,267 |
9. INDEMNIFICATION
Under the Trust’s organizational documents, the officers and Trustees have been granted certain indemnification rights against certain liabilities that may arise out of performance of their duties to the Trust. Additionally, in the normal course of business, the Trust may enter into contracts with service providers that contain a variety of indemnification clauses. The Trust’s maximum exposure under these arrangements is dependent on future claims that may be made against the Fund and, therefore, cannot be estimated.
10. NEW ACCOUNTING PRONOUNCEMENT
In August 2018, FASB issued Accounting Standards Update (“ASU”)No. 2018-13, Fair Value Measurement (Topic 820)Disclosure Framework—Changes to the Disclosure Requirements for Fair Value Measurement.ASU2018-13 updates the disclosure requirements for fair value measurements by modifying or removing certain disclosures and adding certain new disclosures. The amendments are effective for fiscal years, and interim periods within those fiscal years, beginning after December 15, 2019. Early adoption is permitted. Management has adopted the removal and modification of disclosures early, as permitted, and will adopt the additional new disclosures at the effective date.
24 | Wells Fargo VT Opportunity Fund
Report of independent registered public accounting firm
TO THE SHAREHOLDERS OF THE FUND AND BOARD OF TRUSTEES OF WELLS FARGO VARIABLE TRUST:
Opinion on the Financial Statements
We have audited the accompanying statement of assets and liabilities of Wells Fargo VT Opportunity Fund (the Fund), one of the funds constituting Wells Fargo Variable Trust, including the portfolio of investments, as of December 31, 2019, the related statement of operations for the year then ended, the statements of changes in net assets for each of the years in the two-year period then ended, and the related notes (collectively, the financial statements) and the financial highlights for each of the years in the five-year period then ended. In our opinion, the financial statements and financial highlights present fairly, in all material respects, the financial position of the Fund as of December 31, 2019, the results of its operations for the year then ended, the changes in its net assets for each of the years in the two-year period then ended, and the financial highlights for each of the years in the five-year period then ended, in conformity with U.S. generally accepted accounting principles.
Basis for Opinion
These financial statements and financial highlights are the responsibility of the Fund’s management. Our responsibility is to express an opinion on these financial statements and financial highlights based on our audits. We are a public accounting firm registered with the Public Company Accounting Oversight Board (United States) (PCAOB) and are required to be independent with respect to the Fund in accordance with the U.S. federal securities laws and the applicable rules and regulations of the Securities and Exchange Commission and the PCAOB.
We conducted our audits in accordance with the standards of the PCAOB. Those standards require that we plan and perform the audit to obtain reasonable assurance about whether the financial statements and financial highlights are free of material misstatement, whether due to error or fraud. Our audits included performing procedures to assess the risks of material misstatement of the financial statements and financial highlights, whether due to error or fraud, and performing procedures that respond to those risks. Such procedures included examining, on a test basis, evidence regarding the amounts and disclosures in the financial statements and financial highlights. Such procedures also included confirmation of securities owned as of December 31, 2019, by correspondence with the custodian and transfer agent. Our audits also included evaluating the accounting principles used and significant estimates made by management, as well as evaluating the overall presentation of the financial statements and financial highlights. We believe that our audits provide a reasonable basis for our opinion.

We have not been able to determine the specific year that we began serving as the auditor of one or more Wells Fargo Funds investment companies; however we are aware that we have served as the auditor of one or more Wells Fargo Funds investment companies since at least 1955.
Boston, Massachusetts
February 25, 2020
Wells Fargo VT Opportunity Fund | 25
Other information (unaudited)
TAX INFORMATION
For corporate shareholders, pursuant to Section 854 of the Internal Revenue Code, 99.99% of ordinary income dividends qualify for the corporate dividends-received deduction for the fiscal year ended December 31, 2019.
Pursuant to Section 852 of the Internal Revenue Code, $20,448,116 was designated as a 20% rate gain distribution for the fiscal year ended December 31, 2019.
PROXY VOTING INFORMATION
A description of the policies and procedures used to determine how to vote proxies relating to portfolio securities is available, upon request, by calling1-800-260-5969, visiting our website atwfam.com, or visiting the SEC website at sec.gov. Information regarding how the proxies related to portfolio securities were voted during the most recent12-month period ended June 30 is available on the website atwfam.comor by visiting the SEC website at sec.gov.
QUARTERLY PORTFOLIO HOLDINGS INFORMATION
The Fund files its complete schedule of portfolio holdings with the SEC for the first and third quarters of each fiscal year as an exhibit to its reports on FormN-PORT. Shareholders may view the filed FormN-PORT by visiting the SEC website at sec.gov.
26 | Wells Fargo VT Opportunity Fund
Other information (unaudited)
BOARD OF TRUSTEES AND OFFICERS
Each of the Trustees and Officers1 listed in the table below acts in identical capacities for each fund in the Wells Fargo family of funds, which consists of 149 mutual funds comprising the Wells Fargo Funds Trust, Wells Fargo Variable Trust, Wells Fargo Master Trust and fourclosed-end funds (collectively the “Fund Complex”). This table should be read in conjunction with the Prospectus and the Statement of Additional Information2. The mailing address of each Trustee and Officer is 525 Market Street, 12th Floor, San Francisco, CA 94105. Each Trustee and Officer serves an indefinite term, however, each Trustee serves such term until reaching the mandatory retirement age established by the Trustees.
Independent Trustees
| | | | | | |
Name and year of birth | | Position held and
length of service* | | Principal occupations during past five years or longer | | Current other
public company or
investment
company
directorships |
| | | |
| William R. Ebsworth (Born 1957) | | Trustee, since 2015 | | Retired. From 1984 to 2013, equities analyst, portfolio manager, research director and chief investment officer at Fidelity Management and Research Company in Boston, Tokyo, and Hong Kong, and retired in 2013 as Chief Investment Officer of Fidelity Strategic Advisers, Inc. where he led a team of investment professionals managing client assets. Prior thereto, Board member of Hong Kong Securities Clearing Co., Hong Kong Options Clearing Corp., the Thailand International Fund, Ltd., Fidelity Investments Life Insurance Company, and Empire Fidelity Investments Life Insurance Company. Audit Committee Chair and Investment Committee Chair of the Vincent Memorial Hospital Endowment(non-profit organization). Mr. Ebsworth is a CFA® charterholder. | | N/A |
| | | |
| Jane A. Freeman (Born 1953) | | Trustee, since 2015; Chair Liaison, since 2018 | | Retired. From 2012 to 2014 and 1999 to 2008, Chief Financial Officer of Scientific Learning Corporation. From 2008 to 2012, Ms. Freeman provided consulting services related to strategic business projects. Prior to 1999, Portfolio Manager at Rockefeller & Co. and Scudder, Stevens & Clark. Board member of the Harding Loevner Funds from 1996 to 2014, serving as both Lead Independent Director and chair of the Audit Committee. Board member of the Russell Exchange Traded Funds Trust from 2011 to 2012 and the chair of the Audit Committee. Ms. Freeman is a Board Member of The Ruth Bancroft Garden(non-profit organization). She is also an inactive Chartered Financial Analyst. | | N/A |
| | | |
| Isaiah Harris, Jr. (Born 1952) | | Trustee, since 2009; Audit Committee Chairman, since 2019 | | Retired. Chairman of the Board of CIGNA Corporation since 2009, and Director since 2005. From 2003 to 2011, Director of Deluxe Corporation. Prior thereto, President and CEO of BellSouth Advertising and Publishing Corp. from 2005 to 2007, President and CEO of BellSouth Enterprises from 2004 to 2005 and President of BellSouth Consumer Services from 2000 to 2003. Emeritus member of the Iowa State University Foundation Board of Governors. Emeritus Member of the Advisory Board of Iowa State University School of Business. Advisory Board Member, Palm Harbor Academy (private school). Advisory Board Member, Child Evangelism Fellowship(non-profit). Mr. Harris is a certified public accountant (inactive status). | | CIGNA Corporation |
| | | |
| Judith M. Johnson (Born 1949) | | Trustee, since 2008; Audit Committee Chairman, from 2009 to 2018 | | Retired. Prior thereto, Chief Executive Officer and Chief Investment Officer of Minneapolis Employees Retirement Fund from 1996 to 2008. Ms. Johnson is an attorney, certified public accountant and a certified managerial accountant. | | N/A |
Wells Fargo VT Opportunity Fund | 27
Other information (unaudited)
| | | | | | |
Name and year of birth | | Position held and
length of service* | | Principal occupations during past five years or longer | | Current other
public company or
investment
company
directorships |
| | | |
| David F. Larcker (Born 1950) | | Trustee, since 2009 | | James Irvin Miller Professor of Accounting at the Graduate School of Business, Stanford University, Director of the Corporate Governance Research Initiative and Senior Faculty of The Rock Center for Corporate Governance since 2006. From 2005 to 2008, Professor of Accounting at the Graduate School of Business, Stanford University. Prior thereto, Ernst & Young Professor of Accounting at The Wharton School, University of Pennsylvania from 1985 to 2005. | | N/A |
| | | |
| Olivia S. Mitchell (Born 1953) | | Trustee, since 2006; Nominating and Governance Committee Chair, since 2018 | | International Foundation of Employee Benefit Plans Professor, Wharton School of the University of Pennsylvania since 1993. Director of Wharton’s Pension Research Council and Boettner Center on Pensions & Retirement Research, and Research Associate at the National Bureau of Economic Research. Previously, Cornell University Professor from 1978 to 1993. | | N/A |
| | | |
| Timothy J. Penny (Born 1951) | | Trustee, since 1996; Chairman, since 2018 | | President and Chief Executive Officer of Southern Minnesota Initiative Foundation, anon-profit organization, since 2007. Member of the Board of Trustees of NorthStar Education Finance, Inc., anon-profit organization, since 2007. | | N/A |
| | | |
| James G. Polisson (Born 1959) | | Trustee, since 2018 | | Retired. Chief Marketing Officer, Source (ETF) UK Services, Ltd, from 2015 to 2017. From 2012 to 2015, Principal of The Polisson Group, LLC, a management consulting, corporate advisory and principal investing company. Chief Executive Officer and Managing Director at Russell Investments, Global Exchange Traded Funds from 2010 to 2012. Managing Director of Barclays Global Investors from 1998 to 2010 and Global Chief Marketing Officer for iShares and Barclays Global Investors from 2000 to 2010. Trustee of the San Francisco Mechanics’ Institute, anon-profit organization, from 2013 to 2015. Board member of the Russell Exchange Traded Fund Trust from 2011 to 2012. Director of Barclays Global Investors Holdings Deutschland GmbH from 2006 to 2009. Mr. Polisson is an attorney and has a retired status with the Massachusetts and District of Columbia Bar Associations. | | N/A |
| | | |
| Pamela Wheelock3 (Born 1959) | | Trustee, since January 2020; previously Trustee from January 2018 to July 2019 | | Board member of the Destination Medical Center Economic Development Agency, Rochester, Minnesota since 2019. Acting Commissioner, Minnesota Department of Human Services, July 2019 through September 2019. Human Services Manager (part-time), Minnesota Department of Human Services, October 2019 through December 2019. Chief Operating Officer, Twin Cities Habitat for Humanity from 2017 to 2019. Vice President of University Services, University of Minnesota from 2012 to 2016. Prior thereto, on the Board of Directors, Governance Committee and Finance Committee for the Minnesota Philanthropy Partners (Saint Paul Foundation) from 2012 to 2018, Interim Chief Executive Officer of Blue Cross Blue Shield of Minnesota from 2011 to 2012, Chairman of the Board from 2009 to 2012 and Board Director from 2003 to 2015. Vice President, Leadership and Community Engagement, Bush Foundation, Saint Paul, Minnesota (a private foundation) from 2009 to 2011. Executive Vice President and Chief Financial Officer, Minnesota Sports and Entertainment from 2004 to 2009 and Senior Vice President from 2002 to 2004. Executive Vice President of the Minnesota Wild Foundation from 2004 to 2008. Commissioner of Finance, State of Minnesota, from 1999 to 2002. Currently Board Chair of the Minnesota Wild Foundation since 2010. | | N/A |
| * | Length of service dates reflect the Trustee’s commencement of service with the Trust’s predecessor entities, where applicable. |
28 | Wells Fargo VT Opportunity Fund
Other information (unaudited)
Officers
| | | | |
Name and year of birth | | Position held and
length of service | | Principal occupations during past five years or longer |
| | |
| Andrew Owen (Born 1960) | | President, since 2017 | | Executive Vice President of Wells Fargo & Company and Head of Affiliated Managers, Wells Fargo Asset Management, since 2014. In addition, Mr. Owen is currently President, Chief Executive Officer and Director of Wells Fargo Funds Management, LLC since 2017. Prior thereto, Executive Vice President responsible for marketing, investments and product development for Wells Fargo Funds Management, LLC, from 2009 to 2014. |
| | |
| Jeremy DePalma1 (Born 1974) | | Treasurer, since 2012 | | Senior Vice President of Wells Fargo Funds Management, LLC since 2009. Senior Vice President of Evergreen Investment Management Company, LLC from 2008 to 2010 and head of the Fund Reporting and Control Team within Fund Administration from 2005 to 2010. |
| | |
| Michelle Rhee4 (Born 1966) | | Chief Legal Officer, since 2019 | | Secretary of Wells Fargo Funds Management, LLC, Chief Legal Counsel of Wells Fargo Asset Management and Assistant General Counsel of Wells Fargo Bank, N.A. since 2018. Associate General Counsel and Managing Director of Bank of America Corporation from 2004 to 2018. |
| | |
| Catherine Kennedy5 (Born 1969) | | Secretary, since 2019 | | Vice President of Wells Fargo Funds Management, LLC and Senior Counsel of the Wells Fargo Legal Department since 2010. Vice President and Senior Counsel of Evergreen Investment Management Company, LLC from 1998 to 2010. |
| | |
| Michael H. Whitaker(Born 1967) | | Chief Compliance Officer, since 2016 | | Chief Compliance Officer of Wells Fargo Asset Management since 2016. Senior Vice President and Chief Compliance Officer for Fidelity Investments from 2007 to 2016. |
| | |
| David Berardi (Born 1975) | | Assistant Treasurer, since 2009 | | Vice President of Wells Fargo Funds Management, LLC since 2009. Vice President of Evergreen Investment Management Company, LLC from 2008 to 2010. Manager of Fund Reporting and Control for Evergreen Investment Management Company, LLC from 2004 to 2010. |
| 1 | Jeremy DePalma acts as Treasurer of 85 funds and Assistant Treasurer of 64 funds in the Fund Complex. |
| 2 | The Statement of Additional Information includes additional information about the Trustees and is available, without charge, upon request, by calling1-800-260-5969 or by visiting the website atwfam.com. |
| 3 | Pamela Wheelock wasre-appointed to the Board effective January 1, 2020. |
| 4 | Michelle Rhee became Chief Legal Officer effective October 22, 2019. |
| 5 | Catherine Kennedy became Secretary effective October 22, 2019. |
Wells Fargo VT Opportunity Fund | 29
This page is intentionally left blank.
This page is intentionally left blank.
This page is intentionally left blank.

For more information
More information about Wells Fargo Funds is available free upon request. To obtain literature, please write, visit the Fund’s website, or call:
Wells Fargo Funds
P.O. Box 219967
Kansas City, MO 64121-9967
Website:wfam.com
Individual investors:1-800-222-8222
Retail investment professionals:1-888-877-9275
Institutional investment professionals:1-866-765-0778

This report and the financial statements contained herein are submitted for the general information of the shareholders of the Fund. If this report is used for promotional purposes, distribution of the report must be accompanied or preceded by a current prospectus. Before investing, please consider the investment objectives, risks, charges, and expenses of the investment. For a current prospectus and, if available, a summary prospectus, containing this information, call1-800-260-5969 or visit the Fund’s website atwfam.com. Read the prospectus carefully before you invest or send money.
Wells Fargo Asset Management (WFAM) is the trade name for certain investment advisory/management firms owned by Wells Fargo & Company. These firms include but are not limited to Wells Capital Management Incorporated and Wells Fargo Funds Management, LLC. Certain products managed by WFAM entities are distributed by Wells Fargo Funds Distributor, LLC (a broker-dealer and Member FINRA).
This material is for general informational and educational purposes only and is NOT intended to provide investment advice or a recommendation of any kind—including a recommendation for any specific investment, strategy, or plan.
INVESTMENT PRODUCTS: NOT FDIC INSURED ◾ NO BANK GUARANTEE ◾ MAY LOSE VALUE
© 2020 Wells Fargo & Company. All rights reserved.
PAR-0120-02379 02-20
AVT6/AR152 12-19
Annual Report
December 31, 2019
Wells Fargo
VT Small Cap Growth Fund
Beginning on January 1, 2021, as permitted by new regulations adopted by the Securities and Exchange Commission, paper copies of the Wells Fargo Funds’ annual and semi-annual shareholder reports issued after this date will no longer be sent by mail, unless you specifically request paper copies of the reports. Instead, the reports will be made available on the Funds’ website, and you will be notified by mail each time a report is posted and provided with a website address to access the report.
If you already elected to receive shareholder reports electronically, you will not be affected by this change and you need not take any action. You may elect to receive shareholder reports and other communications from the Fund electronically at any time by contacting your financial intermediary (such as a broker-dealer or bank) or, if you are a direct investor, by calling1-800-222-8222 or by enrolling at wellsfargo.com/advantagedelivery.
You may elect to receive all future reports in paper free of charge. If you invest through a financial intermediary, you can contact your financial intermediary to request that you continue to receive paper copies of your shareholder reports; if you invest directly with the Fund, you can call 1-800-222-8222. Your election to receive reports in paper will apply to all Wells Fargo Funds held in your account with your financial intermediary or, if you are a direct investor, to all Wells Fargo Funds that you hold.
|
|
|
Reduce clutter. Save trees. |
Sign up for electronic delivery of prospectuses and shareholder reports atwellsfargo.com/advantagedelivery |
The views expressed and any forward-looking statements are as of December 31, 2019, unless otherwise noted, and are those of the Fund managers and/or Wells Fargo Asset Management. Discussions of individual securities, or the markets generally, or any Wells Fargo Fund are not intended as individual recommendations. Future events or results may vary significantly from those expressed in any forward-looking statements. The views expressed are subject to change at any time in response to changing circumstances in the market. Wells Fargo Asset Management and the Fund disclaim any obligation to publicly update or revise any views expressed or forward-looking statements.
INVESTMENT PRODUCTS: NOT FDIC INSURED ◾ NO BANK GUARANTEE ◾ MAY LOSE VALUE
Wells Fargo VT Small Cap Growth Fund | 1
Letter to shareholders (unaudited)

Andrew Owen
President
Wells Fargo Funds
“Financial markets rebounded strongly to open 2019 on a positive note”
Dear Shareholder:
We are pleased to offer you this annual report for the Wells Fargo VT Small Cap Growth Fund for the12-month period that ended December 31, 2019. Despite some periods of market volatility, the year was strongly positive for financial markets as supportive central banks more than offset concerns over slowing global economic growth and international trade tensions.
Overall, both fixed-income and equity investors enjoyed healthy annual returns. For the period, U.S. stocks, based on the S&P 500 Index,1 gained 31.49% and international stocks, as measured by the MSCI ACWI ex USA Index (Net),2 returned 21.51%. The MSCI EM Index (Net)3 gained 18.42%. For bond investors, the Bloomberg Barclays U.S. Aggregate Bond Index4 added 8.72%, the Bloomberg Barclays Global Aggregateex-USD Index5 returned 5.09%, the Bloomberg Barclays Municipal Bond Index6 gained 7.54%, and the ICE BofA U.S. High Yield Index7 added 14.41%.
The year began with a strong market rebound.
After a volatile end of 2018 involving sharp losses, financial markets rebounded strongly to open 2019 on a positive note, as investors were encouraged by a sudden pivot by the U.S. Federal Reserve (Fed) to a more accommodative stance after a series of increases to the federal funds rate in 2017 and 2018. The S&P 500 Index gained 8.01% in January, the best monthly performance in 30 years. Returns for the MSCI ACWI ex USA Index (Net), the Bloomberg Barclays U.S. Aggregate Bond Index, and the Bloomberg Barclays Global Aggregateex-USD Index also were positive.
In February 2019, signs of slowing global growth grew more ominous. The Bureau of Economic Analysis announced fourth-quarter 2018 gross domestic product (GDP) grew at an annualized 2.2% rate, down from the levels of the prior two quarters. In a February report, the Bank of England forecast the slowest growth since the financial crisis for 2019. China and the U.S. continued to wrangle over trade issues. By the end of the first quarter of 2019, more accommodative Fed sentiment and steady, if not spectacular, U.S. economic and business metrics encouraged domestic investors.
Early second-quarter 2019 enthusiasm among investors faded.
During April, sustained low inflation, solid employment data, and first-quarter U.S. GDP of an annualized rate of 3.2% supported favorable sentiment. During May, markets
| 1 | The S&P 500 Index consists of 500 stocks chosen for market size, liquidity, and industry group representation. It is a market-value-weighted index with each stock’s weight in the index proportionate to its market value. You cannot invest directly in an index. |
| 2 | The Morgan Stanley Capital International (MSCI) All Country World Index (ACWI) ex USA Index (Net) is a free-float-adjusted market-capitalization-weighted index that is designed to measure the equity market performance of developed markets, excluding the United States. Source: MSCI. MSCI makes no express or implied warranties or representations and shall have no liability whatsoever with respect to any MSCI data contained herein. The MSCI data may not be further redistributed or used as a basis for other indices or any securities or financial products. This report is not approved, reviewed, or produced by MSCI. You cannot invest directly in an index. |
| 3 | The MSCI Emerging Markets (EM) Index (Net) is a free-float-adjusted market-capitalization-weighted index that is designed to measure equity market performance of emerging markets. You cannot invest directly in an index. |
| 4 | The Bloomberg Barclays U.S. Aggregate Bond Index is a broad-based benchmark that measures the investment-grade, U.S. dollar-denominated, fixed-rate taxable bond market, including Treasuries, government-related and corporate securities, mortgage-backed securities (agency fixed-rate and hybrid adjustable-rate mortgage pass-throughs), asset-backed securities, and commercial mortgage-backed securities. You cannot invest directly in an index. |
| 5 | The Bloomberg Barclays Global Aggregateex-USD Index is an unmanaged index that provides a broad-based measure of the global investment-grade fixed-income markets excluding the U.S. dollar-denominated debt market. You cannot invest directly in an index. |
| 6 | The Bloomberg Barclays Municipal Bond Index is an unmanaged index composed of long-termtax-exempt bonds with a minimum credit rating of Baa. You cannot invest directly in an index. |
| 7 | The ICE BofA U.S. High Yield Index is a market-capitalization-weighted index of domestic and Yankee high-yield bonds. The index tracks the performance of high-yield securities traded in the U.S. bond market. You cannot invest directly in an index. Copyright 2020. ICE Data Indices, LLC. All rights reserved. |
2 | Wells Fargo VT Small Cap Growth Fund
Letter to shareholders (unaudited)
tumbled on mixed investment signals. In the U.S., partisan wrangling ramped up as Democrats and Republicans set their sights on 2020 presidential politics. The U.K.’s Brexit disagreements caused Prime Minister Theresa May to resign. Boris Johnson succeeded her only to exacerbate uncertainty about Brexit’s resolution ahead of an October 2019 deadline. The European Commission downgraded the 2019 growth forecast to 1.2%. The U.S. increased tariffs on products from China, China responded, and then talks broke down. President Donald Trump threatened to turn his foreign policy tariff tool to Mexico over immigration issues.
Midway through the year, investors regrouped, sentiment turned positive, and U.S. equity markets advanced during June and July. The gains, primarily driven by geopolitical and monetary policy events, pushed equity markets to new highs. European Central Bank President Mario Draghi indicated the bank was ready to cut rates or buy more assets to prop up inflation if needed. President Trump backed off of tariff threats against Mexico and China. In the U.S., the Fed implemented a 0.25% federal funds rate cut in July.
Later in July, the U.S. reversed course and threatened to impose higher tariffs on China’s exports after talks failed. China responded with tariff threats of its own and devalued the renminbi, a move that roiled global markets. Major U.S. stock market indices closed July with the worst weekly results of the year. Bond prices gained as Treasury yields fell to multiyear lows, and the yield curve inverted at multiple points along the30-year arc.
In August, U.S.-China trade tensions continued with no signs of compromise. Evidence of a continued global economic slowdown mounted, and central banks in China, New Zealand, and Thailand cut interest rates. Industrial and manufacturing data declined in China, Canada, Japan, and Germany. Adding to global uncertainty, Italy’s prime minister resigned, many feared a crackdown in Hong Kong as protestors sustained their calls for reform, and Boris Johnson planned to suspend Parliament as Brexit’s deadline neared.
In the U.S., the Fed cut interest rates a second time in September. U.S. manufacturing data disappointed investors. The U.S. Congress announced it would pursue an impeachment investigation of President Trump. Meanwhile, the Brexit impasse showed no signs of resolution. Officials in China said that hitting the country’s economic growth goals for the year would be difficult considering the weight of tariffs and trade restrictions. Although the S&P 500 Index finished the third quarter with the bestyear-to-date returns in more than 20 years, concerns about future returns remained.
The fourth quarter started on a strong note, with U.S.-China trade tensions relaxing in October 2019 along with renewed optimism for a U.K. Brexit deal and positive macroeconomic data. The initial estimate of U.S. third-quarter GDP growth was a resilient 1.9% annualized rate, while the U.S. unemployment rate fell to a50-year low of 3.5% in September. However, despite resilience among U.S. consumers, business confidence declined while manufacturing activity contracted. Concerned with a potential economic slowdown, the Fed lowered interest rates another quarter point in late October, its third rate cut in four months. This helped push the S&P 500 Index to a newall-time high, while emerging market equities rallied and global bonds declined overall, reflecting a broad pickup in risk appetite.
Equity markets continued to rally in November despite ongoing geopolitical risks. Hopes for a U.S.-China trade deal buoyed investor confidence. U.S. business sentiment improved slightly, and manufacturing and services activity picked up. Throughout the month, central bank actions were on hold. With that positive backdrop, developed market equities outpaced those in emerging markets, and U.S. stocks, as reflected by the S&P 500 Index, outperformednon-U.S. stocks overall. While consumer confidence and purchasing manager activity rose in the eurozone, China reported weakening manufacturing and consumer data. Bond yields rose marginally, leading to slightly negative returns for global government and investment-grade corporate bonds.
“Equity markets continued to rally in November despite ongoing geopolitical risks.”
Wells Fargo VT Small Cap Growth Fund | 3
Letter to shareholders (unaudited)
Financial markets ended the year on a broadly positive note, with the U.S. and China reaching an accord on a Phase One trade deal, with some details to be worked out. That, along with the landslide win by thepro-Brexit U.K. Conservative Party in a national election and ongoing central bank support, gave investors greater certainty and confidence. U.S. economic indicators were generally positive, with the exception of manufacturing activity and business confidence. However, consumer confidence was resilient, fed by a robust labor market, tame inflation, and lower interest rates, which boosted housing affordability and stimulated homebuyer activity. The impeachment of U.S. President Donald Trump, while historically noteworthy, had little impact on markets. Meanwhile, slowing Chinese economic activity, partly attributable to the trade war, led to further government stimulus atyear-end through lower reserve ratios, allowing banks to lend more money.
Don’t let short-term uncertainty derail long-term investment goals.
Periods of investment uncertainty can present challenges, but experience has taught us that maintaining long-term investment goals can be an effective way to plan for the future. To help you create a sound strategy based on your personal goals and risk tolerance, Wells Fargo Funds offers more than 100 mutual funds spanning a wide range of asset classes and investment styles. Although diversification cannot guarantee an investment profit or prevent losses, we believe it can be an effective way to manage investment risk and potentially smooth out overall portfolio performance. We encourage investors to know their investments and to understand that appropriate levels of risk-taking may unlock opportunities.
Thank you for choosing to invest with Wells Fargo Funds. We appreciate your confidence in us and remain committed to helping you meet your financial needs.
Sincerely,

Andrew Owen
President
Wells Fargo Funds
|
|
|
For further information about your Fund, contact your investment professional, visit our website at wfam.com, or call us directly at1-800-260-5969. |
4 | Wells Fargo VT Small Cap Growth Fund
This page is intentionally left blank.
Performance highlights (unaudited)
Investment objective
The Fund seeks long-term capital appreciation.
Manager
Wells Fargo Funds Management, LLC
Subadviser
Wells Capital Management Incorporated
Portfolio managers
Joseph M. Eberhardy, CFA®‡, CPA
Thomas C. Ognar, CFA®‡
Average annual total returns (%) as of December 31, 2019
| | | | | | | | | | | | | | | | | | | | | | |
| | | | | |
| | | | | | | | | | | | | | Expense ratios1 (%) | |
| | | | | | |
| | | Inception date | | 1 year | | | 5 year | | | 10 year | | | Gross | | | Net2 | |
| | | | | | | |
| Class 13 | | 7-16-2010 | | | 25.31 | | | | 11.04 | | | | 12.61 | | | | 0.93 | | | | 0.93 | |
| | | | | | | |
| Class 2 | | 5-1-1995 | | | 24.83 | | | | 10.74 | | | | 12.35 | | | | 1.18 | | | | 1.18 | |
| | | | | | | |
| Russell 2000®Growth Index4 | | – | | | 28.48 | | | | 9.34 | | | | 13.01 | | | | – | | | | – | |
Figures quoted represent past performance, which is no guarantee of future results. Investment return and principal value of an investment will fluctuate so that an investor’s shares, when redeemed, may be worth more or less than their original cost. Current performance may be lower or higher than the performance data quoted and assumes the reinvestment of dividends and capital gains. Currentmonth-end performance is available by calling1-800-260-5969. Performance figures of the Fund do not reflect fees and expenses charged pursuant to the terms of variable life insurance policies and variable annuity contracts. If these fees and expenses had been reflected, performance would have been lower.
Please keep in mind that high double-digit returns were primarily achieved during favorable market conditions. You should not expect that such favorable returns can be consistently achieved. A fund’s performance, especially for short time periods, should not be the sole factor in making your investment decision.
Shares are sold without afront-end sales charge or contingent deferred sales charge.
Index returns do not include transaction costs associated with buying and selling securities, any mutual fund fees or expenses, or any taxes. It is not possible to invest directly in an index.
Stock values fluctuate in response to the activities of individual companies and general market and economic conditions. Smaller-company stocks tend to be more volatile and less liquid than those of larger companies. Consult the Fund’s prospectus for additional information on these and other risks.
Please refer to the prospectus provided by your participating insurance company for detailed information describing the separate accounts for information regarding surrender charges, mortality and expense risk fees, and other charges that may be assessed by the participating insurance companies.
Please see footnotes on page 7.
6 | Wells Fargo VT Small Cap Growth Fund
Performance highlights (unaudited)
|
|
| Growth of $10,000 investment as of December 31, 20195 |
|
|
| ‡ | CFA® and Chartered Financial Analyst® are trademarks owned by CFA Institute. |
| 1 | Reflects the expense ratios as stated in the most recent prospectuses, which include 0.01% in acquired fund fees. The expense ratios shown are subject to change and may differ from the annualized expense ratios shown in the financial highlights of this report, which do not include acquired fund fees and expenses. |
| 2 | The manager has contractually committed through April 30, 2020, to waive fees and/or reimburse expenses to the extent necessary to cap total annual fund operating expenses after fee waivers at 0.95% for Class 1 and 1.20% for Class 2. Brokerage commissions, stamp duty fees, interest, taxes, acquired fund fees and expenses (if any), and extraordinary expenses are excluded from the expense cap. Prior to or after the commitment expiration date, the cap may be increased or the commitment to maintain the cap may be terminated only with the approval of the Board of Trustees. Without this cap, the Fund’s returns would have been lower. The expense ratio paid by an investor is the net expense ratio (the total annual fund operating expenses after fee waivers) as stated in the prospectuses. |
| 3 | Historical performance shown for Class 1 shares prior to their inception reflects the performance of Class 2 shares, and includes the higher expenses applicable to Class 2 shares. If these expenses had not been included, returns for Class 1 shares would be higher. |
| 4 | The Russell 2000® Growth Index measures the performance of those Russell 2000 companies with higher price/book ratios and higher forecasted growth values. You cannot invest directly in an index. |
| 5 | The chart compares the performance of Class 2 shares for the most recent ten years with the Russell 2000® Growth Index. The chart assumes a hypothetical $10,000 investment and reflects all operating expenses of the Fund but does not reflect fees and expenses charged pursuant to the terms of variable life insurance policies and variable annuity contracts. |
| 6 | The S&P 500 Index consists of 500 stocks chosen for market size, liquidity, and industry group representation. It is a market-value-weighted index with each stock’s weight in the index proportionate to its market value. You cannot invest directly in an index. |
| 7 | The Russell 2000® Index measures the performance of the 2,000 smallest companies in the Russell 3000® Index, which represents approximately 8% of the total market capitalization of the Russell 3000® Index. You cannot invest directly in an index. |
| 8 | The ten largest holdings, excluding cash, cash equivalents and any money market funds, are calculated based on the value of the investments divided by total net assets of the Fund. Holdings are subject to change and may have changed since the date specified. |
| 9 | Amounts are calculated based on the total long-term investments of the Fund. These amounts are subject to change and may have changed since the date specified. |
| * | This security was no longer held at the end of the reporting period. |
Wells Fargo VT Small Cap Growth Fund | 7
Performance highlights (unaudited)
MANAGER’S DISCUSSION
Fund highlights
| ∎ | | The Fund underperformed its benchmark, the Russell 2000® Growth Index, for the12-month period that ended December 31, 2019. |
| ∎ | | Stocks within the health care sector served as the largest source of underperformance. |
| ∎ | | The financials, consumer discretionary, and information technology (IT) sectors contributed to relative performance. |
2019 was the best year for stocks in six years, with the S&P 500 Index6 and Russell 2000® Index7 generating total returns of 31.5% and 25.5%, respectively. Although the major indices rallied sharply during the year, investors climbed the wall of worry for much of the period, grappling with President Trump’s threats toward tariffs on Chinese goods, weakening manufacturing data, an inverted yield curve, and an increasing amount of negative-yielding sovereign debt. Other factors that led to marked bouts of volatility were attacks on Saudi oil facilities, problems in the overnight repurchase agreement market, and, to a lesser extent, the impeachment of President Trump. The Fund generated strong absolute returns from companies benefiting from constructive dynamics and secular growth catalysts, but it underperformed the benchmark, mainly due to weak returns from stocks within the health care sector.
| | | | |
|
| Ten largest holdings(%) as of December 31, 20198 | |
| | |
ASGN Incorporated | | | 3.96 | |
| | |
Kinsale Capital Group Incorporated | | | 3.50 | |
| | |
MasTec Incorporated | | | 3.10 | |
| | |
Casella Waste Systems Incorporated Class A | | | 3.06 | |
| | |
Rapid7 Incorporated | | | 2.81 | |
| | |
Envestnet Incorporated | | | 2.74 | |
| | |
Rexnord Corporation | | | 2.67 | |
| | |
Q2 Holdings Incorporated | | | 2.63 | |
| | |
Amedisys Incorporated | | | 2.55 | |
| | |
Five9 Incorporated | | | 2.45 | |
|
|
| Sector distribution as of December 31, 20199 |
|
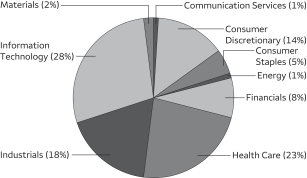 |
Stock selection within health care hindered the Fund’s relative performance.
Weakness in the health care sector came mainly from biotechnology and medical technology companies, which retraced largely due to stock-specific factors that hurt their share prices. The Fund’s large underweight to biotechnology was a headwind, as several stocks that we didn’t own showed positive data or were acquired by larger players. There are nearly 250 biotech stocks in the Russell 2000® Growth Index, and many of them are preclinical and binary in nature and, consequently, don’t meet our definition of sustainable growth. Another key detractor within biotech was Ligand Pharmaceuticals Incorporated*, which was pressured after announcing the sale of its largest royalty-generating asset. Elsewhere within health care, Merit Medical Systems, Incorporated, maker of more than 200 devices used in difficult medical procedures, fell sharply after it delivered disappointing results that fell short of expectations on revenue and earnings per share, citing slowness from its higher-margin products. We exited our position as we questioned Merit’s ability to increase its margin profile in the near term.
We opportunistically added and trimmed positions as the valuation gap changed during the period.
We remain overweight IT and maintain diversified exposure to software, electronic equipment instruments, semiconductors, and IT services. The structural advantages of the software industry continue to include benefits such as a predictable cost of ownership to customers, simplification, flexibility and scale, and quick and seamless implementation. Many of the companies we own generate high recurring revenues and do not have to deploy large amounts of capital expenditures in order to generate free cash flow. Despite our overweight to IT, we trimmed select positions whose valuation gap narrowed during the period. We remain cognizant of the risks within the consumer discretionary sector, which are mainly due to changing spending patterns and thee-commerce effect on manybrick-and-mortar retailers. However, we do find opportunities in companies whose business models are resistant toe-commerce competition. Within health care, many of our holdings are having a profound impact on patient outcomes and are playing a key role within the value-based health care landscape.
Please see footnotes on page 7.
8 | Wells Fargo VT Small Cap Growth Fund
Performance highlights (unaudited)
The Fund benefited from stock selection within the financials, consumer discretionary, and IT sectors.
Stocks within the financials sector were the best-performing area of the portfolio. Kinsale Capital Group, Incorporated, a provider of excess and surplus insurance, rallied sharply after reporting a strong increase in submissions and net premium earned metrics throughout the year. One of the company’s key advantages over its competitors is its lower cost structure, resulting from its proprietary IT system and lower commission payout to brokers. Within IT,software-as-a-service (SaaS) companies, including vulnerability management analytics solutions firm Rapid7, Incorporated, rose sharply after generating robust annualized recurring revenue metrics benefiting from increased company spending on security threats. Within consumer discretionary, the Fund benefited from its emphasis on companies with differentiated concepts and unique offerings. Share gains from companies including fitness operator Planet Fitness, Incorporated, and Boot Barn Holdings, Incorporated, as well as strong growth from auto dealership operator Lithia Motors, Incorporated, added to relative performance during the period.
We remain positive regarding the Fund’s growth prospects in the future.
The economic backdrop remains positive, with more modest but still expanding gross domestic product growth, an accommodative U.S. Federal Reserve, reasonable inflation, low unemployment, and a strong consumer. This is an environment that typically cultivates a scarcity of growth aspect in the market—a dynamic that has historically been favorable to our investing style. While our process is largelybottom-up, we continue to monitor fluctuations in the global economy and its potential implications on our portfolio. Market risks include ongoing trade tariffs with China and other geopolitical concerns, weakness in the manufacturing sector, and political noise typical of an election year. We strive to generate alpha (excess returns) from diverse sources and remain comfortable with our positioning and our focus on SaaS, cloud services, online retail, digital payments, the internet of things, and innovation. Given the current environment, we believe investors should be less reliant on stock valuations expanding generally and should consider proven active managers with adept stock selection to drive returns going forward.
Wells Fargo VT Small Cap Growth Fund | 9
Fund expenses (unaudited)
As a shareholder of the Fund, you incur ongoing costs, including management fees, distribution(12b-1) fees, and other Fund expenses. This example is intended to help you understand your ongoing costs (in dollars) of investing in the Fund and to compare these costs with the ongoing costs of investing in other mutual funds.
The example is based on an investment of $1,000 invested at the beginning of thesix-month period and held for the entire period from July 1, 2019 to December 31, 2019.
Actual expenses
The “Actual” line of the table below provides information about actual account values and actual expenses. You may use the information in this line, together with the amount you invested, to estimate the expenses that you paid over the period. Simply divide your account value by $1,000 (for example, an $8,600 account value divided by $1,000 = 8.6), then multiply the result by the number in the “Actual” line under the heading entitled “Expenses Paid During Period” for your applicable class of shares to estimate the expenses you paid on your account during this period.
Hypothetical example for comparison purposes
The “Hypothetical” line of the table below provides information about hypothetical account values and hypothetical expenses based on the Fund’s actual expense ratio and an assumed rate of return of 5% per year before expenses, which is not the Fund’s actual return. The hypothetical account values and expenses may not be used to estimate the actual ending account balance or expenses you paid for the period. You may use this information to compare the ongoing costs of investing in the Fund and other funds. To do so, compare this 5% hypothetical example with the 5% hypothetical examples that appear in the shareholder reports of the other funds.
Please note that the expenses shown in the table are meant to highlight your ongoing costs only and do not reflect any separate account charges assessed by participating insurance companies. Therefore, the “Hypothetical” line of the table is useful in comparing ongoing costs only, and will not help you determine the relative total costs of owning different funds. In addition, if these separate account charges assessed by participating insurance companies were included, your costs would have been higher.
| | | | | | | | | | | | | | | | |
| | | Beginning
account value
7-1-2019 | | | Ending
account value
12-31-2019 | | | Expenses
paid during
the period¹ | | | Annualized net
expense ratio | |
| | | | | |
Class 1 | | | | | | | | | | | | | | | | |
| | | | |
Actual | | $ | 1,000.00 | | | $ | 1,013.83 | | | $ | 4.70 | | | | 0.93 | % |
| | | | |
Hypothetical (5% return before expenses) | | $ | 1,000.00 | | | $ | 1,020.54 | | | $ | 4.72 | | | | 0.93 | % |
| | | | | |
Class 2 | | | | | | | | | | | | | | | | |
| | | | |
Actual | | $ | 1,000.00 | | | $ | 1,011.34 | | | $ | 5.96 | | | | 1.18 | % |
| | | | |
Hypothetical (5% return before expenses) | | $ | 1,000.00 | | | $ | 1,019.28 | | | $ | 5.98 | | | | 1.18 | % |
| 1 | Expenses paid is equal to the annualized net expense ratio of each class multiplied by the average account value over the period, multiplied by the number of days in the most recent fiscal half-year divided by the number of days in the fiscal year (to reflect theone-half year period). |
10 | Wells Fargo VT Small Cap Growth Fund
Portfolio of investments—December 31, 2019
| | | | | | | | | | | | | | | | |
| | | | | | | | | Shares | | | Value | |
| Common Stocks: 98.88% | |
|
Communication Services: 0.63% | |
|
| Media: 0.63% | |
Nexstar Media Group Incorporated Class A | | | | | | | | | | | 15,800 | | | $ | 1,852,550 | |
| | | | | | | | | | | | | | | | |
|
Consumer Discretionary: 13.89% | |
|
| Auto Components: 1.05% | |
Fox Factory Holding Corporation † | | | | | | | | | | | 44,400 | | | | 3,088,908 | |
| | | | | | | | | | | | | | | | |
|
| Diversified Consumer Services: 1.18% | |
Chegg Incorporated † | | | | | | | | | | | 71,686 | | | | 2,717,616 | |
Grand Canyon Education Incorporated † | | | | | | | | | | | 7,620 | | | | 729,920 | |
| | | | |
| | | | | | | | | | | | | | | 3,447,536 | |
| | | | | | | | | | | | | | | | |
|
| Hotels, Restaurants & Leisure: 4.56% | |
Eldorado Resorts Incorporated † | | | | | | | | | | | 63,800 | | | | 3,805,032 | |
Lindblad Expeditions Holding † | | | | | | | | | | | 146,800 | | | | 2,400,180 | |
Planet Fitness Incorporated Class A † | | | | | | | | | | | 27,820 | | | | 2,077,598 | |
Wingstop Incorporated | | | | | | | | | | | 58,689 | | | | 5,060,752 | |
| | | | |
| | | | | | | | | | | | | | | 13,343,562 | |
| | | | | | | | | | | | | | | | |
|
| Internet & Direct Marketing Retail: 0.42% | |
Fiverr International Limited †« | | | | | | | | | | | 52,800 | | | | 1,240,800 | |
| | | | | | | | | | | | | | | | |
|
| Leisure Products: 1.15% | |
Yeti Holdings Incorporated †« | | | | | | | | | | | 96,416 | | | | 3,353,348 | |
| | | | | | | | | | | | | | | | |
|
| Multiline Retail: 0.53% | |
Ollie’s Bargain Outlet Holdings Incorporated † | | | | | | | | | | | 23,610 | | | | 1,541,969 | |
| | | | | | | | | | | | | | | | |
|
| Specialty Retail: 4.18% | |
America’sCar-Mart Incorporated † | | | | | | | | | | | 13,700 | | | | 1,502,342 | |
Boot Barn Holdings Incorporated † | | | | | | | | | | | 109,600 | | | | 4,880,488 | |
Five Below Incorporated † | | | | | | | | | | | 11,908 | | | | 1,522,557 | |
Lithia Motors Incorporated Class A | | | | | | | | | | | 29,430 | | | | 4,326,210 | |
| | | | |
| | | | | | | | | | | | | | | 12,231,597 | |
| | | | | | | | | | | | | | | | |
|
| Textiles, Apparel & Luxury Goods: 0.82% | |
Deckers Outdoor Corporation † | | | | | | | | | | | 14,200 | | | | 2,397,812 | |
| | | | | | | | | | | | | | | | |
|
Consumer Staples: 5.25% | |
|
| Beverages: 0.94% | |
Boston Beer Company Incorporated Class A † | | | | | | | | | | | 7,300 | | | | 2,758,305 | |
| | | | | | | | | | | | | | | | |
|
| Food & Staples Retailing: 1.71% | |
Grocery Outlet Holding Corporation † | | | | | | | | | | | 46,335 | | | | 1,503,571 | |
The Chef’s Warehouse Incorporated † | | | | | | | | | | | 91,500 | | | | 3,487,065 | |
| | | | |
| | | | | | | | | | | | | | | 4,990,636 | |
| | | | | | | | | | | | | | | | |
|
| Food Products: 1.68% | |
Freshpet Incorporated † | | | | | | | | | | | 82,901 | | | | 4,898,620 | |
| | | | | | | | | | | | | | | | |
|
| Personal Products: 0.92% | |
Inter Parfums Incorporated | | | | | | | | | | | 37,100 | | | | 2,697,541 | |
| | | | | | | | | | | | | | | | |
The accompanying notes are an integral part of these financial statements.
Wells Fargo VT Small Cap Growth Fund | 11
Portfolio of investments—December 31, 2019
| | | | | | | | | | | | | | | | |
| | | | | | | | | Shares | | | Value | |
| Energy: 0.35% | |
|
| Energy Equipment & Services: 0.35% | |
Cactus Incorporated Class A | | | | | | | | | | | 29,887 | | | $ | 1,025,722 | |
| | | | | | | | | | | | | | | | |
|
Financials: 8.05% | |
|
| Capital Markets: 1.43% | |
Assetmark Financial Holdings † | | | | | | | | | | | 51,015 | | | | 1,480,455 | |
Stifel Financial Corporation | | | | | | | | | | | 44,700 | | | | 2,711,055 | |
| | | | |
| | | | | | | | | | | | | | | 4,191,510 | |
| | | | | | | | | | | | | | | | |
|
| Insurance: 4.92% | |
eHealth Incorporated † | | | | | | | | | | | 21,200 | | | | 2,036,896 | |
Goosehead Insurance Incorporated Class A | | | | | | | | | | | 22,807 | | | | 967,017 | |
Kinsale Capital Group Incorporated | | | | | | | | | | | 100,624 | | | | 10,229,436 | |
Trupanion Incorporated †« | | | | | | | | | | | 30,700 | | | | 1,150,022 | |
| | | | |
| | | | | | | | | | | | | | | 14,383,371 | |
| | | | | | | | | | | | | | | | |
|
| Thrifts & Mortgage Finance: 1.70% | |
LendingTree Incorporated †« | | | | | | | | | | | 16,428 | | | | 4,984,912 | |
| | | | | | | | | | | | | | | | |
|
Health Care: 22.97% | |
|
| Biotechnology: 3.36% | |
CareDx Incorporated † | | | | | | | | | | | 40,544 | | | | 874,534 | |
Castle Biosciences Incorporated † | | | | | | | | | | | 500 | | | | 17,185 | |
Fate Therapeutics Incorporated † | | | | | | | | | | | 86,200 | | | | 1,686,934 | |
Halozyme Therapeutics Incorporated † | | | | | | | | | | | 80,300 | | | | 1,423,719 | |
Invitae Corporation † | | | | | | | | | | | 103,900 | | | | 1,675,907 | |
Natera Incorporated † | | | | | | | | | | | 57,001 | | | | 1,920,364 | |
Vericel Corporation † | | | | | | | | | | | 127,800 | | | | 2,223,720 | |
| | | | |
| | | | | | | | | | | | | | | 9,822,363 | |
| | | | | | | | | | | | | | | | |
|
Health Care Equipment & Supplies: 7.32% | |
Glaukos Corporation † | | | | | | | | | | | 60,040 | | | | 3,270,379 | |
iRhythm Technologies Incorporated † | | | | | | | | | | | 59,226 | | | | 4,032,698 | |
Orthopediatrics Corporation † | | | | | | | | | | | 52,811 | | | | 2,481,589 | |
Shockwave Medical Incorporated †« | | | | | | | | | | | 55,449 | | | | 2,435,320 | |
SI-BONE Incorporated † | | | | | | | | | | | 96,894 | | | | 2,083,221 | |
Silk Road Medical Incorporated † | | | | | | | | | | | 24,440 | | | | 986,887 | |
Tactile Systems Technology Class I † | | | | | | | | | | | 48,157 | | | | 3,251,079 | |
Tandem Diabetes Care Incorporated † | | | | | | | | | | | 30,000 | | | | 1,788,300 | |
Vapotherm Incorporated † | | | | | | | | | | | 89,191 | | | | 1,084,563 | |
| | | | |
| | | | | | | | | | | | | | | 21,414,036 | |
| | | | | | | | | | | | | | | | |
|
| Health Care Providers & Services: 2.95% | |
Amedisys Incorporated † | | | | | | | | | | | 44,700 | | | | 7,461,324 | |
HealthEquity Incorporated † | | | | | | | | | | | 15,925 | | | | 1,179,565 | |
| | | | |
| | | | | | | | | | | | | | | 8,640,889 | |
| | | | | | | | | | | | | | | | |
|
| Health Care Technology: 2.64% | |
Health Catalyst Incorporated †« | | | | | | | | | | | 35,567 | | | | 1,234,175 | |
Phreesia Incorporated † | | | | | | | | | | | 82,861 | | | | 2,207,417 | |
Teladoc Incorporated †« | | | | | | | | | | | 51,146 | | | | 4,281,943 | |
| | | | |
| | | | | | | | | | | | | | | 7,723,535 | |
| | | | | | | | | | | | | | | | |
The accompanying notes are an integral part of these financial statements.
12 | Wells Fargo VT Small Cap Growth Fund
Portfolio of investments—December 31, 2019
| | | | | | | | | | | | | | | | |
| | | | | | | | | Shares | | | Value | |
| Life Sciences Tools & Services: 6.03% | |
Adaptive Biotechnologies Corporation †« | | | | | | | | | | | 24,049 | | | $ | 719,546 | |
Codexis Incorporated † | | | | | | | | | | | 404,827 | | | | 6,473,184 | |
Neogenomics Incorporated † | | | | | | | | | | | 114,582 | | | | 3,351,524 | |
Repligen Corporation † | | | | | | | | | | | 76,600 | | | | 7,085,500 | |
| | | | |
| | | | | | | | | | | | | | | 17,629,754 | |
| | | | | | | | | | | | | | | | |
|
| Pharmaceuticals: 0.67% | |
MyoKardia Incorporated † | | | | | | | | | | | 27,000 | | | | 1,967,895 | |
| | | | | | | | | | | | | | | | |
|
Industrials: 18.57% | |
|
| Aerospace & Defense: 3.11% | |
Kratos Defense & Security Solutions Incorporated † | | | | | | | | | | | 152,300 | | | | 2,742,923 | |
Mercury Computer Systems Incorporated † | | | | | | | | | | | 92,168 | | | | 6,369,730 | |
| | | | |
| | | | | | | | | | | | | | | 9,112,653 | |
| | | | | | | | | | | | | | | | |
|
| Airlines: 1.24% | |
SkyWest Incorporated | | | | | | | | | | | 56,140 | | | | 3,628,328 | |
| | | | | | | | | | | | | | | | |
|
| Commercial Services & Supplies: 3.06% | |
Casella Waste Systems Incorporated Class A † | | | | | | | | | | | 194,500 | | | | 8,952,835 | |
| | | | | | | | | | | | | | | | |
|
| Construction & Engineering: 3.10% | |
MasTec Incorporated † | | | | | | | | | | | 141,300 | | | | 9,065,808 | |
| | | | | | | | | | | | | | | | |
|
| Machinery: 2.67% | |
Rexnord Corporation † | | | | | | | | | | | 239,220 | | | | 7,803,356 | |
| | | | | | | | | | | | | | | | |
|
| Professional Services: 3.96% | |
ASGN Incorporated † | | | | | | | | | | | 163,181 | | | | 11,580,956 | |
| | | | | | | | | | | | | | | | |
|
| Road & Rail: 0.55% | |
Saia Incorporated † | | | | | | | | | | | 17,300 | | | | 1,610,976 | |
| | | | | | | | | | | | | | | | |
|
| Trading Companies & Distributors: 0.88% | |
SiteOne Landscape Supply Incorporated † | | | | | | | | | | | 28,400 | | | | 2,574,460 | |
| | | | | | | | | | | | | | | | |
|
Information Technology: 27.65% | |
|
| Electronic Equipment, Instruments & Components: 2.08% | |
Novanta Incorporated † | | | | | | | | | | | 68,900 | | | | 6,093,516 | |
| | | | | | | | | | | | | | | | |
|
| IT Services: 2.71% | |
Endava plc Sponsored ADR † | | | | | | | | | | | 67,094 | | | | 3,126,580 | |
EVO Payments Incorporated Class A † | | | | | | | | | | | 89,291 | | | | 2,358,175 | |
InterXion Holding NV † | | | | | | | | | | | 14,190 | | | | 1,189,264 | |
LiveRamp Holdings Incorporated † | | | | | | | | | | | 26,400 | | | | 1,269,048 | |
| | | | |
| | | | | | | | | | | | | | | 7,943,067 | |
| | | | | | | | | | | | | | | | |
|
| Semiconductors & Semiconductor Equipment: 3.21% | |
Diodes Incorporated † | | | | | | | | | | | 68,430 | | | | 3,857,399 | |
Semtech Corporation † | | | | | | | | | | | 71,300 | | | | 3,771,770 | |
Silicon Laboratories Incorporated † | | | | | | | | | | | 15,200 | | | | 1,762,896 | |
| | | | |
| | | | | | | | | | | | | | | 9,392,065 | |
| | | | | | | | | | | | | | | | |
|
| Software: 19.65% | |
Altair Engineering Incorporated Class A † | | | | | | | | | | | 15,162 | | | | 544,467 | |
Anaplan Incorporated † | | | | 10,998 | | | | 576,295 | |
The accompanying notes are an integral part of these financial statements.
Wells Fargo VT Small Cap Growth Fund | 13
Portfolio of investments—December 31, 2019
| | | | | | | | | | | | | | | | |
| | | | | | | | | Shares | | | Value | |
| Software (continued) | | | | | | | | | | | | |
Bill.com Holdings Incorporated † | | | | | | | | | | | 4,768 | | | $ | 181,422 | |
BlackLine Incorporated † | | | | | | | | | | | 51,353 | | | | 2,647,761 | |
Envestnet Incorporated † | | | | | | | | | | | 115,311 | | | | 8,029,105 | |
Everbridge Incorporated † | | | | | | | | | | | 36,900 | | | | 2,881,152 | |
Five9 Incorporated † | | | | | | | | | | | 109,513 | | | | 7,181,863 | |
Globant SA † | | | | | | | | | | | 27,800 | | | | 2,948,190 | |
Mimecast Limited † | | | | | | | | | | | 60,000 | | | | 2,602,800 | |
New Relic Incorporated † | | | | | | | | | | | 29,500 | | | | 1,938,445 | |
PROS Holdings Incorporated † | | | | | | | | | | | 30,600 | | | | 1,833,552 | |
Q2 Holdings Incorporated † | | | | | | | | | | | 94,776 | | | | 7,684,438 | |
Rapid7 Incorporated † | | | | | | | | | | | 146,578 | | | | 8,211,300 | |
Sprout Social Incorporated Class A †« | | | | | | | | | | | 55,239 | | | | 886,586 | |
SPS Commerce Incorporated † | | | | | | | | | | | 78,864 | | | | 4,370,643 | |
Talend SA ADR † | | | | | | | | | | | 126,839 | | | | 4,960,673 | |
| | | | |
| | | | | | | | | | | | | | | 57,478,692 | |
| | | | | | | | | | | | | | | | |
| | | | |
Materials: 1.52% | | | | | | | | | | | | | | | | |
| | | | |
| Chemicals: 1.23% | | | | | | | | | | | | |
Ingevity Corporation † | | | | | | | | | | | 11,300 | | | | 987,394 | |
PQ Group Holdings Incorporated † | | | | | | | | | | | 152,680 | | | | 2,623,042 | |
| | | | |
| | | | | | | | | | | | | | | 3,610,436 | |
| | | | | | | | | | | | | | | | |
| | | | |
| Metals & Mining: 0.29% | | | | | | | | | | | | |
Mayville Engineering Company Incorporated † | | | | | | | | | | | 90,315 | | | | 847,155 | |
| | | | | | | | | | | | | | | | |
| | | | |
Total Common Stocks (Cost $221,634,094) | | | | | | | | | | | | | | | 289,321,474 | |
| | | | | | | | | | | | | | | | |
| | | | |
| | | | | | | | | | | | | | | | |
| | | Yield | | | | | | | | | | |
| Short-Term Investments: 6.97% | | | | | | | | | | | | | | | | |
| | | | |
| Investment Companies: 6.97% | | | | | | | | | | | | |
Securities Lending Cash Investments LLC (l)(r)(u) | | | 1.73 | % | | | | | | | 17,152,504 | | | | 17,154,220 | |
Wells Fargo Government Money Market Fund Select Class (l)(u) | | | 1.55 | | | | | | | | 3,229,069 | | | | 3,229,069 | |
| | | | |
Total Short-Term Investments (Cost $20,382,432) | | | | | | | | | | | | | | | 20,383,289 | |
| | | | | | | | | | | | | | | | |
| | | | | | | | |
| Total investments in securities (Cost $242,016,526) | | | 105.85 | % | | | 309,704,763 | |
| | |
Other assets and liabilities, net | | | (5.85 | ) | | | (17,122,332 | ) |
| | | | | | | | |
| Total net assets | | | 100.00 | % | | $ | 292,582,431 | |
| | | | | | | | |
| † | Non-income-earning security |
| « | All or a portion of this security is on loan. |
| (l) | The issuer of the security is an affiliated person of the Fund as defined in the Investment Company Act of 1940. |
| (r) | The investment is anon-registered investment company purchased with cash collateral received from securities on loan. |
| (u) | The rate represents the7-day annualized yield at period end. |
Abbreviations:
| ADR | American depositary receipt |
The accompanying notes are an integral part of these financial statements.
14 | Wells Fargo VT Small Cap Growth Fund
Portfolio of investments—December 31, 2019
Investments in Affiliates
An affiliated investment is an investment in which the Fund owns at least 5% of the outstanding voting shares of the issuer or as a result of other relationships, such as the Fund and the issuer having the same investment manager. Transactions with issuers that were either affiliated persons of the Fund at the beginning of the period or the end of the period were as follows:
| | | | | | | | | | | | | | | | | | | | | | | | | | | | | | | | | | | | |
| | | Shares,
beginning of
period | | | Shares
purchased | | | Shares sold | | | Shares,
end of
period | | | Net
realized
gains
(losses) | | | Net
change in
unrealized
gains
(losses) | | | Income
from
affiliated
securities | | | Value, end of
period | | | % of
net
assets | |
| | | | | | | | | |
| Short-Term Investments | | | | | | | �� | | | | | | | | | | | | | | | | | | | | |
Investment Companies | | | | | | | | | | | | | | | | | | | | | | | | | | | | | | | | | | | | |
Securities Lending Cash Investments LLC | | | 18,426,160 | | | | 163,927,047 | | | | (165,200,703 | ) | | | 17,152,504 | | | $ | 1,673 | | | $ | 0 | | | $ | 456,779 | # | | $ | 17,154,220 | | | | | |
Wells Fargo Government Money Market Fund Select Class | | | 2,136,828 | | | | 95,980,032 | | | | (94,887,791 | ) | | | 3,229,069 | | | | 0 | | | | 0 | | | | 77,140 | | | | 3,229,069 | | | | | |
| | | | | | | | | | | | | | | | | | | | | | | | | | | | | | | | | | | | |
| | | | | | | | | | | | | | | | | | $ | 1,673 | | | $ | 0 | | | $ | 533,919 | | | $ | 20,383,289 | | | | 6.97 | % |
| | | | | | | | | | | | | | | | | | | | | | | | | | | | | | | | | | | | |
| # | Amount shown represents income before fees and rebates. |
The accompanying notes are an integral part of these financial statements.
Wells Fargo VT Small Cap Growth Fund | 15
Statement of assets and liabilities—December 31, 2019
| | | | |
| | | | |
| |
Assets | | | | |
Investments in unaffiliated securities (including $16,840,835 of securities loaned), at value (cost $221,634,094) | | $ | 289,321,474 | |
Investments in affiliated securities, at value (cost $20,382,432) | | | 20,383,289 | |
Cash | | | 823,585 | |
Receivable for investments sold | | | 603,925 | |
Receivable for Fund shares sold | | | 3,344 | |
Receivable for dividends | | | 24,059 | |
Receivable for securities lending income, net | | | 9,827 | |
Prepaid expenses and other assets | | | 16,758 | |
| | | | |
Total assets | | | 311,186,261 | |
| | | | |
| |
Liabilities | | | | |
Payable upon receipt of securities loaned | | | 17,141,954 | |
Payable for investments purchased | | | 961,055 | |
Payable for Fund shares redeemed | | | 204,585 | |
Management fee payable | | | 203,873 | |
Administration fees payable | | | 20,388 | |
Distribution fee payable | | | 58,460 | |
Trustees’ fees and expenses payable | | | 5,688 | |
Accrued expenses and other liabilities | | | 7,827 | |
| | | | |
Total liabilities | | | 18,603,830 | |
| | | | |
Total net assets | | $ | 292,582,431 | |
| | | | |
| |
Net assets consist of | | | | |
Paid-in capital | | $ | 207,138,228 | |
Total distributable earnings | | | 85,444,203 | |
| | | | |
Total net assets | | $ | 292,582,431 | |
| | | | |
| |
Computation of net asset value per share | | | | |
Net assets – Class 1 | | $ | 22,925,379 | |
Shares outstanding – Class 11 | | | 2,228,548 | |
Net asset value per share – Class 1 | | | $10.29 | |
Net assets – Class 2 | | $ | 269,657,052 | |
Shares outstanding – Class 21 | | | 27,202,636 | |
Net asset value per share – Class 2 | | | $9.91 | |
| 1 | The Fund has an unlimited number of authorized shares. |
The accompanying notes are an integral part of these financial statements.
16 | Wells Fargo VT Small Cap Growth Fund
Statement of operations—year ended December 31, 2019
| | | | |
| | | | |
| |
Investment income | | | | |
Securities lending income from affiliates, net | | $ | 299,081 | |
Dividends | | | 297,368 | |
Income from affiliated securities | | | 77,140 | |
| | | | |
Total investment income | | | 673,589 | |
| | | | |
| |
Expenses | | | | |
Management fee | | | 2,341,437 | |
Administration fees | | | | |
Class 1 | | | 18,544 | |
Class 2 | | | 215,599 | |
Distribution fee | | | | |
Class 2 | | | 672,456 | |
Custody and accounting fees | | | 13,556 | |
Professional fees | | | 44,421 | |
Shareholder report expenses | | | 40,000 | |
Trustees’ fees and expenses | | | 21,652 | |
Other fees and expenses | | | 14,524 | |
| | | | |
Total expenses | | | 3,382,189 | |
Less: Fee waivers and/or expense reimbursements | | | | |
Class 1 | | | (7 | ) |
| | | | |
Net expenses | | | 3,382,182 | |
| | | | |
Net investment loss | | | (2,708,593 | ) |
| | | | |
| |
Realized and unrealized gains (losses) on investments | | | | |
Net realized gains on | | | | |
Unaffiliated securities | | | 18,187,306 | |
Affiliated securities | | | 1,673 | |
| | | | |
Net realized gains on investments | | | 18,188,979 | |
Net change in unrealized gains (losses) on investments | | | 48,624,852 | |
| | | | |
Net realized and unrealized gains (losses) on investments | | | 66,813,831 | |
| | | | |
Net increase in net assets resulting from operations | | $ | 64,105,238 | |
| | | | |
The accompanying notes are an integral part of these financial statements.
Wells Fargo VT Small Cap Growth Fund | 17
Statement of changes in net assets
| | | | | | | | | | | | | | | | |
| | | Year ended
December 31, 2019 | | | Year ended
December 31, 2018 | |
| | | |
Operations | | | | | | | | | | | | |
Net investment loss | | | | | | $ | (2,708,593 | ) | | | | | | $ | (2,463,017 | ) |
Net realized gains on investments | | | | | | | 18,188,979 | | | | | | | | 50,054,833 | |
Net change in unrealized gains (losses) on investments | | | | | | | 48,624,852 | | | | | | | | (45,714,046 | ) |
| | | | |
Net increase in net assets resulting from operations | | | | | | | 64,105,238 | | | | | | | | 1,877,770 | |
| | | | |
| | | |
Distributions to shareholders from net investment income and net realized gains | | | | | | | | | | | | |
Class 1 | | | | | | | (3,689,450 | ) | | | | | | | (2,299,577 | ) |
Class 2 | | | | | | | (44,225,338 | ) | | | | | | | (26,787,868 | ) |
| | | | |
Total distributions to shareholders | | | | | | | (47,914,788 | ) | | | | | | | (29,087,445 | ) |
| | | | |
| | | | |
Capital share transactions | | | Shares | | | | | | | | Shares | | | | | |
Proceeds from shares sold | | | | | | | | | | | | | | | | |
Class 1 | | | 343,664 | | | | 3,528,410 | | | | 364,681 | | | | 4,303,429 | |
Class 2 | | | 1,600,764 | | | | 15,682,418 | | | | 5,175,836 | | | | 58,869,242 | |
| | | | |
| | | | | | | 19,210,828 | | | | | | | | 63,172,671 | |
| | | | |
Reinvestment of distributions | | | | | | | | | | | | | | | | |
Class 1 | | | 358,896 | | | | 3,689,450 | | | | 196,882 | | | | 2,299,577 | |
Class 2 | | | 4,458,199 | | | | 44,225,338 | | | | 2,358,087 | | | | 26,787,868 | |
| | | | |
| | | | | | | 47,914,788 | | | | | | | | 29,087,445 | |
| | | | |
Payment for shares redeemed | | | | | | | | | | | | | | | | |
Class 1 | | | (523,347 | ) | | | (5,516,594 | ) | | | (678,205 | ) | | | (7,559,025 | ) |
Class 2 | | | (4,754,197 | ) | | | (48,055,795 | ) | | | (5,058,038 | ) | | | (55,703,260 | ) |
| | | | |
| | | | | | | (53,572,389 | ) | | | | | | | (63,262,285 | ) |
| | | | |
Net increase in net assets resulting from capital share transactions | | | | | | | 13,553,227 | | | | | | | | 28,997,831 | |
| | | | |
Total increase in net assets | | | | | | | 29,743,677 | | | | | | | | 1,788,156 | |
| | | | |
| | |
Net assets | | | | | | | | |
Beginning of period | | | | | | | 262,838,754 | | | | | | | | 261,050,598 | |
| | | | |
End of period | | | | | | $ | 292,582,431 | | | | | | | $ | 262,838,754 | |
| | | | |
The accompanying notes are an integral part of these financial statements.
18 | Wells Fargo VT Small Cap Growth Fund
Financial highlights
(For a share outstanding throughout each period)
| | | | | | | | | | | | | | | | | | | | |
| | | Year ended December 31 | |
| CLASS 1 | | 2019 | | | 2018 | | | 2017 | | | 2016 | | | 2015 | |
Net asset value, beginning of period | | | $9.66 | | | | $10.43 | | | | $8.51 | | | | $8.70 | | | | $10.08 | |
Net investment loss | | | (0.07 | )1 | | | (0.05 | ) | | | (0.04 | ) | | | (0.01 | )1 | | | (0.06 | ) |
Net realized and unrealized gains (losses) on investments | | | 2.51 | | | | 0.40 | | | | 2.24 | | | | 0.65 | | | | (0.02 | ) |
| | | | | | | | | | | | | | | | | | | | |
Total from investment operations | | | 2.44 | | | | 0.35 | | | | 2.20 | | | | 0.64 | | | | (0.08 | ) |
Distributions to shareholders from | | | | | | | | | | | | | | | | | | | | |
Net realized gains | | | (1.81 | ) | | | (1.12 | ) | | | (0.28 | ) | | | (0.83 | ) | | | (1.30 | ) |
Net asset value, end of period | | | $10.29 | | | | $9.66 | | | | $10.43 | | | | $8.51 | | | | $8.70 | |
Total return2 | | | 25.31 | % | | | 1.48 | % | | | 26.14 | % | | | 8.10 | % | | | (2.63 | )% |
Ratios to average net assets (annualized) | | | | | | | | | | | | | | | | | | | | |
Gross expenses | | | 0.93 | % | | | 0.92 | % | | | 0.94 | % | | | 0.94 | % | | | 0.93 | % |
Net expenses | | | 0.93 | % | | | 0.92 | % | | | 0.94 | % | | | 0.94 | % | | | 0.93 | % |
Net investment loss | | | (0.69 | )% | | | (0.59 | )% | | | (0.65 | )% | | | (0.10 | )% | | | (0.69 | )% |
Supplemental data | | | | | | | | | | | | | | | | | | | | |
Portfolio turnover rate | | | 62 | % | | | 68 | % | | | 72 | % | | | 89 | % | | | 77 | % |
Net assets, end of period (000s omitted) | | | $22,925 | | | | $19,801 | | | | $22,591 | | | | $20,554 | | | | $22,402 | |
| 1 | Calculated based upon average shares outstanding |
| 2 | Returns do not reflect fees and expenses charged pursuant to the terms of variable life insurance policies and variable annuity contracts. |
The accompanying notes are an integral part of these financial statements.
Wells Fargo VT Small Cap Growth Fund | 19
Financial highlights
(For a share outstanding throughout each period)
| | | | | | | | | | | | | | | | | | | | |
| | | Year ended December 31 | |
| CLASS 2 | | 2019 | | | 2018 | | | 2017 | | | 2016 | | | 2015 | |
Net asset value, beginning of period | | | $9.38 | | | | $10.18 | | | | $8.33 | | | | $8.56 | | | | $9.96 | |
Net investment loss | | | (0.09 | ) | | | (0.09 | ) | | | (0.09 | ) | | | (0.03 | ) | | | (0.08 | ) |
Net realized and unrealized gains (losses) on investments | | | 2.43 | | | | 0.41 | | | | 2.22 | | | | 0.63 | | | | (0.02 | ) |
| | | | | | | | | | | | | | | | | | | | |
Total from investment operations | | | 2.34 | | | | 0.32 | | | | 2.13 | | | | 0.60 | | | | (0.10 | ) |
Distributions to shareholders from | | | | | | | | | | | | | | | | | | | | |
Net realized gains | | | (1.81 | ) | | | (1.12 | ) | | | (0.28 | ) | | | (0.83 | ) | | | (1.30 | ) |
Net asset value, end of period | | | $9.91 | | | | $9.38 | | | | $10.18 | | | | $8.33 | | | | $8.56 | |
Total return1 | | | 24.83 | % | | | 1.20 | % | | | 25.86 | % | | | 7.75 | % | | | (2.88 | )% |
Ratios to average net assets (annualized) | | | | | | | | | | | | | | | | | | | | |
Gross expenses | | | 1.18 | % | | | 1.17 | % | | | 1.19 | % | | | 1.19 | % | | | 1.18 | % |
Net expenses | | | 1.18 | % | | | 1.17 | % | | | 1.19 | % | | | 1.19 | % | | | 1.18 | % |
Net investment loss | | | (0.95 | )% | | | (0.84 | )% | | | (0.90 | )% | | | (0.35 | )% | | | (0.93 | )% |
Supplemental data | | | | | | | | | | | | | | | | | | | | |
Portfolio turnover rate | | | 62 | % | | | 68 | % | | | 72 | % | | | 89 | % | | | 77 | % |
Net assets, end of period (000s omitted) | | | $269,657 | | | | $243,038 | | | | $238,460 | | | | $202,718 | | | | $226,867 | |
| 1 | Returns do not reflect fees and expenses charged pursuant to the terms of variable life insurance policies and variable annuity contracts. |
The accompanying notes are an integral part of these financial statements.
20 | Wells Fargo VT Small Cap Growth Fund
Notes to financial statements
1. ORGANIZATION
Wells Fargo Variable Trust (the “Trust”), a Delaware statutory trust organized on March 10, 1999, is anopen-end management investment company registered under the Investment Company Act of 1940, as amended (the “1940 Act”). As an investment company, the Trust follows the accounting and reporting guidance in Financial Accounting Standards Board (“FASB”)Accounting Standards Codification Topic 946, Financial Services – Investment Companies. These financial statements report on the Wells Fargo VT Small Cap Growth Fund (the “Fund”) which is a diversified series of the Trust. The Trust offers shares of the Fund to separate accounts of various life insurance companies as funding vehicles for certain variable annuity contracts and variable life insurance policies.
2. SIGNIFICANT ACCOUNTING POLICIES
The following significant accounting policies, which are consistently followed in the preparation of the financial statements of the Fund, are in conformity with U.S. generally accepted accounting principles which require management to make estimates and assumptions that affect the reported amounts of assets and liabilities, disclosure of contingent assets and liabilities at the date of the financial statements, and the reported amounts of revenues and expenses during the reporting period. Actual results could differ from those estimates.
Securities valuation
All investments are valued each business day as of the close of regular trading on the New York Stock Exchange (generally 4 p.m. Eastern Time), although the Fund may deviate from this calculation time under unusual or unexpected circumstances.
Equity securities that are listed on a foreign or domestic exchange or market are valued at the official closing price or, if none, the last sales price. If no sale occurs on the principal exchange or market that day, a fair value price will be determined in accordance with the Fund’s Valuation Procedures.
Investments in registeredopen-end investment companies are valued at net asset value. Interests innon-registered investment companies that are redeemable at net asset value are fair valued normally at net asset value.
Investments which are not valued using any of the methods discussed above are valued at their fair value, as determined in good faith by the Board of Trustees of the Fund. The Board of Trustees has established a Valuation Committee comprised of the Trustees and has delegated to it the authority to take any actions regarding the valuation of portfolio securities that the Valuation Committee deems necessary or appropriate, including determining the fair value of portfolio securities, unless the determination has been delegated to the Wells Fargo Asset Management Pricing Committee at Wells Fargo Funds Management, LLC (“Funds Management”). The Board of Trustees retains the authority to make or ratify any valuation decisions or approve any changes to the Valuation Procedures as it deems appropriate. On a quarterly basis, the Board of Trustees receives reports on any valuation actions taken by the Valuation Committee or the Wells Fargo Asset Management Pricing Committee which may include items for ratification.
Securities lending
The Fund may lend its securities from time to time in order to earn additional income in the form of fees or interest on securities received as collateral or the investment of any cash received as collateral. When securities are on loan, the Fund receives interest or dividends on those securities. Cash collateral received in connection with its securities lending transactions is invested in Securities Lending Cash Investments, LLC (the “Securities Lending Fund”). Investments in Securities Lending Fund are valued at the evaluated bid price provided by an independent pricing service. Income earned from investment in the Securities Lending Fund, if any, is included in securities lending income from affiliates (net of fees and rebates) on the Statement of Operations.
In a securities lending transaction, the net asset value of the Fund is affected by an increase or decrease in the value of the securities loaned and by an increase or decrease in the value of the instrument in which collateral is invested. The amount of securities lending activity undertaken by the Fund fluctuates from time to time. The Fund has the right under the lending agreement to recover the securities from the borrower on demand. In the event of default or bankruptcy by the borrower, the Fund may be prevented from recovering the loaned securities or gaining access to the collateral or may experience delays or costs in doing so. In such an event, the terms of the agreement allows the unaffiliated securities lending agent to use the collateral to purchase replacement securities on behalf of the Fund or pay the Fund the market value of the loaned securities. The Fund bears the risk of loss with respect to depreciation of its investment of the cash collateral.
Security transactions and income recognition
Securities transactions are recorded on a trade date basis. Realized gains or losses are recorded on the basis of identified cost.
Dividend income is recognized on theex-dividend date.
Wells Fargo VT Small Cap Growth Fund | 21
Notes to financial statements
Distributions to shareholders
Distributions to shareholders from net investment income and any net realized gains are recorded on theex-dividend date and paid at least annually. Such distributions are determined in accordance with income tax regulations and may differ from U.S. generally accepted accounting principles. Dividend sources are estimated at the time of declaration. The tax character of distributions is determined as of the Fund’s fiscal year end. Therefore, a portion of the Fund’s distributions made prior to the Fund’s fiscal year end may be categorized as a tax return of capital at year end.
Federal and other taxes
The Fund intends to continue to qualify as a regulated investment company by distributing substantially all of its investment company taxable income and any net realized capital gains (after reduction for capital loss carryforwards) sufficient to relieve it from all, or substantially all, federal income taxes. Accordingly, no provision for federal income taxes was required.
The Fund’s income and federal excise tax returns and all financial records supporting those returns for the prior three fiscal years are subject to examination by the federal and Delaware revenue authorities. Management has analyzed the Fund’s tax positions taken on federal, state, and foreign tax returns for all open tax years and does not believe that there are any uncertain tax positions that require recognition of a tax liability.
As of December 31, 2019, the aggregate cost of all investments for federal income tax purposes was $242,325,270 and the unrealized gains (losses) consisted of:
| | | | |
| |
Gross unrealized gains | | $ | 70,502,973 | |
| |
Gross unrealized losses | | | (3,123,480 | ) |
| |
Net unrealized gains | | $ | 67,379,493 | |
Reclassifications are made to the Fund’s capital accounts for permanent tax differences to reflect income and gains available for distribution (or available capital loss carryforwards) under federal income tax regulations. U.S. generally accepted accounting principles require that certain components of net assets be adjusted to reflect permanent differences between financial and tax reporting. These reclassifications have no effect on net assets or net asset values per share. At December 31, 2019, as a result of permanentbook-to-tax differences, the following reclassification adjustments were made on the Statement of Assets and Liabilities:
| | |
| Paid-in capital | | Total distributable earnings |
| |
| $(2,708,150) | | $2,708,150 |
Class allocations
The separate classes of shares offered by the Fund differ principally in distribution fees. Class specific expenses are charged directly to that share class. Investment income, common fund-level expenses, and realized and unrealized gains (losses) on investments are allocated daily to each class of shares based on the relative proportion of net assets of each class.
3. FAIR VALUATION MEASUREMENTS
Fair value measurements of investments are determined within a framework that has established a fair value hierarchy based upon the various data inputs utilized in determining the value of the Fund’s investments. The three-level hierarchy gives the highest priority to unadjusted quoted prices in active markets for identical assets or liabilities (Level 1) and the lowest priority to unobservable inputs (Level 3). The Fund’s investments are classified within the fair value hierarchy based on the lowest level of input that is significant to the fair value measurement. The inputs are summarized into three broad levels as follows:
| ∎ | | Level 1 – quoted prices in active markets for identical securities |
| ∎ | | Level 2 – other significant observable inputs (including quoted prices for similar securities, interest rates, prepayment speeds, credit risk, etc.) |
| ∎ | | Level 3 – significant unobservable inputs (including the Fund’s own assumptions in determining the fair value of investments) |
The inputs or methodologies used for valuing investments in securities are not necessarily an indication of the risk associated with investing in those securities.
22 | Wells Fargo VT Small Cap Growth Fund
Notes to financial statements
The following is a summary of the inputs used in valuing the Fund’s assets and liabilities as of December 31, 2019:
| | | | | | | | | | | | | | | | |
| | | | |
| | | Quoted prices
(Level 1) | | | Other significant
observable inputs
(Level 2) | | | Significant
unobservable inputs (Level 3) | | | Total | |
| | | | |
Assets | | | | | | | | | | | | | | | | |
Investments in: | | | | | | | | | | | | | | | | |
| | | | |
Common stocks | | | | | | | | | | | | | | | | |
| | | | |
Communication services | | $ | 1,852,550 | | | $ | 0 | | | $ | 0 | | | $ | 1,852,550 | |
| | | | |
Consumer discretionary | | | 40,645,532 | | | | 0 | | | | 0 | | | | 40,645,532 | |
| | | | |
Consumer staples | | | 15,345,102 | | | | 0 | | | | 0 | | | | 15,345,102 | |
| | | | |
Energy | | | 1,025,722 | | | | 0 | | | | 0 | | | | 1,025,722 | |
| | | | |
Financials | | | 23,559,793 | | | | 0 | | | | 0 | | | | 23,559,793 | |
| | | | |
Health care | | | 67,198,472 | | | | 0 | | | | 0 | | | | 67,198,472 | |
| | | | |
Industrials | | | 54,329,372 | | | | 0 | | | | 0 | | | | 54,329,372 | |
| | | | |
Information technology | | | 80,907,340 | | | | 0 | | | | 0 | | | | 80,907,340 | |
| | | | |
Materials | | | 4,457,591 | | | | 0 | | | | 0 | | | | 4,457,591 | |
| | | | |
Short-term investments | | | | | | | | | | | | | | | | |
| | | | |
Investment companies | | | 20,383,289 | | | | 0 | | | | 0 | | | | 20,383,289 | |
| | | | |
Total assets | | $ | 309,704,763 | | | $ | 0 | | | $ | 0 | | | $ | 309,704,763 | |
Additional sector, industry or geographic detail is included in the Portfolio of Investments.
For the year ended December 31, 2019, the Fund did not have any transfers into/out of Level 3.
4. TRANSACTIONS WITH AFFILIATES
Management fee
Funds Management, an indirect wholly owned subsidiary of Wells Fargo & Company (“Wells Fargo”), is the manager of the Fund and provides advisory and fund-level administrative services under an investment management agreement. Under the investment management agreement, Funds Management is responsible for, among other services, implementing the investment objectives and strategies of the Fund, supervising the subadviser and providing fund-level administrative services in connection with the Fund’s operations. As compensation for its services under the investment management agreement, Funds Management is entitled to receive a management fee at the following annual rate based on the Fund’s average daily net assets:
| | |
| |
| Average daily net assets | | Management fee |
| |
First $500 million | | 0.800% |
| |
Next $500 million | | 0.750 |
| |
Next $1 billion | | 0.700 |
| |
Next $1 billion | | 0.675 |
| |
Next $2 billion | | 0.650 |
| |
Next $5 billion | | 0.640 |
| |
Over $10 billion | | 0.630 |
For the year ended December 31, 2019, the management fee was equivalent to an annual rate of 0.80% of the Fund’s average daily net assets.
Funds Management has retained the services of a subadviser to provide daily portfolio management to the Fund. The fee for subadvisory services is borne by Funds Management. Wells Capital Management Incorporated (“WellsCap”), an affiliate of Funds Management and an indirect wholly owned subsidiary of Wells Fargo, is the subadviser to the Fund and is entitled to receive a fee from Funds Management at an annual rate starting at 0.55% and declining to 0.40% as the average daily net assets of the Fund increase.
Wells Fargo VT Small Cap Growth Fund | 23
Notes to financial statements
Administration fees
Under a class-level administration agreement, Funds Management provides class-level administrative services to the Fund, which includes paying fees and expenses for services provided by the transfer agent,sub-transfer agents, omnibus account servicers and record-keepers. As compensation for its services under the class-level administration agreement, Funds Management receives an annual fee of 0.08% which is calculated based on the average daily net assets of each class.
Waivers and/or expense reimbursements
Funds Management has contractually waived and/or reimbursed management and administration fees to the extent necessary to maintain certain net operating expense ratios for the Fund. When each class of the Fund has exceeded its expense cap, Funds Management has waived fees and/or reimbursed expenses from fund-level expenses on a proportionate basis and then from class specific expenses. When only certain classes exceed their expense caps, waivers and/or reimbursements are applied against class specific expenses before fund-level expenses. Funds Management has committed through April 30, 2020 to waive fees and/or reimburse expenses to the extent necessary to cap the Fund’s expenses at 0.95% for Class 1 shares and 1.20% for Class 2 shares. Prior to or after the commitment expiration date, the cap may be increased or the commitment to maintain the cap may be terminated only with the approval of the Board of Trustees.
Distribution fee
The Trust has adopted a distribution plan for Class 2 shares of the Fund pursuant to Rule12b-1 under the 1940 Act. A distribution fee is charged to Class 2 shares and paid to Wells Fargo Funds Distributor, LLC, the principal underwriter, at an annual rate of 0.25% of the average daily net assets of Class 2 shares.
Interfund transactions
The Fund may purchase or sell portfolio investment securities to certain other Wells Fargo affiliates pursuant to Rule17a-7 under the 1940 Act and under procedures adopted by the Board of Trustees. The procedures have been designed to ensure that these interfund transactions, which do not incur broker commissions, are effected at current market prices.
5. INVESTMENT PORTFOLIO TRANSACTIONS
Purchases and sales of investments, excluding U.S. government obligations (if any) and short-term securities, for the year ended December 31, 2019 were $178,406,157 and $213,818,892, respectively.
6. SECURITIES LENDING TRANSACTIONS
The Fund lends its securities through an unaffiliated securities lending agent and receives collateral in the form of cash or securities with a value at least equal to the value of the securities on loan. The value of the loaned securities is determined at the close of each business day and any increases or decreases in the required collateral are exchanged between the Fund and the counterparty on the next business day. Cash collateral received is invested in the Securities Lending Fund which seeks to provide a positive return compared to the daily Fed Funds Open Rate by investing in high-quality, U.S. dollar-denominated short-term money market instruments and is exempt from registration under Section 3(c)(7) of the 1940 Act. Securities Lending Fund is managed by Funds Management and is subadvised by WellsCap. Funds Management receives an advisory fee starting at 0.05% and declining to 0.01% as the average daily net assets of the Securities Lending Fund increase. All of the fees received by Funds Management are paid to WellsCap for its services as subadviser.
In the event of counterparty default or the failure of a borrower to return a loaned security, the Fund has the right to use the collateral to offset any losses incurred. As of December 31, 2019, the Fund had securities lending transactions with the following counterparties which are subject to offset:
| | | | | | | | | | | | |
| | | |
| Counterparty | | Value of
securities on loan | | | Collateral
received1 | | | Net amount | |
| | | |
Bank of America Securities Inc. | | $ | 159,068 | | | $ | (159,068 | ) | | $ | 0 | |
| | | |
Barclays Capital Inc. | | | 3,484,198 | | | | (3,484,198 | ) | | | 0 | |
| | | |
BNP Paribas Securities Corp. | | | 5,506,152 | | | | (5,506,152 | ) | | | 0 | |
| | | |
Citigroup Global Markets Inc. | | | 2,263,294 | | | | (2,263,294 | ) | | | 0 | |
| | | |
Deutsche Bank Securities Inc. | | | 117,500 | | | | (117,500 | ) | | | 0 | |
| | | |
JPMorgan Securities LLC | | | 2,279,650 | | | | (2,279,650 | ) | | | 0 | |
| | | |
Morgan Stanley & Co. LLC | | | 2,967,291 | | | | (2,967,291 | ) | | | 0 | |
| | | |
SG Americas Securities LLC | | | 63,682 | | | | (63,682 | ) | | | 0 | |
| 1 | Collateral received within this table is limited to the collateral for the net transaction with the counterparty. |
24 | Wells Fargo VT Small Cap Growth Fund
Notes to financial statements
7. BANK BORROWINGS
The Trust, Wells Fargo Master Trust and Wells Fargo Funds Trust (excluding the money market funds) are parties to a $280,000,000 revolving credit agreement whereby the Fund is permitted to use bank borrowings for temporary or emergency purposes, such as to fund shareholder redemption requests. Interest under the credit agreement is charged to the Fund based on a borrowing rate equal to the higher of the Federal Funds rate in effect on that day plus 1.25% or the overnight LIBOR rate in effect on that day plus 1.25%. In addition, an annual commitment fee equal to 0.25% of the unused balance is allocated to each participating fund.
For the year ended December 31, 2019, there were no borrowings by the Fund under the agreement.
8. DISTRIBUTIONS TO SHAREHOLDERS
The tax character of distributions paid during the years ended December 31, 2019 and December 31, 2018 were as follows:
| | | | | | | | |
| | | Year ended December | |
| | |
| | | 2019 | | | 2018 | |
| | |
Ordinary income | | $ | 1,567,204 | | | $ | 0 | |
| | |
Long-term capital gain | | | 46,347,584 | | | | 29,087,445 | |
As of December 31, 2019, the components of distributable earnings on a tax basis were as follows:
| | |
Undistributed long-term gain | | Unrealized gains |
| |
| $18,065,691 | | $67,379,493 |
9. CONCENTRATION RISK
Concentration risks result from exposure to a limited number of sectors. As of the end of the period, the Fund invests a concentration of its portfolio in the information technology sector. A fund that invests a substantial portion of its assets in any sector may be more affected by changes in that sector than would be a fund whose investments are not heavily weighted in any sector.
10. INDEMNIFICATION
Under the Trust’s organizational documents, the officers and Trustees have been granted certain indemnification rights against certain liabilities that may arise out of performance of their duties to the Trust. Additionally, in the normal course of business, the Trust may enter into contracts with service providers that contain a variety of indemnification clauses. The Trust’s maximum exposure under these arrangements is dependent on future claims that may be made against the Fund and, therefore, cannot be estimated.
11. NEW ACCOUNTING PRONOUNCEMENT
In August 2018, FASB issued Accounting Standards Update (“ASU”)No. 2018-13, Fair Value Measurement (Topic 820)Disclosure Framework—Changes to the Disclosure Requirements for Fair Value Measurement.ASU2018-13 updates the disclosure requirements for fair value measurements by modifying or removing certain disclosures and adding certain new disclosures. The amendments are effective for fiscal years, and interim periods within those fiscal years, beginning after December 15, 2019. Early adoption is permitted. Management has adopted the removal and modification of disclosures early, as permitted, and will adopt the additional new disclosures at the effective date.
Wells Fargo VT Small Cap Growth Fund | 25
Report of independent registered public accounting firm
TO THE SHAREHOLDERS OF THE FUND AND BOARD OF TRUSTEES OF WELLS FARGO VARIABLE TRUST:
Opinion on the Financial Statements
We have audited the accompanying statement of assets and liabilities of Wells Fargo VT Small Cap Growth Fund (the Fund), one of the funds constituting Wells Fargo Variable Trust, including the portfolio of investments, as of December 31, 2019, the related statement of operations for the year then ended, the statements of changes in net assets for each of the years in the two-year period then ended, and the related notes (collectively, the financial statements) and the financial highlights for each of the years in the five-year period then ended. In our opinion, the financial statements and financial highlights present fairly, in all material respects, the financial position of the Fund as of December 31, 2019, the results of its operations for the year then ended, the changes in its net assets for each of the years in the two-year period then ended, and the financial highlights for each of the years in the five-year period then ended, in conformity with U.S. generally accepted accounting principles.
Basis for Opinion
These financial statements and financial highlights are the responsibility of the Fund’s management. Our responsibility is to express an opinion on these financial statements and financial highlights based on our audits. We are a public accounting firm registered with the Public Company Accounting Oversight Board (United States) (PCAOB) and are required to be independent with respect to the Fund in accordance with the U.S. federal securities laws and the applicable rules and regulations of the Securities and Exchange Commission and the PCAOB.
We conducted our audits in accordance with the standards of the PCAOB. Those standards require that we plan and perform the audit to obtain reasonable assurance about whether the financial statements and financial highlights are free of material misstatement, whether due to error or fraud. Our audits included performing procedures to assess the risks of material misstatement of the financial statements and financial highlights, whether due to error or fraud, and performing procedures that respond to those risks. Such procedures included examining, on a test basis, evidence regarding the amounts and disclosures in the financial statements and financial highlights. Such procedures also included confirmation of securities owned as of December 31, 2019, by correspondence with the custodian, transfer agent and brokers, or by other appropriate auditing procedures. Our audits also included evaluating the accounting principles used and significant estimates made by management, as well as evaluating the overall presentation of the financial statements and financial highlights. We believe that our audits provide a reasonable basis for our opinion.

We have not been able to determine the specific year that we began serving as the auditor of one or more Wells Fargo Funds investment companies; however we are aware that we have served as the auditor of one or more Wells Fargo Funds investment companies since at least 1955.
Boston, Massachusetts
February 25, 2020
26 | Wells Fargo VT Small Cap Growth Fund
Other information (unaudited)
TAX INFORMATION
For corporate shareholders, pursuant to Section 854 of the Internal Revenue Code, 20.72% of ordinary income dividends qualify for the corporate dividends-received deduction for the fiscal year ended December 31, 2019.
Pursuant to Section 852 of the Internal Revenue Code, $46,347,584 was designated as a 20% rate gain distribution for the fiscal year ended December 31, 2019.
PROXY VOTING INFORMATION
A description of the policies and procedures used to determine how to vote proxies relating to portfolio securities is available, upon request, by calling1-800-260-5969, visiting our website atwfam.com, or visiting the SEC website at sec.gov. Information regarding how the proxies related to portfolio securities were voted during the most recent12-month period ended June 30 is available on the website atwfam.com or by visiting the SEC website at sec.gov.
QUARTERLY PORTFOLIO HOLDINGS INFORMATION
The Fund files its complete schedule of portfolio holdings with the SEC for the first and third quarters of each fiscal year as an exhibit to its reports on FormN-PORT. Shareholders may view the filed FormN-PORT by visiting the SEC website at sec.gov.
Wells Fargo VT Small Cap Growth Fund | 27
Other information (unaudited)
BOARD OF TRUSTEES AND OFFICERS
Each of the Trustees and Officers1 listed in the table below acts in identical capacities for each fund in the Wells Fargo family of funds, which consists of 149 mutual funds comprising the Wells Fargo Funds Trust, Wells Fargo Variable Trust, Wells Fargo Master Trust and fourclosed-end funds (collectively the “Fund Complex”). This table should be read in conjunction with the Prospectus and the Statement of Additional Information2. The mailing address of each Trustee and Officer is 525 Market Street, 12th Floor, San Francisco, CA 94105. Each Trustee and Officer serves an indefinite term, however, each Trustee serves such term until reaching the mandatory retirement age established by the Trustees.
Independent Trustees
| | | | | | |
Name and year of birth | | Position held and
length of service* | | Principal occupations during past five years or longer | | Current other
public company or
investment
company
directorships |
| | | |
William R. Ebsworth (Born 1957) | | Trustee, since 2015 | | Retired. From 1984 to 2013, equities analyst, portfolio manager, research director and chief investment officer at Fidelity Management and Research Company in Boston, Tokyo, and Hong Kong, and retired in 2013 as Chief Investment Officer of Fidelity Strategic Advisers, Inc. where he led a team of investment professionals managing client assets. Prior thereto, Board member of Hong Kong Securities Clearing Co., Hong Kong Options Clearing Corp., the Thailand International Fund, Ltd., Fidelity Investments Life Insurance Company, and Empire Fidelity Investments Life Insurance Company. Audit Committee Chair and Investment Committee Chair of the Vincent Memorial Hospital Endowment(non-profit organization). Mr. Ebsworth is a CFA® charterholder. | | N/A |
| | | |
Jane A. Freeman (Born 1953) | | Trustee, since 2015; Chair Liaison, since 2018 | | Retired. From 2012 to 2014 and 1999 to 2008, Chief Financial Officer of Scientific Learning Corporation. From 2008 to 2012, Ms. Freeman provided consulting services related to strategic business projects. Prior to 1999, Portfolio Manager at Rockefeller & Co. and Scudder, Stevens & Clark. Board member of the Harding Loevner Funds from 1996 to 2014, serving as both Lead Independent Director and chair of the Audit Committee. Board member of the Russell Exchange Traded Funds Trust from 2011 to 2012 and the chair of the Audit Committee. Ms. Freeman is a Board Member of The Ruth Bancroft Garden(non-profit organization). She is also an inactive Chartered Financial Analyst. | | N/A |
| | | |
Isaiah Harris, Jr. (Born 1952) | | Trustee, since 2009; Audit Committee Chairman, since 2019 | | Retired. Chairman of the Board of CIGNA Corporation since 2009, and Director since 2005. From 2003 to 2011, Director of Deluxe Corporation. Prior thereto, President and CEO of BellSouth Advertising and Publishing Corp. from 2005 to 2007, President and CEO of BellSouth Enterprises from 2004 to 2005 and President of BellSouth Consumer Services from 2000 to 2003. Emeritus member of the Iowa State University Foundation Board of Governors. Emeritus Member of the Advisory Board of Iowa State University School of Business. Advisory Board Member, Palm Harbor Academy (private school). Advisory Board Member, Child Evangelism Fellowship(non-profit). Mr. Harris is a certified public accountant (inactive status). | | CIGNA Corporation |
| | | |
Judith M. Johnson (Born 1949) | | Trustee, since 2008; Audit Committee Chairman, from 2009 to 2018 | | Retired. Prior thereto, Chief Executive Officer and Chief Investment Officer of Minneapolis Employees Retirement Fund from 1996 to 2008. Ms. Johnson is an attorney, certified public accountant and a certified managerial accountant. | | N/A |
28 | Wells Fargo VT Small Cap Growth Fund
Other information (unaudited)
| | | | | | |
Name and year of birth | | Position held and
length of service* | | Principal occupations during past five years or longer | | Current other
public company or
investment
company
directorships |
| | | |
David F. Larcker (Born 1950) | | Trustee, since 2009 | | James Irvin Miller Professor of Accounting at the Graduate School of Business, Stanford University, Director of the Corporate Governance Research Initiative and Senior Faculty of The Rock Center for Corporate Governance since 2006. From 2005 to 2008, Professor of Accounting at the Graduate School of Business, Stanford University. Prior thereto, Ernst & Young Professor of Accounting at The Wharton School, University of Pennsylvania from 1985 to 2005. | | N/A |
| | | |
Olivia S. Mitchell (Born 1953) | | Trustee, since 2006; Nominating and Governance Committee Chair, since 2018 | | International Foundation of Employee Benefit Plans Professor, Wharton School of the University of Pennsylvania since 1993. Director of Wharton’s Pension Research Council and Boettner Center on Pensions & Retirement Research, and Research Associate at the National Bureau of Economic Research. Previously, Cornell University Professor from 1978 to 1993. | | N/A |
| | | |
Timothy J. Penny (Born 1951) | | Trustee, since 1996; Chairman, since 2018 | | President and Chief Executive Officer of Southern Minnesota Initiative Foundation, anon-profit organization, since 2007. Member of the Board of Trustees of NorthStar Education Finance, Inc., anon-profit organization, since 2007. | | N/A |
| | | |
James G. Polisson (Born 1959) | | Trustee, since 2018 | | Retired. Chief Marketing Officer, Source (ETF) UK Services, Ltd, from 2015 to 2017. From 2012 to 2015, Principal of The Polisson Group, LLC, a management consulting, corporate advisory and principal investing company. Chief Executive Officer and Managing Director at Russell Investments, Global Exchange Traded Funds from 2010 to 2012. Managing Director of Barclays Global Investors from 1998 to 2010 and Global Chief Marketing Officer for iShares and Barclays Global Investors from 2000 to 2010. Trustee of the San Francisco Mechanics’ Institute, anon-profit organization, from 2013 to 2015. Board member of the Russell Exchange Traded Fund Trust from 2011 to 2012. Director of Barclays Global Investors Holdings Deutschland GmbH from 2006 to 2009. Mr. Polisson is an attorney and has a retired status with the Massachusetts and District of Columbia Bar Associations. | | N/A |
| | | |
Pamela Wheelock3 (Born 1959) | | Trustee, since January 2020; previously Trustee from January 2018 to July 2019 | | Board member of the Destination Medical Center Economic Development Agency, Rochester, Minnesota since 2019. Acting Commissioner, Minnesota Department of Human Services, July 2019 through September 2019. Human Services Manager (part-time), Minnesota Department of Human Services, October 2019 through December 2019. Chief Operating Officer, Twin Cities Habitat for Humanity from 2017 to 2019. Vice President of University Services, University of Minnesota from 2012 to 2016. Prior thereto, on the Board of Directors, Governance Committee and Finance Committee for the Minnesota Philanthropy Partners (Saint Paul Foundation) from 2012 to 2018, Interim Chief Executive Officer of Blue Cross Blue Shield of Minnesota from 2011 to 2012, Chairman of the Board from 2009 to 2012 and Board Director from 2003 to 2015. Vice President, Leadership and Community Engagement, Bush Foundation, Saint Paul, Minnesota (a private foundation) from 2009 to 2011. Executive Vice President and Chief Financial Officer, Minnesota Sports and Entertainment from 2004 to 2009 and Senior Vice President from 2002 to 2004. Executive Vice President of the Minnesota Wild Foundation from 2004 to 2008. Commissioner of Finance, State of Minnesota, from 1999 to 2002. Currently Board Chair of the Minnesota Wild Foundation since 2010. | | N/A |
| * | Length of service dates reflect the Trustee’s commencement of service with the Trust’s predecessor entities, where applicable. |
Wells Fargo VT Small Cap Growth Fund | 29
Other information (unaudited)
Officers
| | | | |
Name and year of birth | | Position held and
length of service | | Principal occupations during past five years or longer |
| | |
Andrew Owen (Born 1960) | | President, since 2017 | | Executive Vice President of Wells Fargo & Company and Head of Affiliated Managers, Wells Fargo Asset Management, since 2014. In addition, Mr. Owen is currently President, Chief Executive Officer and Director of Wells Fargo Funds Management, LLC since 2017. Prior thereto, Executive Vice President responsible for marketing, investments and product development for Wells Fargo Funds Management, LLC, from 2009 to 2014. |
| | |
Jeremy DePalma1 (Born 1974) | | Treasurer, since 2012 | | Senior Vice President of Wells Fargo Funds Management, LLC since 2009. Senior Vice President of Evergreen Investment Management Company, LLC from 2008 to 2010 and head of the Fund Reporting and Control Team within Fund Administration from 2005 to 2010. |
| | |
Michelle Rhee4 (Born 1966) | | Chief Legal Officer, since 2019 | | Secretary of Wells Fargo Funds Management, LLC, Chief Legal Counsel of Wells Fargo Asset Management and Assistant General Counsel of Wells Fargo Bank, N.A. since 2018. Associate General Counsel and Managing Director of Bank of America Corporation from 2004 to 2018. |
| | |
Catherine Kennedy5 (Born 1969) | | Secretary, since 2019 | | Vice President of Wells Fargo Funds Management, LLC and Senior Counsel of the Wells Fargo Legal Department since 2010. Vice President and Senior Counsel of Evergreen Investment Management Company, LLC from 1998 to 2010. |
| | |
Michael H. Whitaker (Born 1967) | | Chief Compliance Officer, since 2016 | | Chief Compliance Officer of Wells Fargo Asset Management since 2016. Senior Vice President and Chief Compliance Officer for Fidelity Investments from 2007 to 2016. |
| | |
David Berardi (Born 1975) | | Assistant Treasurer, since 2009 | | Vice President of Wells Fargo Funds Management, LLC since 2009. Vice President of Evergreen Investment Management Company, LLC from 2008 to 2010. Manager of Fund Reporting and Control for Evergreen Investment Management Company, LLC from 2004 to 2010. |
| 1 | Jeremy DePalma acts as Treasurer of 85 funds and Assistant Treasurer of 64 funds in the Fund Complex. |
| 2 | The Statement of Additional Information includes additional information about the Trustees and is available, without charge, upon request, by calling1-800-260-5969 or by visiting the website at wfam.com. |
| 3 | Pamela Wheelock wasre-appointed to the Board effective January 1, 2020. |
| 4 | Michelle Rhee became Chief Legal Officer effective October 22, 2019. |
| 5 | Catherine Kennedy became Secretary effective October 22, 2019. |
30 | Wells Fargo VT Small Cap Growth Fund
This page is intentionally left blank.
This page is intentionally left blank.

For more information
More information about Wells Fargo Funds is available free upon request. To obtain literature, please write, visit the Fund’s website, or call:
Wells Fargo Funds
P.O. Box 219967
Kansas City, MO 64121-9967
Website:wfam.com
Individual investors:1-800-222-8222
Retail investment professionals:1-888-877-9275
Institutional investment professionals:1-866-765-0778

This report and the financial statements contained herein are submitted for the general information of the shareholders of the Fund. If this report is used for promotional purposes, distribution of the report must be accompanied or preceded by a current prospectus. Before investing, please consider the investment objectives, risks, charges, and expenses of the investment. For a current prospectus and, if available, a summary prospectus, containing this information, call1-800-260-5969 or visit the Fund’s website atwfam.com. Read the prospectus carefully before you invest or send money.
Wells Fargo Asset Management (WFAM) is the trade name for certain investment advisory/management firms owned by Wells Fargo & Company. These firms include but are not limited to Wells Capital Management Incorporated and Wells Fargo Funds Management, LLC. Certain products managed by WFAM entities are distributed by Wells Fargo Funds Distributor, LLC (a broker-dealer and Member FINRA).
This material is for general informational and educational purposes only and is NOT intended to provide investment advice or a recommendation of any kind—including a recommendation for any specific investment, strategy, or plan.
INVESTMENT PRODUCTS: NOT FDIC INSURED ◾ NO BANK GUARANTEE ◾ MAY LOSE VALUE
© 2020 Wells Fargo & Company. All rights reserved.
PAR-0120-02380 02-20
AVT7/AR153 12-19
ITEM 2. CODE OF ETHICS
(a) As of the end of the period, covered by the report, Wells Fargo Variable Trust has adopted a code of ethics that applies to its President and Treasurer. A copy of the code of ethics is filed as an exhibit to this FormN-CSR.
(c) During the period covered by this report, there were no amendments to the provisions of the code of ethics adopted in Item 2(a) above.
(d) During the period covered by this report, there were no implicit or explicit waivers to the provisions of the code of ethics adopted in Item 2(a) above.
ITEM 3. AUDIT COMMITTEE FINANCIAL EXPERT
The Board of Trustees of Wells Fargo Variable Trust has determined that Judith Johnson is an audit committee financial expert, as defined in Item 3 of FormN-CSR. Mrs. Johnson is independent for purposes of Item 3 of FormN-CSR.
ITEM 4. PRINCIPAL ACCOUNTANT FEES AND SERVICES
(a), (b), (c), (d) The following table presents aggregate fees billed in each of the last two fiscal years for services rendered to the Registrant by the Registrant’s principal accountant. These fees were billed to the registrant and were approved by
the Registrant’s audit committee.
| | | | | | | | |
| | | Fiscal
year ended
December 31, 2019 | | | Fiscal
year ended
December 31,
2018 | |
Audit fees | | $ | 188,560 | | | $ | 185,901 | |
Audit-related fees | | | — | | | | — | |
Tax fees (1) | | | 16,305 | | | | 15,900 | |
All other fees | | | — | | | | — | |
| | $ | 204,865 | | | $ | 201,801 | |
(1) Tax fees consist of fees for tax compliance, tax advice, tax planning and excise tax.
(e) The Chairman of the Audit Committees is authorized topre-approve: (1) audit services to the mutual funds of Wells Fargo Variable Trust;(2) non-audit tax or compliance consulting or training services provided to the Funds by the independent auditors (“Auditors”) if the fees for any particular engagement are not anticipated to exceed $50,000; and(3) non-audit tax or compliance consulting or training services provided by the Auditors to a Fund’s investment adviser and its controlling entities (wherepre-approval is required because the engagement relates directly to the operations and financial reporting of the Fund) if the fee to
the Auditors for any particular engagement is not anticipated to exceed $50,000. For any suchpre-approval sought from the Chairman, Management shall prepare a brief description of the proposed services. If the Chairman approves of such service, he or she shall sign the statement prepared by Management. Such written statement shall be presented to the full Committees at their next regularly scheduled meetings.
(f) Not applicable
(g) Not applicable
(h) Not applicable
ITEM 5. AUDIT COMMITTEE OF LISTED REGISTRANTS
Not applicable.
ITEM 6. INVESTMENTS
A Portfolio of Investments for each series of Wells Fargo Variable Trust is included as part of the report to shareholders filed under Item 1 of this Form.
ITEM 7. DISCLOSURE OF PROXY VOTING POLICIES AND PROCEDURES FORCLOSED-END MANAGEMENT INVESTMENT COMPANIES
Not applicable.
ITEM 8. PORTFOLIO MANAGERS OFCLOSED-END MANAGEMENT INVESTMENT COMPANIES
Not applicable.
ITEM 9. PURCHASES OF EQUITY SECURITIES BYCLOSED-END MANAGEMENT INVESTMENT COMPANY AND AFFILIATED PURCHASERS
Not applicable.
ITEM 10. SUBMISSION OF MATTERS TO A VOTE OF SECURITY HOLDERS
There have been no material changes to the procedures by which shareholders may recommend nominees to the registrant’s Board of Trustees that have been implemented since the registrant’s last provided disclosure in response to the requirements of this Item.
ITEM 11. CONTROLS AND PROCEDURES
(a) The President and Treasurer have concluded that Wells Fargo Variable Trust disclosure controls and procedures (as defined in Rule30a-3(c) under the Investment Company Act of 1940) provide reasonable assurances that material information relating to the registrant is made known to them by the appropriate persons based on their evaluation of these controls and procedures as of a date within 90 days of the filing of this report.
(b) There were no significant changes in the registrant’s internal controls over financial reporting (as defined in Rule30a-3(d) under the Investment Company Act of 1940) that occurred during the most recent fiscal half-year of the period covered by this report that materially affected, or is reasonably likely to materially affect, the registrant’s internal control over financial reporting.
ITEM 12. DISCLOSURES OF SECURITIES LENDING ACTIVITES FORCLOSED-END
MANAGEMENT INVESTMENT COMPANIES
Not applicable.
ITEM 13. EXHIBITS
(a)(1) Code of Ethics pursuant to Item 2 of FormN-CSR is filed and attached hereto as Exhibit COE.
(a)(2) Certification pursuant to Rule30a-2(a) under the Investment Company Act of 1940 (17 CFR270.30a-2(a)) is filed and attached hereto as Exhibit 99.CERT.
(b) Certification pursuant to Rule30a-2(b) under the Investment Company Act of 1940 (17 CFR270.30a-2(b)) is filed and attached hereto as Exhibit 99.906CERT.
SIGNATURES
Pursuant to the requirements of the Securities Exchange Act of 1934 and the Investment Company Act of 1940, the registrant has duly caused this report to be signed on its behalf by the undersigned, thereunto duly authorized.
| | |
| Wells Fargo Variable Trust |
| |
| By: | | |
| |
| | /s/ Andrew Owen |
| |
| | Andrew Owen |
| | | President |
|
| Date: February 25, 2020 |
Pursuant to the requirements of the Securities Exchange Act of 1934 and the Investment Company Act of 1940, this report has been signed below by the following persons on behalf of the registrant and in the capacities and on the date indicated.
| | |
| Wells Fargo Variable Trust |
| |
| By: | | |
| |
| | /s/ Andrew Owen |
| |
| | Andrew Owen |
| | President |
|
| Date: February 25, 2020 |
| | |
| By: | | |
| | /s/ Jeremy DePalma |
| |
| | Jeremy DePalma |
| | Treasurer |
|
| Date: February 25, 2020 |