UNITED STATES
SECURITIES AND EXCHANGE COMMISSION
Washington, D.C. 20549
FORM N-CSR
CERTIFIED SHAREHOLDER REPORT OF REGISTERED
MANAGEMENT INVESTMENT COMPANIES
Investment Company Act file number: 811-09255
Wells Fargo Variable Trust
(Exact name of registrant as specified in charter)
525 Market St., San Francisco, CA 94105
(Address of principal executive offices) (Zip code)
Catherine Kennedy
Wells Fargo Funds Management, LLC
525 Market St., San Francisco, CA 94105
(Name and address of agent for service)
Registrant’s telephone number, including area code: 800-222-8222
Date of fiscal year end: December 31
Registrant is making a filing for 6 of its series:
Wells Fargo VT Discovery Fund, Wells Fargo VT Index Asset Allocation Fund, Wells Fargo VT International Equity Fund, Wells Fargo VT Omega Growth Fund, Wells Fargo VT Opportunity Fund, and the Wells Fargo VT Small Cap Growth Fund.
Date of reporting period: December 31, 2020
ITEM 1. REPORT TO STOCKHOLDERS
Annual Report
December 31, 2020
Wells Fargo VT Discovery Fund
Reduce clutter.
Save trees.
Sign up for electronic delivery of prospectuses and shareholder reports at wellsfargo.com/ advantagedelivery
The views expressed and any forward-looking statements are as of December 31, 2020, unless otherwise noted, and are those of the Fund's portfolio managers and/or Wells Fargo Asset Management. Discussions of individual securities or the markets generally are not intended as individual recommendations. Future events or results may vary significantly from those expressed in any forward-looking statements. The views expressed are subject to change at any time in response to changing circumstances in the market. Wells Fargo Asset Management and the Fund disclaim any obligation to publicly update or revise any views expressed or forward-looking statements.
INVESTMENT PRODUCTS: NOT FDIC INSURED ■ NO BANK GUARANTEE ■ MAY LOSE VALUE
Wells Fargo VT Discovery Fund | 1
Letter to shareholders (unaudited)
Dear Shareholder:
We are pleased to offer you this annual report for the Wells Fargo VT Discovery Fund for the 12-month period that ended December 31, 2020. Despite a deeply challenging year, dominated by the spread of COVID-19 cases and a sharp drop in economic output throughout much of the world, global stocks fared well overall, benefiting from strong central bank support. Bonds generally had modestly positive returns, providing some measure of diversification during turbulent market stretches.
For the 12-month period, equities had solid returns, more than making up for intense volatility in March. Non-U.S. developed market equities had weaker performance than emerging market and U.S. stocks. While gains from fixed-income securities were positive, they were more modest than equities. For the period, U.S. stocks, based on the S&P 500 Index1, gained 18.40%. International stocks, as measured by the MSCI ACWI ex USA Index (Net)2, returned 10.65%, while the MSCI EM Index (Net)3 had stronger performance, with a 18.31% gain. Among bond indexes, the Bloomberg Barclays U.S. Aggregate Bond Index4 returned 7.51%, the Bloomberg Barclays Global Aggregate ex-USD Index (unhedged)5 gained 10.11%, and the Bloomberg Barclays Municipal Bond Index6 returned 5.21% while the ICE BofA U.S. High Yield Index7 returned 6.17%.
The mood changed soon after the year began.
A year-end 2019 rally continued in early January 2020. However, market volatility spiked in late January on concerns over the potential impact of COVID-19 on the global economy and stock markets. With sentiment somewhat souring, perceived safe havens did well in January. The U.S. dollar and Japanese yen both rose, and government bonds outperformed equities. While the S&P 500 Index held its ground, emerging market equities tumbled.
Fears over the spread of COVID-19 and its impact on global growth led to a sharp downturn by late February. Oil prices tumbled as Russia and the Organization of the Petroleum Exporting Countries compounded a major decline in oil demand with a brutal price war, causing the price of crude oil to plummet.
Andrew Owen
President
Wells Fargo Funds
“Non-U.S. developed market equities had weaker performance than emerging market and U.S. stocks”
| 1 | The S&P 500 Index consists of 500 stocks chosen for market size, liquidity, and industry group representation. It is a market-value-weighted index with each stock's weight in the index proportionate to its market value. You cannot invest directly in an index. |
| 2 | The Morgan Stanley Capital International (MSCI) All Country World Index (ACWI) ex USA Index (Net) is a free-float-adjusted market-capitalization-weighted index that is designed to measure the equity market performance of developed and emerging markets, excluding the United States. Source: MSCI. MSCI makes no express or implied warranties or representations and shall have no liability whatsoever with respect to any MSCI data contained herein. The MSCI data may not be further redistributed or used as a basis for other indices or any securities or financial products. This report is not approved, reviewed, or produced by MSCI. You cannot invest directly in an index. |
| 3 | The MSCI Emerging Markets (EM) Index (Net) is a free-float-adjusted market-capitalization-weighted index that is designed to measure equity market performance of emerging markets. You cannot invest directly in an index. |
| 4 | The Bloomberg Barclays U.S. Aggregate Bond Index is a broad-based benchmark that measures the investment-grade, U.S. dollar-denominated, fixed-rate taxable bond market, including Treasuries, government-related and corporate securities, mortgage-backed securities (agency fixed-rate and hybrid adjustable-rate mortgage pass-throughs), asset-backed securities, and commercial mortgage-backed securities. You cannot invest directly in an index. |
| 5 | The Bloomberg Barclays Global Aggregate ex-USD Index (unhedged) is an unmanaged index that provides a broad-based measure of the global investment-grade fixed-income markets excluding the U.S. dollar-denominated debt market. You cannot invest directly in an index. |
| 6 | The Bloomberg Barclays Municipal Bond Index is an unmanaged index composed of long-term tax-exempt bonds with a minimum credit rating of Baa. You cannot invest directly in an index. |
| 7 | The ICE BofA U.S. High Yield Index is a market-capitalization-weighted index of domestic and Yankee high-yield bonds. The index tracks the performance of high-yield securities traded in the U.S. bond market. You cannot invest directly in an index. Copyright 2021. ICE Data Indices, LLC. All rights reserved. |
2 | Wells Fargo VT Discovery Fund
Letter to shareholders (unaudited)
The global spread of COVID-19 led country after country to clamp down on social- and business-related activity in order to contain the virus. This sent economies into a deep contraction. Central banks responded by slashing interest rates and expanding quantitative easing programs to restore liquidity and market confidence. The U.S. Federal Reserve (Fed) launched several lending programs, funding investment-grade bonds, money market mutual funds, and commercial paper while purchasing Treasuries, mortgage-backed securities, and overnight repurchase agreements. Meanwhile, stock markets tumbled, ending the longest bull stock market in U.S. history.
Markets rebounded strongly through the spring, fueled by unprecedented government and central bank stimulus measures in the U.S. and globally. The U.S. economy contracted by an annualized 5.0% pace in the first quarter, with 30 million new unemployment insurance claims in six weeks. In the eurozone, first-quarter real gross domestic product (GDP) shrank 3.8%. China’s first-quarter GDP fell by 6.8% year over year. Extreme oil-price volatility continued as global supply far exceeded demand.
In May, investors regained confidence on reports of early success in human trials of a COVID-19 vaccine. Growth stocks outperformed value, while returns on global government bonds were flat. However, in the U.S., the April unemployment rate rose to 14.7%, its highest level since World War II. Purchasing managers’ indexes (PMIs), a monthly survey of purchasing managers, reflected broadly weakening activity in May. U.S. corporate earnings contracted 14% year over year from the first quarter of 2019. However, high demand for information technology (IT), driven by remote activity, supported robust IT sector earnings, which helped drive IT stocks higher.
By June, economies reopened and global central banks committed to do all they could to provide economic support through liquidity and low borrowing costs. U.S. economic activity was aided by one-time $1,200 stimulus checks and $600 weekly bonus unemployment benefits that lasted through July. However, unemployment remained historically high and COVID-19 cases began to increase by late June. China’s economic recovery began to pick up momentum.
July was broadly positive for equities and fixed income. However, economic data and a resurgence of COVID-19 cases underscored the urgent need to regain control of the pandemic. Second-quarter GDP shrank from the previous quarter by 9.5% and 12.1% in the U.S. and the eurozone, respectively. In contrast, China’s second-quarter GDP grew 3.2% year over year. The U.S. economy added 1.8 million jobs in July, but a double-digit jobless rate persisted.
The stock market continued to rally in August despite concerns over rising numbers of U.S. and European COVID-19 cases as well as the July expiration of the $600 weekly bonus unemployment benefit. Relatively strong second-quarter earnings boosted investor sentiment along with the Fed’s announcement of a monetary policy shift expected to support longer-term low interest rates. U.S. manufacturing and services activity indexes beat expectations while the U.S. housing market maintained strength. In Europe, retail sales expanded and consumer confidence was steady. China’s economy continued to expand.
Stocks grew more volatile in September on mixed economic data. U.S. economic activity continued to grow. However, U.S. unemployment remained elevated at 7.9% in September. With U.S. Congress delaying further fiscal relief and uncertainties surrounding a possible vaccine, doubts crept back into the financial markets. In the U.K., a lack of progress in Brexit talks weighed on markets. China’s economy picked up steam, fueled by increased global demand.
Wells Fargo VT Discovery Fund | 3
Letter to shareholders (unaudited)
In October, capital markets stepped back from their six-month rally. Market volatility rose in advance of the U.S. election and amid a global increase in COVID-19 infections. Europe introduced tighter restrictions affecting economic activity. U.S. markets looked favorably at the prospect of Democratic control of the federal purse strings, which could lead to additional fiscal stimulus and a boost to economic activity. Meanwhile, China reported 4.9% third-quarter GDP growth.
Global stocks rallied in November, propelled by optimism over three promising COVID-19 vaccines. Reversing recent trends, value stocks outperformed growth stocks and cyclical stocks outpaced technology stocks. However, U.S. unemployment remained elevated, with a net job loss of 10 million since February. The eurozone services PMI contracted sharply while the region’s manufacturing activity grew. The U.S. election results added to the upbeat mood as investors anticipated more consistent policies in the new administration.
Financial markets ended the year with strength on high expectations for a rapid rollout of the COVID-19 vaccines, the successful passage of a $900 billion stimulus package, and rising expectations of additional economic support from a Democratic-led Congress. U.S. economic data were mixed with still-elevated unemployment and weak retail sales but growth in manufacturing output. In contrast, China’s economic expansion continued in both manufacturing and nonmanufacturing. U.S. COVID-19 infection rates continued to rise even as new state and local lockdown measures were implemented.
Don’t let short-term uncertainty derail long-term investment goals.
Periods of investment uncertainty can present challenges, but experience has taught us that maintaining long-term investment goals can be an effective way to plan for the future. To help you create a sound strategy based on your personal goals and risk tolerance, Wells Fargo Funds offers more than 100 mutual funds spanning a wide range of asset classes and investment styles. Although diversification cannot guarantee an investment profit or prevent losses, we believe it can be an effective way to manage investment risk and potentially smooth out overall portfolio performance. We encourage investors to know their investments and to understand that appropriate levels of risk-taking may unlock opportunities.
Thank you for choosing to invest with Wells Fargo Funds. We appreciate your confidence in us and remain committed to helping you meet your financial needs.
Sincerely,
Andrew Owen
President
Wells Fargo Funds
“Global stocks rallied in November, propelled by optimism over three promising COVID-19 vaccines.”
For further information about your Fund, contact your investment professional, visit our website at wfam.com, or call us directly at 1-800-260-5969.
4 | Wells Fargo VT Discovery Fund
This page is intentionally left blank.
Performance highlights (unaudited)
Investment objective
The Fund seeks long-term capital appreciation.
Manager
Wells Fargo Funds Management, LLC
Subadviser
Wells Capital Management Incorporated
Portfolio managers
Michael T. Smith, CFA®‡
Christopher J. Warner, CFA®‡
Average annual total returns (%) as of December 31, 2020
| | | | | | Expense ratios1 (%) |
| | Inception date | 1 year | 5 year | 10 year | Gross | Net 2 |
| Class 2 | 5-8-1992 | 62.65 | 23.91 | 17.25 | 1.17 | 1.16 |
| Russell 2500™ Growth Index3 | – | 40.47 | 18.68 | 15.00 | – | – |
Figures quoted represent past performance, which is no guarantee of future results. Investment return and principal value of an investment will fluctuate so that an investor’s shares, when redeemed, may be worth more or less than their original cost. Current performance may be lower or higher than the performance data quoted and assumes the reinvestment of dividends and capital gains. Current month-end performance is available by calling 1-800-260-5969. Performance figures of the Fund do not reflect fees and expenses charged pursuant to the terms of variable life insurance policies and variable annuity contracts. If these fees and expenses had been reflected, performance would have been lower.
Please keep in mind that high double-digit returns were primarily achieved during favorable market conditions. You should not expect that such favorable returns can be consistently achieved. A fund’s performance, especially for short time periods, should not be the sole factor in making your investment decision.
Shares are sold without a front-end sales charge or a contingent deferred sales charge.
Index returns do not include transaction costs associated with buying and selling securities, any mutual fund fees or expenses, or any taxes. It is not possible to invest directly in an index.
Stock values fluctuate in response to the activities of individual companies and general market and economic conditions. Smaller-company stocks tend to be more volatile and less liquid than those of larger companies. Certain investment strategies tend to increase the total risk of an investment (relative to the broader market). The Fund is exposed to foreign investment risk. Consult the Fund’s prospectus for additional information on these and other risks.
Please refer to the prospectus provided by your participating insurance company for detailed information describing the separate accounts for information regarding surrender charges, mortality and expense risk fees, and other charges that may be assessed by the participating insurance companies.
Please see footnotes on page 7.
6 | Wells Fargo VT Discovery Fund
Performance highlights (unaudited)
| Growth of $10,000 investment as of December 31, 20204 |

| ‡ | CFA® and Chartered Financial Analyst® are trademarks owned by CFA Institute. |
| 1 | Reflects the expense ratios as stated in the most recent prospectus, which include the impact of 0.01% in acquired fund fees and expenses. The expense ratios shown are subject to change and may differ from the annualized expense ratios shown in the financial highlights of this report, which do not include acquired fund fees and expenses. |
| 2 | The manager has contractually committed through April 30, 2021, to waive fees and/or reimburse expenses to the extent necessary to cap total annual fund operating expenses after fee waivers at 1.15% for Class 2. Brokerage commissions, stamp duty fees, interest, taxes, acquired fund fees and expenses (if any), and extraordinary expenses are excluded from the expense cap. Prior to or after the commitment expiration date, the cap may be increased or the commitment to maintain the cap may be terminated only with the approval of the Board of Trustees. Without this cap, the Fund’s returns would have been lower. The expense ratio paid by an investor is the net expense ratio (the total annual fund operating expenses after fee waivers) as stated in the prospectus. |
| 3 | The Russell 2500TM Growth Index measures the performance of those Russell 2500 companies with higher price/book ratios and higher forecasted growth values. You cannot invest directly in an index. |
| 4 | The chart compares the performance of the Class 2 shares for the most recent ten years with the Russell 2500TM Growth Index. The chart assumes a hypothetical $10,000 investment and reflects all operating expenses of the Fund but does not reflect fees and expenses charged pursuant to the terms of variable life insurance policies and variable annuity contracts. |
| 5 | Figures represent the percentage of the Fund's net assets. Holdings are subject to change and may have changed since the date specified. |
| 6 | Figures represent the percentage of the Fund's long-term investments. These amounts are subject to change and may have changed since the date specified. |
Wells Fargo VT Discovery Fund | 7
Performance highlights (unaudited)
MANAGER'S DISCUSSION
Fund highlights
| ■ | The Fund outperformed its benchmark, the Russell 2500TM Growth Index, for the 12-month period that ended December 31, 2020. |
| ■ | Stock selection in the health care and consumer discretionary sectors contributed to the Fund’s results. |
| ■ | Select holdings in the consumer staples sector hindered performance. |
A global pandemic triggered a massive policy response and remarkable health care innovations.
Over the past year, global economies shifted from long-toothed bull markets to rapid recessions, spurred by a global pandemic and shelter-at-home orders. Central banks and governments rallied quickly to prevent a possible depression by proposing massive stimulus packages. Within the United States, the Federal Reserve took extraordinary measures to provide liquidity. Optimism grew among equity investors as consumers reestablished confidence and progress was made toward therapeutic treatments for the coronavirus. As 2020 came to a close, markets rallied on the speed and efficacy of a COVID-19 vaccine and prospects of further reopening of the economy.
Despite the heightened volatility, we have not significantly repositioned the Fund. Our investment process has long focused on companies harnessing technology to create superior growth. The Fund remains positioned toward companies that we believe are on the right side of change. As a result, along with strong stock selection, our portfolios were well positioned for the market environment in 2020.
Stock selection in the health care and consumer discretionary sectors contributed to performance relative to the index.
IRhythm Technologies, Incorporated, was a standout health care performer. IRhythm is a medical device manufacturer that has developed a next-generation device for patients with heart irregularities. The company's monitor, called Zio, digitally monitors a patient's heart rate for 7 to 14 days and continuously reports data back to a doctor. The ease and long duration of use increase the likelihood that iRythm’s device identifies a heart issue before it causes problems for the patient. This innovation, superior to the current standard of care, the Holter monitor, is bringing new technology to the large addressable market of cardiology.
Within consumer discretionary, MercadoLibre, Incorporated, contributed to performance. MercadoLibre is the dominant Latin American e-commerce provider, where e-commerce penetration rates are accelerating but remain far below that of developed countries. The company also owns MercadoPago, a digital payment application that has been fueling strong growth and is now the leading online payment solution in Latin America. In addition to growth in the core e-commerce marketplace, we believe MercadoPago will significantly contribute to earnings going forward.
Stock selection within consumer staples detracted from relative performance.
Within consumer staples, shares of foodservice distributor US Foods Holding Corporation were negatively affected by the global pandemic. State and local governments initially closed and later restricted capacity at dine-in restaurants in an effort to mitigate the impact of the coronavirus. As a result, diminished demand from restaurants, hospitals, and hotels weighed on the shares for most of the year. Similarly, these restrictions hurt shares of Lamb Weston Holdings, Incorporated, a leading provider of frozen potatoes and appetizers to global fast-food and dine-in restaurants. As the effects of the pandemic resounded globally for much of the year, there was uncertainty as to when demand would return to pre-pandemic levels. As a result, we executed our sell discipline and exited both positions.
| Ten largest holdings (%) as of December 31, 20205 |
| MercadoLibre Incorporated | 3.01 |
| StoneCo Limited Class A | 2.67 |
| MongoDB Incorporated | 2.64 |
| Five9 Incorporated | 2.23 |
| Generac Holdings Incorporated | 2.16 |
| Align Technology Incorporated | 2.05 |
| Chipotle Mexican Grill Incorporated | 1.95 |
| Casella Waste Systems Incorporated Class A | 1.91 |
| Twilio Incorporated Class A | 1.89 |
| Black Knight Incorporated | 1.88 |
Please see footnotes on page 7.
8 | Wells Fargo VT Discovery Fund
Performance highlights (unaudited)
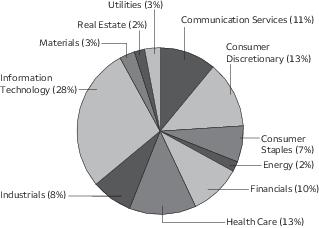
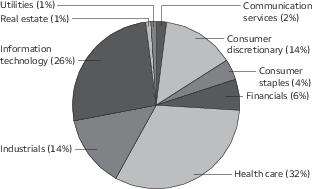
| Sector allocation as of December 31, 20206 |
While volatility remains high, companies on the right side of change provide resiliency.
2020 ended with enthusiasm for putting the coronavirus behind us, new rounds of economic stimulus, and improving macro conditions. In the short term, this sparked a rotation toward interest-rate-sensitive and cyclical assets. However, it does not alter our long-term view. We believe economic growth will remain slow as the structural forces of debt, demographics, and disruption are here to stay. We continue to emphasize companies on the right side of change. These are dynamic businesses positioned to take advantage of the massive shift around digital transformation. A massive amount of spending is moving online from offline. Growth themes, such as telemedicine, cloud software, digital payments, and e-commerce, will likely continue for the foreseeable future. We are long-term investors focused on opportunities well beyond 2020. As economic growth remains scarce, we expect stocks with superior fundamentals to be rewarded with premium valuations. While we anticipate volatility to persist in 2021, we remain confident that right-side-of-change companies will deliver superior results.
Please see footnotes on page 7.
Wells Fargo VT Discovery Fund | 9
Fund expenses (unaudited)
As a shareholder of the Fund, you incur ongoing costs, including management fees, distribution (12b-1) fees, and other Fund expenses. This example is intended to help you understand your ongoing costs (in dollars) of investing in the Fund and to compare these costs with the ongoing costs of investing in other mutual funds.
The example is based on an investment of $1,000 invested at the beginning of the six-month period and held for the entire period from July 1, 2020 to December 31, 2020.
Actual expenses
The “Actual” line of the table below provides information about actual account values and actual expenses. You may use the information in this line, together with the amount you invested, to estimate the expenses that you paid over the period. Simply divide your account value by $1,000 (for example, an $8,600 account value divided by $1,000 = 8.6), then multiply the result by the number in the “Actual” line under the heading entitled “Expenses paid during period” for your applicable class of shares to estimate the expenses you paid on your account during this period.
Hypothetical example for comparison purposes
The “Hypothetical” line of the table below provides information about hypothetical account values and hypothetical expenses based on the Fund’s actual expense ratio and an assumed rate of return of 5% per year before expenses, which is not the Fund’s actual return. The hypothetical account values and expenses may not be used to estimate the actual ending account balance or expenses you paid for the period. You may use this information to compare the ongoing costs of investing in the Fund and other funds. To do so, compare this 5% hypothetical example with the 5% hypothetical examples that appear in the shareholder reports of the other funds.
Please note that the expenses shown in the table are meant to highlight your ongoing costs only and do not reflect any separate account charges assessed by participating insurance companies. Therefore, the “Hypothetical” line of the table is useful in comparing ongoing costs only, and will not help you determine the relative total costs of owning different funds. In addition, if these separate account charges assessed by participating insurance companies were included, your costs would have been higher.
| | Beginning
account value
7-1-2020 | Ending
account value
12-31-2020 | Expenses
paid during
the period1 | Annualized net
expense ratio |
| Class 2 | | | | |
| Actual | $1,000.00 | $1,450.34 | $6.98 | 1.13% |
| Hypothetical (5% return before expenses) | $1,000.00 | $1,019.44 | $5.75 | 1.13% |
1 Expenses paid is equal to the annualized net expense ratio multiplied by the average account value over the period, multiplied by the number of days in the most recent fiscal half-year divided by the number of days in the fiscal year (to reflect the one-half-year period).
10 | Wells Fargo VT Discovery Fund
Portfolio of investments—December 31, 2020
| | | | | Shares | Value |
| Common stocks: 98.09% | | | | | |
| Communication services: 1.95% | | | | | |
| Media: 1.95% | | | | | |
| IAC/InterActiveCorp † | | | | 6,001 | 1,136,289 |
| Match Group Incorporated † | | | | 25,400 | 3,840,226 |
| | | | | | 4,976,515 |
| Consumer discretionary: 12.14% | | | | | |
| Diversified consumer services: 3.01% | | | | | |
| Bright Horizons Family Solutions Incorporated † | | | | 22,804 | 3,944,864 |
| Chegg Incorporated † | | | | 41,600 | 3,757,728 |
| | | | | | 7,702,592 |
| Hotels, restaurants & leisure: 3.06% | | | | | |
| Chipotle Mexican Grill Incorporated † | | | | 3,600 | 4,992,156 |
| Domino's Pizza Incorporated | | | | 7,394 | 2,835,303 |
| | | | | | 7,827,459 |
| Internet & direct marketing retail: 6.07% | | | | | |
| Chewy Incorporated Class A † | | | | 36,700 | 3,298,963 |
| Etsy Incorporated † | | | | 25,511 | 4,538,662 |
| MercadoLibre Incorporated † | | | | 4,603 | 7,711,038 |
| | | | | | 15,548,663 |
| Financials: 1.67% | | | | | |
| Consumer finance: 1.67% | | | | | |
| Foley Trasimene Acquisition Corporation † | | | | 174,900 | 2,640,990 |
| LendingTree Incorporated † | | | | 6,000 | 1,642,740 |
| | | | | | 4,283,730 |
| Health care: 33.43% | | | | | |
| Biotechnology: 9.24% | | | | | |
| Black Diamond Therapeutics Incorporated † | | | | 24,000 | 769,200 |
| CRISPR Therapeutics AG † | | | | 10,527 | 1,611,789 |
| Deciphera Pharmaceuticals Incorporated † | | | | 19,211 | 1,096,372 |
| Exact Sciences Corporation † | | | | 28,800 | 3,815,712 |
| Mirati Therapeutics Incorporated † | | | | 5,900 | 1,295,876 |
| Natera Incorporated † | | | | 34,423 | 3,425,777 |
| ORIC Pharmaceuticals Incorporated †« | | | | 31,140 | 1,054,089 |
| Sarepta Therapeutics Incorporated † | | | | 14,550 | 2,480,630 |
| Turning Point Therapeutics Incorporated † | | | | 18,537 | 2,258,733 |
| Twist Bioscience Corporation † | | | | 19,610 | 2,770,697 |
| Zai Lab Limited ADR † | | | | 17,812 | 2,410,676 |
| Zymeworks Incorporated † | | | | 14,200 | 671,092 |
| | | | | | 23,660,643 |
| Health care equipment & supplies: 11.37% | | | | | |
| ABIOMED Incorporated † | | | | 8,600 | 2,788,122 |
| Align Technology Incorporated † | | | | 9,800 | 5,236,924 |
| DexCom Incorporated † | | | | 5,700 | 2,107,404 |
| Haemonetics Corporation † | | | | 26,100 | 3,099,375 |
The accompanying notes are an integral part of these financial statements.
Wells Fargo VT Discovery Fund | 11
Portfolio of investments—December 31, 2020
| | | | | Shares | Value |
| Health care equipment & supplies (continued) | | | | | |
| Inari Medical Incorporated † | | | | 46,000 | $ 4,015,340 |
| Insulet Corporation † | | | | 12,699 | 3,246,245 |
| iRhythm Technologies Incorporated † | | | | 19,811 | 4,699,367 |
| Shockwave Medical Incorporated † | | | | 37,552 | 3,894,893 |
| | | | | | 29,087,670 |
| Health care providers & services: 7.73% | | | | | |
| Amedisys Incorporated † | | | | 12,754 | 3,741,131 |
| Chemed Corporation | | | | 9,000 | 4,793,490 |
| Guardant Health Incorporated † | | | | 29,000 | 3,737,520 |
| HealthEquity Incorporated † | | | | 37,383 | 2,605,969 |
| Molina Healthcare Incorporated † | | | | 13,500 | 2,871,180 |
| OAK Street Health Incorporated † | | | | 33,407 | 2,043,172 |
| | | | | | 19,792,462 |
| Health care technology: 1.64% | | | | | |
| Veeva Systems Incorporated Class A † | | | | 15,405 | 4,194,011 |
| Life sciences tools & services: 2.08% | | | | | |
| Berkeley Lights Incorporated † | | | | 23,028 | 2,058,933 |
| Bio-Rad Laboratories Incorporated Class A † | | | | 5,600 | 3,264,464 |
| | | | | | 5,323,397 |
| Pharmaceuticals: 1.37% | | | | | |
| Catalent Incorporated † | | | | 33,600 | 3,496,752 |
| Industrials: 14.61% | | | | | |
| Aerospace & defense: 3.48% | | | | | |
| HEICO Corporation | | | | 19,100 | 2,528,840 |
| Mercury Systems Incorporated † | | | | 40,400 | 3,557,624 |
| Teledyne Technologies Incorporated † | | | | 7,200 | 2,822,256 |
| | | | | | 8,908,720 |
| Building products: 1.48% | | | | | |
| Trex Company Incorporated † | | | | 45,200 | 3,784,144 |
| Commercial services & supplies: 3.50% | | | | | |
| Casella Waste Systems Incorporated Class A † | | | | 79,019 | 4,895,227 |
| IAA Incorporated † | | | | 59,000 | 3,833,820 |
| Tetra Tech Incorporated | | | | 1,981 | 229,360 |
| | | | | | 8,958,407 |
| Electrical equipment: 2.16% | | | | | |
| Generac Holdings Incorporated † | | | | 24,300 | 5,526,063 |
| Professional services: 1.30% | | | | | |
| Clarivate Analytics plc † | | | | 111,955 | 3,326,183 |
| Road & rail: 1.37% | | | | | |
| Saia Incorporated † | | | | 19,500 | 3,525,600 |
| Trading companies & distributors: 1.32% | | | | | |
| SiteOne Landscape Supply Incorporated † | | | | 21,261 | 3,372,632 |
The accompanying notes are an integral part of these financial statements.
12 | Wells Fargo VT Discovery Fund
Portfolio of investments—December 31, 2020
| | | | | Shares | Value |
| Information technology: 32.92% | | | | | |
| Electronic equipment, instruments & components: 0.98% | | | | | |
| Novanta Incorporated † | | | | 21,200 | $ 2,506,264 |
| IT services: 17.79% | | | | | |
| Black Knight Incorporated † | | | | 54,500 | 4,815,075 |
| Booz Allen Hamilton Holding Corporation | | | | 12,224 | 1,065,688 |
| EPAM Systems Incorporated † | | | | 10,719 | 3,841,154 |
| Euronet Worldwide Incorporated † | | | | 22,193 | 3,216,210 |
| Globant SA † | | | | 20,600 | 4,482,766 |
| MongoDB Incorporated † | | | | 18,800 | 6,749,952 |
| Square Incorporated Class A † | | | | 15,900 | 3,460,476 |
| StoneCo Limited Class A † | | | | 81,619 | 6,849,466 |
| Twilio Incorporated Class A † | | | | 14,298 | 4,839,873 |
| WEX Incorporated † | | | | 17,100 | 3,480,363 |
| WNS Holdings Limited ADR † | | | | 38,100 | 2,745,105 |
| | | | | | 45,546,128 |
| Semiconductors & semiconductor equipment: 4.16% | | | | | |
| Lattice Semiconductor Corporation † | | | | 79,476 | 3,641,590 |
| MKS Instruments Incorporated | | | | 27,300 | 4,107,285 |
| Universal Display Corporation | | | | 12,600 | 2,895,480 |
| | | | | | 10,644,355 |
| Software: 9.99% | | | | | |
| Avalara Incorporated † | | | | 26,800 | 4,419,052 |
| Bill.com Holdings Incorporated † | | | | 23,766 | 3,244,059 |
| Crowdstrike Holdings Incorporated Class A † | | | | 21,200 | 4,490,584 |
| Elastic NV † | | | | 31,000 | 4,530,030 |
| Five9 Incorporated † | | | | 32,718 | 5,706,019 |
| Unity Software Incorporated †« | | | | 20,723 | 3,180,359 |
| | | | | | 25,570,103 |
| Real estate: 1.37% | | | | | |
| Equity REITs: 1.37% | | | | | |
| QTS Realty Trust Incorporated Class A | | | | 56,700 | 3,508,596 |
| Total Common stocks (Cost $132,342,237) | | | | | 251,071,089 |
| | | Yield | | | |
| Short-term investments: 2.82% | | | | | |
| Investment companies: 2.82% | | | | | |
| Securities Lending Cash Investments LLC ♠∩∞ | | 0.16% | | 3,816,800 | 3,816,800 |
| Wells Fargo Government Money Market Fund Select Class ♠∞ | | 0.03 | | 3,400,578 | 3,400,578 |
| Total Short-term investments (Cost $7,217,378) | | | | | 7,217,378 |
| Total investments in securities (Cost $139,559,615) | 100.91% | | | | 258,288,467 |
| Other assets and liabilities, net | (0.91) | | | | (2,334,823) |
| Total net assets | 100.00% | | | | $ 255,953,644 |
| † | Non-income-earning security |
| « | All or a portion of this security is on loan. |
| ♠ | The issuer of the security is an affiliated person of the Fund as defined in the Investment Company Act of 1940. |
The accompanying notes are an integral part of these financial statements.
Wells Fargo VT Discovery Fund | 13
Portfolio of investments—December 31, 2020
| ∩ | The investment is a non-registered investment company purchased with cash collateral received from securities on loan. |
| ∞ | The rate represents the 7-day annualized yield at period end. |
| Abbreviations: |
| ADR | American depositary receipt |
| REIT | Real estate investment trust |
Investments in affiliates
An affiliated investment is an investment in which the Fund owns at least 5% of the outstanding voting shares of the issuer or as a result of other relationships, such as the Fund and the issuer having the same investment manager. Transactions with issuers that were either affiliated persons of the Fund at the beginning of the period or the end of the period were as follows:
| | Value,
beginning of
period | Purchases | Sales
proceeds | Net
realized
gains
(losses) | | Net
change in
unrealized
gains
(losses) | | Value,
end of
period | | % of
net
assets | Shares,
end
of period | Income
from
affiliated
securities |
| Short-term investments | | | | | | | | | | | | |
| Investment companies | | | | | | | | | | | | |
| Securities Lending Cash Investments LLC | $4,718,549 | $58,497,580 | $(59,399,385) | $275 | | $ (219) | | $ 3,816,800 | | | 3,816,800 | $ 20,198# |
| Wells Fargo Government Money Market Fund Select Class | 1,560,143 | 40,678,441 | (38,838,006) | 0 | | 0 | | 3,400,578 | | | 3,400,578 | 11,252 |
| | | | | $275 | | $(219) | | $7,217,378 | | 2.82% | | $31,450 |
| # | Amount shown represents income before fees and rebates. |
The accompanying notes are an integral part of these financial statements.
14 | Wells Fargo VT Discovery Fund
Statement of assets and liabilities—December 31, 2020
| | |
| Assets | |
Investments in unaffiliated securities (including $3,657,932 of securities loaned), at value (cost $132,342,237)
| $ 251,071,089 |
Investments in affiliated securites, at value (cost $7,217,378)
| 7,217,378 |
Receivable for investments sold
| 1,118,029 |
Receivable for Fund shares sold
| 732,129 |
Receivable for dividends
| 26,709 |
Receivable for securities lending income, net
| 2,050 |
Prepaid expenses and other assets
| 3,845 |
Total assets
| 260,171,229 |
| Liabilities | |
Payable upon receipt of securities loaned
| 3,816,800 |
Management fee payable
| 172,578 |
Payable for Fund shares redeemed
| 142,188 |
Distribution fee payable
| 57,526 |
Administration fee payable
| 18,408 |
Trustees’ fees and expenses payable
| 3,877 |
Accrued expenses and other liabilities
| 6,208 |
Total liabilities
| 4,217,585 |
Total net assets
| $255,953,644 |
| Net assets consist of | |
Paid-in capital
| $ 119,462,663 |
Total distributable earnings
| 136,490,981 |
Total net assets
| $255,953,644 |
| Computation of net asset value per share | |
Net assets – Class 2
| $ 255,953,644 |
Share outstanding – Class 21
| 5,253,003 |
Net asset value per share – Class 2
| $48.73 |
| 1 | The Fund has an unlimited number of authorized shares |
The accompanying notes are an integral part of these financial statements.
Wells Fargo VT Discovery Fund | 15
Statement of operations—year ended December 31, 2020
| | |
| Investment income | |
Dividends (net of foreign withholdings taxes of $2,768)
| $ 350,783 |
Securities lending income from affiliates, net
| 29,009 |
Income from affiliated securities
| 11,252 |
Total investment income
| 391,044 |
| Expenses | |
Management fee
| 1,418,034 |
Administration fee – Class 2
| 151,257 |
Distribution fee – Class 2
| 471,305 |
Custody and accounting fees
| 22,294 |
Professional fees
| 35,515 |
Shareholder report expenses
| 32,161 |
Trustees’ fees and expenses
| 19,862 |
Other fees and expenses
| 9,425 |
Total expenses
| 2,159,853 |
| Less: Fee waivers and/or expense reimbursements | |
Fund-level
| (4,327) |
Net expenses
| 2,155,526 |
Net investment loss
| (1,764,482) |
| Realized and unrealized gains (losses) on investments | |
| Net realized gains on | |
Unaffiliated securities
| 17,877,459 |
Affiliated securities
| 275 |
Net realized gains on investments
| 17,877,734 |
| Net change in unrealized gains (losses) on | |
Unaffiliated securities
| 82,373,246 |
Affiliated securities
| (219) |
Net change in unrealized gains (losses) on investments
| 82,373,027 |
Net realized and unrealized gains (losses) on investments
| 100,250,761 |
Net increase in net assets resulting from operations
| $ 98,486,279 |
The accompanying notes are an integral part of these financial statements.
16 | Wells Fargo VT Discovery Fund
Statement of changes in net assets
| | |
| | Year ended
December 31, 2020 | Year ended
December 31, 2019 |
| Operations | | | | |
Net investment loss
| | $ (1,764,482) | | $ (1,259,354) |
Net realized gains on investments
| | 17,877,734 | | 17,351,306 |
Net change in unrealized gains (losses) on investments
| | 82,373,027 | | 32,290,402 |
Net increase in net assets resulting from operations
| | 98,486,279 | | 48,382,354 |
| Distributions to shareholders from | | | | |
Net investment income and net realized gains – Class 2
| | (16,114,396) | | (17,124,790) |
| Capital share transactions | Shares | | Shares | |
Proceeds from shares sold – Class 2
| 674,102 | 24,912,455 | 988,344 | 32,962,615 |
Reinvestment of distributions – Class 2
| 468,578 | 16,114,396 | 517,835 | 17,124,790 |
Payment for shares redeemed – Class 2
| (1,018,571) | (35,934,160) | (1,190,533) | (38,661,758) |
Net increase in net assets resulting from capital share transactions
| | 5,092,691 | | 11,425,647 |
Total increase in net assets
| | 87,464,574 | | 42,683,211 |
| Net assets | | | | |
Beginning of period
| | 168,489,070 | | 125,805,859 |
End of period
| | $255,953,644 | | $168,489,070 |
The accompanying notes are an integral part of these financial statements.
Wells Fargo VT Discovery Fund | 17
Financial highlights
(For a share outstanding throughout each period)
| | Year ended December 31 |
| Class 2 | 2020 | 2019 | 2018 | 2017 | 2016 |
Net asset value, beginning of period
| $32.85 | $26.14 | $31.74 | $25.91 | $25.99 |
Net investment loss
| (0.34) | (0.25) | (0.17) | (0.20) | (0.13) |
Net realized and unrealized gains (losses) on investments
| 19.54 | 10.47 | (1.39) | 7.60 | 2.00 |
Total from investment operations
| 19.20 | 10.22 | (1.56) | 7.40 | 1.87 |
| Distributions to shareholders from | | | | | |
Net realized gains
| (3.32) | (3.51) | (4.04) | (1.57) | (1.95) |
Net asset value, end of period
| $48.73 | $32.85 | $26.14 | $31.74 | $25.91 |
Total return1
| 62.65% | 39.02% | (7.06)% | 29.13% | 7.65% |
| Ratios to average net assets (annualized) | | | | | |
Gross expenses
| 1.14% | 1.16% | 1.16% | 1.16% | 1.18% |
Net expenses
| 1.14% | 1.15% | 1.15% | 1.15% | 1.15% |
Net investment loss
| (0.93)% | (0.79)% | (0.55)% | (0.68)% | (0.52)% |
| Supplemental data | | | | | |
Portfolio turnover rate
| 47% | 71% | 60% | 75% | 85% |
Net assets, end of period (000s omitted)
| $255,954 | $168,489 | $125,806 | $145,175 | $119,919 |
| 1 | Performance figures of the Fund do not reflect fees and expenses charged pursuant to the terms of variable life insurance policies and variable annuity contracts. |
The accompanying notes are an integral part of these financial statements.
18 | Wells Fargo VT Discovery Fund
Notes to financial statements
1. ORGANIZATION
Wells Fargo Variable Trust (the “Trust”), a Delaware statutory trust organized on March 10, 1999, is an open-end management investment company registered under the Investment Company Act of 1940, as amended (the “1940 Act”). As an investment company, the Trust follows the accounting and reporting guidance in Financial Accounting Standards Board (“FASB”) Accounting Standards Codification Topic 946, Financial Services – Investment Companies. These financial statements report on the Wells Fargo VT Discovery Fund (the “Fund”) which is a diversified series of the Trust. The Trust offers shares of the Fund to separate accounts of various life insurance companies as funding vehicles for certain variable annuity contracts and variable life insurance policies.
2. SIGNIFICANT ACCOUNTING POLICIES
The following significant accounting policies, which are consistently followed in the preparation of the financial statements of the Fund, are in conformity with U.S. generally accepted accounting principles which require management to make estimates and assumptions that affect the reported amounts of assets and liabilities, disclosure of contingent assets and liabilities at the date of the financial statements, and the reported amounts of income and expenses during the reporting period. Actual results could differ from those estimates.
Securities valuation
All investments are valued each business day as of the close of regular trading on the New York Stock Exchange (generally 4 p.m. Eastern Time), although the Fund may deviate from this calculation time under unusual or unexpected circumstances.
Equity securities that are listed on a foreign or domestic exchange or market are valued at the official closing price or, if none, the last sales price. If no sale occurs on the principal exchange or market that day, a fair value price will be determined in accordance with the Fund’s Valuation Procedures.
Investments in registered open-end investment companies are valued at net asset value. Interests in non-registered investment companies that are redeemable at net asset value are fair valued normally at net asset value.
Investments which are not valued using any of the methods discussed above are valued at their fair value, as determined in good faith by the Board of Trustees of the Fund. The Board of Trustees has established a Valuation Committee comprised of the Trustees and has delegated to it the authority to take any actions regarding the valuation of portfolio securities that the Valuation Committee deems necessary or appropriate, including determining the fair value of portfolio securities, unless the determination has been delegated to the Wells Fargo Asset Management Pricing Committee at Wells Fargo Funds Management, LLC ("Funds Management"). The Board of Trustees retains the authority to make or ratify any valuation decisions or approve any changes to the Valuation Procedures as it deems appropriate. On a quarterly basis, the Board of Trustees receives reports on any valuation actions taken by the Valuation Committee or the Wells Fargo Asset Management Pricing Committee which may include items for ratification.
Foreign currency translation
The accounting records of the Fund are maintained in U.S. dollars. The values of other assets and liabilities denominated in foreign currencies are translated into U.S. dollars at rates provided by an independent foreign currency pricing source at a time each business day specified by the Wells Fargo Asset Management Pricing Committee. Purchases and sales of securities, and income and expenses are converted at the rate of exchange on the respective dates of such transactions. Net realized foreign exchange gains or losses arise from sales of foreign currencies, currency gains or losses realized between the trade and settlement dates on securities transactions, and the difference between the amounts of dividends, interest and foreign withholding taxes recorded and the U.S. dollar equivalent of the amounts actually paid or received. Net unrealized foreign exchange gains and losses arise from changes in the fair value of assets and liabilities other than investments in securities resulting from changes in exchange rates. The changes in net assets arising from changes in exchange rates of securities and the changes in net assets resulting from changes in market prices of securities are not separately presented. Such changes are included in net realized and unrealized gains or losses from investments.
Securities lending
The Fund may lend its securities from time to time in order to earn additional income in the form of fees or interest on securities received as collateral or the investment of any cash received as collateral. When securities are on loan, the Fund receives interest or dividends on those securities. Cash collateral received in connection with its securities lending transactions is invested in Securities Lending Cash Investments, LLC (the “Securities Lending Fund”). Investments in Securities Lending Fund
Wells Fargo VT Discovery Fund | 19
Notes to financial statements
are valued at the evaluated bid price provided by an independent pricing service. Income earned from investment in the Securities Lending Fund, if any, is included in securities lending income from affiliates (net of fees and rebates) on the Statement of Operations.
In a securities lending transaction, the net asset value of the Fund is affected by an increase or decrease in the value of the securities loaned and by an increase or decrease in the value of the instrument in which collateral is invested. The amount of securities lending activity undertaken by the Fund fluctuates from time to time. The Fund has the right under the lending agreement to recover the securities from the borrower on demand. In the event of default or bankruptcy by the borrower, the Fund may be prevented from recovering the loaned securities or gaining access to the collateral or may experience delays or costs in doing so. In such an event, the terms of the agreement allow the unaffiliated securities lending agent to use the collateral to purchase replacement securities on behalf of the Fund or pay the Fund the market value of the loaned securities. The Fund bears the risk of loss with respect to depreciation of its investment of the cash collateral.
Security transactions and income recognition
Securities transactions are recorded on a trade date basis. Realized gains or losses are recorded on the basis of identified cost.
Dividend income is recognized on the ex-dividend date. Dividend income is recorded net of foreign taxes withheld where recovery of such taxes is not assured.
Distributions to shareholders
Distributions to shareholders from net investment income and any net realized gains are recorded on the ex-dividend date and paid at least annually. Such distributions are determined in accordance with income tax regulations and may differ from U.S. generally accepted accounting principles. Dividend sources are estimated at the time of declaration. The tax character of distributions is determined as of the Fund’s fiscal year end. Therefore, a portion of the Fund’s distributions made prior to the Fund’s fiscal year end may be categorized as a tax return of capital at year end.
Federal and other taxes
The Fund intends to continue to qualify as a regulated investment company by distributing substantially all of its investment company taxable income and any net realized capital gains (after reduction for capital loss carryforwards) sufficient to relieve it from all, or substantially all, federal income taxes. Accordingly, no provision for federal income taxes was required.
The Fund’s income and federal excise tax returns and all financial records supporting those returns for the prior three fiscal years are subject to examination by the federal and Delaware revenue authorities. Management has analyzed the Fund’s tax positions taken on federal, state, and foreign tax returns for all open tax years and does not believe that there are any uncertain tax positions that require recognition of a tax liability.
As of December 31, 2020, the aggregate cost of all investments for federal income tax purposes was $139,740,313 and the unrealized gains (losses) consisted of:
| Gross unrealized gains | $118,698,991 |
| Gross unrealized losses | (150,837) |
| Net unrealized gains | $118,548,154 |
Reclassifications are made to the Fund’s capital accounts for permanent tax differences to reflect income and gains available for distribution (or available capital loss carryforwards) under federal income tax regulations. U.S. generally accepted accounting principles require that certain components of net assets be adjusted to reflect permanent differences between financial and tax reporting. These reclassifications have no effect on net assets or net asset values per share. The primary permanent difference causing such reclassification is due to net operating loss. At December 31, 2020, as a result of permanent book-to-tax differences, the following reclassification adjustments were made on the Statement of Assets and Liabilities:
| Paid-in capital | Total distributable
earnings |
| $(1,773,526) | $1,773,526 |
20 | Wells Fargo VT Discovery Fund
Notes to financial statements
3. FAIR VALUATION MEASUREMENTS
Fair value measurements of investments are determined within a framework that has established a fair value hierarchy based upon the various data inputs utilized in determining the value of the Fund’s investments. The three-level hierarchy gives the highest priority to unadjusted quoted prices in active markets for identical assets or liabilities (Level 1) and the lowest priority to unobservable inputs (Level 3). The Fund’s investments are classified within the fair value hierarchy based on the lowest level of input that is significant to the fair value measurement. The inputs are summarized into three broad levels as follows:
| ■ | Level 1 – quoted prices in active markets for identical securities |
| ■ | Level 2 – other significant observable inputs (including quoted prices for similar securities, interest rates, prepayment speeds, credit risk, etc.) |
| ■ | Level 3 – significant unobservable inputs (including the Fund’s own assumptions in determining the fair value of investments) |
The inputs or methodologies used for valuing investments in securities are not necessarily an indication of the risk associated with investing in those securities.
The following is a summary of the inputs used in valuing the Fund’s assets and liabilities as of December 31, 2020:
| | Quoted prices
(Level 1) | Other significant
observable inputs
(Level 2) | Significant
unobservable inputs
(Level 3) | Total |
| Assets | | | | |
| Investments in: | | | | |
| Common stocks | | | | |
| Communication services | $ 4,976,515 | $0 | $0 | $ 4,976,515 |
| Consumer discretionary | 31,078,714 | 0 | 0 | 31,078,714 |
| Financials | 4,283,730 | 0 | 0 | 4,283,730 |
| Health care | 85,554,935 | 0 | 0 | 85,554,935 |
| Industrials | 37,401,749 | 0 | 0 | 37,401,749 |
| Information technology | 84,266,850 | 0 | 0 | 84,266,850 |
| Real estate | 3,508,596 | 0 | 0 | 3,508,596 |
| Short-term investments | | | | |
| Investment companies | 7,217,378 | 0 | 0 | 7,217,378 |
| Total assets | $258,288,467 | $0 | $0 | $258,288,467 |
Additional sector, industry or geographic detail is included in the Portfolio of Investments.
For the year ended December 31, 2020, the Fund did not have any transfers into/out of Level 3.
4. TRANSACTIONS WITH AFFILIATES
Management fee
Funds Management, an indirect wholly owned subsidiary of Wells Fargo & Company (“Wells Fargo”), is the manager of the Fund and provides advisory and fund-level administrative services under an investment management agreement. Under the investment management agreement, Funds Management is responsible for, among other services, implementing the investment objectives and strategies of the Fund, supervising the subadviser and providing fund-level administrative services in connection with the Fund’s operations. As compensation for its services under the investment management agreement, Funds Management is entitled to receive a management fee at the following annual rate based on the Fund’s average daily net assets:
Wells Fargo VT Discovery Fund | 21
Notes to financial statements
| Average daily net assets | Management fee |
| First $500 million | 0.750% |
| Next $500 million | 0.700 |
| Next $1 billion | 0.650 |
| Next $2 billion | 0.625 |
| Next $1 billion | 0.600 |
| Next $5 billion | 0.590 |
| Over $10 billion | 0.580 |
For the year ended December 31, 2020, the management fee was equivalent to an annual rate of 0.75% of the Fund’s average daily net assets.
Funds Management has retained the services of a subadviser to provide daily portfolio management to the Fund. The fee for subadvisory services is borne by Funds Management. Wells Capital Management Incorporated ("WellsCap"), an affiliate of Funds Management and an indirect wholly owned subsidiary of Wells Fargo, is the subadviser to the Fund and is entitled to receive a fee from Funds Management at an annual rate starting at 0.45% and declining to 0.35% as the average daily net assets of the Fund increase.
Administration fee
Under a class-level administration agreement, Funds Management provides class-level administrative services to the Fund, which includes paying fees and expenses for services provided by the transfer agent, sub-transfer agents, omnibus account servicers and record-keepers. As compensation for its services under the class-level administration agreement, Funds Management receives an annual fee of 0.08% which is calculated based on the average daily net assets of Class 2 shares.
Waivers and/or expense reimbursements
Funds Management has contractually waived and/or reimbursed management and administration fees to the extent necessary to maintain certain net operating expense ratios for the Fund. Funds Management has committed through April 30, 2021 to waive fees and/ or reimburse expenses to the extent necessary to cap the Fund’s expenses at 1.15% for Class 2 shares. Prior to or after the commitment expiration date, the cap may be increased or the commitment to maintain the cap may be terminated only with the approval of the Board of Trustees.
Distribution fee
The Trust has adopted a distribution plan for Class 2 shares of the Fund pursuant to Rule 12b-1 under the 1940 Act. A distribution fee is charged to Class 2 shares and paid to Wells Fargo Funds Distributor, LLC, the principal underwriter, at an annual rate of 0.25% of the average daily net assets of Class 2 shares.
Interfund transactions
The Fund may purchase or sell portfolio investment securities to certain other Wells Fargo affiliates pursuant to Rule 17a-7 under the 1940 Act and under procedures adopted by the Board of Trustees. The procedures have been designed to ensure that these interfund transactions, which do not incur broker commissions, are effected at current market prices.
5. INVESTMENT PORTFOLIO TRANSACTIONS
Purchases and sales of investments, excluding U.S. government obligations (if any) and short-term securities, for the year ended December 31, 2020 were $88,075,467 and $104,539,694, respectively.
6. SECURITIES LENDING TRANSACTIONS
The Fund lends its securities through an unaffiliated securities lending agent and receives collateral in the form of cash or securities with a value at least equal to the value of the securities on loan. The value of the loaned securities is determined at the close of each business day and any increases or decreases in the required collateral are exchanged between the Fund and the counterparty on the next business day. Cash collateral received is invested in the Securities Lending Fund which seeks to provide a positive return compared to the daily Federal Funds Open Rate by investing in high-quality, U.S. dollar-denominated short-term money market instruments and is exempt from registration under Section 3(c)(7) of the 1940 Act. Securities Lending Fund is managed by Funds Management and is subadvised by WellsCap. Funds Management receives an advisory fee starting at 0.05% and declining to 0.01% as the average daily net assets of the Securities Lending Fund increase. All of the fees received by Funds Management are paid to WellsCap for its services as subadviser.
22 | Wells Fargo VT Discovery Fund
Notes to financial statements
In the event of counterparty default or the failure of a borrower to return a loaned security, the Fund has the right to use the collateral to offset any losses incurred. As of December 31, 2020, the Fund had securities lending transactions with the following counterparties which are subject to offset:
| Counterparty | Value of
securities on
loan | Collateral
received1 | Net amount |
| Barclays Capital Inc. | $3,008,012 | $(3,008,012) | $0 |
| Bank of America Securities Inc. | 649,920 | (649,920) | $0 |
1 Collateral received within this table is limited to the collateral for the net transaction with the counterparty.
7. BANK BORROWINGS
The Trust, Wells Fargo Master Trust and Wells Fargo Funds Trust (excluding the money market funds) are parties to a $350,000,000 revolving credit agreement whereby the Fund is permitted to use bank borrowings for temporary or emergency purposes, such as to fund shareholder redemption requests. Interest under the credit agreement is charged to the Fund based on a borrowing rate equal to the higher of the Federal Funds rate in effect on that day plus 1.25% or the overnight LIBOR rate in effect on that day plus 1.25%. In addition, an annual commitment fee equal to 0.25% of the unused balance is allocated to each participating fund.
For the year ended December 31, 2020, there were no borrowings by the Fund under the agreement.
8. DISTRIBUTIONS TO SHAREHOLDERS
The tax character of distributions paid during the years ended December 31, 2020 and December 31, 2019 were as follows:
| | Year ended December 31 |
| | 2020 | 2019 |
| Ordinary income | $ 688,096 | $ 2,914,486 |
| Long-term capital gain | 15,426,300 | 14,210,304 |
As of December 31, 2020, the components of distributable earnings on a tax basis were as follows:
Undistributed
long-term
gain | Unrealized
gains |
| $17,942,827 | $118,548,154 |
9. CONCENTRATION RISKS
Concentration risks result from exposure to a limited number of sectors. As of the end of the period, the Fund concentrated its portfolio in investments related to the health care and information technology sectors. A fund that invests a substantial portion of its assets in any sector may be more affected by changes in that sector than would be a fund whose investments are not heavily weighted in any sector.
10. INDEMNIFICATION
Under the Fund's organizational documents, the officers and Trustees have been granted certain indemnification rights against certain liabilities that may arise out of performance of their duties to the Fund. The Fund has entered into a separate agreement with each Trustee that converts indemnification rights currently existing under the Fund’s organizational documents into contractual rights that cannot be changed in the future without the consent of the Trustee. Additionally, in the normal course of business, the Fund may enter into contracts with service providers that contain a variety of indemnification clauses. The Fund’s maximum exposure under these arrangements is dependent on future claims that may be made against the Fund and, therefore, cannot be estimated.
Wells Fargo VT Discovery Fund | 23
Notes to financial statements
11. NEW ACCOUNTING PRONOUNCEMENT
In August 2018, FASB issued Accounting Standards Update (“ASU”) No. 2018-13, Fair Value Measurement (Topic 820) Disclosure Framework - Changes to the Disclosure Requirements for Fair Value Measurement. ASU 2018-13 updates the disclosure requirements on fair value measurements in Topic 820, Fair Value Measurements. The amendments are effective for fiscal years, and interim periods within those fiscal years, beginning after December 15, 2019. Management has adopted this guidance which did not have a material impact on the financial statements.
12. SUBSEQUENT EVENT
On February 23, 2021, Wells Fargo announced that it has entered into a definitive agreement to sell Wells Fargo Asset Management (“WFAM”) to GTCR LLC and Reverence Capital Partners, L.P. WFAM is the trade name used by the asset management businesses of Wells Fargo and includes Wells Fargo Funds Management, LLC, the investment manager to the Fund, Wells Capital Management Incorporated and Wells Fargo Asset Management (International) Limited, both registered investment advisers providing sub-advisory services to certain funds, and Wells Fargo Funds Distributor, LLC, the Fund’s principal underwriter. As part of the transaction, Wells Fargo will own a 9.9% equity interest and will continue to serve as an important client and distribution partner.
Consummation of the transaction will result in the automatic termination of the Fund’s investment management agreement and sub-advisory agreement(s). The Fund’s Board of Trustees will be asked to approve new investment management arrangements with the new company. If approved by the Board, the new investment management arrangements with the new company will be presented to the shareholders of the Fund for approval, and, if approved by shareholders, would take effect upon the closing of the transaction. The transaction is expected to close in the second half of 2021, subject to customary closing conditions.
13. CORONAVIRUS (COVID-19) PANDEMIC
On March 11, 2020, the World Health Organization announced that it had made the assessment that coronavirus disease 2019 (“COVID-19”) is a pandemic. The impacts of COVID-19 are affecting the entire global economy, individual companies and investment products, and the market in general. There is significant uncertainty around the extent and duration of business disruptions related to COVID-19 and the impacts may be short term or may last for an extended period of time. The risk of further spreading of COVID-19 has led to significant uncertainty and volatility in the financial markets.
24 | Wells Fargo VT Discovery Fund
Report of independent registered public accounting firm
To the Shareholders of the Fund and Board of Trustees
Wells Fargo Variable Trust:
Opinion on the Financial Statements
We have audited the accompanying statement of assets and liabilities of Wells Fargo VT Discovery Fund (the Fund), one of the funds constituting Wells Fargo Variable Trust, including the portfolio of investments, as of December 31, 2020, the related statement of operations for the year then ended, the statements of changes in net assets for each of the years in the two-year period then ended, and the related notes (collectively, the financial statements) and the financial highlights for each of the years in the five-year period then ended. In our opinion, the financial statements and financial highlights present fairly, in all material respects, the financial position of the Fund as of December 31, 2020, the results of its operations for the year then ended, the changes in its net assets for each of the years in the two-year period then ended, and the financial highlights for each of the years in the five-year period then ended, in conformity with U.S. generally accepted accounting principles.
Basis for Opinion
These financial statements and financial highlights are the responsibility of the Fund’s management. Our responsibility is to express an opinion on these financial statements and financial highlights based on our audits. We are a public accounting firm registered with the Public Company Accounting Oversight Board (United States) (PCAOB) and are required to be independent with respect to the Fund in accordance with the U.S. federal securities laws and the applicable rules and regulations of the Securities and Exchange Commission and the PCAOB.
We conducted our audits in accordance with the standards of the PCAOB. Those standards require that we plan and perform the audit to obtain reasonable assurance about whether the financial statements and financial highlights are free of material misstatement, whether due to error or fraud. Our audits included performing procedures to assess the risks of material misstatement of the financial statements and financial highlights, whether due to error or fraud, and performing procedures that respond to those risks. Such procedures included examining, on a test basis, evidence regarding the amounts and disclosures in the financial statements and financial highlights. Such procedures also included confirmation of securities owned as of December 31, 2020, by correspondence with the custodian and transfer agent. Our audits also included evaluating the accounting principles used and significant estimates made by management, as well as evaluating the overall presentation of the financial statements and financial highlights. We believe that our audits provide a reasonable basis for our opinion.

We have not been able to determine the specific year that we began serving as the auditor of one or more Wells Fargo Funds investment companies; however we are aware that we have served as the auditor of one or more Wells Fargo Funds investment companies since at least 1955.
Boston, Massachusetts
February 25, 2021
Wells Fargo VT Discovery Fund | 25
Other information (unaudited)
TAX INFORMATION
For corporate shareholders, pursuant to Section 854 of the Internal Revenue Code, 52.78% of ordinary income dividends qualify for the corporate dividends-received deduction for the fiscal year ended December 31, 2020.
Pursuant to Section 852 of the Internal Revenue Code, $15,426,300 was designated as a 20% rate gain distribution for the fiscal year ended December 31, 2020
For the fiscal year ended December 31, 2020, $688,096 has been designated as short-term capital gain dividends for nonresident alien shareholders pursuant to Section 871 of the Internal Revenue Code.
PROXY VOTING INFORMATION
A description of the policies and procedures used to determine how to vote proxies relating to portfolio securities is available without charge, upon request, by calling 1-800-260-5969, visiting our website at wfam.com, or visiting the SEC website at sec.gov. Information regarding how the proxies related to portfolio securities were voted during the most recent 12-month period ended June 30 is available on the website at wfam.com or by visiting the SEC website at sec.gov.
QUARTERLY PORTFOLIO HOLDINGS INFORMATION
The Fund files its complete schedule of portfolio holdings with the SEC for the first and third quarters of each fiscal year as an exhibit to its reports on Form N-PORT. Shareholders may view the filed Form N-PORT by visiting the SEC website at sec.gov.
26 | Wells Fargo VT Discovery Fund
Other information (unaudited)
BOARD OF TRUSTEES AND OFFICERS
Each of the Trustees and Officers1 listed in the table below acts in identical capacities for each fund in the Wells Fargo family of funds, which consists of 144 mutual funds comprising the Wells Fargo Funds Trust, Wells Fargo Variable Trust, Wells Fargo Master Trust and four closed-end funds (collectively the “Fund Complex”). This table should be read in conjunction with the Prospectus and the Statement of Additional Information2. The mailing address of each Trustee and Officer is 525 Market Street, 12th Floor, San Francisco, CA 94105. Each Trustee and Officer serves an indefinite term, however, each Trustee serves such term until reaching the mandatory retirement age established by the Trustees.
Independent Trustees
Name and
year of birth | Position held and
length of service* | Principal occupations during past five years or longer | Current other
public company or
investment
company
directorships |
William R. Ebsworth
(Born 1957) | Trustee,
since 2015 | Retired. From 1984 to 2013, equities analyst, portfolio manager, research director and chief investment officer at Fidelity Management and Research Company in Boston, Tokyo, and Hong Kong, and retired in 2013 as Chief Investment Officer of Fidelity Strategic Advisers, Inc. where he led a team of investment professionals managing client assets. Prior thereto, Board member of Hong Kong Securities Clearing Co., Hong Kong Options Clearing Corp., the Thailand International Fund, Ltd., Fidelity Investments Life Insurance Company, and Empire Fidelity Investments Life Insurance Company. Audit Committee Chair and Investment Committee Chair of the Vincent Memorial Hospital Endowment (non-profit organization). Mr. Ebsworth is a CFA® charterholder. | N/A |
Jane A. Freeman
(Born 1953) | Trustee,
since 2015;
Chair Liaison,
since 2018 | Retired. From 2012 to 2014 and 1999 to 2008, Chief Financial Officer of Scientific Learning Corporation. From 2008 to 2012, Ms. Freeman provided consulting services related to strategic business projects. Prior to 1999, Portfolio Manager at Rockefeller & Co. and Scudder, Stevens & Clark. Board member of the Harding Loevner Funds from 1996 to 2014, serving as both Lead Independent Director and chair of the Audit Committee. Board member of the Russell Exchange Traded Funds Trust from 2011 to 2012 and the chair of the Audit Committee. Ms. Freeman is also an inactive Chartered Financial Analyst. | N/A |
Isaiah Harris, Jr.
(Born 1952) | Trustee,
since 2009; Audit
Committee
Chair,
since 2019 | Retired. Chairman of the Board of CIGNA Corporation since 2009, and Director since 2005. From 2003 to 2011, Director of Deluxe Corporation. Prior thereto, President and CEO of BellSouth Advertising and Publishing Corp. from 2005 to 2007, President and CEO of BellSouth Enterprises from 2004 to 2005 and President of BellSouth Consumer Services from 2000 to 2003. Emeritus member of the Iowa State University Foundation Board of Governors. Emeritus Member of the Advisory Board of Iowa State University School of Business. Advisory Board Member, Palm Harbor Academy (private school). Mr. Harris is a certified public accountant (inactive status). | CIGNA Corporation |
Judith M. Johnson
(Born 1949) | Trustee,
since 2008 | Retired. Prior thereto, Chief Executive Officer and Chief Investment Officer of Minneapolis Employees Retirement Fund from 1996 to 2008. Ms. Johnson is an attorney, certified public accountant and a certified managerial accountant. | N/A |
David F. Larcker
(Born 1950) | Trustee,
since 2009 | James Irvin Miller Professor of Accounting at the Graduate School of Business (Emeritus), Stanford University, Director of the Corporate Governance Research Initiative and Senior Faculty of The Rock Center for Corporate Governance since 2006. From 2005 to 2008, Professor of Accounting at the Graduate School of Business, Stanford University. Prior thereto, Ernst & Young Professor of Accounting at The Wharton School, University of Pennsylvania from 1985 to 2005. | N/A |
Wells Fargo VT Discovery Fund | 27
Other information (unaudited)
Name and
year of birth | Position held and
length of service* | Principal occupations during past five years or longer | Current other
public company or
investment
company
directorships |
Olivia S. Mitchell
(Born 1953) | Trustee,
since 2006;
Nominating and
Governance
Committee Chair,
since 2018 | International Foundation of Employee Benefit Plans Professor, Wharton School of the University of Pennsylvania since 1993. Director of Wharton’s Pension Research Council and Boettner Center on Pensions & Retirement Research, and Research Associate at the National Bureau of Economic Research. Previously, Cornell University Professor from 1978 to 1993. | N/A |
Timothy J. Penny
(Born 1951) | Trustee,
since 1996;
Chair,
since 2018 | President and Chief Executive Officer of Southern Minnesota Initiative Foundation, a non-profit organization, since 2007. Member of the Board of Trustees of NorthStar Education Finance, Inc., a non-profit organization, since 2007. | N/A |
James G. Polisson
(Born 1959) | Trustee,
since 2018 | Retired. Chief Marketing Officer, Source (ETF) UK Services, Ltd, from 2015 to 2017. From 2012 to 2015, Principal of The Polisson Group, LLC, a management consulting, corporate advisory and principal investing company. Chief Executive Officer and Managing Director at Russell Investments, Global Exchange Traded Funds from 2010 to 2012. Managing Director of Barclays Global Investors from 1998 to 2010 and Global Chief Marketing Officer for iShares and Barclays Global Investors from 2000 to 2010. Trustee of the San Francisco Mechanics’ Institute, a non-profit organization, from 2013 to 2015. Board member of the Russell Exchange Traded Fund Trust from 2011 to 2012. Director of Barclays Global Investors Holdings Deutschland GmbH from 2006 to 2009. Mr. Polisson is an attorney and has a retired status with the Massachusetts and District of Columbia Bar Associations. | N/A |
Pamela Wheelock
(Born 1959) | Trustee,
since January
2020; previously
Trustee from
January 2018 to
July 2019 | Board member of the Destination Medical Center Economic Development Agency, Rochester, Minnesota since 2019. Interim President of the McKnight Foundation from January to September 2020. Acting Commissioner, Minnesota Department of Human Services, July 2019 through September 2019. Human Services Manager (part-time), Minnesota Department of Human Services, October 2019 through December 2019. Chief Operating Officer, Twin Cities Habitat for Humanity from 2017 to 2019. Vice President of University Services, University of Minnesota from 2012 to 2016. Prior thereto, on the Board of Directors, Governance Committee and Finance Committee for the Minnesota Philanthropy Partners (Saint Paul Foundation) from 2012 to 2018, Interim Chief Executive Officer of Blue Cross Blue Shield of Minnesota from 2011 to 2012, Chairman of the Board from 2009 to 2012 and Board Director from 2003 to 2015. Vice President, Leadership and Community Engagement, Bush Foundation, Saint Paul, Minnesota (a private foundation) from 2009 to 2011. Executive Vice President and Chief Financial Officer, Minnesota Sports and Entertainment from 2004 to 2009 and Senior Vice President from 2002 to 2004. Executive Vice President of the Minnesota Wild Foundation from 2004 to 2008. Commissioner of Finance, State of Minnesota, from 1999 to 2002. Currently Board Chair of the Minnesota Wild Foundation since 2010. | N/A |
* Length of service dates reflect the Trustee’s commencement of service with the Trust’s predecessor entities, where applicable.
28 | Wells Fargo VT Discovery Fund
Other information (unaudited)
Officers
Name and
year of birth | Position held and
length of service | Principal occupations during past five years or longer |
Andrew Owen
(Born 1960) | President,
since 2017 | Executive Vice President of Wells Fargo & Company and Head of Affiliated Managers, Wells Fargo Asset Management, since 2014. In addition, Mr. Owen is currently President, Chief Executive Officer and Director of Wells Fargo Funds Management, LLC since 2017. Prior thereto, Executive Vice President responsible for marketing, investments and product development for Wells Fargo Funds Management, LLC, from 2009 to 2014. |
Jeremy DePalma1
(Born 1974) | Treasurer,
since 2012 | Senior Vice President of Wells Fargo Funds Management, LLC since 2009. Senior Vice President of Evergreen Investment Management Company, LLC from 2008 to 2010 and head of the Fund Reporting and Control Team within Fund Administration from 2005 to 2010. |
Michelle Rhee
(Born 1966) | Chief Legal Officer,
since 2019 | Secretary of Wells Fargo Funds Management, LLC and Chief Legal Counsel of Wells Fargo Asset Management since 2018. Deputy General Counsel of Wells Fargo Bank, N.A. since 2020 and Assistant General Counsel of Wells Fargo Bank, N.A. from 2018 to 2020. Associate General Counsel and Managing Director of Bank of America Corporation from 2004 to 2018. |
Catherine Kennedy
(Born 1969) | Secretary,
since 2019 | Vice President of Wells Fargo Funds Management, LLC and Senior Counsel of the Wells Fargo Legal Department since 2010. Vice President and Senior Counsel of Evergreen Investment Management Company, LLC from 1998 to 2010. |
Michael H. Whitaker
(Born 1967) | Chief Compliance Officer,
since 2016 | Chief Compliance Officer of Wells Fargo Asset Management since 2016. Senior Vice President and Chief Compliance Officer for Fidelity Investments from 2007 to 2016. |
1 Jeremy DePalma acts as Treasurer of 77 funds in the Fund Complex.
2 The Statement of Additional Information includes additional information about the Trustees and is available, without charge, upon request, by calling 1-800-260-5969 or by visiting the website at wfam.com.
Wells Fargo VT Discovery Fund | 29
For more information
More information about Wells Fargo Funds is available free upon request. To obtain literature, please write, visit the Fund's website, or call:
Wells Fargo Funds
P.O. Box 219967
Kansas City, MO 64121-9967
Website: wfam.com
Individual investors: 1-800-222-8222
Retail investment professionals: 1-888-877-9275
Institutional investment professionals: 1-866-765-0778
This report and the financial statements contained herein are submitted for the general information of the shareholders of the Fund. If this report is used for promotional purposes, distribution of the report must be accompanied or preceded by a current prospectus. Before investing, please consider the investment objectives, risks, charges, and expenses of the investment. For a current prospectus and, if available, a summary prospectus, containing this information, call 1-800-260-5969 or visit the Fund’s website at wfam.com. Read the prospectus carefully before you invest or send money.
Wells Fargo Asset Management (WFAM) is the trade name for certain investment advisory/management firms owned by Wells Fargo & Company. These firms include but are not limited to Wells Capital Management Incorporated and Wells Fargo Funds Management, LLC. Certain products managed by WFAM entities are distributed by Wells Fargo Funds Distributor, LLC (a broker-dealer and Member FINRA).
This material is for general informational and educational purposes only and is NOT intended to provide investment advice or a recommendation of any kind— including a recommendation for any specific investment, strategy, or plan.
INVESTMENT PRODUCTS: NOT FDIC INSURED ■ NO BANK GUARANTEE ■ MAY LOSE VALUE
© 2021 Wells Fargo & Company. All rights reserved.
PAR-0121-00261 02-21
AVT1/AR147 12-20
Annual Report
December 31, 2020
Wells Fargo
VT Index Asset Allocation Fund
Reduce clutter.
Save trees.
Sign up for electronic delivery of prospectuses and shareholder reports at wellsfargo.com/ advantagedelivery
The views expressed and any forward-looking statements are as of December 31, 2020, unless otherwise noted, and are those of the Fund's portfolio managers and/or Wells Fargo Asset Management. Discussions of individual securities or the markets generally are not intended as individual recommendations. Future events or results may vary significantly from those expressed in any forward-looking statements. The views expressed are subject to change at any time in response to changing circumstances in the market. Wells Fargo Asset Management and the Fund disclaim any obligation to publicly update or revise any views expressed or forward-looking statements.
INVESTMENT PRODUCTS: NOT FDIC INSURED ■ NO BANK GUARANTEE ■ MAY LOSE VALUE
Wells Fargo VT Index Asset Allocation Fund | 1
Letter to shareholders (unaudited)
Dear Shareholder:
We are pleased to offer you this annual report for the Wells Fargo VT Index Asset Allocation Fund for the 12-month period that ended December 31, 2020. Despite a deeply challenging year, dominated by the spread of COVID-19 cases and a sharp drop in economic output throughout much of the world, global stocks fared well overall, benefiting from strong central bank support. Bonds generally had modestly positive returns, providing some measure of diversification during turbulent market stretches.
For the 12-month period, equities had solid returns, more than making up for intense volatility in March. Non-U.S. developed market equities had weaker performance than emerging market and U.S. stocks. While gains from fixed-income securities were positive, they were more modest than equities. For the period, U.S. stocks, based on the S&P 500 Index1, gained 18.40%. International stocks, as measured by the MSCI ACWI ex USA Index (Net)2, returned 10.65%, while the MSCI EM Index (Net)3 had stronger performance, with a 18.31% gain. Among bond indexes, the Bloomberg Barclays U.S. Aggregate Bond Index4 returned 7.51%, the Bloomberg Barclays Global Aggregate ex-USD Index (unhedged)5 gained 10.11%, and the Bloomberg Barclays Municipal Bond Index6 returned 5.21% while the ICE BofA U.S. High Yield Index7 returned 6.17%.
The mood changed soon after the year began.
A year-end 2019 rally continued in early January 2020. However, market volatility spiked in late January on concerns over the potential impact of COVID-19 on the global economy and stock markets. With sentiment somewhat souring, perceived safe havens did well in January. The U.S. dollar and Japanese yen both rose, and government bonds outperformed equities. While the S&P 500 Index held its ground, emerging market equities tumbled.
Fears over the spread of COVID-19 and its impact on global growth led to a sharp downturn by late February. Oil prices tumbled as Russia and the Organization of the Petroleum Exporting Countries compounded a major decline in oil demand with a brutal price war, causing the price of crude oil to plummet.
Andrew Owen
President
Wells Fargo Funds
“Non-U.S. developed market equities had weaker performance than emerging market and U.S. stocks”
| 1 | The S&P 500 Index consists of 500 stocks chosen for market size, liquidity, and industry group representation. It is a market-value-weighted index with each stock's weight in the index proportionate to its market value. You cannot invest directly in an index. |
| 2 | The Morgan Stanley Capital International (MSCI) All Country World Index (ACWI) ex USA Index (Net) is a free-float-adjusted market-capitalization-weighted index that is designed to measure the equity market performance of developed and emerging markets, excluding the United States. Source: MSCI. MSCI makes no express or implied warranties or representations and shall have no liability whatsoever with respect to any MSCI data contained herein. The MSCI data may not be further redistributed or used as a basis for other indices or any securities or financial products. This report is not approved, reviewed, or produced by MSCI. You cannot invest directly in an index. |
| 3 | The MSCI Emerging Markets (EM) Index (Net) is a free-float-adjusted market-capitalization-weighted index that is designed to measure equity market performance of emerging markets. You cannot invest directly in an index. |
| 4 | The Bloomberg Barclays U.S. Aggregate Bond Index is a broad-based benchmark that measures the investment-grade, U.S. dollar-denominated, fixed-rate taxable bond market, including Treasuries, government-related and corporate securities, mortgage-backed securities (agency fixed-rate and hybrid adjustable-rate mortgage pass-throughs), asset-backed securities, and commercial mortgage-backed securities. You cannot invest directly in an index. |
| 5 | The Bloomberg Barclays Global Aggregate ex-USD Index (unhedged) is an unmanaged index that provides a broad-based measure of the global investment-grade fixed-income markets excluding the U.S. dollar-denominated debt market. You cannot invest directly in an index. |
| 6 | The Bloomberg Barclays Municipal Bond Index is an unmanaged index composed of long-term tax-exempt bonds with a minimum credit rating of Baa. You cannot invest directly in an index. |
| 7 | The ICE BofA U.S. High Yield Index is a market-capitalization-weighted index of domestic and Yankee high-yield bonds. The index tracks the performance of high-yield securities traded in the U.S. bond market. You cannot invest directly in an index. Copyright 2021. ICE Data Indices, LLC. All rights reserved. |
2 | Wells Fargo VT Index Asset Allocation Fund
Letter to shareholders (unaudited)
The global spread of COVID-19 led country after country to clamp down on social- and business-related activity in order to contain the virus. This sent economies into a deep contraction. Central banks responded by slashing interest rates and expanding quantitative easing programs to restore liquidity and market confidence. The U.S. Federal Reserve (Fed) launched several lending programs, funding investment-grade bonds, money market mutual funds, and commercial paper while purchasing Treasuries, mortgage-backed securities, and overnight repurchase agreements. Meanwhile, stock markets tumbled, ending the longest bull stock market in U.S. history.
Markets rebounded strongly through the spring, fueled by unprecedented government and central bank stimulus measures in the U.S. and globally. The U.S. economy contracted by an annualized 5.0% pace in the first quarter, with 30 million new unemployment insurance claims in six weeks. In the eurozone, first-quarter real gross domestic product (GDP) shrank 3.8%. China’s first-quarter GDP fell by 6.8% year over year. Extreme oil-price volatility continued as global supply far exceeded demand.
In May, investors regained confidence on reports of early success in human trials of a COVID-19 vaccine. Growth stocks outperformed value, while returns on global government bonds were flat. However, in the U.S., the April unemployment rate rose to 14.7%, its highest level since World War II. Purchasing managers’ indexes (PMIs), a monthly survey of purchasing managers, reflected broadly weakening activity in May. U.S. corporate earnings contracted 14% year over year from the first quarter of 2019. However, high demand for information technology (IT), driven by remote activity, supported robust IT sector earnings, which helped drive IT stocks higher.
By June, economies reopened and global central banks committed to do all they could to provide economic support through liquidity and low borrowing costs. U.S. economic activity was aided by one-time $1,200 stimulus checks and $600 weekly bonus unemployment benefits that lasted through July. However, unemployment remained historically high and COVID-19 cases began to increase by late June. China’s economic recovery began to pick up momentum.
July was broadly positive for equities and fixed income. However, economic data and a resurgence of COVID-19 cases underscored the urgent need to regain control of the pandemic. Second-quarter GDP shrank from the previous quarter by 9.5% and 12.1% in the U.S. and the eurozone, respectively. In contrast, China’s second-quarter GDP grew 3.2% year over year. The U.S. economy added 1.8 million jobs in July, but a double-digit jobless rate persisted.
The stock market continued to rally in August despite concerns over rising numbers of U.S. and European COVID-19 cases as well as the July expiration of the $600 weekly bonus unemployment benefit. Relatively strong second-quarter earnings boosted investor sentiment along with the Fed���s announcement of a monetary policy shift expected to support longer-term low interest rates. U.S. manufacturing and services activity indexes beat expectations while the U.S. housing market maintained strength. In Europe, retail sales expanded and consumer confidence was steady. China’s economy continued to expand.
Stocks grew more volatile in September on mixed economic data. U.S. economic activity continued to grow. However, U.S. unemployment remained elevated at 7.9% in September. With U.S. Congress delaying further fiscal relief and uncertainties surrounding a possible vaccine, doubts crept back into the financial markets. In the U.K., a lack of progress in Brexit talks weighed on markets. China’s economy picked up steam, fueled by increased global demand.
“Global stocks rallied in November, propelled by optimism over three promising COVID-19 vaccines.”
Wells Fargo VT Index Asset Allocation Fund | 3
Letter to shareholders (unaudited)
In October, capital markets stepped back from their six-month rally. Market volatility rose in advance of the U.S. election and amid a global increase in COVID-19 infections. Europe introduced tighter restrictions affecting economic activity. U.S. markets looked favorably at the prospect of Democratic control of the federal purse strings, which could lead to additional fiscal stimulus and a boost to economic activity. Meanwhile, China reported 4.9% third-quarter GDP growth.
Global stocks rallied in November, propelled by optimism over three promising COVID-19 vaccines. Reversing recent trends, value stocks outperformed growth stocks and cyclical stocks outpaced technology stocks. However, U.S. unemployment remained elevated, with a net job loss of 10 million since February. The eurozone services PMI contracted sharply while the region’s manufacturing activity grew. The U.S. election results added to the upbeat mood as investors anticipated more consistent policies in the new administration.
Financial markets ended the year with strength on high expectations for a rapid rollout of the COVID-19 vaccines, the successful passage of a $900 billion stimulus package, and rising expectations of additional economic support from a Democratic-led Congress. U.S. economic data were mixed with still-elevated unemployment and weak retail sales but growth in manufacturing output. In contrast, China’s economic expansion continued in both manufacturing and nonmanufacturing. U.S. COVID-19 infection rates continued to rise even as new state and local lockdown measures were implemented.
Don’t let short-term uncertainty derail long-term investment goals.
Periods of investment uncertainty can present challenges, but experience has taught us that maintaining long-term investment goals can be an effective way to plan for the future. To help you create a sound strategy based on your personal goals and risk tolerance, Wells Fargo Funds offers more than 100 mutual funds spanning a wide range of asset classes and investment styles. Although diversification cannot guarantee an investment profit or prevent losses, we believe it can be an effective way to manage investment risk and potentially smooth out overall portfolio performance. We encourage investors to know their investments and to understand that appropriate levels of risk-taking may unlock opportunities.
Thank you for choosing to invest with Wells Fargo Funds. We appreciate your confidence in us and remain committed to helping you meet your financial needs.
Sincerely,
Andrew Owen
President
Wells Fargo Funds
“Global stocks rallied in November, propelled by optimism over three promising COVID-19 vaccines.”
For further information about your Fund, contact your investment professional, visit our website at wfam.com, or call us directly at 1-800-260-5969.
4 | Wells Fargo VT Index Asset Allocation Fund
Letter to shareholders (unaudited)
Preparing for LIBOR Transition
The global financial industry is preparing to transition away from the London Interbank Offered Rate (LIBOR), a key benchmark interest rate, to new alternative rates. LIBOR underpins more than $350 trillion of financial contracts. It is the benchmark rate for a wide spectrum of products ranging from residential mortgages to corporate bonds to derivatives. Regulators have called for a market-wide transition away from LIBOR to successor reference rates by the end of 2021 (expected to be extended through June 30, 2023 for most tenors of the U.S. dollar LIBOR), which requires proactive steps be taken by issuers, counterparties, and asset managers to identify impacted products and adopt new reference rates.
The Fund holds at least one security that uses LIBOR as a floating reference rate and has a maturity date after 12-31-2021.
Although the transition process away from LIBOR has become increasingly well-defined in advance of the anticipated discontinuation date, there remains uncertainty regarding the nature of successor reference rates, and any potential effects of the transition away from LIBOR on investment instruments that use it as a benchmark rate. The transition process may result in, among other things, increased volatility or illiquidity in markets for instruments that currently rely on LIBOR and could negatively impact the value of certain instruments held by the Fund.
Wells Fargo Asset Management is monitoring LIBOR exposure closely and has put resources and controls in place to manage this transition effectively. The Fund’s portfolio management team is evaluating LIBOR holdings to understand what happens to those securities when LIBOR ceases to exist, including examining security documentation to identify the presence or absence of fallback language identifying a replacement rate to LIBOR.
While the pace of transition away from LIBOR will differ by asset class and investment strategy, the portfolio management team will monitor market conditions for those holdings to identify and mitigate deterioration or volatility in pricing and liquidity and ensure appropriate actions are taken in a timely manner.
Further information regarding the potential risks associated with the discontinuation of LIBOR can be found in the Fund’s Statement of Additional Information.
Wells Fargo VT Index Asset Allocation Fund | 5
Performance highlights (unaudited)
Investment objective
The Fund seeks long-term total return, consisting of capital appreciation and current income.
Manager
Wells Fargo Funds Management, LLC
Subadviser
Wells Capital Management Incorporated
Portfolio managers
Kandarp Acharya, CFA®‡, FRM
Petros N. Bocray, CFA®‡FRM
Christian L. Chan, CFA®‡
Average annual total returns (%) as of December 31, 2020
| | | | | | Expense ratios1 (%) |
| | Inception date | 1 year | 5 year | 10 year | Gross | Net 2 |
| Class 2 | 4-15-1994 | 16.59 | 10.45 | 10.96 | 1.05 | 1.00 |
| Index Asset Allocation Blended Index3 | – | 15.18 | 10.89 | 11.40 | – | – |
| Bloomberg Barclays U.S. Treasury Index4 | – | 8.00 | 3.77 | 3.34 | – | – |
| S&P 500 Index5 | – | 18.40 | 15.22 | 13.88 | – | – |
Figures quoted represent past performance, which is no guarantee of future results. Investment return and principal value of an investment will fluctuate so that an investor’s shares, when redeemed, may be worth more or less than their original cost. Current performance may be lower or higher than the performance data quoted and assumes the reinvestment of dividends and capital gains. Current month-end performance is available by calling 1-800-260-5969. Performance figures of the Fund do not reflect fees and expenses charged pursuant to the terms of variable life insurance policies and variable annuity contracts. If these fees and expenses had been reflected, performance would have been lower.
Shares are sold without a front-end sales charge or contingent deferred sales charge.
Index returns do not include transaction costs associated with buying and selling securities, any mutual fund fees or expenses, or any taxes. It is not possible to invest directly in an index.
Balanced funds may invest in stocks and bonds. Stock values fluctuate in response to the activities of individual companies and general market and economic conditions. Bond values fluctuate in response to the financial condition of individual issuers, general market and economic conditions, and changes in interest rates. Changes in market conditions and government policies may lead to periods of heightened volatility in the bond market and reduced liquidity for certain bonds held by the Fund. In general, when interest rates rise, bond values fall and investors may lose principal value. Interest rate changes and their impact on the Fund and its share price can be sudden and unpredictable. The use of derivatives may reduce returns and/or increase volatility. Consult the Fund’s prospectus for additional information on these and other risks.
Please refer to the prospectus provided by your participating insurance company for detailed information describing the separate accounts for information regarding surrender charges, mortality and expense risk fees, and other charges that may be assessed by the participating insurance companies.
Please see footnotes on page 7.
6 | Wells Fargo VT Index Asset Allocation Fund
Performance highlights (unaudited)
| Growth of $10,000 investment as of December 31, 20206 |

| ‡ | CFA® and Chartered Financial Analyst® are trademarks owned by CFA Institute. |
| 1 | Reflects the expense ratios as stated in the most recent prospectus. The expense ratios shown are subject to change and may differ from the annualized expense ratios shown in the financial highlights of this report. |
| 2 | The manager has contractually committed through April 30, 2021, to waive fees and/or reimburse expenses to the extent necessary to cap total annual fund operating expenses after fee waivers at 1.00% for Class 2. Brokerage commissions, stamp duty fees, interest, taxes, acquired fund fees and expenses (if any), and extraordinary expenses are excluded from the expense cap. Prior to or after the commitment expiration date, the cap may be increased or the commitment to maintain the cap may be terminated only with the approval of the Board of Trustees. Without this cap, the Fund’s returns would have been lower. The expense ratio paid by an investor is the net expense ratio (the total annual fund operating expenses after fee waivers) as stated in the prospectus. |
| 3 | Source: Wells Fargo Funds Management, LLC. The Index Asset Allocation Blended Index is weighted 60% in the S&P 500 Index and 40% in the Bloomberg Barclays U.S. Treasury Index. You cannot invest directly in an index. |
| 4 | The Bloomberg Barclays U.S. Treasury Index is an unmanaged index of prices of U.S. Treasury bonds with maturities of 1 to 30 years. You cannot invest directly in an index. |
| 5 | The S&P 500 Index consists of 500 stocks chosen for market size, liquidity, and industry group representation. It is a market-value-weighted index with each stock’s weight in the index proportionate to its market value. You cannot invest directly in an index. |
| 6 | The chart compares the performance of Class 2 shares for the most recent ten years with the Index Asset Allocation Blended Index, Bloomberg Barclays U.S. Treasury Index, and the S&P 500 Index. The chart assumes a hypothetical $10,000 investment and reflects all operating expenses of the Fund but does not reflect fees and expenses charged pursuant to the terms of variable life insurance policies and variable annuity contracts. |
| 7 | The Morgan Stanley Capital International (MSCI) All Country World Index (ACWI) ex USA Index (Net) is a free-float-adjusted market-capitalization-weighted index that is designed to measure the equity market performance of developed and emerging markets, excluding the U.S. Source: MSCI. MSCI makes no express or implied warranties or representations and shall have no liability whatsoever with respect to any MSCI data contained herein. The MSCI data may not be further redistributed or used as a basis for other indices or any securities or financial products. This report is not approved, reviewed, or produced by MSCI. You cannot invest directly in an index. |
| 8 | Bloomberg Barclays 20+ Year U.S. Treasury Index is an unmanaged index composed of securities in the U.S. Treasury Index with maturities of 20 years or greater. You cannot invest directly in an index. |
| 9 | Figures represent the percentage of the Fund's net assets. Holdings are subject to change and may have changed since the date specified. |
| 10 | Figures represent the percentage of the Fund's long-term investments. These amounts are subject to change and may have changed since the date specified. |
| 11 | Effective allocation includes the effect of any tactical futures overlay that may be in place. Effective cash, if any, represents the net offset to such future positions. The amounts are subject to change and may have changed since the date specified. |
Wells Fargo VT Index Asset Allocation Fund | 7
Performance highlights (unaudited)
MANAGER'S DISCUSSION
Fund highlights
| ■ | The Fund outperformed its benchmark, the Index Asset Allocation Blended Index, for the 12-month period that ended December 31, 2020. |
| ■ | The Fund’s tactical asset allocation overlay, which is implemented with liquid futures contracts, contributed to performance during the period. |
| ■ | The Fund’s stock allocation performed in line with its respective benchmark, the S&P 500 Index, while the Fund’s bond allocation outperformed its respective benchmark, the Bloomberg Barclays U.S. Treasury Index. |
Central bank support drove a broad rally after a rocky first quarter.
The two big stories of 2019 were trade and Brexit. Politics seemed to drive markets lower as the issues became more severe, but markets rebounded as tensions eased. The one big story of 2020 was the coronavirus crisis. While the problems of 2019 meant business capital spending stayed on hold and manufacturing fell into a recession until the Phase One U.S.-China trade deal came to pass, the problems of 2020 were much more broadly felt and acute.
In 2020, markets tumbled from February into March with the rise of COVID-19 cases. The U.S. Federal Reserve (Fed) cut rates in an off-cycle meeting but also said that the fundamentals of the economy were strong. The fundamentals quickly weakened, though, as countries went on lockdown to try to manage the worsening coronavirus crisis.
The turning point for the U.S. market came on March 23, when the Fed took action with a massive asset-purchase program. Congress followed up more quickly than many expected with a coronavirus relief package. Governments and central banks around the world reacted similarly. While 2020 was supposed to be a year of synchronized global growth, by March it had become a year of synchronized seizing up and massive stimulus to help dull the pain.
In the spring and summer of 2020, new COVID-19 cases began to fall. People started kicking their spending back into high gear, helped by stimulus checks and enhanced unemployment benefits. It also helped that as we learned more about the coronavirus, governments across the U.S. relaxed restrictions, banking on the idea that taking a more targeted approach to manage the spread would be effective.
While there was a historic drop in global economic activity in the first and second quarters, the third quarter saw a historic rise in activity. But as winter approached and the number of COVID-19 cases climbed, some countries went back into lockdown. Economic activity was tapering — and some countries would likely experience an outright decline in activity. But with COVID-19 vaccines on the way, the decline was viewed as just a speed bump.
In early November, a massive market rotation occurred. Following the U.S. presidential election, gridlock seemed to prevail. But the big news was how effective the COVID-19 vaccines turned out to be. It became a matter of when rather than if people could get vaccinated. By mid-December, vaccination programs were underway.
Equity markets posted more than decent gains during the 12-month period despite the sharp first-quarter sell-off. After a relatively quiet start to the year, mounting fears of the rapid spread of the coronavirus and the economic impact of shutdowns in the U.S. and across the globe sent markets reeling in February and March in the fastest bear market in history. The subsequent recovery, which picked up steam in the second quarter, was just as remarkable. After a miserable first quarter, equity markets posted their strongest second-quarter gains in more than 20 years. For the full year, U.S. equity markets, as measured by the S&P 500 Index, rose by 18.40%. International equities, as measured by the MSCI ACWI ex USA Index (Net)7, gained 10.65% during the same period.
Longer-duration U.S. government bond prices rose sharply amid a precipitous decline in yields. For the 12-month period, the yield on 30-year U.S. Treasury bonds fell by 0.74%, from 2.39% to 1.65%, while yields on 10-year U.S. Treasury notes fell by 1.00%, from 1.92% to 0.92%. The Bloomberg Barclays U.S. Treasury Index, a broad measure of U.S. Treasury notes and bonds, gained 8.00% during the 12-month period, while the Bloomberg Barclays 20+ Year U.S. Treasury Index8 returned 18.10%.
Tactical asset allocation shifts contributed to performance during the 12-month period.
The Fund’s stock holdings seek to replicate the holdings of the S&P 500 Index, while its bond holdings seek to replicate the holdings of the Bloomberg Barclays U.S. Treasury Index. The Fund’s neutral target allocation is 60% stocks and 40% bonds. As of year-end, the Fund had an effective target allocation of 64.5% in stocks, 52.0% in bonds, and -16.5% in effective cash. The effective target allocation reflects the Fund’s year-end long exposure to S&P 500 futures and 10-year U.S. Treasury futures, which increased the portfolio’s effective exposure to both stocks and bonds.
Please see footnotes on page 7.
8 | Wells Fargo VT Index Asset Allocation Fund
Performance highlights (unaudited)
| Ten largest holdings (%) as of December 31, 20209 |
| Apple Incorporated | 4.02 |
| Microsoft Corporation | 3.19 |
| Amazon.com Incorporated | 2.63 |
| Facebook Incorporated Class A | 1.24 |
| Tesla Motors Incorporated | 1.03 |
| Alphabet Incorporated Class A | 1.00 |
| Alphabet Incorporated Class C | 0.97 |
| Berkshire Hathaway Incorporated Class B | 0.86 |
| Johnson & Johnson | 0.79 |
| JPMorgan Chase & Company | 0.74 |
During the period, the portfolio management team implemented tactical shifts between stocks and bonds in order to adjust the Fund’s effective allocations based on the relative attractiveness of the two asset classes. The team started 2020 with a defensively tilted posture, which was initiated in the summer of 2019. In January, as bond prices rose, the team locked in some gains by closing out its long exposure to 10-year U.S. Treasury futures. After a brief period in which the team maintained a neutral allocation between stocks and bonds, it found an opportunity to add risk to the portfolio amid the height of the COVID-19-induced sell-off. Specifically, in mid-March, the team initiated a long position in S&P 500 futures, which was held until July, when the team sold the position at a handsome profit. A long position was reestablished in August along with a short position in the Ultra U.S. Treasury futures (the longest-dated U.S. Treasury futures traded on the Chicago Mercantile Exchange). The team closed the long S&P 500 futures position in late September. During the last three months of the year, the team closed out the short position in the Ultra U.S. Treasury futures and established a long position in S&P 500 futures as well as a long position in 10-year U.S. Treasury futures.
The Fund’s effective allocation is determined by a combination of inputs from multiple quantitative and qualitative factors. As of period-end, relative to its benchmark, the Fund maintained an overweight to stocks and bonds, offset by a negative effective exposure to cash. All of the changes to the effective asset allocation were implemented with liquid futures contracts.
On the whole, the tactical positions implemented during the 12-month period contributed roughly 1.7% to the performance of the overall Fund.
The outlook for 2021 includes hope for a synchronized global recovery.
We believe 2021 will be a year of second chances. Going into 2020, trailing earnings for companies in the S&P 500 Index were around $157. We think corporate America should be able to earn that back, but so should corporate Europe, Japan, and emerging markets (and everyone else).
Also going into 2020, there was hope of a synchronized global recovery after the fallout from President Trump’s trade war. Now there is hope of a synchronized global recovery with the help of the COVID-19 vaccine. The difference is that while in 2020 we were starting very late in the cycle, we are now starting with synchronized growth and a brand new cycle in front of us.
We will continue to monitor the situation carefully and stand ready to adjust exposures as needed.
| Sector distribution as of December 31, 202010 |
| Allocation (%) as of December 31, 2020 |
| | Neutral
allocation | Effective
allocation11 |
| Stocks | 60 | 65 |
| Bonds | 40 | 52 |
| Effective cash | 0 | (17) |
Please see footnotes on page 7.
Wells Fargo VT Index Asset Allocation Fund | 9
Fund expenses (unaudited)
As a shareholder of the Fund, you incur ongoing costs, including management fees, distribution (12b-1) fees, and other Fund expenses. This example is intended to help you understand your ongoing costs (in dollars) of investing in the Fund and to compare these costs with the ongoing costs of investing in other mutual funds.
The example is based on an investment of $1,000 invested at the beginning of the six-month period and held for the entire period from July 1, 2020 to December 31, 2020.
Actual expenses
The “Actual” line of the table below provides information about actual account values and actual expenses. You may use the information in this line, together with the amount you invested, to estimate the expenses that you paid over the period. Simply divide your account value by $1,000 (for example, an $8,600 account value divided by $1,000 = 8.6), then multiply the result by the number in the “Actual” line under the heading entitled “Expenses paid during period” for your applicable class of shares to estimate the expenses you paid on your account during this period.
Hypothetical example for comparison purposes
The “Hypothetical” line of the table below provides information about hypothetical account values and hypothetical expenses based on the Fund’s actual expense ratio and an assumed rate of return of 5% per year before expenses, which is not the Fund’s actual return. The hypothetical account values and expenses may not be used to estimate the actual ending account balance or expenses you paid for the period. You may use this information to compare the ongoing costs of investing in the Fund and other funds. To do so, compare this 5% hypothetical example with the 5% hypothetical examples that appear in the shareholder reports of the other funds.
Please note that the expenses shown in the table are meant to highlight your ongoing costs only and do not reflect any separate account charges assessed by participating insurance companies. Therefore, the “Hypothetical” line of the table is useful in comparing ongoing costs only, and will not help you determine the relative total costs of owning different funds. In addition, if these separate account charges assessed by participating insurance companies were included, your costs would have been higher.
| | Beginning
account value
7-1-2020 | Ending
account value
12-31-2020 | Expenses
paid during
the period1 | Annualized net
expense ratio |
| Class 2 | | | | |
| Actual | $1,000.00 | $1,128.96 | $5.35 | 1.00% |
| Hypothetical (5% return before expenses) | $1,000.00 | $1,020.11 | $5.08 | 1.00% |
1 Expenses paid is equal to the annualized net expense ratio multiplied by the average account value over the period, multiplied by the number of days in the most recent fiscal half-year divided by the number of days in the fiscal year (to reflect the one-half-year period).
10 | Wells Fargo VT Index Asset Allocation Fund
Portfolio of investments—December 31, 2020
| | | | | Shares | Value |
| Common stocks: 60.19% | | | | | |
| Communication services: 6.47% | | | | | |
| Diversified telecommunication services: 0.87% | | | | | |
| AT&T Incorporated | | | | 10,682 | 307,214 |
| CenturyLink Incorporated | | | | 1,476 | 14,391 |
| Verizon Communications Incorporated | | | | 6,198 | 364,133 |
| | | | | | 685,738 |
| Entertainment: 1.36% | | | | | |
| Activision Blizzard Incorporated | | | | 1,154 | 107,149 |
| Electronic Arts Incorporated | | | | 434 | 62,322 |
| Live Nation Entertainment Incorporated † | | | | 213 | 15,651 |
| Netflix Incorporated † | | | | 661 | 357,423 |
| Take-Two Interactive Software Incorporated † | | | | 171 | 35,532 |
| The Walt Disney Company | | | | 2,711 | 491,179 |
| | | | | | 1,069,256 |
| Interactive media & services: 3.29% | | | | | |
| Alphabet Incorporated Class A † | | | | 450 | 788,688 |
| Alphabet Incorporated Class C † | | | | 435 | 762,068 |
| Facebook Incorporated Class A † | | | | 3,586 | 979,552 |
| Twitter Incorporated † | | | | 1,191 | 64,493 |
| | | | | | 2,594,801 |
| Media: 0.80% | | | | | |
| Charter Communications Incorporated Class A † | | | | 218 | 144,218 |
| Comcast Corporation Class A | | | | 6,832 | 357,997 |
| Discovery Incorporated Class A † | | | | 240 | 7,222 |
| Discovery Incorporated Class C † | | | | 441 | 11,550 |
| DISH Network Corporation Class A † | | | | 367 | 11,869 |
| Fox Corporation Class A | | | | 504 | 14,676 |
| Fox Corporation Class B | | | | 231 | 6,671 |
| Interpublic Group of Companies Incorporated | | | | 582 | 13,689 |
| News Corporation Class A | | | | 584 | 10,494 |
| News Corporation Class B | | | | 182 | 3,234 |
| Omnicom Group Incorporated | | | | 322 | 20,083 |
| ViacomCBS Incorporated Class B | | | | 847 | 31,559 |
| | | | | | 633,262 |
| Wireless telecommunication services: 0.15% | | | | | |
| T-Mobile US Incorporated † | | | | 874 | 117,859 |
| Consumer discretionary: 7.66% | | | | | |
| Auto components: 0.09% | | | | | |
| Aptiv plc | | | | 406 | 52,898 |
| BorgWarner Incorporated | | | | 367 | 14,181 |
| | | | | | 67,079 |
| Automobiles: 1.20% | | | | | |
| Ford Motor Company | | | | 5,863 | 51,536 |
| General Motors Company | | | | 1,886 | 78,533 |
| Tesla Motors Incorporated † | | | | 1,155 | 815,049 |
| | | | | | 945,118 |
The accompanying notes are an integral part of these financial statements.
Wells Fargo VT Index Asset Allocation Fund | 11
Portfolio of investments—December 31, 2020
| | | | | Shares | Value |
| Distributors: 0.07% | | | | | |
| Genuine Parts Company | | | | 215 | $ 21,592 |
| LKQ Corporation † | | | | 420 | 14,801 |
| Pool Corporation | | | | 60 | 22,350 |
| | | | | | 58,743 |
| Hotels, restaurants & leisure: 1.02% | | | | | |
| Carnival Corporation | | | | 1,116 | 24,173 |
| Chipotle Mexican Grill Incorporated † | | | | 42 | 58,242 |
| Darden Restaurants Incorporated | | | | 194 | 23,109 |
| Domino's Pizza Incorporated | | | | 59 | 22,624 |
| Hilton Worldwide Holdings Incorporated | | | | 416 | 46,284 |
| Las Vegas Sands Corporation | | | | 491 | 29,264 |
| Marriott International Incorporated Class A | | | | 398 | 52,504 |
| McDonald's Corporation | | | | 1,115 | 239,257 |
| MGM Resorts International | | | | 614 | 19,347 |
| Norwegian Cruise Line Holdings Limited † | | | | 472 | 12,003 |
| Royal Caribbean Cruises Limited | | | | 281 | 20,988 |
| Starbucks Corporation | | | | 1,758 | 188,071 |
| Wynn Resorts Limited | | | | 144 | 16,248 |
| Yum! Brands Incorporated | | | | 451 | 48,961 |
| | | | | | 801,075 |
| Household durables: 0.23% | | | | | |
| D.R. Horton Incorporated | | | | 495 | 34,115 |
| Garmin Limited | | | | 223 | 26,684 |
| Leggett & Platt Incorporated | | | | 199 | 8,816 |
| Lennar Corporation Class A | | | | 410 | 31,254 |
| Mohawk Industries Incorporated † | | | | 89 | 12,545 |
| Newell Rubbermaid Incorporated | | | | 567 | 12,037 |
| NVR Incorporated † | | | | 5 | 20,399 |
| Pulte Group Incorporated | | | | 400 | 17,248 |
| Whirlpool Corporation | | | | 93 | 16,786 |
| | | | | | 179,884 |
| Internet & direct marketing retail: 2.94% | | | | | |
| Amazon.com Incorporated † | | | | 636 | 2,071,407 |
| Booking Holdings Incorporated † | | | | 61 | 135,863 |
| eBay Incorporated | | | | 974 | 48,944 |
| Etsy Incorporated † | | | | 191 | 33,981 |
| Expedia Group Incorporated | | | | 203 | 26,877 |
| | | | | | 2,317,072 |
| Leisure products: 0.02% | | | | | |
| Hasbro Incorporated | | | | 191 | 17,866 |
| Multiline retail: 0.31% | | | | | |
| Dollar General Corporation | | | | 366 | 76,970 |
| Dollar Tree Incorporated † | | | | 351 | 37,922 |
| Target Corporation | | | | 751 | 132,574 |
| | | | | | 247,466 |
| Specialty retail: 1.33% | | | | | |
| Advance Auto Parts Incorporated | | | | 100 | 15,751 |
| AutoZone Incorporated † | | | | 35 | 41,490 |
| Best Buy Company Incorporated | | | | 344 | 34,328 |
The accompanying notes are an integral part of these financial statements.
12 | Wells Fargo VT Index Asset Allocation Fund
Portfolio of investments—December 31, 2020
| | | | | Shares | Value |
| Specialty retail (continued) | | | | | |
| CarMax Incorporated † | | | | 247 | $ 23,332 |
| L Brands Incorporated | | | | 349 | 12,979 |
| Lowe's Companies Incorporated | | | | 1,097 | 176,079 |
| O'Reilly Automotive Incorporated † | | | | 108 | 48,878 |
| Ross Stores Incorporated | | | | 533 | 65,458 |
| The Gap Incorporated | | | | 308 | 6,219 |
| The Home Depot Incorporated | | | | 1,613 | 428,445 |
| The TJX Companies Incorporated | | | | 1,799 | 122,854 |
| Tiffany & Company | | | | 161 | 21,163 |
| Tractor Supply Company | | | | 174 | 24,461 |
| Ulta Beauty Incorporated † | | | | 85 | 24,409 |
| | | | | | 1,045,846 |
| Textiles, apparel & luxury goods: 0.45% | | | | | |
| HanesBrands Incorporated | | | | 523 | 7,625 |
| Nike Incorporated Class B | | | | 1,885 | 266,671 |
| PVH Corporation | | | | 105 | 9,858 |
| Ralph Lauren Corporation | | | | 71 | 7,366 |
| Tapestry Incorporated | | | | 418 | 12,991 |
| Under Armour Incorporated Class A † | | | | 286 | 4,911 |
| Under Armour Incorporated Class C † | | | | 294 | 4,375 |
| VF Corporation | | | | 480 | 40,997 |
| | | | | | 354,794 |
| Consumer staples: 3.92% | | | | | |
| Beverages: 0.97% | | | | | |
| Brown-Forman Corporation Class B | | | | 273 | 21,684 |
| Constellation Brands Incorporated Class A | | | | 253 | 55,420 |
| Molson Coors Brewing Company Class B | | | | 282 | 12,744 |
| Monster Beverage Corporation † | | | | 554 | 51,234 |
| PepsiCo Incorporated | | | | 2,072 | 307,278 |
| The Coca-Cola Company | | | | 5,803 | 318,237 |
| | | | | | 766,597 |
| Food & staples retailing: 0.87% | | | | | |
| Costco Wholesale Corporation | | | | 663 | 249,805 |
| Sysco Corporation | | | | 765 | 56,809 |
| The Kroger Company | | | | 1,158 | 36,778 |
| Walgreens Boots Alliance Incorporated | | | | 1,076 | 42,911 |
| Walmart Incorporated | | | | 2,078 | 299,544 |
| | | | | | 685,847 |
| Food products: 0.60% | | | | | |
| Archer Daniels Midland Company | | | | 835 | 42,092 |
| Campbell Soup Company | | | | 302 | 14,602 |
| ConAgra Foods Incorporated | | | | 731 | 26,506 |
| General Mills Incorporated | | | | 914 | 53,743 |
| Hormel Foods Corporation | | | | 420 | 19,576 |
| Kellogg Company | | | | 381 | 23,710 |
| Lamb Weston Holdings Incorporated | | | | 219 | 17,244 |
| McCormick & Company Incorporated | | | | 372 | 35,563 |
| Mondelez International Incorporated Class A | | | | 2,143 | 125,301 |
| The Hershey Company | | | | 220 | 33,513 |
| The J.M. Smucker Company | | | | 170 | 19,652 |
The accompanying notes are an integral part of these financial statements.
Wells Fargo VT Index Asset Allocation Fund | 13
Portfolio of investments—December 31, 2020
| | | | | Shares | Value |
| Food products (continued) | | | | | |
| The Kraft Heinz Company | | | | 968 | $ 33,551 |
| Tyson Foods Incorporated Class A | | | | 440 | 28,354 |
| | | | | | 473,407 |
| Household products: 0.97% | | | | | |
| Church & Dwight Company Incorporated | | | | 371 | 32,362 |
| Colgate-Palmolive Company | | | | 1,285 | 109,880 |
| Kimberly-Clark Corporation | | | | 509 | 68,628 |
| The Clorox Company | | | | 188 | 37,961 |
| The Procter & Gamble Company | | | | 3,716 | 517,044 |
| | | | | | 765,875 |
| Personal products: 0.12% | | | | | |
| The Estee Lauder Companies Incorporated Class A | | | | 339 | 90,238 |
| Tobacco: 0.39% | | | | | |
| Altria Group Incorporated | | | | 2,790 | 114,390 |
| Philip Morris International Incorporated | | | | 2,333 | 193,149 |
| | | | | | 307,539 |
| Energy: 1.38% | | | | | |
| Energy equipment & services: 0.14% | | | | | |
| Baker Hughes Incorporated | | | | 1,031 | 21,496 |
| Halliburton Company | | | | 1,333 | 25,194 |
| NOV Incorporated | | | | 585 | 8,032 |
| Schlumberger Limited | | | | 2,100 | 45,843 |
| TechnipFMC plc | | | | 631 | 5,931 |
| | | | | | 106,496 |
| Oil, gas & consumable fuels: 1.24% | | | | | |
| Apache Corporation | | | | 568 | 8,060 |
| Cabot Oil & Gas Corporation | | | | 598 | 9,735 |
| Chevron Corporation | | | | 2,883 | 243,469 |
| Concho Resources Incorporated | | | | 295 | 17,213 |
| ConocoPhillips | | | | 1,612 | 64,464 |
| Devon Energy Corporation | | | | 578 | 9,138 |
| Diamondback Energy Incorporated | | | | 239 | 11,568 |
| EOG Resources Incorporated | | | | 882 | 43,985 |
| Exxon Mobil Corporation | | | | 6,318 | 260,428 |
| Hess Corporation | | | | 412 | 21,749 |
| HollyFrontier Corporation | | | | 223 | 5,765 |
| Kinder Morgan Incorporated | | | | 2,909 | 39,766 |
| Marathon Oil Corporation | | | | 1,190 | 7,937 |
| Marathon Petroleum Corporation | | | | 977 | 40,409 |
| Occidental Petroleum Corporation | | | | 1,264 | 21,880 |
| ONEOK Incorporated | | | | 665 | 25,523 |
| Phillips 66 | | | | 658 | 46,021 |
| Pioneer Natural Resources Company | | | | 247 | 28,131 |
| The Williams Companies Incorporated | | | | 1,813 | 36,351 |
| Valero Energy Corporation | | | | 614 | 34,734 |
| | | | | | 976,326 |
The accompanying notes are an integral part of these financial statements.
14 | Wells Fargo VT Index Asset Allocation Fund
Portfolio of investments—December 31, 2020
| | | | | Shares | Value |
| Financials: 6.29% | | | | | |
| Banks: 2.33% | | | | | |
| Bank of America Corporation | | | | 11,406 | $ 345,716 |
| Citigroup Incorporated | | | | 3,122 | 192,503 |
| Citizens Financial Group Incorporated | | | | 643 | 22,994 |
| Comerica Incorporated | | | | 208 | 11,619 |
| Fifth Third Bancorp | | | | 1,069 | 29,472 |
| First Republic Bank | | | | 261 | 38,349 |
| Huntington Bancshares Incorporated | | | | 1,531 | 19,337 |
| JPMorgan Chase & Company | | | | 4,572 | 580,964 |
| KeyCorp | | | | 1,468 | 24,090 |
| M&T Bank Corporation | | | | 192 | 24,442 |
| People's United Financial Incorporated | | | | 639 | 8,262 |
| PNC Financial Services Group Incorporated | | | | 636 | 94,764 |
| Regions Financial Corporation | | | | 1,441 | 23,229 |
| SVB Financial Group † | | | | 78 | 30,251 |
| Truist Financial Corporation | | | | 2,025 | 97,058 |
| US Bancorp | | | | 2,058 | 95,882 |
| Wells Fargo & Company ♠ | | | | 6,199 | 187,086 |
| Zions Bancorporation | | | | 245 | 10,643 |
| | | | | | 1,836,661 |
| Capital markets: 1.66% | | | | | |
| Ameriprise Financial Incorporated | | | | 176 | 34,202 |
| Bank of New York Mellon Corporation | | | | 1,222 | 51,862 |
| BlackRock Incorporated | | | | 212 | 152,966 |
| Cboe Global Markets Incorporated | | | | 161 | 14,992 |
| CME Group Incorporated | | | | 536 | 97,579 |
| Franklin Resources Incorporated | | | | 408 | 10,196 |
| Intercontinental Exchange Incorporated | | | | 842 | 97,074 |
| Invesco Limited | | | | 566 | 9,865 |
| MarketAxess Holdings Incorporated | | | | 56 | 31,951 |
| Moody's Corporation | | | | 243 | 70,528 |
| Morgan Stanley | | | | 2,142 | 146,791 |
| MSCI Incorporated | | | | 125 | 55,816 |
| Northern Trust Corporation | | | | 311 | 28,967 |
| Raymond James Financial Incorporated | | | | 182 | 17,412 |
| S&P Global Incorporated | | | | 362 | 119,000 |
| State Street Corporation | | | | 528 | 38,428 |
| T. Rowe Price Group Incorporated | | | | 338 | 51,170 |
| The Charles Schwab Corporation | | | | 2,233 | 118,438 |
| The Goldman Sachs Group Incorporated | | | | 517 | 136,338 |
| The NASDAQ OMX Group Incorporated | | | | 172 | 22,831 |
| | | | | | 1,306,406 |
| Consumer finance: 0.33% | | | | | |
| American Express Company | | | | 978 | 118,250 |
| Capital One Financial Corporation | | | | 688 | 68,009 |
| Discover Financial Services | | | | 459 | 41,553 |
| Synchrony Financial | | | | 813 | 28,219 |
| | | | | | 256,031 |
| Diversified financial services: 0.86% | | | | | |
| Berkshire Hathaway Incorporated Class B † | | | | 2,920 | 677,060 |
The accompanying notes are an integral part of these financial statements.
Wells Fargo VT Index Asset Allocation Fund | 15
Portfolio of investments—December 31, 2020
| | | | | Shares | Value |
| Insurance: 1.11% | | | | | |
| AFLAC Incorporated | | | | 977 | $ 43,447 |
| American International Group Incorporated | | | | 1,291 | 48,877 |
| Aon plc Class A | | | | 341 | 72,043 |
| Arthur J. Gallagher & Company | | | | 288 | 35,628 |
| Assurant Incorporated | | | | 88 | 11,987 |
| Chubb Limited | | | | 676 | 104,050 |
| Cincinnati Financial Corporation | | | | 224 | 19,571 |
| Everest Reinsurance Group Limited | | | | 60 | 14,045 |
| Globe Life Incorporated | | | | 144 | 13,674 |
| Lincoln National Corporation | | | | 272 | 13,684 |
| Loews Corporation | | | | 350 | 15,757 |
| Marsh & McLennan Companies Incorporated | | | | 760 | 88,920 |
| MetLife Incorporated | | | | 1,145 | 53,758 |
| Principal Financial Group Incorporated | | | | 383 | 19,001 |
| Progressive Corporation | | | | 876 | 86,619 |
| Prudential Financial Incorporated | | | | 594 | 46,374 |
| The Allstate Corporation | | | | 455 | 50,018 |
| The Hartford Financial Services Group Incorporated | | | | 536 | 26,253 |
| The Travelers Companies Incorporated | | | | 379 | 53,200 |
| UnumProvident Corporation | | | | 305 | 6,997 |
| W.R. Berkley Corporation | | | | 210 | 13,948 |
| Willis Towers Watson plc | | | | 192 | 40,451 |
| | | | | | 878,302 |
| Health care: 8.10% | | | | | |
| Biotechnology: 1.13% | | | | | |
| AbbVie Incorporated | | | | 2,642 | 283,090 |
| Alexion Pharmaceuticals Incorporated † | | | | 327 | 51,090 |
| Amgen Incorporated | | | | 871 | 200,260 |
| Biogen Incorporated † | | | | 230 | 56,318 |
| Gilead Sciences Incorporated | | | | 1,878 | 109,412 |
| Incyte Corporation † | | | | 278 | 24,180 |
| Regeneron Pharmaceuticals Incorporated † | | | | 156 | 75,365 |
| Vertex Pharmaceuticals Incorporated † | | | | 388 | 91,700 |
| | | | | | 891,415 |
| Health care equipment & supplies: 2.29% | | | | | |
| Abbott Laboratories | | | | 2,660 | 291,243 |
| ABIOMED Incorporated † | | | | 68 | 22,046 |
| Align Technology Incorporated † | | | | 108 | 57,713 |
| Baxter International Incorporated | | | | 765 | 61,384 |
| Becton Dickinson & Company | | | | 434 | 108,595 |
| Boston Scientific Corporation † | | | | 2,147 | 77,185 |
| Danaher Corporation | | | | 946 | 210,144 |
| Dentsply Sirona Incorporated | | | | 327 | 17,122 |
| DexCom Incorporated † | | | | 145 | 53,609 |
| Edwards Lifesciences Corporation † | | | | 933 | 85,118 |
| Hologic Incorporated † | | | | 385 | 28,040 |
| IDEXX Laboratories Incorporated † | | | | 128 | 63,983 |
| Intuitive Surgical Incorporated † | | | | 177 | 144,804 |
| Medtronic plc | | | | 2,018 | 236,389 |
| ResMed Incorporated | | | | 216 | 45,913 |
| STERIS plc | | | | 127 | 24,072 |
| Stryker Corporation | | | | 491 | 120,315 |
The accompanying notes are an integral part of these financial statements.
16 | Wells Fargo VT Index Asset Allocation Fund
Portfolio of investments—December 31, 2020
| | | | | Shares | Value |
| Health care equipment & supplies (continued) | | | | | |
| Teleflex Incorporated | | | | 70 | $ 28,810 |
| The Cooper Companies Incorporated | | | | 74 | 26,886 |
| Varian Medical Systems Incorporated † | | | | 136 | 23,801 |
| West Pharmaceutical Services Incorporated | | | | 111 | 31,447 |
| Zimmer Biomet Holdings Incorporated | | | | 310 | 47,768 |
| | | | | | 1,806,387 |
| Health care providers & services: 1.58% | | | | | |
| AmerisourceBergen Corporation | | | | 220 | 21,507 |
| Anthem Incorporated | | | | 373 | 119,767 |
| Cardinal Health Incorporated | | | | 440 | 23,566 |
| Centene Corporation † | | | | 868 | 52,106 |
| Cigna Corporation | | | | 540 | 112,417 |
| CVS Health Corporation | | | | 1,966 | 134,278 |
| DaVita HealthCare Partners Incorporated † | | | | 109 | 12,797 |
| HCA Healthcare Incorporated | | | | 394 | 64,797 |
| Henry Schein Incorporated † | | | | 213 | 14,241 |
| Humana Incorporated | | | | 198 | 81,233 |
| Laboratory Corporation of America Holdings † | | | | 146 | 29,718 |
| McKesson Corporation | | | | 240 | 41,741 |
| Quest Diagnostics Incorporated | | | | 201 | 23,953 |
| UnitedHealth Group Incorporated | | | | 1,420 | 497,966 |
| Universal Health Services Incorporated Class B | | | | 117 | 16,088 |
| | | | | | 1,246,175 |
| Health care technology: 0.05% | | | | | |
| Cerner Corporation | | | | 458 | 35,944 |
| Life sciences tools & services: 0.72% | | | | | |
| Agilent Technologies Incorporated | | | | 457 | 54,150 |
| Bio-Rad Laboratories Incorporated Class A † | | | | 32 | 18,654 |
| Illumina Incorporated † | | | | 219 | 81,030 |
| IQVIA Holdings Incorporated † | | | | 287 | 51,422 |
| Mettler-Toledo International Incorporated † | | | | 36 | 41,028 |
| PerkinElmer Incorporated | | | | 167 | 23,965 |
| Thermo Fisher Scientific Incorporated | | | | 593 | 276,208 |
| Waters Corporation † | | | | 92 | 22,763 |
| | | | | | 569,220 |
| Pharmaceuticals: 2.33% | | | | | |
| Bristol-Myers Squibb Company | | | | 3,397 | 210,716 |
| Catalent Incorporated † | | | | 246 | 25,601 |
| Eli Lilly & Company | | | | 1,190 | 200,920 |
| Johnson & Johnson | | | | 3,955 | 622,438 |
| Merck & Company Incorporated | | | | 3,781 | 309,286 |
| Perrigo Company plc | | | | 203 | 9,078 |
| Pfizer Incorporated | | | | 8,301 | 305,560 |
| Viatris Incorporated † | | | | 1,829 | 34,275 |
| Zoetis Incorporated | | | | 713 | 118,002 |
| | | | | | 1,835,876 |
| Industrials: 5.06% | | | | | |
| Aerospace & defense: 0.97% | | | | | |
| General Dynamics Corporation | | | | 348 | 51,789 |
| Howmet Aerospace Incorporated | | | | 583 | 16,639 |
The accompanying notes are an integral part of these financial statements.
Wells Fargo VT Index Asset Allocation Fund | 17
Portfolio of investments—December 31, 2020
| | | | | Shares | Value |
| Aerospace & defense (continued) | | | | | |
| Huntington Ingalls Industries Incorporated | | | | 61 | $ 10,399 |
| L3Harris Technologies Incorporated | | | | 314 | 59,352 |
| Lockheed Martin Corporation | | | | 369 | 130,988 |
| Northrop Grumman Corporation | | | | 233 | 71,000 |
| Raytheon Technologies Corporation | | | | 2,280 | 163,043 |
| Teledyne Technologies Incorporated † | | | | 55 | 21,559 |
| Textron Incorporated | | | | 343 | 16,577 |
| The Boeing Company | | | | 795 | 170,178 |
| TransDigm Group Incorporated | | | | 82 | 50,746 |
| | | | | | 762,270 |
| Air freight & logistics: 0.40% | | | | | |
| C.H. Robinson Worldwide Incorporated | | | | 202 | 18,962 |
| Expeditors International of Washington Incorporated | | | | 253 | 24,063 |
| FedEx Corporation | | | | 363 | 94,242 |
| United Parcel Service Incorporated Class B | | | | 1,067 | 179,683 |
| | | | | | 316,950 |
| Airlines: 0.16% | | | | | |
| Alaska Air Group Incorporated | | | | 186 | 9,672 |
| American Airlines Group Incorporated | | | | 924 | 14,571 |
| Delta Air Lines Incorporated | | | | 958 | 38,521 |
| Southwest Airlines Company | | | | 882 | 41,110 |
| United Airlines Holdings Incorporated † | | | | 441 | 19,073 |
| | | | | | 122,947 |
| Building products: 0.27% | | | | | |
| A.O. Smith Corporation | | | | 202 | 11,074 |
| Allegion plc | | | | 138 | 16,060 |
| Carrier Global Corporation | | | | 1,229 | 46,358 |
| Fortune Brands Home & Security Incorporated | | | | 207 | 17,744 |
| Johnson Controls International plc | | | | 1,084 | 50,504 |
| Masco Corporation | | | | 391 | 21,478 |
| Trane Technologies plc | | | | 360 | 52,258 |
| | | | | | 215,476 |
| Commercial services & supplies: 0.25% | | | | | |
| Cintas Corporation | | | | 132 | 46,657 |
| Copart Incorporated † | | | | 309 | 39,320 |
| Republic Services Incorporated | | | | 315 | 30,335 |
| Rollins Incorporated | | | | 331 | 12,932 |
| Waste Management Incorporated | | | | 583 | 68,753 |
| | | | | | 197,997 |
| Construction & engineering: 0.05% | | | | | |
| Jacobs Engineering Group Incorporated | | | | 193 | 21,029 |
| Quanta Services Incorporated | | | | 207 | 14,908 |
| | | | | | 35,937 |
| Electrical equipment: 0.29% | | | | | |
| AMETEK Incorporated | | | | 344 | 41,603 |
| Eaton Corporation plc | | | | 598 | 71,844 |
The accompanying notes are an integral part of these financial statements.
18 | Wells Fargo VT Index Asset Allocation Fund
Portfolio of investments—December 31, 2020
| | | | | Shares | Value |
| Electrical equipment (continued) | | | | | |
| Emerson Electric Company | | | | 897 | $ 72,092 |
| Rockwell Automation Incorporated | | | | 175 | 43,892 |
| | | | | | 229,431 |
| Industrial conglomerates: 0.74% | | | | | |
| 3M Company | | | | 865 | 151,193 |
| General Electric Company | | | | 13,111 | 141,599 |
| Honeywell International Incorporated | | | | 1,053 | 223,973 |
| Roper Technologies Incorporated | | | | 157 | 67,681 |
| | | | | | 584,446 |
| Machinery: 1.00% | | | | | |
| Caterpillar Incorporated | | | | 813 | 147,982 |
| Cummins Incorporated | | | | 222 | 50,416 |
| Deere & Company | | | | 470 | 126,454 |
| Dover Corporation | | | | 215 | 27,144 |
| Flowserve Corporation | | | | 194 | 7,149 |
| Fortive Corporation | | | | 506 | 35,835 |
| IDEX Corporation | | | | 113 | 22,510 |
| Illinois Tool Works Incorporated | | | | 432 | 88,076 |
| Ingersoll Rand Incorporated † | | | | 558 | 25,422 |
| Otis Worldwide Corporation | | | | 611 | 41,273 |
| PACCAR Incorporated | | | | 520 | 44,866 |
| Parker-Hannifin Corporation | | | | 193 | �� 52,575 |
| Pentair plc | | | | 249 | 13,219 |
| Snap-on Incorporated | | | | 81 | 13,862 |
| Stanley Black & Decker Incorporated | | | | 240 | 42,854 |
| Wabtec Corporation | | | | 267 | 19,544 |
| Xylem Incorporated | | | | 270 | 27,483 |
| | | | | | 786,664 |
| Professional services: 0.20% | | | | | |
| Equifax Incorporated | | | | 182 | 35,097 |
| IHS Markit Limited | | | | 560 | 50,305 |
| Nielsen Holdings plc | | | | 533 | 11,124 |
| Robert Half International Incorporated | | | | 170 | 10,622 |
| Verisk Analytics Incorporated | | | | 242 | 50,237 |
| | | | | | 157,385 |
| Road & rail: 0.61% | | | | | |
| CSX Corporation | | | | 1,149 | 104,272 |
| J.B. Hunt Transport Services Incorporated | | | | 124 | 16,945 |
| Kansas City Southern | | | | 140 | 28,578 |
| Norfolk Southern Corporation | | | | 381 | 90,529 |
| Old Dominion Freight Line Incorporated | | | | 144 | 28,106 |
| Union Pacific Corporation | | | | 1,011 | 210,510 |
| | | | | | 478,940 |
| Trading companies & distributors: 0.12% | | | | | |
| Fastenal Company | | | | 859 | 41,945 |
| United Rentals Incorporated † | | | | 108 | 25,046 |
| W.W. Grainger Incorporated | | | | 68 | 27,767 |
| | | | | | 94,758 |
The accompanying notes are an integral part of these financial statements.
Wells Fargo VT Index Asset Allocation Fund | 19
Portfolio of investments—December 31, 2020
| | | | | Shares | Value |
| Information technology: 16.61% | | | | | |
| Communications equipment: 0.48% | | | | | |
| Arista Networks Incorporated † | | | | 82 | $ 23,827 |
| Cisco Systems Incorporated | | | | 6,324 | 282,999 |
| F5 Networks Incorporated † | | | | 92 | 16,186 |
| Juniper Networks Incorporated | | | | 494 | 11,120 |
| Motorola Solutions Incorporated | | | | 253 | 43,025 |
| | | | | | 377,157 |
| Electronic equipment, instruments & components: 0.36% | | | | | |
| Amphenol Corporation Class A | | | | 448 | 58,585 |
| CDW Corporation of Delaware | | | | 214 | 28,203 |
| Corning Incorporated | | | | 1,145 | 41,220 |
| FLIR Systems Incorporated | | | | 195 | 8,547 |
| IPG Photonics Corporation † | | | | 53 | 11,861 |
| Keysight Technologies Incorporated † | | | | 277 | 36,589 |
| TE Connectivity Limited | | | | 496 | 60,051 |
| Vontier Corporation † | | | | 201 | 6,713 |
| Zebra Technologies Corporation Class A † | | | | 80 | 30,746 |
| | | | | | 282,515 |
| IT services: 3.31% | | | | | |
| Accenture plc Class A | | | | 949 | 247,888 |
| Akamai Technologies Incorporated † | | | | 243 | 25,513 |
| Automatic Data Processing Incorporated | | | | 642 | 113,120 |
| Broadridge Financial Solutions Incorporated | | | | 173 | 26,504 |
| Cognizant Technology Solutions Corporation Class A | | | | 801 | 65,642 |
| DXC Technology Company | | | | 380 | 9,785 |
| Fidelity National Information Services Incorporated | | | | 927 | 131,133 |
| Fiserv Incorporated † | | | | 862 | 98,147 |
| FleetCor Technologies Incorporated † | | | | 125 | 34,104 |
| Gartner Incorporated † | | | | 133 | 21,305 |
| Global Payments Incorporated | | | | 447 | 96,293 |
| International Business Machines Corporation | | | | 1,337 | 168,302 |
| Jack Henry & Associates Incorporated | | | | 113 | 18,305 |
| Leidos Holdings Incorporated | | | | 199 | 20,919 |
| MasterCard Incorporated Class A | | | | 1,324 | 472,589 |
| Paychex Incorporated | | | | 479 | 44,633 |
| PayPal Holdings Incorporated † | | | | 1,758 | 411,724 |
| The Western Union Company | | | | 616 | 13,515 |
| VeriSign Incorporated † | | | | 150 | 32,460 |
| Visa Incorporated Class A | | | | 2,540 | 555,574 |
| | | | | | 2,607,455 |
| Semiconductors & semiconductor equipment: 3.09% | | | | | |
| Advanced Micro Devices Incorporated † | | | | 1,815 | 166,454 |
| Analog Devices Incorporated | | | | 554 | 81,842 |
| Applied Materials Incorporated | | | | 1,371 | 118,317 |
| Broadcom Incorporated | | | | 607 | 265,775 |
| Intel Corporation | | | | 6,145 | 306,144 |
| KLA Corporation | | | | 232 | 60,067 |
| Lam Research Corporation | | | | 216 | 102,010 |
| Maxim Integrated Products Incorporated | | | | 400 | 35,460 |
| Microchip Technology Incorporated | | | | 390 | 53,863 |
| Micron Technology Incorporated † | | | | 1,671 | 125,626 |
| NVIDIA Corporation | | | | 934 | 487,735 |
The accompanying notes are an integral part of these financial statements.
20 | Wells Fargo VT Index Asset Allocation Fund
Portfolio of investments—December 31, 2020
| | | | | Shares | Value |
| Semiconductors & semiconductor equipment (continued) | | | | | |
| Qorvo Incorporated † | | | | 171 | $ 28,432 |
| QUALCOMM Incorporated | | | | 1,693 | 257,912 |
| Skyworks Solutions Incorporated | | | | 248 | 37,914 |
| Teradyne Incorporated | | | | 248 | 29,733 |
| Texas Instruments Incorporated | | | | 1,377 | 226,007 |
| Xilinx Incorporated | | | | 367 | 52,030 |
| | | | | | 2,435,321 |
| Software: 5.16% | | | | | |
| Adobe Incorporated † | | | | 719 | 359,586 |
| ANSYS Incorporated † | | | | 129 | 46,930 |
| Autodesk Incorporated † | | | | 330 | 100,762 |
| Cadence Design Systems Incorporated † | | | | 418 | 57,028 |
| Citrix Systems Incorporated | | | | 184 | 23,938 |
| Fortinet Incorporated † | | | | 200 | 29,706 |
| Intuit Incorporated | | | | 392 | 148,901 |
| Microsoft Corporation | | | | 11,310 | 2,515,570 |
| NortonLifeLock Incorporated | | | | 885 | 18,390 |
| Oracle Corporation | | | | 2,838 | 183,590 |
| Paycom Software Incorporated † | | | | 73 | 33,014 |
| Salesforce.com Incorporated † | | | | 1,372 | 305,311 |
| ServiceNow Incorporated † | | | | 292 | 160,726 |
| Synopsys Incorporated † | | | | 229 | 59,366 |
| Tyler Technologies Incorporated † | | | | 60 | 26,191 |
| | | | | | 4,069,009 |
| Technology hardware, storage & peripherals: 4.21% | | | | | |
| Apple Incorporated | | | | 23,883 | 3,169,032 |
| Hewlett Packard Enterprise Company | | | | 1,925 | 22,811 |
| HP Incorporated | | | | 2,051 | 50,434 |
| NetApp Incorporated | | | | 333 | 22,058 |
| Seagate Technology plc | | | | 334 | 20,761 |
| Western Digital Corporation | | | | 454 | 25,147 |
| Xerox Holdings Corporation | | | | 248 | 5,751 |
| | | | | | 3,315,994 |
| Materials: 1.58% | | | | | |
| Chemicals: 1.10% | | | | | |
| Air Products & Chemicals Incorporated | | | | 332 | 90,709 |
| Albemarle Corporation | | | | 158 | 23,308 |
| Celanese Corporation Series A | | | | 175 | 22,740 |
| CF Industries Holdings Incorporated | | | | 320 | 12,387 |
| Corteva Incorporated | | | | 1,119 | 43,328 |
| Dow Incorporated | | | | 1,114 | 61,827 |
| DuPont de Nemours Incorporated | | | | 1,105 | 78,577 |
| Eastman Chemical Company | | | | 202 | 20,257 |
| Ecolab Incorporated | | | | 371 | 80,270 |
| FMC Corporation | | | | 194 | 22,296 |
| International Flavors & Fragrances Incorporated « | | | | 160 | 17,414 |
| Linde plc | | | | 788 | 207,646 |
| LyondellBasell Industries NV Class A | | | | 385 | 35,289 |
| PPG Industries Incorporated | | | | 353 | 50,910 |
The accompanying notes are an integral part of these financial statements.
Wells Fargo VT Index Asset Allocation Fund | 21
Portfolio of investments—December 31, 2020
| | | | | Shares | Value |
| Chemicals (continued) | | | | | |
| The Mosaic Company | | | | 518 | $ 11,919 |
| The Sherwin-Williams Company | | | | 122 | 89,659 |
| | | | | | 868,536 |
| Construction materials: 0.07% | | | | | |
| Martin Marietta Materials Incorporated | | | | 94 | 26,693 |
| Vulcan Materials Company | | | | 198 | 29,365 |
| | | | | | 56,058 |
| Containers & packaging: 0.21% | | | | | |
| Amcor plc | | | | 2,355 | 27,718 |
| Avery Dennison Corporation | | | | 125 | 19,389 |
| Ball Corporation | | | | 489 | 45,565 |
| International Paper Company | | | | 589 | 29,285 |
| Packaging Corporation of America | | | | 142 | 19,583 |
| Sealed Air Corporation | | | | 232 | 10,623 |
| WestRock Company | | | | 393 | 17,107 |
| | | | | | 169,270 |
| Metals & mining: 0.20% | | | | | |
| Freeport-McMoRan Incorporated | | | | 2,193 | 57,062 |
| Newmont Corporation | | | | 1,210 | 72,467 |
| Nucor Corporation | | | | 453 | 24,095 |
| | | | | | 153,624 |
| Real estate: 1.46% | | | | | |
| Equity REITs: 1.42% | | | | | |
| Alexandria Real Estate Equities Incorporated | | | | 185 | 32,971 |
| American Tower Corporation | | | | 667 | 149,715 |
| AvalonBay Communities Incorporated | | | | 208 | 33,369 |
| Boston Properties Incorporated | | | | 212 | 20,040 |
| Crown Castle International Corporation | | | | 647 | 102,996 |
| Digital Realty Trust Incorporated | | | | 419 | 58,455 |
| Duke Realty Corporation | | | | 556 | 22,223 |
| Equinix Incorporated | | | | 133 | 94,986 |
| Equity Residential | | | | 514 | 30,470 |
| Essex Property Trust Incorporated | | | | 98 | 23,267 |
| Extra Space Storage Incorporated | | | | 193 | 22,361 |
| Federal Realty Investment Trust | | | | 102 | 8,682 |
| Healthpeak Properties Incorporated | | | | 804 | 24,305 |
| Host Hotels & Resorts Incorporated | | | | 1,055 | 15,435 |
| Iron Mountain Incorporated | | | | 432 | 12,735 |
| Kimco Realty Corporation | | | | 649 | 9,741 |
| Mid-America Apartment Communities Incorporated | | | | 171 | 21,664 |
| Prologis Incorporated | | | | 1,110 | 110,623 |
| Public Storage Incorporated | | | | 228 | 52,652 |
| Realty Income Corporation | | | | 526 | 32,701 |
| Regency Centers Corporation | | | | 235 | 10,714 |
| SBA Communications Corporation | | | | 167 | 47,116 |
| Simon Property Group Incorporated | | | | 489 | 41,702 |
| SL Green Realty Corporation | | | | 107 | 6,375 |
| UDR Incorporated | | | | 441 | 16,948 |
| Ventas Incorporated | | | | 560 | 27,462 |
| Vornado Realty Trust | | | | 235 | 8,775 |
The accompanying notes are an integral part of these financial statements.
22 | Wells Fargo VT Index Asset Allocation Fund
Portfolio of investments—December 31, 2020
| | | | | Shares | Value |
| Equity REITs (continued) | | | | | |
| Welltower Incorporated | | | | 624 | $ 40,323 |
| Weyerhaeuser Company | | | | 1,119 | 37,520 |
| | | | | | 1,116,326 |
| Real estate management & development: 0.04% | | | | | |
| CBRE Group Incorporated Class A † | | | | 502 | 31,485 |
| Utilities: 1.66% | | | | | |
| Electric utilities: 1.06% | | | | | |
| Alliant Energy Corporation | | | | 374 | 19,272 |
| American Electric Power Company Incorporated | | | | 745 | 62,036 |
| Duke Energy Corporation | | | | 1,103 | 100,991 |
| Edison International | | | | 567 | 35,619 |
| Entergy Corporation | | | | 300 | 29,952 |
| Evergy Incorporated | | | | 340 | 18,873 |
| Eversource Energy | | | | 514 | 44,466 |
| Exelon Corporation | | | | 1,461 | 61,683 |
| FirstEnergy Corporation | | | | 816 | 24,978 |
| NextEra Energy Incorporated | | | | 2,939 | 226,744 |
| NRG Energy Incorporated | | | | 365 | 13,706 |
| Pinnacle West Capital Corporation | | | | 168 | 13,432 |
| PPL Corporation | | | | 1,154 | 32,543 |
| The Southern Company | | | | 1,585 | 97,367 |
| Xcel Energy Incorporated | | | | 788 | 52,536 |
| | | | | | 834,198 |
| Gas utilities: 0.02% | | | | | |
| Atmos Energy Corporation | | | | 188 | 17,941 |
| Independent power & renewable electricity producers: 0.03% | | | | | |
| AES Corporation | | | | 997 | 23,430 |
| Multi-utilities: 0.50% | | | | | |
| Ameren Corporation | | | | 370 | 28,882 |
| CenterPoint Energy Incorporated | | | | 817 | 17,680 |
| CMS Energy Corporation | | | | 430 | 26,234 |
| Consolidated Edison Incorporated | | | | 513 | 37,075 |
| Dominion Energy Incorporated | | | | 1,223 | 91,970 |
| DTE Energy Company | | | | 289 | 35,087 |
| NiSource Incorporated | | | | 575 | 13,191 |
| Public Service Enterprise Group Incorporated | | | | 759 | 44,250 |
| Sempra Energy | | | | 432 | 55,041 |
| WEC Energy Group Incorporated | | | | 473 | 43,530 |
| | | | | | 392,940 |
| Water utilities: 0.05% | | | | | |
| American Water Works Company Incorporated | | | | 271 | 41,590 |
| Total Common stocks (Cost $22,472,971) | | | | | 47,423,711 |
| | | Interest
rate | Maturity
date | Principal | |
| U.S. Treasury securities: 36.82% | | | | | |
| U.S. Treasury Bond | | 1.13 | 5-15-2040 | $109,000 | 103,312 |
| U.S. Treasury Bond | | 1.13 | 8-15-2040 | 145,000 | 137,048 |
The accompanying notes are an integral part of these financial statements.
Wells Fargo VT Index Asset Allocation Fund | 23
Portfolio of investments—December 31, 2020
| | | Interest
rate | Maturity
date | Principal | Value |
| U.S. Treasury securities (continued) | | | | | |
| U.S. Treasury Bond | | 1.25% | 5-15-2050 | $120,000 | $ 108,619 |
| U.S. Treasury Bond | | 1.38 | 11-15-2040 | 87,000 | 85,872 |
| U.S. Treasury Bond | | 1.38 | 8-15-2050 | 151,000 | 141,091 |
| U.S. Treasury Bond | | 1.50 | 1-31-2027 | 98,000 | 103,838 |
| U.S. Treasury Bond | | 1.50 | 2-15-2030 | 209,000 | 220,977 |
| U.S. Treasury Bond | | 1.63 | 11-15-2050 | 87,000 | 86,483 |
| U.S. Treasury Bond | | 2.00 | 2-15-2050 | 152,000 | 164,736 |
| U.S. Treasury Bond | | 2.13 | 9-30-2024 | 118,000 | 126,297 |
| U.S. Treasury Bond | | 2.13 | 11-30-2024 | 119,000 | 127,660 |
| U.S. Treasury Bond | | 2.25 | 8-15-2046 | 106,000 | 120,757 |
| U.S. Treasury Bond | | 2.25 | 8-15-2049 | 108,000 | 123,339 |
| U.S. Treasury Bond | | 2.38 | 11-15-2049 | 127,000 | 148,883 |
| U.S. Treasury Bond | | 2.50 | 2-15-2045 | 116,000 | 138,076 |
| U.S. Treasury Bond | | 2.50 | 2-15-2046 | 106,000 | 126,393 |
| U.S. Treasury Bond | | 2.50 | 5-15-2046 | 105,000 | 125,196 |
| U.S. Treasury Bond | | 2.75 | 8-15-2042 | 66,000 | 81,688 |
| U.S. Treasury Bond | | 2.75 | 11-15-2042 | 78,000 | 96,473 |
| U.S. Treasury Bond | | 2.75 | 8-15-2047 | 101,000 | 126,376 |
| U.S. Treasury Bond | | 2.75 | 11-15-2047 | 100,000 | 125,246 |
| U.S. Treasury Bond | | 2.88 | 5-15-2028 | 178,000 | 206,139 |
| U.S. Treasury Bond | | 2.88 | 5-15-2043 | 111,000 | 140,085 |
| U.S. Treasury Bond | | 2.88 | 8-15-2045 | 115,000 | 146,046 |
| U.S. Treasury Bond | | 2.88 | 11-15-2046 | 104,000 | 132,616 |
| U.S. Treasury Bond | | 2.88 | 5-15-2049 | 140,000 | 180,392 |
| U.S. Treasury Bond | | 3.00 | 5-15-2042 | 40,000 | 51,361 |
| U.S. Treasury Bond | | 3.00 | 11-15-2044 | 114,000 | 147,274 |
| U.S. Treasury Bond | | 3.00 | 5-15-2045 | 116,000 | 150,229 |
| U.S. Treasury Bond | | 3.00 | 11-15-2045 | 115,000 | 149,379 |
| U.S. Treasury Bond | | 3.00 | 2-15-2047 | 106,000 | 138,338 |
| U.S. Treasury Bond | | 3.00 | 5-15-2047 | 104,000 | 135,935 |
| U.S. Treasury Bond | | 3.00 | 2-15-2048 | 114,000 | 149,362 |
| U.S. Treasury Bond | | 3.00 | 8-15-2048 | 121,000 | 158,864 |
| U.S. Treasury Bond | | 3.00 | 2-15-2049 | 140,000 | 184,308 |
| U.S. Treasury Bond | | 3.13 | 11-15-2041 | 37,000 | 48,314 |
| U.S. Treasury Bond | | 3.13 | 2-15-2042 | 46,000 | 60,220 |
| U.S. Treasury Bond | | 3.13 | 2-15-2043 | 79,000 | 103,444 |
| U.S. Treasury Bond | | 3.13 | 8-15-2044 | 115,000 | 151,400 |
| U.S. Treasury Bond | | 3.13 | 5-15-2048 | 123,000 | 164,791 |
| U.S. Treasury Bond | | 3.38 | 5-15-2044 | 110,000 | 150,167 |
| U.S. Treasury Bond | | 3.38 | 11-15-2048 | 135,000 | 189,253 |
| U.S. Treasury Bond | | 3.50 | 2-15-2039 | 29,000 | 39,329 |
| U.S. Treasury Bond | | 3.63 | 8-15-2043 | 88,000 | 124,073 |
| U.S. Treasury Bond | | 3.63 | 2-15-2044 | 113,000 | 159,741 |
| U.S. Treasury Bond | | 3.75 | 8-15-2041 | 36,000 | 51,078 |
| U.S. Treasury Bond | | 3.75 | 11-15-2043 | 110,000 | 158,065 |
| U.S. Treasury Bond | | 3.88 | 8-15-2040 | 37,000 | 52,953 |
| U.S. Treasury Bond | | 4.25 | 5-15-2039 | 31,000 | 45,945 |
| U.S. Treasury Bond | | 4.25 | 11-15-2040 | 40,000 | 59,997 |
| U.S. Treasury Bond | | 4.38 | 2-15-2038 | 18,000 | 26,729 |
| U.S. Treasury Bond | | 4.38 | 11-15-2039 | 35,000 | 52,860 |
| U.S. Treasury Bond | | 4.38 | 5-15-2040 | 35,000 | 53,046 |
| U.S. Treasury Bond | | 4.38 | 5-15-2041 | 33,000 | 50,514 |
| U.S. Treasury Bond | | 4.50 | 2-15-2036 | 26,000 | 38,121 |
| U.S. Treasury Bond | | 4.50 | 5-15-2038 | 21,000 | 31,678 |
| U.S. Treasury Bond | | 4.50 | 8-15-2039 | 33,000 | 50,426 |
The accompanying notes are an integral part of these financial statements.
24 | Wells Fargo VT Index Asset Allocation Fund
Portfolio of investments—December 31, 2020
| | | Interest
rate | Maturity
date | Principal | Value |
| U.S. Treasury securities (continued) | | | | | |
| U.S. Treasury Bond | | 4.63% | 2-15-2040 | $ 38,000 | $ 59,161 |
| U.S. Treasury Bond | | 4.75 | 2-15-2037 | 13,000 | 19,797 |
| U.S. Treasury Bond | | 4.75 | 2-15-2041 | 44,000 | 70,190 |
| U.S. Treasury Bond | | 5.00 | 5-15-2037 | 17,000 | 26,616 |
| U.S. Treasury Bond | | 5.25 | 11-15-2028 | 45,000 | 60,645 |
| U.S. Treasury Bond | | 5.25 | 2-15-2029 | 33,000 | 44,712 |
| U.S. Treasury Bond | | 5.38 | 2-15-2031 | 31,000 | 44,539 |
| U.S. Treasury Bond | | 5.50 | 8-15-2028 | 35,000 | 47,496 |
| U.S. Treasury Bond | | 6.13 | 11-15-2027 | 49,000 | 67,275 |
| U.S. Treasury Bond | | 6.13 | 8-15-2029 | 25,000 | 36,215 |
| U.S. Treasury Bond | | 6.25 | 5-15-2030 | 21,000 | 31,283 |
| U.S. Treasury Bond | | 6.38 | 8-15-2027 | 21,000 | 28,945 |
| U.S. Treasury Bond | | 6.88 | 8-15-2025 | 21,000 | 27,308 |
| U.S. Treasury Note | | 0.13 | 11-30-2022 | 178,000 | 178,014 |
| U.S. Treasury Note | | 0.13 | 5-15-2023 | 117,000 | 116,959 |
| U.S. Treasury Note | | 0.13 | 7-15-2023 | 123,000 | 122,933 |
| U.S. Treasury Note | | 0.13 | 8-15-2023 | 128,000 | 127,920 |
| U.S. Treasury Note | | 0.13 | 9-15-2023 | 143,000 | 142,888 |
| U.S. Treasury Note | | 0.13 | 10-15-2023 | 146,000 | 145,886 |
| U.S. Treasury Note | | 0.25 | 4-15-2023 | 119,000 | 119,284 |
| U.S. Treasury Note | | 0.25 | 6-15-2023 | 122,000 | 122,305 |
| U.S. Treasury Note | | 0.25 | 11-15-2023 | 172,000 | 172,470 |
| U.S. Treasury Note | | 0.25 | 5-31-2025 | 132,000 | 131,727 |
| U.S. Treasury Note | | 0.25 | 6-30-2025 | 142,000 | 141,612 |
| U.S. Treasury Note | | 0.25 | 7-31-2025 | 147,000 | 146,541 |
| U.S. Treasury Note | | 0.25 | 8-31-2025 | 153,000 | 152,474 |
| U.S. Treasury Note | | 0.25 | 10-31-2025 | 176,000 | 175,203 |
| U.S. Treasury Note | | 0.38 | 4-30-2025 | 126,000 | 126,438 |
| U.S. Treasury Note | | 0.38 | 11-30-2025 | 181,000 | 181,212 |
| U.S. Treasury Note | | 0.38 | 7-31-2027 | 134,000 | 132,189 |
| U.S. Treasury Note | | 0.38 | 9-30-2027 | 155,000 | 152,566 |
| U.S. Treasury Note | | 0.50 | 3-15-2023 | 104,000 | 104,837 |
| U.S. Treasury Note | | 0.50 | 3-31-2025 | 120,000 | 121,088 |
| U.S. Treasury Note | | 0.50 | 4-30-2027 | 98,000 | 97,721 |
| U.S. Treasury Note | | 0.50 | 5-31-2027 | 111,000 | 110,566 |
| U.S. Treasury Note | | 0.50 | 6-30-2027 | 122,000 | 121,442 |
| U.S. Treasury Note | | 0.50 | 8-31-2027 | 142,000 | 141,079 |
| U.S. Treasury Note | | 0.50 | 10-31-2027 | 168,000 | 166,609 |
| U.S. Treasury Note | | 0.63 | 3-31-2027 | 81,000 | 81,456 |
| U.S. Treasury Note | | 0.63 | 11-30-2027 | 179,000 | 178,888 |
| U.S. Treasury Note | | 0.63 | 5-15-2030 | 178,000 | 173,912 |
| U.S. Treasury Note | | 0.63 | 8-15-2030 | 222,000 | 216,311 |
| U.S. Treasury Note | | 0.88 | 11-15-2030 | 132,000 | 131,484 |
| U.S. Treasury Note | | 1.13 | 2-28-2025 | 118,000 | 122,144 |
| U.S. Treasury Note | | 1.13 | 2-28-2027 | 47,000 | 48,722 |
| U.S. Treasury Note | | 1.25 | 7-31-2023 | 67,000 | 68,903 |
| U.S. Treasury Note | | 1.25 | 8-31-2024 | 104,000 | 107,872 |
| U.S. Treasury Note | | 1.38 | 2-15-2023 | 82,000 | 84,156 |
| U.S. Treasury Note | | 1.38 | 6-30-2023 | 64,000 | 65,955 |
| U.S. Treasury Note | | 1.38 | 8-31-2023 | 124,000 | 128,040 |
| U.S. Treasury Note | | 1.38 | 9-30-2023 | 90,000 | 93,020 |
| U.S. Treasury Note | | 1.38 | 1-31-2025 | 105,000 | 109,709 |
| U.S. Treasury Note | | 1.38 | 8-31-2026 | 95,000 | 99,898 |
| U.S. Treasury Note | | 1.50 | 1-31-2022 | 128,000 | 129,900 |
| U.S. Treasury Note | | 1.50 | 1-15-2023 | 79,000 | 81,197 |
The accompanying notes are an integral part of these financial statements.
Wells Fargo VT Index Asset Allocation Fund | 25
Portfolio of investments—December 31, 2020
| | | Interest
rate | Maturity
date | Principal | Value |
| U.S. Treasury securities (continued) | | | | | |
| U.S. Treasury Note | | 1.50% | 2-28-2023 | $126,000 | $ 129,701 |
| U.S. Treasury Note | | 1.50 | 3-31-2023 | 126,000 | 129,829 |
| U.S. Treasury Note | | 1.50 | 9-30-2024 | 108,000 | 113,079 |
| U.S. Treasury Note | | 1.50 | 10-31-2024 | 114,000 | 119,464 |
| U.S. Treasury Note | | 1.50 | 11-30-2024 | 122,000 | 127,914 |
| U.S. Treasury Note | | 1.50 | 8-15-2026 | 102,000 | 107,977 |
| U.S. Treasury Note | | 1.63 | 8-15-2022 | 117,000 | 119,838 |
| U.S. Treasury Note | | 1.63 | 8-31-2022 | 151,000 | 154,746 |
| U.S. Treasury Note | | 1.63 | 11-15-2022 | 150,000 | 154,172 |
| U.S. Treasury Note | | 1.63 | 12-15-2022 | 104,000 | 107,031 |
| U.S. Treasury Note | | 1.63 | 4-30-2023 | 66,000 | 68,271 |
| U.S. Treasury Note | | 1.63 | 5-31-2023 | 64,000 | 66,278 |
| U.S. Treasury Note | | 1.63 | 10-31-2023 | 90,000 | 93,748 |
| U.S. Treasury Note | | 1.63 | 2-15-2026 | 102,000 | 108,463 |
| U.S. Treasury Note | | 1.63 | 5-15-2026 | 105,000 | 111,772 |
| U.S. Treasury Note | | 1.63 | 9-30-2026 | 97,000 | 103,381 |
| U.S. Treasury Note | | 1.63 | 10-31-2026 | 94,000 | 100,220 |
| U.S. Treasury Note | | 1.63 | 11-30-2026 | 97,000 | 103,449 |
| U.S. Treasury Note | | 1.63 | 8-15-2029 | 157,000 | 167,855 |
| U.S. Treasury Note | | 1.75 | 2-28-2022 | 129,000 | 131,439 |
| U.S. Treasury Note | | 1.75 | 3-31-2022 | 128,000 | 130,600 |
| U.S. Treasury Note | | 1.75 | 4-30-2022 | 126,000 | 128,737 |
| U.S. Treasury Note | | 1.75 | 5-15-2022 | 111,000 | 113,471 |
| U.S. Treasury Note | | 1.75 | 5-31-2022 | 149,000 | 152,428 |
| U.S. Treasury Note | | 1.75 | 6-30-2022 | 149,000 | 152,620 |
| U.S. Treasury Note | | 1.75 | 9-30-2022 | 144,000 | 148,061 |
| U.S. Treasury Note | | 1.75 | 1-31-2023 | 129,000 | 133,334 |
| U.S. Treasury Note | | 1.75 | 5-15-2023 | 113,000 | 117,290 |
| U.S. Treasury Note | | 1.75 | 7-31-2024 | 110,000 | 116,011 |
| U.S. Treasury Note | | 1.75 | 12-31-2024 | 99,000 | 104,859 |
| U.S. Treasury Note | | 1.75 | 12-31-2026 | 99,000 | 106,355 |
| U.S. Treasury Note | | 1.75 | 11-15-2029 | 178,000 | 192,261 |
| U.S. Treasury Note | | 1.88 | 1-31-2022 | 157,000 | 159,968 |
| U.S. Treasury Note | | 1.88 | 2-28-2022 | 153,000 | 156,108 |
| U.S. Treasury Note | | 1.88 | 3-31-2022 | 153,000 | 156,347 |
| U.S. Treasury Note | | 1.88 | 4-30-2022 | 153,000 | 156,562 |
| U.S. Treasury Note | | 1.88 | 5-31-2022 | 128,000 | 131,170 |
| U.S. Treasury Note | | 1.88 | 7-31-2022 | 149,000 | 153,109 |
| U.S. Treasury Note | | 1.88 | 8-31-2022 | 142,000 | 146,110 |
| U.S. Treasury Note | | 1.88 | 9-30-2022 | 144,000 | 148,365 |
| U.S. Treasury Note | | 1.88 | 10-31-2022 | 143,000 | 147,564 |
| U.S. Treasury Note | | 1.88 | 8-31-2024 | 125,000 | 132,524 |
| U.S. Treasury Note | | 1.88 | 6-30-2026 | 98,000 | 105,718 |
| U.S. Treasury Note | | 1.88 | 7-31-2026 | 99,000 | 106,854 |
| U.S. Treasury Note | | 2.00 | 12-31-2021 | 155,000 | 157,894 |
| U.S. Treasury Note | | 2.00 | 2-15-2022 | 133,000 | 135,790 |
| U.S. Treasury Note | | 2.00 | 7-31-2022 | 144,000 | 148,236 |
| U.S. Treasury Note | | 2.00 | 10-31-2022 | 143,000 | 147,882 |
| U.S. Treasury Note | | 2.00 | 11-30-2022 | 129,000 | 133,616 |
| U.S. Treasury Note | | 2.00 | 2-15-2023 | 118,000 | 122,637 |
| U.S. Treasury Note | | 2.00 | 4-30-2024 | 123,000 | 130,356 |
| U.S. Treasury Note | | 2.00 | 5-31-2024 | 123,000 | 130,519 |
| U.S. Treasury Note | | 2.00 | 6-30-2024 | 123,000 | 130,678 |
| U.S. Treasury Note | | 2.00 | 2-15-2025 | 289,000 | 309,377 |
| U.S. Treasury Note | | 2.00 | 8-15-2025 | 220,000 | 236,921 |
The accompanying notes are an integral part of these financial statements.
26 | Wells Fargo VT Index Asset Allocation Fund
Portfolio of investments—December 31, 2020
| | | Interest
rate | Maturity
date | Principal | Value |
| U.S. Treasury securities (continued) | | | | | |
| U.S. Treasury Note | | 2.00% | 11-15-2026 | $170,000 | $ 184,975 |
| U.S. Treasury Note | | 2.13 | 12-31-2021 | 126,000 | 128,510 |
| U.S. Treasury Note | | 2.13 | 6-30-2022 | 126,000 | 129,765 |
| U.S. Treasury Note | | 2.13 | 12-31-2022 | 129,000 | 134,125 |
| U.S. Treasury Note | | 2.13 | 11-30-2023 | 110,000 | 116,291 |
| U.S. Treasury Note | | 2.13 | 2-29-2024 | 128,000 | 135,835 |
| U.S. Treasury Note | | 2.13 | 3-31-2024 | 127,000 | 134,918 |
| U.S. Treasury Note | | 2.13 | 7-31-2024 | 123,000 | 131,389 |
| U.S. Treasury Note | | 2.13 | 5-15-2025 | 234,000 | 252,519 |
| U.S. Treasury Note | | 2.13 | 5-31-2026 | 97,000 | 105,866 |
| U.S. Treasury Note | | 2.25 | 12-31-2023 | 127,000 | 134,913 |
| U.S. Treasury Note | | 2.25 | 1-31-2024 | 127,000 | 135,101 |
| U.S. Treasury Note | | 2.25 | 4-30-2024 | 120,000 | 128,161 |
| U.S. Treasury Note | | 2.25 | 10-31-2024 | 121,000 | 130,255 |
| U.S. Treasury Note | | 2.25 | 11-15-2024 | 290,000 | 312,362 |
| U.S. Treasury Note | | 2.25 | 12-31-2024 | 118,000 | 127,329 |
| U.S. Treasury Note | | 2.25 | 11-15-2025 | 219,000 | 239,104 |
| U.S. Treasury Note | | 2.25 | 3-31-2026 | 99,000 | 108,552 |
| U.S. Treasury Note | | 2.25 | 2-15-2027 | 196,000 | 216,580 |
| U.S. Treasury Note | | 2.25 | 8-15-2027 | 101,000 | 111,948 |
| U.S. Treasury Note | | 2.25 | 11-15-2027 | 99,000 | 109,882 |
| U.S. Treasury Note | | 2.38 | 1-31-2023 | 144,000 | 150,694 |
| U.S. Treasury Note | | 2.38 | 2-29-2024 | 84,000 | 89,782 |
| U.S. Treasury Note | | 2.38 | 8-15-2024 | 289,000 | 311,443 |
| U.S. Treasury Note | | 2.38 | 4-30-2026 | 98,000 | 108,190 |
| U.S. Treasury Note | | 2.38 | 5-15-2027 | 164,000 | 182,866 |
| U.S. Treasury Note | | 2.38 | 5-15-2029 | 90,000 | 101,658 |
| U.S. Treasury Note | | 2.50 | 3-31-2023 | 83,000 | 87,390 |
| U.S. Treasury Note | | 2.50 | 8-15-2023 | 102,000 | 108,263 |
| U.S. Treasury Note | | 2.50 | 1-31-2024 | 103,000 | 110,343 |
| U.S. Treasury Note | | 2.50 | 5-15-2024 | 281,000 | 302,767 |
| U.S. Treasury Note | | 2.50 | 1-31-2025 | 116,000 | 126,499 |
| U.S. Treasury Note | | 2.50 | 2-28-2026 | 97,000 | 107,511 |
| U.S. Treasury Note | | 2.63 | 2-28-2023 | 146,000 | 153,819 |
| U.S. Treasury Note | | 2.63 | 6-30-2023 | 83,000 | 88,103 |
| U.S. Treasury Note | | 2.63 | 12-31-2023 | 97,000 | 104,101 |
| U.S. Treasury Note | | 2.63 | 3-31-2025 | 114,000 | 125,231 |
| U.S. Treasury Note | | 2.63 | 12-31-2025 | 97,000 | 107,848 |
| U.S. Treasury Note | | 2.63 | 1-31-2026 | 95,000 | 105,784 |
| U.S. Treasury Note | | 2.63 | 2-15-2029 | 181,000 | 207,676 |
| U.S. Treasury Note | | 2.75 | 4-30-2023 | 82,000 | 86,952 |
| U.S. Treasury Note | | 2.75 | 5-31-2023 | 82,000 | 87,131 |
| U.S. Treasury Note | | 2.75 | 7-31-2023 | 80,000 | 85,350 |
| U.S. Treasury Note | | 2.75 | 8-31-2023 | 145,000 | 154,974 |
| U.S. Treasury Note | | 2.75 | 11-15-2023 | 134,000 | 143,930 |
| U.S. Treasury Note | | 2.75 | 2-15-2024 | 217,000 | 234,377 |
| U.S. Treasury Note | | 2.75 | 2-28-2025 | 121,000 | 133,351 |
| U.S. Treasury Note | | 2.75 | 6-30-2025 | 119,000 | 131,932 |
| U.S. Treasury Note | | 2.75 | 8-31-2025 | 122,000 | 135,625 |
| U.S. Treasury Note | | 2.75 | 2-15-2028 | 189,000 | 216,641 |
| U.S. Treasury Note | | 2.88 | 9-30-2023 | 148,000 | 158,979 |
| U.S. Treasury Note | | 2.88 | 10-31-2023 | 84,000 | 90,418 |
| U.S. Treasury Note | | 2.88 | 11-30-2023 | 76,000 | 81,970 |
| U.S. Treasury Note | | 2.88 | 4-30-2025 | 114,000 | 126,638 |
| U.S. Treasury Note | | 2.88 | 5-31-2025 | 117,000 | 130,158 |
The accompanying notes are an integral part of these financial statements.
Wells Fargo VT Index Asset Allocation Fund | 27
Portfolio of investments—December 31, 2020
| | | Interest
rate | Maturity
date | Principal | Value |
| U.S. Treasury securities (continued) | | | | | |
| U.S. Treasury Note | | 2.88% | 7-31-2025 | $118,000 | $ 131,694 |
| U.S. Treasury Note | | 2.88 | 11-30-2025 | 96,000 | 107,764 |
| U.S. Treasury Note | | 2.88 | 8-15-2028 | 190,000 | 220,600 |
| U.S. Treasury Note | | 3.00 | 9-30-2025 | 121,000 | 136,139 |
| U.S. Treasury Note | | 3.00 | 10-31-2025 | 76,000 | 85,654 |
| U.S. Treasury Note | | 3.13 | 11-15-2028 | 226,000 | 267,448 |
| U.S. Treasury Note | | 6.00 | 2-15-2026 | 42,000 | 54,016 |
| U.S. Treasury Note | | 6.25 | 8-15-2023 | 17,000 | 19,717 |
| U.S. Treasury Note | | 6.50 | 11-15-2026 | 28,000 | 37,763 |
| U.S. Treasury Note | | 6.63 | 2-15-2027 | 18,000 | 24,660 |
| U.S. Treasury Note | | 6.75 | 8-15-2026 | 21,000 | 28,355 |
| U.S. Treasury Note | | 7.13 | 2-15-2023 | 24,000 | 27,553 |
| U.S. Treasury Note | | 7.25 | 8-15-2022 | 24,000 | 26,771 |
| U.S. Treasury Note | | 7.50 | 11-15-2024 | 22,000 | 28,164 |
| U.S. Treasury Note | | 7.63 | 11-15-2022 | 12,000 | 13,681 |
| U.S. Treasury Note | | 7.63 | 2-15-2025 | 20,000 | 26,028 |
| Total U.S. Treasury securities (Cost $26,878,451) | | | | | 29,010,284 |
| | | Yield | | Shares | |
| Short-term investments: 1.15% | | | | | |
| Investment companies: 1.15% | | | | | |
| Securities Lending Cash Investments LLC ♠∩∞ | | 0.16% | | 11,350 | 11,350 |
| Wells Fargo Government Money Market Fund Select Class ♠∞ | | 0.03 | | 898,399 | 898,399 |
| Total Short-term investments (Cost $909,749) | | | | | 909,749 |
| Total investments in securities (Cost $50,261,171) | 98.16% | | | | 77,343,744 |
| Other assets and liabilities, net | 1.84 | | | | 1,447,504 |
| Total net assets | 100.00% | | | | $ 78,791,248 |
| † | Non-income-earning security |
| « | All or a portion of this security is on loan. |
| ♠ | The issuer of the security is an affiliated person of the Fund as defined in the Investment Company Act of 1940. |
| ∩ | The investment is a non-registered investment company purchased with cash collateral received from securities on loan. |
| ∞ | The rate represents the 7-day annualized yield at period end. |
| Abbreviations: |
| REIT | Real estate investment trust |
The accompanying notes are an integral part of these financial statements.
28 | Wells Fargo VT Index Asset Allocation Fund
Portfolio of investments—December 31, 2020
Investments in affiliates
An affiliated investment is an investment in which the Fund owns at least 5% of the outstanding voting shares of the issuer or as a result of other relationships, such as the Fund and the issuer having the same investment manager. Transactions with issuers that were either affiliated persons of the Fund at the beginning of the period or the end of the period were as follows:
| | Value,
beginning of
period | Purchases | Sales
proceeds | Net
realized
gains
(losses) | | Net
change in
unrealized
gains
(losses) | | Value,
end of
period | | % of
net
assets | Shares,
end
of period | Income
from
affiliated
securities |
| Common stocks | | | | | | | | | | | |
| Financials | | | | | | | | | |
| Banks | | | | | | | | | |
| Wells Fargo & Company | $337,379 | $ 29,044 | $ (34,927) | $ 1,734 | | $ (146,144) | | $ 187,086 | | 0.24% | 6,199 | $ 7,596 |
| Short-term investments | | | | | | | | | | | | |
| Investment companies | | | | | | | | | | | | |
| Securities Lending Cash Investments LLC | 0 | 85,300 | (73,950) | 0 | | 0 | | 11,350 | | | 11,350 | 35 # |
| Wells Fargo Government Money Market Fund Select Class | 126,233 | 19,657,510 | (18,885,344) | 0 | | 0 | | 898,399 | | | 898,399 | 3,963 |
| | | | | | | | | 909,749 | | 1.15 | | |
| | | | | $1,734 | | $(146,144) | | $1,096,835 | | 1.39% | | $11,594 |
| # | Amount shown represents income before fees and rebates. |
Futures contracts
| Description | Number of
contracts | Expiration
date | Notional
cost | Notional
value | Unrealized
gains | | Unrealized
losses |
| Long | | | | | | | |
| E-Mini S&P 500 Index | 19 | 3-19-2021 | $3,477,899 | $3,561,360 | $ 83,461 | | $ 0 |
| 10-Year U.S. Treasury Notes | 71 | 3-22-2021 | 9,780,233 | 9,803,547 | 23,314 | | 0 |
| U.S. Treasury Bond | 1 | 3-22-2021 | 173,034 | 173,187 | 153 | | 0 |
| U.S. Ultra Bond | 2 | 3-22-2021 | 427,138 | 427,125 | 0 | | (13) |
| 2-Year U.S. Treasury Notes | 4 | 3-31-2021 | 883,546 | 883,906 | 360 | | 0 |
| Short | | | | | | | |
| 5-Year U.S. Treasury Notes | (2) | 3-31-2021 | (251,932) | (252,328) | 0 | | (396) |
| | | | | | $107,288 | | $(409) |
The accompanying notes are an integral part of these financial statements.
Wells Fargo VT Index Asset Allocation Fund | 29
Statement of assets and liabilities—December 31, 2020
| | |
| Assets | |
Investments in unaffiliated securities (including $10,884 of securities loaned), at value (cost $49,162,371)
| $ 76,246,909 |
Investments in affiliated securites, at value (cost $1,098,800)
| 1,096,835 |
Receivable for investments sold
| 1,029,511 |
Segregated cash for futures contracts
| 290,981 |
Receivable for dividends and interest
| 170,524 |
Receivable for daily variation margin on open futures contracts
| 32,621 |
Receivable for Fund shares sold
| 180 |
Receivable for securities lending income, net
| 27 |
Prepaid expenses and other assets
| 26,720 |
Total assets
| 78,894,308 |
| Liabilities | |
Management fee payable
| 32,998 |
Payable for Fund shares redeemed
| 22,948 |
Distribution fee payable
| 18,201 |
Payable upon receipt of securities loaned
| 11,350 |
Custodian and accounting fee payable
| 7,554 |
Administration fee payable
| 5,823 |
Trustees’ fees and expenses payable
| 2,935 |
Payable for investments purchased
| 1,251 |
Total liabilities
| 103,060 |
Total net assets
| $78,791,248 |
| Net assets consist of | |
Paid-in capital
| $ 45,589,576 |
Total distributable earnings
| 33,201,672 |
Total net assets
| $78,791,248 |
| Computation of net asset value per share | |
Net assets - Class 2
| $ 78,791,248 |
Share outstanding - Class 21
| 3,600,515 |
Net asset value per share - Class 2
| $21.88 |
| 1 | The Fund has an unlimited number of authorized shares |
The accompanying notes are an integral part of these financial statements.
30 | Wells Fargo VT Index Asset Allocation Fund
Statement of operations—year ended December 31, 2020
| | |
| Investment income | |
Dividends
| $ 780,403 |
Interest
| 507,907 |
Income from affiliated securities
| 11,735 |
Total investment income
| 1,300,045 |
| Expenses | |
Management fee
| 437,643 |
Administration fee - Class 2
| 58,352 |
Distribution fee - Class 2
| 179,558 |
Custody and accounting fees
| 36,470 |
Professional fees
| 43,561 |
Shareholder report expenses
| 29,533 |
Trustees’ fees and expenses
| 19,134 |
Other fees and expenses
| 25,320 |
Total expenses
| 829,571 |
| Less: Fee waivers and/or expense reimbursements | |
Fund-level
| (100,166) |
Net expenses
| 729,405 |
Net investment income
| 570,640 |
| Realized and unrealized gains (losses) on investments | |
| Net realized gains on | |
Unaffiliated securities
| 6,181,795 |
Affiliated securities
| 1,734 |
Futures contracts
| 1,348,498 |
Net realized gains on investments
| 7,532,027 |
| Net change in unrealized gains (losses) on | |
Unaffiliated securities
| 3,210,348 |
Affiliated securities
| (146,144) |
Futures contracts
| 148,890 |
Net change in unrealized gains (losses) on investments
| 3,213,094 |
Net realized and unrealized gains (losses) on investments
| 10,745,121 |
Net increase in net assets resulting from operations
| $11,315,761 |
The accompanying notes are an integral part of these financial statements.
Wells Fargo VT Index Asset Allocation Fund | 31
Statement of changes in net assets
| | |
| | Year ended
December 31, 2020 | Year ended
December 31, 2019 |
| Operations | | | | |
Net investment income
| | $ 570,640 | | $ 779,366 |
Net realized gains on investments
| | 7,532,027 | | 5,395,088 |
Net change in unrealized gains (losses) on investments
| | 3,213,094 | | 7,066,026 |
Net increase in net assets resulting from operations
| | 11,315,761 | | 13,240,480 |
| Distributions to shareholders from | | | | |
Net investment income and net realized gains - Class 2
| | (6,314,848) | | (5,335,197) |
| Capital share transactions | Shares | | Shares | |
Proceeds from shares sold - Class 2
| 180,317 | 3,691,931 | 75,995 | 1,504,042 |
Reinvestment of distributions - Class 2
| 318,519 | 6,314,848 | 269,720 | 5,335,197 |
Payment for shares redeemed - Class 2
| (411,678) | (8,409,040) | (570,099) | (11,403,024) |
Net increase (decrease) in net assets resulting from capital share transactions
| | 1,597,739 | | (4,563,785) |
Total increase in net assets
| | 6,598,652 | | 3,341,498 |
| Net assets | | | | |
Beginning of period
| | 72,192,596 | | 68,851,098 |
End of period
| | $78,791,248 | | $ 72,192,596 |
The accompanying notes are an integral part of these financial statements.
32 | Wells Fargo VT Index Asset Allocation Fund
Financial highlights
(For a share outstanding throughout each period)
| | Year ended December 31 |
| Class 2 | 2020 | 2019 | 2018 | 2017 | 2016 |
Net asset value, beginning of period
| $20.55 | $18.42 | $20.45 | $19.16 | $18.47 |
Net investment income
| 0.16 | 0.22 | 0.20 | 0.17 | 0.17 |
Net realized and unrealized gains (losses) on investments
| 3.04 | 3.42 | (0.70) | 2.12 | 1.22 |
Total from investment operations
| 3.20 | 3.64 | (0.50) | 2.29 | 1.39 |
| Distributions to shareholders from | | | | | |
Net investment income
| (0.17) | (0.22) | (0.20) | (0.15) | (0.17) |
Net realized gains
| (1.70) | (1.29) | (1.33) | (0.85) | (0.53) |
Total distributions to shareholders
| (1.87) | (1.51) | (1.53) | (1.00) | (0.70) |
Net asset value, end of period
| $21.88 | $20.55 | $18.42 | $20.45 | $19.16 |
Total return1
| 16.59% | 20.16% | (2.90)% | 12.25% | 7.67% |
| Ratios to average net assets (annualized) | | | | | |
Gross expenses
| 1.14% | 1.05% | 1.05% | 1.16% | 1.10% |
Net expenses
| 1.00% | 1.00% | 1.00% | 1.00% | 1.00% |
Net investment income
| 0.78% | 1.07% | 0.94% | 0.86% | 0.93% |
| Supplemental data | | | | | |
Portfolio turnover rate
| 21% | 4% | 10% | 10% | 15% |
Net assets, end of period (000s omitted)
| $78,791 | $72,193 | $68,851 | $81,956 | $81,505 |
| 1 | Performance figures of the Fund do not reflect fees and expenses charged pursuant to the terms of variable life insurance policies and variable annuity contracts. |
The accompanying notes are an integral part of these financial statements.
Wells Fargo VT Index Asset Allocation Fund | 33
Notes to financial statements
1. ORGANIZATION
Wells Fargo Variable Trust (the “Trust”), a Delaware statutory trust organized on March 10, 1999, is an open-end management investment company registered under the Investment Company Act of 1940, as amended (the “1940 Act”). As an investment company, the Trust follows the accounting and reporting guidance in Financial Accounting Standards Board (“FASB”) Accounting Standards Codification Topic 946, Financial Services – Investment Companies. These financial statements report on the Wells Fargo VT Index Asset Allocation Fund (the “Fund”) which is a diversified series of the Trust. The Trust offers shares of the Fund to separate accounts of various life insurance companies as funding vehicles for certain variable annuity contracts and variable life insurance policies.
2. SIGNIFICANT ACCOUNTING POLICIES
The following significant accounting policies, which are consistently followed in the preparation of the financial statements of the Fund, are in conformity with U.S. generally accepted accounting principles which require management to make estimates and assumptions that affect the reported amounts of assets and liabilities, disclosure of contingent assets and liabilities at the date of the financial statements, and the reported amounts of income and expenses during the reporting period. Actual results could differ from those estimates.
Securities valuation
All investments are valued each business day as of the close of regular trading on the New York Stock Exchange (generally 4 p.m. Eastern Time), although the Fund may deviate from this calculation time under unusual or unexpected circumstances.
Equity securities and futures contracts that are listed on a foreign or domestic exchange or market are valued at the official closing price or, if none, the last sales price. If no sale occurs on the principal exchange or market that day, a fair value price will be determined in accordance with the Fund’s Valuation Procedures.
Debt securities are valued at the evaluated bid price provided by an independent pricing service (e.g. taking into account various factors, including yields, maturities, or credit ratings) or, if a reliable price is not available, the quoted bid price from an independent broker-dealer.
Investments in registered open-end investment companies are valued at net asset value. Interests in non-registered investment companies that are redeemable at net asset value are fair valued normally at net asset value.
Investments which are not valued using any of the methods discussed above are valued at their fair value, as determined in good faith by the Board of Trustees of the Fund. The Board of Trustees has established a Valuation Committee comprised of the Trustees and has delegated to it the authority to take any actions regarding the valuation of portfolio securities that the Valuation Committee deems necessary or appropriate, including determining the fair value of portfolio securities, unless the determination has been delegated to the Wells Fargo Asset Management Pricing Committee at Wells Fargo Funds Management, LLC ("Funds Management"). The Board of Trustees retains the authority to make or ratify any valuation decisions or approve any changes to the Valuation Procedures as it deems appropriate. On a quarterly basis, the Board of Trustees receives reports on any valuation actions taken by the Valuation Committee or the Wells Fargo Asset Management Pricing Committee which may include items for ratification.
Securities lending
The Fund may lend its securities from time to time in order to earn additional income in the form of fees or interest on securities received as collateral or the investment of any cash received as collateral. When securities are on loan, the Fund receives interest or dividends on those securities. Cash collateral received in connection with its securities lending transactions is invested in Securities Lending Cash Investments, LLC (the “Securities Lending Fund”). Investments in Securities Lending Fund are valued at the evaluated bid price provided by an independent pricing service. Income earned from investment in the Securities Lending Fund (net of fees and rebates), if any, is included in income from affiliated securities on the Statement of Operations.
In a securities lending transaction, the net asset value of the Fund is affected by an increase or decrease in the value of the securities loaned and by an increase or decrease in the value of the instrument in which collateral is invested. The amount of securities lending activity undertaken by the Fund fluctuates from time to time. The Fund has the right under the lending agreement to recover the securities from the borrower on demand. In the event of default or bankruptcy by the borrower, the Fund may be prevented from recovering the loaned securities or gaining access to the collateral or may experience delays or costs in doing so. In such an event, the terms of the agreement allow the unaffiliated securities lending agent to use the collateral to purchase replacement securities on behalf of the Fund or pay the Fund the market value of the loaned securities. The Fund bears the risk of loss with respect to depreciation of its investment of the cash collateral.
34 | Wells Fargo VT Index Asset Allocation Fund
Notes to financial statements
Futures contracts
Futures contracts are agreements between the Fund and a counterparty to buy or sell a specific amount of a commodity, financial instrument or currency at a specified price and on a specified date. The Fund may buy and sell futures contracts in order to gain exposure to, or protect against, changes in interest rates and security values and is subject to interest rate risk and equity price risk. The primary risks associated with the use of futures contracts are the imperfect correlation between changes in market values of securities held by the Fund and the prices of futures contracts, and the possibility of an illiquid market. Futures contracts are generally entered into on a regulated futures exchange and cleared through a clearinghouse associated with the exchange. With futures contracts, there is minimal counterparty risk to the Fund since futures contracts are exchange traded and the exchange’s clearinghouse, as the counterparty to all exchange traded futures, guarantees the futures contracts against default.
Upon entering into a futures contracts, the Fund is required to deposit either cash or securities (initial margin) with the broker in an amount equal to a certain percentage of the contract value. Subsequent payments (variation margin) are paid to or from the broker each day equal to the daily changes in the contract value. Such payments are recorded as unrealized gains or losses and, if any, shown as variation margin receivable (payable) in the Statement of Assets and Liabilities. Should the Fund fail to make requested variation margin payments, the broker can gain access to the initial margin to satisfy the Fund’s payment obligations. When the contracts are closed, a realized gain or loss is recorded in the Statement of Operations.
Security transactions and income recognition
Securities transactions are recorded on a trade date basis. Realized gains or losses are recorded on the basis of identified cost.
Dividend income is recognized on the ex-dividend date.
Interest income is accrued daily and bond discounts are accreted and premiums are amortized daily. To the extent debt obligations are placed on non-accrual status, any related interest income may be reduced by writing off interest receivables when the collection of all or a portion of interest has been determined to be doubtful based on consistently applied procedures and the fair value has decreased. If the issuer subsequently resumes interest payments or when the collectability of interest is reasonably assured, the debt obligation is removed from non-accrual status.
Distributions to shareholders
Distributions to shareholders are recorded on the ex-dividend date and paid from net investment income quarterly and any net realized gains are paid at least annually. Such distributions are determined in accordance with income tax regulations and may differ from U.S. generally accepted accounting principles. Dividend sources are estimated at the time of declaration. The tax character of distributions is determined as of the Fund’s fiscal year end. Therefore, a portion of the Fund’s distributions made prior to the Fund’s fiscal year end may be categorized as a tax return of capital at year end.
Federal and other taxes
The Fund intends to continue to qualify as a regulated investment company by distributing substantially all of its investment company taxable income and any net realized capital gains (after reduction for capital loss carryforwards) sufficient to relieve it from all, or substantially all, federal income taxes. Accordingly, no provision for federal income taxes was required.
The Fund’s income and federal excise tax returns and all financial records supporting those returns for the prior three fiscal years are subject to examination by the federal and Delaware revenue authorities. Management has analyzed the Fund’s tax positions taken on federal, state, and foreign tax returns for all open tax years and does not believe that there are any uncertain tax positions that require recognition of a tax liability.
As of December 31, 2020, the aggregate cost of all investments for federal income tax purposes was $51,939,345 and the unrealized gains (losses) consisted of:
| Gross unrealized gains | $26,586,884 |
| Gross unrealized losses | (1,075,606) |
| Net unrealized gains | $25,511,278 |
Wells Fargo VT Index Asset Allocation Fund | 35
Notes to financial statements
3. FAIR VALUATION MEASUREMENTS
Fair value measurements of investments are determined within a framework that has established a fair value hierarchy based upon the various data inputs utilized in determining the value of the Fund’s investments. The three-level hierarchy gives the highest priority to unadjusted quoted prices in active markets for identical assets or liabilities (Level 1) and the lowest priority to unobservable inputs (Level 3). The Fund’s investments are classified within the fair value hierarchy based on the lowest level of input that is significant to the fair value measurement. The inputs are summarized into three broad levels as follows:
| ■ | Level 1 – quoted prices in active markets for identical securities |
| ■ | Level 2 – other significant observable inputs (including quoted prices for similar securities, interest rates, prepayment speeds, credit risk, etc.) |
| ■ | Level 3 – significant unobservable inputs (including the Fund’s own assumptions in determining the fair value of investments) |
The inputs or methodologies used for valuing investments in securities are not necessarily an indication of the risk associated with investing in those securities.
The following is a summary of the inputs used in valuing the Fund’s assets and liabilities as of December 31, 2020:
| | Quoted prices
(Level 1) | Other significant
observable inputs
(Level 2) | Significant
unobservable inputs
(Level 3) | Total |
| Assets | | | | |
| Investments in: | | | | |
| Common stocks | | | | |
| Communication services | $ 5,100,916 | $0 | $0 | $ 5,100,916 |
| Consumer discretionary | 6,034,943 | 0 | 0 | 6,034,943 |
| Consumer staples | 3,089,503 | 0 | 0 | 3,089,503 |
| Energy | 1,082,822 | 0 | 0 | 1,082,822 |
| Financials | 4,954,460 | 0 | 0 | 4,954,460 |
| Health care | 6,385,017 | 0 | 0 | 6,385,017 |
| Industrials | 3,983,201 | 0 | 0 | 3,983,201 |
| Information technology | 13,087,451 | 0 | 0 | 13,087,451 |
| Materials | 1,247,488 | 0 | 0 | 1,247,488 |
| Real estate | 1,147,811 | 0 | 0 | 1,147,811 |
| Utilities | 1,310,099 | 0 | 0 | 1,310,099 |
| U.S. Treasury securities | 29,010,284 | 0 | 0 | 29,010,284 |
| Short-term investments | | | | |
| Investment companies | 909,749 | 0 | 0 | 909,749 |
| | 77,343,744 | 0 | 0 | 77,343,744 |
| Futures contracts | 107,288 | 0 | 0 | 107,288 |
| Total assets | $77,451,032 | $0 | $0 | $77,451,032 |
| Liabilities | | | | |
| Futures contracts | $ 409 | $0 | $0 | $ 409 |
| Total liabilities | $ 409 | $0 | $0 | $ 409 |
Futures contracts are reported at their cumulative unrealized gains (losses) at measurement date as reported in the table following the Portfolio of Investments. For futures contracts, the current day’s variation margin is reported on the Statement of Assets and Liabilities. All other assets and liabilities are reported at their market value at measurement date.
Additional sector, industry or geographic detail is included in the Portfolio of Investments.
For the year ended December 31, 2020, the Fund did not have any transfers into/out of Level 3.
36 | Wells Fargo VT Index Asset Allocation Fund
Notes to financial statements
4. TRANSACTIONS WITH AFFILIATES
Management fee
Funds Management, an indirect wholly owned subsidiary of Wells Fargo & Company (“Wells Fargo”), is the manager of the Fund and provides advisory and fund-level administrative services under an investment management agreement. Under the investment management agreement, Funds Management is responsible for, among other services, implementing the investment objectives and strategies of the Fund, supervising the subadviser and providing fund-level administrative services in connection with the Fund’s operations. As compensation for its services under the investment management agreement, Funds Management is entitled to receive a management fee at the following annual rate based on the Fund’s average daily net assets:
| Average daily net assets | Management fee |
| First $500 million | 0.600% |
| Next $500 million | 0.550 |
| Next $2 billion | 0.500 |
| Next $2 billion | 0.475 |
| Next $5 billion | 0.440 |
| Over $10 billion | 0.430 |
For the year ended December 31, 2020, the management fee was equivalent to an annual rate of 0.60% of the Fund’s average daily net assets.
Funds Management has retained the services of a subadviser to provide daily portfolio management to the Fund. The fee for subadvisory services is borne by Funds Management. Wells Capital Management Incorporated ("WellsCap"), an affiliate of Funds Management and an indirect wholly owned subsidiary of Wells Fargo, is the subadviser to the Fund and is entitled to receive a fee from Funds Management at an annual rate starting at 0.15% and declining to 0.10% as the average daily net assets of the Fund increase.
Administration fee
Under a class-level administration agreement, Funds Management provides class-level administrative services to the Fund, which includes paying fees and expenses for services provided by the transfer agent, sub-transfer agents, omnibus account servicers and record-keepers. As compensation for its services under the class-level administration agreement, Funds Management receives an annual fee of 0.08% which is calculated based on the average daily net assets of Class 2 shares.
Waivers and/or expense reimbursements
Funds Management has contractually waived and/or reimbursed management and administration fees to the extent necessary to maintain certain net operating expense ratios for the Fund. Funds Management has committed through April 30, 2021 to waive fees and/ or reimburse expenses to the extent necessary to cap the Fund’s expenses at 1.00% for Class 2 shares. Prior to or after the commitment expiration date, the cap may be increased or the commitment to maintain the cap may be terminated only with the approval of the Board of Trustees.
Distribution fee
The Trust has adopted a distribution plan for Class 2 shares of the Fund pursuant to Rule 12b-1 under the 1940 Act. A distribution fee is charged to Class 2 shares and paid to Wells Fargo Funds Distributor, LLC, the principal underwriter, at an annual rate of 0.25% of the average daily net assets of Class 2 shares.
Interfund transactions
The Fund may purchase or sell portfolio investment securities to certain other Wells Fargo affiliates pursuant to Rule 17a-7 under the 1940 Act and under procedures adopted by the Board of Trustees. The procedures have been designed to ensure that these interfund transactions, which do not incur broker commissions, are effected at current market prices.
Wells Fargo VT Index Asset Allocation Fund | 37
Notes to financial statements
5. INVESTMENT PORTFOLIO TRANSACTIONS
Purchases and sales of investments, excluding short-term securities, for the year ended December 31, 2020 were as follows:
| Purchases at cost | | Sales proceeds |
U.S.
government | Non-U.S.
government | | U.S.
government | Non-U.S.
government |
| $9,590,469 | $5,154,045 | | $10,420,812 | $8,569,979 |
6. SECURITIES LENDING TRANSACTIONS
The Fund lends its securities through an unaffiliated securities lending agent and receives collateral in the form of cash or securities with a value at least equal to the value of the securities on loan. The value of the loaned securities is determined at the close of each business day and any increases or decreases in the required collateral are exchanged between the Fund and the counterparty on the next business day. Cash collateral received is invested in the Securities Lending Fund which seeks to provide a positive return compared to the daily Federal Funds Open Rate by investing in high-quality, U.S. dollar-denominated short-term money market instruments and is exempt from registration under Section 3(c)(7) of the 1940 Act. Securities Lending Fund is managed by Funds Management and is subadvised by WellsCap. Funds Management receives an advisory fee starting at 0.05% and declining to 0.01% as the average daily net assets of the Securities Lending Fund increase. All of the fees received by Funds Management are paid to WellsCap for its services as subadviser.
In the event of counterparty default or the failure of a borrower to return a loaned security, the Fund has the right to use the collateral to offset any losses incurred. As of December 31, 2020, the Fund had securities lending transactions with the following counterparties which are subject to offset:
| Counterparty | Value of
securities on loan | Collateral
received1 | Net
amount |
| Bank of America Securities Inc. | $10,884 | $(10,884) | $0 |
1 Collateral received within this table is limited to the collateral for the net transaction with the counterparty.
7. DERIVATIVE TRANSACTIONS
During the year ended December 31, 2020, the Fund entered into futures contracts to gain market exposure to certain asset classes consistent with an active asset allocation strategy. The Fund had an average notional amount of $5,499,990 in long futures contracts and $1,198,430 in short futures contracts during the year ended December 31, 2020.
The cumulative unrealized gains (losses) reported in the table following the Portfolio of Investments represents the fair value of futures contracts at the end of the period. Only the current day’s variation margin as of December 31, 2020 is reported separately on the Statement of Assets and Liabilities.
The effect of derivative instruments on the Statement of Operations for the year ended December 31, 2020 was as follows for the Fund:
| | Amount of realized
gains on
derivatives | Change in unrealized
gains (losses) on
derivatives |
| Equity risk | $ 1,162,075 | $ 83,461 |
| Interest rate risk | 186,423 | 65,429 |
| | $1,348,498 | $148,890 |
8. BANK BORROWINGS
The Trust, Wells Fargo Master Trust and Wells Fargo Funds Trust (excluding the money market funds) are parties to a $350,000,000 revolving credit agreement whereby the Fund is permitted to use bank borrowings for temporary or emergency purposes, such as to fund shareholder redemption requests. Interest under the credit agreement is charged to the Fund based
38 | Wells Fargo VT Index Asset Allocation Fund
Notes to financial statements
on a borrowing rate equal to the higher of the Federal Funds rate in effect on that day plus 1.25% or the overnight LIBOR rate in effect on that day plus 1.25%. In addition, an annual commitment fee equal to 0.25% of the unused balance is allocated to each participating fund.
For the year ended December 31, 2020, there were no borrowings by the Fund under the agreement.
9. DISTRIBUTIONS TO SHAREHOLDERS
The tax character of distributions paid during the years ended December 31, 2020 and December 31, 2019 were as follows:
| | Year ended December 31 |
| | 2020 | 2019 |
| Ordinary income | $ 769,127 | $ 801,395 |
| Long-term capital gain | 5,545,721 | 4,533,802 |
As of December 31, 2020, the components of distributable earnings on a tax basis were as follows:
Undistributed
ordinary
income | Undistributed
long-term
gain | Unrealized
gains |
| $755,191 | $6,935,203 | $25,511,278 |
10. CONCENTRATION RISK
Concentration risk results from exposure to a limited number of sectors. As of the end of the period, the Fund concentrated its portfolio in investments related to information technology sector. A fund that invests a substantial portion of its assets in any sector may be more affected by changes in that sector than would be a fund whose investments are not heavily weighted in any sector.
11. INDEMNIFICATION
Under the Fund's organizational documents, the officers and Trustees have been granted certain indemnification rights against certain liabilities that may arise out of performance of their duties to the Fund. The Fund has entered into a separate agreement with each Trustee that converts indemnification rights currently existing under the Fund’s organizational documents into contractual rights that cannot be changed in the future without the consent of the Trustee. Additionally, in the normal course of business, the Fund may enter into contracts with service providers that contain a variety of indemnification clauses. The Fund’s maximum exposure under these arrangements is dependent on future claims that may be made against the Fund and, therefore, cannot be estimated.
12. NEW ACCOUNTING PRONOUNCEMENT
In August 2018, FASB issued Accounting Standards Update (“ASU”) No. 2018-13, Fair Value Measurement (Topic 820) Disclosure Framework - Changes to the Disclosure Requirements for Fair Value Measurement. ASU 2018-13 updates the disclosure requirements on fair value measurements in Topic 820, Fair Value Measurements. The amendments are effective for fiscal years, and interim periods within those fiscal years, beginning after December 15, 2019. Management has adopted this guidance which did not have a material impact on the financial statements.
13. SUBSEQUENT EVENT
On February 23, 2021, Wells Fargo announced that it has entered into a definitive agreement to sell Wells Fargo Asset Management (“WFAM”) to GTCR LLC and Reverence Capital Partners, L.P. WFAM is the trade name used by the asset management businesses of Wells Fargo and includes Wells Fargo Funds Management, LLC, the investment manager to the Fund, Wells Capital Management Incorporated and Wells Fargo Asset Management (International) Limited, both registered investment advisers providing sub-advisory services to certain funds, and Wells Fargo Funds Distributor, LLC, the Fund’s principal underwriter. As part of the transaction, Wells Fargo will own a 9.9% equity interest and will continue to serve as an important client and distribution partner.
Consummation of the transaction will result in the automatic termination of the Fund’s investment management agreement and sub-advisory agreement(s). The Fund’s Board of Trustees will be asked to approve new investment management
Wells Fargo VT Index Asset Allocation Fund | 39
Notes to financial statements
arrangements with the new company. If approved by the Board, the new investment management arrangements with the new company will be presented to the shareholders of the Fund for approval, and, if approved by shareholders, would take effect upon the closing of the transaction. The transaction is expected to close in the second half of 2021, subject to customary closing conditions.
14. CORONAVIRUS (COVID-19) PANDEMIC
On March 11, 2020, the World Health Organization announced that it had made the assessment that coronavirus disease 2019 (“COVID-19”) is a pandemic. The impacts of COVID-19 are affecting the entire global economy, individual companies and investment products, and the market in general. There is significant uncertainty around the extent and duration of business disruptions related to COVID-19 and the impacts may be short term or may last for an extended period of time. The risk of further spreading of COVID-19 has led to significant uncertainty and volatility in the financial markets.
40 | Wells Fargo VT Index Asset Allocation Fund
Report of independent registered public accounting firm
To the Shareholders of the Fund and Board of Trustees
Wells Fargo Variable Trust:
Opinion on the Financial Statements
We have audited the accompanying statement of assets and liabilities of Wells Fargo VT Index Asset Allocation Fund (the Fund), one of the funds constituting Wells Fargo Variable Trust, including the portfolio of investments, as of December 31, 2020, the related statement of operations for the year then ended, the statements of changes in net assets for each of the years in the two-year period then ended, and the related notes (collectively, the financial statements) and the financial highlights for each of the years in the five-year period then ended. In our opinion, the financial statements and financial highlights present fairly, in all material respects, the financial position of the Fund as of December 31, 2020, the results of its operations for the year then ended, the changes in its net assets for each of the years in the two-year period then ended, and the financial highlights for each of the years in the five-year period then ended, in conformity with U.S. generally accepted accounting principles.
Basis for Opinion
These financial statements and financial highlights are the responsibility of the Fund’s management. Our responsibility is to express an opinion on these financial statements and financial highlights based on our audits. We are a public accounting firm registered with the Public Company Accounting Oversight Board (United States) (PCAOB) and are required to be independent with respect to the Fund in accordance with the U.S. federal securities laws and the applicable rules and regulations of the Securities and Exchange Commission and the PCAOB.
We conducted our audits in accordance with the standards of the PCAOB. Those standards require that we plan and perform the audit to obtain reasonable assurance about whether the financial statements and financial highlights are free of material misstatement, whether due to error or fraud. Our audits included performing procedures to assess the risks of material misstatement of the financial statements and financial highlights, whether due to error or fraud, and performing procedures that respond to those risks. Such procedures included examining, on a test basis, evidence regarding the amounts and disclosures in the financial statements and financial highlights. Such procedures also included confirmation of securities owned as of December 31, 2020, by correspondence with the custodian, transfer agent and brokers, or by other appropriate auditing procedures. Our audits also included evaluating the accounting principles used and significant estimates made by management, as well as evaluating the overall presentation of the financial statements and financial highlights. We believe that our audits provide a reasonable basis for our opinion.

We have not been able to determine the specific year that we began serving as the auditor of one or more Wells Fargo Funds investment companies; however we are aware that we have served as the auditor of one or more Wells Fargo Funds investment companies since at least 1955.
Boston, Massachusetts
February 25, 2021
Wells Fargo VT Index Asset Allocation Fund | 41
Other information (unaudited)
TAX INFORMATION
For corporate shareholders, pursuant to Section 854 of the Internal Revenue Code, 62.74% of ordinary income dividends qualify for the corporate dividends-received deduction for the fiscal year ended December 31, 2020.
Pursuant to Section 852 of the Internal Revenue Code, $5,545,721 was designated as a 20% rate gain distribution for the fiscal year ended December 31, 2020
For the fiscal year ended December 31, 2020, 27.78% of the ordinary income distributed was derived from interest on U.S. government securities.
For corporate shareholders, pursuant to Section 163(j) of the Internal Revenue Code, 29.77% of ordinary income dividends qualify as interest dividends for the fiscal year ended December 31, 2020.
PROXY VOTING INFORMATION
A description of the policies and procedures used to determine how to vote proxies relating to portfolio securities is available without charge, upon request, by calling 1-800-260-5969, visiting our website at wfam.com, or visiting the SEC website at sec.gov. Information regarding how the proxies related to portfolio securities were voted during the most recent 12-month period ended June 30 is available on the website at wfam.com or by visiting the SEC website at sec.gov.
QUARTERLY PORTFOLIO HOLDINGS INFORMATION
The Fund files its complete schedule of portfolio holdings with the SEC for the first and third quarters of each fiscal year as an exhibit to its reports on Form N-PORT. Shareholders may view the filed Form N-PORT by visiting the SEC website at sec.gov.
42 | Wells Fargo VT Index Asset Allocation Fund
Other information (unaudited)
BOARD OF TRUSTEES AND OFFICERS
Each of the Trustees and Officers1 listed in the table below acts in identical capacities for each fund in the Wells Fargo family of funds, which consists of 144 mutual funds comprising the Wells Fargo Funds Trust, Wells Fargo Variable Trust, Wells Fargo Master Trust and four closed-end funds (collectively the “Fund Complex”). This table should be read in conjunction with the Prospectus and the Statement of Additional Information2. The mailing address of each Trustee and Officer is 525 Market Street, 12th Floor, San Francisco, CA 94105. Each Trustee and Officer serves an indefinite term, however, each Trustee serves such term until reaching the mandatory retirement age established by the Trustees.
Independent Trustees
Name and
year of birth | Position held and
length of service* | Principal occupations during past five years or longer | Current other
public company or
investment
company
directorships |
William R. Ebsworth
(Born 1957) | Trustee,
since 2015 | Retired. From 1984 to 2013, equities analyst, portfolio manager, research director and chief investment officer at Fidelity Management and Research Company in Boston, Tokyo, and Hong Kong, and retired in 2013 as Chief Investment Officer of Fidelity Strategic Advisers, Inc. where he led a team of investment professionals managing client assets. Prior thereto, Board member of Hong Kong Securities Clearing Co., Hong Kong Options Clearing Corp., the Thailand International Fund, Ltd., Fidelity Investments Life Insurance Company, and Empire Fidelity Investments Life Insurance Company. Audit Committee Chair and Investment Committee Chair of the Vincent Memorial Hospital Endowment (non-profit organization). Mr. Ebsworth is a CFA® charterholder. | N/A |
Jane A. Freeman
(Born 1953) | Trustee,
since 2015;
Chair Liaison,
since 2018 | Retired. From 2012 to 2014 and 1999 to 2008, Chief Financial Officer of Scientific Learning Corporation. From 2008 to 2012, Ms. Freeman provided consulting services related to strategic business projects. Prior to 1999, Portfolio Manager at Rockefeller & Co. and Scudder, Stevens & Clark. Board member of the Harding Loevner Funds from 1996 to 2014, serving as both Lead Independent Director and chair of the Audit Committee. Board member of the Russell Exchange Traded Funds Trust from 2011 to 2012 and the chair of the Audit Committee. Ms. Freeman is also an inactive Chartered Financial Analyst. | N/A |
Isaiah Harris, Jr.
(Born 1952) | Trustee,
since 2009; Audit
Committee
Chair,
since 2019 | Retired. Chairman of the Board of CIGNA Corporation since 2009, and Director since 2005. From 2003 to 2011, Director of Deluxe Corporation. Prior thereto, President and CEO of BellSouth Advertising and Publishing Corp. from 2005 to 2007, President and CEO of BellSouth Enterprises from 2004 to 2005 and President of BellSouth Consumer Services from 2000 to 2003. Emeritus member of the Iowa State University Foundation Board of Governors. Emeritus Member of the Advisory Board of Iowa State University School of Business. Advisory Board Member, Palm Harbor Academy (private school). Mr. Harris is a certified public accountant (inactive status). | CIGNA Corporation |
Judith M. Johnson
(Born 1949) | Trustee,
since 2008 | Retired. Prior thereto, Chief Executive Officer and Chief Investment Officer of Minneapolis Employees Retirement Fund from 1996 to 2008. Ms. Johnson is an attorney, certified public accountant and a certified managerial accountant. | N/A |
David F. Larcker
(Born 1950) | Trustee,
since 2009 | James Irvin Miller Professor of Accounting at the Graduate School of Business (Emeritus), Stanford University, Director of the Corporate Governance Research Initiative and Senior Faculty of The Rock Center for Corporate Governance since 2006. From 2005 to 2008, Professor of Accounting at the Graduate School of Business, Stanford University. Prior thereto, Ernst & Young Professor of Accounting at The Wharton School, University of Pennsylvania from 1985 to 2005. | N/A |
Wells Fargo VT Index Asset Allocation Fund | 43
Other information (unaudited)
Name and
year of birth | Position held and
length of service* | Principal occupations during past five years or longer | Current other
public company or
investment
company
directorships |
Olivia S. Mitchell
(Born 1953) | Trustee,
since 2006;
Nominating and
Governance
Committee Chair,
since 2018 | International Foundation of Employee Benefit Plans Professor, Wharton School of the University of Pennsylvania since 1993. Director of Wharton’s Pension Research Council and Boettner Center on Pensions & Retirement Research, and Research Associate at the National Bureau of Economic Research. Previously, Cornell University Professor from 1978 to 1993. | N/A |
Timothy J. Penny
(Born 1951) | Trustee,
since 1996;
Chair,
since 2018 | President and Chief Executive Officer of Southern Minnesota Initiative Foundation, a non-profit organization, since 2007. Member of the Board of Trustees of NorthStar Education Finance, Inc., a non-profit organization, since 2007. | N/A |
James G. Polisson
(Born 1959) | Trustee,
since 2018 | Retired. Chief Marketing Officer, Source (ETF) UK Services, Ltd, from 2015 to 2017. From 2012 to 2015, Principal of The Polisson Group, LLC, a management consulting, corporate advisory and principal investing company. Chief Executive Officer and Managing Director at Russell Investments, Global Exchange Traded Funds from 2010 to 2012. Managing Director of Barclays Global Investors from 1998 to 2010 and Global Chief Marketing Officer for iShares and Barclays Global Investors from 2000 to 2010. Trustee of the San Francisco Mechanics’ Institute, a non-profit organization, from 2013 to 2015. Board member of the Russell Exchange Traded Fund Trust from 2011 to 2012. Director of Barclays Global Investors Holdings Deutschland GmbH from 2006 to 2009. Mr. Polisson is an attorney and has a retired status with the Massachusetts and District of Columbia Bar Associations. | N/A |
Pamela Wheelock
(Born 1959) | Trustee,
since January
2020; previously
Trustee from
January 2018 to
July 2019 | Board member of the Destination Medical Center Economic Development Agency, Rochester, Minnesota since 2019. Interim President of the McKnight Foundation from January to September 2020. Acting Commissioner, Minnesota Department of Human Services, July 2019 through September 2019. Human Services Manager (part-time), Minnesota Department of Human Services, October 2019 through December 2019. Chief Operating Officer, Twin Cities Habitat for Humanity from 2017 to 2019. Vice President of University Services, University of Minnesota from 2012 to 2016. Prior thereto, on the Board of Directors, Governance Committee and Finance Committee for the Minnesota Philanthropy Partners (Saint Paul Foundation) from 2012 to 2018, Interim Chief Executive Officer of Blue Cross Blue Shield of Minnesota from 2011 to 2012, Chairman of the Board from 2009 to 2012 and Board Director from 2003 to 2015. Vice President, Leadership and Community Engagement, Bush Foundation, Saint Paul, Minnesota (a private foundation) from 2009 to 2011. Executive Vice President and Chief Financial Officer, Minnesota Sports and Entertainment from 2004 to 2009 and Senior Vice President from 2002 to 2004. Executive Vice President of the Minnesota Wild Foundation from 2004 to 2008. Commissioner of Finance, State of Minnesota, from 1999 to 2002. Currently Board Chair of the Minnesota Wild Foundation since 2010. | N/A |
* Length of service dates reflect the Trustee’s commencement of service with the Trust’s predecessor entities, where applicable.
44 | Wells Fargo VT Index Asset Allocation Fund
Other information (unaudited)
Officers
Name and
year of birth | Position held and
length of service | Principal occupations during past five years or longer |
Andrew Owen
(Born 1960) | President,
since 2017 | Executive Vice President of Wells Fargo & Company and Head of Affiliated Managers, Wells Fargo Asset Management, since 2014. In addition, Mr. Owen is currently President, Chief Executive Officer and Director of Wells Fargo Funds Management, LLC since 2017. Prior thereto, Executive Vice President responsible for marketing, investments and product development for Wells Fargo Funds Management, LLC, from 2009 to 2014. |
Jeremy DePalma1
(Born 1974) | Treasurer,
since 2012 | Senior Vice President of Wells Fargo Funds Management, LLC since 2009. Senior Vice President of Evergreen Investment Management Company, LLC from 2008 to 2010 and head of the Fund Reporting and Control Team within Fund Administration from 2005 to 2010. |
Michelle Rhee
(Born 1966) | Chief Legal Officer,
since 2019 | Secretary of Wells Fargo Funds Management, LLC and Chief Legal Counsel of Wells Fargo Asset Management since 2018. Deputy General Counsel of Wells Fargo Bank, N.A. since 2020 and Assistant General Counsel of Wells Fargo Bank, N.A. from 2018 to 2020. Associate General Counsel and Managing Director of Bank of America Corporation from 2004 to 2018. |
Catherine Kennedy
(Born 1969) | Secretary,
since 2019 | Vice President of Wells Fargo Funds Management, LLC and Senior Counsel of the Wells Fargo Legal Department since 2010. Vice President and Senior Counsel of Evergreen Investment Management Company, LLC from 1998 to 2010. |
Michael H. Whitaker
(Born 1967) | Chief Compliance Officer,
since 2016 | Chief Compliance Officer of Wells Fargo Asset Management since 2016. Senior Vice President and Chief Compliance Officer for Fidelity Investments from 2007 to 2016. |
1 Jeremy DePalma acts as Treasurer of 77 funds in the Fund Complex.
2 The Statement of Additional Information includes additional information about the Trustees and is available, without charge, upon request, by calling 1-800-260-5969 or by visiting the website at wfam.com.
Wells Fargo VT Index Asset Allocation Fund | 45
For more information
More information about Wells Fargo Funds is available free upon request. To obtain literature, please write, visit the Fund's website, or call:
Wells Fargo Funds
P.O. Box 219967
Kansas City, MO 64121-9967
Website: wfam.com
Individual investors: 1-800-222-8222
Retail investment professionals: 1-888-877-9275
Institutional investment professionals: 1-866-765-0778
This report and the financial statements contained herein are submitted for the general information of the shareholders of the Fund. If this report is used for promotional purposes, distribution of the report must be accompanied or preceded by a current prospectus. Before investing, please consider the investment objectives, risks, charges, and expenses of the investment. For a current prospectus and, if available, a summary prospectus, containing this information, call 1-800-260-5969 or visit the Fund’s website at wfam.com. Read the prospectus carefully before you invest or send money.
Wells Fargo Asset Management (WFAM) is the trade name for certain investment advisory/management firms owned by Wells Fargo & Company. These firms include but are not limited to Wells Capital Management Incorporated and Wells Fargo Funds Management, LLC. Certain products managed by WFAM entities are distributed by Wells Fargo Funds Distributor, LLC (a broker-dealer and Member FINRA).
This material is for general informational and educational purposes only and is NOT intended to provide investment advice or a recommendation of any kind— including a recommendation for any specific investment, strategy, or plan.
INVESTMENT PRODUCTS: NOT FDIC INSURED ■ NO BANK GUARANTEE ■ MAY LOSE VALUE
© 2021 Wells Fargo & Company. All rights reserved.
PAR-0121-00262 02-21
AVT2/AR148 12-20
Annual Report
December 31, 2020
Wells Fargo
VT International Equity Fund
Reduce clutter.
Save trees.
Sign up for electronic delivery of prospectuses and shareholder reports at wellsfargo.com/ advantagedelivery
The views expressed and any forward-looking statements are as of December 31, 2020, unless otherwise noted, and are those of the Fund's portfolio managers and/or Wells Fargo Asset Management. Discussions of individual securities or the markets generally are not intended as individual recommendations. Future events or results may vary significantly from those expressed in any forward-looking statements. The views expressed are subject to change at any time in response to changing circumstances in the market. Wells Fargo Asset Management and the Fund disclaim any obligation to publicly update or revise any views expressed or forward-looking statements.
INVESTMENT PRODUCTS: NOT FDIC INSURED ■ NO BANK GUARANTEE ■ MAY LOSE VALUE
Wells Fargo VT International Equity Fund | 1
Letter to shareholders (unaudited)
Dear Shareholder:
We are pleased to offer you this annual report for the Wells Fargo VT International Equity Fund for the 12-month period that ended December 31, 2020. Despite a deeply challenging year, dominated by the spread of COVID-19 cases and a sharp drop in economic output throughout much of the world, global stocks fared well overall, benefiting from strong central bank support. Bonds generally had modestly positive returns, providing some measure of diversification during turbulent market stretches.
For the 12-month period, equities had solid returns, more than making up for intense volatility in March. Non-U.S. developed market equities had weaker performance than emerging market and U.S. stocks. While gains from fixed-income securities were positive, they were more modest than equities. For the period, U.S. stocks, based on the S&P 500 Index1, gained 18.40%. International stocks, as measured by the MSCI ACWI ex USA Index (Net)2, returned 10.65%, while the MSCI EM Index (Net)3 had stronger performance, with a 18.31% gain. Among bond indexes, the Bloomberg Barclays U.S. Aggregate Bond Index4 returned 7.51%, the Bloomberg Barclays Global Aggregate ex-USD Index (unhedged)5 gained 10.11%, and the Bloomberg Barclays Municipal Bond Index6 returned 5.21% while the ICE BofA U.S. High Yield Index7 returned 6.17%.
The mood changed soon after the year began.
A year-end 2019 rally continued in early January 2020. However, market volatility spiked in late January on concerns over the potential impact of COVID-19 on the global economy and stock markets. With sentiment somewhat souring, perceived safe havens did well in January. The U.S. dollar and Japanese yen both rose, and government bonds outperformed equities. While the S&P 500 Index held its ground, emerging market equities tumbled.
Fears over the spread of COVID-19 and its impact on global growth led to a sharp downturn by late February. Oil prices tumbled as Russia and the Organization of the Petroleum Exporting Countries compounded a major decline in oil demand with a brutal price war, causing the price of crude oil to plummet.
Andrew Owen
President
Wells Fargo Funds
“Non-U.S. developed market equities had weaker performance than emerging market and U.S. stocks”
| 1 | The S&P 500 Index consists of 500 stocks chosen for market size, liquidity, and industry group representation. It is a market-value-weighted index with each stock's weight in the index proportionate to its market value. You cannot invest directly in an index. |
| 2 | The Morgan Stanley Capital International (MSCI) All Country World Index (ACWI) ex USA Index (Net) is a free-float-adjusted market-capitalization-weighted index that is designed to measure the equity market performance of developed and emerging markets, excluding the United States. Source: MSCI. MSCI makes no express or implied warranties or representations and shall have no liability whatsoever with respect to any MSCI data contained herein. The MSCI data may not be further redistributed or used as a basis for other indices or any securities or financial products. This report is not approved, reviewed, or produced by MSCI. You cannot invest directly in an index. |
| 3 | The MSCI Emerging Markets (EM) Index (Net) is a free-float-adjusted market-capitalization-weighted index that is designed to measure equity market performance of emerging markets. You cannot invest directly in an index. |
| 4 | The Bloomberg Barclays U.S. Aggregate Bond Index is a broad-based benchmark that measures the investment-grade, U.S. dollar-denominated, fixed-rate taxable bond market, including Treasuries, government-related and corporate securities, mortgage-backed securities (agency fixed-rate and hybrid adjustable-rate mortgage pass-throughs), asset-backed securities, and commercial mortgage-backed securities. You cannot invest directly in an index. |
| 5 | The Bloomberg Barclays Global Aggregate ex-USD Index (unhedged) is an unmanaged index that provides a broad-based measure of the global investment-grade fixed-income markets excluding the U.S. dollar-denominated debt market. You cannot invest directly in an index. |
| 6 | The Bloomberg Barclays Municipal Bond Index is an unmanaged index composed of long-term tax-exempt bonds with a minimum credit rating of Baa. You cannot invest directly in an index. |
| 7 | The ICE BofA U.S. High Yield Index is a market-capitalization-weighted index of domestic and Yankee high-yield bonds. The index tracks the performance of high-yield securities traded in the U.S. bond market. You cannot invest directly in an index. Copyright 2021. ICE Data Indices, LLC. All rights reserved. |
2 | Wells Fargo VT International Equity Fund
Letter to shareholders (unaudited)
The global spread of COVID-19 led country after country to clamp down on social- and business-related activity in order to contain the virus. This sent economies into a deep contraction. Central banks responded by slashing interest rates and expanding quantitative easing programs to restore liquidity and market confidence. The U.S. Federal Reserve (Fed) launched several lending programs, funding investment-grade bonds, money market mutual funds, and commercial paper while purchasing Treasuries, mortgage-backed securities, and overnight repurchase agreements. Meanwhile, stock markets tumbled, ending the longest bull stock market in U.S. history.
Markets rebounded strongly through the spring, fueled by unprecedented government and central bank stimulus measures in the U.S. and globally. The U.S. economy contracted by an annualized 5.0% pace in the first quarter, with 30 million new unemployment insurance claims in six weeks. In the eurozone, first-quarter real gross domestic product (GDP) shrank 3.8%. China’s first-quarter GDP fell by 6.8% year over year. Extreme oil-price volatility continued as global supply far exceeded demand.
In May, investors regained confidence on reports of early success in human trials of a COVID-19 vaccine. Growth stocks outperformed value, while returns on global government bonds were flat. However, in the U.S., the April unemployment rate rose to 14.7%, its highest level since World War II. Purchasing managers’ indexes (PMIs), a monthly survey of purchasing managers, reflected broadly weakening activity in May. U.S. corporate earnings contracted 14% year over year from the first quarter of 2019. However, high demand for information technology (IT), driven by remote activity, supported robust IT sector earnings, which helped drive IT stocks higher.
By June, economies reopened and global central banks committed to do all they could to provide economic support through liquidity and low borrowing costs. U.S. economic activity was aided by one-time $1,200 stimulus checks and $600 weekly bonus unemployment benefits that lasted through July. However, unemployment remained historically high and COVID-19 cases began to increase by late June. China’s economic recovery began to pick up momentum.
July was broadly positive for equities and fixed income. However, economic data and a resurgence of COVID-19 cases underscored the urgent need to regain control of the pandemic. Second-quarter GDP shrank from the previous quarter by 9.5% and 12.1% in the U.S. and the eurozone, respectively. In contrast, China’s second-quarter GDP grew 3.2% year over year. The U.S. economy added 1.8 million jobs in July, but a double-digit jobless rate persisted.
The stock market continued to rally in August despite concerns over rising numbers of U.S. and European COVID-19 cases as well as the July expiration of the $600 weekly bonus unemployment benefit. Relatively strong second-quarter earnings boosted investor sentiment along with the Fed’s announcement of a monetary policy shift expected to support longer-term low interest rates. U.S. manufacturing and services activity indexes beat expectations while the U.S. housing market maintained strength. In Europe, retail sales expanded and consumer confidence was steady. China’s economy continued to expand.
Stocks grew more volatile in September on mixed economic data. U.S. economic activity continued to grow. However, U.S. unemployment remained elevated at 7.9% in September. With U.S. Congress delaying further fiscal relief and uncertainties surrounding a possible vaccine, doubts crept back into the financial markets. In the U.K., a lack of progress in Brexit talks weighed on markets. China’s economy picked up steam, fueled by increased global demand.
Wells Fargo VT International Equity Fund | 3
Letter to shareholders (unaudited)
In October, capital markets stepped back from their six-month rally. Market volatility rose in advance of the U.S. election and amid a global increase in COVID-19 infections. Europe introduced tighter restrictions affecting economic activity. U.S. markets looked favorably at the prospect of Democratic control of the federal purse strings, which could lead to additional fiscal stimulus and a boost to economic activity. Meanwhile, China reported 4.9% third-quarter GDP growth.
Global stocks rallied in November, propelled by optimism over three promising COVID-19 vaccines. Reversing recent trends, value stocks outperformed growth stocks and cyclical stocks outpaced technology stocks. However, U.S. unemployment remained elevated, with a net job loss of 10 million since February. The eurozone services PMI contracted sharply while the region’s manufacturing activity grew. The U.S. election results added to the upbeat mood as investors anticipated more consistent policies in the new administration.
Financial markets ended the year with strength on high expectations for a rapid rollout of the COVID-19 vaccines, the successful passage of a $900 billion stimulus package, and rising expectations of additional economic support from a Democratic-led Congress. U.S. economic data were mixed with still-elevated unemployment and weak retail sales but growth in manufacturing output. In contrast, China’s economic expansion continued in both manufacturing and nonmanufacturing. U.S. COVID-19 infection rates continued to rise even as new state and local lockdown measures were implemented.
Don’t let short-term uncertainty derail long-term investment goals.
Periods of investment uncertainty can present challenges, but experience has taught us that maintaining long-term investment goals can be an effective way to plan for the future. To help you create a sound strategy based on your personal goals and risk tolerance, Wells Fargo Funds offers more than 100 mutual funds spanning a wide range of asset classes and investment styles. Although diversification cannot guarantee an investment profit or prevent losses, we believe it can be an effective way to manage investment risk and potentially smooth out overall portfolio performance. We encourage investors to know their investments and to understand that appropriate levels of risk-taking may unlock opportunities.
Thank you for choosing to invest with Wells Fargo Funds. We appreciate your confidence in us and remain committed to helping you meet your financial needs.
Sincerely,
Andrew Owen
President
Wells Fargo Funds
“Global stocks rallied in November, propelled by optimism over three promising COVID-19 vaccines.”
For further information about your Fund, contact your investment professional, visit our website at wfam.com, or call us directly at 1-800-260-5969.
4 | Wells Fargo VT International Equity Fund
This page is intentionally left blank.
Performance highlights (unaudited)
Investment objective
The Fund seeks long-term capital appreciation.
Manager
Wells Fargo Funds Management, LLC
Subadviser
Wells Capital Management Incorporated
Portfolio managers
Venkateshwar (Venk) Lal
Dale A. Winner, CFA®‡
Average annual total returns (%) as of December 31, 2020
| | | | | | Expense ratios1 (%) |
| | Inception date | 1 year | 5 year | 10 year | Gross | Net 2 |
| Class 1 | 8-17-1998 | 4.89* | 5.36 | 4.11 | 1.13 | 0.69 |
| Class 2 | 7-31-2002 | 4.93* | 5.18 | 3.89 | 1.38 | 0.94 |
| MSCI ACWI ex USA Index (Net)3 | – | 10.65 | 8.93 | 4.92 | – | – |
| MSCI ACWI ex USA Value Index (Net)4 | – | -0.77 | 5.70 | 2.78 | – | – |
* Total return differs from the return in the Financial Highlights in this report. The total return presented is calculated based on the NAV at which the shareholder transactions were processed. The NAV and total return presented in the Financial Highlights reflects certain adjustments made to the net assets of the Fund that are necessary under U.S. generally accepted accounting principles.
Figures quoted represent past performance, which is no guarantee of future results. Investment return and principal value of an investment will fluctuate so that an investor’s shares, when redeemed, may be worth more or less than their original cost. Current performance may be lower or higher than the performance data quoted and assumes the reinvestment of dividends and capital gains. Current month-end performance is available by calling 1-800-260-5969. Performance figures of the Fund do not reflect fees and expenses charged pursuant to the terms of variable life insurance policies and variable annuity contracts. If these fees and expenses had been reflected, performance would have been lower.
Shares are sold without a front-end sales charge or contingent deferred sales charge.
Index returns do not include transaction costs associated with buying and selling securities, any mutual fund fees or expenses, or any taxes. It is not possible to invest directly in an index.
Stock values fluctuate in response to the activities of individual companies and general market and economic conditions. Foreign investments are especially volatile and can rise or fall dramatically due to differences in the political and economic conditions of the host country. These risks are generally intensified in emerging markets. The use of derivatives may reduce returns and/or increase volatility. Certain investment strategies tend to increase the total risk of an investment (relative to the broader market). The Fund is exposed to smaller-company securities risk. Consult the Fund’s prospectus for additional information on these and other risks.
Please refer to the prospectus provided by your participating insurance company for detailed information describing the separate accounts for information regarding surrender charges, mortality and expense risk fees, and other charges that may be assessed by the participating insurance companies.
Please see footnotes on page 7.
6 | Wells Fargo VT International Equity Fund
Performance highlights (unaudited)
| Growth of $10,000 investment as of December 31, 20205 |

| ‡ | CFA® and Chartered Financial Analyst® are trademarks owned by CFA Institute. |
| 1 | Reflects the expense ratios as stated in the most recent prospectuses. The expense ratios shown are subject to change and may differ from the annualized expense ratios shown in the financial highlights of this report. |
| 2 | The manager has contractually committed through April 30, 2021, to waive fees and/or reimburse expenses to the extent necessary to cap total annual fund operating expenses after fee waivers at 0.69% for Class 1 and 0.94% for Class 2. Brokerage commissions, stamp duty fees, interest, taxes, acquired fund fees and expenses (if any), and extraordinary expenses are excluded from the expense caps. Prior to or after the commitment expiration date, the caps may be increased or the commitment to maintain the caps may be terminated only with the approval of the Board of Trustees. Without these caps, the Fund’s returns would have been lower. The expense ratio paid by an investor is the net expense ratio (the total annual fund operating expenses after fee waivers) as stated in the prospectuses. |
| 3 | The Morgan Stanley Capital International (MSCI) All Country World Index (ACWI) ex USA Index (Net) is a free-float-adjusted market capitalization-weighted index that is designed to measure the equity market performance of developed and emerging markets, excluding the United States. Source: MSCI. MSCI makes no express or implied warranties or representations and shall have no liability whatsoever with respect to any MSCI data contained herein. The MSCI data may not be further redistributed or used as a basis for other indexes or any securities or financial products. This report is not approved, reviewed, or produced by MSCI. You cannot invest directly in an index. |
| 4 | The MSCI ACWI ex USA Value Index (Net) measures the equity market performance of large- and mid-cap securities exhibiting overall value style characteristics across developed and emerging market countries, excluding the United States. The value investment style characteristics for index construction are defined using three variables: book value to price, 12-month forward earnings to price, and dividend yield. You cannot invest directly in an index. |
| 5 | The chart compares the performance of Class 2 shares for the most recent ten years with the MSCI ACWI ex USA Index (Net) and the MSCI ACWI ex USA Value Index (Net). The chart assumes a hypothetical $10,000 investment and reflects all operating expenses of the Fund but does not reflect fees and expenses charged pursuant to the terms of variable life insurance policies and variable annuity contracts. |
| 6 | The MSCI World Index (Net) is a free-float-adjusted market-capitalization-weighted index that is designed to measure the equity market performance of developed markets. You cannot invest directly in an index. |
| 7 | The MSCI Emerging Markets (EM) Index (Net) is a free-float-adjusted market-capitalization-weighted index that is designed to measure equity market performance of emerging markets. You cannot invest directly in an index. |
| 8 | Figures represent the percentage of the Fund's net assets. Holdings are subject to change and may have changed since the date specified. |
| 9 | The S&P 500 Index consists of 500 stocks chosen for market size, liquidity, and industry group representation. It is a market-value-weighted index with each stock’s weight in the index proportionate to its market value. You cannot invest directly in an index. |
| 10 | The Chicago Board Options Exchange (CBOE) Market Volatility Index (VIX) is a popular measure of the implied volatility of S&P 500 Index options. It represents one measure of the market's expectation of stock market volatility over the next 30-day period. You cannot invest directly in an index. |
| 11 | Figures represent the percentage of the Fund's long-term investments. These amounts are subject to change and may have changed since the date specified. |
Wells Fargo VT International Equity Fund | 7
Performance highlights (unaudited)
MANAGER'S DISCUSSION
Fund highlights
| ■ | The Fund underperformed the MSCI ACWI ex USA Index (Net) while outperforming the MSCI ACWI ex USA Value Index (Net) for the 12-month period that ended December 31, 2020. |
| ■ | Information technology (IT), communication services, and consumer staples were relative performance laggards. Financials, consumer discretionary, and materials contributed to performance. |
| ■ | ▪ The Fund remained overweight Europe, including overweights to the Netherlands, the U.K., Norway, and Italy, partly offset by underweights to Sweden, Switzerland, Spain, and France. The Fund was underweight Asia on a regional basis, including average underweights to Japan, Taiwan, and Australia, partly offset by overweights to Korea, Singapore, and China/Hong Kong. |
A first-quarter sharp decline was erased by a historic rally.
International markets declined 34.4% from peak to trough in the first quarter as a result of the COVID-19 pandemic but rebounded 66.0% through the end of the year, driven by a historic monetary, fiscal, and health care response, resulting in a one-year return of 10.7% for the MSCI ACWI ex USA Index (Net). In this environment, the global purchasing managers’ indexes (PMIs), a monthly survey of purchasing managers, fell to historic lows in April but quickly returned to expansionary territory in July with the global manufacturing PMI reaching 53.8 in November and December, the highest level since February 2018. Developed market equities, represented by the MSCI World Index (Net)6, returned 15.9%, underperforming emerging markets, represented by the MSCI EM Index (Net)7, which gained 18.3%. Overall, traditional value sectors underperformed growth during the year by the greatest margin since MSCI introduced the subindexes in 1997. However, the value index outperformed growth in the fourth quarter for the first time in seven quarters.
Our investment and risk management process of finding non-consensus undervalued equities, marrying core micro stock picking with macro risk management in each region of the globe, resulted in shifts to sector and country allocations. This included an increase in exposure to consumer discretionary, financials, health care, Korea, Denmark, and Australia. We reduced allocations to energy, communication services, industrials, Italy, the U.K., and Singapore. Notable position changes included the addition of Nomad Foods Limited, Europe’s leading frozen-food company and one of the largest in the world, and Tech Mahindra Limited, a leading Indian IT services firm providing digital transformation, consulting, and business process engineering and outsourcing services. The Fund notably exited Eni S.p.A., an Italian energy company, due to demand destruction from the COVID-19 outbreak; accelerating environmental, social, and governance pressure in Europe; and the Russia-Saudi oil price war, which dramatically changed our previously constructive view on Brent Crude Oil. The Fund also exited Melrose Industries plc, a U.K.-domiciled investment company, given challenges in the aerospace — civil aerospace, in particular — and automotive space during the pandemic.
Weakness in Japan, the U.K., and Switzerland offset annual gains.
Detractors included Alps Alpine Company, Limited, and Melrose Industries. Alps Alpine, a Japanese manufacturer of electronic components for autos and smartphone cameras, recently reported quarterly results including operating profit of 3 billion yen, up from a loss of 6.5 billion yen the previous quarter, primarily due to better-than-expected cost-cutting. However, profitability in camera actuators for iPhones, its key product, declined, resulting in earnings and price-target downgrades.
| Ten largest holdings (%) as of December 31, 20208 |
| LafargeHolcim Limited | 3.01 |
| DNB ASA | 2.95 |
| Hitachi Limited | 2.94 |
| NN Group NV | 2.91 |
| Rheinmetall AG | 2.86 |
| Mobile TeleSystems PJSC ADR | 2.81 |
| Hana Financial Group Incorporated | 2.80 |
| Mitsubishi UFJ Financial Group Incorporated | 2.78 |
| Samsung Electronics Company Limited GDR | 2.74 |
| Nomad Foods Limited | 2.73 |
Please see footnotes on page 7.
8 | Wells Fargo VT International Equity Fund
Performance highlights (unaudited)
Contributors included stock selection in China, Canada, and the U.S.
Over the past 12 months, contributions to performance were driven largely by stock selection in China/Hong Kong, Canada, and the U.S. Xinyi Glass Holdings Limited, a Chinese float glass manufacturer benefiting from industry supply constraints, capacity expansion, and line extensions, outperformed given a strong rebound in the float glass price from demand improvement, particularly in the area of property completion and limited supply expansion; lower cost of goods sold from lower soda ash and liquefied natural gas, which should result in improved profit margins; and capacity expansion from the acquisition of three float glass production lines. Lundin Mining Corporation, a Canadian miner, reported strong third-quarter results due to copper, nickel, and zinc pricing improvement.
Our outlook is neutral in the short-term and constructive in the long term.
Our short-term outlook is neutral. The market has traversed the initial panic sell-off and relief rally phases and may now be nearing the end of the relapse correction phase. First, the market has experienced two recent corrections with the S&P 500 Index9 declining 10% in September and 7.5% in October. Second, the global economic recovery is continuing, illustrated by a seventh consecutive gain in the global manufacturing PMI in November, holding at 53.8 in the final two months of the year, the highest level since February 2018. Third, there have been multiple breakouts of the U.S. 10-year Treasury yield from the 0.6% to 0.8% range, where it spent most of the April-to-October period. Fourth quarter, volatility, as measured by the CBOE VIX10 was in the low 20s at year-end. Fifth, shortly after year-end, Joe Biden was confirmed president-elect by the U.S. Congress. Finally, the COVID-19 vaccine has made good early progress, with Pfizer/Moderna/AstraZeneca trials showing 90% to 95% efficacy.
Our longer-term outlook remains constructive. The COVID-19-induced recession and bear market is over and a new economic recovery has begun, supported by aggressive monetary, fiscal, and health care responses and a globally synchronized recovery. First, the U.S. Federal Reserve’s pivot to targeting an average 2% inflation was a policy inflection point that will allow inflation to run higher and aid a recovery in employment. This is expected to anchor short-term rates at close to zero for two to three years and potentially steepen yield curves as longer-term rates start to forecast economic normalization. Other central banks could follow suit. Second, fiscal stimulus continues with the historic €750 billion European Union recovery fund and likely increased fiscal spending in the U.S. and globally on infrastructure and green technology post-inauguration. Third, the COVID-19 health care response is improving in terms of progress on rapid testing, treatment, and the rollout of vaccines. Finally, global growth prospects are improving as the Organisation for Economic Co-operation and Development recently upgraded global gross domestic product forecasts for 2020 from -4.5% in September to -4.2% in December and is forecasting +4.2% for 2021.
Our outlook is cautious yet confident.
As we look out over the next 12 months, we believe volatility could remain elevated as the duration and full impact of the virus is unknown. We believe it is prudent to protect the Fund’s downside risks as we look for investment opportunities to present themselves. We do not focus on forecasting future macroeconomic news or the short-term direction of the market. Through our bottom-up stock selection process, we focus on investing in companies that we believe have the potential to generate strong cash flows and have the balance sheet flexibility to make intelligent investment decisions. In our view, this approach may better position our investments to reap outsized rewards relative to the level of risk being taken. Because of this disciplined investment process, we remain confident in our ability to navigate all economic environments over the long term.
| Sector distribution as of December 31, 202011 |
| Geographic allocation as of December 31, 202011 |
Please see footnotes on page 7.
Wells Fargo VT International Equity Fund | 9
Fund expenses (unaudited)
As a shareholder of the Fund, you incur ongoing costs, including management fees, distribution (12b-1) fees, and other Fund expenses. This example is intended to help you understand your ongoing costs (in dollars) of investing in the Fund and to compare these costs with the ongoing costs of investing in other mutual funds.
The example is based on an investment of $1,000 invested at the beginning of the six-month period and held for the entire period from July 1, 2020 to December 31, 2020.
Actual expenses
The “Actual” line of the table below provides information about actual account values and actual expenses. You may use the information in this line, together with the amount you invested, to estimate the expenses that you paid over the period. Simply divide your account value by $1,000 (for example, an $8,600 account value divided by $1,000 = 8.6), then multiply the result by the number in the “Actual” line under the heading entitled “Expenses paid during period” for your applicable class of shares to estimate the expenses you paid on your account during this period.
Hypothetical example for comparison purposes
The “Hypothetical” line of the table below provides information about hypothetical account values and hypothetical expenses based on the Fund’s actual expense ratio and an assumed rate of return of 5% per year before expenses, which is not the Fund’s actual return. The hypothetical account values and expenses may not be used to estimate the actual ending account balance or expenses you paid for the period. You may use this information to compare the ongoing costs of investing in the Fund and other funds. To do so, compare this 5% hypothetical example with the 5% hypothetical examples that appear in the shareholder reports of the other funds.
Please note that the expenses shown in the table are meant to highlight your ongoing costs only and do not reflect any separate account charges assessed by participating insurance companies. Therefore, the “Hypothetical” line of the table is useful in comparing ongoing costs only, and will not help you determine the relative total costs of owning different funds. In addition, if these separate account charges assessed by participating insurance companies were included, your costs would have been higher.
| | Beginning
account value
7-1-2020 | Ending
account value
12-31-2020 | Expenses
paid during
the period1 | Annualized net
expense ratio |
| Class 1 | | | | |
| Actual | $1,000.00 | $1,281.18 | $3.96 | 0.69% |
| Hypothetical (5% return before expenses) | $1,000.00 | $1,021.67 | $3.51 | 0.69% |
| Class 2 | | | | |
| Actual | $1,000.00 | $1,280.97 | $5.39 | 0.94% |
| Hypothetical (5% return before expenses) | $1,000.00 | $1,020.41 | $4.77 | 0.94% |
1 Expenses paid is equal to the annualized net expense ratio of each class multiplied by the average account value over the period, multiplied by the number of days in the most recent fiscal half-year divided by the number of days in the fiscal year (to reflect the one-half-year period).
10 | Wells Fargo VT International Equity Fund
Portfolio of investments—December 31, 2020
| | | | | | Shares | Value |
| Common stocks: 97.89% | | | | | | |
| Australia: 2.16% | | | | | | |
| Qantas Airways Limited (Industrials, Airlines)† | | | | | 431,426 | 1,613,148 |
| Brazil: 1.76% | | | | | | |
| Banco do Brasil SA (Financials, Banks) | | | | | 174,300 | 1,310,331 |
| Canada: 3.47% | | | | | | |
| Home Capital Group Incorporated (Financials, Thrifts & mortgage finance)† | | | | | 40,500 | 944,968 |
| Lundin Mining Corporation (Materials, Metals & mining) | | | | | 185,172 | 1,643,840 |
| | | | | | | 2,588,808 |
| China: 9.02% | | | | | | |
| Alibaba Group Holding Limited ADR (Consumer discretionary, Internet & direct marketing retail)† | | | | | 22,304 | 669,196 |
| HollySys Automation Technologies Limited (Information technology, Electronic equipment, instruments & components) | | | | | 39,681 | 582,914 |
| LONGi Green Energy Technology Company Limited Class A (Information technology, Semiconductors & semiconductor equipment) | | | | | 34,600 | 487,801 |
| Midea Group Company Limited Class A (Consumer discretionary, Household durables) | | | | | 83,798 | 1,261,365 |
| Oppein Home Group Incorporated Class A (Consumer discretionary, Household durables) | | | | | 45,640 | 938,650 |
| Shanghai Pharmaceuticals Holding Company Limited H Shares (Health care, Health care providers & services) | | | | | 756,000 | 1,332,090 |
| Topsports International Holdings Limited (Consumer discretionary, Specialty retail)144A | | | | | 978,000 | 1,463,383 |
| | | | | | | 6,735,399 |
| Denmark: 2.21% | | | | | | |
| Danske Bank AS (Financials, Banks)† | | | | | 99,813 | 1,649,650 |
| France: 5.02% | | | | | | |
| Compagnie de Saint-Gobain SA (Industrials, Building products)† | | | | | 40,102 | 1,837,148 |
| Sanofi SA (Health care, Pharmaceuticals) | | | | | 19,860 | 1,909,417 |
| | | | | | | 3,746,565 |
| Germany: 6.04% | | | | | | |
| Muenchener Rueckversicherungs Gesellschaft AG (Financials, Insurance) | | | | | 5,050 | 1,500,487 |
| Rheinmetall AG (Industrials, Industrial conglomerates) | | | | | 20,122 | 2,130,467 |
| Siemens AG (Industrials, Industrial conglomerates) | | | | | 5,395 | 777,130 |
| Siemens Energy AG (Industrials, Electrical equipment)† | | | | | 2,697 | 98,844 |
| | | | | | | 4,506,928 |
| Hong Kong: 2.52% | | | | | | |
| Xinyi Glass Holdings Limited (Consumer discretionary, Auto components) | | | | | 674,000 | 1,882,257 |
| India: 2.57% | | | | | | |
| Tech Mahindra Limited (Information technology, IT services) | | | | | 144,228 | 1,921,000 |
| Ireland: 1.05% | | | | | | |
| Greencore Group plc (Consumer staples, Food products) | | | | | 492,911 | 785,275 |
The accompanying notes are an integral part of these financial statements.
Wells Fargo VT International Equity Fund | 11
Portfolio of investments—December 31, 2020
| | | | | | Shares | Value |
| Israel: 2.52% | | | | | | |
| Check Point Software Technologies Limited (Information technology, Software)† | | | | | 14,141 | $ 1,879,480 |
| Italy: 1.33% | | | | | | |
| Prysmian SpA (Industrials, Electrical equipment) | | | | | 27,800 | 989,475 |
| Japan: 11.62% | | | | | | |
| Alps Electric Company Limited (Information technology, Electronic equipment, instruments & components) | | | | | 99,100 | 1,307,616 |
| Daiwa Securities Group Incorporated (Financials, Capital markets) | | | | | 346,100 | 1,576,428 |
| Hitachi Limited (Information technology, Electronic equipment, instruments & components) | | | | | 55,500 | 2,190,546 |
| Mitsubishi UFJ Financial Group Incorporated (Financials, Banks) | | | | | 467,600 | 2,070,354 |
| Takeda Pharmaceutical Company Limited (Health care, Pharmaceuticals) | | | | | 42,100 | 1,523,572 |
| | | | | | | 8,668,516 |
| Luxembourg: 0.89% | | | | | | |
| ArcelorMittal (Materials, Metals & mining)† | | | | | 28,749 | 663,089 |
| Netherlands: 6.47% | | | | | | |
| Koninklijke Philips NV (Health care, Health care equipment & supplies)† | | | | | 28,250 | 1,510,919 |
| NN Group NV (Financials, Insurance) | | | | | 50,031 | 2,171,607 |
| OCI NV (Materials, Chemicals)† | | | | | 59,628 | 1,145,116 |
| | | | | | | 4,827,642 |
| Norway: 2.95% | | | | | | |
| DNB ASA (Financials, Banks)† | | | | | 112,471 | 2,203,938 |
| Russia: 2.81% | | | | | | |
| Mobile TeleSystems PJSC ADR (Communication services, Wireless telecommunication services) | | | | | 234,316 | 2,097,128 |
| South Korea: 9.17% | | | | | | |
| Coway Company Limited (Consumer discretionary, Household durables)† | | | | | 27,151 | 1,819,523 |
| Hana Financial Group Incorporated (Financials, Banks) | | | | | 65,656 | 2,091,232 |
| Samsung Electronics Company Limited GDR (Information technology, Technology hardware, storage & peripherals)144A | | | | | 1,120 | 2,044,000 |
| SK Telecom Company Limited (Communication services, Wireless telecommunication services) | | | | | 4,028 | 885,215 |
| | | | | | | 6,839,970 |
| Switzerland: 3.01% | | | | | | |
| LafargeHolcim Limited (Materials, Construction materials) | | | | | 40,893 | 2,244,525 |
| Thailand: 0.87% | | | | | | |
| Siam Commercial Bank plc (Financials, Banks) | | | | | 221,300 | 646,320 |
| United Kingdom: 13.09% | | | | | | |
| ConvaTec Limited (Health care, Health care equipment & supplies)144A | | | | | 414,449 | 1,128,985 |
| Fresnillo plc (Materials, Metals & mining) | | | | | 22,634 | 349,603 |
| John Wood Group plc (Energy, Energy equipment & services)† | | | | | 229,919 | 975,314 |
| Kingfisher plc (Consumer discretionary, Specialty retail)† | | | | | 253,919 | 938,922 |
| Man Group plc (Financials, Capital markets) | | | | | 913,476 | 1,723,867 |
| Nomad Foods Limited (Consumer staples, Food products)† | | | | | 80,154 | 2,037,515 |
| Sensata Technologies Holding plc (Industrials, Electrical equipment)† | | | | | 16,927 | 892,730 |
| Smiths Group plc (Industrials, Industrial conglomerates) | | | | | 83,767 | 1,723,426 |
| | | | | | | 9,770,362 |
The accompanying notes are an integral part of these financial statements.
12 | Wells Fargo VT International Equity Fund
Portfolio of investments—December 31, 2020
| | | | | | Shares | Value |
| United States: 7.34% | | | | | | |
| Advance Auto Parts Incorporated (Consumer discretionary, Specialty retail) | | | | | 5,250 | $ 826,928 |
| Berry Global Group Incorporated (Materials, Containers & packaging)† | | | | | 23,859 | 1,340,637 |
| Gentex Corporation (Consumer discretionary, Auto components) | | | | | 45,392 | 1,540,151 |
| Samsonite International SA (Consumer discretionary, Textiles, apparel & luxury goods)† | | | | | 999,000 | 1,770,569 |
| | | | | | | 5,478,285 |
| Total Common stocks (Cost $61,600,075) | | | | | | 73,048,091 |
| | | Yield | | | | |
| Short-term investments: 2.02% | | | | | | |
| Investment companies: 2.02% | | | | | | |
| Wells Fargo Government Money Market Fund Select Class ♠∞ | | 0.03% | | | 1,508,148 | 1,508,148 |
| Total Short-term investments (Cost $1,508,148) | | | | | | 1,508,148 |
| Total investments in securities (Cost $63,108,223) | 99.91% | | | | | 74,556,239 |
| Other assets and liabilities, net | 0.09 | | | | | 70,538 |
| Total net assets | 100.00% | | | | | $ 74,626,777 |
| † | Non-income-earning security |
| 144A | The security may be resold in transactions exempt from registration, normally to qualified institutional buyers, pursuant to Rule 144A under the Securities Act of 1933. |
| ♠ | The issuer of the security is an affiliated person of the Fund as defined in the Investment Company Act of 1940. |
| ∞ | The rate represents the 7-day annualized yield at period end. |
| Abbreviations: |
| ADR | American depositary receipt |
| GDR | Global depositary receipt |
Investments in affiliates
An affiliated investment is an investment in which the Fund owns at least 5% of the outstanding voting shares of the issuer or as a result of other relationships, such as the Fund and the issuer having the same investment manager. Transactions with issuers that were either affiliated persons of the Fund at the beginning of the period or the end of the period were as follows:
| | Value,
beginning of
period | Purchases | Sales
proceeds | Net
realized
gains
(losses) | | Net
change in
unrealized
gains
(losses) | | Value,
end of
period | | % of
net
assets | Shares,
end
of period | Income
from
affiliated
securities |
| Short-term investments | | | | | | | | | | | | |
| Investment companies | | | | | | | | | | | | |
| Securities Lending Cash Investments LLC* | $ 664,309 | $ 1,004,539 | $ (1,668,850) | $2 | | $0 | | $ 0 | | | 0 | $ 624# |
| Wells Fargo Government Money Market Fund Select Class | 1,474,228 | 30,103,401 | (30,069,481) | 0 | | 0 | | 1,508,148 | | | 1,508,148 | 7,134 |
| | | | | $2 | | $0 | | $1,508,148 | | 2.02% | | $7,758 |
| * | No longer held at the end of period |
| # | Amount shown represents income before fees and rebates. |
The accompanying notes are an integral part of these financial statements.
Wells Fargo VT International Equity Fund | 13
Portfolio of investments—December 31, 2020
Forward foreign currency contracts
Currency to be
received | Currency to be
delivered | Counterparty | Settlement
date | Unrealized
gains | | Unrealized
losses |
| 903,000 GBP | 1,200,602 USD | Barclays Bank plc | 2-18-2021 | $ 34,629 | | $ 0 |
| 1,191,864 USD | 903,000 GBP | Barclays Bank plc | 2-18-2021 | 0 | | (43,367) |
| | | | | $34,629 | | $(43,367) |
The accompanying notes are an integral part of these financial statements.
14 | Wells Fargo VT International Equity Fund
Statement of assets and liabilities—December 31, 2020
| | |
| Assets | |
Investments in unaffiliated securities, at value (cost $61,600,075)
| $ 73,048,091 |
Investments in affiliated securites, at value (cost $1,508,148)
| 1,508,148 |
Cash
| 90,678 |
Receivable for dividends
| 355,223 |
Foreign currency, at value (cost $113,970)
| 114,665 |
Unrealized gains on forward foreign currency contracts
| 34,629 |
Receivable for Fund shares sold
| 19 |
Prepaid expenses and other assets
| 1,898 |
Total assets
| 75,153,351 |
| Liabilities | |
Payable for investments purchased
| 189,066 |
Management fee payable
| 174,449 |
Payable for Fund shares redeemed
| 58,612 |
Unrealized losses on forward foreign currency contracts
| 43,367 |
Distribution fee payable
| 13,044 |
Administration fees payable
| 5,479 |
Trustees’ fees and expenses payable
| 4,009 |
Accrued expenses and other liabilities
| 38,548 |
Total liabilities
| 526,574 |
Total net assets
| $74,626,777 |
| Net assets consist of | |
Paid-in capital
| $ 73,554,737 |
Total distributable earnings
| 1,072,040 |
Total net assets
| $74,626,777 |
| Computation of net asset value per share | |
Net assets – Class 1
| $ 17,459,353 |
Shares outstanding – Class 11
| 9,438,883 |
Net asset value per share – Class 1
| $1.85 |
Net assets – Class 2
| $ 57,167,424 |
Shares outstanding – Class 21
| 29,870,506 |
Net asset value per share – Class 2
| $1.91 |
| 1 | The Fund has an unlimited number of authorized shares |
The accompanying notes are an integral part of these financial statements.
Wells Fargo VT International Equity Fund | 15
Statement of operations—year ended December 31, 2020
| | |
| Investment income | |
Dividends (net of foreign withholdings taxes of $179,655)
| $ 1,532,794 |
Income from affiliated securities
| 7,757 |
Total investment income
| 1,540,551 |
| Expenses | |
Management fee
| 540,905 |
| Administration fees | |
Class 1
| 12,974 |
Class 2
| 41,116 |
| Distribution fee | |
Class 2
| 128,266 |
Custody and accounting fees
| 55,939 |
Professional fees
| 46,311 |
Shareholder report expenses
| 30,488 |
Trustees’ fees and expenses
| 19,862 |
Other fees and expenses
| 17,112 |
Total expenses
| 892,973 |
| Less: Fee waivers and/or expense reimbursements | |
Fund-level
| (297,954) |
Net expenses
| 595,019 |
Net investment income
| 945,532 |
| Realized and unrealized gains (losses) on investments | |
| Net realized gains (losses) on | |
Unaffiliated securities
| (9,172,080) |
Affiliated securities
| 2 |
Forward foreign currency contracts
| (240,342) |
Net realized losses on investments
| (9,412,420) |
| Net change in unrealized gains (losses) on | |
Unaffiliated securities
| 10,480,272 |
Forward foreign currency contracts
| 79,507 |
Net change in unrealized gains (losses) on investments
| 10,559,779 |
Net realized and unrealized gains (losses) on investments
| 1,147,359 |
Net increase in net assets resulting from operations
| $ 2,092,891 |
The accompanying notes are an integral part of these financial statements.
16 | Wells Fargo VT International Equity Fund
Statement of changes in net assets
| | |
| | Year ended
December 31, 2020 | Year ended
December 31, 2019 |
| Operations | | | | |
Net investment income
| | $ 945,532 | | $ 1,907,276 |
Net realized losses on investments
| | (9,412,420) | | (1,090,787) |
Net change in unrealized gains (losses) on investments
| | 10,559,779 | | 10,994,817 |
Net increase in net assets resulting from operations
| | 2,092,891 | | 11,811,306 |
| Distributions to shareholders from | | | | |
| Net investment income and net realized gains | | | | |
Class 1
| | (472,932) | | (9,077,111) |
Class 2
| | (1,308,572) | | (27,331,240) |
Total distributions to shareholders
| | (1,781,504) | | (36,408,351) |
| Capital share transactions | Shares | | Shares | |
| Proceeds from shares sold | | | | |
Class 1
| 514,844 | 744,962 | 386,051 | 874,936 |
Class 2
| 1,093,316 | 1,614,560 | 803,693 | 1,889,549 |
| | | 2,359,522 | | 2,764,485 |
| Reinvestment of distributions | | | | |
Class 1
| 319,548 | 472,932 | 5,186,921 | 9,077,111 |
Class 2
| 849,722 | 1,308,572 | 15,100,133 | 27,331,240 |
| | | 1,781,504 | | 36,408,351 |
| Payment for shares redeemed | | | | |
Class 1
| (2,281,763) | (3,640,125) | (1,474,212) | (3,230,199) |
Class 2
| (4,910,668) | (7,964,863) | (3,468,601) | (7,885,488) |
| | | (11,604,988) | | (11,115,687) |
Net increase (decrease) in net assets resulting from capital share transactions
| | (7,463,962) | | 28,057,149 |
Total increase (decrease) in net assets
| | (7,152,575) | | 3,460,104 |
| Net assets | | | | |
Beginning of period
| | 81,779,352 | | 78,319,248 |
End of period
| | $ 74,626,777 | | $ 81,779,352 |
The accompanying notes are an integral part of these financial statements.
Wells Fargo VT International Equity Fund | 17
Financial highlights
(For a share outstanding throughout each period)
| | Year ended December 31 |
| Class 1 | 2020 | 2019 | 2018 | 2017 | 2016 |
Net asset value, beginning of period
| $1.83 | $2.85 | $5.34 | $4.41 | $4.82 |
Net investment income
| 0.03 1 | 0.06 1 | 0.10 1 | 0.12 1 | 0.11 1 |
Net realized and unrealized gains (losses) on investments
| 0.04 | 0.34 | (0.77) | 0.96 | (0.01) |
Total from investment operations
| 0.07 | 0.40 | (0.67) | 1.08 | 0.10 |
| Distributions to shareholders from | | | | | |
Net investment income
| (0.05) | (0.13) | (0.61) | (0.15) | (0.15) |
Net realized gains
| 0.00 | (1.29) | (1.21) | 0.00 | (0.36) |
Total distributions to shareholders
| (0.05) | (1.42) | (1.82) | (0.15) | (0.51) |
Net asset value, end of period
| $1.85 | $1.83 | $2.85 | $5.34 | $4.41 |
Total return2
| 4.31% | 16.14% | (16.86)% | 24.86% | 3.25% |
| Ratios to average net assets (annualized) | | | | | |
Gross expenses
| 1.13% | 1.13% | 1.12% | 0.95% | 0.95% |
Net expenses
| 0.69% | 0.69% | 0.69% | 0.69% | 0.69% |
Net investment income
| 1.59% | 2.55% | 2.41% | 2.41% | 2.49% |
| Supplemental data | | | | | |
Portfolio turnover rate
| 80% | 48% | 51% | 55% | 77% |
Net assets, end of period (000s omitted)
| $17,459 | $19,872 | $19,315 | $28,001 | $25,137 |
| 1 | Calculated based upon average shares outstanding |
| 2 | Performance figures of the Fund do not reflect fees and expenses charged pursuant to the terms of variable life insurance policies and variable annuity contracts. |
The accompanying notes are an integral part of these financial statements.
18 | Wells Fargo VT International Equity Fund
Financial highlights
(For a share outstanding throughout each period)
| | Year ended December 31 |
| Class 2 | 2020 | 2019 | 2018 | 2017 | 2016 |
Net asset value, beginning of period
| $1.89 | $2.89 | $5.38 | $4.45 | $4.84 |
Net investment income
| 0.03 1 | 0.05 1 | 0.09 1 | 0.11 1 | 0.10 |
Net realized and unrealized gains (losses) on investments
| 0.03 | 0.36 | (0.78) | 0.96 | 0.00 |
Total from investment operations
| 0.06 | 0.41 | (0.69) | 1.07 | 0.10 |
| Distributions to shareholders from | | | | | |
Net investment income
| (0.04) | (0.12) | (0.59) | (0.14) | (0.13) |
Net realized gains
| 0.00 | (1.29) | (1.21) | 0.00 | (0.36) |
Total distributions to shareholders
| (0.04) | (1.41) | (1.80) | (0.14) | (0.49) |
Net asset value, end of period
| $1.91 | $1.89 | $2.89 | $5.38 | $4.45 |
Total return2
| 3.83% | 16.10% | (17.28)% | 24.34% | 3.30% |
| Ratios to average net assets (annualized) | | | | | |
Gross expenses
| 1.38% | 1.38% | 1.30% | 1.20% | 1.20% |
Net expenses
| 0.94% | 0.94% | 0.94% | 0.94% | 0.94% |
Net investment income
| 1.34% | 2.30% | 1.82% | 2.18% | 2.25% |
| Supplemental data | | | | | |
Portfolio turnover rate
| 80% | 48% | 51% | 55% | 77% |
Net assets, end of period (000s omitted)
| $57,167 | $61,907 | $59,004 | $318,202 | $288,628 |
| 1 | Calculated based upon average shares outstanding |
| 2 | Performance figures of the Fund do not reflect fees and expenses charged pursuant to the terms of variable life insurance policies and variable annuity contracts. |
The accompanying notes are an integral part of these financial statements.
Wells Fargo VT International Equity Fund | 19
Notes to financial statements
1. ORGANIZATION
Wells Fargo Variable Trust (the “Trust”), a Delaware statutory trust organized on March 10, 1999, is an open-end management investment company registered under the Investment Company Act of 1940, as amended (the “1940 Act”). As an investment company, the Trust follows the accounting and reporting guidance in Financial Accounting Standards Board (“FASB”) Accounting Standards Codification Topic 946, Financial Services – Investment Companies. These financial statements report on the Wells Fargo VT International Equity Fund (the “Fund”) which is a diversified series of the Trust. The Trust offers shares of the Fund to separate accounts of various life insurance companies as funding vehicles for certain variable annuity contracts and variable life insurance policies.
2. SIGNIFICANT ACCOUNTING POLICIES
The following significant accounting policies, which are consistently followed in the preparation of the financial statements of the Fund, are in conformity with U.S. generally accepted accounting principles which require management to make estimates and assumptions that affect the reported amounts of assets and liabilities, disclosure of contingent assets and liabilities at the date of the financial statements, and the reported amounts of income and expenses during the reporting period. Actual results could differ from those estimates.
Securities valuation
All investments are valued each business day as of the close of regular trading on the New York Stock Exchange (generally 4 p.m. Eastern Time), although the Fund may deviate from this calculation time under unusual or unexpected circumstances.
Equity securities that are listed on a foreign or domestic exchange or market are valued at the official closing price or, if none, the last sales price. If no sale occurs on the principal exchange or market that day, a fair value price will be determined in accordance with the Fund’s Valuation Procedures.
Forward foreign currency contracts are recorded at the forward rate provided by an independent foreign currency pricing source at a time each business day specified by the Wells Fargo Asset Management Pricing Committee at Wells Fargo Funds Management, LLC (“Funds Management”).
Many securities markets and exchanges outside the U.S. close prior to the close of the New York Stock Exchange and therefore may not fully reflect trading or events that occur after the close of the principal exchange in which the foreign securities are traded, but before the close of the New York Stock Exchange. If such trading or events are expected to materially affect the value of such securities, then fair value pricing procedures approved by the Board of Trustees of the Fund are applied. These procedures take into account multiple factors including movements in U.S. securities markets after foreign exchanges close. Foreign securities that are fair valued under these procedures are categorized as Level 2 and the application of these procedures may result in transfers between Level 1 and Level 2. Depending on market activity, such fair valuations may be frequent. Such fair value pricing may result in net asset values that are higher or lower than net asset values based on the last reported sales price or latest quoted bid price. On December 31, 2020, such fair value pricing was used in pricing certain foreign securities.
Investments in registered open-end investment companies are valued at net asset value. Interests in non-registered investment companies that are redeemable at net asset value are fair valued normally at net asset value.
Investments which are not valued using any of the methods discussed above are valued at their fair value, as determined in good faith by the Board of Trustees of the Fund. The Board of Trustees has established a Valuation Committee comprised of the Trustees and has delegated to it the authority to take any actions regarding the valuation of portfolio securities that the Valuation Committee deems necessary or appropriate, including determining the fair value of portfolio securities, unless the determination has been delegated to the Wells Fargo Asset Management Pricing Committee. The Board of Trustees retains the authority to make or ratify any valuation decisions or approve any changes to the Valuation Procedures as it deems appropriate. On a quarterly basis, the Board of Trustees receives reports on any valuation actions taken by the Valuation Committee or the Wells Fargo Asset Management Pricing Committee which may include items for ratification.
Foreign currency translation
The accounting records of the Fund are maintained in U.S. dollars. The values of other assets and liabilities denominated in foreign currencies are translated into U.S. dollars at rates provided by an independent foreign currency pricing source at a time each business day specified by the Wells Fargo Asset Management Pricing Committee. Purchases and sales of securities, and income and expenses are converted at the rate of exchange on the respective dates of such transactions. Net realized foreign exchange gains or losses arise from sales of foreign currencies, currency gains or losses realized between the trade and settlement dates on securities transactions, and the difference between the amounts of dividends, interest and foreign
20 | Wells Fargo VT International Equity Fund
Notes to financial statements
withholding taxes recorded and the U.S. dollar equivalent of the amounts actually paid or received. Net unrealized foreign exchange gains and losses arise from changes in the fair value of assets and liabilities other than investments in securities resulting from changes in exchange rates. The changes in net assets arising from changes in exchange rates of securities and the changes in net assets resulting from changes in market prices of securities are not separately presented. Such changes are included in net realized and unrealized gains or losses from investments.
Forward foreign currency contracts
A forward foreign currency contract is an agreement between two parties to purchase or sell a specific currency for an agreed-upon price at a future date. The Fund enters into forward foreign currency contracts to facilitate transactions in foreign-denominated securities and to attempt to minimize the risk to the Fund from adverse changes in the relationship between currencies. Forward foreign currency contracts are recorded at the forward rate and marked-to-market daily. When the contracts are closed, realized gains and losses arising from such transactions are recorded as realized gains or losses on forward foreign currency contracts. The Fund is subject to foreign currency risk and may be exposed to risks if the counterparties to the contracts are unable to meet the terms of their contracts or if the value of the foreign currency changes unfavorably. The Fund's maximum risk of loss from counterparty credit risk is the unrealized gains on the contracts. This risk may be mitigated if there is a master netting arrangement between the Fund and the counterparty.
Securities lending
The Fund may lend its securities from time to time in order to earn additional income in the form of fees or interest on securities received as collateral or the investment of any cash received as collateral. When securities are on loan, the Fund receives interest or dividends on those securities. Cash collateral received in connection with its securities lending transactions is invested in Securities Lending Cash Investments, LLC (the “Securities Lending Fund”). Investments in Securities Lending Fund are valued at the evaluated bid price provided by an independent pricing service. Income earned from investment in the Securities Lending Fund (net of fees and rebates), if any, is included in income from affiliated securities on the Statement of Operations.
In a securities lending transaction, the net asset value of the Fund is affected by an increase or decrease in the value of the securities loaned and by an increase or decrease in the value of the instrument in which collateral is invested. The amount of securities lending activity undertaken by the Fund fluctuates from time to time. The Fund has the right under the lending agreement to recover the securities from the borrower on demand. In the event of default or bankruptcy by the borrower, the Fund may be prevented from recovering the loaned securities or gaining access to the collateral or may experience delays or costs in doing so. In such an event, the terms of the agreement allow the unaffiliated securities lending agent to use the collateral to purchase replacement securities on behalf of the Fund or pay the Fund the market value of the loaned securities. The Fund bears the risk of loss with respect to depreciation of its investment of the cash collateral.
Security transactions and income recognition
Securities transactions are recorded on a trade date basis. Realized gains or losses are recorded on the basis of identified cost.
Dividend income is recognized on the ex-dividend date, except for certain dividends from foreign securities, which are recorded as soon as the custodian verifies the ex-dividend date. Dividend income from foreign securities is recorded net of foreign taxes withheld where recovery of such taxes is not assured.
Distributions to shareholders
Distributions to shareholders from net investment income and any net realized gains are recorded on the ex-dividend date and paid at least annually. Such distributions are determined in accordance with income tax regulations and may differ from U.S. generally accepted accounting principles. Dividend sources are estimated at the time of declaration. The tax character of distributions is determined as of the Fund’s fiscal year end. Therefore, a portion of the Fund’s distributions made prior to the Fund’s fiscal year end may be categorized as a tax return of capital at year end.
Federal and other taxes
The Fund intends to continue to qualify as a regulated investment company by distributing substantially all of its investment company taxable income and any net realized capital gains (after reduction for capital loss carryforwards) sufficient to relieve it from all, or substantially all, federal income taxes. Accordingly, no provision for federal income taxes was required.
The Fund’s income and federal excise tax returns and all financial records supporting those returns for the prior three fiscal years are subject to examination by the federal and Delaware revenue authorities. Management has analyzed the Fund’s tax positions taken on federal, state, and foreign tax returns for all open tax years and does not believe that there are any uncertain tax positions that require recognition of a tax liability.
Wells Fargo VT International Equity Fund | 21
Notes to financial statements
As of December 31, 2020, the aggregate cost of all investments for federal income tax purposes was $64,981,475 and the unrealized gains (losses) consisted of:
| Gross unrealized gains | $12,154,856 |
| Gross unrealized losses | (2,588,830) |
| Net unrealized gains | $ 9,566,026 |
As of December 31, 2020, the Fund had capital loss carryforwards which consisted of $1,749,723 in short-term capital losses and $7,609,870 in long-term capital losses.
Class allocations
The separate classes of shares offered by the Fund differ principally in distribution fees. Class specific expenses are charged directly to that share class. Investment income, common fund-level expenses, and realized and unrealized gains (losses) on investments are allocated daily to each class of shares based on the relative proportion of net assets of each class.
3. FAIR VALUATION MEASUREMENTS
Fair value measurements of investments are determined within a framework that has established a fair value hierarchy based upon the various data inputs utilized in determining the value of the Fund’s investments. The three-level hierarchy gives the highest priority to unadjusted quoted prices in active markets for identical assets or liabilities (Level 1) and the lowest priority to unobservable inputs (Level 3). The Fund’s investments are classified within the fair value hierarchy based on the lowest level of input that is significant to the fair value measurement. The inputs are summarized into three broad levels as follows:
| ■ | Level 1 – quoted prices in active markets for identical securities |
| ■ | Level 2 – other significant observable inputs (including quoted prices for similar securities, interest rates, prepayment speeds, credit risk, etc.) |
| ■ | Level 3 – significant unobservable inputs (including the Fund’s own assumptions in determining the fair value of investments) |
The inputs or methodologies used for valuing investments in securities are not necessarily an indication of the risk associated with investing in those securities.
22 | Wells Fargo VT International Equity Fund
Notes to financial statements
The following is a summary of the inputs used in valuing the Fund’s assets and liabilities as of December 31, 2020:
| | Quoted prices
(Level 1) | Other significant
observable inputs
(Level 2) | Significant
unobservable inputs
(Level 3) | Total |
| Assets | | | | |
| Investments in: | | | | |
| Common stocks | | | | |
| Australia | $ 1,613,148 | $ 0 | $0 | $ 1,613,148 |
| Brazil | 0 | 1,310,331 | 0 | 1,310,331 |
| Canada | 2,588,808 | 0 | 0 | 2,588,808 |
| China | 6,735,399 | 0 | 0 | 6,735,399 |
| Denmark | 0 | 1,649,650 | 0 | 1,649,650 |
| France | 3,746,565 | 0 | 0 | 3,746,565 |
| Germany | 98,844 | 4,408,084 | 0 | 4,506,928 |
| Hong Kong | 1,882,257 | 0 | 0 | 1,882,257 |
| India | 1,921,000 | 0 | 0 | 1,921,000 |
| Ireland | 785,275 | 0 | 0 | 785,275 |
| Israel | 1,879,480 | 0 | 0 | 1,879,480 |
| Italy | 0 | 989,475 | 0 | 989,475 |
| Japan | 0 | 8,668,516 | 0 | 8,668,516 |
| Luxembourg | 663,089 | 0 | 0 | 663,089 |
| Netherlands | 4,827,642 | 0 | 0 | 4,827,642 |
| Norway | 0 | 2,203,938 | 0 | 2,203,938 |
| Russia | 2,097,128 | 0 | 0 | 2,097,128 |
| South Korea | 2,044,000 | 4,795,970 | 0 | 6,839,970 |
| Switzerland | 0 | 2,244,525 | 0 | 2,244,525 |
| Thailand | 646,320 | 0 | 0 | 646,320 |
| United Kingdom | 9,770,362 | 0 | 0 | 9,770,362 |
| United States | 5,478,285 | 0 | 0 | 5,478,285 |
| Short-term investments | | | | |
| Investment companies | 1,508,148 | 0 | 0 | 1,508,148 |
| Forward foreign currency contract | 0 | 34,629 | 0 | 34,629 |
| Total assets | $48,285,750 | $26,305,118 | $0 | $74,590,868 |
| Liabilitites | | | | |
| Forward foreign currency contract | $ 0 | $ 43,367 | $0 | $ 43,367 |
| Total liabilities | $ 0 | $ 43,367 | $0 | $ 43,367 |
Forward foreign currency contracts are reported at their cumulative unrealized gains (losses) at measurement date as reported in the table following the Portfolio of Investments. All other assets and liabilities are reported at their market value at measurement date.
Additional sector, industry or geographic detail is included in the Portfolio of Investments.
For the year ended December 31, 2020, the Fund did not have any transfers into/out of Level 3.
4. TRANSACTIONS WITH AFFILIATES
Management fee
Funds Management, an indirect wholly owned subsidiary of Wells Fargo & Company (“Wells Fargo”), is the manager of the Fund and provides advisory and fund-level administrative services under an investment management agreement. Under the investment management agreement, Funds Management is responsible for, among other services, implementing the investment objectives and strategies of the Fund, supervising the subadviser and providing fund-level administrative services in
Wells Fargo VT International Equity Fund | 23
Notes to financial statements
connection with the Fund’s operations. As compensation for its services under the investment management agreement, Funds Management is entitled to receive a management fee at the following annual rate based on the Fund’s average daily net assets:
| Average daily net assets | Management fee |
| First $500 million | 0.800% |
| Next $500 million | 0.750 |
| Next $1 billion | 0.700 |
| Next $2 billion | 0.675 |
| Next $1 billion | 0.650 |
| Next $5 billion | 0.640 |
| Over $10 billion | 0.630 |
For the year ended December 31, 2020, the management fee was equivalent to an annual rate of 0.80% of the Fund’s average daily net assets.
Funds Management has retained the services of a subadviser to provide daily portfolio management to the Fund. The fee for subadvisory services is borne by Funds Management. Wells Capital Management Incorporated ("WellsCap"), an affiliate of Funds Management and an indirect wholly owned subsidiary of Wells Fargo, is the subadviser to the Fund and is entitled to receive a fee from Funds Management at an annual rate starting at 0.45% and declining to 0.40% as the average daily net assets of the Fund increase.
Administration fees
Under a class-level administration agreement, Funds Management provides class-level administrative services to the Fund, which includes paying fees and expenses for services provided by the transfer agent, sub-transfer agents, omnibus account services and record-keepers. As compensation for its services under the class-level administration agreement, Funds Management receives an annual fee of 0.08% which is calculated based on the average daily net assets of each class.
Waivers and/or expense reimbursements
Funds Management has contractually waived and/or reimbursed management and administration fees to the extent necessary to maintain certain net operating expense ratios for the Fund. When each class of the Fund has exceeded its expense cap, Funds Management has waived fees and/or reimbursed expenses from fund-level expenses on a proportionate basis and then from class specific expenses. When only certain classes exceed their expense caps, waivers and/or reimbursements are applied against class specific expenses before fund-level expenses. Funds Management has committed through April 30, 2021 to waive fees and/or reimburse expenses to the extent necessary to cap the Fund’s expenses at 0.69% for Class 1 shares and 0.94% for Class 2 shares. Prior to or after the commitment expiration date, the cap may be increased or the commitment to maintain the cap may be terminated only with the approval of the Board of Trustees.
Distribution fee
The Trust has adopted a distribution plan for Class 2 shares of the Fund pursuant to Rule 12b-1 under the 1940 Act. A distribution fee is charged to Class 2 shares and paid to Wells Fargo Funds Distributor, LLC, the principal underwriter, at an annual rate of 0.25% of the average daily net assets of Class 2 shares.
Interfund transactions
The Fund may purchase or sell portfolio investment securities to certain other Wells Fargo affiliates pursuant to Rule 17a-7 under the 1940 Act and under procedures adopted by the Board of Trustees. The procedures have been designed to ensure that these interfund transactions, which do not incur broker commissions, are effected at current market prices.
5. INVESTMENT PORTFOLIO TRANSACTIONS
Purchases and sales of investments, excluding U.S. government obligations (if any) and short-term securities, for the year ended December 31, 2020 were $52,380,344 and $60,179,234, respectively.
6. SECURITIES LENDING TRANSACTIONS
The Fund lends its securities through an unaffiliated securities lending agent and receives collateral in the form of cash or securities with a value at least equal to the value of the securities on loan. The value of the loaned securities is determined at the close of each business day and any increases or decreases in the required collateral are exchanged between the Fund and
24 | Wells Fargo VT International Equity Fund
Notes to financial statements
the counterparty on the next business day. Cash collateral received is invested in the Securities Lending Fund which seeks to provide a positive return compared to the daily Federal Funds Open Rate by investing in high-quality, U.S. dollar-denominated short-term money market instruments and is exempt from registration under Section 3(c)(7) of the 1940 Act. Securities Lending Fund is managed by Funds Management and is subadvised by WellsCap. Funds Management receives an advisory fee starting at 0.05% and declining to 0.01% as the average daily net assets of the Securities Lending Fund increase. All of the fees received by Funds Management are paid to WellsCap for its services as subadviser.
In the event of counterparty default or the failure of a borrower to return a loaned security, the Fund has the right to use the collateral to offset any losses incurred. As of December 31, 2020, the Fund did not have any securities on loan.
7. DERIVATIVE TRANSACTIONS
During the year ended December 31, 2020, the Fund entered into forward foreign currency contracts for economic hedging purposes. The Fund had average contract amounts of $1,509,968 and $3,456,462 in forward foreign currency contracts to buy and forward foreign currency contracts to sell, respectively, during the year ended December 31, 2020.
For certain types of derivative transactions, the Fund has entered into International Swaps and Derivatives Association, Inc. master agreements (“ISDA Master Agreements”) or similar agreements with approved counterparties. The ISDA Master Agreements or similar agreements may have requirements to deliver/deposit securities or cash to/with an exchange or broker-dealer as collateral and allows the Fund to offset, with each counterparty, certain derivative financial instrument’s assets and/or liabilities with collateral held or pledged. Collateral requirements differ by type of derivative. Collateral or margin requirements are set by the broker or exchange clearinghouse for exchange traded derivatives while collateral terms are contract specific for over-the-counter traded derivatives. Cash collateral that has been pledged to cover obligations of the Fund under ISDA Master Agreements or similar agreements, if any, are reported separately in the Statement of Assets and Liabilities. Securities pledged as collateral, if any, are noted in the Portfolio of Investments. With respect to balance sheet offsetting, absent an event of default by the counterparty or a termination of the agreement, the reported amounts of financial assets and financial liabilities in the Statement of Assets and Liabilities are not offset across transactions between the Fund and the applicable counterparty. A reconciliation of the gross amounts on the Statement of Assets and Liabilities to the net amounts by counterparty, including any collateral exposure, for OTC derivatives is as follows:
| Counterparty | Gross amounts
of assets in the
Statement of
Assets and
Liabilities | Amounts
subject to
netting
agreements | Collateral
received | Net amount
of assets |
| Barclays Bank plc | $34,629 | $(34,629) | $0 | $0 |
| Counterparty | Gross amounts
of liabilities in the
Statement of
Assets and
Liabilities | Amounts
subject to
netting
agreements | Collateral
pledged | Net amount
of liabilities |
| Barclays Bank plc | $43,367 | $(34,629) | $0 | $8,738 |
8. BANK BORROWINGS
The Trust, Wells Fargo Master Trust and Wells Fargo Funds Trust (excluding the money market funds) are parties to a $350,000,000 revolving credit agreement whereby the Fund is permitted to use bank borrowings for temporary or emergency purposes, such as to fund shareholder redemption requests. Interest under the credit agreement is charged to the Fund based on a borrowing rate equal to the higher of the Federal Funds rate in effect on that day plus 1.25% or the overnight LIBOR rate in effect on that day plus 1.25%. In addition, an annual commitment fee equal to 0.25% of the unused balance is allocated to each participating fund.
For the year ended December 31, 2020, there were no borrowings by the Fund under the agreement.
Wells Fargo VT International Equity Fund | 25
Notes to financial statements
9. DISTRIBUTIONS TO SHAREHOLDERS
The tax character of distributions paid during the years ended December 31, 2020 and December 31, 2019 were as follows:
| | Year ended December 31 |
| | 2020 | 2019 |
| Ordinary income | $1,781,504 | $ 9,446,993 |
| Long-term capital gain | 0 | 26,961,358 |
As of December 31, 2020, the components of distributable earnings on a tax basis were as follows:
Undistributed
ordinary
income | Unrealized
gains | Capital loss
carryforward |
| $870,186 | $9,566,722 | $(9,359,593) |
10. CONCENTRATION RISKS
Concentration risks result from exposure to a limited number of geographic regions. As of the end of the period, the Fund invested a concentration of its portfolio in Asia/Pacific ex-Japan and Europe . A fund that invests a substantial portion of its assets in any geographic region may be more affected by changes in that geographic region than would be a fund whose investments are not heavily weighted in any geographic region.
11. INDEMNIFICATION
Under the Fund's organizational documents, the officers and Trustees have been granted certain indemnification rights against certain liabilities that may arise out of performance of their duties to the Fund. The Fund has entered into a separate agreement with each Trustee that converts indemnification rights currently existing under the Fund’s organizational documents into contractual rights that cannot be changed in the future without the consent of the Trustee. Additionally, in the normal course of business, the Fund may enter into contracts with service providers that contain a variety of indemnification clauses. The Fund’s maximum exposure under these arrangements is dependent on future claims that may be made against the Fund and, therefore, cannot be estimated.
12. NEW ACCOUNTING PRONOUNCEMENT
In August 2018, FASB issued Accounting Standards Update (“ASU”) No. 2018-13, Fair Value Measurement (Topic 820) Disclosure Framework - Changes to the Disclosure Requirements for Fair Value Measurement. ASU 2018-13 updates the disclosure requirements on fair value measurements in Topic 820, Fair Value Measurements. The amendments are effective for fiscal years, and interim periods within those fiscal years, beginning after December 15, 2019. Management has adopted this guidance which did not have a material impact on the financial statements.
13. SUBSEQUENT EVENT
On February 23, 2021, Wells Fargo announced that it has entered into a definitive agreement to sell Wells Fargo Asset Management (“WFAM”) to GTCR LLC and Reverence Capital Partners, L.P. WFAM is the trade name used by the asset management businesses of Wells Fargo and includes Wells Fargo Funds Management, LLC, the investment manager to the Fund, Wells Capital Management Incorporated and Wells Fargo Asset Management (International) Limited, both registered investment advisers providing sub-advisory services to certain funds, and Wells Fargo Funds Distributor, LLC, the Fund’s principal underwriter. As part of the transaction, Wells Fargo will own a 9.9% equity interest and will continue to serve as an important client and distribution partner.
Consummation of the transaction will result in the automatic termination of the Fund’s investment management agreement and sub-advisory agreement(s). The Fund’s Board of Trustees will be asked to approve new investment management arrangements with the new company. If approved by the Board, the new investment management arrangements with the new company will be presented to the shareholders of the Fund for approval, and, if approved by shareholders, would take effect upon the closing of the transaction. The transaction is expected to close in the second half of 2021, subject to customary closing conditions.
26 | Wells Fargo VT International Equity Fund
Notes to financial statements
14. CORONAVIRUS (COVID-19) PANDEMIC
On March 11, 2020, the World Health Organization announced that it had made the assessment that coronavirus disease 2019 (“COVID-19”) is a pandemic. The impacts of COVID-19 are affecting the entire global economy, individual companies and investment products, and the market in general. There is significant uncertainty around the extent and duration of business disruptions related to COVID-19 and the impacts may be short term or may last for an extended period of time. The risk of further spreading of COVID-19 has led to significant uncertainty and volatility in the financial markets.
Wells Fargo VT International Equity Fund | 27
Report of independent registered public accounting firm
To the Shareholders of the Fund and Board of Trustees
Wells Fargo Variable Trust:
Opinion on the Financial Statements
We have audited the accompanying statement of assets and liabilities of Wells Fargo VT International Equity Fund (the Fund), one of the funds constituting Wells Fargo Variable Trust, including the portfolio of investments, as of December 31, 2020, the related statement of operations for the year then ended, the statements of changes in net assets for each of the years in the two-year period then ended, and the related notes (collectively, the financial statements) and the financial highlights for each of the years in the five-year period then ended. In our opinion, the financial statements and financial highlights present fairly, in all material respects, the financial position of the Fund as of December 31, 2020, the results of its operations for the year then ended, the changes in its net assets for each of the years in the two-year period then ended, and the financial highlights for each of the years in the five-year period then ended, in conformity with U.S. generally accepted accounting principles.
Basis for Opinion
These financial statements and financial highlights are the responsibility of the Fund’s management. Our responsibility is to express an opinion on these financial statements and financial highlights based on our audits. We are a public accounting firm registered with the Public Company Accounting Oversight Board (United States) (PCAOB) and are required to be independent with respect to the Fund in accordance with the U.S. federal securities laws and the applicable rules and regulations of the Securities and Exchange Commission and the PCAOB.
We conducted our audits in accordance with the standards of the PCAOB. Those standards require that we plan and perform the audit to obtain reasonable assurance about whether the financial statements and financial highlights are free of material misstatement, whether due to error or fraud. Our audits included performing procedures to assess the risks of material misstatement of the financial statements and financial highlights, whether due to error or fraud, and performing procedures that respond to those risks. Such procedures included examining, on a test basis, evidence regarding the amounts and disclosures in the financial statements and financial highlights. Such procedures also included confirmation of securities owned as of December 31, 2020, by correspondence with the custodian, transfer agent and brokers, or by other appropriate auditing procedures. Our audits also included evaluating the accounting principles used and significant estimates made by management, as well as evaluating the overall presentation of the financial statements and financial highlights. We believe that our audits provide a reasonable basis for our opinion.

We have not been able to determine the specific year that we began serving as the auditor of one or more Wells Fargo Funds investment companies; however we are aware that we have served as the auditor of one or more Wells Fargo Funds investment companies since at least 1955.
Boston, Massachusetts
February 25, 2021
28 | Wells Fargo VT International Equity Fund
Other information (unaudited)
TAX INFORMATION
For corporate shareholders, pursuant to Section 854 of the Internal Revenue Code, 3.58% of ordinary income dividends qualify for the corporate dividends-received deduction for the fiscal year ended December 31, 2020.
For the fiscal year ended December 31, 2020, $22,941 has been designated as interest-related dividends for nonresident alien shareholders pursuant to Section 871 of the Internal Revenue Code.
Pursuant to Section 853 of the Internal Revenue Code, the following amounts have been designated as foreign taxes paid for the fiscal year ended December 31, 2020. These amounts may be less than the actual foreign taxes paid for financial statement purposes. Foreign taxes paid or withheld should be included in taxable income with an offsetting deduction from gross income or as a credit for taxes paid to foreign governments. None of the income was derived from ineligible foreign sources as defined under Section 901(j) of the Internal Revenue Code.
Creditable
foreign taxes
paid | Per share
amount | Foreign
income as % of
ordinary income
distributions |
| $153,330 | $$0.0039 | 100% |
PROXY VOTING INFORMATION
A description of the policies and procedures used to determine how to vote proxies relating to portfolio securities is available without charge, upon request, by calling 1-800-260-5969, visiting our website at wfam.com, or visiting the SEC website at sec.gov. Information regarding how the proxies related to portfolio securities were voted during the most recent 12-month period ended June 30 is available on the website at wfam.com or by visiting the SEC website at sec.gov.
QUARTERLY PORTFOLIO HOLDINGS INFORMATION
The Fund files its complete schedule of portfolio holdings with the SEC for the first and third quarters of each fiscal year as an exhibit to its reports on Form N-PORT. Shareholders may view the filed Form N-PORT by visiting the SEC website at sec.gov.
Wells Fargo VT International Equity Fund | 29
Other information (unaudited)
BOARD OF TRUSTEES AND OFFICERS
Each of the Trustees and Officers1 listed in the table below acts in identical capacities for each fund in the Wells Fargo family of funds, which consists of 144 mutual funds comprising the Wells Fargo Funds Trust, Wells Fargo Variable Trust, Wells Fargo Master Trust and four closed-end funds (collectively the “Fund Complex”). This table should be read in conjunction with the Prospectus and the Statement of Additional Information2. The mailing address of each Trustee and Officer is 525 Market Street, 12th Floor, San Francisco, CA 94105. Each Trustee and Officer serves an indefinite term, however, each Trustee serves such term until reaching the mandatory retirement age established by the Trustees.
Independent Trustees
Name and
year of birth | Position held and
length of service* | Principal occupations during past five years or longer | Current other
public company or
investment
company
directorships |
William R. Ebsworth
(Born 1957) | Trustee,
since 2015 | Retired. From 1984 to 2013, equities analyst, portfolio manager, research director and chief investment officer at Fidelity Management and Research Company in Boston, Tokyo, and Hong Kong, and retired in 2013 as Chief Investment Officer of Fidelity Strategic Advisers, Inc. where he led a team of investment professionals managing client assets. Prior thereto, Board member of Hong Kong Securities Clearing Co., Hong Kong Options Clearing Corp., the Thailand International Fund, Ltd., Fidelity Investments Life Insurance Company, and Empire Fidelity Investments Life Insurance Company. Audit Committee Chair and Investment Committee Chair of the Vincent Memorial Hospital Endowment (non-profit organization). Mr. Ebsworth is a CFA® charterholder. | N/A |
Jane A. Freeman
(Born 1953) | Trustee,
since 2015;
Chair Liaison,
since 2018 | Retired. From 2012 to 2014 and 1999 to 2008, Chief Financial Officer of Scientific Learning Corporation. From 2008 to 2012, Ms. Freeman provided consulting services related to strategic business projects. Prior to 1999, Portfolio Manager at Rockefeller & Co. and Scudder, Stevens & Clark. Board member of the Harding Loevner Funds from 1996 to 2014, serving as both Lead Independent Director and chair of the Audit Committee. Board member of the Russell Exchange Traded Funds Trust from 2011 to 2012 and the chair of the Audit Committee. Ms. Freeman is also an inactive Chartered Financial Analyst. | N/A |
Isaiah Harris, Jr.
(Born 1952) | Trustee,
since 2009; Audit
Committee
Chair,
since 2019 | Retired. Chairman of the Board of CIGNA Corporation since 2009, and Director since 2005. From 2003 to 2011, Director of Deluxe Corporation. Prior thereto, President and CEO of BellSouth Advertising and Publishing Corp. from 2005 to 2007, President and CEO of BellSouth Enterprises from 2004 to 2005 and President of BellSouth Consumer Services from 2000 to 2003. Emeritus member of the Iowa State University Foundation Board of Governors. Emeritus Member of the Advisory Board of Iowa State University School of Business. Advisory Board Member, Palm Harbor Academy (private school). Mr. Harris is a certified public accountant (inactive status). | CIGNA Corporation |
Judith M. Johnson
(Born 1949) | Trustee,
since 2008 | Retired. Prior thereto, Chief Executive Officer and Chief Investment Officer of Minneapolis Employees Retirement Fund from 1996 to 2008. Ms. Johnson is an attorney, certified public accountant and a certified managerial accountant. | N/A |
David F. Larcker
(Born 1950) | Trustee,
since 2009 | James Irvin Miller Professor of Accounting at the Graduate School of Business (Emeritus), Stanford University, Director of the Corporate Governance Research Initiative and Senior Faculty of The Rock Center for Corporate Governance since 2006. From 2005 to 2008, Professor of Accounting at the Graduate School of Business, Stanford University. Prior thereto, Ernst & Young Professor of Accounting at The Wharton School, University of Pennsylvania from 1985 to 2005. | N/A |
30 | Wells Fargo VT International Equity Fund
Other information (unaudited)
Name and
year of birth | Position held and
length of service* | Principal occupations during past five years or longer | Current other
public company or
investment
company
directorships |
Olivia S. Mitchell
(Born 1953) | Trustee,
since 2006;
Nominating and
Governance
Committee Chair,
since 2018 | International Foundation of Employee Benefit Plans Professor, Wharton School of the University of Pennsylvania since 1993. Director of Wharton’s Pension Research Council and Boettner Center on Pensions & Retirement Research, and Research Associate at the National Bureau of Economic Research. Previously, Cornell University Professor from 1978 to 1993. | N/A |
Timothy J. Penny
(Born 1951) | Trustee,
since 1996;
Chair,
since 2018 | President and Chief Executive Officer of Southern Minnesota Initiative Foundation, a non-profit organization, since 2007. Member of the Board of Trustees of NorthStar Education Finance, Inc., a non-profit organization, since 2007. | N/A |
James G. Polisson
(Born 1959) | Trustee,
since 2018 | Retired. Chief Marketing Officer, Source (ETF) UK Services, Ltd, from 2015 to 2017. From 2012 to 2015, Principal of The Polisson Group, LLC, a management consulting, corporate advisory and principal investing company. Chief Executive Officer and Managing Director at Russell Investments, Global Exchange Traded Funds from 2010 to 2012. Managing Director of Barclays Global Investors from 1998 to 2010 and Global Chief Marketing Officer for iShares and Barclays Global Investors from 2000 to 2010. Trustee of the San Francisco Mechanics’ Institute, a non-profit organization, from 2013 to 2015. Board member of the Russell Exchange Traded Fund Trust from 2011 to 2012. Director of Barclays Global Investors Holdings Deutschland GmbH from 2006 to 2009. Mr. Polisson is an attorney and has a retired status with the Massachusetts and District of Columbia Bar Associations. | N/A |
Pamela Wheelock
(Born 1959) | Trustee,
since January
2020; previously
Trustee from
January 2018 to
July 2019 | Board member of the Destination Medical Center Economic Development Agency, Rochester, Minnesota since 2019. Interim President of the McKnight Foundation from January to September 2020. Acting Commissioner, Minnesota Department of Human Services, July 2019 through September 2019. Human Services Manager (part-time), Minnesota Department of Human Services, October 2019 through December 2019. Chief Operating Officer, Twin Cities Habitat for Humanity from 2017 to 2019. Vice President of University Services, University of Minnesota from 2012 to 2016. Prior thereto, on the Board of Directors, Governance Committee and Finance Committee for the Minnesota Philanthropy Partners (Saint Paul Foundation) from 2012 to 2018, Interim Chief Executive Officer of Blue Cross Blue Shield of Minnesota from 2011 to 2012, Chairman of the Board from 2009 to 2012 and Board Director from 2003 to 2015. Vice President, Leadership and Community Engagement, Bush Foundation, Saint Paul, Minnesota (a private foundation) from 2009 to 2011. Executive Vice President and Chief Financial Officer, Minnesota Sports and Entertainment from 2004 to 2009 and Senior Vice President from 2002 to 2004. Executive Vice President of the Minnesota Wild Foundation from 2004 to 2008. Commissioner of Finance, State of Minnesota, from 1999 to 2002. Currently Board Chair of the Minnesota Wild Foundation since 2010. | N/A |
* Length of service dates reflect the Trustee’s commencement of service with the Trust’s predecessor entities, where applicable.
Wells Fargo VT International Equity Fund | 31
Other information (unaudited)
Officers
Name and
year of birth | Position held and
length of service | Principal occupations during past five years or longer |
Andrew Owen
(Born 1960) | President,
since 2017 | Executive Vice President of Wells Fargo & Company and Head of Affiliated Managers, Wells Fargo Asset Management, since 2014. In addition, Mr. Owen is currently President, Chief Executive Officer and Director of Wells Fargo Funds Management, LLC since 2017. Prior thereto, Executive Vice President responsible for marketing, investments and product development for Wells Fargo Funds Management, LLC, from 2009 to 2014. |
Jeremy DePalma1
(Born 1974) | Treasurer,
since 2012 | Senior Vice President of Wells Fargo Funds Management, LLC since 2009. Senior Vice President of Evergreen Investment Management Company, LLC from 2008 to 2010 and head of the Fund Reporting and Control Team within Fund Administration from 2005 to 2010. |
Michelle Rhee
(Born 1966) | Chief Legal Officer,
since 2019 | Secretary of Wells Fargo Funds Management, LLC and Chief Legal Counsel of Wells Fargo Asset Management since 2018. Deputy General Counsel of Wells Fargo Bank, N.A. since 2020 and Assistant General Counsel of Wells Fargo Bank, N.A. from 2018 to 2020. Associate General Counsel and Managing Director of Bank of America Corporation from 2004 to 2018. |
Catherine Kennedy
(Born 1969) | Secretary,
since 2019 | Vice President of Wells Fargo Funds Management, LLC and Senior Counsel of the Wells Fargo Legal Department since 2010. Vice President and Senior Counsel of Evergreen Investment Management Company, LLC from 1998 to 2010. |
Michael H. Whitaker
(Born 1967) | Chief Compliance Officer,
since 2016 | Chief Compliance Officer of Wells Fargo Asset Management since 2016. Senior Vice President and Chief Compliance Officer for Fidelity Investments from 2007 to 2016. |
1 Jeremy DePalma acts as Treasurer of 77 funds in the Fund Complex.
2 The Statement of Additional Information includes additional information about the Trustees and is available, without charge, upon request, by calling 1-800-260-5969 or by visiting the website at wfam.com.
32 | Wells Fargo VT International Equity Fund
For more information
More information about Wells Fargo Funds is available free upon request. To obtain literature, please write, visit the Fund's website, or call:
Wells Fargo Funds
P.O. Box 219967
Kansas City, MO 64121-9967
Website: wfam.com
Individual investors: 1-800-222-8222
Retail investment professionals: 1-888-877-9275
Institutional investment professionals: 1-866-765-0778
This report and the financial statements contained herein are submitted for the general information of the shareholders of the Fund. If this report is used for promotional purposes, distribution of the report must be accompanied or preceded by a current prospectus. Before investing, please consider the investment objectives, risks, charges, and expenses of the investment. For a current prospectus and, if available, a summary prospectus, containing this information, call 1-800-260-5969 or visit the Fund’s website at wfam.com. Read the prospectus carefully before you invest or send money.
Wells Fargo Asset Management (WFAM) is the trade name for certain investment advisory/management firms owned by Wells Fargo & Company. These firms include but are not limited to Wells Capital Management Incorporated and Wells Fargo Funds Management, LLC. Certain products managed by WFAM entities are distributed by Wells Fargo Funds Distributor, LLC (a broker-dealer and Member FINRA).
This material is for general informational and educational purposes only and is NOT intended to provide investment advice or a recommendation of any kind— including a recommendation for any specific investment, strategy, or plan.
INVESTMENT PRODUCTS: NOT FDIC INSURED ■ NO BANK GUARANTEE ■ MAY LOSE VALUE
© 2021 Wells Fargo & Company. All rights reserved.
PAR-0121-00265 02-21
AVT3/AR149 12-20
Annual Report
December 31, 2020
Wells Fargo
VT Omega Growth Fund
Reduce clutter.
Save trees.
Sign up for electronic delivery of prospectuses and shareholder reports at wellsfargo.com/ advantagedelivery
The views expressed and any forward-looking statements are as of December 31, 2020, unless otherwise noted, and are those of the Fund's portfolio managers and/or Wells Fargo Asset Management. Discussions of individual securities or the markets generally are not intended as individual recommendations. Future events or results may vary significantly from those expressed in any forward-looking statements. The views expressed are subject to change at any time in response to changing circumstances in the market. Wells Fargo Asset Management and the Fund disclaim any obligation to publicly update or revise any views expressed or forward-looking statements.
INVESTMENT PRODUCTS: NOT FDIC INSURED ■ NO BANK GUARANTEE ■ MAY LOSE VALUE
Wells Fargo VT Omega Growth Fund | 1
Letter to shareholders (unaudited)
Dear Shareholder:
We are pleased to offer you this annual report for the Wells Fargo VT Omega Growth Fund for the 12-month period that ended December 31, 2020. Despite a deeply challenging year, dominated by the spread of COVID-19 cases and a sharp drop in economic output throughout much of the world, global stocks fared well overall, benefiting from strong central bank support. Bonds generally had modestly positive returns, providing some measure of diversification during turbulent market stretches.
For the 12-month period, equities had solid returns, more than making up for intense volatility in March. Non-U.S. developed market equities had weaker performance than emerging market and U.S. stocks. While gains from fixed-income securities were positive, they were more modest than equities. For the period, U.S. stocks, based on the S&P 500 Index1, gained 18.40%. International stocks, as measured by the MSCI ACWI ex USA Index (Net)2, returned 10.65%, while the MSCI EM Index (Net)3 had stronger performance, with a 18.31% gain. Among bond indexes, the Bloomberg Barclays U.S. Aggregate Bond Index4 returned 7.51%, the Bloomberg Barclays Global Aggregate ex-USD Index (unhedged)5 gained 10.11%, and the Bloomberg Barclays Municipal Bond Index6 returned 5.21% while the ICE BofA U.S. High Yield Index7 returned 6.17%.
The mood changed soon after the year began.
A year-end 2019 rally continued in early January 2020. However, market volatility spiked in late January on concerns over the potential impact of COVID-19 on the global economy and stock markets. With sentiment somewhat souring, perceived safe havens did well in January. The U.S. dollar and Japanese yen both rose, and government bonds outperformed equities. While the S&P 500 Index held its ground, emerging market equities tumbled.
Fears over the spread of COVID-19 and its impact on global growth led to a sharp downturn by late February. Oil prices tumbled as Russia and the Organization of the Petroleum Exporting Countries compounded a major decline in oil demand with a brutal price war, causing the price of crude oil to plummet.
Andrew Owen
President
Wells Fargo Funds
“Non-U.S. developed market equities had weaker performance than emerging market and U.S. stocks”
| 1 | The S&P 500 Index consists of 500 stocks chosen for market size, liquidity, and industry group representation. It is a market-value-weighted index with each stock's weight in the index proportionate to its market value. You cannot invest directly in an index. |
| 2 | The Morgan Stanley Capital International (MSCI) All Country World Index (ACWI) ex USA Index (Net) is a free-float-adjusted market-capitalization-weighted index that is designed to measure the equity market performance of developed and emerging markets, excluding the United States. Source: MSCI. MSCI makes no express or implied warranties or representations and shall have no liability whatsoever with respect to any MSCI data contained herein. The MSCI data may not be further redistributed or used as a basis for other indices or any securities or financial products. This report is not approved, reviewed, or produced by MSCI. You cannot invest directly in an index. |
| 3 | The MSCI Emerging Markets (EM) Index (Net) is a free-float-adjusted market-capitalization-weighted index that is designed to measure equity market performance of emerging markets. You cannot invest directly in an index. |
| 4 | The Bloomberg Barclays U.S. Aggregate Bond Index is a broad-based benchmark that measures the investment-grade, U.S. dollar-denominated, fixed-rate taxable bond market, including Treasuries, government-related and corporate securities, mortgage-backed securities (agency fixed-rate and hybrid adjustable-rate mortgage pass-throughs), asset-backed securities, and commercial mortgage-backed securities. You cannot invest directly in an index. |
| 5 | The Bloomberg Barclays Global Aggregate ex-USD Index (unhedged) is an unmanaged index that provides a broad-based measure of the global investment-grade fixed-income markets excluding the U.S. dollar-denominated debt market. You cannot invest directly in an index. |
| 6 | The Bloomberg Barclays Municipal Bond Index is an unmanaged index composed of long-term tax-exempt bonds with a minimum credit rating of Baa. You cannot invest directly in an index. |
| 7 | The ICE BofA U.S. High Yield Index is a market-capitalization-weighted index of domestic and Yankee high-yield bonds. The index tracks the performance of high-yield securities traded in the U.S. bond market. You cannot invest directly in an index. Copyright 2021. ICE Data Indices, LLC. All rights reserved. |
2 | Wells Fargo VT Omega Growth Fund
Letter to shareholders (unaudited)
The global spread of COVID-19 led country after country to clamp down on social- and business-related activity in order to contain the virus. This sent economies into a deep contraction. Central banks responded by slashing interest rates and expanding quantitative easing programs to restore liquidity and market confidence. The U.S. Federal Reserve (Fed) launched several lending programs, funding investment-grade bonds, money market mutual funds, and commercial paper while purchasing Treasuries, mortgage-backed securities, and overnight repurchase agreements. Meanwhile, stock markets tumbled, ending the longest bull stock market in U.S. history.
Markets rebounded strongly through the spring, fueled by unprecedented government and central bank stimulus measures in the U.S. and globally. The U.S. economy contracted by an annualized 5.0% pace in the first quarter, with 30 million new unemployment insurance claims in six weeks. In the eurozone, first-quarter real gross domestic product (GDP) shrank 3.8%. China’s first-quarter GDP fell by 6.8% year over year. Extreme oil-price volatility continued as global supply far exceeded demand.
In May, investors regained confidence on reports of early success in human trials of a COVID-19 vaccine. Growth stocks outperformed value, while returns on global government bonds were flat. However, in the U.S., the April unemployment rate rose to 14.7%, its highest level since World War II. Purchasing managers’ indexes (PMIs), a monthly survey of purchasing managers, reflected broadly weakening activity in May. U.S. corporate earnings contracted 14% year over year from the first quarter of 2019. However, high demand for information technology (IT), driven by remote activity, supported robust IT sector earnings, which helped drive IT stocks higher.
By June, economies reopened and global central banks committed to do all they could to provide economic support through liquidity and low borrowing costs. U.S. economic activity was aided by one-time $1,200 stimulus checks and $600 weekly bonus unemployment benefits that lasted through July. However, unemployment remained historically high and COVID-19 cases began to increase by late June. China’s economic recovery began to pick up momentum.
July was broadly positive for equities and fixed income. However, economic data and a resurgence of COVID-19 cases underscored the urgent need to regain control of the pandemic. Second-quarter GDP shrank from the previous quarter by 9.5% and 12.1% in the U.S. and the eurozone, respectively. In contrast, China’s second-quarter GDP grew 3.2% year over year. The U.S. economy added 1.8 million jobs in July, but a double-digit jobless rate persisted.
The stock market continued to rally in August despite concerns over rising numbers of U.S. and European COVID-19 cases as well as the July expiration of the $600 weekly bonus unemployment benefit. Relatively strong second-quarter earnings boosted investor sentiment along with the Fed’s announcement of a monetary policy shift expected to support longer-term low interest rates. U.S. manufacturing and services activity indexes beat expectations while the U.S. housing market maintained strength. In Europe, retail sales expanded and consumer confidence was steady. China’s economy continued to expand.
Stocks grew more volatile in September on mixed economic data. U.S. economic activity continued to grow. However, U.S. unemployment remained elevated at 7.9% in September. With U.S. Congress delaying further fiscal relief and uncertainties surrounding a possible vaccine, doubts crept back into the financial markets. In the U.K., a lack of progress in Brexit talks weighed on markets. China’s economy picked up steam, fueled by increased global demand.
Wells Fargo VT Omega Growth Fund | 3
Letter to shareholders (unaudited)
In October, capital markets stepped back from their six-month rally. Market volatility rose in advance of the U.S. election and amid a global increase in COVID-19 infections. Europe introduced tighter restrictions affecting economic activity. U.S. markets looked favorably at the prospect of Democratic control of the federal purse strings, which could lead to additional fiscal stimulus and a boost to economic activity. Meanwhile, China reported 4.9% third-quarter GDP growth.
Global stocks rallied in November, propelled by optimism over three promising COVID-19 vaccines. Reversing recent trends, value stocks outperformed growth stocks and cyclical stocks outpaced technology stocks. However, U.S. unemployment remained elevated, with a net job loss of 10 million since February. The eurozone services PMI contracted sharply while the region’s manufacturing activity grew. The U.S. election results added to the upbeat mood as investors anticipated more consistent policies in the new administration.
Financial markets ended the year with strength on high expectations for a rapid rollout of the COVID-19 vaccines, the successful passage of a $900 billion stimulus package, and rising expectations of additional economic support from a Democratic-led Congress. U.S. economic data were mixed with still-elevated unemployment and weak retail sales but growth in manufacturing output. In contrast, China’s economic expansion continued in both manufacturing and nonmanufacturing. U.S. COVID-19 infection rates continued to rise even as new state and local lockdown measures were implemented.
Don’t let short-term uncertainty derail long-term investment goals.
Periods of investment uncertainty can present challenges, but experience has taught us that maintaining long-term investment goals can be an effective way to plan for the future. To help you create a sound strategy based on your personal goals and risk tolerance, Wells Fargo Funds offers more than 100 mutual funds spanning a wide range of asset classes and investment styles. Although diversification cannot guarantee an investment profit or prevent losses, we believe it can be an effective way to manage investment risk and potentially smooth out overall portfolio performance. We encourage investors to know their investments and to understand that appropriate levels of risk-taking may unlock opportunities.
Thank you for choosing to invest with Wells Fargo Funds. We appreciate your confidence in us and remain committed to helping you meet your financial needs.
Sincerely,
Andrew Owen
President
Wells Fargo Funds
“Global stocks rallied in November, propelled by optimism over three promising COVID-19 vaccines.”
For further information about your Fund, contact your investment professional, visit our website at wfam.com, or call us directly at 1-800-260-5969.
4 | Wells Fargo VT Omega Growth Fund
This page is intentionally left blank.
Performance highlights (unaudited)
Investment objective
The Fund seeks long-term capital appreciation.
Manager
Wells Fargo Funds Management, LLC
Subadviser
Wells Capital Management Incorporated
Portfolio managers
Michael T. Smith, CFA®‡
Christopher J. Warner, CFA®‡
Average annual total returns (%) as of December 31, 2020
| | | | | | Expense ratios1 (%) |
| | Inception date | 1 year | 5 year | 10 year | Gross | Net 2 |
| Class 1 | 3-6-1997 | 43.41 | 21.91 | 16.40 | 0.82 | 0.75 |
| Class 2 | 7-31-2002 | 43.18 | 21.63 | 16.12 | 1.07 | 1.00 |
| Russell 3000® Growth Index3 | – | 38.26 | 20.67 | 16.93 | – | – |
Figures quoted represent past performance, which is no guarantee of future results. Investment return and principal value of an investment will fluctuate so that an investor’s shares, when redeemed, may be worth more or less than their original cost. Current performance may be lower or higher than the performance data quoted and assumes the reinvestment of dividends and capital gains. Current month-end performance is available by calling 1-800-260-5969. Performance figures of the Fund do not reflect fees and expenses charged pursuant to the terms of variable life insurance policies and variable annuity contracts. If these fees and expenses had been reflected, performance would have been lower.
Please keep in mind that high double-digit returns were primarily achieved during favorable market conditions. You should not expect that such favorable returns can be consistently achieved. A fund’s performance, especially for short time periods, should not be the sole factor in making your investment decision.
Shares are sold without a front-end sales charge or a contingent deferred sales charge.
Index returns do not include transaction costs associated with buying and selling securities, any mutual fund fees or expenses, or any taxes. It is not possible to invest directly in an index.
Stock values fluctuate in response to the activities of individual companies and general market and economic conditions. Foreign investments are especially volatile and can rise or fall dramatically due to differences in the political and economic conditions of the host country. These risks are generally intensified in emerging markets. The use of derivatives may reduce returns and/or increase volatility. Certain investment strategies tend to increase the total risk of an investment (relative to the broader market). The Fund is exposed to smaller-company securities risk. Consult the Fund’s prospectus for additional information on these and other risks.
Please refer to the prospectus provided by your participating insurance company for detailed information describing the separate accounts for information regarding surrender charges, mortality and expense risk fees, and other charges that may be assessed by the participating insurance companies.
Please see footnotes on page 7.
6 | Wells Fargo VT Omega Growth Fund
Performance highlights (unaudited)
| Growth of $10,000 investment as of December 31, 20204 |

| ‡ | CFA® and Chartered Financial Analyst® are trademarks owned by CFA Institute. |
| 1 | Reflects the expense ratios as stated in the most recent prospectuses. The expense ratios shown are subject to change and may differ from the annualized expense ratios shown in the financial highlights of this report. |
| 2 | The manager has contractually committed through April 30, 2021, to waive fees and/or reimburse expenses to the extent necessary to cap total annual fund operating expenses after fee waivers at 0.75% for Class 1 and 1.00% for Class 2. Brokerage commissions, stamp duty fees, interest, taxes, acquired fund fees and expenses (if any), and extraordinary expenses are excluded from the expense caps. Prior to or after the commitment expiration date, the caps may be increased or the commitment to maintain the caps may be terminated only with the approval of the Board of Trustees. Without these caps, the Fund’s returns would have been lower. The expense ratio paid by an investor is the net expense ratio (the total annual fund operating expenses after fee waivers) as stated in the prospectuses. |
| 3 | The Russell 3000® Growth Index measures the performance of those Russell 3000® Index companies with higher price/book ratios and higher forecasted growth values. You cannot invest directly in an index. |
| 4 | The chart compares the performance of Class 2 shares for the most recent ten years with the Russell 3000® Growth Index. The chart assumes a hypothetical $10,000 investment and reflects all operating expenses of the Fund but does not reflect fees and expenses charged pursuant to the terms of variable life insurance policies and variable annuity contracts. |
| 5 | Figures represent the percentage of the Fund's net assets. Holdings are subject to change and may have changed since the date specified. |
| 6 | Figures represent the percentage of the Fund's long-term investments. These amounts are subject to change and may have changed since the date specified. |
* This security was no longer held at the end of the reporting period.
Wells Fargo VT Omega Growth Fund | 7
Performance highlights (unaudited)
MANAGER'S DISCUSSION
Fund highlights
| ■ | The Fund outperformed its benchmark, the Russell 3000® Growth Index, for the 12-month period that ended December 31, 2020. |
| ■ | Stock selection in the information technology (IT) and consumer discretionary sectors contributed to the Fund’s results. |
| ■ | Non-ownership and select positions in IT, along with holdings in the materials sector, detracted from relative performance. |
A global pandemic triggered a massive policy response and remarkable health care innovations.
Over the past year, global economies shifted from long-toothed bull markets to rapid recessions, spurred by a global pandemic and shelter-at-home orders. Central banks and governments rallied quickly to prevent a possible depression by proposing massive stimulus packages. Within the United States, the Federal Reserve took extraordinary measures to provide liquidity. Optimism grew among equity investors as consumers reestablished confidence and progress was made toward therapeutic treatments for the coronavirus. As 2020 came to a close, markets rallied on the speed and efficacy of a COVID-19 vaccine and prospects of further reopening of the economy.
Despite the heightened volatility, we have not significantly repositioned the Fund. Our investment process has long focused on companies harnessing technology to create superior growth. The Fund remains positioned toward companies that we believe are on the right side of change. As a result, along with strong stock selection, our portfolios were well positioned for the market environment in 2020.
Stock selection in the IT and consumer discretionary sectors contributed to relative performance.
Within IT, Square, Incorporated, contributed to the portfolio. Square is a leading IT company that enables small businesses to accept credit card and digital payments. Its ease-of-use technology allows Square to outgrow payment processing peers that focus primarily on larger businesses. In addition, Square is the developer of the Cash App virtual wallet, which saw rapid user growth in 2020. The Cash App provides the functionality of debit cards to those who lack access to bank accounts.
Within consumer discretionary, MercadoLibre, Incorporated, contributed to performance. MercadoLibre is the dominant Latin American e-commerce provider, where e-commerce penetration rates are accelerating but remain far below that of developed countries. The company also owns MercadoPago, a digital payment application that has been fueling strong growth and is now the leading online payment solution in Latin America. In addition to growth in the core e-commerce marketplace, we believe MercadoPago will significantly contribute to earnings going forward.
Select positions within IT and materials detracted from relative performance.
Within IT, not having a position in Apple Incorporated significantly detracted from relative performance. Though it’s a high-quality enterprise, after considerable research, we have determined Apple does not meet our investment criteria for organic growth.
Also within IT, shares of Euronet Worldwide, Incorporated, underperformed as a result of the coronavirus crisis. Euronet is an electronic payments and financial transaction processor for banks and retailers, with most of its transactions originating from tourism in Europe. As travel ground to a halt, lower transaction volumes at automated teller machines exerted pressure on the shares.
| Ten largest holdings (%) as of December 31, 20205 |
| Microsoft Corporation | 8.71 |
| Amazon.com Incorporated | 8.25 |
| Alphabet Incorporated Class A | 4.09 |
| Visa Incorporated Class A | 3.21 |
| PayPal Holdings Incorporated | 2.93 |
| UnitedHealth Group Incorporated | 2.76 |
| MercadoLibre Incorporated | 2.54 |
| Chipotle Mexican Grill Incorporated | 2.44 |
| ServiceNow Incorporated | 2.42 |
| Align Technology Incorporated | 2.28 |
Please see footnotes on page 7.
8 | Wells Fargo VT Omega Growth Fund
Performance highlights (unaudited)
Within materials, shares of Vulcan Materials Company* underperformed as investors became concerned that stressed state and local budgets would lead to lower demand for infrastructure and road construction projects. As delays continued, we followed our sell discipline and exited the position.
While volatility remains high, companies on the right side of change provide resiliency.
2020 ended with enthusiasm for putting the coronavirus behind us, new rounds of economic stimulus, and improving macro conditions. In the short term, this sparked a rotation toward interest-rate-sensitive and cyclical assets. However, it does not alter our long-term view. We believe economic growth will remain slow as the structural forces of debt, demographics, and disruption are here to stay. We continue to emphasize companies on the right side of change. These are dynamic businesses positioned to take advantage of the massive shift around digital transformation. A massive amount of spending is moving online from offline. Growth themes, such as telemedicine, cloud software, digital payments, and e-commerce, will likely continue for the foreseeable future. We are long-term investors focused on opportunities well beyond 2020. As economic growth remains scarce, we expect stocks with superior fundamentals to be rewarded with premium valuations. While we anticipate volatility to persist in 2021, we remain confident that right-side-of-change companies will deliver superior results.
| Sector allocation as of December 31, 20206 |
Please see footnotes on page 7.
Wells Fargo VT Omega Growth Fund | 9
Fund expenses (unaudited)
As a shareholder of the Fund, you incur ongoing costs, including management fees, distribution (12b-1) fees, and other Fund expenses. This example is intended to help you understand your ongoing costs (in dollars) of investing in the Fund and to compare these costs with the ongoing costs of investing in other mutual funds.
The example is based on an investment of $1,000 invested at the beginning of the six-month period and held for the entire period from July 1, 2020 to December 31, 2020.
Actual expenses
The “Actual” line of the table below provides information about actual account values and actual expenses. You may use the information in this line, together with the amount you invested, to estimate the expenses that you paid over the period. Simply divide your account value by $1,000 (for example, an $8,600 account value divided by $1,000 = 8.6), then multiply the result by the number in the “Actual” line under the heading entitled “Expenses paid during period” for your applicable class of shares to estimate the expenses you paid on your account during this period.
Hypothetical example for comparison purposes
The “Hypothetical” line of the table below provides information about hypothetical account values and hypothetical expenses based on the Fund’s actual expense ratio and an assumed rate of return of 5% per year before expenses, which is not the Fund’s actual return. The hypothetical account values and expenses may not be used to estimate the actual ending account balance or expenses you paid for the period. You may use this information to compare the ongoing costs of investing in the Fund and other funds. To do so, compare this 5% hypothetical example with the 5% hypothetical examples that appear in the shareholder reports of the other funds.
Please note that the expenses shown in the table are meant to highlight your ongoing costs only and do not reflect any separate account charges assessed by participating insurance companies. Therefore, the “Hypothetical” line of the table is useful in comparing ongoing costs only, and will not help you determine the relative total costs of owning different funds. In addition, if these separate account charges assessed by participating insurance companies were included, your costs would have been higher.
| | Beginning
account value
7-1-2020 | Ending
account value
12-31-2020 | Expenses
paid during
the period1 | Annualized net
expense ratio |
| Class 1 | | | | |
| Actual | $1,000.00 | $1,283.91 | $4.31 | 0.75% |
| Hypothetical (5% return before expenses) | $1,000.00 | $1,021.37 | $3.81 | 0.75% |
| Class 2 | | | | |
| Actual | $1,000.00 | $1,283.54 | $5.74 | 1.00% |
| Hypothetical (5% return before expenses) | $1,000.00 | $1,020.11 | $5.08 | 1.00% |
1 Expenses paid is equal to the annualized net expense ratio of each class multiplied by the average account value over the period, multiplied by the number of days in the most recent fiscal half-year divided by the number of days in the fiscal year (to reflect the one-half-year period).
10 | Wells Fargo VT Omega Growth Fund
Portfolio of investments—December 31, 2020
| | | | | Shares | Value |
| Common stocks: 99.50% | | | | | |
| Communication services: 10.34% | | | | | |
| Entertainment: 3.28% | | | | | |
| Netflix Incorporated † | | | | 3,700 | 2,000,701 |
| Spotify Technology SA † | | | | 4,900 | 1,541,834 |
| | | | | | 3,542,535 |
| Interactive media & services: 4.48% | | | | | |
| Alphabet Incorporated Class A † | | | | 2,520 | 4,416,653 |
| Alphabet Incorporated Class C † | | | | 239 | 418,699 |
| | | | | | 4,835,352 |
| Media: 2.58% | | | | | |
| IAC/InterActiveCorp † | | | | 6,000 | 1,136,100 |
| Match Group Incorporated † | | | | 10,887 | 1,646,006 |
| | | | | | 2,782,106 |
| Consumer discretionary: 17.05% | | | | | |
| Auto components: 1.34% | | | | | |
| Aptiv plc | | | | 11,100 | 1,446,219 |
| Automobiles: 0.83% | | | | | |
| Ferrari NV | | | | 3,900 | 895,128 |
| Hotels, restaurants & leisure: 2.44% | | | | | |
| Chipotle Mexican Grill Incorporated † | | | | 1,900 | 2,634,749 |
| Internet & direct marketing retail: 10.79% | | | | | |
| Amazon.com Incorporated † | | | | 2,735 | 8,907,704 |
| MercadoLibre Incorporated † | | | | 1,640 | 2,747,361 |
| | | | | | 11,655,065 |
| Specialty retail: 1.65% | | | | | |
| The Home Depot Incorporated | | | | 6,700 | 1,779,654 |
| Financials: 2.99% | | | | | |
| Capital markets: 2.99% | | | | | |
| Intercontinental Exchange Incorporated | | | | 14,200 | 1,637,118 |
| MarketAxess Holdings Incorporated | | | | 2,800 | 1,597,568 |
| | | | | | 3,234,686 |
| Health care: 18.09% | | | | | |
| Biotechnology: 2.28% | | | | | |
| Exact Sciences Corporation † | | | | 13,800 | 1,828,362 |
| Sarepta Therapeutics Incorporated † | | | | 3,700 | 630,813 |
| | | | | | 2,459,175 |
| Health care equipment & supplies: 9.06% | | | | | |
| ABIOMED Incorporated † | | | | 3,400 | 1,102,280 |
| Alcon Incorporated † | | | | 20,300 | 1,339,394 |
| Align Technology Incorporated † | | | | 4,600 | 2,458,148 |
| DexCom Incorporated † | | | | 4,500 | 1,663,740 |
The accompanying notes are an integral part of these financial statements.
Wells Fargo VT Omega Growth Fund | 11
Portfolio of investments—December 31, 2020
| | | | | Shares | Value |
| Health care equipment & supplies (continued) | | | | | |
| Edwards Lifesciences Corporation † | | | | 12,400 | $ 1,131,252 |
| Intuitive Surgical Incorporated † | | | | 2,550 | 2,086,155 |
| | | | | | 9,780,969 |
| Health care providers & services: 5.29% | | | | | |
| Chemed Corporation | | | | 3,200 | 1,704,352 |
| HealthEquity Incorporated † | | | | 14,755 | 1,028,571 |
| UnitedHealth Group Incorporated | | | | 8,500 | 2,980,780 |
| | | | | | 5,713,703 |
| Health care technology: 1.46% | | | | | |
| Veeva Systems Incorporated Class A † | | | | 5,800 | 1,579,050 |
| Industrials: 6.08% | | | | | |
| Aerospace & defense: 0.73% | | | | | |
| HEICO Corporation | | | | 5,900 | 781,160 |
| Air freight & logistics: 1.06% | | | | | |
| United Parcel Service Incorporated Class B | | | | 6,800 | 1,145,120 |
| Commercial services & supplies: 2.69% | | | | | |
| Cintas Corporation | | | | 3,600 | 1,272,456 |
| Waste Connections Incorporated | | | | 15,946 | 1,635,581 |
| | | | | | 2,908,037 |
| Road & rail: 1.60% | | | | | |
| Union Pacific Corporation | | | | 8,300 | 1,728,226 |
| Information technology: 42.13% | | | | | |
| Communications equipment: 1.16% | | | | | |
| Motorola Solutions Incorporated | | | | 7,400 | 1,258,444 |
| Electronic equipment, instruments & components: 1.21% | | | | | |
| Zebra Technologies Corporation Class A † | | | | 3,400 | 1,306,722 |
| IT services: 22.10% | | | | | |
| Black Knight Incorporated † | | | | 21,200 | 1,873,020 |
| EPAM Systems Incorporated † | | | | 6,615 | 2,370,485 |
| Euronet Worldwide Incorporated † | | | | 5,900 | 855,028 |
| Fiserv Incorporated † | | | | 15,395 | 1,752,875 |
| Global Payments Incorporated | | | | 7,271 | 1,566,319 |
| MongoDB Incorporated † | | | | 4,900 | 1,759,296 |
| PayPal Holdings Incorporated † | | | | 13,500 | 3,161,700 |
| Shopify Incorporated Class A † | | | | 1,400 | 1,584,730 |
| Square Incorporated Class A † | | | | 11,200 | 2,437,568 |
| StoneCo Limited Class A † | | | | 17,900 | 1,502,168 |
| Visa Incorporated Class A | | | | 15,844 | 3,465,558 |
| WEX Incorporated † | | | | 7,512 | 1,528,917 |
| | | | | | 23,857,664 |
| Software: 17.66% | | | | | |
| Atlassian Corporation plc Class A † | | | | 5,800 | 1,356,446 |
| Autodesk Incorporated † | | | | 5,800 | 1,770,972 |
| Cadence Design Systems Incorporated † | | | | 13,200 | 1,800,876 |
| Microsoft Corporation | | | | 42,300 | 9,408,365 |
The accompanying notes are an integral part of these financial statements.
12 | Wells Fargo VT Omega Growth Fund
Portfolio of investments—December 31, 2020
| | | | | Shares | Value |
| Software (continued) | | | | | |
| ServiceNow Incorporated † | | | | 4,750 | $ 2,614,543 |
| Unity Software Incorporated †« | | | | 8,762 | 1,344,704 |
| Zoom Video Communications Incorporated † | | | | 2,280 | 769,090 |
| | | | | | 19,064,996 |
| Materials: 1.63% | | | | | |
| Chemicals: 1.63% | | | | | |
| The Sherwin-Williams Company | | | | 2,390 | 1,756,435 |
| Real estate: 1.19% | | | | | |
| Equity REITs: 1.19% | | | | | |
| SBA Communications Corporation | | | | 4,570 | 1,289,334 |
| Total Common stocks (Cost $44,132,171) | | | | | 107,434,529 |
| | | Yield | | | |
| Short-term investments: 1.41% | | | | | |
| Investment companies: 1.41% | | | | | |
| Securities Lending Cash Investments LLC ♠∩∞ | | 0.16% | | 1,315,192 | 1,315,192 |
| Wells Fargo Government Money Market Fund Select Class ♠∞ | | 0.03 | | 206,090 | 206,090 |
| Total Short-term investments (Cost $1,521,282) | | | | | 1,521,282 |
| Total investments in securities (Cost $45,653,453) | 100.91% | | | | 108,955,811 |
| Other assets and liabilities, net | (0.91) | | | | (983,744) |
| Total net assets | 100.00% | | | | $ 107,972,067 |
| † | Non-income-earning security |
| « | All or a portion of this security is on loan. |
| ♠ | The issuer of the security is an affiliated person of the Fund as defined in the Investment Company Act of 1940. |
| ∩ | The investment is a non-registered investment company purchased with cash collateral received from securities on loan. |
| ∞ | The rate represents the 7-day annualized yield at period end. |
| Abbreviations: |
| REIT | Real estate investment trust |
The accompanying notes are an integral part of these financial statements.
Wells Fargo VT Omega Growth Fund | 13
Portfolio of investments—December 31, 2020
Investments in affiliates
An affiliated investment is an investment in which the Fund owns at least 5% of the outstanding voting shares of the issuer or as a result of other relationships, such as the Fund and the issuer having the same investment manager. Transactions with issuers that were either affiliated persons of the Fund at the beginning of the period or the end of the period were as follows:
| | Value,
beginning of
period | Purchases | Sales
proceeds | Net
realized
gains
(losses) | | Net
change in
unrealized
gains
(losses) | | Value,
end of
period | | % of
net
assets | Shares,
end
of period | Income
from
affiliated
securities |
| Short-term investments | | | | | | | | | | | | |
| Investment companies | | | | | | | | | | | | |
| Securities Lending Cash Investments LLC | $1,089,526 | $ 7,711,671 | $ (7,486,413) | $408 | | $0 | | $ 1,315,192 | | | 1,315,192 | $ 2,331# |
| Wells Fargo Government Money Market Fund Select Class | 515,647 | 19,321,852 | (19,631,409) | 0 | | 0 | | 206,090 | | | 206,090 | 4,385 |
| | | | | $408 | | $0 | | $1,521,282 | | 1.41% | | $6,716 |
| # | Amount shown represents income before fees and rebates. |
The accompanying notes are an integral part of these financial statements.
14 | Wells Fargo VT Omega Growth Fund
Statement of assets and liabilities—December 31, 2020
| | |
| Assets | |
Investments in unaffiliated securities (including $1,277,484 of securities loaned), at value (cost $44,132,171)
| $ 107,434,529 |
Investments in affiliated securites, at value (cost $1,521,282)
| 1,521,282 |
Receivable for investments sold
| 1,662,134 |
Receivable for dividends
| 7,255 |
Receivable for securities lending income, net
| 623 |
Receivable for Fund shares sold
| 111 |
Prepaid expenses and other assets
| 1,583 |
Total assets
| 110,627,517 |
| Liabilities | |
Payable upon receipt of securities loaned
| 1,315,192 |
Payable for investments purchased
| 1,174,838 |
Payable for Fund shares redeemed
| 75,412 |
Management fee payable
| 53,150 |
Distribution fee payable
| 13,216 |
Administration fees payable
| 7,886 |
Trustees’ fees and expenses payable
| 4,278 |
Accrued expenses and other liabilities
| 11,478 |
Total liabilities
| 2,655,450 |
Total net assets
| $107,972,067 |
| Net assets consist of | |
Paid-in capital
| $ 33,276,331 |
Total distributable earnings
| 74,695,736 |
Total net assets
| $107,972,067 |
| Computation of net asset value per share | |
Net assets – Class 1
| $ 50,122,455 |
Shares outstanding – Class 11
| 1,185,608 |
Net asset value per share – Class 1
| $42.28 |
Net assets – Class 2
| $ 57,849,612 |
Shares outstanding – Class 21
| 1,430,699 |
Net asset value per share – Class 2
| $40.43 |
| 1 | The Fund has an unlimited number of authorized shares |
The accompanying notes are an integral part of these financial statements.
Wells Fargo VT Omega Growth Fund | 15
Statement of operations—year ended December 31, 2020
| | |
| Investment income | |
Dividends (net of foreign withholdings taxes of $6,293)
| $ 448,180 |
Income from affiliated securities
| 7,208 |
Total investment income
| 455,388 |
| Expenses | |
Management fee
| 566,524 |
| Administration fees | |
Class 1
| 33,235 |
Class 2
| 42,301 |
| Distribution fee | |
Class 2
| 124,913 |
Custody and accounting fees
| 14,780 |
Professional fees
| 50,389 |
Shareholder report expenses
| 22,545 |
Trustees’ fees and expenses
| 19,862 |
Other fees and expenses
| 8,035 |
Total expenses
| 882,584 |
| Less: Fee waivers and/or expense reimbursements | |
Fund-level
| (38,105) |
Class 1
| (4,132) |
Net expenses
| 840,347 |
Net investment loss
| (384,959) |
| Realized and unrealized gains (losses) on investments | |
| Net realized gains on | |
Unaffiliated securities
| 11,839,689 |
Affiliated securities
| 408 |
Net realized gains on investments
| 11,840,097 |
Net change in unrealized gains (losses) on investments
| 23,208,430 |
Net realized and unrealized gains (losses) on investments
| 35,048,527 |
Net increase in net assets resulting from operations
| $34,663,568 |
The accompanying notes are an integral part of these financial statements.
16 | Wells Fargo VT Omega Growth Fund
Statement of changes in net assets
| | |
| | Year ended
December 31, 2020 | Year ended
December 31, 2019 |
| Operations | | | | |
Net investment loss
| | $ (384,959) | | $ (200,889) |
Net realized gains on investments
| | 11,840,097 | | 7,507,542 |
Net change in unrealized gains (losses) on investments
| | 23,208,430 | | 20,470,814 |
Net increase in net assets resulting from operations
| | 34,663,568 | | 27,777,467 |
| Distributions to shareholders from | | | | |
| Net investment income and net realized gains | | | | |
Class 1
| | (3,187,408) | | (4,663,133) |
Class 2
| | (4,101,867) | | (6,195,458) |
Total distributions to shareholders
| | (7,289,275) | | (10,858,591) |
| Capital share transactions | Shares | | Shares | |
| Proceeds from shares sold | | | | |
Class 1
| 76,567 | 2,678,319 | 73,112 | 2,241,178 |
Class 2
| 102,999 | 3,489,523 | 114,807 | 3,406,537 |
| | | 6,167,842 | | 5,647,715 |
| Reinvestment of distributions | | | | |
Class 1
| 92,792 | 3,187,408 | 152,191 | 4,663,133 |
Class 2
| 124,829 | 4,101,867 | 210,801 | 6,195,458 |
| | | 7,289,275 | | 10,858,591 |
| Payment for shares redeemed | | | | |
Class 1
| (238,236) | (7,901,466) | (228,659) | (6,950,692) |
Class 2
| (461,624) | (15,801,257) | (583,624) | (17,173,879) |
| | | (23,702,723) | | (24,124,571) |
Net decrease in net assets resulting from capital share transactions
| | (10,245,606) | | (7,618,265) |
Total increase in net assets
| | 17,128,687 | | 9,300,611 |
| Net assets | | | | |
Beginning of period
| | 90,843,380 | | 81,542,769 |
End of period
| | $107,972,067 | | $ 90,843,380 |
The accompanying notes are an integral part of these financial statements.
Wells Fargo VT Omega Growth Fund | 17
Financial highlights
(For a share outstanding throughout each period)
| | Year ended December 31 |
| Class 1 | 2020 | 2019 | 2018 | 2017 | 2016 |
Net asset value, beginning of period
| $31.89 | $26.27 | $28.99 | $22.20 | $23.30 |
Net investment income (loss)
| (0.07) | (0.03) 1 | (0.03) 1 | (0.02) 1 | 0.10 |
Net realized and unrealized gains (losses) on investments
| 13.27 | 9.69 | 0.62 | 7.68 | 0.05 |
Total from investment operations
| 13.20 | 9.66 | 0.59 | 7.66 | 0.15 |
| Distributions to shareholders from | | | | | |
Net investment income
| 0.00 | 0.00 | 0.00 | (0.06) | 0.00 |
Net realized gains
| (2.81) | (4.04) | (3.31) | (0.81) | (1.25) |
Total distributions to shareholders
| (2.81) | (4.04) | (3.31) | (0.87) | (1.25) |
Net asset value, end of period
| $42.28 | $31.89 | $26.27 | $28.99 | $22.20 |
Total return2
| 43.41% | 37.39% | 0.52% | 34.95% | 0.77% |
| Ratios to average net assets (annualized) | | | | | |
Gross expenses
| 0.80% | 0.82% | 0.81% | 0.82% | 0.82% |
Net expenses
| 0.75% | 0.75% | 0.75% | 0.75% | 0.75% |
Net investment income (loss)
| (0.27)% | (0.08)% | (0.10)% | (0.07)% | 0.26% |
| Supplemental data | | | | | |
Portfolio turnover rate
| 24% | 31% | 46% | 67% | 90% |
Net assets, end of period (000s omitted)
| $50,122 | $40,001 | $33,043 | $38,687 | $33,373 |
| 1 | Calculated based upon average shares outstanding |
| 2 | Performance figures of the Fund do not reflect fees and expenses charged pursuant to the terms of variable life insurance policies and variable annuity contracts. |
The accompanying notes are an integral part of these financial statements.
18 | Wells Fargo VT Omega Growth Fund
Financial highlights
(For a share outstanding throughout each period)
| | Year ended December 31 |
| Class 2 | 2020 | 2019 | 2018 | 2017 | 2016 |
Net asset value, beginning of period
| $30.55 | $25.23 | $27.91 | $21.38 | $22.54 |
Net investment income (loss)
| (0.17) 1 | (0.10) 1 | (0.11) | (0.08) | 0.00 1,2 |
Net realized and unrealized gains (losses) on investments
| 12.73 | 9.29 | 0.61 | 7.39 | 0.09 |
Total from investment operations
| 12.56 | 9.19 | 0.50 | 7.31 | 0.09 |
| Distributions to shareholders from | | | | | |
Net investment income
| 0.00 | 0.00 | 0.00 | (0.00) 2 | 0.00 |
Net realized gains
| (2.68) | (3.87) | (3.18) | (0.78) | (1.25) |
Total distributions to shareholders
| (2.68) | (3.87) | (3.18) | (0.78) | (1.25) |
Net asset value, end of period
| $40.43 | $30.55 | $25.23 | $27.91 | $21.38 |
Total return3
| 43.18% | 37.04% | 0.28% | 34.60% | 0.52% |
| Ratios to average net assets (annualized) | | | | | |
Gross expenses
| 1.04% | 1.06% | 1.06% | 1.07% | 1.07% |
Net expenses
| 1.00% | 1.00% | 1.00% | 1.00% | 1.00% |
Net investment income (loss)
| (0.52)% | (0.33)% | (0.35)% | (0.31)% | 0.01% |
| Supplemental data | | | | | |
Portfolio turnover rate
| 24% | 31% | 46% | 67% | 90% |
Net assets, end of period (000s omitted)
| $57,850 | $50,843 | $48,500 | $54,334 | $42,684 |
| 1 | Calculated based upon average shares outstanding |
| 2 | Amount is less than $0.005. |
| 3 | Performance figures of the Fund do not reflect fees and expenses charged pursuant to the terms of variable life insurance policies and variable annuity contracts. |
The accompanying notes are an integral part of these financial statements.
Wells Fargo VT Omega Growth Fund | 19
Notes to financial statements
1. ORGANIZATION
Wells Fargo Variable Trust (the “Trust”), a Delaware statutory trust organized on March 10, 1999, is an open-end management investment company registered under the Investment Company Act of 1940, as amended (the “1940 Act”). As an investment company, the Trust follows the accounting and reporting guidance in Financial Accounting Standards Board (“FASB”) Accounting Standards Codification Topic 946, Financial Services – Investment Companies. These financial statements report on the Wells Fargo VT Omega Growth Fund (the “Fund”) which is a diversified series of the Trust. The Trust offers shares of the Fund to separate accounts of various life insurance companies as funding vehicles for certain variable annuity contracts and variable life insurance policies.
2. SIGNIFICANT ACCOUNTING POLICIES
The following significant accounting policies, which are consistently followed in the preparation of the financial statements of the Fund, are in conformity with U.S. generally accepted accounting principles which require management to make estimates and assumptions that affect the reported amounts of assets and liabilities, disclosure of contingent assets and liabilities at the date of the financial statements, and the reported amounts of income and expenses during the reporting period. Actual results could differ from those estimates.
Securities valuation
All investments are valued each business day as of the close of regular trading on the New York Stock Exchange (generally 4 p.m. Eastern Time), although the Fund may deviate from this calculation time under unusual or unexpected circumstances.
Equity securities that are listed on a foreign or domestic exchange or market are valued at the official closing price or, if none, the last sales price. If no sale occurs on the principal exchange or market that day, a fair value price will be determined in accordance with the Fund’s Valuation Procedures.
Investments in registered open-end investment companies are valued at net asset value. Interests in non-registered investment companies that are redeemable at net asset value are fair valued normally at net asset value.
Investments which are not valued using any of the methods discussed above are valued at their fair value, as determined in good faith by the Board of Trustees of the Fund. The Board of Trustees has established a Valuation Committee comprised of the Trustees and has delegated to it the authority to take any actions regarding the valuation of portfolio securities that the Valuation Committee deems necessary or appropriate, including determining the fair value of portfolio securities, unless the determination has been delegated to the Wells Fargo Asset Management Pricing Committee at Wells Fargo Funds Management, LLC ("Funds Management"). The Board of Trustees retains the authority to make or ratify any valuation decisions or approve any changes to the Valuation Procedures as it deems appropriate. On a quarterly basis, the Board of Trustees receives reports on any valuation actions taken by the Valuation Committee or the Wells Fargo Asset Management Pricing Committee which may include items for ratification.
Securities lending
The Fund may lend its securities from time to time in order to earn additional income in the form of fees or interest on securities received as collateral or the investment of any cash received as collateral. When securities are on loan, the Fund receives interest or dividends on those securities. Cash collateral received in connection with its securities lending transactions is invested in Securities Lending Cash Investments, LLC (the “Securities Lending Fund”). Investments in Securities Lending Fund are valued at the evaluated bid price provided by an independent pricing service. Income earned from investment in the Securities Lending Fund (net of fees and rebates), if any, is included in income from affiliated securities on the Statement of Operations.
In a securities lending transaction, the net asset value of the Fund is affected by an increase or decrease in the value of the securities loaned and by an increase or decrease in the value of the instrument in which collateral is invested. The amount of securities lending activity undertaken by the Fund fluctuates from time to time. The Fund has the right under the lending agreement to recover the securities from the borrower on demand. In the event of default or bankruptcy by the borrower, the Fund may be prevented from recovering the loaned securities or gaining access to the collateral or may experience delays or costs in doing so. In such an event, the terms of the agreement allow the unaffiliated securities lending agent to use the collateral to purchase replacement securities on behalf of the Fund or pay the Fund the market value of the loaned securities. The Fund bears the risk of loss with respect to depreciation of its investment of the cash collateral.
Security transactions and income recognition
Securities transactions are recorded on a trade date basis. Realized gains or losses are recorded on the basis of identified cost.
20 | Wells Fargo VT Omega Growth Fund
Notes to financial statements
Dividend income is recognized on the ex-dividend date. Dividend income is recorded net of foreign taxes withheld where recovery of such taxes is not assured.
Distributions to shareholders
Distributions to shareholders from net investment income and any net realized gains are recorded on the ex-dividend date and paid at least annually. Such distributions are determined in accordance with income tax regulations and may differ from U.S. generally accepted accounting principles. Dividend sources are estimated at the time of declaration. The tax character of distributions is determined as of the Fund’s fiscal year end. Therefore, a portion of the Fund’s distributions made prior to the Fund’s fiscal year end may be categorized as a tax return of capital at year end.
Federal and other taxes
The Fund intends to continue to qualify as a regulated investment company by distributing substantially all of its investment company taxable income and any net realized capital gains (after reduction for capital loss carryforwards) sufficient to relieve it from all, or substantially all, federal income taxes. Accordingly, no provision for federal income taxes was required.
The Fund’s income and federal excise tax returns and all financial records supporting those returns for the fiscal years are subject to examination by the federal and Delaware revenue authorities. Management has analyzed the Fund’s tax positions taken on federal, state, and foreign tax returns for all open tax years and does not believe that there are any uncertain tax positions that require recognition of a tax liability.
As of December 31, 2020, the aggregate cost of all investments for federal income tax purposes was $45,771,939 and the unrealized gains (losses) consisted of:
| Gross unrealized gains | $63,183,872 |
| Gross unrealized losses | 0 |
| Net unrealized gains | $63,183,872 |
Class allocations
The separate classes of shares offered by the Fund differ principally in distribution fees. Class specific expenses are charged directly to that share class. Investment income, common fund-level expenses, and realized and unrealized gains (losses) on investments are allocated daily to each class of shares based on the relative proportion of net assets of each class.
3. FAIR VALUATION MEASUREMENTS
Fair value measurements of investments are determined within a framework that has established a fair value hierarchy based upon the various data inputs utilized in determining the value of the Fund’s investments. The three-level hierarchy gives the highest priority to unadjusted quoted prices in active markets for identical assets or liabilities (Level 1) and the lowest priority to unobservable inputs (Level 3). The Fund’s investments are classified within the fair value hierarchy based on the lowest level of input that is significant to the fair value measurement. The inputs are summarized into three broad levels as follows:
| ■ | Level 1 – quoted prices in active markets for identical securities |
| ■ | Level 2 – other significant observable inputs (including quoted prices for similar securities, interest rates, prepayment speeds, credit risk, etc.) |
| ■ | Level 3 – significant unobservable inputs (including the Fund’s own assumptions in determining the fair value of investments) |
The inputs or methodologies used for valuing investments in securities are not necessarily an indication of the risk associated with investing in those securities.
Wells Fargo VT Omega Growth Fund | 21
Notes to financial statements
The following is a summary of the inputs used in valuing the Fund’s assets and liabilities as of December 31, 2020:
| | Quoted prices
(Level 1) | Other significant
observable inputs
(Level 2) | Significant
unobservable inputs
(Level 3) | Total |
| Assets | | | | |
| Investments in: | | | | |
| Common stocks | | | | |
| Communication services | $ 11,159,993 | $0 | $0 | $ 11,159,993 |
| Consumer discretionary | 18,410,815 | 0 | 0 | 18,410,815 |
| Financials | 3,234,686 | 0 | 0 | 3,234,686 |
| Health care | 19,532,897 | 0 | 0 | 19,532,897 |
| Industrials | 6,562,543 | 0 | 0 | 6,562,543 |
| Information technology | 45,487,826 | 0 | 0 | 45,487,826 |
| Materials | 1,756,435 | 0 | 0 | 1,756,435 |
| Real estate | 1,289,334 | 0 | 0 | 1,289,334 |
| Short-term investments | | | | |
| Investment companies | 1,521,282 | 0 | 0 | 1,521,282 |
| Total assets | $108,955,811 | $0 | $0 | $108,955,811 |
Additional sector, industry or geographic detail is included in the Portfolio of Investments.
For the year ended December 31, 2020, the Fund did not have any transfers into/out of Level 3.
4. TRANSACTIONS WITH AFFILIATES
Management fee
Funds Management, an indirect wholly owned subsidiary of Wells Fargo & Company (“Wells Fargo”), is the manager of the Fund and provides advisory and fund-level administrative services under an investment management agreement. Under the investment management agreement, Funds Management is responsible for, among other services, implementing the investment objectives and strategies of the Fund, supervising the subadviser and providing fund-level administrative services in connection with the Fund’s operations. As compensation for its services under the investment management agreement, Funds Management is entitled to receive a management fee at the following annual rate based on the Fund’s average daily net assets:
| Average daily net assets | Management fee |
| First $500 million | 0.600% |
| Next $500 million | 0.550 |
| Next $1 billion | 0.500 |
| Next $2 billion | 0.475 |
| Next $1 billion | 0.450 |
| Next $5 billion | 0.440 |
| Over $10 billion | 0.430 |
For the year ended December 31, 2020, the management fee was equivalent to an annual rate of 0.60% of the Fund’s average daily net assets.
Funds Management has retained the services of a subadviser to provide daily portfolio management to the Fund. The fee for subadvisory services is borne by Funds Management. Wells Capital Management Incorporated ("WellsCap"), an affiliate of Funds Management and an indirect wholly owned subsidiary of Wells Fargo, is the subadviser to the Fund and is entitled to receive a fee from Funds Management at an annual rate starting at 0.45% and declining to 0.30% as the average daily net assets of the Fund increase.
Administration fees
Under a class-level administration agreement, Funds Management provides class-level administrative services to the Fund, which includes paying fees and expenses for services provided by the transfer agent, sub-transfer agents, omnibus account
22 | Wells Fargo VT Omega Growth Fund
Notes to financial statements
services and record-keepers. As compensation for its services under the class-level administration agreement, Funds Management receives an annual fee of 0.08% which is calculated based on the average daily net assets of each class.
Waivers and/or expense reimbursements
Funds Management has contractually waived and/or reimbursed management and administration fees to the extent necessary to maintain certain net operating expense ratios for the Fund. When each class of the Fund has exceeded its expense cap, Funds Management has waived fees and/or reimbursed expenses from fund-level expenses on a proportionate basis and then from class specific expenses. When only certain classes exceed their expense caps, waivers and/or reimbursements are applied against class specific expenses before fund-level expenses. Funds Management has committed through April 30, 2021 to waive fees and/or reimburse expenses to the extent necessary to cap the Fund’s expenses at 0.75% for Class 1 shares and 1.00% for Class 2 shares. Prior to or after the commitment expiration date, the cap may be increased or the commitment to maintain the cap may be terminated only with the approval of the Board of Trustees.
Distribution fee
The Trust has adopted a distribution plan for Class 2 shares of the Fund pursuant to Rule 12b-1 under the 1940 Act. A distribution fee is charged to Class 2 shares and paid to Wells Fargo Funds Distributor, LLC (“Funds Distributor”), the principal underwriter, at an annual rate of 0.25% of the average daily net assets of Class 2 shares.
Interfund transactions
The Fund may purchase or sell portfolio investment securities to certain other Wells Fargo affiliates pursuant to Rule 17a-7 under the 1940 Act and under procedures adopted by the Board of Trustees. The procedures have been designed to ensure that these interfund transactions, which do not incur broker commissions, are effected at current market prices.
5. INVESTMENT PORTFOLIO TRANSACTIONS
Purchases and sales of investments, excluding U.S. government obligations (if any) and short-term securities, for the year ended December 31, 2020 were $22,391,221 and $40,259,930, respectively.
6. SECURITIES LENDING TRANSACTIONS
The Fund lends its securities through an unaffiliated securities lending agent and receives collateral in the form of cash or securities with a value at least equal to the value of the securities on loan. The value of the loaned securities is determined at the close of each business day and any increases or decreases in the required collateral are exchanged between the Fund and the counterparty on the next business day. Cash collateral received is invested in the Securities Lending Fund which seeks to provide a positive return compared to the daily Federal Funds Open Rate by investing in high-quality, U.S. dollar-denominated short-term money market instruments and is exempt from registration under Section 3(c)(7) of the 1940 Act. Securities Lending Fund is managed by Funds Management and is subadvised by WellsCap. Funds Management receives an advisory fee starting at 0.05% and declining to 0.01% as the average daily net assets of the Securities Lending Fund increase. All of the fees received by Funds Management are paid to WellsCap for its services as subadviser.
In the event of counterparty default or the failure of a borrower to return a loaned security, the Fund has the right to use the collateral to offset any losses incurred. As of December 31, 2020, the Fund had securities lending transactions with the following counterparties which are subject to offset:
| Counterparty | Value of
securities on
loan | Collateral
received1 | Net amount |
| Barclays Capital Inc. | $1,277,484 | $(1,277,484) | $0 |
1 Collateral received within this table is limited to the collateral for the net transaction with the counterparty.
7. BANK BORROWINGS
The Trust, Wells Fargo Master Trust and Wells Fargo Funds Trust (excluding the money market funds) are parties to a $350,000,000 revolving credit agreement whereby the Fund is permitted to use bank borrowings for temporary or emergency purposes, such as to fund shareholder redemption requests. Interest under the credit agreement is charged to the Fund based on a borrowing rate equal to the higher of the Federal Funds rate in effect on that day plus 1.25% or the overnight LIBOR rate in effect on that day plus 1.25%. In addition, an annual commitment fee equal to 0.25% of the unused balance is allocated to each participating fund.
Wells Fargo VT Omega Growth Fund | 23
Notes to financial statements
For the year ended December 31, 2020, there were no borrowings by the Fund under the agreement.
8. DISTRIBUTIONS TO SHAREHOLDERS
The tax character of distributions paid during the years ended December 31, 2020 and December 31, 2019 were as follows:
| | Year ended December 31 |
| | 2020 | 2019 |
| Ordinary income | $ 728,859 | $1,104,228 |
| Long-term capital gain | 6,560,416 | 9,754,363 |
As of December 31, 2020, the components of distributable earnings on a tax basis were as follows:
Undistributed
ordinary
income | Undistributed
long-term
gain | Unrealized
gains |
| $1,131,692 | $10,381,397 | $63,183,872 |
9. CONCENTRATION RISK
Concentration risk results from exposure to a limited number of sectors. As of the end of the period, the Fund concentrated its portfolio in investments related to information technology sector. A fund that invests a substantial portion of its assets in any sector may be more affected by changes in that sector than would be a fund whose investments are not heavily weighted in any sector.
10. INDEMNIFICATION
Under the Fund's organizational documents, the officers and Trustees have been granted certain indemnification rights against certain liabilities that may arise out of performance of their duties to the Fund. The Fund has entered into a separate agreement with each Trustee that converts indemnification rights currently existing under the Fund’s organizational documents into contractual rights that cannot be changed in the future without the consent of the Trustee. Additionally, in the normal course of business, the Fund may enter into contracts with service providers that contain a variety of indemnification clauses. The Fund’s maximum exposure under these arrangements is dependent on future claims that may be made against the Fund and, therefore, cannot be estimated.
11. NEW ACCOUNTING PRONOUNCEMENT
In August 2018, FASB issued Accounting Standards Update (“ASU”) No. 2018-13, Fair Value Measurement (Topic 820) Disclosure Framework - Changes to the Disclosure Requirements for Fair Value Measurement. ASU 2018-13 updates the disclosure requirements on fair value measurements in Topic 820, Fair Value Measurements. The amendments are effective for fiscal years, and interim periods within those fiscal years, beginning after December 15, 2019. Management has adopted this guidance which did not have a material impact on the financial statements.
12. SUBSEQUENT EVENT
On February 23, 2021, Wells Fargo announced that it has entered into a definitive agreement to sell Wells Fargo Asset Management (“WFAM”) to GTCR LLC and Reverence Capital Partners, L.P. WFAM is the trade name used by the asset management businesses of Wells Fargo and includes Wells Fargo Funds Management, LLC, the investment manager to the Fund, Wells Capital Management Incorporated and Wells Fargo Asset Management (International) Limited, both registered investment advisers providing sub-advisory services to certain funds, and Wells Fargo Funds Distributor, LLC, the Fund’s principal underwriter. As part of the transaction, Wells Fargo will own a 9.9% equity interest and will continue to serve as an important client and distribution partner.
Consummation of the transaction will result in the automatic termination of the Fund’s investment management agreement and sub-advisory agreement(s). The Fund’s Board of Trustees will be asked to approve new investment management arrangements with the new company. If approved by the Board, the new investment management arrangements with the new company will be presented to the shareholders of the Fund for approval, and, if approved by shareholders, would take effect upon the closing of the transaction. The transaction is expected to close in the second half of 2021, subject to customary closing conditions.
24 | Wells Fargo VT Omega Growth Fund
Notes to financial statements
13. CORONAVIRUS (COVID-19) PANDEMIC
On March 11, 2020, the World Health Organization announced that it had made the assessment that coronavirus disease 2019 (“COVID-19”) is a pandemic. The impacts of COVID-19 are affecting the entire global economy, individual companies and investment products, and the market in general. There is significant uncertainty around the extent and duration of business disruptions related to COVID-19 and the impacts may be short term or may last for an extended period of time. The risk of further spreading of COVID-19 has led to significant uncertainty and volatility in the financial markets.
Wells Fargo VT Omega Growth Fund | 25
Report of independent registered public accounting firm
To the Shareholders of the Fund and Board of Trustees
Wells Fargo Variable Trust:
Opinion on the Financial Statements
We have audited the accompanying statement of assets and liabilities of Wells Fargo VT Omega Growth Fund (the Fund), one of the funds constituting Wells Fargo Variable Trust, including the portfolio of investments, as of December 31, 2020, the related statement of operations for the year then ended, the statements of changes in net assets for each of the years in the two-year period then ended, and the related notes (collectively, the financial statements) and the financial highlights for each of the years in the five-year period then ended. In our opinion, the financial statements and financial highlights present fairly, in all material respects, the financial position of the Fund as of December 31, 2020, the results of its operations for the year then ended, the changes in its net assets for each of the years in the two-year period then ended, and the financial highlights for each of the years in the five-year period then ended, in conformity with U.S. generally accepted accounting principles.
Basis for Opinion
These financial statements and financial highlights are the responsibility of the Fund’s management. Our responsibility is to express an opinion on these financial statements and financial highlights based on our audits. We are a public accounting firm registered with the Public Company Accounting Oversight Board (United States) (PCAOB) and are required to be independent with respect to the Fund in accordance with the U.S. federal securities laws and the applicable rules and regulations of the Securities and Exchange Commission and the PCAOB.
We conducted our audits in accordance with the standards of the PCAOB. Those standards require that we plan and perform the audit to obtain reasonable assurance about whether the financial statements and financial highlights are free of material misstatement, whether due to error or fraud. Our audits included performing procedures to assess the risks of material misstatement of the financial statements and financial highlights, whether due to error or fraud, and performing procedures that respond to those risks. Such procedures included examining, on a test basis, evidence regarding the amounts and disclosures in the financial statements and financial highlights. Such procedures also included confirmation of securities owned as of December 31, 2020, by correspondence with the custodian, transfer agent and brokers, or by other appropriate auditing procedures. Our audits also included evaluating the accounting principles used and significant estimates made by management, as well as evaluating the overall presentation of the financial statements and financial highlights. We believe that our audits provide a reasonable basis for our opinion.

We have not been able to determine the specific year that we began serving as the auditor of one or more Wells Fargo Funds investment companies; however we are aware that we have served as the auditor of one or more Wells Fargo Funds investment companies since at least 1955.
Boston, Massachusetts
February 25, 2021
26 | Wells Fargo VT Omega Growth Fund
Other information (unaudited)
TAX INFORMATION
For corporate shareholders, pursuant to Section 854 of the Internal Revenue Code, 66.49% of ordinary income dividends qualify for the corporate dividends-received deduction for the fiscal year ended December 31, 2020.
Pursuant to Section 852 of the Internal Revenue Code, $6,560,416 was designated as a 20% rate gain distribution for the fiscal year ended December 31, 2020
PROXY VOTING INFORMATION
A description of the policies and procedures used to determine how to vote proxies relating to portfolio securities is available without charge, upon request, by calling 1-800-260-5969, visiting our website at wfam.com, or visiting the SEC website at sec.gov. Information regarding how the proxies related to portfolio securities were voted during the most recent 12-month period ended June 30 is available on the website at wfam.com or by visiting the SEC website at sec.gov.
QUARTERLY PORTFOLIO HOLDINGS INFORMATION
The Fund files its complete schedule of portfolio holdings with the SEC for the first and third quarters of each fiscal year as an exhibit to its reports on Form N-PORT. Shareholders may view the filed Form N-PORT by visiting the SEC website at sec.gov.
Wells Fargo VT Omega Growth Fund | 27
Other information (unaudited)
BOARD OF TRUSTEES AND OFFICERS
Each of the Trustees and Officers1 listed in the table below acts in identical capacities for each fund in the Wells Fargo family of funds, which consists of 144 mutual funds comprising the Wells Fargo Funds Trust, Wells Fargo Variable Trust, Wells Fargo Master Trust and four closed-end funds (collectively the “Fund Complex”). This table should be read in conjunction with the Prospectus and the Statement of Additional Information2. The mailing address of each Trustee and Officer is 525 Market Street, 12th Floor, San Francisco, CA 94105. Each Trustee and Officer serves an indefinite term, however, each Trustee serves such term until reaching the mandatory retirement age established by the Trustees.
Independent Trustees
Name and
year of birth | Position held and
length of service* | Principal occupations during past five years or longer | Current other
public company or
investment
company
directorships |
William R. Ebsworth
(Born 1957) | Trustee,
since 2015 | Retired. From 1984 to 2013, equities analyst, portfolio manager, research director and chief investment officer at Fidelity Management and Research Company in Boston, Tokyo, and Hong Kong, and retired in 2013 as Chief Investment Officer of Fidelity Strategic Advisers, Inc. where he led a team of investment professionals managing client assets. Prior thereto, Board member of Hong Kong Securities Clearing Co., Hong Kong Options Clearing Corp., the Thailand International Fund, Ltd., Fidelity Investments Life Insurance Company, and Empire Fidelity Investments Life Insurance Company. Audit Committee Chair and Investment Committee Chair of the Vincent Memorial Hospital Endowment (non-profit organization). Mr. Ebsworth is a CFA® charterholder. | N/A |
Jane A. Freeman
(Born 1953) | Trustee,
since 2015;
Chair Liaison,
since 2018 | Retired. From 2012 to 2014 and 1999 to 2008, Chief Financial Officer of Scientific Learning Corporation. From 2008 to 2012, Ms. Freeman provided consulting services related to strategic business projects. Prior to 1999, Portfolio Manager at Rockefeller & Co. and Scudder, Stevens & Clark. Board member of the Harding Loevner Funds from 1996 to 2014, serving as both Lead Independent Director and chair of the Audit Committee. Board member of the Russell Exchange Traded Funds Trust from 2011 to 2012 and the chair of the Audit Committee. Ms. Freeman is also an inactive Chartered Financial Analyst. | N/A |
Isaiah Harris, Jr.
(Born 1952) | Trustee,
since 2009; Audit
Committee
Chair,
since 2019 | Retired. Chairman of the Board of CIGNA Corporation since 2009, and Director since 2005. From 2003 to 2011, Director of Deluxe Corporation. Prior thereto, President and CEO of BellSouth Advertising and Publishing Corp. from 2005 to 2007, President and CEO of BellSouth Enterprises from 2004 to 2005 and President of BellSouth Consumer Services from 2000 to 2003. Emeritus member of the Iowa State University Foundation Board of Governors. Emeritus Member of the Advisory Board of Iowa State University School of Business. Advisory Board Member, Palm Harbor Academy (private school). Mr. Harris is a certified public accountant (inactive status). | CIGNA Corporation |
Judith M. Johnson
(Born 1949) | Trustee,
since 2008 | Retired. Prior thereto, Chief Executive Officer and Chief Investment Officer of Minneapolis Employees Retirement Fund from 1996 to 2008. Ms. Johnson is an attorney, certified public accountant and a certified managerial accountant. | N/A |
David F. Larcker
(Born 1950) | Trustee,
since 2009 | James Irvin Miller Professor of Accounting at the Graduate School of Business (Emeritus), Stanford University, Director of the Corporate Governance Research Initiative and Senior Faculty of The Rock Center for Corporate Governance since 2006. From 2005 to 2008, Professor of Accounting at the Graduate School of Business, Stanford University. Prior thereto, Ernst & Young Professor of Accounting at The Wharton School, University of Pennsylvania from 1985 to 2005. | N/A |
28 | Wells Fargo VT Omega Growth Fund
Other information (unaudited)
Name and
year of birth | Position held and
length of service* | Principal occupations during past five years or longer | Current other
public company or
investment
company
directorships |
Olivia S. Mitchell
(Born 1953) | Trustee,
since 2006;
Nominating and
Governance
Committee Chair,
since 2018 | International Foundation of Employee Benefit Plans Professor, Wharton School of the University of Pennsylvania since 1993. Director of Wharton’s Pension Research Council and Boettner Center on Pensions & Retirement Research, and Research Associate at the National Bureau of Economic Research. Previously, Cornell University Professor from 1978 to 1993. | N/A |
Timothy J. Penny
(Born 1951) | Trustee,
since 1996;
Chair,
since 2018 | President and Chief Executive Officer of Southern Minnesota Initiative Foundation, a non-profit organization, since 2007. Member of the Board of Trustees of NorthStar Education Finance, Inc., a non-profit organization, since 2007. | N/A |
James G. Polisson
(Born 1959) | Trustee,
since 2018 | Retired. Chief Marketing Officer, Source (ETF) UK Services, Ltd, from 2015 to 2017. From 2012 to 2015, Principal of The Polisson Group, LLC, a management consulting, corporate advisory and principal investing company. Chief Executive Officer and Managing Director at Russell Investments, Global Exchange Traded Funds from 2010 to 2012. Managing Director of Barclays Global Investors from 1998 to 2010 and Global Chief Marketing Officer for iShares and Barclays Global Investors from 2000 to 2010. Trustee of the San Francisco Mechanics’ Institute, a non-profit organization, from 2013 to 2015. Board member of the Russell Exchange Traded Fund Trust from 2011 to 2012. Director of Barclays Global Investors Holdings Deutschland GmbH from 2006 to 2009. Mr. Polisson is an attorney and has a retired status with the Massachusetts and District of Columbia Bar Associations. | N/A |
Pamela Wheelock
(Born 1959) | Trustee,
since January
2020; previously
Trustee from
January 2018 to
July 2019 | Board member of the Destination Medical Center Economic Development Agency, Rochester, Minnesota since 2019. Interim President of the McKnight Foundation from January to September 2020. Acting Commissioner, Minnesota Department of Human Services, July 2019 through September 2019. Human Services Manager (part-time), Minnesota Department of Human Services, October 2019 through December 2019. Chief Operating Officer, Twin Cities Habitat for Humanity from 2017 to 2019. Vice President of University Services, University of Minnesota from 2012 to 2016. Prior thereto, on the Board of Directors, Governance Committee and Finance Committee for the Minnesota Philanthropy Partners (Saint Paul Foundation) from 2012 to 2018, Interim Chief Executive Officer of Blue Cross Blue Shield of Minnesota from 2011 to 2012, Chairman of the Board from 2009 to 2012 and Board Director from 2003 to 2015. Vice President, Leadership and Community Engagement, Bush Foundation, Saint Paul, Minnesota (a private foundation) from 2009 to 2011. Executive Vice President and Chief Financial Officer, Minnesota Sports and Entertainment from 2004 to 2009 and Senior Vice President from 2002 to 2004. Executive Vice President of the Minnesota Wild Foundation from 2004 to 2008. Commissioner of Finance, State of Minnesota, from 1999 to 2002. Currently Board Chair of the Minnesota Wild Foundation since 2010. | N/A |
* Length of service dates reflect the Trustee’s commencement of service with the Trust’s predecessor entities, where applicable.
Wells Fargo VT Omega Growth Fund | 29
Other information (unaudited)
Officers
Name and
year of birth | Position held and
length of service | Principal occupations during past five years or longer |
Andrew Owen
(Born 1960) | President,
since 2017 | Executive Vice President of Wells Fargo & Company and Head of Affiliated Managers, Wells Fargo Asset Management, since 2014. In addition, Mr. Owen is currently President, Chief Executive Officer and Director of Wells Fargo Funds Management, LLC since 2017. Prior thereto, Executive Vice President responsible for marketing, investments and product development for Wells Fargo Funds Management, LLC, from 2009 to 2014. |
Jeremy DePalma1
(Born 1974) | Treasurer,
since 2012 | Senior Vice President of Wells Fargo Funds Management, LLC since 2009. Senior Vice President of Evergreen Investment Management Company, LLC from 2008 to 2010 and head of the Fund Reporting and Control Team within Fund Administration from 2005 to 2010. |
Michelle Rhee
(Born 1966) | Chief Legal Officer,
since 2019 | Secretary of Wells Fargo Funds Management, LLC and Chief Legal Counsel of Wells Fargo Asset Management since 2018. Deputy General Counsel of Wells Fargo Bank, N.A. since 2020 and Assistant General Counsel of Wells Fargo Bank, N.A. from 2018 to 2020. Associate General Counsel and Managing Director of Bank of America Corporation from 2004 to 2018. |
Catherine Kennedy
(Born 1969) | Secretary,
since 2019 | Vice President of Wells Fargo Funds Management, LLC and Senior Counsel of the Wells Fargo Legal Department since 2010. Vice President and Senior Counsel of Evergreen Investment Management Company, LLC from 1998 to 2010. |
Michael H. Whitaker
(Born 1967) | Chief Compliance Officer,
since 2016 | Chief Compliance Officer of Wells Fargo Asset Management since 2016. Senior Vice President and Chief Compliance Officer for Fidelity Investments from 2007 to 2016. |
1 Jeremy DePalma acts as Treasurer of 77 funds in the Fund Complex.
2 The Statement of Additional Information includes additional information about the Trustees and is available, without charge, upon request, by calling 1-800-260-5969 or by visiting the website at wfam.com.
30 | Wells Fargo VT Omega Growth Fund
For more information
More information about Wells Fargo Funds is available free upon request. To obtain literature, please write, visit the Fund's website, or call:
Wells Fargo Funds
P.O. Box 219967
Kansas City, MO 64121-9967
Website: wfam.com
Individual investors: 1-800-222-8222
Retail investment professionals: 1-888-877-9275
Institutional investment professionals: 1-866-765-0778
This report and the financial statements contained herein are submitted for the general information of the shareholders of the Fund. If this report is used for promotional purposes, distribution of the report must be accompanied or preceded by a current prospectus. Before investing, please consider the investment objectives, risks, charges, and expenses of the investment. For a current prospectus and, if available, a summary prospectus, containing this information, call 1-800-260-5969 or visit the Fund’s website at wfam.com. Read the prospectus carefully before you invest or send money.
Wells Fargo Asset Management (WFAM) is the trade name for certain investment advisory/management firms owned by Wells Fargo & Company. These firms include but are not limited to Wells Capital Management Incorporated and Wells Fargo Funds Management, LLC. Certain products managed by WFAM entities are distributed by Wells Fargo Funds Distributor, LLC (a broker-dealer and Member FINRA).
This material is for general informational and educational purposes only and is NOT intended to provide investment advice or a recommendation of any kind— including a recommendation for any specific investment, strategy, or plan.
INVESTMENT PRODUCTS: NOT FDIC INSURED ■ NO BANK GUARANTEE ■ MAY LOSE VALUE
© 2021 Wells Fargo & Company. All rights reserved.
PAR-0121-00266 02-21
AVT5/AR151 12-20
Annual Report
December 31, 2020
Wells Fargo VT Opportunity Fund
Reduce clutter.
Save trees.
Sign up for electronic delivery of prospectuses and shareholder reports at wellsfargo.com/ advantagedelivery
The views expressed and any forward-looking statements are as of December 31, 2020, unless otherwise noted, and are those of the Fund's portfolio managers and/or Wells Fargo Asset Management. Discussions of individual securities or the markets generally are not intended as individual recommendations. Future events or results may vary significantly from those expressed in any forward-looking statements. The views expressed are subject to change at any time in response to changing circumstances in the market. Wells Fargo Asset Management and the Fund disclaim any obligation to publicly update or revise any views expressed or forward-looking statements.
INVESTMENT PRODUCTS: NOT FDIC INSURED ■ NO BANK GUARANTEE ■ MAY LOSE VALUE
Wells Fargo VT Opportunity Fund | 1
Letter to shareholders (unaudited)
Dear Shareholder:
We are pleased to offer you this annual report for the Wells Fargo VT Opportunity Fund for the 12-month period that ended December 31, 2020. Despite a deeply challenging year, dominated by the spread of COVID-19 cases and a sharp drop in economic output throughout much of the world, global stocks fared well overall, benefiting from strong central bank support. Bonds generally had modestly positive returns, providing some measure of diversification during turbulent market stretches.
For the 12-month period, equities had solid returns, more than making up for intense volatility in March. Non-U.S. developed market equities had weaker performance than emerging market and U.S. stocks. While gains from fixed-income securities were positive, they were more modest than equities. For the period, U.S. stocks, based on the S&P 500 Index1, gained 18.40%. International stocks, as measured by the MSCI ACWI ex USA Index (Net)2, returned 10.65%, while the MSCI EM Index (Net)3 had stronger performance, with a 18.31% gain. Among bond indexes, the Bloomberg Barclays U.S. Aggregate Bond Index4 returned 7.51%, the Bloomberg Barclays Global Aggregate ex-USD Index (unhedged)5 gained 10.11%, and the Bloomberg Barclays Municipal Bond Index6 returned 5.21% while the ICE BofA U.S. High Yield Index7 returned 6.17%.
The mood changed soon after the year began.
A year-end 2019 rally continued in early January 2020. However, market volatility spiked in late January on concerns over the potential impact of COVID-19 on the global economy and stock markets. With sentiment somewhat souring, perceived safe havens did well in January. The U.S. dollar and Japanese yen both rose, and government bonds outperformed equities. While the S&P 500 Index held its ground, emerging market equities tumbled.
Fears over the spread of COVID-19 and its impact on global growth led to a sharp downturn by late February. Oil prices tumbled as Russia and the Organization of the Petroleum Exporting Countries compounded a major decline in oil demand with a brutal price war, causing the price of crude oil to plummet.
Andrew Owen
President
Wells Fargo Funds
“Non-U.S. developed market equities had weaker performance than emerging market and U.S. stocks.”
| 1 | The S&P 500 Index consists of 500 stocks chosen for market size, liquidity, and industry group representation. It is a market-value-weighted index with each stock's weight in the index proportionate to its market value. You cannot invest directly in an index. |
| 2 | The Morgan Stanley Capital International (MSCI) All Country World Index (ACWI) ex USA Index (Net) is a free-float-adjusted market-capitalization-weighted index that is designed to measure the equity market performance of developed and emerging markets, excluding the United States. Source: MSCI. MSCI makes no express or implied warranties or representations and shall have no liability whatsoever with respect to any MSCI data contained herein. The MSCI data may not be further redistributed or used as a basis for other indices or any securities or financial products. This report is not approved, reviewed, or produced by MSCI. You cannot invest directly in an index. |
| 3 | The MSCI Emerging Markets (EM) Index (Net) is a free-float-adjusted market-capitalization-weighted index that is designed to measure equity market performance of emerging markets. You cannot invest directly in an index. |
| 4 | The Bloomberg Barclays U.S. Aggregate Bond Index is a broad-based benchmark that measures the investment-grade, U.S. dollar-denominated, fixed-rate taxable bond market, including Treasuries, government-related and corporate securities, mortgage-backed securities (agency fixed-rate and hybrid adjustable-rate mortgage pass-throughs), asset-backed securities, and commercial mortgage-backed securities. You cannot invest directly in an index. |
| 5 | The Bloomberg Barclays Global Aggregate ex-USD Index (unhedged) is an unmanaged index that provides a broad-based measure of the global investment-grade fixed-income markets excluding the U.S. dollar-denominated debt market. You cannot invest directly in an index. |
| 6 | The Bloomberg Barclays Municipal Bond Index is an unmanaged index composed of long-term tax-exempt bonds with a minimum credit rating of Baa. You cannot invest directly in an index. |
| 7 | The ICE BofA U.S. High Yield Index is a market-capitalization-weighted index of domestic and Yankee high-yield bonds. The index tracks the performance of high-yield securities traded in the U.S. bond market. You cannot invest directly in an index. Copyright 2021. ICE Data Indices, LLC. All rights reserved. |
2 | Wells Fargo VT Opportunity Fund
Letter to shareholders (unaudited)
The global spread of COVID-19 led country after country to clamp down on social- and business-related activity in order to contain the virus. This sent economies into a deep contraction. Central banks responded by slashing interest rates and expanding quantitative easing programs to restore liquidity and market confidence. The U.S. Federal Reserve (Fed) launched several lending programs, funding investment-grade bonds, money market mutual funds, and commercial paper while purchasing Treasuries, mortgage-backed securities, and overnight repurchase agreements. Meanwhile, stock markets tumbled, ending the longest bull stock market in U.S. history.
Markets rebounded strongly through the spring, fueled by unprecedented government and central bank stimulus measures in the U.S. and globally. The U.S. economy contracted by an annualized 5.0% pace in the first quarter, with 30 million new unemployment insurance claims in six weeks. In the eurozone, first-quarter real gross domestic product (GDP) shrank 3.8%. China’s first-quarter GDP fell by 6.8% year over year. Extreme oil-price volatility continued as global supply far exceeded demand.
In May, investors regained confidence on reports of early success in human trials of a COVID-19 vaccine. Growth stocks outperformed value, while returns on global government bonds were flat. However, in the U.S., the April unemployment rate rose to 14.7%, its highest level since World War II. Purchasing managers’ indexes (PMIs), a monthly survey of purchasing managers, reflected broadly weakening activity in May. U.S. corporate earnings contracted 14% year over year from the first quarter of 2019. However, high demand for information technology (IT), driven by remote activity, supported robust IT sector earnings, which helped drive IT stocks higher.
By June, economies reopened and global central banks committed to do all they could to provide economic support through liquidity and low borrowing costs. U.S. economic activity was aided by one-time $1,200 stimulus checks and $600 weekly bonus unemployment benefits that lasted through July. However, unemployment remained historically high and COVID-19 cases began to increase by late June. China’s economic recovery began to pick up momentum.
July was broadly positive for equities and fixed income. However, economic data and a resurgence of COVID-19 cases underscored the urgent need to regain control of the pandemic. Second-quarter GDP shrank from the previous quarter by 9.5% and 12.1% in the U.S. and the eurozone, respectively. In contrast, China’s second-quarter GDP grew 3.2% year over year. The U.S. economy added 1.8 million jobs in July, but a double-digit jobless rate persisted.
The stock market continued to rally in August despite concerns over rising numbers of U.S. and European COVID-19 cases as well as the July expiration of the $600 weekly bonus unemployment benefit. Relatively strong second-quarter earnings boosted investor sentiment along with the Fed’s announcement of a monetary policy shift expected to support longer-term low interest rates. U.S. manufacturing and services activity indexes beat expectations while the U.S. housing market maintained strength. In Europe, retail sales expanded and consumer confidence was steady. China’s economy continued to expand.
Stocks grew more volatile in September on mixed economic data. U.S. economic activity continued to grow. However, U.S. unemployment remained elevated at 7.9% in September. With U.S. Congress delaying further fiscal relief and uncertainties surrounding a possible vaccine, doubts crept back into the financial markets. In the U.K., a lack of progress in Brexit talks weighed on markets. China’s economy picked up steam, fueled by increased global demand.
Wells Fargo VT Opportunity Fund | 3
Letter to shareholders (unaudited)
In October, capital markets stepped back from their six-month rally. Market volatility rose in advance of the U.S. election and amid a global increase in COVID-19 infections. Europe introduced tighter restrictions affecting economic activity. U.S. markets looked favorably at the prospect of Democratic control of the federal purse strings, which could lead to additional fiscal stimulus and a boost to economic activity. Meanwhile, China reported 4.9% third-quarter GDP growth.
Global stocks rallied in November, propelled by optimism over three promising COVID-19 vaccines. Reversing recent trends, value stocks outperformed growth stocks and cyclical stocks outpaced technology stocks. However, U.S. unemployment remained elevated, with a net job loss of 10 million since February. The eurozone services PMI contracted sharply while the region’s manufacturing activity grew. The U.S. election results added to the upbeat mood as investors anticipated more consistent policies in the new administration.
Financial markets ended the year with strength on high expectations for a rapid rollout of the COVID-19 vaccines, the successful passage of a $900 billion stimulus package, and rising expectations of additional economic support from a Democratic-led Congress. U.S. economic data were mixed with still-elevated unemployment and weak retail sales but growth in manufacturing output. In contrast, China’s economic expansion continued in both manufacturing and nonmanufacturing. U.S. COVID-19 infection rates continued to rise even as new state and local lockdown measures were implemented.
Don’t let short-term uncertainty derail long-term investment goals.
Periods of investment uncertainty can present challenges, but experience has taught us that maintaining long-term investment goals can be an effective way to plan for the future. To help you create a sound strategy based on your personal goals and risk tolerance, Wells Fargo Funds offers more than 100 mutual funds spanning a wide range of asset classes and investment styles. Although diversification cannot guarantee an investment profit or prevent losses, we believe it can be an effective way to manage investment risk and potentially smooth out overall portfolio performance. We encourage investors to know their investments and to understand that appropriate levels of risk-taking may unlock opportunities.
Thank you for choosing to invest with Wells Fargo Funds. We appreciate your confidence in us and remain committed to helping you meet your financial needs.
Sincerely,
Andrew Owen
President
Wells Fargo Funds
“Global stocks rallied in November, propelled by optimism over three promising COVID-19 vaccines.”
For further information about your Fund, contact your investment professional, visit our website at wfam.com, or call us directly at 1-800-260-5969.
4 | Wells Fargo VT Opportunity Fund
This page is intentionally left blank.
Performance highlights (unaudited)
Investment objective
The Fund seeks long-term capital appreciation.
Manager
Wells Fargo Funds Management, LLC
Subadviser
Wells Capital Management Incorporated
Portfolio managers
Kurt Gunderson*
Christopher J. Miller, CFA®‡
Average annual total returns (%) as of December 31, 2020
| | | | | | Expense ratios1 (%) |
| | Inception date | 1 year | 5 year | 10 year | Gross | Net 2 |
| Class 13 | 8-26-2011 | 21.32 | 15.12 | 12.05 | 0.85 | 0.75 |
| Class 2 | 5-8-1992 | 21.00 | 14.83 | 11.79 | 1.10 | 1.00 |
| Russell 3000® Index4 | – | 20.89 | 15.43 | 13.79 | – | – |
Figures quoted represent past performance, which is no guarantee of future results. Investment return and principal value of an investment will fluctuate so that an investor’s shares, when redeemed, may be worth more or less than their original cost. Current performance may be lower or higher than the performance data quoted and assumes the reinvestment of dividends and capital gains. Current month-end performance is available by calling 1-800-260-5969. Performance figures of the Fund do not reflect fees and expenses charged pursuant to the terms of variable life insurance policies and variable annuity contracts. If these fees and expenses had been reflected, performance would have been lower.
Shares are sold without a front-end sales charge or contingent deferred sales charge.
Index returns do not include transaction costs associated with buying and selling securities, any mutual fund fees or expenses, or any taxes. It is not possible to invest directly in an index.
Stock values fluctuate in response to the activities of individual companies and general market and economic conditions. Smaller-company stocks tend to be more volatile and less liquid than those of larger companies. Certain investment strategies tend to increase the total risk of an investment (relative to the broader market). The Fund is exposed to foreign investment risk. Consult the Fund’s prospectus for additional information on these and other risks.
Please refer to the prospectus provided by your participating insurance company for detailed information describing the separate accounts for information regarding surrender charges, mortality and expense risk fees, and other charges that may be assessed by the participating insurance companies.
Please see footnotes on page 7.
6 | Wells Fargo VT Opportunity Fund
Performance highlights (unaudited)
| Growth of $10,000 investment as of December 31, 20205 |

| ‡ | CFA® and Chartered Financial Analyst® are trademarks owned by CFA Institute. |
| * | Mr. Gunderson became a portfolio manager of the Fund on February 1, 2021. |
| 1 | Reflects the expense ratios as stated in the most recent prospectuses. The expense ratios shown are subject to change and may differ from the annualized expense ratios shown in the financial highlights of this report. |
| 2 | The manager has contractually committed through April 30, 2021, to waive fees and/or reimburse expenses to the extent necessary to cap total annual fund operating expenses after fee waivers at 0.75% for Class 1 and 1.00% for Class 2. Brokerage commissions, stamp duty fees, interest, taxes, acquired fund fees and expenses (if any), and extraordinary expenses are excluded from the expense caps. Prior to or after the commitment expiration date, the caps may be increased or the commitment to maintain the caps may be terminated only with the approval of the Board of Trustees. Without these caps, the Fund’s returns would have been lower. The expense ratio paid by an investor is the net expense ratio (the total annual fund operating expenses after fee waivers) as stated in the prospectuses. |
| 3 | Historical performance shown for Class 1 shares prior to their inception reflects the performance of the Class 2 shares, and includes the higher expenses applicable to the Class 2 shares. If these expenses had not been included, returns for the Class 1 shares would be higher. |
| 4 | The Russell 3000® Index measures the performance of the 3,000 largest U.S. companies based on total market capitalization, which represents approximately 98% of the investable U.S. equity market. You cannot invest directly in an index. |
| 5 | The chart compares the performance of Class 2 shares for the most recent ten years with the Russell 3000® Index. The chart assumes a hypothetical $10,000 investment and reflects all operating expenses of the Fund but does not reflect fees and expenses charged pursuant to the terms of variable life insurance policies and variable annuity contracts. |
| 6 | Figures represent the percentage of the Fund's net assets. Holdings are subject to change and may have changed since the date specified. |
| 7 | Figures represent the percentage of the Fund's long-term investments. These amounts are subject to change and may have changed since the date specified. |
** This security was no longer held at the end of the reporting period.
Wells Fargo VT Opportunity Fund | 7
Performance highlights (unaudited)
MANAGER'S DISCUSSION
Fund highlights
| ■ | The Fund outperformed its benchmark, the Russell 3000® Index, for the 12-month period that ended December 31, 2020. |
| ■ | The Fund’s holdings in the financials and consumer staples sectors and an underexposure to the energy sector were the largest contributors to relative performance during the period. |
| ■ | The Fund’s holdings in the consumer discretionary, industrials, and materials sectors were the largest detractors from relative performance. |
The U.S. equity markets were extremely volatile and moved sharply in both directions during the reporting period. The markets continued their momentum from the prior year into mid-February 2020, hitting new all-time highs along the way. Then, as the global pandemic took hold, the equity markets proceeded to lose more than 35% of their value in less than six weeks, ending the longest bull market in U.S. history while entering bear-market territory in record time. Beginning in the last week of March, U.S. equities began to recover and rose for the rest of the year, except for a brief respite in September. The Fund’s benchmark gained 21% for the 12-month period. The information technology (IT), consumer discretionary, and health care sectors in the benchmark were the largest contributors to performance, while financials, energy, and real estate detracted. Growth stocks generally outperformed value.
Leading up to the mid-February high, U.S. equities benefited from a dovish U.S. Federal Reserve (Fed), lower corporate taxes, less regulation, share buybacks, capital spending, and high-profile merger and acquisition activity that boosted optimism in U.S. businesses. Rising wages, low unemployment, low inflation, and declining household debt fueled consumer confidence. The coronavirus evolved into a global pandemic, largely shutting down the international economy and eventually reaching up a worldwide death toll of over 1.8 million by year-end. The six-week market decline was followed by a recovery that can mostly be attributed to the speed and aggressiveness of the U.S. government’s fiscal and monetary policy response. Sentiment ebbed and flowed during the year with news of infection rates, mortality rates, vaccines, therapeutics, and partial business openings. The legislature approved five stimulus bills, including the Coronavirus Aid, Relief, and Economic Security (CARES) Act, representing the largest stimulus bill in U.S. history at $2.2 trillion. The fifth relief package totaling $900 billion was approved in December, including direct stimulus checks and extended unemployment benefits. The Fed had cut interest rates to near zero by mid-March and announced an aggressive open-ended commitment to keep buying assets under its quantitative easing measures to also include corporate bonds for the first time in its history. The year ended with inflation remaining muted at 1.2%, the 10-year U.S. Treasury yield below 1%, and the labor market improving, with the U.S. unemployment rate falling to 6.9%. The highly contested November elections resulted in the Democratic Party winning control of the executive and legislative branches of government, but some of that was already priced into the market. Through the period, we continued to seek companies with solid business models, strong management teams, and healthy cash flow prospects.
Stock selection in financials and consumer staples and positioning in energy contributed to relative returns.
The financials sector was the largest contributor to relative returns versus the benchmark, with an overweight to capital markets, which generally benefited from low interest rates as well as activity in the equity and debt markets, and an underweight to banks, which were hurt by falling interest rates and elevated credit risks associated with the economic impact of the pandemic. Within the consumer finance industry, Discover Financial Services**, the third-largest credit card brand in the U.S, with nearly 50 million cardholders, benefited from increased consumer spending in certain areas. We exited our position after the stock rose 44% during the period. The energy sector was hurt by the collapse in the price of crude oil, as global demand faded from the pandemic-induced economic slowdown without a proportional reduction in supply. Energy was the worst-performing sector in the benchmark, with a decline of 33%, but an underweight positioning caused it to be a relative contributor to the Fund. Our holdings in IT generated the largest contribution to overall returns. Apple Incorporated rose 82% during the period after consistently beating expectations on financial performance, product sales, new product launches, and future demand. Apple is one of the Fund’s top holdings and the largest individual contributor to returns, but the Fund was still underweight Apple relative to its large position within the benchmark. Another large individual contributor to performance was Bio-Rad Laboratories, Incorporated, a leading life science company providing instruments, software, consumables, reagents, and related content. The stock rose 58% on increased demand for its products, including a real-time PCR screening assay and a blood-based immunoassay kit to identify antibodies to COVID-19.
| Ten largest holdings (%) as of December 31, 20206 |
| Apple Incorporated | 4.30 |
| Alphabet Incorporated Class C | 4.23 |
| Amazon.com Incorporated | 3.93 |
| Salesforce.com Incorporated | 2.82 |
| Texas Instruments Incorporated | 2.70 |
| MasterCard Incorporated Class A | 2.69 |
| Facebook Incorporated Class A | 2.64 |
| Carlisle Companies Incorporated | 2.16 |
| Burlington Stores Incorporated | 2.08 |
| UnitedHealth Group Incorporated | 1.94 |
Please see footnotes on page 7.
8 | Wells Fargo VT Opportunity Fund
Performance highlights (unaudited)
Positioning and selection in consumer discretionary, industrials, and materials detracted from performance.
The consumer discretionary sector was one of the largest sources of absolute return in the benchmark, with the automobiles and internet marketing retail industries gaining the most. A slight underweight and stock selection in the sector that did not keep up with peers was a source of relative underperformance. The Fund’s holdings in industrials, particularly in aerospace/defense and building products, were overweight and underperformed the benchmark. Hexcel Corporation** is a leading producer of carbon fiber reinforcements and resin systems and honeycomb manufacturing for the commercial aerospace, industrial, and defense industries. Travel restrictions severely curtailed demand from aircraft manufacturers, and the stock declined 53% during the period. While the financials sector was an overall contributor to the Fund, individual bank holdings detracted. Webster Financial Corporation** (WBS) operates as the bank and financial holding company for Webster Bank. While it has a differentiated health savings account business that is undervalued, WBS and most banks were negatively affected by falling interest rates and concerns over potential credit losses related to the economic impact of the pandemic. We exited our position after the stock declined 46% during the period. Health care was also a large contributor to overall returns, but stock selection in medical devices and pharmaceuticals underperformed the benchmark. LivaNova PLC is a medical technology company that specializes in neuromodulation, cardiac surgery, and cardiac rhythm management. The stock declined 12% during the period, affected by a pandemic-related delay in clinical trial timelines and postponement of non-emergent procedures that hurt its neuromodulation business.
Our focus is constant: to add value by investing in attractively priced holdings.
We seek to buy stocks at a discount to their estimated private market valuation (PMV) and sell them as they reach the top of their PMV range. The PMV represents the expected price an investor would pay for the entire company as a stand-alone private entity. Our disciplined, bottom-up investment process leads us to be overweight or underweight certain sectors. This positioning changes over time based on macroeconomic and industry-specific factors. During the reporting period, the Fund had the most exposure to the IT, health care, and industrials sectors. The Fund was overweight the industrials and real estate sectors while being underweight consumer staples and utilities relative to the benchmark. Through our disciplined investment process, we remain keenly aware of both price and enterprise values on a company-by-company basis.
The economic impact of the COVID-19 global pandemic will continue to consume the equity markets for the near future. More than 21 million cases and 350,000 COVID-19-related deaths had been reported in the U.S. by year-end. Parts of the country gradually opened after they felt that infection rates were under control and patient recovery was on the rise, but when infections rose again later in the year, various states have had to reintroduce restrictions and delay their reopening plans. We now know a lot more about COVID-19, and the approval and rollout of the first two vaccines boosted optimism that the pandemic could get under control. It is too early to know how deep the ultimate economic damage will be and if the extraordinary fiscal/monetary responses to date will be effective. However, this economic downturn is different than any other in recent history, and there is still the possibility that things could get back to normal sooner than expected. The markets could be affected by future waves and mutant strains of COVID-19, changes in policies and laws following the recent elections in the U.S., and trade relationships between the major world powers.
| Sector allocation as of December 31, 20207 |
Please see footnotes on page 7.
Wells Fargo VT Opportunity Fund | 9
Fund expenses (unaudited)
As a shareholder of the Fund, you incur ongoing costs, including management fees, distribution (12b-1) fees, and other Fund expenses. This example is intended to help you understand your ongoing costs (in dollars) of investing in the Fund and to compare these costs with the ongoing costs of investing in other mutual funds.
The example is based on an investment of $1,000 invested at the beginning of the six-month period and held for the entire period from July 1, 2020 to December 31, 2020.
Actual expenses
The “Actual” line of the table below provides information about actual account values and actual expenses. You may use the information in this line, together with the amount you invested, to estimate the expenses that you paid over the period. Simply divide your account value by $1,000 (for example, an $8,600 account value divided by $1,000 = 8.6), then multiply the result by the number in the “Actual” line under the heading entitled “Expenses paid during period” for your applicable class of shares to estimate the expenses you paid on your account during this period.
Hypothetical example for comparison purposes
The “Hypothetical” line of the table below provides information about hypothetical account values and hypothetical expenses based on the Fund’s actual expense ratio and an assumed rate of return of 5% per year before expenses, which is not the Fund’s actual return. The hypothetical account values and expenses may not be used to estimate the actual ending account balance or expenses you paid for the period. You may use this information to compare the ongoing costs of investing in the Fund and other funds. To do so, compare this 5% hypothetical example with the 5% hypothetical examples that appear in the shareholder reports of the other funds.
Please note that the expenses shown in the table are meant to highlight your ongoing costs only and do not reflect any separate account charges assessed by participating insurance companies. Therefore, the “Hypothetical” line of the table is useful in comparing ongoing costs only, and will not help you determine the relative total costs of owning different funds. In addition, if these separate account charges assessed by participating insurance companies were included, your costs would have been higher.
| | Beginning
account value
7-1-2020 | Ending
account value
12-31-2020 | Expenses
paid during
the period1 | Annualized net
expense ratio |
| Class 1 | | | | |
| Actual | $1,000.00 | $1,275.18 | $4.29 | 0.75% |
| Hypothetical (5% return before expenses) | $1,000.00 | $1,021.37 | $3.81 | 0.75% |
| Class 2 | | | | |
| Actual | $1,000.00 | $1,273.03 | $5.71 | 1.00% |
| Hypothetical (5% return before expenses) | $1,000.00 | $1,020.11 | $5.08 | 1.00% |
1 Expenses paid is equal to the annualized net expense ratio of each class multiplied by the average account value over the period, multiplied by the number of days in the most recent fiscal half-year divided by the number of days in the fiscal year (to reflect the one-half-year period).
10 | Wells Fargo VT Opportunity Fund
Portfolio of investments—December 31, 2020
| | | | | Shares | Value |
| Common stocks: 98.82% | | | | | |
| Communication services: 8.57% | | | | | |
| Interactive media & services: 6.87% | | | | | |
| Alphabet Incorporated Class C † | | | | 4,811 | 8,428,295 |
| Facebook Incorporated Class A † | | | | 19,265 | 5,262,427 |
| | | | | | 13,690,722 |
| Wireless telecommunication services: 1.70% | | | | | |
| T-Mobile US Incorporated † | | | | 25,113 | 3,386,488 |
| Consumer discretionary: 10.58% | | | | | |
| Automobiles: 1.90% | | | | | |
| General Motors Company | | | | 90,905 | 3,785,284 |
| Internet & direct marketing retail: 3.93% | | | | | |
| Amazon.com Incorporated † | | | | 2,409 | 7,845,944 |
| Multiline retail: 1.19% | | | | | |
| Dollar General Corporation | | | | 11,259 | 2,367,768 |
| Specialty retail: 3.56% | | | | | |
| Burlington Stores Incorporated † | | | | 15,845 | 4,144,260 |
| Ulta Beauty Incorporated † | | | | 10,285 | 2,953,441 |
| | | | | | 7,097,701 |
| Consumer staples: 2.58% | | | | | |
| Food & staples retailing: 1.69% | | | | | |
| Sysco Corporation | | | | 45,426 | 3,373,335 |
| Household products: 0.89% | | | | | |
| Church & Dwight Company Incorporated | | | | 20,363 | 1,776,264 |
| Financials: 7.76% | | | | | |
| Capital markets: 5.05% | | | | | |
| CME Group Incorporated | | | | 9,198 | 1,674,496 |
| Intercontinental Exchange Incorporated | | | | 32,431 | 3,738,970 |
| S&P Global Incorporated | | | | 7,260 | 2,386,580 |
| The Charles Schwab Corporation | | | | 42,932 | 2,277,113 |
| | | | | | 10,077,159 |
| Insurance: 2.71% | | | | | |
| Chubb Limited | | | | 15,671 | 2,412,080 |
| Marsh & McLennan Companies Incorporated | | | | 25,474 | 2,980,458 |
| | | | | | 5,392,538 |
| Health care: 16.65% | | | | | |
| Biotechnology: 1.18% | | | | | |
| Alexion Pharmaceuticals Incorporated † | | | | 15,026 | 2,347,662 |
| Health care equipment & supplies: 6.27% | | | | | |
| Align Technology Incorporated † | | | | 4,904 | 2,620,600 |
| Boston Scientific Corporation † | | | | 82,387 | 2,961,813 |
The accompanying notes are an integral part of these financial statements.
Wells Fargo VT Opportunity Fund | 11
Portfolio of investments—December 31, 2020
| | | | | Shares | Value |
| Health care equipment & supplies (continued) | | | | | |
| LivaNova plc † | | | | 57,276 | $ 3,792,244 |
| Medtronic plc | | | | 26,786 | 3,137,712 |
| | | | | | 12,512,369 |
| Health care providers & services: 1.94% | | | | | |
| UnitedHealth Group Incorporated | | | | 11,065 | 3,880,274 |
| Life sciences tools & services: 4.90% | | | | | |
| Agilent Technologies Incorporated | | | | 26,949 | 3,193,187 |
| Bio-Rad Laboratories Incorporated Class A † | | | | 5,290 | 3,083,753 |
| Thermo Fisher Scientific Incorporated | | | | 7,484 | 3,485,898 |
| | | | | | 9,762,838 |
| Pharmaceuticals: 2.36% | | | | | |
| Novartis AG ADR | | | | 36,187 | 3,417,138 |
| Viatris Incorporated † | | | | 68,591 | 1,285,395 |
| | | | | | 4,702,533 |
| Industrials: 15.41% | | | | | |
| Aerospace & defense: 2.59% | | | | | |
| MTU Aero Engines AG † | | | | 10,132 | 2,641,099 |
| Teledyne Technologies Incorporated † | | | | 6,409 | 2,512,200 |
| | | | | | 5,153,299 |
| Commercial services & supplies: 1.10% | | | | | |
| Republic Services Incorporated | | | | 22,786 | 2,194,292 |
| Electrical equipment: 1.26% | | | | | |
| AMETEK Incorporated | | | | 20,806 | 2,516,278 |
| Industrial conglomerates: 2.16% | | | | | |
| Carlisle Companies Incorporated | | | | 27,555 | 4,303,540 |
| Machinery: 5.58% | | | | | |
| Fortive Corporation | | | | 27,148 | 1,922,621 |
| Ingersoll Rand Incorporated † | | | | 47,724 | 2,174,305 |
| ITT Incorporated | | | | 33,807 | 2,603,815 |
| Otis Worldwide Corporation | | | | 32,675 | 2,207,196 |
| SPX Corporation † | | | | 40,802 | 2,225,341 |
| | | | | | 11,133,278 |
| Trading companies & distributors: 2.72% | | | | | |
| Air Lease Corporation | | | | 63,494 | 2,820,403 |
| United Rentals Incorporated † | | | | 11,226 | 2,603,422 |
| | | | | | 5,423,825 |
| Information technology: 28.22% | | | | | |
| Electronic equipment, instruments & components: 1.80% | | | | | |
| Amphenol Corporation Class A | | | | 27,433 | 3,587,413 |
| IT services: 5.47% | | | | | |
| Fidelity National Information Services Incorporated | | | | 21,046 | 2,977,167 |
The accompanying notes are an integral part of these financial statements.
12 | Wells Fargo VT Opportunity Fund
Portfolio of investments—December 31, 2020
| | | | | Shares | Value |
| IT services (continued) | | | | | |
| Genpact Limited | | | | 61,963 | $ 2,562,790 |
| MasterCard Incorporated Class A | | | | 15,043 | 5,369,448 |
| | | | | | 10,909,405 |
| Semiconductors & semiconductor equipment: 4.59% | | | | | |
| Marvell Technology Group Limited | | | | 79,329 | 3,771,301 |
| Texas Instruments Incorporated | | | | 32,786 | 5,381,166 |
| | | | | | 9,152,467 |
| Software: 12.06% | | | | | |
| Fair Isaac Corporation † | | | | 5,591 | 2,857,225 |
| Palo Alto Networks Incorporated † | | | | 9,694 | 3,445,151 |
| Proofpoint Incorporated † | | | | 21,500 | 2,932,815 |
| RealPage Incorporated † | | | | 36,678 | 3,199,789 |
| Salesforce.com Incorporated † | | | | 25,272 | 5,623,778 |
| ServiceNow Incorporated † | | | | 3,913 | 2,153,833 |
| Workday Incorporated Class A † | | | | 15,998 | 3,833,281 |
| | | | | | 24,045,872 |
| Technology hardware, storage & peripherals: 4.30% | | | | | |
| Apple Incorporated | | | | 64,666 | 8,580,532 |
| Materials: 2.59% | | | | | |
| Chemicals: 1.84% | | | | | |
| The Sherwin-Williams Company | | | | 2,631 | 1,933,548 |
| Westlake Chemical Corporation | | | | 21,190 | 1,729,104 |
| | | | | | 3,662,652 |
| Metals & mining: 0.75% | | | | | |
| Steel Dynamics Incorporated | | | | 40,843 | 1,505,881 |
| Real estate: 6.46% | | | | | |
| Equity REITs: 6.46% | | | | | |
| American Tower Corporation | | | | 13,470 | 3,023,476 |
| Equinix Incorporated | | | | 4,190 | 2,992,414 |
| Sun Communities Incorporated | | | | 22,564 | 3,428,600 |
| VICI Properties Incorporated | | | | 135,044 | 3,443,622 |
| | | | | | 12,888,112 |
| Total Common stocks (Cost $119,001,384) | | | | | 197,055,725 |
| | | Yield | | | |
| Short-term investments: 1.09% | | | | | |
| Investment companies: 1.09% | | | | | |
| Wells Fargo Government Money Market Fund Select Class ♠∞ | | 0.03% | | 2,161,993 | 2,161,993 |
| Total Short-term investments (Cost $2,161,993) | | | | | 2,161,993 |
| Total investments in securities (Cost $121,163,377) | 99.91% | | | | 199,217,718 |
| Other assets and liabilities, net | 0.09 | | | | 186,039 |
| Total net assets | 100.00% | | | | $ 199,403,757 |
The accompanying notes are an integral part of these financial statements.
Wells Fargo VT Opportunity Fund | 13
Portfolio of investments—December 31, 2020
| † | Non-income-earning security |
| ♠ | The issuer of the security is an affiliated person of the Fund as defined in the Investment Company Act of 1940. |
| ∞ | The rate represents the 7-day annualized yield at period end. |
| Abbreviations: |
| ADR | American depositary receipt |
| REIT | Real estate investment trust |
Investments in affiliates
An affiliated investment is an investment in which the Fund owns at least 5% of the outstanding voting shares of the issuer or as a result of other relationships, such as the Fund and the issuer having the same investment manager. Transactions with issuers that were either affiliated persons of the Fund at the beginning of the period or the end of the period were as follows:
| | Value,
beginning of
period | Purchases | Sales
proceeds | Net
realized
gains
(losses) | Net
change in
unrealized
gains
(losses) | Value,
end of
period | % of
net
assets | Shares,
end
of period | Income
from
affiliated
securities |
| Short-term investments | | | | | | | | | |
| Investment companies | | | | | | | | | |
| Wells Fargo Government Money Market Fund Select Class | $1,838,788 | $38,439,636 | $(38,116,431) | $0 | $0 | $2,161,993 | 1.09% | 2,161,993 | $7,558 |
The accompanying notes are an integral part of these financial statements.
14 | Wells Fargo VT Opportunity Fund
Statement of assets and liabilities—December 31, 2020
| | |
| Assets | |
Investments in unaffiliated securities, at value (cost $119,001,384)
| $ 197,055,725 |
Investments in affiliated securites, at value (cost $2,161,993)
| 2,161,993 |
Receivable for investments sold
| 415,675 |
Receivable for dividends
| 254,085 |
Receivable for Fund shares sold
| 1,087 |
Prepaid expenses and other assets
| 2,144 |
Total assets
| 199,890,709 |
| Liabilities | |
Payable for investments purchased
| 230,757 |
Management fee payable
| 108,530 |
Payable for Fund shares redeemed
| 90,908 |
Distribution fee payable
| 38,155 |
Administration fees payable
| 14,553 |
Trustees’ fees and expenses payable
| 3,796 |
Accrued expenses and other liabilities
| 253 |
Total liabilities
| 486,952 |
Total net assets
| $199,403,757 |
| Net assets consist of | |
Paid-in capital
| $ 111,452,141 |
Total distributable earnings
| 87,951,616 |
Total net assets
| $199,403,757 |
| Computation of net asset value per share | |
Net assets – Class 1
| $ 32,065,941 |
Shares outstanding – Class 11
| 1,087,825 |
Net asset value per share – Class 1
| $29.48 |
Net assets – Class 2
| $ 167,337,816 |
Shares outstanding – Class 21
| 5,647,513 |
Net asset value per share – Class 2
| $29.63 |
| 1 | The Fund has an unlimited number of authorized shares |
The accompanying notes are an integral part of these financial statements.
Wells Fargo VT Opportunity Fund | 15
Statement of operations—year ended December 31, 2020
| | |
| Investment income | |
Dividends (net of foreign withholdings taxes of $21,415)
| $ 1,860,416 |
Income from affiliated securities
| 7,558 |
Total investment income
| 1,867,974 |
| Expenses | |
Management fee
| 1,230,264 |
| Administration fees | |
Class 1
| 22,723 |
Class 2
| 117,878 |
| Distribution fee | |
Class 2
| 367,721 |
Custody and accounting fees
| 18,613 |
Professional fees
| 48,348 |
Shareholder report expenses
| 36,627 |
Trustees’ fees and expenses
| 19,862 |
Other fees and expenses
| 14,379 |
Total expenses
| 1,876,415 |
| Less: Fee waivers and/or expense reimbursements | |
Fund-level
| (189,905) |
Net expenses
| 1,686,510 |
Net investment income
| 181,464 |
| Realized and unrealized gains (losses) on investments | |
Net realized gains on investments
| 9,938,608 |
Net change in unrealized gains (losses) on investments
| 24,029,460 |
Net realized and unrealized gains (losses) on investments
| 33,968,068 |
Net increase in net assets resulting from operations
| $34,149,532 |
The accompanying notes are an integral part of these financial statements.
16 | Wells Fargo VT Opportunity Fund
Statement of changes in net assets
| | |
| | Year ended
December 31, 2020 | Year ended
December 31, 2019 |
| Operations | | | | |
Net investment income
| | $ 181,464 | | $ 836,348 |
Net realized gains on investments
| | 9,938,608 | | 13,216,674 |
Net change in unrealized gains (losses) on investments
| | 24,029,460 | | 34,750,912 |
Net increase in net assets resulting from operations
| | 34,149,532 | | 48,803,934 |
| Distributions to shareholders from | | | | |
| Net investment income and net realized gains | | | | |
Class 1
| | (2,328,698) | | (3,501,610) |
Class 2
| | (11,686,840) | | (17,537,462) |
Total distributions to shareholders
| | (14,015,538) | | (21,039,072) |
| Capital share transactions | Shares | | Shares | |
| Proceeds from shares sold | | | | |
Class 1
| 21,174 | 498,604 | 16,098 | 390,406 |
Class 2
| 123,816 | 3,170,894 | 117,672 | 3,032,567 |
| | | 3,669,498 | | 3,422,973 |
| Reinvestment of distributions | | | | |
Class 1
| 98,715 | 2,328,698 | 141,137 | 3,501,610 |
Class 2
| 492,285 | 11,686,840 | 702,904 | 17,537,462 |
| | | 14,015,538 | | 21,039,072 |
| Payment for shares redeemed | | | | |
Class 1
| (192,184) | (4,908,447) | (190,606) | (4,880,882) |
Class 2
| (899,151) | (22,533,873) | (797,590) | (20,455,623) |
| | | (27,442,320) | | (25,336,505) |
Net decrease in net assets resulting from capital share transactions
| | (9,757,284) | | (874,460) |
Total increase in net assets
| | 10,376,710 | | 26,890,402 |
| Net assets | | | | |
Beginning of period
| | 189,027,047 | | 162,136,645 |
End of period
| | $199,403,757 | | $189,027,047 |
The accompanying notes are an integral part of these financial statements.
Wells Fargo VT Opportunity Fund | 17
Financial highlights
(For a share outstanding throughout each period)
| | Year ended December 31 |
| Class 1 | 2020 | 2019 | 2018 | 2017 | 2016 |
Net asset value, beginning of period
| $26.56 | $22.76 | $27.05 | $24.60 | $25.00 |
Net investment income
| 0.09 | 0.17 | 0.15 | 0.13 | 0.22 |
Net realized and unrealized gains (losses) on investments
| 5.03 | 6.84 | (1.69) | 4.77 | 2.59 |
Total from investment operations
| 5.12 | 7.01 | (1.54) | 4.90 | 2.81 |
| Distributions to shareholders from | | | | | |
Net investment income
| (0.19) | (0.15) | (0.12) | (0.25) | (0.60) |
Net realized gains
| (2.01) | (3.06) | (2.63) | (2.20) | (2.61) |
Total distributions to shareholders
| (2.20) | (3.21) | (2.75) | (2.45) | (3.21) |
Net asset value, end of period
| $29.48 | $26.56 | $22.76 | $27.05 | $24.60 |
Total return1
| 21.32% | 31.81% | (6.93)% | 20.72% | 12.52% |
| Ratios to average net assets (annualized) | | | | | |
Gross expenses
| 0.86% | 0.85% | 0.84% | 0.86% | 0.85% |
Net expenses
| 0.75% | 0.75% | 0.75% | 0.75% | 0.75% |
Net investment income
| 0.31% | 0.67% | 0.52% | 0.43% | 0.65% |
| Supplemental data | | | | | |
Portfolio turnover rate
| 42% | 25% | 31% | 36% | 47% |
Net assets, end of period (000s omitted)
| $32,066 | $30,811 | $27,165 | $33,843 | $33,035 |
| 1 | Performance figures of the Fund do not reflect fees and expenses charged pursuant to the terms of variable life insurance policies and variable annuity contracts. |
The accompanying notes are an integral part of these financial statements.
18 | Wells Fargo VT Opportunity Fund
Financial highlights
(For a share outstanding throughout each period)
| | Year ended December 31 |
| Class 2 | 2020 | 2019 | 2018 | 2017 | 2016 |
Net asset value, beginning of period
| $26.68 | $22.85 | $27.14 | $24.67 | $25.05 |
Net investment income
| 0.03 | 0.11 | 0.08 | 0.06 | 0.13 |
Net realized and unrealized gains (losses) on investments
| 5.05 | 6.86 | (1.69) | 4.79 | 2.63 |
Total from investment operations
| 5.08 | 6.97 | (1.61) | 4.85 | 2.76 |
| Distributions to shareholders from | | | | | |
Net investment income
| (0.12) | (0.08) | (0.05) | (0.18) | (0.53) |
Net realized gains
| (2.01) | (3.06) | (2.63) | (2.20) | (2.61) |
Total distributions to shareholders
| (2.13) | (3.14) | (2.68) | (2.38) | (3.14) |
Net asset value, end of period
| $29.63 | $26.68 | $22.85 | $27.14 | $24.67 |
Total return1
| 21.00% | 31.46% | (7.15)% | 20.44% | 12.23% |
| Ratios to average net assets (annualized) | | | | | |
Gross expenses
| 1.11% | 1.10% | 1.09% | 1.11% | 1.10% |
Net expenses
| 1.00% | 1.00% | 1.00% | 1.00% | 1.00% |
Net investment income
| 0.06% | 0.42% | 0.27% | 0.18% | 0.39% |
| Supplemental data | | | | | |
Portfolio turnover rate
| 42% | 25% | 31% | 36% | 47% |
Net assets, end of period (000s omitted)
| $167,338 | $158,216 | $134,972 | $165,992 | $158,783 |
| 1 | Performance figures of the Fund do not reflect fees and expenses charged pursuant to the terms of variable life insurance policies and variable annuity contracts. |
The accompanying notes are an integral part of these financial statements.
Wells Fargo VT Opportunity Fund | 19
Notes to financial statements
1. ORGANIZATION
Wells Fargo Variable Trust (the “Trust”), a Delaware statutory trust organized on March 10, 1999, is an open-end management investment company registered under the Investment Company Act of 1940, as amended (the “1940 Act”). As an investment company, the Trust follows the accounting and reporting guidance in Financial Accounting Standards Board (“FASB”) Accounting Standards Codification Topic 946, Financial Services – Investment Companies. These financial statements report on the Wells Fargo VT Opportunity Fund (the “Fund”) which is a diversified series of the Trust. The Trust offers shares of the Fund to separate accounts of various life insurance companies as funding vehicles for certain variable annuity contracts and variable life insurance policies.
2. SIGNIFICANT ACCOUNTING POLICIES
The following significant accounting policies, which are consistently followed in the preparation of the financial statements of the Fund, are in conformity with U.S. generally accepted accounting principles which require management to make estimates and assumptions that affect the reported amounts of assets and liabilities, disclosure of contingent assets and liabilities at the date of the financial statements, and the reported amounts of income and expenses during the reporting period. Actual results could differ from those estimates.
Securities valuation
All investments are valued each business day as of the close of regular trading on the New York Stock Exchange (generally 4 p.m. Eastern Time), although the Fund may deviate from this calculation time under unusual or unexpected circumstances.
Equity securities that are listed on a foreign or domestic exchange or market are valued at the official closing price or, if none, the last sales price. If no sale occurs on the principal exchange or market that day, a fair value price will be determined in accordance with the Fund’s Valuation Procedures.
The values of securities denominated in foreign currencies are translated into U.S. dollars at rates provided by an independent foreign currency pricing source at a time each business day specified by the Wells Fargo Asset Management Pricing Committee at Wells Fargo Funds Management, LLC ("Funds Management").
Many securities markets and exchanges outside the U.S. close prior to the close of the New York Stock Exchange and therefore may not fully reflect trading or events that occur after the close of the principal exchange in which the foreign securities are traded, but before the close of the New York Stock Exchange. If such trading or events are expected to materially affect the value of such securities, then fair value pricing procedures approved by the Board of Trustees of the Fund are applied. These procedures take into account multiple factors including movements in U.S. securities markets after foreign exchanges close. Foreign securities that are fair valued under these procedures are categorized as Level 2 and the application of these procedures may result in transfers between Level 1 and Level 2. Depending on market activity, such fair valuations may be frequent. Such fair value pricing may result in net asset values that are higher or lower than net asset values based on the last reported sales price or latest quoted bid price. On December 31, 2020, such fair value pricing was used in pricing certain foreign securities.
Investments in registered open-end investment companies are valued at net asset value. Interests in non-registered investment companies that are redeemable at net asset value are fair valued normally at net asset value.
Investments which are not valued using any of the methods discussed above are valued at their fair value, as determined in good faith by the Board of Trustees of the Fund. The Board of Trustees has established a Valuation Committee comprised of the Trustees and has delegated to it the authority to take any actions regarding the valuation of portfolio securities that the Valuation Committee deems necessary or appropriate, including determining the fair value of portfolio securities, unless the determination has been delegated to the Wells Fargo Asset Management Pricing Committee. The Board of Trustees retains the authority to make or ratify any valuation decisions or approve any changes to the Valuation Procedures as it deems appropriate. On a quarterly basis, the Board of Trustees receives reports on any valuation actions taken by the Valuation Committee or the Wells Fargo Asset Management Pricing Committee which may include items for ratification.
Foreign currency translation
The accounting records of the Fund are maintained in U.S. dollars. The values of other assets and liabilities denominated in foreign currencies are translated into U.S. dollars at rates provided by an independent foreign currency pricing source at a time each business day specified by the Wells Fargo Asset Management Pricing Committee. Purchases and sales of securities, and income and expenses are converted at the rate of exchange on the respective dates of such transactions. Net realized foreign exchange gains or losses arise from sales of foreign currencies, currency gains or losses realized between the trade and settlement dates on securities transactions, and the difference between the amounts of dividends, interest and foreign
20 | Wells Fargo VT Opportunity Fund
Notes to financial statements
withholding taxes recorded and the U.S. dollar equivalent of the amounts actually paid or received. Net unrealized foreign exchange gains and losses arise from changes in the fair value of assets and liabilities other than investments in securities resulting from changes in exchange rates. The changes in net assets arising from changes in exchange rates of securities and the changes in net assets resulting from changes in market prices of securities are not separately presented. Such changes are included in net realized and unrealized gains or losses from investments.
Securities lending
The Fund may lend its securities from time to time in order to earn additional income in the form of fees or interest on securities received as collateral or the investment of any cash received as collateral. When securities are on loan, the Fund receives interest or dividends on those securities. Cash collateral received in connection with its securities lending transactions is invested in Securities Lending Cash Investments, LLC (the “Securities Lending Fund”). Investments in Securities Lending Fund are valued at the evaluated bid price provided by an independent pricing service. Income earned from investment in the Securities Lending Fund (net of fees and rebates), if any, is included in income from affiliated securities on the Statement of Operations.
In a securities lending transaction, the net asset value of the Fund is affected by an increase or decrease in the value of the securities loaned and by an increase or decrease in the value of the instrument in which collateral is invested. The amount of securities lending activity undertaken by the Fund fluctuates from time to time. The Fund has the right under the lending agreement to recover the securities from the borrower on demand. In the event of default or bankruptcy by the borrower, the Fund may be prevented from recovering the loaned securities or gaining access to the collateral or may experience delays or costs in doing so. In such an event, the terms of the agreement allow the unaffiliated securities lending agent to use the collateral to purchase replacement securities on behalf of the Fund or pay the Fund the market value of the loaned securities. The Fund bears the risk of loss with respect to depreciation of its investment of the cash collateral.
Security transactions and income recognition
Securities transactions are recorded on a trade date basis. Realized gains or losses are recorded on the basis of identified cost.
Dividend income is recognized on the ex-dividend date, except for certain dividends from foreign securities, which are recorded as soon as the custodian verifies the ex-dividend date. Dividend income from foreign securities is recorded net of foreign taxes withheld where recovery of such taxes is not assured.
Distributions to shareholders
Distributions to shareholders from net investment income and any net realized gains are recorded on the ex-dividend date and paid at least annually. Such distributions are determined in accordance with income tax regulations and may differ from U.S. generally accepted accounting principles. Dividend sources are estimated at the time of declaration. The tax character of distributions is determined as of the Fund’s fiscal year end. Therefore, a portion of the Fund’s distributions made prior to the Fund’s fiscal year end may be categorized as a tax return of capital at year end.
Federal and other taxes
The Fund intends to continue to qualify as a regulated investment company by distributing substantially all of its investment company taxable income and any net realized capital gains (after reduction for capital loss carryforwards) sufficient to relieve it from all, or substantially all, federal income taxes. Accordingly, no provision for federal income taxes was required.
The Fund’s income and federal excise tax returns and all financial records supporting those returns for the prior three fiscal years are subject to examination by the federal and Delaware revenue authorities. Management has analyzed the Fund’s tax positions taken on federal, state, and foreign tax returns for all open tax years and does not believe that there are any uncertain tax positions that require recognition of a tax liability.
As of December 31, 2020, the aggregate cost of all investments for federal income tax purposes was $121,963,158 and the unrealized gains (losses) consisted of:
| Gross unrealized gains | $78,556,020 |
| Gross unrealized losses | (1,301,460) |
| Net unrealized gains | $77,254,560 |
Wells Fargo VT Opportunity Fund | 21
Notes to financial statements
Class allocations
The separate classes of shares offered by the Fund differ principally in distribution fees. Class specific expenses are charged directly to that share class. Investment income, common fund-level expenses, and realized and unrealized gains (losses) on investments are allocated daily to each class of shares based on the relative proportion of net assets of each class.
3. FAIR VALUATION MEASUREMENTS
Fair value measurements of investments are determined within a framework that has established a fair value hierarchy based upon the various data inputs utilized in determining the value of the Fund’s investments. The three-level hierarchy gives the highest priority to unadjusted quoted prices in active markets for identical assets or liabilities (Level 1) and the lowest priority to unobservable inputs (Level 3). The Fund’s investments are classified within the fair value hierarchy based on the lowest level of input that is significant to the fair value measurement. The inputs are summarized into three broad levels as follows:
| ■ | Level 1 – quoted prices in active markets for identical securities |
| ■ | Level 2 – other significant observable inputs (including quoted prices for similar securities, interest rates, prepayment speeds, credit risk, etc.) |
| ■ | Level 3 – significant unobservable inputs (including the Fund’s own assumptions in determining the fair value of investments) |
The inputs or methodologies used for valuing investments in securities are not necessarily an indication of the risk associated with investing in those securities.
The following is a summary of the inputs used in valuing the Fund’s assets and liabilities as of December 31, 2020:
| | Quoted prices
(Level 1) | Other significant
observable inputs
(Level 2) | Significant
unobservable inputs
(Level 3) | Total |
| Assets | | | | |
| Investments in: | | | | |
| Common stocks | | | | |
| Communication services | $ 17,077,210 | $ 0 | $0 | $ 17,077,210 |
| Consumer discretionary | 21,096,697 | 0 | 0 | 21,096,697 |
| Consumer staples | 5,149,599 | 0 | 0 | 5,149,599 |
| Financials | 15,469,697 | 0 | 0 | 15,469,697 |
| Health care | 33,205,676 | 0 | 0 | 33,205,676 |
| Industrials | 28,083,413 | 2,641,099 | 0 | 30,724,512 |
| Information technology | 56,275,689 | 0 | 0 | 56,275,689 |
| Materials | 5,168,533 | 0 | 0 | 5,168,533 |
| Real estate | 12,888,112 | 0 | 0 | 12,888,112 |
| Short-term investments | | | | |
| Investment companies | 2,161,993 | 0 | 0 | 2,161,993 |
| Total assets | $196,576,619 | $2,641,099 | $0 | $199,217,718 |
Additional sector, industry or geographic detail is included in the Portfolio of Investments.
For the year ended December 31, 2020, the Fund did not have any transfers into/out of Level 3.
4. TRANSACTIONS WITH AFFILIATES
Management fee
Funds Management, an indirect wholly owned subsidiary of Wells Fargo & Company (“Wells Fargo”), is the manager of the Fund and provides advisory and fund-level administrative services under an investment management agreement. Under the investment management agreement, Funds Management is responsible for, among other services, implementing the investment objectives and strategies of the Fund, supervising the subadviser and providing fund-level administrative services in connection with the Fund’s operations. As compensation for its services under the investment management agreement, Funds Management is entitled to receive a management fee at the following annual rate based on the Fund’s average daily net assets:
22 | Wells Fargo VT Opportunity Fund
Notes to financial statements
| Average daily net assets | Management fee |
| First $500 million | 0.700% |
| Next $500 million | 0.675 |
| Next $1 billion | 0.650 |
| Next $2 billion | 0.625 |
| Next $1 billion | 0.600 |
| Next $5 billion | 0.590 |
| Over $10 billion | 0.580 |
For the year ended December 31, 2020, the management fee was equivalent to an annual rate of 0.70% of the Fund’s average daily net assets.
Funds Management has retained the services of a subadviser to provide daily portfolio management to the Fund. The fee for subadvisory services is borne by Funds Management. Wells Capital Management, Incorporated, an affiliate of Funds Management and an indirect wholly owned subsidiary of Wells Fargo, is the subadviser to the Fund and is entitled to receive a fee from Funds Management at an annual rate starting at 0.45% and declining to 0.30% as the average daily net assets of the Fund increase.
Administration fees
Under a class-level administration agreement, Funds Management provides class-level administrative services to the Fund, which includes paying fees and expenses for services provided by the transfer agent, sub-transfer agents, omnibus account services and record-keepers. As compensation for its services under the class-level administration agreement, Funds Management receives an annual fee of 0.08% which is calculated based on the average daily net assets of each class.
Waivers and/or expense reimbursements
Funds Management has contractually waived and/or reimbursed management and administration fees to the extent necessary to maintain certain net operating expense ratios for the Fund. When each class of the Fund has exceeded its expense cap, Funds Management has waived fees and/or reimbursed expenses from fund-level expenses on a proportionate basis and then from class specific expenses. When only certain classes exceed their expense caps, waivers and/or reimbursements are applied against class specific expenses before fund-level expenses. Funds Management has committed through April 30, 2021 to waive fees and/or reimburse expenses to the extent necessary to cap the Fund’s expenses at 0.75% for Class 1 shares and 1.00% for Class 2 shares. Prior to or after the commitment expiration date, the cap may be increased or the commitment to maintain the cap may be terminated only with the approval of the Board of Trustees.
Distribution fee
The Trust has adopted a distribution plan for Class 2 shares of the Fund pursuant to Rule 12b-1 under the 1940 Act. A distribution fee is charged to Class 2 shares and paid to Wells Fargo Funds Distributor, LLC, the principal underwriter, at an annual rate of 0.25% of the average daily net assets of Class 2 shares.
Interfund transactions
The Fund may purchase or sell portfolio investment securities to certain other Wells Fargo affiliates pursuant to Rule 17a-7 under the 1940 Act and under procedures adopted by the Board of Trustees. The procedures have been designed to ensure that these interfund transactions, which do not incur broker commissions, are effected at current market prices.
5. INVESTMENT PORTFOLIO TRANSACTIONS
Purchases and sales of investments, excluding U.S. government obligations (if any) and short-term securities, for the year ended December 31, 2020 were $73,138,680 and $97,226,278, respectively.
6. BANK BORROWINGS
The Trust, Wells Fargo Master Trust and Wells Fargo Funds Trust (excluding the money market funds) are parties to a $350,000,000 revolving credit agreement whereby the Fund is permitted to use bank borrowings for temporary or emergency purposes, such as to fund shareholder redemption requests. Interest under the credit agreement is charged to the Fund based on a borrowing rate equal to the higher of the Federal Funds rate in effect on that day plus 1.25% or the overnight LIBOR rate in effect on that day plus 1.25%. In addition, an annual commitment fee equal to 0.25% of the unused balance is allocated to each participating fund.
Wells Fargo VT Opportunity Fund | 23
Notes to financial statements
For the year ended December 31, 2020, there were no borrowings by the Fund under the agreement.
7. DISTRIBUTIONS TO SHAREHOLDERS
The tax character of distributions paid during the years ended December 31, 2020 and December 31, 2019 were as follows:
| | Year ended December 31 |
| | 2020 | 2019 |
| Ordinary income | $ 3,149,628 | $ 590,956 |
| Long-term capital gain | 10,865,910 | 20,448,116 |
As of December 31, 2020, the components of distributable earnings on a tax basis were as follows:
Undistributed
ordinary
income | Undistributed
long-term
gain | Unrealized
gains |
| $155,608 | $10,546,453 | $77,254,560 |
8. CONCENTRATION RISK
Concentration risk results from exposure to a limited number of sectors. As of the end of the period, the Fund concentrated its portfolio in investments related to the information technology sector. A fund that invests a substantial portion of its assets in any sector may be more affected by changes in that sector than would be a fund whose investments are not heavily weighted in any sector.
9. INDEMNIFICATION
Under the Fund's organizational documents, the officers and Trustees have been granted certain indemnification rights against certain liabilities that may arise out of performance of their duties to the Fund. The Fund has entered into a separate agreement with each Trustee that converts indemnification rights currently existing under the Fund’s organizational documents into contractual rights that cannot be changed in the future without the consent of the Trustee. Additionally, in the normal course of business, the Fund may enter into contracts with service providers that contain a variety of indemnification clauses. The Fund’s maximum exposure under these arrangements is dependent on future claims that may be made against the Fund and, therefore, cannot be estimated.
10. NEW ACCOUNTING PRONOUNCEMENT
In August 2018, FASB issued Accounting Standards Update (“ASU”) No. 2018-13, Fair Value Measurement (Topic 820) Disclosure Framework - Changes to the Disclosure Requirements for Fair Value Measurement. ASU 2018-13 updates the disclosure requirements on fair value measurements in Topic 820, Fair Value Measurements. The amendments are effective for fiscal years, and interim periods within those fiscal years, beginning after December 15, 2019. Management has adopted this guidance which did not have a material impact on the financial statements.
11. SUBSEQUENT EVENT
On February 23, 2021, Wells Fargo announced that it has entered into a definitive agreement to sell Wells Fargo Asset Management (“WFAM”) to GTCR LLC and Reverence Capital Partners, L.P. WFAM is the trade name used by the asset management businesses of Wells Fargo and includes Wells Fargo Funds Management, LLC, the investment manager to the Fund, Wells Capital Management Incorporated and Wells Fargo Asset Management (International) Limited, both registered investment advisers providing sub-advisory services to certain funds, and Wells Fargo Funds Distributor, LLC, the Fund’s principal underwriter. As part of the transaction, Wells Fargo will own a 9.9% equity interest and will continue to serve as an important client and distribution partner.
Consummation of the transaction will result in the automatic termination of the Fund’s investment management agreement and sub-advisory agreement(s). The Fund’s Board of Trustees will be asked to approve new investment management arrangements with the new company. If approved by the Board, the new investment management arrangements with the new company will be presented to the shareholders of the Fund for approval, and, if approved by shareholders, would take effect upon the closing of the transaction. The transaction is expected to close in the second half of 2021, subject to customary closing conditions.
24 | Wells Fargo VT Opportunity Fund
Notes to financial statements
12. CORONAVIRUS (COVID-19) PANDEMIC
On March 11, 2020, the World Health Organization announced that it had made the assessment that coronavirus disease 2019 (“COVID-19”) is a pandemic. The impacts of COVID-19 are affecting the entire global economy, individual companies and investment products, and the market in general. There is significant uncertainty around the extent and duration of business disruptions related to COVID-19 and the impacts may be short term or may last for an extended period of time. The risk of further spreading of COVID-19 has led to significant uncertainty and volatility in the financial markets.
Wells Fargo VT Opportunity Fund | 25
Report of independent registered public accounting firm
To the Shareholders of the Fund and Board of Trustees
Wells Fargo Variable Trust:
Opinion on the Financial Statements
We have audited the accompanying statement of assets and liabilities of Wells Fargo VT Opportunity Fund (the Fund), one of the funds constituting Wells Fargo Variable Trust, including the portfolio of investments, as of December 31, 2020, the related statement of operations for the year then ended, the statements of changes in net assets for each of the years in the two-year period then ended, and the related notes (collectively, the financial statements) and the financial highlights for each of the years in the five-year period then ended. In our opinion, the financial statements and financial highlights present fairly, in all material respects, the financial position of the Fund as of December 31, 2020, the results of its operations for the year then ended, the changes in its net assets for each of the years in the two-year period then ended, and the financial highlights for each of the years in the five-year period then ended, in conformity with U.S. generally accepted accounting principles.
Basis for Opinion
These financial statements and financial highlights are the responsibility of the Fund’s management. Our responsibility is to express an opinion on these financial statements and financial highlights based on our audits. We are a public accounting firm registered with the Public Company Accounting Oversight Board (United States) (PCAOB) and are required to be independent with respect to the Fund in accordance with the U.S. federal securities laws and the applicable rules and regulations of the Securities and Exchange Commission and the PCAOB.
We conducted our audits in accordance with the standards of the PCAOB. Those standards require that we plan and perform the audit to obtain reasonable assurance about whether the financial statements and financial highlights are free of material misstatement, whether due to error or fraud. Our audits included performing procedures to assess the risks of material misstatement of the financial statements and financial highlights, whether due to error or fraud, and performing procedures that respond to those risks. Such procedures included examining, on a test basis, evidence regarding the amounts and disclosures in the financial statements and financial highlights. Such procedures also included confirmation of securities owned as of December 31, 2020, by correspondence with the custodian, transfer agent and brokers, or by other appropriate auditing procedures. Our audits also included evaluating the accounting principles used and significant estimates made by management, as well as evaluating the overall presentation of the financial statements and financial highlights. We believe that our audits provide a reasonable basis for our opinion.

We have not been able to determine the specific year that we began serving as the auditor of one or more Wells Fargo Funds investment companies; however we are aware that we have served as the auditor of one or more Wells Fargo Funds investment companies since at least 1955.
Boston, Massachusetts
February 25, 2021
26 | Wells Fargo VT Opportunity Fund
Other information (unaudited)
TAX INFORMATION
For corporate shareholders, pursuant to Section 854 of the Internal Revenue Code, 53.88% of ordinary income dividends qualify for the corporate dividends-received deduction for the fiscal year ended December 31, 2020.
Pursuant to Section 852 of the Internal Revenue Code, $10,865,910 was designated as a 20% rate gain distribution for the fiscal year ended December 31, 2020
PROXY VOTING INFORMATION
A description of the policies and procedures used to determine how to vote proxies relating to portfolio securities is available without charge, upon request, by calling 1-800-260-5969, visiting our website at wfam.com, or visiting the SEC website at sec.gov. Information regarding how the proxies related to portfolio securities were voted during the most recent 12-month period ended June 30 is available on the website at wfam.com or by visiting the SEC website at sec.gov.
QUARTERLY PORTFOLIO HOLDINGS INFORMATION
The Fund files its complete schedule of portfolio holdings with the SEC for the first and third quarters of each fiscal year as an exhibit to its reports on Form N-PORT. Shareholders may view the filed Form N-PORT by visiting the SEC website at sec.gov.
Wells Fargo VT Opportunity Fund | 27
Other information (unaudited)
BOARD OF TRUSTEES AND OFFICERS
Each of the Trustees and Officers1 listed in the table below acts in identical capacities for each fund in the Wells Fargo family of funds, which consists of 144 mutual funds comprising the Wells Fargo Funds Trust, Wells Fargo Variable Trust, Wells Fargo Master Trust and four closed-end funds (collectively the “Fund Complex”). This table should be read in conjunction with the Prospectus and the Statement of Additional Information2. The mailing address of each Trustee and Officer is 525 Market Street, 12th Floor, San Francisco, CA 94105. Each Trustee and Officer serves an indefinite term, however, each Trustee serves such term until reaching the mandatory retirement age established by the Trustees.
Independent Trustees
Name and
year of birth | Position held and
length of service* | Principal occupations during past five years or longer | Current other
public company or
investment
company
directorships |
William R. Ebsworth
(Born 1957) | Trustee,
since 2015 | Retired. From 1984 to 2013, equities analyst, portfolio manager, research director and chief investment officer at Fidelity Management and Research Company in Boston, Tokyo, and Hong Kong, and retired in 2013 as Chief Investment Officer of Fidelity Strategic Advisers, Inc. where he led a team of investment professionals managing client assets. Prior thereto, Board member of Hong Kong Securities Clearing Co., Hong Kong Options Clearing Corp., the Thailand International Fund, Ltd., Fidelity Investments Life Insurance Company, and Empire Fidelity Investments Life Insurance Company. Audit Committee Chair and Investment Committee Chair of the Vincent Memorial Hospital Endowment (non-profit organization). Mr. Ebsworth is a CFA® charterholder. | N/A |
Jane A. Freeman
(Born 1953) | Trustee,
since 2015;
Chair Liaison,
since 2018 | Retired. From 2012 to 2014 and 1999 to 2008, Chief Financial Officer of Scientific Learning Corporation. From 2008 to 2012, Ms. Freeman provided consulting services related to strategic business projects. Prior to 1999, Portfolio Manager at Rockefeller & Co. and Scudder, Stevens & Clark. Board member of the Harding Loevner Funds from 1996 to 2014, serving as both Lead Independent Director and chair of the Audit Committee. Board member of the Russell Exchange Traded Funds Trust from 2011 to 2012 and the chair of the Audit Committee. Ms. Freeman is also an inactive Chartered Financial Analyst. | N/A |
Isaiah Harris, Jr.
(Born 1952) | Trustee,
since 2009; Audit
Committee
Chair,
since 2019 | Retired. Chairman of the Board of CIGNA Corporation since 2009, and Director since 2005. From 2003 to 2011, Director of Deluxe Corporation. Prior thereto, President and CEO of BellSouth Advertising and Publishing Corp. from 2005 to 2007, President and CEO of BellSouth Enterprises from 2004 to 2005 and President of BellSouth Consumer Services from 2000 to 2003. Emeritus member of the Iowa State University Foundation Board of Governors. Emeritus Member of the Advisory Board of Iowa State University School of Business. Advisory Board Member, Palm Harbor Academy (private school). Mr. Harris is a certified public accountant (inactive status). | CIGNA Corporation |
Judith M. Johnson
(Born 1949) | Trustee,
since 2008 | Retired. Prior thereto, Chief Executive Officer and Chief Investment Officer of Minneapolis Employees Retirement Fund from 1996 to 2008. Ms. Johnson is an attorney, certified public accountant and a certified managerial accountant. | N/A |
David F. Larcker
(Born 1950) | Trustee,
since 2009 | James Irvin Miller Professor of Accounting at the Graduate School of Business (Emeritus), Stanford University, Director of the Corporate Governance Research Initiative and Senior Faculty of The Rock Center for Corporate Governance since 2006. From 2005 to 2008, Professor of Accounting at the Graduate School of Business, Stanford University. Prior thereto, Ernst & Young Professor of Accounting at The Wharton School, University of Pennsylvania from 1985 to 2005. | N/A |
28 | Wells Fargo VT Opportunity Fund
Other information (unaudited)
Name and
year of birth | Position held and
length of service* | Principal occupations during past five years or longer | Current other
public company or
investment
company
directorships |
Olivia S. Mitchell
(Born 1953) | Trustee,
since 2006;
Nominating and
Governance
Committee Chair,
since 2018 | International Foundation of Employee Benefit Plans Professor, Wharton School of the University of Pennsylvania since 1993. Director of Wharton’s Pension Research Council and Boettner Center on Pensions & Retirement Research, and Research Associate at the National Bureau of Economic Research. Previously, Cornell University Professor from 1978 to 1993. | N/A |
Timothy J. Penny
(Born 1951) | Trustee,
since 1996;
Chair,
since 2018 | President and Chief Executive Officer of Southern Minnesota Initiative Foundation, a non-profit organization, since 2007. Member of the Board of Trustees of NorthStar Education Finance, Inc., a non-profit organization, since 2007. | N/A |
James G. Polisson
(Born 1959) | Trustee,
since 2018 | Retired. Chief Marketing Officer, Source (ETF) UK Services, Ltd, from 2015 to 2017. From 2012 to 2015, Principal of The Polisson Group, LLC, a management consulting, corporate advisory and principal investing company. Chief Executive Officer and Managing Director at Russell Investments, Global Exchange Traded Funds from 2010 to 2012. Managing Director of Barclays Global Investors from 1998 to 2010 and Global Chief Marketing Officer for iShares and Barclays Global Investors from 2000 to 2010. Trustee of the San Francisco Mechanics’ Institute, a non-profit organization, from 2013 to 2015. Board member of the Russell Exchange Traded Fund Trust from 2011 to 2012. Director of Barclays Global Investors Holdings Deutschland GmbH from 2006 to 2009. Mr. Polisson is an attorney and has a retired status with the Massachusetts and District of Columbia Bar Associations. | N/A |
Pamela Wheelock
(Born 1959) | Trustee,
since January
2020; previously
Trustee from
January 2018 to
July 2019 | Board member of the Destination Medical Center Economic Development Agency, Rochester, Minnesota since 2019. Interim President of the McKnight Foundation from January to September 2020. Acting Commissioner, Minnesota Department of Human Services, July 2019 through September 2019. Human Services Manager (part-time), Minnesota Department of Human Services, October 2019 through December 2019. Chief Operating Officer, Twin Cities Habitat for Humanity from 2017 to 2019. Vice President of University Services, University of Minnesota from 2012 to 2016. Prior thereto, on the Board of Directors, Governance Committee and Finance Committee for the Minnesota Philanthropy Partners (Saint Paul Foundation) from 2012 to 2018, Interim Chief Executive Officer of Blue Cross Blue Shield of Minnesota from 2011 to 2012, Chairman of the Board from 2009 to 2012 and Board Director from 2003 to 2015. Vice President, Leadership and Community Engagement, Bush Foundation, Saint Paul, Minnesota (a private foundation) from 2009 to 2011. Executive Vice President and Chief Financial Officer, Minnesota Sports and Entertainment from 2004 to 2009 and Senior Vice President from 2002 to 2004. Executive Vice President of the Minnesota Wild Foundation from 2004 to 2008. Commissioner of Finance, State of Minnesota, from 1999 to 2002. Currently Board Chair of the Minnesota Wild Foundation since 2010. | N/A |
* Length of service dates reflect the Trustee’s commencement of service with the Trust’s predecessor entities, where applicable.
Wells Fargo VT Opportunity Fund | 29
Other information (unaudited)
Officers
Name and
year of birth | Position held and
length of service | Principal occupations during past five years or longer |
Andrew Owen
(Born 1960) | President,
since 2017 | Executive Vice President of Wells Fargo & Company and Head of Affiliated Managers, Wells Fargo Asset Management, since 2014. In addition, Mr. Owen is currently President, Chief Executive Officer and Director of Wells Fargo Funds Management, LLC since 2017. Prior thereto, Executive Vice President responsible for marketing, investments and product development for Wells Fargo Funds Management, LLC, from 2009 to 2014. |
Jeremy DePalma1
(Born 1974) | Treasurer,
since 2012 | Senior Vice President of Wells Fargo Funds Management, LLC since 2009. Senior Vice President of Evergreen Investment Management Company, LLC from 2008 to 2010 and head of the Fund Reporting and Control Team within Fund Administration from 2005 to 2010. |
Michelle Rhee
(Born 1966) | Chief Legal Officer,
since 2019 | Secretary of Wells Fargo Funds Management, LLC and Chief Legal Counsel of Wells Fargo Asset Management since 2018. Deputy General Counsel of Wells Fargo Bank, N.A. since 2020 and Assistant General Counsel of Wells Fargo Bank, N.A. from 2018 to 2020. Associate General Counsel and Managing Director of Bank of America Corporation from 2004 to 2018. |
Catherine Kennedy
(Born 1969) | Secretary,
since 2019 | Vice President of Wells Fargo Funds Management, LLC and Senior Counsel of the Wells Fargo Legal Department since 2010. Vice President and Senior Counsel of Evergreen Investment Management Company, LLC from 1998 to 2010. |
Michael H. Whitaker
(Born 1967) | Chief Compliance Officer,
since 2016 | Chief Compliance Officer of Wells Fargo Asset Management since 2016. Senior Vice President and Chief Compliance Officer for Fidelity Investments from 2007 to 2016. |
1 Jeremy DePalma acts as Treasurer of 77 funds in the Fund Complex.
2 The Statement of Additional Information includes additional information about the Trustees and is available, without charge, upon request, by calling 1-800-260-5969 or by visiting the website at wfam.com.
30 | Wells Fargo VT Opportunity Fund
For more information
More information about Wells Fargo Funds is available free upon request. To obtain literature, please write, visit the Fund's website, or call:
Wells Fargo Funds
P.O. Box 219967
Kansas City, MO 64121-9967
Website: wfam.com
Individual investors: 1-800-222-8222
Retail investment professionals: 1-888-877-9275
Institutional investment professionals: 1-866-765-0778
This report and the financial statements contained herein are submitted for the general information of the shareholders of the Fund. If this report is used for promotional purposes, distribution of the report must be accompanied or preceded by a current prospectus. Before investing, please consider the investment objectives, risks, charges, and expenses of the investment. For a current prospectus and, if available, a summary prospectus, containing this information, call 1-800-260-5969 or visit the Fund’s website at wfam.com. Read the prospectus carefully before you invest or send money.
Wells Fargo Asset Management (WFAM) is the trade name for certain investment advisory/management firms owned by Wells Fargo & Company. These firms include but are not limited to Wells Capital Management Incorporated and Wells Fargo Funds Management, LLC. Certain products managed by WFAM entities are distributed by Wells Fargo Funds Distributor, LLC (a broker-dealer and Member FINRA).
This material is for general informational and educational purposes only and is NOT intended to provide investment advice or a recommendation of any kind— including a recommendation for any specific investment, strategy, or plan.
INVESTMENT PRODUCTS: NOT FDIC INSURED ■ NO BANK GUARANTEE ■ MAY LOSE VALUE
© 2021 Wells Fargo & Company. All rights reserved.
PAR-0121-00267 02-21
AVT6/AR152 12-20
Annual Report
December 31, 2020
Wells Fargo
VT Small Cap Growth Fund
Reduce clutter.
Save trees.
Sign up for electronic delivery of prospectuses and shareholder reports at wellsfargo.com/ advantagedelivery
The views expressed and any forward-looking statements are as of December 31, 2020, unless otherwise noted, and are those of the Fund's portfolio managers and/or Wells Fargo Asset Management. Discussions of individual securities or the markets generally are not intended as individual recommendations. Future events or results may vary significantly from those expressed in any forward-looking statements. The views expressed are subject to change at any time in response to changing circumstances in the market. Wells Fargo Asset Management and the Fund disclaim any obligation to publicly update or revise any views expressed or forward-looking statements.
INVESTMENT PRODUCTS: NOT FDIC INSURED ■ NO BANK GUARANTEE ■ MAY LOSE VALUE
Wells Fargo VT Small Cap Growth Fund | 1
Letter to shareholders (unaudited)
Dear Shareholder:
We are pleased to offer you this annual report for the Wells Fargo VT Small Cap Growth Fund for the 12-month period that ended December 31, 2020. Despite a deeply challenging year, dominated by the spread of COVID-19 cases and a sharp drop in economic output throughout much of the world, global stocks fared well overall, benefiting from strong central bank support. Bonds generally had modestly positive returns, providing some measure of diversification during turbulent market stretches.
For the 12-month period, equities had solid returns, more than making up for intense volatility in March. Non-U.S. developed market equities had weaker performance than emerging market and U.S. stocks. While gains from fixed-income securities were positive, they were more modest than equities. For the period, U.S. stocks, based on the S&P 500 Index1, gained 18.40%. International stocks, as measured by the MSCI ACWI ex USA Index (Net)2, returned 10.65%, while the MSCI EM Index (Net)3 had stronger performance, with a 18.31% gain. Among bond indexes, the Bloomberg Barclays U.S. Aggregate Bond Index4 returned 7.51%, the Bloomberg Barclays Global Aggregate ex-USD Index (unhedged)5 gained 10.11%, and the Bloomberg Barclays Municipal Bond Index6 returned 5.21% while the ICE BofA U.S. High Yield Index7 returned 6.17%.
The mood changed soon after the year began.
A year-end 2019 rally continued in early January 2020. However, market volatility spiked in late January on concerns over the potential impact of COVID-19 on the global economy and stock markets. With sentiment somewhat souring, perceived safe havens did well in January. The U.S. dollar and Japanese yen both rose, and government bonds outperformed equities. While the S&P 500 Index held its ground, emerging market equities tumbled.
Fears over the spread of COVID-19 and its impact on global growth led to a sharp downturn by late February. Oil prices tumbled as Russia and the Organization of the Petroleum Exporting Countries compounded a major decline in oil demand with a brutal price war, causing the price of crude oil to plummet.
Andrew Owen
President
Wells Fargo Funds
“Non-U.S. developed market equities had weaker performance than emerging market and U.S. stocks”
| 1 | The S&P 500 Index consists of 500 stocks chosen for market size, liquidity, and industry group representation. It is a market-value-weighted index with each stock's weight in the index proportionate to its market value. You cannot invest directly in an index. |
| 2 | The Morgan Stanley Capital International (MSCI) All Country World Index (ACWI) ex USA Index (Net) is a free-float-adjusted market-capitalization-weighted index that is designed to measure the equity market performance of developed and emerging markets, excluding the United States. Source: MSCI. MSCI makes no express or implied warranties or representations and shall have no liability whatsoever with respect to any MSCI data contained herein. The MSCI data may not be further redistributed or used as a basis for other indices or any securities or financial products. This report is not approved, reviewed, or produced by MSCI. You cannot invest directly in an index. |
| 3 | The MSCI Emerging Markets (EM) Index (Net) is a free-float-adjusted market-capitalization-weighted index that is designed to measure equity market performance of emerging markets. You cannot invest directly in an index. |
| 4 | The Bloomberg Barclays U.S. Aggregate Bond Index is a broad-based benchmark that measures the investment-grade, U.S. dollar-denominated, fixed-rate taxable bond market, including Treasuries, government-related and corporate securities, mortgage-backed securities (agency fixed-rate and hybrid adjustable-rate mortgage pass-throughs), asset-backed securities, and commercial mortgage-backed securities. You cannot invest directly in an index. |
| 5 | The Bloomberg Barclays Global Aggregate ex-USD Index (unhedged) is an unmanaged index that provides a broad-based measure of the global investment-grade fixed-income markets excluding the U.S. dollar-denominated debt market. You cannot invest directly in an index. |
| 6 | The Bloomberg Barclays Municipal Bond Index is an unmanaged index composed of long-term tax-exempt bonds with a minimum credit rating of Baa. You cannot invest directly in an index. |
| 7 | The ICE BofA U.S. High Yield Index is a market-capitalization-weighted index of domestic and Yankee high-yield bonds. The index tracks the performance of high-yield securities traded in the U.S. bond market. You cannot invest directly in an index. Copyright 2021. ICE Data Indices, LLC. All rights reserved. |
2 | Wells Fargo VT Small Cap Growth Fund
Letter to shareholders (unaudited)
The global spread of COVID-19 led country after country to clamp down on social- and business-related activity in order to contain the virus. This sent economies into a deep contraction. Central banks responded by slashing interest rates and expanding quantitative easing programs to restore liquidity and market confidence. The U.S. Federal Reserve (Fed) launched several lending programs, funding investment-grade bonds, money market mutual funds, and commercial paper while purchasing Treasuries, mortgage-backed securities, and overnight repurchase agreements. Meanwhile, stock markets tumbled, ending the longest bull stock market in U.S. history.
Markets rebounded strongly through the spring, fueled by unprecedented government and central bank stimulus measures in the U.S. and globally. The U.S. economy contracted by an annualized 5.0% pace in the first quarter, with 30 million new unemployment insurance claims in six weeks. In the eurozone, first-quarter real gross domestic product (GDP) shrank 3.8%. China’s first-quarter GDP fell by 6.8% year over year. Extreme oil-price volatility continued as global supply far exceeded demand.
In May, investors regained confidence on reports of early success in human trials of a COVID-19 vaccine. Growth stocks outperformed value, while returns on global government bonds were flat. However, in the U.S., the April unemployment rate rose to 14.7%, its highest level since World War II. Purchasing managers’ indexes (PMIs), a monthly survey of purchasing managers, reflected broadly weakening activity in May. U.S. corporate earnings contracted 14% year over year from the first quarter of 2019. However, high demand for information technology (IT), driven by remote activity, supported robust IT sector earnings, which helped drive IT stocks higher.
By June, economies reopened and global central banks committed to do all they could to provide economic support through liquidity and low borrowing costs. U.S. economic activity was aided by one-time $1,200 stimulus checks and $600 weekly bonus unemployment benefits that lasted through July. However, unemployment remained historically high and COVID-19 cases began to increase by late June. China’s economic recovery began to pick up momentum.
July was broadly positive for equities and fixed income. However, economic data and a resurgence of COVID-19 cases underscored the urgent need to regain control of the pandemic. Second-quarter GDP shrank from the previous quarter by 9.5% and 12.1% in the U.S. and the eurozone, respectively. In contrast, China’s second-quarter GDP grew 3.2% year over year. The U.S. economy added 1.8 million jobs in July, but a double-digit jobless rate persisted.
The stock market continued to rally in August despite concerns over rising numbers of U.S. and European COVID-19 cases as well as the July expiration of the $600 weekly bonus unemployment benefit. Relatively strong second-quarter earnings boosted investor sentiment along with the Fed’s announcement of a monetary policy shift expected to support longer-term low interest rates. U.S. manufacturing and services activity indexes beat expectations while the U.S. housing market maintained strength. In Europe, retail sales expanded and consumer confidence was steady. China’s economy continued to expand.
Stocks grew more volatile in September on mixed economic data. U.S. economic activity continued to grow. However, U.S. unemployment remained elevated at 7.9% in September. With U.S. Congress delaying further fiscal relief and uncertainties surrounding a possible vaccine, doubts crept back into the financial markets. In the U.K., a lack of progress in Brexit talks weighed on markets. China’s economy picked up steam, fueled by increased global demand.
Wells Fargo VT Small Cap Growth Fund | 3
Letter to shareholders (unaudited)
In October, capital markets stepped back from their six-month rally. Market volatility rose in advance of the U.S. election and amid a global increase in COVID-19 infections. Europe introduced tighter restrictions affecting economic activity. U.S. markets looked favorably at the prospect of Democratic control of the federal purse strings, which could lead to additional fiscal stimulus and a boost to economic activity. Meanwhile, China reported 4.9% third-quarter GDP growth.
Global stocks rallied in November, propelled by optimism over three promising COVID-19 vaccines. Reversing recent trends, value stocks outperformed growth stocks and cyclical stocks outpaced technology stocks. However, U.S. unemployment remained elevated, with a net job loss of 10 million since February. The eurozone services PMI contracted sharply while the region’s manufacturing activity grew. The U.S. election results added to the upbeat mood as investors anticipated more consistent policies in the new administration.
Financial markets ended the year with strength on high expectations for a rapid rollout of the COVID-19 vaccines, the successful passage of a $900 billion stimulus package, and rising expectations of additional economic support from a Democratic-led Congress. U.S. economic data were mixed with still-elevated unemployment and weak retail sales but growth in manufacturing output. In contrast, China’s economic expansion continued in both manufacturing and nonmanufacturing. U.S. COVID-19 infection rates continued to rise even as new state and local lockdown measures were implemented.
Don’t let short-term uncertainty derail long-term investment goals.
Periods of investment uncertainty can present challenges, but experience has taught us that maintaining long-term investment goals can be an effective way to plan for the future. To help you create a sound strategy based on your personal goals and risk tolerance, Wells Fargo Funds offers more than 100 mutual funds spanning a wide range of asset classes and investment styles. Although diversification cannot guarantee an investment profit or prevent losses, we believe it can be an effective way to manage investment risk and potentially smooth out overall portfolio performance. We encourage investors to know their investments and to understand that appropriate levels of risk-taking may unlock opportunities.
Thank you for choosing to invest with Wells Fargo Funds. We appreciate your confidence in us and remain committed to helping you meet your financial needs.
Sincerely,
Andrew Owen
President
Wells Fargo Funds
“Global stocks rallied in November, propelled by optimism over three promising COVID-19 vaccines.”
For further information about your Fund, contact your investment professional, visit our website at wfam.com, or call us directly at 1-800-260-5969.
4 | Wells Fargo VT Small Cap Growth Fund
This page is intentionally left blank.
Performance highlights (unaudited)
Investment objective
The Fund seeks long-term capital appreciation.
Manager
Wells Fargo Funds Management, LLC
Subadviser
Wells Capital Management Incorporated
Portfolio managers
Joseph M. Eberhardy, CFA®‡, CPA
Robert Gruendyke, CFA®‡†
David Nazaret, CFA®‡†
Thomas C. Ognar, CFA®‡
Average annual total returns (%) as of December 31, 2020
| | | | | | Expense ratios1 (%) |
| | Inception date | 1 year | 5 year | 10 year | Gross | Net 2 |
| Class 1 | 7-16-2010 | 58.09 | 22.35 | 15.11 | 0.94 | 0.94 |
| Class 2 | 5-1-1995 | 57.78 | 22.03 | 14.83 | 1.19 | 1.19 |
| Russell 2000® Growth Index3 | – | 34.63 | 16.36 | 13.48 | – | – |
Figures quoted represent past performance, which is no guarantee of future results. Investment return and principal value of an investment will fluctuate so that an investor’s shares, when redeemed, may be worth more or less than their original cost. Current performance may be lower or higher than the performance data quoted and assumes the reinvestment of dividends and capital gains. Current month-end performance is available by calling 1-800-260-5969. Performance figures of the Fund do not reflect fees and expenses charged pursuant to the terms of variable life insurance policies and variable annuity contracts. If these fees and expenses had been reflected, performance would have been lower.
Please keep in mind that high double-digit returns were primarily achieved during favorable market conditions. You should not expect that such favorable returns can be consistently achieved. A fund’s performance, especially for short time periods, should not be the sole factor in making your investment decision.
Shares are sold without a front-end sales charge or a contingent deferred sales charge.
Index returns do not include transaction costs associated with buying and selling securities, any mutual fund fees or expenses, or any taxes. It is not possible to invest directly in an index.
Stock values fluctuate in response to the activities of individual companies and general market and economic conditions. Smaller-company stocks tend to be more volatile and less liquid than those of larger companies. Consult the Fund’s prospectus for additional information on these and other risks.
Please refer to the prospectus provided by your participating insurance company for detailed information describing the separate accounts for information regarding surrender charges, mortality and expense risk fees, and other charges that may be assessed by the participating insurance companies.
Please see footnotes on page 7.
6 | Wells Fargo VT Small Cap Growth Fund
Performance highlights (unaudited)
| Growth of $10,000 investment as of December 31, 20206 |

| ‡ | CFA® and Chartered Financial Analyst® are trademarks owned by CFA Institute. |
| † | Mr. Gruendyke and Mr. Nazaret became portfolio managers of the Fund on July 28, 2020. |
| 1 | Reflects the expense ratios as stated in the most recent prospectuses, which include the impact of 0.01% in acquired fund fees and expenses. The expense ratios shown are subject to change and may differ from the annualized expense ratios shown in the financial highlights of this report, which do not include acquired fund fees and expenses. |
| 2 | The manager has contractually committed through April 30, 2021, to waive fees and/or reimburse expenses to the extent necessary to cap total annual fund operating expenses after fee waivers at 0.95% for Class 1 and 1.20% for Class 2. Brokerage commissions, stamp duty fees, interest, taxes, acquired fund fees and expenses (if any), and extraordinary expenses are excluded from the expense caps. Prior to or after the commitment expiration date, the caps may be increased or the commitment to maintain the caps may be terminated only with the approval of the Board of Trustees. Without these caps, the Fund’s returns would have been lower. The expense ratio paid by an investor is the net expense ratio (the total annual fund operating expenses after fee waivers) as stated in the prospectuses. |
| 3 | The Russell 2000® Growth Index measures the performance of those Russell 2000 companies with higher price/book ratios and higher forecasted growth values. You cannot invest directly in an index |
| 4 | The chart compares the performance of Class 2 shares for the most recent ten years with the Russell 2000® Growth Index. The chart assumes a hypothetical $10,000 investment and reflects all operating expenses of the Fund but does not reflect fees and expenses charged pursuant to the terms of variable life insurance policies and variable annuity contracts. |
| 5 | Figures represent the percentage of the Fund's net assets. Holdings are subject to change and may have changed since the date specified. |
| 6 | Figures represent the percentage of the Fund's long-term investments. These amounts are subject to change and may have changed since the date specified. |
* This security was no longer held at the end of the reporting period.
Wells Fargo VT Small Cap Growth Fund | 7
Performance highlights (unaudited)
MANAGER'S DISCUSSION
Fund highlights
| ■ | The Fund outperformed its benchmark, the Russell 2000® Growth Index, for the 12-month period that ended December 31, 2020. |
| ■ | Stocks within the health care, information technology (IT), and consumer discretionary sectors aided relative performance during the period. |
| ■ | The industrials sector hindered relative performance during the period. |
The past year was a volatile and memorable one.
The year 2020 will go down as one of the most memorable on record. An exogenous event that no one could have predicted sent equity markets into a tailspin followed by one of the sharpest and quickest recoveries ever. The spread of COVID-19 crushed the U.S. economy, causing corporate profits to plummet, a spike in unemployment, and other unfathomable events, such as oil futures settling at negative prices. With the help of monetary and fiscal accommodation, the economy stabilized and gradually improved as reopenings across the country spurred an increase in consumer spending and investor confidence. Late in the year, markets surged higher as several drug companies proved that their vaccine candidates were highly effective in preventing the virus. The pandemic pulled forward the adoption of new technologies, with the market shifting capital toward innovative areas. While new leadership may arise, we are positioning the portfolio to capitalize on an array of outcomes. We continue to adhere to our process of owning robust, sustainable, and underappreciated growth — a process that has created substantial gains over time.
The Fund benefited from stock selection within the health care, IT, and consumer discretionary sectors.
Strength in the Fund came from the health care sector as select diagnostics companies, biotechnology holdings, and medical device stocks were rewarded for their durable business models, innovative therapeutics, and solid fundamentals. Several of our health care holdings benefited from a recovery in elective procedures as hospital capacity has improved over the past few months. Also contributing to relative performance were select IT stocks within the social media, security, and digital transformation verticals that rallied sharply as they witnessed increased demand for their respective industries. Notable strength from the consumer discretionary sector came from Fiverr International Limited and Chegg, Incorporated*, which rallied sharply after citing strength in several key segments. We sold our position in Chegg before period-end to adhere to our small-cap market cap discipline. With more people working and attending school from home, companies and consumers have been using products made by these companies to help them fulfill many critical tasks.
Stock selection within the industrials sector inhibited relative performance.
Within industrials, our underweight to several of the more cyclical constituents within the index hindered performance as select housing-related stocks, machinery, and alternative energy names rallied sharply during the period. ASGN Incorporated underperformed amid concerns over a deceleration in temporary staffing volumes earlier in the period. Weakness also stemmed from MasTec, Incorporated,* whose decline was driven by worries over its pipeline segment in light of significantly lower oil prices in the first quarter, and SkyWest, Incorporated,* which fell sharply amid a falloff in demand as a result of the COVID-19 pandemic.
| Ten largest holdings (%) as of December 31, 20205 |
| Q2 Holdings Incorporated | 3.08 |
| Rapid7 Incorporated | 3.05 |
| Casella Waste Systems Incorporated Class A | 2.68 |
| ASGN Incorporated | 2.63 |
| iRhythm Technologies Incorporated | 2.52 |
| Kinsale Capital Group Incorporated | 2.44 |
| SPS Commerce Incorporated | 2.42 |
| Rexnord Corporation | 2.41 |
| Shockwave Medical Incorporated | 2.00 |
| Castle Biosciences Incorporated | 1.91 |
Please see footnotes on page 7.
8 | Wells Fargo VT Small Cap Growth Fund
Performance highlights (unaudited)
We remain diversified in many secular areas.
We remain overweight IT and maintain diversified exposure to software, electronic equipment instruments, semiconductors, and IT services. The structural advantages of the software industry continue to include benefits such as a predictable cost of ownership to customers, simplification, flexibility and scale, and quick and seamless implementation. Many of the companies we own continue to generate high recurring revenues and don’t have to spend large amounts of money to generate free cash flow. Despite our overweight to IT, we trimmed select positions whose valuation gap narrowed during the period. Within consumer discretionary, we are finding opportunities in companies that play in the traditional retail landscape but that are adopting and embracing omni-channel capabilities as a secular part of their growth engine. Within health care, many of our holdings are having a profound impact on patient outcomes and are playing a key role within the value-based health care landscape.
We remain positive regarding the Fund’s growth prospects in the future.
The coronavirus pandemic has pulled forward many secular trends largely evident within the digitization of our economy. This trend has been personified within our SCODIi acronym, which stands for software as a service, cloud computing, online retail, digital payments, the internet of things, and innovation. In our view, growth stocks have outperformed on the basis of superior returns and better balance sheets, and the group remains well positioned against lower-for-longer interest rates and a scarce growth environment. The past year was a reminder that allocating portfolios based solely on macro forecasts can be difficult. As such, we proudly adhere to our bottom-up process and believe that it is a key to our success. One of our main mantras is that we go where the underappreciated growth will be and we take a diversified approach to portfolio construction that optimizes opportunities. This philosophy has led to strong returns over time.
| Sector allocation as of December 31, 20206 |
Please see footnotes on page 7.
Wells Fargo VT Small Cap Growth Fund | 9
Fund expenses (unaudited)
As a shareholder of the Fund, you incur ongoing costs, including management fees, distribution (12b-1) fees, and other Fund expenses. This example is intended to help you understand your ongoing costs (in dollars) of investing in the Fund and to compare these costs with the ongoing costs of investing in other mutual funds.
The example is based on an investment of $1,000 invested at the beginning of the six-month period and held for the entire period from July 1, 2020 to December 31, 2020.
Actual expenses
The “Actual” line of the table below provides information about actual account values and actual expenses. You may use the information in this line, together with the amount you invested, to estimate the expenses that you paid over the period. Simply divide your account value by $1,000 (for example, an $8,600 account value divided by $1,000 = 8.6), then multiply the result by the number in the “Actual” line under the heading entitled “Expenses paid during period” for your applicable class of shares to estimate the expenses you paid on your account during this period.
Hypothetical example for comparison purposes
The “Hypothetical” line of the table below provides information about hypothetical account values and hypothetical expenses based on the Fund’s actual expense ratio and an assumed rate of return of 5% per year before expenses, which is not the Fund’s actual return. The hypothetical account values and expenses may not be used to estimate the actual ending account balance or expenses you paid for the period. You may use this information to compare the ongoing costs of investing in the Fund and other funds. To do so, compare this 5% hypothetical example with the 5% hypothetical examples that appear in the shareholder reports of the other funds.
Please note that the expenses shown in the table are meant to highlight your ongoing costs only and do not reflect any separate account charges assessed by participating insurance companies. Therefore, the “Hypothetical” line of the table is useful in comparing ongoing costs only, and will not help you determine the relative total costs of owning different funds. In addition, if these separate account charges assessed by participating insurance companies were included, your costs would have been higher.
| | Beginning
account value
7-1-2020 | Ending
account value
12-31-2020 | Expenses
paid during
the period1 | Annualized net
expense ratio |
| Class 1 | | | | |
| Actual | $1,000.00 | $1,434.56 | $5.66 | 0.92% |
| Hypothetical (5% return before expenses) | $1,000.00 | $1,020.49 | $4.69 | 0.92% |
| Class 2 | | | | |
| Actual | $1,000.00 | $1,431.90 | $7.17 | 1.17% |
| Hypothetical (5% return before expenses) | $1,000.00 | $1,019.24 | $5.95 | 1.17% |
1 Expenses paid is equal to the annualized net expense ratio of each class multiplied by the average account value over the period, multiplied by the number of days in the most recent fiscal half-year divided by the number of days in the fiscal year (to reflect the one-half-year period).
10 | Wells Fargo VT Small Cap Growth Fund
Portfolio of investments—December 31, 2020
| | | | | Shares | Value |
| Common stocks: 99.96% | | | | | |
| Communication services: 1.66% | | | | | |
| Interactive media & services: 0.26% | | | | | |
| EverQuote Incorporated Class A † | | | | 30,300 | 1,131,705 |
| Media: 1.40% | | | | | |
| Cardlytics Incorporated † | | | | 41,770 | 5,963,503 |
| Consumer discretionary: 13.96% | | | | | |
| Auto components: 1.19% | | | | | |
| Fox Factory Holding Corporation † | | | | 47,910 | 5,064,566 |
| Hotels, restaurants & leisure: 2.47% | | | | | |
| Papa John's International Incorporated | | | | 53,420 | 4,532,687 |
| Wingstop Incorporated | | | | 45,569 | 6,040,171 |
| | | | | | 10,572,858 |
| Household durables: 1.60% | | | | | |
| Purple Innovation Incorporated † | | | | 207,128 | 6,822,796 |
| Internet & direct marketing retail: 1.91% | | | | | |
| CarParts.com Incorporated †« | | | | 164,310 | 2,035,801 |
| Fiverr International Limited † | | | | 31,450 | 6,135,895 |
| | | | | | 8,171,696 |
| Leisure products: 1.41% | | | | | |
| YETI Holdings Incorporated † | | | | 87,696 | 6,004,545 |
| Specialty retail: 2.95% | | | | | |
| Boot Barn Holdings Incorporated † | | | | 155,240 | 6,731,206 |
| Leslie's Incorporated †« | | | | 41,492 | 1,151,403 |
| Lithia Motors Incorporated Class A | | | | 16,220 | 4,747,107 |
| | | | | | 12,629,716 |
| Textiles, apparel & luxury goods: 2.43% | | | | | |
| Crocs Incorporated † | | | | 111,180 | 6,966,539 |
| Deckers Outdoor Corporation † | | | | 11,980 | 3,435,624 |
| | | | | | 10,402,163 |
| Consumer staples: 3.96% | | | | | |
| Beverages: 0.96% | | | | | |
| Celsius Holdings Incorporated † | | | | 81,600 | 4,105,296 |
| Food & staples retailing: 0.46% | | | | | |
| The Chef's Warehouse Incorporated † | | | | 76,470 | 1,964,514 |
| Food products: 2.54% | | | | | |
| Freshpet Incorporated † | | | | 55,007 | 7,810,444 |
| Vital Farms Incorporated †« | | | | 120,749 | 3,056,157 |
| | | | | | 10,866,601 |
The accompanying notes are an integral part of these financial statements.
Wells Fargo VT Small Cap Growth Fund | 11
Portfolio of investments—December 31, 2020
| | | | | Shares | Value |
| Financials: 5.61% | | | | | |
| Capital markets: 1.60% | | | | | |
| Assetmark Financial Holdings † | | | | 90,215 | $ 2,183,203 |
| Stifel Financial Corporation | | | | 91,935 | 4,639,040 |
| | | | | | 6,822,243 |
| Consumer finance: 0.95% | | | | | |
| LendingTree Incorporated † | | | | 14,878 | 4,073,448 |
| Insurance: 3.06% | | | | | |
| Goosehead Insurance Incorporated Class A | | | | 21,407 | 2,670,737 |
| Kinsale Capital Group Incorporated | | | | 52,074 | 10,421,570 |
| | | | | | 13,092,307 |
| Health care: 32.24% | | | | | |
| Biotechnology: 9.67% | | | | | |
| Arcutis Biotherapeutics Incorporated † | | | | 139,346 | 3,919,803 |
| Arena Pharmaceuticals Incorporated † | | | | 38,920 | 2,990,224 |
| Biohaven Pharmaceutical Holding Company † | | | | 19,280 | 1,652,489 |
| CareDx Incorporated † | | | | 49,284 | 3,570,626 |
| Chemocentryx Incorporated † | | | | 19,100 | 1,182,672 |
| Deciphera Pharmaceuticals Incorporated † | | | | 29,100 | 1,660,737 |
| Emergent BioSolutions Incorporated † | | | | 19,370 | 1,735,552 |
| Fate Therapeutics Incorporated † | | | | 25,860 | 2,351,450 |
| Halozyme Therapeutics Incorporated † | | | | 147,340 | 6,292,891 |
| Invitae Corporation †« | | | | 47,160 | 1,971,760 |
| Natera Incorporated † | | | | 64,811 | 6,449,991 |
| Vericel Corporation † | | | | 244,890 | 7,562,203 |
| | | | | | 41,340,398 |
| Health care equipment & supplies: 10.54% | | | | | |
| Acutus Medical Incorporated †« | | | | 81,266 | 2,341,273 |
| iRhythm Technologies Incorporated † | | | | 45,376 | 10,763,641 |
| Mesa Laboratories Incorporated | | | | 6,660 | 1,909,022 |
| Orthopediatrics Corporation † | | | | 83,001 | 3,423,791 |
| Outset Medical Incorporated † | | | | 32,743 | 1,861,112 |
| Pulmonx Corporation † | | | | 48,323 | 3,335,253 |
| Shockwave Medical Incorporated † | | | | 82,546 | 8,561,671 |
| SI-BONE Incorporated † | | | | 165,298 | 4,942,410 |
| Silk Road Medical Incorporated † | | | | 31,310 | 1,971,904 |
| Tandem Diabetes Care Incorporated † | | | | 27,380 | 2,619,718 |
| Vapotherm Incorporated †« | | | | 124,031 | 3,331,473 |
| | | | | | 45,061,268 |
| Health care providers & services: 3.62% | | | | | |
| Addus Homecare Corporation † | | | | 62,330 | 7,298,220 |
| Castle Biosciences Incorporated † | | | | 121,918 | 8,186,794 |
| | | | | | 15,485,014 |
| Health care technology: 2.63% | | | | | |
| Inspire Medical Systems Incorporated † | | | | 29,540 | 5,556,179 |
| Phreesia Incorporated † | | | | 104,796 | 5,686,231 |
| | | | | | 11,242,410 |
The accompanying notes are an integral part of these financial statements.
12 | Wells Fargo VT Small Cap Growth Fund
Portfolio of investments—December 31, 2020
| | | | | Shares | Value |
| Life sciences tools & services: 4.00% | | | | | |
| Adaptive Biotechnologies Corporation † | | | | 31,431 | $ 1,858,515 |
| Codexis Incorporated † | | | | 359,567 | 7,849,348 |
| Neogenomics Incorporated † | | | | 137,462 | 7,400,954 |
| | | | | | 17,108,817 |
| Pharmaceuticals: 1.78% | | | | | |
| Pacira Pharmaceuticals Incorporated † | | | | 92,690 | 5,546,570 |
| Revance Therapeutics Incorporated † | | | | 71,800 | 2,034,812 |
| | | | | | 7,581,382 |
| Industrials: 13.88% | | | | | |
| Aerospace & defense: 2.96% | | | | | |
| Kratos Defense & Security Solutions Incorporated † | | | | 212,830 | 5,837,927 |
| Mercury Systems Incorporated † | | | | 77,278 | 6,805,101 |
| | | | | | 12,643,028 |
| Building products: 0.12% | | | | | |
| The AZEK Company Incorporated † | | | | 12,973 | 498,812 |
| Commercial services & supplies: 2.68% | | | | | |
| Casella Waste Systems Incorporated Class A † | | | | 185,090 | 11,466,326 |
| Construction & engineering: 0.29% | | | | | |
| Construction Partners Incorporated Class A † | | | | 42,600 | 1,240,086 |
| Electrical equipment: 0.52% | | | | | |
| Bloom Energy Corporation Class A † | | | | 76,900 | 2,203,954 |
| Machinery: 2.41% | | | | | |
| Rexnord Corporation | | | | 261,050 | 10,308,865 |
| Professional services: 2.63% | | | | | |
| ASGN Incorporated † | | | | 134,541 | 11,238,206 |
| Road & rail: 1.12% | | | | | |
| Marten Transport Limited | | | | 35,264 | 607,599 |
| Saia Incorporated † | | | | 23,092 | 4,175,034 |
| | | | | | 4,782,633 |
| Trading companies & distributors: 1.15% | | | | | |
| SiteOne Landscape Supply Incorporated † | | | | 31,070 | 4,928,634 |
| Information technology: 26.49% | | | | | |
| Electronic equipment, instruments & components: 1.90% | | | | | |
| Novanta Incorporated † | | | | 68,790 | 8,132,354 |
| IT services: 2.83% | | | | | |
| Endava plc Sponsored ADR † | | | | 64,634 | 4,960,660 |
| EVO Payments Incorporated Class A † | | | | 224,401 | 6,061,071 |
| LiveRamp Holdings Incorporated † | | | | 14,770 | 1,081,016 |
| | | | | | 12,102,747 |
| Semiconductors & semiconductor equipment: 3.66% | | | | | |
| Allegro MicroSystems Incorporated † | | | | 100,816 | 2,687,755 |
| Diodes Incorporated † | | | | 73,090 | 5,152,845 |
The accompanying notes are an integral part of these financial statements.
Wells Fargo VT Small Cap Growth Fund | 13
Portfolio of investments—December 31, 2020
| | | | | Shares | Value |
| Semiconductors & semiconductor equipment (continued) | | | | | |
| Semtech Corporation † | | | | 86,450 | $ 6,232,181 |
| Silicon Laboratories Incorporated † | | | | 12,370 | 1,575,196 |
| | | | | | 15,647,977 |
| Software: 18.10% | | | | | |
| 8x8 Incorporated † | | | | 68,700 | 2,368,089 |
| Envestnet Incorporated † | | | | 90,251 | 7,426,755 |
| Everbridge Incorporated † | | | | 26,890 | 4,008,492 |
| Jamf Holding Corporation † | | | | 61,058 | 1,826,855 |
| Mimecast Limited † | | | | 69,860 | 3,970,842 |
| Q2 Holdings Incorporated † | | | | 104,196 | 13,183,920 |
| Rapid7 Incorporated † | | | | 144,418 | 13,020,727 |
| Sprout Social Incorporated Class A † | | | | 138,439 | 6,286,515 |
| SPS Commerce Incorporated † | | | | 95,274 | 10,345,804 |
| Sumo Logic Incorporated †« | | | | 122,630 | 3,504,765 |
| Talend SA ADR † | | | | 178,299 | 6,835,984 |
| Vertex Incorporated Class A † | | | | 60,355 | 2,103,372 |
| Workiva Incorporated † | | | | 26,800 | 2,455,416 |
| | | | | | 77,337,536 |
| Real estate: 1.58% | | | | | |
| Equity REITs: 1.58% | | | | | |
| Community Healthcare Trust Incorporated | | | | 69,380 | 3,268,492 |
| QTS Realty Trust Incorporated Class A | | | | 56,570 | 3,500,552 |
| | | | | | 6,769,044 |
| Utilities: 0.58% | | | | | |
| Independent power & renewable electricity producers: 0.58% | | | | | |
| Sunnova Energy International Incorporated † | | | | 54,724 | 2,469,694 |
| Total Common stocks (Cost $250,565,537) | | | | | 427,277,142 |
| | | Yield | | | |
| Short-term investments: 3.23% | | | | | |
| Investment companies: 3.23% | | | | | |
| Securities Lending Cash Investments LLC ♠∩∞ | | 0.16% | | 13,231,250 | 13,231,250 |
| Wells Fargo Government Money Market Fund Select Class ♠∞ | | 0.03 | | 555,598 | 555,598 |
| Total Short-term investments (Cost $13,786,848) | | | | | 13,786,848 |
| Total investments in securities (Cost $264,352,385) | 103.19% | | | | 441,063,990 |
| Other assets and liabilities, net | (3.19) | | | | (13,619,832) |
| Total net assets | 100.00% | | | | $ 427,444,158 |
| † | Non-income-earning security |
| « | All or a portion of this security is on loan. |
| ♠ | The issuer of the security is an affiliated person of the Fund as defined in the Investment Company Act of 1940. |
| ∩ | The investment is a non-registered investment company purchased with cash collateral received from securities on loan. |
| ∞ | The rate represents the 7-day annualized yield at period end. |
| Abbreviations: |
| ADR | American depositary receipt |
| REIT | Real estate investment trust |
The accompanying notes are an integral part of these financial statements.
14 | Wells Fargo VT Small Cap Growth Fund
Portfolio of investments—December 31, 2020
Investments in affiliates
An affiliated investment is an investment in which the Fund owns at least 5% of the outstanding voting shares of the issuer or as a result of other relationships, such as the Fund and the issuer having the same investment manager. Transactions with issuers that were either affiliated persons of the Fund at the beginning of the period or the end of the period were as follows:
| | Value,
beginning of
period | Purchases | Sales
proceeds | Net
realized
gains
(losses) | | Net
change in
unrealized
gains
(losses) | | Value,
end of
period | | % of
net
assets | Shares,
end
of period | Income
from
affiliated
securities |
| Short-term investments | | | | | | | | | | | | |
| Investment companies | | | | | | | | | | | | |
| Securities Lending Cash Investments LLC | $17,154,220 | $112,768,399 | $(116,692,047) | $ 1,535 | | $ (857) | | $ 13,231,250 | | | 13,231,250 | $ 71,956# |
| Wells Fargo Government Money Market Fund Select Class | 3,229,069 | 89,079,408 | (91,752,879) | 0 | | 0 | | 555,598 | | | 555,598 | 15,289 |
| | | | | $1,535 | | $(857) | | $13,786,848 | | 3.23% | | $87,245 |
| # | Amount shown represents income before fees and rebates. |
The accompanying notes are an integral part of these financial statements.
Wells Fargo VT Small Cap Growth Fund | 15
Statement of assets and liabilities—December 31, 2020
| | |
| Assets | |
Investments in unaffiliated securities (including $12,750,308 of securities loaned), at value (cost $250,565,537)
| $ 427,277,142 |
Investments in affiliated securites, at value (cost $13,786,848)
| 13,786,848 |
Receivable for investments sold
| 452,456 |
Receivable for Fund shares sold
| 192,797 |
Receivable for dividends
| 26,707 |
Receivable for securities lending income, net
| 17,916 |
Prepaid expenses and other assets
| 26,986 |
Total assets
| 441,780,852 |
| Liabilities | |
Payable upon receipt of securities loaned
| 13,231,250 |
Payable for Fund shares redeemed
| 668,586 |
Management fee payable
| 312,310 |
Distribution fee payable
| 89,715 |
Administration fees payable
| 31,231 |
Trustees’ fees and expenses payable
| 3,602 |
Total liabilities
| 14,336,694 |
Total net assets
| $427,444,158 |
| Net assets consist of | |
Paid-in capital
| $ 200,922,446 |
Total distributable earnings
| 226,521,712 |
Total net assets
| $427,444,158 |
| Computation of net asset value per share | |
Net assets – Class 1
| $ 35,127,886 |
Shares outstanding – Class 11
| 2,288,174 |
Net asset value per share – Class 1
| $15.35 |
Net assets – Class 2
| $ 392,316,272 |
Shares outstanding – Class 21
| 26,644,978 |
Net asset value per share – Class 2
| $14.72 |
| 1 | The Fund has an unlimited number of authorized shares |
The accompanying notes are an integral part of these financial statements.
16 | Wells Fargo VT Small Cap Growth Fund
Statement of operations—year ended December 31, 2020
| | |
| Investment income | |
Dividends
| $ 400,866 |
Securities lending income from affiliates, net
| 133,168 |
Income from affiliated securities
| 15,289 |
Total investment income
| 549,323 |
| Expenses | |
Management fee
| 2,541,973 |
| Administration fees | |
Class 1
| 20,560 |
Class 2
| 233,637 |
| Distribution fee | |
Class 2
| 727,135 |
Custody and accounting fees
| 35,078 |
Professional fees
| 42,194 |
Shareholder report expenses
| 41,957 |
Trustees’ fees and expenses
| 19,862 |
Other fees and expenses
| 12,983 |
Total expenses
| 3,675,379 |
| Less: Fee waivers and/or expense reimbursements | |
Fund-level
| (372) |
Net expenses
| 3,675,007 |
Net investment loss
| (3,125,684) |
| Realized and unrealized gains (losses) on investments | |
| Net realized gains on | |
Unaffiliated securities
| 53,244,180 |
Affiliated securities
| 1,535 |
Net realized gains on investments
| 53,245,715 |
| Net change in unrealized gains (losses) on | |
Unaffiliated securities
| 109,024,225 |
Affiliated securities
| (857) |
Net change in unrealized gains (losses) on investments
| 109,023,368 |
Net realized and unrealized gains (losses) on investments
| 162,269,083 |
Net increase in net assets resulting from operations
| $159,143,399 |
The accompanying notes are an integral part of these financial statements.
Wells Fargo VT Small Cap Growth Fund | 17
Statement of changes in net assets
| | |
| | Year ended
December 31, 2020 | Year ended
December 31, 2019 |
| Operations | | | | |
Net investment loss
| | $ (3,125,684) | | $ (2,708,593) |
Net realized gains on investments
| | 53,245,715 | | 18,188,979 |
Net change in unrealized gains (losses) on investments
| | 109,023,368 | | 48,624,852 |
Net increase in net assets resulting from operations
| | 159,143,399 | | 64,105,238 |
| Distributions to shareholders from | | | | |
| Net investment income and net realized gains | | | | |
Class 1
| | (1,435,682) | | (3,689,450) |
Class 2
| | (16,630,208) | | (44,225,338) |
Total distributions to shareholders
| | (18,065,890) | | (47,914,788) |
| Capital share transactions | Shares | | Shares | |
| Proceeds from shares sold | | | | |
Class 1
| 604,357 | 6,902,098 | 343,664 | 3,528,410 |
Class 2
| 3,286,731 | 35,875,297 | 1,600,764 | 15,682,418 |
| | | 42,777,395 | | 19,210,828 |
| Reinvestment of distributions | | | | |
Class 1
| 131,233 | 1,435,682 | 358,896 | 3,689,450 |
Class 2
| 1,582,322 | 16,630,208 | 4,458,199 | 44,225,338 |
| | | 18,065,890 | | 47,914,788 |
| Payment for shares redeemed | | | | |
Class 1
| (675,964) | (7,532,393) | (523,347) | (5,516,594) |
Class 2
| (5,426,711) | (59,526,674) | (4,754,197) | (48,055,795) |
| | | (67,059,067) | | (53,572,389) |
Net increase (decrease) in net assets resulting from capital share transactions
| | (6,215,782) | | 13,553,227 |
Total increase in net assets
| | 134,861,727 | | 29,743,677 |
| Net assets | | | | |
Beginning of period
| | 292,582,431 | | 262,838,754 |
End of period
| | $427,444,158 | | $292,582,431 |
The accompanying notes are an integral part of these financial statements.
18 | Wells Fargo VT Small Cap Growth Fund
Financial highlights
(For a share outstanding throughout each period)
| | Year ended December 31 |
| Class 1 | 2020 | 2019 | 2018 | 2017 | 2016 |
Net asset value, beginning of period
| $10.29 | $9.66 | $10.43 | $8.51 | $8.70 |
Net investment loss
| (0.09) | (0.07) 1 | (0.05) | (0.04) | (0.01) 1 |
Net realized and unrealized gains (losses) on investments
| 5.80 | 2.51 | 0.40 | 2.24 | 0.65 |
Total from investment operations
| 5.71 | 2.44 | 0.35 | 2.20 | 0.64 |
| Distributions to shareholders from | | | | | |
Net realized gains
| (0.65) | (1.81) | (1.12) | (0.28) | (0.83) |
Net asset value, end of period
| $15.35 | $10.29 | $9.66 | $10.43 | $8.51 |
Total return2
| 58.09% | 25.31% | 1.48% | 26.14% | 8.10% |
| Ratios to average net assets (annualized) | | | | | |
Gross expenses
| 0.93% | 0.93% | 0.92% | 0.94% | 0.94% |
Net expenses
| 0.93% | 0.93% | 0.92% | 0.94% | 0.94% |
Net investment loss
| (0.76)% | (0.69)% | (0.59)% | (0.65)% | (0.10)% |
| Supplemental data | | | | | |
Portfolio turnover rate
| 51% | 62% | 68% | 72% | 89% |
Net assets, end of period (000s omitted)
| $35,128 | $22,925 | $19,801 | $22,591 | $20,554 |
| 1 | Calculated based upon average shares outstanding |
| 2 | Performance figures of the Fund do not reflect fees and expenses charged pursuant to the terms of variable life insurance policies and variable annuity contracts. |
The accompanying notes are an integral part of these financial statements.
Wells Fargo VT Small Cap Growth Fund | 19
Financial highlights
(For a share outstanding throughout each period)
| | Year ended December 31 |
| Class 2 | 2020 | 2019 | 2018 | 2017 | 2016 |
Net asset value, beginning of period
| $9.91 | $9.38 | $10.18 | $8.33 | $8.56 |
Net investment loss
| (0.11) | (0.09) | (0.09) | (0.09) | (0.03) |
Net realized and unrealized gains (losses) on investments
| 5.57 | 2.43 | 0.41 | 2.22 | 0.63 |
Total from investment operations
| 5.46 | 2.34 | 0.32 | 2.13 | 0.60 |
| Distributions to shareholders from | | | | | |
Net realized gains
| (0.65) | (1.81) | (1.12) | (0.28) | (0.83) |
Net asset value, end of period
| $14.72 | $9.91 | $9.38 | $10.18 | $8.33 |
Total return1
| 57.78% | 24.83% | 1.20% | 25.86% | 7.75% |
| Ratios to average net assets (annualized) | | | | | |
Gross expenses
| 1.18% | 1.18% | 1.17% | 1.19% | 1.19% |
Net expenses
| 1.18% | 1.18% | 1.17% | 1.19% | 1.19% |
Net investment loss
| (1.00)% | (0.95)% | (0.84)% | (0.90)% | (0.35)% |
| Supplemental data | | | | | |
Portfolio turnover rate
| 51% | 62% | 68% | 72% | 89% |
Net assets, end of period (000s omitted)
| $392,316 | $269,657 | $243,038 | $238,460 | $202,718 |
| 1 | Performance figures of the Fund do not reflect fees and expenses charged pursuant to the terms of variable life insurance policies and variable annuity contracts. |
The accompanying notes are an integral part of these financial statements.
20 | Wells Fargo VT Small Cap Growth Fund
Notes to financial statements
1. ORGANIZATION
Wells Fargo Variable Trust (the “Trust”), a Delaware statutory trust organized on March 10, 1999, is an open-end management investment company registered under the Investment Company Act of 1940, as amended (the “1940 Act”). As an investment company, the Trust follows the accounting and reporting guidance in Financial Accounting Standards Board (“FASB”) Accounting Standards Codification Topic 946, Financial Services – Investment Companies. These financial statements report on the Wells Fargo VT Small Cap Growth Fund (the “Fund”) which is a diversified series of the Trust. The Trust offers shares of the Fund to separate accounts of various life insurance companies as funding vehicles for certain variable annuity contracts and variable life insurance policies.
2. SIGNIFICANT ACCOUNTING POLICIES
The following significant accounting policies, which are consistently followed in the preparation of the financial statements of the Fund, are in conformity with U.S. generally accepted accounting principles which require management to make estimates and assumptions that affect the reported amounts of assets and liabilities, disclosure of contingent assets and liabilities at the date of the financial statements, and the reported amounts of income and expenses during the reporting period. Actual results could differ from those estimates.
Securities valuation
All investments are valued each business day as of the close of regular trading on the New York Stock Exchange (generally 4 p.m. Eastern Time), although the Fund may deviate from this calculation time under unusual or unexpected circumstances.
Equity securities that are listed on a foreign or domestic exchange or market are valued at the official closing price or, if none, the last sales price. If no sale occurs on the principal exchange or market that day, a fair value price will be determined in accordance with the Fund’s Valuation Procedures.
Investments in registered open-end investment companies are valued at net asset value. Interests in non-registered investment companies that are redeemable at net asset value are fair valued normally at net asset value.
Investments which are not valued using any of the methods discussed above are valued at their fair value, as determined in good faith by the Board of Trustees of the Fund. The Board of Trustees has established a Valuation Committee comprised of the Trustees and has delegated to it the authority to take any actions regarding the valuation of portfolio securities that the Valuation Committee deems necessary or appropriate, including determining the fair value of portfolio securities, unless the determination has been delegated to the Wells Fargo Asset Management Pricing Committee at Wells Fargo Funds Management, LLC ("Funds Management"). The Board of Trustees retains the authority to make or ratify any valuation decisions or approve any changes to the Valuation Procedures as it deems appropriate. On a quarterly basis, the Board of Trustees receives reports on any valuation actions taken by the Valuation Committee or the Wells Fargo Asset Management Pricing Committee which may include items for ratification.
Securities lending
The Fund may lend its securities from time to time in order to earn additional income in the form of fees or interest on securities received as collateral or the investment of any cash received as collateral. When securities are on loan, the Fund receives interest or dividends on those securities. Cash collateral received in connection with its securities lending transactions is invested in Securities Lending Cash Investments, LLC (the “Securities Lending Fund”). Investments in Securities Lending Fund are valued at the evaluated bid price provided by an independent pricing service. Income earned from investment in the Securities Lending Fund, if any, is included in securities lending income from affiliates (net of fees and rebates) on the Statement of Operations.
In a securities lending transaction, the net asset value of the Fund is affected by an increase or decrease in the value of the securities loaned and by an increase or decrease in the value of the instrument in which collateral is invested. The amount of securities lending activity undertaken by the Fund fluctuates from time to time. The Fund has the right under the lending agreement to recover the securities from the borrower on demand. In the event of default or bankruptcy by the borrower, the Fund may be prevented from recovering the loaned securities or gaining access to the collateral or may experience delays or costs in doing so. In such an event, the terms of the agreement allow the unaffiliated securities lending agent to use the collateral to purchase replacement securities on behalf of the Fund or pay the Fund the market value of the loaned securities. The Fund bears the risk of loss with respect to depreciation of its investment of the cash collateral.
Wells Fargo VT Small Cap Growth Fund | 21
Notes to financial statements
Security transactions and income recognition
Securities transactions are recorded on a trade date basis. Realized gains or losses are recorded on the basis of identified cost.
Dividend income is recognized on the ex-dividend date.
Distributions to shareholders
Distributions to shareholders from net investment income and any net realized gains are recorded on the ex-dividend date and paid at least annually. Such distributions are determined in accordance with income tax regulations and may differ from U.S. generally accepted accounting principles. Dividend sources are estimated at the time of declaration. The tax character of distributions is determined as of the Fund’s fiscal year end. Therefore, a portion of the Fund’s distributions made prior to the Fund’s fiscal year end may be categorized as a tax return of capital at year end.
Federal and other taxes
The Fund intends to continue to qualify as a regulated investment company by distributing substantially all of its investment company taxable income and any net realized capital gains (after reduction for capital loss carryforwards) sufficient to relieve it from all, or substantially all, federal income taxes. Accordingly, no provision for federal income taxes was required.
The Fund’s income and federal excise tax returns and all financial records supporting those returns for the prior three fiscal years are subject to examination by the federal and Delaware revenue authorities. Management has analyzed the Fund’s tax positions taken on federal, state, and foreign tax returns for all open tax years and does not believe that there are any uncertain tax positions that require recognition of a tax liability.
As of December 31, 2020, the aggregate cost of all investments for federal income tax purposes was $264,629,344 and the unrealized gains (losses) consisted of:
| Gross unrealized gains | $177,877,643 |
| Gross unrealized losses | (1,442,997) |
| Net unrealized gains | $176,434,646 |
Class allocations
The separate classes of shares offered by the Fund differ principally in distribution fees. Class specific expenses are charged directly to that share class. Investment income, common fund-level expenses, and realized and unrealized gains (losses) on investments are allocated daily to each class of shares based on the relative proportion of net assets of each class.
3. FAIR VALUATION MEASUREMENTS
Fair value measurements of investments are determined within a framework that has established a fair value hierarchy based upon the various data inputs utilized in determining the value of the Fund’s investments. The three-level hierarchy gives the highest priority to unadjusted quoted prices in active markets for identical assets or liabilities (Level 1) and the lowest priority to unobservable inputs (Level 3). The Fund’s investments are classified within the fair value hierarchy based on the lowest level of input that is significant to the fair value measurement. The inputs are summarized into three broad levels as follows:
| ■ | Level 1 – quoted prices in active markets for identical securities |
| ■ | Level 2 – other significant observable inputs (including quoted prices for similar securities, interest rates, prepayment speeds, credit risk, etc.) |
| ■ | Level 3 – significant unobservable inputs (including the Fund’s own assumptions in determining the fair value of investments) |
The inputs or methodologies used for valuing investments in securities are not necessarily an indication of the risk associated with investing in those securities.
22 | Wells Fargo VT Small Cap Growth Fund
Notes to financial statements
The following is a summary of the inputs used in valuing the Fund’s assets and liabilities as of December 31, 2020:
| | Quoted prices
(Level 1) | Other significant
observable inputs
(Level 2) | Significant
unobservable inputs
(Level 3) | Total |
| Assets | | | | |
| Investments in: | | | | |
| Common stocks | | | | |
| Communication services | $ 7,095,208 | $0 | $0 | $ 7,095,208 |
| Consumer discretionary | 59,668,340 | 0 | 0 | 59,668,340 |
| Consumer staples | 16,936,411 | 0 | 0 | 16,936,411 |
| Financials | 23,987,998 | 0 | 0 | 23,987,998 |
| Health care | 137,819,289 | 0 | 0 | 137,819,289 |
| Industrials | 59,310,544 | 0 | 0 | 59,310,544 |
| Information technology | 113,220,614 | 0 | 0 | 113,220,614 |
| Real estate | 6,769,044 | 0 | 0 | 6,769,044 |
| Utilities | 2,469,694 | 0 | 0 | 2,469,694 |
| Short-term investments | | | | |
| Investment companies | 13,786,848 | 0 | 0 | 13,786,848 |
| Total assets | $441,063,990 | $0 | $0 | $441,063,990 |
Additional sector, industry or geographic detail is included in the Portfolio of Investments.
For the year ended December 31, 2020, the Fund did not have any transfers into/out of Level 3.
4. TRANSACTIONS WITH AFFILIATES
Management fee
Funds Management, an indirect wholly owned subsidiary of Wells Fargo & Company (“Wells Fargo”), is the manager of the Fund and provides advisory and fund-level administrative services under an investment management agreement. Under the investment management agreement, Funds Management is responsible for, among other services, implementing the investment objectives and strategies of the Fund, supervising the subadviser and providing fund-level administrative services in connection with the Fund’s operations. As compensation for its services under the investment management agreement, Funds Management is entitled to receive a management fee at the following annual rate based on the Fund’s average daily net assets:
| Average daily net assets | Management fee |
| First $500 million | 0.800% |
| Next $500 million | 0.750 |
| Next $1 billion | 0.700 |
| Next $1 billion | 0.675 |
| Next $2 billion | 0.650 |
| Next $5 billion | 0.640 |
| Over $10 billion | 0.630 |
For the year ended December 31, 2020, the management fee was equivalent to an annual rate of 0.80% of the Fund’s average daily net assets.
Funds Management has retained the services of a subadviser to provide daily portfolio management to the Fund. The fee for subadvisory services is borne by Funds Management. Wells Capital Management Incorporated ("WellsCap"), an affiliate of Funds Management and an indirect wholly owned subsidiary of Wells Fargo, is the subadviser to the Fund and is entitled to receive a fee from Funds Management at an annual rate starting at 0.55% and declining to 0.40% as the average daily net assets of the Fund increase.
Wells Fargo VT Small Cap Growth Fund | 23
Notes to financial statements
Administration fees
Under a class-level administration agreement, Funds Management provides class-level administrative services to the Fund, which includes paying fees and expenses for services provided by the transfer agent, sub-transfer agents, omnibus account services and record-keepers. As compensation for its services under the class-level administration agreement, Funds Management receives an annual fee of 0.08% which is calculated based on the average daily net assets of each class.
Waivers and/or expense reimbursements
Funds Management has contractually waived and/or reimbursed management and administration fees to the extent necessary to maintain certain net operating expense ratios for the Fund. When each class of the Fund has exceeded its expense cap, Funds Management has waived fees and/or reimbursed expenses from fund-level expenses on a proportionate basis and then from class specific expenses. When only certain classes exceed their expense caps, waivers and/or reimbursements are applied against class specific expenses before fund-level expenses. Funds Management has committed through April 30, 2021 to waive fees and/or reimburse expenses to the extent necessary to cap the Fund’s expenses at 0.95% for Class 1 shares and 1.20% for Class 2 shares. Prior to or after the commitment expiration date, the cap may be increased or the commitment to maintain the cap may be terminated only with the approval of the Board of Trustees.
Distribution fee
The Trust has adopted a distribution plan for Class 2 shares of the Fund pursuant to Rule 12b-1 under the 1940 Act. A distribution fee is charged to Class 2 shares and paid to Wells Fargo Funds Distributor, LLC, the principal underwriter, at an annual rate of 0.25% of the average daily net assets of Class 2 shares.
Interfund transactions
The Fund may purchase or sell portfolio investment securities to certain other Wells Fargo affiliates pursuant to Rule 17a-7 under the 1940 Act and under procedures adopted by the Board of Trustees. The procedures have been designed to ensure that these interfund transactions, which do not incur broker commissions, are effected at current market prices.
5. INVESTMENT PORTFOLIO TRANSACTIONS
Purchases and sales of investments, excluding U.S. government obligations (if any) and short-term securities, for the year ended December 31, 2020 were $159,225,789 and $180,765,517, respectively.
6. SECURITIES LENDING TRANSACTIONS
The Fund lends its securities through an unaffiliated securities lending agent and receives collateral in the form of cash or securities with a value at least equal to the value of the securities on loan. The value of the loaned securities is determined at the close of each business day and any increases or decreases in the required collateral are exchanged between the Fund and the counterparty on the next business day. Cash collateral received is invested in the Securities Lending Fund which seeks to provide a positive return compared to the daily Federal Funds Open Rate by investing in high-quality, U.S. dollar-denominated short-term money market instruments and is exempt from registration under Section 3(c)(7) of the 1940 Act. Securities Lending Fund is managed by Funds Management and is subadvised by WellsCap. Funds Management receives an advisory fee starting at 0.05% and declining to 0.01% as the average daily net assets of the Securities Lending Fund increase. All of the fees received by Funds Management are paid to WellsCap for its services as subadviser.
In the event of counterparty default or the failure of a borrower to return a loaned security, the Fund has the right to use the collateral to offset any losses incurred. As of December 31, 2020, the Fund had securities lending transactions with the following counterparties which are subject to offset:
| Counterparty | Value of
securities on
loan | Collateral
received1 | Net amount |
| Bank of America Securities Incorporated | $4,559,850 | $(4,559,850) | $0 |
| Barclays Capital Incorporated | 1,243,538 | (1,243,538) | 0 |
| Deutsche Bank Securities Incorporated | 139,672 | (139,672) | 0 |
| ING Financial Markets LLC | 403,025 | (403,025) | 0 |
| Morgan Stanley & Company LLC | 5,511,113 | (5,511,113) | 0 |
| National Financial Services LLC | 893,110 | (893,110) | 0 |
1 Collateral received within this table is limited to the collateral for the net transaction with the counterparty.
24 | Wells Fargo VT Small Cap Growth Fund
Notes to financial statements
7. BANK BORROWINGS
The Trust, Wells Fargo Master Trust and Wells Fargo Funds Trust (excluding the money market funds) are parties to a $350,000,000 revolving credit agreement whereby the Fund is permitted to use bank borrowings for temporary or emergency purposes, such as to fund shareholder redemption requests. Interest under the credit agreement is charged to the Fund based on a borrowing rate equal to the higher of the Federal Funds rate in effect on that day plus 1.25% or the overnight LIBOR rate in effect on that day plus 1.25%. In addition, an annual commitment fee equal to 0.25% of the unused balance is allocated to each participating fund.
For the year ended December 31, 2020, there were no borrowings by the Fund under the agreement.
8. DISTRIBUTIONS TO SHAREHOLDERS
The tax character of distributions paid during the years ended December 31, 2020 and December 31, 2019 were as follows:
| | Year ended December 31 |
| | 2020 | 2019 |
| Ordinary income | $ 0 | $ 1,567,204 |
| Long-term capital gain | 18,065,890 | 46,347,584 |
As of December 31, 2020, the components of distributable earnings on a tax basis were as follows:
Undistributed
ordinary
income | Undistributed
long-term
gain | Unrealized
gains |
| $5,641,030 | $44,446,845 | $176,434,646 |
9. CONCENTRATION RISKS
Concentration risks result from exposure to a limited number of sectors. As of the end of the period, the Fund concentrated its portfolio in investments related to health care and information technology sectors. A fund that invests a substantial portion of its assets in any sector may be more affected by changes in that sector than would be a fund whose investments are not heavily weighted in any sector.
10. INDEMNIFICATION
Under the Fund's organizational documents, the officers and Trustees have been granted certain indemnification rights against certain liabilities that may arise out of performance of their duties to the Fund. The Fund has entered into a separate agreement with each Trustee that converts indemnification rights currently existing under the Fund’s organizational documents into contractual rights that cannot be changed in the future without the consent of the Trustee. Additionally, in the normal course of business, the Fund may enter into contracts with service providers that contain a variety of indemnification clauses. The Fund’s maximum exposure under these arrangements is dependent on future claims that may be made against the Fund and, therefore, cannot be estimated.
11. NEW ACCOUNTING PRONOUNCEMENT
In August 2018, FASB issued Accounting Standards Update (“ASU”) No. 2018-13, Fair Value Measurement (Topic 820) Disclosure Framework - Changes to the Disclosure Requirements for Fair Value Measurement. ASU 2018-13 updates the disclosure requirements on fair value measurements in Topic 820, Fair Value Measurements. The amendments are effective for fiscal years, and interim periods within those fiscal years, beginning after December 15, 2019. Management has adopted this guidance which did not have a material impact on the financial statements.
12. SUBSEQUENT EVENT
On February 23, 2021, Wells Fargo announced that it has entered into a definitive agreement to sell Wells Fargo Asset Management (“WFAM”) to GTCR LLC and Reverence Capital Partners, L.P. WFAM is the trade name used by the asset management businesses of Wells Fargo and includes Wells Fargo Funds Management, LLC, the investment manager to the Fund, Wells Capital Management Incorporated and Wells Fargo Asset Management (International) Limited, both registered investment advisers providing sub-advisory services to certain funds, and Wells Fargo Funds Distributor, LLC, the Fund’s
Wells Fargo VT Small Cap Growth Fund | 25
Notes to financial statements
principal underwriter. As part of the transaction, Wells Fargo will own a 9.9% equity interest and will continue to serve as an important client and distribution partner.
Consummation of the transaction will result in the automatic termination of the Fund’s investment management agreement and sub-advisory agreement(s). The Fund’s Board of Trustees will be asked to approve new investment management arrangements with the new company. If approved by the Board, the new investment management arrangements with the new company will be presented to the shareholders of the Fund for approval, and, if approved by shareholders, would take effect upon the closing of the transaction. The transaction is expected to close in the second half of 2021, subject to customary closing conditions.
13. CORONAVIRUS (COVID-19) PANDEMIC
On March 11, 2020, the World Health Organization announced that it had made the assessment that coronavirus disease 2019 (“COVID-19”) is a pandemic. The impacts of COVID-19 are affecting the entire global economy, individual companies and investment products, and the market in general. There is significant uncertainty around the extent and duration of business disruptions related to COVID-19 and the impacts may be short term or may last for an extended period of time. The risk of further spreading of COVID-19 has led to significant uncertainty and volatility in the financial markets.
26 | Wells Fargo VT Small Cap Growth Fund
Report of independent registered public accounting firm
To the Shareholders of the Fund and Board of Trustees
Wells Fargo Variable Trust:
Opinion on the Financial Statements
We have audited the accompanying statement of assets and liabilities of Wells Fargo VT Small Cap Growth Fund (the Fund), one of the funds constituting Wells Fargo Variable Trust, including the portfolio of investments, as of December 31, 2020, the related statement of operations for the year then ended, the statements of changes in net assets for each of the years in the two-year period then ended, and the related notes (collectively, the financial statements) and the financial highlights for each of the years in the five-year period then ended. In our opinion, the financial statements and financial highlights present fairly, in all material respects, the financial position of the Fund as of December 31, 2020, the results of its operations for the year then ended, the changes in its net assets for each of the years in the two-year period then ended, and the financial highlights for each of the years in the five-year period then ended, in conformity with U.S. generally accepted accounting principles.
Basis for Opinion
These financial statements and financial highlights are the responsibility of the Fund’s management. Our responsibility is to express an opinion on these financial statements and financial highlights based on our audits. We are a public accounting firm registered with the Public Company Accounting Oversight Board (United States) (PCAOB) and are required to be independent with respect to the Fund in accordance with the U.S. federal securities laws and the applicable rules and regulations of the Securities and Exchange Commission and the PCAOB.
We conducted our audits in accordance with the standards of the PCAOB. Those standards require that we plan and perform the audit to obtain reasonable assurance about whether the financial statements and financial highlights are free of material misstatement, whether due to error or fraud. Our audits included performing procedures to assess the risks of material misstatement of the financial statements and financial highlights, whether due to error or fraud, and performing procedures that respond to those risks. Such procedures included examining, on a test basis, evidence regarding the amounts and disclosures in the financial statements and financial highlights. Such procedures also included confirmation of securities owned as of December 31, 2020, by correspondence with the custodian and transfer agent. Our audits also included evaluating the accounting principles used and significant estimates made by management, as well as evaluating the overall presentation of the financial statements and financial highlights. We believe that our audits provide a reasonable basis for our opinion.

We have not been able to determine the specific year that we began serving as the auditor of one or more Wells Fargo Funds investment companies; however we are aware that we have served as the auditor of one or more Wells Fargo Funds investment companies since at least 1955.
Boston, Massachusetts
February 25, 2021
Wells Fargo VT Small Cap Growth Fund | 27
Other information (unaudited)
TAX INFORMATION
Pursuant to Section 852 of the Internal Revenue Code, $18,065,890 was designated as a 20% rate gain distribution for the fiscal year ended December 31, 2020.
PROXY VOTING INFORMATION
A description of the policies and procedures used to determine how to vote proxies relating to portfolio securities is available without charge, upon request, by calling 1-800-260-5969, visiting our website at wfam.com, or visiting the SEC website at sec.gov. Information regarding how the proxies related to portfolio securities were voted during the most recent 12-month period ended June 30 is available on the website at wfam.com or by visiting the SEC website at sec.gov.
QUARTERLY PORTFOLIO HOLDINGS INFORMATION
The Fund files its complete schedule of portfolio holdings with the SEC for the first and third quarters of each fiscal year as an exhibit to its reports on Form N-PORT. Shareholders may view the filed Form N-PORT by visiting the SEC website at sec.gov.
28 | Wells Fargo VT Small Cap Growth Fund
Other information (unaudited)
BOARD OF TRUSTEES AND OFFICERS
Each of the Trustees and Officers1 listed in the table below acts in identical capacities for each fund in the Wells Fargo family of funds, which consists of 144 mutual funds comprising the Wells Fargo Funds Trust, Wells Fargo Variable Trust, Wells Fargo Master Trust and four closed-end funds (collectively the “Fund Complex”). This table should be read in conjunction with the Prospectus and the Statement of Additional Information2. The mailing address of each Trustee and Officer is 525 Market Street, 12th Floor, San Francisco, CA 94105. Each Trustee and Officer serves an indefinite term, however, each Trustee serves such term until reaching the mandatory retirement age established by the Trustees.
Independent Trustees
Name and
year of birth | Position held and
length of service* | Principal occupations during past five years or longer | Current other
public company or
investment
company
directorships |
William R. Ebsworth
(Born 1957) | Trustee,
since 2015 | Retired. From 1984 to 2013, equities analyst, portfolio manager, research director and chief investment officer at Fidelity Management and Research Company in Boston, Tokyo, and Hong Kong, and retired in 2013 as Chief Investment Officer of Fidelity Strategic Advisers, Inc. where he led a team of investment professionals managing client assets. Prior thereto, Board member of Hong Kong Securities Clearing Co., Hong Kong Options Clearing Corp., the Thailand International Fund, Ltd., Fidelity Investments Life Insurance Company, and Empire Fidelity Investments Life Insurance Company. Audit Committee Chair and Investment Committee Chair of the Vincent Memorial Hospital Endowment (non-profit organization). Mr. Ebsworth is a CFA® charterholder. | N/A |
Jane A. Freeman
(Born 1953) | Trustee,
since 2015;
Chair Liaison,
since 2018 | Retired. From 2012 to 2014 and 1999 to 2008, Chief Financial Officer of Scientific Learning Corporation. From 2008 to 2012, Ms. Freeman provided consulting services related to strategic business projects. Prior to 1999, Portfolio Manager at Rockefeller & Co. and Scudder, Stevens & Clark. Board member of the Harding Loevner Funds from 1996 to 2014, serving as both Lead Independent Director and chair of the Audit Committee. Board member of the Russell Exchange Traded Funds Trust from 2011 to 2012 and the chair of the Audit Committee. Ms. Freeman is also an inactive Chartered Financial Analyst. | N/A |
Isaiah Harris, Jr.
(Born 1952) | Trustee,
since 2009; Audit
Committee
Chair,
since 2019 | Retired. Chairman of the Board of CIGNA Corporation since 2009, and Director since 2005. From 2003 to 2011, Director of Deluxe Corporation. Prior thereto, President and CEO of BellSouth Advertising and Publishing Corp. from 2005 to 2007, President and CEO of BellSouth Enterprises from 2004 to 2005 and President of BellSouth Consumer Services from 2000 to 2003. Emeritus member of the Iowa State University Foundation Board of Governors. Emeritus Member of the Advisory Board of Iowa State University School of Business. Advisory Board Member, Palm Harbor Academy (private school). Mr. Harris is a certified public accountant (inactive status). | CIGNA Corporation |
Judith M. Johnson
(Born 1949) | Trustee,
since 2008 | Retired. Prior thereto, Chief Executive Officer and Chief Investment Officer of Minneapolis Employees Retirement Fund from 1996 to 2008. Ms. Johnson is an attorney, certified public accountant and a certified managerial accountant. | N/A |
David F. Larcker
(Born 1950) | Trustee,
since 2009 | James Irvin Miller Professor of Accounting at the Graduate School of Business (Emeritus), Stanford University, Director of the Corporate Governance Research Initiative and Senior Faculty of The Rock Center for Corporate Governance since 2006. From 2005 to 2008, Professor of Accounting at the Graduate School of Business, Stanford University. Prior thereto, Ernst & Young Professor of Accounting at The Wharton School, University of Pennsylvania from 1985 to 2005. | N/A |
Wells Fargo VT Small Cap Growth Fund | 29
Other information (unaudited)
Name and
year of birth | Position held and
length of service* | Principal occupations during past five years or longer | Current other
public company or
investment
company
directorships |
Olivia S. Mitchell
(Born 1953) | Trustee,
since 2006;
Nominating and
Governance
Committee Chair,
since 2018 | International Foundation of Employee Benefit Plans Professor, Wharton School of the University of Pennsylvania since 1993. Director of Wharton’s Pension Research Council and Boettner Center on Pensions & Retirement Research, and Research Associate at the National Bureau of Economic Research. Previously, Cornell University Professor from 1978 to 1993. | N/A |
Timothy J. Penny
(Born 1951) | Trustee,
since 1996;
Chair,
since 2018 | President and Chief Executive Officer of Southern Minnesota Initiative Foundation, a non-profit organization, since 2007. Member of the Board of Trustees of NorthStar Education Finance, Inc., a non-profit organization, since 2007. | N/A |
James G. Polisson
(Born 1959) | Trustee,
since 2018 | Retired. Chief Marketing Officer, Source (ETF) UK Services, Ltd, from 2015 to 2017. From 2012 to 2015, Principal of The Polisson Group, LLC, a management consulting, corporate advisory and principal investing company. Chief Executive Officer and Managing Director at Russell Investments, Global Exchange Traded Funds from 2010 to 2012. Managing Director of Barclays Global Investors from 1998 to 2010 and Global Chief Marketing Officer for iShares and Barclays Global Investors from 2000 to 2010. Trustee of the San Francisco Mechanics’ Institute, a non-profit organization, from 2013 to 2015. Board member of the Russell Exchange Traded Fund Trust from 2011 to 2012. Director of Barclays Global Investors Holdings Deutschland GmbH from 2006 to 2009. Mr. Polisson is an attorney and has a retired status with the Massachusetts and District of Columbia Bar Associations. | N/A |
Pamela Wheelock
(Born 1959) | Trustee,
since January
2020; previously
Trustee from
January 2018 to
July 2019 | Board member of the Destination Medical Center Economic Development Agency, Rochester, Minnesota since 2019. Interim President of the McKnight Foundation from January to September 2020. Acting Commissioner, Minnesota Department of Human Services, July 2019 through September 2019. Human Services Manager (part-time), Minnesota Department of Human Services, October 2019 through December 2019. Chief Operating Officer, Twin Cities Habitat for Humanity from 2017 to 2019. Vice President of University Services, University of Minnesota from 2012 to 2016. Prior thereto, on the Board of Directors, Governance Committee and Finance Committee for the Minnesota Philanthropy Partners (Saint Paul Foundation) from 2012 to 2018, Interim Chief Executive Officer of Blue Cross Blue Shield of Minnesota from 2011 to 2012, Chairman of the Board from 2009 to 2012 and Board Director from 2003 to 2015. Vice President, Leadership and Community Engagement, Bush Foundation, Saint Paul, Minnesota (a private foundation) from 2009 to 2011. Executive Vice President and Chief Financial Officer, Minnesota Sports and Entertainment from 2004 to 2009 and Senior Vice President from 2002 to 2004. Executive Vice President of the Minnesota Wild Foundation from 2004 to 2008. Commissioner of Finance, State of Minnesota, from 1999 to 2002. Currently Board Chair of the Minnesota Wild Foundation since 2010. | N/A |
* Length of service dates reflect the Trustee’s commencement of service with the Trust’s predecessor entities, where applicable.
30 | Wells Fargo VT Small Cap Growth Fund
Other information (unaudited)
Officers
Name and
year of birth | Position held and
length of service | Principal occupations during past five years or longer |
Andrew Owen
(Born 1960) | President,
since 2017 | Executive Vice President of Wells Fargo & Company and Head of Affiliated Managers, Wells Fargo Asset Management, since 2014. In addition, Mr. Owen is currently President, Chief Executive Officer and Director of Wells Fargo Funds Management, LLC since 2017. Prior thereto, Executive Vice President responsible for marketing, investments and product development for Wells Fargo Funds Management, LLC, from 2009 to 2014. |
Jeremy DePalma1
(Born 1974) | Treasurer,
since 2012 | Senior Vice President of Wells Fargo Funds Management, LLC since 2009. Senior Vice President of Evergreen Investment Management Company, LLC from 2008 to 2010 and head of the Fund Reporting and Control Team within Fund Administration from 2005 to 2010. |
Michelle Rhee
(Born 1966) | Chief Legal Officer,
since 2019 | Secretary of Wells Fargo Funds Management, LLC and Chief Legal Counsel of Wells Fargo Asset Management since 2018. Deputy General Counsel of Wells Fargo Bank, N.A. since 2020 and Assistant General Counsel of Wells Fargo Bank, N.A. from 2018 to 2020. Associate General Counsel and Managing Director of Bank of America Corporation from 2004 to 2018. |
Catherine Kennedy
(Born 1969) | Secretary,
since 2019 | Vice President of Wells Fargo Funds Management, LLC and Senior Counsel of the Wells Fargo Legal Department since 2010. Vice President and Senior Counsel of Evergreen Investment Management Company, LLC from 1998 to 2010. |
Michael H. Whitaker
(Born 1967) | Chief Compliance Officer,
since 2016 | Chief Compliance Officer of Wells Fargo Asset Management since 2016. Senior Vice President and Chief Compliance Officer for Fidelity Investments from 2007 to 2016. |
1 Jeremy DePalma acts as Treasurer of 77 funds in the Fund Complex.
2 The Statement of Additional Information includes additional information about the Trustees and is available, without charge, upon request, by calling 1-800-260-5969 or by visiting the website at wfam.com.
Wells Fargo VT Small Cap Growth Fund | 31
For more information
More information about Wells Fargo Funds is available free upon request. To obtain literature, please write, visit the Fund's website, or call:
Wells Fargo Funds
P.O. Box 219967
Kansas City, MO 64121-9967
Website: wfam.com
Individual investors: 1-800-222-8222
Retail investment professionals: 1-888-877-9275
Institutional investment professionals: 1-866-765-0778
This report and the financial statements contained herein are submitted for the general information of the shareholders of the Fund. If this report is used for promotional purposes, distribution of the report must be accompanied or preceded by a current prospectus. Before investing, please consider the investment objectives, risks, charges, and expenses of the investment. For a current prospectus and, if available, a summary prospectus, containing this information, call 1-800-260-5969 or visit the Fund’s website at wfam.com. Read the prospectus carefully before you invest or send money.
Wells Fargo Asset Management (WFAM) is the trade name for certain investment advisory/management firms owned by Wells Fargo & Company. These firms include but are not limited to Wells Capital Management Incorporated and Wells Fargo Funds Management, LLC. Certain products managed by WFAM entities are distributed by Wells Fargo Funds Distributor, LLC (a broker-dealer and Member FINRA).
This material is for general informational and educational purposes only and is NOT intended to provide investment advice or a recommendation of any kind— including a recommendation for any specific investment, strategy, or plan.
INVESTMENT PRODUCTS: NOT FDIC INSURED ■ NO BANK GUARANTEE ■ MAY LOSE VALUE
© 2021 Wells Fargo & Company. All rights reserved.
PAR-0121-00269 02-21
AVT7/AR153 12-20
ITEM 2. CODE OF ETHICS
(a) As of the end of the period, covered by the report, Wells Fargo Variable Trust has adopted a code of ethics that applies to its President and Treasurer. A copy of the code of ethics is filed as an exhibit to this Form N-CSR.
(c) During the period covered by this report, there were no amendments to the provisions of the code of ethics adopted in Item 2(a) above.
(d) During the period covered by this report, there were no implicit or explicit waivers to the provisions of the code of ethics adopted in Item 2(a) above.
ITEM 3. AUDIT COMMITTEE FINANCIAL EXPERT
The Board of Trustees of Wells Fargo Variable Trust has determined that Judith Johnson is an audit committee financial expert, as defined in Item 3 of Form N-CSR. Mrs. Johnson is independent for purposes of Item 3 of Form N-CSR.
ITEM 4. PRINCIPAL ACCOUNTANT FEES AND SERVICES
(a), (b), (c), (d) The following table presents aggregate fees billed in each of the last two fiscal years for services rendered to the Registrant by the Registrant’s principal accountant. These fees were billed to the registrant and were approved by the Registrant’s audit committee.
| | | | | | | | |
| | | Fiscal
year ended
December 31, 2020 | | | Fiscal
year ended
December 31, 2019 | |
Audit fees | | $ | 192,340 | | | $ | 188,560 | |
Audit-related fees | | | — | | | | — | |
Tax fees (1) | | | 16,910 | | | | 16,305 | |
All other fees | | | — | | | | — | |
| | | | | | | | |
| | $ | 209,250 | | | $ | 204,865 | |
| | | | | | | | |
| (1) | Tax fees consist of fees for tax compliance, tax advice, tax planning and excise tax. |
(e) The Chair of the Audit Committees is authorized to pre-approve: (1) audit services to the mutual funds of the Wells Fargo Variable Trust; (2) non-audit tax or compliance consulting or training services provided to the Wells Fargo Multi-Sector Income Fund by the independent auditors (“Auditors”) if the fees for any particular engagement are not anticipated to exceed $50,000; and (3) non-audit tax or compliance consulting or training services provided by the Auditors to a Wells Fargo Multi-Sector Income Fund’s investment adviser and its controlling entities (where pre-approval is required because the engagement relates directly to the operations and financial reporting of the Wells Fargo Multi-Sector Income Fund) if the fee to the Auditors for any particular engagement is not anticipated to exceed $50,000. For any such pre-approval sought from the Chair, Management shall prepare a brief description of the proposed services. If the Chair approves of such service, he or she shall sign the statement prepared by Management. Such written statement shall be presented to the full Committees at their next regularly scheduled meetings.
(f) Not applicable
(g) Not applicable
(h) Not applicable
ITEM 5. AUDIT COMMITTEE OF LISTED REGISTRANTS
Not applicable.
ITEM 6. INVESTMENTS
A Portfolio of Investments for each series of Wells Fargo Variable Trust is included as part of the report to shareholders filed under Item 1 of this Form.
ITEM 7. DISCLOSURE OF PROXY VOTING POLICIES AND PROCEDURES FOR CLOSED-END MANAGEMENT INVESTMENT COMPANIES
Not applicable.
ITEM 8. PORTFOLIO MANAGERS OF CLOSED-END MANAGEMENT INVESTMENT COMPANIES
Not applicable.
ITEM 9. PURCHASES OF EQUITY SECURITIES BY CLOSED-END MANAGEMENT INVESTMENT COMPANY AND AFFILIATED PURCHASERS
Not applicable.
ITEM 10. SUBMISSION OF MATTERS TO A VOTE OF SECURITY HOLDERS
There have been no material changes to the procedures by which shareholders may recommend nominees to the registrant’s Board of Trustees that have been implemented since the registrant’s last provided disclosure in response to the requirements of this Item.
ITEM 11. CONTROLS AND PROCEDURES
(a) The President and Treasurer have concluded that Wells Fargo Variable Trust disclosure controls and procedures (as defined in Rule 30a-3(c) under the Investment Company Act of 1940) provide reasonable assurances that material information relating to the registrant is made known to them by the appropriate persons based on their evaluation of these controls and procedures as of a date within 90 days of the filing of this report.
(b) There were no significant changes in the registrant’s internal controls over financial reporting (as defined in Rule 30a-3(d) under the Investment Company Act of 1940) that occurred during the most recent fiscal half-year of the period covered by this report that materially affected, or is reasonably likely to materially affect, the registrant’s internal control over financial reporting.
ITEM 12. DISCLOSURES OF SECURITIES LENDING ACTIVITES FOR CLOSED-END MANAGEMENT INVESTMENT COMPANIES
Not applicable.
ITEM 13. EXHIBITS
SIGNATURES
Pursuant to the requirements of the Securities Exchange Act of 1934 and the Investment Company Act of 1940, the registrant has duly caused this report to be signed on its behalf by the undersigned, thereunto duly authorized.
| | |
Wells Fargo Variable Trust |
| By: /s/ Andrew Owen |
|
Andrew Owen |
President |
Date: February 25, 2021 |
Pursuant to the requirements of the Securities Exchange Act of 1934 and the Investment Company Act of 1940, this report has been signed below by the following persons on behalf of the registrant and in the capacities and on the date indicated.
|
Wells Fargo Variable Trust |
| By: /s/ Andrew Owen |
|
Andrew Owen |
President |
Date: February 25, 2021 |
| By: /s/ Jeremy DePalma |
|
Jeremy DePalma |
Treasurer |
Date: February 25, 2021 |