UNITED STATES
SECURITIES AND EXCHANGE COMMISSION
Washington, D.C. 20549
FORM N-CSR
CERTIFIED SHAREHOLDER REPORT OF REGISTERED
MANAGEMENT INVESTMENT COMPANIES
Investment Company Act file number: 811-09255
Allspring Variable Trust
(Exact name of registrant as specified in charter)
525 Market St., San Francisco, CA 94105
(Address of principal executive offices) (Zip code)
Matthew Prasse
Allspring Funds Management, LLC
525 Market St., San Francisco, CA 94105
(Name and address of agent for service)
Registrant’s telephone number, including area code: 800-222-8222
Date of fiscal year end: December 31,
Registrant is making a filing for 6 of its series:
Allspring VT Discovery Fund, Allspring VT Index Asset Allocation Fund, Allspring VT International Equity Fund, Allspring VT Omega Growth Fund, Allspring VT Opportunity Fund, and Allspring VT Small Cap Growth Fund.
Date of reporting period: December 31, 2021
ITEM 1. REPORT TO STOCKHOLDERS
Annual Report
December 31, 2021
Allspring VT Discovery Fund
The views expressed and any forward-looking statements are as of December 31, 2021, unless otherwise noted, and are those of the Fund's portfolio managers and/or Allspring Global Investments. Discussions of individual securities or the markets generally are not intended as individual recommendations. Future events or results may vary significantly from those expressed in any forward-looking statements. The views expressed are subject to change at any time in response to changing circumstances in the market. Allspring Global Investments disclaims any obligation to publicly update or revise any views expressed or forward-looking statements.
Allspring VT Discovery Fund | 1
Letter to shareholders (unaudited)
Andrew Owen
President
Allspring Funds
Dear Shareholder:
We are pleased to offer you this annual report for the Allspring VT Discovery Fund for the 12-month period that ended December 31, 2021. Global stocks yielded mixed results as the global economy continued to emerge from the haze of COVID-19. Tailwinds were provided by global stimulus programs, a rapid vaccination rollout, and recovering consumer and corporate sentiment. Bonds also saw mixed performance during the period.
For the 12-month period, equities had mixed returns as policymakers continued to fight the effects of COVID-19. U.S. stocks led both non-U.S. developed market equities and emerging market stocks. Returns by fixed-income securities were also a mix of positive and negative. For the period, U.S. stocks, based on the S&P 500 Index,1 gained 28.71%. International stocks, as measured by the MSCI ACWI ex USA Index (Net),2 returned 7.82%, while the MSCI EM Index (Net) (USD)3 had weaker performance with a 2.54% loss. Among bond indexes, the Bloomberg U.S. Aggregate Bond Index4 returned -1.54%, the Bloomberg Global Aggregate ex-USD Index (unhedged)5 returned -7.05%, the Bloomberg Municipal Bond Index6 gained 1.52%, and the ICE BofA U.S. High Yield Index7 returned 5.36%.
Efforts to contain COVID-19 drove market performance.
The year 2021 began with emerging market stocks leading all major asset classes in January, driven by China’s strong economic growth and a broad recovery in corporate earnings, which propelled China’s stock market higher. In the U.S., positive news on vaccine trials and January expansion in both the manufacturing and services sectors were offset by a weak December monthly jobs report. This was compounded by technical factors as some hedge funds were forced to sell stocks to protect themselves against a well-publicized short squeeze coordinated by a group of retail investors. Eurozone sentiment and economic growth were particularly weak, reflecting the impact of a new lockdown with stricter social distancing along with a slow vaccine rollout.
February saw major domestic equity indexes driven higher on the hope of a new stimulus bill, improving COVID-19 vaccination numbers, and the gradual reopening of the economy. Most S&P 500 companies reported better-than-expected earnings, with positive surprises coming from the financials, information technology, health care, and materials sectors. Japan saw its economy strengthen as a result of strong export numbers. Meanwhile, crude oil prices continued their climb, rising more than 25% for the year. Domestic government bonds experienced a sharp sell-off in late February as markets priced in a more robust economic recovery and higher future growth and inflation expectations.
| 1 | The S&P 500 Index consists of 500 stocks chosen for market size, liquidity, and industry group representation. It is a market-value-weighted index with each stock's weight in the index proportionate to its market value. You cannot invest directly in an index. |
| 2 | The Morgan Stanley Capital International (MSCI) All Country World Index (ACWI) ex USA Index (Net) is a free-float-adjusted market-capitalization-weighted index that is designed to measure the equity market performance of developed and emerging markets, excluding the U.S. Source: MSCI. MSCI makes no express or implied warranties or representations and shall have no liability whatsoever with respect to any MSCI data contained herein. The MSCI data may not be further redistributed or used as a basis for other indexes or any securities or financial products. This report is not approved, reviewed, or produced by MSCI. You cannot invest directly in an index. |
| 3 | The MSCI Emerging Markets (EM) Index (Net) (USD) is a free-float-adjusted market-capitalization-weighted index that is designed to measure equity market performance of emerging markets. You cannot invest directly in an index. |
| 4 | The Bloomberg U.S. Aggregate Bond Index is a broad-based benchmark that measures the investment-grade, U.S.-dollar-denominated, fixed-rate taxable bond market, including Treasuries, government-related and corporate securities, mortgage-backed securities (agency fixed-rate and hybrid adjustable-rate mortgage pass-throughs), asset-backed securities, and commercial mortgage-backed securities. You cannot invest directly in an index. |
| 5 | The Bloomberg Global Aggregate ex-USD Index (unhedged) is an unmanaged index that provides a broad-based measure of the global investment-grade fixed-income markets excluding the U.S.-dollar-denominated debt market. You cannot invest directly in an index. |
| 6 | The Bloomberg Municipal Bond Index is an unmanaged index composed of long-term tax-exempt bonds with a minimum credit rating of Baa. You cannot invest directly in an index. |
| 7 | The ICE BofA U.S. High Yield Index is a market-capitalization-weighted index of domestic and Yankee high-yield bonds. The index tracks the performance of high-yield securities traded in the U.S. bond market. You cannot invest directly in an index. Copyright 2022. ICE Data Indices, LLC. All rights reserved. |
2 | Allspring VT Discovery Fund
Letter to shareholders (unaudited)
The passage of the massive domestic stimulus bill highlighted March activity, leading to increased forecasts for U.S. growth in 2021. Domestic employment surged as COVID-19 vaccinations and an increasingly open economy spurred hiring. A majority of U.S. small companies reported they were operating at pre-pandemic capacity or higher. Value stocks continued their outperformance of growth stocks in the month, continuing the trend that started in late 2020. Meanwhile, most major developed global equity indexes were up month to date on the back of rising optimism regarding the outlook for global growth. While the U.S. and the U.K. have been the most successful in terms of the vaccine rollout, even in markets where the vaccine has lagged, such as in the eurozone and Japan, equity indexes in many of those countries have also been in positive territory for the year through March 2021.
Equity markets produced another strong showing in April. Domestically, the continued reopening of the economy had a strong impact on positive equity performance, as people started leaving their households and jobless claims continued to fall. Domestic corporate bonds performed well and the U.S. dollar weakened. Meanwhile, the U.S. government continued to seek to invest in the recovery, this time by outlining a package of over $2 trillion to improve infrastructure. The primary headwind in April was inflation, as investors tried to determine the breadth and longevity of recent price increases. Developed Europe has been supported by a meaningful increase in the pace of vaccinations. Unfortunately many emerging market countries have not been as successful. India in particular saw COVID-19 cases surge, serving as an example of the need to get vaccinations rolled out to less developed nations.
Vaccine rollouts continued in May, leading to loosened restrictions globally. As a result, equity markets in general saw a minor increase in returns. Concerns that the continued economic rebound could result in inflation increases becoming more than transitory were supported by the higher input costs businesses were experiencing. Meanwhile, those inflation concerns were tempered by the U.S. Federal Reserve (Fed), which stayed steady on its view of the economy and eased fears of a sudden and substantial policy change. Positive performance in the emerging market equity space was supported this month by steady consumer demand and strong commodity prices. Fixed-income markets were also slightly positive for the month, driven by inflation uncertainty and a softer U.S. dollar.
June witnessed the S&P 500 Index reach a new all-time high. 2021 economic growth and inflation forecasts were revised higher to reflect a strong economic recovery and some supply and demand imbalances. Late June saw a deal reached on a U.S. infrastructure package of approximately $1 trillion for road, bridge, and broadband network upgrades over the next eight years. The Fed’s June meeting yielded no change to policy, but its projections pointed to a possible interest rate rise in 2023. This, combined with a rebound in economic activity and investors searching for yield, led to U.S. Treasury yields being down for the month. Many European and Asian countries saw vaccination momentum increase, while the U.K. dealt with a rise in COVID-19 infections, specifically the Delta variant. Meanwhile, crude oil jumped over 10% in June on the back of the pickup in global economic activity and the Organization of the Petroleum Exporting Countries’ (OPEC) slow pace of supply growth.
July began the month seeing vaccinations making progress, as several major developed countries eased restrictions, only to be threatened again by the spread of COVID-19’s Delta variant. Inflation continued to climb, aided by the continued supply bottleneck in the face of high demand. As it pertains to the equity area of the market, U.S. equities led the way in positive return territory followed by international developed markets. In contrast, emerging markets were well in negative territory for the month, hindered by China’s plans for new regulations on a number of sectors, specifically education and technology. The U.S. 10-year Treasury bond yield continued to decline as strong demand swallowed up supply. After hitting a multiyear high earlier in the month, oil prices leveled off following an agreement by OPEC to raise oil production starting in August.
Allspring VT Discovery Fund | 3
Letter to shareholders (unaudited)
“ Municipal debt experienced its first monthly performance drop since February of this year, slowing a rally that made it one of the best-performing sectors of the bond market.” |
The Delta variant of COVID-19 produced outbreaks globally in August, increasing the potential for increased market volatility and bringing into question the ongoing economic recovery. Domestically, the U.S. economy continued to stay strong in the face of the Delta variant, continued inflationary pressures, and worries over Hurricane Ida. Emerging market equities experienced elevated volatility, largely influenced by China’s regulatory stance. Emerging market equities started the month with poor performance but rebounded to end the month in positive territory. Municipal debt experienced its first monthly performance drop since February of this year, slowing a rally that made it one of the best-performing sectors of the bond market. In the commodity segment of the market, crude oil fell sharply during the month on the back of dampened expectations as a result of the Delta variant but was still a leading asset-class performer for the year.
Global markets suffered their broadest retreat in a year during September, with the exception of commodities. Concerns over inflation and the interest rate outlook depressed investor confidence and hurt performance. Emerging markets declined on concerns over the continued supply chain disruptions and worries over higher energy and food prices. Meanwhile, the Fed indicated it would slow the pace of asset purchases in the near future (pointing towards November). All eyes domestically are fixed on the raising of the debt ceiling, the 2022 budget plan, and the ongoing debate over the infrastructure package. Contrary to most asset classes, commodities thrived in September, driven by sharply higher energy prices.
October’s key themes continued to be elevated inflation pressures and a supply bottleneck, but strong earnings provided a bright spot in the markets. Earnings releases in the U.S. were generally strong and consumer confidence was high. The Fed reaffirmed its plans to taper quantitative easing to a stop by mid-2022. Meanwhile, elevated inflation figures were considered transitory by the Fed. Similar to the U.S., the eurozone and many Asian countries saw positive earnings but were facing inflation pressures caused by supply bottlenecks while also experiencing energy price increases amid natural gas shortages. Globally, government bond yields rose as central banks prepared to lower monetary policy accommodation in the face of rising inflationary pressures. As previously referenced, positive commodity performance was driven by sharply higher energy costs.
November was dominated by rising COVID-19 hospitalizations and concerns regarding the Omicron variant. Most major asset classes, both domestically and internationally, declined in November with two exceptions: U.S. investment-grade bonds and Treasury Inflation-Protected Securities. The United Nations Climate Change Conference (COP26) took place during the month with hopes of agreement among countries to limit global warming. While several initiatives were discussed, the conference ultimately ended without the specifics required to instill confidence that the limiting of global warming would succeed. In the U.S., President Biden signed a long-awaited infrastructure bill to upgrade U.S. roads, bridges, and railways. Meanwhile, the Consumer Price Index1, a measure of domestic inflation conditions, jumped to its highest level in 31 years. While the threat of consistently high inflation led the Fed to discuss a faster pace of tapering, the Omicron strain makes that less likely to occur. Commodities came in negative for the month, largely driven by sharp declines in oil prices (and energy costs in general) as well as precious metals.
Global volatility in December lessened as data indicated a lower risk of severe disease and death as a result of the Omicron variant. Even so, a number of countries introduced restrictions on sectors such as travel and hospitality to try to reduce the spread. In the U.S., data indicated that the overall domestic economy remains stable and corporate earnings remain robust. Consumer spending capability looks strong heading into 2022 on the back of elevated household savings and the lowest ratio of U.S. household liabilities to assets since 1973. U.S. corporate and high-yield bonds produced positive returns for the month while Treasuries declined. Bonds were strongly affected by the projection of three 25-basis-point (bp; 100 bps equal 1.00%) policy rate hikes in 2022 by senior Federal Open Market Committee members, contrary to just one hike as previously believed.
“ Bonds were strongly affected by the projection of three 25-basis-point (bp; 100 bps equal 1.00%) policy rate hikes in 2022 by senior Federal Open Market Committee members, contrary to just one hike as previously believed.”
| 1 | The Consumer Price Index (CPI) is a measure of the average change over time in the prices paid by urban consumers for a market basket of consumer goods and services. You cannot invest directly in an index. |
4 | Allspring VT Discovery Fund
Letter to shareholders (unaudited)
Don’t let short-term uncertainty derail long-term investment goals.
Periods of investment uncertainty can present challenges, but experience has taught us that maintaining long-term investment goals can be an effective way to plan for the future. To help you create a sound strategy based on your personal goals and risk tolerance, Allspring Funds offers more than 100 mutual funds spanning a wide range of asset classes and investment styles. Although diversification cannot guarantee an investment profit or prevent losses, we believe it can be an effective way to manage investment risk and potentially smooth out overall portfolio performance. We encourage investors to know their investments and to understand that appropriate levels of risk-taking may unlock opportunities.
Information on transaction closing.
On November 1, 2021, GTCR LLC and Reverence Capital Partners, L.P., announced the beginning of Allspring Global Investments™, with the close of the transaction to acquire Wells Fargo Funds Management, LLC; Wells Capital Management, LLC; Galliard Capital Management, LLC.; Wells Fargo Asset Management (International) Ltd.; Wells Fargo Asset Management Luxembourg S.A.; and Wells Fargo Funds Distributor, LLC, as well as Wells Fargo Bank, N.A.’s business of acting as trustee to its collective investment trusts and all related Wells Fargo Asset Management legal entities. The transaction closed on November 1, 2021, forming Allspring Global Investments, a privately held asset management firm with $575 billion in AUM1 as of December 31, 2021.
Allspring Global Investments™ is a leading independent asset management firm with a full breadth of investment capabilities across diverse asset classes, serving the needs of its institutional and wealth management clients around the world. Allspring operates across 18 offices globally supported by more than 480 investment professionals. Allspring and its investment teams provide a broad range of differentiated investment products and solutions to help its diverse range of clients meet their investment objectives.
As part of this transition, all mutual funds within the Wells Fargo Funds family were rebranded as Allspring Funds. Each individual fund had “Wells Fargo” removed from its fund name and replaced with “Allspring.” The fund name changes went into effect on December 6, 2021.
Allspring Global Investments is the trade name for the asset management firms of Allspring Global Investments Holdings, LLC, a holding company indirectly owned by certain private funds of GTCR LLC and Reverence Capital Partners, L.P.
Thank you for choosing to invest with Allspring Funds. We appreciate your confidence in us and remain committed to helping you meet your financial needs.
Sincerely,
Andrew Owen
President
Allspring Funds
For further information about your Fund, contact your investment professional, visit our website at allspringglobal.com, or call us directly at 1-800-222-8222.
| 1 | As of December 31, 2021, assets under management (AUM) includes $91.6 billion from Galliard Capital Management, LLC, an investment advisor that is not part of the Allspring trade name/GIPS firm. |
Allspring VT Discovery Fund | 5
Performance highlights (unaudited)
| Investment objective | The Fund seeks long-term capital appreciation. |
| Manager | Allspring Funds Management, LLC |
| Subadviser | Allspring Global Investments, LLC |
| Portfolio managers | Michael T. Smith, CFA®‡, Christopher J. Warner, CFA®‡ |
| Average annual total returns (%) as of December 31, 2021 |
| | | | | | Expense ratios1 (%) |
| | Inception date | 1 year | 5 year | 10 year | Gross | Net 2 |
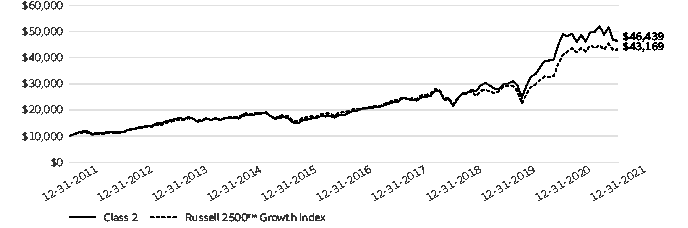
| Class 2 | 5-8-1992 | -5.04 | 20.84 | 16.60 | 1.14 | 1.14 |
| Russell 2500™ Growth Index3 | – | 5.04 | 17.65 | 15.75 | – | – |
| 1 | Reflects the expense ratios as stated in the most recent prospectus. The expense ratios shown are subject to change and may differ from the annualized expense ratios shown in the financial highlights of this report. |
| 2 | The manager has contractually committed through April 30, 2022, to waive fees and/or reimburse expenses to the extent necessary to cap total annual fund operating expenses after fee waivers at 1.15% for Class 2 shares. Brokerage commissions, stamp duty fees, interest, taxes, acquired fund fees and expenses (if any), and extraordinary expenses are excluded from the expense cap. Prior to or after the commitment expiration date, the cap may be increased or the commitment to maintain the cap may be terminated only with the approval of the Board of Trustees. Without this cap, the Fund’s returns would have been lower. The expense ratio paid by an investor is the net expense ratio (the total annual fund operating expenses after fee waivers) as stated in the prospectus. |
| 3 | The Russell 2500™ Growth Index measures the performance of those Russell 2500 companies with higher price/book ratios and higher forecasted growth values. You cannot invest directly in an index. |
Figures quoted represent past performance, which is no guarantee of future results. Investment return and principal value of an investment will fluctuate so that an investor’s shares, when redeemed, may be worth more or less than their original cost. Current performance may be lower or higher than the performance data quoted and assumes the reinvestment of dividends and capital gains. Current month-end performance is available by calling 1-800-260-5969. Performance figures of the Fund do not reflect fees and expenses charged pursuant to the terms of variable life insurance policies and variable annuity contracts. If these fees and expenses had been reflected, performance would have been lower.
Index returns do not include transaction costs associated with buying and selling securities, any mutual fund fees or expenses, or any taxes. It is not possible to invest directly in an index.
Shares are sold without a front-end sales charge or contingent deferred sales charge.
Stock values fluctuate in response to the activities of individual companies and general market and economic conditions. Smaller-company stocks tend to be more volatile and less liquid than those of larger companies. Certain investment strategies tend to increase the total risk of an investment (relative to the broader market). This fund is exposed to foreign investment risk. Consult the Fund’s prospectus for additional information on these and other risks.
Please refer to the prospectus provided by your participating insurance company for detailed information describing the separate accounts for information regarding surrender charges, mortality and expense risk fees, and other charges that may be assessed by the participating insurance companies.
| ‡ | CFA® and Chartered Financial Analyst® are trademarks owned by CFA Institute. |
6 | Allspring VT Discovery Fund
Performance highlights (unaudited)
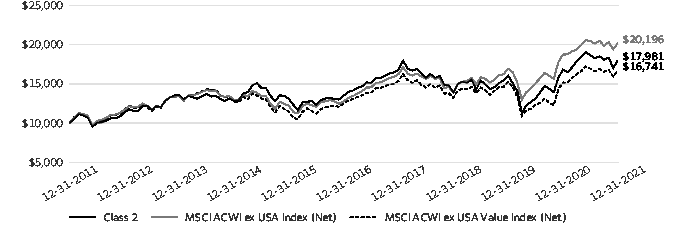
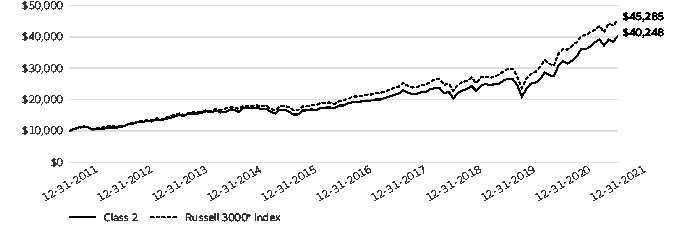
Growth of $10,000 investment as of December 31, 20211
| 1 | The chart compares the performance of Class 2 shares for the most recent ten years with the Russell 2500™ Growth Index. The chart assumes a hypothetical investment of $10,000 in Class 2 shares and reflects all operating expenses of the Fund but does not reflect fees and expenses charged pursuant to the terms of variable life insurance policies and variable annuity contracts. |
Allspring VT Discovery Fund | 7
Performance highlights (unaudited)
MANAGER'S DISCUSSION
Fund highlights
| ■ | The Fund underperformed its benchmark, the Russell 2500™ Growth Index, for the 12-month period that ended December 31, 2021. |
| ■ | Stock selection within the information technology (IT) and consumer discretionary sectors detracted from relative performance. |
| ■ | Security selection in the industrials sector contributed to the Fund’s results. |
From pandemic to reflation to caution.
For much of the past year, the U.S. economy experienced a sharp recovery fueled by optimism over the COVID-19 vaccine, the reopening of global economies, and a high level of policy stimulus. Within U.S. equities, leadership was tilted toward cyclicals and interest rate sensitive securities as long term inflation expectations spiked upward.
Later in the year, however, this exuberance dissipated as variants of COVID-19 emerged and renewed fears of global shutdowns. Labor shortages and supply chain constraints contributed to persistently high inflation and brought about hawkish signaling by the U.S. Federal Reserve Board, which announced that tapering of asset purchases would begin imminently. This triggered a rise in Treasury yields and contributed to a high level of overall market volatility as the year came to an end.
Despite the heightened volatility, we did not significantly reposition the Fund. Our investment process has long focused on companies harnessing innovation to create superior long-term growth. The Fund remains positioned toward companies that we believe are situated on the right side of change.
| Ten largest holdings (%) as of December 31, 20211 |
| MongoDB Incorporated | 3.50 |
| Five9 Incorporated | 2.98 |
| Bill.com Holdings Incorporated | 2.78 |
| Globant SA | 2.67 |
| MercadoLibre Incorporated | 2.44 |
| Black Knight Incorporated | 2.37 |
| SiteOne Landscape Supply Incorporated | 2.33 |
| Teledyne Technologies Incorporated | 2.25 |
| Saia Incorporated | 2.15 |
| Generac Holdings Incorporated | 2.15 |
| 1 | Figures represent the percentage of the Fund's net assets. Holdings are subject to change and may have changed since the date specified. |
Stock selection within IT and health care detracted from relative performance.
StoneCo. Limited, a detractor in IT, provides software and digital payment solutions to small and medium-size companies in Brazil. A failure within Brazil’s national registry for credit receivables resulted in an abnormally high volume of defaulted loans for StoneCo. Additionally, the global pandemic weighed heavily on consumers as elevated infection rates led to shuttered retail locations and escalating inflation reduced demand. As a result, transactions and margins were compressed for StoneCo. We continue to hold the position as we believe StoneCo.’s platform is providing indispensable solutions to Brazil’s economy; however, we are closely monitoring fundamentals.
Within health care, iRhythm Technologies, Incorporated, developed a next-generation monitoring device for patients with heart irregularities. In addition to extreme volatility in Medicare reimbursement rates, iRhythm’s experienced CEO unexpectedly announced his immediate departure. These factors triggered our sell discipline and exited the position for higher-conviction ideas.
Security selection within the industrials sector contributed to relative performance.
Within industrials, Saia, Incorporated, is a short-haul trucking company that specializes in e-commerce order fulfillment. The company is strategically expanding its network of terminals to meet demand. Despite rising costs, Saia exceeded revenue and operating income estimates during the year and announced a partnership to trial electric fleet trucks in Portland.
Generac Holdings Inc. provides commercial and residential generators and backup solar power solutions. In addition to backup generators, Generac has created a hybrid inverter for solar power, which has the capability to harvest and store solar energy. The company announced plans to increase capacity throughout the year to meet the rapid rise in demand for its products and reduce lead times. With innovative and high quality products to competitors, Generac is leading the industry in backup and solar power solutions.
8 | Allspring VT Discovery Fund
Performance highlights (unaudited)
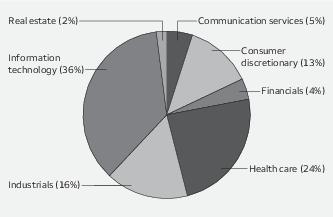
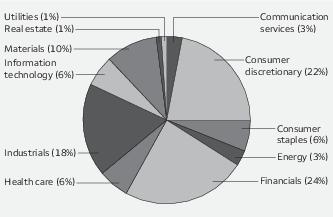
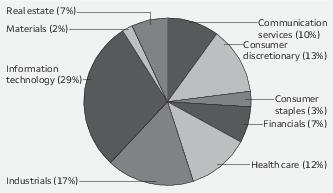
| Sector allocation as of December 31, 20211 |
| 1 | Figures represent the percentage of the Fund's long-term investments. These amounts are subject to change and may have changed since the date specified. |
Disruption created compelling long-term opportunities.
Over the past year, market sentiment has wavered violently as investors grappled with when the world will fully emerge
from the pandemic. These rotations have been primarily fueled by macro headlines and have shifted leadership generally toward cyclical industries. It is our experience that attempting to time such short-term macro rotations is not a way to deliver consistent long-term performance.
As investors focused on innovation and disruption, we look for companies that can compound growth well beyond the current “trade.” It is our experience that fundamentals—not narratives—are truly what drive stock prices in the long run. By emphasizing companies on the “right side of change,” we are well positioned to take advantage of the massive shift from internet technologies and cloud computing, which are still in early stages of mass adoption.
As the economy and inflation ultimately cool down, disruptive growth stocks should be rewarded with premium valuations deserving of their scarce attributes. Deep fundamental research is needed to identify who is winning and losing in a world of rapid disruption. While we anticipate that inflationary pressures, taper talks, and supply chains will continue to influence sentiment over the next year, we remain confident that “right side of change” companies will generate long-term superior returns for our clients.
Allspring VT Discovery Fund | 9
Fund expenses (unaudited)
As a shareholder of the Fund, you incur ongoing costs, including management fees, distribution (12b-1) fees, and other Fund expenses. This example is intended to help you understand your ongoing costs (in dollars) of investing in the Fund and to compare these costs with the ongoing costs of investing in other mutual funds.
The example is based on an investment of $1,000 invested at the beginning of the six-month period and held for the entire period from July 1, 2021 to December 31, 2021.
Actual expenses
The “Actual” line of the table below provides information about actual account values and actual expenses. You may use the information in this line, together with the amount you invested, to estimate the expenses that you paid over the period. Simply divide your account value by $1,000 (for example, an $8,600 account value divided by $1,000 = 8.6), then multiply the result by the number in the “Actual” line under the heading entitled “Expenses paid during period” for your applicable class of shares to estimate the expenses you paid on your account during this period.
Hypothetical example for comparison purposes
The “Hypothetical” line of the table below provides information about hypothetical account values and hypothetical expenses based on the Fund’s actual expense ratio and an assumed rate of return of 5% per year before expenses, which is not the Fund’s actual return. The hypothetical account values and expenses may not be used to estimate the actual ending account balance or expenses you paid for the period. You may use this information to compare the ongoing costs of investing in the Fund and other funds. To do so, compare this 5% hypothetical example with the 5% hypothetical examples that appear in the shareholder reports of the other funds.
Please note that the expenses shown in the table are meant to highlight your ongoing costs only and do not reflect any separate account charges assessed by participating insurance companies. Therefore, the “Hypothetical” line of the table is useful in comparing ongoing costs only, and will not help you determine the relative total costs of owning different funds. In addition, if these separate account charges assessed by participating insurance companies were included, your costs would have been higher.
| | Beginning
account value
7-1-2021 | Ending
account value
12-31-2021 | Expenses
paid during
the period1 | Annualized net
expense ratio |
| Class 2 | | | | |
| Actual | $1,000.00 | $ 933.12 | $5.51 | 1.13% |
| Hypothetical (5% return before expenses) | $1,000.00 | $1,019.51 | $5.75 | 1.13% |
1 Expenses paid is equal to the annualized net expense ratio multiplied by the average account value over the period, multiplied by the number of days in the most recent fiscal half-year divided by the number of days in the fiscal year (to reflect the one-half-year period).
10 | Allspring VT Discovery Fund
Portfolio of investments—December 31, 2021
| | | | | Shares | Value |
| Common stocks: 99.30% | | | | | |
| Communication services: 5.44% | | | | | |
| Entertainment: 1.22% | | | | | |
| Roku Incorporated † | | | | 11,800 | $ 2,692,760 |
| Interactive media & services: 4.22% | | | | | |
| Bumble Incorporated Class A † | | | | 68,400 | 2,316,024 |
| IAC/InterActiveCorp | | | | 22,472 | 2,937,315 |
| ZoomInfo Technologies Incorporated † | | | | 63,500 | 4,076,700 |
| | | | | | 9,330,039 |
| Consumer discretionary: 12.69% | | | | | |
| Diversified consumer services: 1.16% | | | | | |
| Mister Car Wash Incorporated †« | | | | 140,630 | 2,560,872 |
| Hotels, restaurants & leisure: 3.34% | | | | | |
| Chipotle Mexican Grill Incorporated † | | | | 2,700 | 4,720,275 |
| Domino's Pizza Incorporated | | | | 4,694 | 2,648,965 |
| | | | | | 7,369,240 |
| Internet & direct marketing retail: 5.88% | | | | | |
| Etsy Incorporated † | | | | 15,711 | 3,439,766 |
| Global-E Online Limited †« | | | | 65,300 | 4,139,367 |
| MercadoLibre Incorporated † | | | | 4,003 | 5,397,645 |
| | | | | | 12,976,778 |
| Leisure products: 1.50% | | | | | |
| Callaway Golf Company † | | | | 121,010 | 3,320,514 |
| Textiles, apparel & luxury goods: 0.81% | | | | | |
| On Holding AG Class A †« | | | | 47,200 | 1,784,632 |
| Financials: 3.78% | | | | | |
| Banks: 0.92% | | | | | |
| Silvergate Capital Corporation Class A † | | | | 13,700 | 2,030,340 |
| Capital markets: 1.45% | | | | | |
| MarketAxess Holdings Incorporated | | | | 7,800 | 3,207,906 |
| Insurance: 1.41% | | | | | |
| Goosehead Insurance Incorporated Class A | | | | 23,946 | 3,114,896 |
| Health care: 23.72% | | | | | |
| Biotechnology: 5.36% | | | | | |
| Ascendis Pharma AS ADR † | | | | 10,948 | 1,472,834 |
| CRISPR Therapeutics AG † | | | | 11,427 | 865,938 |
| Mirati Therapeutics Incorporated † | | | | 10,500 | 1,540,245 |
| Natera Incorporated † | | | | 39,323 | 3,672,375 |
| ORIC Pharmaceuticals Incorporated † | | | | 40,140 | 590,058 |
| Turning Point Therapeutics Incorporated † | | | | 22,637 | 1,079,785 |
| Twist Bioscience Corporation † | | | | 16,310 | 1,262,231 |
| Zentalis Pharmaceuticals Incorporated † | | | | 16,200 | 1,361,772 |
| | | | | | 11,845,238 |
The accompanying notes are an integral part of these financial statements.
Allspring VT Discovery Fund | 11
Portfolio of investments—December 31, 2021
| | | | | Shares | Value |
| Health care equipment & supplies: 9.48% | | | | | |
| ABIOMED Incorporated † | | | | 7,000 | $ 2,514,190 |
| DexCom Incorporated † | | | | 7,400 | 3,973,430 |
| Heska Corporation † | | | | 13,632 | 2,487,704 |
| Inari Medical Incorporated † | | | | 47,900 | 4,371,833 |
| Insulet Corporation † | | | | 11,699 | 3,112,753 |
| Shockwave Medical Incorporated † | | | | 25,052 | 4,467,523 |
| | | | | | 20,927,433 |
| Health care providers & services: 3.97% | | | | | |
| Amedisys Incorporated † | | | | 20,954 | 3,392,034 |
| Oak Street Health Incorporated †« | | | | 53,824 | 1,783,727 |
| Option Care Health Incorporated † | | | | 126,500 | 3,597,660 |
| | | | | | 8,773,421 |
| Health care technology: 1.70% | | | | | |
| Doximity Incorporated Class A †« | | | | 32,531 | 1,630,779 |
| Inspire Medical Systems Incorporated † | | | | 9,200 | 2,116,552 |
| | | | | | 3,747,331 |
| Life sciences tools & services: 3.21% | | | | | |
| 10x Genomics Incorporated Class A † | | | | 26,200 | 3,902,752 |
| Bio-Rad Laboratories Incorporated Class A † | | | | 4,200 | 3,173,394 |
| | | | | | 7,076,146 |
| Industrials: 15.99% | | | | | |
| Aerospace & defense: 1.96% | | | | | |
| Axon Enterprise Incorporated † | | | | 27,500 | 4,317,500 |
| Building products: 3.58% | | | | | |
| Advanced Drainage Systems Incorporated | | | | 25,400 | 3,457,702 |
| Trex Company Incorporated † | | | | 32,900 | 4,442,487 |
| | | | | | 7,900,189 |
| Commercial services & supplies: 2.12% | | | | | |
| Casella Waste Systems Incorporated Class A † | | | | 54,919 | 4,691,181 |
| Electrical equipment: 2.15% | | | | | |
| Generac Holdings Incorporated † | | | | 13,500 | 4,750,920 |
| Professional services: 1.70% | | | | | |
| Clarivate plc † | | | | 159,611 | 3,754,051 |
| Road & rail: 2.15% | | | | | |
| Saia Incorporated † | | | | 14,100 | 4,752,123 |
| Trading companies & distributors: 2.33% | | | | | |
| SiteOne Landscape Supply Incorporated † | | | | 21,261 | 5,151,115 |
| Information technology: 35.75% | | | | | |
| Electronic equipment, instruments & components: 5.44% | | | | | |
| Cognex Corporation | | | | 43,000 | 3,343,680 |
| Novanta Incorporated † | | | | 21,000 | 3,702,930 |
| Teledyne Technologies Incorporated † | | | | 11,400 | 4,980,546 |
| | | | | | 12,027,156 |
The accompanying notes are an integral part of these financial statements.
12 | Allspring VT Discovery Fund
Portfolio of investments—December 31, 2021
| | | | | Shares | Value |
| IT services: 10.20% | | | | | |
| EPAM Systems Incorporated † | | | | 4,119 | $ 2,753,346 |
| Globant SA † | | | | 18,800 | 5,904,892 |
| Marqeta Incorporated † | | | | 100,900 | 1,732,453 |
| MongoDB Incorporated † | | | | 14,600 | 7,728,510 |
| StoneCo Limited Class A † | | | | 53,819 | 907,388 |
| WNS Holdings Limited ADR † | | | | 39,700 | 3,502,334 |
| | | | | | 22,528,923 |
| Semiconductors & semiconductor equipment: 5.43% | | | | | |
| Brooks Automation Incorporated | | | | 28,000 | 2,887,080 |
| Enphase Energy Incorporated † | | | | 22,400 | 4,097,856 |
| Impinj Incorporated † | | | | 23,600 | 2,093,320 |
| MKS Instruments Incorporated | | | | 16,700 | 2,908,639 |
| | | | | | 11,986,895 |
| Software: 14.68% | | | | | |
| Avalara Incorporated † | | | | 27,300 | 3,524,703 |
| Bill.com Holdings Incorporated † | | | | 24,666 | 6,145,534 |
| Black Knight Incorporated † | | | | 63,100 | 5,230,359 |
| Crowdstrike Holdings Incorporated Class A † | | | | 16,700 | 3,419,325 |
| Elastic NV † | | | | 31,100 | 3,828,099 |
| Five9 Incorporated † | | | | 47,900 | 6,577,628 |
| Lightspeed Commerce Incorporated † | | | | 51,200 | 2,070,016 |
| Olo Incorporated Class A † | | | | 77,600 | 1,614,856 |
| | | | | | 32,410,520 |
| Real estate: 1.93% | | | | | |
| Equity REITs: 1.93% | | | | | |
| Rexford Industrial Realty Incorporated | | | | 52,400 | 4,250,164 |
| Total Common stocks (Cost $160,959,407) | | | | | 219,278,283 |
| | | Yield | | | |
| Short-term investments: 6.29% | | | | | |
| Investment companies: 6.29% | | | | | |
| Allspring Government Money Market Fund Select Class ♠∞ | | 0.03% | | 2,530,623 | 2,530,623 |
| Securities Lending Cash Investments LLC ♠∩∞ | | 0.07 | | 11,352,850 | 11,352,850 |
| Total Short-term investments (Cost $13,883,473) | | | | | 13,883,473 |
| Total investments in securities (Cost $174,842,880) | 105.59% | | | | 233,161,756 |
| Other assets and liabilities, net | (5.59) | | | | (12,338,876) |
| Total net assets | 100.00% | | | | $220,822,880 |
| † | Non-income-earning security |
| « | All or a portion of this security is on loan. |
| ♠ | The issuer of the security is an affiliated person of the Fund as defined in the Investment Company Act of 1940. |
| ∩ | The investment is a non-registered investment company purchased with cash collateral received from securities on loan. |
| ∞ | The rate represents the 7-day annualized yield at period end. |
| Abbreviations: |
| ADR | American depositary receipt |
| REIT | Real estate investment trust |
The accompanying notes are an integral part of these financial statements.
Allspring VT Discovery Fund | 13
Portfolio of investments—December 31, 2021
Investments in affiliates
An affiliated investment is an investment in which the Fund owns at least 5% of the outstanding voting shares of the issuer or as a result of other relationships, such as the Fund and the issuer having the same investment manager. Transactions with issuers that were either affiliates of the Fund at the beginning of the period or the end of the period were as follows:
| | Value,
beginning of
period | Purchases | Sales
proceeds | Net
realized
gains
(losses) | | Net
change in
unrealized
gains
(losses) | | Value,
end of
period | Shares,
end
of period | Income
from
affiliated
securities |
| Short-term investments | | | | | | | | | |
| Allspring Government Money Market Fund Select Class | $3,400,578 | $59,272,229 | $(60,142,184) | $0 | | $0 | | $ 2,530,623 | 2,530,623 | $ 908 |
| Securities Lending Cash Investments LLC | 3,816,800 | 93,220,742 | (85,684,692) | 0 | | 0 | | 11,352,850 | 11,352,850 | 2,366 # |
| | | | | $0 | | $0 | | $13,883,473 | | $3,274 |
| # | Amount shown represents income before fees and rebates. |
The accompanying notes are an integral part of these financial statements.
14 | Allspring VT Discovery Fund
Statement of assets and liabilities—December 31, 2021
| | |
| Assets | |
Investments in unaffiliated securities (including $10,952,598 of securities loaned), at value (cost $160,959,407)
| $ 219,278,283 |
Investments in affiliated securities, at value (cost $13,883,473)
| 13,883,473 |
Cash
| 1,364,370 |
Receivable for Fund shares sold
| 67,707 |
Receivable for dividends
| 12,657 |
Receivable for securities lending income, net
| 2,873 |
Prepaid expenses and other assets
| 3,137 |
Total assets
| 234,612,500 |
| Liabilities | |
Payable upon receipt of securities loaned
| 11,352,850 |
Payable for investments purchased
| 2,074,572 |
Management fee payable
| 147,423 |
Payable for Fund shares redeemed
| 137,434 |
Distribution fee payable
| 49,064 |
Administration fee payable
| 15,725 |
Trustees’ fees and expenses payable
| 2,675 |
Accrued expenses and other liabilities
| 9,877 |
Total liabilities
| 13,789,620 |
Total net assets
| $220,822,880 |
| Net assets consist of | |
Paid-in capital
| $ 111,509,806 |
Total distributable earnings
| 109,313,074 |
Total net assets
| $220,822,880 |
| Computation of net asset value per share | |
Net assets – Class 2
| $ 220,822,880 |
Share outstanding – Class 21
| 5,166,498 |
Net asset value per share – Class 2
| $42.74 |
| 1 | The Fund has an unlimited number of authorized shares. |
The accompanying notes are an integral part of these financial statements.
Allspring VT Discovery Fund | 15
Statement of operations—year ended December 31, 2021
| | |
| Investment income | |
Dividends
| $ 199,811 |
Securities lending income (including from affiliate), net
| 41,723 |
Income from affiliated securities
| 908 |
Total investment income
| 242,442 |
| Expenses | |
Management fee
| 1,811,675 |
Administration fee – Class 2
| 193,245 |
Distribution fee – Class 2
| 603,253 |
Custody and accounting fees
| 23,137 |
Professional fees
| 48,962 |
Shareholder report expenses
| 26,990 |
Trustees’ fees and expenses
| 19,219 |
Other fees and expenses
| 6,300 |
Total expenses
| 2,732,781 |
Net investment loss
| (2,490,339) |
| Realized and unrealized gains (losses) on investments | |
Net realized gains on investments
| 51,123,731 |
Net change in unrealized gains (losses) on investments
| (60,409,976) |
Net realized and unrealized gains (losses) on investments
| (9,286,245) |
Net decrease in net assets resulting from operations
| $(11,776,584) |
The accompanying notes are an integral part of these financial statements.
16 | Allspring VT Discovery Fund
Statement of changes in net assets
| | | | | |
| | Year ended
December 31, 2021 | Year ended
December 31, 2020 |
| Operations | | | | |
Net investment loss
| | $ (2,490,339) | | $ (1,764,482) |
Net realized gains on investments
| | 51,123,731 | | 17,877,734 |
Net change in unrealized gains (losses) on investments
| | (60,409,976) | | 82,373,027 |
Net increase (decrease) in net assets resulting from operations
| | (11,776,584) | | 98,486,279 |
| Distributions to shareholders from | | | | |
Net investment income and net realized gains – Class 2
| | (17,942,862) | | (16,114,396) |
| Capital share transactions | Shares | | Shares | |
Proceeds from shares sold – Class 2
| 455,338 | 21,604,014 | 674,102 | 24,912,455 |
Reinvestment of distributions – Class 2
| 410,216 | 17,942,862 | 468,578 | 16,114,396 |
Payment for shares redeemed – Class 2
| (952,059) | (44,958,194) | (1,018,571) | (35,934,160) |
Net increase (decrease) in net assets resulting from capital share transactions
| | (5,411,318) | | 5,092,691 |
Total increase (decrease) in net assets
| | (35,130,764) | | 87,464,574 |
| Net assets | | | | |
Beginning of period
| | 255,953,644 | | 168,489,070 |
End of period
| | $220,822,880 | | $255,953,644 |
The accompanying notes are an integral part of these financial statements.
Allspring VT Discovery Fund | 17
Financial highlights
(For a share outstanding throughout each period)
| | Year ended December 31 |
| Class 2 | 2021 | 2020 | 2019 | 2018 | 2017 |
Net asset value, beginning of period
| $48.73 | $32.85 | $26.14 | $31.74 | $25.91 |
Net investment loss
| (0.48) | (0.34) | (0.25) | (0.17) | (0.20) |
Net realized and unrealized gains (losses) on investments
| (1.89) | 19.54 | 10.47 | (1.39) | 7.60 |
Total from investment operations
| (2.37) | 19.20 | 10.22 | (1.56) | 7.40 |
| Distributions to shareholders from | | | | | |
Net realized gains
| (3.62) | (3.32) | (3.51) | (4.04) | (1.57) |
Net asset value, end of period
| $42.74 | $48.73 | $32.85 | $26.14 | $31.74 |
Total return1
| (5.04)% | 62.65% | 39.02% | (7.06)% | 29.13% |
| Ratios to average net assets (annualized) | | | | | |
Gross expenses
| 1.13% | 1.14% | 1.16% | 1.16% | 1.16% |
Net expenses
| 1.13% | 1.14% | 1.15% | 1.15% | 1.15% |
Net investment loss
| (1.03)% | (0.93)% | (0.79)% | (0.55)% | (0.68)% |
| Supplemental data | | | | | |
Portfolio turnover rate
| 57% | 47% | 71% | 60% | 75% |
Net assets, end of period (000s omitted)
| $220,823 | $255,954 | $168,489 | $125,806 | $145,175 |
| 1 | Returns do not reflect fees and expenses charged pursuant to the terms of variable life insurance policies and variable annuity contracts. |
The accompanying notes are an integral part of these financial statements.
18 | Allspring VT Discovery Fund
Notes to financial statements
1. ORGANIZATION
Allspring Variable Trust (the "Trust"), a Delaware statutory trust organized on March 10, 1999, is an open-end management investment company registered under the Investment Company Act of 1940, as amended (the "1940 Act"). As an investment company, the Trust follows the accounting and reporting guidance in Financial Accounting Standards Board ("FASB") Accounting Standards Codification Topic 946, Financial Services – Investment Companies. These financial statements report on the Allspring VT Discovery Fund (the "Fund") which is a diversified series of the Trust. The Trust offers shares of the Fund to separate accounts of various life insurance companies as funding vehicles for certain variable annuity contracts and variable life insurance policies.
Effective on November 1, 2021, the sale transaction of Wells Fargo Asset Management ("WFAM") by Wells Fargo & Company to GTCR LLC and Reverence Capital Partners, L.P. was closed. In connection with the closing of the transaction, WFAM became known as Allspring Global Investments (“Allspring”) and various entities that provided services to the Fund changed their names to "Allspring", including Allspring Funds Management, LLC, the investment manager to the Fund, Allspring Global Investments, LLC and Allspring Global Investments (UK) Limited, both registered investment advisers providing subadvisory services to certain funds, and Allspring Funds Distributor, LLC, the Fund's principal underwriter. Consummation of the transaction resulted in a new investment management agreement and subadvisory agreement which became effective on November 1, 2021.
2. SIGNIFICANT ACCOUNTING POLICIES
The following significant accounting policies, which are consistently followed in the preparation of the financial statements of the Fund, are in conformity with U.S. generally accepted accounting principles which require management to make estimates and assumptions that affect the reported amounts of assets and liabilities, disclosure of contingent assets and liabilities at the date of the financial statements, and the reported amounts of income and expenses during the reporting period. Actual results could differ from those estimates.
Securities valuation
All investments are valued each business day as of the close of regular trading on the New York Stock Exchange (generally 4 p.m. Eastern Time), although the Fund may deviate from this calculation time under unusual or unexpected circumstances.
Equity securities that are listed on a foreign or domestic exchange or market are valued at the official closing price or, if none, the last sales price. If no sale occurs on the principal exchange or market that day, a fair value price will be determined in accordance with the Fund’s Valuation Procedures.
Investments in registered open-end investment companies are valued at net asset value. Interests in non-registered investment companies that are redeemable at net asset value are fair valued normally at net asset value.
Investments which are not valued using any of the methods discussed above are valued at their fair value, as determined in good faith by the Board of Trustees. The Board of Trustees has established a Valuation Committee comprised of the Trustees and has delegated to it the authority to take any actions regarding the valuation of portfolio securities that the Valuation Committee deems necessary or appropriate, including determining the fair value of portfolio securities, unless the determination has been delegated to the Allspring Global Investments Pricing Committee at Allspring Funds Management, LLC ("Allspring Funds Management"). The Board of Trustees retains the authority to make or ratify any valuation decisions or approve any changes to the Valuation Procedures as it deems appropriate. On a quarterly basis, the Board of Trustees receives reports on any valuation actions taken by the Valuation Committee or the Allspring Global Investments Pricing Committee which may include items for ratification.
Securities lending
The Fund may lend its securities from time to time in order to earn additional income in the form of fees or interest on securities received as collateral or the investment of any cash received as collateral. When securities are on loan, the Fund receives interest or dividends on those securities. Cash collateral received in connection with its securities lending transactions is invested in Securities Lending Cash Investments, LLC (the "Securities Lending Fund"), an affiliated non-registered investment company. Investments in Securities Lending Fund are valued at the evaluated bid price provided by an independent pricing service. Income earned from investment in the Securities Lending Fund, if any, is included in securities lending income (including from affiliate) (net of fees and rebates) on the Statement of Operations.
In a securities lending transaction, the net asset value of the Fund is affected by an increase or decrease in the value of the securities loaned and by an increase or decrease in the value of the instrument in which collateral is invested. The amount of securities lending activity undertaken by the Fund fluctuates from time to time. The Fund has the right under the lending agreement to recover the securities from the borrower on demand. In the event of default or bankruptcy by the borrower, the
Allspring VT Discovery Fund | 19
Notes to financial statements
Fund may be prevented from recovering the loaned securities or gaining access to the collateral or may experience delays or costs in doing so. In such an event, the terms of the agreement allow the unaffiliated securities lending agent to use the collateral to purchase replacement securities on behalf of the Fund or pay the Fund the market value of the loaned securities. The Fund bears the risk of loss with respect to depreciation of its investment of the cash collateral.
Security transactions and income recognition
Securities transactions are recorded on a trade date basis. Realized gains or losses are recorded on the basis of identified cost.
Dividend income is recognized on the ex-dividend date.
Distributions to shareholders
Distributions to shareholders from net investment income and any net realized gains are recorded on the ex-dividend date and paid at least annually. Such distributions are determined in accordance with income tax regulations and may differ from U.S. generally accepted accounting principles. Dividend sources are estimated at the time of declaration. The tax character of distributions is determined as of the Fund's fiscal year end. Therefore, a portion of the Fund's distributions made prior to the Fund’s fiscal year end may be categorized as a tax return of capital at year end.
Federal and other taxes
The Fund intends to continue to qualify as a regulated investment company by distributing substantially all of its investment company taxable income and any net realized capital gains (after reduction for capital loss carryforwards) sufficient to relieve it from all, or substantially all, federal income taxes. Accordingly, no provision for federal income taxes was required.
The Fund’s income and federal excise tax returns and all financial records supporting those returns for the prior three fiscal years are subject to examination by the federal and Delaware revenue authorities. Management has analyzed the Fund's tax positions taken on federal, state, and foreign tax returns for all open tax years and does not believe that there are any uncertain tax positions that require recognition of a tax liability.
As of December 31, 2021, the aggregate cost of all investments for federal income tax purposes was $174,956,909 and the unrealized gains (losses) consisted of:
| Gross unrealized gains | $ 71,007,338 |
| Gross unrealized losses | (12,802,491) |
| Net unrealized gains | $ 58,204,847 |
Reclassifications are made to the Fund’s capital accounts for permanent tax differences to reflect income and gains available for distribution (or available capital loss carryforwards) under federal income tax regulations. U.S. generally accepted accounting principles require that certain components of net assets be adjusted to reflect permanent differences between financial and tax reporting. These reclassifications have no effect on net assets or net asset values per share. The primary permanent difference causing such reclassification is due to net operating loss. At December 31, 2021, as a result of permanent book-to-tax differences, the following reclassification adjustments were made on the Statement of Assets and Liabilities:
| Paid-in capital | Total distributable
earnings |
| $(2,541,539) | $2,541,539 |
20 | Allspring VT Discovery Fund
Notes to financial statements
3. FAIR VALUATION MEASUREMENTS
Fair value measurements of investments are determined within a framework that has established a fair value hierarchy based upon the various data inputs utilized in determining the value of the Fund’s investments. The three-level hierarchy gives the highest priority to unadjusted quoted prices in active markets for identical assets or liabilities (Level 1) and the lowest priority to unobservable inputs (Level 3). The Fund’s investments are classified within the fair value hierarchy based on the lowest level of input that is significant to the fair value measurement. The inputs are summarized into three broad levels as follows:
| ■ | Level 1 – quoted prices in active markets for identical securities |
| ■ | Level 2 – other significant observable inputs (including quoted prices for similar securities, interest rates, prepayment speeds, credit risk, etc.) |
| ■ | Level 3 – significant unobservable inputs (including the Fund’s own assumptions in determining the fair value of investments) |
The inputs or methodologies used for valuing investments in securities are not necessarily an indication of the risk associated with investing in those securities.
The following is a summary of the inputs used in valuing the Fund’s assets and liabilities as of December 31, 2021:
| | Quoted prices
(Level 1) | Other significant
observable inputs
(Level 2) | Significant
unobservable inputs
(Level 3) | Total |
| Assets | | | | |
| Investments in: | | | | |
| Common stocks | | | | |
| Communication services | $ 12,022,799 | $0 | $0 | $ 12,022,799 |
| Consumer discretionary | 28,012,036 | 0 | 0 | 28,012,036 |
| Financials | 8,353,142 | 0 | 0 | 8,353,142 |
| Health care | 52,369,569 | 0 | 0 | 52,369,569 |
| Industrials | 35,317,079 | 0 | 0 | 35,317,079 |
| Information technology | 78,953,494 | 0 | 0 | 78,953,494 |
| Real estate | 4,250,164 | 0 | 0 | 4,250,164 |
| Short-term investments | | | | |
| Investment companies | 13,883,473 | 0 | 0 | 13,883,473 |
| Total assets | $233,161,756 | $0 | $0 | $233,161,756 |
Additional sector, industry or geographic detail, if any, is included in the Portfolio of Investments.
For the year ended December 31, 2021, the Fund did not have any transfers into/out of Level 3.
4. TRANSACTIONS WITH AFFILIATES
Management fee
Allspring Funds Management, a wholly owned subsidiary of Allspring Global Investments Holdings, LLC, a holding company indirectly owned by certain private funds of GTCR LLC and Reverence Capital Partners, L.P., is the manager of the Fund and provides advisory and fund-level administrative services under an investment management agreement. Under the investment management agreement, Allspring Funds Management is responsible for, among other services, implementing the investment objectives and strategies of the Fund, supervising the subadviser and providing fund-level administrative services in connection with the Fund’s operations. As compensation for its services under the investment management agreement, Allspring Funds Management is entitled to receive a management fee at the following annual rate based on the Fund’s average daily net assets:
Allspring VT Discovery Fund | 21
Notes to financial statements
| Average daily net assets | Management fee |
| First $500 million | 0.750% |
| Next $500 million | 0.700 |
| Next $1 billion | 0.650 |
| Next $2 billion | 0.625 |
| Next $1 billion | 0.600 |
| Next $5 billion | 0.590 |
| Over $10 billion | 0.580 |
For the year ended December 31, 2021, the management fee was equivalent to an annual rate of 0.75% of the Fund’s average daily net assets.
Allspring Funds Management has retained the services of a subadviser to provide daily portfolio management to the Fund. The fee for subadvisory services is borne by Allspring Funds Management. Allspring Global Investments, LLC ("Allspring Investments"), an affiliate of Allspring Funds Management and a wholly owned subsidiary of Allspring Global Investments Holdings, LLC, is the subadviser to the Fund and is entitled to receive a fee from Allspring Funds Management at an annual rate starting at 0.45% and declining to 0.35% as the average daily net assets of the Fund increase.
Administration fee
Under a class-level administration agreement, Allspring Funds Management provides class-level administrative services to the Fund, which includes paying fees and expenses for services provided by the transfer agent, sub-transfer agents, omnibus account servicers and record-keepers. As compensation for its services under the class-level administration agreement, Allspring Funds Management receives an annual fee of 0.08% which is calculated based on the average daily net assets of Class 2 shares.
Waivers and/or expense reimbursements
Allspring Funds Management has contractually committed through April 30, 2022 to waive fees and/or reimburse management and administration fees to the extent necessary to cap the Fund’s expenses at 1.15% for Class 2 shares. Prior to or after the commitment expiration date, the cap may be increased or the commitment to maintain the cap may be terminated only with the approval of the Board of Trustees.
Distribution fee
The Trust has adopted a distribution plan for Class 2 shares of the Fund pursuant to Rule 12b-1 under the 1940 Act. A distribution fee is charged to Class 2 shares and paid to Allspring Funds Distributor, LLC, an affiliate of Allspring Funds Management, the principal underwriter, at an annual rate of 0.25% of the average daily net assets of Class 2 shares.
Interfund transactions
The Fund may purchase or sell portfolio investment securities to certain affiliates pursuant to Rule 17a-7 under the 1940 Act and under procedures adopted by the Board of Trustees. The procedures have been designed to ensure that these interfund transactions, which do not incur broker commissions, are effected at current market prices.
5. INVESTMENT PORTFOLIO TRANSACTIONS
Purchases and sales of investments, excluding U.S. government obligations (if any) and short-term securities, for the year ended December 31, 2021 were $135,278,917 and $157,785,225, respectively.
6. SECURITIES LENDING TRANSACTIONS
The Fund lends its securities through an unaffiliated securities lending agent and receives collateral in the form of cash or securities with a value at least equal to the value of the securities on loan. The value of the loaned securities is determined at the close of each business day and any increases or decreases in the required collateral are exchanged between the Fund and the counterparty on the next business day. Cash collateral received is invested in the Securities Lending Fund which seeks to provide a positive return compared to the daily Federal Funds Open Rate by investing in high-quality, U.S. dollar-denominated short-term money market instruments and is exempt from registration under Section 3(c)(7) of the 1940 Act. Securities Lending Fund is managed by Allspring Funds Management and is subadvised by Allspring Investments. Allspring Funds
22 | Allspring VT Discovery Fund
Notes to financial statements
Management receives an advisory fee starting at 0.05% and declining to 0.01% as the average daily net assets of the Securities Lending Fund increase. All of the fees received by Allspring Funds Management are paid to Allspring Investments for its services as subadviser.
In the event of counterparty default or the failure of a borrower to return a loaned security, the Fund has the right to use the collateral to offset any losses incurred. As of December 31, 2021, the Fund had securities lending transactions with the following counterparties which are subject to offset:
| Counterparty | Value of
securities on
loan | Collateral
received1 | Net amount |
| Bank of America Securities Incorporated | $1,213,146 | $(1,213,146) | $0 |
| Barclays Capital Incorporated | 75,620 | (75,620) | 0 |
| BNP Paribas Securities Corporation | 440,589 | (440,589) | 0 |
| Citigroup Global Markets Incorporated | 2,421,930 | (2,421,930) | 0 |
| JPMorgan Securities LLC | 1,403,916 | (1,403,916) | 0 |
| Morgan Stanley & Company LLC | 5,397,397 | (5,397,397) | 0 |
1 Collateral received within this table is limited to the collateral for the net transaction with the counterparty.
7. BANK BORROWINGS
The Trust, Allspring Master Trust and Allspring Funds Trust (excluding the money market funds) are parties to a $350,000,000 revolving credit agreement whereby the Fund is permitted to use bank borrowings for temporary or emergency purposes, such as to fund shareholder redemption requests. Interest under the credit agreement is charged to the Fund based on a borrowing rate equal to the higher of the Federal Funds rate in effect on that day plus 1.25% or the overnight bank funding rate in effect on that day plus 1.25%. In addition, an annual commitment fee equal to 0.25% of the unused balance is allocated to each participating fund.
For the year ended December 31, 2021, there were no borrowings by the Fund under the agreement.
8. DISTRIBUTIONS TO SHAREHOLDERS
The tax character of distributions paid during the years ended December 31, 2021 and December 31, 2020 were as follows:
| | Year ended December 31 |
| | 2021 | 2020 |
| Ordinary income | $ 0 | $ 688,096 |
| Long-term capital gain | 17,942,862 | 15,426,300 |
As of December 31, 2021, the components of distributable earnings on a tax basis were as follows:
Undistributed
long-term
gain | Unrealized
gains |
| $51,108,227 | $58,204,847 |
9. CONCENTRATION RISKS
As of the end of the period, the Fund concentrated its portfolio of investments in the information technology sector. A fund that invests a substantial portion of its assets in any sector may be more affected by changes in that sector than would be a fund whose investments are not heavily weighted in any sector.
10. INDEMNIFICATION
Under the Fund's organizational documents, the officers and Trustees have been granted certain indemnification rights against certain liabilities that may arise out of performance of their duties to the Fund. The Fund has entered into a separate
Allspring VT Discovery Fund | 23
Notes to financial statements
agreement with each Trustee that converts indemnification rights currently existing under the Fund’s organizational documents into contractual rights that cannot be changed in the future without the consent of the Trustee. Additionally, in the normal course of business, the Fund may enter into contracts with service providers that contain a variety of indemnification clauses. The Fund’s maximum exposure under these arrangements is dependent on future claims that may be made against the Fund and, therefore, cannot be estimated.
11. CORONAVIRUS (COVID-19) PANDEMIC
On March 11, 2020, the World Health Organization announced that it had made the assessment that coronavirus disease 2019 (“COVID-19”) is a pandemic. The impacts of COVID-19 are affecting the entire global economy, individual companies and investment products, the funds, and the market in general. There is significant uncertainty around the extent and duration of business disruptions related to COVID-19 and the impacts may last for an extended period of time. COVID-19 has led to significant uncertainty and volatility in the financial markets.
24 | Allspring VT Discovery Fund
Report of independent registered public accounting firm
To the Shareholders of the Fund and Board of Trustees
Allspring Variable Trust:
Opinion on the Financial Statements
We have audited the accompanying statement of assets and liabilities of Allspring VT Discovery Fund (formerly, Wells Fargo VT Discovery Fund) (the Fund), one of the funds constituting Allspring Variable Trust (formerly, Wells Fargo Variable Trust), including the portfolio of investments, as of December 31, 2021, the related statement of operations for the year then ended, the statements of changes in net assets for each of the years in the two-year period then ended, and the related notes (collectively, the financial statements) and the financial highlights for each of the years in the five-year period then ended. In our opinion, the financial statements and financial highlights present fairly, in all material respects, the financial position of the Fund as of December 31, 2021, the results of its operations for the year then ended, the changes in its net assets for each of the years in the two-year period then ended, and the financial highlights for each of the years in the five-year period then ended, in conformity with U.S. generally accepted accounting principles.
Basis for Opinion
These financial statements and financial highlights are the responsibility of the Fund’s management. Our responsibility is to express an opinion on these financial statements and financial highlights based on our audits. We are a public accounting firm registered with the Public Company Accounting Oversight Board (United States) (PCAOB) and are required to be independent with respect to the Fund in accordance with the U.S. federal securities laws and the applicable rules and regulations of the Securities and Exchange Commission and the PCAOB.
We conducted our audits in accordance with the standards of the PCAOB. Those standards require that we plan and perform the audit to obtain reasonable assurance about whether the financial statements and financial highlights are free of material misstatement, whether due to error or fraud. Our audits included performing procedures to assess the risks of material misstatement of the financial statements and financial highlights, whether due to error or fraud, and performing procedures that respond to those risks. Such procedures included examining, on a test basis, evidence regarding the amounts and disclosures in the financial statements and financial highlights. Such procedures also included confirmation of securities owned as of December 31, 2021, by correspondence with the custodian, transfer agent and brokers, or by other appropriate auditing procedures. Our audits also included evaluating the accounting principles used and significant estimates made by management, as well as evaluating the overall presentation of the financial statements and financial highlights. We believe that our audits provide a reasonable basis for our opinion.

We have not been able to determine the specific year that we began serving as the auditor of one or more Allspring Funds investment companies; however, we are aware that we have served as the auditor of one or more Allspring Funds investment companies since at least 1955.
Boston, Massachusetts
February 25, 2022
Allspring VT Discovery Fund | 25
Other information (unaudited)
TAX INFORMATION
Pursuant to Section 852 of the Internal Revenue Code, $17,942,862 was designated as a 20% rate gain distribution for the fiscal year ended December 31, 2021.
PROXY VOTING INFORMATION
A description of the policies and procedures used to determine how to vote proxies relating to portfolio securities is available without charge, upon request, by calling 1-800-260-5969, visiting our website at allspringglobal.com, or visiting the SEC website at sec.gov. Information regarding how the proxies related to portfolio securities were voted during the most recent 12-month period ended June 30 is available on the website at allspringglobal.com or by visiting the SEC website at sec.gov.
SPECIAL MEETING OF SHAREHOLDERS
On August 16, 2021, a Special Meeting of Shareholders for the Fund was held to consider the following proposals. The results of the proposals are indicated below.
Proposal 1 – To consider and approve a new investment management agreement with Wells Fargo Funds Management, LLC*.
| Shares voted “For” | | 3,290,626 |
| Shares voted “Against” | | 317,568 |
| Shares voted “Abstain” | | 242,927 |
Proposal 2 – To consider and approve a new subadvisory agreement with Wells Capital Management, LLC**.
| Shares voted “For” | | 2,785,034 |
| Shares voted “Against” | | 319,299 |
| Shares voted “Abstain” | | 746,788 |
* Effective November 1, 2021, known as Allspring Funds Management, LLC.
** Effective November 1, 2021, known as Allspring Global Investments, LLC.
QUARTERLY PORTFOLIO HOLDINGS INFORMATION
The Fund files its complete schedule of portfolio holdings with the SEC for the first and third quarters of each fiscal year as an exhibit to its reports on Form N-PORT. Shareholders may view the filed Form N-PORT by visiting the SEC website at sec.gov.
26 | Allspring VT Discovery Fund
Other information (unaudited)
BOARD OF TRUSTEES AND OFFICERS
Each of the Trustees and Officers listed in the table below acts in identical capacities for each fund in the Allspring family of funds, which consists of 139 mutual funds comprising the Allspring Funds Trust, Allspring Variable Trust, Allspring Master Trust and four closed-end funds (collectively the “Fund Complex”). This table should be read in conjunction with the Prospectus and the Statement of Additional Information1. The mailing address of each Trustee and Officer is 525 Market Street, 12th Floor, San Francisco, CA 94105. Each Trustee and Officer serves an indefinite term, however, each Trustee serves such term until reaching the mandatory retirement age established by the Trustees.
Independent Trustees
Name and
year of birth | Position held and
length of service* | Principal occupations during past five years or longer | Current other
public company or
investment
company
directorships |
William R. Ebsworth
(Born 1957) | Trustee,
since 2015 | Retired. From 1984 to 2013, equities analyst, portfolio manager, research director and chief investment officer at Fidelity Management and Research Company in Boston, Tokyo, and Hong Kong, and retired in 2013 as Chief Investment Officer of Fidelity Strategic Advisers, Inc. where he led a team of investment professionals managing client assets. Prior thereto, Board member of Hong Kong Securities Clearing Co., Hong Kong Options Clearing Corp., the Thailand International Fund, Ltd., Fidelity Investments Life Insurance Company, and Empire Fidelity Investments Life Insurance Company. Audit Committee Chair and Investment Committee Chair of the Vincent Memorial Hospital Endowment (non-profit organization). Mr. Ebsworth is a CFA® charterholder. | N/A |
Jane A. Freeman
(Born 1953) | Trustee,
since 2015;
Chair Liaison,
since 2018 | Retired. From 2012 to 2014 and 1999 to 2008, Chief Financial Officer of Scientific Learning Corporation. From 2008 to 2012, Ms. Freeman provided consulting services related to strategic business projects. Prior to 1999, Portfolio Manager at Rockefeller & Co. and Scudder, Stevens & Clark. Board member of the Harding Loevner Funds from 1996 to 2014, serving as both Lead Independent Director and chair of the Audit Committee. Board member of the Russell Exchange Traded Funds Trust from 2011 to 2012 and the chair of the Audit Committee. Ms. Freeman is also an inactive Chartered Financial Analyst. | N/A |
Isaiah Harris, Jr.
(Born 1952) | Trustee,
since 2009; Audit
Committee
Chair,
since 2019 | Retired. Chairman of the Board of CIGNA Corporation from 2009 to 2021, and Director from 2005 to 2008. From 2003 to 2011, Director of Deluxe Corporation. Prior thereto, President and CEO of BellSouth Advertising and Publishing Corp. from 2005 to 2007, President and CEO of BellSouth Enterprises from 2004 to 2005 and President of BellSouth Consumer Services from 2000 to 2003. Emeritus member of the Iowa State University Foundation Board of Governors. Emeritus Member of the Advisory Board of Iowa State University School of Business. Advisory Board Member, Palm Harbor Academy (private school). Advisory Board Member, Fellowship of Christian Athletes. Mr. Harris is a certified public accountant (inactive status). | N/A |
Judith M. Johnson**
(Born 1949) | Trustee,
since 2008 | Retired. Prior thereto, Chief Executive Officer and Chief Investment Officer of Minneapolis Employees Retirement Fund from 1996 to 2008. Ms. Johnson is an attorney, certified public accountant and a certified managerial accountant. | N/A |
David F. Larcker
(Born 1950) | Trustee,
since 2009 | James Irvin Miller Professor of Accounting at the Graduate School of Business (Emeritus), Stanford University, Director of the Corporate Governance Research Initiative and Senior Faculty of The Rock Center for Corporate Governance since 2006. From 2005 to 2008, Professor of Accounting at the Graduate School of Business, Stanford University. Prior thereto, Ernst & Young Professor of Accounting at The Wharton School, University of Pennsylvania from 1985 to 2005. | N/A |
Allspring VT Discovery Fund | 27
Other information (unaudited)
Name and
year of birth | Position held and
length of service* | Principal occupations during past five years or longer | Current other
public company or
investment
company
directorships |
Olivia S. Mitchell
(Born 1953) | Trustee,
since 2006;
Nominating and
Governance
Committee Chair,
since 2018 | International Foundation of Employee Benefit Plans Professor since 1993, Wharton School of the University of Pennsylvania. Director of Wharton’s Pension Research Council and Boettner Center on Pensions & Retirement Research, and Research Associate at the National Bureau of Economic Research. Previously taught at Cornell University from 1978 to 1993. | N/A |
Timothy J. Penny
(Born 1951) | Trustee,
since 1996;
Chair,
since 2018 | President and Chief Executive Officer of Southern Minnesota Initiative Foundation, a non-profit organization, since 2007. Member of the Board of Trustees of NorthStar Education Finance, Inc., a non-profit organization, since 2007. | N/A |
James G. Polisson
(Born 1959) | Trustee,
since 2018 | Retired. Chief Marketing Officer, Source (ETF) UK Services, Ltd, from 2015 to 2017. From 2012 to 2015, Principal of The Polisson Group, LLC, a management consulting, corporate advisory and principal investing company. Chief Executive Officer and Managing Director at Russell Investments, Global Exchange Traded Funds from 2010 to 2012. Managing Director of Barclays Global Investors from 1998 to 2010 and Global Chief Marketing Officer for iShares and Barclays Global Investors from 2000 to 2010. Trustee of the San Francisco Mechanics’ Institute, a non-profit organization, from 2013 to 2015. Board member of the Russell Exchange Traded Fund Trust from 2011 to 2012. Director of Barclays Global Investors Holdings Deutschland GmbH from 2006 to 2009. Mr. Polisson is an attorney and has a retired status with the Massachusetts and District of Columbia Bar Associations. | N/A |
Pamela Wheelock
(Born 1959) | Trustee,
since January
2020; previously
Trustee from
January 2018 to
July 2019 | Board member of the Destination Medical Center Economic Development Agency, Rochester, Minnesota since 2019. Interim President of the McKnight Foundation from January to September 2020. McKnight Foundation Consultant, November 2020 to February 2021. Acting Commissioner, Minnesota Department of Human Services, July 2019 through September 2019. Consultant (part-time), Minnesota Department of Human Services, October 2019 through December 2019. Chief Operating Officer, Twin Cities Habitat for Humanity from 2017 to 2019. Vice President of University Services, University of Minnesota from 2012 to 2016. Prior thereto, on the Board of Directors, Governance Committee and Finance Committee for the Minnesota Philanthropy Partners (Saint Paul Foundation) from 2012 to 2018, Interim Chief Executive Officer of Blue Cross Blue Shield of Minnesota from 2011 to 2012, Chairman of the Board from 2009 to 2012 and Board Director from 2003 to 2015. Vice President, Leadership and Community Engagement, Bush Foundation, Saint Paul, Minnesota (a private foundation) from 2009 to 2011. Executive Vice President and Chief Financial Officer, Minnesota Sports and Entertainment from 2004 to 2009 and Senior Vice President from 2002 to 2004. Executive Vice President of the Minnesota Wild Foundation from 2004 to 2008. Commissioner of Finance, State of Minnesota, from 1999 to 2002. Currently Board Chair of the Minnesota Wild Foundation since 2010. | N/A |
* Length of service dates reflect the Trustee’s commencement of service with the Trust’s predecessor entities, where applicable.
** Ms. Johnson has resigned from the Board effective December 31, 2021.
28 | Allspring VT Discovery Fund
Other information (unaudited)
Officers2
Name and
year of birth | Position held and
length of service | Principal occupations during past five years or longer |
Andrew Owen
(Born 1960) | President,
since 2017 | President, Chief Executive Officer and Director of Allspring Funds Management, LLC since 2017 and co-president of Galliard Capital Management, LLC, an affiliate of Allspring Funds Management, LLC, since 2019. Prior thereto, Head of Affiliated Managers, Allspring Global Investments, from 2014 to 2019 and Executive Vice President responsible for marketing, investments and product development for Allspring Funds Management, LLC, from 2009 to 2014. In addition, Mr. Owen was an Executive Vice President of Wells Fargo & Company from 2014 to 2021. |
Jeremy DePalma
(Born 1974) | Treasurer,
since 2012
(for certain funds in
the Fund Complex);
since 2021 (for
the remaining funds in the
Fund Complex) | Senior Vice President of Allspring Funds Management, LLC since 2009. Senior Vice President of Evergreen Investment Management Company, LLC from 2008 to 2010 and head of the Fund Reporting and Control Team within Fund Administration. |
Kate McKinley
(Born 1977) | Chief Legal Officer,
since 2021 | Chief Legal Officer of Allspring Global Investments since 2021. Prior thereto, held various roles at State Street Global Advisors beginning in 2010, including serving as Senior Vice President and General Counsel from 2019 to 2021, and Chief Operating Officer of the Institutional Client Group from 2016 - 2019. Prior to working at State Street Global Advisors served as Assistant General Counsel for Bank of America Corporation from 2005 to 2010 and as an Associate at WilmerHale from 2002 to 2005. |
Christopher Baker
(Born 1976) | Chief Compliance Officer, since 2022 | Global Chief Compliance Officer for Allspring Global Investments since 2022. Prior thereto, Chief Compliance Officer for State Street Global Advisors from 2018 to 2021. Senior Compliance Officer for the State Street divisions of Alternative Investment Solutions, Sector Solutions, and Global Marketing from 2015 to 2018. From 2010 to 2015 Vice President, Global Head of Investment and Marketing Compliance for State Street Global Advisors. |
Matthew Prasse
(Born 1983) | Secretary,
since 2021 | Senior Counsel of the Allspring Legal Department since 2021. Senior Counsel of the Wells Fargo Legal Department from 2018 to 2021. Previously, Counsel for Barings LLC from 2015 to 2018. Prior to joining Barings, Associate at Morgan, Lewis & Bockius LLP from 2008 to 2015. |
1 The Statement of Additional Information includes additional information about the Trustees and is available, without charge, upon request, by calling 1-800-222-8222 or by visiting the website at allspringglobal.com.
2 For those Officers with tenures at Allspring Global Investments and/or Allspring Funds Management, LLC that began prior to 2021, such tenures include years of service during which these businesses/entities were known as Wells Fargo Asset Management and Wells Fargo Funds Management, LLC, respectively.
Allspring VT Discovery Fund | 29
For more information
More information about Allspring Funds is available free upon request. To obtain literature, please write, visit the Fund's website, or call:
Allspring Funds
P.O. Box 219967
Kansas City, MO 64121-9967
Website: allspringglobal.com
Individual investors: 1-800-260-5969
Retail investment professionals: 1-888-877-9275
Institutional investment professionals: 1-866-765-0778
This report and the financial statements contained herein are submitted for the general information of the shareholders of the Fund. If this report is used for promotional purposes, distribution of the report must be accompanied or preceded by a current prospectus. Before investing, please consider the investment objectives, risks, charges, and expenses of the investment. For a current prospectus and, if available, a summary prospectus, containing this information, call
1-800-260-5969 or visit the Fund's website at allspringglobal.com. Read the prospectus carefully before you invest or send money.
Allspring Global InvestmentsTM is the trade name for the asset management firms of Allspring Global Investments Holdings, LLC, a holding company indirectly owned by certain private funds of GTCR LLC and Reverence Capital Partners, L.P. These firms include but are not limited to Allspring Global Investments, LLC, and Allspring Funds Management, LLC. Certain products managed by Allspring entities are distributed by Allspring Funds Distributor, LLC (a broker-dealer and Member FINRA/SIPC).
This material is for general informational and educational purposes only and is NOT intended to provide investment advice or a recommendation of any kind - including a recommendation for any specific investment, strategy, or plan.
© 2022 Allspring Global Investments Holdings, LLC. All rights reserved.
PAR-0122-00225 02-22
AVT1/AR147 12-21
Annual Report
December 31, 2021
Allspring
VT Index Asset Allocation Fund
The views expressed and any forward-looking statements are as of December 31, 2021, unless otherwise noted, and are those of the Fund's portfolio managers and/or Allspring Global Investments. Discussions of individual securities or the markets generally are not intended as individual recommendations. Future events or results may vary significantly from those expressed in any forward-looking statements. The views expressed are subject to change at any time in response to changing circumstances in the market. Allspring Global Investments disclaims any obligation to publicly update or revise any views expressed or forward-looking statements.
Allspring VT Index Asset Allocation Fund | 1
Letter to shareholders (unaudited)
Andrew Owen
President
Allspring Funds
Dear Shareholder:
We are pleased to offer you this annual report for the Allspring VT Index Asset Allocation Fund for the 12-month period that ended December 31, 2021. Global stocks yielded mixed results as the global economy continued to emerge from the haze of COVID-19. Tailwinds were provided by global stimulus programs, a rapid vaccination rollout, and recovering consumer and corporate sentiment. Bonds also saw mixed performance during the period.
For the 12-month period, equities had mixed returns as policymakers continued to fight the effects of COVID-19. U.S. stocks led both non-U.S. developed market equities and emerging market stocks. Returns by fixed-income securities were also a mix of positive and negative. For the period, U.S. stocks, based on the S&P 500 Index,1 gained 28.71%. International stocks, as measured by the MSCI ACWI ex USA Index (Net),2 returned 7.82%, while the MSCI EM Index (Net) (USD)3 had weaker performance with a 2.54% loss. Among bond indexes, the Bloomberg U.S. Aggregate Bond Index4 returned -1.54%, the Bloomberg Global Aggregate ex-USD Index (unhedged)5 returned -7.05%, the Bloomberg Municipal Bond Index6 gained 1.52%, and the ICE BofA U.S. High Yield Index7 returned 5.36%.
Efforts to contain COVID-19 drove market performance.
The year 2021 began with emerging market stocks leading all major asset classes in January, driven by China’s strong economic growth and a broad recovery in corporate earnings, which propelled China’s stock market higher. In the U.S., positive news on vaccine trials and January expansion in both the manufacturing and services sectors were offset by a weak December monthly jobs report. This was compounded by technical factors as some hedge funds were forced to sell stocks to protect themselves against a well-publicized short squeeze coordinated by a group of retail investors. Eurozone sentiment and economic growth were particularly weak, reflecting the impact of a new lockdown with stricter social distancing along with a slow vaccine rollout.
February saw major domestic equity indexes driven higher on the hope of a new stimulus bill, improving COVID-19 vaccination numbers, and the gradual reopening of the economy. Most S&P 500 companies reported better-than-expected earnings, with positive surprises coming from the financials, information technology, health care, and materials sectors. Japan saw its economy strengthen as a result of strong export numbers. Meanwhile, crude oil prices continued their climb, rising more than 25% for the year. Domestic government bonds experienced a sharp sell-off in late February as markets priced in a more robust economic recovery and higher future growth and inflation expectations.
| 1 | The S&P 500 Index consists of 500 stocks chosen for market size, liquidity, and industry group representation. It is a market-value-weighted index with each stock's weight in the index proportionate to its market value. You cannot invest directly in an index. |
| 2 | The Morgan Stanley Capital International (MSCI) All Country World Index (ACWI) ex USA Index (Net) is a free-float-adjusted market-capitalization-weighted index that is designed to measure the equity market performance of developed and emerging markets, excluding the U.S. Source: MSCI. MSCI makes no express or implied warranties or representations and shall have no liability whatsoever with respect to any MSCI data contained herein. The MSCI data may not be further redistributed or used as a basis for other indexes or any securities or financial products. This report is not approved, reviewed, or produced by MSCI. You cannot invest directly in an index. |
| 3 | The MSCI Emerging Markets (EM) Index (Net) (USD) is a free-float-adjusted market-capitalization-weighted index that is designed to measure equity market performance of emerging markets. You cannot invest directly in an index. |
| 4 | The Bloomberg U.S. Aggregate Bond Index is a broad-based benchmark that measures the investment-grade, U.S.-dollar-denominated, fixed-rate taxable bond market, including Treasuries, government-related and corporate securities, mortgage-backed securities (agency fixed-rate and hybrid adjustable-rate mortgage pass-throughs), asset-backed securities, and commercial mortgage-backed securities. You cannot invest directly in an index. |
| 5 | The Bloomberg Global Aggregate ex-USD Index (unhedged) is an unmanaged index that provides a broad-based measure of the global investment-grade fixed-income markets excluding the U.S.-dollar-denominated debt market. You cannot invest directly in an index. |
| 6 | The Bloomberg Municipal Bond Index is an unmanaged index composed of long-term tax-exempt bonds with a minimum credit rating of Baa. You cannot invest directly in an index. |
| 7 | The ICE BofA U.S. High Yield Index is a market-capitalization-weighted index of domestic and Yankee high-yield bonds. The index tracks the performance of high-yield securities traded in the U.S. bond market. You cannot invest directly in an index. Copyright 2022. ICE Data Indices, LLC. All rights reserved. |
2 | Allspring VT Index Asset Allocation Fund
Letter to shareholders (unaudited)
The passage of the massive domestic stimulus bill highlighted March activity, leading to increased forecasts for U.S. growth in 2021. Domestic employment surged as COVID-19 vaccinations and an increasingly open economy spurred hiring. A majority of U.S. small companies reported they were operating at pre-pandemic capacity or higher. Value stocks continued their outperformance of growth stocks in the month, continuing the trend that started in late 2020. Meanwhile, most major developed global equity indexes were up month to date on the back of rising optimism regarding the outlook for global growth. While the U.S. and the U.K. have been the most successful in terms of the vaccine rollout, even in markets where the vaccine has lagged, such as in the eurozone and Japan, equity indexes in many of those countries have also been in positive territory for the year through March 2021.
Equity markets produced another strong showing in April. Domestically, the continued reopening of the economy had a strong impact on positive equity performance, as people started leaving their households and jobless claims continued to fall. Domestic corporate bonds performed well and the U.S. dollar weakened. Meanwhile, the U.S. government continued to seek to invest in the recovery, this time by outlining a package of over $2 trillion to improve infrastructure. The primary headwind in April was inflation, as investors tried to determine the breadth and longevity of recent price increases. Developed Europe has been supported by a meaningful increase in the pace of vaccinations. Unfortunately many emerging market countries have not been as successful. India in particular saw COVID-19 cases surge, serving as an example of the need to get vaccinations rolled out to less developed nations.
Vaccine rollouts continued in May, leading to loosened restrictions globally. As a result, equity markets in general saw a minor increase in returns. Concerns that the continued economic rebound could result in inflation increases becoming more than transitory were supported by the higher input costs businesses were experiencing. Meanwhile, those inflation concerns were tempered by the U.S. Federal Reserve (Fed), which stayed steady on its view of the economy and eased fears of a sudden and substantial policy change. Positive performance in the emerging market equity space was supported this month by steady consumer demand and strong commodity prices. Fixed-income markets were also slightly positive for the month, driven by inflation uncertainty and a softer U.S. dollar.
June witnessed the S&P 500 Index reach a new all-time high. 2021 economic growth and inflation forecasts were revised higher to reflect a strong economic recovery and some supply and demand imbalances. Late June saw a deal reached on a U.S. infrastructure package of approximately $1 trillion for road, bridge, and broadband network upgrades over the next eight years. The Fed’s June meeting yielded no change to policy, but its projections pointed to a possible interest rate rise in 2023. This, combined with a rebound in economic activity and investors searching for yield, led to U.S. Treasury yields being down for the month. Many European and Asian countries saw vaccination momentum increase, while the U.K. dealt with a rise in COVID-19 infections, specifically the Delta variant. Meanwhile, crude oil jumped over 10% in June on the back of the pickup in global economic activity and the Organization of the Petroleum Exporting Countries’ (OPEC) slow pace of supply growth.
July began the month seeing vaccinations making progress, as several major developed countries eased restrictions, only to be threatened again by the spread of COVID-19’s Delta variant. Inflation continued to climb, aided by the continued supply bottleneck in the face of high demand. As it pertains to the equity area of the market, U.S. equities led the way in positive return territory followed by international developed markets. In contrast, emerging markets were well in negative territory for the month, hindered by China’s plans for new regulations on a number of sectors, specifically education and technology. The U.S. 10-year Treasury bond yield continued to decline as strong demand swallowed up supply. After hitting a multiyear high earlier in the month, oil prices leveled off following an agreement by OPEC to raise oil production starting in August.
Allspring VT Index Asset Allocation Fund | 3
Letter to shareholders (unaudited)
“ Municipal debt experienced its first monthly performance drop since February of this year, slowing a rally that made it one of the best-performing sectors of the bond market.” |
The Delta variant of COVID-19 produced outbreaks globally in August, increasing the potential for increased market volatility and bringing into question the ongoing economic recovery. Domestically, the U.S. economy continued to stay strong in the face of the Delta variant, continued inflationary pressures, and worries over Hurricane Ida. Emerging market equities experienced elevated volatility, largely influenced by China’s regulatory stance. Emerging market equities started the month with poor performance but rebounded to end the month in positive territory. Municipal debt experienced its first monthly performance drop since February of this year, slowing a rally that made it one of the best-performing sectors of the bond market. In the commodity segment of the market, crude oil fell sharply during the month on the back of dampened expectations as a result of the Delta variant but was still a leading asset-class performer for the year.
Global markets suffered their broadest retreat in a year during September, with the exception of commodities. Concerns over inflation and the interest rate outlook depressed investor confidence and hurt performance. Emerging markets declined on concerns over the continued supply chain disruptions and worries over higher energy and food prices. Meanwhile, the Fed indicated it would slow the pace of asset purchases in the near future (pointing towards November). All eyes domestically are fixed on the raising of the debt ceiling, the 2022 budget plan, and the ongoing debate over the infrastructure package. Contrary to most asset classes, commodities thrived in September, driven by sharply higher energy prices.
October’s key themes continued to be elevated inflation pressures and a supply bottleneck, but strong earnings provided a bright spot in the markets. Earnings releases in the U.S. were generally strong and consumer confidence was high. The Fed reaffirmed its plans to taper quantitative easing to a stop by mid-2022. Meanwhile, elevated inflation figures were considered transitory by the Fed. Similar to the U.S., the eurozone and many Asian countries saw positive earnings but were facing inflation pressures caused by supply bottlenecks while also experiencing energy price increases amid natural gas shortages. Globally, government bond yields rose as central banks prepared to lower monetary policy accommodation in the face of rising inflationary pressures. As previously referenced, positive commodity performance was driven by sharply higher energy costs.
November was dominated by rising COVID-19 hospitalizations and concerns regarding the Omicron variant. Most major asset classes, both domestically and internationally, declined in November with two exceptions: U.S. investment-grade bonds and Treasury Inflation-Protected Securities. The United Nations Climate Change Conference (COP26) took place during the month with hopes of agreement among countries to limit global warming. While several initiatives were discussed, the conference ultimately ended without the specifics required to instill confidence that the limiting of global warming would succeed. In the U.S., President Biden signed a long-awaited infrastructure bill to upgrade U.S. roads, bridges, and railways. Meanwhile, the Consumer Price Index1, a measure of domestic inflation conditions, jumped to its highest level in 31 years. While the threat of consistently high inflation led the Fed to discuss a faster pace of tapering, the Omicron strain makes that less likely to occur. Commodities came in negative for the month, largely driven by sharp declines in oil prices (and energy costs in general) as well as precious metals.
Global volatility in December lessened as data indicated a lower risk of severe disease and death as a result of the Omicron variant. Even so, a number of countries introduced restrictions on sectors such as travel and hospitality to try to reduce the spread. In the U.S., data indicated that the overall domestic economy remains stable and corporate earnings remain robust. Consumer spending capability looks strong heading into 2022 on the back of elevated household savings and the lowest ratio of U.S. household liabilities to assets since 1973. U.S. corporate and high-yield bonds produced positive returns for the month while Treasuries declined. Bonds were strongly affected by the projection of three 25-basis-point (bp; 100 bps equal 1.00%) policy rate hikes in 2022 by senior Federal Open Market Committee members, contrary to just one hike as previously believed.
“ Bonds were strongly affected by the projection of three 25-basis-point (bp; 100 bps equal 1.00%) policy rate hikes in 2022 by senior Federal Open Market Committee members, contrary to just one hike as previously believed.”
| 1 | The Consumer Price Index (CPI) is a measure of the average change over time in the prices paid by urban consumers for a market basket of consumer goods and services. You cannot invest directly in an index. |
4 | Allspring VT Index Asset Allocation Fund
Letter to shareholders (unaudited)
Don’t let short-term uncertainty derail long-term investment goals.
Periods of investment uncertainty can present challenges, but experience has taught us that maintaining long-term investment goals can be an effective way to plan for the future. To help you create a sound strategy based on your personal goals and risk tolerance, Allspring Funds offers more than 100 mutual funds spanning a wide range of asset classes and investment styles. Although diversification cannot guarantee an investment profit or prevent losses, we believe it can be an effective way to manage investment risk and potentially smooth out overall portfolio performance. We encourage investors to know their investments and to understand that appropriate levels of risk-taking may unlock opportunities.
Information on transaction closing.
On November 1, 2021, GTCR LLC and Reverence Capital Partners, L.P., announced the beginning of Allspring Global Investments™, with the close of the transaction to acquire Wells Fargo Funds Management, LLC; Wells Capital Management, LLC; Galliard Capital Management, LLC.; Wells Fargo Asset Management (International) Ltd.; Wells Fargo Asset Management Luxembourg S.A.; and Wells Fargo Funds Distributor, LLC, as well as Wells Fargo Bank, N.A.’s business of acting as trustee to its collective investment trusts and all related Wells Fargo Asset Management legal entities. The transaction closed on November 1, 2021, forming Allspring Global Investments, a privately held asset management firm with $575 billion in AUM1 as of December 31, 2021.
Allspring Global Investments™ is a leading independent asset management firm with a full breadth of investment capabilities across diverse asset classes, serving the needs of its institutional and wealth management clients around the world. Allspring operates across 18 offices globally supported by more than 480 investment professionals. Allspring and its investment teams provide a broad range of differentiated investment products and solutions to help its diverse range of clients meet their investment objectives.
As part of this transition, all mutual funds within the Wells Fargo Funds family were rebranded as Allspring Funds. Each individual fund had “Wells Fargo” removed from its fund name and replaced with “Allspring.” The fund name changes went into effect on December 6, 2021.
Allspring Global Investments is the trade name for the asset management firms of Allspring Global Investments Holdings, LLC, a holding company indirectly owned by certain private funds of GTCR LLC and Reverence Capital Partners, L.P.
Thank you for choosing to invest with Allspring Funds. We appreciate your confidence in us and remain committed to helping you meet your financial needs.
Sincerely,
Andrew Owen
President
Allspring Funds
For further information about your Fund, contact your investment professional, visit our website at allspringglobal.com, or call us directly at 1-800-222-8222.
| 1 | As of December 31, 2021, assets under management (AUM) includes $91.6 billion from Galliard Capital Management, LLC, an investment advisor that is not part of the Allspring trade name/GIPS firm. |
Allspring VT Index Asset Allocation Fund | 5
Performance highlights (unaudited)
| Investment objective | The Fund seeks long-term total return, consisting of capital appreciation and current income. |
| Manager | Allspring Funds Management, LLC |
| Subadviser | Allspring Global Investments, LLC |
| Portfolio managers | Kandarp R. Acharya, CFA®‡, FRM, Petros N. Bocray, CFA®‡, FRM, Christian L. Chan, CFA®‡ |
| Average annual total returns (%) as of December 31, 2021 |
| | | | | | Expense ratios1 (%) |
| | Inception date | 1 year | 5 year | 10 year | Gross | Net 2 |
| Class 2 | 4-15-1994 | 16.00 | 12.11 | 11.91 | 1.14 | 1.00 |
| Index Asset Allocation Blended Index3 | – | 15.50 | 12.47 | 11.44 | – | – |
| Bloomberg U.S. Treasury Index4 | – | -2.32 | 3.07 | 2.13 | – | – |
| S&P 500 Index5 | – | 28.71 | 18.47 | 16.55 | – | – |
| 1 | Reflects the expense ratios as stated in the most recent prospectus. The expense ratios shown are subject to change and may differ from the annualized expense ratios shown in the financial highlights of this report. |
| 2 | The manager has contractually committed through April 30, 2022, to waive fees and/or reimburse expenses to the extent necessary to cap total annual fund operating expenses after fee waivers at 1.00% for Class 2 shares. Brokerage commissions, stamp duty fees, interest, taxes, acquired fund fees and expenses (if any), and extraordinary expenses are excluded from the expense cap. Prior to or after the commitment expiration date, the cap may be increased or the commitment to maintain the cap may be terminated only with the approval of the Board of Trustees. Without this cap, the Fund’s returns would have been lower. The expense ratio paid by an investor is the net expense ratio (the total annual fund operating expenses after fee waivers) as stated in the prospectus. |
| 3 | Source: Allspring Funds Management, LLC. Index Asset Allocation Blended Index is composed 60% of the S&P 500 Index and 40% of the Bloomberg U.S. Treasury Index. Prior to April 1, 2015, the Index Asset Allocation Blended Index was composed 60% of the S&P 500 Index and 40% of the Bloomberg U.S. Treasury 20+ Year Index. You cannot invest directly in an index. |
| 4 | The Bloomberg U.S. Treasury Index is an unmanaged index of prices of U.S. Treasury bonds with maturities of 1 to 30 years. You cannot invest directly in an index. |
| 5 | The S&P 500 Index consists of 500 stocks chosen for market size, liquidity, and industry group representation. It is a market-value weighted index with each stock’s weight in the index proportionate to its market value. You cannot invest directly in an index. |
Figures quoted represent past performance, which is no guarantee of future results. Investment return and principal value of an investment will fluctuate so that an investor’s shares, when redeemed, may be worth more or less than their original cost. Current performance may be lower or higher than the performance data quoted and assumes the reinvestment of dividends and capital gains. Current month-end performance is available by calling 1-800-260-5969. Performance figures of the Fund do not reflect fees and expenses charged pursuant to the terms of variable life insurance policies and variable annuity contracts. If these fees and expenses had been reflected, performance would have been lower.
Index returns do not include transaction costs associated with buying and selling securities, any mutual fund fees or expenses, or any taxes. It is not possible to invest directly in an index.
Shares are sold without a front-end sales charge or contingent deferred sales charge.
Balanced funds may invest in stocks and bonds. Stock values fluctuate in response to the activities of individual companies and general market and economic conditions. Bond values fluctuate in response to the financial condition of individual issuers, general market and economic conditions, and changes in interest rates. Changes in market conditions and government policies may lead to periods of heightened volatility in the bond market and reduced liquidity for certain bonds held by the Fund. In general, when interest rates rise, bond values fall and investors may lose principal value. Interest rate changes and their impact on the Fund and its share price can be sudden and unpredictable. The use of derivatives may reduce returns and/or increase volatility. Consult the Fund’s prospectus for additional information on these and other risks.
Please refer to the prospectus provided by your participating insurance company for detailed information describing the separate accounts for information regarding surrender charges, mortality and expense risk fees, and other charges that may be assessed by the participating insurance companies.
| ‡ | CFA® and Chartered Financial Analyst® are trademarks owned by CFA Institute. |
6 | Allspring VT Index Asset Allocation Fund
Performance highlights (unaudited)
Growth of $10,000 investment as of December 31, 20211
| 1 | The chart compares the performance of Class 2 shares for the most recent ten years with the Index Asset Allocation Blended Index, Bloomberg U.S. Treasury Index and S&P 500 Index. The chart assumes a hypothetical investment of $10,000 in Class 2 shares and reflects all operating expenses of the Fund but does not reflect fees and expenses charged pursuant to the terms of variable life insurance policies and variable annuity contracts. |
Allspring VT Index Asset Allocation Fund | 7
Performance highlights (unaudited)
MANAGER'S DISCUSSION
Fund highlights
| ■ | The Fund outperformed its benchmark, the Index Asset Allocation Blended Index, for the 12-month period that ended December 31, 2021. |
| ■ | The Fund’s tactical asset allocation overlay, which is implemented with liquid futures contracts, contributed to performance during the period. |
| ■ | The Fund’s stock and bond allocations performed in line with their respective benchmarks, the S&P 500 Index and the Bloomberg U.S. Treasury Index. |
Despite concerns about higher inflation and the spread of new COVID-19 variants, equity markets posted sizable gains in 2021 as economies continued to rebound from the depths of the COVID-19 pandemic. The National Bureau of Economic Research's Business Cycle Dating Committee said the COVID-19-induced recession of 2020 lasted two months. According to the committee, economic activity peaked in February 2020 and then the economic bottom was in April 2020, making it the shortest recession in the record books. Recoveries start at the bottom, though it may take a while to fully recover.
| Ten largest holdings (%) as of December 31, 20211 |
| Apple Incorporated | 4.11 |
| Microsoft Corporation | 3.76 |
| Amazon.com Incorporated | 2.17 |
| Alphabet Incorporated Class A | 1.30 |
| Tesla Motors Incorporated | 1.27 |
| Alphabet Incorporated Class C | 1.21 |
| Meta Platforms Incorporated Class A | 1.19 |
| NVIDIA Corporation | 1.08 |
| Berkshire Hathaway Incorporated Class B | 0.82 |
| UnitedHealth Group Incorporated | 0.71 |
| 1 | Figures represent the percentage of the Fund's net assets. Holdings are subject to change and may have changed since the date specified. |
During the 12-month period as a whole, U.S. equity markets—as measured by the S&P 500 Index—rose by 28.71%. There was a wide variety of returns across sectors. For the year, energy stocks gained 50.02% while defensive staples and utilities returned 7.56% and 7.33%, respectively. Overseas, international equity market returns, although positive, were a bit more subdued. The MSCI ACWI ex USA Index (Net)*—a measure of international developed and emerging market stocks—gained 7.82% during the period.
U.S. Treasury yields rose during the 12-month period. The yield on 30-year U.S. Treasury bonds rose by 0.25% to end the period at 1.90%, while yields on 10-year U.S. Treasury notes rose by 0.59% to end the period at 1.51%. Higher yields had an adverse impact on U.S. Treasury bond prices, which move in opposite directions. The Bloomberg 20+ Year U.S. Treasury Index**, a measure of longer-dated U.S. Treasury bonds, lost 4.37% during the 12-month period.
Tactical asset allocation shifts contributed to performance during the 12-month period.
The Fund’s stock holdings seek to replicate the holdings of the S&P 500 Index, while its bond holdings seek to replicate the holdings of the Bloomberg U.S. Treasury Index. The Fund’s neutral target allocation is 60% stocks and 40% bonds. As of year-end, the Fund had an effective target allocation of 66.5% stocks, 38.0% bonds, and -4.5% effective cash. During the period, the portfolio management team implemented tactical shifts between stocks and bonds in order to adjust the Fund’s effective allocations based on the relative attractiveness of the two asset classes.
The team maintained an overweight to stocks throughout the 12-month period. The tactical tilt toward equities—implemented with long positions in S&P 500 futures—contributed handsomely to performance as stocks continued to climb higher during the period. Meanwhile, a short position in 10-year Treasury futures, which was implemented in March 2021 and closed in early July, detracted from performance amid a decline in yields.
The Fund’s effective allocation is determined by a combination of inputs from multiple quantitative and qualitative factors. As of the close of the period, relative to its benchmark, the Fund maintained an overweight to equities and an underweight to Treasuries.
On the whole, the tactical futures overlay positions implemented during the 12-month period contributed approximately 1.5% to the performance of the overall Fund.
| * | The Morgan Stanley Capital International (MSCI) All Country World Index (ACWI) ex USA Index (Net) is a free-float-adjusted market capitalization-weighted index that is designed to measure the equity market performance of developed and emerging markets, excluding the U.S. You cannot invest directly in an index. |
| ** | Bloomberg 20+ Year U.S. Treasury Index is an unmanaged index composed of securities in the U.S. Treasury Index with maturities of 20 years or greater. You cannot invest directly in an index. |
8 | Allspring VT Index Asset Allocation Fund
Performance highlights (unaudited)
| Sector allocation as of December 31, 20211 |
| 1 | Figures represent the percentage of the Fund's long-term investments. These amounts are subject to change and may have changed since the date specified. |
Outlook
The year 2020 was a year when investors anticipated a recovery, so market multiples like price/earnings ratios shot higher. The year 2021 was a year when earnings did the heavy lifting and returns were mostly from earnings growth, not multiple expansion. We think 2022 could be a year when earnings will still likely do the heavy lifting and multiples can take different paths depending on the country, sector, and company. Some areas look like there is room for multiples to expand, like in smaller- and mid-cap stocks, with value more so than growth. Late in 2021, the Federal Reserve started to
taper its asset purchases and may stop asset purchases in mid-March 2022, with hikes possible in March or May. Globally, there is a mixture of central bank policies to contend with.
| Allocation (%) as of December 31, 2021 |
| | Neutral
allocation | Effective
allocation1 |
| Stocks | 60 | 66 |
| Bonds | 40 | 38 |
| Effective Cash | 0 | (4) |
| 1 | Effective allocation reflects the effect of the tactical futures overlay that may be in place. Effective cash, if any, represents the net offset to such future positions. Effective allocations are subject to change and may have changed since the date specified. |
Our outlook calls for stronger growth and lower inflation in 2022. Growth was very erratic in 2021. Globally, the year started strong but weakened in the second half. So, maybe we could get a reacceleration to a more sustainable growth rate in 2022. Inflation shot up like a hockey stick, but many of the forces at work, to us, look like they could fade as we move through the first and second quarter of 2022. Policies are parting ways from the pandemic response to more normal conditions. Different countries will walk that path at different paces. We think the return of diversity and normality across policy, consumer, and business activity could create significant investment opportunities in 2022.
We will continue to monitor the situation carefully and stand ready to adjust exposures as needed.
Allspring VT Index Asset Allocation Fund | 9
Fund expenses (unaudited)
As a shareholder of the Fund, you incur ongoing costs, including management fees, distribution (12b-1) fees, and other Fund expenses. This example is intended to help you understand your ongoing costs (in dollars) of investing in the Fund and to compare these costs with the ongoing costs of investing in other mutual funds.
The example is based on an investment of $1,000 invested at the beginning of the six-month period and held for the entire period from July 1, 2021 to December 31, 2021.
Actual expenses
The “Actual” line of the table below provides information about actual account values and actual expenses. You may use the information in this line, together with the amount you invested, to estimate the expenses that you paid over the period. Simply divide your account value by $1,000 (for example, an $8,600 account value divided by $1,000 = 8.6), then multiply the result by the number in the “Actual” line under the heading entitled “Expenses paid during period” for your applicable class of shares to estimate the expenses you paid on your account during this period.
Hypothetical example for comparison purposes
The “Hypothetical” line of the table below provides information about hypothetical account values and hypothetical expenses based on the Fund’s actual expense ratio and an assumed rate of return of 5% per year before expenses, which is not the Fund’s actual return. The hypothetical account values and expenses may not be used to estimate the actual ending account balance or expenses you paid for the period. You may use this information to compare the ongoing costs of investing in the Fund and other funds. To do so, compare this 5% hypothetical example with the 5% hypothetical examples that appear in the shareholder reports of the other funds.
Please note that the expenses shown in the table are meant to highlight your ongoing costs only and do not reflect any separate account charges assessed by participating insurance companies. Therefore, the “Hypothetical” line of the table is useful in comparing ongoing costs only, and will not help you determine the relative total costs of owning different funds. In addition, if these separate account charges assessed by participating insurance companies were included, your costs would have been higher.
| | Beginning
account value
7-1-2021 | Ending
account value
12-31-2021 | Expenses
paid during
the period1 | Annualized net
expense ratio |
| Class 2 | | | | |
| Actual | $1,000.00 | $1,070.78 | $5.22 | 1.00% |
| Hypothetical (5% return before expenses) | $1,000.00 | $1,020.16 | $5.09 | 1.00% |
1 Expenses paid is equal to the annualized net expense ratio multiplied by the average account value over the period, multiplied by the number of days in the most recent fiscal half-year divided by the number of days in the fiscal year (to reflect the one-half-year period).
10 | Allspring VT Index Asset Allocation Fund
Portfolio of investments—December 31, 2021
| | | | | Shares | Value |
| Common stocks: 60.08% | | | | | |
| Communication services: 6.11% | | | | | |
| Diversified telecommunication services: 0.60% | | | | | |
| AT&T Incorporated | | | | 8,863 | $ 218,030 |
| Lumen Technologies Incorporated | | | | 1,144 | 14,357 |
| Verizon Communications Incorporated | | | | 5,141 | 267,126 |
| | | | | | 499,513 |
| Entertainment: 1.00% | | | | | |
| Activision Blizzard Incorporated | | | | 966 | 64,268 |
| Electronic Arts Incorporated | | | | 349 | 46,033 |
| Live Nation Entertainment Incorporated † | | | | 165 | 19,749 |
| Netflix Incorporated † | | | | 548 | 330,137 |
| Take-Two Interactive Software Incorporated † | | | | 143 | 25,414 |
| The Walt Disney Company † | | | | 2,251 | 348,657 |
| | | | | | 834,258 |
| Interactive media & services: 3.80% | | | | | |
| Alphabet Incorporated Class A † | | | | 372 | 1,077,699 |
| Alphabet Incorporated Class C † | | | | 347 | 1,004,078 |
| Match Group Incorporated † | | | | 350 | 46,288 |
| Meta Platforms Incorporated Class A † | | | | 2,929 | 985,169 |
| Twitter Incorporated † | | | | 994 | 42,961 |
| | | | | | 3,156,195 |
| Media: 0.61% | | | | | |
| Charter Communications Incorporated Class A † | | | | 152 | 99,099 |
| Comcast Corporation Class A | | | | 5,648 | 284,264 |
| Discovery Incorporated Class A † | | | | 209 | 4,920 |
| Discovery Incorporated Class C † | | | | 375 | 8,588 |
| DISH Network Corporation Class A † | | | | 308 | 9,992 |
| Fox Corporation Class A | | | | 397 | 14,649 |
| Fox Corporation Class B | | | | 182 | 6,237 |
| Interpublic Group of Companies Incorporated | | | | 486 | 18,201 |
| News Corporation Class A | | | | 484 | 10,798 |
| News Corporation Class B | | | | 149 | 3,353 |
| Omnicom Group Incorporated | | | | 262 | 19,197 |
| ViacomCBS Incorporated Class B | | | | 754 | 22,756 |
| | | | | | 502,054 |
| Wireless telecommunication services: 0.10% | | | | | |
| T-Mobile US Incorporated † | | | | 724 | 83,970 |
| Consumer discretionary: 7.53% | | | | | |
| Auto components: 0.08% | | | | | |
| Aptiv plc † | | | | 333 | 54,928 |
| BorgWarner Incorporated | | | | 296 | 13,341 |
| | | | | | 68,269 |
| Automobiles: 1.52% | | | | | |
| Ford Motor Company | | | | 4,828 | 100,278 |
The accompanying notes are an integral part of these financial statements.
Allspring VT Index Asset Allocation Fund | 11
Portfolio of investments—December 31, 2021
| | | | | Shares | Value |
| Automobiles (continued) | | | | | |
| General Motors Company † | | | | 1,797 | $ 105,358 |
| Tesla Motors Incorporated † | | | | 1,003 | 1,059,950 |
| | | | | | 1,265,586 |
| Distributors: 0.09% | | | | | |
| Genuine Parts Company | | | | 176 | 24,675 |
| LKQ Corporation | | | | 332 | 19,930 |
| Pool Corporation | | | | 50 | 28,300 |
| | | | | | 72,905 |
| Hotels, restaurants & leisure: 1.18% | | | | | |
| Booking Holdings Incorporated † | | | | 51 | 122,361 |
| Caesars Entertainment Incorporated † | | | | 263 | 24,598 |
| Carnival Corporation † | | | | 983 | 19,778 |
| Chipotle Mexican Grill Incorporated † | | | | 35 | 61,189 |
| Darden Restaurants Incorporated | | | | 160 | 24,102 |
| Domino's Pizza Incorporated | | | | 45 | 25,395 |
| Expedia Group Incorporated † | | | | 180 | 32,530 |
| Hilton Worldwide Holdings Incorporated † | | | | 344 | 53,661 |
| Las Vegas Sands Corporation † | | | | 423 | 15,922 |
| Marriott International Incorporated Class A † | | | | 336 | 55,521 |
| McDonald's Corporation | | | | 926 | 248,233 |
| MGM Resorts International | | | | 480 | 21,542 |
| Norwegian Cruise Line Holdings Limited † | | | | 448 | 9,292 |
| Penn National Gaming Incorporated † | | | | 206 | 10,681 |
| Royal Caribbean Cruises Limited † | | | | 275 | 21,148 |
| Starbucks Corporation | | | | 1,461 | 170,893 |
| Wynn Resorts Limited † | | | | 129 | 10,970 |
| Yum! Brands Incorporated | | | | 363 | 50,406 |
| | | | | | 978,222 |
| Household durables: 0.23% | | | | | |
| D.R. Horton Incorporated | | | | 403 | 43,705 |
| Garmin Limited | | | | 187 | 25,464 |
| Lennar Corporation Class A | | | | 335 | 38,914 |
| Mohawk Industries Incorporated † | | | | 68 | 12,388 |
| Newell Rubbermaid Incorporated | | | | 468 | 10,221 |
| NVR Incorporated † | | | | 4 | 23,635 |
| PulteGroup Incorporated | | | | 311 | 17,777 |
| Whirlpool Corporation | | | | 74 | 17,365 |
| | | | | | 189,469 |
| Internet & direct marketing retail: 2.27% | | | | | |
| Amazon.com Incorporated † | | | | 539 | 1,797,204 |
| eBay Incorporated | | | | 774 | 51,471 |
| Etsy Incorporated † | | | | 155 | 33,936 |
| | | | | | 1,882,611 |
| Leisure products: 0.02% | | | | | |
| Hasbro Incorporated | | | | 160 | 16,285 |
| Multiline retail: 0.30% | | | | | |
| Dollar General Corporation | | | | 289 | 68,155 |
The accompanying notes are an integral part of these financial statements.
12 | Allspring VT Index Asset Allocation Fund
Portfolio of investments—December 31, 2021
| | | | | Shares | Value |
| Multiline retail (continued) | | | | | |
| Dollar Tree Incorporated † | | | | 278 | $ 39,065 |
| Target Corporation | | | | 605 | 140,021 |
| | | | | | 247,241 |
| Specialty retail: 1.44% | | | | | |
| Advance Auto Parts Incorporated | | | | 77 | 18,471 |
| AutoZone Incorporated † | | | | 26 | 54,506 |
| Bath & Body Works Incorporated | | | | 326 | 22,752 |
| Best Buy Company Incorporated | | | | 273 | 27,737 |
| CarMax Incorporated † | | | | 200 | 26,046 |
| Lowe's Companies Incorporated | | | | 857 | 221,517 |
| O'Reilly Automotive Incorporated † | | | | 83 | 58,617 |
| Ross Stores Incorporated | | | | 440 | 50,283 |
| The Gap Incorporated | | | | 264 | 4,660 |
| The Home Depot Incorporated | | | | 1,308 | 542,833 |
| The TJX Companies Incorporated | | | | 1,488 | 112,969 |
| Tractor Supply Company | | | | 140 | 33,404 |
| Ulta Beauty Incorporated † | | | | 67 | 27,627 |
| | | | | | 1,201,422 |
| Textiles, apparel & luxury goods: 0.40% | | | | | |
| Nike Incorporated Class B | | | | 1,580 | 263,339 |
| PVH Corporation | | | | 87 | 9,279 |
| Ralph Lauren Corporation | | | | 59 | 7,013 |
| Tapestry Incorporated | | | | 339 | 13,763 |
| Under Armour Incorporated Class A † | | | | 231 | 4,895 |
| Under Armour Incorporated Class C † | | | | 266 | 4,799 |
| VF Corporation | | | | 403 | 29,508 |
| | | | | | 332,596 |
| Consumer staples: 3.54% | | | | | |
| Beverages: 0.85% | | | | | |
| Brown-Forman Corporation Class B | | | | 226 | 16,466 |
| Constellation Brands Incorporated Class A | | | | 203 | 50,947 |
| Molson Coors Brewing Company Class B | | | | 232 | 10,753 |
| Monster Beverage Corporation † | | | | 464 | 44,563 |
| PepsiCo Incorporated | | | | 1,716 | 298,086 |
| The Coca-Cola Company | | | | 4,818 | 285,274 |
| | | | | | 706,089 |
| Food & staples retailing: 0.84% | | | | | |
| Costco Wholesale Corporation | | | | 548 | 311,100 |
| Sysco Corporation | | | | 634 | 49,801 |
| The Kroger Company | | | | 841 | 38,064 |
| Walgreens Boots Alliance Incorporated | | | | 889 | 46,370 |
| Walmart Incorporated | | | | 1,765 | 255,378 |
| | | | | | 700,713 |
| Food products: 0.53% | | | | | |
| Archer Daniels Midland Company | | | | 693 | 46,840 |
| Campbell Soup Company | | | | 250 | 10,865 |
| ConAgra Foods Incorporated | | | | 594 | 20,285 |
| General Mills Incorporated | | | | 752 | 50,670 |
| Hormel Foods Corporation | | | | 350 | 17,084 |
The accompanying notes are an integral part of these financial statements.
Allspring VT Index Asset Allocation Fund | 13
Portfolio of investments—December 31, 2021
| | | | | Shares | Value |
| Food products (continued) | | | | | |
| Kellogg Company | | | | 317 | $ 20,421 |
| Lamb Weston Holdings Incorporated | | | | 180 | 11,408 |
| McCormick & Company Incorporated | | | | 309 | 29,852 |
| Mondelez International Incorporated Class A | | | | 1,729 | 114,650 |
| The Hershey Company | | | | 180 | 34,825 |
| The J.M. Smucker Company | | | | 134 | 18,200 |
| The Kraft Heinz Company | | | | 879 | 31,556 |
| Tyson Foods Incorporated Class A | | | | 365 | 31,813 |
| | | | | | 438,469 |
| Household products: 0.84% | | | | | |
| Church & Dwight Company Incorporated | | | | 303 | 31,058 |
| Colgate-Palmolive Company | | | | 1,044 | 89,095 |
| Kimberly-Clark Corporation | | | | 417 | 59,598 |
| The Clorox Company | | | | 151 | 26,328 |
| The Procter & Gamble Company | | | | 3,002 | 491,067 |
| | | | | | 697,146 |
| Personal products: 0.13% | | | | | |
| The Estee Lauder Companies Incorporated Class A | | | | 287 | 106,247 |
| Tobacco: 0.35% | | | | | |
| Altria Group Incorporated | | | | 2,276 | 107,860 |
| Philip Morris International Incorporated | | | | 1,929 | 183,255 |
| | | | | | 291,115 |
| Energy: 1.60% | | | | | |
| Energy equipment & services: 0.12% | | | | | |
| Baker Hughes Incorporated | | | | 1,080 | 25,985 |
| Halliburton Company | | | | 1,106 | 25,294 |
| Schlumberger Limited | | | | 1,743 | 52,203 |
| | | | | | 103,482 |
| Oil, gas & consumable fuels: 1.48% | | | | | |
| APA Corporation | | | | 444 | 11,939 |
| Cabot Oil & Gas Corporation | | | | 1,001 | 19,019 |
| Chevron Corporation | | | | 2,388 | 280,232 |
| ConocoPhillips | | | | 1,629 | 117,581 |
| Devon Energy Corporation | | | | 775 | 34,139 |
| Diamondback Energy Incorporated | | | | 209 | 22,541 |
| EOG Resources Incorporated | | | | 722 | 64,135 |
| Exxon Mobil Corporation | | | | 5,239 | 320,574 |
| Hess Corporation | | | | 340 | 25,170 |
| Kinder Morgan Incorporated | | | | 2,415 | 38,302 |
| Marathon Oil Corporation | | | | 957 | 15,714 |
| Marathon Petroleum Corporation | | | | 758 | 48,504 |
| Occidental Petroleum Corporation | | | | 1,092 | 31,657 |
| ONEOK Incorporated | | | | 552 | 32,436 |
| Phillips 66 | | | | 541 | 39,201 |
| Pioneer Natural Resources Company | | | | 280 | 50,926 |
| The Williams Companies Incorporated | | | | 1,502 | 39,112 |
| Valero Energy Corporation | | | | 506 | 38,006 |
| | | | | | 1,229,188 |
The accompanying notes are an integral part of these financial statements.
14 | Allspring VT Index Asset Allocation Fund
Portfolio of investments—December 31, 2021
| | | | | Shares | Value |
| Financials: 6.42% | | | | | |
| Banks: 2.38% | | | | | |
| Bank of America Corporation | | | | 8,915 | $ 396,628 |
| Citigroup Incorporated | | | | 2,455 | 148,257 |
| Citizens Financial Group Incorporated | | | | 526 | 24,854 |
| Comerica Incorporated | | | | 161 | 14,007 |
| Fifth Third Bancorp | | | | 846 | 36,843 |
| First Republic Bank | | | | 221 | 45,639 |
| Huntington Bancshares Incorporated | | | | 1,789 | 27,586 |
| JPMorgan Chase & Company | | | | 3,660 | 579,561 |
| KeyCorp | | | | 1,150 | 26,600 |
| M&T Bank Corporation | | | | 158 | 24,266 |
| People's United Financial Incorporated | | | | 528 | 9,409 |
| PNC Financial Services Group Incorporated | | | | 522 | 104,671 |
| Regions Financial Corporation | | | | 1,177 | 25,659 |
| Signature Bank | | | | 74 | 23,937 |
| SVB Financial Group † | | | | 73 | 49,512 |
| Truist Financial Corporation | | | | 1,649 | 96,549 |
| US Bancorp | | | | 1,671 | 93,860 |
| Wells Fargo & Company | | | | 4,931 | 236,589 |
| Zions Bancorporation | | | | 192 | 12,127 |
| | | | | | 1,976,554 |
| Capital markets: 1.79% | | | | | |
| Ameriprise Financial Incorporated | | | | 138 | 41,629 |
| Bank of New York Mellon Corporation | | | | 939 | 54,537 |
| BlackRock Incorporated | | | | 178 | 162,970 |
| Cboe Global Markets Incorporated | | | | 131 | 17,082 |
| CME Group Incorporated | | | | 445 | 101,665 |
| FactSet Research Systems Incorporated | | | | 46 | 22,356 |
| Franklin Resources Incorporated | | | | 347 | 11,621 |
| Intercontinental Exchange Incorporated | | | | 698 | 95,465 |
| Invesco Limited | | | | 420 | 9,668 |
| MarketAxess Holdings Incorporated | | | | 47 | 19,330 |
| Moody's Corporation | | | | 200 | 78,116 |
| Morgan Stanley | | | | 1,776 | 174,332 |
| MSCI Incorporated | | | | 102 | 62,494 |
| Northern Trust Corporation | | | | 257 | 30,740 |
| Raymond James Financial Incorporated | | | | 227 | 22,791 |
| S&P Global Incorporated | | | | 298 | 140,635 |
| State Street Corporation | | | | 451 | 41,943 |
| T. Rowe Price Group Incorporated | | | | 278 | 54,666 |
| The Charles Schwab Corporation | | | | 1,859 | 156,342 |
| The Goldman Sachs Group Incorporated | | | | 420 | 160,671 |
| The NASDAQ Incorporated | | | | 144 | 30,241 |
| | | | | | 1,489,294 |
| Consumer finance: 0.33% | | | | | |
| American Express Company | | | | 776 | 126,954 |
| Capital One Financial Corporation | | | | 525 | 76,172 |
| Discover Financial Services | | | | 362 | 41,833 |
| Synchrony Financial | | | | 674 | 31,267 |
| | | | | | 276,226 |
| Diversified financial services: 0.82% | | | | | |
| Berkshire Hathaway Incorporated Class B † | | | | 2,270 | 678,730 |
The accompanying notes are an integral part of these financial statements.
Allspring VT Index Asset Allocation Fund | 15
Portfolio of investments—December 31, 2021
| | | | | Shares | Value |
| Insurance: 1.10% | | | | | |
| AFLAC Incorporated | | | | 753 | $ 43,968 |
| American International Group Incorporated | | | | 1,027 | 58,395 |
| Aon plc Class A | | | | 272 | 81,752 |
| Arthur J. Gallagher & Company | | | | 256 | 43,436 |
| Assurant Incorporated | | | | 70 | 10,910 |
| Brown & Brown Incorporated | | | | 290 | 20,381 |
| Chubb Limited | | | | 533 | 103,034 |
| Cincinnati Financial Corporation | | | | 185 | 21,077 |
| Everest Reinsurance Group Limited | | | | 49 | 13,422 |
| Globe Life Incorporated | | | | 113 | 10,590 |
| Lincoln National Corporation | | | | 209 | 14,266 |
| Loews Corporation | | | | 248 | 14,324 |
| Marsh & McLennan Companies Incorporated | | | | 625 | 108,638 |
| MetLife Incorporated | | | | 885 | 55,304 |
| Principal Financial Group Incorporated | | | | 304 | 21,988 |
| Progressive Corporation | | | | 724 | 74,319 |
| Prudential Financial Incorporated | | | | 467 | 50,548 |
| The Allstate Corporation | | | | 354 | 41,648 |
| The Hartford Financial Services Group Incorporated | | | | 420 | 28,997 |
| The Travelers Companies Incorporated | | | | 304 | 47,555 |
| W.R. Berkley Corporation | | | | 172 | 14,171 |
| Willis Towers Watson plc | | | | 153 | 36,336 |
| | | | | | 915,059 |
| Health care: 8.00% | | | | | |
| Biotechnology: 1.07% | | | | | |
| AbbVie Incorporated | | | | 2,188 | 296,255 |
| Amgen Incorporated | | | | 696 | 156,579 |
| Biogen Incorporated † | | | | 182 | 43,665 |
| Gilead Sciences Incorporated | | | | 1,554 | 112,836 |
| Incyte Corporation † | | | | 230 | 16,882 |
| Moderna Incorporated † | | | | 440 | 111,751 |
| Regeneron Pharmaceuticals Incorporated † | | | | 131 | 82,729 |
| Vertex Pharmaceuticals Incorporated † | | | | 314 | 68,954 |
| | | | | | 889,651 |
| Health care equipment & supplies: 1.83% | | | | | |
| Abbott Laboratories | | | | 2,192 | 308,502 |
| ABIOMED Incorporated † | | | | 56 | 20,114 |
| Align Technology Incorporated † | | | | 91 | 59,803 |
| Baxter International Incorporated | | | | 619 | 53,135 |
| Becton Dickinson & Company | | | | 356 | 89,527 |
| Boston Scientific Corporation † | | | | 1,762 | 74,850 |
| Dentsply Sirona Incorporated | | | | 270 | 15,063 |
| DexCom Incorporated † | | | | 120 | 64,434 |
| Edwards Lifesciences Corporation † | | | | 773 | 100,142 |
| Hologic Incorporated † | | | | 315 | 24,116 |
| IDEXX Laboratories Incorporated † | | | | 106 | 69,797 |
| Intuitive Surgical Incorporated † | | | | 442 | 158,811 |
| Medtronic plc | | | | 1,666 | 172,348 |
| ResMed Incorporated | | | | 180 | 46,886 |
| STERIS plc | | | | 123 | 29,939 |
| Stryker Corporation | | | | 413 | 110,444 |
| Teleflex Incorporated | | | | 58 | 19,052 |
The accompanying notes are an integral part of these financial statements.
16 | Allspring VT Index Asset Allocation Fund
Portfolio of investments—December 31, 2021
| | | | | Shares | Value |
| Health care equipment & supplies (continued) | | | | | |
| The Cooper Companies Incorporated | | | | 61 | $ 25,555 |
| West Pharmaceutical Services Incorporated | | | | 92 | 43,149 |
| Zimmer Biomet Holdings Incorporated | | | | 258 | 32,776 |
| | | | | | 1,518,443 |
| Health care providers & services: 1.67% | | | | | |
| AmerisourceBergen Corporation | | | | 185 | 24,585 |
| Anthem Incorporated | | | | 300 | 139,062 |
| Cardinal Health Incorporated | | | | 348 | 17,919 |
| Centene Corporation † | | | | 722 | 59,493 |
| Cigna Corporation | | | | 409 | 93,919 |
| CVS Health Corporation | | | | 1,636 | 168,770 |
| DaVita HealthCare Partners Incorporated † | | | | 79 | 8,987 |
| HCA Healthcare Incorporated | | | | 296 | 76,048 |
| Henry Schein Incorporated † | | | | 171 | 13,258 |
| Humana Incorporated | | | | 159 | 73,754 |
| Laboratory Corporation of America Holdings † | | | | 118 | 37,077 |
| McKesson Corporation | | | | 188 | 46,731 |
| Quest Diagnostics Incorporated | | | | 151 | 26,125 |
| UnitedHealth Group Incorporated | | | | 1,167 | 585,997 |
| Universal Health Services Incorporated Class B | | | | 90 | 11,669 |
| | | | | | 1,383,394 |
| Health care technology: 0.04% | | | | | |
| Cerner Corporation | | | | 365 | 33,898 |
| Life sciences tools & services: 1.16% | | | | | |
| Agilent Technologies Incorporated | | | | 374 | 59,709 |
| Bio-Rad Laboratories Incorporated Class A † | | | | 27 | 20,400 |
| Bio-Techne Corporation | | | | 49 | 25,350 |
| Charles River Laboratories International Incorporated † | | | | 63 | 23,737 |
| Danaher Corporation | | | | 788 | 259,260 |
| Illumina Incorporated † | | | | 194 | 73,805 |
| IQVIA Holdings Incorporated † | | | | 236 | 66,585 |
| Mettler-Toledo International Incorporated † | | | | 29 | 49,219 |
| PerkinElmer Incorporated | | | | 156 | 31,365 |
| Thermo Fisher Scientific Incorporated | | | | 489 | 326,280 |
| Waters Corporation † | | | | 76 | 28,318 |
| | | | | | 964,028 |
| Pharmaceuticals: 2.23% | | | | | |
| Bristol-Myers Squibb Company | | | | 2,747 | 171,275 |
| Catalent Incorporated † | | | | 211 | 27,014 |
| Eli Lilly & Company | | | | 985 | 272,077 |
| Johnson & Johnson | | | | 3,267 | 558,886 |
| Merck & Company Incorporated | | | | 3,134 | 240,190 |
| Organon & Company | | | | 316 | 9,622 |
| Pfizer Incorporated | | | | 6,989 | 412,700 |
| Viatris Incorporated | | | | 1,493 | 20,200 |
| Zoetis Incorporated | | | | 585 | 142,758 |
| | | | | | 1,854,722 |
| Industrials: 4.67% | | | | | |
| Aerospace & defense: 0.81% | | | | | |
| General Dynamics Corporation | | | | 287 | 59,831 |
The accompanying notes are an integral part of these financial statements.
Allspring VT Index Asset Allocation Fund | 17
Portfolio of investments—December 31, 2021
| | | | | Shares | Value |
| Aerospace & defense (continued) | | | | | |
| Howmet Aerospace Incorporated | | | | 474 | $ 15,087 |
| Huntington Ingalls Industries Incorporated | | | | 48 | 8,964 |
| L3Harris Technologies Incorporated | | | | 243 | 51,817 |
| Lockheed Martin Corporation | | | | 304 | 108,045 |
| Northrop Grumman Corporation | | | | 185 | 71,608 |
| Raytheon Technologies Corporation | | | | 1,853 | 159,469 |
| Textron Incorporated | | | | 271 | 20,921 |
| The Boeing Company † | | | | 681 | 137,099 |
| TransDigm Group Incorporated † | | | | 65 | 41,358 |
| | | | | | 674,199 |
| Air freight & logistics: 0.38% | | | | | |
| C.H. Robinson Worldwide Incorporated | | | | 160 | 17,221 |
| Expeditors International of Washington Incorporated | | | | 209 | 28,067 |
| FedEx Corporation | | | | 302 | 78,109 |
| United Parcel Service Incorporated Class B | | | | 904 | 193,763 |
| | | | | | 317,160 |
| Airlines: 0.12% | | | | | |
| Alaska Air Group Incorporated † | | | | 153 | 7,971 |
| American Airlines Group Incorporated † | | | | 797 | 14,314 |
| Delta Air Lines Incorporated † | | | | 787 | 30,756 |
| Southwest Airlines Company † | | | | 733 | 31,402 |
| United Airlines Holdings Incorporated † | | | | 397 | 17,381 |
| | | | | | 101,824 |
| Building products: 0.31% | | | | | |
| A.O. Smith Corporation | | | | 164 | 14,079 |
| Allegion plc | | | | 110 | 14,568 |
| Carrier Global Corporation | | | | 1,072 | 58,145 |
| Fortune Brands Home & Security Incorporated | | | | 167 | 17,852 |
| Johnson Controls International plc | | | | 878 | 71,390 |
| Masco Corporation | | | | 301 | 21,136 |
| Trane Technologies plc | | | | 294 | 59,397 |
| | | | | | 256,567 |
| Commercial services & supplies: 0.26% | | | | | |
| Cintas Corporation | | | | 109 | 48,306 |
| Copart Incorporated † | | | | 263 | 39,876 |
| Republic Services Incorporated | | | | 259 | 36,118 |
| Rollins Incorporated | | | | 281 | 9,613 |
| Waste Management Incorporated | | | | 477 | 79,611 |
| | | | | | 213,524 |
| Construction & engineering: 0.02% | | | | | |
| Quanta Services Incorporated | | | | 176 | 20,180 |
| Electrical equipment: 0.33% | | | | | |
| AMETEK Incorporated | | | | 286 | 42,053 |
| Eaton Corporation plc | | | | 493 | 85,200 |
| Emerson Electric Company | | | | 741 | 68,891 |
| Generac Holdings Incorporated † | | | | 78 | 27,450 |
| Rockwell Automation Incorporated | | | | 143 | 49,886 |
| | | | | | 273,480 |
The accompanying notes are an integral part of these financial statements.
18 | Allspring VT Index Asset Allocation Fund
Portfolio of investments—December 31, 2021
| | | | | Shares | Value |
| Industrial conglomerates: 0.60% | | | | | |
| 3M Company | | | | 713 | $ 126,650 |
| General Electric Company | | | | 1,357 | 128,196 |
| Honeywell International Incorporated | | | | 852 | 177,651 |
| Roper Technologies Incorporated | | | | 131 | 64,434 |
| | | | | | 496,931 |
| Machinery: 0.91% | | | | | |
| Caterpillar Incorporated | | | | 667 | 137,896 |
| Cummins Incorporated | | | | 176 | 38,393 |
| Deere & Company | | | | 348 | 119,326 |
| Dover Corporation | | | | 178 | 32,325 |
| Fortive Corporation | | | | 444 | 33,873 |
| IDEX Corporation | | | | 93 | 21,978 |
| Illinois Tool Works Incorporated | | | | 353 | 87,120 |
| Ingersoll Rand Incorporated | | | | 504 | 31,182 |
| Otis Worldwide Corporation | | | | 525 | 45,712 |
| PACCAR Incorporated | | | | 430 | 37,952 |
| Parker-Hannifin Corporation | | | | 160 | 50,899 |
| Pentair plc | | | | 204 | 14,898 |
| Snap-on Incorporated | | | | 66 | 14,215 |
| Stanley Black & Decker Incorporated | | | | 201 | 37,913 |
| Wabtec Corporation | | | | 230 | 21,185 |
| Xylem Incorporated | | | | 222 | 26,622 |
| | | | | | 751,489 |
| Professional services: 0.26% | | | | | |
| Equifax Incorporated | | | | 151 | 44,211 |
| IHS Markit Limited | | | | 492 | 65,397 |
| Jacobs Engineering Group Incorporated | | | | 160 | 22,277 |
| Leidos Holdings Incorporated | | | | 173 | 15,380 |
| Nielsen Holdings plc | | | | 442 | 9,065 |
| Robert Half International Incorporated | | | | 137 | 15,278 |
| Verisk Analytics Incorporated | | | | 198 | 45,289 |
| | | | | | 216,897 |
| Road & rail: 0.55% | | | | | |
| CSX Corporation | | | | 2,749 | 103,362 |
| J.B. Hunt Transport Services Incorporated | | | | 103 | 21,053 |
| Norfolk Southern Corporation | | | | 300 | 89,313 |
| Old Dominion Freight Line Incorporated | | | | 115 | 41,214 |
| Union Pacific Corporation | | | | 797 | 200,788 |
| | | | | | 455,730 |
| Trading companies & distributors: 0.12% | | | | | |
| Fastenal Company | | | | 711 | 45,547 |
| United Rentals Incorporated † | | | | 89 | 29,574 |
| W.W. Grainger Incorporated | | | | 53 | 27,467 |
| | | | | | 102,588 |
| Information technology: 17.49% | | | | | |
| Communications equipment: 0.55% | | | | | |
| Arista Networks Incorporated † | | | | 276 | 39,675 |
| Cisco Systems Incorporated | | | | 5,230 | 331,425 |
| F5 Networks Incorporated † | | | | 74 | 18,109 |
The accompanying notes are an integral part of these financial statements.
Allspring VT Index Asset Allocation Fund | 19
Portfolio of investments—December 31, 2021
| | | | | Shares | Value |
| Communications equipment (continued) | | | | | |
| Juniper Networks Incorporated | | | | 402 | $ 14,355 |
| Motorola Solutions Incorporated | | | | 208 | 56,514 |
| | | | | | 460,078 |
| Electronic equipment, instruments & components: 0.41% | | | | | |
| Amphenol Corporation Class A | | | | 740 | 64,720 |
| CDW Corporation of Delaware | | | | 167 | 34,198 |
| Corning Incorporated | | | | 949 | 35,331 |
| IPG Photonics Corporation † | | | | 43 | 7,402 |
| Keysight Technologies Incorporated † | | | | 226 | 46,671 |
| TE Connectivity Limited | | | | 403 | 65,020 |
| Teledyne Technologies Incorporated † | | | | 58 | 25,340 |
| Trimble Incorporated † | | | | 310 | 27,029 |
| Zebra Technologies Corporation Class A † | | | | 66 | 39,283 |
| | | | | | 344,994 |
| IT services: 2.70% | | | | | |
| Accenture plc Class A | | | | 783 | 324,593 |
| Akamai Technologies Incorporated † | | | | 200 | 23,408 |
| Automatic Data Processing Incorporated | | | | 521 | 128,468 |
| Broadridge Financial Solutions Incorporated | | | | 144 | 26,326 |
| Cognizant Technology Solutions Corporation Class A | | | | 650 | 57,668 |
| DXC Technology Company † | | | | 310 | 9,979 |
| EPAM Systems Incorporated † | | | | 70 | 46,792 |
| Fidelity National Information Services Incorporated | | | | 754 | 82,299 |
| Fiserv Incorporated † | | | | 735 | 76,286 |
| FleetCor Technologies Incorporated † | | | | 100 | 22,384 |
| Gartner Incorporated † | | | | 102 | 34,101 |
| Global Payments Incorporated | | | | 359 | 48,530 |
| International Business Machines Corporation | | | | 1,112 | 148,630 |
| Jack Henry & Associates Incorporated | | | | 91 | 15,196 |
| MasterCard Incorporated Class A | | | | 1,073 | 385,550 |
| Paychex Incorporated | | | | 396 | 54,054 |
| PayPal Holdings Incorporated † | | | | 1,457 | 274,761 |
| VeriSign Incorporated † | | | | 118 | 29,951 |
| Visa Incorporated Class A | | | | 2,078 | 450,323 |
| | | | | | 2,239,299 |
| Semiconductors & semiconductor equipment: 3.81% | | | | | |
| Advanced Micro Devices Incorporated † | | | | 1,479 | 212,828 |
| Analog Devices Incorporated | | | | 664 | 116,711 |
| Applied Materials Incorporated | | | | 1,112 | 174,984 |
| Broadcom Incorporated | | | | 509 | 338,694 |
| Enphase Energy Incorporated † | | | | 166 | 30,368 |
| Intel Corporation | | | | 5,032 | 259,148 |
| KLA Corporation | | | | 187 | 80,431 |
| Lam Research Corporation | | | | 174 | 125,132 |
| Microchip Technology Incorporated | | | | 684 | 59,549 |
| Micron Technology Incorporated | | | | 1,379 | 128,454 |
| Monolithic Power Systems Incorporated | | | | 53 | 26,146 |
| NVIDIA Corporation | | | | 3,056 | 898,800 |
| NXP Semiconductors NV | | | | 328 | 74,712 |
| Qorvo Incorporated † | | | | 135 | 21,113 |
| Qualcomm Incorporated | | | | 1,379 | 252,178 |
| Skyworks Solutions Incorporated | | | | 203 | 31,493 |
The accompanying notes are an integral part of these financial statements.
20 | Allspring VT Index Asset Allocation Fund
Portfolio of investments—December 31, 2021
| | | | | Shares | Value |
| Semiconductors & semiconductor equipment (continued) | | | | | |
| Solaredge Technologies Incorporated † | | | | 64 | $ 17,956 |
| Teradyne Incorporated | | | | 201 | 32,870 |
| Texas Instruments Incorporated | | | | 1,141 | 215,044 |
| Xilinx Incorporated | | | | 304 | 64,457 |
| | | | | | 3,161,068 |
| Software: 5.72% | | | | | |
| Adobe Incorporated † | | | | 589 | 333,998 |
| ANSYS Incorporated † | | | | 108 | 43,321 |
| Autodesk Incorporated † | | | | 271 | 76,202 |
| Cadence Design Systems Incorporated † | | | | 342 | 63,732 |
| Ceridian HCM Holding Incorporated † | | | | 167 | 17,445 |
| Citrix Systems Incorporated | | | | 152 | 14,378 |
| Fortinet Incorporated † | | | | 167 | 60,020 |
| Intuit Incorporated | | | | 351 | 225,770 |
| Microsoft Corporation | | | | 9,281 | 3,121,386 |
| NortonLifeLock Incorporated | | | | 719 | 18,680 |
| Oracle Corporation | | | | 1,999 | 174,333 |
| Paycom Software Incorporated † | | | | 60 | 24,911 |
| PTC Incorporated † | | | | 130 | 15,750 |
| Salesforce.com Incorporated † | | | | 1,211 | 307,751 |
| ServiceNow Incorporated † | | | | 246 | 159,681 |
| Synopsys Incorporated † | | | | 188 | 69,278 |
| Tyler Technologies Incorporated † | | | | 51 | 27,435 |
| | | | | | 4,754,071 |
| Technology hardware, storage & peripherals: 4.30% | | | | | |
| Apple Incorporated | | | | 19,231 | 3,414,849 |
| Hewlett Packard Enterprise Company | | | | 1,615 | 25,469 |
| HP Incorporated | | | | 1,425 | 53,680 |
| NetApp Incorporated | | | | 276 | 25,389 |
| Seagate Technology Holdings plc | | | | 252 | 28,471 |
| Western Digital Corporation † | | | | 383 | 24,975 |
| | | | | | 3,572,833 |
| Materials: 1.54% | | | | | |
| Chemicals: 1.07% | | | | | |
| Air Products & Chemicals Incorporated | | | | 274 | 83,367 |
| Albemarle Corporation | | | | 144 | 33,663 |
| Celanese Corporation Series A | | | | 134 | 22,520 |
| CF Industries Holdings Incorporated | | | | 263 | 18,615 |
| Corteva Incorporated | | | | 902 | 42,647 |
| Dow Incorporated | | | | 913 | 51,785 |
| DuPont de Nemours Incorporated | | | | 640 | 51,699 |
| Eastman Chemical Company | | | | 165 | 19,950 |
| Ecolab Incorporated | | | | 308 | 72,254 |
| FMC Corporation | | | | 156 | 17,143 |
| International Flavors & Fragrances Incorporated | | | | 314 | 47,304 |
| Linde plc | | | | 635 | 219,983 |
| LyondellBasell Industries NV Class A | | | | 325 | 29,975 |
| PPG Industries Incorporated | | | | 293 | 50,525 |
| The Mosaic Company | | | | 455 | 17,877 |
| The Sherwin-Williams Company | | | | 299 | 105,296 |
| | | | | | 884,603 |
The accompanying notes are an integral part of these financial statements.
Allspring VT Index Asset Allocation Fund | 21
Portfolio of investments—December 31, 2021
| | | | | Shares | Value |
| Construction materials: 0.08% | | | | | |
| Martin Marietta Materials Incorporated | | | | 77 | $ 33,920 |
| Vulcan Materials Company | | | | 163 | 33,836 |
| | | | | | 67,756 |
| Containers & packaging: 0.18% | | | | | |
| Amcor plc | | | | 1,902 | 22,843 |
| Avery Dennison Corporation | | | | 102 | 22,090 |
| Ball Corporation | | | | 401 | 38,604 |
| International Paper Company | | | | 479 | 22,503 |
| Packaging Corporation of America | | | | 117 | 15,930 |
| Sealed Air Corporation | | | | 183 | 12,347 |
| WestRock Company | | | | 330 | 14,639 |
| | | | | | 148,956 |
| Metals & mining: 0.21% | | | | | |
| Freeport-McMoRan Incorporated | | | | 1,808 | 75,448 |
| Newmont Corporation | | | | 993 | 61,586 |
| Nucor Corporation | | | | 352 | 40,181 |
| | | | | | 177,215 |
| Real estate: 1.67% | | | | | |
| Equity REITs: 1.62% | | | | | |
| Alexandria Real Estate Equities Incorporated | | | | 175 | 39,018 |
| American Tower Corporation | | | | 565 | 165,263 |
| AvalonBay Communities Incorporated | | | | 173 | 43,698 |
| Boston Properties Incorporated | | | | 176 | 20,272 |
| Crown Castle International Corporation | | | | 536 | 111,885 |
| Digital Realty Trust Incorporated | | | | 352 | 62,258 |
| Duke Realty Corporation | | | | 472 | 30,982 |
| Equinix Incorporated | | | | 112 | 94,734 |
| Equity Residential | | | | 422 | 38,191 |
| Essex Property Trust Incorporated | | | | 81 | 28,531 |
| Extra Space Storage Incorporated | | | | 165 | 37,410 |
| Federal Realty Investment Trust | | | | 86 | 11,724 |
| Healthpeak Properties Incorporated | | | | 667 | 24,072 |
| Host Hotels & Resorts Incorporated † | | | | 882 | 15,338 |
| Iron Mountain Incorporated | | | | 359 | 18,786 |
| Kimco Realty Corporation | | | | 765 | 18,857 |
| Mid-America Apartment Communities Incorporated | | | | 142 | 32,580 |
| Prologis Incorporated | | | | 918 | 154,554 |
| Public Storage Incorporated | | | | 189 | 70,792 |
| Realty Income Corporation | | | | 702 | 50,256 |
| Regency Centers Corporation | | | | 190 | 14,317 |
| SBA Communications Corporation | | | | 136 | 52,907 |
| Simon Property Group Incorporated | | | | 407 | 65,026 |
| UDR Incorporated | | | | 360 | 21,596 |
| Ventas Incorporated | | | | 494 | 25,253 |
| Vornado Realty Trust | | | | 196 | 8,205 |
| Welltower Incorporated | | | | 540 | 46,316 |
| Weyerhaeuser Company | | | | 928 | 38,215 |
| | | | | | 1,341,036 |
| Real estate management & development: 0.05% | | | | | |
| CBRE Group Incorporated Class A † | | | | 413 | 44,815 |
The accompanying notes are an integral part of these financial statements.
22 | Allspring VT Index Asset Allocation Fund
Portfolio of investments—December 31, 2021
| | | | | Shares | Value |
| Utilities: 1.51% | | | | | |
| Electric utilities: 0.97% | | | | | |
| Alliant Energy Corporation | | | | 310 | $ 19,056 |
| American Electric Power Company Incorporated | | | | 626 | 55,695 |
| Duke Energy Corporation | | | | 956 | 100,284 |
| Edison International | | | | 473 | 32,282 |
| Entergy Corporation | | | | 248 | 27,937 |
| Evergy Incorporated | | | | 284 | 19,485 |
| Eversource Energy | | | | 428 | 38,939 |
| Exelon Corporation | | | | 1,219 | 70,409 |
| FirstEnergy Corporation | | | | 674 | 28,032 |
| NextEra Energy Incorporated | | | | 2,443 | 228,078 |
| NRG Energy Incorporated | | | | 303 | 13,053 |
| Pinnacle West Capital Corporation | | | | 140 | 9,883 |
| PPL Corporation | | | | 932 | 28,016 |
| The Southern Company | | | | 1,319 | 90,457 |
| Xcel Energy Incorporated | | | | 669 | 45,291 |
| | | | | | 806,897 |
| Gas utilities: 0.02% | | | | | |
| Atmos Energy Corporation | | | | 163 | 17,078 |
| Independent power & renewable electricity producers: 0.03% | | | | | |
| AES Corporation | | | | 828 | 20,120 |
| Multi-utilities: 0.44% | | | | | |
| Ameren Corporation | | | | 319 | 28,394 |
| CenterPoint Energy Incorporated | | | | 778 | 21,714 |
| CMS Energy Corporation | | | | 360 | 23,418 |
| Consolidated Edison Incorporated | | | | 439 | 37,455 |
| Dominion Energy Incorporated | | | | 1,005 | 78,953 |
| DTE Energy Company | | | | 240 | 28,690 |
| NiSource Incorporated | | | | 486 | 13,418 |
| Public Service Enterprise Group Incorporated | | | | 629 | 41,973 |
| Sempra Energy | | | | 396 | 52,383 |
| WEC Energy Group Incorporated | | | | 391 | 37,954 |
| | | | | | 364,352 |
| Water utilities: 0.05% | | | | | |
| American Water Works Company Incorporated | | | | 224 | 42,305 |
| Total Common stocks (Cost $20,346,895) | | | | | 49,911,089 |
| | | Interest
rate | Maturity
date | Principal | |
| U.S. Treasury securities: 36.77% | | | | | |
| U.S. Treasury Bond | | 1.13% | 5-15-2040 | $109,000 | 95,537 |
| U.S. Treasury Bond | | 1.13 | 8-15-2040 | 145,000 | 126,603 |
| U.S. Treasury Bond | | 1.25 | 5-15-2050 | 120,000 | 101,902 |
| U.S. Treasury Bond | | 1.38 | 11-15-2040 | 87,000 | 79,286 |
| U.S. Treasury Bond | | 1.38 | 8-15-2050 | 151,000 | 132,272 |
| U.S. Treasury Bond | | 1.63 | 11-15-2050 | 87,000 | 81,056 |
| U.S. Treasury Bond | | 1.75 | 8-15-2041 | 225,000 | 218,145 |
| U.S. Treasury Bond | | 1.88 | 2-15-2041 | 208,000 | 205,879 |
| U.S. Treasury Bond | | 1.88 | 2-15-2051 | 221,000 | 218,652 |
| U.S. Treasury Bond | | 2.00 | 2-15-2050 | 152,000 | 154,393 |
The accompanying notes are an integral part of these financial statements.
Allspring VT Index Asset Allocation Fund | 23
Portfolio of investments—December 31, 2021
| | | Interest
rate | Maturity
date | Principal | Value |
| U.S. Treasury securities (continued) | | | | | |
| U.S. Treasury Bond | | 2.25% | 8-15-2046 | $106,000 | $ 112,078 |
| U.S. Treasury Bond | | 2.25 | 8-15-2049 | 108,000 | 115,590 |
| U.S. Treasury Bond | | 2.38 | 11-15-2049 | 127,000 | 139,511 |
| U.S. Treasury Bond | | 2.50 | 2-15-2045 | 116,000 | 127,568 |
| U.S. Treasury Bond | | 2.50 | 2-15-2046 | 106,000 | 117,093 |
| U.S. Treasury Bond | | 2.50 | 5-15-2046 | 105,000 | 116,046 |
| U.S. Treasury Bond | | 2.75 | 8-15-2042 | 66,000 | 75,199 |
| U.S. Treasury Bond | | 2.75 | 11-15-2042 | 78,000 | 88,896 |
| U.S. Treasury Bond | | 2.75 | 8-15-2047 | 101,000 | 117,531 |
| U.S. Treasury Bond | | 2.75 | 11-15-2047 | 100,000 | 116,422 |
| U.S. Treasury Bond | | 2.88 | 5-15-2043 | 111,000 | 128,985 |
| U.S. Treasury Bond | | 2.88 | 8-15-2045 | 115,000 | 135,022 |
| U.S. Treasury Bond | | 2.88 | 11-15-2046 | 104,000 | 123,008 |
| U.S. Treasury Bond | | 2.88 | 5-15-2049 | 140,000 | 168,645 |
| U.S. Treasury Bond | | 3.00 | 5-15-2042 | 40,000 | 47,366 |
| U.S. Treasury Bond | | 3.00 | 11-15-2044 | 114,000 | 135,945 |
| U.S. Treasury Bond | | 3.00 | 5-15-2045 | 116,000 | 138,742 |
| U.S. Treasury Bond | | 3.00 | 11-15-2045 | 115,000 | 138,153 |
| U.S. Treasury Bond | | 3.00 | 2-15-2047 | 106,000 | 128,277 |
| U.S. Treasury Bond | | 3.00 | 5-15-2047 | 104,000 | 126,230 |
| U.S. Treasury Bond | | 3.00 | 2-15-2048 | 114,000 | 139,142 |
| U.S. Treasury Bond | | 3.00 | 8-15-2048 | 121,000 | 148,060 |
| U.S. Treasury Bond | | 3.00 | 2-15-2049 | 140,000 | 172,123 |
| U.S. Treasury Bond | | 3.13 | 11-15-2041 | 37,000 | 44,462 |
| U.S. Treasury Bond | | 3.13 | 2-15-2042 | 46,000 | 55,421 |
| U.S. Treasury Bond | | 3.13 | 2-15-2043 | 79,000 | 95,217 |
| U.S. Treasury Bond | | 3.13 | 8-15-2044 | 115,000 | 139,649 |
| U.S. Treasury Bond | | 3.13 | 5-15-2048 | 123,000 | 153,721 |
| U.S. Treasury Bond | | 3.38 | 5-15-2044 | 110,000 | 138,484 |
| U.S. Treasury Bond | | 3.38 | 11-15-2048 | 135,000 | 176,634 |
| U.S. Treasury Bond | | 3.50 | 2-15-2039 | 29,000 | 36,381 |
| U.S. Treasury Bond | | 3.63 | 8-15-2043 | 88,000 | 114,153 |
| U.S. Treasury Bond | | 3.63 | 2-15-2044 | 113,000 | 147,054 |
| U.S. Treasury Bond | | 3.75 | 8-15-2041 | 36,000 | 47,018 |
| U.S. Treasury Bond | | 3.75 | 11-15-2043 | 110,000 | 145,471 |
| U.S. Treasury Bond | | 3.88 | 8-15-2040 | 37,000 | 48,766 |
| U.S. Treasury Bond | | 4.25 | 5-15-2039 | 31,000 | 42,501 |
| U.S. Treasury Bond | | 4.25 | 11-15-2040 | 40,000 | 55,328 |
| U.S. Treasury Bond | | 4.38 | 2-15-2038 | 18,000 | 24,803 |
| U.S. Treasury Bond | | 4.38 | 11-15-2039 | 35,000 | 48,780 |
| U.S. Treasury Bond | | 4.38 | 5-15-2040 | 35,000 | 48,990 |
| U.S. Treasury Bond | | 4.38 | 5-15-2041 | 33,000 | 46,487 |
| U.S. Treasury Bond | | 4.50 | 2-15-2036 | 26,000 | 35,734 |
| U.S. Treasury Bond | | 4.50 | 5-15-2038 | 21,000 | 29,365 |
| U.S. Treasury Bond | | 4.50 | 8-15-2039 | 33,000 | 46,602 |
| U.S. Treasury Bond | | 4.63 | 2-15-2040 | 38,000 | 54,579 |
| U.S. Treasury Bond | | 4.75 | 2-15-2037 | 13,000 | 18,440 |
| U.S. Treasury Bond | | 4.75 | 2-15-2041 | 44,000 | 64,733 |
| U.S. Treasury Bond | | 5.00 | 5-15-2037 | 17,000 | 24,745 |
| U.S. Treasury Bond | | 5.25 | 11-15-2028 | 45,000 | 56,308 |
| U.S. Treasury Bond | | 5.25 | 2-15-2029 | 33,000 | 41,563 |
| U.S. Treasury Bond | | 5.38 | 2-15-2031 | 31,000 | 41,486 |
| U.S. Treasury Bond | | 5.50 | 8-15-2028 | 35,000 | 44,018 |
| U.S. Treasury Bond | | 6.13 | 11-15-2027 | 49,000 | 62,261 |
| U.S. Treasury Bond | | 6.13 | 8-15-2029 | 25,000 | 33,538 |
The accompanying notes are an integral part of these financial statements.
24 | Allspring VT Index Asset Allocation Fund
Portfolio of investments—December 31, 2021
| | | Interest
rate | Maturity
date | Principal | Value |
| U.S. Treasury securities (continued) | | | | | |
| U.S. Treasury Bond | | 6.25% | 5-15-2030 | $ 21,000 | $ 28,993 |
| U.S. Treasury Bond | | 6.38 | 8-15-2027 | 21,000 | 26,760 |
| U.S. Treasury Bond | | 6.88 | 8-15-2025 | 21,000 | 25,313 |
| U.S. Treasury Note | | 0.13 | 11-30-2022 | 178,000 | 177,597 |
| U.S. Treasury Note | | 0.13 | 5-15-2023 | 117,000 | 116,328 |
| U.S. Treasury Note | | 0.13 | 7-15-2023 | 123,000 | 122,111 |
| U.S. Treasury Note | | 0.13 | 8-15-2023 | 128,000 | 126,955 |
| U.S. Treasury Note | | 0.13 | 9-15-2023 | 143,000 | 141,693 |
| U.S. Treasury Note | | 0.13 | 10-15-2023 | 146,000 | 144,540 |
| U.S. Treasury Note | | 0.13 | 12-15-2023 | 142,000 | 140,369 |
| U.S. Treasury Note | | 0.13 | 1-15-2024 | 154,000 | 152,057 |
| U.S. Treasury Note | | 0.13 | 2-15-2024 | 185,000 | 182,586 |
| U.S. Treasury Note | | 0.25 | 4-15-2023 | 119,000 | 118,600 |
| U.S. Treasury Note | | 0.25 | 6-15-2023 | 122,000 | 121,433 |
| U.S. Treasury Note | | 0.25 | 11-15-2023 | 172,000 | 170,582 |
| U.S. Treasury Note | | 0.25 | 3-15-2024 | 185,000 | 182,789 |
| U.S. Treasury Note | | 0.25 | 5-15-2024 | 185,000 | 182,478 |
| U.S. Treasury Note | | 0.25 | 5-31-2025 | 132,000 | 128,401 |
| U.S. Treasury Note | | 0.25 | 6-30-2025 | 142,000 | 137,956 |
| U.S. Treasury Note | | 0.25 | 7-31-2025 | 147,000 | 142,590 |
| U.S. Treasury Note | | 0.25 | 8-31-2025 | 153,000 | 148,213 |
| U.S. Treasury Note | | 0.25 | 9-30-2025 | 166,000 | 160,748 |
| U.S. Treasury Note | | 0.25 | 10-31-2025 | 176,000 | 170,108 |
| U.S. Treasury Note | | 0.38 | 4-15-2024 | 184,000 | 182,153 |
| U.S. Treasury Note | | 0.38 | 4-30-2025 | 126,000 | 123,204 |
| U.S. Treasury Note | | 0.38 | 11-30-2025 | 181,000 | 175,535 |
| U.S. Treasury Note | | 0.38 | 12-31-2025 | 178,000 | 172,535 |
| U.S. Treasury Note | | 0.38 | 1-31-2026 | 191,000 | 184,778 |
| U.S. Treasury Note | | 0.38 | 7-31-2027 | 134,000 | 127,274 |
| U.S. Treasury Note | | 0.38 | 9-30-2027 | 155,000 | 146,711 |
| U.S. Treasury Note | | 0.50 | 3-15-2023 | 104,000 | 104,041 |
| U.S. Treasury Note | | 0.50 | 3-31-2025 | 120,000 | 118,008 |
| U.S. Treasury Note | | 0.50 | 2-28-2026 | 193,000 | 187,519 |
| U.S. Treasury Note | | 0.50 | 4-30-2027 | 98,000 | 94,003 |
| U.S. Treasury Note | | 0.50 | 5-31-2027 | 111,000 | 106,287 |
| U.S. Treasury Note | | 0.50 | 6-30-2027 | 122,000 | 116,739 |
| U.S. Treasury Note | | 0.50 | 8-31-2027 | 142,000 | 135,494 |
| U.S. Treasury Note | | 0.50 | 10-31-2027 | 168,000 | 159,876 |
| U.S. Treasury Note | | 0.63 | 3-31-2027 | 81,000 | 78,295 |
| U.S. Treasury Note | | 0.63 | 11-30-2027 | 179,000 | 171,441 |
| U.S. Treasury Note | | 0.63 | 5-15-2030 | 178,000 | 166,430 |
| U.S. Treasury Note | | 0.63 | 8-15-2030 | 222,000 | 207,032 |
| U.S. Treasury Note | | 0.75 | 3-31-2026 | 191,000 | 187,374 |
| U.S. Treasury Note | | 0.75 | 4-30-2026 | 194,000 | 190,158 |
| U.S. Treasury Note | | 0.75 | 5-31-2026 | 194,000 | 190,014 |
| U.S. Treasury Note | | 0.88 | 11-15-2030 | 132,000 | 125,498 |
| U.S. Treasury Note | | 1.13 | 2-28-2025 | 118,000 | 118,415 |
| U.S. Treasury Note | | 1.13 | 2-28-2027 | 47,000 | 46,636 |
| U.S. Treasury Note | | 1.25 | 7-31-2023 | 67,000 | 67,670 |
| U.S. Treasury Note | | 1.25 | 8-31-2024 | 104,000 | 104,955 |
| U.S. Treasury Note | | 1.25 | 8-15-2031 | 351,000 | 343,157 |
| U.S. Treasury Note | | 1.38 | 2-15-2023 | 82,000 | 82,855 |
| U.S. Treasury Note | | 1.38 | 6-30-2023 | 64,000 | 64,760 |
| U.S. Treasury Note | | 1.38 | 8-31-2023 | 124,000 | 125,468 |
| U.S. Treasury Note | | 1.38 | 9-30-2023 | 90,000 | 91,090 |
The accompanying notes are an integral part of these financial statements.
Allspring VT Index Asset Allocation Fund | 25
Portfolio of investments—December 31, 2021
| | | Interest
rate | Maturity
date | Principal | Value |
| U.S. Treasury securities (continued) | | | | | |
| U.S. Treasury Note | | 1.38% | 1-31-2025 | $105,000 | $ 106,198 |
| U.S. Treasury Note | | 1.38 | 8-31-2026 | 95,000 | 95,553 |
| U.S. Treasury Note | | 1.50 | 1-15-2023 | 79,000 | 79,861 |
| U.S. Treasury Note | | 1.50 | 2-28-2023 | 126,000 | 127,491 |
| U.S. Treasury Note | | 1.50 | 3-31-2023 | 126,000 | 127,541 |
| U.S. Treasury Note | | 1.50 | 9-30-2024 | 108,000 | 109,704 |
| U.S. Treasury Note | | 1.50 | 10-31-2024 | 114,000 | 115,786 |
| U.S. Treasury Note | | 1.50 | 11-30-2024 | 122,000 | 123,916 |
| U.S. Treasury Note | | 1.50 | 8-15-2026 | 102,000 | 103,155 |
| U.S. Treasury Note | | 1.50 | 1-31-2027 | 98,000 | 99,083 |
| U.S. Treasury Note | | 1.50 | 2-15-2030 | 209,000 | 210,078 |
| U.S. Treasury Note | | 1.63 | 8-15-2022 | 117,000 | 118,001 |
| U.S. Treasury Note | | 1.63 | 8-31-2022 | 151,000 | 152,363 |
| U.S. Treasury Note | | 1.63 | 11-15-2022 | 150,000 | 151,605 |
| U.S. Treasury Note | | 1.63 | 12-15-2022 | 104,000 | 105,227 |
| U.S. Treasury Note | | 1.63 | 4-30-2023 | 66,000 | 66,951 |
| U.S. Treasury Note | | 1.63 | 5-31-2023 | 64,000 | 64,965 |
| U.S. Treasury Note | | 1.63 | 10-31-2023 | 90,000 | 91,512 |
| U.S. Treasury Note | | 1.63 | 2-15-2026 | 168,000 | 170,888 |
| U.S. Treasury Note | | 1.63 | 5-15-2026 | 105,000 | 106,760 |
| U.S. Treasury Note | | 1.63 | 9-30-2026 | 97,000 | 98,648 |
| U.S. Treasury Note | | 1.63 | 10-31-2026 | 94,000 | 95,590 |
| U.S. Treasury Note | | 1.63 | 11-30-2026 | 97,000 | 98,652 |
| U.S. Treasury Note | | 1.63 | 8-15-2029 | 157,000 | 159,275 |
| U.S. Treasury Note | | 1.75 | 5-15-2022 | 111,000 | 111,650 |
| U.S. Treasury Note | | 1.75 | 5-31-2022 | 149,000 | 149,972 |
| U.S. Treasury Note | | 1.75 | 6-30-2022 | 149,000 | 150,129 |
| U.S. Treasury Note | | 1.75 | 9-30-2022 | 144,000 | 145,536 |
| U.S. Treasury Note | | 1.75 | 1-31-2023 | 129,000 | 130,809 |
| U.S. Treasury Note | | 1.75 | 5-15-2023 | 113,000 | 114,863 |
| U.S. Treasury Note | | 1.75 | 6-30-2024 | 106,000 | 108,310 |
| U.S. Treasury Note | | 1.75 | 7-31-2024 | 110,000 | 112,462 |
| U.S. Treasury Note | | 1.75 | 12-31-2024 | 99,000 | 101,258 |
| U.S. Treasury Note | | 1.75 | 12-31-2026 | 99,000 | 101,320 |
| U.S. Treasury Note | | 1.75 | 11-15-2029 | 178,000 | 182,450 |
| U.S. Treasury Note | | 1.88 | 4-30-2022 | 153,000 | 153,869 |
| U.S. Treasury Note | | 1.88 | 5-31-2022 | 128,000 | 128,905 |
| U.S. Treasury Note | | 1.88 | 7-31-2022 | 149,000 | 150,397 |
| U.S. Treasury Note | | 1.88 | 8-31-2022 | 142,000 | 143,487 |
| U.S. Treasury Note | | 1.88 | 9-30-2022 | 144,000 | 145,659 |
| U.S. Treasury Note | | 1.88 | 10-31-2022 | 143,000 | 144,782 |
| U.S. Treasury Note | | 1.88 | 8-31-2024 | 125,000 | 128,179 |
| U.S. Treasury Note | | 1.88 | 6-30-2026 | 98,000 | 100,741 |
| U.S. Treasury Note | | 1.88 | 7-31-2026 | 99,000 | 101,804 |
| U.S. Treasury Note | | 2.00 | 7-31-2022 | 144,000 | 145,479 |
| U.S. Treasury Note | | 2.00 | 10-31-2022 | 143,000 | 144,927 |
| U.S. Treasury Note | | 2.00 | 11-30-2022 | 129,000 | 130,869 |
| U.S. Treasury Note | | 2.00 | 2-15-2023 | 118,000 | 120,037 |
| U.S. Treasury Note | | 2.00 | 4-30-2024 | 123,000 | 126,334 |
| U.S. Treasury Note | | 2.00 | 5-31-2024 | 123,000 | 126,378 |
| U.S. Treasury Note | | 2.00 | 6-30-2024 | 123,000 | 126,435 |
| U.S. Treasury Note | | 2.00 | 2-15-2025 | 289,000 | 297,670 |
| U.S. Treasury Note | | 2.00 | 8-15-2025 | 220,000 | 226,892 |
| U.S. Treasury Note | | 2.00 | 11-15-2026 | 170,000 | 175,850 |
| U.S. Treasury Note | | 2.00 | 8-15-2051 | 224,000 | 228,340 |
The accompanying notes are an integral part of these financial statements.
26 | Allspring VT Index Asset Allocation Fund
Portfolio of investments—December 31, 2021
| | | Interest
rate | Maturity
date | Principal | Value |
| U.S. Treasury securities (continued) | | | | | |
| U.S. Treasury Note | | 2.13% | 6-30-2022 | $126,000 | $ 127,171 |
| U.S. Treasury Note | | 2.13 | 12-31-2022 | 129,000 | 131,142 |
| U.S. Treasury Note | | 2.13 | 11-30-2023 | 110,000 | 112,952 |
| U.S. Treasury Note | | 2.13 | 2-29-2024 | 128,000 | 131,675 |
| U.S. Treasury Note | | 2.13 | 3-31-2024 | 127,000 | 130,711 |
| U.S. Treasury Note | | 2.13 | 7-31-2024 | 123,000 | 126,906 |
| U.S. Treasury Note | | 2.13 | 9-30-2024 | 118,000 | 121,853 |
| U.S. Treasury Note | | 2.13 | 11-30-2024 | 119,000 | 122,970 |
| U.S. Treasury Note | | 2.13 | 5-15-2025 | 234,000 | 242,217 |
| U.S. Treasury Note | | 2.13 | 5-31-2026 | 97,000 | 100,751 |
| U.S. Treasury Note | | 2.25 | 12-31-2023 | 127,000 | 130,805 |
| U.S. Treasury Note | | 2.25 | 1-31-2024 | 127,000 | 130,899 |
| U.S. Treasury Note | | 2.25 | 4-30-2024 | 120,000 | 123,923 |
| U.S. Treasury Note | | 2.25 | 10-31-2024 | 121,000 | 125,424 |
| U.S. Treasury Note | | 2.25 | 11-15-2024 | 290,000 | 300,648 |
| U.S. Treasury Note | | 2.25 | 12-31-2024 | 118,000 | 122,434 |
| U.S. Treasury Note | | 2.25 | 11-15-2025 | 219,000 | 228,102 |
| U.S. Treasury Note | | 2.25 | 3-31-2026 | 99,000 | 103,235 |
| U.S. Treasury Note | | 2.25 | 2-15-2027 | 196,000 | 205,318 |
| U.S. Treasury Note | | 2.25 | 8-15-2027 | 101,000 | 105,947 |
| U.S. Treasury Note | | 2.25 | 11-15-2027 | 99,000 | 103,938 |
| U.S. Treasury Note | | 2.25 | 5-15-2041 | 201,000 | 211,113 |
| U.S. Treasury Note | | 2.38 | 1-31-2023 | 144,000 | 146,970 |
| U.S. Treasury Note | | 2.38 | 2-29-2024 | 84,000 | 86,848 |
| U.S. Treasury Note | | 2.38 | 8-15-2024 | 289,000 | 300,075 |
| U.S. Treasury Note | | 2.38 | 4-30-2026 | 98,000 | 102,774 |
| U.S. Treasury Note | | 2.38 | 5-15-2027 | 164,000 | 173,084 |
| U.S. Treasury Note | | 2.38 | 5-15-2029 | 90,000 | 95,924 |
| U.S. Treasury Note | | 2.38 | 5-15-2051 | 224,000 | 247,415 |
| U.S. Treasury Note | | 2.50 | 3-31-2023 | 83,000 | 85,046 |
| U.S. Treasury Note | | 2.50 | 8-15-2023 | 102,000 | 105,052 |
| U.S. Treasury Note | | 2.50 | 1-31-2024 | 103,000 | 106,685 |
| U.S. Treasury Note | | 2.50 | 5-15-2024 | 281,000 | 291,911 |
| U.S. Treasury Note | | 2.50 | 1-31-2025 | 116,000 | 121,279 |
| U.S. Treasury Note | | 2.50 | 2-28-2026 | 97,000 | 102,104 |
| U.S. Treasury Note | | 2.63 | 2-28-2023 | 146,000 | 149,610 |
| U.S. Treasury Note | | 2.63 | 6-30-2023 | 83,000 | 85,513 |
| U.S. Treasury Note | | 2.63 | 12-31-2023 | 97,000 | 100,611 |
| U.S. Treasury Note | | 2.63 | 3-31-2025 | 114,000 | 119,807 |
| U.S. Treasury Note | | 2.63 | 12-31-2025 | 97,000 | 102,562 |
| U.S. Treasury Note | | 2.63 | 1-31-2026 | 95,000 | 100,451 |
| U.S. Treasury Note | | 2.63 | 2-15-2029 | 181,000 | 195,671 |
| U.S. Treasury Note | | 2.75 | 4-30-2023 | 82,000 | 84,396 |
| U.S. Treasury Note | | 2.75 | 5-31-2023 | 82,000 | 84,530 |
| U.S. Treasury Note | | 2.75 | 7-31-2023 | 80,000 | 82,684 |
| U.S. Treasury Note | | 2.75 | 8-31-2023 | 145,000 | 149,973 |
| U.S. Treasury Note | | 2.75 | 11-15-2023 | 134,000 | 139,062 |
| U.S. Treasury Note | | 2.75 | 2-15-2024 | 217,000 | 226,011 |
| U.S. Treasury Note | | 2.75 | 2-28-2025 | 121,000 | 127,518 |
| U.S. Treasury Note | | 2.75 | 6-30-2025 | 119,000 | 125,791 |
| U.S. Treasury Note | | 2.75 | 8-31-2025 | 122,000 | 129,067 |
| U.S. Treasury Note | | 2.75 | 2-15-2028 | 189,000 | 204,268 |
| U.S. Treasury Note | | 2.88 | 9-30-2023 | 148,000 | 153,643 |
| U.S. Treasury Note | | 2.88 | 10-31-2023 | 84,000 | 87,311 |
| U.S. Treasury Note | | 2.88 | 11-30-2023 | 76,000 | 79,111 |
The accompanying notes are an integral part of these financial statements.
Allspring VT Index Asset Allocation Fund | 27
Portfolio of investments—December 31, 2021
| | | Interest
rate | Maturity
date | Principal | Value |
| U.S. Treasury securities (continued) | | | | | |
| U.S. Treasury Note | | 2.88% | 4-30-2025 | $114,000 | $ 120,773 |
| U.S. Treasury Note | | 2.88 | 5-31-2025 | 117,000 | 124,052 |
| U.S. Treasury Note | | 2.88 | 7-31-2025 | 118,000 | 125,398 |
| U.S. Treasury Note | | 2.88 | 11-30-2025 | 96,000 | 102,326 |
| U.S. Treasury Note | | 2.88 | 5-15-2028 | 178,000 | 193,930 |
| U.S. Treasury Note | | 2.88 | 8-15-2028 | 190,000 | 207,501 |
| U.S. Treasury Note | | 3.00 | 9-30-2025 | 121,000 | 129,262 |
| U.S. Treasury Note | | 3.00 | 10-31-2025 | 76,000 | 81,281 |
| U.S. Treasury Note | | 3.13 | 11-15-2028 | 226,000 | 251,204 |
| U.S. Treasury Note | | 6.00 | 2-15-2026 | 42,000 | 50,170 |
| U.S. Treasury Note | | 6.25 | 8-15-2023 | 17,000 | 18,546 |
| U.S. Treasury Note | | 6.50 | 11-15-2026 | 28,000 | 34,939 |
| U.S. Treasury Note | | 6.63 | 2-15-2027 | 18,000 | 22,762 |
| U.S. Treasury Note | | 6.75 | 8-15-2026 | 21,000 | 26,173 |
| U.S. Treasury Note | | 7.13 | 2-15-2023 | 24,000 | 25,785 |
| U.S. Treasury Note | | 7.25 | 8-15-2022 | 24,000 | 25,031 |
| U.S. Treasury Note | | 7.50 | 11-15-2024 | 22,000 | 26,119 |
| U.S. Treasury Note | | 7.63 | 11-15-2022 | 12,000 | 12,755 |
| U.S. Treasury Note | | 7.63 | 2-15-2025 | 20,000 | 24,096 |
| Total U.S. Treasury securities (Cost $29,610,039) | | | | | 30,546,244 |
| | | Yield | | Shares | |
| Short-term investments: 0.89% | | | | | |
| Investment companies: 0.89% | | | | | |
| Allspring Government Money Market Fund Select Class ♠∞ | | 0.03 | | 737,613 | 737,613 |
| Total Short-term investments (Cost $737,613) | | | | | 737,613 |
| Total investments in securities (Cost $50,694,547) | 97.74% | | | | 81,194,946 |
| Other assets and liabilities, net | 2.26 | | | | 1,874,193 |
| Total net assets | 100.00% | | | | $83,069,139 |
| † | Non-income-earning security |
| ♠ | The issuer of the security is an affiliated person of the Fund as defined in the Investment Company Act of 1940. |
| ∞ | The rate represents the 7-day annualized yield at period end. |
| Abbreviations: |
| REIT | Real estate investment trust |
The accompanying notes are an integral part of these financial statements.
28 | Allspring VT Index Asset Allocation Fund
Portfolio of investments—December 31, 2021
Investments in affiliates
An affiliated investment is an investment in which the Fund owns at least 5% of the outstanding voting shares of the issuer or as a result of other relationships, such as the Fund and the issuer having the same investment manager. Transactions with issuers that were either affiliates of the Fund at the beginning of the period or the end of the period were as follows:
| | Value,
beginning of
period | Purchases | Sales
proceeds | Net
realized
gains
(losses) | | Net
change in
unrealized
gains
(losses) | | Value,
end of
period | Shares,
end
of period | Income
from
affiliated
securities |
| Common Stocks | | | | | | | | | |
| Wells Fargo & Company* | $187,086 | $ 2,229 | $ (59,516) | $ 22,347 | | $ 84,443 | | $236,589 | 4,931 | $ 3,341 |
| Short-term investments | | | | | | | | | |
| Allspring Government Money Market Fund Select Class | 898,399 | 13,762,320 | (13,923,106) | 0 | | 0 | | 737,613 | 737,613 | 611 |
| Securities Lending Cash Investments LLC | 11,350 | 14,207 | (25,557) | 0 | | 0 | | 0 | 0 | 2 # |
| | | | | $22,347 | | $84,443 | | $974,202 | | $3,954 |
| * | No longer an affiliate of the Fund at the end of the period. |
| # | Amount shown represents income before fees and rebates. |
Futures contracts
| Description | Number of
contracts | Expiration
date | Notional
cost | Notional
value | Unrealized
gains | | Unrealized
losses |
| Long | | | | | | | |
| E-Mini S&P 500 Index | 23 | 3-18-2022 | $ 5,408,377 | $ 5,472,275 | $ 63,898 | | $ 0 |
| 10-Year U.S. Treasury Notes | 18 | 3-22-2022 | 2,325,423 | 2,348,438 | 23,015 | | 0 |
| U.S. Long Term Bonds | 2 | 3-22-2022 | 317,479 | 320,875 | 3,396 | | 0 |
| U.S. Ultra Treasury Bonds | 2 | 3-22-2022 | 393,008 | 394,250 | 1,242 | | 0 |
| 2-Year U.S. Treasury Notes | 3 | 3-31-2022 | 654,828 | 654,516 | 0 | | (312) |
| 5-Year U.S. Treasury Notes | 10 | 3-31-2022 | 1,209,273 | 1,209,765 | 492 | | 0 |
| Short | | | | | | | |
| U.S. Long Term Bonds | (10) | 3-22-2022 | (1,587,395) | (1,604,375) | 0 | | (16,980) |
| U.S. Ultra Treasury Bonds | (1) | 3-22-2022 | (196,504) | (197,125) | 0 | | (621) |
| | | | | | $92,043 | | $(17,913) |
The accompanying notes are an integral part of these financial statements.
Allspring VT Index Asset Allocation Fund | 29
Statement of assets and liabilities—December 31, 2021
| | |
| Assets | |
Investments in unaffiliated securities, at value (cost $49,956,934)
| $ 80,457,333 |
Investments in affiliated securities, at value (cost $737,613)
| 737,613 |
Cash
| 2,143 |
Cash at broker segregated for futures contracts
| 442,981 |
Receivable for investments sold
| 1,399,668 |
Receivable for dividends and interest
| 169,122 |
Receivable for daily variation margin on open futures contracts
| 6,218 |
Receivable for Fund shares sold
| 125 |
Prepaid expenses and other assets
| 14,375 |
Total assets
| 83,229,578 |
| Liabilities | |
Payable for Fund shares redeemed
| 66,830 |
Management fee payable
| 34,902 |
Payable for daily variation margin on open futures contracts
| 24,614 |
Distribution fee payable
| 18,346 |
Custody and accounting fees payable
| 9,048 |
Administration fee payable
| 5,966 |
Trustees’ fees and expenses payable
| 733 |
Total liabilities
| 160,439 |
Total net assets
| $83,069,139 |
| Net assets consist of | |
Paid-in capital
| $ 45,873,611 |
Total distributable earnings
| 37,195,528 |
Total net assets
| $83,069,139 |
| Computation of net asset value per share | |
Net assets - Class 2
| $ 83,069,139 |
Share outstanding - Class 21
| 3,626,246 |
Net asset value per share - Class 2
| $22.91 |
| 1 | The Fund has an unlimited number of authorized shares. |
The accompanying notes are an integral part of these financial statements.
30 | Allspring VT Index Asset Allocation Fund
Statement of operations—year ended December 31, 2021
| | |
| Investment income | |
Dividends (net of foreign withholdings taxes of $91)
| $ 704,811 |
Interest
| 475,399 |
Income from affiliated securities
| 4,000 |
Total investment income
| 1,184,210 |
| Expenses | |
Management fee
| 487,310 |
Administration fee - Class 2
| 64,975 |
Distribution fee - Class 2
| 200,087 |
Custody and accounting fees
| 35,692 |
Professional fees
| 51,751 |
Shareholder report expenses
| 30,892 |
Trustees’ fees and expenses
| 19,219 |
Other fees and expenses
| 26,547 |
Total expenses
| 916,473 |
| Less: Fee waivers and/or expense reimbursements | |
Fund-level
| (104,631) |
Net expenses
| 811,842 |
Net investment income
| 372,368 |
| Realized and unrealized gains (losses) on investments | |
| Net realized gains on | |
Unaffiliated securities
| 7,165,303 |
Futures contracts
| 1,120,038 |
Net realized gains on investments
| 8,285,341 |
| Net change in unrealized gains (losses) on | |
Unaffiliated securities
| 3,417,826 |
Futures contracts
| (32,749) |
Net change in unrealized gains (losses) on investments
| 3,385,077 |
Net realized and unrealized gains (losses) on investments
| 11,670,418 |
Net increase in net assets resulting from operations
| $12,042,786 |
The accompanying notes are an integral part of these financial statements.
Allspring VT Index Asset Allocation Fund | 31
Statement of changes in net assets
| | | | | |
| | Year ended
December 31, 2021 | Year ended
December 31, 2020 |
| Operations | | | | |
Net investment income
| | $ 372,368 | | $ 570,640 |
Net realized gains on investments
| | 8,285,341 | | 7,532,027 |
Net change in unrealized gains (losses) on investments
| | 3,385,077 | | 3,213,094 |
Net increase in net assets resulting from operations
| | 12,042,786 | | 11,315,761 |
| Distributions to shareholders from | | | | |
Net investment income and net realized gains - Class 2
| | (8,048,930) | | (6,314,848) |
| Capital share transactions | Shares | | Shares | |
Proceeds from shares sold - Class 2
| 70,413 | 1,564,527 | 180,317 | 3,691,931 |
Reinvestment of distributions - Class 2
| 371,846 | 8,048,930 | 318,519 | 6,314,848 |
Payment for shares redeemed - Class 2
| (416,528) | (9,329,422) | (411,678) | (8,409,040) |
Net increase in net assets resulting from capital share transactions
| | 284,035 | | 1,597,739 |
Total increase in net assets
| | 4,277,891 | | 6,598,652 |
| Net assets | | | | |
Beginning of period
| | 78,791,248 | | 72,192,596 |
End of period
| | $83,069,139 | | $78,791,248 |
The accompanying notes are an integral part of these financial statements.
32 |�� Allspring VT Index Asset Allocation Fund
Financial highlights
(For a share outstanding throughout each period)
| | Year ended December 31 |
| Class 2 | 2021 | 2020 | 2019 | 2018 | 2017 |
Net asset value, beginning of period
| $21.88 | $20.55 | $18.42 | $20.45 | $19.16 |
Net investment income
| 0.10 | 0.16 | 0.22 | 0.20 | 0.17 |
Net realized and unrealized gains (losses) on investments
| 3.25 | 3.04 | 3.42 | (0.70) | 2.12 |
Total from investment operations
| 3.35 | 3.20 | 3.64 | (0.50) | 2.29 |
| Distributions to shareholders from | | | | | |
Net investment income
| (0.13) | (0.17) | (0.22) | (0.20) | (0.15) |
Net realized gains
| (2.19) | (1.70) | (1.29) | (1.33) | (0.85) |
Total distributions to shareholders
| (2.32) | (1.87) | (1.51) | (1.53) | (1.00) |
Net asset value, end of period
| $22.91 | $21.88 | $20.55 | $18.42 | $20.45 |
Total return1
| 16.00% | 16.59% | 20.16% | (2.90)% | 12.25% |
| Ratios to average net assets (annualized) | | | | | |
Gross expenses
| 1.13% | 1.14% | 1.05% | 1.05% | 1.16% |
Net expenses
| 1.00% | 1.00% | 1.00% | 1.00% | 1.00% |
Net investment income
| 0.46% | 0.78% | 1.07% | 0.94% | 0.86% |
| Supplemental data | | | | | |
Portfolio turnover rate
| 7% | 21% | 4% | 10% | 10% |
Net assets, end of period (000s omitted)
| $83,069 | $78,791 | $72,193 | $68,851 | $81,956 |
| 1 | Returns do not reflect fees and expenses charged pursuant to the terms of variable life insurance policies and variable annuity contracts. |
The accompanying notes are an integral part of these financial statements.
Allspring VT Index Asset Allocation Fund | 33
Notes to financial statements
1. ORGANIZATION
Allspring Variable Trust (the "Trust"), a Delaware statutory trust organized on March 10, 1999, is an open-end management investment company registered under the Investment Company Act of 1940, as amended (the "1940 Act"). As an investment company, the Trust follows the accounting and reporting guidance in Financial Accounting Standards Board ("FASB") Accounting Standards Codification Topic 946, Financial Services – Investment Companies. These financial statements report on the Allspring VT Index Asset Allocation Fund (the "Fund") which is a diversified series of the Trust. The Trust offers shares of the Fund to separate accounts of various life insurance companies as funding vehicles for certain variable annuity contracts and variable life insurance policies.
Effective on November 1, 2021, the sale transaction of Wells Fargo Asset Management ("WFAM") by Wells Fargo & Company to GTCR LLC and Reverence Capital Partners, L.P. was closed. In connection with the closing of the transaction, WFAM became known as Allspring Global Investments (“Allspring”) and various entities that provided services to the Fund changed their names to "Allspring", including Allspring Funds Management, LLC, the investment manager to the Fund, Allspring Global Investments, LLC and Allspring Global Investments (UK) Limited, both registered investment advisers providing subadvisory services to certain funds, and Allspring Funds Distributor, LLC, the Fund's principal underwriter. Consummation of the transaction resulted in a new investment management agreement and subadvisory agreement which became effective on November 1, 2021.
2. SIGNIFICANT ACCOUNTING POLICIES
The following significant accounting policies, which are consistently followed in the preparation of the financial statements of the Fund, are in conformity with U.S. generally accepted accounting principles which require management to make estimates and assumptions that affect the reported amounts of assets and liabilities, disclosure of contingent assets and liabilities at the date of the financial statements, and the reported amounts of income and expenses during the reporting period. Actual results could differ from those estimates.
Securities valuation
All investments are valued each business day as of the close of regular trading on the New York Stock Exchange (generally 4 p.m. Eastern Time), although the Fund may deviate from this calculation time under unusual or unexpected circumstances.
Equity securities and futures contracts that are listed on a foreign or domestic exchange or market are valued at the official closing price or, if none, the last sales price. If no sale occurs on the principal exchange or market that day, a fair value price will be determined in accordance with the Fund’s Valuation Procedures.
Debt securities are valued at the evaluated bid price provided by an independent pricing service (e.g. taking into account various factors, including yields, maturities, or credit ratings) or, if a reliable price is not available, the quoted bid price from an independent broker-dealer.
Investments in registered open-end investment companies are valued at net asset value. Interests in non-registered investment companies that are redeemable at net asset value are fair valued normally at net asset value.
Investments which are not valued using any of the methods discussed above are valued at their fair value, as determined in good faith by the Board of Trustees. The Board of Trustees has established a Valuation Committee comprised of the Trustees and has delegated to it the authority to take any actions regarding the valuation of portfolio securities that the Valuation Committee deems necessary or appropriate, including determining the fair value of portfolio securities, unless the determination has been delegated to the Allspring Global Investments Pricing Committee at Allspring Funds Management, LLC ("Allspring Funds Management"). The Board of Trustees retains the authority to make or ratify any valuation decisions or approve any changes to the Valuation Procedures as it deems appropriate. On a quarterly basis, the Board of Trustees receives reports on any valuation actions taken by the Valuation Committee or the Allspring Global Investments Pricing Committee which may include items for ratification.
Securities lending
The Fund may lend its securities from time to time in order to earn additional income in the form of fees or interest on securities received as collateral or the investment of any cash received as collateral. When securities are on loan, the Fund receives interest or dividends on those securities. Cash collateral received in connection with its securities lending transactions is invested in Securities Lending Cash Investments, LLC (the "Securities Lending Fund"), an affiliated non-registered investment company. Investments in Securities Lending Fund are valued at the evaluated bid price provided by an independent pricing service. Income earned from investment in the Securities Lending Fund (net of fees and rebates), if any, is included in income from affiliated securities on the Statement of Operations.
34 | Allspring VT Index Asset Allocation Fund
Notes to financial statements
In a securities lending transaction, the net asset value of the Fund is affected by an increase or decrease in the value of the securities loaned and by an increase or decrease in the value of the instrument in which collateral is invested. The amount of securities lending activity undertaken by the Fund fluctuates from time to time. The Fund has the right under the lending agreement to recover the securities from the borrower on demand. In the event of default or bankruptcy by the borrower, the Fund may be prevented from recovering the loaned securities or gaining access to the collateral or may experience delays or costs in doing so. In such an event, the terms of the agreement allow the unaffiliated securities lending agent to use the collateral to purchase replacement securities on behalf of the Fund or pay the Fund the market value of the loaned securities. The Fund bears the risk of loss with respect to depreciation of its investment of the cash collateral.
Futures contracts
Futures contracts are agreements between the Fund and a counterparty to buy or sell a specific amount of a commodity, financial instrument or currency at a specified price on a specified date. The Fund may buy and sell futures contracts in order to gain exposure to, or protect against, changes in interest rates and security values and is subject to interest rate risk and equity price risk. The primary risks associated with the use of futures contracts are the imperfect correlation between changes in market values of securities held by the Fund and the prices of futures contracts, and the possibility of an illiquid market. Futures contracts are generally entered into on a regulated futures exchange and cleared through a clearinghouse associated with the exchange. With futures contracts, there is minimal counterparty risk to the Fund since futures contracts are exchange traded and the exchange’s clearinghouse, as the counterparty to all exchange traded futures, guarantees the futures contracts against default.
Upon entering into a futures contract, the Fund is required to deposit either cash or securities (initial margin) with the broker in an amount equal to a certain percentage of the contract value. Subsequent payments (variation margin) are paid to or from the broker each day equal to the daily changes in the contract value. Such payments are recorded as unrealized gains or losses and, if any, shown as variation margin receivable (payable) in the Statement of Assets and Liabilities. Should the Fund fail to make requested variation margin payments, the broker can gain access to the initial margin to satisfy the Fund’s payment obligations. When the contracts are closed, a realized gain or loss is recorded in the Statement of Operations.
Security transactions and income recognition
Securities transactions are recorded on a trade date basis. Realized gains or losses are recorded on the basis of identified cost.
Dividend income is recognized on the ex-dividend date.
Interest income is accrued daily and bond discounts are accreted and premiums are amortized daily. To the extent debt obligations are placed on non-accrual status, any related interest income may be reduced by writing off interest receivables when the collection of all or a portion of interest has been determined to be doubtful based on consistently applied procedures and the fair value has decreased. If the issuer subsequently resumes interest payments or when the collectability of interest is reasonably assured, the debt obligation is removed from non-accrual status.
Income is recorded net of foreign taxes withheld where recovery of such taxes is not assured.
Distributions to shareholders
Distributions to shareholders are recorded on the ex-dividend date and paid from net investment income quarterly and any net realized gains are paid at least annually. Such distributions are determined in accordance with income tax regulations and may differ from U.S. generally accepted accounting principles. Dividend sources are estimated at the time of declaration. The tax character of distributions is determined as of the Fund's fiscal year end. Therefore, a portion of the Fund's distributions made prior to the Fund’s fiscal year end may be categorized as a tax return of capital at year end.
Federal and other taxes
The Fund intends to continue to qualify as a regulated investment company by distributing substantially all of its investment company taxable income and any net realized capital gains (after reduction for capital loss carryforwards) sufficient to relieve it from all, or substantially all, federal income taxes. Accordingly, no provision for federal income taxes was required.
The Fund’s income and federal excise tax returns and all financial records supporting those returns for the prior three fiscal years are subject to examination by the federal and Delaware revenue authorities. Management has analyzed the Fund's tax positions taken on federal, state, and foreign tax returns for all open tax years and does not believe that there are any uncertain tax positions that require recognition of a tax liability.
Allspring VT Index Asset Allocation Fund | 35
Notes to financial statements
As of December 31, 2021, the aggregate cost of all investments for federal income tax purposes was $52,063,577 and the unrealized gains (losses) consisted of:
| Gross unrealized gains | $29,969,204 |
| Gross unrealized losses | (763,705) |
| Net unrealized gains | $29,205,499 |
3. FAIR VALUATION MEASUREMENTS
Fair value measurements of investments are determined within a framework that has established a fair value hierarchy based upon the various data inputs utilized in determining the value of the Fund’s investments. The three-level hierarchy gives the highest priority to unadjusted quoted prices in active markets for identical assets or liabilities (Level 1) and the lowest priority to unobservable inputs (Level 3). The Fund’s investments are classified within the fair value hierarchy based on the lowest level of input that is significant to the fair value measurement. The inputs are summarized into three broad levels as follows:
| ■ | Level 1 – quoted prices in active markets for identical securities |
| ■ | Level 2 – other significant observable inputs (including quoted prices for similar securities, interest rates, prepayment speeds, credit risk, etc.) |
| ■ | Level 3 – significant unobservable inputs (including the Fund’s own assumptions in determining the fair value of investments) |
The inputs or methodologies used for valuing investments in securities are not necessarily an indication of the risk associated with investing in those securities.
The following is a summary of the inputs used in valuing the Fund’s assets and liabilities as of December 31, 2021:
| | Quoted prices
(Level 1) | Other significant
observable inputs
(Level 2) | Significant
unobservable inputs
(Level 3) | Total |
| Assets | | | | |
| Investments in: | | | | |
| Common stocks | | | | |
| Communication services | $ 5,075,990 | $0 | $0 | $ 5,075,990 |
| Consumer discretionary | 6,254,606 | 0 | 0 | 6,254,606 |
| Consumer staples | 2,939,779 | 0 | 0 | 2,939,779 |
| Energy | 1,332,670 | 0 | 0 | 1,332,670 |
| Financials | 5,335,863 | 0 | 0 | 5,335,863 |
| Health care | 6,644,136 | 0 | 0 | 6,644,136 |
| Industrials | 3,880,569 | 0 | 0 | 3,880,569 |
| Information technology | 14,532,343 | 0 | 0 | 14,532,343 |
| Materials | 1,278,530 | 0 | 0 | 1,278,530 |
| Real estate | 1,385,851 | 0 | 0 | 1,385,851 |
| Utilities | 1,250,752 | 0 | 0 | 1,250,752 |
| U.S. Treasury securities | 30,546,244 | 0 | 0 | 30,546,244 |
| Short-term investments | | | | |
| Investment companies | 737,613 | 0 | 0 | 737,613 |
| | 81,194,946 | 0 | 0 | 81,194,946 |
| Futures contracts | 92,043 | 0 | 0 | 92,043 |
| Total assets | $81,286,989 | $0 | $0 | $81,286,989 |
| Liabilities | | | | |
| Futures contracts | $ 17,913 | $0 | $0 | $ 17,913 |
| Total liabilities | $ 17,913 | $0 | $0 | $ 17,913 |
36 | Allspring VT Index Asset Allocation Fund
Notes to financial statements
Futures contracts are reported at their cumulative unrealized gains (losses) at measurement date as reported in the table following the Portfolio of Investments. For futures contracts, the current day’s variation margin is reported on the Statement of Assets and Liabilities. All other assets and liabilities are reported at their market value at measurement date.
Additional sector, industry or geographic detail, if any, is included in the Portfolio of Investments.
For the year ended December 31, 2021, the Fund did not have any transfers into/out of Level 3.
4. TRANSACTIONS WITH AFFILIATES
Management fee
Allspring Funds Management, a wholly owned subsidiary of Allspring Global Investments Holdings, LLC, a holding company indirectly owned by certain private funds of GTCR LLC and Reverence Capital Partners, L.P., is the manager of the Fund and provides advisory and fund-level administrative services under an investment management agreement. Under the investment management agreement, Allspring Funds Management is responsible for, among other services, implementing the investment objectives and strategies of the Fund, supervising the subadviser and providing fund-level administrative services in connection with the Fund’s operations. As compensation for its services under the investment management agreement, Allspring Funds Management is entitled to receive a management fee at the following annual rate based on the Fund’s average daily net assets:
| Average daily net assets | Management fee |
| First $500 million | 0.600% |
| Next $500 million | 0.550 |
| Next $2 billion | 0.500 |
| Next $2 billion | 0.475 |
| Next $5 billion | 0.440 |
| Over $10 billion | 0.430 |
For the year ended December 31, 2021, the management fee was equivalent to an annual rate of 0.60% of the Fund’s average daily net assets.
Allspring Funds Management has retained the services of a subadviser to provide daily portfolio management to the Fund. The fee for subadvisory services is borne by Allspring Funds Management. Allspring Global Investments, LLC ("Allspring Investments"), an affiliate of Allspring Funds Management and a wholly owned subsidiary of Allspring Global Investments Holdings, LLC, is the subadviser to the Fund and is entitled to receive a fee from Allspring Funds Management at an annual rate starting at 0.15% and declining to 0.10% as the average daily net assets of the Fund increase.
Administration fee
Under a class-level administration agreement, Allspring Funds Management provides class-level administrative services to the Fund, which includes paying fees and expenses for services provided by the transfer agent, sub-transfer agents, omnibus account servicers and record-keepers. As compensation for its services under the class-level administration agreement, Allspring Funds Management receives an annual fee of 0.08% which is calculated based on the average daily net assets of Class 2 shares.
Waivers and/or expense reimbursements
Allspring Funds Management has contractually committed through April 30, 2022 to waive fees and/or reimburse management and administration fees to the extent necessary to cap the Fund’s expenses at 1.00% for Class 2 shares. Prior to or after the commitment expiration date, the cap may be increased or the commitment to maintain the cap may be terminated only with the approval of the Board of Trustees.
Distribution fee
The Trust has adopted a distribution plan for Class 2 shares of the Fund pursuant to Rule 12b-1 under the 1940 Act. A distribution fee is charged to Class 2 shares and paid to Allspring Funds Distributor, LLC, an affiliate of Allspring Funds Management, the principal underwriter, at an annual rate of 0.25% of the average daily net assets of Class 2 shares.
Allspring VT Index Asset Allocation Fund | 37
Notes to financial statements
Interfund transactions
The Fund may purchase or sell portfolio investment securities to certain affiliates pursuant to Rule 17a-7 under the 1940 Act and under procedures adopted by the Board of Trustees. The procedures have been designed to ensure that these interfund transactions, which do not incur broker commissions, are effected at current market prices.
5. INVESTMENT PORTFOLIO TRANSACTIONS
Purchases and sales of investments, excluding short-term securities, for the year ended December 31, 2021 were as follows:
| Purchases at cost | | Sales proceeds |
U.S.
government | Non-U.S.
government | | U.S.
government | Non-U.S.
government |
| $4,181,870 | $1,515,230 | | $1,396,834 | $10,765,088 |
6. SECURITIES LENDING TRANSACTIONS
The Fund lends its securities through an unaffiliated securities lending agent and receives collateral in the form of cash or securities with a value at least equal to the value of the securities on loan. The value of the loaned securities is determined at the close of each business day and any increases or decreases in the required collateral are exchanged between the Fund and the counterparty on the next business day. Cash collateral received is invested in the Securities Lending Fund which seeks to provide a positive return compared to the daily Federal Funds Open Rate by investing in high-quality, U.S. dollar-denominated short-term money market instruments and is exempt from registration under Section 3(c)(7) of the 1940 Act. Securities Lending Fund is managed by Allspring Funds Management and is subadvised by Allspring Investments. Allspring Funds Management receives an advisory fee starting at 0.05% and declining to 0.01% as the average daily net assets of the Securities Lending Fund increase. All of the fees received by Allspring Funds Management are paid to Allspring Investments for its services as subadviser.
In the event of counterparty default or the failure of a borrower to return a loaned security, the Fund has the right to use the collateral to offset any losses incurred. As of December 31, 2021, the Fund did not have any securities on loan.
7. DERIVATIVE TRANSACTIONS
During the year ended December 31, 2021, the Fund entered into futures contracts to gain market exposure to certain asset classes consistent with an active asset allocation strategy. The Fund had an average notional amount of $10,919,672 in long futures contracts and $1,601,484 in short futures contracts during the year ended December 31, 2021.
The fair value of derivative instruments as of December 31, 2021 by primary risk type was as follows for the Fund:
| | Asset derivatives | | Liability derivatives |
| | Statement of
Assets and Liabilities location | Fair value | | Statement of
Assets and Liabilities location | Fair value |
| Interest rate risk | Unrealized gains on futures contracts | $ 28,145* | | Unrealized losses on futures contracts | $ 17,913* |
| Equity risk | Unrealized gains on futures contracts | 63,898* | | Unrealized losses on futures contracts | 0* |
| | | $92,043 | | | $17,913 |
* Amount represents the cumulative unrealized gains (losses) as reported in the table following the Portfolio of Investments. For futures contracts, only the current day's variation margin as of December 31, 2021 is reported separately on the Statement of Assets and Liabilities.
The effect of derivative instruments on the Statement of Operations for the year ended December 31, 2021 was as follows:
| | Amount of realized
gains (losses) on
derivatives | Change in unrealized
gains (losses) on
derivatives |
| Equity risk | $ 1,283,617 | $ (19,563) |
| Interest rate risk | (163,579) | (13,186) |
| | $1,120,038 | $(32,749) |
38 | Allspring VT Index Asset Allocation Fund
Notes to financial statements
8. BANK BORROWINGS
The Trust, Allspring Master Trust and Allspring Funds Trust (excluding the money market funds) are parties to a $350,000,000 revolving credit agreement whereby the Fund is permitted to use bank borrowings for temporary or emergency purposes, such as to fund shareholder redemption requests. Interest under the credit agreement is charged to the Fund based on a borrowing rate equal to the higher of the Federal Funds rate in effect on that day plus 1.25% or the overnight bank funding rate in effect on that day plus 1.25%. In addition, an annual commitment fee equal to 0.25% of the unused balance is allocated to each participating fund.
For the year ended December 31, 2021, there were no borrowings by the Fund under the agreement.
9. DISTRIBUTIONS TO SHAREHOLDERS
The tax character of distributions paid during the years ended December 31, 2021 and December 31, 2020 were as follows:
| | Year ended December 31 |
| | 2021 | 2020 |
| Ordinary income | $1,113,680 | $ 769,127 |
| Long-term capital gain | 6,935,250 | 5,545,721 |
As of December 31, 2021, the components of distributable earnings on a tax basis were as follows:
Undistributed
ordinary
income | Undistributed
long-term
gain | Unrealized
gains |
| $530,137 | $7,459,892 | $29,205,499 |
10. CONCENTRATION RISKS
As of the end of the period, the Fund concentrated its portfolio of investments in the information technology sector. A fund that invests a substantial portion of its assets in any sector may be more affected by changes in that sector than would be a fund whose investments are not heavily weighted in any sector.
11. INDEMNIFICATION
Under the Fund's organizational documents, the officers and Trustees have been granted certain indemnification rights against certain liabilities that may arise out of performance of their duties to the Fund. The Fund has entered into a separate agreement with each Trustee that converts indemnification rights currently existing under the Fund’s organizational documents into contractual rights that cannot be changed in the future without the consent of the Trustee. Additionally, in the normal course of business, the Fund may enter into contracts with service providers that contain a variety of indemnification clauses. The Fund’s maximum exposure under these arrangements is dependent on future claims that may be made against the Fund and, therefore, cannot be estimated.
12. CORONAVIRUS (COVID-19) PANDEMIC
On March 11, 2020, the World Health Organization announced that it had made the assessment that coronavirus disease 2019 (“COVID-19”) is a pandemic. The impacts of COVID-19 are affecting the entire global economy, individual companies and investment products, the funds, and the market in general. There is significant uncertainty around the extent and duration of business disruptions related to COVID-19 and the impacts may last for an extended period of time. COVID-19 has led to significant uncertainty and volatility in the financial markets.
Allspring VT Index Asset Allocation Fund | 39
Report of independent registered public accounting firm
To the Shareholders of the Fund and Board of Trustees
Allspring Variable Trust:
Opinion on the Financial Statements
We have audited the accompanying statement of assets and liabilities of Allspring VT Index Asset Allocation Fund (formerly, Wells Fargo VT Index Asset Allocation Fund) (the Fund), one of the funds constituting Allspring Variable Trust (formerly, Wells Fargo Variable Trust), including the portfolio of investments, as of December 31, 2021, the related statement of operations for the year then ended, the statements of changes in net assets for each of the years in the two-year period then ended, and the related notes (collectively, the financial statements) and the financial highlights for each of the years in the five-year period then ended. In our opinion, the financial statements and financial highlights present fairly, in all material respects, the financial position of the Fund as of December 31, 2021, the results of its operations for the year then ended, the changes in its net assets for each of the years in the two-year period then ended, and the financial highlights for each of the years in the five-year period then ended, in conformity with U.S. generally accepted accounting principles.
Basis for Opinion
These financial statements and financial highlights are the responsibility of the Fund’s management. Our responsibility is to express an opinion on these financial statements and financial highlights based on our audits. We are a public accounting firm registered with the Public Company Accounting Oversight Board (United States) (PCAOB) and are required to be independent with respect to the Fund in accordance with the U.S. federal securities laws and the applicable rules and regulations of the Securities and Exchange Commission and the PCAOB.
We conducted our audits in accordance with the standards of the PCAOB. Those standards require that we plan and perform the audit to obtain reasonable assurance about whether the financial statements and financial highlights are free of material misstatement, whether due to error or fraud. Our audits included performing procedures to assess the risks of material misstatement of the financial statements and financial highlights, whether due to error or fraud, and performing procedures that respond to those risks. Such procedures included examining, on a test basis, evidence regarding the amounts and disclosures in the financial statements and financial highlights. Such procedures also included confirmation of securities owned as of December 31, 2021, by correspondence with the custodian, transfer agent and brokers. Our audits also included evaluating the accounting principles used and significant estimates made by management, as well as evaluating the overall presentation of the financial statements and financial highlights. We believe that our audits provide a reasonable basis for our opinion.

We have not been able to determine the specific year that we began serving as the auditor of one or more Allspring Funds investment companies; however, we are aware that we have served as the auditor of one or more Allspring Funds investment companies since at least 1955.
Boston, Massachusetts
February 25, 2022
40 | Allspring VT Index Asset Allocation Fund
Other information (unaudited)
TAX INFORMATION
For corporate shareholders, pursuant to Section 854 of the Internal Revenue Code, 61% of ordinary income dividends qualify for the corporate dividends-received deduction for the fiscal year ended December 31, 2021.
Pursuant to Section 852 of the Internal Revenue Code, $6,935,250 was designated as a 20% rate gain distribution for the fiscal year ended December 31, 2021.
For the fiscal year ended December 31, 2021, $637,569 has been designated as short-term capital gain dividends for nonresident alien shareholders pursuant to Section 871 of the Internal Revenue Code.
For the fiscal year ended December 31, 2021, 18% of the ordinary income distributed was derived from interest on U.S. government securities.
For corporate shareholders, pursuant to Section 163(j) of the Internal Revenue Code, 24% of ordinary income dividends qualify as interest dividends for the fiscal year ended December 31, 2021.
PROXY VOTING INFORMATION
A description of the policies and procedures used to determine how to vote proxies relating to portfolio securities is available without charge, upon request, by calling 1-800-260-5969, visiting our website at allspringglobal.com, or visiting the SEC website at sec.gov. Information regarding how the proxies related to portfolio securities were voted during the most recent 12-month period ended June 30 is available on the website at allspringglobal.com or by visiting the SEC website at sec.gov.
SPECIAL MEETING OF SHAREHOLDERS
On August 16, 2021, a Special Meeting of Shareholders for the Fund was held to consider the following proposals. The results of the proposals are indicated below.
Proposal 1 – To consider and approve a new investment management agreement with Wells Fargo Funds Management, LLC*.
| Shares voted “For” | 2,779,842 |
| Shares voted “Against” | 317,996 |
| Shares voted “Abstain” | 395,719 |
Proposal 2 – To consider and approve a new subadvisory agreement with Wells Capital Management, LLC**.
| Shares voted “For” | 2,795,137 |
| Shares voted “Against” | 305,803 |
| Shares voted “Abstain” | 392,617 |
* Effective November 1, 2021, known as Allspring Funds Management, LLC.
** Effective November 1, 2021, known as Allspring Global Investments, LLC.
QUARTERLY PORTFOLIO HOLDINGS INFORMATION
The Fund files its complete schedule of portfolio holdings with the SEC for the first and third quarters of each fiscal year as an exhibit to its reports on Form N-PORT. Shareholders may view the filed Form N-PORT by visiting the SEC website at sec.gov.
Allspring VT Index Asset Allocation Fund | 41
Other information (unaudited)
BOARD OF TRUSTEES AND OFFICERS
Each of the Trustees and Officers listed in the table below acts in identical capacities for each fund in the Allspring family of funds, which consists of 139 mutual funds comprising the Allspring Funds Trust, Allspring Variable Trust, Allspring Master Trust and four closed-end funds (collectively the “Fund Complex”). This table should be read in conjunction with the Prospectus and the Statement of Additional Information1. The mailing address of each Trustee and Officer is 525 Market Street, 12th Floor, San Francisco, CA 94105. Each Trustee and Officer serves an indefinite term, however, each Trustee serves such term until reaching the mandatory retirement age established by the Trustees.
Independent Trustees
Name and
year of birth | Position held and
length of service* | Principal occupations during past five years or longer | Current other
public company or
investment
company
directorships |
William R. Ebsworth
(Born 1957) | Trustee,
since 2015 | Retired. From 1984 to 2013, equities analyst, portfolio manager, research director and chief investment officer at Fidelity Management and Research Company in Boston, Tokyo, and Hong Kong, and retired in 2013 as Chief Investment Officer of Fidelity Strategic Advisers, Inc. where he led a team of investment professionals managing client assets. Prior thereto, Board member of Hong Kong Securities Clearing Co., Hong Kong Options Clearing Corp., the Thailand International Fund, Ltd., Fidelity Investments Life Insurance Company, and Empire Fidelity Investments Life Insurance Company. Audit Committee Chair and Investment Committee Chair of the Vincent Memorial Hospital Endowment (non-profit organization). Mr. Ebsworth is a CFA® charterholder. | N/A |
Jane A. Freeman
(Born 1953) | Trustee,
since 2015;
Chair Liaison,
since 2018 | Retired. From 2012 to 2014 and 1999 to 2008, Chief Financial Officer of Scientific Learning Corporation. From 2008 to 2012, Ms. Freeman provided consulting services related to strategic business projects. Prior to 1999, Portfolio Manager at Rockefeller & Co. and Scudder, Stevens & Clark. Board member of the Harding Loevner Funds from 1996 to 2014, serving as both Lead Independent Director and chair of the Audit Committee. Board member of the Russell Exchange Traded Funds Trust from 2011 to 2012 and the chair of the Audit Committee. Ms. Freeman is also an inactive Chartered Financial Analyst. | N/A |
Isaiah Harris, Jr.
(Born 1952) | Trustee,
since 2009; Audit
Committee
Chair,
since 2019 | Retired. Chairman of the Board of CIGNA Corporation from 2009 to 2021, and Director from 2005 to 2008. From 2003 to 2011, Director of Deluxe Corporation. Prior thereto, President and CEO of BellSouth Advertising and Publishing Corp. from 2005 to 2007, President and CEO of BellSouth Enterprises from 2004 to 2005 and President of BellSouth Consumer Services from 2000 to 2003. Emeritus member of the Iowa State University Foundation Board of Governors. Emeritus Member of the Advisory Board of Iowa State University School of Business. Advisory Board Member, Palm Harbor Academy (private school). Advisory Board Member, Fellowship of Christian Athletes. Mr. Harris is a certified public accountant (inactive status). | N/A |
Judith M. Johnson**
(Born 1949) | Trustee,
since 2008 | Retired. Prior thereto, Chief Executive Officer and Chief Investment Officer of Minneapolis Employees Retirement Fund from 1996 to 2008. Ms. Johnson is an attorney, certified public accountant and a certified managerial accountant. | N/A |
David F. Larcker
(Born 1950) | Trustee,
since 2009 | James Irvin Miller Professor of Accounting at the Graduate School of Business (Emeritus), Stanford University, Director of the Corporate Governance Research Initiative and Senior Faculty of The Rock Center for Corporate Governance since 2006. From 2005 to 2008, Professor of Accounting at the Graduate School of Business, Stanford University. Prior thereto, Ernst & Young Professor of Accounting at The Wharton School, University of Pennsylvania from 1985 to 2005. | N/A |
42 | Allspring VT Index Asset Allocation Fund
Other information (unaudited)
Name and
year of birth | Position held and
length of service* | Principal occupations during past five years or longer | Current other
public company or
investment
company
directorships |
Olivia S. Mitchell
(Born 1953) | Trustee,
since 2006;
Nominating and
Governance
Committee Chair,
since 2018 | International Foundation of Employee Benefit Plans Professor since 1993, Wharton School of the University of Pennsylvania. Director of Wharton’s Pension Research Council and Boettner Center on Pensions & Retirement Research, and Research Associate at the National Bureau of Economic Research. Previously taught at Cornell University from 1978 to 1993. | N/A |
Timothy J. Penny
(Born 1951) | Trustee,
since 1996;
Chair,
since 2018 | President and Chief Executive Officer of Southern Minnesota Initiative Foundation, a non-profit organization, since 2007. Member of the Board of Trustees of NorthStar Education Finance, Inc., a non-profit organization, since 2007. | N/A |
James G. Polisson
(Born 1959) | Trustee,
since 2018 | Retired. Chief Marketing Officer, Source (ETF) UK Services, Ltd, from 2015 to 2017. From 2012 to 2015, Principal of The Polisson Group, LLC, a management consulting, corporate advisory and principal investing company. Chief Executive Officer and Managing Director at Russell Investments, Global Exchange Traded Funds from 2010 to 2012. Managing Director of Barclays Global Investors from 1998 to 2010 and Global Chief Marketing Officer for iShares and Barclays Global Investors from 2000 to 2010. Trustee of the San Francisco Mechanics’ Institute, a non-profit organization, from 2013 to 2015. Board member of the Russell Exchange Traded Fund Trust from 2011 to 2012. Director of Barclays Global Investors Holdings Deutschland GmbH from 2006 to 2009. Mr. Polisson is an attorney and has a retired status with the Massachusetts and District of Columbia Bar Associations. | N/A |
Pamela Wheelock
(Born 1959) | Trustee,
since January
2020; previously
Trustee from
January 2018 to
July 2019 | Board member of the Destination Medical Center Economic Development Agency, Rochester, Minnesota since 2019. Interim President of the McKnight Foundation from January to September 2020. McKnight Foundation Consultant, November 2020 to February 2021. Acting Commissioner, Minnesota Department of Human Services, July 2019 through September 2019. Consultant (part-time), Minnesota Department of Human Services, October 2019 through December 2019. Chief Operating Officer, Twin Cities Habitat for Humanity from 2017 to 2019. Vice President of University Services, University of Minnesota from 2012 to 2016. Prior thereto, on the Board of Directors, Governance Committee and Finance Committee for the Minnesota Philanthropy Partners (Saint Paul Foundation) from 2012 to 2018, Interim Chief Executive Officer of Blue Cross Blue Shield of Minnesota from 2011 to 2012, Chairman of the Board from 2009 to 2012 and Board Director from 2003 to 2015. Vice President, Leadership and Community Engagement, Bush Foundation, Saint Paul, Minnesota (a private foundation) from 2009 to 2011. Executive Vice President and Chief Financial Officer, Minnesota Sports and Entertainment from 2004 to 2009 and Senior Vice President from 2002 to 2004. Executive Vice President of the Minnesota Wild Foundation from 2004 to 2008. Commissioner of Finance, State of Minnesota, from 1999 to 2002. Currently Board Chair of the Minnesota Wild Foundation since 2010. | N/A |
* Length of service dates reflect the Trustee’s commencement of service with the Trust’s predecessor entities, where applicable.
** Ms. Johnson has resigned from the Board effective December 31, 2021.
Allspring VT Index Asset Allocation Fund | 43
Other information (unaudited)
Officers2
Name and
year of birth | Position held and
length of service | Principal occupations during past five years or longer |
Andrew Owen
(Born 1960) | President,
since 2017 | President, Chief Executive Officer and Director of Allspring Funds Management, LLC since 2017 and co-president of Galliard Capital Management, LLC, an affiliate of Allspring Funds Management, LLC, since 2019. Prior thereto, Head of Affiliated Managers, Allspring Global Investments, from 2014 to 2019 and Executive Vice President responsible for marketing, investments and product development for Allspring Funds Management, LLC, from 2009 to 2014. In addition, Mr. Owen was an Executive Vice President of Wells Fargo & Company from 2014 to 2021. |
Jeremy DePalma
(Born 1974) | Treasurer,
since 2012
(for certain funds in
the Fund Complex);
since 2021 (for
the remaining funds in the
Fund Complex) | Senior Vice President of Allspring Funds Management, LLC since 2009. Senior Vice President of Evergreen Investment Management Company, LLC from 2008 to 2010 and head of the Fund Reporting and Control Team within Fund Administration. |
Kate McKinley
(Born 1977) | Chief Legal Officer,
since 2021 | Chief Legal Officer of Allspring Global Investments since 2021. Prior thereto, held various roles at State Street Global Advisors beginning in 2010, including serving as Senior Vice President and General Counsel from 2019 to 2021, and Chief Operating Officer of the Institutional Client Group from 2016 - 2019. Prior to working at State Street Global Advisors served as Assistant General Counsel for Bank of America Corporation from 2005 to 2010 and as an Associate at WilmerHale from 2002 to 2005. |
Christopher Baker
(Born 1976) | Chief Compliance Officer, since 2022 | Global Chief Compliance Officer for Allspring Global Investments since 2022. Prior thereto, Chief Compliance Officer for State Street Global Advisors from 2018 to 2021. Senior Compliance Officer for the State Street divisions of Alternative Investment Solutions, Sector Solutions, and Global Marketing from 2015 to 2018. From 2010 to 2015 Vice President, Global Head of Investment and Marketing Compliance for State Street Global Advisors. |
Matthew Prasse
(Born 1983) | Secretary,
since 2021 | Senior Counsel of the Allspring Legal Department since 2021. Senior Counsel of the Wells Fargo Legal Department from 2018 to 2021. Previously, Counsel for Barings LLC from 2015 to 2018. Prior to joining Barings, Associate at Morgan, Lewis & Bockius LLP from 2008 to 2015. |
1 The Statement of Additional Information includes additional information about the Trustees and is available, without charge, upon request, by calling 1-800-222-8222 or by visiting the website at allspringglobal.com.
2 For those Officers with tenures at Allspring Global Investments and/or Allspring Funds Management, LLC that began prior to 2021, such tenures include years of service during which these businesses/entities were known as Wells Fargo Asset Management and Wells Fargo Funds Management, LLC, respectively.
44 | Allspring VT Index Asset Allocation Fund
For more information
More information about Allspring Funds is available free upon request. To obtain literature, please write, visit the Fund's website, or call:
Allspring Funds
P.O. Box 219967
Kansas City, MO 64121-9967
Website: allspringglobal.com
Individual investors: 1-800-260-5969
Retail investment professionals: 1-888-877-9275
Institutional investment professionals: 1-866-765-0778
This report and the financial statements contained herein are submitted for the general information of the shareholders of the Fund. If this report is used for promotional purposes, distribution of the report must be accompanied or preceded by a current prospectus. Before investing, please consider the investment objectives, risks, charges, and expenses of the investment. For a current prospectus and, if available, a summary prospectus, containing this information, call
1-800-260-5969 or visit the Fund's website at allspringglobal.com. Read the prospectus carefully before you invest or send money.
Allspring Global InvestmentsTM is the trade name for the asset management firms of Allspring Global Investments Holdings, LLC, a holding company indirectly owned by certain private funds of GTCR LLC and Reverence Capital Partners, L.P. These firms include but are not limited to Allspring Global Investments, LLC, and Allspring Funds Management, LLC. Certain products managed by Allspring entities are distributed by Allspring Funds Distributor, LLC (a broker-dealer and Member FINRA/SIPC).
This material is for general informational and educational purposes only and is NOT intended to provide investment advice or a recommendation of any kind - including a recommendation for any specific investment, strategy, or plan.
© 2022 Allspring Global Investments Holdings, LLC. All rights reserved.
PAR-0122-00226 02-22
AVT2/AR148 12-21
Annual Report
December 31, 2021
Allspring
VT International Equity Fund
The views expressed and any forward-looking statements are as of December 31, 2021, unless otherwise noted, and are those of the Fund's portfolio managers and/or Allspring Global Investments. Discussions of individual securities or the markets generally are not intended as individual recommendations. Future events or results may vary significantly from those expressed in any forward-looking statements. The views expressed are subject to change at any time in response to changing circumstances in the market. Allspring Global Investments disclaims any obligation to publicly update or revise any views expressed or forward-looking statements.
Allspring VT International Equity Fund | 1
Letter to shareholders (unaudited)
Andrew Owen
President
Allspring Funds
Dear Shareholder:
We are pleased to offer you this annual report for the Allspring VT International Equity Fund for the 12-month period that ended December 31, 2021. Global stocks yielded mixed results as the global economy continued to emerge from the haze of COVID-19. Tailwinds were provided by global stimulus programs, a rapid vaccination rollout, and recovering consumer and corporate sentiment. Bonds also saw mixed performance during the period.
For the 12-month period, equities had mixed returns as policymakers continued to fight the effects of COVID-19. U.S. stocks led both non-U.S. developed market equities and emerging market stocks. Returns by fixed-income securities were also a mix of positive and negative. For the period, U.S. stocks, based on the S&P 500 Index,1 gained 28.71%. International stocks, as measured by the MSCI ACWI ex USA Index (Net),2 returned 7.82%, while the MSCI EM Index (Net) (USD)3 had weaker performance with a 2.54% loss. Among bond indexes, the Bloomberg U.S. Aggregate Bond Index4 returned -1.54%, the Bloomberg Global Aggregate ex-USD Index (unhedged)5 returned -7.05%, the Bloomberg Municipal Bond Index6 gained 1.52%, and the ICE BofA U.S. High Yield Index7 returned 5.36%.
Efforts to contain COVID-19 drove market performance.
The year 2021 began with emerging market stocks leading all major asset classes in January, driven by China’s strong economic growth and a broad recovery in corporate earnings, which propelled China’s stock market higher. In the U.S., positive news on vaccine trials and January expansion in both the manufacturing and services sectors were offset by a weak December monthly jobs report. This was compounded by technical factors as some hedge funds were forced to sell stocks to protect themselves against a well-publicized short squeeze coordinated by a group of retail investors. Eurozone sentiment and economic growth were particularly weak, reflecting the impact of a new lockdown with stricter social distancing along with a slow vaccine rollout.
February saw major domestic equity indexes driven higher on the hope of a new stimulus bill, improving COVID-19 vaccination numbers, and the gradual reopening of the economy. Most S&P 500 companies reported better-than-expected earnings, with positive surprises coming from the financials, information technology, health care, and materials sectors. Japan saw its economy strengthen as a result of strong export numbers. Meanwhile, crude oil prices continued their climb, rising more than 25% for the year. Domestic government bonds experienced a sharp sell-off in late February as markets priced in a more robust economic recovery and higher future growth and inflation expectations.
| 1 | The S&P 500 Index consists of 500 stocks chosen for market size, liquidity, and industry group representation. It is a market-value-weighted index with each stock's weight in the index proportionate to its market value. You cannot invest directly in an index. |
| 2 | The Morgan Stanley Capital International (MSCI) All Country World Index (ACWI) ex USA Index (Net) is a free-float-adjusted market-capitalization-weighted index that is designed to measure the equity market performance of developed and emerging markets, excluding the U.S. Source: MSCI. MSCI makes no express or implied warranties or representations and shall have no liability whatsoever with respect to any MSCI data contained herein. The MSCI data may not be further redistributed or used as a basis for other indexes or any securities or financial products. This report is not approved, reviewed, or produced by MSCI. You cannot invest directly in an index. |
| 3 | The MSCI Emerging Markets (EM) Index (Net) (USD) is a free-float-adjusted market-capitalization-weighted index that is designed to measure equity market performance of emerging markets. You cannot invest directly in an index. |
| 4 | The Bloomberg U.S. Aggregate Bond Index is a broad-based benchmark that measures the investment-grade, U.S.-dollar-denominated, fixed-rate taxable bond market, including Treasuries, government-related and corporate securities, mortgage-backed securities (agency fixed-rate and hybrid adjustable-rate mortgage pass-throughs), asset-backed securities, and commercial mortgage-backed securities. You cannot invest directly in an index. |
| 5 | The Bloomberg Global Aggregate ex-USD Index (unhedged) is an unmanaged index that provides a broad-based measure of the global investment-grade fixed-income markets excluding the U.S.-dollar-denominated debt market. You cannot invest directly in an index. |
| 6 | The Bloomberg Municipal Bond Index is an unmanaged index composed of long-term tax-exempt bonds with a minimum credit rating of Baa. You cannot invest directly in an index. |
| 7 | The ICE BofA U.S. High Yield Index is a market-capitalization-weighted index of domestic and Yankee high-yield bonds. The index tracks the performance of high-yield securities traded in the U.S. bond market. You cannot invest directly in an index. Copyright 2022. ICE Data Indices, LLC. All rights reserved. |
2 | Allspring VT International Equity Fund
Letter to shareholders (unaudited)
The passage of the massive domestic stimulus bill highlighted March activity, leading to increased forecasts for U.S. growth in 2021. Domestic employment surged as COVID-19 vaccinations and an increasingly open economy spurred hiring. A majority of U.S. small companies reported they were operating at pre-pandemic capacity or higher. Value stocks continued their outperformance of growth stocks in the month, continuing the trend that started in late 2020. Meanwhile, most major developed global equity indexes were up month to date on the back of rising optimism regarding the outlook for global growth. While the U.S. and the U.K. have been the most successful in terms of the vaccine rollout, even in markets where the vaccine has lagged, such as in the eurozone and Japan, equity indexes in many of those countries have also been in positive territory for the year through March 2021.
Equity markets produced another strong showing in April. Domestically, the continued reopening of the economy had a strong impact on positive equity performance, as people started leaving their households and jobless claims continued to fall. Domestic corporate bonds performed well and the U.S. dollar weakened. Meanwhile, the U.S. government continued to seek to invest in the recovery, this time by outlining a package of over $2 trillion to improve infrastructure. The primary headwind in April was inflation, as investors tried to determine the breadth and longevity of recent price increases. Developed Europe has been supported by a meaningful increase in the pace of vaccinations. Unfortunately many emerging market countries have not been as successful. India in particular saw COVID-19 cases surge, serving as an example of the need to get vaccinations rolled out to less developed nations.
Vaccine rollouts continued in May, leading to loosened restrictions globally. As a result, equity markets in general saw a minor increase in returns. Concerns that the continued economic rebound could result in inflation increases becoming more than transitory were supported by the higher input costs businesses were experiencing. Meanwhile, those inflation concerns were tempered by the U.S. Federal Reserve (Fed), which stayed steady on its view of the economy and eased fears of a sudden and substantial policy change. Positive performance in the emerging market equity space was supported this month by steady consumer demand and strong commodity prices. Fixed-income markets were also slightly positive for the month, driven by inflation uncertainty and a softer U.S. dollar.
June witnessed the S&P 500 Index reach a new all-time high. 2021 economic growth and inflation forecasts were revised higher to reflect a strong economic recovery and some supply and demand imbalances. Late June saw a deal reached on a U.S. infrastructure package of approximately $1 trillion for road, bridge, and broadband network upgrades over the next eight years. The Fed’s June meeting yielded no change to policy, but its projections pointed to a possible interest rate rise in 2023. This, combined with a rebound in economic activity and investors searching for yield, led to U.S. Treasury yields being down for the month. Many European and Asian countries saw vaccination momentum increase, while the U.K. dealt with a rise in COVID-19 infections, specifically the Delta variant. Meanwhile, crude oil jumped over 10% in June on the back of the pickup in global economic activity and the Organization of the Petroleum Exporting Countries’ (OPEC) slow pace of supply growth.
July began the month seeing vaccinations making progress, as several major developed countries eased restrictions, only to be threatened again by the spread of COVID-19’s Delta variant. Inflation continued to climb, aided by the continued supply bottleneck in the face of high demand. As it pertains to the equity area of the market, U.S. equities led the way in positive return territory followed by international developed markets. In contrast, emerging markets were well in negative territory for the month, hindered by China’s plans for new regulations on a number of sectors, specifically education and technology. The U.S. 10-year Treasury bond yield continued to decline as strong demand swallowed up supply. After hitting a multiyear high earlier in the month, oil prices leveled off following an agreement by OPEC to raise oil production starting in August.
Allspring VT International Equity Fund | 3
Letter to shareholders (unaudited)
“ Municipal debt experienced its first monthly performance drop since February of this year, slowing a rally that made it one of the best-performing sectors of the bond market.” |
The Delta variant of COVID-19 produced outbreaks globally in August, increasing the potential for increased market volatility and bringing into question the ongoing economic recovery. Domestically, the U.S. economy continued to stay strong in the face of the Delta variant, continued inflationary pressures, and worries over Hurricane Ida. Emerging market equities experienced elevated volatility, largely influenced by China’s regulatory stance. Emerging market equities started the month with poor performance but rebounded to end the month in positive territory. Municipal debt experienced its first monthly performance drop since February of this year, slowing a rally that made it one of the best-performing sectors of the bond market. In the commodity segment of the market, crude oil fell sharply during the month on the back of dampened expectations as a result of the Delta variant but was still a leading asset-class performer for the year.
Global markets suffered their broadest retreat in a year during September, with the exception of commodities. Concerns over inflation and the interest rate outlook depressed investor confidence and hurt performance. Emerging markets declined on concerns over the continued supply chain disruptions and worries over higher energy and food prices. Meanwhile, the Fed indicated it would slow the pace of asset purchases in the near future (pointing towards November). All eyes domestically are fixed on the raising of the debt ceiling, the 2022 budget plan, and the ongoing debate over the infrastructure package. Contrary to most asset classes, commodities thrived in September, driven by sharply higher energy prices.
October’s key themes continued to be elevated inflation pressures and a supply bottleneck, but strong earnings provided a bright spot in the markets. Earnings releases in the U.S. were generally strong and consumer confidence was high. The Fed reaffirmed its plans to taper quantitative easing to a stop by mid-2022. Meanwhile, elevated inflation figures were considered transitory by the Fed. Similar to the U.S., the eurozone and many Asian countries saw positive earnings but were facing inflation pressures caused by supply bottlenecks while also experiencing energy price increases amid natural gas shortages. Globally, government bond yields rose as central banks prepared to lower monetary policy accommodation in the face of rising inflationary pressures. As previously referenced, positive commodity performance was driven by sharply higher energy costs.
November was dominated by rising COVID-19 hospitalizations and concerns regarding the Omicron variant. Most major asset classes, both domestically and internationally, declined in November with two exceptions: U.S. investment-grade bonds and Treasury Inflation-Protected Securities. The United Nations Climate Change Conference (COP26) took place during the month with hopes of agreement among countries to limit global warming. While several initiatives were discussed, the conference ultimately ended without the specifics required to instill confidence that the limiting of global warming would succeed. In the U.S., President Biden signed a long-awaited infrastructure bill to upgrade U.S. roads, bridges, and railways. Meanwhile, the Consumer Price Index1, a measure of domestic inflation conditions, jumped to its highest level in 31 years. While the threat of consistently high inflation led the Fed to discuss a faster pace of tapering, the Omicron strain makes that less likely to occur. Commodities came in negative for the month, largely driven by sharp declines in oil prices (and energy costs in general) as well as precious metals.
Global volatility in December lessened as data indicated a lower risk of severe disease and death as a result of the Omicron variant. Even so, a number of countries introduced restrictions on sectors such as travel and hospitality to try to reduce the spread. In the U.S., data indicated that the overall domestic economy remains stable and corporate earnings remain robust. Consumer spending capability looks strong heading into 2022 on the back of elevated household savings and the lowest ratio of U.S. household liabilities to assets since 1973. U.S. corporate and high-yield bonds produced positive returns for the month while Treasuries declined. Bonds were strongly affected by the projection of three 25-basis-point (bp; 100 bps equal 1.00%) policy rate hikes in 2022 by senior Federal Open Market Committee members, contrary to just one hike as previously believed.
“ Bonds were strongly affected by the projection of three 25-basis-point (bp; 100 bps equal 1.00%) policy rate hikes in 2022 by senior Federal Open Market Committee members, contrary to just one hike as previously believed.”
| 1 | The Consumer Price Index (CPI) is a measure of the average change over time in the prices paid by urban consumers for a market basket of consumer goods and services. You cannot invest directly in an index. |
4 | Allspring VT International Equity Fund
Letter to shareholders (unaudited)
Don’t let short-term uncertainty derail long-term investment goals.
Periods of investment uncertainty can present challenges, but experience has taught us that maintaining long-term investment goals can be an effective way to plan for the future. To help you create a sound strategy based on your personal goals and risk tolerance, Allspring Funds offers more than 100 mutual funds spanning a wide range of asset classes and investment styles. Although diversification cannot guarantee an investment profit or prevent losses, we believe it can be an effective way to manage investment risk and potentially smooth out overall portfolio performance. We encourage investors to know their investments and to understand that appropriate levels of risk-taking may unlock opportunities.
Information on transaction closing.
On November 1, 2021, GTCR LLC and Reverence Capital Partners, L.P., announced the beginning of Allspring Global Investments™, with the close of the transaction to acquire Wells Fargo Funds Management, LLC; Wells Capital Management, LLC; Galliard Capital Management, LLC.; Wells Fargo Asset Management (International) Ltd.; Wells Fargo Asset Management Luxembourg S.A.; and Wells Fargo Funds Distributor, LLC, as well as Wells Fargo Bank, N.A.’s business of acting as trustee to its collective investment trusts and all related Wells Fargo Asset Management legal entities. The transaction closed on November 1, 2021, forming Allspring Global Investments, a privately held asset management firm with $575 billion in AUM1 as of December 31, 2021.
Allspring Global Investments™ is a leading independent asset management firm with a full breadth of investment capabilities across diverse asset classes, serving the needs of its institutional and wealth management clients around the world. Allspring operates across 18 offices globally supported by more than 480 investment professionals. Allspring and its investment teams provide a broad range of differentiated investment products and solutions to help its diverse range of clients meet their investment objectives.
As part of this transition, all mutual funds within the Wells Fargo Funds family were rebranded as Allspring Funds. Each individual fund had “Wells Fargo” removed from its fund name and replaced with “Allspring.” The fund name changes went into effect on December 6, 2021.
Allspring Global Investments is the trade name for the asset management firms of Allspring Global Investments Holdings, LLC, a holding company indirectly owned by certain private funds of GTCR LLC and Reverence Capital Partners, L.P.
Thank you for choosing to invest with Allspring Funds. We appreciate your confidence in us and remain committed to helping you meet your financial needs.
Sincerely,
Andrew Owen
President
Allspring Funds
For further information about your Fund, contact your investment professional, visit our website at allspringglobal.com, or call us directly at 1-800-222-8222.
| 1 | As of December 31, 2021, assets under management (AUM) includes $91.6 billion from Galliard Capital Management, LLC, an investment advisor that is not part of the Allspring trade name/GIPS firm. |
Allspring VT International Equity Fund | 5
Performance highlights (unaudited)
| Investment objective | The Fund seeks long-term capital appreciation. |
| Manager | Allspring Funds Management, LLC |
| Subadviser | Allspring Global Investments, LLC |
| Portfolio managers | Venkateshwar (Venk) Lal, Dale A. Winner, CFA®‡ |
| Average annual total returns (%) as of December 31, 2021 |
| | | | | | Expense ratios1 (%) |
| | Inception date | 1 year | 5 year | 10 year | Gross | Net 2 |
| Class 1 | 8-17-1998 | 7.39 | 6.19 | 6.30 | 1.13 | 0.69 |
| Class 2 | 7-31-2002 | 6.87 * | 5.90 | 6.04 | 1.38 | 0.94 |
| MSCI ACWI ex USA Index (Net)3 | – | 7.82 | 9.61 | 7.28 | – | – |
| MSCI ACWI ex USA Value Index (Net)4 | – | 10.46 | 6.00 | 5.29 | – | – |
| * | Total return differs from the return in the Financial Highlights in this report. The total return presented is calculated based on the NAV at which the shareholder transactions were processed. The NAV and total return presented in the Financial Highlights reflects certain adjustments made to the net assets of the Fund that are necessary under U.S. generally accepted accounting principles. |
| 1 | Reflects the expense ratios as stated in the most recent prospectuses. The expense ratios shown are subject to change and may differ from the annualized expense ratios shown in the financial highlights of this report. |
| 2 | The manager has contractually committed through April 30, 2022, to waive fees and/or reimburse expenses to the extent necessary to cap total annual fund operating expenses after fee waivers at 0.69% for Class 1 shares and 0.94% for Class 2 shares. Brokerage commissions, stamp duty fees, interest, taxes, acquired fund fees and expenses (if any), and extraordinary expenses are excluded from the expense caps. Prior to or after the commitment expiration date, the caps may be increased or the commitment to maintain the caps may be terminated only with the approval of the Board of Trustees. Without these caps, the Fund’s returns would have been lower. The expense ratio paid by an investor is the net expense ratio (the total annual fund operating expenses after fee waivers) as stated in the prospectuses. |
| 3 | The Morgan Stanley Capital International (MSCI) All Country World Index (ACWI) ex USA Index (Net) is a free-float-adjusted market capitalization-weighted index that is designed to measure the equity market performance of developed and emerging markets, excluding the U.S. Source: MSCI. MSCI makes no express or implied warranties or representations and shall have no liability whatsoever with respect to any MSCI data contained herein. The MSCI data may not be further redistributed or used as a basis for other indexes or any securities or financial products. This report is not approved, reviewed, or produced by MSCI. You cannot invest directly in an index. |
| 4 | The MSCI ACWI ex USA Value Index (Net) measures the equity market performance of large- and mid-cap securities exhibiting overall value style characteristics across developed and emerging market countries, excluding the U.S. The value investment style characteristics for index construction are defined using three variables: book value to price, 12-month forward earnings to price, and dividend yield. You cannot invest directly in an index. |
Figures quoted represent past performance, which is no guarantee of future results. Investment return and principal value of an investment will fluctuate so that an investor’s shares, when redeemed, may be worth more or less than their original cost. Current performance may be lower or higher than the performance data quoted and assumes the reinvestment of dividends and capital gains. Current month-end performance is available by calling 1-800-260-5969. Performance figures of the Fund do not reflect fees and expenses charged pursuant to the terms of variable life insurance policies and variable annuity contracts. If these fees and expenses had been reflected, performance would have been lower.
Index returns do not include transaction costs associated with buying and selling securities, any mutual fund fees or expenses, or any taxes. It is not possible to invest directly in an index.
Shares are sold without a front-end sales charge or contingent deferred sales charge.
Stock values fluctuate in response to the activities of individual companies and general market and economic conditions. Foreign investments are especially volatile and can rise or fall dramatically due to differences in the political and economic conditions of the host country. These risks are generally intensified in emerging markets. The use of derivatives may reduce returns and/or increase volatility. Certain investment strategies tend to increase the total risk of an investment (relative to the broader market). This fund is exposed to smaller-company securities risk. Consult the Fund’s prospectus for additional information on these and other risks.
Please refer to the prospectus provided by your participating insurance company for detailed information describing the separate accounts for information regarding surrender charges, mortality and expense risk fees, and other charges that may be assessed by the participating insurance companies.
| ‡ | CFA® and Chartered Financial Analyst® are trademarks owned by CFA Institute. |
6 | Allspring VT International Equity Fund
Performance highlights (unaudited)
Growth of $10,000 investment as of December 31, 20211
| 1 | The chart compares the performance of Class 2 shares for the most recent ten years with the MSCI ACWI ex USA Index (Net) and MSCI ACWI ex USA Value Index (Net). The chart assumes a hypothetical investment of $10,000 in Class 2 shares and reflects all operating expenses of the Fund but does not reflect fees and expenses charged pursuant to the terms of variable life insurance policies and variable annuity contracts. |
Allspring VT International Equity Fund | 7
Performance highlights (unaudited)
MANAGER'S DISCUSSION
Fund highlights
| ■ | The Fund underperformed the MSCI ACWI ex USA Index (Net) and the MSCI ACWI ex USA Value Index (Net) for the 12-month period that ended December 31, 2021. |
| ■ | The Fund remained overweight Europe, including overweights to the U.K., the Netherlands, Norway, and Italy, partly offset by underweights to Switzerland, Germany, Sweden, and Spain. The Fund was underweight Asia-Pacific on a regional basis, including average underweights to Taiwan, Japan, and Australia, partly offset by overweights to Korea, China/Hong Kong, and Thailand. |
| ■ | Consumer discretionary, health care, and consumer staples were relative performance laggards. Financials, communication services, and materials contributed to performance. |
A tale of two halves.
International markets, represented by the MSCI ACWI ex USA Index (Net), advanced 9.2% in the first half of the year as the average daily rate of vaccines administered reached 42.6 million by the end of June and total doses (3 billion+) far exceeded globally confirmed cases (182 million), allowing global growth to recover from the depths of the COVID-19 pandemic illustrated by the International Monetary Fund (IMF) taking up its global gross domestic product growth forecast to 6.0% for 2021 in April. However, the index declined 1.2% in the second half of the year given concerns surrounding peak growth, inflation, and policy as well as Delta and Omicron variant fears. In this environment, the JPMorgan Global Composite Purchasing Managers’ index, a monthly survey of purchasing managers, reached 58.5 (a PMI above 50 represents an improvement from the previous month) in May, the highest level in at least the past three years, but moderated to 54.3 at the end of the year, still firmly in expansionary territory. Developed market equities, represented by the MSCI World Index (Net)*, returned 21.8%, outperforming emerging markets, represented by the MSCI EM Index (Net)**, which declined 2.5%. Overall, traditional value sectors outperformed growth during the year after two years of double-digit underperformance.
Our investment and risk management process of finding non-consensus undervalued equities, marrying core micro stock picking with macro risk management in each region of the globe, resulted in shifts to sector and country allocations. This included an increase in exposure to consumer discretionary, consumer staples, energy, Italy, the U.S. (represented by companies with the majority of revenues sourced from international markets), and the U.K. We reduced allocations to information technology (IT), health care, materials, Russia, Germany, and Korea. Notable position changes included the addition of Stellantis N.V., a global auto original equipment manufacturer; ING Groep, a large‐cap retail/wholesale universal European Union bank; and Baker
Hughes, one of the “Big Three" global oil services companies. The Fund notably exited Mobile TeleSystems OJSC, a Russian telecom, in line with the strategy to reduce allocation to defensive value in favor of cyclical value stocks; Smiths Group plc, a U.K. industrial with leading positions in detection equipment, medical technology, and industrial pumps and valves, following the recent announcement of the sale of the medical division, which was a major catalyst for the stock; and Lundin Mining Corp., a Canadian miner, given a downgrade in conviction from medium to low as the company downgraded production guidance for 2021 as well as 2022 and 2023.
| Ten largest holdings (%) as of December 31, 20211 |
| Stellantis NV | 3.22 |
| Kingfisher plc | 2.82 |
| ING Groep NV | 2.75 |
| Baker Hughes Incorporated | 2.74 |
| Informa plc | 2.70 |
| DNB Bank ASA | 2.66 |
| Nomad Foods Limited | 2.64 |
| Melrose Industries plc | 2.63 |
| Compagnie de Saint-Gobain SA | 2.62 |
| Siam Commercial Bank PCL | 2.59 |
| 1 | Figures represent the percentage of the Fund's net assets. Holdings are subject to change and may have changed since the date specified. |
| * | The Morgan Stanley Capital International (MSCI) World Index (Net) is a free-float-adjusted market-capitalization-weighted index that is designed to measure the equity market performance of developed markets. You cannot invest directly in an index. |
| ** | The MSCI Emerging Markets (EM) Index (Net) is a free-float-adjusted market-capitalization-weighted index that is designed to measure equity market performance of emerging markets. You cannot invest directly in an index. |
8 | Allspring VT International Equity Fund
Performance highlights (unaudited)
Detractors included stock selection in the U.K., the Netherlands, and Switzerland.
Detractors included Smiths Group and Royal Philips. Smiths Group underperformed, as it agreed to sell its medical division for an enterprise value of $2.4 billion versus expectations for $2.8 billion. Royal Philips, an industrial conglomerate that has undergone a massive transformation toward a pure-play medtech company, underperformed as a result of a voluntary recall of certain products in its sleep and respiratory care business and subsequent release of a letter from the Food and Drug Administration suggesting the company knew about the product issues in 2015. We trimmed the position in December following a downgrade in thesis conviction from medium to low given reputational damage to the company will take considerable time to fix, resulting in constrained exit multiples and an environmental, social, and corporate governance discount.
| Sector allocation as of December 31, 20211 |
| 1 | Figures represent the percentage of the Fund's long-term investments. These amounts are subject to change and may have changed since the date specified. |
Stock selection in China/Hong Kong, Japan, and Korea resulted in positive attribution.
Over the past 12 months, contributions to performance were driven largely by stock selection in China/Hong Kong, Japan, and Korea. LONGI Green Energy Technology Co. Ltd., the largest global manufacturer of monocrystalline wafer by capacity, a leading solar energy generation technology, outperformed as it reported fiscal-year 2020 earnings up 62%. The company announced capacity expansion in wafers and modules of 25% and a market share target of 50% in wafers and 25% in modules, up from its already world-leading share of 46% and 19%, respectively, as of the end of 2020. Hitachi, Ltd., a Japanese industrial IT conglomerate,
outperformed as it reported fiscal-year results and guidance above market expectations. Operating profit came in 17.9% above guidance due primarily to strength in the company’s IT and automotive businesses. The company also announced the sale of a 53% stake in Hitachi Metals at a higher-than-expected price and strengthened its shareholder return policy allocating one-third of its capital allocation policy each to growth investments, capital expenditure, and debt repayment and shareholder returns.
| Geographic allocation as of December 31, 20211 |
| 1 | Figures represent the percentage of the Fund's long-term investments. These amounts are subject to change and may have changed since the date specified. |
Our outlook is constructive over both the short and long term.
Our short-term outlook remains constructive. Market sentiment has been bullish despite a surge in COVID-19 cases and the potential for a faster return to more normalized monetary policy worldwide. Second, the severity of Omicron appears to be significantly lower than previous variants, and while the magnitude of cases is likely to far exceed prior waves resulting in mobility restrictions, the boost to global immunity may reduce the likelihood of widespread lockdowns in the future. Third, monetary policy remains incredibly accommodative and prospects for fiscal stimulus remain strong. Finally, the COVID-19 health care response continues apace in terms of progress on rapid testing, treatment (Pfizer Inc. and Merck & Co., Inc., anti-viral pills), and rollout of boosters allowing economies to further reopen.
Allspring VT International Equity Fund | 9
Performance highlights (unaudited)
Our longer-term outlook remains constructive. First, while the valuation of the MSCI ACWI Index (Net)* measured on a price-to-book basis is near peak levels, the MSCI ACWI Value Index** offers a significant discount to growth stocks and equities are undervalued versus bonds on a yield basis, particularly outside the U.S. Second, global growth prospects remain strong with the IMF forecasting 4.9% growth in 2022, which is well above trend. Finally, despite the Federal Reserve’s pivot to a more hawkish stance in December, it is likely to take more than two years to reach the neutral rate, and yield curves are likely to steepen as longer-term rates start to forecast economic normalization. Moreover, prospects of additional fiscal stimulus continue in Europe, the U.S., and Japan as well as China given its recent economic slowdown.
| * | The MSCI All Country World Index (ACWI) Index (Net) is a free-float-adjusted market-capitalization-weighted index that is designed to measure the equity market performance of developed and emerging markets. You cannot invest directly in an index. |
| ** | The MSCI ACWI Value Index captures large and mid cap securities exhibiting overall value style characteristics across 23 Developed Markets countries and 25 Emerging Markets countries. You cannot invest directly in an index. |
10 | Allspring VT International Equity Fund
Fund expenses (unaudited)
As a shareholder of the Fund, you incur ongoing costs, including management fees, distribution (12b-1) fees, and other Fund expenses. This example is intended to help you understand your ongoing costs (in dollars) of investing in the Fund and to compare these costs with the ongoing costs of investing in other mutual funds.
The example is based on an investment of $1,000 invested at the beginning of the six-month period and held for the entire period from July 1, 2021 to December 31, 2021.
Actual expenses
The “Actual” line of the table below provides information about actual account values and actual expenses. You may use the information in this line, together with the amount you invested, to estimate the expenses that you paid over the period. Simply divide your account value by $1,000 (for example, an $8,600 account value divided by $1,000 = 8.6), then multiply the result by the number in the “Actual” line under the heading entitled “Expenses paid during period” for your applicable class of shares to estimate the expenses you paid on your account during this period.
Hypothetical example for comparison purposes
The “Hypothetical” line of the table below provides information about hypothetical account values and hypothetical expenses based on the Fund’s actual expense ratio and an assumed rate of return of 5% per year before expenses, which is not the Fund’s actual return. The hypothetical account values and expenses may not be used to estimate the actual ending account balance or expenses you paid for the period. You may use this information to compare the ongoing costs of investing in the Fund and other funds. To do so, compare this 5% hypothetical example with the 5% hypothetical examples that appear in the shareholder reports of the other funds.
Please note that the expenses shown in the table are meant to highlight your ongoing costs only and do not reflect any separate account charges assessed by participating insurance companies. Therefore, the “Hypothetical” line of the table is useful in comparing ongoing costs only, and will not help you determine the relative total costs of owning different funds. In addition, if these separate account charges assessed by participating insurance companies were included, your costs would have been higher.
| | Beginning
account value
7-1-2021 | Ending
account value
12-31-2021 | Expenses
paid during
the period1 | Annualized net
expense ratio |
| Class 1 | | | | |
| Actual | $1,000.00 | $ 964.40 | $3.42 | 0.69% |
| Hypothetical (5% return before expenses) | $1,000.00 | $1,021.73 | $3.52 | 0.69% |
| Class 2 | | | | |
| Actual | $1,000.00 | $ 963.32 | $4.65 | 0.94% |
| Hypothetical (5% return before expenses) | $1,000.00 | $1,020.47 | $4.79 | 0.94% |
1 Expenses paid is equal to the annualized net expense ratio of each class multiplied by the average account value over the period, multiplied by the number of days in the most recent fiscal half-year divided by the number of days in the fiscal year (to reflect the one-half-year period).
Allspring VT International Equity Fund | 11
Portfolio of investments—December 31, 2021
| | | | | | Shares | Value |
| Common stocks: 98.65% | | | | | | |
| Australia: 1.71% | | | | | | |
| Qantas Airways Limited (Industrials, Airlines) † | | | | | 341,295 | $ 1,244,029 |
| Brazil: 0.79% | | | | | | |
| CPFL Energia SA (Utilities, Electric utilities) | | | | | 119,100 | 573,688 |
| Canada: 2.01% | | | | | | |
| Home Capital Group Incorporated (Financials, Thrifts & mortgage finance) † | | | | | 12,500 | 386,082 |
| SNC-Lavalin Group Incorporated (Industrials, Construction & engineering) | | | | | 44,100 | 1,077,617 |
| | | | | | | 1,463,699 |
| China: 10.06% | | | | | | |
| China Resources Land Limited (Real estate, Real estate management & development) | | | | | 226,000 | 950,658 |
| LONGi Green Energy Technology Company Limited Class A (Information technology, Semiconductors & semiconductor equipment) | | | | | 83,600 | 1,130,696 |
| Midea Group Company Limited Class A (Consumer discretionary, Household durables) | | | | | 144,498 | 1,673,437 |
| Oppein Home Group Incorporated Class A (Consumer discretionary, Household durables) | | | | | 29,640 | 685,966 |
| Sands China Limited (Consumer discretionary, Hotels, restaurants & leisure) † | | | | | 358,400 | 834,691 |
| Shanghai Pharmaceuticals Holding Company Limited Class H (Health care, Health care providers & services) | | | | | 412,900 | 782,638 |
| Topsports International Holdings Limited (Consumer discretionary, Specialty retail) 144A | | | | | 1,251,000 | 1,265,832 |
| | | | | | | 7,323,918 |
| Denmark: 2.16% | | | | | | |
| Danske Bank AS (Financials, Banks) | | | | | 90,952 | 1,570,195 |
| France: 7.39% | | | | | | |
| Compagnie de Saint-Gobain SA (Industrials, Building products) | | | | | 27,038 | 1,904,529 |
| Faurecia SE (Consumer discretionary, Auto components) | | | | | 1,763 | 82,455 |
| Sanofi SA (Health care, Pharmaceuticals) | | | | | 17,367 | 1,751,432 |
| Sodexho Alliance SA (Consumer discretionary, Hotels, restaurants & leisure) | | | | | 18,647 | 1,635,953 |
| | | | | | | 5,374,369 |
| Germany: 3.34% | | | | | | |
| Rheinmetall AG (Industrials, Industrial conglomerates) | | | | | 15,924 | 1,498,609 |
| Siemens AG (Industrials, Industrial conglomerates) | | | | | 5,012 | 868,092 |
| Siemens Energy AG (Industrials, Electrical equipment) † | | | | | 2,506 | 63,939 |
| | | | | | | 2,430,640 |
| Hong Kong: 1.35% | | | | | | |
| Xinyi Glass Holdings Limited (Consumer discretionary, Auto components) | | | | | 393,000 | 982,809 |
| India: 1.98% | | | | | | |
| Tech Mahindra Limited (Information technology, IT services) | | | | | 59,716 | 1,438,401 |
| Ireland: 1.10% | | | | | | |
| Greencore Group plc (Consumer staples, Food products) † | | | | | 457,756 | 802,376 |
| Israel: 0.94% | | | | | | |
| Check Point Software Technologies Limited (Information technology, Software) † | | | | | 5,897 | 687,354 |
The accompanying notes are an integral part of these financial statements.
12 | Allspring VT International Equity Fund
Portfolio of investments—December 31, 2021
| | | | | | Shares | Value |
| Italy: 2.43% | | | | | | |
| Prysmian SpA (Industrials, Electrical equipment) | | | | | 12,094 | $ 454,930 |
| UniCredit SpA (Financials, Banks) | | | | | 85,366 | 1,312,190 |
| | | | | | | 1,767,120 |
| Japan: 10.45% | | | | | | |
| Asahi Breweries Limited (Consumer staples, Beverages) | | | | | 42,100 | 1,638,902 |
| Hitachi Limited (Industrials, Industrial conglomerates) | | | | | 26,100 | 1,413,924 |
| Mitsubishi UFJ Financial Group Incorporated (Financials, Banks) | | | | | 312,300 | 1,699,622 |
| ORIX Corporation (Financials, Diversified financial services) | | | | | 86,100 | 1,757,143 |
| Showa Denko KK (Materials, Chemicals) | | | | | 52,100 | 1,095,516 |
| | | | | | | 7,605,107 |
| Luxembourg: 0.87% | | | | | | |
| ArcelorMittal SA (Materials, Metals & mining) | | | | | 19,747 | 632,755 |
| Mexico: 0.35% | | | | | | |
| Fresnillo plc (Materials, Metals & mining) | | | | | 21,021 | 254,028 |
| Netherlands: 10.04% | | | | | | |
| ING Groep NV (Financials, Banks) | | | | | 143,517 | 2,000,270 |
| Koninklijke Philips NV (Health care, Health care equipment & supplies) | | | | | 19,451 | 725,579 |
| NN Group NV (Financials, Insurance) | | | | | 27,234 | 1,476,191 |
| OCI NV (Materials, Chemicals) † | | | | | 28,961 | 759,017 |
| Stellantis NV (Consumer discretionary, Automobiles) | | | | | 124,284 | 2,346,304 |
| | | | | | | 7,307,361 |
| Norway: 2.66% | | | | | | |
| DNB Bank ASA (Financials, Banks) | | | | | 84,477 | 1,932,304 |
| South Korea: 7.19% | | | | | | |
| Coway Company Limited (Consumer discretionary, Household durables) | | | | | 25,215 | 1,579,752 |
| Hana Financial Group Incorporated (Financials, Banks) | | | | | 12,558 | 443,663 |
| Samsung Electronics Company Limited GDR (Information technology, Technology hardware, storage & peripherals) 144A | | | | | 647 | 1,066,903 |
| SK Square Company Limited (Information technology, Semiconductors & semiconductor equipment) † | | | | | 7,347 | 410,381 |
| SK Telecom Company Limited (Communication services, Wireless telecommunication services) | | | | | 35,667 | 1,733,288 |
| | | | | | | 5,233,987 |
| Switzerland: 2.20% | | | | | | |
| LafargeHolcim Limited (Materials, Construction materials) | | | | | 31,491 | 1,601,602 |
| Thailand: 2.59% | | | | | | |
| Siam Commercial Bank PCL (Financials, Banks) | | | | | 496,000 | 1,882,692 |
| United Kingdom: 16.94% | | | | | | |
| ConvaTec Group plc (Health care, Health care equipment & supplies) 144A | | | | | 342,020 | 894,171 |
| Informa plc (Communication services, Media) † | | | | | 280,536 | 1,961,631 |
| Kingfisher plc (Consumer discretionary, Specialty retail) | | | | | 447,541 | 2,049,317 |
| Man Group plc (Financials, Capital markets) | | | | | 125,794 | 387,190 |
| Melrose Industries plc (Industrials, Industrial conglomerates) | | | | | 885,369 | 1,916,227 |
| NatWest Group plc (Financials, Banks) | | | | | 538,305 | 1,644,501 |
| Nomad Foods Limited (Consumer staples, Food products) † | | | | | 75,659 | 1,920,982 |
| Sensata Technologies Holding plc (Industrials, Electrical equipment) † | | | | | 25,106 | 1,548,789 |
| | | | | | | 12,322,808 |
The accompanying notes are an integral part of these financial statements.
Allspring VT International Equity Fund | 13
Portfolio of investments—December 31, 2021
| | | | | | Shares | Value |
| United States: 10.10% | | | | | | |
| Advance Auto Parts Incorporated (Consumer discretionary, Specialty retail) | | | | | 4,878 | $ 1,170,135 |
| Baker Hughes Incorporated (Energy, Energy equipment & services) | | | | | 82,934 | 1,995,392 |
| Berry Global Group Incorporated (Materials, Containers & packaging) † | | | | | 22,159 | 1,634,891 |
| Gentex Corporation (Consumer discretionary, Auto components) | | | | | 21,189 | 738,437 |
| Samsonite International SA (Consumer discretionary, Textiles, apparel & luxury goods) 144A† | | | | | 891,890 | 1,811,792 |
| | | | | | | 7,350,647 |
| Total Common stocks (Cost $65,278,754) | | | | | | 71,781,889 |
| | | Yield | | | | |
| Short-term investments: 0.65% | | | | | | |
| Investment companies: 0.65% | | | | | | |
| Allspring Government Money Market Fund Select Class ♠∞ | | 0.03% | | | 474,235 | 474,235 |
| Total Short-term investments (Cost $474,235) | | | | | | 474,235 |
| Total investments in securities (Cost $65,752,989) | 99.30% | | | | | 72,256,124 |
| Other assets and liabilities, net | 0.70 | | | | | 507,797 |
| Total net assets | 100.00% | | | | | $72,763,921 |
| † | Non-income-earning security |
| 144A | The security may be resold in transactions exempt from registration, normally to qualified institutional buyers, pursuant to Rule 144A under the Securities Act of 1933. |
| ♠ | The issuer of the security is an affiliated person of the Fund as defined in the Investment Company Act of 1940. |
| ∞ | The rate represents the 7-day annualized yield at period end. |
| Abbreviations: |
| GDR | Global depositary receipt |
Investments in affiliates
An affiliated investment is an investment in which the Fund owns at least 5% of the outstanding voting shares of the issuer or as a result of other relationships, such as the Fund and the issuer having the same investment manager. Transactions with issuers that were either affiliates of the Fund at the beginning of the period or the end of the period were as follows:
| | Value,
beginning of
period | Purchases | Sales
proceeds | Net
realized
gains
(losses) | | Net
change in
unrealized
gains
(losses) | | Value,
end of
period | Shares,
end
of period | Income
from
affiliated
securities |
| Short-term investments | | | | | | | | | |
| Allspring Government Money Market Fund Select Class | $1,508,148 | $26,306,144 | $(27,340,057) | $0 | | $0 | | $ 474,235 | 474,235 | $337 |
| Securities Lending Cash Investments LLC | 0 | 10,511,875 | (10,511,875) | 0 | | 0 | | 0 | 0 | 57 # |
| | | | | $0 | | $0 | | $474,235 | | $394 |
| # | Amount shown represents income before fees and rebates. |
The accompanying notes are an integral part of these financial statements.
14 | Allspring VT International Equity Fund
Statement of assets and liabilities—December 31, 2021
| | |
| Assets | |
Investments in unaffiliated securities, at value (cost $65,278,754)
| $ 71,781,889 |
Investments in affiliated securities, at value (cost $474,235)
| 474,235 |
Foreign currency, at value (cost $150,576)
| 151,449 |
Receivable for dividends
| 468,062 |
Receivable for Fund shares sold
| 5,417 |
Prepaid expenses and other assets
| 3,384 |
Total assets
| 72,884,436 |
| Liabilities | |
Custody and accounting fees payable
| 21,452 |
Contingent tax liability
| 18,641 |
Management fee payable
| 18,476 |
Distribution fee payable
| 12,616 |
Payable for Fund shares redeemed
| 10,446 |
Administration fees payable
| 5,178 |
Trustees’ fees and expenses payable
| 1,807 |
Accrued expenses and other liabilities
| 31,899 |
Total liabilities
| 120,515 |
Total net assets
| $72,763,921 |
| Net assets consist of | |
Paid-in capital
| $ 67,314,417 |
Total distributable earnings
| 5,449,504 |
Total net assets
| $72,763,921 |
| Computation of net asset value per share | |
Net assets – Class 1
| $ 16,019,438 |
Shares outstanding – Class 11
| 8,183,408 |
Net asset value per share – Class 1
| $1.96 |
Net assets – Class 2
| $ 56,744,483 |
Shares outstanding – Class 21
| 28,008,336 |
Net asset value per share – Class 2
| $2.03 |
| 1 | The Fund has an unlimited number of authorized shares. |
The accompanying notes are an integral part of these financial statements.
Allspring VT International Equity Fund | 15
Statement of operations—year ended December 31, 2021
| | |
| Investment income | |
Dividends (net of foreign withholdings taxes of $185,846)
| $ 2,104,146 |
Income from affiliated securities
| 9,587 |
Total investment income
| 2,113,733 |
| Expenses | |
Management fee
| 611,291 |
| Administration fees | |
Class 1
| 13,785 |
Class 2
| 47,344 |
| Distribution fee | |
Class 2
| 147,900 |
Custody and accounting fees
| 64,345 |
Professional fees
| 58,301 |
Shareholder report expenses
| 28,268 |
Trustees’ fees and expenses
| 19,219 |
Other fees and expenses
| 19,505 |
Total expenses
| 1,009,958 |
| Less: Fee waivers and/or expense reimbursements | |
Fund-level
| (334,770) |
Net expenses
| 675,188 |
Net investment income
| 1,438,545 |
| Realized and unrealized gains (losses) on investments | |
| Net realized gains (losses) on | |
Unaffiliated securities
| 8,794,034 |
Forward foreign currency contracts
| (8,714) |
Net realized gains on investments
| 8,785,320 |
| Net change in unrealized gains (losses) on | |
Unaffiliated securities (net of foreign taxes of $(18,641))
| (4,984,557) |
Forward foreign currency contracts
| 8,738 |
Net change in unrealized gains (losses) on investments
| (4,975,819) |
Net realized and unrealized gains (losses) on investments
| 3,809,501 |
Net increase in net assets resulting from operations
| $ 5,248,046 |
The accompanying notes are an integral part of these financial statements.
16 | Allspring VT International Equity Fund
Statement of changes in net assets
| | | | | |
| | Year ended
December 31, 2021 | Year ended
December 31, 2020 |
| Operations | | | | |
Net investment income
| | $ 1,438,545 | | $ 945,532 |
Net realized gains (losses) on investments
| | 8,785,320 | | (9,412,420) |
Net change in unrealized gains (losses) on investments
| | (4,975,819) | | 10,559,779 |
Net increase in net assets resulting from operations
| | 5,248,046 | | 2,092,891 |
| Distributions to shareholders from | | | | |
| Net investment income and net realized gains | | | | |
Class 1
| | (234,100) | | (472,932) |
Class 2
| | (636,482) | | (1,308,572) |
Total distributions to shareholders
| | (870,582) | | (1,781,504) |
| Capital share transactions | Shares | | Shares | |
| Proceeds from shares sold | | | | |
Class 1
| 428,824 | 852,667 | 514,844 | 744,962 |
Class 2
| 1,124,312 | 2,325,463 | 1,093,316 | 1,614,560 |
| | | 3,178,130 | | 2,359,522 |
| Reinvestment of distributions | | | | |
Class 1
| 117,638 | 234,100 | 319,548 | 472,932 |
Class 2
| 307,479 | 636,482 | 849,722 | 1,308,572 |
| | | 870,582 | | 1,781,504 |
| Payment for shares redeemed | | | | |
Class 1
| (1,801,937) | (3,540,869) | (2,281,763) | (3,640,125) |
Class 2
| (3,293,961) | (6,748,163) | (4,910,668) | (7,964,863) |
| | | (10,289,032) | | (11,604,988) |
Net decrease in net assets resulting from capital share transactions
| | (6,240,320) | | (7,463,962) |
Total decrease in net assets
| | (1,862,856) | | (7,152,575) |
| Net assets | | | | |
Beginning of period
| | 74,626,777 | | 81,779,352 |
End of period
| | $ 72,763,921 | | $ 74,626,777 |
The accompanying notes are an integral part of these financial statements.
Allspring VT International Equity Fund | 17
Financial highlights
(For a share outstanding throughout each period)
| | Year ended December 31 |
| Class 1 | 2021 | 2020 | 2019 | 2018 | 2017 |
Net asset value, beginning of period
| $1.85 | $1.83 | $2.85 | $5.34 | $4.41 |
Net investment income
| 0.04 | 0.03 1 | 0.06 1 | 0.10 1 | 0.12 1 |
Net realized and unrealized gains (losses) on investments
| 0.10 | 0.04 | 0.34 | (0.77) | 0.96 |
Total from investment operations
| 0.14 | 0.07 | 0.40 | (0.67) | 1.08 |
| Distributions to shareholders from | | | | | |
Net investment income
| (0.03) | (0.05) | (0.13) | (0.61) | (0.15) |
Net realized gains
| 0.00 | 0.00 | (1.29) | (1.21) | 0.00 |
Total distributions to shareholders
| (0.03) | (0.05) | (1.42) | (1.82) | (0.15) |
Net asset value, end of period
| $1.96 | $1.85 | $1.83 | $2.85 | $5.34 |
Total return2
| 7.39% | 4.31% | 16.14% | (16.86)% | 24.86% |
| Ratios to average net assets (annualized) | | | | | |
Gross expenses
| 1.13% | 1.13% | 1.13% | 1.12% | 0.95% |
Net expenses
| 0.69% | 0.69% | 0.69% | 0.69% | 0.69% |
Net investment income
| 2.07% | 1.59% | 2.55% | 2.41% | 2.41% |
| Supplemental data | | | | | |
Portfolio turnover rate
| 65% | 80% | 48% | 51% | 55% |
Net assets, end of period (000s omitted)
| $16,019 | $17,459 | $19,872 | $19,315 | $28,001 |
| 1 | Calculated based upon average shares outstanding |
| 2 | Returns do not reflect fees and expenses charged pursuant to the terms of variable life insurance policies and variable annuity contracts. |
The accompanying notes are an integral part of these financial statements.
18 | Allspring VT International Equity Fund
Financial highlights
(For a share outstanding throughout each period)
| | Year ended December 31 |
| Class 2 | 2021 | 2020 | 2019 | 2018 | 2017 |
Net asset value, beginning of period
| $1.91 | $1.89 | $2.89 | $5.38 | $4.45 |
Net investment income
| 0.04 | 0.03 1 | 0.05 1 | 0.09 1 | 0.11 1 |
Net realized and unrealized gains (losses) on investments
| 0.10 | 0.03 | 0.36 | (0.78) | 0.96 |
Total from investment operations
| 0.14 | 0.06 | 0.41 | (0.69) | 1.07 |
| Distributions to shareholders from | | | | | |
Net investment income
| (0.02) | (0.04) | (0.12) | (0.59) | (0.14) |
Net realized gains
| 0.00 | 0.00 | (1.29) | (1.21) | 0.00 |
Total distributions to shareholders
| (0.02) | (0.04) | (1.41) | (1.80) | (0.14) |
Net asset value, end of period
| $2.03 | $1.91 | $1.89 | $2.89 | $5.38 |
Total return2
| 7.43% | 3.83% | 16.10% | (17.28)% | 24.34% |
| Ratios to average net assets (annualized) | | | | | |
Gross expenses
| 1.38% | 1.38% | 1.38% | 1.30% | 1.20% |
Net expenses
| 0.94% | 0.94% | 0.94% | 0.94% | 0.94% |
Net investment income
| 1.83% | 1.34% | 2.30% | 1.82% | 2.18% |
| Supplemental data | | | | | |
Portfolio turnover rate
| 65% | 80% | 48% | 51% | 55% |
Net assets, end of period (000s omitted)
| $56,744 | $57,167 | $61,907 | $59,004 | $318,202 |
| 1 | Calculated based upon average shares outstanding |
| 2 | Returns do not reflect fees and expenses charged pursuant to the terms of variable life insurance policies and variable annuity contracts. |
The accompanying notes are an integral part of these financial statements.
Allspring VT International Equity Fund | 19
Notes to financial statements
1. ORGANIZATION
Allspring Variable Trust (the "Trust"), a Delaware statutory trust organized on March 10, 1999, is an open-end management investment company registered under the Investment Company Act of 1940, as amended (the "1940 Act"). As an investment company, the Trust follows the accounting and reporting guidance in Financial Accounting Standards Board ("FASB") Accounting Standards Codification Topic 946, Financial Services – Investment Companies. These financial statements report on the Allspring VT International Equity Fund (the "Fund") which is a diversified series of the Trust. The Trust offers shares of the Fund to separate accounts of various life insurance companies as funding vehicles for certain variable annuity contracts and variable life insurance policies.
Effective on November 1, 2021, the sale transaction of Wells Fargo Asset Management ("WFAM") by Wells Fargo & Company to GTCR LLC and Reverence Capital Partners, L.P. was closed. In connection with the closing of the transaction, WFAM became known as Allspring Global Investments (“Allspring”) and various entities that provided services to the Fund changed their names to "Allspring", including Allspring Funds Management, LLC, the investment manager to the Fund, Allspring Global Investments, LLC and Allspring Global Investments (UK) Limited, both registered investment advisers providing subadvisory services to certain funds, and Allspring Funds Distributor, LLC, the Fund's principal underwriter. Consummation of the transaction resulted in a new investment management agreement and subadvisory agreement which became effective on November 1, 2021.
2. SIGNIFICANT ACCOUNTING POLICIES
The following significant accounting policies, which are consistently followed in the preparation of the financial statements of the Fund, are in conformity with U.S. generally accepted accounting principles which require management to make estimates and assumptions that affect the reported amounts of assets and liabilities, disclosure of contingent assets and liabilities at the date of the financial statements, and the reported amounts of income and expenses during the reporting period. Actual results could differ from those estimates.
Securities valuation
All investments are valued each business day as of the close of regular trading on the New York Stock Exchange (generally 4 p.m. Eastern Time), although the Fund may deviate from this calculation time under unusual or unexpected circumstances.
Equity securities that are listed on a foreign or domestic exchange or market are valued at the official closing price or, if none, the last sales price. If no sale occurs on the principal exchange or market that day, a fair value price will be determined in accordance with the Fund’s Valuation Procedures.
The values of securities denominated in foreign currencies are translated into U.S. dollars at rates provided by an independent foreign currency pricing source at a time each business day specified by the Allspring Global Investments Pricing Committee at Allspring Funds Management, LLC ("Allspring Funds Management").
Many securities markets and exchanges outside the U.S. close prior to the close of the New York Stock Exchange and therefore may not fully reflect trading or events that occur after the close of the principal exchange in which the foreign securities are traded, but before the close of the New York Stock Exchange. If such trading or events are expected to materially affect the value of such securities, then fair value pricing procedures approved by the Board of Trustees of the Fund are applied. These procedures take into account multiple factors including movements in U.S. securities markets after foreign exchanges close. Foreign securities that are fair valued under these procedures are categorized as Level 2 and the application of these procedures may result in transfers between Level 1 and Level 2. Depending on market activity, such fair valuations may be frequent. Such fair value pricing may result in net asset values that are higher or lower than net asset values based on the last reported sales price or latest quoted bid price. On December 31, 2021, such fair value pricing was used in pricing certain foreign securities.
Forward foreign currency contracts are recorded at the forward rate provided by an independent foreign currency pricing source at a time each business day specified by the Allspring Global Investments Pricing Committee.
Investments in registered open-end investment companies are valued at net asset value. Interests in non-registered investment companies that are redeemable at net asset value are fair valued normally at net asset value.
Investments which are not valued using any of the methods discussed above are valued at their fair value, as determined in good faith by the Board of Trustees. The Board of Trustees has established a Valuation Committee comprised of the Trustees and has delegated to it the authority to take any actions regarding the valuation of portfolio securities that the Valuation Committee deems necessary or appropriate, including determining the fair value of portfolio securities, unless the determination has been delegated to the Allspring Global Investments Pricing Committee. The Board of Trustees retains the
20 | Allspring VT International Equity Fund
Notes to financial statements
authority to make or ratify any valuation decisions or approve any changes to the Valuation Procedures as it deems appropriate. On a quarterly basis, the Board of Trustees receives reports on any valuation actions taken by the Valuation Committee or the Allspring Global Investments Pricing Committee which may include items for ratification.
Foreign currency translation
The accounting records of the Fund are maintained in U.S. dollars. The values of other assets and liabilities denominated in foreign currencies are translated into U.S. dollars at rates provided by an independent foreign currency pricing source at a time each business day specified by the Allspring Global Investments Pricing Committee. Purchases and sales of securities, and income and expenses are converted at the rate of exchange on the respective dates of such transactions. Net realized foreign exchange gains or losses arise from sales of foreign currencies, currency gains or losses realized between the trade and settlement dates on securities transactions, and the difference between the amounts of dividends, interest and foreign withholding taxes recorded and the U.S. dollar equivalent of the amounts actually paid or received. Net unrealized foreign exchange gains and losses arise from changes in the fair value of assets and liabilities other than investments in securities resulting from changes in exchange rates. The changes in net assets arising from changes in exchange rates of securities and the changes in net assets resulting from changes in market prices of securities are not separately presented. Such changes are included in net realized and unrealized gains or losses from investments.
Forward foreign currency contracts
A forward foreign currency contract is an agreement between two parties to purchase or sell a specific currency for an agreed-upon price at a future date. The Fund enters into forward foreign currency contracts to facilitate transactions in foreign-denominated securities and to attempt to minimize the risk to the Fund from adverse changes in the relationship between currencies. Forward foreign currency contracts are recorded at the forward rate and marked-to-market daily. When the contracts are closed, realized gains and losses arising from such transactions are recorded as realized gains or losses on forward foreign currency contracts. The Fund is subject to foreign currency risk and may be exposed to risks if the counterparties to the contracts are unable to meet the terms of their contracts or if the value of the foreign currency changes unfavorably. The Fund's maximum risk of loss from counterparty credit risk is the unrealized gains on the contracts. This risk may be mitigated if there is a master netting arrangement between the Fund and the counterparty.
Securities lending
The Fund may lend its securities from time to time in order to earn additional income in the form of fees or interest on securities received as collateral or the investment of any cash received as collateral. When securities are on loan, the Fund receives interest or dividends on those securities. Cash collateral received in connection with its securities lending transactions is invested in Securities Lending Cash Investments, LLC (the "Securities Lending Fund"), an affiliated non-registered investment company. Investments in Securities Lending Fund are valued at the evaluated bid price provided by an independent pricing service. Income earned from investment in the Securities Lending Fund (net of fees and rebates), if any, is included in income from affiliated securities on the Statement of Operations.
In a securities lending transaction, the net asset value of the Fund is affected by an increase or decrease in the value of the securities loaned and by an increase or decrease in the value of the instrument in which collateral is invested. The amount of securities lending activity undertaken by the Fund fluctuates from time to time. The Fund has the right under the lending agreement to recover the securities from the borrower on demand. In the event of default or bankruptcy by the borrower, the Fund may be prevented from recovering the loaned securities or gaining access to the collateral or may experience delays or costs in doing so. In such an event, the terms of the agreement allow the unaffiliated securities lending agent to use the collateral to purchase replacement securities on behalf of the Fund or pay the Fund the market value of the loaned securities. The Fund bears the risk of loss with respect to depreciation of its investment of the cash collateral.
Security transactions and income recognition
Securities transactions are recorded on a trade date basis. Realized gains or losses are recorded on the basis of identified cost.
Dividend income is recognized on the ex-dividend date, except for certain dividends from foreign securities, which are recorded as soon as the custodian verifies the ex-dividend date. Dividend income is recorded net of foreign taxes withheld where recovery of such taxes is not assured.
Distributions to shareholders
Distributions to shareholders from net investment income and any net realized gains are recorded on the ex-dividend date and paid at least annually. Such distributions are determined in accordance with income tax regulations and may differ from U.S. generally accepted accounting principles. Dividend sources are estimated at the time of declaration. The tax character of distributions is determined as of the Fund's fiscal year end. Therefore, a portion of the Fund's distributions made prior to the Fund’s fiscal year end may be categorized as a tax return of capital at year end.
Allspring VT International Equity Fund | 21
Notes to financial statements
Federal and other taxes
The Fund intends to continue to qualify as a regulated investment company by distributing substantially all of its investment company taxable income and any net realized capital gains (after reduction for capital loss carryforwards) sufficient to relieve it from all, or substantially all, federal income taxes. Accordingly, no provision for federal income taxes was required.
The Fund’s income and federal excise tax returns and all financial records supporting those returns for the prior three fiscal years are subject to examination by the federal and Delaware revenue authorities. Management has analyzed the Fund's tax positions taken on federal, state, and foreign tax returns for all open tax years and does not believe that there are any uncertain tax positions that require recognition of a tax liability.
As of December 31, 2021, the aggregate cost of all investments for federal income tax purposes was $67,088,870 and the unrealized gains (losses) consisted of:
| Gross unrealized gains | $ 9,515,090 |
| Gross unrealized losses | (4,347,836) |
| Net unrealized gains | $ 5,167,254 |
As of December 31, 2021, the Fund had capital loss carryforwards which consisted of $318,230 in short-term capital losses and $1,722,342 in long-term capital losses.
Class allocations
The separate classes of shares offered by the Fund differ principally in distribution fees. Class specific expenses are charged directly to that share class. Investment income, common fund-level expenses, and realized and unrealized gains (losses) on investments are allocated daily to each class of shares based on the relative proportion of net assets of each class.
3. FAIR VALUATION MEASUREMENTS
Fair value measurements of investments are determined within a framework that has established a fair value hierarchy based upon the various data inputs utilized in determining the value of the Fund’s investments. The three-level hierarchy gives the highest priority to unadjusted quoted prices in active markets for identical assets or liabilities (Level 1) and the lowest priority to unobservable inputs (Level 3). The Fund’s investments are classified within the fair value hierarchy based on the lowest level of input that is significant to the fair value measurement. The inputs are summarized into three broad levels as follows:
| ■ | Level 1 – quoted prices in active markets for identical securities |
| ■ | Level 2 – other significant observable inputs (including quoted prices for similar securities, interest rates, prepayment speeds, credit risk, etc.) |
| ■ | Level 3 – significant unobservable inputs (including the Fund’s own assumptions in determining the fair value of investments) |
The inputs or methodologies used for valuing investments in securities are not necessarily an indication of the risk associated with investing in those securities.
22 | Allspring VT International Equity Fund
Notes to financial statements
The following is a summary of the inputs used in valuing the Fund’s assets and liabilities as of December 31, 2021:
| | Quoted prices
(Level 1) | Other significant
observable inputs
(Level 2) | Significant
unobservable inputs
(Level 3) | Total |
| Assets | | | | |
| Investments in: | | | | |
| Common stocks | | | | |
| Australia | $ 1,244,029 | $ 0 | $0 | $ 1,244,029 |
| Brazil | 0 | 573,688 | 0 | 573,688 |
| Canada | 1,463,699 | 0 | 0 | 1,463,699 |
| China | 7,323,918 | 0 | 0 | 7,323,918 |
| Denmark | 0 | 1,570,195 | 0 | 1,570,195 |
| France | 5,374,369 | 0 | 0 | 5,374,369 |
| Germany | 0 | 2,430,640 | 0 | 2,430,640 |
| Hong Kong | 982,809 | 0 | 0 | 982,809 |
| India | 1,438,401 | 0 | 0 | 1,438,401 |
| Ireland | 802,376 | 0 | 0 | 802,376 |
| Israel | 687,354 | 0 | 0 | 687,354 |
| Italy | 0 | 1,767,120 | 0 | 1,767,120 |
| Japan | 0 | 7,605,107 | 0 | 7,605,107 |
| Luxembourg | 632,755 | 0 | 0 | 632,755 |
| Mexico | 254,028 | 0 | 0 | 254,028 |
| Netherlands | 4,961,057 | 2,346,304 | 0 | 7,307,361 |
| Norway | 0 | 1,932,304 | 0 | 1,932,304 |
| South Korea | 1,477,284 | 3,756,703 | 0 | 5,233,987 |
| Switzerland | 0 | 1,601,602 | 0 | 1,601,602 |
| Thailand | 0 | 1,882,692 | 0 | 1,882,692 |
| United Kingdom | 12,322,808 | 0 | 0 | 12,322,808 |
| United States | 7,350,647 | 0 | 0 | 7,350,647 |
| Short-term investments | | | | |
| Investment companies | 474,235 | 0 | 0 | 474,235 |
| Total assets | $46,789,769 | $25,466,355 | $0 | $72,256,124 |
Additional sector, industry or geographic detail, if any, is included in the Portfolio of Investments.
For the year ended December 31, 2021, the Fund did not have any transfers into/out of Level 3.
4. TRANSACTIONS WITH AFFILIATES
Management fee
Allspring Funds Management, a wholly owned subsidiary of Allspring Global Investments Holdings, LLC, a holding company indirectly owned by certain private funds of GTCR LLC and Reverence Capital Partners, L.P., is the manager of the Fund and provides advisory and fund-level administrative services under an investment management agreement. Under the investment management agreement, Allspring Funds Management is responsible for, among other services, implementing the investment objectives and strategies of the Fund, supervising the subadviser and providing fund-level administrative services in connection with the Fund’s operations. As compensation for its services under the investment management agreement, Allspring Funds Management is entitled to receive a management fee at the following annual rate based on the Fund’s average daily net assets:
Allspring VT International Equity Fund | 23
Notes to financial statements
| Average daily net assets | Management fee |
| First $500 million | 0.800% |
| Next $500 million | 0.750 |
| Next $1 billion | 0.700 |
| Next $2 billion | 0.675 |
| Next $1 billion | 0.650 |
| Next $5 billion | 0.640 |
| Over $10 billion | 0.630 |
For the year ended December 31, 2021, the management fee was equivalent to an annual rate of 0.80% of the Fund’s average daily net assets.
Allspring Funds Management has retained the services of a subadviser to provide daily portfolio management to the Fund. The fee for subadvisory services is borne by Allspring Funds Management. Allspring Global Investments, LLC ("Allspring Investments"), an affiliate of Allspring Funds Management and a wholly owned subsidiary of Allspring Global Investments Holdings, LLC, is the subadviser to the Fund and is entitled to receive a fee from Allspring Funds Management at an annual rate starting at 0.45% and declining to 0.40% as the average daily net assets of the Fund increase.
Administration fees
Under a class-level administration agreement, Allspring Funds Management provides class-level administrative services to the Fund, which includes paying fees and expenses for services provided by the transfer agent, sub-transfer agents, omnibus account services and record-keepers. As compensation for its services under the class-level administration agreement, Allspring Funds Management receives an annual fee of 0.08% which is calculated based on the average daily net assets of each class.
Waivers and/or expense reimbursements
Allspring Funds Management has contractually committed to waive and/or reimburse management and administration fees to the extent necessary to maintain certain net operating expense ratios for the Fund. When each class of the Fund has exceeded its expense cap, Allspring Funds Management will waive fees and/or reimburse expenses from fund-level expenses on a proportionate basis and then from class specific expenses. When only certain classes exceed their expense caps, waivers and/or reimbursements are applied against class specific expenses before fund-level expenses. Allspring Funds Management has contractually committed through April 30, 2022 to waive fees and/or reimburse expenses to the extent necessary to cap expenses. Prior to or after the commitment expiration date, the caps may be increased or the commitment to maintain the caps may be terminated only with the approval of the Board of Trustees. The contractual expense caps are as follows:
| | Expense ratio caps |
| Class 1 | 0.69% |
| Class 2 | 0.94 |
Distribution fee
The Trust has adopted a distribution plan for Class 2 shares of the Fund pursuant to Rule 12b-1 under the 1940 Act. A distribution fee is charged to Class 2 shares and paid to Allspring Funds Distributor, LLC, an affiliate of Allspring Funds Management, the principal underwriter, at an annual rate of 0.25% of the average daily net assets of Class 2 shares.
Interfund transactions
The Fund may purchase or sell portfolio investment securities to certain affiliates pursuant to Rule 17a-7 under the 1940 Act and under procedures adopted by the Board of Trustees. The procedures have been designed to ensure that these interfund transactions, which do not incur broker commissions, are effected at current market prices.
5. INVESTMENT PORTFOLIO TRANSACTIONS
Purchases and sales of investments, excluding U.S. government obligations (if any) and short-term securities, for the year ended December 31, 2021 were $47,947,028 and $53,342,090, respectively.
24 | Allspring VT International Equity Fund
Notes to financial statements
6. SECURITIES LENDING TRANSACTIONS
The Fund lends its securities through an unaffiliated securities lending agent and receives collateral in the form of cash or securities with a value at least equal to the value of the securities on loan. The value of the loaned securities is determined at the close of each business day and any increases or decreases in the required collateral are exchanged between the Fund and the counterparty on the next business day. Cash collateral received is invested in the Securities Lending Fund which seeks to provide a positive return compared to the daily Federal Funds Open Rate by investing in high-quality, U.S. dollar-denominated short-term money market instruments and is exempt from registration under Section 3(c)(7) of the 1940 Act. Securities Lending Fund is managed by Allspring Funds Management and is subadvised by Allspring Investments. Allspring Funds Management receives an advisory fee starting at 0.05% and declining to 0.01% as the average daily net assets of the Securities Lending Fund increase. All of the fees received by Allspring Funds Management are paid to Allspring Investments for its services as subadviser.
In the event of counterparty default or the failure of a borrower to return a loaned security, the Fund has the right to use the collateral to offset any losses incurred. As of December 31, 2021, the Fund did not have any securities on loan.
7. DERIVATIVE TRANSACTIONS
During the year ended December 31, 2021, the Fund entered into forward foreign currency contracts for economic hedging purposes. The Fund had average contract amounts of $161,881 in forward foreign currency contracts to buy and $156,738 in forward foreign currency contracts to sell during the year ended December 31, 2021.
The fair value, realized gains or losses and change in unrealized gains or losses, if any, on derivative instruments are reflected in the corresponding financial statement captions.
8. BANK BORROWINGS
The Trust, Allspring Master Trust and Allspring Funds Trust (excluding the money market funds) are parties to a $350,000,000 revolving credit agreement whereby the Fund is permitted to use bank borrowings for temporary or emergency purposes, such as to fund shareholder redemption requests. Interest under the credit agreement is charged to the Fund based on a borrowing rate equal to the higher of the Federal Funds rate in effect on that day plus 1.25% or the overnight bank funding rate in effect on that day plus 1.25%. In addition, an annual commitment fee equal to 0.25% of the unused balance is allocated to each participating fund.
For the year ended December 31, 2021, there were no borrowings by the Fund under the agreement.
9. DISTRIBUTIONS TO SHAREHOLDERS
The tax character of distributions paid was $870,582 and $1,781,504 of ordinary income for the years ended December 31, 2021 and December 31, 2020, respectively.
As of December 31, 2021, the components of distributable earnings on a tax basis were as follows:
Undistributed
ordinary
income | Unrealized
gains | Capital loss
carryforward |
| $2,324,934 | $5,170,034 | $(2,040,572) |
10. CONCENTRATION RISKS
As of the end of the period, the Fund concentrated its portfolio of investments in Asia/Pacific ex-Japan and Europe. A fund that invests a substantial portion of its assets in any geographic region may be more affected by changes in that geographic region than would be a fund whose investments are not heavily weighted in any geographic region.
11. INDEMNIFICATION
Under the Fund's organizational documents, the officers and Trustees have been granted certain indemnification rights against certain liabilities that may arise out of performance of their duties to the Fund. The Fund has entered into a separate agreement with each Trustee that converts indemnification rights currently existing under the Fund’s organizational documents into contractual rights that cannot be changed in the future without the consent of the Trustee. Additionally, in the normal course of business, the Fund may enter into contracts with service providers that contain a variety of indemnification
Allspring VT International Equity Fund | 25
Notes to financial statements
clauses. The Fund’s maximum exposure under these arrangements is dependent on future claims that may be made against the Fund and, therefore, cannot be estimated.
12. CORONAVIRUS (COVID-19) PANDEMIC
On March 11, 2020, the World Health Organization announced that it had made the assessment that coronavirus disease 2019 (“COVID-19”) is a pandemic. The impacts of COVID-19 are affecting the entire global economy, individual companies and investment products, the funds, and the market in general. There is significant uncertainty around the extent and duration of business disruptions related to COVID-19 and the impacts may last for an extended period of time. COVID-19 has led to significant uncertainty and volatility in the financial markets.
26 | Allspring VT International Equity Fund
Report of independent registered public accounting firm
To the Shareholders of the Fund and Board of Trustees
Allspring Variable Trust:
Opinion on the Financial Statements
We have audited the accompanying statement of assets and liabilities of Allspring VT International Equity Fund (formerly, Wells Fargo VT International Equity Fund) (the Fund), one of the funds constituting Allspring Variable Trust (formerly, Wells Fargo Variable Trust), including the portfolio of investments, as of December 31, 2021, the related statement of operations for the year then ended, the statements of changes in net assets for each of the years in the two-year period then ended, and the related notes (collectively, the financial statements) and the financial highlights for each of the years in the five-year period then ended. In our opinion, the financial statements and financial highlights present fairly, in all material respects, the financial position of the Fund as of December 31, 2021, the results of its operations for the year then ended, the changes in its net assets for each of the years in the two-year period then ended, and the financial highlights for each of the years in the five-year period then ended, in conformity with U.S. generally accepted accounting principles.
Basis for Opinion
These financial statements and financial highlights are the responsibility of the Fund’s management. Our responsibility is to express an opinion on these financial statements and financial highlights based on our audits. We are a public accounting firm registered with the Public Company Accounting Oversight Board (United States) (PCAOB) and are required to be independent with respect to the Fund in accordance with the U.S. federal securities laws and the applicable rules and regulations of the Securities and Exchange Commission and the PCAOB.
We conducted our audits in accordance with the standards of the PCAOB. Those standards require that we plan and perform the audit to obtain reasonable assurance about whether the financial statements and financial highlights are free of material misstatement, whether due to error or fraud. Our audits included performing procedures to assess the risks of material misstatement of the financial statements and financial highlights, whether due to error or fraud, and performing procedures that respond to those risks. Such procedures included examining, on a test basis, evidence regarding the amounts and disclosures in the financial statements and financial highlights. Such procedures also included confirmation of securities owned as of December 31, 2021, by correspondence with the custodian and transfer agent. Our audits also included evaluating the accounting principles used and significant estimates made by management, as well as evaluating the overall presentation of the financial statements and financial highlights. We believe that our audits provide a reasonable basis for our opinion.

We have not been able to determine the specific year that we began serving as the auditor of one or more Allspring Funds investment companies; however, we are aware that we have served as the auditor of one or more Allspring Funds investment companies since at least 1955.
Boston, Massachusetts
February 25, 2022
Allspring VT International Equity Fund | 27
Other information (unaudited)
TAX INFORMATION
For corporate shareholders, pursuant to Section 854 of the Internal Revenue Code, 3% of ordinary income dividends qualify for the corporate dividends-received deduction for the fiscal year ended December 31, 2021.
Pursuant to Section 853 of the Internal Revenue Code, the following amounts have been designated as foreign taxes paid for the fiscal year ended December 31, 2021. These amounts may be less than the actual foreign taxes paid for financial statement purposes. Foreign taxes paid or withheld should be included in taxable income with an offsetting deduction from gross income or as a credit for taxes paid to foreign governments. None of the income was derived from ineligible foreign sources as defined under Section 901(j) of the Internal Revenue Code.
Creditable
foreign taxes
paid | Per share
amount | Foreign
income as % of
ordinary income
distributions |
| $149,060 | $0.0041 | 37% |
PROXY VOTING INFORMATION
A description of the policies and procedures used to determine how to vote proxies relating to portfolio securities is available without charge, upon request, by calling 1-800-260-5969, visiting our website at allspringglobal.com, or visiting the SEC website at sec.gov. Information regarding how the proxies related to portfolio securities were voted during the most recent 12-month period ended June 30 is available on the website at allspringglobal.com or by visiting the SEC website at sec.gov.
SPECIAL MEETING OF SHAREHOLDERS
On August 16, 2021, a Special Meeting of Shareholders for the Fund was held to consider the following proposals. The results of the proposals are indicated below.
Proposal 1 – To consider and approve a new investment management agreement with Wells Fargo Funds Management, LLC*.
| Shares voted “For” | | 32,530,811 |
| Shares voted “Against” | | 2,631,229 |
| Shares voted “Abstain” | | 2,254,184 |
Proposal 2 – To consider and approve a new subadvisory agreement with Wells Capital Management, LLC**.
| Shares voted “For” | | 32,418,205 |
| Shares voted “Against” | | 2,723,654 |
| Shares voted “Abstain” | | 2,274,365 |
* Effective November 1, 2021, known as Allspring Funds Management, LLC.
** Effective November 1, 2021, known as Allspring Global Investments, LLC.
QUARTERLY PORTFOLIO HOLDINGS INFORMATION
The Fund files its complete schedule of portfolio holdings with the SEC for the first and third quarters of each fiscal year as an exhibit to its reports on Form N-PORT. Shareholders may view the filed Form N-PORT by visiting the SEC website at sec.gov.
28 | Allspring VT International Equity Fund
Other information (unaudited)
BOARD OF TRUSTEES AND OFFICERS
Each of the Trustees and Officers listed in the table below acts in identical capacities for each fund in the Allspring family of funds, which consists of 139 mutual funds comprising the Allspring Funds Trust, Allspring Variable Trust, Allspring Master Trust and four closed-end funds (collectively the “Fund Complex”). This table should be read in conjunction with the Prospectus and the Statement of Additional Information1. The mailing address of each Trustee and Officer is 525 Market Street, 12th Floor, San Francisco, CA 94105. Each Trustee and Officer serves an indefinite term, however, each Trustee serves such term until reaching the mandatory retirement age established by the Trustees.
Independent Trustees
Name and
year of birth | Position held and
length of service* | Principal occupations during past five years or longer | Current other
public company or
investment
company
directorships |
William R. Ebsworth
(Born 1957) | Trustee,
since 2015 | Retired. From 1984 to 2013, equities analyst, portfolio manager, research director and chief investment officer at Fidelity Management and Research Company in Boston, Tokyo, and Hong Kong, and retired in 2013 as Chief Investment Officer of Fidelity Strategic Advisers, Inc. where he led a team of investment professionals managing client assets. Prior thereto, Board member of Hong Kong Securities Clearing Co., Hong Kong Options Clearing Corp., the Thailand International Fund, Ltd., Fidelity Investments Life Insurance Company, and Empire Fidelity Investments Life Insurance Company. Audit Committee Chair and Investment Committee Chair of the Vincent Memorial Hospital Endowment (non-profit organization). Mr. Ebsworth is a CFA® charterholder. | N/A |
Jane A. Freeman
(Born 1953) | Trustee,
since 2015;
Chair Liaison,
since 2018 | Retired. From 2012 to 2014 and 1999 to 2008, Chief Financial Officer of Scientific Learning Corporation. From 2008 to 2012, Ms. Freeman provided consulting services related to strategic business projects. Prior to 1999, Portfolio Manager at Rockefeller & Co. and Scudder, Stevens & Clark. Board member of the Harding Loevner Funds from 1996 to 2014, serving as both Lead Independent Director and chair of the Audit Committee. Board member of the Russell Exchange Traded Funds Trust from 2011 to 2012 and the chair of the Audit Committee. Ms. Freeman is also an inactive Chartered Financial Analyst. | N/A |
Isaiah Harris, Jr.
(Born 1952) | Trustee,
since 2009; Audit
Committee
Chair,
since 2019 | Retired. Chairman of the Board of CIGNA Corporation from 2009 to 2021, and Director from 2005 to 2008. From 2003 to 2011, Director of Deluxe Corporation. Prior thereto, President and CEO of BellSouth Advertising and Publishing Corp. from 2005 to 2007, President and CEO of BellSouth Enterprises from 2004 to 2005 and President of BellSouth Consumer Services from 2000 to 2003. Emeritus member of the Iowa State University Foundation Board of Governors. Emeritus Member of the Advisory Board of Iowa State University School of Business. Advisory Board Member, Palm Harbor Academy (private school). Advisory Board Member, Fellowship of Christian Athletes. Mr. Harris is a certified public accountant (inactive status). | N/A |
Judith M. Johnson**
(Born 1949) | Trustee,
since 2008 | Retired. Prior thereto, Chief Executive Officer and Chief Investment Officer of Minneapolis Employees Retirement Fund from 1996 to 2008. Ms. Johnson is an attorney, certified public accountant and a certified managerial accountant. | N/A |
David F. Larcker
(Born 1950) | Trustee,
since 2009 | James Irvin Miller Professor of Accounting at the Graduate School of Business (Emeritus), Stanford University, Director of the Corporate Governance Research Initiative and Senior Faculty of The Rock Center for Corporate Governance since 2006. From 2005 to 2008, Professor of Accounting at the Graduate School of Business, Stanford University. Prior thereto, Ernst & Young Professor of Accounting at The Wharton School, University of Pennsylvania from 1985 to 2005. | N/A |
Allspring VT International Equity Fund | 29
Other information (unaudited)
Name and
year of birth | Position held and
length of service* | Principal occupations during past five years or longer | Current other
public company or
investment
company
directorships |
Olivia S. Mitchell
(Born 1953) | Trustee,
since 2006;
Nominating and
Governance
Committee Chair,
since 2018 | International Foundation of Employee Benefit Plans Professor since 1993, Wharton School of the University of Pennsylvania. Director of Wharton’s Pension Research Council and Boettner Center on Pensions & Retirement Research, and Research Associate at the National Bureau of Economic Research. Previously taught at Cornell University from 1978 to 1993. | N/A |
Timothy J. Penny
(Born 1951) | Trustee,
since 1996;
Chair,
since 2018 | President and Chief Executive Officer of Southern Minnesota Initiative Foundation, a non-profit organization, since 2007. Member of the Board of Trustees of NorthStar Education Finance, Inc., a non-profit organization, since 2007. | N/A |
James G. Polisson
(Born 1959) | Trustee,
since 2018 | Retired. Chief Marketing Officer, Source (ETF) UK Services, Ltd, from 2015 to 2017. From 2012 to 2015, Principal of The Polisson Group, LLC, a management consulting, corporate advisory and principal investing company. Chief Executive Officer and Managing Director at Russell Investments, Global Exchange Traded Funds from 2010 to 2012. Managing Director of Barclays Global Investors from 1998 to 2010 and Global Chief Marketing Officer for iShares and Barclays Global Investors from 2000 to 2010. Trustee of the San Francisco Mechanics’ Institute, a non-profit organization, from 2013 to 2015. Board member of the Russell Exchange Traded Fund Trust from 2011 to 2012. Director of Barclays Global Investors Holdings Deutschland GmbH from 2006 to 2009. Mr. Polisson is an attorney and has a retired status with the Massachusetts and District of Columbia Bar Associations. | N/A |
Pamela Wheelock
(Born 1959) | Trustee,
since January
2020; previously
Trustee from
January 2018 to
July 2019 | Board member of the Destination Medical Center Economic Development Agency, Rochester, Minnesota since 2019. Interim President of the McKnight Foundation from January to September 2020. McKnight Foundation Consultant, November 2020 to February 2021. Acting Commissioner, Minnesota Department of Human Services, July 2019 through September 2019. Consultant (part-time), Minnesota Department of Human Services, October 2019 through December 2019. Chief Operating Officer, Twin Cities Habitat for Humanity from 2017 to 2019. Vice President of University Services, University of Minnesota from 2012 to 2016. Prior thereto, on the Board of Directors, Governance Committee and Finance Committee for the Minnesota Philanthropy Partners (Saint Paul Foundation) from 2012 to 2018, Interim Chief Executive Officer of Blue Cross Blue Shield of Minnesota from 2011 to 2012, Chairman of the Board from 2009 to 2012 and Board Director from 2003 to 2015. Vice President, Leadership and Community Engagement, Bush Foundation, Saint Paul, Minnesota (a private foundation) from 2009 to 2011. Executive Vice President and Chief Financial Officer, Minnesota Sports and Entertainment from 2004 to 2009 and Senior Vice President from 2002 to 2004. Executive Vice President of the Minnesota Wild Foundation from 2004 to 2008. Commissioner of Finance, State of Minnesota, from 1999 to 2002. Currently Board Chair of the Minnesota Wild Foundation since 2010. | N/A |
* Length of service dates reflect the Trustee’s commencement of service with the Trust’s predecessor entities, where applicable.
** Ms. Johnson has resigned from the Board effective December 31, 2021.
30 | Allspring VT International Equity Fund
Other information (unaudited)
Officers2
Name and
year of birth | Position held and
length of service | Principal occupations during past five years or longer |
Andrew Owen
(Born 1960) | President,
since 2017 | President, Chief Executive Officer and Director of Allspring Funds Management, LLC since 2017 and co-president of Galliard Capital Management, LLC, an affiliate of Allspring Funds Management, LLC, since 2019. Prior thereto, Head of Affiliated Managers, Allspring Global Investments, from 2014 to 2019 and Executive Vice President responsible for marketing, investments and product development for Allspring Funds Management, LLC, from 2009 to 2014. In addition, Mr. Owen was an Executive Vice President of Wells Fargo & Company from 2014 to 2021. |
Jeremy DePalma
(Born 1974) | Treasurer,
since 2012
(for certain funds in
the Fund Complex);
since 2021 (for
the remaining funds in the
Fund Complex) | Senior Vice President of Allspring Funds Management, LLC since 2009. Senior Vice President of Evergreen Investment Management Company, LLC from 2008 to 2010 and head of the Fund Reporting and Control Team within Fund Administration. |
Kate McKinley
(Born 1977) | Chief Legal Officer,
since 2021 | Chief Legal Officer of Allspring Global Investments since 2021. Prior thereto, held various roles at State Street Global Advisors beginning in 2010, including serving as Senior Vice President and General Counsel from 2019 to 2021, and Chief Operating Officer of the Institutional Client Group from 2016 - 2019. Prior to working at State Street Global Advisors served as Assistant General Counsel for Bank of America Corporation from 2005 to 2010 and as an Associate at WilmerHale from 2002 to 2005. |
Christopher Baker
(Born 1976) | Chief Compliance Officer, since 2022 | Global Chief Compliance Officer for Allspring Global Investments since 2022. Prior thereto, Chief Compliance Officer for State Street Global Advisors from 2018 to 2021. Senior Compliance Officer for the State Street divisions of Alternative Investment Solutions, Sector Solutions, and Global Marketing from 2015 to 2018. From 2010 to 2015 Vice President, Global Head of Investment and Marketing Compliance for State Street Global Advisors. |
Matthew Prasse
(Born 1983) | Secretary,
since 2021 | Senior Counsel of the Allspring Legal Department since 2021. Senior Counsel of the Wells Fargo Legal Department from 2018 to 2021. Previously, Counsel for Barings LLC from 2015 to 2018. Prior to joining Barings, Associate at Morgan, Lewis & Bockius LLP from 2008 to 2015. |
1 The Statement of Additional Information includes additional information about the Trustees and is available, without charge, upon request, by calling 1-800-222-8222 or by visiting the website at allspringglobal.com.
2 For those Officers with tenures at Allspring Global Investments and/or Allspring Funds Management, LLC that began prior to 2021, such tenures include years of service during which these businesses/entities were known as Wells Fargo Asset Management and Wells Fargo Funds Management, LLC, respectively.
Allspring VT International Equity Fund | 31
For more information
More information about Allspring Funds is available free upon request. To obtain literature, please write, visit the Fund's website, or call:
Allspring Funds
P.O. Box 219967
Kansas City, MO 64121-9967
Website: allspringglobal.com
Individual investors: 1-800-260-5969
Retail investment professionals: 1-888-877-9275
Institutional investment professionals: 1-866-765-0778
This report and the financial statements contained herein are submitted for the general information of the shareholders of the Fund. If this report is used for promotional purposes, distribution of the report must be accompanied or preceded by a current prospectus. Before investing, please consider the investment objectives, risks, charges, and expenses of the investment. For a current prospectus and, if available, a summary prospectus, containing this information, call
1-800-260-5969 or visit the Fund's website at allspringglobal.com. Read the prospectus carefully before you invest or send money.
Allspring Global InvestmentsTM is the trade name for the asset management firms of Allspring Global Investments Holdings, LLC, a holding company indirectly owned by certain private funds of GTCR LLC and Reverence Capital Partners, L.P. These firms include but are not limited to Allspring Global Investments, LLC, and Allspring Funds Management, LLC. Certain products managed by Allspring entities are distributed by Allspring Funds Distributor, LLC (a broker-dealer and Member FINRA/SIPC).
This material is for general informational and educational purposes only and is NOT intended to provide investment advice or a recommendation of any kind - including a recommendation for any specific investment, strategy, or plan.
© 2022 Allspring Global Investments Holdings, LLC. All rights reserved.
PAR-0122-00227 02-22
AVT3/AR149 12-21
Annual Report
December 31, 2021
Allspring
VT Omega Growth Fund
The views expressed and any forward-looking statements are as of December 31, 2021, unless otherwise noted, and are those of the Fund's portfolio managers and/or Allspring Global Investments. Discussions of individual securities or the markets generally are not intended as individual recommendations. Future events or results may vary significantly from those expressed in any forward-looking statements. The views expressed are subject to change at any time in response to changing circumstances in the market. Allspring Global Investments disclaims any obligation to publicly update or revise any views expressed or forward-looking statements.
Allspring VT Omega Growth Fund | 1
Letter to shareholders (unaudited)
Andrew Owen
President
Allspring Funds
Dear Shareholder:
We are pleased to offer you this annual report for the Allspring VT Omega Growth Fund for the 12-month period that ended December 31, 2021. Global stocks yielded mixed results as the global economy continued to emerge from the haze of COVID-19. Tailwinds were provided by global stimulus programs, a rapid vaccination rollout, and recovering consumer and corporate sentiment. Bonds also saw mixed performance during the period.
For the 12-month period, equities had mixed returns as policymakers continued to fight the effects of COVID-19. U.S. stocks led both non-U.S. developed market equities and emerging market stocks. Returns by fixed-income securities were also a mix of positive and negative. For the period, U.S. stocks, based on the S&P 500 Index,1 gained 28.71%. International stocks, as measured by the MSCI ACWI ex USA Index (Net),2 returned 7.82%, while the MSCI EM Index (Net) (USD)3 had weaker performance with a 2.54% loss. Among bond indexes, the Bloomberg U.S. Aggregate Bond Index4 returned -1.54%, the Bloomberg Global Aggregate ex-USD Index (unhedged)5 returned -7.05%, the Bloomberg Municipal Bond Index6 gained 1.52%, and the ICE BofA U.S. High Yield Index7 returned 5.36%.
Efforts to contain COVID-19 drove market performance.
The year 2021 began with emerging market stocks leading all major asset classes in January, driven by China’s strong economic growth and a broad recovery in corporate earnings, which propelled China’s stock market higher. In the U.S., positive news on vaccine trials and January expansion in both the manufacturing and services sectors were offset by a weak December monthly jobs report. This was compounded by technical factors as some hedge funds were forced to sell stocks to protect themselves against a well-publicized short squeeze coordinated by a group of retail investors. Eurozone sentiment and economic growth were particularly weak, reflecting the impact of a new lockdown with stricter social distancing along with a slow vaccine rollout.
February saw major domestic equity indexes driven higher on the hope of a new stimulus bill, improving COVID-19 vaccination numbers, and the gradual reopening of the economy. Most S&P 500 companies reported better-than-expected earnings, with positive surprises coming from the financials, information technology, health care, and materials sectors. Japan saw its economy strengthen as a result of strong export numbers. Meanwhile, crude oil prices continued their climb, rising more than 25% for the year. Domestic government bonds experienced a sharp sell-off in late February as markets priced in a more robust economic recovery and higher future growth and inflation expectations.
| 1 | The S&P 500 Index consists of 500 stocks chosen for market size, liquidity, and industry group representation. It is a market-value-weighted index with each stock's weight in the index proportionate to its market value. You cannot invest directly in an index. |
| 2 | The Morgan Stanley Capital International (MSCI) All Country World Index (ACWI) ex USA Index (Net) is a free-float-adjusted market-capitalization-weighted index that is designed to measure the equity market performance of developed and emerging markets, excluding the U.S. Source: MSCI. MSCI makes no express or implied warranties or representations and shall have no liability whatsoever with respect to any MSCI data contained herein. The MSCI data may not be further redistributed or used as a basis for other indexes or any securities or financial products. This report is not approved, reviewed, or produced by MSCI. You cannot invest directly in an index. |
| 3 | The MSCI Emerging Markets (EM) Index (Net) (USD) is a free-float-adjusted market-capitalization-weighted index that is designed to measure equity market performance of emerging markets. You cannot invest directly in an index. |
| 4 | The Bloomberg U.S. Aggregate Bond Index is a broad-based benchmark that measures the investment-grade, U.S.-dollar-denominated, fixed-rate taxable bond market, including Treasuries, government-related and corporate securities, mortgage-backed securities (agency fixed-rate and hybrid adjustable-rate mortgage pass-throughs), asset-backed securities, and commercial mortgage-backed securities. You cannot invest directly in an index. |
| 5 | The Bloomberg Global Aggregate ex-USD Index (unhedged) is an unmanaged index that provides a broad-based measure of the global investment-grade fixed-income markets excluding the U.S.-dollar-denominated debt market. You cannot invest directly in an index. |
| 6 | The Bloomberg Municipal Bond Index is an unmanaged index composed of long-term tax-exempt bonds with a minimum credit rating of Baa. You cannot invest directly in an index. |
| 7 | The ICE BofA U.S. High Yield Index is a market-capitalization-weighted index of domestic and Yankee high-yield bonds. The index tracks the performance of high-yield securities traded in the U.S. bond market. You cannot invest directly in an index. Copyright 2022. ICE Data Indices, LLC. All rights reserved. |
2 | Allspring VT Omega Growth Fund
Letter to shareholders (unaudited)
The passage of the massive domestic stimulus bill highlighted March activity, leading to increased forecasts for U.S. growth in 2021. Domestic employment surged as COVID-19 vaccinations and an increasingly open economy spurred hiring. A majority of U.S. small companies reported they were operating at pre-pandemic capacity or higher. Value stocks continued their outperformance of growth stocks in the month, continuing the trend that started in late 2020. Meanwhile, most major developed global equity indexes were up month to date on the back of rising optimism regarding the outlook for global growth. While the U.S. and the U.K. have been the most successful in terms of the vaccine rollout, even in markets where the vaccine has lagged, such as in the eurozone and Japan, equity indexes in many of those countries have also been in positive territory for the year through March 2021.
Equity markets produced another strong showing in April. Domestically, the continued reopening of the economy had a strong impact on positive equity performance, as people started leaving their households and jobless claims continued to fall. Domestic corporate bonds performed well and the U.S. dollar weakened. Meanwhile, the U.S. government continued to seek to invest in the recovery, this time by outlining a package of over $2 trillion to improve infrastructure. The primary headwind in April was inflation, as investors tried to determine the breadth and longevity of recent price increases. Developed Europe has been supported by a meaningful increase in the pace of vaccinations. Unfortunately many emerging market countries have not been as successful. India in particular saw COVID-19 cases surge, serving as an example of the need to get vaccinations rolled out to less developed nations.
Vaccine rollouts continued in May, leading to loosened restrictions globally. As a result, equity markets in general saw a minor increase in returns. Concerns that the continued economic rebound could result in inflation increases becoming more than transitory were supported by the higher input costs businesses were experiencing. Meanwhile, those inflation concerns were tempered by the U.S. Federal Reserve (Fed), which stayed steady on its view of the economy and eased fears of a sudden and substantial policy change. Positive performance in the emerging market equity space was supported this month by steady consumer demand and strong commodity prices. Fixed-income markets were also slightly positive for the month, driven by inflation uncertainty and a softer U.S. dollar.
June witnessed the S&P 500 Index reach a new all-time high. 2021 economic growth and inflation forecasts were revised higher to reflect a strong economic recovery and some supply and demand imbalances. Late June saw a deal reached on a U.S. infrastructure package of approximately $1 trillion for road, bridge, and broadband network upgrades over the next eight years. The Fed’s June meeting yielded no change to policy, but its projections pointed to a possible interest rate rise in 2023. This, combined with a rebound in economic activity and investors searching for yield, led to U.S. Treasury yields being down for the month. Many European and Asian countries saw vaccination momentum increase, while the U.K. dealt with a rise in COVID-19 infections, specifically the Delta variant. Meanwhile, crude oil jumped over 10% in June on the back of the pickup in global economic activity and the Organization of the Petroleum Exporting Countries’ (OPEC) slow pace of supply growth.
July began the month seeing vaccinations making progress, as several major developed countries eased restrictions, only to be threatened again by the spread of COVID-19’s Delta variant. Inflation continued to climb, aided by the continued supply bottleneck in the face of high demand. As it pertains to the equity area of the market, U.S. equities led the way in positive return territory followed by international developed markets. In contrast, emerging markets were well in negative territory for the month, hindered by China’s plans for new regulations on a number of sectors, specifically education and technology. The U.S. 10-year Treasury bond yield continued to decline as strong demand swallowed up supply. After hitting a multiyear high earlier in the month, oil prices leveled off following an agreement by OPEC to raise oil production starting in August.
Allspring VT Omega Growth Fund | 3
Letter to shareholders (unaudited)
“ Municipal debt experienced its first monthly performance drop since February of this year, slowing a rally that made it one of the best-performing sectors of the bond market.” |
The Delta variant of COVID-19 produced outbreaks globally in August, increasing the potential for increased market volatility and bringing into question the ongoing economic recovery. Domestically, the U.S. economy continued to stay strong in the face of the Delta variant, continued inflationary pressures, and worries over Hurricane Ida. Emerging market equities experienced elevated volatility, largely influenced by China’s regulatory stance. Emerging market equities started the month with poor performance but rebounded to end the month in positive territory. Municipal debt experienced its first monthly performance drop since February of this year, slowing a rally that made it one of the best-performing sectors of the bond market. In the commodity segment of the market, crude oil fell sharply during the month on the back of dampened expectations as a result of the Delta variant but was still a leading asset-class performer for the year.
Global markets suffered their broadest retreat in a year during September, with the exception of commodities. Concerns over inflation and the interest rate outlook depressed investor confidence and hurt performance. Emerging markets declined on concerns over the continued supply chain disruptions and worries over higher energy and food prices. Meanwhile, the Fed indicated it would slow the pace of asset purchases in the near future (pointing towards November). All eyes domestically are fixed on the raising of the debt ceiling, the 2022 budget plan, and the ongoing debate over the infrastructure package. Contrary to most asset classes, commodities thrived in September, driven by sharply higher energy prices.
October’s key themes continued to be elevated inflation pressures and a supply bottleneck, but strong earnings provided a bright spot in the markets. Earnings releases in the U.S. were generally strong and consumer confidence was high. The Fed reaffirmed its plans to taper quantitative easing to a stop by mid-2022. Meanwhile, elevated inflation figures were considered transitory by the Fed. Similar to the U.S., the eurozone and many Asian countries saw positive earnings but were facing inflation pressures caused by supply bottlenecks while also experiencing energy price increases amid natural gas shortages. Globally, government bond yields rose as central banks prepared to lower monetary policy accommodation in the face of rising inflationary pressures. As previously referenced, positive commodity performance was driven by sharply higher energy costs.
November was dominated by rising COVID-19 hospitalizations and concerns regarding the Omicron variant. Most major asset classes, both domestically and internationally, declined in November with two exceptions: U.S. investment-grade bonds and Treasury Inflation-Protected Securities. The United Nations Climate Change Conference (COP26) took place during the month with hopes of agreement among countries to limit global warming. While several initiatives were discussed, the conference ultimately ended without the specifics required to instill confidence that the limiting of global warming would succeed. In the U.S., President Biden signed a long-awaited infrastructure bill to upgrade U.S. roads, bridges, and railways. Meanwhile, the Consumer Price Index1, a measure of domestic inflation conditions, jumped to its highest level in 31 years. While the threat of consistently high inflation led the Fed to discuss a faster pace of tapering, the Omicron strain makes that less likely to occur. Commodities came in negative for the month, largely driven by sharp declines in oil prices (and energy costs in general) as well as precious metals.
Global volatility in December lessened as data indicated a lower risk of severe disease and death as a result of the Omicron variant. Even so, a number of countries introduced restrictions on sectors such as travel and hospitality to try to reduce the spread. In the U.S., data indicated that the overall domestic economy remains stable and corporate earnings remain robust. Consumer spending capability looks strong heading into 2022 on the back of elevated household savings and the lowest ratio of U.S. household liabilities to assets since 1973. U.S. corporate and high-yield bonds produced positive returns for the month while Treasuries declined. Bonds were strongly affected by the projection of three 25-basis-point (bp; 100 bps equal 1.00%) policy rate hikes in 2022 by senior Federal Open Market Committee members, contrary to just one hike as previously believed.
“ Bonds were strongly affected by the projection of three 25-basis-point (bp; 100 bps equal 1.00%) policy rate hikes in 2022 by senior Federal Open Market Committee members, contrary to just one hike as previously believed.”
| 1 | The Consumer Price Index (CPI) is a measure of the average change over time in the prices paid by urban consumers for a market basket of consumer goods and services. You cannot invest directly in an index. |
4 | Allspring VT Omega Growth Fund
Letter to shareholders (unaudited)
Don’t let short-term uncertainty derail long-term investment goals.
Periods of investment uncertainty can present challenges, but experience has taught us that maintaining long-term investment goals can be an effective way to plan for the future. To help you create a sound strategy based on your personal goals and risk tolerance, Allspring Funds offers more than 100 mutual funds spanning a wide range of asset classes and investment styles. Although diversification cannot guarantee an investment profit or prevent losses, we believe it can be an effective way to manage investment risk and potentially smooth out overall portfolio performance. We encourage investors to know their investments and to understand that appropriate levels of risk-taking may unlock opportunities.
Information on transaction closing.
On November 1, 2021, GTCR LLC and Reverence Capital Partners, L.P., announced the beginning of Allspring Global Investments™, with the close of the transaction to acquire Wells Fargo Funds Management, LLC; Wells Capital Management, LLC; Galliard Capital Management, LLC.; Wells Fargo Asset Management (International) Ltd.; Wells Fargo Asset Management Luxembourg S.A.; and Wells Fargo Funds Distributor, LLC, as well as Wells Fargo Bank, N.A.’s business of acting as trustee to its collective investment trusts and all related Wells Fargo Asset Management legal entities. The transaction closed on November 1, 2021, forming Allspring Global Investments, a privately held asset management firm with $575 billion in AUM1 as of December 31, 2021.
Allspring Global Investments™ is a leading independent asset management firm with a full breadth of investment capabilities across diverse asset classes, serving the needs of its institutional and wealth management clients around the world. Allspring operates across 18 offices globally supported by more than 480 investment professionals. Allspring and its investment teams provide a broad range of differentiated investment products and solutions to help its diverse range of clients meet their investment objectives.
As part of this transition, all mutual funds within the Wells Fargo Funds family were rebranded as Allspring Funds. Each individual fund had “Wells Fargo” removed from its fund name and replaced with “Allspring.” The fund name changes went into effect on December 6, 2021.
Allspring Global Investments is the trade name for the asset management firms of Allspring Global Investments Holdings, LLC, a holding company indirectly owned by certain private funds of GTCR LLC and Reverence Capital Partners, L.P.
Thank you for choosing to invest with Allspring Funds. We appreciate your confidence in us and remain committed to helping you meet your financial needs.
Sincerely,
Andrew Owen
President
Allspring Funds
For further information about your Fund, contact your investment professional, visit our website at allspringglobal.com, or call us directly at 1-800-222-8222.
| 1 | As of December 31, 2021, assets under management (AUM) includes $91.6 billion from Galliard Capital Management, LLC, an investment advisor that is not part of the Allspring trade name/GIPS firm. |
Allspring VT Omega Growth Fund | 5
Performance highlights (unaudited)
| Investment objective | The Fund seeks long-term capital appreciation. |
| Manager | Allspring Funds Management, LLC |
| Subadviser | Allspring Global Investments, LLC |
| Portfolio managers | Michael T. Smith, CFA®‡, Christopher J. Warner, CFA®‡ |
| Average annual total returns (%) as of December 31, 2021 |
| | | | | | Expense ratios1 (%) |
| | Inception date | 1 year | 5 year | 10 year | Gross | Net 2 |
| Class 1 | 3-6-1997 | 15.27 | 25.24 | 18.72 | 0.81 | 0.76 |
| Class 2 | 7-31-2002 | 14.97 | 24.94 | 18.43 | 1.06 | 1.01 |
| Russell 3000® Growth Index3 | – | 25.85 | 24.56 | 19.39 | – | – |
| 1 | Reflects the expense ratios as stated in the most recent prospectuses, which include the impact of 0.01% in acquired fund fees and expenses. The expense ratios shown are subject to change and may differ from the annualized expense ratios shown in the financial highlights of this report, which do not include acquired fund fees and expenses. |
| 2 | The manager has contractually committed through April 30, 2022, to waive fees and/or reimburse expenses to the extent necessary to cap total annual fund operating expenses after fee waivers at 0.75% for Class 1 shares and 1.00% for Class 2 shares. Brokerage commissions, stamp duty fees, interest, taxes, acquired fund fees and expenses (if any), and extraordinary expenses are excluded from the expense caps. Prior to or after the commitment expiration date, the caps may be increased or the commitment to maintain the caps may be terminated only with the approval of the Board of Trustees. Without these caps, the Fund’s returns would have been lower. The expense ratio paid by an investor is the net expense ratio (the total annual fund operating expenses after fee waivers) as stated in the prospectuses. |
| 3 | The Russell 3000® Growth Index measures the performance of those Russell 3000 ® Index companies with higher price/book ratios and higher forecasted growth values. You cannot invest directly in an index. |
Figures quoted represent past performance, which is no guarantee of future results. Investment return and principal value of an investment will fluctuate so that an investor’s shares, when redeemed, may be worth more or less than their original cost. Current performance may be lower or higher than the performance data quoted and assumes the reinvestment of dividends and capital gains. Current month-end performance is available by calling 1-800-260-5969. Performance figures of the Fund do not reflect fees and expenses charged pursuant to the terms of variable life insurance policies and variable annuity contracts. If these fees and expenses had been reflected, performance would have been lower.
Index returns do not include transaction costs associated with buying and selling securities, any mutual fund fees or expenses, or any taxes. It is not possible to invest directly in an index.
Shares are sold without a front-end sales charge or contingent deferred sales charge.
Stock values fluctuate in response to the activities of individual companies and general market and economic conditions. Certain investment strategies tend to increase the total risk of an investment (relative to the broader market). Foreign investments are especially volatile and can rise or fall dramatically due to differences in the political and economic conditions of the host country. These risks are generally intensified in emerging markets. This fund is exposed to smaller-company securities risk. Consult the Fund’s prospectus for additional information on these and other risks.
Please refer to the prospectus provided by your participating insurance company for detailed information describing the separate accounts for information regarding surrender charges, mortality and expense risk fees, and other charges that may be assessed by the participating insurance companies.
| ‡ | CFA® and Chartered Financial Analyst® are trademarks owned by CFA Institute. |
6 | Allspring VT Omega Growth Fund
Performance highlights (unaudited)
Growth of $10,000 investment as of December 31, 20211
| 1 | The chart compares the performance of Class 2 shares for the most recent ten years with the Russell 3000® Growth Index. The chart assumes a hypothetical investment of $10,000 in Class 2 shares and reflects all operating expenses of the Fund but does not reflect fees and expenses charged pursuant to the terms of variable life insurance policies and variable annuity contracts. |
Allspring VT Omega Growth Fund | 7
Performance highlights (unaudited)
MANAGER'S DISCUSSION
Fund highlights
| ■ | The Fund underperformed its benchmark, the Russell 3000® Growth Index, for the 12-month period that ended December 31, 2021. |
| ■ | Stock selection within the information technology (IT) and consumer discretionary sectors detracted from relative performance. |
| ■ | Non-ownership of several mega-cap companies detracted meaningfully from performance. |
| ■ | Security selection in the industrials sector, along with several IT holdings, contributed to the Fund’s results. |
From pandemic to reflation to caution.
For much of the past year, the U.S. economy experienced a sharp recovery fueled by optimism over the COVID-19 vaccine, the reopening of global economies, and a high level of policy stimulus. Within U.S. equities, leadership was tilted towards cyclicals and interest rate sensitive securities as long-term interest rates and inflation expectations spiked upward.
Later in the year, however, this exuberance dissipated as variants of COVID-19 emerged and renewed fears of global shutdowns. Labor shortages and supply chain constraints contributed to persistently high inflation and brought about hawkish signaling by the U.S. Federal Reserve Board, which announced that tapering of asset purchases would begin imminently. This triggered a rise in Treasury yields and contributed to a high level of overall market volatility as the year came to an end.
Despite the heightened volatility, we did not significantly reposition the Fund. Our investment process has long focused on companies harnessing innovation to create superior long-term growth. The Fund remains positioned toward companies that we believe are situated on the right side of change.
| Ten largest holdings (%) as of December 31, 20211 |
| Microsoft Corporation | 9.80 |
| Amazon.com Incorporated | 7.79 |
| Alphabet Incorporated Class A | 5.72 |
| Visa Incorporated Class A | 3.04 |
| The Home Depot Incorporated | 2.84 |
| UnitedHealth Group Incorporated | 2.49 |
| Intuitive Surgical Incorporated | 2.26 |
| MongoDB Incorporated | 2.09 |
| Spotify Technology | 2.06 |
| ServiceNow Incorporated | 2.04 |
| 1 | Figures represent the percentage of the Fund's net assets. Holdings are subject to change and may have changed since the date specified. |
Security selection within the consumer discretionary and communication services sectors detracted from returns.
Within consumer discretionary, MercadoLibre, Incorporated, is the leading e-commerce and online payment solution within Latin America. During the year, shares were negatively affected by labor shortages, supply chain constraints, and high inflation rates in Brazil. A staple in the Latin American marketplace, we believe the company will overcome these near-term headwinds.
In communication services, investors expressed concerns over the ability of Spotify Technology S.A. to retain and build upon the high levels of subscription growth the company experienced during the pandemic. With an evolving digital experience, we hold conviction in Spotify’s long-term outlook.
Additionally, non-ownership of three mega-cap companies—Apple Incorporated; Tesla, Incorporated; and NVIDIA Corporation—significantly detracted from relative performance. Our investment process focuses on companies whose growth is sustainable over the long term, along with a favorable risk/reward profile. Relative to underlying fundamentals, we believe current valuations of these companies are unattractive.
Select holdings within the IT sector contributed to relative performance.
While the overall IT sector detracted from returns, several IT companies meaningfully outperformed during the year. EPAM Systems, Incorporated, provides solutions for the global shortage of software developers by sourcing highly talented programmers across the globe. After adding meaningfully to its staff of skilled engineers, demand for EPAM’s network has continued to exceed supply, allowing the company to be more selective in which projects it accepts and to command pricing power. Demand for EPAM’s services will remain strong as new technologies compel companies to further invest in digital transformation.
8 | Allspring VT Omega Growth Fund
Performance highlights (unaudited)
Atlassian Corporation PLC provides a full suite of tools designed to increase software-developer efficiency, manage workflows, and centralize documentation. During the year, Atlassian reported significant growth in new client relationships and subscription revenue. As software becomes integrated into every business, the need for developer tools and flexible support will only grow, perpetuating demand for Atlassian’s innovative cloud-based solutions.
| Sector allocation as of December 31, 20211 |
| 1 | Figures represent the percentage of the Fund's long-term investments. These amounts are subject to change and may have changed since the date specified. |
Disruption created compelling long-term opportunities.
Over the past year, market sentiment has wavered violently as investors grappled with when the world will fully emerge from the pandemic. These rotations have been primarily fueled by macro headlines and have shifted leadership generally toward cyclical industries. It is our experience that attempting to time such short-term macro rotations is not a way to deliver consistent long-term performance.
As investors focused on innovation and disruption, we look for companies that can compound growth well beyond the current “trade.” It is our experience that fundamentals—not narratives—are truly what drive stock prices in the long run. By emphasizing companies on the “right side of change,” we are well positioned to take advantage of the massive shift from internet technologies and cloud computing, which are still in the early stages of mass adoption.
As the economy and inflation ultimately cool down, disruptive growth stocks should be rewarded with premium valuations deserving of their scarce attributes. Deep fundamental research is needed to identify who is winning and losing in a world of rapid disruption. While we anticipate that inflationary pressures, taper talks, and supply chains will continue to influence sentiment over the next year, we remain confident that “right side of change” companies will generate long-term superior returns for our clients.
Allspring VT Omega Growth Fund | 9
Fund expenses (unaudited)
As a shareholder of the Fund, you incur ongoing costs, including management fees, distribution (12b-1) fees, and other Fund expenses. This example is intended to help you understand your ongoing costs (in dollars) of investing in the Fund and to compare these costs with the ongoing costs of investing in other mutual funds.
The example is based on an investment of $1,000 invested at the beginning of the six-month period and held for the entire period from July 1, 2021 to December 31, 2021.
Actual expenses
The “Actual” line of the table below provides information about actual account values and actual expenses. You may use the information in this line, together with the amount you invested, to estimate the expenses that you paid over the period. Simply divide your account value by $1,000 (for example, an $8,600 account value divided by $1,000 = 8.6), then multiply the result by the number in the “Actual” line under the heading entitled “Expenses paid during period” for your applicable class of shares to estimate the expenses you paid on your account during this period.
Hypothetical example for comparison purposes
The “Hypothetical” line of the table below provides information about hypothetical account values and hypothetical expenses based on the Fund’s actual expense ratio and an assumed rate of return of 5% per year before expenses, which is not the Fund’s actual return. The hypothetical account values and expenses may not be used to estimate the actual ending account balance or expenses you paid for the period. You may use this information to compare the ongoing costs of investing in the Fund and other funds. To do so, compare this 5% hypothetical example with the 5% hypothetical examples that appear in the shareholder reports of the other funds.
Please note that the expenses shown in the table are meant to highlight your ongoing costs only and do not reflect any separate account charges assessed by participating insurance companies. Therefore, the “Hypothetical” line of the table is useful in comparing ongoing costs only, and will not help you determine the relative total costs of owning different funds. In addition, if these separate account charges assessed by participating insurance companies were included, your costs would have been higher.
| | Beginning
account value
7-1-2021 | Ending
account value
12-31-2021 | Expenses
paid during
the period1 | Annualized net
expense ratio |
| Class 1 | | | | |
| Actual | $1,000.00 | $1,051.03 | $3.88 | 0.75% |
| Hypothetical (5% return before expenses) | $1,000.00 | $1,021.42 | $3.82 | 0.75% |
| Class 2 | | | | |
| Actual | $1,000.00 | $1,049.77 | $5.17 | 1.00% |
| Hypothetical (5% return before expenses) | $1,000.00 | $1,020.16 | $5.09 | 1.00% |
1 Expenses paid is equal to the annualized net expense ratio of each class multiplied by the average account value over the period, multiplied by the number of days in the most recent fiscal half-year divided by the number of days in the fiscal year (to reflect the one-half-year period).
10 | Allspring VT Omega Growth Fund
Portfolio of investments—December 31, 2021
| | | | | Shares | Value |
| Common stocks: 99.09% | | | | | |
| Communication services: 13.71% | | | | | |
| Entertainment: 4.79% | | | | | |
| Netflix Incorporated † | | | | 3,300 | $ 1,988,052 |
| Roku Incorporated † | | | | 4,300 | 981,260 |
| Spotify Technology † | | | | 9,600 | 2,246,688 |
| | | | | | 5,216,000 |
| Interactive media & services: 8.92% | | | | | |
| Alphabet Incorporated Class A † | | | | 2,150 | 6,228,636 |
| Alphabet Incorporated Class C † | | | | 194 | 561,356 |
| Match Group Incorporated † | | | | 13,687 | 1,810,106 |
| ZoomInfo Technologies Incorporated † | | | | 17,200 | 1,104,240 |
| | | | | | 9,704,338 |
| Consumer discretionary: 18.06% | | | | | |
| Auto components: 1.30% | | | | | |
| Aptiv plc † | | | | 8,600 | 1,418,570 |
| Automobiles: 1.21% | | | | | |
| Ferrari NV | | | | 5,100 | 1,319,982 |
| Hotels, restaurants & leisure: 2.01% | | | | | |
| Chipotle Mexican Grill Incorporated † | | | | 1,250 | 2,185,313 |
| Internet & direct marketing retail: 10.70% | | | | | |
| Amazon.com Incorporated † | | | | 2,542 | 8,475,892 |
| Doordash Incorporated † | | | | 8,900 | 1,325,210 |
| MercadoLibre Incorporated † | | | | 1,363 | 1,837,869 |
| | | | | | 11,638,971 |
| Specialty retail: 2.84% | | | | | |
| The Home Depot Incorporated | | | | 7,451 | 3,092,240 |
| Financials: 2.73% | | | | | |
| Capital markets: 2.73% | | | | | |
| Intercontinental Exchange Incorporated | | | | 12,400 | 1,695,948 |
| MarketAxess Holdings Incorporated | | | | 3,099 | 1,274,526 |
| | | | | | 2,970,474 |
| Health care: 14.43% | | | | | |
| Biotechnology: 0.63% | | | | | |
| Natera Incorporated † | | | | 7,400 | 691,086 |
| Health care equipment & supplies: 9.32% | | | | | |
| ABIOMED Incorporated † | | | | 2,900 | 1,041,593 |
| Align Technology Incorporated † | | | | 3,100 | 2,037,258 |
| DexCom Incorporated † | | | | 4,000 | 2,147,800 |
| Edwards Lifesciences Corporation † | | | | 11,000 | 1,425,050 |
| Inari Medical Incorporated † | | | | 11,300 | 1,031,351 |
| Intuitive Surgical Incorporated † | | | | 6,840 | 2,457,612 |
| | | | | | 10,140,664 |
The accompanying notes are an integral part of these financial statements.
Allspring VT Omega Growth Fund | 11
Portfolio of investments—December 31, 2021
| | | | | Shares | Value |
| Health care providers & services: 2.49% | | | | | |
| UnitedHealth Group Incorporated | | | | 5,396 | $ 2,709,547 |
| Health care technology: 1.99% | | | | | |
| Doximity Incorporated Class A †« | | | | 16,108 | 807,494 |
| Veeva Systems Incorporated Class A † | | | | 5,300 | 1,354,044 |
| | | | | | 2,161,538 |
| Industrials: 4.93% | | | | | |
| Commercial services & supplies: 1.58% | | | | | |
| Waste Connections Incorporated | | | | 12,646 | 1,723,270 |
| Professional services: 1.66% | | | | | |
| Equifax Incorporated | | | | 6,150 | 1,800,659 |
| Road & rail: 1.69% | | | | | |
| Union Pacific Corporation | | | | 7,300 | 1,839,089 |
| Information technology: 43.24% | | | | | |
| Communications equipment: 1.62% | | | | | |
| Motorola Solutions Incorporated | | | | 6,500 | 1,766,050 |
| Electronic equipment, instruments & components: 3.92% | | | | | |
| Cognex Corporation | | | | 14,700 | 1,143,072 |
| Teledyne Technologies Incorporated † | | | | 3,200 | 1,398,048 |
| Zebra Technologies Corporation Class A † | | | | 2,900 | 1,726,080 |
| | | | | | 4,267,200 |
| IT services: 15.53% | | | | | |
| Adyen NV ADR † | | | | 38,800 | 1,021,216 |
| Block Incorporated † | | | | 10,382 | 1,676,797 |
| EPAM Systems Incorporated † | | | | 2,815 | 1,881,687 |
| Fiserv Incorporated † | | | | 13,560 | 1,407,392 |
| MongoDB Incorporated † | | | | 4,300 | 2,276,205 |
| PayPal Holdings Incorporated † | | | | 10,841 | 2,044,396 |
| Shopify Incorporated Class A † | | | | 1,050 | 1,446,260 |
| Snowflake Incorporated Class A † | | | | 3,100 | 1,050,125 |
| Twilio Incorporated Class A † | | | | 3,000 | 790,020 |
| Visa Incorporated Class A | | | | 15,290 | 3,313,496 |
| | | | | | 16,907,594 |
| Software: 22.17% | | | | | |
| Atlassian Corporation plc Class A † | | | | 4,593 | 1,751,265 |
| Autodesk Incorporated † | | | | 5,100 | 1,434,069 |
| Bill.com Holdings Incorporated † | | | | 3,800 | 946,770 |
| Black Knight Incorporated † | | | | 20,400 | 1,690,956 |
| Cadence Design Systems Incorporated † | | | | 11,500 | 2,143,025 |
| Crowdstrike Holdings Incorporated Class A † | | | | 4,900 | 1,003,275 |
| Datadog Incorporated Class A † | | | | 6,700 | 1,193,337 |
| Microsoft Corporation | | | | 31,723 | 10,669,079 |
| ServiceNow Incorporated † | | | | 3,410 | 2,213,465 |
| Unity Software Incorporated † | | | | 7,562 | 1,081,290 |
| | | | | | 24,126,531 |
The accompanying notes are an integral part of these financial statements.
12 | Allspring VT Omega Growth Fund
Portfolio of investments—December 31, 2021
| | | | | Shares | Value |
| Materials: 1.99% | | | | | |
| Chemicals: 1.99% | | | | | |
| The Sherwin-Williams Company | | | | 6,170 | $ 2,172,827 |
| Total Common stocks (Cost $44,894,604) | | | | | 107,851,943 |
| | | Yield | | | |
| Short-term investments: 1.62% | | | | | |
| Investment companies: 1.62% | | | | | |
| Allspring Government Money Market Fund Select Class ♠∞ | | 0.03% | | 1,155,987 | 1,155,987 |
| Securities Lending Cash Investments LLC ♠∩∞ | | 0.07 | | 606,100 | 606,100 |
| Total Short-term investments (Cost $1,762,087) | | | | | 1,762,087 |
| Total investments in securities (Cost $46,656,691) | 100.71% | | | | 109,614,030 |
| Other assets and liabilities, net | (0.71) | | | | (776,705) |
| Total net assets | 100.00% | | | | $108,837,325 |
| † | Non-income-earning security |
| « | All or a portion of this security is on loan. |
| ♠ | The issuer of the security is an affiliated person of the Fund as defined in the Investment Company Act of 1940. |
| ∩ | The investment is a non-registered investment company purchased with cash collateral received from securities on loan. |
| ∞ | The rate represents the 7-day annualized yield at period end. |
| Abbreviations: |
| ADR | American depositary receipt |
Investments in affiliates
An affiliated investment is an investment in which the Fund owns at least 5% of the outstanding voting shares of the issuer or as a result of other relationships, such as the Fund and the issuer having the same investment manager. Transactions with issuers that were either affiliates of the Fund at the beginning of the period or the end of the period were as follows:
| | Value,
beginning of
period | Purchases | Sales
proceeds | Net
realized
gains
(losses) | | Net
change in
unrealized
gains
(losses) | | Value,
end of
period | Shares,
end
of period | Income
from
affiliated
securities |
| Short-term investments | | | | | | | | | |
| Allspring Government Money Market Fund Select Class | $ 206,090 | $24,220,921 | $(23,271,024) | $0 | | $0 | | $ 1,155,987 | 1,155,987 | $305 |
| Securities Lending Cash Investments LLC | 1,315,192 | 11,640,812 | (12,349,904) | 0 | | 0 | | 606,100 | 606,100 | 329 # |
| | | | | $0 | | $0 | | $1,762,087 | | $634 |
| # | Amount shown represents income before fees and rebates. |
The accompanying notes are an integral part of these financial statements.
Allspring VT Omega Growth Fund | 13
Statement of assets and liabilities—December 31, 2021
| | |
| Assets | |
Investments in unaffiliated securities (including $581,508 of securities loaned), at value (cost $44,894,604)
| $ 107,851,943 |
Investments in affiliated securities, at value (cost $1,762,087)
| 1,762,087 |
Receivable for dividends
| 7,168 |
Receivable for Fund shares sold
| 3,431 |
Receivable for securities lending income, net
| 149 |
Prepaid expenses and other assets
| 1,559 |
Total assets
| 109,626,337 |
| Liabilities | |
Payable upon receipt of securities loaned
| 606,100 |
Payable for Fund shares redeemed
| 94,248 |
Management fee payable
| 56,685 |
Distribution fee payable
| 12,480 |
Administration fees payable
| 7,822 |
Trustees’ fees and expenses payable
| 2,076 |
Accrued expenses and other liabilities
| 9,601 |
Total liabilities
| 789,012 |
Total net assets
| $108,837,325 |
| Net assets consist of | |
Paid-in capital
| $ 29,554,289 |
Total distributable earnings
| 79,283,036 |
Total net assets
| $108,837,325 |
| Computation of net asset value per share | |
Net assets – Class 1
| $ 48,949,044 |
Shares outstanding – Class 11
| 1,120,212 |
Net asset value per share – Class 1
| $43.70 |
Net assets – Class 2
| $ 59,888,281 |
Shares outstanding – Class 21
| 1,436,516 |
Net asset value per share – Class 2
| $41.69 |
| 1 | The Fund has an unlimited number of authorized shares. |
The accompanying notes are an integral part of these financial statements.
14 | Allspring VT Omega Growth Fund
Statement of operations—year ended December 31, 2021
| | |
| Investment income | |
Dividends (net of foreign withholdings taxes of $3,357)
| $ 351,049 |
Income from affiliated securities
| 4,177 |
Total investment income
| 355,226 |
| Expenses | |
Management fee
| 657,670 |
| Administration fees | |
Class 1
| 40,061 |
Class 2
| 47,628 |
| Distribution fee | |
Class 2
| 139,586 |
Custody and accounting fees
| 12,849 |
Professional fees
| 55,530 |
Shareholder report expenses
| 21,989 |
Trustees’ fees and expenses
| 19,219 |
Other fees and expenses
| 4,553 |
Total expenses
| 999,085 |
| Less: Fee waivers and/or expense reimbursements | |
Fund-level
| (23,394) |
Class 1
| (5,021) |
Net expenses
| 970,670 |
Net investment loss
| (615,444) |
| Realized and unrealized gains (losses) on investments | |
Net realized gains on investments
| 16,445,379 |
Net change in unrealized gains (losses) on investments
| (345,019) |
Net realized and unrealized gains (losses) on investments
| 16,100,360 |
Net increase in net assets resulting from operations
| $15,484,916 |
The accompanying notes are an integral part of these financial statements.
Allspring VT Omega Growth Fund | 15
Statement of changes in net assets
| | | | | |
| | Year ended
December 31, 2021 | Year ended
December 31, 2020 |
| Operations | | | | |
Net investment loss
| | $ (615,444) | | $ (384,959) |
Net realized gains on investments
| | 16,445,379 | | 11,840,097 |
Net change in unrealized gains (losses) on investments
| | (345,019) | | 23,208,430 |
Net increase in net assets resulting from operations
| | 15,484,916 | | 34,663,568 |
| Distributions to shareholders from | | | | |
| Net investment income and net realized gains | | | | |
Class 1
| | (5,286,804) | | (3,187,408) |
Class 2
| | (6,226,350) | | (4,101,867) |
Total distributions to shareholders
| | (11,513,154) | | (7,289,275) |
| Capital share transactions | Shares | | Shares | |
| Proceeds from shares sold | | | | |
Class 1
| 39,946 | 1,745,185 | 76,567 | 2,678,319 |
Class 2
| 78,152 | 3,228,891 | 102,999 | 3,489,523 |
| | | 4,974,076 | | 6,167,842 |
| Reinvestment of distributions | | | | |
Class 1
| 126,388 | 5,286,804 | 92,792 | 3,187,408 |
Class 2
| 155,815 | 6,226,350 | 124,829 | 4,101,867 |
| | | 11,513,154 | | 7,289,275 |
| Payment for shares redeemed | | | | |
Class 1
| (231,730) | (10,127,284) | (238,236) | (7,901,466) |
Class 2
| (228,150) | (9,466,450) | (461,624) | (15,801,257) |
| | | (19,593,734) | | (23,702,723) |
Net decrease in net assets resulting from capital share transactions
| | (3,106,504) | | (10,245,606) |
Total increase in net assets
| | 865,258 | | 17,128,687 |
| Net assets | | | | |
Beginning of period
| | 107,972,067 | | 90,843,380 |
End of period
| | $108,837,325 | | $107,972,067 |
The accompanying notes are an integral part of these financial statements.
16 | Allspring VT Omega Growth Fund
Financial highlights
(For a share outstanding throughout each period)
| | Year ended December 31 |
| Class 1 | 2021 | 2020 | 2019 | 2018 | 2017 |
Net asset value, beginning of period
| $42.28 | $31.89 | $26.27 | $28.99 | $22.20 |
Net investment loss
| (0.19) 1 | (0.07) | (0.03) 1 | (0.03) 1 | (0.02) 1 |
Net realized and unrealized gains (losses) on investments
| 6.43 | 13.27 | 9.69 | 0.62 | 7.68 |
Total from investment operations
| 6.24 | 13.20 | 9.66 | 0.59 | 7.66 |
| Distributions to shareholders from | | | | | |
Net investment income
| 0.00 | 0.00 | 0.00 | 0.00 | (0.06) |
Net realized gains
| (4.82) | (2.81) | (4.04) | (3.31) | (0.81) |
Total distributions to shareholders
| (4.82) | (2.81) | (4.04) | (3.31) | (0.87) |
Net asset value, end of period
| $43.70 | $42.28 | $31.89 | $26.27 | $28.99 |
Total return2
| 15.27% | 43.41% | 37.39% | 0.52% | 34.95% |
| Ratios to average net assets (annualized) | | | | | |
Gross expenses
| 0.78% | 0.80% | 0.82% | 0.81% | 0.82% |
Net expenses
| 0.75% | 0.75% | 0.75% | 0.75% | 0.75% |
Net investment loss
| (0.43)% | (0.27)% | (0.08)% | (0.10)% | (0.07)% |
| Supplemental data | | | | | |
Portfolio turnover rate
| 25% | 24% | 31% | 46% | 67% |
Net assets, end of period (000s omitted)
| $48,949 | $50,122 | $40,001 | $33,043 | $38,687 |
| 1 | Calculated based upon average shares outstanding |
| 2 | Returns do not reflect fees and expenses charged pursuant to the terms of variable life insurance policies and variable annuity contracts. |
The accompanying notes are an integral part of these financial statements.
Allspring VT Omega Growth Fund | 17
Financial highlights
(For a share outstanding throughout each period)
| | Year ended December 31 |
| Class 2 | 2021 | 2020 | 2019 | 2018 | 2017 |
Net asset value, beginning of period
| $40.43 | $30.55 | $25.23 | $27.91 | $21.38 |
Net investment loss
| (0.28) | (0.17) 1 | (0.10) 1 | (0.11) | (0.08) 1 |
Net realized and unrealized gains (losses) on investments
| 6.14 | 12.73 | 9.29 | 0.61 | 7.39 |
Total from investment operations
| 5.86 | 12.56 | 9.19 | 0.50 | 7.31 |
| Distributions to shareholders from | | | | | |
Net investment income
| 0.00 | 0.00 | 0.00 | 0.00 | (0.00) 2 |
Net realized gains
| (4.60) | (2.68) | (3.87) | (3.18) | (0.78) |
Total distributions to shareholders
| (4.60) | (2.68) | (3.87) | (3.18) | (0.78) |
Net asset value, end of period
| $41.69 | $40.43 | $30.55 | $25.23 | $27.91 |
Total return3
| 14.97% | 43.18% | 37.04% | 0.28% | 34.60% |
| Ratios to average net assets (annualized) | | | | | |
Gross expenses
| 1.02% | 1.04% | 1.06% | 1.06% | 1.07% |
Net expenses
| 1.00% | 1.00% | 1.00% | 1.00% | 1.00% |
Net investment loss
| (0.68)% | (0.52)% | (0.33)% | (0.35)% | (0.31)% |
| Supplemental data | | | | | |
Portfolio turnover rate
| 25% | 24% | 31% | 46% | 67% |
Net assets, end of period (000s omitted)
| $59,888 | $57,850 | $50,843 | $48,500 | $54,334 |
| 1 | Calculated based upon average shares outstanding |
| 2 | Amount is less than $0.005. |
| 3 | Returns do not reflect fees and expenses charged pursuant to the terms of variable life insurance policies and variable annuity contracts. |
The accompanying notes are an integral part of these financial statements.
18 | Allspring VT Omega Growth Fund
Notes to financial statements
1. ORGANIZATION
Allspring Variable Trust (the "Trust"), a Delaware statutory trust organized on March 10, 1999, is an open-end management investment company registered under the Investment Company Act of 1940, as amended (the "1940 Act"). As an investment company, the Trust follows the accounting and reporting guidance in Financial Accounting Standards Board ("FASB") Accounting Standards Codification Topic 946, Financial Services – Investment Companies. These financial statements report on the Allspring VT Omega Growth Fund (the "Fund") which is a diversified series of the Trust. The Trust offers shares of the Fund to separate accounts of various life insurance companies as funding vehicles for certain variable annuity contracts and variable life insurance policies.
Effective on November 1, 2021, the sale transaction of Wells Fargo Asset Management ("WFAM") by Wells Fargo & Company to GTCR LLC and Reverence Capital Partners, L.P. was closed. In connection with the closing of the transaction, WFAM became known as Allspring Global Investments (“Allspring”) and various entities that provided services to the Fund changed their names to "Allspring", including Allspring Funds Management, LLC, the investment manager to the Fund, Allspring Global Investments, LLC and Allspring Global Investments (UK) Limited, both registered investment advisers providing subadvisory services to certain funds, and Allspring Funds Distributor, LLC, the Fund's principal underwriter. Consummation of the transaction resulted in a new investment management agreement and subadvisory agreement which became effective on November 1, 2021.
2. SIGNIFICANT ACCOUNTING POLICIES
The following significant accounting policies, which are consistently followed in the preparation of the financial statements of the Fund, are in conformity with U.S. generally accepted accounting principles which require management to make estimates and assumptions that affect the reported amounts of assets and liabilities, disclosure of contingent assets and liabilities at the date of the financial statements, and the reported amounts of income and expenses during the reporting period. Actual results could differ from those estimates.
Securities valuation
All investments are valued each business day as of the close of regular trading on the New York Stock Exchange (generally 4 p.m. Eastern Time), although the Fund may deviate from this calculation time under unusual or unexpected circumstances.
Equity securities that are listed on a foreign or domestic exchange or market are valued at the official closing price or, if none, the last sales price. If no sale occurs on the principal exchange or market that day, a fair value price will be determined in accordance with the Fund’s Valuation Procedures.
Investments in registered open-end investment companies are valued at net asset value. Interests in non-registered investment companies that are redeemable at net asset value are fair valued normally at net asset value.
Investments which are not valued using any of the methods discussed above are valued at their fair value, as determined in good faith by the Board of Trustees. The Board of Trustees has established a Valuation Committee comprised of the Trustees and has delegated to it the authority to take any actions regarding the valuation of portfolio securities that the Valuation Committee deems necessary or appropriate, including determining the fair value of portfolio securities, unless the determination has been delegated to the Allspring Global Investments Pricing Committee at Allspring Funds Management, LLC ("Allspring Funds Management"). The Board of Trustees retains the authority to make or ratify any valuation decisions or approve any changes to the Valuation Procedures as it deems appropriate. On a quarterly basis, the Board of Trustees receives reports on any valuation actions taken by the Valuation Committee or the Allspring Global Investments Pricing Committee which may include items for ratification.
Securities lending
The Fund may lend its securities from time to time in order to earn additional income in the form of fees or interest on securities received as collateral or the investment of any cash received as collateral. When securities are on loan, the Fund receives interest or dividends on those securities. Cash collateral received in connection with its securities lending transactions is invested in Securities Lending Cash Investments, LLC (the "Securities Lending Fund"), an affiliated non-registered investment company. Investments in Securities Lending Fund are valued at the evaluated bid price provided by an independent pricing service. Income earned from investment in the Securities Lending Fund (net of fees and rebates), if any, is included in income from affiliated securities on the Statement of Operations.
In a securities lending transaction, the net asset value of the Fund is affected by an increase or decrease in the value of the securities loaned and by an increase or decrease in the value of the instrument in which collateral is invested. The amount of securities lending activity undertaken by the Fund fluctuates from time to time. The Fund has the right under the lending agreement to recover the securities from the borrower on demand. In the event of default or bankruptcy by the borrower, the
Allspring VT Omega Growth Fund | 19
Notes to financial statements
Fund may be prevented from recovering the loaned securities or gaining access to the collateral or may experience delays or costs in doing so. In such an event, the terms of the agreement allow the unaffiliated securities lending agent to use the collateral to purchase replacement securities on behalf of the Fund or pay the Fund the market value of the loaned securities. The Fund bears the risk of loss with respect to depreciation of its investment of the cash collateral.
Security transactions and income recognition
Securities transactions are recorded on a trade date basis. Realized gains or losses are recorded on the basis of identified cost.
Dividend income is recognized on the ex-dividend date. Dividend income is recorded net of foreign taxes withheld where recovery of such taxes is not assured.
Distributions to shareholders
Distributions to shareholders from net investment income and any net realized gains are recorded on the ex-dividend date and paid at least annually. Such distributions are determined in accordance with income tax regulations and may differ from U.S. generally accepted accounting principles. Dividend sources are estimated at the time of declaration. The tax character of distributions is determined as of the Fund's fiscal year end. Therefore, a portion of the Fund's distributions made prior to the Fund’s fiscal year end may be categorized as a tax return of capital at year end.
Federal and other taxes
The Fund intends to continue to qualify as a regulated investment company by distributing substantially all of its investment company taxable income and any net realized capital gains (after reduction for capital loss carryforwards) sufficient to relieve it from all, or substantially all, federal income taxes. Accordingly, no provision for federal income taxes was required.
The Fund’s income and federal excise tax returns and all financial records supporting those returns for the prior three fiscal years are subject to examination by the federal and Delaware revenue authorities. Management has analyzed the Fund's tax positions taken on federal, state, and foreign tax returns for all open tax years and does not believe that there are any uncertain tax positions that require recognition of a tax liability.
As of December 31, 2021, the aggregate cost of all investments for federal income tax purposes was $46,750,624 and the unrealized gains (losses) consisted of:
| Gross unrealized gains | $64,690,346 |
| Gross unrealized losses | (1,826,940) |
| Net unrealized gains | $62,863,406 |
Reclassifications are made to the Fund’s capital accounts for permanent tax differences to reflect income and gains available for distribution (or available capital loss carryforwards) under federal income tax regulations. U.S. generally accepted accounting principles require that certain components of net assets be adjusted to reflect permanent differences between financial and tax reporting. These reclassifications have no effect on net assets or net asset values per share. The primary permanent difference causing such reclassification is due to net operating loss. At December 31, 2021, as a result of permanent book-to-tax differences, the following reclassification adjustments were made on the Statement of Assets and Liabilities:
| Paid-in capital | Total distributable
earnings |
| $(615,538) | $615,538 |
Class allocations
The separate classes of shares offered by the Fund differ principally in distribution fees. Class specific expenses are charged directly to that share class. Investment income, common fund-level expenses, and realized and unrealized gains (losses) on investments are allocated daily to each class of shares based on the relative proportion of net assets of each class.
20 | Allspring VT Omega Growth Fund
Notes to financial statements
3. FAIR VALUATION MEASUREMENTS
Fair value measurements of investments are determined within a framework that has established a fair value hierarchy based upon the various data inputs utilized in determining the value of the Fund’s investments. The three-level hierarchy gives the highest priority to unadjusted quoted prices in active markets for identical assets or liabilities (Level 1) and the lowest priority to unobservable inputs (Level 3). The Fund’s investments are classified within the fair value hierarchy based on the lowest level of input that is significant to the fair value measurement. The inputs are summarized into three broad levels as follows:
| ■ | Level 1 – quoted prices in active markets for identical securities |
| ■ | Level 2 – other significant observable inputs (including quoted prices for similar securities, interest rates, prepayment speeds, credit risk, etc.) |
| ■ | Level 3 – significant unobservable inputs (including the Fund’s own assumptions in determining the fair value of investments) |
The inputs or methodologies used for valuing investments in securities are not necessarily an indication of the risk associated with investing in those securities.
The following is a summary of the inputs used in valuing the Fund’s assets and liabilities as of December 31, 2021:
| | Quoted prices
(Level 1) | Other significant
observable inputs
(Level 2) | Significant
unobservable inputs
(Level 3) | Total |
| Assets | | | | |
| Investments in: | | | | |
| Common stocks | | | | |
| Communication services | $ 14,920,338 | $0 | $0 | $ 14,920,338 |
| Consumer discretionary | 19,655,076 | 0 | 0 | 19,655,076 |
| Financials | 2,970,474 | 0 | 0 | 2,970,474 |
| Health care | 15,702,835 | 0 | 0 | 15,702,835 |
| Industrials | 5,363,018 | 0 | 0 | 5,363,018 |
| Information technology | 47,067,375 | 0 | 0 | 47,067,375 |
| Materials | 2,172,827 | 0 | 0 | 2,172,827 |
| Short-term investments | | | | |
| Investment companies | 1,762,087 | 0 | 0 | 1,762,087 |
| Total assets | $109,614,030 | $0 | $0 | $109,614,030 |
Additional sector, industry or geographic detail, if any, is included in the Portfolio of Investments.
For the year ended December 31, 2021, the Fund did not have any transfers into/out of Level 3.
4. TRANSACTIONS WITH AFFILIATES
Management fee
Allspring Funds Management, a wholly owned subsidiary of Allspring Global Investments Holdings, LLC, a holding company indirectly owned by certain private funds of GTCR LLC and Reverence Capital Partners, L.P., is the manager of the Fund and provides advisory and fund-level administrative services under an investment management agreement. Under the investment management agreement, Allspring Funds Management is responsible for, among other services, implementing the investment objectives and strategies of the Fund, supervising the subadviser and providing fund-level administrative services in connection with the Fund’s operations. As compensation for its services under the investment management agreement, Allspring Funds Management is entitled to receive a management fee at the following annual rate based on the Fund’s average daily net assets:
Allspring VT Omega Growth Fund | 21
Notes to financial statements
| Average daily net assets | Management fee |
| First $500 million | 0.600% |
| Next $500 million | 0.550 |
| Next $1 billion | 0.500 |
| Next $2 billion | 0.475 |
| Next $1 billion | 0.450 |
| Next $5 billion | 0.440 |
| Over $10 billion | 0.430 |
For the year ended December 31, 2021, the management fee was equivalent to an annual rate of 0.60% of the Fund’s average daily net assets.
Allspring Funds Management has retained the services of a subadviser to provide daily portfolio management to the Fund. The fee for subadvisory services is borne by Allspring Funds Management. Allspring Global Investments, LLC ("Allspring Investments"), an affiliate of Allspring Funds Management and a wholly owned subsidiary of Allspring Global Investments Holdings, LLC, is the subadviser to the Fund and is entitled to receive a fee from Allspring Funds Management at an annual rate starting at 0.45% and declining to 0.30% as the average daily net assets of the Fund increase.
Administration fees
Under a class-level administration agreement, Allspring Funds Management provides class-level administrative services to the Fund, which includes paying fees and expenses for services provided by the transfer agent, sub-transfer agents, omnibus account services and record-keepers. As compensation for its services under the class-level administration agreement, Allspring Funds Management receives an annual fee of 0.08% which is calculated based on the average daily net assets of each class.
Waivers and/or expense reimbursements
Allspring Funds Management has contractually committed to waive and/or reimburse management and administration fees to the extent necessary to maintain certain net operating expense ratios for the Fund. When each class of the Fund has exceeded its expense cap, Allspring Funds Management will waive fees and/or reimburse expenses from fund-level expenses on a proportionate basis and then from class specific expenses. When only certain classes exceed their expense caps, waivers and/or reimbursements are applied against class specific expenses before fund-level expenses. Allspring Funds Management has contractually committed through April 30, 2022 to waive fees and/or reimburse expenses to the extent necessary to cap expenses. Prior to or after the commitment expiration date, the caps may be increased or the commitment to maintain the caps may be terminated only with the approval of the Board of Trustees. The contractual expense caps are as follows:
| | Expense ratio caps |
| Class 1 | 0.75% |
| Class 2 | 1.00 |
Distribution fee
The Trust has adopted a distribution plan for Class 2 shares of the Fund pursuant to Rule 12b-1 under the 1940 Act. A distribution fee is charged to Class 2 shares and paid to Allspring Funds Distributor, LLC, an affiliate of Allspring Funds Management, the principal underwriter, at an annual rate of 0.25% of the average daily net assets of Class 2 shares.
Interfund transactions
The Fund may purchase or sell portfolio investment securities to certain affiliates pursuant to Rule 17a-7 under the 1940 Act and under procedures adopted by the Board of Trustees. The procedures have been designed to ensure that these interfund transactions, which do not incur broker commissions, are effected at current market prices.
5. INVESTMENT PORTFOLIO TRANSACTIONS
Purchases and sales of investments, excluding U.S. government obligations (if any) and short-term securities, for the year ended December 31, 2021 were $27,087,044 and $42,733,750, respectively.
22 | Allspring VT Omega Growth Fund
Notes to financial statements
6. SECURITIES LENDING TRANSACTIONS
The Fund lends its securities through an unaffiliated securities lending agent and receives collateral in the form of cash or securities with a value at least equal to the value of the securities on loan. The value of the loaned securities is determined at the close of each business day and any increases or decreases in the required collateral are exchanged between the Fund and the counterparty on the next business day. Cash collateral received is invested in the Securities Lending Fund which seeks to provide a positive return compared to the daily Federal Funds Open Rate by investing in high-quality, U.S. dollar-denominated short-term money market instruments and is exempt from registration under Section 3(c)(7) of the 1940 Act. Securities Lending Fund is managed by Allspring Funds Management and is subadvised by Allspring Investments. Allspring Funds Management receives an advisory fee starting at 0.05% and declining to 0.01% as the average daily net assets of the Securities Lending Fund increase. All of the fees received by Allspring Funds Management are paid to Allspring Investments for its services as subadviser.
In the event of counterparty default or the failure of a borrower to return a loaned security, the Fund has the right to use the collateral to offset any losses incurred. As of December 31, 2021, the Fund had securities lending transactions with the following counterparties which are subject to offset:
| Counterparty | Value of
securities on
loan | Collateral
received1 | Net amount |
| Bank of America Securities Incorporated | $581,508 | $(581,508) | $0 |
1 Collateral received within this table is limited to the collateral for the net transaction with the counterparty.
7. BANK BORROWINGS
The Trust, Allspring Master Trust and Allspring Funds Trust (excluding the money market funds) are parties to a $350,000,000 revolving credit agreement whereby the Fund is permitted to use bank borrowings for temporary or emergency purposes, such as to fund shareholder redemption requests. Interest under the credit agreement is charged to the Fund based on a borrowing rate equal to the higher of the Federal Funds rate in effect on that day plus 1.25% or the overnight bank funding rate in effect on that day plus 1.25%. In addition, an annual commitment fee equal to 0.25% of the unused balance is allocated to each participating fund.
For the year ended December 31, 2021, there were no borrowings by the Fund under the agreement.
8. DISTRIBUTIONS TO SHAREHOLDERS
The tax character of distributions paid during the years ended December 31, 2021 and December 31, 2020 were as follows:
| | Year ended December 31 |
| | 2021 | 2020 |
| Ordinary income | $ 1,131,692 | $ 728,859 |
| Long-term capital gain | 10,381,462 | 6,560,416 |
As of December 31, 2021, the components of distributable earnings on a tax basis were as follows:
Undistributed
long-term
gain | Unrealized
gains |
| $16,420,766 | $62,863,406 |
9. CONCENTRATION RISKS
As of the end of the period, the Fund concentrated its portfolio of investments in the information technology sector. A fund that invests a substantial portion of its assets in any sector may be more affected by changes in that sector than would be a fund whose investments are not heavily weighted in any sector.
Allspring VT Omega Growth Fund | 23
Notes to financial statements
10. INDEMNIFICATION
Under the Fund's organizational documents, the officers and Trustees have been granted certain indemnification rights against certain liabilities that may arise out of performance of their duties to the Fund. The Fund has entered into a separate agreement with each Trustee that converts indemnification rights currently existing under the Fund’s organizational documents into contractual rights that cannot be changed in the future without the consent of the Trustee. Additionally, in the normal course of business, the Fund may enter into contracts with service providers that contain a variety of indemnification clauses. The Fund’s maximum exposure under these arrangements is dependent on future claims that may be made against the Fund and, therefore, cannot be estimated.
11. CORONAVIRUS (COVID-19) PANDEMIC
On March 11, 2020, the World Health Organization announced that it had made the assessment that coronavirus disease 2019 (“COVID-19”) is a pandemic. The impacts of COVID-19 are affecting the entire global economy, individual companies and investment products, the funds, and the market in general. There is significant uncertainty around the extent and duration of business disruptions related to COVID-19 and the impacts may last for an extended period of time. COVID-19 has led to significant uncertainty and volatility in the financial markets.
24 | Allspring VT Omega Growth Fund
Report of independent registered public accounting firm
To the Shareholders of the Fund and Board of Trustees
Allspring Variable Trust:
Opinion on the Financial Statements
We have audited the accompanying statement of assets and liabilities of Allspring VT Omega Growth Fund (formerly, Wells Fargo VT Omega Growth Fund) (the Fund), one of the funds constituting Allspring Variable Trust (formerly, Wells Fargo Variable Trust), including the portfolio of investments, as of December 31, 2021, the related statement of operations for the year then ended, the statements of changes in net assets for each of the years in the two-year period then ended, and the related notes (collectively, the financial statements) and the financial highlights for each of the years in the five-year period then ended. In our opinion, the financial statements and financial highlights present fairly, in all material respects, the financial position of the Fund as of December 31, 2021, the results of its operations for the year then ended, the changes in its net assets for each of the years in the two-year period then ended, and the financial highlights for each of the years in the five-year period then ended, in conformity with U.S. generally accepted accounting principles.
Basis for Opinion
These financial statements and financial highlights are the responsibility of the Fund’s management. Our responsibility is to express an opinion on these financial statements and financial highlights based on our audits. We are a public accounting firm registered with the Public Company Accounting Oversight Board (United States) (PCAOB) and are required to be independent with respect to the Fund in accordance with the U.S. federal securities laws and the applicable rules and regulations of the Securities and Exchange Commission and the PCAOB.
We conducted our audits in accordance with the standards of the PCAOB. Those standards require that we plan and perform the audit to obtain reasonable assurance about whether the financial statements and financial highlights are free of material misstatement, whether due to error or fraud. Our audits included performing procedures to assess the risks of material misstatement of the financial statements and financial highlights, whether due to error or fraud, and performing procedures that respond to those risks. Such procedures included examining, on a test basis, evidence regarding the amounts and disclosures in the financial statements and financial highlights. Such procedures also included confirmation of securities owned as of December 31, 2021, by correspondence with the custodian and transfer agent. Our audits also included evaluating the accounting principles used and significant estimates made by management, as well as evaluating the overall presentation of the financial statements and financial highlights. We believe that our audits provide a reasonable basis for our opinion.

We have not been able to determine the specific year that we began serving as the auditor of one or more Allspring Funds investment companies; however, we are aware that we have served as the auditor of one or more Allspring Funds investment companies since at least 1955.
Boston, Massachusetts
February 25, 2022
Allspring VT Omega Growth Fund | 25
Other information (unaudited)
TAX INFORMATION
For corporate shareholders, pursuant to Section 854 of the Internal Revenue Code, 34% of ordinary income dividends qualify for the corporate dividends-received deduction for the fiscal year ended December 31, 2021.
Pursuant to Section 852 of the Internal Revenue Code, $10,381,462 was designated as a 20% rate gain distribution for the fiscal year ended December 31, 2021.
For the fiscal year ended December 31, 2021, $1,131,692 has been designated as short-term capital gain dividends for nonresident alien shareholders pursuant to Section 871 of the Internal Revenue Code.
PROXY VOTING INFORMATION
A description of the policies and procedures used to determine how to vote proxies relating to portfolio securities is available without charge, upon request, by calling 1-800-260-5969, visiting our website at allspringglobal.com, or visiting the SEC website at sec.gov. Information regarding how the proxies related to portfolio securities were voted during the most recent 12-month period ended June 30 is available on the website at allspringglobal.com or by visiting the SEC website at sec.gov.
SPECIAL MEETING OF SHAREHOLDERS
On August 16, 2021, a Special Meeting of Shareholders for the Fund was held to consider the following proposals. The results of the proposals are indicated below.
Proposal 1 – To consider and approve a new investment management agreement with Wells Fargo Funds Management, LLC*.
| Shares voted “For” | 1,914,839 |
| Shares voted “Against” | 56,150 |
| Shares voted “Abstain” | 486,800 |
Proposal 2 – To consider and approve a new subadvisory agreement with Wells Capital Management, LLC**.
| Shares voted “For” | 1,911,425 |
| Shares voted “Withhold” | 56,076 |
| Shares voted “Abstain” | 490,288 |
* Effective November 1, 2021, known as Allspring Funds Management, LLC.
** Effective November 1, 2021, known as Allspring Global Investments, LLC.
QUARTERLY PORTFOLIO HOLDINGS INFORMATION
The Fund files its complete schedule of portfolio holdings with the SEC for the first and third quarters of each fiscal year as an exhibit to its reports on Form N-PORT. Shareholders may view the filed Form N-PORT by visiting the SEC website at sec.gov.
26 | Allspring VT Omega Growth Fund
Other information (unaudited)
BOARD OF TRUSTEES AND OFFICERS
Each of the Trustees and Officers listed in the table below acts in identical capacities for each fund in the Allspring family of funds, which consists of 139 mutual funds comprising the Allspring Funds Trust, Allspring Variable Trust, Allspring Master Trust and four closed-end funds (collectively the “Fund Complex”). This table should be read in conjunction with the Prospectus and the Statement of Additional Information1. The mailing address of each Trustee and Officer is 525 Market Street, 12th Floor, San Francisco, CA 94105. Each Trustee and Officer serves an indefinite term, however, each Trustee serves such term until reaching the mandatory retirement age established by the Trustees.
Independent Trustees
Name and
year of birth | Position held and
length of service* | Principal occupations during past five years or longer | Current other
public company or
investment
company
directorships |
William R. Ebsworth
(Born 1957) | Trustee,
since 2015 | Retired. From 1984 to 2013, equities analyst, portfolio manager, research director and chief investment officer at Fidelity Management and Research Company in Boston, Tokyo, and Hong Kong, and retired in 2013 as Chief Investment Officer of Fidelity Strategic Advisers, Inc. where he led a team of investment professionals managing client assets. Prior thereto, Board member of Hong Kong Securities Clearing Co., Hong Kong Options Clearing Corp., the Thailand International Fund, Ltd., Fidelity Investments Life Insurance Company, and Empire Fidelity Investments Life Insurance Company. Audit Committee Chair and Investment Committee Chair of the Vincent Memorial Hospital Endowment (non-profit organization). Mr. Ebsworth is a CFA® charterholder. | N/A |
Jane A. Freeman
(Born 1953) | Trustee,
since 2015;
Chair Liaison,
since 2018 | Retired. From 2012 to 2014 and 1999 to 2008, Chief Financial Officer of Scientific Learning Corporation. From 2008 to 2012, Ms. Freeman provided consulting services related to strategic business projects. Prior to 1999, Portfolio Manager at Rockefeller & Co. and Scudder, Stevens & Clark. Board member of the Harding Loevner Funds from 1996 to 2014, serving as both Lead Independent Director and chair of the Audit Committee. Board member of the Russell Exchange Traded Funds Trust from 2011 to 2012 and the chair of the Audit Committee. Ms. Freeman is also an inactive Chartered Financial Analyst. | N/A |
Isaiah Harris, Jr.
(Born 1952) | Trustee,
since 2009; Audit
Committee
Chair,
since 2019 | Retired. Chairman of the Board of CIGNA Corporation from 2009 to 2021, and Director from 2005 to 2008. From 2003 to 2011, Director of Deluxe Corporation. Prior thereto, President and CEO of BellSouth Advertising and Publishing Corp. from 2005 to 2007, President and CEO of BellSouth Enterprises from 2004 to 2005 and President of BellSouth Consumer Services from 2000 to 2003. Emeritus member of the Iowa State University Foundation Board of Governors. Emeritus Member of the Advisory Board of Iowa State University School of Business. Advisory Board Member, Palm Harbor Academy (private school). Advisory Board Member, Fellowship of Christian Athletes. Mr. Harris is a certified public accountant (inactive status). | N/A |
Judith M. Johnson**
(Born 1949) | Trustee,
since 2008 | Retired. Prior thereto, Chief Executive Officer and Chief Investment Officer of Minneapolis Employees Retirement Fund from 1996 to 2008. Ms. Johnson is an attorney, certified public accountant and a certified managerial accountant. | N/A |
David F. Larcker
(Born 1950) | Trustee,
since 2009 | James Irvin Miller Professor of Accounting at the Graduate School of Business (Emeritus), Stanford University, Director of the Corporate Governance Research Initiative and Senior Faculty of The Rock Center for Corporate Governance since 2006. From 2005 to 2008, Professor of Accounting at the Graduate School of Business, Stanford University. Prior thereto, Ernst & Young Professor of Accounting at The Wharton School, University of Pennsylvania from 1985 to 2005. | N/A |
Allspring VT Omega Growth Fund | 27
Other information (unaudited)
Name and
year of birth | Position held and
length of service* | Principal occupations during past five years or longer | Current other
public company or
investment
company
directorships |
Olivia S. Mitchell
(Born 1953) | Trustee,
since 2006;
Nominating and
Governance
Committee Chair,
since 2018 | International Foundation of Employee Benefit Plans Professor since 1993, Wharton School of the University of Pennsylvania. Director of Wharton’s Pension Research Council and Boettner Center on Pensions & Retirement Research, and Research Associate at the National Bureau of Economic Research. Previously taught at Cornell University from 1978 to 1993. | N/A |
Timothy J. Penny
(Born 1951) | Trustee,
since 1996;
Chair,
since 2018 | President and Chief Executive Officer of Southern Minnesota Initiative Foundation, a non-profit organization, since 2007. Member of the Board of Trustees of NorthStar Education Finance, Inc., a non-profit organization, since 2007. | N/A |
James G. Polisson
(Born 1959) | Trustee,
since 2018 | Retired. Chief Marketing Officer, Source (ETF) UK Services, Ltd, from 2015 to 2017. From 2012 to 2015, Principal of The Polisson Group, LLC, a management consulting, corporate advisory and principal investing company. Chief Executive Officer and Managing Director at Russell Investments, Global Exchange Traded Funds from 2010 to 2012. Managing Director of Barclays Global Investors from 1998 to 2010 and Global Chief Marketing Officer for iShares and Barclays Global Investors from 2000 to 2010. Trustee of the San Francisco Mechanics’ Institute, a non-profit organization, from 2013 to 2015. Board member of the Russell Exchange Traded Fund Trust from 2011 to 2012. Director of Barclays Global Investors Holdings Deutschland GmbH from 2006 to 2009. Mr. Polisson is an attorney and has a retired status with the Massachusetts and District of Columbia Bar Associations. | N/A |
Pamela Wheelock
(Born 1959) | Trustee,
since January
2020; previously
Trustee from
January 2018 to
July 2019 | Board member of the Destination Medical Center Economic Development Agency, Rochester, Minnesota since 2019. Interim President of the McKnight Foundation from January to September 2020. McKnight Foundation Consultant, November 2020 to February 2021. Acting Commissioner, Minnesota Department of Human Services, July 2019 through September 2019. Consultant (part-time), Minnesota Department of Human Services, October 2019 through December 2019. Chief Operating Officer, Twin Cities Habitat for Humanity from 2017 to 2019. Vice President of University Services, University of Minnesota from 2012 to 2016. Prior thereto, on the Board of Directors, Governance Committee and Finance Committee for the Minnesota Philanthropy Partners (Saint Paul Foundation) from 2012 to 2018, Interim Chief Executive Officer of Blue Cross Blue Shield of Minnesota from 2011 to 2012, Chairman of the Board from 2009 to 2012 and Board Director from 2003 to 2015. Vice President, Leadership and Community Engagement, Bush Foundation, Saint Paul, Minnesota (a private foundation) from 2009 to 2011. Executive Vice President and Chief Financial Officer, Minnesota Sports and Entertainment from 2004 to 2009 and Senior Vice President from 2002 to 2004. Executive Vice President of the Minnesota Wild Foundation from 2004 to 2008. Commissioner of Finance, State of Minnesota, from 1999 to 2002. Currently Board Chair of the Minnesota Wild Foundation since 2010. | N/A |
* Length of service dates reflect the Trustee’s commencement of service with the Trust’s predecessor entities, where applicable.
** Ms. Johnson has resigned from the Board effective December 31, 2021.
28 | Allspring VT Omega Growth Fund
Other information (unaudited)
Officers2
Name and
year of birth | Position held and
length of service | Principal occupations during past five years or longer |
Andrew Owen
(Born 1960) | President,
since 2017 | President, Chief Executive Officer and Director of Allspring Funds Management, LLC since 2017 and co-president of Galliard Capital Management, LLC, an affiliate of Allspring Funds Management, LLC, since 2019. Prior thereto, Head of Affiliated Managers, Allspring Global Investments, from 2014 to 2019 and Executive Vice President responsible for marketing, investments and product development for Allspring Funds Management, LLC, from 2009 to 2014. In addition, Mr. Owen was an Executive Vice President of Wells Fargo & Company from 2014 to 2021. |
Jeremy DePalma
(Born 1974) | Treasurer,
since 2012
(for certain funds in
the Fund Complex);
since 2021 (for
the remaining funds in the
Fund Complex) | Senior Vice President of Allspring Funds Management, LLC since 2009. Senior Vice President of Evergreen Investment Management Company, LLC from 2008 to 2010 and head of the Fund Reporting and Control Team within Fund Administration. |
Kate McKinley
(Born 1977) | Chief Legal Officer,
since 2021 | Chief Legal Officer of Allspring Global Investments since 2021. Prior thereto, held various roles at State Street Global Advisors beginning in 2010, including serving as Senior Vice President and General Counsel from 2019 to 2021, and Chief Operating Officer of the Institutional Client Group from 2016 - 2019. Prior to working at State Street Global Advisors served as Assistant General Counsel for Bank of America Corporation from 2005 to 2010 and as an Associate at WilmerHale from 2002 to 2005. |
Christopher Baker
(Born 1976) | Chief Compliance Officer, since 2022 | Global Chief Compliance Officer for Allspring Global Investments since 2022. Prior thereto, Chief Compliance Officer for State Street Global Advisors from 2018 to 2021. Senior Compliance Officer for the State Street divisions of Alternative Investment Solutions, Sector Solutions, and Global Marketing from 2015 to 2018. From 2010 to 2015 Vice President, Global Head of Investment and Marketing Compliance for State Street Global Advisors. |
Matthew Prasse
(Born 1983) | Secretary,
since 2021 | Senior Counsel of the Allspring Legal Department since 2021. Senior Counsel of the Wells Fargo Legal Department from 2018 to 2021. Previously, Counsel for Barings LLC from 2015 to 2018. Prior to joining Barings, Associate at Morgan, Lewis & Bockius LLP from 2008 to 2015. |
1 The Statement of Additional Information includes additional information about the Trustees and is available, without charge, upon request, by calling 1-800-222-8222 or by visiting the website at allspringglobal.com.
2 For those Officers with tenures at Allspring Global Investments and/or Allspring Funds Management, LLC that began prior to 2021, such tenures include years of service during which these businesses/entities were known as Wells Fargo Asset Management and Wells Fargo Funds Management, LLC, respectively.
Allspring VT Omega Growth Fund | 29
For more information
More information about Allspring Funds is available free upon request. To obtain literature, please write, visit the Fund's website, or call:
Allspring Funds
P.O. Box 219967
Kansas City, MO 64121-9967
Website: allspringglobal.com
Individual investors: 1-800-260-5969
Retail investment professionals: 1-888-877-9275
Institutional investment professionals: 1-866-765-0778
This report and the financial statements contained herein are submitted for the general information of the shareholders of the Fund. If this report is used for promotional purposes, distribution of the report must be accompanied or preceded by a current prospectus. Before investing, please consider the investment objectives, risks, charges, and expenses of the investment. For a current prospectus and, if available, a summary prospectus, containing this information, call
1-800-260-5969 or visit the Fund's website at allspringglobal.com. Read the prospectus carefully before you invest or send money.
Allspring Global InvestmentsTM is the trade name for the asset management firms of Allspring Global Investments Holdings, LLC, a holding company indirectly owned by certain private funds of GTCR LLC and Reverence Capital Partners, L.P. These firms include but are not limited to Allspring Global Investments, LLC, and Allspring Funds Management, LLC. Certain products managed by Allspring entities are distributed by Allspring Funds Distributor, LLC (a broker-dealer and Member FINRA/SIPC).
This material is for general informational and educational purposes only and is NOT intended to provide investment advice or a recommendation of any kind - including a recommendation for any specific investment, strategy, or plan.
© 2022 Allspring Global Investments Holdings, LLC. All rights reserved.
PAR-0122-00228 02-22
AVT5/AR151 12-21
Annual Report
December 31, 2021
Allspring VT Opportunity Fund
The views expressed and any forward-looking statements are as of December 31, 2021, unless otherwise noted, and are those of the Fund's portfolio managers and/or Allspring Global Investments. Discussions of individual securities or the markets generally are not intended as individual recommendations. Future events or results may vary significantly from those expressed in any forward-looking statements. The views expressed are subject to change at any time in response to changing circumstances in the market. Allspring Global Investments disclaims any obligation to publicly update or revise any views expressed or forward-looking statements.
Allspring VT Opportunity Fund | 1
Letter to shareholders (unaudited)
Andrew Owen
President
Allspring Funds
Dear Shareholder:
We are pleased to offer you this annual report for the Allspring VT Opportunity Fund for the 12-month period that ended December 31, 2021. Global stocks yielded mixed results as the global economy continued to emerge from the haze of COVID-19. Tailwinds were provided by global stimulus programs, a rapid vaccination rollout, and recovering consumer and corporate sentiment. Bonds also saw mixed performance during the period.
For the 12-month period, equities had mixed returns as policymakers continued to fight the effects of COVID-19. U.S. stocks led both non-U.S. developed market equities and emerging market stocks. Returns by fixed-income securities were also a mix of positive and negative. For the period, U.S. stocks, based on the S&P 500 Index,1 gained 28.71%. International stocks, as measured by the MSCI ACWI ex USA Index (Net),2 returned 7.82%, while the MSCI EM Index (Net) (USD)3 had weaker performance with a 2.54% loss. Among bond indexes, the Bloomberg U.S. Aggregate Bond Index4 returned -1.54%, the Bloomberg Global Aggregate ex-USD Index (unhedged)5 returned -7.05%, the Bloomberg Municipal Bond Index6 gained 1.52%, and the ICE BofA U.S. High Yield Index7 returned 5.36%.
Efforts to contain COVID-19 drove market performance.
The year 2021 began with emerging market stocks leading all major asset classes in January, driven by China’s strong economic growth and a broad recovery in corporate earnings, which propelled China’s stock market higher. In the U.S., positive news on vaccine trials and January expansion in both the manufacturing and services sectors were offset by a weak December monthly jobs report. This was compounded by technical factors as some hedge funds were forced to sell stocks to protect themselves against a well-publicized short squeeze coordinated by a group of retail investors. Eurozone sentiment and economic growth were particularly weak, reflecting the impact of a new lockdown with stricter social distancing along with a slow vaccine rollout.
February saw major domestic equity indexes driven higher on the hope of a new stimulus bill, improving COVID-19 vaccination numbers, and the gradual reopening of the economy. Most S&P 500 companies reported better-than-expected earnings, with positive surprises coming from the financials, information technology, health care, and materials sectors. Japan saw its economy strengthen as a result of strong export numbers. Meanwhile, crude oil prices continued their climb, rising more than 25% for the year. Domestic government bonds experienced a sharp sell-off in late February as markets priced in a more robust economic recovery and higher future growth and inflation expectations.
| 1 | The S&P 500 Index consists of 500 stocks chosen for market size, liquidity, and industry group representation. It is a market-value-weighted index with each stock's weight in the index proportionate to its market value. You cannot invest directly in an index. |
| 2 | The Morgan Stanley Capital International (MSCI) All Country World Index (ACWI) ex USA Index (Net) is a free-float-adjusted market-capitalization-weighted index that is designed to measure the equity market performance of developed and emerging markets, excluding the U.S. Source: MSCI. MSCI makes no express or implied warranties or representations and shall have no liability whatsoever with respect to any MSCI data contained herein. The MSCI data may not be further redistributed or used as a basis for other indexes or any securities or financial products. This report is not approved, reviewed, or produced by MSCI. You cannot invest directly in an index. |
| 3 | The MSCI Emerging Markets (EM) Index (Net) (USD) is a free-float-adjusted market-capitalization-weighted index that is designed to measure equity market performance of emerging markets. You cannot invest directly in an index. |
| 4 | The Bloomberg U.S. Aggregate Bond Index is a broad-based benchmark that measures the investment-grade, U.S.-dollar-denominated, fixed-rate taxable bond market, including Treasuries, government-related and corporate securities, mortgage-backed securities (agency fixed-rate and hybrid adjustable-rate mortgage pass-throughs), asset-backed securities, and commercial mortgage-backed securities. You cannot invest directly in an index. |
| 5 | The Bloomberg Global Aggregate ex-USD Index (unhedged) is an unmanaged index that provides a broad-based measure of the global investment-grade fixed-income markets excluding the U.S.-dollar-denominated debt market. You cannot invest directly in an index. |
| 6 | The Bloomberg Municipal Bond Index is an unmanaged index composed of long-term tax-exempt bonds with a minimum credit rating of Baa. You cannot invest directly in an index. |
| 7 | The ICE BofA U.S. High Yield Index is a market-capitalization-weighted index of domestic and Yankee high-yield bonds. The index tracks the performance of high-yield securities traded in the U.S. bond market. You cannot invest directly in an index. Copyright 2022. ICE Data Indices, LLC. All rights reserved. |
2 | Allspring VT Opportunity Fund
Letter to shareholders (unaudited)
The passage of the massive domestic stimulus bill highlighted March activity, leading to increased forecasts for U.S. growth in 2021. Domestic employment surged as COVID-19 vaccinations and an increasingly open economy spurred hiring. A majority of U.S. small companies reported they were operating at pre-pandemic capacity or higher. Value stocks continued their outperformance of growth stocks in the month, continuing the trend that started in late 2020. Meanwhile, most major developed global equity indexes were up month to date on the back of rising optimism regarding the outlook for global growth. While the U.S. and the U.K. have been the most successful in terms of the vaccine rollout, even in markets where the vaccine has lagged, such as in the eurozone and Japan, equity indexes in many of those countries have also been in positive territory for the year through March 2021.
Equity markets produced another strong showing in April. Domestically, the continued reopening of the economy had a strong impact on positive equity performance, as people started leaving their households and jobless claims continued to fall. Domestic corporate bonds performed well and the U.S. dollar weakened. Meanwhile, the U.S. government continued to seek to invest in the recovery, this time by outlining a package of over $2 trillion to improve infrastructure. The primary headwind in April was inflation, as investors tried to determine the breadth and longevity of recent price increases. Developed Europe has been supported by a meaningful increase in the pace of vaccinations. Unfortunately many emerging market countries have not been as successful. India in particular saw COVID-19 cases surge, serving as an example of the need to get vaccinations rolled out to less developed nations.
Vaccine rollouts continued in May, leading to loosened restrictions globally. As a result, equity markets in general saw a minor increase in returns. Concerns that the continued economic rebound could result in inflation increases becoming more than transitory were supported by the higher input costs businesses were experiencing. Meanwhile, those inflation concerns were tempered by the U.S. Federal Reserve (Fed), which stayed steady on its view of the economy and eased fears of a sudden and substantial policy change. Positive performance in the emerging market equity space was supported this month by steady consumer demand and strong commodity prices. Fixed-income markets were also slightly positive for the month, driven by inflation uncertainty and a softer U.S. dollar.
June witnessed the S&P 500 Index reach a new all-time high. 2021 economic growth and inflation forecasts were revised higher to reflect a strong economic recovery and some supply and demand imbalances. Late June saw a deal reached on a U.S. infrastructure package of approximately $1 trillion for road, bridge, and broadband network upgrades over the next eight years. The Fed’s June meeting yielded no change to policy, but its projections pointed to a possible interest rate rise in 2023. This, combined with a rebound in economic activity and investors searching for yield, led to U.S. Treasury yields being down for the month. Many European and Asian countries saw vaccination momentum increase, while the U.K. dealt with a rise in COVID-19 infections, specifically the Delta variant. Meanwhile, crude oil jumped over 10% in June on the back of the pickup in global economic activity and the Organization of the Petroleum Exporting Countries’ (OPEC) slow pace of supply growth.
July began the month seeing vaccinations making progress, as several major developed countries eased restrictions, only to be threatened again by the spread of COVID-19’s Delta variant. Inflation continued to climb, aided by the continued supply bottleneck in the face of high demand. As it pertains to the equity area of the market, U.S. equities led the way in positive return territory followed by international developed markets. In contrast, emerging markets were well in negative territory for the month, hindered by China’s plans for new regulations on a number of sectors, specifically education and technology. The U.S. 10-year Treasury bond yield continued to decline as strong demand swallowed up supply. After hitting a multiyear high earlier in the month, oil prices leveled off following an agreement by OPEC to raise oil production starting in August.
Allspring VT Opportunity Fund | 3
Letter to shareholders (unaudited)
“ Municipal debt experienced its first monthly performance drop since February of this year, slowing a rally that made it one of the best-performing sectors of the bond market.” |
The Delta variant of COVID-19 produced outbreaks globally in August, increasing the potential for increased market volatility and bringing into question the ongoing economic recovery. Domestically, the U.S. economy continued to stay strong in the face of the Delta variant, continued inflationary pressures, and worries over Hurricane Ida. Emerging market equities experienced elevated volatility, largely influenced by China’s regulatory stance. Emerging market equities started the month with poor performance but rebounded to end the month in positive territory. Municipal debt experienced its first monthly performance drop since February of this year, slowing a rally that made it one of the best-performing sectors of the bond market. In the commodity segment of the market, crude oil fell sharply during the month on the back of dampened expectations as a result of the Delta variant but was still a leading asset-class performer for the year.
Global markets suffered their broadest retreat in a year during September, with the exception of commodities. Concerns over inflation and the interest rate outlook depressed investor confidence and hurt performance. Emerging markets declined on concerns over the continued supply chain disruptions and worries over higher energy and food prices. Meanwhile, the Fed indicated it would slow the pace of asset purchases in the near future (pointing towards November). All eyes domestically are fixed on the raising of the debt ceiling, the 2022 budget plan, and the ongoing debate over the infrastructure package. Contrary to most asset classes, commodities thrived in September, driven by sharply higher energy prices.
October’s key themes continued to be elevated inflation pressures and a supply bottleneck, but strong earnings provided a bright spot in the markets. Earnings releases in the U.S. were generally strong and consumer confidence was high. The Fed reaffirmed its plans to taper quantitative easing to a stop by mid-2022. Meanwhile, elevated inflation figures were considered transitory by the Fed. Similar to the U.S., the eurozone and many Asian countries saw positive earnings but were facing inflation pressures caused by supply bottlenecks while also experiencing energy price increases amid natural gas shortages. Globally, government bond yields rose as central banks prepared to lower monetary policy accommodation in the face of rising inflationary pressures. As previously referenced, positive commodity performance was driven by sharply higher energy costs.
November was dominated by rising COVID-19 hospitalizations and concerns regarding the Omicron variant. Most major asset classes, both domestically and internationally, declined in November with two exceptions: U.S. investment-grade bonds and Treasury Inflation-Protected Securities. The United Nations Climate Change Conference (COP26) took place during the month with hopes of agreement among countries to limit global warming. While several initiatives were discussed, the conference ultimately ended without the specifics required to instill confidence that the limiting of global warming would succeed. In the U.S., President Biden signed a long-awaited infrastructure bill to upgrade U.S. roads, bridges, and railways. Meanwhile, the Consumer Price Index1, a measure of domestic inflation conditions, jumped to its highest level in 31 years. While the threat of consistently high inflation led the Fed to discuss a faster pace of tapering, the Omicron strain makes that less likely to occur. Commodities came in negative for the month, largely driven by sharp declines in oil prices (and energy costs in general) as well as precious metals.
Global volatility in December lessened as data indicated a lower risk of severe disease and death as a result of the Omicron variant. Even so, a number of countries introduced restrictions on sectors such as travel and hospitality to try to reduce the spread. In the U.S., data indicated that the overall domestic economy remains stable and corporate earnings remain robust. Consumer spending capability looks strong heading into 2022 on the back of elevated household savings and the lowest ratio of U.S. household liabilities to assets since 1973. U.S. corporate and high-yield bonds produced positive returns for the month while Treasuries declined. Bonds were strongly affected by the projection of three 25-basis-point (bp; 100 bps equal 1.00%) policy rate hikes in 2022 by senior Federal Open Market Committee members, contrary to just one hike as previously believed.
“ Bonds were strongly affected by the projection of three 25-basis-point (bp; 100 bps equal 1.00%) policy rate hikes in 2022 by senior Federal Open Market Committee members, contrary to just one hike as previously believed.”
| 1 | The Consumer Price Index (CPI) is a measure of the average change over time in the prices paid by urban consumers for a market basket of consumer goods and services. You cannot invest directly in an index. |
4 | Allspring VT Opportunity Fund
Letter to shareholders (unaudited)
Don’t let short-term uncertainty derail long-term investment goals.
Periods of investment uncertainty can present challenges, but experience has taught us that maintaining long-term investment goals can be an effective way to plan for the future. To help you create a sound strategy based on your personal goals and risk tolerance, Allspring Funds offers more than 100 mutual funds spanning a wide range of asset classes and investment styles. Although diversification cannot guarantee an investment profit or prevent losses, we believe it can be an effective way to manage investment risk and potentially smooth out overall portfolio performance. We encourage investors to know their investments and to understand that appropriate levels of risk-taking may unlock opportunities.
Information on transaction closing.
On November 1, 2021, GTCR LLC and Reverence Capital Partners, L.P., announced the beginning of Allspring Global Investments™, with the close of the transaction to acquire Wells Fargo Funds Management, LLC; Wells Capital Management, LLC; Galliard Capital Management, LLC.; Wells Fargo Asset Management (International) Ltd.; Wells Fargo Asset Management Luxembourg S.A.; and Wells Fargo Funds Distributor, LLC, as well as Wells Fargo Bank, N.A.’s business of acting as trustee to its collective investment trusts and all related Wells Fargo Asset Management legal entities. The transaction closed on November 1, 2021, forming Allspring Global Investments, a privately held asset management firm with $575 billion in AUM1 as of December 31, 2021.
Allspring Global Investments™ is a leading independent asset management firm with a full breadth of investment capabilities across diverse asset classes, serving the needs of its institutional and wealth management clients around the world. Allspring operates across 18 offices globally supported by more than 480 investment professionals. Allspring and its investment teams provide a broad range of differentiated investment products and solutions to help its diverse range of clients meet their investment objectives.
As part of this transition, all mutual funds within the Wells Fargo Funds family were rebranded as Allspring Funds. Each individual fund had “Wells Fargo” removed from its fund name and replaced with “Allspring.” The fund name changes went into effect on December 6, 2021.
Allspring Global Investments is the trade name for the asset management firms of Allspring Global Investments Holdings, LLC, a holding company indirectly owned by certain private funds of GTCR LLC and Reverence Capital Partners, L.P.
Thank you for choosing to invest with Allspring Funds. We appreciate your confidence in us and remain committed to helping you meet your financial needs.
Sincerely,
Andrew Owen
President
Allspring Funds
For further information about your Fund, contact your investment professional, visit our website at allspringglobal.com, or call us directly at 1-800-222-8222.
| 1 | As of December 31, 2021, assets under management (AUM) includes $91.6 billion from Galliard Capital Management, LLC, an investment advisor that is not part of the Allspring trade name/GIPS firm. |
Allspring VT Opportunity Fund | 5
Performance highlights (unaudited)
| Investment objective | The Fund seeks long-term capital appreciation. |
| Manager | Allspring Funds Management, LLC |
| Subadviser | Allspring Global Investments, LLC |
| Portfolio managers | Kurt Gunderson*, Christopher G. Miller, CFA®‡ |
| Average annual total returns (%) as of December 31, 2021 |
| | | | | | Expense ratios1 (%) |
| | Inception date | 1 year | 5 year | 10 year | Gross | Net 2 |
| Class 1 3 | 8-26-2011 | 25.06 | 17.58 | 15.22 | 0.86 | 0.75 |
| Class 2 | 5-8-1992 | 24.78 | 17.29 | 14.94 | 1.11 | 1.00 |
| Russell 3000® Index4 | – | 25.66 | 17.97 | 16.30 | – | – |
| 1 | Reflects the expense ratios as stated in the most recent prospectuses. The expense ratios shown are subject to change and may differ from the annualized expense ratios shown in the financial highlights of this report. |
| 2 | The manager has contractually committed through April 30, 2022, to waive fees and/or reimburse expenses to the extent necessary to cap total annual fund operating expenses after fee waivers at 0.75% for Class 1 shares and 1.00% for Class 2 shares. Brokerage commissions, stamp duty fees, interest, taxes, acquired fund fees and expenses (if any), and extraordinary expenses are excluded from the expense caps. Prior to or after the commitment expiration date, the caps may be increased or the commitment to maintain the caps may be terminated only with the approval of the Board of Trustees. Without these caps, the Fund’s returns would have been lower. The expense ratio paid by an investor is the net expense ratio (the total annual fund operating expenses after fee waivers) as stated in the prospectuses. |
| 3 | Historical performance shown for Class 1 shares prior to their inception reflects the performance of the Class 2 shares, and includes the higher expenses applicable to the Class 2 shares. If these expenses had not been included, returns for the Class 1 shares would be higher. |
| 4 | The Russell 3000® Index measures the performance of the 3,000 largest U.S. companies based on total market capitalization, which represents approximately 98% of the investable U.S. equity market. You cannot invest directly in an index. |
Figures quoted represent past performance, which is no guarantee of future results. Investment return and principal value of an investment will fluctuate so that an investor’s shares, when redeemed, may be worth more or less than their original cost. Current performance may be lower or higher than the performance data quoted and assumes the reinvestment of dividends and capital gains. Current month-end performance is available by calling 1-800-260-5969. Performance figures of the Fund do not reflect fees and expenses charged pursuant to the terms of variable life insurance policies and variable annuity contracts. If these fees and expenses had been reflected, performance would have been lower.
Index returns do not include transaction costs associated with buying and selling securities, any mutual fund fees or expenses, or any taxes. It is not possible to invest directly in an index.
Shares are sold without a front-end sales charge or contingent deferred sales charge.
Stock values fluctuate in response to the activities of individual companies and general market and economic conditions. Smaller-company stocks tend to be more volatile and less liquid than those of larger companies. Certain investment strategies tend to increase the total risk of an investment (relative to the broader market). This fund is exposed to foreign investment risk. Consult the Fund’s prospectus for additional information on these and other risks.
Please refer to the prospectus provided by your participating insurance company for detailed information describing the separate accounts for information regarding surrender charges, mortality and expense risk fees, and other charges that may be assessed by the participating insurance companies.
| ‡ | CFA® and Chartered Financial Analyst® are trademarks owned by CFA Institute. |
| * | Mr. Gunderson became a portfolio manager of the Fund on February 1, 2021. |
6 | Allspring VT Opportunity Fund
Performance highlights (unaudited)
Growth of $10,000 investment as of December 31, 20211
| 1 | The chart compares the performance of Class 2 shares for the most recent ten years with the Russell 3000® Index. The chart assumes a hypothetical investment of $10,000 in Class 2 shares and reflects all operating expenses of the Fund but does not reflect fees and expenses charged pursuant to the terms of variable life insurance policies and variable annuity contracts. |
Allspring VT Opportunity Fund | 7
Performance highlights (unaudited)
MANAGER'S DISCUSSION
Fund highlights
| ■ | The Fund modestly lagged its benchmark, the Russell 3000® Index, for the 12-month period that ended December 31, 2021. |
| ■ | The Fund’s holdings in the information technology (IT) sector and an underweight position in the outperforming energy sector were the largest relative detractors from performance. |
| ■ | The Fund’s holdings in the communication services and industrials sectors were the largest relative contributors to performance during the period. |
The U.S. market thrived despite continued COVID-19 concerns.
The U.S. market climbed higher in 2021, with the S&P 500 Index hitting a series of all-time closing highs and ending the year near a record. While COVID-19 continued to dominate headlines, concerns also focused on inflation and its potential impact to the recovery. Coming out of a volatile 2020, investors sought signals as to which way the economy was headed as the economic recovery continued to unfold. The distribution of vaccines and the easing of lockdowns were followed by an economic rebound, but the emergence of new variants would be a setback for the recovery as the year progressed. Despite these concerns, market fundamentals continued to improve and earnings rebounded for many companies, which helped propel the market throughout the year.
| Ten largest holdings (%) as of December 31, 20211 |
| Alphabet Incorporated Class C | 4.80 |
| Apple Incorporated | 4.71 |
| Amazon.com Incorporated | 4.02 |
| Meta Platforms Incorporated Class A | 3.44 |
| Salesforce.com Incorporated | 3.24 |
| Texas Instruments Incorporated | 2.53 |
| The Home Depot Incorporated | 2.37 |
| UnitedHealth Group Incorporated | 2.28 |
| MasterCard Incorporated Class A | 2.10 |
| Palo Alto Networks Incorporated | 2.06 |
| 1 | Figures represent the percentage of the Fund's net assets. Holdings are subject to change and may have changed since the date specified. |
Portfolio changes were modest for the year. The team added to its overweight position in the industrials sector and sees opportunity for company fundamentals to continue to improve as supply-chain issues recover due to COVID-19. In the consumer discretionary sector, the portfolio shifted from a modest underweight to an overweight position. The team bought new positions in The Home Depot, Incorporated; Deckers Outdoor Corporation; and Farfetch Limited within the sector. In health care, the team trimmed its overweight position and now has a modest underweight to the sector.
The portfolio’s position changes are a byproduct of the team’s fundamental, bottom-up research on each company.
The IT and energy sectors detracted from performance.
Among sectors, IT and energy were among leading relative detractors from performance. IT was a relative detractor due to stock selection. The leading relative stock detractors included Fidelity National Information Services, Incorporated, a provider of payment processing and software to the banking and merchant industries. Resurgence of COVID-19 cases dampened expectations on merchant spending and put downward pressure on analyst consensus estimates, which weighed on shares. Fair Issac Corporation, a software company, was a leading relative underperformer as the company’s outlook for software was tempered as the company continues to navigate licenses to software-as-a-service transition. Energy was a relative detractor due to the Fund’s underweight position to the outperforming sector.
Stock selection within the communication services and industrials sectors contributed to performance.
Among sectors, communication services and industrials were among leading relative contributors to performance. Communication services was a relative contributor due to strong stock selection. The leading relative stock contributor was Alphabet Incorporated, a leading technology company. The advertising market experienced acceleration with the economy recovering and Alphabet is continuing to take market share. Industrials was a leading relative contributor due to stock selection. Leading relative stock contributors included Carlisle Companies, Incorporated, a commercial roofing company. The company has successfully implemented material price increases to offset commodity input cost pressures in that segment of the business, supporting profitability. Further, nonresidential lead indicators, such as the Architectural Billings Index, an economic indicator for nonresidential construction activity, have inflected meaningfully positive, portending a 2022 recovery in new construction activity.
8 | Allspring VT Opportunity Fund
Performance highlights (unaudited)
| Sector allocation as of December 31, 20211 |
| 1 | Figures represent the percentage of the Fund's long-term investments. These amounts are subject to change and may have changed since the date specified. |
2022 will be dictated by similar themes from 2021.
While 2021 was a strong year for the equity markets, there are reasons for both caution and optimism as we look ahead. As the new year begins, many themes from 2021 are still very much in focus. The key questions include: 1. pandemic resolution: will economies be able to move on from COVID-19 or will it continue to linger; 2. inflation: will it be transitory or enduring; and 3. Fed policy: will the Fed pull the right levers if inflation lingers, yet avoid tipping the economy into a downturn? All of these themes, among others, merit attention as the calendar turns. 2022 could experience higher volatility; however, we expect to see opportunities in high-quality companies.
Overall, we continue to feel comfortable with our portfolio positioning and continue to have diversified exposure across sectors with both growth and value stocks. A key outcome of our bottom-up, flexible, active core approach is the ability to migrate to wherever we find opportunities in the market. Our style-agnostic focus and Private Market Value (PMV) process provide access to a broader opportunity set for selecting stocks, which allows the team to better navigate volatility that arises when different investment styles come into or fall out of favor.
Allspring VT Opportunity Fund | 9
Fund expenses (unaudited)
As a shareholder of the Fund, you incur ongoing costs, including management fees, distribution (12b-1) fees, and other Fund expenses. This example is intended to help you understand your ongoing costs (in dollars) of investing in the Fund and to compare these costs with the ongoing costs of investing in other mutual funds.
The example is based on an investment of $1,000 invested at the beginning of the six-month period and held for the entire period from July 1, 2021 to December 31, 2021.
Actual expenses
The “Actual” line of the table below provides information about actual account values and actual expenses. You may use the information in this line, together with the amount you invested, to estimate the expenses that you paid over the period. Simply divide your account value by $1,000 (for example, an $8,600 account value divided by $1,000 = 8.6), then multiply the result by the number in the “Actual” line under the heading entitled “Expenses paid during period” for your applicable class of shares to estimate the expenses you paid on your account during this period.
Hypothetical example for comparison purposes
The “Hypothetical” line of the table below provides information about hypothetical account values and hypothetical expenses based on the Fund’s actual expense ratio and an assumed rate of return of 5% per year before expenses, which is not the Fund’s actual return. The hypothetical account values and expenses may not be used to estimate the actual ending account balance or expenses you paid for the period. You may use this information to compare the ongoing costs of investing in the Fund and other funds. To do so, compare this 5% hypothetical example with the 5% hypothetical examples that appear in the shareholder reports of the other funds.
Please note that the expenses shown in the table are meant to highlight your ongoing costs only and do not reflect any separate account charges assessed by participating insurance companies. Therefore, the “Hypothetical” line of the table is useful in comparing ongoing costs only, and will not help you determine the relative total costs of owning different funds. In addition, if these separate account charges assessed by participating insurance companies were included, your costs would have been higher.
| | Beginning
account value
7-1-2021 | Ending
account value
12-31-2021 | Expenses
paid during
the period1 | Annualized net
expense ratio |
| Class 1 | | | | |
| Actual | $1,000.00 | $1,093.71 | $3.96 | 0.75% |
| Hypothetical (5% return before expenses) | $1,000.00 | $1,021.42 | $3.82 | 0.75% |
| Class 2 | | | | |
| Actual | $1,000.00 | $1,092.21 | $5.27 | 1.00% |
| Hypothetical (5% return before expenses) | $1,000.00 | $1,020.16 | $5.09 | 1.00% |
1 Expenses paid is equal to the annualized net expense ratio of each class multiplied by the average account value over the period, multiplied by the number of days in the most recent fiscal half-year divided by the number of days in the fiscal year (to reflect the one-half-year period).
10 | Allspring VT Opportunity Fund
Portfolio of investments—December 31, 2021
| | | | | Shares | Value |
| Common stocks: 99.30% | | | | | |
| Communication services: 9.65% | | | | | |
| Interactive media & services: 8.24% | | | | | |
| Alphabet Incorporated Class C † | | | | 3,671 | $ 10,622,367 |
| Meta Platforms Incorporated Class A † | | | | 22,621 | 7,608,573 |
| | | | | | 18,230,940 |
| Wireless telecommunication services: 1.41% | | | | | |
| T-Mobile US Incorporated † | | | | 26,822 | 3,110,816 |
| Consumer discretionary: 13.11% | | | | | |
| Internet & direct marketing retail: 4.85% | | | | | |
| Amazon.com Incorporated † | | | | 2,665 | 8,886,016 |
| Farfetch Limited Class A † | | | | 54,763 | 1,830,727 |
| | | | | | 10,716,743 |
| Multiline retail: 1.67% | | | | | |
| Dollar General Corporation | | | | 15,686 | 3,699,229 |
| Specialty retail: 5.53% | | | | | |
| Burlington Stores Incorporated † | | | | 13,306 | 3,878,832 |
| The Home Depot Incorporated | | | | 12,600 | 5,229,126 |
| Ulta Beauty Incorporated † | | | | 7,585 | 3,127,599 |
| | | | | | 12,235,557 |
| Textiles, apparel & luxury goods: 1.06% | | | | | |
| Deckers Outdoor Corporation † | | | | 6,411 | 2,348,413 |
| Consumer staples: 2.57% | | | | | |
| Food & staples retailing: 1.39% | | | | | |
| Sysco Corporation | | | | 39,130 | 3,073,662 |
| Household products: 1.18% | | | | | |
| Church & Dwight Company Incorporated | | | | 25,418 | 2,605,345 |
| Financials: 7.24% | | | | | |
| Capital markets: 4.79% | | | | | |
| CME Group Incorporated | | | | 6,186 | 1,413,254 |
| Intercontinental Exchange Incorporated | | | | 25,359 | 3,468,350 |
| S&P Global Incorporated | | | | 6,695 | 3,159,571 |
| The Charles Schwab Corporation | | | | 30,367 | 2,553,865 |
| | | | | | 10,595,040 |
| Insurance: 2.45% | | | | | |
| Chubb Limited | | | | 9,580 | 1,851,910 |
| Marsh & McLennan Companies Incorporated | | | | 20,518 | 3,566,439 |
| | | | | | 5,418,349 |
| Health care: 11.76% | | | | | |
| Health care equipment & supplies: 4.19% | | | | | |
| Boston Scientific Corporation † | | | | 78,889 | 3,351,205 |
The accompanying notes are an integral part of these financial statements.
Allspring VT Opportunity Fund | 11
Portfolio of investments—December 31, 2021
| | | | | Shares | Value |
| Health care equipment & supplies (continued) | | | | | |
| LivaNova plc † | | | | 38,899 | $ 3,400,940 |
| Medtronic plc | | | | 24,282 | 2,511,973 |
| | | | | | 9,264,118 |
| Health care providers & services: 2.28% | | | | | |
| UnitedHealth Group Incorporated | | | | 10,028 | 5,035,460 |
| Health care technology: 0.46% | | | | | |
| Schrodinger Incorporated † | | | | 29,557 | 1,029,470 |
| Life sciences tools & services: 4.41% | | | | | |
| Agilent Technologies Incorporated | | | | 17,446 | 2,785,254 |
| Bio-Rad Laboratories Incorporated Class A † | | | | 4,025 | 3,041,169 |
| Thermo Fisher Scientific Incorporated | | | | 5,871 | 3,917,366 |
| | | | | | 9,743,789 |
| Pharmaceuticals: 0.42% | | | | | |
| Viatris Incorporated | | | | 69,079 | 934,639 |
| Industrials: 17.03% | | | | | |
| Aerospace & defense: 0.90% | | | | | |
| MTU Aero Engines AG | | | | 9,789 | 1,987,596 |
| Building products: 3.47% | | | | | |
| Carlisle Companies Incorporated | | | | 18,212 | 4,518,761 |
| The AZEK Company Incorporated † | | | | 68,141 | 3,150,840 |
| | | | | | 7,669,601 |
| Commercial services & supplies: 1.99% | | | | | |
| Republic Services Incorporated | | | | 31,548 | 4,399,369 |
| Electrical equipment: 1.37% | | | | | |
| Regal-Beloit Corporation | | | | 17,815 | 3,031,757 |
| Machinery: 5.46% | | | | | |
| Fortive Corporation | | | | 52,782 | 4,026,739 |
| Ingersoll Rand Incorporated | | | | 49,078 | 3,036,456 |
| Otis Worldwide Corporation | | | | 32,219 | 2,805,308 |
| SPX Corporation † | | | | 36,889 | 2,201,536 |
| | | | | | 12,070,039 |
| Professional services: 1.35% | | | | | |
| Dun & Bradstreet Holdings Incorporated † | | | | 145,737 | 2,986,151 |
| Trading companies & distributors: 2.49% | | | | | |
| Air Lease Corporation | | | | 56,152 | 2,483,603 |
| United Rentals Incorporated † | | | | 9,116 | 3,029,156 |
| | | | | | 5,512,759 |
| Information technology: 28.50% | | | | | |
| Electronic equipment, instruments & components: 3.93% | | | | | |
| Amphenol Corporation Class A | | | | 49,740 | 4,350,260 |
| Teledyne Technologies Incorporated † | | | | 9,935 | 4,340,502 |
| | | | | | 8,690,762 |
The accompanying notes are an integral part of these financial statements.
12 | Allspring VT Opportunity Fund
Portfolio of investments—December 31, 2021
| | | | | Shares | Value |
| IT services: 5.27% | | | | | |
| Fidelity National Information Services Incorporated | | | | 33,884 | $ 3,698,439 |
| Genpact Limited | | | | 62,243 | 3,303,858 |
| MasterCard Incorporated Class A | | | | 12,907 | 4,637,743 |
| | | | | | 11,640,040 |
| Semiconductors & semiconductor equipment: 4.32% | | | | | |
| Marvell Technology Incorporated | | | | 45,224 | 3,956,648 |
| Texas Instruments Incorporated | | | | 29,721 | 5,601,517 |
| | | | | | 9,558,165 |
| Software: 10.27% | | | | | |
| Fair Isaac Corporation † | | | | 6,477 | 2,808,881 |
| Palo Alto Networks Incorporated † | | | | 8,191 | 4,560,421 |
| Riskified Limited Class A †« | | | | 69,065 | 542,851 |
| Salesforce.com Incorporated † | | | | 28,167 | 7,158,080 |
| ServiceNow Incorporated † | | | | 5,359 | 3,478,580 |
| Workday Incorporated Class A † | | | | 15,235 | 4,161,897 |
| | | | | | 22,710,710 |
| Technology hardware, storage & peripherals: 4.71% | | | | | |
| Apple Incorporated | | | | 58,625 | 10,410,041 |
| Materials: 2.27% | | | | | |
| Chemicals: 1.55% | | | | | |
| Ashland Global Holdings Incorporated | | | | 31,877 | 3,431,878 |
| Metals & mining: 0.72% | | | | | |
| Steel Dynamics Incorporated | | | | 25,526 | 1,584,399 |
| Real estate: 7.17% | | | | | |
| Equity REITs: 7.17% | | | | | |
| American Tower Corporation | | | | 13,060 | 3,820,050 |
| Equinix Incorporated | | | | 4,949 | 4,186,062 |
| Sun Communities Incorporated | | | | 19,300 | 4,052,421 |
| VICI Properties Incorporated « | | | | 125,797 | 3,787,748 |
| | | | | | 15,846,281 |
| Total Common stocks (Cost $129,089,931) | | | | | 219,571,118 |
| | | Yield | | | |
| Short-term investments: 2.54% | | | | | |
| Investment companies: 2.54% | | | | | |
| Allspring Government Money Market Fund Select Class ♠∞ | | 0.03% | | 1,561,097 | 1,561,097 |
| Securities Lending Cash Investments LLC ♠∩∞ | | 0.07 | | 4,058,435 | 4,058,435 |
| Total Short-term investments (Cost $5,619,532) | | | | | 5,619,532 |
| Total investments in securities (Cost $134,709,463) | 101.84% | | | | 225,190,650 |
| Other assets and liabilities, net | (1.84) | | | | (4,069,750) |
| Total net assets | 100.00% | | | | $221,120,900 |
The accompanying notes are an integral part of these financial statements.
Allspring VT Opportunity Fund | 13
Portfolio of investments—December 31, 2021
| † | Non-income-earning security |
| « | All or a portion of this security is on loan. |
| ♠ | The issuer of the security is an affiliated person of the Fund as defined in the Investment Company Act of 1940. |
| ∩ | The investment is a non-registered investment company purchased with cash collateral received from securities on loan. |
| ∞ | The rate represents the 7-day annualized yield at period end. |
| Abbreviations: |
| REIT | Real estate investment trust |
Investments in affiliates
An affiliated investment is an investment in which the Fund owns at least 5% of the outstanding voting shares of the issuer or as a result of other relationships, such as the Fund and the issuer having the same investment manager. Transactions with issuers that were either affiliates of the Fund at the beginning of the period or the end of the period were as follows:
| | Value,
beginning of
period | Purchases | Sales
proceeds | Net
realized
gains
(losses) | | Net
change in
unrealized
gains
(losses) | | Value,
end of
period | Shares,
end
of period | Income
from
affiliated
securities |
| Short-term investments | | | | | | | | | |
| Allspring Government Money Market Fund Select Class | $2,161,993 | $35,365,103 | $(35,965,999) | $0 | | $0 | | $ 1,561,097 | 1,561,097 | $650 |
| Securities Lending Cash Investments LLC | 0 | 10,080,050 | (6,021,615) | 0 | | 0 | | 4,058,435 | 4,058,435 | 195 # |
| | | | | $0 | | $0 | | $5,619,532 | | $845 |
| # | Amount shown represents income before fees and rebates. |
The accompanying notes are an integral part of these financial statements.
14 | Allspring VT Opportunity Fund
Statement of assets and liabilities—December 31, 2021
| | |
| Assets | |
Investments in unaffiliated securities (including $3,966,501 of securities loaned), at value (cost $129,089,931)
| $ 219,571,118 |
Investments in affiliated securities, at value (cost $5,619,532)
| 5,619,532 |
Receivable for dividends
| 255,585 |
Receivable for Fund shares sold
| 11,232 |
Receivable for securities lending income, net
| 717 |
Prepaid expenses and other assets
| 2,934 |
Total assets
| 225,461,118 |
| Liabilities | |
Payable upon receipt of securities loaned
| 4,058,435 |
Management fee payable
| 118,391 |
Payable for Fund shares redeemed
| 94,451 |
Distribution fee payable
| 41,485 |
Administration fees payable
| 15,714 |
Trustees’ fees and expenses payable
| 1,595 |
Accrued expenses and other liabilities
| 10,147 |
Total liabilities
| 4,340,218 |
Total net assets
| $221,120,900 |
| Net assets consist of | |
Paid-in capital
| $ 97,258,479 |
Total distributable earnings
| 123,862,421 |
Total net assets
| $221,120,900 |
| Computation of net asset value per share | |
Net assets – Class 1
| $ 34,376,325 |
Shares outstanding – Class 11
| 983,303 |
Net asset value per share – Class 1
| $34.96 |
Net assets – Class 2
| $ 186,744,575 |
Shares outstanding – Class 21
| 5,314,747 |
Net asset value per share – Class 2
| $35.14 |
| 1 | The Fund has an unlimited number of authorized shares. |
The accompanying notes are an integral part of these financial statements.
Allspring VT Opportunity Fund | 15
Statement of operations—year ended December 31, 2021
| | |
| Investment income | |
Dividends (net of foreign withholdings taxes of $17,823)
| $ 1,538,358 |
Income from affiliated securities
| 1,724 |
Total investment income
| 1,540,082 |
| Expenses | |
Management fee
| 1,477,763 |
| Administration fees | |
Class 1
| 26,540 |
Class 2
| 142,348 |
| Distribution fee | |
Class 2
| 444,836 |
Custody and accounting fees
| 19,412 |
Professional fees
| 55,955 |
Shareholder report expenses
| 35,832 |
Trustees’ fees and expenses
| 19,219 |
Other fees and expenses
| 6,823 |
Total expenses
| 2,228,728 |
| Less: Fee waivers and/or expense reimbursements | |
Fund-level
| (182,732) |
Class 2
| (17,842) |
Net expenses
| 2,028,154 |
Net investment loss
| (488,072) |
| Realized and unrealized gains (losses) on investments | |
Net realized gains on investments
| 34,674,337 |
Net change in unrealized gains (losses) on investments
| 12,426,757 |
Net realized and unrealized gains (losses) on investments
| 47,101,094 |
Net increase in net assets resulting from operations
| $46,613,022 |
The accompanying notes are an integral part of these financial statements.
16 | Allspring VT Opportunity Fund
Statement of changes in net assets
| | | | | |
| | Year ended
December 31, 2021 | Year ended
December 31, 2020 |
| Operations | | | | |
Net investment income (loss)
| | $ (488,072) | | $ 181,464 |
Net realized gains on investments
| | 34,674,337 | | 9,938,608 |
Net change in unrealized gains (losses) on investments
| | 12,426,757 | | 24,029,460 |
Net increase in net assets resulting from operations
| | 46,613,022 | | 34,149,532 |
| Distributions to shareholders from | | | | |
| Net investment income and net realized gains | | | | |
Class 1
| | (1,721,579) | | (2,328,698) |
Class 2
| | (8,980,638) | | (11,686,840) |
Total distributions to shareholders
| | (10,702,217) | | (14,015,538) |
| Capital share transactions | Shares | | Shares | |
| Proceeds from shares sold | | | | |
Class 1
| 14,838 | 488,248 | 21,174 | 498,604 |
Class 2
| 92,298 | 3,047,866 | 123,816 | 3,170,894 |
| | | 3,536,114 | | 3,669,498 |
| Reinvestment of distributions | | | | |
Class 1
| 53,415 | 1,721,579 | 98,715 | 2,328,698 |
Class 2
| 276,924 | 8,980,638 | 492,285 | 11,686,840 |
| | | 10,702,217 | | 14,015,538 |
| Payment for shares redeemed | | | | |
Class 1
| (172,775) | (5,602,343) | (192,184) | (4,908,447) |
Class 2
| (701,988) | (22,829,650) | (899,151) | (22,533,873) |
| | | (28,431,993) | | (27,442,320) |
Net decrease in net assets resulting from capital share transactions
| | (14,193,662) | | (9,757,284) |
Total increase in net assets
| | 21,717,143 | | 10,376,710 |
| Net assets | | | | |
Beginning of period
| | 199,403,757 | | 189,027,047 |
End of period
| | $221,120,900 | | $199,403,757 |
The accompanying notes are an integral part of these financial statements.
Allspring VT Opportunity Fund | 17
Financial highlights
(For a share outstanding throughout each period)
| | Year ended December 31 |
| Class 1 | 2021 | 2020 | 2019 | 2018 | 2017 |
Net asset value, beginning of period
| $29.48 | $26.56 | $22.76 | $27.05 | $24.60 |
Net investment income (loss)
| (0.01) | 0.09 | 0.17 | 0.15 | 0.13 |
Net realized and unrealized gains (losses) on investments
| 7.25 | 5.03 | 6.84 | (1.69) | 4.77 |
Total from investment operations
| 7.24 | 5.12 | 7.01 | (1.54) | 4.90 |
| Distributions to shareholders from | | | | | |
Net investment income
| (0.08) | (0.19) | (0.15) | (0.12) | (0.25) |
Net realized gains
| (1.68) | (2.01) | (3.06) | (2.63) | (2.20) |
Total distributions to shareholders
| (1.76) | (2.20) | (3.21) | (2.75) | (2.45) |
Net asset value, end of period
| $34.96 | $29.48 | $26.56 | $22.76 | $27.05 |
Total return1
| 25.06% | 21.32% | 31.81% | (6.93)% | 20.72% |
| Ratios to average net assets (annualized) | | | | | |
Gross expenses
| 0.84% | 0.86% | 0.85% | 0.84% | 0.86% |
Net expenses
| 0.75% | 0.75% | 0.75% | 0.75% | 0.75% |
Net investment income (loss)
| (0.02)% | 0.31% | 0.67% | 0.52% | 0.43% |
| Supplemental data | | | | | |
Portfolio turnover rate
| 27% | 42% | 25% | 31% | 36% |
Net assets, end of period (000s omitted)
| $34,376 | $32,066 | $30,811 | $27,165 | $33,843 |
| 1 | Returns do not reflect fees and expenses charged pursuant to the terms of variable life insurance policies and variable annuity contracts. |
The accompanying notes are an integral part of these financial statements.
18 | Allspring VT Opportunity Fund
Financial highlights
(For a share outstanding throughout each period)
| | Year ended December 31 |
| Class 2 | 2021 | 2020 | 2019 | 2018 | 2017 |
Net asset value, beginning of period
| $29.63 | $26.68 | $22.85 | $27.14 | $24.67 |
Net investment income (loss)
| (0.09) | 0.03 | 0.11 | 0.08 | 0.06 |
Net realized and unrealized gains (losses) on investments
| 7.29 | 5.05 | 6.86 | (1.69) | 4.79 |
Total from investment operations
| 7.20 | 5.08 | 6.97 | (1.61) | 4.85 |
| Distributions to shareholders from | | | | | |
Net investment income
| (0.01) | (0.12) | (0.08) | (0.05) | (0.18) |
Net realized gains
| (1.68) | (2.01) | (3.06) | (2.63) | (2.20) |
Total distributions to shareholders
| (1.69) | (2.13) | (3.14) | (2.68) | (2.38) |
Net asset value, end of period
| $35.14 | $29.63 | $26.68 | $22.85 | $27.14 |
Total return1
| 24.78% | 21.00% | 31.46% | (7.15)% | 20.44% |
| Ratios to average net assets (annualized) | | | | | |
Gross expenses
| 1.10% | 1.11% | 1.10% | 1.09% | 1.11% |
Net expenses
| 1.00% | 1.00% | 1.00% | 1.00% | 1.00% |
Net investment income (loss)
| (0.27)% | 0.06% | 0.42% | 0.27% | 0.18% |
| Supplemental data | | | | | |
Portfolio turnover rate
| 27% | 42% | 25% | 31% | 36% |
Net assets, end of period (000s omitted)
| $186,745 | $167,338 | $158,216 | $134,972 | $165,992 |
| 1 | Returns do not reflect fees and expenses charged pursuant to the terms of variable life insurance policies and variable annuity contracts. |
The accompanying notes are an integral part of these financial statements.
Allspring VT Opportunity Fund | 19
Notes to financial statements
1. ORGANIZATION
Allspring Variable Trust (the "Trust"), a Delaware statutory trust organized on March 10, 1999, is an open-end management investment company registered under the Investment Company Act of 1940, as amended (the "1940 Act"). As an investment company, the Trust follows the accounting and reporting guidance in Financial Accounting Standards Board ("FASB") Accounting Standards Codification Topic 946, Financial Services – Investment Companies. These financial statements report on the Allspring VT Opportunity Fund (the "Fund") which is a diversified series of the Trust. The Trust offers shares of the Fund to separate accounts of various life insurance companies as funding vehicles for certain variable annuity contracts and variable life insurance policies.
Effective on November 1, 2021, the sale transaction of Wells Fargo Asset Management ("WFAM") by Wells Fargo & Company to GTCR LLC and Reverence Capital Partners, L.P. was closed. In connection with the closing of the transaction, WFAM became known as Allspring Global Investments (“Allspring”) and various entities that provided services to the Fund changed their names to "Allspring", including Allspring Funds Management, LLC, the investment manager to the Fund, Allspring Global Investments, LLC and Allspring Global Investments (UK) Limited, both registered investment advisers providing subadvisory services to certain funds, and Allspring Funds Distributor, LLC, the Fund's principal underwriter. Consummation of the transaction resulted in a new investment management agreement and subadvisory agreement which became effective on November 1, 2021.
2. SIGNIFICANT ACCOUNTING POLICIES
The following significant accounting policies, which are consistently followed in the preparation of the financial statements of the Fund, are in conformity with U.S. generally accepted accounting principles which require management to make estimates and assumptions that affect the reported amounts of assets and liabilities, disclosure of contingent assets and liabilities at the date of the financial statements, and the reported amounts of income and expenses during the reporting period. Actual results could differ from those estimates.
Securities valuation
All investments are valued each business day as of the close of regular trading on the New York Stock Exchange (generally 4 p.m. Eastern Time), although the Fund may deviate from this calculation time under unusual or unexpected circumstances.
Equity securities that are listed on a foreign or domestic exchange or market are valued at the official closing price or, if none, the last sales price. If no sale occurs on the principal exchange or market that day, a fair value price will be determined in accordance with the Fund’s Valuation Procedures.
The values of securities denominated in foreign currencies are translated into U.S. dollars at rates provided by an independent foreign currency pricing source at a time each business day specified by the Allspring Global Investments Pricing Committee at Allspring Funds Management, LLC ("Allspring Funds Management").
Many securities markets and exchanges outside the U.S. close prior to the close of the New York Stock Exchange and therefore may not fully reflect trading or events that occur after the close of the principal exchange in which the foreign securities are traded, but before the close of the New York Stock Exchange. If such trading or events are expected to materially affect the value of such securities, then fair value pricing procedures approved by the Board of Trustees of the Fund are applied. These procedures take into account multiple factors including movements in U.S. securities markets after foreign exchanges close. Foreign securities that are fair valued under these procedures are categorized as Level 2 and the application of these procedures may result in transfers between Level 1 and Level 2. Depending on market activity, such fair valuations may be frequent. Such fair value pricing may result in net asset values that are higher or lower than net asset values based on the last reported sales price or latest quoted bid price. On December 31, 2021, such fair value pricing was used in pricing certain foreign securities.
Investments in registered open-end investment companies are valued at net asset value. Interests in non-registered investment companies that are redeemable at net asset value are fair valued normally at net asset value.
Investments which are not valued using any of the methods discussed above are valued at their fair value, as determined in good faith by the Board of Trustees. The Board of Trustees has established a Valuation Committee comprised of the Trustees and has delegated to it the authority to take any actions regarding the valuation of portfolio securities that the Valuation Committee deems necessary or appropriate, including determining the fair value of portfolio securities, unless the determination has been delegated to the Allspring Global Investments Pricing Committee. The Board of Trustees retains the authority to make or ratify any valuation decisions or approve any changes to the Valuation Procedures as it deems appropriate. On a quarterly basis, the Board of Trustees receives reports on any valuation actions taken by the Valuation Committee or the Allspring Global Investments Pricing Committee which may include items for ratification.
20 | Allspring VT Opportunity Fund
Notes to financial statements
Foreign currency translation
The accounting records of the Fund are maintained in U.S. dollars. The values of other assets and liabilities denominated in foreign currencies are translated into U.S. dollars at rates provided by an independent foreign currency pricing source at a time each business day specified by the Allspring Global Investments Pricing Committee. Purchases and sales of securities, and income and expenses are converted at the rate of exchange on the respective dates of such transactions. Net realized foreign exchange gains or losses arise from sales of foreign currencies, currency gains or losses realized between the trade and settlement dates on securities transactions, and the difference between the amounts of dividends, interest and foreign withholding taxes recorded and the U.S. dollar equivalent of the amounts actually paid or received. Net unrealized foreign exchange gains and losses arise from changes in the fair value of assets and liabilities other than investments in securities resulting from changes in exchange rates. The changes in net assets arising from changes in exchange rates of securities and the changes in net assets resulting from changes in market prices of securities are not separately presented. Such changes are included in net realized and unrealized gains or losses from investments.
Securities lending
The Fund may lend its securities from time to time in order to earn additional income in the form of fees or interest on securities received as collateral or the investment of any cash received as collateral. When securities are on loan, the Fund receives interest or dividends on those securities. Cash collateral received in connection with its securities lending transactions is invested in Securities Lending Cash Investments, LLC (the "Securities Lending Fund"), an affiliated non-registered investment company. Investments in Securities Lending Fund are valued at the evaluated bid price provided by an independent pricing service. Income earned from investment in the Securities Lending Fund (net of fees and rebates), if any, is included in income from affiliated securities on the Statement of Operations.
In a securities lending transaction, the net asset value of the Fund is affected by an increase or decrease in the value of the securities loaned and by an increase or decrease in the value of the instrument in which collateral is invested. The amount of securities lending activity undertaken by the Fund fluctuates from time to time. The Fund has the right under the lending agreement to recover the securities from the borrower on demand. In the event of default or bankruptcy by the borrower, the Fund may be prevented from recovering the loaned securities or gaining access to the collateral or may experience delays or costs in doing so. In such an event, the terms of the agreement allow the unaffiliated securities lending agent to use the collateral to purchase replacement securities on behalf of the Fund or pay the Fund the market value of the loaned securities. The Fund bears the risk of loss with respect to depreciation of its investment of the cash collateral.
Security transactions and income recognition
Securities transactions are recorded on a trade date basis. Realized gains or losses are recorded on the basis of identified cost.
Dividend income is recognized on the ex-dividend date, except for certain dividends from foreign securities, which are recorded as soon as the custodian verifies the ex-dividend date. Dividend income is recorded net of foreign taxes withheld where recovery of such taxes is not assured.
Distributions to shareholders
Distributions to shareholders from net investment income and any net realized gains are recorded on the ex-dividend date and paid at least annually. Such distributions are determined in accordance with income tax regulations and may differ from U.S. generally accepted accounting principles. Dividend sources are estimated at the time of declaration. The tax character of distributions is determined as of the Fund's fiscal year end. Therefore, a portion of the Fund's distributions made prior to the Fund’s fiscal year end may be categorized as a tax return of capital at year end.
Federal and other taxes
The Fund intends to continue to qualify as a regulated investment company by distributing substantially all of its investment company taxable income and any net realized capital gains (after reduction for capital loss carryforwards) sufficient to relieve it from all, or substantially all, federal income taxes. Accordingly, no provision for federal income taxes was required.
The Fund’s income and federal excise tax returns and all financial records supporting those returns for the prior three fiscal years are subject to examination by the federal and Delaware revenue authorities. Management has analyzed the Fund's tax positions taken on federal, state, and foreign tax returns for all open tax years and does not believe that there are any uncertain tax positions that require recognition of a tax liability.
Allspring VT Opportunity Fund | 21
Notes to financial statements
As of December 31, 2021, the aggregate cost of all investments for federal income tax purposes was $135,229,097 and the unrealized gains (losses) consisted of:
| Gross unrealized gains | $92,865,472 |
| Gross unrealized losses | (2,903,919) |
| Net unrealized gains | $89,961,553 |
Class allocations
The separate classes of shares offered by the Fund differ principally in distribution fees. Class specific expenses are charged directly to that share class. Investment income, common fund-level expenses, and realized and unrealized gains (losses) on investments are allocated daily to each class of shares based on the relative proportion of net assets of each class.
3. FAIR VALUATION MEASUREMENTS
Fair value measurements of investments are determined within a framework that has established a fair value hierarchy based upon the various data inputs utilized in determining the value of the Fund’s investments. The three-level hierarchy gives the highest priority to unadjusted quoted prices in active markets for identical assets or liabilities (Level 1) and the lowest priority to unobservable inputs (Level 3). The Fund’s investments are classified within the fair value hierarchy based on the lowest level of input that is significant to the fair value measurement. The inputs are summarized into three broad levels as follows:
| ■ | Level 1 – quoted prices in active markets for identical securities |
| ■ | Level 2 – other significant observable inputs (including quoted prices for similar securities, interest rates, prepayment speeds, credit risk, etc.) |
| ■ | Level 3 – significant unobservable inputs (including the Fund’s own assumptions in determining the fair value of investments) |
The inputs or methodologies used for valuing investments in securities are not necessarily an indication of the risk associated with investing in those securities.
The following is a summary of the inputs used in valuing the Fund’s assets and liabilities as of December 31, 2021:
| | Quoted prices
(Level 1) | Other significant
observable inputs
(Level 2) | Significant
unobservable inputs
(Level 3) | Total |
| Assets | | | | |
| Investments in: | | | | |
| Common stocks | | | | |
| Communication services | $ 21,341,756 | $ 0 | $0 | $ 21,341,756 |
| Consumer discretionary | 28,999,942 | 0 | 0 | 28,999,942 |
| Consumer staples | 5,679,007 | 0 | 0 | 5,679,007 |
| Financials | 16,013,389 | 0 | 0 | 16,013,389 |
| Health care | 26,007,476 | 0 | 0 | 26,007,476 |
| Industrials | 35,669,676 | 1,987,596 | 0 | 37,657,272 |
| Information technology | 63,009,718 | 0 | 0 | 63,009,718 |
| Materials | 5,016,277 | 0 | 0 | 5,016,277 |
| Real estate | 15,846,281 | 0 | 0 | 15,846,281 |
| Short-term investments | | | | |
| Investment companies | 5,619,532 | 0 | 0 | 5,619,532 |
| Total assets | $223,203,054 | $1,987,596 | $0 | $225,190,650 |
Additional sector, industry or geographic detail, if any, is included in the Portfolio of Investments.
For the year ended December 31, 2021, the Fund did not have any transfers into/out of Level 3.
22 | Allspring VT Opportunity Fund
Notes to financial statements
4. TRANSACTIONS WITH AFFILIATES
Management fee
Allspring Funds Management, a wholly owned subsidiary of Allspring Global Investments Holdings, LLC, a holding company indirectly owned by certain private funds of GTCR LLC and Reverence Capital Partners, L.P., is the manager of the Fund and provides advisory and fund-level administrative services under an investment management agreement. Under the investment management agreement, Allspring Funds Management is responsible for, among other services, implementing the investment objectives and strategies of the Fund, supervising the subadviser and providing fund-level administrative services in connection with the Fund’s operations. As compensation for its services under the investment management agreement, Allspring Funds Management is entitled to receive a management fee at the following annual rate based on the Fund’s average daily net assets:
| Average daily net assets | Management fee |
| First $500 million | 0.700% |
| Next $500 million | 0.675 |
| Next $1 billion | 0.650 |
| Next $2 billion | 0.625 |
| Next $1 billion | 0.600 |
| Next $5 billion | 0.590 |
| Over $10 billion | 0.580 |
For the year ended December 31, 2021, the management fee was equivalent to an annual rate of 0.70% of the Fund’s average daily net assets.
Allspring Funds Management has retained the services of a subadviser to provide daily portfolio management to the Fund. The fee for subadvisory services is borne by Allspring Funds Management. Allspring Global Investments, LLC ("Allspring Investments"), an affiliate of Allspring Funds Management and a wholly owned subsidiary of Allspring Global Investments Holdings, LLC, is the subadviser to the Fund and is entitled to receive a fee from Allspring Funds Management at an annual rate starting at 0.45% and declining to 0.30% as the average daily net assets of the Fund increase.
Administration fees
Under a class-level administration agreement, Allspring Funds Management provides class-level administrative services to the Fund, which includes paying fees and expenses for services provided by the transfer agent, sub-transfer agents, omnibus account services and record-keepers. As compensation for its services under the class-level administration agreement, Allspring Funds Management receives an annual fee of 0.08% which is calculated based on the average daily net assets of each class.
Waivers and/or expense reimbursements
Allspring Funds Management has contractually committed to waive and/or reimburse management and administration fees to the extent necessary to maintain certain net operating expense ratios for the Fund. When each class of the Fund has exceeded its expense cap, Allspring Funds Management will waive fees and/or reimburse expenses from fund-level expenses on a proportionate basis and then from class specific expenses. When only certain classes exceed their expense caps, waivers and/or reimbursements are applied against class specific expenses before fund-level expenses. Allspring Funds Management has contractually committed through April 30, 2022 to waive fees and/or reimburse expenses to the extent necessary to cap expenses. Prior to or after the commitment expiration date, the caps may be increased or the commitment to maintain the caps may be terminated only with the approval of the Board of Trustees. The contractual expense caps are as follows:
| | Expense ratio caps |
| Class 1 | 0.75% |
| Class 2 | 1.00 |
Distribution fee
The Trust has adopted a distribution plan for Class 2 shares of the Fund pursuant to Rule 12b-1 under the 1940 Act. A distribution fee is charged to Class 2 shares and paid to Allspring Funds Distributor, LLC, an affiliate of Allspring Funds Management, the principal underwriter, at an annual rate of 0.25% of the average daily net assets of Class 2 shares.
Allspring VT Opportunity Fund | 23
Notes to financial statements
Interfund transactions
The Fund may purchase or sell portfolio investment securities to certain affiliates pursuant to Rule 17a-7 under the 1940 Act and under procedures adopted by the Board of Trustees. The procedures have been designed to ensure that these interfund transactions, which do not incur broker commissions, are effected at current market prices.
5. INVESTMENT PORTFOLIO TRANSACTIONS
Purchases and sales of investments, excluding U.S. government obligations (if any) and short-term securities, for the year ended December 31, 2021 were $55,197,725 and $79,676,825, respectively.
6. SECURITIES LENDING TRANSACTIONS
The Fund lends its securities through an unaffiliated securities lending agent and receives collateral in the form of cash or securities with a value at least equal to the value of the securities on loan. The value of the loaned securities is determined at the close of each business day and any increases or decreases in the required collateral are exchanged between the Fund and the counterparty on the next business day. Cash collateral received is invested in the Securities Lending Fund which seeks to provide a positive return compared to the daily Federal Funds Open Rate by investing in high-quality, U.S. dollar-denominated short-term money market instruments and is exempt from registration under Section 3(c)(7) of the 1940 Act. Securities Lending Fund is managed by Allspring Funds Management and is subadvised by Allspring Investments. Allspring Funds Management receives an advisory fee starting at 0.05% and declining to 0.01% as the average daily net assets of the Securities Lending Fund increase. All of the fees received by Allspring Funds Management are paid to Allspring Investments for its services as subadviser.
In the event of counterparty default or the failure of a borrower to return a loaned security, the Fund has the right to use the collateral to offset any losses incurred. As of December 31, 2021, the Fund had securities lending transactions with the following counterparties which are subject to offset:
| Counterparty | Value of
securities on
loan | Collateral
received1 | Net amount |
| Citigroup Global Markets Incorporated | $ 168,204 | $ (168,204) | $0 |
| Deutsche Bank Securities Incorporated | 3,622,233 | (3,622,233) | 0 |
| JPMorgan Securities LLC | 176,064 | (176,064) | 0 |
1 Collateral received within this table is limited to the collateral for the net transaction with the counterparty.
7. BANK BORROWINGS
The Trust, Allspring Master Trust and Allspring Funds Trust (excluding the money market funds) are parties to a $350,000,000 revolving credit agreement whereby the Fund is permitted to use bank borrowings for temporary or emergency purposes, such as to fund shareholder redemption requests. Interest under the credit agreement is charged to the Fund based on a borrowing rate equal to the higher of the Federal Funds rate in effect on that day plus 1.25% or the overnight bank funding rate in effect on that day plus 1.25%. In addition, an annual commitment fee equal to 0.25% of the unused balance is allocated to each participating fund.
For the year ended December 31, 2021, there were no borrowings by the Fund under the agreement.
8. DISTRIBUTIONS TO SHAREHOLDERS
The tax character of distributions paid during the years ended December 31, 2021 and December 31, 2020 were as follows:
| | Year ended December 31 |
| | 2021 | 2020 |
| Ordinary income | $ 155,690 | $ 3,149,628 |
| Long-term capital gain | 10,546,527 | 10,865,910 |
24 | Allspring VT Opportunity Fund
Notes to financial statements
As of December 31, 2021, the components of distributable earnings on a tax basis were as follows:
Undistributed
ordinary
income | Undistributed
long-term
gain | Unrealized
gains |
| $4,301,723 | $29,603,876 | $89,961,464 |
9. CONCENTRATION RISKS
As of the end of the period, the Fund concentrated its portfolio of investments in the information technology sector. A fund that invests a substantial portion of its assets in any sector may be more affected by changes in that sector than would be a fund whose investments are not heavily weighted in any sector.
10. INDEMNIFICATION
Under the Fund's organizational documents, the officers and Trustees have been granted certain indemnification rights against certain liabilities that may arise out of performance of their duties to the Fund. The Fund has entered into a separate agreement with each Trustee that converts indemnification rights currently existing under the Fund’s organizational documents into contractual rights that cannot be changed in the future without the consent of the Trustee. Additionally, in the normal course of business, the Fund may enter into contracts with service providers that contain a variety of indemnification clauses. The Fund’s maximum exposure under these arrangements is dependent on future claims that may be made against the Fund and, therefore, cannot be estimated.
11. CORONAVIRUS (COVID-19) PANDEMIC
On March 11, 2020, the World Health Organization announced that it had made the assessment that coronavirus disease 2019 (“COVID-19”) is a pandemic. The impacts of COVID-19 are affecting the entire global economy, individual companies and investment products, the funds, and the market in general. There is significant uncertainty around the extent and duration of business disruptions related to COVID-19 and the impacts may last for an extended period of time. COVID-19 has led to significant uncertainty and volatility in the financial markets.
Allspring VT Opportunity Fund | 25
Report of independent registered public accounting firm
To the Shareholders of the Fund and Board of Trustees
Allspring Variable Trust:
Opinion on the Financial Statements
We have audited the accompanying statement of assets and liabilities of Allspring VT Opportunity Fund (formerly, Wells Fargo VT Opportunity Fund) (the Fund), one of the funds constituting Allspring Variable Trust (formerly, Wells Fargo Variable Trust), including the portfolio of investments, as of December 31, 2021, the related statement of operations for the year then ended, the statements of changes in net assets for each of the years in the two-year period then ended, and the related notes (collectively, the financial statements) and the financial highlights for each of the years in the five-year period then ended. In our opinion, the financial statements and financial highlights present fairly, in all material respects, the financial position of the Fund as of December 31, 2021, the results of its operations for the year then ended, the changes in its net assets for each of the years in the two-year period then ended, and the financial highlights for each of the years in the five-year period then ended, in conformity with U.S. generally accepted accounting principles.
Basis for Opinion
These financial statements and financial highlights are the responsibility of the Fund’s management. Our responsibility is to express an opinion on these financial statements and financial highlights based on our audits. We are a public accounting firm registered with the Public Company Accounting Oversight Board (United States) (PCAOB) and are required to be independent with respect to the Fund in accordance with the U.S. federal securities laws and the applicable rules and regulations of the Securities and Exchange Commission and the PCAOB.
We conducted our audits in accordance with the standards of the PCAOB. Those standards require that we plan and perform the audit to obtain reasonable assurance about whether the financial statements and financial highlights are free of material misstatement, whether due to error or fraud. Our audits included performing procedures to assess the risks of material misstatement of the financial statements and financial highlights, whether due to error or fraud, and performing procedures that respond to those risks. Such procedures included examining, on a test basis, evidence regarding the amounts and disclosures in the financial statements and financial highlights. Such procedures also included confirmation of securities owned as of December 31, 2021, by correspondence with the custodian and transfer agent. Our audits also included evaluating the accounting principles used and significant estimates made by management, as well as evaluating the overall presentation of the financial statements and financial highlights. We believe that our audits provide a reasonable basis for our opinion.

We have not been able to determine the specific year that we began serving as the auditor of one or more Allspring Funds investment companies; however, we are aware that we have served as the auditor of one or more Allspring Funds investment companies since at least 1955.
Boston, Massachusetts
February 25, 2022
26 | Allspring VT Opportunity Fund
Other information (unaudited)
TAX INFORMATION
For corporate shareholders, pursuant to Section 854 of the Internal Revenue Code, 100% of ordinary income dividends qualify for the corporate dividends-received deduction for the fiscal year ended December 31, 2021.
Pursuant to Section 852 of the Internal Revenue Code, $10,546,527 was designated as a 20% rate gain distribution for the fiscal year ended December 31, 2021.
PROXY VOTING INFORMATION
A description of the policies and procedures used to determine how to vote proxies relating to portfolio securities is available without charge, upon request, by calling 1-800-260-5969, visiting our website at allspringglobal.com, or visiting the SEC website at sec.gov. Information regarding how the proxies related to portfolio securities were voted during the most recent 12-month period ended June 30 is available on the website at allspringglobal.com or by visiting the SEC website at sec.gov.
SPECIAL MEETING OF SHAREHOLDERS
On August 16, 2021, a Special Meeting of Shareholders for the Fund was held to consider the following proposals. The results of the proposals are indicated below.
Proposal 1 – To consider and approve a new investment management agreement with Wells Fargo Funds Management, LLC*.
| Shares voted “For” | | 4,479,870 |
| Shares voted “Against” | | 332,172 |
| Shares voted “Abstain” | | 471,228 |
Proposal 2 – To consider and approve a new subadvisory agreement with Wells Capital Management, LLC**.
| Shares voted “For” | | 4,413,546 |
| Shares voted “Against” | | 379,558 |
| Shares voted “Abstain” | | 490,166 |
* Effective November 1, 2021, known as Allspring Funds Management, LLC.
** Effective November 1, 2021, known as Allspring Global Investments, LLC.
QUARTERLY PORTFOLIO HOLDINGS INFORMATION
The Fund files its complete schedule of portfolio holdings with the SEC for the first and third quarters of each fiscal year as an exhibit to its reports on Form N-PORT. Shareholders may view the filed Form N-PORT by visiting the SEC website at sec.gov.
Allspring VT Opportunity Fund | 27
Other information (unaudited)
BOARD OF TRUSTEES AND OFFICERS
Each of the Trustees and Officers listed in the table below acts in identical capacities for each fund in the Allspring family of funds, which consists of 139 mutual funds comprising the Allspring Funds Trust, Allspring Variable Trust, Allspring Master Trust and four closed-end funds (collectively the “Fund Complex”). This table should be read in conjunction with the Prospectus and the Statement of Additional Information1. The mailing address of each Trustee and Officer is 525 Market Street, 12th Floor, San Francisco, CA 94105. Each Trustee and Officer serves an indefinite term, however, each Trustee serves such term until reaching the mandatory retirement age established by the Trustees.
Independent Trustees
Name and
year of birth | Position held and
length of service* | Principal occupations during past five years or longer | Current other
public company or
investment
company
directorships |
William R. Ebsworth
(Born 1957) | Trustee,
since 2015 | Retired. From 1984 to 2013, equities analyst, portfolio manager, research director and chief investment officer at Fidelity Management and Research Company in Boston, Tokyo, and Hong Kong, and retired in 2013 as Chief Investment Officer of Fidelity Strategic Advisers, Inc. where he led a team of investment professionals managing client assets. Prior thereto, Board member of Hong Kong Securities Clearing Co., Hong Kong Options Clearing Corp., the Thailand International Fund, Ltd., Fidelity Investments Life Insurance Company, and Empire Fidelity Investments Life Insurance Company. Audit Committee Chair and Investment Committee Chair of the Vincent Memorial Hospital Endowment (non-profit organization). Mr. Ebsworth is a CFA® charterholder. | N/A |
Jane A. Freeman
(Born 1953) | Trustee,
since 2015;
Chair Liaison,
since 2018 | Retired. From 2012 to 2014 and 1999 to 2008, Chief Financial Officer of Scientific Learning Corporation. From 2008 to 2012, Ms. Freeman provided consulting services related to strategic business projects. Prior to 1999, Portfolio Manager at Rockefeller & Co. and Scudder, Stevens & Clark. Board member of the Harding Loevner Funds from 1996 to 2014, serving as both Lead Independent Director and chair of the Audit Committee. Board member of the Russell Exchange Traded Funds Trust from 2011 to 2012 and the chair of the Audit Committee. Ms. Freeman is also an inactive Chartered Financial Analyst. | N/A |
Isaiah Harris, Jr.
(Born 1952) | Trustee,
since 2009; Audit
Committee
Chair,
since 2019 | Retired. Chairman of the Board of CIGNA Corporation from 2009 to 2021, and Director from 2005 to 2008. From 2003 to 2011, Director of Deluxe Corporation. Prior thereto, President and CEO of BellSouth Advertising and Publishing Corp. from 2005 to 2007, President and CEO of BellSouth Enterprises from 2004 to 2005 and President of BellSouth Consumer Services from 2000 to 2003. Emeritus member of the Iowa State University Foundation Board of Governors. Emeritus Member of the Advisory Board of Iowa State University School of Business. Advisory Board Member, Palm Harbor Academy (private school). Advisory Board Member, Fellowship of Christian Athletes. Mr. Harris is a certified public accountant (inactive status). | N/A |
Judith M. Johnson**
(Born 1949) | Trustee,
since 2008 | Retired. Prior thereto, Chief Executive Officer and Chief Investment Officer of Minneapolis Employees Retirement Fund from 1996 to 2008. Ms. Johnson is an attorney, certified public accountant and a certified managerial accountant. | N/A |
David F. Larcker
(Born 1950) | Trustee,
since 2009 | James Irvin Miller Professor of Accounting at the Graduate School of Business (Emeritus), Stanford University, Director of the Corporate Governance Research Initiative and Senior Faculty of The Rock Center for Corporate Governance since 2006. From 2005 to 2008, Professor of Accounting at the Graduate School of Business, Stanford University. Prior thereto, Ernst & Young Professor of Accounting at The Wharton School, University of Pennsylvania from 1985 to 2005. | N/A |
28 | Allspring VT Opportunity Fund
Other information (unaudited)
Name and
year of birth | Position held and
length of service* | Principal occupations during past five years or longer | Current other
public company or
investment
company
directorships |
Olivia S. Mitchell
(Born 1953) | Trustee,
since 2006;
Nominating and
Governance
Committee Chair,
since 2018 | International Foundation of Employee Benefit Plans Professor since 1993, Wharton School of the University of Pennsylvania. Director of Wharton’s Pension Research Council and Boettner Center on Pensions & Retirement Research, and Research Associate at the National Bureau of Economic Research. Previously taught at Cornell University from 1978 to 1993. | N/A |
Timothy J. Penny
(Born 1951) | Trustee,
since 1996;
Chair,
since 2018 | President and Chief Executive Officer of Southern Minnesota Initiative Foundation, a non-profit organization, since 2007. Member of the Board of Trustees of NorthStar Education Finance, Inc., a non-profit organization, since 2007. | N/A |
James G. Polisson
(Born 1959) | Trustee,
since 2018 | Retired. Chief Marketing Officer, Source (ETF) UK Services, Ltd, from 2015 to 2017. From 2012 to 2015, Principal of The Polisson Group, LLC, a management consulting, corporate advisory and principal investing company. Chief Executive Officer and Managing Director at Russell Investments, Global Exchange Traded Funds from 2010 to 2012. Managing Director of Barclays Global Investors from 1998 to 2010 and Global Chief Marketing Officer for iShares and Barclays Global Investors from 2000 to 2010. Trustee of the San Francisco Mechanics’ Institute, a non-profit organization, from 2013 to 2015. Board member of the Russell Exchange Traded Fund Trust from 2011 to 2012. Director of Barclays Global Investors Holdings Deutschland GmbH from 2006 to 2009. Mr. Polisson is an attorney and has a retired status with the Massachusetts and District of Columbia Bar Associations. | N/A |
Pamela Wheelock
(Born 1959) | Trustee,
since January
2020; previously
Trustee from
January 2018 to
July 2019 | Board member of the Destination Medical Center Economic Development Agency, Rochester, Minnesota since 2019. Interim President of the McKnight Foundation from January to September 2020. McKnight Foundation Consultant, November 2020 to February 2021. Acting Commissioner, Minnesota Department of Human Services, July 2019 through September 2019. Consultant (part-time), Minnesota Department of Human Services, October 2019 through December 2019. Chief Operating Officer, Twin Cities Habitat for Humanity from 2017 to 2019. Vice President of University Services, University of Minnesota from 2012 to 2016. Prior thereto, on the Board of Directors, Governance Committee and Finance Committee for the Minnesota Philanthropy Partners (Saint Paul Foundation) from 2012 to 2018, Interim Chief Executive Officer of Blue Cross Blue Shield of Minnesota from 2011 to 2012, Chairman of the Board from 2009 to 2012 and Board Director from 2003 to 2015. Vice President, Leadership and Community Engagement, Bush Foundation, Saint Paul, Minnesota (a private foundation) from 2009 to 2011. Executive Vice President and Chief Financial Officer, Minnesota Sports and Entertainment from 2004 to 2009 and Senior Vice President from 2002 to 2004. Executive Vice President of the Minnesota Wild Foundation from 2004 to 2008. Commissioner of Finance, State of Minnesota, from 1999 to 2002. Currently Board Chair of the Minnesota Wild Foundation since 2010. | N/A |
* Length of service dates reflect the Trustee’s commencement of service with the Trust’s predecessor entities, where applicable.
** Ms. Johnson has resigned from the Board effective December 31, 2021.
Allspring VT Opportunity Fund | 29
Other information (unaudited)
Officers2
Name and
year of birth | Position held and
length of service | Principal occupations during past five years or longer |
Andrew Owen
(Born 1960) | President,
since 2017 | President, Chief Executive Officer and Director of Allspring Funds Management, LLC since 2017 and co-president of Galliard Capital Management, LLC, an affiliate of Allspring Funds Management, LLC, since 2019. Prior thereto, Head of Affiliated Managers, Allspring Global Investments, from 2014 to 2019 and Executive Vice President responsible for marketing, investments and product development for Allspring Funds Management, LLC, from 2009 to 2014. In addition, Mr. Owen was an Executive Vice President of Wells Fargo & Company from 2014 to 2021. |
Jeremy DePalma
(Born 1974) | Treasurer,
since 2012
(for certain funds in
the Fund Complex);
since 2021 (for
the remaining funds in the
Fund Complex) | Senior Vice President of Allspring Funds Management, LLC since 2009. Senior Vice President of Evergreen Investment Management Company, LLC from 2008 to 2010 and head of the Fund Reporting and Control Team within Fund Administration. |
Kate McKinley
(Born 1977) | Chief Legal Officer,
since 2021 | Chief Legal Officer of Allspring Global Investments since 2021. Prior thereto, held various roles at State Street Global Advisors beginning in 2010, including serving as Senior Vice President and General Counsel from 2019 to 2021, and Chief Operating Officer of the Institutional Client Group from 2016 - 2019. Prior to working at State Street Global Advisors served as Assistant General Counsel for Bank of America Corporation from 2005 to 2010 and as an Associate at WilmerHale from 2002 to 2005. |
Christopher Baker
(Born 1976) | Chief Compliance Officer, since 2022 | Global Chief Compliance Officer for Allspring Global Investments since 2022. Prior thereto, Chief Compliance Officer for State Street Global Advisors from 2018 to 2021. Senior Compliance Officer for the State Street divisions of Alternative Investment Solutions, Sector Solutions, and Global Marketing from 2015 to 2018. From 2010 to 2015 Vice President, Global Head of Investment and Marketing Compliance for State Street Global Advisors. |
Matthew Prasse
(Born 1983) | Secretary,
since 2021 | Senior Counsel of the Allspring Legal Department since 2021. Senior Counsel of the Wells Fargo Legal Department from 2018 to 2021. Previously, Counsel for Barings LLC from 2015 to 2018. Prior to joining Barings, Associate at Morgan, Lewis & Bockius LLP from 2008 to 2015. |
1 The Statement of Additional Information includes additional information about the Trustees and is available, without charge, upon request, by calling 1-800-222-8222 or by visiting the website at allspringglobal.com.
2 For those Officers with tenures at Allspring Global Investments and/or Allspring Funds Management, LLC that began prior to 2021, such tenures include years of service during which these businesses/entities were known as Wells Fargo Asset Management and Wells Fargo Funds Management, LLC, respectively.
30 | Allspring VT Opportunity Fund
For more information
More information about Allspring Funds is available free upon request. To obtain literature, please write, visit the Fund's website, or call:
Allspring Funds
P.O. Box 219967
Kansas City, MO 64121-9967
Website: allspringglobal.com
Individual investors: 1-800-260-5969
Retail investment professionals: 1-888-877-9275
Institutional investment professionals: 1-866-765-0778
This report and the financial statements contained herein are submitted for the general information of the shareholders of the Fund. If this report is used for promotional purposes, distribution of the report must be accompanied or preceded by a current prospectus. Before investing, please consider the investment objectives, risks, charges, and expenses of the investment. For a current prospectus and, if available, a summary prospectus, containing this information, call
1-800-260-5969 or visit the Fund's website at allspringglobal.com. Read the prospectus carefully before you invest or send money.
Allspring Global InvestmentsTM is the trade name for the asset management firms of Allspring Global Investments Holdings, LLC, a holding company indirectly owned by certain private funds of GTCR LLC and Reverence Capital Partners, L.P. These firms include but are not limited to Allspring Global Investments, LLC, and Allspring Funds Management, LLC. Certain products managed by Allspring entities are distributed by Allspring Funds Distributor, LLC (a broker-dealer and Member FINRA/SIPC).
This material is for general informational and educational purposes only and is NOT intended to provide investment advice or a recommendation of any kind - including a recommendation for any specific investment, strategy, or plan.
© 2022 Allspring Global Investments Holdings, LLC. All rights reserved.
PAR-0122-00230 02-22
AVT6/AR152 12-21
Annual Report
December 31, 2021
Allspring
VT Small Cap Growth Fund
The views expressed and any forward-looking statements are as of December 31, 2021, unless otherwise noted, and are those of the Fund's portfolio managers and/or Allspring Global Investments. Discussions of individual securities or the markets generally are not intended as individual recommendations. Future events or results may vary significantly from those expressed in any forward-looking statements. The views expressed are subject to change at any time in response to changing circumstances in the market. Allspring Global Investments disclaims any obligation to publicly update or revise any views expressed or forward-looking statements.
Allspring VT Small Cap Growth Fund | 1
Letter to shareholders (unaudited)
Andrew Owen
President
Allspring Funds
Dear Shareholder:
We are pleased to offer you this annual report for the Allspring VT Small Cap Growth Fund for the 12-month period that ended December 31, 2021. Global stocks yielded mixed results as the global economy continued to emerge from the haze of COVID-19. Tailwinds were provided by global stimulus programs, a rapid vaccination rollout, and recovering consumer and corporate sentiment. Bonds also saw mixed performance during the period.
For the 12-month period, equities had mixed returns as policymakers continued to fight the effects of COVID-19. U.S. stocks led both non-U.S. developed market equities and emerging market stocks. Returns by fixed-income securities were also a mix of positive and negative. For the period, U.S. stocks, based on the S&P 500 Index,1 gained 28.71%. International stocks, as measured by the MSCI ACWI ex USA Index (Net),2 returned 7.82%, while the MSCI EM Index (Net) (USD)3 had weaker performance with a 2.54% loss. Among bond indexes, the Bloomberg U.S. Aggregate Bond Index4 returned -1.54%, the Bloomberg Global Aggregate ex-USD Index (unhedged)5 returned -7.05%, the Bloomberg Municipal Bond Index6 gained 1.52%, and the ICE BofA U.S. High Yield Index7 returned 5.36%.
Efforts to contain COVID-19 drove market performance.
The year 2021 began with emerging market stocks leading all major asset classes in January, driven by China’s strong economic growth and a broad recovery in corporate earnings, which propelled China’s stock market higher. In the U.S., positive news on vaccine trials and January expansion in both the manufacturing and services sectors were offset by a weak December monthly jobs report. This was compounded by technical factors as some hedge funds were forced to sell stocks to protect themselves against a well-publicized short squeeze coordinated by a group of retail investors. Eurozone sentiment and economic growth were particularly weak, reflecting the impact of a new lockdown with stricter social distancing along with a slow vaccine rollout.
February saw major domestic equity indexes driven higher on the hope of a new stimulus bill, improving COVID-19 vaccination numbers, and the gradual reopening of the economy. Most S&P 500 companies reported better-than-expected earnings, with positive surprises coming from the financials, information technology, health care, and materials sectors. Japan saw its economy strengthen as a result of strong export numbers. Meanwhile, crude oil prices continued their climb, rising more than 25% for the year. Domestic government bonds experienced a sharp sell-off in late February as markets priced in a more robust economic recovery and higher future growth and inflation expectations.
| 1 | The S&P 500 Index consists of 500 stocks chosen for market size, liquidity, and industry group representation. It is a market-value-weighted index with each stock's weight in the index proportionate to its market value. You cannot invest directly in an index. |
| 2 | The Morgan Stanley Capital International (MSCI) All Country World Index (ACWI) ex USA Index (Net) is a free-float-adjusted market-capitalization-weighted index that is designed to measure the equity market performance of developed and emerging markets, excluding the U.S. Source: MSCI. MSCI makes no express or implied warranties or representations and shall have no liability whatsoever with respect to any MSCI data contained herein. The MSCI data may not be further redistributed or used as a basis for other indexes or any securities or financial products. This report is not approved, reviewed, or produced by MSCI. You cannot invest directly in an index. |
| 3 | The MSCI Emerging Markets (EM) Index (Net) (USD) is a free-float-adjusted market-capitalization-weighted index that is designed to measure equity market performance of emerging markets. You cannot invest directly in an index. |
| 4 | The Bloomberg U.S. Aggregate Bond Index is a broad-based benchmark that measures the investment-grade, U.S.-dollar-denominated, fixed-rate taxable bond market, including Treasuries, government-related and corporate securities, mortgage-backed securities (agency fixed-rate and hybrid adjustable-rate mortgage pass-throughs), asset-backed securities, and commercial mortgage-backed securities. You cannot invest directly in an index. |
| 5 | The Bloomberg Global Aggregate ex-USD Index (unhedged) is an unmanaged index that provides a broad-based measure of the global investment-grade fixed-income markets excluding the U.S.-dollar-denominated debt market. You cannot invest directly in an index. |
| 6 | The Bloomberg Municipal Bond Index is an unmanaged index composed of long-term tax-exempt bonds with a minimum credit rating of Baa. You cannot invest directly in an index. |
| 7 | The ICE BofA U.S. High Yield Index is a market-capitalization-weighted index of domestic and Yankee high-yield bonds. The index tracks the performance of high-yield securities traded in the U.S. bond market. You cannot invest directly in an index. Copyright 2022. ICE Data Indices, LLC. All rights reserved. |
2 | Allspring VT Small Cap Growth Fund
Letter to shareholders (unaudited)
The passage of the massive domestic stimulus bill highlighted March activity, leading to increased forecasts for U.S. growth in 2021. Domestic employment surged as COVID-19 vaccinations and an increasingly open economy spurred hiring. A majority of U.S. small companies reported they were operating at pre-pandemic capacity or higher. Value stocks continued their outperformance of growth stocks in the month, continuing the trend that started in late 2020. Meanwhile, most major developed global equity indexes were up month to date on the back of rising optimism regarding the outlook for global growth. While the U.S. and the U.K. have been the most successful in terms of the vaccine rollout, even in markets where the vaccine has lagged, such as in the eurozone and Japan, equity indexes in many of those countries have also been in positive territory for the year through March 2021.
Equity markets produced another strong showing in April. Domestically, the continued reopening of the economy had a strong impact on positive equity performance, as people started leaving their households and jobless claims continued to fall. Domestic corporate bonds performed well and the U.S. dollar weakened. Meanwhile, the U.S. government continued to seek to invest in the recovery, this time by outlining a package of over $2 trillion to improve infrastructure. The primary headwind in April was inflation, as investors tried to determine the breadth and longevity of recent price increases. Developed Europe has been supported by a meaningful increase in the pace of vaccinations. Unfortunately many emerging market countries have not been as successful. India in particular saw COVID-19 cases surge, serving as an example of the need to get vaccinations rolled out to less developed nations.
Vaccine rollouts continued in May, leading to loosened restrictions globally. As a result, equity markets in general saw a minor increase in returns. Concerns that the continued economic rebound could result in inflation increases becoming more than transitory were supported by the higher input costs businesses were experiencing. Meanwhile, those inflation concerns were tempered by the U.S. Federal Reserve (Fed), which stayed steady on its view of the economy and eased fears of a sudden and substantial policy change. Positive performance in the emerging market equity space was supported this month by steady consumer demand and strong commodity prices. Fixed-income markets were also slightly positive for the month, driven by inflation uncertainty and a softer U.S. dollar.
June witnessed the S&P 500 Index reach a new all-time high. 2021 economic growth and inflation forecasts were revised higher to reflect a strong economic recovery and some supply and demand imbalances. Late June saw a deal reached on a U.S. infrastructure package of approximately $1 trillion for road, bridge, and broadband network upgrades over the next eight years. The Fed’s June meeting yielded no change to policy, but its projections pointed to a possible interest rate rise in 2023. This, combined with a rebound in economic activity and investors searching for yield, led to U.S. Treasury yields being down for the month. Many European and Asian countries saw vaccination momentum increase, while the U.K. dealt with a rise in COVID-19 infections, specifically the Delta variant. Meanwhile, crude oil jumped over 10% in June on the back of the pickup in global economic activity and the Organization of the Petroleum Exporting Countries’ (OPEC) slow pace of supply growth.
July began the month seeing vaccinations making progress, as several major developed countries eased restrictions, only to be threatened again by the spread of COVID-19’s Delta variant. Inflation continued to climb, aided by the continued supply bottleneck in the face of high demand. As it pertains to the equity area of the market, U.S. equities led the way in positive return territory followed by international developed markets. In contrast, emerging markets were well in negative territory for the month, hindered by China’s plans for new regulations on a number of sectors, specifically education and technology. The U.S. 10-year Treasury bond yield continued to decline as strong demand swallowed up supply. After hitting a multiyear high earlier in the month, oil prices leveled off following an agreement by OPEC to raise oil production starting in August.
Allspring VT Small Cap Growth Fund | 3
Letter to shareholders (unaudited)
“ Municipal debt experienced its first monthly performance drop since February of this year, slowing a rally that made it one of the best-performing sectors of the bond market.” |
The Delta variant of COVID-19 produced outbreaks globally in August, increasing the potential for increased market volatility and bringing into question the ongoing economic recovery. Domestically, the U.S. economy continued to stay strong in the face of the Delta variant, continued inflationary pressures, and worries over Hurricane Ida. Emerging market equities experienced elevated volatility, largely influenced by China’s regulatory stance. Emerging market equities started the month with poor performance but rebounded to end the month in positive territory. Municipal debt experienced its first monthly performance drop since February of this year, slowing a rally that made it one of the best-performing sectors of the bond market. In the commodity segment of the market, crude oil fell sharply during the month on the back of dampened expectations as a result of the Delta variant but was still a leading asset-class performer for the year.
Global markets suffered their broadest retreat in a year during September, with the exception of commodities. Concerns over inflation and the interest rate outlook depressed investor confidence and hurt performance. Emerging markets declined on concerns over the continued supply chain disruptions and worries over higher energy and food prices. Meanwhile, the Fed indicated it would slow the pace of asset purchases in the near future (pointing towards November). All eyes domestically are fixed on the raising of the debt ceiling, the 2022 budget plan, and the ongoing debate over the infrastructure package. Contrary to most asset classes, commodities thrived in September, driven by sharply higher energy prices.
October’s key themes continued to be elevated inflation pressures and a supply bottleneck, but strong earnings provided a bright spot in the markets. Earnings releases in the U.S. were generally strong and consumer confidence was high. The Fed reaffirmed its plans to taper quantitative easing to a stop by mid-2022. Meanwhile, elevated inflation figures were considered transitory by the Fed. Similar to the U.S., the eurozone and many Asian countries saw positive earnings but were facing inflation pressures caused by supply bottlenecks while also experiencing energy price increases amid natural gas shortages. Globally, government bond yields rose as central banks prepared to lower monetary policy accommodation in the face of rising inflationary pressures. As previously referenced, positive commodity performance was driven by sharply higher energy costs.
November was dominated by rising COVID-19 hospitalizations and concerns regarding the Omicron variant. Most major asset classes, both domestically and internationally, declined in November with two exceptions: U.S. investment-grade bonds and Treasury Inflation-Protected Securities. The United Nations Climate Change Conference (COP26) took place during the month with hopes of agreement among countries to limit global warming. While several initiatives were discussed, the conference ultimately ended without the specifics required to instill confidence that the limiting of global warming would succeed. In the U.S., President Biden signed a long-awaited infrastructure bill to upgrade U.S. roads, bridges, and railways. Meanwhile, the Consumer Price Index1, a measure of domestic inflation conditions, jumped to its highest level in 31 years. While the threat of consistently high inflation led the Fed to discuss a faster pace of tapering, the Omicron strain makes that less likely to occur. Commodities came in negative for the month, largely driven by sharp declines in oil prices (and energy costs in general) as well as precious metals.
Global volatility in December lessened as data indicated a lower risk of severe disease and death as a result of the Omicron variant. Even so, a number of countries introduced restrictions on sectors such as travel and hospitality to try to reduce the spread. In the U.S., data indicated that the overall domestic economy remains stable and corporate earnings remain robust. Consumer spending capability looks strong heading into 2022 on the back of elevated household savings and the lowest ratio of U.S. household liabilities to assets since 1973. U.S. corporate and high-yield bonds produced positive returns for the month while Treasuries declined. Bonds were strongly affected by the projection of three 25-basis-point (bp; 100 bps equal 1.00%) policy rate hikes in 2022 by senior Federal Open Market Committee members, contrary to just one hike as previously believed.
“ Bonds were strongly affected by the projection of three 25-basis-point (bp; 100 bps equal 1.00%) policy rate hikes in 2022 by senior Federal Open Market Committee members, contrary to just one hike as previously believed.”
| 1 | The Consumer Price Index (CPI) is a measure of the average change over time in the prices paid by urban consumers for a market basket of consumer goods and services. You cannot invest directly in an index. |
4 | Allspring VT Small Cap Growth Fund
Letter to shareholders (unaudited)
Don’t let short-term uncertainty derail long-term investment goals.
Periods of investment uncertainty can present challenges, but experience has taught us that maintaining long-term investment goals can be an effective way to plan for the future. To help you create a sound strategy based on your personal goals and risk tolerance, Allspring Funds offers more than 100 mutual funds spanning a wide range of asset classes and investment styles. Although diversification cannot guarantee an investment profit or prevent losses, we believe it can be an effective way to manage investment risk and potentially smooth out overall portfolio performance. We encourage investors to know their investments and to understand that appropriate levels of risk-taking may unlock opportunities.
Information on transaction closing.
On November 1, 2021, GTCR LLC and Reverence Capital Partners, L.P., announced the beginning of Allspring Global Investments™, with the close of the transaction to acquire Wells Fargo Funds Management, LLC; Wells Capital Management, LLC; Galliard Capital Management, LLC.; Wells Fargo Asset Management (International) Ltd.; Wells Fargo Asset Management Luxembourg S.A.; and Wells Fargo Funds Distributor, LLC, as well as Wells Fargo Bank, N.A.’s business of acting as trustee to its collective investment trusts and all related Wells Fargo Asset Management legal entities. The transaction closed on November 1, 2021, forming Allspring Global Investments, a privately held asset management firm with $575 billion in AUM1 as of December 31, 2021.
Allspring Global Investments™ is a leading independent asset management firm with a full breadth of investment capabilities across diverse asset classes, serving the needs of its institutional and wealth management clients around the world. Allspring operates across 18 offices globally supported by more than 480 investment professionals. Allspring and its investment teams provide a broad range of differentiated investment products and solutions to help its diverse range of clients meet their investment objectives.
As part of this transition, all mutual funds within the Wells Fargo Funds family were rebranded as Allspring Funds. Each individual fund had “Wells Fargo” removed from its fund name and replaced with “Allspring.” The fund name changes went into effect on December 6, 2021.
Allspring Global Investments is the trade name for the asset management firms of Allspring Global Investments Holdings, LLC, a holding company indirectly owned by certain private funds of GTCR LLC and Reverence Capital Partners, L.P.
Thank you for choosing to invest with Allspring Funds. We appreciate your confidence in us and remain committed to helping you meet your financial needs.
Sincerely,
Andrew Owen
President
Allspring Funds
For further information about your Fund, contact your investment professional, visit our website at allspringglobal.com, or call us directly at 1-800-222-8222.
| 1 | As of December 31, 2021, assets under management (AUM) includes $91.6 billion from Galliard Capital Management, LLC, an investment advisor that is not part of the Allspring trade name/GIPS firm. |
Allspring VT Small Cap Growth Fund | 5
Performance highlights (unaudited)
| Investment objective | The Fund seeks long-term capital appreciation. |
| Manager | Allspring Funds Management, LLC |
| Subadviser | Allspring Global Investments, LLC |
| Portfolio managers | Robert Gruendyke, CFA®‡, David Nazaret, CFA®‡, Thomas C. Ognar, CFA®‡ |
| Average annual total returns (%) as of December 31, 2021 |
| | | | | | Expense ratios1 (%) |
| | Inception date | 1 year | 5 year | 10 year | Gross | Net 2 |
| Class 1 | 7-16-2010 | 7.93 | 22.31 | 16.51 | 0.93 | 0.93 |
| Class 2 | 5-1-1995 | 7.64 | 22.00 | 16.23 | 1.18 | 1.18 |
| Russell 2000® Growth Index3 | – | 2.83 | 14.53 | 14.14 | – | – |
| 1 | Reflects the expense ratios as stated in the most recent prospectuses. The expense ratios shown are subject to change and may differ from the annualized expense ratios shown in the financial highlights of this report. |
| 2 | The manager has contractually committed through April 30, 2022, to waive fees and/or reimburse expenses to the extent necessary to cap total annual fund operating expenses after fee waivers at 0.95% for Class 1 shares and 1.20% for Class 2 shares. Brokerage commissions, stamp duty fees, interest, taxes, acquired fund fees and expenses (if any), and extraordinary expenses are excluded from the expense caps. Prior to or after the commitment expiration date, the caps may be increased or the commitment to maintain the caps may be terminated only with the approval of the Board of Trustees. Without these caps, the Fund’s returns would have been lower. The expense ratio paid by an investor is the net expense ratio (the total annual fund operating expenses after fee waivers) as stated in the prospectuses. |
| 3 | The Russell 2000® Growth Index measures the performance of those Russell 2000 companies with higher price/book ratios and higher forecasted growth values. You cannot invest directly in an index. |
Figures quoted represent past performance, which is no guarantee of future results. Investment return and principal value of an investment will fluctuate so that an investor’s shares, when redeemed, may be worth more or less than their original cost. Current performance may be lower or higher than the performance data quoted and assumes the reinvestment of dividends and capital gains. Current month-end performance is available by calling 1-800-260-5969. Performance figures of the Fund do not reflect fees and expenses charged pursuant to the terms of variable life insurance policies and variable annuity contracts. If these fees and expenses had been reflected, performance would have been lower.
Index returns do not include transaction costs associated with buying and selling securities, any mutual fund fees or expenses, or any taxes. It is not possible to invest directly in an index.
Shares are sold without a front-end sales charge or contingent deferred sales charge.
Stock values fluctuate in response to the activities of individual companies and general market and economic conditions. Smaller-company stocks tend to be more volatile and less liquid than those of larger companies. Consult the Fund’s prospectus for additional information on these and other risks.
Please refer to the prospectus provided by your participating insurance company for detailed information describing the separate accounts for information regarding surrender charges, mortality and expense risk fees, and other charges that may be assessed by the participating insurance companies.
| ‡ | CFA® and Chartered Financial Analyst® are trademarks owned by CFA Institute. |
6 | Allspring VT Small Cap Growth Fund
Performance highlights (unaudited)
Growth of $10,000 investment as of December 31, 20211
| 1 | The chart compares the performance of Class 2 shares for the most recent ten years with the Russell 2000® Growth Index. The chart assumes a hypothetical investment of $10,000 in Class 2 shares and reflects all operating expenses of the Fund but does not reflect fees and expenses charged pursuant to the terms of variable life insurance policies and variable annuity contracts. |
Allspring VT Small Cap Growth Fund | 7
Performance highlights (unaudited)
MANAGER'S DISCUSSION
Fund highlights
| ■ | The Fund outperformed its benchmark, the Russell 2000® Growth Index, for the 12-month period that ended December 31, 2021. |
| ■ | Stocks within the consumer discretionary and health care sectors aided relative performance during the period. |
| ■ | The communication services sector hindered relative performance during the period. |
Although the market proved to be resilient during 2021, the returns were narrowly led by select mega-cap stocks.
The market once again proved its resiliency with another year of solid gains with the S&P 500 Index rising 28.71%. Mega-cap stocks led the move higher with select narrative-driven stocks generating outsized returns. Strong economic growth, along with fears over rising interest rates and higher inflation, exacerbated the rotation from growth stocks into economically sensitive stocks. Within the growth universe, large- and mega-cap growth stocks proved to be buoyant. However, it was a very different picture down the market-cap spectrum as growth stocks struggled mightily across the mid- and small-cap segments. Fundamentally, small-cap growth stocks have performed well, but the reflexive nature of higher-inflation metrics has caused multiple compression in longer-duration assets. Nevertheless, the Fund was able to outperform in spite of these headwinds through strong stock selection and diversification.
The Fund benefited from stock selection within the consumer discretionary and health care sectors.
Strength in the Fund came from select retailers within the consumer discretionary sector, which benefited from a healthy backdrop of low unemployment and added stimulus. Boot Barn Holdings, Incorporated, posted solid quarterly results, issuing strong same-store-sales comparables guidance with promising commentary around e-commerce and the burgeoning ladies Western-wear segment. The stock also rose in conjunction with many retailers that benefited from a cyclical tailwind. Many of our consumer discretionary holdings continue to expand market share within the internet retail, apparel, and housing verticals and should be able to monetize future demand due to their unique offerings. Within health care, select medical device and diagnostics companies were rewarded for their durable business models, innovative therapeutics, and solid fundamentals. Shockwave Medical, Incorporated, which leverages its Intravascular Lithotripsy (IVL) technology to treat peripheral artery disease and coronary artery diseases, outperformed after generating cogent revenue growth along with strong full-year guidance. Its IVL technology has been much safer than other methods of treating calcium deposits in arteries.
| Ten largest holdings (%) as of December 31, 20211 |
| Rapid7 Incorporated | 3.16 |
| ASGN Incorporated | 3.11 |
| SPS Commerce Incorporated | 2.91 |
| Shockwave Medical Incorporated | 2.81 |
| Boot Barn Holdings Incorporated | 2.72 |
| Workiva Incorporated | 2.69 |
| Kinsale Capital Group Incorporated | 2.66 |
| Novanta Incorporated | 2.54 |
| Codexis Incorporated | 2.27 |
| Sprout Social Incorporated Class A | 2.25 |
| 1 | Figures represent the percentage of the Fund's net assets. Holdings are subject to change and may have changed since the date specified. |
Stock selection within the communication services sector inhibited performance.
Within communication services, Bandwidth Incorporated, a communications platform-as-a-service provider, fell sharply after the company reported a sequential deceleration of revenue growth with slower-than-expected execution from its recent acquisition of Voxbone in Europe. At the time of the acquisition, we felt that it would be a material cross-sell opportunity into the international segments of its domestic customers, but it has been taking longer to materialize. With less visibility on the sustainability of its growth, we sold our position. Additionally within the sector, marketing solutions provider Cardlytics, Incorporated, retraced after delivering tepid revenue metrics and weak guidance, citing weakened demand from advertisers. Given its heightened customer concentration and decelerating growth profile, we exited the stock during the period.
Many of our holdings that were winners during the outset of COVID-19 in 2020 languished this year during the recovery, yet we still managed to outperform the Russell 2000® Growth Index in 2021.
Many of our holdings that were winners during the outset of COVID-19 in 2020 languished this year during the recovery. Within health care, we exited select medical device
8 | Allspring VT Small Cap Growth Fund
Performance highlights (unaudited)
companies that endured reimbursement challenges and sold home health care providers that struggled with COVID-19-related challenges pertaining to worker recruitment. We also reduced our biotechnology weight, selling certain stocks with questionable sustainability regarding the efficacy of their key products. We added to select investments within the information technology sector, where the durability of growth has continued post COVID-19. Some of these software-as-a-service businesses include the compliance, security, human capital management, and device management verticals.
| Sector allocation as of December 31, 20211 |
| 1 | Figures represent the percentage of the Fund's long-term investments. These amounts are subject to change and may have changed since the date specified. |
We continue to focus on sustainable business models with strong growth propositions for the long term. Innovative companies that continue to iterate are taking market share at the expense of legacy incumbents. The digital transformation is becoming a requisite to businesses and consumers worldwide, driving a bonanza of growth opportunities for companies in many segments of the economy. This transformation is driving new methods of payment solutions, commerce, more targeted health care, and a cloud-based revolution in software. In our view, the types of growth stocks we own are better positioned for the long term as many of them are less capital intensive with higher margins making them more insulated to rising inflation.
Allspring VT Small Cap Growth Fund | 9
Fund expenses (unaudited)
As a shareholder of the Fund, you incur ongoing costs, including management fees, distribution (12b-1) fees, and other Fund expenses. This example is intended to help you understand your ongoing costs (in dollars) of investing in the Fund and to compare these costs with the ongoing costs of investing in other mutual funds.
The example is based on an investment of $1,000 invested at the beginning of the six-month period and held for the entire period from July 1, 2021 to December 31, 2021.
Actual expenses
The “Actual” line of the table below provides information about actual account values and actual expenses. You may use the information in this line, together with the amount you invested, to estimate the expenses that you paid over the period. Simply divide your account value by $1,000 (for example, an $8,600 account value divided by $1,000 = 8.6), then multiply the result by the number in the “Actual” line under the heading entitled “Expenses paid during period” for your applicable class of shares to estimate the expenses you paid on your account during this period.
Hypothetical example for comparison purposes
The “Hypothetical” line of the table below provides information about hypothetical account values and hypothetical expenses based on the Fund’s actual expense ratio and an assumed rate of return of 5% per year before expenses, which is not the Fund’s actual return. The hypothetical account values and expenses may not be used to estimate the actual ending account balance or expenses you paid for the period. You may use this information to compare the ongoing costs of investing in the Fund and other funds. To do so, compare this 5% hypothetical example with the 5% hypothetical examples that appear in the shareholder reports of the other funds.
Please note that the expenses shown in the table are meant to highlight your ongoing costs only and do not reflect any separate account charges assessed by participating insurance companies. Therefore, the “Hypothetical” line of the table is useful in comparing ongoing costs only, and will not help you determine the relative total costs of owning different funds. In addition, if these separate account charges assessed by participating insurance companies were included, your costs would have been higher.
| | Beginning
account value
7-1-2021 | Ending
account value
12-31-2021 | Expenses
paid during
the period1 | Annualized net
expense ratio |
| Class 1 | | | | |
| Actual | $1,000.00 | $ 987.92 | $4.66 | 0.93% |
| Hypothetical (5% return before expenses) | $1,000.00 | $1,020.52 | $4.74 | 0.93% |
| Class 2 | | | | |
| Actual | $1,000.00 | $ 985.98 | $5.91 | 1.18% |
| Hypothetical (5% return before expenses) | $1,000.00 | $1,019.26 | $6.01 | 1.18% |
1 Expenses paid is equal to the annualized net expense ratio of each class multiplied by the average account value over the period, multiplied by the number of days in the most recent fiscal half-year divided by the number of days in the fiscal year (to reflect the one-half-year period).
10 | Allspring VT Small Cap Growth Fund
Portfolio of investments—December 31, 2021
| | | | | Shares | Value |
| Common stocks: 98.66% | | | | | |
| Communication services: 1.75% | | | | | |
| Interactive media & services: 0.97% | | | | | |
| Eventbrite Incorporated Class A † | | | | 251,100 | $ 4,379,184 |
| Media: 0.78% | | | | | |
| Magnite Incorporated † | | | | 73,200 | 1,281,000 |
| TechTarget Incorporated † | | | | 23,000 | 2,200,180 |
| | | | | | 3,481,180 |
| Consumer discretionary: 15.11% | | | | | |
| Auto components: 2.01% | | | | | |
| Fox Factory Holding Corporation † | | | | 53,310 | 9,068,031 |
| Hotels, restaurants & leisure: 4.20% | | | | | |
| Bally's Corporation † | | | | 70,909 | 2,698,797 |
| F45 Training Holdings Incorporated †« | | | | 96,860 | 1,054,805 |
| Papa John's International Incorporated | | | | 66,720 | 8,905,118 |
| Wingstop Incorporated | | | | 36,169 | 6,250,003 |
| | | | | | 18,908,723 |
| Internet & direct marketing retail: 0.69% | | | | | |
| CarParts.com Incorporated † | | | | 108,110 | 1,210,832 |
| Fiverr International Limited † | | | | 16,650 | 1,893,105 |
| | | | | | 3,103,937 |
| Leisure products: 1.25% | | | | | |
| YETI Holdings Incorporated † | | | | 67,796 | 5,615,543 |
| Specialty retail: 4.10% | | | | | |
| Boot Barn Holdings Incorporated † | | | | 99,540 | 12,248,397 |
| Leslie's Incorporated † | | | | 158,592 | 3,752,287 |
| Lithia Motors Incorporated Class A | | | | 8,220 | 2,440,929 |
| | | | | | 18,441,613 |
| Textiles, apparel & luxury goods: 2.86% | | | | | |
| Crocs Incorporated † | | | | 75,180 | 9,639,580 |
| Deckers Outdoor Corporation † | | | | 8,780 | 3,216,202 |
| | | | | | 12,855,782 |
| Consumer staples: 3.80% | | | | | |
| Beverages: 1.06% | | | | | |
| Celsius Holdings Incorporated † | | | | 63,900 | 4,765,023 |
| Food & staples retailing: 1.17% | | | | | |
| The Chef's Warehouse Incorporated † | | | | 158,570 | 5,280,381 |
| Food products: 1.57% | | | | | |
| Freshpet Incorporated † | | | | 52,007 | 4,954,707 |
| Vital Farms Incorporated † | | | | 115,449 | 2,085,009 |
| | | | | | 7,039,716 |
The accompanying notes are an integral part of these financial statements.
Allspring VT Small Cap Growth Fund | 11
Portfolio of investments—December 31, 2021
| | | | | Shares | Value |
| Financials: 5.03% | | | | | |
| Capital markets: 1.60% | | | | | |
| Stifel Financial Corporation | | | | 102,335 | $ 7,206,431 |
| Insurance: 3.43% | | | | | |
| Goosehead Insurance Incorporated Class A | | | | 26,507 | 3,448,031 |
| Kinsale Capital Group Incorporated | | | | 50,276 | 11,960,158 |
| | | | | | 15,408,189 |
| Health care: 25.26% | | | | | |
| Biotechnology: 6.73% | | | | | |
| Arcutis Biotherapeutics Incorporated † | | | | 147,546 | 3,060,104 |
| Biohaven Pharmaceutical Holding Company † | | | | 18,480 | 2,546,729 |
| CareDx Incorporated † | | | | 38,230 | 1,738,700 |
| Cytokinetics Incorporated † | | | | 40,800 | 1,859,664 |
| Fate Therapeutics Incorporated † | | | | 45,560 | 2,665,716 |
| Halozyme Therapeutics Incorporated † | | | | 140,740 | 5,659,155 |
| Natera Incorporated † | | | | 41,311 | 3,858,034 |
| Vericel Corporation † | | | | 226,190 | 8,889,267 |
| | | | | | 30,277,369 |
| Health care equipment & supplies: 10.24% | | | | | |
| Axonics Modulation Technologies Incorporated † | | | | 115,400 | 6,462,400 |
| CVRx Incorporated † | | | | 59,280 | 724,994 |
| Figs Incorporated Class A †« | | | | 135,630 | 3,737,963 |
| Nyxoah SA † | | | | 31,253 | 693,817 |
| Orthopediatrics Corporation † | | | | 83,601 | 5,004,356 |
| Outset Medical Incorporated † | | | | 61,968 | 2,856,105 |
| Pulmonx Corporation † | | | | 73,623 | 2,361,090 |
| Shockwave Medical Incorporated † | | | | 70,846 | 12,633,967 |
| SI-BONE Incorporated † | | | | 175,798 | 3,904,474 |
| Silk Road Medical Incorporated † | | | | 29,710 | 1,265,943 |
| Tandem Diabetes Care Incorporated † | | | | 26,180 | 3,940,614 |
| Vapotherm Incorporated † | | | | 118,631 | 2,456,848 |
| | | | | | 46,042,571 |
| Health care providers & services: 1.48% | | | | | |
| Castle Biosciences Incorporated † | | | | 107,418 | 4,605,010 |
| Privia Health Group Incorporated † | | | | 79,794 | 2,064,271 |
| | | | | | 6,669,281 |
| Health care technology: 3.29% | | | | | |
| Inspire Medical Systems Incorporated † | | | | 41,940 | 9,648,716 |
| Phreesia Incorporated † | | | | 123,856 | 5,159,841 |
| | | | | | 14,808,557 |
| Life sciences tools & services: 3.52% | | | | | |
| Akoya Biosciences Incorporated † | | | | 111,852 | 1,712,454 |
| Alpha Teknova Incorporated † | | | | 75,581 | 1,547,899 |
| Codexis Incorporated † | | | | 327,167 | 10,230,512 |
| Neogenomics Incorporated † | | | | 69,162 | 2,359,807 |
| | | | | | 15,850,672 |
The accompanying notes are an integral part of these financial statements.
12 | Allspring VT Small Cap Growth Fund
Portfolio of investments—December 31, 2021
| | | | | Shares | Value |
| Industrials: 14.60% | | | | | |
| Building products: 2.69% | | | | | |
| The AZEK Company Incorporated † | | | | 59,073 | $ 2,731,536 |
| Zurn Water Solutions Corporation | | | | 258,150 | 9,396,660 |
| | | | | | 12,128,196 |
| Commercial services & supplies: 2.77% | | | | | |
| ACV Auctions Incorporated Class A † | | | | 193,658 | 3,648,515 |
| Casella Waste Systems Incorporated Class A † | | | | 103,090 | 8,805,948 |
| | | | | | 12,454,463 |
| Construction & engineering: 0.55% | | | | | |
| Construction Partners Incorporated Class A † | | | | 84,200 | 2,476,322 |
| Electrical equipment: 1.72% | | | | | |
| Regal-Beloit Corporation | | | | 45,374 | 7,721,747 |
| Professional services: 3.11% | | | | | |
| ASGN Incorporated † | | | | 113,441 | 13,998,619 |
| Road & rail: 1.93% | | | | | |
| Saia Incorporated † | | | | 25,792 | 8,692,678 |
| Trading companies & distributors: 1.83% | | | | | |
| SiteOne Landscape Supply Incorporated † | | | | 33,970 | 8,230,252 |
| Information technology: 32.79% | | | | | |
| Electronic equipment, instruments & components: 2.90% | | | | | |
| Novanta Incorporated † | | | | 64,690 | 11,406,788 |
| Par Technology Corporation †« | | | | 30,700 | 1,620,039 |
| | | | | | 13,026,827 |
| IT services: 5.45% | | | | | |
| BigCommerce Holdings Incorporated Series 1 † | | | | 169,200 | 5,984,604 |
| DigitalOcean Holdings Incorporated † | | | | 42,800 | 3,438,124 |
| Endava plc ADR † | | | | 46,134 | 7,746,821 |
| EVO Payments Incorporated Class A † | | | | 131,601 | 3,368,986 |
| Paymentus Holdings Incorporated A †« | | | | 113,929 | 3,985,236 |
| | | | | | 24,523,771 |
| Semiconductors & semiconductor equipment: 6.04% | | | | | |
| Allegro MicroSystems Incorporated † | | | | 176,016 | 6,368,259 |
| Diodes Incorporated † | | | | 74,890 | 8,223,671 |
| Semtech Corporation † | | | | 93,250 | 8,292,723 |
| Silicon Laboratories Incorporated † | | | | 12,870 | 2,656,625 |
| Skywater Technology Incorporated †« | | | | 101,929 | 1,653,288 |
| | | | | | 27,194,566 |
| Software: 18.40% | | | | | |
| Alkami Technology Incorporated † | | | | 139,256 | 2,793,475 |
| CyberArk Software Limited † | | | | 51,900 | 8,993,232 |
| Domo Incorporated Class B † | | | | 68,700 | 3,407,520 |
| Jamf Holding Corporation † | | | | 139,358 | 5,296,998 |
| Olo Incorporated Class A † | | | | 81,376 | 1,693,435 |
| Paycor HCM Incorporated † | | | | 146,061 | 4,208,017 |
| Q2 Holdings Incorporated † | | | | 68,996 | 5,481,042 |
The accompanying notes are an integral part of these financial statements.
Allspring VT Small Cap Growth Fund | 13
Portfolio of investments—December 31, 2021
| | | | | Shares | Value |
| Software (continued) | | | | | |
| Rapid7 Incorporated † | | | | 120,918 | $ 14,230,839 |
| SimilarWeb Limited †« | | | | 74,700 | 1,337,877 |
| Sprout Social Incorporated Class A † | | | | 111,539 | 10,115,472 |
| SPS Commerce Incorporated † | | | | 91,874 | 13,078,264 |
| Workiva Incorporated † | | | | 92,900 | 12,122,521 |
| | | | | | 82,758,692 |
| Utilities: 0.32% | | | | | |
| Independent power & renewable electricity producers: 0.32% | | | | | |
| Sunnova Energy International Incorporated † | | | | 51,624 | 1,441,342 |
| Total Common stocks (Cost $286,129,062) | | | | | 443,849,658 |
| | | Yield | | | |
| Short-term investments: 3.89% | | | | | |
| Investment companies: 3.89% | | | | | |
| Allspring Government Money Market Fund Select Class ♠∞ | | 0.03% | | 6,232,112 | 6,232,112 |
| Securities Lending Cash Investments LLC ♠∩∞ | | 0.07 | | 11,274,475 | 11,274,475 |
| Total Short-term investments (Cost $17,506,587) | | | | | 17,506,587 |
| Total investments in securities (Cost $303,635,649) | 102.55% | | | | 461,356,245 |
| Other assets and liabilities, net | (2.55) | | | | (11,469,545) |
| Total net assets | 100.00% | | | | $449,886,700 |
| † | Non-income-earning security |
| « | All or a portion of this security is on loan. |
| ♠ | The issuer of the security is an affiliated person of the Fund as defined in the Investment Company Act of 1940. |
| ∩ | The investment is a non-registered investment company purchased with cash collateral received from securities on loan. |
| ∞ | The rate represents the 7-day annualized yield at period end. |
| Abbreviations: |
| ADR | American depositary receipt |
Investments in affiliates
An affiliated investment is an investment in which the Fund owns at least 5% of the outstanding voting shares of the issuer or as a result of other relationships, such as the Fund and the issuer having the same investment manager. Transactions with issuers that were either affiliates of the Fund at the beginning of the period or the end of the period were as follows:
| | Value,
beginning of
period | Purchases | Sales
proceeds | Net
realized
gains
(losses) | | Net
change in
unrealized
gains
(losses) | | Value,
end of
period | Shares,
end
of period | Income
from
affiliated
securities |
| Short-term investments | | | | | | | | | |
| Allspring Government Money Market Fund Select Class | $ 555,598 | $105,154,999 | $ (99,478,485) | $0 | | $0 | | $ 6,232,112 | 6,232,112 | $ 1,758 |
| Securities Lending Cash Investments LLC | 13,231,250 | 119,006,023 | (120,962,798) | 0 | | 0 | | 11,274,475 | 11,274,475 | 5,171 # |
| | | | | $0 | | $0 | | $17,506,587 | | $6,929 |
| # | Amount shown represents income before fees and rebates. |
The accompanying notes are an integral part of these financial statements.
14 | Allspring VT Small Cap Growth Fund
Statement of assets and liabilities—December 31, 2021
| | |
| Assets | |
Investments in unaffiliated securities (including $11,007,085 of securities loaned), at value (cost $286,129,062)
| $ 443,849,658 |
Investments in affiliated securities, at value (cost $17,506,587)
| 17,506,587 |
Receivable for Fund shares sold
| 243,017 |
Receivable for investments sold
| 156,864 |
Receivable for securities lending income, net
| 55,096 |
Receivable for dividends
| 15,178 |
Prepaid expenses and other assets
| 7,661 |
Total assets
| 461,834,061 |
| Liabilities | |
Payable upon receipt of securities loaned
| 11,274,475 |
Management fee payable
| 319,978 |
Payable for Fund shares redeemed
| 225,182 |
Distribution fee payable
| 92,005 |
Administration fees payable
| 31,998 |
Trustees’ fees and expenses payable
| 1,400 |
Accrued expenses and other liabilities
| 2,323 |
Total liabilities
| 11,947,361 |
Total net assets
| $449,886,700 |
| Net assets consist of | |
Paid-in capital
| $ 236,619,636 |
Total distributable earnings
| 213,267,064 |
Total net assets
| $449,886,700 |
| Computation of net asset value per share | |
Net assets – Class 1
| $ 35,203,773 |
Shares outstanding – Class 11
| 2,385,401 |
Net asset value per share – Class 1
| $14.76 |
Net assets – Class 2
| $ 414,682,927 |
Shares outstanding – Class 21
| 29,529,495 |
Net asset value per share – Class 2
| $14.04 |
| 1 | The Fund has an unlimited number of authorized shares. |
The accompanying notes are an integral part of these financial statements.
Allspring VT Small Cap Growth Fund | 15
Statement of operations—year ended December 31, 2021
| | |
| Investment income | |
Dividends
| $ 382,314 |
Securities lending income (including from affiliate), net
| 262,476 |
Income from affiliated securities
| 1,758 |
Total investment income
| 646,548 |
| Expenses | |
Management fee
| 3,639,079 |
| Administration fees | |
Class 1
| 29,249 |
Class 2
| 334,671 |
| Distribution fee | |
Class 2
| 1,043,436 |
Custody and accounting fees
| 44,124 |
Professional fees
| 64,164 |
Shareholder report expenses
| 64,834 |
Trustees’ fees and expenses
| 19,219 |
Other fees and expenses
| 10,192 |
Total expenses
| 5,248,968 |
Net investment loss
| (4,602,420) |
| Realized and unrealized gains (losses) on investments | |
Net realized gains on investments
| 55,782,072 |
Net change in unrealized gains (losses) on investments
| (18,991,009) |
Net realized and unrealized gains (losses) on investments
| 36,791,063 |
Net increase in net assets resulting from operations
| $ 32,188,643 |
The accompanying notes are an integral part of these financial statements.
16 | Allspring VT Small Cap Growth Fund
Statement of changes in net assets
| | | | | |
| | Year ended
December 31, 2021 | Year ended
December 31, 2020 |
| Operations | | | | |
Net investment loss
| | $ (4,602,420) | | $ (3,125,684) |
Net realized gains on investments
| | 55,782,072 | | 53,245,715 |
Net change in unrealized gains (losses) on investments
| | (18,991,009) | | 109,023,368 |
Net increase in net assets resulting from operations
| | 32,188,643 | | 159,143,399 |
| Distributions to shareholders from | | | | |
| Net investment income and net realized gains | | | | |
Class 1
| | (3,835,125) | | (1,435,682) |
Class 2
| | (46,253,009) | | (16,630,208) |
Total distributions to shareholders
| | (50,088,134) | | (18,065,890) |
| Capital share transactions | Shares | | Shares | |
| Proceeds from shares sold | | | | |
Class 1
| 403,806 | 6,327,801 | 604,357 | 6,902,098 |
Class 2
| 3,593,609 | 54,641,517 | 3,286,731 | 35,875,297 |
| | | 60,969,318 | | 42,777,395 |
| Reinvestment of distributions | | | | |
Class 1
| 270,842 | 3,835,125 | 131,233 | 1,435,682 |
Class 2
| 3,428,689 | 46,253,009 | 1,582,322 | 16,630,208 |
| | | 50,088,134 | | 18,065,890 |
| Payment for shares redeemed | | | | |
Class 1
| (577,421) | (9,014,167) | (675,964) | (7,532,393) |
Class 2
| (4,137,781) | (61,701,252) | (5,426,711) | (59,526,674) |
| | | (70,715,419) | | (67,059,067) |
Net increase (decrease) in net assets resulting from capital share transactions
| | 40,342,033 | | (6,215,782) |
Total increase in net assets
| | 22,442,542 | | 134,861,727 |
| Net assets | | | | |
Beginning of period
| | 427,444,158 | | 292,582,431 |
End of period
| | $449,886,700 | | $427,444,158 |
The accompanying notes are an integral part of these financial statements.
Allspring VT Small Cap Growth Fund | 17
Financial highlights
(For a share outstanding throughout each period)
| | Year ended December 31 |
| Class 1 | 2021 | 2020 | 2019 | 2018 | 2017 |
Net asset value, beginning of period
| $15.35 | $10.29 | $9.66 | $10.43 | $8.51 |
Net investment loss
| (0.12) 1 | (0.09) | (0.07) 1 | (0.05) | (0.04) |
Net realized and unrealized gains (losses) on investments
| 1.26 | 5.80 | 2.51 | 0.40 | 2.24 |
Total from investment operations
| 1.14 | 5.71 | 2.44 | 0.35 | 2.20 |
| Distributions to shareholders from | | | | | |
Net realized gains
| (1.73) | (0.65) | (1.81) | (1.12) | (0.28) |
Net asset value, end of period
| $14.76 | $15.35 | $10.29 | $9.66 | $10.43 |
Total return2
| 7.93% | 58.09% | 25.31% | 1.48% | 26.14% |
| Ratios to average net assets (annualized) | | | | | |
Gross expenses
| 0.92% | 0.93% | 0.93% | 0.92% | 0.94% |
Net expenses
| 0.92% | 0.93% | 0.93% | 0.92% | 0.94% |
Net investment loss
| (0.78)% | (0.76)% | (0.69)% | (0.59)% | (0.65)% |
| Supplemental data | | | | | |
Portfolio turnover rate
| 46% | 51% | 62% | 68% | 72% |
Net assets, end of period (000s omitted)
| $35,204 | $35,128 | $22,925 | $19,801 | $22,591 |
| 1 | Calculated based upon average shares outstanding |
| 2 | Returns do not reflect fees and expenses charged pursuant to the terms of variable life insurance policies and variable annuity contracts. |
The accompanying notes are an integral part of these financial statements.
18 | Allspring VT Small Cap Growth Fund
Financial highlights
(For a share outstanding throughout each period)
| | Year ended December 31 |
| Class 2 | 2021 | 2020 | 2019 | 2018 | 2017 |
Net asset value, beginning of period
| $14.72 | $9.91 | $9.38 | $10.18 | $8.33 |
Net investment loss
| (0.14) | (0.11) | (0.09) | (0.09) | (0.09) |
Net realized and unrealized gains (losses) on investments
| 1.19 | 5.57 | 2.43 | 0.41 | 2.22 |
Total from investment operations
| 1.05 | 5.46 | 2.34 | 0.32 | 2.13 |
| Distributions to shareholders from | | | | | |
Net realized gains
| (1.73) | (0.65) | (1.81) | (1.12) | (0.28) |
Net asset value, end of period
| $14.04 | $14.72 | $9.91 | $9.38 | $10.18 |
Total return1
| 7.64% | 57.78% | 24.83% | 1.20% | 25.86% |
| Ratios to average net assets (annualized) | | | | | |
Gross expenses
| 1.17% | 1.18% | 1.18% | 1.17% | 1.19% |
Net expenses
| 1.17% | 1.18% | 1.18% | 1.17% | 1.19% |
Net investment loss
| (1.03)% | (1.00)% | (0.95)% | (0.84)% | (0.90)% |
| Supplemental data | | | | | |
Portfolio turnover rate
| 46% | 51% | 62% | 68% | 72% |
Net assets, end of period (000s omitted)
| $414,683 | $392,316 | $269,657 | $243,038 | $238,460 |
| 1 | Returns do not reflect fees and expenses charged pursuant to the terms of variable life insurance policies and variable annuity contracts. |
The accompanying notes are an integral part of these financial statements.
Allspring VT Small Cap Growth Fund | 19
Notes to financial statements
1. ORGANIZATION
Allspring Variable Trust (the "Trust"), a Delaware statutory trust organized on March 10, 1999, is an open-end management investment company registered under the Investment Company Act of 1940, as amended (the "1940 Act"). As an investment company, the Trust follows the accounting and reporting guidance in Financial Accounting Standards Board ("FASB") Accounting Standards Codification Topic 946, Financial Services – Investment Companies. These financial statements report on the Allspring VT Small Cap Growth Fund (the "Fund") which is a diversified series of the Trust. The Trust offers shares of the Fund to separate accounts of various life insurance companies as funding vehicles for certain variable annuity contracts and variable life insurance policies.
Effective on November 1, 2021, the sale transaction of Wells Fargo Asset Management ("WFAM") by Wells Fargo & Company to GTCR LLC and Reverence Capital Partners, L.P. was closed. In connection with the closing of the transaction, WFAM became known as Allspring Global Investments (“Allspring”) and various entities that provided services to the Fund changed their names to "Allspring", including Allspring Funds Management, LLC, the investment manager to the Fund, Allspring Global Investments, LLC and Allspring Global Investments (UK) Limited, both registered investment advisers providing subadvisory services to certain funds, and Allspring Funds Distributor, LLC, the Fund's principal underwriter. Consummation of the transaction resulted in a new investment management agreement and subadvisory agreement which became effective on November 1, 2021.
2. SIGNIFICANT ACCOUNTING POLICIES
The following significant accounting policies, which are consistently followed in the preparation of the financial statements of the Fund, are in conformity with U.S. generally accepted accounting principles which require management to make estimates and assumptions that affect the reported amounts of assets and liabilities, disclosure of contingent assets and liabilities at the date of the financial statements, and the reported amounts of income and expenses during the reporting period. Actual results could differ from those estimates.
Securities valuation
All investments are valued each business day as of the close of regular trading on the New York Stock Exchange (generally 4 p.m. Eastern Time), although the Fund may deviate from this calculation time under unusual or unexpected circumstances.
Equity securities that are listed on a foreign or domestic exchange or market are valued at the official closing price or, if none, the last sales price. If no sale occurs on the principal exchange or market that day, a fair value price will be determined in accordance with the Fund’s Valuation Procedures.
Investments in registered open-end investment companies are valued at net asset value. Interests in non-registered investment companies that are redeemable at net asset value are fair valued normally at net asset value.
Investments which are not valued using any of the methods discussed above are valued at their fair value, as determined in good faith by the Board of Trustees. The Board of Trustees has established a Valuation Committee comprised of the Trustees and has delegated to it the authority to take any actions regarding the valuation of portfolio securities that the Valuation Committee deems necessary or appropriate, including determining the fair value of portfolio securities, unless the determination has been delegated to the Allspring Global Investments Pricing Committee at Allspring Funds Management, LLC ("Allspring Funds Management"). The Board of Trustees retains the authority to make or ratify any valuation decisions or approve any changes to the Valuation Procedures as it deems appropriate. On a quarterly basis, the Board of Trustees receives reports on any valuation actions taken by the Valuation Committee or the Allspring Global Investments Pricing Committee which may include items for ratification.
Securities lending
The Fund may lend its securities from time to time in order to earn additional income in the form of fees or interest on securities received as collateral or the investment of any cash received as collateral. When securities are on loan, the Fund receives interest or dividends on those securities. Cash collateral received in connection with its securities lending transactions is invested in Securities Lending Cash Investments, LLC (the "Securities Lending Fund"), an affiliated non-registered investment company. Investments in Securities Lending Fund are valued at the evaluated bid price provided by an independent pricing service. Income earned from investment in the Securities Lending Fund, if any, is included in securities lending income (including from affiliate) (net of fees and rebates) on the Statement of Operations.
In a securities lending transaction, the net asset value of the Fund is affected by an increase or decrease in the value of the securities loaned and by an increase or decrease in the value of the instrument in which collateral is invested. The amount of securities lending activity undertaken by the Fund fluctuates from time to time. The Fund has the right under the lending agreement to recover the securities from the borrower on demand. In the event of default or bankruptcy by the borrower, the
20 | Allspring VT Small Cap Growth Fund
Notes to financial statements
Fund may be prevented from recovering the loaned securities or gaining access to the collateral or may experience delays or costs in doing so. In such an event, the terms of the agreement allow the unaffiliated securities lending agent to use the collateral to purchase replacement securities on behalf of the Fund or pay the Fund the market value of the loaned securities. The Fund bears the risk of loss with respect to depreciation of its investment of the cash collateral.
Security transactions and income recognition
Securities transactions are recorded on a trade date basis. Realized gains or losses are recorded on the basis of identified cost.
Dividend income is recognized on the ex-dividend date.
Distributions to shareholders
Distributions to shareholders from net investment income and any net realized gains are recorded on the ex-dividend date and paid at least annually. Such distributions are determined in accordance with income tax regulations and may differ from U.S. generally accepted accounting principles. Dividend sources are estimated at the time of declaration. The tax character of distributions is determined as of the Fund's fiscal year end. Therefore, a portion of the Fund's distributions made prior to the Fund’s fiscal year end may be categorized as a tax return of capital at year end.
Federal and other taxes
The Fund intends to continue to qualify as a regulated investment company by distributing substantially all of its investment company taxable income and any net realized capital gains (after reduction for capital loss carryforwards) sufficient to relieve it from all, or substantially all, federal income taxes. Accordingly, no provision for federal income taxes was required.
The Fund’s income and federal excise tax returns and all financial records supporting those returns for the prior three fiscal years are subject to examination by the federal and Delaware revenue authorities. Management has analyzed the Fund's tax positions taken on federal, state, and foreign tax returns for all open tax years and does not believe that there are any uncertain tax positions that require recognition of a tax liability.
As of December 31, 2021, the aggregate cost of all investments for federal income tax purposes was $303,891,455 and the unrealized gains (losses) consisted of:
| Gross unrealized gains | $176,993,121 |
| Gross unrealized losses | (19,528,331) |
| Net unrealized gains | $157,464,790 |
Reclassifications are made to the Fund’s capital accounts for permanent tax differences to reflect income and gains available for distribution (or available capital loss carryforwards) under federal income tax regulations. U.S. generally accepted accounting principles require that certain components of net assets be adjusted to reflect permanent differences between financial and tax reporting. These reclassifications have no effect on net assets or net asset values per share. The primary permanent difference causing such reclassification is due to net operating loss. At December 31, 2021, as a result of permanent book-to-tax differences, the following reclassification adjustments were made on the Statement of Assets and Liabilities:
| Paid-in capital | Total distributable
earnings |
| $(4,644,843) | $4,644,843 |
Class allocations
The separate classes of shares offered by the Fund differ principally in distribution fees. Class specific expenses are charged directly to that share class. Investment income, common fund-level expenses, and realized and unrealized gains (losses) on investments are allocated daily to each class of shares based on the relative proportion of net assets of each class.
Allspring VT Small Cap Growth Fund | 21
Notes to financial statements
3. FAIR VALUATION MEASUREMENTS
Fair value measurements of investments are determined within a framework that has established a fair value hierarchy based upon the various data inputs utilized in determining the value of the Fund’s investments. The three-level hierarchy gives the highest priority to unadjusted quoted prices in active markets for identical assets or liabilities (Level 1) and the lowest priority to unobservable inputs (Level 3). The Fund’s investments are classified within the fair value hierarchy based on the lowest level of input that is significant to the fair value measurement. The inputs are summarized into three broad levels as follows:
| ■ | Level 1 – quoted prices in active markets for identical securities |
| ■ | Level 2 – other significant observable inputs (including quoted prices for similar securities, interest rates, prepayment speeds, credit risk, etc.) |
| ■ | Level 3 – significant unobservable inputs (including the Fund’s own assumptions in determining the fair value of investments) |
The inputs or methodologies used for valuing investments in securities are not necessarily an indication of the risk associated with investing in those securities.
The following is a summary of the inputs used in valuing the Fund’s assets and liabilities as of December 31, 2021:
| | Quoted prices
(Level 1) | Other significant
observable inputs
(Level 2) | Significant
unobservable inputs
(Level 3) | Total |
| Assets | | | | |
| Investments in: | | | | |
| Common stocks | | | | |
| Communication services | $ 7,860,364 | $0 | $0 | $ 7,860,364 |
| Consumer discretionary | 67,993,629 | 0 | 0 | 67,993,629 |
| Consumer staples | 17,085,120 | 0 | 0 | 17,085,120 |
| Financials | 22,614,620 | 0 | 0 | 22,614,620 |
| Health care | 113,648,450 | 0 | 0 | 113,648,450 |
| Industrials | 65,702,277 | 0 | 0 | 65,702,277 |
| Information technology | 147,503,856 | 0 | 0 | 147,503,856 |
| Utilities | 1,441,342 | 0 | 0 | 1,441,342 |
| Short-term investments | | | | |
| Investment companies | 17,506,587 | 0 | 0 | 17,506,587 |
| Total assets | $461,356,245 | $0 | $0 | $461,356,245 |
Additional sector, industry or geographic detail, if any, is included in the Portfolio of Investments.
For the year ended December 31, 2021, the Fund did not have any transfers into/out of Level 3.
4. TRANSACTIONS WITH AFFILIATES
Management fee
Allspring Funds Management, a wholly owned subsidiary of Allspring Global Investments Holdings, LLC, a holding company indirectly owned by certain private funds of GTCR LLC and Reverence Capital Partners, L.P., is the manager of the Fund and provides advisory and fund-level administrative services under an investment management agreement. Under the investment management agreement, Allspring Funds Management is responsible for, among other services, implementing the investment objectives and strategies of the Fund, supervising the subadviser and providing fund-level administrative services in connection with the Fund’s operations. As compensation for its services under the investment management agreement, Allspring Funds Management is entitled to receive a management fee at the following annual rate based on the Fund’s average daily net assets:
22 | Allspring VT Small Cap Growth Fund
Notes to financial statements
| Average daily net assets | Management fee |
| First $500 million | 0.800% |
| Next $500 million | 0.750 |
| Next $1 billion | 0.700 |
| Next $1 billion | 0.675 |
| Next $2 billion | 0.650 |
| Next $5 billion | 0.640 |
| Over $10 billion | 0.630 |
For the year ended December 31, 2021, the management fee was equivalent to an annual rate of 0.80% of the Fund’s average daily net assets.
Allspring Funds Management has retained the services of a subadviser to provide daily portfolio management to the Fund. The fee for subadvisory services is borne by Allspring Funds Management. Allspring Global Investments, LLC ("Allspring Investments"), an affiliate of Allspring Funds Management and a wholly owned subsidiary of Allspring Global Investments Holdings, LLC, is the subadviser to the Fund and is entitled to receive a fee from Allspring Funds Management at an annual rate starting at 0.55% and declining to 0.40% as the average daily net assets of the Fund increase.
Administration fees
Under a class-level administration agreement, Allspring Funds Management provides class-level administrative services to the Fund, which includes paying fees and expenses for services provided by the transfer agent, sub-transfer agents, omnibus account services and record-keepers. As compensation for its services under the class-level administration agreement, Allspring Funds Management receives an annual fee of 0.08% which is calculated based on the average daily net assets of each class.
Waivers and/or expense reimbursements
Allspring Funds Management has contractually committed to waive and/or reimburse management and administration fees to the extent necessary to maintain certain net operating expense ratios for the Fund. When each class of the Fund has exceeded its expense cap, Allspring Funds Management will waive fees and/or reimburse expenses from fund-level expenses on a proportionate basis and then from class specific expenses. When only certain classes exceed their expense caps, waivers and/or reimbursements are applied against class specific expenses before fund-level expenses. Allspring Funds Management has contractually committed through April 30, 2022 to waive fees and/or reimburse expenses to the extent necessary to cap expenses. Prior to or after the commitment expiration date, the caps may be increased or the commitment to maintain the caps may be terminated only with the approval of the Board of Trustees. The contractual expense caps are as follows:
| | Expense ratio caps |
| Class 1 | 0.95% |
| Class 2 | 1.20 |
Distribution fee
The Trust has adopted a distribution plan for Class 2 shares of the Fund pursuant to Rule 12b-1 under the 1940 Act. A distribution fee is charged to Class 2 shares and paid to Allspring Funds Distributor, LLC, an affiliate of Allspring Funds Management, the principal underwriter, at an annual rate of 0.25% of the average daily net assets of Class 2 shares.
Interfund transactions
The Fund may purchase or sell portfolio investment securities to certain affiliates pursuant to Rule 17a-7 under the 1940 Act and under procedures adopted by the Board of Trustees. The procedures have been designed to ensure that these interfund transactions, which do not incur broker commissions, are effected at current market prices.
5. INVESTMENT PORTFOLIO TRANSACTIONS
Purchases and sales of investments, excluding U.S. government obligations (if any) and short-term securities, for the year ended December 31, 2021 were $205,399,694 and $225,635,531, respectively.
Allspring VT Small Cap Growth Fund | 23
Notes to financial statements
6. SECURITIES LENDING TRANSACTIONS
The Fund lends its securities through an unaffiliated securities lending agent and receives collateral in the form of cash or securities with a value at least equal to the value of the securities on loan. The value of the loaned securities is determined at the close of each business day and any increases or decreases in the required collateral are exchanged between the Fund and the counterparty on the next business day. Cash collateral received is invested in the Securities Lending Fund which seeks to provide a positive return compared to the daily Federal Funds Open Rate by investing in high-quality, U.S. dollar-denominated short-term money market instruments and is exempt from registration under Section 3(c)(7) of the 1940 Act. Securities Lending Fund is managed by Allspring Funds Management and is subadvised by Allspring Investments. Allspring Funds Management receives an advisory fee starting at 0.05% and declining to 0.01% as the average daily net assets of the Securities Lending Fund increase. All of the fees received by Allspring Funds Management are paid to Allspring Investments for its services as subadviser.
In the event of counterparty default or the failure of a borrower to return a loaned security, the Fund has the right to use the collateral to offset any losses incurred. As of December 31, 2021, the Fund had securities lending transactions with the following counterparties which are subject to offset:
| Counterparty | Value of
securities on
loan | Collateral
received1 | Net amount |
| Bank of America Securities Incorporated | $ 118,932 | $ (118,932) | $0 |
| Barclays Capital Incorporated | 1,038,780 | (1,038,780) | 0 |
| BMO Capital Markets Corporation | 633,240 | (633,240) | 0 |
| BNP Paribas Securities Corporation | 570,492 | (570,492) | 0 |
| JPMorgan Securities LLC | 1,245,712 | (1,245,712) | 0 |
| Morgan Stanley & Co. LLC | 7,399,929 | (7,399,929) | 0 |
1 Collateral received within this table is limited to the collateral for the net transaction with the counterparty.
7. BANK BORROWINGS
The Trust, Allspring Master Trust and Allspring Funds Trust (excluding the money market funds) are parties to a $350,000,000 revolving credit agreement whereby the Fund is permitted to use bank borrowings for temporary or emergency purposes, such as to fund shareholder redemption requests. Interest under the credit agreement is charged to the Fund based on a borrowing rate equal to the higher of the Federal Funds rate in effect on that day plus 1.25% or the overnight bank funding rate in effect on that day plus 1.25%. In addition, an annual commitment fee equal to 0.25% of the unused balance is allocated to each participating fund.
For the year ended December 31, 2021, there were no borrowings by the Fund under the agreement.
8. DISTRIBUTIONS TO SHAREHOLDERS
The tax character of distributions paid during the years ended December 31, 2021 and December 31, 2020 were as follows:
| | Year ended December 31 |
| | 2021 | 2020 |
| Ordinary income | $ 5,641,030 | $ 0 |
| Long-term capital gain | 44,447,104 | 18,065,890 |
As of December 31, 2021, the components of distributable earnings on a tax basis were as follows:
Undistributed
long-term
gain | Unrealized
gains |
| $55,803,023 | $157,464,790 |
24 | Allspring VT Small Cap Growth Fund
Notes to financial statements
9. CONCENTRATION RISKS
As of the end of the period, the Fund concentrated its portfolio of investments in the health care and information technology sectors. A fund that invests a substantial portion of its assets in any sector may be more affected by changes in that sector than would be a fund whose investments are not heavily weighted in any sector.
10. INDEMNIFICATION
Under the Fund's organizational documents, the officers and Trustees have been granted certain indemnification rights against certain liabilities that may arise out of performance of their duties to the Fund. The Fund has entered into a separate agreement with each Trustee that converts indemnification rights currently existing under the Fund’s organizational documents into contractual rights that cannot be changed in the future without the consent of the Trustee. Additionally, in the normal course of business, the Fund may enter into contracts with service providers that contain a variety of indemnification clauses. The Fund’s maximum exposure under these arrangements is dependent on future claims that may be made against the Fund and, therefore, cannot be estimated.
11. CORONAVIRUS (COVID-19) PANDEMIC
On March 11, 2020, the World Health Organization announced that it had made the assessment that coronavirus disease 2019 (“COVID-19”) is a pandemic. The impacts of COVID-19 are affecting the entire global economy, individual companies and investment products, the funds, and the market in general. There is significant uncertainty around the extent and duration of business disruptions related to COVID-19 and the impacts may last for an extended period of time. COVID-19 has led to significant uncertainty and volatility in the financial markets.
Allspring VT Small Cap Growth Fund | 25
Report of independent registered public accounting firm
To the Shareholders of the Fund and Board of Trustees
Allspring Variable Trust:
Opinion on the Financial Statements
We have audited the accompanying statement of assets and liabilities of Allspring VT Small Cap Growth Fund (formerly, Wells Fargo VT Small Cap Growth Fund) (the Fund), one of the funds constituting Allspring Variable Trust (formerly, Wells Fargo Variable Trust), including the portfolio of investments, as of December 31, 2021, the related statement of operations for the year then ended, the statements of changes in net assets for each of the years in the two-year period then ended, and the related notes (collectively, the financial statements) and the financial highlights for each of the years in the five-year period then ended. In our opinion, the financial statements and financial highlights present fairly, in all material respects, the financial position of the Fund as of December 31, 2021, the results of its operations for the year then ended, the changes in its net assets for each of the years in the two-year period then ended, and the financial highlights for each of the years in the five-year period then ended, in conformity with U.S. generally accepted accounting principles.
Basis for Opinion
These financial statements and financial highlights are the responsibility of the Fund’s management. Our responsibility is to express an opinion on these financial statements and financial highlights based on our audits. We are a public accounting firm registered with the Public Company Accounting Oversight Board (United States) (PCAOB) and are required to be independent with respect to the Fund in accordance with the U.S. federal securities laws and the applicable rules and regulations of the Securities and Exchange Commission and the PCAOB.
We conducted our audits in accordance with the standards of the PCAOB. Those standards require that we plan and perform the audit to obtain reasonable assurance about whether the financial statements and financial highlights are free of material misstatement, whether due to error or fraud. Our audits included performing procedures to assess the risks of material misstatement of the financial statements and financial highlights, whether due to error or fraud, and performing procedures that respond to those risks. Such procedures included examining, on a test basis, evidence regarding the amounts and disclosures in the financial statements and financial highlights. Such procedures also included confirmation of securities owned as of December 31, 2021, by correspondence with the custodian and transfer agent. Our audits also included evaluating the accounting principles used and significant estimates made by management, as well as evaluating the overall presentation of the financial statements and financial highlights. We believe that our audits provide a reasonable basis for our opinion.

We have not been able to determine the specific year that we began serving as the auditor of one or more Allspring Funds investment companies; however, we are aware that we have served as the auditor of one or more Allspring Funds investment companies since at least 1955.
Boston, Massachusetts
February 25, 2022
26 | Allspring VT Small Cap Growth Fund
Other information (unaudited)
TAX INFORMATION
Pursuant to Section 852 of the Internal Revenue Code, $44,447,104 was designated as a 20% rate gain distribution for the fiscal year ended December 31, 2021.
For the fiscal year ended December 31, 2021, $5,641,030 has been designated as short-term capital gain dividends for nonresident alien shareholders pursuant to Section 871 of the Internal Revenue Code.
PROXY VOTING INFORMATION
A description of the policies and procedures used to determine how to vote proxies relating to portfolio securities is available without charge, upon request, by calling 1-800-260-5969, visiting our website at allspringglobal.com, or visiting the SEC website at sec.gov. Information regarding how the proxies related to portfolio securities were voted during the most recent 12-month period ended June 30 is available on the website at allspringglobal.com or by visiting the SEC website at sec.gov.
SPECIAL MEETING OF SHAREHOLDERS
On August 16, 2021, a Special Meeting of Shareholders for the Fund was held to consider the following proposals. The results of the proposals are indicated below.
Proposal 1 – To consider and approve a new investment management agreement with Wells Fargo Funds Management, LLC*.
| Shares voted “For” | 23,900,737 |
| Shares voted “Against” | 1,958,214 |
| Shares voted “Abstain” | 2,263,222 |
Proposal 2 – To consider and approve a new subadvisory agreement with Wells Capital Management, LLC**.
| Shares voted “For” | 23,780,897 |
| Shares voted “Against” | 1,965,353 |
| Shares voted “Abstain” | 2,375,923 |
* Effective November 1, 2021, known as Allspring Funds Management, LLC.
** Effective November 1, 2021, known as Allspring Global Investments, LLC.
QUARTERLY PORTFOLIO HOLDINGS INFORMATION
The Fund files its complete schedule of portfolio holdings with the SEC for the first and third quarters of each fiscal year as an exhibit to its reports on Form N-PORT. Shareholders may view the filed Form N-PORT by visiting the SEC website at sec.gov.
Allspring VT Small Cap Growth Fund | 27
Other information (unaudited)
BOARD OF TRUSTEES AND OFFICERS
Each of the Trustees and Officers listed in the table below acts in identical capacities for each fund in the Allspring family of funds, which consists of 139 mutual funds comprising the Allspring Funds Trust, Allspring Variable Trust, Allspring Master Trust and four closed-end funds (collectively the “Fund Complex”). This table should be read in conjunction with the Prospectus and the Statement of Additional Information1. The mailing address of each Trustee and Officer is 525 Market Street, 12th Floor, San Francisco, CA 94105. Each Trustee and Officer serves an indefinite term, however, each Trustee serves such term until reaching the mandatory retirement age established by the Trustees.
Independent Trustees
Name and
year of birth | Position held and
length of service* | Principal occupations during past five years or longer | Current other
public company or
investment
company
directorships |
William R. Ebsworth
(Born 1957) | Trustee,
since 2015 | Retired. From 1984 to 2013, equities analyst, portfolio manager, research director and chief investment officer at Fidelity Management and Research Company in Boston, Tokyo, and Hong Kong, and retired in 2013 as Chief Investment Officer of Fidelity Strategic Advisers, Inc. where he led a team of investment professionals managing client assets. Prior thereto, Board member of Hong Kong Securities Clearing Co., Hong Kong Options Clearing Corp., the Thailand International Fund, Ltd., Fidelity Investments Life Insurance Company, and Empire Fidelity Investments Life Insurance Company. Audit Committee Chair and Investment Committee Chair of the Vincent Memorial Hospital Endowment (non-profit organization). Mr. Ebsworth is a CFA® charterholder. | N/A |
Jane A. Freeman
(Born 1953) | Trustee,
since 2015;
Chair Liaison,
since 2018 | Retired. From 2012 to 2014 and 1999 to 2008, Chief Financial Officer of Scientific Learning Corporation. From 2008 to 2012, Ms. Freeman provided consulting services related to strategic business projects. Prior to 1999, Portfolio Manager at Rockefeller & Co. and Scudder, Stevens & Clark. Board member of the Harding Loevner Funds from 1996 to 2014, serving as both Lead Independent Director and chair of the Audit Committee. Board member of the Russell Exchange Traded Funds Trust from 2011 to 2012 and the chair of the Audit Committee. Ms. Freeman is also an inactive Chartered Financial Analyst. | N/A |
Isaiah Harris, Jr.
(Born 1952) | Trustee,
since 2009; Audit
Committee
Chair,
since 2019 | Retired. Chairman of the Board of CIGNA Corporation from 2009 to 2021, and Director from 2005 to 2008. From 2003 to 2011, Director of Deluxe Corporation. Prior thereto, President and CEO of BellSouth Advertising and Publishing Corp. from 2005 to 2007, President and CEO of BellSouth Enterprises from 2004 to 2005 and President of BellSouth Consumer Services from 2000 to 2003. Emeritus member of the Iowa State University Foundation Board of Governors. Emeritus Member of the Advisory Board of Iowa State University School of Business. Advisory Board Member, Palm Harbor Academy (private school). Advisory Board Member, Fellowship of Christian Athletes. Mr. Harris is a certified public accountant (inactive status). | N/A |
Judith M. Johnson**
(Born 1949) | Trustee,
since 2008 | Retired. Prior thereto, Chief Executive Officer and Chief Investment Officer of Minneapolis Employees Retirement Fund from 1996 to 2008. Ms. Johnson is an attorney, certified public accountant and a certified managerial accountant. | N/A |
David F. Larcker
(Born 1950) | Trustee,
since 2009 | James Irvin Miller Professor of Accounting at the Graduate School of Business (Emeritus), Stanford University, Director of the Corporate Governance Research Initiative and Senior Faculty of The Rock Center for Corporate Governance since 2006. From 2005 to 2008, Professor of Accounting at the Graduate School of Business, Stanford University. Prior thereto, Ernst & Young Professor of Accounting at The Wharton School, University of Pennsylvania from 1985 to 2005. | N/A |
28 | Allspring VT Small Cap Growth Fund
Other information (unaudited)
Name and
year of birth | Position held and
length of service* | Principal occupations during past five years or longer | Current other
public company or
investment
company
directorships |
Olivia S. Mitchell
(Born 1953) | Trustee,
since 2006;
Nominating and
Governance
Committee Chair,
since 2018 | International Foundation of Employee Benefit Plans Professor since 1993, Wharton School of the University of Pennsylvania. Director of Wharton’s Pension Research Council and Boettner Center on Pensions & Retirement Research, and Research Associate at the National Bureau of Economic Research. Previously taught at Cornell University from 1978 to 1993. | N/A |
Timothy J. Penny
(Born 1951) | Trustee,
since 1996;
Chair,
since 2018 | President and Chief Executive Officer of Southern Minnesota Initiative Foundation, a non-profit organization, since 2007. Member of the Board of Trustees of NorthStar Education Finance, Inc., a non-profit organization, since 2007. | N/A |
James G. Polisson
(Born 1959) | Trustee,
since 2018 | Retired. Chief Marketing Officer, Source (ETF) UK Services, Ltd, from 2015 to 2017. From 2012 to 2015, Principal of The Polisson Group, LLC, a management consulting, corporate advisory and principal investing company. Chief Executive Officer and Managing Director at Russell Investments, Global Exchange Traded Funds from 2010 to 2012. Managing Director of Barclays Global Investors from 1998 to 2010 and Global Chief Marketing Officer for iShares and Barclays Global Investors from 2000 to 2010. Trustee of the San Francisco Mechanics’ Institute, a non-profit organization, from 2013 to 2015. Board member of the Russell Exchange Traded Fund Trust from 2011 to 2012. Director of Barclays Global Investors Holdings Deutschland GmbH from 2006 to 2009. Mr. Polisson is an attorney and has a retired status with the Massachusetts and District of Columbia Bar Associations. | N/A |
Pamela Wheelock
(Born 1959) | Trustee,
since January
2020; previously
Trustee from
January 2018 to
July 2019 | Board member of the Destination Medical Center Economic Development Agency, Rochester, Minnesota since 2019. Interim President of the McKnight Foundation from January to September 2020. McKnight Foundation Consultant, November 2020 to February 2021. Acting Commissioner, Minnesota Department of Human Services, July 2019 through September 2019. Consultant (part-time), Minnesota Department of Human Services, October 2019 through December 2019. Chief Operating Officer, Twin Cities Habitat for Humanity from 2017 to 2019. Vice President of University Services, University of Minnesota from 2012 to 2016. Prior thereto, on the Board of Directors, Governance Committee and Finance Committee for the Minnesota Philanthropy Partners (Saint Paul Foundation) from 2012 to 2018, Interim Chief Executive Officer of Blue Cross Blue Shield of Minnesota from 2011 to 2012, Chairman of the Board from 2009 to 2012 and Board Director from 2003 to 2015. Vice President, Leadership and Community Engagement, Bush Foundation, Saint Paul, Minnesota (a private foundation) from 2009 to 2011. Executive Vice President and Chief Financial Officer, Minnesota Sports and Entertainment from 2004 to 2009 and Senior Vice President from 2002 to 2004. Executive Vice President of the Minnesota Wild Foundation from 2004 to 2008. Commissioner of Finance, State of Minnesota, from 1999 to 2002. Currently Board Chair of the Minnesota Wild Foundation since 2010. | N/A |
* Length of service dates reflect the Trustee’s commencement of service with the Trust’s predecessor entities, where applicable.
** Ms. Johnson has resigned from the Board effective December 31, 2021.
Allspring VT Small Cap Growth Fund | 29
Other information (unaudited)
Officers2
Name and
year of birth | Position held and
length of service | Principal occupations during past five years or longer |
Andrew Owen
(Born 1960) | President,
since 2017 | President, Chief Executive Officer and Director of Allspring Funds Management, LLC since 2017 and co-president of Galliard Capital Management, LLC, an affiliate of Allspring Funds Management, LLC, since 2019. Prior thereto, Head of Affiliated Managers, Allspring Global Investments, from 2014 to 2019 and Executive Vice President responsible for marketing, investments and product development for Allspring Funds Management, LLC, from 2009 to 2014. In addition, Mr. Owen was an Executive Vice President of Wells Fargo & Company from 2014 to 2021. |
Jeremy DePalma
(Born 1974) | Treasurer,
since 2012
(for certain funds in
the Fund Complex);
since 2021 (for
the remaining funds in the
Fund Complex) | Senior Vice President of Allspring Funds Management, LLC since 2009. Senior Vice President of Evergreen Investment Management Company, LLC from 2008 to 2010 and head of the Fund Reporting and Control Team within Fund Administration. |
Kate McKinley
(Born 1977) | Chief Legal Officer,
since 2021 | Chief Legal Officer of Allspring Global Investments since 2021. Prior thereto, held various roles at State Street Global Advisors beginning in 2010, including serving as Senior Vice President and General Counsel from 2019 to 2021, and Chief Operating Officer of the Institutional Client Group from 2016 - 2019. Prior to working at State Street Global Advisors served as Assistant General Counsel for Bank of America Corporation from 2005 to 2010 and as an Associate at WilmerHale from 2002 to 2005. |
Christopher Baker
(Born 1976) | Chief Compliance Officer, since 2022 | Global Chief Compliance Officer for Allspring Global Investments since 2022. Prior thereto, Chief Compliance Officer for State Street Global Advisors from 2018 to 2021. Senior Compliance Officer for the State Street divisions of Alternative Investment Solutions, Sector Solutions, and Global Marketing from 2015 to 2018. From 2010 to 2015 Vice President, Global Head of Investment and Marketing Compliance for State Street Global Advisors. |
Matthew Prasse
(Born 1983) | Secretary,
since 2021 | Senior Counsel of the Allspring Legal Department since 2021. Senior Counsel of the Wells Fargo Legal Department from 2018 to 2021. Previously, Counsel for Barings LLC from 2015 to 2018. Prior to joining Barings, Associate at Morgan, Lewis & Bockius LLP from 2008 to 2015. |
1 The Statement of Additional Information includes additional information about the Trustees and is available, without charge, upon request, by calling 1-800-222-8222 or by visiting the website at allspringglobal.com.
2 For those Officers with tenures at Allspring Global Investments and/or Allspring Funds Management, LLC that began prior to 2021, such tenures include years of service during which these businesses/entities were known as Wells Fargo Asset Management and Wells Fargo Funds Management, LLC, respectively.
30 | Allspring VT Small Cap Growth Fund
For more information
More information about Allspring Funds is available free upon request. To obtain literature, please write, visit the Fund's website, or call:
Allspring Funds
P.O. Box 219967
Kansas City, MO 64121-9967
Website: allspringglobal.com
Individual investors: 1-800-260-5969
Retail investment professionals: 1-888-877-9275
Institutional investment professionals: 1-866-765-0778
This report and the financial statements contained herein are submitted for the general information of the shareholders of the Fund. If this report is used for promotional purposes, distribution of the report must be accompanied or preceded by a current prospectus. Before investing, please consider the investment objectives, risks, charges, and expenses of the investment. For a current prospectus and, if available, a summary prospectus, containing this information, call
1-800-260-5969 or visit the Fund's website at allspringglobal.com. Read the prospectus carefully before you invest or send money.
Allspring Global InvestmentsTM is the trade name for the asset management firms of Allspring Global Investments Holdings, LLC, a holding company indirectly owned by certain private funds of GTCR LLC and Reverence Capital Partners, L.P. These firms include but are not limited to Allspring Global Investments, LLC, and Allspring Funds Management, LLC. Certain products managed by Allspring entities are distributed by Allspring Funds Distributor, LLC (a broker-dealer and Member FINRA/SIPC).
This material is for general informational and educational purposes only and is NOT intended to provide investment advice or a recommendation of any kind - including a recommendation for any specific investment, strategy, or plan.
© 2022 Allspring Global Investments Holdings, LLC. All rights reserved.
PAR-0122-00231 02-22
AVT7/AR153 12-21
ITEM 2. CODE OF ETHICS
(a) As of the end of the period, covered by the report, Allspring Variable Trust has adopted a code of ethics that applies to its President and Treasurer. A copy of the code of ethics is filed as an exhibit to this Form N-CSR.
(c) During the period covered by this report, there were no amendments to the provisions of the code of ethics adopted in Item 2(a) above.
(d) During the period covered by this report, there were no implicit or explicit waivers to the provisions of the code of ethics adopted in Item 2(a) above.
ITEM 3. AUDIT COMMITTEE FINANCIAL EXPERT
The Board of Trustees of Allspring Variable Trust has determined that Isaiah Harris and Judith Johnson are each an audit committee financial expert, as defined in Item 3 of Form N-CSR. Mr. Harris and Ms. Johnson are independent for purposes of Item 3 of Form N-CSR.
ITEM 4. PRINCIPAL ACCOUNTANT FEES AND SERVICES
(a), (b), (c), (d) The following table presents aggregate fees billed in each of the last two fiscal years for services rendered to the Registrant by the Registrant’s principal accountant. These fees were billed to the registrant and were approved by the Registrant’s audit committee.
| | | | | | | | |
| | | Fiscal year ended | | | Fiscal year ended | |
| | | December 31,
2021, | | | December 31, 2020, | |
Audit fees | | $ | 195,810 | | | $ | 192,340 | |
Audit-related fees | | | — | | | | — | |
Tax fees (1) | | | 17,300 | | | | 16,910 | |
All other fees | | | — | | | | — | |
| | | | | | | | |
| | $ | 213,110 | | | $ | 209,250 | |
| | | | | | | | |
(1) Tax fees consist of fees for tax compliance, tax advice, tax planning and excise tax.
(e) The Chair of the Audit Committees is authorized to pre-approve: (1) audit services to the mutual funds of the Allspring Variable Trust; (2) non-audit tax or compliance consulting or training services provided to the Allspring Multi-Sector Income Fund by the independent auditors (“Auditors”) if the fees for any particular engagement are not anticipated to exceed $50,000; and (3) non-audit tax or compliance consulting or training services provided by the Auditors to a Allspring Multi-Sector Income Fund’s
investment adviser and its controlling entities (where pre-approval is required because the engagement relates directly to the operations and financial reporting of the Allspring Multi-Sector Income Fund) if the fee to the Auditors for any particular engagement is not anticipated to exceed $50,000. For any such pre-approval sought from the Chair, Management shall prepare a brief description of the proposed services. If the Chair approves of such service, he or she shall sign the statement prepared by Management. Such written statement shall be presented to the full Committees at their next regularly scheduled meetings.
(f) Not applicable
(g) Not applicable
(h) Not applicable
| ITEM 5. | AUDIT COMMITTEE OF LISTED REGISTRANTS |
Not applicable.
A Portfolio of Investments for each series of Allspring Variable Trust is included as part of the report to shareholders filed under Item 1 of this Form.
| ITEM 7. | DISCLOSURE OF PROXY VOTING POLICIES AND PROCEDURES FOR CLOSED-END MANAGEMENT INVESTMENT COMPANIES |
Not applicable.
| ITEM 8. | PORTFOLIO MANAGERS OF CLOSED-END MANAGEMENT INVESTMENT COMPANIES |
Not applicable.
| ITEM 9. | PURCHASES OF EQUITY SECURITIES BY CLOSED-END MANAGEMENT INVESTMENT COMPANY AND AFFILIATED PURCHASERS |
Not applicable.
| ITEM 10. | SUBMISSION OF MATTERS TO A VOTE OF SECURITY HOLDERS |
There have been no material changes to the procedures by which shareholders may recommend nominees to the registrant’s Board of Trustees that have been implemented since the registrant’s last provided disclosure in response to the requirements of this Item.
| ITEM 11. | CONTROLS AND PROCEDURES |
(a) The President and Treasurer have concluded that Allspring Variable Trust disclosure controls and procedures (as defined in Rule 30a-3(c) under the Investment Company Act of 1940) provide reasonable assurances that material information relating to the registrant is made known to them by the appropriate persons based on their evaluation of these controls and procedures as of a date within 90 days of the filing of this report.
(b) There were no significant changes in the registrant’s internal controls over financial reporting (as defined in Rule 30a-3(d) under the Investment Company Act of 1940) that occurred during the most recent fiscal half-year of the period covered by this report that materially affected, or is reasonably likely to materially affect, the registrant’s internal control over financial reporting.
| ITEM 12. | DISCLOSURES OF SECURITIES LENDING ACTIVITES FOR CLOSED-END MANAGEMENT INVESTMENT COMPANIES |
Not applicable.
(a)(1) Code of Ethics.
(a)(2) Certifications pursuant to Section 302 of the Sarbanes-Oxley Act of 2002.
(b) Certifications pursuant to Section 906 of the Sarbanes-Oxley Act of 2002.
SIGNATURES
Pursuant to the requirements of the Securities Exchange Act of 1934 and the Investment Company Act of 1940, the registrant has duly caused this report to be signed on its behalf by the undersigned, thereunto duly authorized.
| | |
| Allspring Variable Trust |
| |
| By: | | |
| |
| | /s/ Andrew Owen |
| |
| | Andrew Owen |
| | President |
| |
| Date: | | February 25, 2022 |
Pursuant to the requirements of the Securities Exchange Act of 1934 and the Investment Company Act of 1940, this report has been signed below by the following persons on behalf of the registrant and in the capacities and on the date indicated.
| | |
| Allspring Variable Trust |
| |
| By: | | /s/ Andrew Owen |
| |
| | Andrew Owen |
| | President |
| | |
| |
| Date: | | February 25, 2022 |
| |
| By: | | |
| | /s/ Jeremy DePalma |
| |
| | Jeremy DePalma |
| | Treasurer |
| |
| Date: | | February 25, 2022 |