UNITED STATES
SECURITIES AND EXCHANGE COMMISSION
Washington, D.C. 20549
FORM N-CSR
CERTIFIED SHAREHOLDER REPORT OF REGISTERED
MANAGEMENT INVESTMENT COMPANIES
Investment Company Act file number: 811-09255
Allspring Variable Trust
(Exact name of registrant as specified in charter)
1415 Vantage Park Drive, 3rd Floor, Charlotte, NC 28203
(Address of principal executive offices) (Zip code)
Matthew Prasse
Allspring Funds Management, LLC
1415 Vantage Park Drive, 3rd Floor, Charlotte, NC 28203
(Name and address of agent for service)
Registrant’s telephone number, including area code: 800-222-8222
Date of fiscal year end: December 31
Registrant is making a filing for 6 of its series: Allspring VT Discovery All Cap Growth Fund, Allspring VT Discovery SMID Cap Growth Fund, Allspring VT Index Asset Allocation Fund, Allspring VT International Equity Fund, Allspring VT Opportunity Fund and Allspring VT Small Cap Growth Fund.
Date of reporting period: December 31, 2023
ITEM 1. REPORT TO STOCKHOLDERS
Allspring VT
Discovery All Cap
Growth Fund
(formerly, Allspring VT Omega Growth Fund)
Annual Report
December 31, 2023
The views expressed and any forward-looking statements are as of December 31, 2023, unless otherwise noted, and are those of the Fund’s portfolio managers and/or Allspring Global Investments. Discussions of individual securities or the markets generally are not intended as individual recommendations. Future events or results may vary significantly from those expressed in any forward-looking statements. The views expressed are subject to change at any time in response to changing circumstances in the market. Allspring Global Investments disclaims any obligation to publicly update or revise any views expressed or forward-looking statements.
Allspring VT Discovery All Cap Growth Fund | 1
Letter to shareholders (unaudited)
Andrew Owen
President
Allspring Funds
Dear Shareholder:
We are pleased to offer you this annual report for the Allspring VT Discovery All Cap Growth Fund for the 12-month period that ended December 31, 2023. Effective May 1, 2023, the Fund changed its name from Allspring VT Omega Growth Fund to Allspring VT Discovery All Cap Growth Fund. Globally, stocks and bonds experienced high levels of volatility throughout the period but had positive overall results. The market was focused on persistently high inflation and the impact of ongoing aggressive central bank rate hikes. Compounding these concerns were the global reverberations of the Russia-Ukraine war. Riskier assets rallied in 2023, as investors anticipated an end to the tight monetary policy despite concerns of a possible recession. After suffering deep and broad losses through 2022, bonds now benefit from a base of higher yields that can help generate higher income.
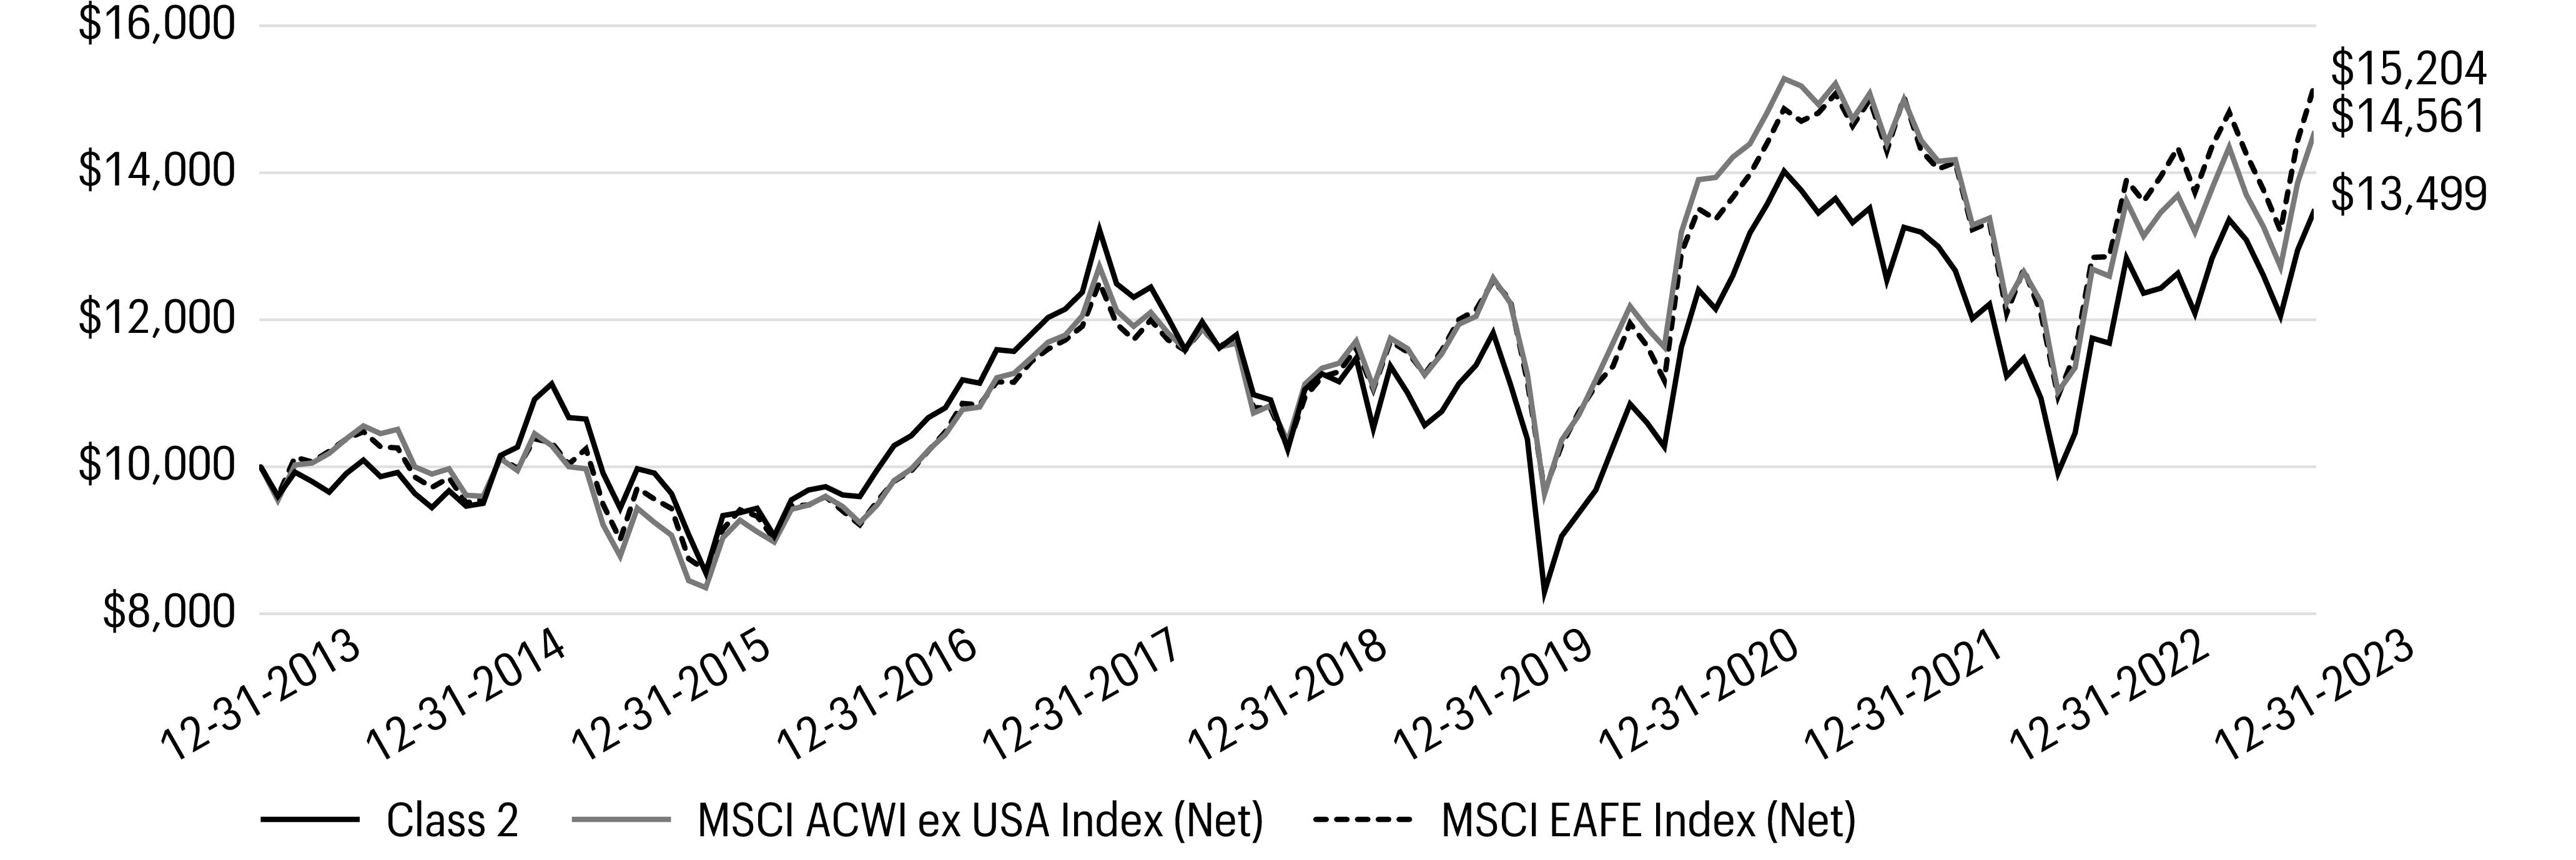
For the 12-month period, stocks generally outperformed bonds—both domestic U.S. and global. For the period, U.S. stocks, based on the S&P 500 Index,1 gained 26.29%. International stocks, as measured by the MSCI ACWI ex USA Index (Net),2 returned 15.62%, while the MSCI EM Index (Net) (USD)3 had more modest performance, with a gain of 9.83%. Among bond indexes, the Bloomberg U.S. Aggregate Bond Index4 returned 5.53%, the Bloomberg Global Aggregate ex-USD Index (unhedged)5 gained 5.72%, the Bloomberg Municipal Bond Index6 returned 6.40%, and the ICE BofA U.S. High Yield Index7 gained 13.54%.
Despite high inflation and central bank rate hikes, markets rallied.
The year 2023 began with a rally across global equities and fixed income securities. Investor optimism rose in response to data indicating declining inflation rates and the reopening of China’s economy with the abrupt end to its zero-COVID-19 policy. The U.S. reported strong job gains and unemployment fell to 3.4%—the lowest level since 1969. Meanwhile, wage growth, seen as a potential contributor to ongoing high inflation, continued to moderate. All eyes remained on the Federal Reserve (Fed) and on how many more rate hikes remain in this tightening cycle. The 0.25% federal funds rate hike announced in January was the Fed’s smallest rate increase since March 2022.
Markets declined in February as investors responded unfavorably to resilient economic data. The takeaway: Central banks would likely continue their monetary tightening cycle for longer than markets had priced in. In this environment—where strong economic data is seen as bad news—the resilient U.S. labor market was taken as a negative, with inflation not falling quickly enough for the Fed, which raised interest rates by 0.25% in February. Meanwhile, the Bank of England (BoE) and the European Central Bank (ECB) both raised rates by 0.50%.
1
The S&P 500 Index consists of 500 stocks chosen for market size, liquidity, and industry group representation. It is a market-value-weighted index with each stock’s weight in the index proportionate to its market value. You cannot invest directly in an index.
2
The Morgan Stanley Capital International (MSCI) All Country World Index (ACWI) ex USA Index (Net) is a free-float-adjusted market-capitalization-weighted index that is designed to measure the equity market performance of developed and emerging markets, excluding the U.S. Source: MSCI. MSCI makes no express or implied warranties or representations and shall have no liability whatsoever with respect to any MSCI data contained herein. The MSCI data may not be further redistributed or used as a basis for other indexes or any securities or financial products. This report is not approved, reviewed, or produced by MSCI. You cannot invest directly in an index.
3
The MSCI Emerging Markets (EM) Index (Net) (USD) is a free-float-adjusted market-capitalization-weighted index that is designed to measure the equity market performance of emerging markets. You cannot invest directly in an index.
4
The Bloomberg U.S. Aggregate Bond Index is a broad-based benchmark that measures the investment-grade, U.S.-dollar-denominated, fixed-rate taxable bond market, including Treasuries, government-related and corporate securities, mortgage-backed securities (agency fixed-rate and hybrid adjustable-rate mortgage pass-throughs), asset-backed securities, and commercial mortgage-backed securities. You cannot invest directly in an index.
5
The Bloomberg Global Aggregate ex-USD Index (unhedged) is an unmanaged index that provides a broad-based measure of the global investment-grade fixed-income markets excluding the U.S.-dollar-denominated debt market. You cannot invest directly in an index.
6
The Bloomberg Municipal Bond Index is an unmanaged index composed of long-term tax-exempt bonds with a minimum credit rating of Baa. You cannot invest directly in an index.
7
The ICE BofA U.S. High Yield Index is a market-capitalization-weighted index of domestic and Yankee high yield bonds. The index tracks the performance of high yield securities traded in the U.S. bond market. You cannot invest directly in an index. Copyright 2024. ICE Data Indices, LLC. All rights reserved.
2 | Allspring VT Discovery All Cap Growth Fund
Letter to shareholders (unaudited)
“ The collapse of Silicon Valley Bank in March—the second-largest banking failure in U.S. history—led to a bank run that spread to Europe, where Switzerland’s Credit Suisse was taken over by its rival, UBS. ”
The collapse of Silicon Valley Bank in March—the second-largest banking failure in U.S. history—led to a bank run that spread to Europe, where Switzerland’s Credit Suisse was taken over by its rival, UBS. The banking industry turmoil created an additional challenge for central banks in balancing inflationary concerns against potential economic weakening. Meanwhile, recent data pointed to economic strength in the U.S., Europe, and China. And China’s economy continued to rebound after the removal of its COVID-19 lockdown. Inflation rates in the U.S., the U.K., and the eurozone all remained higher than central bank targets, leading to additional rate hikes in March.
Economic data released in April pointed to global resilience, as Purchasing Managers Indexes1 in the U.S., U.K., and eurozone beat expectations and China reported first-quarter annualized economic growth of 4.5%. Despite banking industry stress, developed market stocks had monthly gains. The U.S. labor market remained strong, with a 3.5% jobless rate and monthly payroll gains above 200,000. However, uncertainty and inflationary concerns weighed on investors in the U.S. and abroad.
May was marked by a divergence between expanding activity in services and an overall contraction in manufacturing activity in the U.S., U.K., and eurozone. Core inflation remained elevated in the U.S. and Europe, despite the ongoing efforts of the Fed and the ECB, which included rate hikes of 0.25% by both in May. Stubborn inflation and the resilient U.S. labor market led to expectations of further interest rate hikes, overall monthly declines across bond indexes, and mixed results for stocks in May. Investor worries over a U.S. debt ceiling impasse were modest, and market confidence was buoyed by a deal in late May to avert a potential U.S. debt default.
June featured the Fed’s first pause on interest rate hikes since March 2022, when it began its aggressive campaign to rein in inflation. However, inflation, as measured by the Core Consumer Price Index (CPI)2, while continuing to decline, remained stubbornly high in June at 4.8%, well above the Fed’s 2.0% target rate. With the U.S. unemployment rate still at 3.6%, near a historical low, and U.S. payrolls growing in June for the 30th consecutive month, expectations of more Fed rate hikes were reinforced. However, U.S. and global stocks had strong returns in June.
July was a good month for stocks. However, bonds had more muted but positive monthly returns overall. Riskier sectors and regions tended to do well, as investors grew more optimistic regarding economic prospects. With strong second-quarter gross domestic product (GDP) growth—initially estimated at 2.4%—and U.S. annual inflation easing steadily to 3.2% in July, hopes for a soft economic landing grew. The Fed, the ECB, and the BoE all raised their respective key interest rates by 0.25% in July. In the Fed’s case, speculation grew that it could be very close to the end of its tightening cycle. Meanwhile, China’s economy showed signs of stagnation, renewing concerns of global fallout.
Stocks retreated in August while monthly bond returns were flat overall. Increased global market volatility reflected unease over the Chinese property market being stressed along with weak Chinese economic data. On a more positive note, speculation grew over a possible end to the Fed’s campaign of interest rate increases or at least a pause in September. U.S. economic data generally remained solid, with resilient job market data and inflation ticking up slightly in August, as the annual CPI3 rose 3.7%. However, the three-month trend for Core CPI stood at a more encouraging annualized 2.4%.
1
The Purchasing Managers Index (PMI) is an index of the prevailing direction of economic trends in the manufacturing and service sectors. You cannot invest directly in an index.
2
The Core Consumer Price Index (CPI) is a measure of the average change over time in the prices paid by urban consumers for a market basket of consumer goods and services excluding energy and food prices. You cannot invest directly in an index.
3
The CPI is a measure of the average change over time in the prices paid by urban consumers for a market basket of consumer goods and services. You cannot invest directly in an index.
Allspring VT Discovery All Cap Growth Fund | 3
Letter to shareholders (unaudited)
Stocks and bonds both had negative overall returns in September as investors reluctantly recited the new chorus of “higher for longer,” led by the Fed’s determination not to lower interest rates until it knows it has vanquished its pesky opponent—higher-than-targeted inflation. As of September, the two primary gauges of U.S. inflation—the annual Core Personal Consumption Expenditures Price Index1 and the CPI—both stood at roughly 4%, twice as high as the Fed’s oft-stated 2% target. The month ended with the prospect of yet another U.S. government shutdown, averted at least temporarily but looming later this fall.
October was a tough month for stocks and bonds. Key global and domestic indexes all were pushed down by rising geopolitical tensions, particularly the Israel-Hamas conflict, and concerns over the Fed’s “higher for longer” monetary policy. The U.S. 10-year Treasury yield rose above 5% for the first time since 2007. Commodity prices did well as oil prices rallied in response to the prospect of oil supply disruptions from the Middle East. U.S. annualized third-quarter GDP was estimated at a healthier-than-anticipated 4.9%. China’s GDP indicated surprisingly strong industrial production and retail sales, offset by ongoing weakness in its real estate sector.
In November, the market mood turned positive as cooling inflation inspired confidence that central banks could hold off on further rate hikes. Overall annual inflation in the U.S. fell to 3.1% in November while 12-month inflation in the U.K. and eurozone eased to 4.6% and 2.4%, respectively—far below their peak levels of mid-2022. Third quarter annualized U.S. GDP growth was raised to an estimated 5.2% while U.S. job totals rose by just below 200,000 in November, indicating a slight cooling of the labor market. All of this fresh evidence added to confidence for a U.S. soft economic landing, leading to a more buoyant mood heading into winter as the Federal Open Market Committee held rates steady at its December meeting.
The broad year-end rally among stocks and bonds that began in November continued through December as investors became more confident that monetary policy would ease in 2024. Supporting the bubbly market mood were a series of reports confirming lower inflationary trends in the U.S. and Europe. During the period, it appeared more likely that the U.S. economy could achieve a soft landing, cooling enough to lower inflation without the pain of a recession. However, by year-end, an expectations gap developed. Capital markets priced in a total of 1.50 percentage points in federal funds rate cuts in 2024—twice as much as the three cuts of 0.25% hinted at by Fed officials.
“ In November, the market mood turned positive as cooling inflation inspired confidence that central banks could hold off on further rate hikes. ”
1
The Core Personal Consumption Expenditures Price Index (PCE) is a measure of prices that people living in the United States, or those buying on their behalf, pay for goods and services. It is sometimes called the core PCE price index, because two categories that can have price swings – food and energy – are left out to make underlying inflation easier to see. You cannot invest directly in an index.
4 | Allspring VT Discovery All Cap Growth Fund
Letter to shareholders (unaudited)
For further information about your fund, contact your investment professional, visit our website at allspringglobal.com, or call us directly at 1-800-260-5969.
Don’t let short-term uncertainty derail long-term investment goals.
Periods of investment uncertainty can present challenges, but experience has taught us that maintaining long-term investment goals can be an effective way to plan for the future. To help you create a sound strategy based on your personal goals and risk tolerance, Allspring Funds offers more than 100 mutual funds spanning a wide range of asset classes and investment styles. Although diversification cannot guarantee an investment profit or prevent losses, we believe it can be an effective way to manage investment risk and potentially smooth out overall portfolio performance. We encourage investors to know their investments and to understand that appropriate levels of risk-taking may unlock opportunities.
Thank you for choosing to invest with Allspring Funds. We appreciate your confidence in us and remain committed to helping you meet your financial needs.
Sincerely,
Andrew Owen
President
Allspring Funds
Allspring VT Discovery All Cap Growth Fund | 5
Letter to shareholders (unaudited)
|
Beginning in July 2024, the Fund will be required by the Securities and Exchange Commission to send shareholders a paper copy of a new tailored shareholder report in place of the full shareholder report that you are now receiving. The tailored shareholder report will contain concise information about the Fund, including certain expense and performance information and fund statistics. If you wish to receive this new tailored shareholder report electronically, please follow the instructions on the back cover of this report. |
Other information that is currently included in the shareholder report, such as the Fund’s financial statements, will be available online and upon request, free of charge, in paper or electronic format. |
6 | Allspring VT Discovery All Cap Growth Fund
This page is intentionally left blank.
Performance highlights (unaudited)
Performance highlights
| The Fund seeks long-term capital appreciation. |
| Allspring Funds Management, LLC |
| Allspring Global Investments, LLC |
| Michael T. Smith, CFA, Christopher J. Warner, CFA |
Average annual total returns (%) as of December 31, 2023 |
| | | | | |
| | | | | | |
| | | | | | |
| | | | | | |
Russell 3000® Growth Index3 | | | | | | |
Figures quoted represent past performance, which is no guarantee of future results. Investment return and principal value of an investment will fluctuate so that an investor’s shares, when redeemed, may be worth more or less than their original cost. Current performance may be lower or higher than the performance data quoted and assumes the reinvestment of dividends and capital gains. Current month-end performance is available by calling 1-800-260-5969. Performance figures of the Fund do not reflect fees and expenses charged pursuant to the terms of variable life insurance policies and variable annuity contracts. If these fees and expenses had been reflected, performance would have been lower.
Index returns do not include transaction costs associated with buying and selling securities, any mutual fund fees or expenses, or any taxes. It is not possible to invest directly in an index.
Shares are sold without a front-end sales charge or contingent deferred sales charge.
|
| Reflects the expense ratios as stated in the most recent prospectuses. The expense ratios shown are subject to change and may differ from the annualized expense ratios shown in the Financial Highlights of this report. |
| The manager has contractually committed through April 30, 2024, to waive fees and/or reimburse expenses to the extent necessary to cap total annual fund operating expenses after fee waivers at 0.75% for Class 1 shares and 1.00% for Class 2 shares. Brokerage commissions, stamp duty fees, interest, taxes, acquired fund fees and expenses (if any), and extraordinary expenses are excluded from the expense caps. Prior to or after the commitment expiration date, the caps may be increased or the commitment to maintain the caps may be terminated only with the approval of the Board of Trustees. Without these caps, the Fund’s returns would have been lower. The expense ratio paid by an investor is the net expense ratio (the total annual fund operating expenses after fee waivers) as stated in the prospectuses. |
| The Russell 3000® Growth Index measures the performance of those Russell 3000® Index companies with higher price/book ratios and higher forecasted growth values. You cannot invest directly in an index. |
Stock values fluctuate in response to the activities of individual companies and general market and economic conditions. Certain investment strategies tend to increase the total risk of an investment (relative to the broader market). Foreign investments are especially volatile and can rise or fall dramatically due to differences in the political and economic conditions of the host country. These risks are generally intensified in emerging markets. This fund is exposed to smaller-company securities risk. Consult the Fund’s prospectus for additional information on these and other risks.
Please refer to the prospectus provided by your participating insurance company for detailed information describing the separate accounts for information regarding surrender charges, mortality and expense risk fees, and other charges that may be assessed by the participating insurance companies.
CFA® and Chartered Financial Analyst® are trademarks owned by CFA Institute. |
8 | Allspring VT Discovery All Cap Growth Fund
Performance highlights (unaudited)
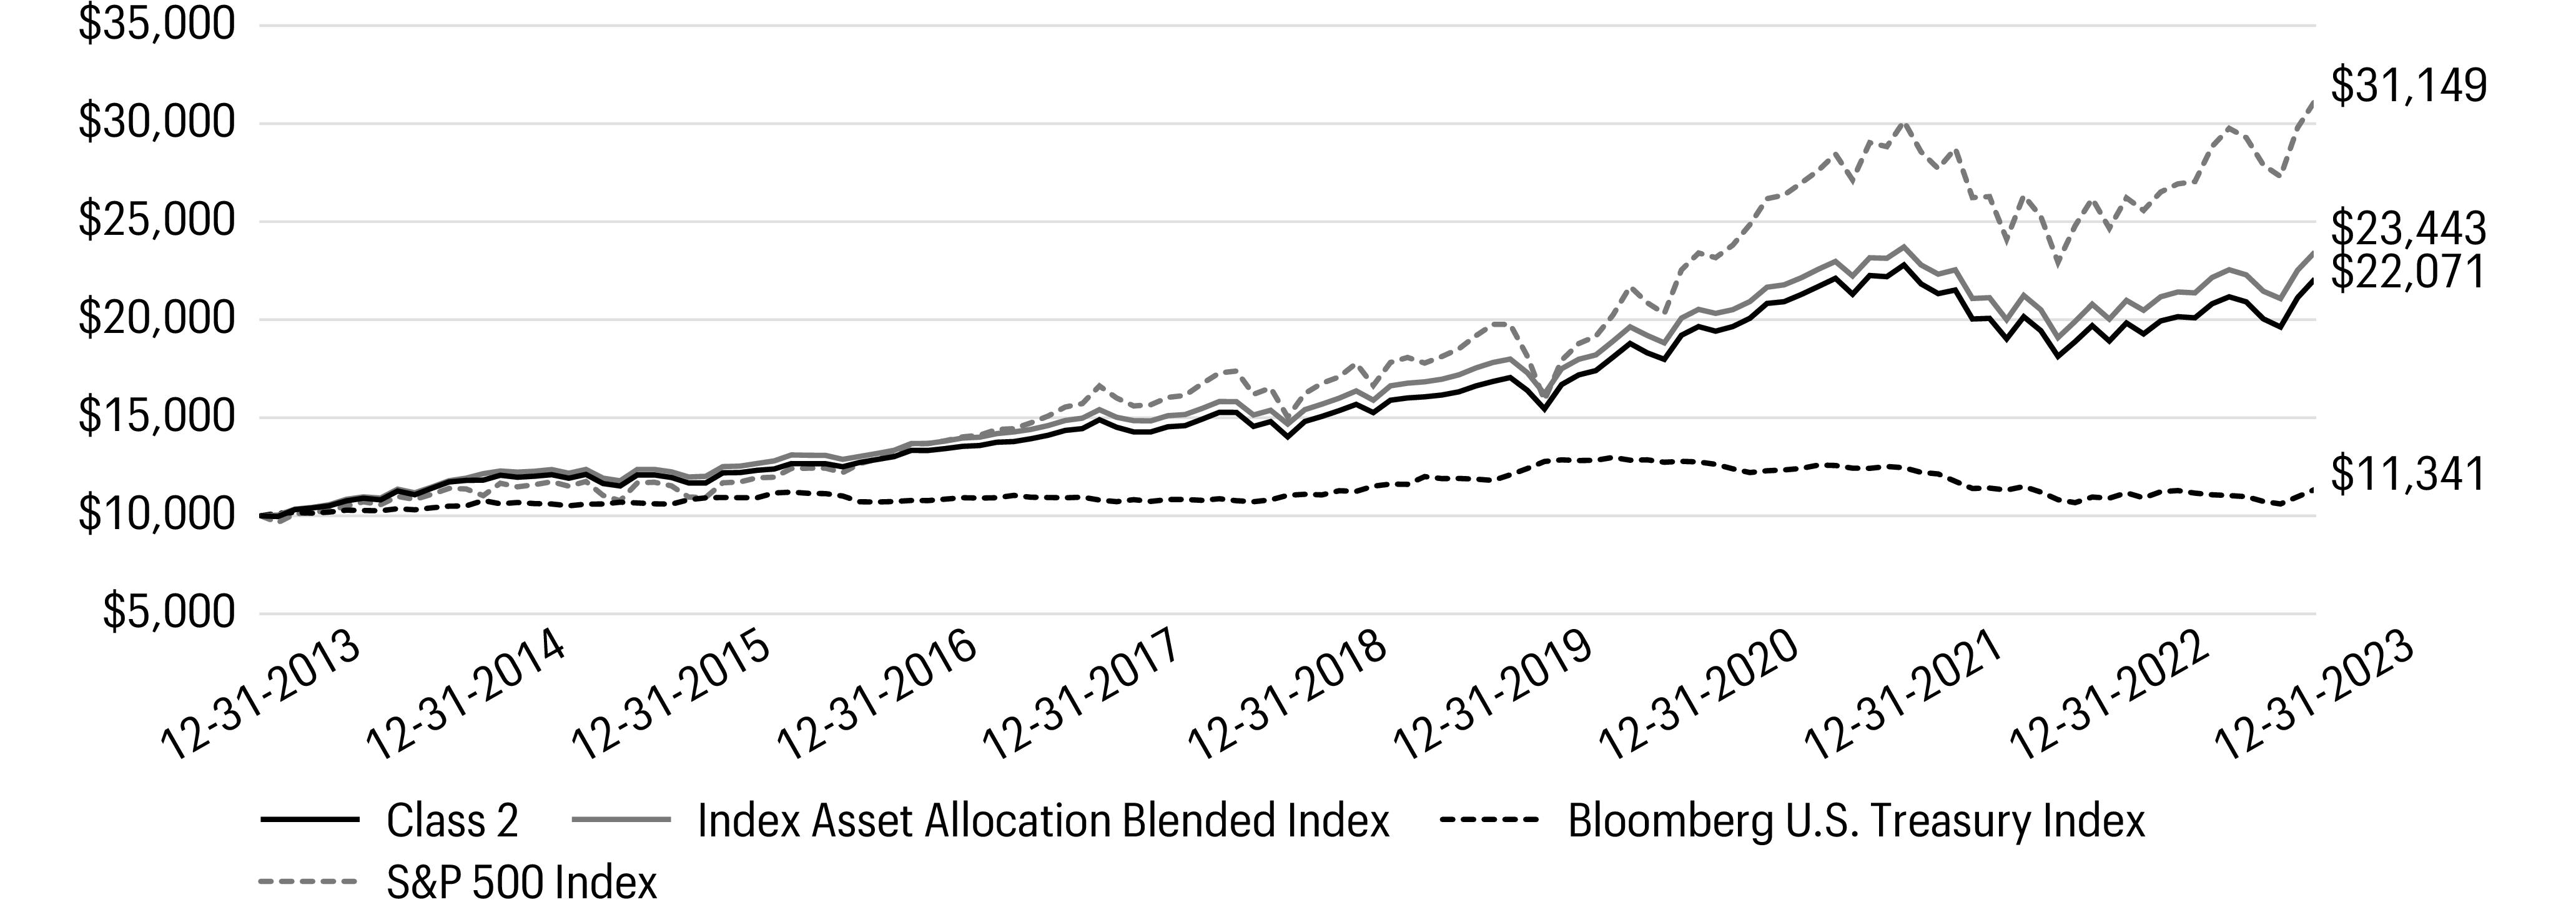
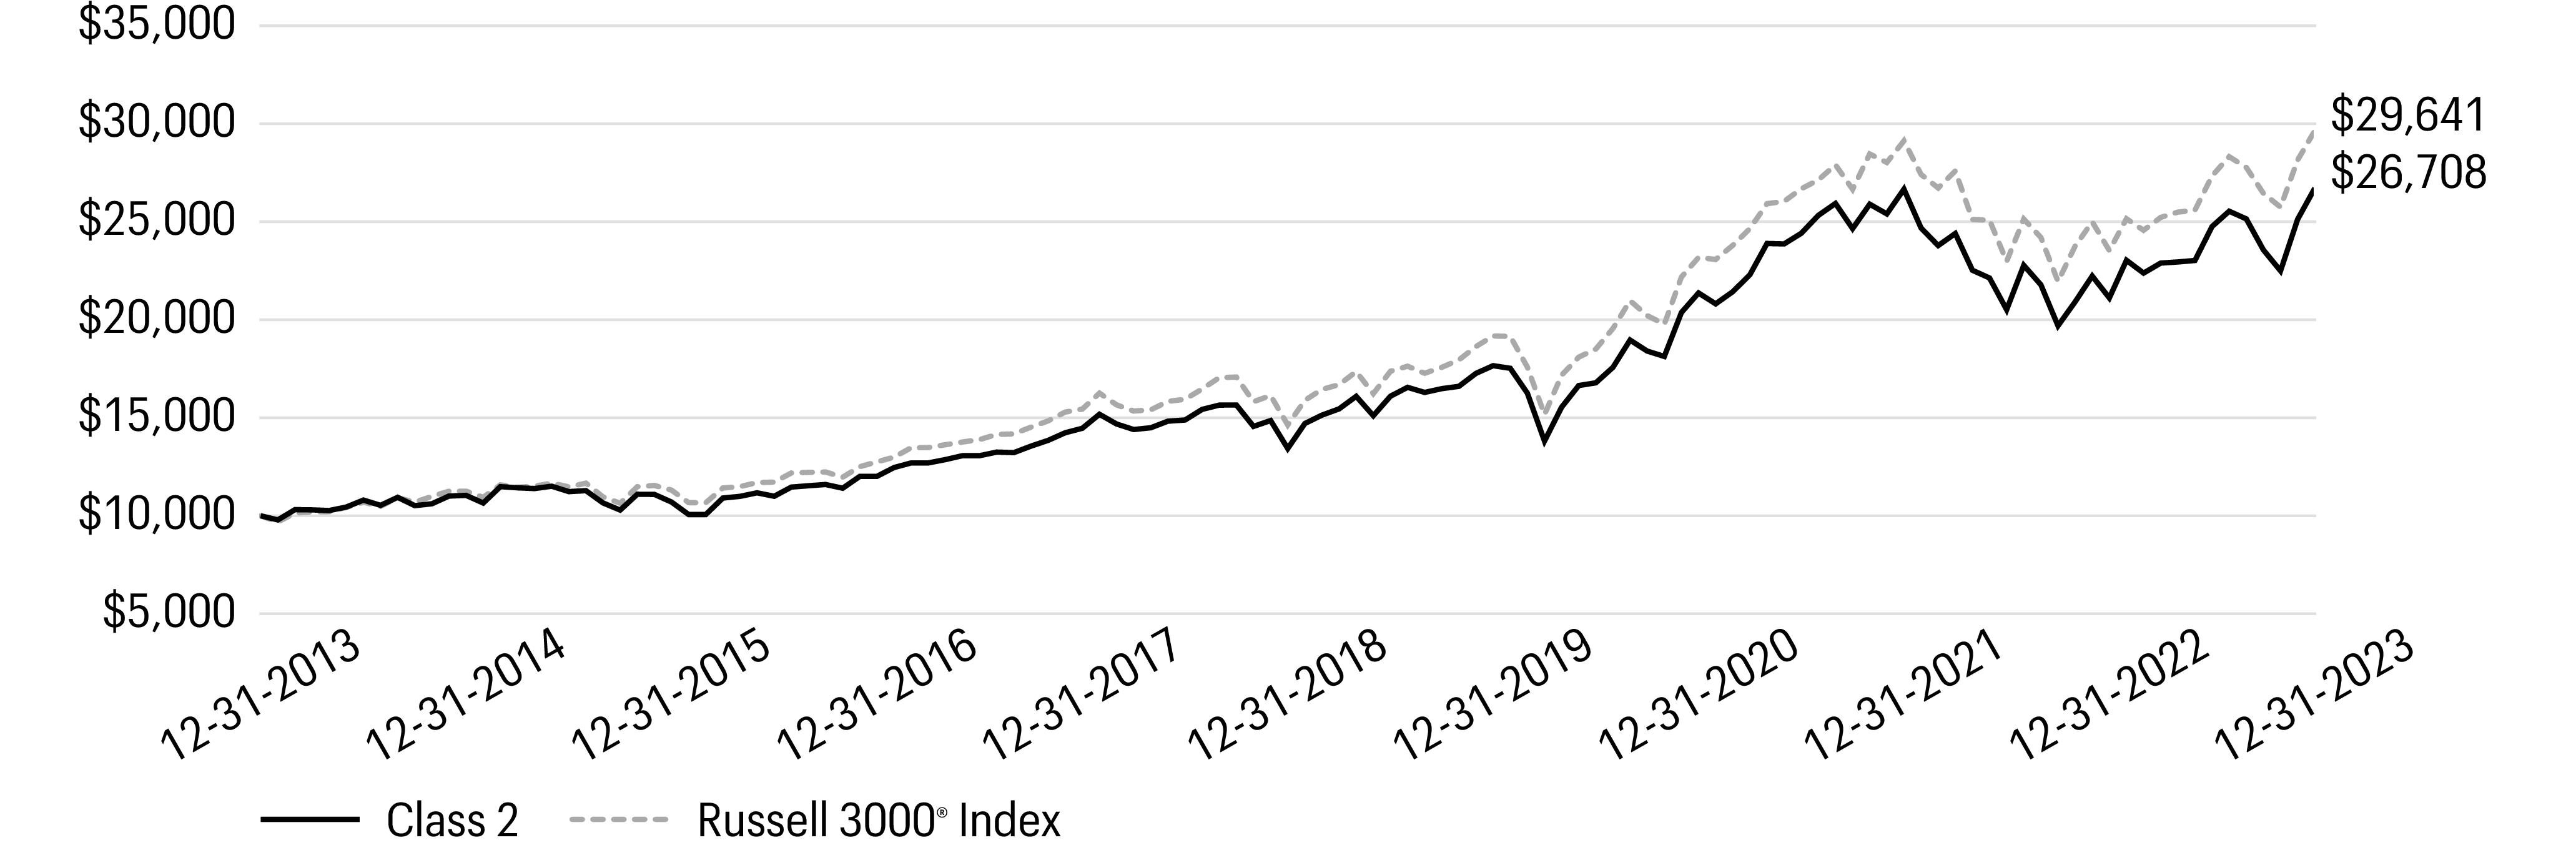
Growth of $10,000 investment as of December 31, 20231 |
| The chart compares the performance of Class 2 shares for the most recent ten years with the Russell 3000® Growth Index. The chart assumes a hypothetical investment of $10,000 in Class 2 shares and reflects all operating expenses of the Fund but does not reflect fees and expenses charged pursuant to the terms of variable life insurance policies and variable annuity contracts. |
Allspring VT Discovery All Cap Growth Fund | 9
Performance highlights (unaudited)
MANAGER’S DISCUSSION
Fund highlights
•The Fund underperformed its benchmark, the Russell 3000® Growth Index, for the 12-month period that ended December 31, 2023.
•Positioning within the information technology (IT) and communication services sectors detracted from relative performance.
•Stock selection within the consumer discretionary sector and an underweight to energy contributed to the Fund’s results.
Market leadership was concentrated for much of 2023.
The year started with high inflation and financial tightening producing a resounding call for a recession in 2023, yet the year ended on a positive note for most major U.S. equity indexes. Supported by healthy labor markets, declining inflation metrics, and a resilient consumer, earnings results largely exceeded expectations. Most notably, companies connected to artificial intelligence and GLP-1s (glucagon-like peptide-1) garnered significant attention and saw their valuations soar. For much of the year, the “Magnificent 7” stocks substantially outperformed the rest of the U.S. equity universe, boosting returns in large-cap indexes while restrictive policy rates deterred sentiment for small-cap stocks. However, along with favorable economic data, a dovish shift in tone from the Federal Reserve fueled a market rally late in the year. After trailing the Magnificent 7 for most of the year, market leadership broadened out in the fourth quarter and a soft landing became the consensus outlook for 2024.
Ten largest holdings (%) as of December 31, 20231 |
| |
| |
| |
| |
| |
| |
| |
| |
| |
Chipotle Mexican Grill, Inc. | |
| Figures represent the percentage of the Fund’s net assets. Holdings are subject to change and may have changed since the date specified. |
Stock selection within the IT and communication services sectors detracted from returns.
Within communication services, ZoomInfo Technologies, Inc., hosts a global database that connects sales and marketing professionals with prospective clients. During the year, layoffs within the tech industry and pauses within corporate discretionary spending decreased demand for ZoomInfo. When sales did not reaccelerate as recession fears receded, our sell discipline was triggered and we exited the position.
BILL Holdings, Inc., in IT provides cloud-based software that enables small and medium-size businesses to digitize back-office functions. In return, BILL receives subscription fees and a portion of each transaction processed on its platform. Macro headwinds resulted in many of BILL’s customers reducing advertising and discretionary spending, which adversely affected BILL’s transactional revenue. We still hold the position but we are closely monitoring fundamentals.
Allocation within the consumer discretionary sector along with a select IT holding contributed to relative performance.
While the Fund’s overall exposure to the IT sector detracted from returns, several IT companies meaningfully outperformed the overall market during the year. CrowdStrike Holdings, Inc., is a next-generation, end-point security system that continuously monitors for malicious software code. The company exceeded expectations on several key financial metrics and unveiled plans for new product launches in 2024. With most global enterprises still relying on archaic infrastructures, CrowdStrike’s addressable market remains massively underpenetrated, providing a long runway for growth.
In consumer discretionary, MercadoLibre, Inc., a leading e-commerce and payments platform in Latin America, launched services to boost user engagement and advertising revenue. Improving profitability and a leading technology platform provide multiple growth opportunities for MercadoLibre. We have held MercadoLibre within our portfolio for several years and continue to believe in its potential to deliver superior future
returns.
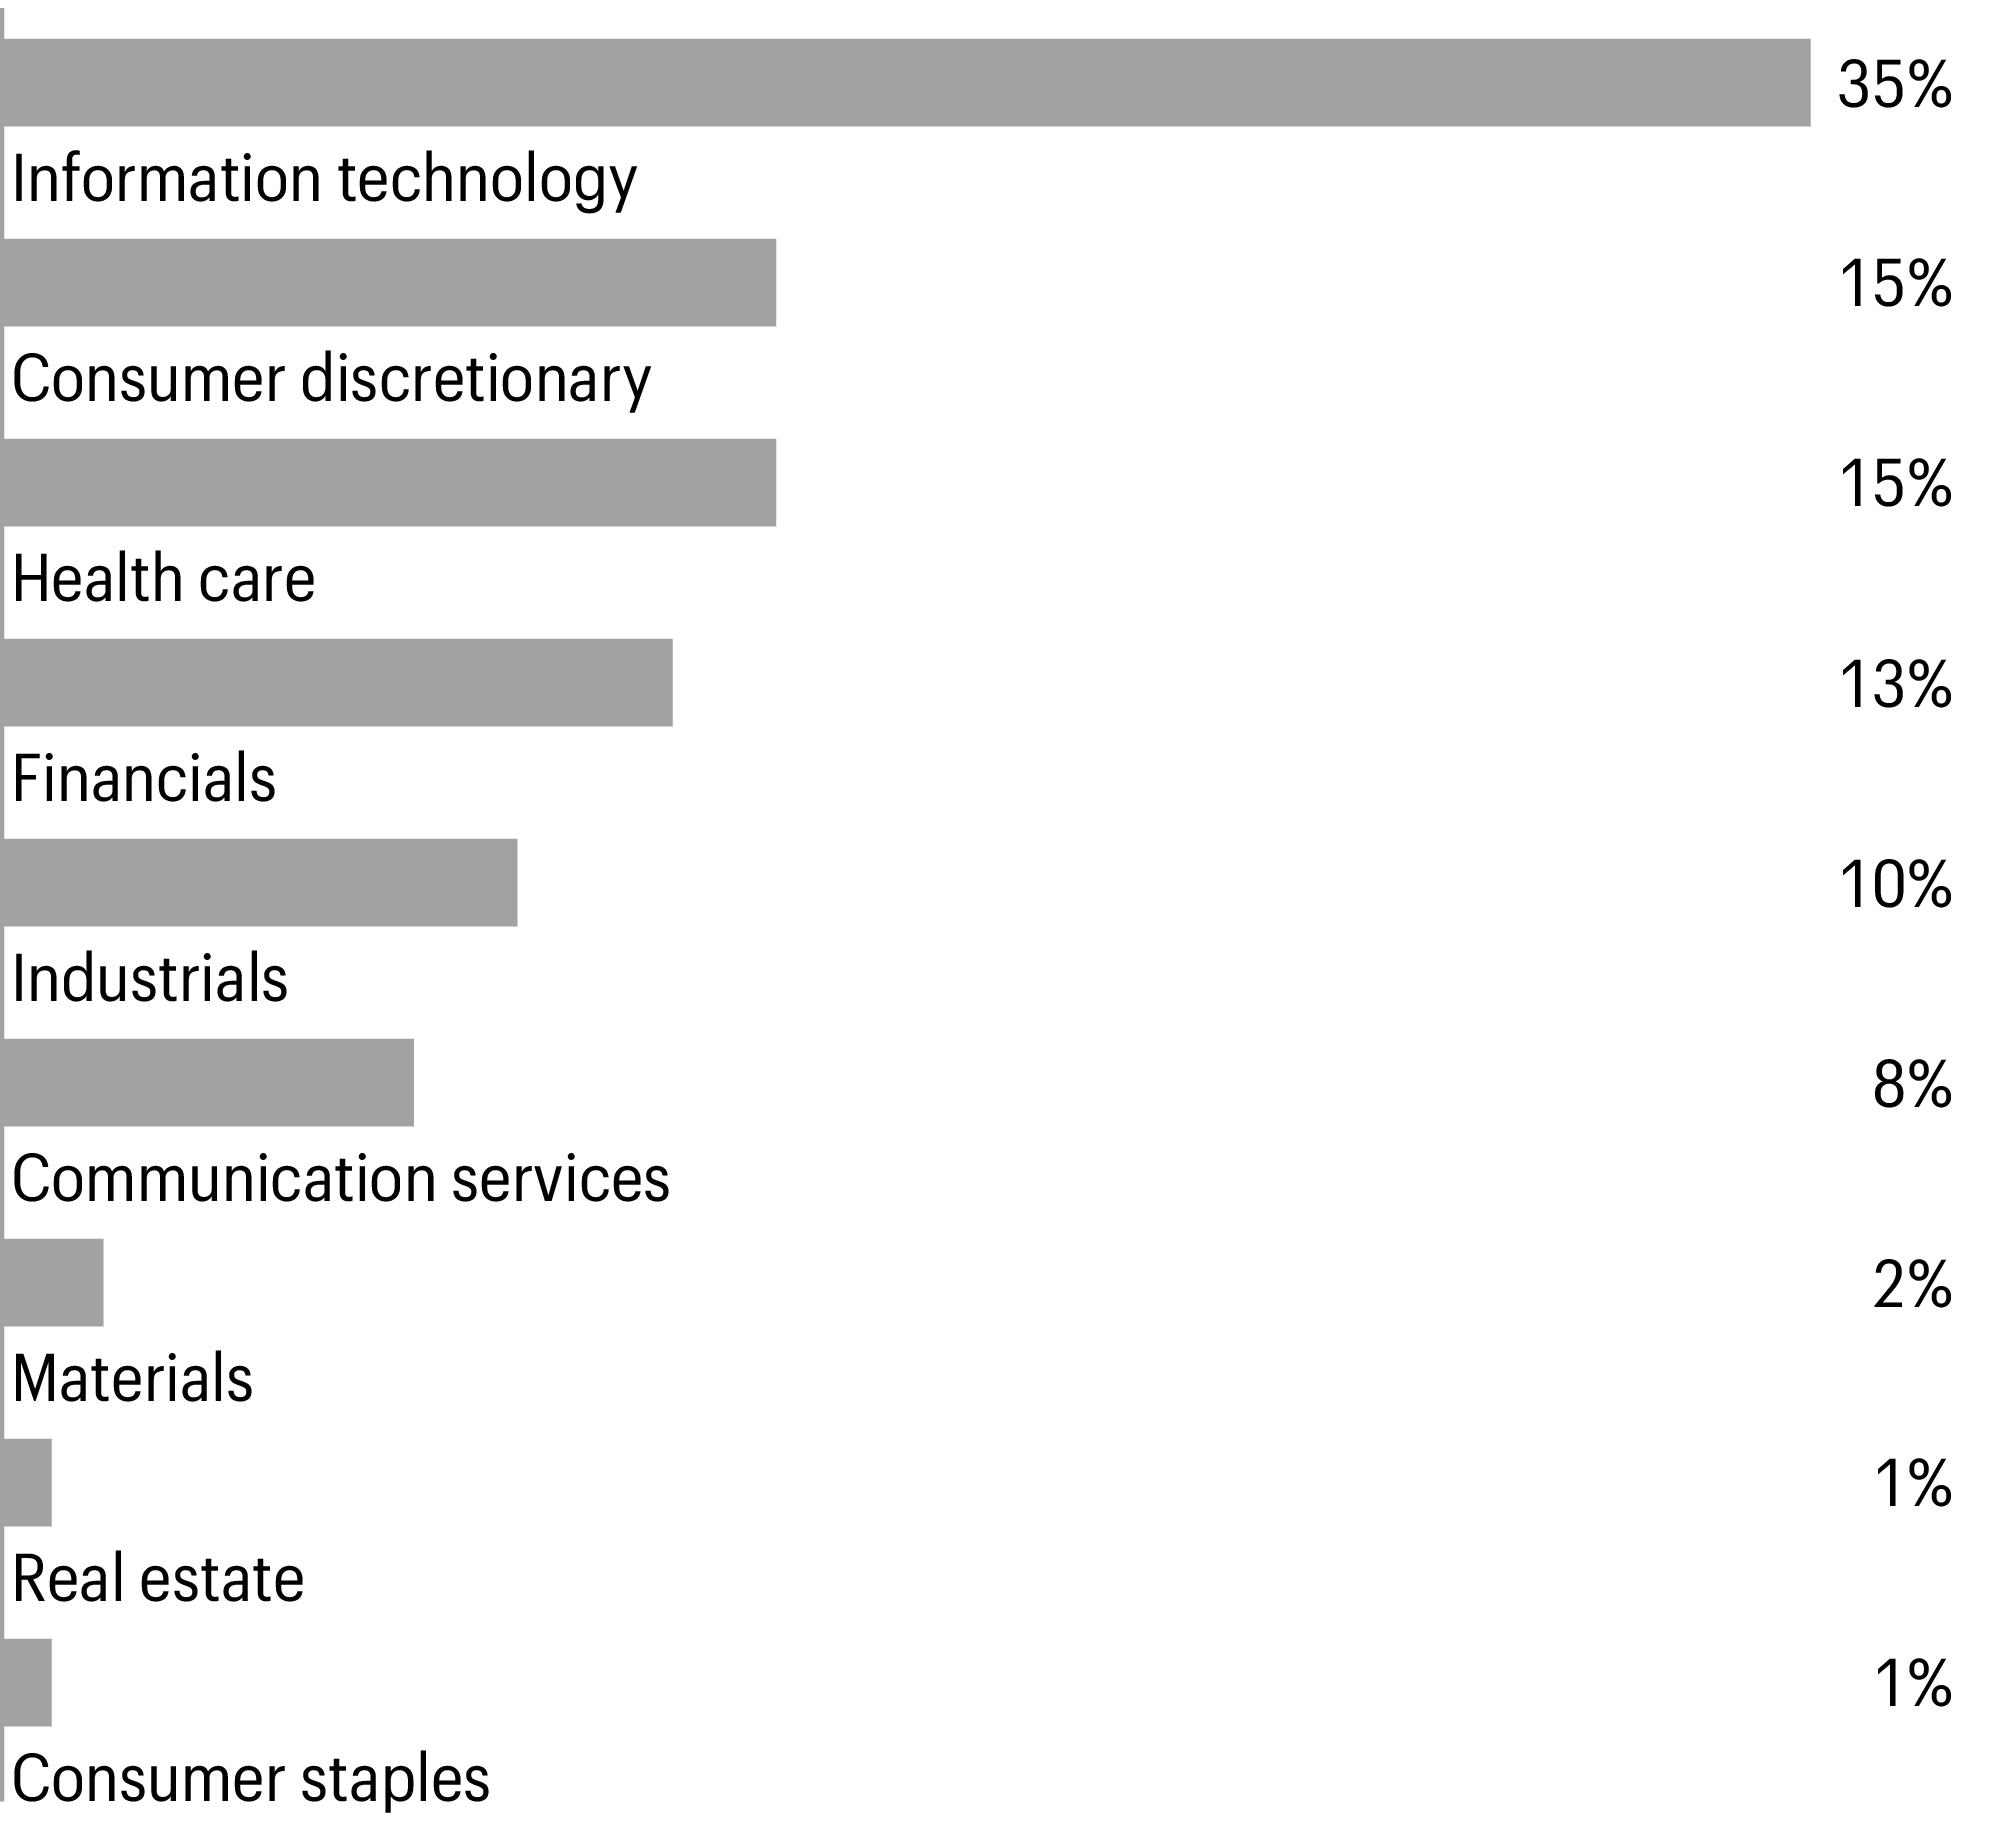
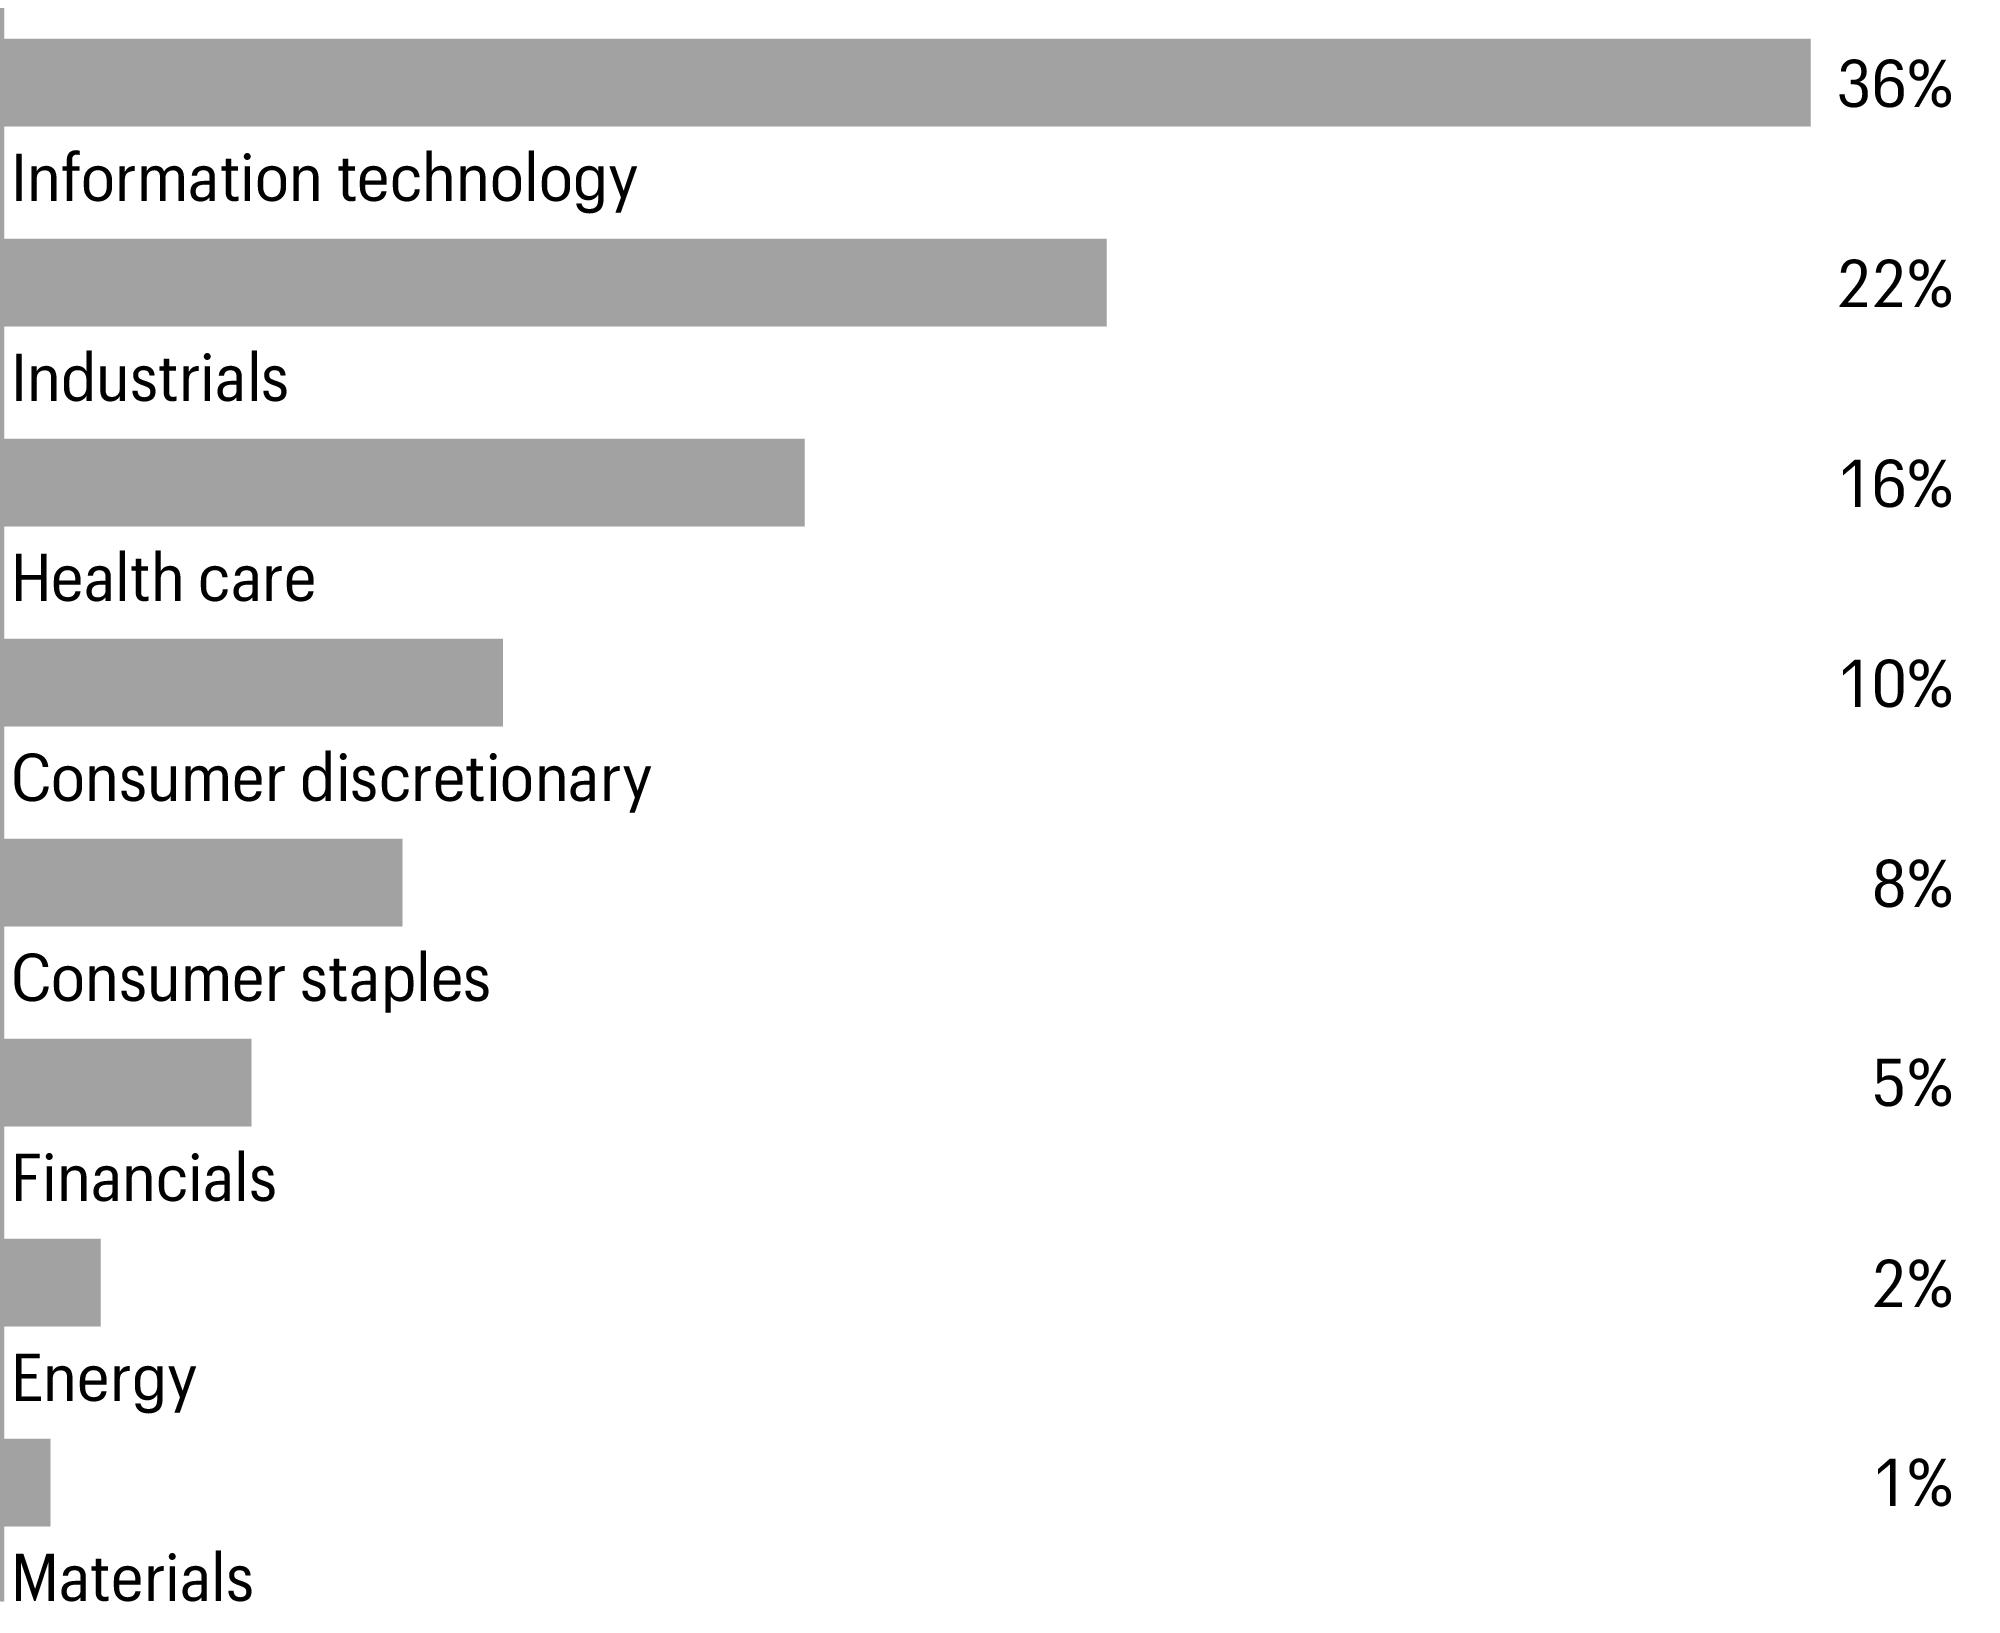
Sector allocation as of December 31, 20231 |
| Figures represent the percentage of the Fund’s long-term investments. Allocations are subject to change and may have changed since the date specified. |
10 | Allspring VT Discovery All Cap Growth Fund
Performance highlights (unaudited)
Staying balanced, with a skew toward quality
The recent year was positive for equities, with most major U.S.-based equity indexes producing healthy gains. While the rally in December created optimism going into 2024, we believe investors should guard against extrapolating near-term signals. Consensus expectations are now for double-digit earnings growth for S&P 500 companies in the next year. Given lingering inflation uncertainties and the delayed impact of higher rates, we are concerned that this could be an optimistic bar for the market to clear. With elevated valuations and expectations, the markets may experience a negative surprise. Our strategy for navigating this environment is to be balanced and highly selective. We are placing a
priority on companies with profitable business models, free cash flow generation, and strong management execution.
We think there are exciting opportunities in small- and mid-cap growth stocks, which still trade at compelling relative valuations to large caps. Should the economy avoid a sharp downturn, there is considerable upside in smaller companies on the other side of a recovery. Most importantly, after a long period of hyperfocus on monetary policy, we are encouraged to see investors become more discerning toward company fundamentals. When it comes to compounding wealth, investors are realizing that profits may matter more than interest rates. This is an encouraging trend that we expect to continue.
Allspring VT Discovery All Cap Growth Fund | 11
Fund expenses (unaudited)
Fund expenses
As a shareholder of the Fund, you incur ongoing costs, including management fees, distribution (12b-1) fees and other Fund expenses. This example is intended to help you understand your ongoing costs (in dollars) of investing in the Fund and to compare these costs with the ongoing costs of investing in other mutual funds.
The example is based on an investment of $1,000 invested at the beginning of the six-month period and held for the entire period from July 1, 2023 to December 31, 2023.
Actual expenses
The “Actual” line of the table below provides information about actual account values and actual expenses. You may use the information in this line, together with the amount you invested, to estimate the expenses that you paid over the period. Simply divide your account value by $1,000 (for example, an $8,600 account value divided by $1,000= 8.6), then multiply the result by the number in the “Actual” line under the heading entitled “Expenses paid during period” for your applicable class of shares to estimate the expenses you paid on your account during this period.
Hypothetical example for comparison purposes
The “Hypothetical” line of the table below provides information about hypothetical account values and hypothetical expenses based on the Fund’s actual expense ratio and an assumed rate of return of 5% per year before expenses, which is not the Fund’s actual return. The hypothetical account values and expenses may not be used to estimate the actual ending account balance or expenses you paid for the period. You may use this information to compare the ongoing costs of investing in the Fund and other funds. To do so, compare this 5% hypothetical example with the 5% hypothetical examples that appear in the shareholder reports of the other funds.
Please note that the expenses shown in the table are meant to highlight your ongoing costs only and do not reflect any separate account charges assessed by participating insurance companies. Therefore, the “Hypothetical” line of the table is useful in comparing ongoing costs only, and will not help you determine the relative total costs of owning different funds. In addition, if these separate account charges assessed by participating insurance companies were included, your costs would have been higher.
| Beginning
account value
7-1-2023 | Ending
account value
12-31-2023 | | Annualized net
expense ratio |
| | | | |
| | | | |
Hypothetical (5% return before expenses) | | | | |
| | | | |
| | | | |
Hypothetical (5% return before expenses) | | | | |
| Expenses paid is equal to the annualized net expense ratio of each class multiplied by the average account value over the period, multiplied by 183 divided by 365 (to reflect the one-half-year period). |
12 | Allspring VT Discovery All Cap Growth Fund
Portfolio of investments—December 31, 2023
| | | | | |
| | | | | | |
Communication services: 7.81% | | | | | | |
| | | | | | |
| | | | | | |
Interactive media & services: 6.55% | | | | | | |
| | | | | | |
Consumer discretionary: 15.32% | | | | | | |
| | | | | | |
| | | | | | |
| | | | | | |
| | | | | | |
| | | | | | |
| | | | | | |
Hotels, restaurants & leisure: 2.01% | | | | | | |
Chipotle Mexican Grill, Inc.† | | | | | | |
| | | | | | |
| | | | | | |
Textiles, apparel & luxury goods: 1.53% | | | | | | |
lululemon athletica, Inc.† | | | | | | |
| | | | | | |
| | | | | | |
| | | | | | |
| | | | | | |
| | | | | | |
Intercontinental Exchange, Inc. | | | | | | |
Tradeweb Markets, Inc. Class A | | | | | | |
| | | | | | |
Financial services: 7.53% | | | | | | |
| | | | | | |
| | | | | | |
| | | | | | |
| | | | | | |
| | | | | | |
| | | | | | |
| | | | | | |
| | | | | | |
| | | | | | |
Health care equipment & supplies: 4.50% | | | | | | |
| | | | | | |
The accompanying notes are an integral part of these financial statements.
Allspring VT Discovery All Cap Growth Fund | 13
Portfolio of investments—December 31, 2023
| | | | | |
Health care equipment & supplies(continued) | | | | | | |
| | | | | | |
Intuitive Surgical, Inc.† | | | | | | |
| | | | | | |
Health care providers & services: 3.29% | | | | | | |
| | | | | | |
Health care technology: 1.34% | | | | | | |
Veeva Systems, Inc. Class A† | | | | | | |
Life sciences tools & services: 2.57% | | | | | | |
| | | | | | |
| | | | | | |
| | | | | | |
| | | | | | |
| | | | | | |
| | | | | | |
Commercial services & supplies: 3.49% | | | | | | |
| | | | | | |
| | | | | | |
| | | | | | |
Electrical equipment: 0.94% | | | | | | |
| | | | | | |
Ground transportation: 1.44% | | | | | | |
Old Dominion Freight Line, Inc. | | | | | | |
Industrial conglomerates: 1.54% | | | | | | |
| | | | | | |
| | | | | | |
| | | | | | |
Professional services: 1.08% | | | | | | |
| | | | | | |
Information technology: 34.52% | | | | | | |
Communications equipment: 2.00% | | | | | | |
| | | | | | |
Electronic equipment, instruments & components: 2.41% | | | | | | |
Teledyne Technologies, Inc.† | | | | | | |
Zebra Technologies Corp. Class A† | | | | | | |
| | | | | | |
| | | | | | |
| | | | | | |
The accompanying notes are an integral part of these financial statements.
14 | Allspring VT Discovery All Cap Growth Fund
Portfolio of investments—December 31, 2023
| | | | | |
| | | | | | |
| | | | | | |
| | | | | | |
| | | | | | |
Semiconductors & semiconductor equipment: 4.42% | | | | | | |
Advanced Micro Devices, Inc.† | | | | | | |
| | | | | | |
Monolithic Power Systems, Inc. | | | | | | |
| | | | | | |
| | | | | | |
| | | | | | |
Cadence Design Systems, Inc.† | | | | | | |
Crowdstrike Holdings, Inc. Class A† | | | | | | |
| | | | | | |
| | | | | | |
| | | | | | |
| | | | | | |
| | | | | | |
| | | | | | |
| | | | | | |
| | | | | | |
| | | | | | |
| | | | | | |
Specialized REITs : 1.15% | | | | | | |
| | | | | | |
Total common stocks (Cost $35,526,315) | | | | | | |
| | | | | |
Short-term investments: 0.44% | | | | | | |
Investment companies: 0.44% | | | | | | |
Allspring Government Money Market Fund Select Class♠∞ | | | | | | |
Total short-term investments (Cost $311,643) | | | | | | |
Total investments in securities (Cost $35,837,958) | | | | | | |
Other assets and liabilities, net | | | | | | |
| | | | | | |
| Non-income-earning security |
| The issuer of the security is an affiliated person of the Fund as defined in the Investment Company Act of 1940. |
| The rate represents the 7-day annualized yield at period end. |
|
| American depositary receipt |
| Real estate investment trust |
The accompanying notes are an integral part of these financial statements.
Allspring VT Discovery All Cap Growth Fund | 15
Portfolio of investments—December 31, 2023
Investments in affiliates
An affiliated investment is an investment in which the Fund owns at least 5% of the outstanding voting shares of the issuer or as a result of other relationships, such as the Fund and the issuer having the same investment manager. Transactions with issuers that were affiliates of the Fund at the end of the period were as follows:
| | | | | Net
change in
unrealized
gains
(losses) | | | Income
from
affiliated
securities |
| | | | | | | | |
Allspring Government Money Market Fund Select Class | | | | | | | | |
The accompanying notes are an integral part of these financial statements.
16 | Allspring VT Discovery All Cap Growth Fund
Statement of assets and liabilities—December 31, 2023
Financial statements
Statement of assets and liabilities
| |
Investments in unaffiliated securities, at value (cost $35,526,315) | |
Investments in affiliated securities, at value (cost $311,643) | |
Receivable for investments sold | |
| |
Receivable for Fund shares sold | |
Prepaid expenses and other assets | |
| |
| |
Payable for investments purchased | |
Payable for Fund shares redeemed | |
| |
| |
Administration fees payable | |
Trustees’ fees and expenses payable | |
Accrued expenses and other liabilities | |
| |
| |
| |
| |
Total distributable earnings | |
| |
Computation of net asset value per share | |
| |
Shares outstanding–Class 11 | |
Net asset value per share–Class 1 | |
| |
Shares outstanding–Class 21 | |
Net asset value per share–Class 2 | |
1 The Fund has an unlimited number of authorized shares.
The accompanying notes are an integral part of these financial statements.
Allspring VT Discovery All Cap Growth Fund | 17
Statement of operations—year ended December 31, 2023
Statement of operations
| |
Dividends (net of foreign withholdings taxes of $3,416) | |
Income from affiliated securities | |
| |
| |
| |
| |
| |
| |
| |
| |
| |
Custody and accounting fees | |
| |
Shareholder report expenses | |
Trustees’ fees and expenses | |
| |
| |
Less: Fee waivers and/or expense reimbursements | |
| |
| |
| |
Realized and unrealized gains (losses) on investments | |
Net realized gains on investments | |
Net change in unrealized gains (losses) on investments | |
Net realized and unrealized gains (losses) on investments | |
Net increase in net assets resulting from operations | |
The accompanying notes are an integral part of these financial statements.
18 | Allspring VT Discovery All Cap Growth Fund
Statement of changes in net assets
Statement of changes in net assets
| Year ended December 31, 2023 | Year ended December 31, 2022 |
| | | | |
| | | | |
Net realized gains on investments | | | | |
Net change in unrealized gains (losses) on investments | | | | |
Net increase (decrease) in net assets resulting from operations | | | | |
Distributions to shareholders from | | | | |
Net investment income and net realized gains | | | | |
| | | | |
| | | | |
Total distributions to shareholders | | | | |
Capital share transactions | | | | |
Proceeds from shares sold | | | | |
| | | | |
| | | | |
| | | | |
Reinvestment of distributions | | | | |
| | | | |
| | | | |
| | | | |
Payment for shares redeemed | | | | |
| | | | |
| | | | |
| | | | |
Net increase (decrease) in net assets resulting from capital share transactions | | | | |
Total increase (decrease) in net assets | | | | |
| | | | |
| | | | |
| | | | |
The accompanying notes are an integral part of these financial statements.
Allspring VT Discovery All Cap Growth Fund | 19
Financial highlights
(For a share outstanding throughout each period)
| |
| | | | | |
Net asset value, beginning of period | | | | | |
| | | | | |
Net realized and unrealized gains (losses) on investments | | | | | |
Total from investment operations | | | | | |
Distributions to shareholders from | | | | | |
| | | | | |
Net asset value, end of period | | | | | |
| | | | | |
Ratios to average net assets (annualized) | | | | | |
| | | | | |
| | | | | |
| | | | | |
| | | | | |
| | | | | |
Net assets, end of period (000s omitted) | | | | | |
| Calculated based upon average shares outstanding |
| Returns do not reflect fees and expenses charged pursuant to the terms of variable life insurance policies and variable annuity contracts. |
The accompanying notes are an integral part of these financial statements.
20 | Allspring VT Discovery All Cap Growth Fund
(For a share outstanding throughout each period)
| |
| | | | | |
Net asset value, beginning of period | | | | | |
| | | | | |
Net realized and unrealized gains (losses) on investments | | | | | |
Total from investment operations | | | | | |
Distributions to shareholders from | | | | | |
| | | | | |
Net asset value, end of period | | | | | |
| | | | | |
Ratios to average net assets (annualized) | | | | | |
| | | | | |
| | | | | |
| | | | | |
| | | | | |
| | | | | |
Net assets, end of period (000s omitted) | | | | | |
| Calculated based upon average shares outstanding |
| Returns do not reflect fees and expenses charged pursuant to the terms of variable life insurance policies and variable annuity contracts. |
The accompanying notes are an integral part of these financial statements.
Allspring VT Discovery All Cap Growth Fund | 21
Notes to financial statements
Notes to financial statements
Allspring Variable Trust (the “Trust”), a Delaware statutory trust organized on March 10, 1999, is an open-end management investment company registered under the Investment Company Act of 1940, as amended (the “1940 Act”). As an investment company, the Trust follows the accounting and reporting guidance in Financial Accounting Standards Board (“FASB”) Accounting Standards Codification Topic 946, Financial Services – Investment Companies. These financial statements report on the Allspring VT Discovery All Cap Growth Fund (formerly, Allspring VT Omega Growth Fund) (the “Fund”) which is a diversified series of the Trust. The Trust offers shares of the Fund to separate accounts of various life insurance companies as funding vehicles for certain variable annuity contracts and variable life insurance policies.
2.
SIGNIFICANT ACCOUNTING POLICIES
The following significant accounting policies, which are consistently followed in the preparation of the financial statements of the Fund, are in conformity with U.S. generally accepted accounting principles which require management to make estimates and assumptions that affect the reported amounts of assets and liabilities, disclosure of contingent assets and liabilities at the date of the financial statements, and the reported amounts of income and expenses during the reporting period. Actual results could differ from those estimates.
Securities valuation
All investments are valued each business day as of the close of regular trading on the New York Stock Exchange (generally 4 p.m. Eastern Time), although the Fund may deviate from this calculation time under unusual or unexpected circumstances.
Equity securities and exchange-traded funds that are listed on a foreign or domestic exchange or market are valued at the official closing price or, if none, the last sales price.
Investments in registered open-end investment companies (other than those listed on a foreign or domestic exchange or market) are valued at net asset value.
Investments which are not valued using the methods discussed above are valued at their fair value, as determined in good faith by Allspring Funds Management, LLC (“Allspring Funds Management”), which was named the valuation designee by the Board of Trustees. As the valuation designee, Allspring Funds Management is responsible for day-to-day valuation activities for the Allspring Funds. In connection with these responsibilities, Allspring Funds Management has established a Valuation Committee and has delegated to it the authority to take any actions regarding the valuation of portfolio securities that the Valuation Committee deems necessary or appropriate, including determining the fair value of portfolio securities. On a quarterly basis, the Board of Trustees receives reports of valuation actions taken by the Valuation Committee. On at least an annual basis, the Board of Trustees receives an assessment of the adequacy and effectiveness of Allspring Funds Management’s process for determining the fair value of the portfolio of investments.
Security transactions and income recognition
Securities transactions are recorded on a trade date basis. Realized gains or losses are recorded on the basis of identified cost.
Dividend income is recognized on the ex-dividend date. Dividend income is recorded net of foreign taxes withheld where recovery of such taxes is not assured.
Interest earned on cash balances held at the custodian is recorded as interest income.
Distributions received from REIT investments may be characterized as ordinary income, capital gains, or a return of capital to the Fund based on information provided by the REIT. The proper characterization of REIT distributions is generally not known until after the end of each calendar year. As such, estimates may be used in reporting the character of income and distributions for financial statement purposes.
Distributions to shareholders
Distributions to shareholders from net investment income and any net realized gains are recorded on the ex-dividend date and paid at least annually. Such distributions are determined in accordance with income tax regulations and may differ from U.S. generally accepted accounting principles. Dividend sources are estimated at the time of declaration. The tax character of distributions is determined as of the Fund’s fiscal year end. Therefore, a portion of the Fund’s distributions made prior to the Fund’s fiscal year end may be categorized as a tax return of capital at year end.
Federal and other taxes
The Fund intends to continue to qualify as a regulated investment company by distributing substantially all of its investment company taxable income and any net realized capital gains (after reduction for capital loss carryforwards) sufficient to relieve it from all, or substantially all, federal income taxes. Accordingly, no provision for federal income taxes was required.
The Fund’s income and federal excise tax returns and all financial records supporting those returns for the prior three fiscal years are subject to examination by the federal and Delaware revenue authorities. Management has analyzed the Fund’s tax positions taken on federal, state, and foreign tax returns, as applicable, for all open tax years and does not believe that there are any uncertain tax positions that require recognition of a tax liability.
22 | Allspring VT Discovery All Cap Growth Fund
Notes to financial statements
As of December 31, 2023, the aggregate cost of all investments for federal income tax purposes was $35,923,646 and the unrealized gains (losses) consisted of:
Reclassifications are made to the Fund’s capital accounts for permanent tax differences to reflect income and gains available for distribution (or available capital loss carryforwards) under federal income tax regulations. U.S. generally accepted accounting principles require that certain components of net assets be adjusted to reflect permanent differences between financial and tax reporting. These reclassifications have no effect on net assets or net asset values per share. The primary permanent difference causing such reclassification is due to net operating loss. At December 31, 2023, as a result of permanent book-to-tax differences, the following reclassification adjustments were made on the Statement of Assets and Liabilities:
| Total distributable
earnings |
| |
Class allocations
The separate classes of shares offered by the Fund differ principally in distribution fees. Class specific expenses are charged directly to that share class. Investment income, common fund-level expenses, and realized and unrealized gains (losses) on investments are allocated daily to each class of shares based on the relative proportion of net assets of each class.
3.
FAIR VALUATION MEASUREMENTS
Fair value measurements of investments are determined within a framework that has established a fair value hierarchy based upon the various data inputs utilized in determining the value of the Fund’s investments. The three-level hierarchy gives the highest priority to unadjusted quoted prices in active markets for identical assets or liabilities (Level 1) and the lowest priority to unobservable inputs (Level 3). The Fund’s investments are classified within the fair value hierarchy based on the lowest level of input that is significant to the fair value measurement. The inputs are summarized into three broad levels as follows:
•Level 1—quoted prices in active markets for identical securities
•Level 2—other significant observable inputs (including quoted prices for similar securities, interest rates, prepayment speeds, credit risk, etc.)
•Level 3—significant unobservable inputs (including the Fund’s own assumptions in determining the fair value of investments)
The inputs or methodologies used for valuing investments in securities are not necessarily an indication of the risk associated with investing in those securities.
The following is a summary of the inputs used in valuing the Fund’s assets and liabilities as of December 31, 2023:
| | Other significant
observable inputs
(Level 2) | Significant
unobservable inputs
(Level 3) | |
| | | | |
| | | | |
| | | | |
| | | | |
| | | | |
| | | | |
| | | | |
| | | | |
| | | | |
| | | | |
| | | | |
| | | | |
| | | | |
| | | | |
| | | | |
Additional sector, industry or geographic detail, if any, is included in the Portfolio of Investments.
Allspring VT Discovery All Cap Growth Fund | 23
Notes to financial statements
At December 31, 2023, the Fund did not have any transfers into/out of Level 3.
4.
TRANSACTIONS WITH AFFILIATES
Management fee
Allspring Funds Management, a wholly owned subsidiary of Allspring Global Investments Holdings, LLC, a holding company indirectly owned by certain private funds of GTCR LLC and Reverence Capital Partners, L.P., is the manager of the Fund and provides advisory and fund-level administrative services under an investment management agreement. Under the investment management agreement, Allspring Funds Management is responsible for, among other services, implementing the investment objectives and strategies of the Fund, supervising the subadviser and providing fund-level administrative services in connection with the Fund’s operations. As compensation for its services under the investment management agreement, Allspring Funds Management is entitled to receive a management fee at the following annual rate based on the Fund’s average daily net assets:
For the year ended December 31, 2023, the management fee was equivalent to an annual rate of 0.60% of the Fund’s average daily net assets.
Allspring Funds Management has retained the services of a subadviser to provide daily portfolio management to the Fund. The fee for subadvisory services is borne by Allspring Funds Management. Allspring Global Investments, LLC, an affiliate of Allspring Funds Management and a wholly owned subsidiary of Allspring Global Investments Holdings, LLC, is the subadviser to the Fund and is entitled to receive a fee from Allspring Funds Management at an annual rate starting at 0.45% and declining to 0.30% as the average daily net assets of the Fund increase.
Administration fees
Under a class-level administration agreement, Allspring Funds Management provides class-level administrative services to the Fund, which includes paying fees and expenses for services provided by the transfer agent, sub-transfer agents, omnibus account servicers and record-keepers. As compensation for its services under the class-level administration agreement, Allspring Funds Management receives an annual fee of 0.08% which is calculated based on the average daily net assets of each class.
Waivers and/or expense reimbursements
Allspring Funds Management has contractually committed to waive and/or reimburse management and administration fees to the extent necessary to maintain certain net operating expense ratios for the Fund. When each class of the Fund has exceeded its expense cap, Allspring Funds Management will waive fees and/or reimburse expenses from fund-level expenses on a proportionate basis and then from class specific expenses. When only certain classes exceed their expense caps, waivers and/or reimbursements are applied against class specific expenses before fund-level expenses. Allspring Funds Management has contractually committed through April 30, 2024 to waive fees and/or reimburse expenses to the extent necessary to cap the Fund’s expenses. Prior to or after the commitment expiration date, the cap may be increased or the commitment to maintain the cap may be terminated only with the approval of the Board of Trustees. As of December 31, 2023, the contractual expense caps are as follows:
Distribution fee
The Trust has adopted a distribution plan for Class 2 shares pursuant to Rule 12b-1 under the 1940 Act. A distribution fee is charged to Class 2 shares and paid to Allspring Funds Distributor, LLC, the principal underwriter, an affiliate of Allspring Funds Management, at an annual rate up to 0.25% of the average daily net assets of Class 2 shares.
Interfund transactions
The Fund may purchase or sell portfolio investment securities to certain affiliates pursuant to Rule 17a-7 under the 1940 Act and under procedures adopted by the Board of Trustees. The procedures have been designed to ensure that these interfund transactions, which do not incur broker commissions, are effected at current market prices. Pursuant to these procedures, the Fund did not have any interfund transactions during the year ended December 31, 2023.
24 | Allspring VT Discovery All Cap Growth Fund
Notes to financial statements
5.
INVESTMENT PORTFOLIO TRANSACTIONS
Purchases and sales of investments, excluding U.S. government obligations (if any) and short-term securities, for the year ended December 31, 2023 were $19,099,246 and $26,225,969, respectively.
The Trust, Allspring Master Trust and Allspring Funds Trust (excluding the money market funds) are parties to a $350,000,000 revolving credit agreement whereby the Fund is permitted to use bank borrowings for temporary or emergency purposes, such as to fund shareholder redemption requests. Interest under the credit agreement is charged to the Fund based on borrowing rate equal to the higher of the Federal Funds rate or the overnight bank funding rate in effect on that day plus a spread. In addition, an annual commitment fee based on the unused balance is allocated to each participating fund.
For the year ended December 31, 2023, there were no borrowings by the Fund under the agreement.
7.
DISTRIBUTIONS TO SHAREHOLDERS
The tax character of distributions paid was $6,707,121 and $16,420,814 of long-term capital gain for the years ended December 31, 2023 and December 31, 2022, respectively.
As of December 31, 2023, the components of distributable earnings on a tax basis were as follows:
Undistributed
long-term
gain | |
| |
As of the end of the period, the Fund concentrated its portfolio of investments in the information technology sector. A fund that invests a substantial portion of its assets in any sector may be more affected by changes in that sector than would be a fund whose investments are not heavily weighted in any sector.
Under the Fund’s organizational documents, the officers and Trustees have been granted certain indemnification rights against certain liabilities that may arise out of performance of their duties to the Fund. The Fund has entered into a separate agreement with each Trustee that converts indemnification rights currently existing under the Fund’s organizational documents into contractual rights that cannot be changed in the future without the consent of the Trustee. Additionally, in the normal course of business, the Fund may enter into contracts with service providers that contain a variety of indemnification clauses. The Fund’s maximum exposure under these arrangements is dependent on future claims that may be made against the Fund and, therefore, cannot be estimated.
Allspring VT Discovery All Cap Growth Fund | 25
Report of independent registered public accounting firm
To the Shareholders of the Fund and Board of Trustees
Allspring Variable Trust:
Opinion on the Financial Statements
We have audited the accompanying statement of assets and liabilities of Allspring VT Discovery All Cap Growth Fund (formerly, Allspring VT Omega Growth Fund) (the Fund), one of the funds constituting Allspring Variable Trust, including the portfolio of investments, as of December 31, 2023, the related statement of operations for the year then ended, the statements of changes in net assets for each of the years in the two-year period then ended, and the related notes (collectively, the financial statements) and the financial highlights for each of the years in the five-year period then ended. In our opinion, the financial statements and financial highlights present fairly, in all material respects, the financial position of the Fund as of December 31, 2023, the results of its operations for the year then ended, the changes in its net assets for each of the years in the two-year period then ended, and the financial highlights for each of the years in the five-year period then ended, in conformity with U.S. generally accepted accounting principles.
Basis for Opinion
These financial statements and financial highlights are the responsibility of the Fund’s management. Our responsibility is to express an opinion on these financial statements and financial highlights based on our audits. We are a public accounting firm registered with the Public Company Accounting Oversight Board (United States) (PCAOB) and are required to be independent with respect to the Fund in accordance with the U.S. federal securities laws and the applicable rules and regulations of the Securities and Exchange Commission and the PCAOB.
We conducted our audits in accordance with the standards of the PCAOB. Those standards require that we plan and perform the audit to obtain reasonable assurance about whether the financial statements and financial highlights are free of material misstatement, whether due to error or fraud. Our audits included performing procedures to assess the risks of material misstatement of the financial statements and financial highlights, whether due to error or fraud, and performing procedures that respond to those risks. Such procedures included examining, on a test basis, evidence regarding the amounts and disclosures in the financial statements and financial highlights. Such procedures also included confirmation of securities owned as of December 31, 2023, by correspondence with the custodian, transfer agent and brokers, or by other appropriate auditing procedures. Our audits also included evaluating the accounting principles used and significant estimates made by management, as well as evaluating the overall presentation of the financial statements and financial highlights. We believe that our audits provide a reasonable basis for our opinion.

We have not been able to determine the specific year that we began serving as the auditor of one or more Allspring Funds investment companies; however, we are aware that we have served as the auditor of one or more Allspring Funds investment companies since at least 1955.
Boston, Massachusetts
February 26, 2024
26 | Allspring VT Discovery All Cap Growth Fund
Other information (unaudited)
Other information
Tax information
Pursuant to Section 852 of the Internal Revenue Code, $6,707,121 was designated as a 20% rate gain distribution for the fiscal year ended
December 31, 2023.
Proxy voting information
A description of the policies and procedures used to determine how to vote proxies relating to portfolio securities is available without charge, upon request, by calling 1-866-259-3305, visiting our website at allspringglobal.com, or visiting the SEC website at sec.gov. Information regarding how the proxies related to portfolio securities were voted during the most recent 12-month period ended June 30 is available on the website at allspringglobal.com or by visiting the SEC website at sec.gov.
Quarterly portfolio holdings information
The Fund files its complete schedule of portfolio holdings with the SEC for the first and third quarters of each fiscal year as an exhibit to its reports on Form N-PORT. Shareholders may view the filed Form N-PORT by visiting the SEC website at sec.gov.
Allspring VT Discovery All Cap Growth Fund | 27
Other information (unaudited)
BOARD OF TRUSTEES AND OFFICERS
Each of the Trustees and Officers listed in the table below acts in identical capacities for each fund in the Allspring family of funds, which consists of 117 mutual funds comprising the Allspring Funds Trust, Allspring Variable Trust, Allspring Master Trust and four closed-end funds (collectively the “Fund Complex”). This table should be read in conjunction with the Prospectus and the Statement of Additional Information†. The mailing address of each Trustee and Officer is 1415 Vantage Park Drive, 3rd Floor, Charlotte, NC 28203. Each Trustee and Officer serves an indefinite term, however, each Trustee serves such term until reaching the mandatory retirement age established by the Trustees.
Independent Trustees
| | Principal occupations during past five years or longer | Current other
public company or
investment
company
directorships |
William R. Ebsworth
(Born 1957) | | Retired. From 1984 to 2013, equities analyst, portfolio manager, research director and chief investment officer at Fidelity Management and Research Company in Boston, Tokyo, and Hong Kong, and retired in 2013 as Chief Investment Officer of Fidelity Strategic Advisers, Inc. where he led a team of investment professionals managing client assets. Prior thereto, Board member of Hong Kong Securities Clearing Co., Hong Kong Options Clearing Corp., the Thailand International Fund, Ltd., Fidelity Investments Life Insurance Company, and Empire Fidelity Investments Life Insurance Company. Serves on the Investment Company Institute’s Board of Governors since 2022 and Executive Committee since 2023 as well as the Vice Chairman of the Governing Council of the Independent Directors Council since 2023. Audit Committee Chair and Investment Committee Chair of the Vincent Memorial Hospital Foundation (non-profit organization). Mr. Ebsworth is a CFA charterholder. | |
Jane A. Freeman
(Born 1953) | Trustee,
since 2015;
Chair Liaison,
| Retired. From 2012 to 2014 and 1999 to 2008, Chief Financial Officer of Scientific Learning Corporation. From 2008 to 2012, Ms. Freeman provided consulting services related to strategic business projects. Prior to 1999, Portfolio Manager at Rockefeller & Co. and Scudder, Stevens & Clark. Board member of the Harding Loevner Funds from 1996 to 2014, serving as both Lead Independent Director and chair of the Audit Committee. Board member of the Russell Exchange Traded Funds Trust from 2011 to 2012 and the chair of the Audit Committee. Ms. Freeman is also an inactive Chartered Financial Analyst. | |
Isaiah Harris, Jr.
(Born 1952) | Trustee,
since 2009;
Audit Committee Chair,
since 2019 | Retired. Member of the Advisory Board of CEF of East Central Florida. Chairman of the Board of CIGNA Corporation from 2009 to 2021, and Director from 2005 to 2008. From 2003 to 2011, Director of Deluxe Corporation. Prior thereto, President and CEO of BellSouth Advertising and Publishing Corp. from 2005 to 2007, President and CEO of BellSouth Enterprises from 2004 to 2005 and President of BellSouth Consumer Services from 2000 to 2003. Emeritus member of the Iowa State University Foundation Board of Governors. Emeritus Member of the Advisory board of Iowa State University School of Business. Advisory Board Member, Palm Harbor Academy (private school). Advisory Board Member, Fellowship of Christian Athletes. Mr. Harris is a certified public accountant (inactive status). | |
David F. Larcker
(Born 1950) | | Distinguished Visiting Fellow at the Hoover Institution since 2022. James Irvin Miller Professor of Accounting at the Graduate School of Business (Emeritus), Stanford University, Director of the Corporate Governance Research Initiative and Senior Faculty of The Rock Center for Corporate Governance since 2006. From 2005 to 2008, Professor of Accounting at the Graduate School of Business, Stanford University. Prior thereto, Ernst & Young Professor of Accounting at The Wharton School, University of Pennsylvania from 1985 to 2005. | |
Olivia S. Mitchell
(Born 1953) | | International Foundation of Employee Benefit Plans Professor since 1993, Wharton School of the University of Pennsylvania. Director of Wharton’s Pension Research Council and Boettner Center on Pensions & Retirement Research, and Research Associate at the National Bureau of Economic Research. Previously taught at Cornell University from 1978 to 1993. | |
Timothy J. Penny
(Born 1951) | Trustee,
since 1996;
Chair,
since 2018 | President and Chief Executive Officer of Southern Minnesota Initiative Foundation, a non-profit organization, since 2007. Vice Chair of the Economic Club of Minnesota, since 2007. Co-Chair of the Committee for a Responsible Federal Budget, since 1995. Member of the Board of Trustees of NorthStar Education Finance, Inc., a non-profit organization, from 2007-2022. Senior Fellow of the University of Minnesota Humphrey Institute from 1995 to 2017. | |
* Length of service dates reflect the Trustee’s commencement of service with the Trust’s predecessor entities, where applicable.
# Ms. Freeman will serve as Chair Liaison through June 2024, at which time Ms. Wheelock will assume the role.
†
The Statement of Additional Information includes additional information about the Trustees and is available, without charge, upon request, by calling 1-800-260-5969 or by visiting the website at allspringglobal.com.
28 | Allspring VT Discovery All Cap Growth Fund
Other information (unaudited)
| Position held and length of service* | Principal occupations during past five years or longer | Current other public company or investment company directorships |
James G. Polisson
(Born 1959) | Trustee,
since 2018; Nominating and Governance Committee Chair, since 2024 | Retired. Chief Marketing Officer, Source (ETF) UK Services, Ltd, from 2015 to 2017. From 2012 to 2015, Principal of The Polisson Group, LLC, a management consulting, corporate advisory and principal investing company. Chief Executive Officer and Managing Director at Russell Investments, Global Exchange Traded Funds from 2010 to 2012. Managing Director of Barclays Global Investors from 1998 to 2010 and Global Chief Marketing Officer for iShares and Barclays Global Investors from 2000 to 2010. Trustee of the San Francisco Mechanics’ Institute, a non- profit organization, from 2013 to 2015. Board member of the Russell Exchange Traded Fund Trust from 2011 to 2012. Director of Barclays Global Investors Holdings Deutschland GmbH from 2006 to 2009. Mr. Polisson is an attorney and has a retired status with the Massachusetts and District of Columbia Bar Associations. | |
Pamela Wheelock
(Born 1959) | Trustee,
since January 2020;
previously Trustee from
January 2018 to
| Retired. Executive and Senior Financial leadership positions in the public, private and nonprofit sectors. Interim President and CEO, McKnight Foundation, 2020. Interim Commissioner, Minnesota Department of Human Services, 2019. Chief Operating Officer, Twin Cities Habitat for Humanity, 2017-2019. Vice President for University Services, University of Minnesota, 2012- 2016. Interim President and CEO, Blue Cross and Blue Shield of Minnesota, 2011-2012. Executive Vice-President and Chief Financial Officer, Minnesota Wild, 2002-2008. Commissioner, Minnesota Department of Finance, 1999-2002. Chair of the Board of Directors of Destination Medical Center Corporation. Board member of the Minnesota Wild Foundation. | |
* Length of service dates reflect the Trustee’s commencement of service with the Trust’s predecessor entities, where applicable.
# Ms. Freeman will serve as Chair Liaison through June 2024, at which time Ms. Wheelock will assume the role.
Allspring VT Discovery All Cap Growth Fund | 29
Other information (unaudited)
Officers1
| Position held and
length of service | Principal occupations during past five years or longer |
| | President and Chief Executive Officer of Allspring Funds Management, LLC since 2017 and Head of Global Fund Governance of Allspring Global Investments since 2022. Prior thereto, co-president of Galliard Capital Management, LLC, an affiliate of Allspring Funds Management, LLC, from 2019 to 2022 and Head of Affiliated Managers, Allspring Global Investments, from 2014 to 2019 and Executive Vice President responsible for marketing, investments and product development for Allspring Funds Management, LLC, from 2009 to 2014. |
Jeremy DePalma
(Born 1974) | Treasurer,
since 2012
(for certain funds in
the Fund Complex);
since 2021 (for
the remaining funds in the Complex) | Senior Vice President of Allspring Funds Management, LLC since 2009. Senior Vice President of Evergreen Investment Management Company, LLC from 2008 to 2010 and head of the Fund Reporting and Control Team within Fund Administration from 2005 to 2010. |
Christopher Baker
(Born 1976) | Chief Compliance Officer,
since 2022 | Global Chief Compliance Officer for Allspring Global Investments since 2022. Prior thereto, Chief Compliance Officer for State Street Global Advisors from 2018 to 2021. Senior Compliance Officer for the State Street divisions of Alternative Investment Solutions, Sector Solutions, and Global Marketing from 2015 to 2018. From 2010 to 2015 Vice President, Global Head of Investment and Marketing Compliance for State Street Global Advisors. |
Matthew Prasse
(Born 1983) | Chief Legal Officer,
since 2022;
Secretary,
since 2021 | Senior Counsel of the Allspring Legal Department since 2021. Senior Counsel of the Wells Fargo Legal Department from 2018 to 2021. Previously, Counsel for Barings LLC from 2015 to 2018. Prior to joining Barings, Associate at Morgan, Lewis & Bockius LLP from 2008 to 2015. |
1 For those Officers with tenures at Allspring Global Investments and/or Allspring Funds Management, LLC that began prior to 2021, such tenures include years of service during which these businesses/entities were known as Wells Fargo Asset Management and Wells Fargo Funds Management, LLC, respectively.
30 | Allspring VT Discovery All Cap Growth Fund
This page is intentionally left blank.
This page is intentionally left blank.
For more information
More information about Allspring Funds is available free upon request. To obtain literature, please write, visit the Fund’s website, or call:
Allspring Funds
P.O. Box 219967
Kansas City, MO 64121-9967
Website: allspringglobal.com
Individual investors: 1-800-260-5969
Retail investment professionals: 1-888-877-9275
Institutional investment professionals: 1-866-765-0778
This report and the financial statements contained herein are submitted for the general information of the shareholders of the Fund. If this report is used for promotional purposes, distribution of the report must be accompanied or preceded by a current prospectus. Before investing, please consider the investment objectives, risks, charges, and expenses of the investment. For a current prospectus and, if available, a summary prospectus, containing this information, call 1-800-260-5969 or visit the Fund’s website at allspringglobal.com. Read the prospectus carefully before you invest or send money.
Allspring Global InvestmentsTM is the trade name for the asset management firms of Allspring Global Investments Holdings, LLC, a holding company indirectly owned by certain private funds of GTCR LLC and Reverence Capital Partners, L.P. These firms include but are not limited to Allspring Global Investments, LLC, and Allspring Funds Management, LLC. Certain products managed by Allspring entities are distributed by Allspring Funds Distributor, LLC (a broker-dealer and Member FINRA/SIPC).
This material is for general informational and educational purposes only and is NOT intended to provide investment advice or a recommendation of any kind - including a recommendation for any specific investment, strategy, or plan.
© 2024 Allspring Global Investments Holdings, LLC. All rights reserved.
ALL-01052024-ab2bssdw 02-24
AR0578 12-23
Allspring VT
Discovery SMID Cap
Growth Fund
(formerly, Allspring VT Discovery Fund)
Annual Report
December 31, 2023
The views expressed and any forward-looking statements are as of December 31, 2023, unless otherwise noted, and are those of the Fund’s portfolio managers and/or Allspring Global Investments. Discussions of individual securities or the markets generally are not intended as individual recommendations. Future events or results may vary significantly from those expressed in any forward-looking statements. The views expressed are subject to change at any time in response to changing circumstances in the market. Allspring Global Investments disclaims any obligation to publicly update or revise any views expressed or forward-looking statements.
Allspring VT Discovery SMID Cap Growth Fund | 1
Letter to shareholders (unaudited)
Andrew Owen
President
Allspring Funds
Dear Shareholder:
We are pleased to offer you this annual report for the Allspring VT Discovery SMID Cap Growth Fund for the 12-month period that ended December 31, 2023. Effective May 1, 2023, the Fund changed its name from Allspring VT Discovery Fund to Allspring VT Discovery SMID Cap Growth Fund. Globally, stocks and bonds experienced high levels of volatility throughout the period but had positive overall results. The market was focused on persistently high inflation and the impact of ongoing aggressive central bank rate hikes. Compounding these concerns were the global reverberations of the Russia-Ukraine war. Riskier assets rallied in 2023, as investors anticipated an end to the tight monetary policy despite concerns of a possible recession. After suffering deep and broad losses through 2022, bonds now benefit from a base of higher yields that can help generate higher income.
For the 12-month period, stocks generally outperformed bonds—both domestic U.S. and global. For the period, U.S. stocks, based on the S&P 500 Index,1 gained 26.29%. International stocks, as measured by the MSCI ACWI ex USA Index (Net),2 returned 15.62%, while the MSCI EM Index (Net) (USD)3 had more modest performance, with a gain of 9.83%. Among bond indexes, the Bloomberg U.S. Aggregate Bond Index4 returned 5.53%, the Bloomberg Global Aggregate ex-USD Index (unhedged)5 gained 5.72%, the Bloomberg Municipal Bond Index6 returned 6.40%, and the ICE BofA U.S. High Yield Index7 gained 13.54%.
Despite high inflation and central bank rate hikes, markets rallied.
The year 2023 began with a rally across global equities and fixed income securities. Investor optimism rose in response to data indicating declining inflation rates and the reopening of China’s economy with the abrupt end to its zero-COVID-19 policy. The U.S. reported strong job gains and unemployment fell to 3.4%—the lowest level since 1969. Meanwhile, wage growth, seen as a potential contributor to ongoing high inflation, continued to moderate. All eyes remained on the Federal Reserve (Fed) and on how many more rate hikes remain in this tightening cycle. The 0.25% federal funds rate hike announced in January was the Fed’s smallest rate increase since March 2022.
Markets declined in February as investors responded unfavorably to resilient economic data. The takeaway: Central banks would likely continue their monetary tightening cycle for longer than markets had priced in. In this environment—where strong economic data is seen as bad news—the resilient U.S. labor market was taken as a negative, with inflation not falling quickly enough for the Fed, which raised interest rates by 0.25% in February. Meanwhile, the Bank of England (BoE) and the European Central Bank (ECB) both raised rates by 0.50%.
1
The S&P 500 Index consists of 500 stocks chosen for market size, liquidity, and industry group representation. It is a market-value-weighted index with each stock’s weight in the index proportionate to its market value. You cannot invest directly in an index.
2
The Morgan Stanley Capital International (MSCI) All Country World Index (ACWI) ex USA Index (Net) is a free-float-adjusted market-capitalization-weighted index that is designed to measure the equity market performance of developed and emerging markets, excluding the U.S. Source: MSCI. MSCI makes no express or implied warranties or representations and shall have no liability whatsoever with respect to any MSCI data contained herein. The MSCI data may not be further redistributed or used as a basis for other indexes or any securities or financial products. This report is not approved, reviewed, or produced by MSCI. You cannot invest directly in an index.
3
The MSCI Emerging Markets (EM) Index (Net) (USD) is a free-float-adjusted market-capitalization-weighted index that is designed to measure the equity market performance of emerging markets. You cannot invest directly in an index.
4
The Bloomberg U.S. Aggregate Bond Index is a broad-based benchmark that measures the investment-grade, U.S.-dollar-denominated, fixed-rate taxable bond market, including Treasuries, government-related and corporate securities, mortgage-backed securities (agency fixed-rate and hybrid adjustable-rate mortgage pass-throughs), asset-backed securities, and commercial mortgage-backed securities. You cannot invest directly in an index.
5
The Bloomberg Global Aggregate ex-USD Index (unhedged) is an unmanaged index that provides a broad-based measure of the global investment-grade fixed-income markets excluding the U.S.-dollar-denominated debt market. You cannot invest directly in an index.
6
The Bloomberg Municipal Bond Index is an unmanaged index composed of long-term tax-exempt bonds with a minimum credit rating of Baa. You cannot invest directly in an index.
7
The ICE BofA U.S. High Yield Index is a market-capitalization-weighted index of domestic and Yankee high yield bonds. The index tracks the performance of high yield securities traded in the U.S. bond market. You cannot invest directly in an index. Copyright 2024. ICE Data Indices, LLC. All rights reserved.
2 | Allspring VT Discovery SMID Cap Growth Fund
Letter to shareholders (unaudited)
“ The collapse of Silicon Valley Bank in March—the second-largest banking failure in U.S. history—led to a bank run that spread to Europe, where Switzerland’s Credit Suisse was taken over by its rival, UBS. ”
The collapse of Silicon Valley Bank in March—the second-largest banking failure in U.S. history—led to a bank run that spread to Europe, where Switzerland’s Credit Suisse was taken over by its rival, UBS. The banking industry turmoil created an additional challenge for central banks in balancing inflationary concerns against potential economic weakening. Meanwhile, recent data pointed to economic strength in the U.S., Europe, and China. And China’s economy continued to rebound after the removal of its COVID-19 lockdown. Inflation rates in the U.S., the U.K., and the eurozone all remained higher than central bank targets, leading to additional rate hikes in March.
Economic data released in April pointed to global resilience, as Purchasing Managers Indexes1 in the U.S., U.K., and eurozone beat expectations and China reported first-quarter annualized economic growth of 4.5%. Despite banking industry stress, developed market stocks had monthly gains. The U.S. labor market remained strong, with a 3.5% jobless rate and monthly payroll gains above 200,000. However, uncertainty and inflationary concerns weighed on investors in the U.S. and abroad.
May was marked by a divergence between expanding activity in services and an overall contraction in manufacturing activity in the U.S., U.K., and eurozone. Core inflation remained elevated in the U.S. and Europe, despite the ongoing efforts of the Fed and the ECB, which included rate hikes of 0.25% by both in May. Stubborn inflation and the resilient U.S. labor market led to expectations of further interest rate hikes, overall monthly declines across bond indexes, and mixed results for stocks in May. Investor worries over a U.S. debt ceiling impasse were modest, and market confidence was buoyed by a deal in late May to avert a potential U.S. debt default.
June featured the Fed’s first pause on interest rate hikes since March 2022, when it began its aggressive campaign to rein in inflation. However, inflation, as measured by the Core Consumer Price Index (CPI)2, while continuing to decline, remained stubbornly high in June at 4.8%, well above the Fed’s 2.0% target rate. With the U.S. unemployment rate still at 3.6%, near a historical low, and U.S. payrolls growing in June for the 30th consecutive month, expectations of more Fed rate hikes were reinforced. However, U.S. and global stocks had strong returns in June.
July was a good month for stocks. However, bonds had more muted but positive monthly returns overall. Riskier sectors and regions tended to do well, as investors grew more optimistic regarding economic prospects. With strong second-quarter gross domestic product (GDP) growth—initially estimated at 2.4%—and U.S. annual inflation easing steadily to 3.2% in July, hopes for a soft economic landing grew. The Fed, the ECB, and the BoE all raised their respective key interest rates by 0.25% in July. In the Fed’s case, speculation grew that it could be very close to the end of its tightening cycle. Meanwhile, China’s economy showed signs of stagnation, renewing concerns of global fallout.
Stocks retreated in August while monthly bond returns were flat overall. Increased global market volatility reflected unease over the Chinese property market being stressed along with weak Chinese economic data. On a more positive note, speculation grew over a possible end to the Fed’s campaign of interest rate increases or at least a pause in September. U.S. economic data generally remained solid, with resilient job market data and inflation ticking up slightly in August, as the annual CPI3 rose 3.7%. However, the three-month trend for Core CPI stood at a more encouraging annualized 2.4%.
1
The Purchasing Managers Index (PMI) is an index of the prevailing direction of economic trends in the manufacturing and service sectors. You cannot invest directly in an index.
2
The Core Consumer Price Index (CPI) is a measure of the average change over time in the prices paid by urban consumers for a market basket of consumer goods and services excluding energy and food prices. You cannot invest directly in an index.
3
The CPI is a measure of the average change over time in the prices paid by urban consumers for a market basket of consumer goods and services. You cannot invest directly in an index.
Allspring VT Discovery SMID Cap Growth Fund | 3
Letter to shareholders (unaudited)
Stocks and bonds both had negative overall returns in September as investors reluctantly recited the new chorus of “higher for longer,” led by the Fed’s determination not to lower interest rates until it knows it has vanquished its pesky opponent—higher-than-targeted inflation. As of September, the two primary gauges of U.S. inflation—the annual Core Personal Consumption Expenditures Price Index1 and the CPI—both stood at roughly 4%, twice as high as the Fed’s oft-stated 2% target. The month ended with the prospect of yet another U.S. government shutdown, averted at least temporarily but looming later this fall.
October was a tough month for stocks and bonds. Key global and domestic indexes all were pushed down by rising geopolitical tensions, particularly the Israel-Hamas conflict, and concerns over the Fed’s “higher for longer” monetary policy. The U.S. 10-year Treasury yield rose above 5% for the first time since 2007. Commodity prices did well as oil prices rallied in response to the prospect of oil supply disruptions from the Middle East. U.S. annualized third-quarter GDP was estimated at a healthier-than-anticipated 4.9%. China’s GDP indicated surprisingly strong industrial production and retail sales, offset by ongoing weakness in its real estate sector.
In November, the market mood turned positive as cooling inflation inspired confidence that central banks could hold off on further rate hikes. Overall annual inflation in the U.S. fell to 3.1% in November while 12-month inflation in the U.K. and eurozone eased to 4.6% and 2.4%, respectively—far below their peak levels of mid-2022. Third quarter annualized U.S. GDP growth was raised to an estimated 5.2% while U.S. job totals rose by just below 200,000 in November, indicating a slight cooling of the labor market. All of this fresh evidence added to confidence for a U.S. soft economic landing, leading to a more buoyant mood heading into winter as the Federal Open Market Committee held rates steady at its December meeting.
The broad year-end rally among stocks and bonds that began in November continued through December as investors became more confident that monetary policy would ease in 2024. Supporting the bubbly market mood were a series of reports confirming lower inflationary trends in the U.S. and Europe. During the period, it appeared more likely that the U.S. economy could achieve a soft landing, cooling enough to lower inflation without the pain of a recession. However, by year-end, an expectations gap developed. Capital markets priced in a total of 1.50 percentage points in federal funds rate cuts in 2024—twice as much as the three cuts of 0.25% hinted at by Fed officials.
“ In November, the market mood turned positive as cooling inflation inspired confidence that central banks could hold off on further rate hikes. ”
1
The Core Personal Consumption Expenditures Price Index (PCE) is a measure of prices that people living in the United States, or those buying on their behalf, pay for goods and services. It is sometimes called the core PCE price index, because two categories that can have price swings – food and energy – are left out to make underlying inflation easier to see. You cannot invest directly in an index.
4 | Allspring VT Discovery SMID Cap Growth Fund
Letter to shareholders (unaudited)
For further information about your fund, contact your investment professional, visit our website at allspringglobal.com, or call us directly at 1-800-260-5969.
Don’t let short-term uncertainty derail long-term investment goals.
Periods of investment uncertainty can present challenges, but experience has taught us that maintaining long-term investment goals can be an effective way to plan for the future. To help you create a sound strategy based on your personal goals and risk tolerance, Allspring Funds offers more than 100 mutual funds spanning a wide range of asset classes and investment styles. Although diversification cannot guarantee an investment profit or prevent losses, we believe it can be an effective way to manage investment risk and potentially smooth out overall portfolio performance. We encourage investors to know their investments and to understand that appropriate levels of risk-taking may unlock opportunities.
Thank you for choosing to invest with Allspring Funds. We appreciate your confidence in us and remain committed to helping you meet your financial needs.
Sincerely,
Andrew Owen
President
Allspring Funds
Allspring VT Discovery SMID Cap Growth Fund | 5
Letter to shareholders (unaudited)
|
Beginning in July 2024, the Fund will be required by the Securities and Exchange Commission to send shareholders a paper copy of a new tailored shareholder report in place of the full shareholder report that you are now receiving. The tailored shareholder report will contain concise information about the Fund, including certain expense and performance information and fund statistics. If you wish to receive this new tailored shareholder report electronically, please follow the instructions on the back cover of this report. |
Other information that is currently included in the shareholder report, such as the Fund’s financial statements, will be available online and upon request, free of charge, in paper or electronic format. |
6 | Allspring VT Discovery SMID Cap Growth Fund
This page is intentionally left blank.
Performance highlights (unaudited)
Performance highlights
| The Fund seeks long-term capital appreciation. |
| Allspring Funds Management, LLC |
| Allspring Global Investments, LLC |
| Michael T. Smith, CFA, Christopher J. Warner, CFA |
Average annual total returns (%) as of December 31, 2023 |
| | | | | |
| | | | | | |
| | | | | | |
Russell 2500TM Growth Index3 | | | | | | |
Figures quoted represent past performance, which is no guarantee of future results. Investment return and principal value of an investment will fluctuate so that an investor’s shares, when redeemed, may be worth more or less than their original cost. Current performance may be lower or higher than the performance data quoted and assumes the reinvestment of dividends and capital gains. Current month-end performance is available by calling 1-800-260-5969. Performance figures of the Fund do not reflect fees and expenses charged pursuant to the terms of variable life insurance policies and variable annuity contracts. If these fees and expenses had been reflected, performance would have been lower.
Index returns do not include transaction costs associated with buying and selling securities, any mutual fund fees or expenses, or any taxes. It is not possible to invest directly in an index.
Shares are sold without a front-end sales charge or contingent deferred sales charge.
|
| Reflects the expense ratios as stated in the most recent prospectus. The expense ratios shown are subject to change and may differ from the annualized expense ratios shown in the Financial Highlights of this report. |
| The manager has contractually committed through April 30, 2024, to waive fees and/or reimburse expenses to the extent necessary to cap total annual fund operating expenses after fee waivers at 1.15% for Class 2 shares. Brokerage commissions, stamp duty fees, interest, taxes, acquired fund fees and expenses (if any), and extraordinary expenses are excluded from the expense cap. Prior to or after the commitment expiration date, the cap may be increased or the commitment to maintain the cap may be terminated only with the approval of the Board of Trustees. Without these caps, the Fund’s returns would have been lower. The expense ratio paid by an investor is the net expense ratio (the total annual fund operating expenses after fee waivers) as stated in the prospectus. |
| The Russell 2500TM Growth Index measures the performance of those Russell 2500TM companies with higher price/book ratios and higher forecasted growth values. You cannot invest directly in an index. |
Stock values fluctuate in response to the activities of individual companies and general market and economic conditions. Smaller-company stocks tend to be more volatile and less liquid than those of larger companies. Certain investment strategies tend to increase the total risk of an investment (relative to the broader market). This fund is exposed to foreign investment risk. Consult the Fund’s prospectus for additional information on these and other risks.
Please refer to the prospectus provided by your participating insurance company for detailed information describing the separate accounts for information regarding surrender charges, mortality and expense risk fees, and other charges that may be assessed by the participating insurance companies.
CFA® and Chartered Financial Analyst® are trademarks owned by CFA Institute. |
8 | Allspring VT Discovery SMID Cap Growth Fund
Performance highlights (unaudited)
Growth of $10,000 investment as of December 31, 20231 |
| The chart compares the performance of Class 2 shares for the most recent ten years with the Russell 2500TM Growth Index. The chart assumes a hypothetical investment of $10,000 in Class 2 shares and reflects all operating expenses of the Fund but does not reflect fees and expenses charged pursuant to the terms of variable life insurance policies and variable annuity contracts. |
Allspring VT Discovery SMID Cap Growth Fund | 9
Performance highlights (unaudited)
MANAGER’S DISCUSSION
Fund highlights
•The Fund outperformed its benchmark, the Russell 2500TM Growth Index, for the 12-month period that ended December 31, 2023.
•Security selection in the consumer discretionary and industrials sectors, along with a material underweight to the energy sector, contributed to the Fund’s results.
•Holdings within the communication services and information technology (IT) sectors detracted from relative performance.
Market leadership was concentrated for much of 2023.
The year started with high inflation and financial tightening producing a resounding call for a recession in 2023, yet the year ended on a positive note for most major U.S. equity indexes. Supported by healthy labor markets, declining inflation metrics, and a resilient consumer, earnings results largely exceeded expectations. Most notably, companies connected to artificial intelligence and GLP-1s (glucagon-like peptide-1) garnered significant attention and saw their valuations soar. For much of the year, the “Magnificent 7” stocks substantially outperformed the rest of the U.S. equity universe, boosting returns in large-cap indexes while restrictive policy rates deterred sentiment for small-cap stocks. However, along with favorable economic data, a dovish shift in tone from the Federal Reserve fueled a market rally late in the year. After trailing the Magnificent 7 for most of the year, market leadership broadened out in the fourth quarter and a soft landing became the consensus outlook for 2024.
Ten largest holdings (%) as of December 31, 20231 |
Casella Waste Systems, Inc. Class A | |
Teledyne Technologies, Inc. | |
SiteOne Landscape Supply, Inc. | |
| |
| |
| |
Rexford Industrial Realty, Inc. | |
| |
| |
| |
| Figures represent the percentage of the Fund’s net assets. Holdings are subject to change and may have changed since the date specified. |
Security selection in industrials and consumer discretionary contributed to relative performance.
Within industrials, Saia, Inc., contributed to performance. Saia is a short-haul trucking company that specializes in e-commerce fulfillment. During the year, shipment volumes and contract renewals exceeded expectations. Additionally, the dissolution of a key competitor created a unique opportunity for Saia to expand its distribution network. We hold conviction in Saia’s ability to execute, but we modestly trimmed the position due to elevated valuation.
In consumer discretionary, MercadoLibre, Inc., also contributed. MercadoLibre, a leading e-commerce and payments platform in Latin America, launched services to boost user engagement and advertising
revenue. Improving profitability and a leading technology platform provide multiple growth opportunities for MercadoLibre. We have held MercadoLibre within our portfolio for several years and continue to believe in its potential to deliver superior future returns.
Stock selection within communication services and IT detracted from relative performance.
Within communication services, ZoomInfo Technologies, Inc., detracted from performance. ZoomInfo hosts a global database that connects sale and marketing professionals with prospective clients. During the year, layoffs within the tech industry and pauses within corporate discretionary spending decreased demand for ZoomInfo. When sales did not reaccelerate as recession fears receded, our sell discipline was triggered and we exited the position.
BILL Holdings, Inc., in IT, also detracted from performance. BILL provides cloud-based software that enables small and medium-size businesses to digitize back-office functions. In return, BILL receives subscription fees and a portion of each transaction processed on its platform. Macro headwinds resulted in many of BILL’s customers reducing advertising and discretionary spending, which adversely affected BILL’s transactional revenue. We still hold the position but we are closely monitoring
fundamentals.
Sector allocation as of December 31, 20231 |
| Figures represent the percentage of the Fund’s long-term investments. Allocations are subject to change and may have changed since the date specified. |
10 | Allspring VT Discovery SMID Cap Growth Fund
Performance highlights (unaudited)
Staying balanced, with a skew toward quality.
The recent year was positive for equities, with most major U.S.-based equity indexes producing healthy gains. While the rally in December created optimism going into 2024, we believe investors should guard against extrapolating near-term signals. Consensus expectations are now for double-digit earnings growth for S&P 500 companies in the next year. Given lingering inflation uncertainties and the delayed impact of higher rates, we are concerned that this could be an optimistic bar for the market to clear. With elevated valuations and expectations, the markets may experience a negative surprise. Our strategy for navigating this environment is to be balanced and highly selective. We are placing a
priority on companies with profitable business models, free cash flow generation, and strong management execution.
We think there are exciting opportunities in small- and mid-cap growth stocks, which still trade at compelling relative valuations to large caps. Should the economy avoid a sharp downturn, there is considerable upside in smaller companies on the other side of a recovery. Most importantly, after a long period of hyperfocus on monetary policy, we are encouraged to see investors become more discerning toward company fundamentals. When it comes to compounding wealth, investors are realizing that profits may matter more than interest rates. This is an encouraging trend that we expect to continue.
Allspring VT Discovery SMID Cap Growth Fund | 11
Fund expenses (unaudited)
Fund expenses
As a shareholder of the Fund, you incur ongoing costs, including management fees, distribution (12b-1) fees and other Fund expenses. This example is intended to help you understand your ongoing costs (in dollars) of investing in the Fund and to compare these costs with the ongoing costs of investing in other mutual funds.
The example is based on an investment of $1,000 invested at the beginning of the six-month period and held for the entire period from July 1, 2023 to December 31, 2023.
Actual expenses
The “Actual” line of the table below provides information about actual account values and actual expenses. You may use the information in this line, together with the amount you invested, to estimate the expenses that you paid over the period. Simply divide your account value by $1,000 (for example, an $8,600 account value divided by $1,000= 8.6), then multiply the result by the number in the “Actual” line under the heading entitled “Expenses paid during period” for your applicable class of shares to estimate the expenses you paid on your account during this period.
Hypothetical example for comparison purposes
The “Hypothetical” line of the table below provides information about hypothetical account values and hypothetical expenses based on the Fund’s actual expense ratio and an assumed rate of return of 5% per year before expenses, which is not the Fund’s actual return. The hypothetical account values and expenses may not be used to estimate the actual ending account balance or expenses you paid for the period. You may use this information to compare the ongoing costs of investing in the Fund and other funds. To do so, compare this 5% hypothetical example with the 5% hypothetical examples that appear in the shareholder reports of the other funds.
Please note that the expenses shown in the table are meant to highlight your ongoing costs only and do not reflect any separate account charges assessed by participating insurance companies. Therefore, the “Hypothetical” line of the table is useful in comparing ongoing costs only, and will not help you determine the relative total costs of owning different funds. In addition, if these separate account charges assessed by participating insurance companies were included, your costs would have been higher.
| Beginning
account value
7-1-2023 | Ending
account value
12-31-2023 | Expenses
paid during
paid during
| Annualized net
expense ratio |
| | | | |
Hypothetical (5% return before expenses) | | | | |
| Expenses paid is equal to the annualized net expense ratio multiplied by the average account value over the period, multiplied by 183 divided by 365 (to reflect the one-half-year period). |
12 | Allspring VT Discovery SMID Cap Growth Fund
Portfolio of investments—December 31, 2023
| | | | | |
| | | | | | |
Communication services: 4.56% | | | | | | |
| | | | | | |
Liberty Media Corp.-Liberty Formula One Class C† | | | | | | |
Liberty Media Corp.-Liberty Live Class C† | | | | | | |
| | | | | | |
| | | | | | |
Interactive media & services: 1.15% | | | | | | |
| | | | | | |
Consumer discretionary: 8.88% | | | | | | |
| | | | | | |
| | | | | | |
| | | | | | |
| | | | | | |
Hotels, restaurants & leisure: 3.93% | | | | | | |
Chipotle Mexican Grill, Inc.† | | | | | | |
MGM Resorts International† | | | | | | |
| | | | | | |
| | | | | | |
| | | | | | |
| | | | | | |
Textiles, apparel & luxury goods: 1.10% | | | | | | |
| | | | | | |
| | | | | | |
| | | | | | |
| | | | | | |
Personal care products: 2.07% | | | | | | |
| | | | | | |
| | | | | | |
| | | | | | |
| | | | | | |
| | | | | | |
| | | | | | |
Tradeweb Markets, Inc. Class A | | | | | | |
| | | | | | |
Financial services: 2.83% | | | | | | |
Jack Henry & Associates, Inc. | | | | | | |
| | | | | | |
| | | | | | |
The accompanying notes are an integral part of these financial statements.
Allspring VT Discovery SMID Cap Growth Fund | 13
Portfolio of investments—December 31, 2023
| | | | | |
| | | | | | |
| | | | | | |
| | | | | | |
| | | | | | |
Halozyme Therapeutics, Inc.† | | | | | | |
| | | | | | |
Sarepta Therapeutics, Inc.† | | | | | | |
| | | | | | |
Health care equipment & supplies: 7.23% | | | | | | |
| | | | | | |
| | | | | | |
Inspire Medical Systems, Inc.† | | | | | | |
iRhythm Technologies, Inc.† | | | | | | |
| | | | | | |
| | | | | | |
| | | | | | |
Health care providers & services: 2.87% | | | | | | |
| | | | | | |
Option Care Health, Inc.† | | | | | | |
| | | | | | |
Life sciences tools & services: 3.41% | | | | | | |
| | | | | | |
| | | | | | |
| | | | | | |
| | | | | | |
Aerospace & defense: 2.14% | | | | | | |
| | | | | | |
| | | | | | |
Advanced Drainage Systems, Inc. | | | | | | |
Commercial services & supplies: 7.11% | | | | | | |
Casella Waste Systems, Inc. Class A† | | | | | | |
| | | | | | |
| | | | | | |
| | | | | | |
| | | | | | |
Construction & engineering: 1.28% | | | | | | |
| | | | | | |
Electrical equipment: 1.82% | | | | | | |
| | | | | | |
The accompanying notes are an integral part of these financial statements.
14 | Allspring VT Discovery SMID Cap Growth Fund
Portfolio of investments—December 31, 2023
| | | | | |
Ground transportation: 2.89% | | | | | | |
J.B. Hunt Transport Services, Inc. | | | | | | |
| | | | | | |
| | | | | | |
| | | | | | |
| | | | | | |
| | | | | | |
| | | | | | |
Professional services: 3.26% | | | | | | |
| | | | | | |
| | | | | | |
| | | | | | |
| | | | | | |
Trading companies & distributors: 5.50% | | | | | | |
Applied Industrial Technologies, Inc. | | | | | | |
SiteOne Landscape Supply, Inc.† | | | | | | |
| | | | | | |
| | | | | | |
Information technology: 24.96% | | | | | | |
Electronic equipment, instruments & components: 4.05% | | | | | | |
| | | | | | |
Teledyne Technologies, Inc.† | | | | | | |
| | | | | | |
| | | | | | |
| | | | | | |
| | | | | | |
| | | | | | |
Semiconductors & semiconductor equipment: 5.33% | | | | | | |
Axcelis Technologies, Inc.† | | | | | | |
| | | | | | |
| | | | | | |
Monolithic Power Systems, Inc. | | | | | | |
| | | | | | |
| | | | | | |
| | | | | | |
| | | | | | |
CCC Intelligent Solutions Holdings, Inc.† | | | | | | |
Clearwater Analytics Holdings, Inc. Class A† | | | | | | |
| | | | | | |
Descartes Systems Group, Inc.† | | | | | | |
| | | | | | |
| | | | | | |
| | | | | | |
The accompanying notes are an integral part of these financial statements.
Allspring VT Discovery SMID Cap Growth Fund | 15
Portfolio of investments—December 31, 2023
| | | | | |
| | | | | | |
Tyler Technologies, Inc.† | | | | | | |
| | | | | | |
| | | | | | |
| | | | | | |
| | | | | | |
| | | | | | |
| | | | | | |
| | | | | | |
Rexford Industrial Realty, Inc. | | | | | | |
Total common stocks (Cost $114,199,416) | | | | | | |
| | | | | |
Short-term investments: 2.15% | | | | | | |
Investment companies: 2.15% | | | | | | |
Allspring Government Money Market Fund Select Class♠∞ | | | | | | |
Total short-term investments (Cost $2,933,293) | | | | | | |
Total investments in securities (Cost $117,132,709) | | | | | | |
Other assets and liabilities, net | | | | | | |
| | | | | | |
| Non-income-earning security |
| The issuer of the security is an affiliated person of the Fund as defined in the Investment Company Act of 1940. |
| The rate represents the 7-day annualized yield at period end. |
|
| American depositary receipt |
| Real estate investment trust |
Investments in affiliates
An affiliated investment is an investment in which the Fund owns at least 5% of the outstanding voting shares of the issuer or as a result of other relationships, such as the Fund and the issuer having the same investment manager. Transactions with issuers that were affiliates of the Fund at the end of the period were as follows:
| | | | | Net
change in
unrealized
gains
(losses) | | | Income
from
affiliated
securities |
| | | | | | | | |
Allspring Government Money Market Fund Select Class | | | | | | | | |
Investments in affiliates no longer held at end of period | | | | | | | | |
Securities Lending Cash Investments LLC | | | | | | | | |
| | | | | | | | |
| Amount shown represents income before fees and rebates. |
The accompanying notes are an integral part of these financial statements.
16 | Allspring VT Discovery SMID Cap Growth Fund
Statement of assets and liabilities—December 31, 2023
Financial statements
Statement of assets and liabilities
| |
Investments in unaffiliated securities, at value (cost $114,199,416) | |
Investments in affiliated securities, at value (cost $2,933,293) | |
Receivable for Fund shares sold | |
| |
Prepaid expenses and other assets | |
| |
| |
| |
Payable for Fund shares redeemed | |
| |
Administration fee payable | |
Trustees’ fees and expenses payable | |
Accrued expenses and other liabilities | |
| |
| |
| |
| |
Total distributable earnings | |
| |
Computation of net asset value per share | |
| |
Shares outstanding - Class 21 | |
Net asset value per share - Class 2 | |
1 The Fund has an unlimited number of authorized shares.
The accompanying notes are an integral part of these financial statements.
Allspring VT Discovery SMID Cap Growth Fund | 17
Statement of operations—year ended December 31, 2023
Statement of operations
| |
Dividends (net of foreign withholdings taxes of $6,111) | |
Income from affiliated securities | |
| |
| |
| |
| |
Administration fee - Class 2 | |
Distribution fee - Class 2 | |
Custody and accounting fees | |
| |
Shareholder report expenses | |
Trustees’ fees and expenses | |
| |
| |
Less: Fee waivers and/or expense reimbursements | |
| |
| |
| |
Realized and unrealized gains (losses) on investments | |
| |
| |
| |
Net realized losses on investments | |
Net change in unrealized gains (losses) on | |
| |
| |
Net change in unrealized gains (losses) on investments | |
Net realized and unrealized gains (losses) on investments | |
Net increase in net assets resulting from operations | |
The accompanying notes are an integral part of these financial statements.
18 | Allspring VT Discovery SMID Cap Growth Fund
Statement of changes in net assets
Statement of changes in net assets
| Year ended December 31, 2023 | Year ended December 31, 2022 |
| | | | |
| | | | |
Net realized losses on investments | | | | |
Net change in unrealized gains (losses) on investments | | | | |
Net increase (decrease) in net assets resulting from operations | | | | |
Distributions to shareholders from | | | | |
Net investment income and net realized gains - Class 2 | | | | |
Capital share transactions | | | | |
Proceeds from shares sold - Class 2 | | | | |
Reinvestment of distributions - Class 2 | | | | |
Payment for shares redeemed - Class 2 | | | | |
Net increase (decrease) in net assets resulting from capital share transactions | | | | |
Total increase (decrease) in net assets | | | | |
| | | | |
| | | | |
| | | | |
The accompanying notes are an integral part of these financial statements.
Allspring VT Discovery SMID Cap Growth Fund | 19
Financial highlights
(For a share outstanding throughout each period)
| |
| | | | | |
Net asset value, beginning of period | | | | | |
| | | | | |
Net realized and unrealized gains (losses) on investments | | | | | |
Total from investment operations | | | | | |
Distributions to shareholders from | | | | | |
| | | | | |
Net asset value, end of period | | | | | |
| | | | | |
Ratios to average net assets (annualized) | | | | | |
| | | | | |
| | | | | |
| | | | | |
| | | | | |
| | | | | |
Net assets, end of period (000s omitted) | | | | | |
| Calculated based upon average shares outstanding |
| Returns do not reflect fees and expenses charged pursuant to the terms of variable life insurance policies and variable annuity contracts. |
The accompanying notes are an integral part of these financial statements.
20 | Allspring VT Discovery SMID Cap Growth Fund
Notes to financial statements
Notes to financial statements
Allspring Variable Trust (the “Trust”), a Delaware statutory trust organized on March 10, 1999, is an open-end management investment company registered under the Investment Company Act of 1940, as amended (the “1940 Act”). As an investment company, the Trust follows the accounting and reporting guidance in Financial Accounting Standards Board (“FASB”) Accounting Standards Codification Topic 946, Financial Services – Investment Companies. These financial statements report on the Allspring VT Discovery SMID Cap Growth Fund (formerly, Allspring VT Discovery Fund) (the “Fund”) which is a diversified series of the Trust. The Trust offers shares of the Fund to separate accounts of various life insurance companies as funding vehicles for certain variable annuity contracts and variable life insurance policies.
2.
SIGNIFICANT ACCOUNTING POLICIES
The following significant accounting policies, which are consistently followed in the preparation of the financial statements of the Fund, are in conformity with U.S. generally accepted accounting principles which require management to make estimates and assumptions that affect the reported amounts of assets and liabilities, disclosure of contingent assets and liabilities at the date of the financial statements, and the reported amounts of income and expenses during the reporting period. Actual results could differ from those estimates.
Securities valuation
All investments are valued each business day as of the close of regular trading on the New York Stock Exchange (generally 4 p.m. Eastern Time), although the Fund may deviate from this calculation time under unusual or unexpected circumstances.
Equity securities and exchange-traded funds that are listed on a foreign or domestic exchange or market are valued at the official closing price or, if none, the last sales price.
Investments in registered open-end investment companies (other than those listed on a foreign or domestic exchange or market) are valued at net asset value.
Investments which are not valued using the methods discussed above are valued at their fair value, as determined in good faith by Allspring Funds Management, LLC (“Allspring Funds Management”), which was named the valuation designee by the Board of Trustees. As the valuation designee, Allspring Funds Management is responsible for day-to-day valuation activities for the Allspring Funds. In connection with these responsibilities, Allspring Funds Management has established a Valuation Committee and has delegated to it the authority to take any actions regarding the valuation of portfolio securities that the Valuation Committee deems necessary or appropriate, including determining the fair value of portfolio securities. On a quarterly basis, the Board of Trustees receives reports of valuation actions taken by the Valuation Committee. On at least an annual basis, the Board of Trustees receives an assessment of the adequacy and effectiveness of Allspring Funds Management’s process for determining the fair value of the portfolio of investments.
Securities lending
During the period, the Fund participated in a program to lend its securities from time to time in order to earn additional income in the form of fees or interest on securities received as collateral or the investment of any cash received as collateral. When securities were on loan, the Fund received interest or dividends on those securities. Cash collateral received in connection with its securities lending transactions was invested in Securities Lending Cash Investments, LLC (the “Securities Lending Fund”), an affiliated non-registered investment company. Interests in the non-registered investment company that were redeemable at net asset value were fair valued normally at net asset value. Effective at the close of business on March 29, 2023, the Fund is no longer participating in the securities lending program and the Securities Lending Fund was liquidated. Securities Lending Fund was managed by Allspring Funds Management and was subadvised by Allspring Global Investments, LLC (“Allspring Investments”), an affiliate of Allspring Funds Management and wholly owned subsidiary of Allspring Global Investments Holdings, LLC. Allspring Funds Management received an advisory fee starting at 0.05% and declining to 0.01% as the average daily net assets of the Securities Lending Fund increased. All of the fees received by Allspring Funds Management were paid to Allspring Investments for its services as subadviser.
Income earned from investment in the Securities Lending Fund (net of fees and rebates), if any, is included in income from affiliated securities on the Statement of Operations.
Security transactions and income recognition
Securities transactions are recorded on a trade date basis. Realized gains or losses are recorded on the basis of identified cost.
Dividend income is recognized on the ex-dividend date. Dividend income is recorded net of foreign taxes withheld where recovery of such taxes is not assured.
Interest earned on cash balances held at the custodian is recorded as interest income.
Distributions received from REIT investments may be characterized as ordinary income, capital gains, or a return of capital to the Fund based on information provided by the REIT. The proper characterization of REIT distributions is generally not known until after the end of each calendar year. As such, estimates may be used in reporting the character of income and distributions for financial statement purposes.
Allspring VT Discovery SMID Cap Growth Fund | 21
Notes to financial statements
Distributions to shareholders
Distributions to shareholders from net investment income and any net realized gains are recorded on the ex-dividend date and paid at least annually. Such distributions are determined in accordance with income tax regulations and may differ from U.S. generally accepted accounting principles. Dividend sources are estimated at the time of declaration. The tax character of distributions is determined as of the Fund’s fiscal year end. Therefore, a portion of the Fund’s distributions made prior to the Fund’s fiscal year end may be categorized as a tax return of capital at year end.
Federal and other taxes
The Fund intends to continue to qualify as a regulated investment company by distributing substantially all of its investment company taxable income and any net realized capital gains (after reduction for capital loss carryforwards) sufficient to relieve it from all, or substantially all, federal income taxes. Accordingly, no provision for federal income taxes was required.
The Fund’s income and federal excise tax returns and all financial records supporting those returns for the prior three fiscal years are subject to examination by the federal and Delaware revenue authorities. Management has analyzed the Fund’s tax positions taken on federal, state, and foreign tax returns, as applicable, for all open tax years and does not believe that there are any uncertain tax positions that require recognition of a tax liability.
As of December 31, 2023, the aggregate cost of all investments for federal income tax purposes was $118,313,061 and the unrealized gains (losses) consisted of:
Reclassifications are made to the Fund’s capital accounts for permanent tax differences to reflect income and gains available for distribution (or available capital loss carryforwards) under federal income tax regulations. U.S. generally accepted accounting principles require that certain components of net assets be adjusted to reflect permanent differences between financial and tax reporting. These reclassifications have no effect on net assets or net asset values per share. The primary permanent difference causing such reclassification are due to dividends from certain securities and net operating loss. At December 31, 2023, as a result of permanent book-to-tax differences, the following reclassification adjustments were made on the Statement of Assets and Liabilities:
| Total distributable
earnings |
| |
As of December 31, 2023, the Fund had capital loss carryforwards which consist of $6,874,659 in short-term capital losses and $8,977,436 in long-term capital losses.
3.
FAIR VALUATION MEASUREMENTS
Fair value measurements of investments are determined within a framework that has established a fair value hierarchy based upon the various data inputs utilized in determining the value of the Fund’s investments. The three-level hierarchy gives the highest priority to unadjusted quoted prices in active markets for identical assets or liabilities (Level 1) and the lowest priority to unobservable inputs (Level 3). The Fund’s investments are classified within the fair value hierarchy based on the lowest level of input that is significant to the fair value measurement. The inputs are summarized into three broad levels as follows:
•Level 1—quoted prices in active markets for identical securities
•Level 2—other significant observable inputs (including quoted prices for similar securities, interest rates, prepayment speeds, credit risk, etc.)
•Level 3—significant unobservable inputs (including the Fund’s own assumptions in determining the fair value of investments)
The inputs or methodologies used for valuing investments in securities are not necessarily an indication of the risk associated with investing in those securities.
22 | Allspring VT Discovery SMID Cap Growth Fund
Notes to financial statements
The following is a summary of the inputs used in valuing the Fund’s assets and liabilities as of December 31, 2023:
| | Other significant
observable inputs
(Level 2) | Significant
unobservable inputs
(Level 3) | |
| | | | |
| | | | |
| | | | |
| | | | |
| | | | |
| | | | |
| | | | |
| | | | |
| | | | |
| | | | |
| | | | |
| | | | |
| | | | |
| | | | |
| | | | |
Additional sector, industry or geographic detail, if any, is included in the Portfolio of Investments.
At December 31, 2023, the Fund did not have any transfers into/out of Level 3.
4.
TRANSACTIONS WITH AFFILIATES
Management fee
Allspring Funds Management, a wholly owned subsidiary of Allspring Global Investments Holdings, LLC, a holding company indirectly owned by certain private funds of GTCR LLC and Reverence Capital Partners, L.P., is the manager of the Fund and provides advisory and fund-level administrative services under an investment management agreement. Under the investment management agreement, Allspring Funds Management is responsible for, among other services, implementing the investment objectives and strategies of the Fund, supervising the subadviser and providing fund-level administrative services in connection with the Fund’s operations. As compensation for its services under the investment management agreement, Allspring Funds Management is entitled to receive a management fee at the following annual rate based on the Fund’s average daily net assets:
For the year ended December 31, 2023, the management fee was equivalent to an annual rate of 0.75% of the Fund’s average daily net assets.
Allspring Funds Management has retained the services of a subadviser to provide daily portfolio management to the Fund. The fee for subadvisory services is borne by Allspring Funds Management. Allspring Investments is the subadviser to the Fund and is entitled to receive a fee from Allspring Funds Management at an annual rate starting at 0.45% and declining to 0.35% as the average daily net assets of the Fund increase.
Administration fee
Under a class-level administration agreement, Allspring Funds Management provides class-level administrative services to the Fund, which includes paying fees and expenses for services provided by the transfer agent, sub-transfer agents, omnibus account servicers and record-keepers. As compensation for its services under the class-level administration agreement, Allspring Funds Management receives an annual fee of 0.08% which is calculated based on the average daily net assets of Class 2 shares.
Waivers and/or expense reimbursements
Allspring Funds Management has contractually committed through April 30, 2024 to waive fees and/or reimburse management and administration fees to the extent necessary to cap the Fund’s expenses at 1.15% for Class 2 shares. Prior to or after the commitment expiration date, the cap may be increased or the commitment to maintain the cap may be terminated only with the approval of the Board of Trustees.
Allspring VT Discovery SMID Cap Growth Fund | 23
Notes to financial statements
Distribution fee
The Trust has adopted a distribution plan for Class 2 shares pursuant to Rule 12b-1 under the 1940 Act. A distribution fee is charged to Class 2 shares and paid to Allspring Funds Distributor, LLC, the principal underwriter, an affiliate of Allspring Funds Management, at an annual rate up to 0.25% of the average daily net assets of Class 2 shares.
Interfund transactions
The Fund may purchase or sell portfolio investment securities to certain affiliates pursuant to Rule 17a-7 under the 1940 Act and under procedures adopted by the Board of Trustees. The procedures have been designed to ensure that these interfund transactions, which do not incur broker commissions, are effected at current market prices. Pursuant to these procedures, the Fund did not have any interfund transactions during the year ended December 31, 2023.
5.
INVESTMENT PORTFOLIO TRANSACTIONS
Purchases and sales of investments, excluding U.S. government obligations (if any) and short-term securities, for the year ended December 31, 2023 were $69,120,529 and $83,863,914, respectively.
The Trust, Allspring Master Trust and Allspring Funds Trust (excluding the money market funds) are parties to a $350,000,000 revolving credit agreement whereby the Fund is permitted to use bank borrowings for temporary or emergency purposes, such as to fund shareholder redemption requests. Interest under the credit agreement is charged to the Fund based on borrowing rate equal to the higher of the Federal Funds rate or the overnight bank funding rate in effect on that day plus a spread. In addition, an annual commitment fee based on the unused balance is allocated to each participating fund.
For the year ended December 31, 2023, there were no borrowings by the Fund under the agreement.
7.
DISTRIBUTIONS TO SHAREHOLDERS
The tax character of distributions paid was $0 and $51,108,273 of long-term capital gain for the years ended December 31, 2023 and December 31, 2022, respectively.
As of December 31, 2023, the components of distributable earnings on a tax basis were as follows:
As of the end of the period, the Fund concentrated its portfolio of investments in industrials and information technology sector. A fund that invests a substantial portion of its assets in any sector may be more affected by changes in that sector than would be a fund whose investments are not heavily weighted in any sector.
Under the Fund’s organizational documents, the officers and Trustees have been granted certain indemnification rights against certain liabilities that may arise out of performance of their duties to the Fund. The Fund has entered into a separate agreement with each Trustee that converts indemnification rights currently existing under the Fund’s organizational documents into contractual rights that cannot be changed in the future without the consent of the Trustee. Additionally, in the normal course of business, the Fund may enter into contracts with service providers that contain a variety of indemnification clauses. The Fund’s maximum exposure under these arrangements is dependent on future claims that may be made against the Fund and, therefore, cannot be estimated.
24 | Allspring VT Discovery SMID Cap Growth Fund
Report of independent registered public accounting firm
To the Shareholders of the Fund and Board of Trustees
Allspring Variable Trust:
Opinion on the Financial Statements
We have audited the accompanying statement of assets and liabilities of Allspring VT Discovery SMID Cap Growth Fund (formerly, Allspring VT Discovery Fund) (the Fund), one of the funds constituting Allspring Variable Trust, including the portfolio of investments, as of December 31, 2023, the related statement of operations for the year then ended, the statements of changes in net assets for each of the years in the two-year period then ended, and the related notes (collectively, the financial statements) and the financial highlights for each of the years in the five-year period then ended. In our opinion, the financial statements and financial highlights present fairly, in all material respects, the financial position of the Fund as of December 31, 2023, the results of its operations for the year then ended, the changes in its net assets for each of the years in the two-year period then ended, and the financial highlights for each of the years in the five-year period then ended, in conformity with U.S. generally accepted accounting principles.
Basis for Opinion
These financial statements and financial highlights are the responsibility of the Fund’s management. Our responsibility is to express an opinion on these financial statements and financial highlights based on our audits. We are a public accounting firm registered with the Public Company Accounting Oversight Board (United States) (PCAOB) and are required to be independent with respect to the Fund in accordance with the U.S. federal securities laws and the applicable rules and regulations of the Securities and Exchange Commission and the PCAOB.
We conducted our audits in accordance with the standards of the PCAOB. Those standards require that we plan and perform the audit to obtain reasonable assurance about whether the financial statements and financial highlights are free of material misstatement, whether due to error or fraud. Our audits included performing procedures to assess the risks of material misstatement of the financial statements and financial highlights, whether due to error or fraud, and performing procedures that respond to those risks. Such procedures included examining, on a test basis, evidence regarding the amounts and disclosures in the financial statements and financial highlights. Such procedures also included confirmation of securities owned as of December 31, 2023, by correspondence with the custodian and transfer agent. Our audits also included evaluating the accounting principles used and significant estimates made by management, as well as evaluating the overall presentation of the financial statements and financial highlights. We believe that our audits provide a reasonable basis for our opinion.

We have not been able to determine the specific year that we began serving as the auditor of one or more Allspring Funds investment companies; however, we are aware that we have served as the auditor of one or more Allspring Funds investment companies since at least 1955.
Boston, Massachusetts
February 26, 2024
Allspring VT Discovery SMID Cap Growth Fund | 25
Other information (unaudited)
Other information
Proxy voting information
A description of the policies and procedures used to determine how to vote proxies relating to portfolio securities is available without charge, upon request, by calling 1-866-259-3305, visiting our website at allspringglobal.com, or visiting the SEC website at sec.gov. Information regarding how the proxies related to portfolio securities were voted during the most recent 12-month period ended June 30 is available on the website at allspringglobal.com or by visiting the SEC website at sec.gov.
Quarterly portfolio holdings information
The Fund files its complete schedule of portfolio holdings with the SEC for the first and third quarters of each fiscal year as an exhibit to its reports on Form N-PORT. Shareholders may view the filed Form N-PORT by visiting the SEC website at sec.gov.
26 | Allspring VT Discovery SMID Cap Growth Fund
Other information (unaudited)
Board of trustees and officers
Each of the Trustees and Officers listed in the table below acts in identical capacities for each fund in the Allspring family of funds, which consists of 117 mutual funds comprising the Allspring Funds Trust, Allspring Variable Trust, Allspring Master Trust and four closed-end funds (collectively the “Fund Complex”). This table should be read in conjunction with the Prospectus and the Statement of Additional Information†. The mailing address of each Trustee and Officer is 1415 Vantage Park Drive, 3rd Floor, Charlotte, NC 28203. Each Trustee and Officer serves an indefinite term, however, each Trustee serves such term until reaching the mandatory retirement age established by the Trustees.
Independent Trustees
| | Principal occupations during past five years or longer | Current other
public company or
investment
company
directorships |
William R. Ebsworth
(Born 1957) | | Retired. From 1984 to 2013, equities analyst, portfolio manager, research director and chief investment officer at Fidelity Management and Research Company in Boston, Tokyo, and Hong Kong, and retired in 2013 as Chief Investment Officer of Fidelity Strategic Advisers, Inc. where he led a team of investment professionals managing client assets. Prior thereto, Board member of Hong Kong Securities Clearing Co., Hong Kong Options Clearing Corp., the Thailand International Fund, Ltd., Fidelity Investments Life Insurance Company, and Empire Fidelity Investments Life Insurance Company. Serves on the Investment Company Institute’s Board of Governors since 2022 and Executive Committee since 2023 as well as the Vice Chairman of the Governing Council of the Independent Directors Council since 2023. Audit Committee Chair and Investment Committee Chair of the Vincent Memorial Hospital Foundation (non-profit organization). Mr. Ebsworth is a CFA charterholder. | |
Jane A. Freeman
(Born 1953) | Trustee,
since 2015;
Chair Liaison,
| Retired. From 2012 to 2014 and 1999 to 2008, Chief Financial Officer of Scientific Learning Corporation. From 2008 to 2012, Ms. Freeman provided consulting services related to strategic business projects. Prior to 1999, Portfolio Manager at Rockefeller & Co. and Scudder, Stevens & Clark. Board member of the Harding Loevner Funds from 1996 to 2014, serving as both Lead Independent Director and chair of the Audit Committee. Board member of the Russell Exchange Traded Funds Trust from 2011 to 2012 and the chair of the Audit Committee. Ms. Freeman is also an inactive Chartered Financial Analyst. | |
Isaiah Harris, Jr.
(Born 1952) | Trustee,
since 2009;
Audit Committee Chair,
since 2019 | Retired. Member of the Advisory Board of CEF of East Central Florida. Chairman of the Board of CIGNA Corporation from 2009 to 2021, and Director from 2005 to 2008. From 2003 to 2011, Director of Deluxe Corporation. Prior thereto, President and CEO of BellSouth Advertising and Publishing Corp. from 2005 to 2007, President and CEO of BellSouth Enterprises from 2004 to 2005 and President of BellSouth Consumer Services from 2000 to 2003. Emeritus member of the Iowa State University Foundation Board of Governors. Emeritus Member of the Advisory board of Iowa State University School of Business. Advisory Board Member, Palm Harbor Academy (private school). Advisory Board Member, Fellowship of Christian Athletes. Mr. Harris is a certified public accountant (inactive status). | |
David F. Larcker
(Born 1950) | | Distinguished Visiting Fellow at the Hoover Institution since 2022. James Irvin Miller Professor of Accounting at the Graduate School of Business (Emeritus), Stanford University, Director of the Corporate Governance Research Initiative and Senior Faculty of The Rock Center for Corporate Governance since 2006. From 2005 to 2008, Professor of Accounting at the Graduate School of Business, Stanford University. Prior thereto, Ernst & Young Professor of Accounting at The Wharton School, University of Pennsylvania from 1985 to 2005. | |
Olivia S. Mitchell
(Born 1953) | | International Foundation of Employee Benefit Plans Professor since 1993, Wharton School of the University of Pennsylvania. Director of Wharton’s Pension Research Council and Boettner Center on Pensions & Retirement Research, and Research Associate at the National Bureau of Economic Research. Previously taught at Cornell University from 1978 to 1993. | |
Timothy J. Penny
(Born 1951) | Trustee,
since 1996;
Chair,
since 2018 | President and Chief Executive Officer of Southern Minnesota Initiative Foundation, a non-profit organization, since 2007. Vice Chair of the Economic Club of Minnesota, since 2007. Co-Chair of the Committee for a Responsible Federal Budget, since 1995. Member of the Board of Trustees of NorthStar Education Finance, Inc., a non-profit organization, from 2007-2022. Senior Fellow of the University of Minnesota Humphrey Institute from 1995 to 2017. | |
* Length of service dates reflect the Trustee’s commencement of service with the Trust’s predecessor entities, where applicable.
# Ms. Freeman will serve as Chair Liaison through June 2024, at which time Ms. Wheelock will assume the role.
†
The Statement of Additional Information includes additional information about the Trustees and is available, without charge, upon request, by calling 1-800-260-5969 or by visiting the website at allspringglobal.com.
Allspring VT Discovery SMID Cap Growth Fund | 27
Other information (unaudited)
| Position held and length of service* | Principal occupations during past five years or longer | Current other public company or investment company directorships |
James G. Polisson
(Born 1959) | Trustee,
since 2018; Nominating and Governance Committee Chair, since 2024 | Retired. Chief Marketing Officer, Source (ETF) UK Services, Ltd, from 2015 to 2017. From 2012 to 2015, Principal of The Polisson Group, LLC, a management consulting, corporate advisory and principal investing company. Chief Executive Officer and Managing Director at Russell Investments, Global Exchange Traded Funds from 2010 to 2012. Managing Director of Barclays Global Investors from 1998 to 2010 and Global Chief Marketing Officer for iShares and Barclays Global Investors from 2000 to 2010. Trustee of the San Francisco Mechanics’ Institute, a non- profit organization, from 2013 to 2015. Board member of the Russell Exchange Traded Fund Trust from 2011 to 2012. Director of Barclays Global Investors Holdings Deutschland GmbH from 2006 to 2009. Mr. Polisson is an attorney and has a retired status with the Massachusetts and District of Columbia Bar Associations. | |
Pamela Wheelock
(Born 1959) | Trustee,
since January 2020;
previously Trustee from
January 2018 to
| Retired. Executive and Senior Financial leadership positions in the public, private and nonprofit sectors. Interim President and CEO, McKnight Foundation, 2020. Interim Commissioner, Minnesota Department of Human Services, 2019. Chief Operating Officer, Twin Cities Habitat for Humanity, 2017-2019. Vice President for University Services, University of Minnesota, 2012- 2016. Interim President and CEO, Blue Cross and Blue Shield of Minnesota, 2011-2012. Executive Vice-President and Chief Financial Officer, Minnesota Wild, 2002-2008. Commissioner, Minnesota Department of Finance, 1999-2002. Chair of the Board of Directors of Destination Medical Center Corporation. Board member of the Minnesota Wild Foundation. | |
* Length of service dates reflect the Trustee’s commencement of service with the Trust’s predecessor entities, where applicable.
# Ms. Freeman will serve as Chair Liaison through June 2024, at which time Ms. Wheelock will assume the role.
28 | Allspring VT Discovery SMID Cap Growth Fund
Other information (unaudited)
Officers1
| Position held and
length of service | Principal occupations during past five years or longer |
| | President and Chief Executive Officer of Allspring Funds Management, LLC since 2017 and Head of Global Fund Governance of Allspring Global Investments since 2022. Prior thereto, co-president of Galliard Capital Management, LLC, an affiliate of Allspring Funds Management, LLC, from 2019 to 2022 and Head of Affiliated Managers, Allspring Global Investments, from 2014 to 2019 and Executive Vice President responsible for marketing, investments and product development for Allspring Funds Management, LLC, from 2009 to 2014. |
Jeremy DePalma
(Born 1974) | Treasurer,
since 2012
(for certain funds in
the Fund Complex);
since 2021 (for
the remaining funds in the Complex) | Senior Vice President of Allspring Funds Management, LLC since 2009. Senior Vice President of Evergreen Investment Management Company, LLC from 2008 to 2010 and head of the Fund Reporting and Control Team within Fund Administration from 2005 to 2010. |
Christopher Baker
(Born 1976) | Chief Compliance Officer,
since 2022 | Global Chief Compliance Officer for Allspring Global Investments since 2022. Prior thereto, Chief Compliance Officer for State Street Global Advisors from 2018 to 2021. Senior Compliance Officer for the State Street divisions of Alternative Investment Solutions, Sector Solutions, and Global Marketing from 2015 to 2018. From 2010 to 2015 Vice President, Global Head of Investment and Marketing Compliance for State Street Global Advisors. |
Matthew Prasse
(Born 1983) | Chief Legal Officer,
since 2022;
Secretary,
since 2021 | Senior Counsel of the Allspring Legal Department since 2021. Senior Counsel of the Wells Fargo Legal Department from 2018 to 2021. Previously, Counsel for Barings LLC from 2015 to 2018. Prior to joining Barings, Associate at Morgan, Lewis & Bockius LLP from 2008 to 2015. |
1 For those Officers with tenures at Allspring Global Investments and/or Allspring Funds Management, LLC that began prior to 2021, such tenures include years of service during which these businesses/entities were known as Wells Fargo Asset Management and Wells Fargo Funds Management, LLC, respectively.
Allspring VT Discovery SMID Cap Growth Fund | 29
For more information
More information about Allspring Funds is available free upon request. To obtain literature, please write, visit the Fund’s website, or call:
Allspring Funds
P.O. Box 219967
Kansas City, MO 64121-9967
Website: allspringglobal.com
Individual investors: 1-800-260-5969
Retail investment professionals: 1-888-877-9275
Institutional investment professionals: 1-866-765-0778
This report and the financial statements contained herein are submitted for the general information of the shareholders of the Fund. If this report is used for promotional purposes, distribution of the report must be accompanied or preceded by a current prospectus. Before investing, please consider the investment objectives, risks, charges, and expenses of the investment. For a current prospectus and, if available, a summary prospectus, containing this information, call 1-800-260-5969 or visit the Fund’s website at allspringglobal.com. Read the prospectus carefully before you invest or send money.
Allspring Global InvestmentsTM is the trade name for the asset management firms of Allspring Global Investments Holdings, LLC, a holding company indirectly owned by certain private funds of GTCR LLC and Reverence Capital Partners, L.P. These firms include but are not limited to Allspring Global Investments, LLC, and Allspring Funds Management, LLC. Certain products managed by Allspring entities are distributed by Allspring Funds Distributor, LLC (a broker-dealer and Member FINRA/SIPC).
This material is for general informational and educational purposes only and is NOT intended to provide investment advice or a recommendation of any kind - including a recommendation for any specific investment, strategy, or plan.
© 2024 Allspring Global Investments Holdings, LLC. All rights reserved.
ALL-01052024-lx2dkkwq 02-24
AR3221 12-23
Allspring VT Index Asset Allocation Fund
Annual Report
December 31, 2023
The views expressed and any forward-looking statements are as of December 31, 2023, unless otherwise noted, and are those of the Fund’s portfolio managers and/or Allspring Global Investments. Discussions of individual securities or the markets generally are not intended as individual recommendations. Future events or results may vary significantly from those expressed in any forward-looking statements. The views expressed are subject to change at any time in response to changing circumstances in the market. Allspring Global Investments disclaims any obligation to publicly update or revise any views expressed or forward-looking statements.
Allspring VT Index Asset Allocation Fund | 1
Letter to shareholders (unaudited)
Andrew Owen
President
Allspring Funds
Dear Shareholder:
We are pleased to offer you this annual report for the Allspring VT Index Asset Allocation Fund for the 12-month period that ended December 31, 2023. Globally, stocks and bonds experienced high levels of volatility throughout the period but had positive overall results. The market was focused on persistently high inflation and the impact of ongoing aggressive central bank rate hikes. Compounding these concerns were the global reverberations of the Russia-Ukraine war. Riskier assets rallied in 2023, as investors anticipated an end to the tight monetary policy despite concerns of a possible recession. After suffering deep and broad losses through 2022, bonds now benefit from a base of higher yields that can help generate higher income.
For the 12-month period, stocks generally outperformed bonds—both domestic U.S. and global. For the period, U.S. stocks, based on the S&P 500 Index,1 gained 26.29%. International stocks, as measured by the MSCI ACWI ex USA Index (Net),2 returned 15.62%, while the MSCI EM Index (Net) (USD)3 had more modest performance, with a gain of 9.83%. Among bond indexes, the Bloomberg U.S. Aggregate Bond Index4 returned 5.53%, the Bloomberg Global Aggregate ex-USD Index (unhedged)5 gained 5.72%, the Bloomberg Municipal Bond Index6 returned 6.40%, and the ICE BofA U.S. High Yield Index7 gained 13.54%.
Despite high inflation and central bank rate hikes, markets rallied.
The year 2023 began with a rally across global equities and fixed income securities. Investor optimism rose in response to data indicating declining inflation rates and the reopening of China’s economy with the abrupt end to its zero-COVID-19 policy. The U.S. reported strong job gains and unemployment fell to 3.4%—the lowest level since 1969. Meanwhile, wage growth, seen as a potential contributor to ongoing high inflation, continued to moderate. All eyes remained on the Federal Reserve (Fed) and on how many more rate hikes remain in this tightening cycle. The 0.25% federal funds rate hike announced in January was the Fed’s smallest rate increase since March 2022.
Markets declined in February as investors responded unfavorably to resilient economic data. The takeaway: Central banks would likely continue their monetary tightening cycle for longer than markets had priced in. In this environment—where strong economic data is seen as bad news—the resilient U.S. labor market was taken as a negative, with inflation not falling quickly enough for the Fed, which raised interest rates by 0.25% in February. Meanwhile, the Bank of England (BoE) and the European Central Bank (ECB) both raised rates by 0.50%.
1
The S&P 500 Index consists of 500 stocks chosen for market size, liquidity, and industry group representation. It is a market-value-weighted index with each stock’s weight in the index proportionate to its market value. You cannot invest directly in an index.
2
The Morgan Stanley Capital International (MSCI) All Country World Index (ACWI) ex USA Index (Net) is a free-float-adjusted market-capitalization-weighted index that is designed to measure the equity market performance of developed and emerging markets, excluding the U.S. Source: MSCI. MSCI makes no express or implied warranties or representations and shall have no liability whatsoever with respect to any MSCI data contained herein. The MSCI data may not be further redistributed or used as a basis for other indexes or any securities or financial products. This report is not approved, reviewed, or produced by MSCI. You cannot invest directly in an index.
3
The MSCI Emerging Markets (EM) Index (Net) (USD) is a free-float-adjusted market-capitalization-weighted index that is designed to measure the equity market performance of emerging markets. You cannot invest directly in an index.
4
The Bloomberg U.S. Aggregate Bond Index is a broad-based benchmark that measures the investment-grade, U.S.-dollar-denominated, fixed-rate taxable bond market, including Treasuries, government-related and corporate securities, mortgage-backed securities (agency fixed-rate and hybrid adjustable-rate mortgage pass-throughs), asset-backed securities, and commercial mortgage-backed securities. You cannot invest directly in an index.
5
The Bloomberg Global Aggregate ex-USD Index (unhedged) is an unmanaged index that provides a broad-based measure of the global investment-grade fixed-income markets excluding the U.S.-dollar-denominated debt market. You cannot invest directly in an index.
6
The Bloomberg Municipal Bond Index is an unmanaged index composed of long-term tax-exempt bonds with a minimum credit rating of Baa. You cannot invest directly in an index.
7
The ICE BofA U.S. High Yield Index is a market-capitalization-weighted index of domestic and Yankee high yield bonds. The index tracks the performance of high yield securities traded in the U.S. bond market. You cannot invest directly in an index. Copyright 2024. ICE Data Indices, LLC. All rights reserved.
2 | Allspring VT Index Asset Allocation Fund
Letter to shareholders (unaudited)
“ The collapse of Silicon Valley Bank in March—the second-largest banking failure in U.S. history—led to a bank run that spread to Europe, where Switzerland’s Credit Suisse was taken over by its rival, UBS. ”
The collapse of Silicon Valley Bank in March—the second-largest banking failure in U.S. history—led to a bank run that spread to Europe, where Switzerland’s Credit Suisse was taken over by its rival, UBS. The banking industry turmoil created an additional challenge for central banks in balancing inflationary concerns against potential economic weakening. Meanwhile, recent data pointed to economic strength in the U.S., Europe, and China. And China’s economy continued to rebound after the removal of its COVID-19 lockdown. Inflation rates in the U.S., the U.K., and the eurozone all remained higher than central bank targets, leading to additional rate hikes in March.
Economic data released in April pointed to global resilience, as Purchasing Managers Indexes1 in the U.S., U.K., and eurozone beat expectations and China reported first-quarter annualized economic growth of 4.5%. Despite banking industry stress, developed market stocks had monthly gains. The U.S. labor market remained strong, with a 3.5% jobless rate and monthly payroll gains above 200,000. However, uncertainty and inflationary concerns weighed on investors in the U.S. and abroad.
May was marked by a divergence between expanding activity in services and an overall contraction in manufacturing activity in the U.S., U.K., and eurozone. Core inflation remained elevated in the U.S. and Europe, despite the ongoing efforts of the Fed and the ECB, which included rate hikes of 0.25% by both in May. Stubborn inflation and the resilient U.S. labor market led to expectations of further interest rate hikes, overall monthly declines across bond indexes, and mixed results for stocks in May. Investor worries over a U.S. debt ceiling impasse were modest, and market confidence was buoyed by a deal in late May to avert a potential U.S. debt default.
June featured the Fed’s first pause on interest rate hikes since March 2022, when it began its aggressive campaign to rein in inflation. However, inflation, as measured by the Core Consumer Price Index (CPI)2, while continuing to decline, remained stubbornly high in June at 4.8%, well above the Fed’s 2.0% target rate. With the U.S. unemployment rate still at 3.6%, near a historical low, and U.S. payrolls growing in June for the 30th consecutive month, expectations of more Fed rate hikes were reinforced. However, U.S. and global stocks had strong returns in June.
July was a good month for stocks. However, bonds had more muted but positive monthly returns overall. Riskier sectors and regions tended to do well, as investors grew more optimistic regarding economic prospects. With strong second-quarter gross domestic product (GDP) growth—initially estimated at 2.4%—and U.S. annual inflation easing steadily to 3.2% in July, hopes for a soft economic landing grew. The Fed, the ECB, and the BoE all raised their respective key interest rates by 0.25% in July. In the Fed’s case, speculation grew that it could be very close to the end of its tightening cycle. Meanwhile, China’s economy showed signs of stagnation, renewing concerns of global fallout.
Stocks retreated in August while monthly bond returns were flat overall. Increased global market volatility reflected unease over the Chinese property market being stressed along with weak Chinese economic data. On a more positive note, speculation grew over a possible end to the Fed’s campaign of interest rate increases or at least a pause in September. U.S. economic data generally remained solid, with resilient job market data and inflation ticking up slightly in August, as the annual CPI3 rose 3.7%. However, the three-month trend for Core CPI stood at a more encouraging annualized 2.4%.
1
The Purchasing Managers Index (PMI) is an index of the prevailing direction of economic trends in the manufacturing and service sectors. You cannot invest directly in an index.
2
The Core Consumer Price Index (CPI) is a measure of the average change over time in the prices paid by urban consumers for a market basket of consumer goods and services excluding energy and food prices. You cannot invest directly in an index.
3
The CPI is a measure of the average change over time in the prices paid by urban consumers for a market basket of consumer goods and services. You cannot invest directly in an index.
Allspring VT Index Asset Allocation Fund | 3
Letter to shareholders (unaudited)
Stocks and bonds both had negative overall returns in September as investors reluctantly recited the new chorus of “higher for longer,” led by the Fed’s determination not to lower interest rates until it knows it has vanquished its pesky opponent—higher-than-targeted inflation. As of September, the two primary gauges of U.S. inflation—the annual Core Personal Consumption Expenditures Price Index1 and the CPI—both stood at roughly 4%, twice as high as the Fed’s oft-stated 2% target. The month ended with the prospect of yet another U.S. government shutdown, averted at least temporarily but looming later this fall.
October was a tough month for stocks and bonds. Key global and domestic indexes all were pushed down by rising geopolitical tensions, particularly the Israel-Hamas conflict, and concerns over the Fed’s “higher for longer” monetary policy. The U.S. 10-year Treasury yield rose above 5% for the first time since 2007. Commodity prices did well as oil prices rallied in response to the prospect of oil supply disruptions from the Middle East. U.S. annualized third-quarter GDP was estimated at a healthier-than-anticipated 4.9%. China’s GDP indicated surprisingly strong industrial production and retail sales, offset by ongoing weakness in its real estate sector.
In November, the market mood turned positive as cooling inflation inspired confidence that central banks could hold off on further rate hikes. Overall annual inflation in the U.S. fell to 3.1% in November while 12-month inflation in the U.K. and eurozone eased to 4.6% and 2.4%, respectively—far below their peak levels of mid-2022. Third quarter annualized U.S. GDP growth was raised to an estimated 5.2% while U.S. job totals rose by just below 200,000 in November, indicating a slight cooling of the labor market. All of this fresh evidence added to confidence for a U.S. soft economic landing, leading to a more buoyant mood heading into winter as the Federal Open Market Committee held rates steady at its December meeting.
The broad year-end rally among stocks and bonds that began in November continued through December as investors became more confident that monetary policy would ease in 2024. Supporting the bubbly market mood were a series of reports confirming lower inflationary trends in the U.S. and Europe. During the period, it appeared more likely that the U.S. economy could achieve a soft landing, cooling enough to lower inflation without the pain of a recession. However, by year-end, an expectations gap developed. Capital markets priced in a total of 1.50 percentage points in federal funds rate cuts in 2024—twice as much as the three cuts of 0.25% hinted at by Fed officials.
“ In November, the market mood turned positive as cooling inflation inspired confidence that central banks could hold off on further rate hikes. ”
1
The Core Personal Consumption Expenditures Price Index (PCE) is a measure of prices that people living in the United States, or those buying on their behalf, pay for goods and services. It is sometimes called the core PCE price index, because two categories that can have price swings – food and energy – are left out to make underlying inflation easier to see. You cannot invest directly in an index.
4 | Allspring VT Index Asset Allocation Fund
Letter to shareholders (unaudited)
For further information about your fund, contact your investment professional, visit our website at allspringglobal.com, or call us directly at 1-800-260-5969.
Don’t let short-term uncertainty derail long-term investment goals.
Periods of investment uncertainty can present challenges, but experience has taught us that maintaining long-term investment goals can be an effective way to plan for the future. To help you create a sound strategy based on your personal goals and risk tolerance, Allspring Funds offers more than 100 mutual funds spanning a wide range of asset classes and investment styles. Although diversification cannot guarantee an investment profit or prevent losses, we believe it can be an effective way to manage investment risk and potentially smooth out overall portfolio performance. We encourage investors to know their investments and to understand that appropriate levels of risk-taking may unlock opportunities.
Thank you for choosing to invest with Allspring Funds. We appreciate your confidence in us and remain committed to helping you meet your financial needs.
Sincerely,
Andrew Owen
President
Allspring Funds
Allspring VT Index Asset Allocation Fund | 5
Letter to shareholders (unaudited)
|
Beginning in July 2024, the Fund will be required by the Securities and Exchange Commission to send shareholders a paper copy of a new tailored shareholder report in place of the full shareholder report that you are now receiving. The tailored shareholder report will contain concise information about the Fund, including certain expense and performance information and fund statistics. If you wish to receive this new tailored shareholder report electronically, please follow the instructions on the back cover of this report. |
Other information that is currently included in the shareholder report, such as the Fund’s financial statements, will be available online and upon request, free of charge, in paper or electronic format. |
6 | Allspring VT Index Asset Allocation Fund
This page is intentionally left blank.
Performance highlights (unaudited)
Performance highlights
| The Fund seeks long-term total return, consisting of capital appreciation and current income. |
| Allspring Funds Management, LLC |
| Allspring Global Investments, LLC |
| Kandarp R. Acharya, CFA, FRM†, Petros N. Bocray, CFA, FRM, Manjunath Boraiah, John R. Campbell, CFA, Travis L. Keshemberg, CFA, CIPM, FRM, David Kowalske, Jr.††, David Neal, CFA, Nick Toporkov, Ph.D., CFA, Robert M. Wicentowski, CFA, Limin Xiao, Ph.D., CFA |
Average annual total returns (%) as of December 31, 2023 |
| | | | | |
| | | | | | |
| | | | | | |
Index Asset Allocation Blended Index3 | | | | | | |
Bloomberg U.S. Treasury Index4 | | | | | | |
| | | | | | |
Figures quoted represent past performance, which is no guarantee of future results. Investment return and principal value of an investment will fluctuate so that an investor’s shares, when redeemed, may be worth more or less than their original cost. Current performance may be lower or higher than the performance data quoted and assumes the reinvestment of dividends and capital gains. Current month-end performance is available by calling 1-800-260-5969. Performance figures of the Fund do not reflect fees and expenses charged pursuant to the terms of variable life insurance policies and variable annuity contracts. If these fees and expenses had been reflected, performance would have been lower.
Index returns do not include transaction costs associated with buying and selling securities, any mutual fund fees or expenses, or any taxes. It is not possible to invest directly in an index.
Shares are sold without a front-end sales charge or contingent deferred sales charge.
|
| Reflects the expense ratios as stated in the most recent prospectus. The expense ratios shown are subject to change and may differ from the annualized expense ratios shown in the Financial Highlights of this report. |
| The manager has contractually committed through April 30, 2024, to waive fees and/or reimburse expenses to the extent necessary to cap total annual fund operating expenses after fee waivers at 1.00% for Class 2 shares. Brokerage commissions, stamp duty fees, interest, taxes, acquired fund fees and expenses (if any), and extraordinary expenses are excluded from the expense cap. Prior to or after the commitment expiration date, the cap may be increased or the commitment to maintain the cap may be terminated only with the approval of the Board of Trustees. Without these caps, the Fund’s returns would have been lower. The expense ratio paid by an investor is the net expense ratio (the total annual fund operating expenses after fee waivers) as stated in the prospectus. |
| Source: Allspring Funds Management, LLC. Index Asset Allocation Blended Index is composed 60% of the S&P 500 Index and 40% of the Bloomberg U.S. Treasury Index. Prior to April 1, 2015, the Index Asset Allocation Blended Index was composed 60% of the S&P 500 Index and 40% of the Bloomberg U.S. Treasury 20+ Year Index. You cannot invest directly in an index. |
| The Bloomberg U.S. Treasury Index is an unmanaged index of prices of U.S. Treasury bonds with maturities of 1 to 30 years. You cannot invest directly in an index. |
| The S&P 500 Index consists of 500 stocks chosen for market size, liquidity, and industry group representation. It is a market-value-weighted index with each stock’s weight in the index proportionate to its market value. You cannot invest directly in an index. |
Balanced funds may invest in stocks and bonds. Stock values fluctuate in response to the activities of individual companies and general market and economic conditions. Bond values fluctuate in response to the financial condition of individual issuers, general market and economic conditions, and changes in interest rates. Changes in market conditions and government policies may lead to periods of heightened volatility in the bond market and reduced liquidity for certain bonds held by the Fund. In general, when interest rates rise, bond values fall and investors may lose principal value. Interest rate changes and their impact on the Fund and its share price can be sudden and unpredictable. The use of derivatives may reduce returns and/or increase volatility. Consult the Fund’s prospectus for additional information on these and other risks.
Please refer to the prospectus provided by your participating insurance company for detailed information describing the separate accounts for information regarding surrender charges, mortality and expense risk fees, and other charges that may be assessed by the participating insurance companies.
| Mr. Acharya has announced his intention to retire from Allspring Global Investments, LLC on February 15, 2024 but will continue to serve as a portfolio manager of the Fund until that date. |
| Mr. Kowalske became a portfolio manager of the Fund effective January 16, 2024. |
CFA® and Chartered Financial Analyst® are trademarks owned by CFA Institute. |
8 | Allspring VT Index Asset Allocation Fund
Performance highlights (unaudited)
Growth of $10,000 investment as of December 31, 20231 |
| The chart compares the performance of Class 2 shares for the most recent ten years with the Index Asset Allocation Blended Index, Bloomberg U.S. Treasury Index and S&P 500 Index. The chart assumes a hypothetical investment of $10,000 in Class 2 shares and reflects all operating expenses of the Fund but does not reflect fees and expenses charged pursuant to the terms of variable life insurance policies and variable annuity contracts. |
Allspring VT Index Asset Allocation Fund | 9
Performance highlights (unaudited)
MANAGER’S DISCUSSION
Fund highlights
•The Fund underperformed its benchmark, the Index Asset Allocation Blended Index, for the 12-month period that ended December 31, 2023.
•The Fund’s tactical asset allocation overlay, which is implemented with liquid futures contracts, contributed to performance during the period.
•The Fund’s stock and bond allocations performed in line with their respective benchmarks, the S&P 500 Index and the Bloomberg U.S. Treasury Index.
Market review: Strong gains on rising optimism over rate cuts
Despite concerns about the adverse impact of higher rates, markets proceeded to climb higher as inflationary pressures eased while consumer spending and employment remained strong. The prospect of a soft landing—a seemingly unlikely scenario in early 2023—gathered steam as we entered the latter part of the year.
The last month of 2023 was particularly strong for global equities and bonds as central banks and macroeconomic data continued to signal that interest rate cuts may be on the way for 2024. Developed market equities outperformed emerging market equities. Crude oil prices fell despite some output cuts and ongoing geopolitical tensions in the Middle East.
Ten largest holdings (%) as of December 31, 20231 |
| |
| |
| |
| |
U.S. Treasury Notes, 1.38%, 10-31-2028 | |
U.S. Treasury Bonds, 6.88%, 8-15-2025 | |
U.S. Treasury Bonds, 6.00%, 2-15-2026 | |
| |
U.S. Treasury Notes, 1.38%, 11-15-2031 | |
Meta Platforms, Inc. Class A | |
| Figures represent the percentage of the Fund’s net assets. Holdings are subject to change and may have changed since the date specified. |
Strong equity gains in December were led by the S&P 500 Index and the Nasdaq 100 Index†, which rose by 4.5% and 5.2%, respectively, in December. During the 12-month period, global equity markets, as measured by the MSCI ACWI IMI*, gained 21.6% while broad-based bond markets, as measured by the Bloomberg Global Aggregate Bond Index**, rose by 5.7%. U.S. small-cap stocks lagged U.S. large-cap stocks, while international developed equities outperformed emerging market stocks.
Tactical asset allocation shifts contributed to performance during the 12-month period
The Fund’s stock holdings seek to replicate the holdings of the S&P 500 Index, while its bond holdings seek to replicate those of the Bloomberg U.S. Treasury Index. The Fund’s neutral target allocation is 60% stocks and 40% bonds. As of year-end, the Fund had an effective target allocation of 68% stocks, 46.4% bonds and -14.4% effective cash. During the period, the portfolio management team implemented tactical shifts between stocks and bonds, adjusting the Fund’s effective allocations based on the relative
attractiveness of the two asset classes.
Sector allocation as of December 31, 20231 |
| Figures represent the percentage of the Fund’s long-term investments. Allocations are subject to change and may have changed since the date specified. |
†
The Nasdaq 100 Index is an unmanaged group of the 100 biggest companies listed on the Nasdaq Composite Index. The list is updated quarterly, and companies on this index are typically representative of technology-related industries, such as computer hardware and software products, telecommunications, biotechnology, and retail/wholesale trade. You cannot invest directly in an index.
*
The Morgan Stanley Capital International (MSCI) All Country World Index (ACWI) Investable Market Index (IMI) captures large, mid and small cap representation across 23 Developed Markets and 24 Emerging Markets countries. With 9,084 constituents, the index is comprehensive, covering approximately 99% of the global equity investment opportunity set. You cannot invest directly in an index.
**
The Bloomberg Global Aggregate Bond Index is a measure of global investment-grade debt performance. This multicurrency benchmark includes Treasury, government-related, corporate, and securitized fixed-rate bonds from both developed and emerging market issuers. You cannot invest directly in an index.
10 | Allspring VT Index Asset Allocation Fund
Performance highlights (unaudited)
On average, the team maintained an overweight to both stocks and bonds in 2023, which benefited the strategy as equities and bonds rose amid a risk rally and sharp drop in yields during the final two months of the year. The tactical futures overlay positions implemented during the 12-month period contributed approximately 0.5% to the Fund’s performance.
Allocation (%) as of December 31, 2023 |
| | |
| | |
| | |
| | |
| Effective allocation reflects the effect of the tactical futures overlay that may be in place. Effective cash, if any, represents the net offset to such future positions. Effective allocations are subject to change and may have changed since the date specified. |
Outlook: Growth to weaken along with inflation
Monetary policy is likely to shift markedly this year. While the interest rate market is pricing broad rate cuts across the U.S., the U.K., Europe, and
emerging markets, central banks are likely to stay cautious for now. Given the experience over the past three years, a more gradual approach is likely. Data dependence is still important to central banks, and if the labor market stays strong, some caution is warranted. Growth outside of the U.S. is likely to continue to weaken while growth within the U.S. is only seeing a very gradual decline. Fourth quarter gross domestic product was likely softer than the third quarter, though the result comes from a strong base. Consumer demand is likely to be marginally supported by lower rates and looser financial conditions. The labor market, both in the U.S. and globally, remains robust. While nominal wages are likely to come down, real wages are expected to remain stable.
Inflation is expected to come further down. Core inflation has trended steadily lower while headline inflation will likely benefit from a continued drop in energy prices. Our inflation framework, which focuses on level (how high is inflation?), breadth (how widely dispersed is inflation?), and persistence (how sticky is inflation?), shows that all three indicators have receded. Prices of services and rents remain sticky for now, although they have slowly declined.
Allspring VT Index Asset Allocation Fund | 11
Fund expenses (unaudited)
Fund expenses
As a shareholder of the Fund, you incur ongoing costs, including management fees, distribution (12b-1) fees and other Fund expenses. This example is intended to help you understand your ongoing costs (in dollars) of investing in the Fund and to compare these costs with the ongoing costs of investing in other mutual funds.
The example is based on an investment of $1,000 invested at the beginning of the six-month period and held for the entire period from July 1, 2023 to December 31, 2023.
Actual expenses
The “Actual” line of the table below provides information about actual account values and actual expenses. You may use the information in this line, together with the amount you invested, to estimate the expenses that you paid over the period. Simply divide your account value by $1,000 (for example, an $8,600 account value divided by $1,000= 8.6), then multiply the result by the number in the “Actual” line under the heading entitled “Expenses paid during period” for your applicable class of shares to estimate the expenses you paid on your account during this period.
Hypothetical example for comparison purposes
The “Hypothetical” line of the table below provides information about hypothetical account values and hypothetical expenses based on the Fund’s actual expense ratio and an assumed rate of return of 5% per year before expenses, which is not the Fund’s actual return. The hypothetical account values and expenses may not be used to estimate the actual ending account balance or expenses you paid for the period. You may use this information to compare the ongoing costs of investing in the Fund and other funds. To do so, compare this 5% hypothetical example with the 5% hypothetical examples that appear in the shareholder reports of the other funds.
Please note that the expenses shown in the table are meant to highlight your ongoing costs only and do not reflect any separate account charges assessed by participating insurance companies. Therefore, the “Hypothetical” line of the table is useful in comparing ongoing costs only, and will not help you determine the relative total costs of owning different funds. In addition, if these separate account charges assessed by participating insurance companies were included, your costs would have been higher.
| Beginning
account value
7-1-2023 | Ending
account value
12-31-2023 | Expenses
paid during
paid during
| Annualized net
expense ratio |
| | | | |
Hypothetical (5% return before expenses) | | | | |
| Expenses paid is equal to the annualized net expense ratio multiplied by the average account value over the period, multiplied by 183 divided by 365 (to reflect the one-half-year period). |
12 | Allspring VT Index Asset Allocation Fund
Portfolio of investments—December 31, 2023
| | | | | |
| | | | | | |
Communication services: 5.10% | | | | | | |
Diversified telecommunication services: 0.41% | | | | | | |
| | | | | | |
Verizon Communications, Inc. | | | | | | |
| | | | | | |
| | | | | | |
| | | | | | |
Live Nation Entertainment, Inc.† | | | | | | |
| | | | | | |
Take-Two Interactive Software, Inc.† | | | | | | |
| | | | | | |
Warner Bros Discovery, Inc.† | | | | | | |
| | | | | | |
Interactive media & services: 3.45% | | | | | | |
| | | | | | |
| | | | | | |
| | | | | | |
Meta Platforms, Inc. Class A† | | | | | | |
| | | | | | |
| | | | | | |
Charter Communications, Inc. Class A† | | | | | | |
| | | | | | |
| | | | | | |
| | | | | | |
Interpublic Group of Cos., Inc. | | | | | | |
| | | | | | |
| | | | | | |
| | | | | | |
| | | | | | |
| | | | | | |
Wireless telecommunication services: 0.12% | | | | | | |
| | | | | | |
Consumer discretionary: 6.45% | | | | | | |
Automobile components: 0.05% | | | | | | |
| | | | | | |
| | | | | | |
| | | | | | |
| | | | | | |
| | | | | | |
| | | | | | |
| | | | | | |
| | | | | | |
The accompanying notes are an integral part of these financial statements.
Allspring VT Index Asset Allocation Fund | 13
Portfolio of investments—December 31, 2023
| | | | | |
| | | | | | |
| | | | | | |
| | | | | | |
| | | | | | |
| | | | | | |
| | | | | | |
| | | | | | |
| | | | | | |
| | | | | | |
| | | | | | |
Hotels, restaurants & leisure: 1.29% | | | | | | |
| | | | | | |
| | | | | | |
Caesars Entertainment, Inc.† | | | | | | |
| | | | | | |
Chipotle Mexican Grill, Inc.† | | | | | | |
| | | | | | |
| | | | | | |
| | | | | | |
Hilton Worldwide Holdings, Inc. | | | | | | |
| | | | | | |
Marriott International, Inc. Class A | | | | | | |
| | | | | | |
MGM Resorts International† | | | | | | |
Norwegian Cruise Line Holdings Ltd.† | | | | | | |
Royal Caribbean Cruises Ltd.† | | | | | | |
| | | | | | |
| | | | | | |
| | | | | | |
| | | | | | |
Household durables: 0.24% | | | | | | |
| | | | | | |
| | | | | | |
| | | | | | |
| | | | | | |
| | | | | | |
| | | | | | |
| | | | | | |
| | | | | | |
| | | | | | |
| | | | | | |
| | | | | | |
| | | | | | |
| | | | | | |
| | | | | | |
The accompanying notes are an integral part of these financial statements.
14 | Allspring VT Index Asset Allocation Fund
Portfolio of investments—December 31, 2023
| | | | | |
Specialty retail(continued) | | | | | | |
| | | | | | |
| | | | | | |
| | | | | | |
O’Reilly Automotive, Inc.† | | | | | | |
| | | | | | |
| | | | | | |
| | | | | | |
| | | | | | |
| | | | | | |
Textiles, apparel & luxury goods: 0.32% | | | | | | |
lululemon athletica, Inc.† | | | | | | |
| | | | | | |
| | | | | | |
| | | | | | |
| | | | | | |
| | | | | | |
| | | | | | |
| | | | | | |
Brown-Forman Corp. Class B | | | | | | |
| | | | | | |
Constellation Brands, Inc. Class A | | | | | | |
| | | | | | |
Molson Coors Beverage Co. Class B | | | | | | |
| | | | | | |
| | | | | | |
| | | | | | |
Consumer staples distribution & retail: 1.08% | | | | | | |
| | | | | | |
| | | | | | |
| | | | | | |
| | | | | | |
| | | | | | |
| | | | | | |
Walgreens Boots Alliance, Inc. | | | | | | |
| | | | | | |
| | | | | | |
| | | | | | |
Archer-Daniels-Midland Co. | | | | | | |
| | | | | | |
| | | | | | |
| | | | | | |
| | | | | | |
| | | | | | |
| | | | | | |
| | | | | | |
The accompanying notes are an integral part of these financial statements.
Allspring VT Index Asset Allocation Fund | 15
Portfolio of investments—December 31, 2023
| | | | | |
| | | | | | |
| | | | | | |
| | | | | | |
Lamb Weston Holdings, Inc. | | | | | | |
| | | | | | |
Mondelez International, Inc. Class A | | | | | | |
Tyson Foods, Inc. Class A | | | | | | |
| | | | | | |
Household products: 0.73% | | | | | | |
Church & Dwight Co., Inc. | | | | | | |
| | | | | | |
| | | | | | |
| | | | | | |
| | | | | | |
| | | | | | |
Personal care products: 0.11% | | | | | | |
Estee Lauder Cos., Inc. Class A | | | | | | |
| | | | | | |
| | | | | | |
| | | | | | |
| | | | | | |
Philip Morris International, Inc. | | | | | | |
| | | | | | |
| | | | | | |
Energy equipment & services: 0.21% | | | | | | |
| | | | | | |
| | | | | | |
| | | | | | |
| | | | | | |
Oil, gas & consumable fuels: 2.10% | | | | | | |
| | | | | | |
| | | | | | |
| | | | | | |
| | | | | | |
| | | | | | |
| | | | | | |
| | | | | | |
| | | | | | |
| | | | | | |
| | | | | | |
| | | | | | |
| | | | | | |
| | | | | | |
Occidental Petroleum Corp. | | | | | | |
| | | | | | |
The accompanying notes are an integral part of these financial statements.
16 | Allspring VT Index Asset Allocation Fund
Portfolio of investments—December 31, 2023
| | | | | |
Oil, gas & consumable fuels(continued) | | | | | | |
| | | | | | |
Pioneer Natural Resources Co. | | | | | | |
| | | | | | |
| | | | | | |
| | | | | | |
| | | | | | |
| | | | | | |
| | | | | | |
| | | | | | |
| | | | | | |
Citizens Financial Group, Inc. | | | | | | |
| | | | | | |
| | | | | | |
Huntington Bancshares, Inc. | | | | | | |
| | | | | | |
| | | | | | |
| | | | | | |
PNC Financial Services Group, Inc. | | | | | | |
| | | | | | |
| | | | | | |
| | | | | | |
| | | | | | |
| | | | | | |
| | | | | | |
| | | | | | |
Ameriprise Financial, Inc. | | | | | | |
Bank of New York Mellon Corp. | | | | | | |
| | | | | | |
| | | | | | |
Cboe Global Markets, Inc. | | | | | | |
| | | | | | |
| | | | | | |
FactSet Research Systems, Inc. | | | | | | |
| | | | | | |
Goldman Sachs Group, Inc. | | | | | | |
Intercontinental Exchange, Inc. | | | | | | |
| | | | | | |
MarketAxess Holdings, Inc. | | | | | | |
| | | | | | |
| | | | | | |
| | | | | | |
| | | | | | |
| | | | | | |
Raymond James Financial, Inc. | | | | | | |
| | | | | | |
The accompanying notes are an integral part of these financial statements.
Allspring VT Index Asset Allocation Fund | 17
Portfolio of investments—December 31, 2023
| | | | | |
Capital markets(continued) | | | | | | |
| | | | | | |
| | | | | | |
| | | | | | |
| | | | | | |
| | | | | | |
Capital One Financial Corp. | | | | | | |
Discover Financial Services | | | | | | |
| | | | | | |
| | | | | | |
Financial services: 2.47% | | | | | | |
Berkshire Hathaway, Inc. Class B† | | | | | | |
Fidelity National Information Services, Inc. | | | | | | |
| | | | | | |
FleetCor Technologies, Inc.† | | | | | | |
| | | | | | |
Jack Henry & Associates, Inc. | | | | | | |
| | | | | | |
| | | | | | |
| | | | | | |
| | | | | | |
| | | | | | |
| | | | | | |
| | | | | | |
American International Group, Inc. | | | | | | |
| | | | | | |
| | | | | | |
| | | | | | |
| | | | | | |
| | | | | | |
| | | | | | |
Cincinnati Financial Corp. | | | | | | |
| | | | | | |
| | | | | | |
Hartford Financial Services Group, Inc. | | | | | | |
| | | | | | |
Marsh & McLennan Cos., Inc. | | | | | | |
| | | | | | |
Principal Financial Group, Inc. | | | | | | |
| | | | | | |
Prudential Financial, Inc. | | | | | | |
| | | | | | |
| | | | | | |
| | | | | | |
| | | | | | |
The accompanying notes are an integral part of these financial statements.
18 | Allspring VT Index Asset Allocation Fund
Portfolio of investments—December 31, 2023
| | | | | |
| | | | | | |
| | | | | | |
| | | | | | |
| | | | | | |
| | | | | | |
| | | | | | |
| | | | | | |
| | | | | | |
Regeneron Pharmaceuticals, Inc.† | | | | | | |
Vertex Pharmaceuticals, Inc.† | | | | | | |
| | | | | | |
Health care equipment & supplies: 1.53% | | | | | | |
| | | | | | |
| | | | | | |
Baxter International, Inc. | | | | | | |
| | | | | | |
| | | | | | |
| | | | | | |
| | | | | | |
| | | | | | |
Edwards Lifesciences Corp.† | | | | | | |
GE HealthCare Technologies, Inc. | | | | | | |
| | | | | | |
IDEXX Laboratories, Inc.† | | | | | | |
| | | | | | |
Intuitive Surgical, Inc.† | | | | | | |
| | | | | | |
| | | | | | |
| | | | | | |
| | | | | | |
| | | | | | |
Zimmer Biomet Holdings, Inc. | | | | | | |
| | | | | | |
Health care providers & services: 1.69% | | | | | | |
| | | | | | |
| | | | | | |
| | | | | | |
| | | | | | |
| | | | | | |
| | | | | | |
| | | | | | |
| | | | | | |
| | | | | | |
| | | | | | |
Laboratory Corp. of America Holdings | | | | | | |
| | | | | | |
| | | | | | |
| | | | | | |
The accompanying notes are an integral part of these financial statements.
Allspring VT Index Asset Allocation Fund | 19
Portfolio of investments—December 31, 2023
| | | | | |
Health care providers & services(continued) | | | | | | |
| | | | | | |
Universal Health Services, Inc. Class B | | | | | | |
| | | | | | |
Life sciences tools & services: 0.86% | | | | | | |
Agilent Technologies, Inc. | | | | | | |
Bio-Rad Laboratories, Inc. Class A† | | | | | | |
| | | | | | |
Charles River Laboratories International, Inc.† | | | | | | |
| | | | | | |
| | | | | | |
| | | | | | |
Mettler-Toledo International, Inc.† | | | | | | |
| | | | | | |
Thermo Fisher Scientific, Inc. | | | | | | |
| | | | | | |
West Pharmaceutical Services, Inc. | | | | | | |
| | | | | | |
| | | | | | |
| | | | | | |
| | | | | | |
| | | | | | |
| | | | | | |
| | | | | | |
| | | | | | |
| | | | | | |
| | | | | | |
| | | | | | |
| | | | | | |
Aerospace & defense: 0.97% | | | | | | |
| | | | | | |
| | | | | | |
| | | | | | |
| | | | | | |
Huntington Ingalls Industries, Inc. | | | | | | |
L3Harris Technologies, Inc. | | | | | | |
| | | | | | |
| | | | | | |
| | | | | | |
| | | | | | |
| | | | | | |
| | | | | | |
Air freight & logistics: 0.30% | | | | | | |
CH Robinson Worldwide, Inc. | | | | | | |
Expeditors International of Washington, Inc. | | | | | | |
The accompanying notes are an integral part of these financial statements.
20 | Allspring VT Index Asset Allocation Fund
Portfolio of investments—December 31, 2023
| | | | | |
Air freight & logistics(continued) | | | | | | |
| | | | | | |
United Parcel Service, Inc. Class B | | | | | | |
| | | | | | |
| | | | | | |
| | | | | | |
| | | | | | |
Builders FirstSource, Inc.† | | | | | | |
| | | | | | |
Johnson Controls International PLC | | | | | | |
| | | | | | |
| | | | | | |
| | | | | | |
Commercial services & supplies: 0.33% | | | | | | |
| | | | | | |
| | | | | | |
| | | | | | |
| | | | | | |
| | | | | | |
| | | | | | |
| | | | | | |
Construction & engineering: 0.04% | | | | | | |
| | | | | | |
Electrical equipment: 0.37% | | | | | | |
| | | | | | |
| | | | | | |
| | | | | | |
| | | | | | |
| | | | | | |
Rockwell Automation, Inc. | | | | | | |
| | | | | | |
Ground transportation: 0.67% | | | | | | |
| | | | | | |
J.B. Hunt Transport Services, Inc. | | | | | | |
| | | | | | |
Old Dominion Freight Line, Inc. | | | | | | |
| | | | | | |
| | | | | | |
| | | | | | |
Industrial conglomerates: 0.50% | | | | | | |
| | | | | | |
| | | | | | |
Honeywell International, Inc. | | | | | | |
| | | | | | |
The accompanying notes are an integral part of these financial statements.
Allspring VT Index Asset Allocation Fund | 21
Portfolio of investments—December 31, 2023
| | | | | |
| | | | | | |
| | | | | | |
| | | | | | |
| | | | | | |
| | | | | | |
| | | | | | |
| | | | | | |
Illinois Tool Works, Inc. | | | | | | |
| | | | | | |
| | | | | | |
| | | | | | |
| | | | | | |
| | | | | | |
| | | | | | |
| | | | | | |
Stanley Black & Decker, Inc. | | | | | | |
Westinghouse Air Brake Technologies Corp. | | | | | | |
| | | | | | |
| | | | | | |
Passenger airlines: 0.10% | | | | | | |
American Airlines Group, Inc.† | | | | | | |
| | | | | | |
| | | | | | |
United Airlines Holdings, Inc.† | | | | | | |
| | | | | | |
Professional services: 0.42% | | | | | | |
Automatic Data Processing, Inc. | | | | | | |
Broadridge Financial Solutions, Inc. | | | | | | |
Ceridian HCM Holding, Inc.† | | | | | | |
| | | | | | |
| | | | | | |
| | | | | | |
| | | | | | |
| | | | | | |
| | | | | | |
| | | | | | |
| | | | | | |
Trading companies & distributors: 0.17% | | | | | | |
| | | | | | |
| | | | | | |
| | | | | | |
| | | | | | |
Information technology: 17.15% | | | | | | |
Communications equipment: 0.50% | | | | | | |
| | | | | | |
| | | | | | |
The accompanying notes are an integral part of these financial statements.
22 | Allspring VT Index Asset Allocation Fund
Portfolio of investments—December 31, 2023
| | | | | |
Communications equipment(continued) | | | | | | |
| | | | | | |
| | | | | | |
| | | | | | |
| | | | | | |
Electronic equipment, instruments & components: 0.37% | | | | | | |
| | | | | | |
| | | | | | |
| | | | | | |
| | | | | | |
Keysight Technologies, Inc.† | | | | | | |
| | | | | | |
Teledyne Technologies, Inc.† | | | | | | |
| | | | | | |
Zebra Technologies Corp. Class A† | | | | | | |
| | | | | | |
| | | | | | |
| | | | | | |
Akamai Technologies, Inc.† | | | | | | |
Cognizant Technology Solutions Corp. Class A | | | | | | |
| | | | | | |
| | | | | | |
International Business Machines Corp. | | | | | | |
| | | | | | |
| | | | | | |
Semiconductors & semiconductor equipment: 4.81% | | | | | | |
Advanced Micro Devices, Inc.† | | | | | | |
| | | | | | |
| | | | | | |
| | | | | | |
| | | | | | |
| | | | | | |
| | | | | | |
| | | | | | |
| | | | | | |
Microchip Technology, Inc. | | | | | | |
| | | | | | |
Monolithic Power Systems, Inc. | | | | | | |
| | | | | | |
| | | | | | |
| | | | | | |
| | | | | | |
| | | | | | |
| | | | | | |
| | | | | | |
| | | | | | |
| | | | | | |
The accompanying notes are an integral part of these financial statements.
Allspring VT Index Asset Allocation Fund | 23
Portfolio of investments—December 31, 2023
| | | | | |
| | | | | | |
| | | | | | |
| | | | | | |
| | | | | | |
Cadence Design Systems, Inc.† | | | | | | |
| | | | | | |
| | | | | | |
| | | | | | |
| | | | | | |
| | | | | | |
| | | | | | |
Palo Alto Networks, Inc.† | | | | | | |
| | | | | | |
| | | | | | |
| | | | | | |
| | | | | | |
| | | | | | |
Tyler Technologies, Inc.† | | | | | | |
| | | | | | |
Technology hardware, storage & peripherals: 4.33% | | | | | | |
| | | | | | |
Hewlett Packard Enterprise Co. | | | | | | |
| | | | | | |
| | | | | | |
Seagate Technology Holdings PLC | | | | | | |
| | | | | | |
| | | | | | |
| | | | | | |
| | | | | | |
Air Products & Chemicals, Inc. | | | | | | |
| | | | | | |
| | | | | | |
CF Industries Holdings, Inc. | | | | | | |
| | | | | | |
| | | | | | |
| | | | | | |
| | | | | | |
| | | | | | |
| | | | | | |
International Flavors & Fragrances, Inc. | | | | | | |
| | | | | | |
LyondellBasell Industries NV Class A | | | | | | |
| | | | | | |
| | | | | | |
| | | | | | |
| | | | | | |
The accompanying notes are an integral part of these financial statements.
24 | Allspring VT Index Asset Allocation Fund
Portfolio of investments—December 31, 2023
| | | | | |
Construction materials: 0.09% | | | | | | |
Martin Marietta Materials, Inc. | | | | | | |
| | | | | | |
| | | | | | |
Containers & packaging: 0.13% | | | | | | |
| | | | | | |
| | | | | | |
| | | | | | |
| | | | | | |
Packaging Corp. of America | | | | | | |
| | | | | | |
| | | | | | |
| | | | | | |
| | | | | | |
Newmont Corp.-U.S. Exchange Traded Shares | | | | | | |
| | | | | | |
| | | | | | |
| | | | | | |
| | | | | | |
| | | | | | |
Healthpeak Properties, Inc. | | | | | | |
| | | | | | |
| | | | | | |
| | | | | | |
Hotel & resort REITs: 0.02% | | | | | | |
Host Hotels & Resorts, Inc. | | | | | | |
| | | | | | |
| | | | | | |
| | | | | | |
Alexandria Real Estate Equities, Inc. | | | | | | |
| | | | | | |
| | | | | | |
Real estate management & development: 0.10% | | | | | | |
CBRE Group, Inc. Class A† | | | | | | |
| | | | | | |
| | | | | | |
Residential REITs : 0.18% | | | | | | |
AvalonBay Communities, Inc. | | | | | | |
| | | | | | |
| | | | | | |
Essex Property Trust, Inc. | | | | | | |
| | | | | | |
The accompanying notes are an integral part of these financial statements.
Allspring VT Index Asset Allocation Fund | 25
Portfolio of investments—December 31, 2023
| | | | | |
Residential REITs (continued) | | | | | | |
Mid-America Apartment Communities, Inc. | | | | | | |
| | | | | | |
| | | | | | |
| | | | | | |
Federal Realty Investment Trust | | | | | | |
| | | | | | |
| | | | | | |
| | | | | | |
Simon Property Group, Inc. | | | | | | |
| | | | | | |
Specialized REITs : 0.68% | | | | | | |
| | | | | | |
| | | | | | |
Digital Realty Trust, Inc. | | | | | | |
| | | | | | |
Extra Space Storage, Inc. | | | | | | |
| | | | | | |
| | | | | | |
| | | | | | |
| | | | | | |
| | | | | | |
| | | | | | |
| | | | | | |
Electric utilities: 0.92% | | | | | | |
| | | | | | |
American Electric Power Co., Inc. | | | | | | |
Constellation Energy Corp. | | | | | | |
| | | | | | |
| | | | | | |
| | | | | | |
| | | | | | |
| | | | | | |
| | | | | | |
| | | | | | |
| | | | | | |
| | | | | | |
| | | | | | |
Pinnacle West Capital Corp. | | | | | | |
| | | | | | |
| | | | | | |
| | | | | | |
| | | | | | |
| | | | | | |
| | | | | | |
The accompanying notes are an integral part of these financial statements.
26 | Allspring VT Index Asset Allocation Fund
Portfolio of investments—December 31, 2023
| | | | | |
Independent power and renewable electricity producers: 0.02% | | | | | | |
| | | | | | |
| | | | | | |
| | | | | | |
| | | | | | |
| | | | | | |
Consolidated Edison, Inc. | | | | | | |
| | | | | | |
| | | | | | |
| | | | | | |
Public Service Enterprise Group, Inc. | | | | | | |
| | | | | | |
| | | | | | |
| | | | | | |
| | | | | | |
American Water Works Co., Inc. | | | | | | |
Total common stocks (Cost $18,580,847) | | | | | | |
| | | | | |
U.S. Treasury securities: 34.71% | | | | | | |
| | | | | | |
| | | | | | |
| | | | | | |
| | | | | | |
| | | | | | |
| | | | | | |
| | | | | | |
| | | | | | |
| | | | | | |
| | | | | | |
| | | | | | |
| | | | | | |
| | | | | | |
| | | | | | |
| | | | | | |
| | | | | | |
| | | | | | |
| | | | | | |
| | | | | | |
| | | | | | |
| | | | | | |
| | | | | | |
| | | | | | |
| | | | | | |
| | | | | | |
| | | | | | |
The accompanying notes are an integral part of these financial statements.
Allspring VT Index Asset Allocation Fund | 27
Portfolio of investments—December 31, 2023
| | | | | |
U.S. Treasury securities(continued) | | | | | | |
| | | | | | |
| | | | | | |
| | | | | | |
| | | | | | |
| | | | | | |
| | | | | | |
| | | | | | |
| | | | | | |
| | | | | | |
| | | | | | |
| | | | | | |
| | | | | | |
| | | | | | |
| | | | | | |
| | | | | | |
| | | | | | |
| | | | | | |
| | | | | | |
| | | | | | |
| | | | | | |
| | | | | | |
| | | | | | |
| | | | | | |
| | | | | | |
| | | | | | |
| | | | | | |
| | | | | | |
| | | | | | |
| | | | | | |
| | | | | | |
| | | | | | |
| | | | | | |
| | | | | | |
| | | | | | |
| | | | | | |
| | | | | | |
| | | | | | |
| | | | | | |
| | | | | | |
| | | | | | |
| | | | | | |
| | | | | | |
| | | | | | |
| | | | | | |
| | | | | | |
| | | | | | |
| | | | | | |
| | | | | | |
The accompanying notes are an integral part of these financial statements.
28 | Allspring VT Index Asset Allocation Fund
Portfolio of investments—December 31, 2023
| | | | | |
U.S. Treasury securities(continued) | | | | | | |
| | | | | | |
| | | | | | |
| | | | | | |
| | | | | | |
| | | | | | |
| | | | | | |
| | | | | | |
| | | | | | |
| | | | | | |
| | | | | | |
| | | | | | |
| | | | | | |
| | | | | | |
| | | | | | |
| | | | | | |
| | | | | | |
| | | | | | |
| | | | | | |
| | | | | | |
| | | | | | |
| | | | | | |
| | | | | | |
| | | | | | |
| | | | | | |
| | | | | | |
| | | | | | |
| | | | | | |
| | | | | | |
| | | | | | |
| | | | | | |
| | | | | | |
| | | | | | |
| | | | | | |
| | | | | | |
| | | | | | |
| | | | | | |
| | | | | | |
| | | | | | |
| | | | | | |
| | | | | | |
| | | | | | |
| | | | | | |
| | | | | | |
| | | | | | |
| | | | | | |
| | | | | | |
| | | | | | |
| | | | | | |
The accompanying notes are an integral part of these financial statements.
Allspring VT Index Asset Allocation Fund | 29
Portfolio of investments—December 31, 2023
| | | | | |
U.S. Treasury securities(continued) | | | | | | |
| | | | | | |
| | | | | | |
| | | | | | |
| | | | | | |
| | | | | | |
| | | | | | |
| | | | | | |
| | | | | | |
| | | | | | |
| | | | | | |
| | | | | | |
| | | | | | |
| | | | | | |
| | | | | | |
| | | | | | |
| | | | | | |
| | | | | | |
Total U.S. Treasury securities (Cost $24,857,515) | | | | | | |
| | | | | |
Short-term investments: 4.31% | | | | | | |
Investment companies: 4.31% | | | | | | |
Allspring Government Money Market Fund Select Class♠∞ | | | | | | |
Total short-term investments (Cost $2,872,731) | | | | | | |
Total investments in securities (Cost $46,311,093) | | | | | | |
Other assets and liabilities, net | | | | | | |
| | | | | | |
| Non-income-earning security |
| The issuer of the security is an affiliated person of the Fund as defined in the Investment Company Act of 1940. |
| The rate represents the 7-day annualized yield at period end. |
|
| Real estate investment trust |
Investments in affiliates
An affiliated investment is an investment in which the Fund owns at least 5% of the outstanding voting shares of the issuer or as a result of other relationships, such as the Fund and the issuer having the same investment manager. Transactions with issuers that were affiliates of the Fund at the end of the period were as follows:
| | | | | Net
change in
unrealized
gains
(losses) | | | Income
from
affiliated
securities |
| | | | | | | | |
Allspring Government Money Market Fund Select Class | | | | | | | | |
The accompanying notes are an integral part of these financial statements.
30 | Allspring VT Index Asset Allocation Fund
Portfolio of investments—December 31, 2023
| | | | | | |
| | | | | | |
| | | | | | |
| | | | | | |
10-Year U.S. Treasury Notes | | | | | | |
| | | | | | |
Ultra Long Term U.S. Treasury Bond | | | | | | |
2-Year U.S. Treasury Notes | | | | | | |
5-Year U.S. Treasury Notes | | | | | | |
| | | | | | |
The accompanying notes are an integral part of these financial statements.
Allspring VT Index Asset Allocation Fund | 31
Statement of assets and liabilities—December 31, 2023
Financial statements
Statement of assets and liabilities
| |
Investments in unaffiliated securities, at value (cost $43,438,362) | |
Investments in affiliated securities, at value (cost $2,872,731) | |
| |
Cash at broker segregated for futures contracts | |
Receivable for investments sold | |
Receivable for dividends and interest | |
Receivable for daily variation margin on open futures contracts | |
Receivable for Fund shares sold | |
Prepaid expenses and other assets | |
| |
| |
Payable for Fund shares redeemed | |
| |
Payable for daily variation margin on open futures contracts | |
| |
Custody and accounting fees payable | |
Administration fee payable | |
Payable for investments purchased | |
Trustees’ fees and expenses payable | |
Accrued expenses and other liabilities | |
| |
| |
| |
| |
Total distributable earnings | |
| |
Computation of net asset value per share | |
| |
Shares outstanding - Class 21 | |
Net asset value per share - Class 2 | |
1 The Fund has an unlimited number of authorized shares.
The accompanying notes are an integral part of these financial statements.
32 | Allspring VT Index Asset Allocation Fund
Statement of operations—year ended December 31, 2023
Statement of operations
| |
Dividends (net of foreign withholdings taxes of $174) | |
| |
Income from affiliated securities | |
| |
| |
| |
Administration fee - Class 2 | |
Distribution fee - Class 2 | |
Custody and accounting fees | |
| |
Shareholder report expenses | |
Trustees’ fees and expenses | |
| |
| |
Less: Fee waivers and/or expense reimbursements | |
| |
| |
| |
Realized and unrealized gains (losses) on investments | |
Net realized gains (losses) on | |
| |
| |
Net realized gains on investments | |
Net change in unrealized gains (losses) on | |
| |
| |
Net change in unrealized gains (losses) on investments | |
Net realized and unrealized gains (losses) on investments | |
Net increase in net assets resulting from operations | |
The accompanying notes are an integral part of these financial statements.
Allspring VT Index Asset Allocation Fund | 33
Statement of changes in net assets
Statement of changes in net assets
| Year ended December 31, 2023 | Year ended December 31, 2022 |
| | | | |
| | | | |
Net realized gains on investments | | | | |
Net change in unrealized gains (losses) on investments | | | | |
Net increase (decrease) in net assets resulting from operations | | | | |
Distributions to shareholders from | | | | |
Net investment income and net realized gains - Class 2 | | | | |
Capital share transactions | | | | |
Proceeds from shares sold - Class 2 | | | | |
Reinvestment of distributions - Class 2 | | | | |
Payment for shares redeemed - Class 2 | | | | |
Net increase (decrease) in net assets resulting from capital share transactions | | | | |
Total increase (decrease) in net assets | | | | |
| | | | |
| | | | |
| | | | |
The accompanying notes are an integral part of these financial statements.
34 | Allspring VT Index Asset Allocation Fund
Financial highlights
(For a share outstanding throughout each period)
| |
| | | | | |
Net asset value, beginning of period | | | | | |
| | | | | |
Net realized and unrealized gains (losses) on investments | | | | | |
Total from investment operations | | | | | |
Distributions to shareholders from | | | | | |
| | | | | |
| | | | | |
Total distributions to shareholders | | | | | |
Net asset value, end of period | | | | | |
| | | | | |
Ratios to average net assets (annualized) | | | | | |
| | | | | |
| | | | | |
| | | | | |
| | | | | |
| | | | | |
Net assets, end of period (000s omitted) | | | | | |
| Calculated based upon average shares outstanding |
| Returns do not reflect fees and expenses charged pursuant to the terms of variable life insurance policies and variable annuity contracts. |
The accompanying notes are an integral part of these financial statements.
Allspring VT Index Asset Allocation Fund | 35
Notes to financial statements
Notes to financial statements
Allspring Variable Trust (the “Trust”), a Delaware statutory trust organized on March 10, 1999, is an open-end management investment company registered under the Investment Company Act of 1940, as amended (the “1940 Act”). As an investment company, the Trust follows the accounting and reporting guidance in Financial Accounting Standards Board (“FASB”) Accounting Standards Codification Topic 946, Financial Services – Investment Companies. These financial statements report on the Allspring VT Index Asset Allocation Fund (the “Fund”) which is a diversified series of the Trust. The Trust offers shares of the Fund to separate accounts of various life insurance companies as funding vehicles for certain variable annuity contracts and variable life insurance policies.
2.
SIGNIFICANT ACCOUNTING POLICIES
The following significant accounting policies, which are consistently followed in the preparation of the financial statements of the Fund, are in conformity with U.S. generally accepted accounting principles which require management to make estimates and assumptions that affect the reported amounts of assets and liabilities, disclosure of contingent assets and liabilities at the date of the financial statements, and the reported amounts of income and expenses during the reporting period. Actual results could differ from those estimates.
Securities valuation
All investments are valued each business day as of the close of regular trading on the New York Stock Exchange (generally 4 p.m. Eastern Time), although the Fund may deviate from this calculation time under unusual or unexpected circumstances.
Equity securities, exchange-traded funds and futures contracts that are listed on a foreign or domestic exchange or market are valued at the official closing price or, if none, the last sales price.
Debt securities are valued at the evaluated bid price provided by an independent pricing service (e.g. taking into account various factors, including yields, maturities, or credit ratings) or, if a reliable price is not available, the quoted bid price from an independent broker-dealer.
Investments in registered open-end investment companies (other than those listed on a foreign or domestic exchange or market) are valued at net asset value.
Investments which are not valued using the methods discussed above are valued at their fair value, as determined in good faith by Allspring Funds Management, LLC (“Allspring Funds Management”), which was named the valuation designee by the Board of Trustees. As the valuation designee, Allspring Funds Management is responsible for day-to-day valuation activities for the Allspring Funds. In connection with these responsibilities, Allspring Funds Management has established a Valuation Committee and has delegated to it the authority to take any actions regarding the valuation of portfolio securities that the Valuation Committee deems necessary or appropriate, including determining the fair value of portfolio securities. On a quarterly basis, the Board of Trustees receives reports of valuation actions taken by the Valuation Committee. On at least an annual basis, the Board of Trustees receives an assessment of the adequacy and effectiveness of Allspring Funds Management’s process for determining the fair value of the portfolio of investments.
Futures contracts
Futures contracts are agreements between the Fund and a counterparty to buy or sell a specific amount of a commodity, financial instrument or currency at a specified price and on a specified date. The Fund may buy and sell futures contracts in order to gain exposure to, or protect against, changes in interest rates and security values and is subject to interest rate risk and equity price risk. The primary risks associated with the use of futures contracts are the imperfect correlation between changes in market values of securities held by the Fund and the prices of futures contracts, and the possibility of an illiquid market. Futures contracts are generally entered into on a regulated futures exchange and cleared through a clearinghouse associated with the exchange. With futures contracts, there is minimal counterparty risk to the Fund since futures contracts are exchange-traded and the exchange’s clearinghouse, as the counterparty to all exchange-traded futures, guarantees the futures contracts against default.
Upon entering into a futures contracts, the Fund is required to deposit either cash or securities (initial margin) with the broker in an amount equal to a certain percentage of the contract value. Subsequent payments (variation margin) are paid to or received from the broker each day equal to the daily changes in the contract value. Such payments are recorded as unrealized gains or losses and, if any, shown as variation margin receivable (payable) in the Statement of Assets and Liabilities. Should the Fund fail to make requested variation margin payments, the broker can gain access to the initial margin to satisfy the Fund’s payment obligations. When the contracts are closed, a realized gain or loss is recorded in the Statement of Operations.
Security transactions and income recognition
Securities transactions are recorded on a trade date basis. Realized gains or losses are recorded on the basis of identified cost.
Dividend income is recognized on the ex-dividend date.
Interest income is accrued daily and bond discounts are accreted and premiums are amortized daily. To the extent debt obligations are placed on non-accrual status, any related interest income may be reduced by writing off interest receivables when the collection of all or a portion of interest has been determined to be doubtful based on consistently applied procedures and the fair value has decreased. If the issuer subsequently resumes interest payments or when the collectability of interest is reasonably assured, the debt obligation is removed from non-accrual status.
36 | Allspring VT Index Asset Allocation Fund
Notes to financial statements
Interest earned on cash balances held at the custodian is recorded as interest income.
Income is recorded net of foreign taxes withheld where recovery of such taxes is not assured.
Distributions received from REIT investments may be characterized as ordinary income, capital gains, or a return of capital to the Fund based on information provided by the REIT. The proper characterization of REIT distributions is generally not known until after the end of each calendar year. As such, estimates may be used in reporting the character of income and distributions for financial statement purposes.
Distributions to shareholders
Distributions to shareholders are recorded on the ex-dividend date and paid from net investment income quarterly and any net realized gains are paid at least annually. Such distributions are determined in accordance with income tax regulations and may differ from U.S. generally accepted accounting principles. Dividend sources are estimated at the time of declaration. The tax character of distributions is determined as of the Fund’s fiscal year end. Therefore, a portion of the Fund’s distributions made prior to the Fund’s fiscal year end may be categorized as a tax return of capital at year end.
Federal and other taxes
The Fund intends to continue to qualify as a regulated investment company by distributing substantially all of its investment company taxable income and any net realized capital gains (after reduction for capital loss carryforwards) sufficient to relieve it from all, or substantially all, federal income taxes. Accordingly, no provision for federal income taxes was required.
The Fund’s income and federal excise tax returns and all financial records supporting those returns for the prior three fiscal years are subject to examination by the federal and Delaware revenue authorities. Management has analyzed the Fund’s tax positions taken on federal, state, and foreign tax returns, as applicable, for all open tax years and does not believe that there are any uncertain tax positions that require recognition of a tax liability.
As of December 31, 2023, the aggregate cost of all investments for federal income tax purposes was $48,183,324 and the unrealized gains (losses) consisted of:
3.
FAIR VALUATION MEASUREMENTS
Fair value measurements of investments are determined within a framework that has established a fair value hierarchy based upon the various data inputs utilized in determining the value of the Fund’s investments. The three-level hierarchy gives the highest priority to unadjusted quoted prices in active markets for identical assets or liabilities (Level 1) and the lowest priority to unobservable inputs (Level 3). The Fund’s investments are classified within the fair value hierarchy based on the lowest level of input that is significant to the fair value measurement. The inputs are summarized into three broad levels as follows:
•Level 1—quoted prices in active markets for identical securities
•Level 2—other significant observable inputs (including quoted prices for similar securities, interest rates, prepayment speeds, credit risk, etc.)
•Level 3—significant unobservable inputs (including the Fund’s own assumptions in determining the fair value of investments)
The inputs or methodologies used for valuing investments in securities are not necessarily an indication of the risk associated with investing in those securities.
Allspring VT Index Asset Allocation Fund | 37
Notes to financial statements
The following is a summary of the inputs used in valuing the Fund’s assets and liabilities as of December 31, 2023:
| | Other significant
observable inputs
(Level 2) | Significant
unobservable inputs
(Level 3) | |
| | | | |
| | | | |
| | | | |
| | | | |
| | | | |
| | | | |
| | | | |
| | | | |
| | | | |
| | | | |
| | | | |
| | | | |
| | | | |
| | | | |
| | | | |
| | | | |
| | | | |
| | | | |
| | | | |
| | | | |
Futures contracts are reported at their cumulative unrealized gains (losses) at measurement date as reported in the table following the Portfolio of Investments. For futures contracts, the current day’s variation margin is reported on the Statement of Assets and Liabilities. All other assets and liabilities are reported at their market value at measurement date.
Additional sector, industry or geographic detail, if any, is included in the Portfolio of Investments.
At December 31, 2023, the Fund did not have any transfers into/out of Level 3.
4.
TRANSACTIONS WITH AFFILIATES
Management fee
Allspring Funds Management, a wholly owned subsidiary of Allspring Global Investments Holdings, LLC, a holding company indirectly owned by certain private funds of GTCR LLC and Reverence Capital Partners, L.P., is the manager of the Fund and provides advisory and fund-level administrative services under an investment management agreement. Under the investment management agreement, Allspring Funds Management is responsible for, among other services, implementing the investment objectives and strategies of the Fund, supervising the subadviser and providing fund-level administrative services in connection with the Fund’s operations. As compensation for its services under the investment management agreement, Allspring Funds Management is entitled to receive a management fee at the following annual rate based on the Fund’s average daily net assets:
For the year ended December 31, 2023, the management fee was equivalent to an annual rate of 0.60% of the Fund’s average daily net assets.
Allspring Funds Management has retained the services of a subadviser to provide daily portfolio management to the Fund. The fee for subadvisory services is borne by Allspring Funds Management. Allspring Global Investments, LLC, an affiliate of Allspring Funds Management and a wholly owned subsidiary of Allspring Global Investments Holdings, LLC, is the subadviser to the Fund and is entitled to receive a fee from Allspring Funds Management at an annual rate starting at 0.15% and declining to 0.10% as the average daily net assets of the Fund increase.
38 | Allspring VT Index Asset Allocation Fund
Notes to financial statements
Administration fee
Under a class-level administration agreement, Allspring Funds Management provides class-level administrative services to the Fund, which includes paying fees and expenses for services provided by the transfer agent, sub-transfer agents, omnibus account servicers and record-keepers. As compensation for its services under the class-level administration agreement, Allspring Funds Management receives an annual fee of 0.08% which is calculated based on the average daily net assets of Class 2 shares.
Waivers and/or expense reimbursements
Allspring Funds Management has contractually committed through April 30, 2024 to waive fees and/or reimburse management and administration fees to the extent necessary to cap the Fund’s expenses at 1.00% for Class 2 shares. Prior to or after the commitment expiration date, the cap may be increased or the commitment to maintain the cap may be terminated only with the approval of the Board of Trustees.
Distribution fee
The Trust has adopted a distribution plan for Class 2 shares pursuant to Rule 12b-1 under the 1940 Act. A distribution fee is charged to Class 2 shares and paid to Allspring Funds Distributor, LLC, the principal underwriter, an affiliate of Allspring Funds Management, at an annual rate up to 0.25% of the average daily net assets of Class 2 shares.
Interfund transactions
The Fund may purchase or sell portfolio investment securities to certain affiliates pursuant to Rule 17a-7 under the 1940 Act and under procedures adopted by the Board of Trustees. The procedures have been designed to ensure that these interfund transactions, which do not incur broker commissions, are effected at current market prices. Pursuant to these procedures, the Fund did not have any interfund transactions during the year ended December 31, 2023.
5.
INVESTMENT PORTFOLIO TRANSACTIONS
Purchases and sales of investments, excluding short-term securities, for the year ended December 31, 2023 were as follows:
6.
DERIVATIVE TRANSACTIONS
During the year ended December 31, 2023, the Fund entered into futures contracts to manage market exposure to certain asset classes consistent with an active asset allocation strategy. The Fund had an average notional amount of $7,028,831 in long futures contracts and $1,185,125 in short futures contracts during the year ended December 31, 2023.
The fair value of derivative instruments as of December 31, 2023 by primary risk type was as follows for the Fund:
| Amount represents the cumulative unrealized gains (losses) as reported in the table following the Portfolio of Investments. For futures contracts, only the current day’s variation margin as of December 31, 2023 is reported separately on the Statement of Assets and Liabilities. |
The effect of derivative instruments on the Statement of Operations for the year ended December 31, 2023 was as follows:
| | | |
Net realized gains (losses) on derivatives |
| | | |
Net change in unrealized gains (losses) on derivatives |
| | | |
The Trust, Allspring Master Trust and Allspring Funds Trust (excluding the money market funds) are parties to a $350,000,000 revolving credit agreement whereby the Fund is permitted to use bank borrowings for temporary or emergency purposes, such as to fund shareholder redemption
Allspring VT Index Asset Allocation Fund | 39
Notes to financial statements
requests. Interest under the credit agreement is charged to the Fund based on borrowing rate equal to the higher of the Federal Funds rate or the overnight bank funding rate in effect on that day plus a spread. In addition, an annual commitment fee based on the unused balance is allocated to each participating fund.
For the year ended December 31, 2023, there were no borrowings by the Fund under the agreement.
8.
DISTRIBUTIONS TO SHAREHOLDERS
The tax character of distributions paid during the years ended December 31, 2023 and December 31, 2022 were as follows:
As of December 31, 2023, the components of distributable earnings on a tax basis were as follows:
Undistributed
ordinary
income | Undistributed
long-term
gain | |
| | |
As of the end of the period, the Fund concentrated its portfolio of investments in the information technology sector. A fund that invests a substantial portion of its assets in any sector may be more affected by changes in that sector than would be a fund whose investments are not heavily weighted in any sector.
10.INDEMNIFICATION
Under the Fund’s organizational documents, the officers and Trustees have been granted certain indemnification rights against certain liabilities that may arise out of performance of their duties to the Fund. The Fund has entered into a separate agreement with each Trustee that converts indemnification rights currently existing under the Fund’s organizational documents into contractual rights that cannot be changed in the future without the consent of the Trustee. Additionally, in the normal course of business, the Fund may enter into contracts with service providers that contain a variety of indemnification clauses. The Fund’s maximum exposure under these arrangements is dependent on future claims that may be made against the Fund and, therefore, cannot be estimated.
40 | Allspring VT Index Asset Allocation Fund
Report of independent registered public accounting firm
To the Shareholders of the Fund and Board of Trustees
Allspring Variable Trust:
Opinion on the Financial Statements
We have audited the accompanying statement of assets and liabilities of Allspring VT Index Asset Allocation Fund (the Fund), one of the funds constituting Allspring Variable Trust, including the portfolio of investments, as of December 31, 2023, the related statement of operations for the year then ended, the statements of changes in net assets for each of the years in the two-year period then ended, and the related notes (collectively, the financial statements) and the financial highlights for each of the years in the five-year period then ended. In our opinion, the financial statements and financial highlights present fairly, in all material respects, the financial position of the Fund as of December 31, 2023, the results of its operations for the year then ended, the changes in its net assets for each of the years in the two-year period then ended, and the financial highlights for each of the years in the five-year period then ended, in conformity with U.S. generally accepted accounting principles.
Basis for Opinion
These financial statements and financial highlights are the responsibility of the Fund’s management. Our responsibility is to express an opinion on these financial statements and financial highlights based on our audits. We are a public accounting firm registered with the Public Company Accounting Oversight Board (United States) (PCAOB) and are required to be independent with respect to the Fund in accordance with the U.S. federal securities laws and the applicable rules and regulations of the Securities and Exchange Commission and the PCAOB.
We conducted our audits in accordance with the standards of the PCAOB. Those standards require that we plan and perform the audit to obtain reasonable assurance about whether the financial statements and financial highlights are free of material misstatement, whether due to error or fraud. Our audits included performing procedures to assess the risks of material misstatement of the financial statements and financial highlights, whether due to error or fraud, and performing procedures that respond to those risks. Such procedures included examining, on a test basis, evidence regarding the amounts and disclosures in the financial statements and financial highlights. Such procedures also included confirmation of securities owned as of December 31, 2023, by correspondence with the custodian, transfer agent and brokers, or by other appropriate auditing procedures. Our audits also included evaluating the accounting principles used and significant estimates made by management, as well as evaluating the overall presentation of the financial statements and financial highlights. We believe that our audits provide a reasonable basis for our opinion.

We have not been able to determine the specific year that we began serving as the auditor of one or more Allspring Funds investment companies; however, we are aware that we have served as the auditor of one or more Allspring Funds investment companies since at least 1955.
Boston, Massachusetts
February 26, 2024
Allspring VT Index Asset Allocation Fund | 41
Other information (unaudited)
Other information
Tax information
For corporate shareholders, pursuant to Section 854 of the Internal Revenue Code, 83% of ordinary income dividends qualify for the corporate dividends-received deduction for the fiscal year ended December 31, 2023.
Pursuant to Section 852 of the Internal Revenue Code, $2,002,479 was designated as a 20% rate gain distribution for the fiscal year ended
December 31, 2023.
For corporate shareholders, pursuant to Section 163(j) of the Internal Revenue Code, 49% of ordinary income dividends qualify as interest dividends for the fiscal year ended December 31, 2023.
Proxy voting information
A description of the policies and procedures used to determine how to vote proxies relating to portfolio securities is available without charge, upon request, by calling 1-866-259-3305, visiting our website at allspringglobal.com, or visiting the SEC website at sec.gov. Information regarding how the proxies related to portfolio securities were voted during the most recent 12-month period ended June 30 is available on the website at allspringglobal.com or by visiting the SEC website at sec.gov.
Quarterly portfolio holdings information
The Fund files its complete schedule of portfolio holdings with the SEC for the first and third quarters of each fiscal year as an exhibit to its reports on Form N-PORT. Shareholders may view the filed Form N-PORT by visiting the SEC website at sec.gov.
42 | Allspring VT Index Asset Allocation Fund
Other information (unaudited)
Board of trustees and officers
Each of the Trustees and Officers listed in the table below acts in identical capacities for each fund in the Allspring family of funds, which consists of 117 mutual funds comprising the Allspring Funds Trust, Allspring Variable Trust, Allspring Master Trust and four closed-end funds (collectively the “Fund Complex”). This table should be read in conjunction with the Prospectus and the Statement of Additional Information†. The mailing address of each Trustee and Officer is 1415 Vantage Park Drive, 3rd Floor, Charlotte, NC 28203. Each Trustee and Officer serves an indefinite term, however, each Trustee serves such term until reaching the mandatory retirement age established by the Trustees.
Independent Trustees
| | Principal occupations during past five years or longer | Current other
public company or
investment
company
directorships |
William R. Ebsworth
(Born 1957) | | Retired. From 1984 to 2013, equities analyst, portfolio manager, research director and chief investment officer at Fidelity Management and Research Company in Boston, Tokyo, and Hong Kong, and retired in 2013 as Chief Investment Officer of Fidelity Strategic Advisers, Inc. where he led a team of investment professionals managing client assets. Prior thereto, Board member of Hong Kong Securities Clearing Co., Hong Kong Options Clearing Corp., the Thailand International Fund, Ltd., Fidelity Investments Life Insurance Company, and Empire Fidelity Investments Life Insurance Company. Serves on the Investment Company Institute’s Board of Governors since 2022 and Executive Committee since 2023 as well as the Vice Chairman of the Governing Council of the Independent Directors Council since 2023. Audit Committee Chair and Investment Committee Chair of the Vincent Memorial Hospital Foundation (non-profit organization). Mr. Ebsworth is a CFA charterholder. | |
Jane A. Freeman
(Born 1953) | Trustee,
since 2015;
Chair Liaison,
| Retired. From 2012 to 2014 and 1999 to 2008, Chief Financial Officer of Scientific Learning Corporation. From 2008 to 2012, Ms. Freeman provided consulting services related to strategic business projects. Prior to 1999, Portfolio Manager at Rockefeller & Co. and Scudder, Stevens & Clark. Board member of the Harding Loevner Funds from 1996 to 2014, serving as both Lead Independent Director and chair of the Audit Committee. Board member of the Russell Exchange Traded Funds Trust from 2011 to 2012 and the chair of the Audit Committee. Ms. Freeman is also an inactive Chartered Financial Analyst. | |
Isaiah Harris, Jr.
(Born 1952) | Trustee,
since 2009;
Audit Committee Chair,
since 2019 | Retired. Member of the Advisory Board of CEF of East Central Florida. Chairman of the Board of CIGNA Corporation from 2009 to 2021, and Director from 2005 to 2008. From 2003 to 2011, Director of Deluxe Corporation. Prior thereto, President and CEO of BellSouth Advertising and Publishing Corp. from 2005 to 2007, President and CEO of BellSouth Enterprises from 2004 to 2005 and President of BellSouth Consumer Services from 2000 to 2003. Emeritus member of the Iowa State University Foundation Board of Governors. Emeritus Member of the Advisory board of Iowa State University School of Business. Advisory Board Member, Palm Harbor Academy (private school). Advisory Board Member, Fellowship of Christian Athletes. Mr. Harris is a certified public accountant (inactive status). | |
David F. Larcker
(Born 1950) | | Distinguished Visiting Fellow at the Hoover Institution since 2022. James Irvin Miller Professor of Accounting at the Graduate School of Business (Emeritus), Stanford University, Director of the Corporate Governance Research Initiative and Senior Faculty of The Rock Center for Corporate Governance since 2006. From 2005 to 2008, Professor of Accounting at the Graduate School of Business, Stanford University. Prior thereto, Ernst & Young Professor of Accounting at The Wharton School, University of Pennsylvania from 1985 to 2005. | |
Olivia S. Mitchell
(Born 1953) | | International Foundation of Employee Benefit Plans Professor since 1993, Wharton School of the University of Pennsylvania. Director of Wharton’s Pension Research Council and Boettner Center on Pensions & Retirement Research, and Research Associate at the National Bureau of Economic Research. Previously taught at Cornell University from 1978 to 1993. | |
Timothy J. Penny
(Born 1951) | Trustee,
since 1996;
Chair,
since 2018 | President and Chief Executive Officer of Southern Minnesota Initiative Foundation, a non-profit organization, since 2007. Vice Chair of the Economic Club of Minnesota, since 2007. Co-Chair of the Committee for a Responsible Federal Budget, since 1995. Member of the Board of Trustees of NorthStar Education Finance, Inc., a non-profit organization, from 2007-2022. Senior Fellow of the University of Minnesota Humphrey Institute from 1995 to 2017. | |
* Length of service dates reflect the Trustee’s commencement of service with the Trust’s predecessor entities, where applicable.
# Ms. Freeman will serve as Chair Liaison through June 2024, at which time Ms. Wheelock will assume the role.
†
The Statement of Additional Information includes additional information about the Trustees and is available, without charge, upon request, by calling 1-800-260-5969 or by visiting the website at allspringglobal.com.
Allspring VT Index Asset Allocation Fund | 43
Other information (unaudited)
| Position held and length of service* | Principal occupations during past five years or longer | Current other public company or investment company directorships |
James G. Polisson
(Born 1959) | Trustee,
since 2018; Nominating and Governance Committee Chair, since 2024 | Retired. Chief Marketing Officer, Source (ETF) UK Services, Ltd, from 2015 to 2017. From 2012 to 2015, Principal of The Polisson Group, LLC, a management consulting, corporate advisory and principal investing company. Chief Executive Officer and Managing Director at Russell Investments, Global Exchange Traded Funds from 2010 to 2012. Managing Director of Barclays Global Investors from 1998 to 2010 and Global Chief Marketing Officer for iShares and Barclays Global Investors from 2000 to 2010. Trustee of the San Francisco Mechanics’ Institute, a non- profit organization, from 2013 to 2015. Board member of the Russell Exchange Traded Fund Trust from 2011 to 2012. Director of Barclays Global Investors Holdings Deutschland GmbH from 2006 to 2009. Mr. Polisson is an attorney and has a retired status with the Massachusetts and District of Columbia Bar Associations. | |
Pamela Wheelock
(Born 1959) | Trustee,
since January 2020;
previously Trustee from
January 2018 to
| Retired. Executive and Senior Financial leadership positions in the public, private and nonprofit sectors. Interim President and CEO, McKnight Foundation, 2020. Interim Commissioner, Minnesota Department of Human Services, 2019. Chief Operating Officer, Twin Cities Habitat for Humanity, 2017-2019. Vice President for University Services, University of Minnesota, 2012- 2016. Interim President and CEO, Blue Cross and Blue Shield of Minnesota, 2011-2012. Executive Vice-President and Chief Financial Officer, Minnesota Wild, 2002-2008. Commissioner, Minnesota Department of Finance, 1999-2002. Chair of the Board of Directors of Destination Medical Center Corporation. Board member of the Minnesota Wild Foundation. | |
* Length of service dates reflect the Trustee’s commencement of service with the Trust’s predecessor entities, where applicable.
# Ms. Freeman will serve as Chair Liaison through June 2024, at which time Ms. Wheelock will assume the role.
44 | Allspring VT Index Asset Allocation Fund
Other information (unaudited)
Officers1
| Position held and
length of service | Principal occupations during past five years or longer |
| | President and Chief Executive Officer of Allspring Funds Management, LLC since 2017 and Head of Global Fund Governance of Allspring Global Investments since 2022. Prior thereto, co-president of Galliard Capital Management, LLC, an affiliate of Allspring Funds Management, LLC, from 2019 to 2022 and Head of Affiliated Managers, Allspring Global Investments, from 2014 to 2019 and Executive Vice President responsible for marketing, investments and product development for Allspring Funds Management, LLC, from 2009 to 2014. |
Jeremy DePalma
(Born 1974) | Treasurer,
since 2012
(for certain funds in
the Fund Complex);
since 2021 (for
the remaining funds in the Complex) | Senior Vice President of Allspring Funds Management, LLC since 2009. Senior Vice President of Evergreen Investment Management Company, LLC from 2008 to 2010 and head of the Fund Reporting and Control Team within Fund Administration from 2005 to 2010. |
Christopher Baker
(Born 1976) | Chief Compliance Officer,
since 2022 | Global Chief Compliance Officer for Allspring Global Investments since 2022. Prior thereto, Chief Compliance Officer for State Street Global Advisors from 2018 to 2021. Senior Compliance Officer for the State Street divisions of Alternative Investment Solutions, Sector Solutions, and Global Marketing from 2015 to 2018. From 2010 to 2015 Vice President, Global Head of Investment and Marketing Compliance for State Street Global Advisors. |
Matthew Prasse
(Born 1983) | Chief Legal Officer,
since 2022;
Secretary,
since 2021 | Senior Counsel of the Allspring Legal Department since 2021. Senior Counsel of the Wells Fargo Legal Department from 2018 to 2021. Previously, Counsel for Barings LLC from 2015 to 2018. Prior to joining Barings, Associate at Morgan, Lewis & Bockius LLP from 2008 to 2015. |
1 For those Officers with tenures at Allspring Global Investments and/or Allspring Funds Management, LLC that began prior to 2021, such tenures include years of service during which these businesses/entities were known as Wells Fargo Asset Management and Wells Fargo Funds Management, LLC, respectively.
Allspring VT Index Asset Allocation Fund | 45
For more information
More information about Allspring Funds is available free upon request. To obtain literature, please write, visit the Fund’s website, or call:
Allspring Funds
P.O. Box 219967
Kansas City, MO 64121-9967
Website: allspringglobal.com
Individual investors: 1-800-260-5969
Retail investment professionals: 1-888-877-9275
Institutional investment professionals: 1-866-765-0778
This report and the financial statements contained herein are submitted for the general information of the shareholders of the Fund. If this report is used for promotional purposes, distribution of the report must be accompanied or preceded by a current prospectus. Before investing, please consider the investment objectives, risks, charges, and expenses of the investment. For a current prospectus and, if available, a summary prospectus, containing this information, call 1-800-222-8222 or visit the Fund’s website at allspringglobal.com. Read the prospectus carefully before you invest or send money.
Allspring Global InvestmentsTM is the trade name for the asset management firms of Allspring Global Investments Holdings, LLC, a holding company indirectly owned by certain private funds of GTCR LLC and Reverence Capital Partners, L.P. These firms include but are not limited to Allspring Global Investments, LLC, and Allspring Funds Management, LLC. Certain products managed by Allspring entities are distributed by Allspring Funds Distributor, LLC (a broker-dealer and Member FINRA/SIPC).
This material is for general informational and educational purposes only and is NOT intended to provide investment advice or a recommendation of any kind - including a recommendation for any specific investment, strategy, or plan.
© 2024 Allspring Global Investments Holdings, LLC. All rights reserved.
ALL-01052024-jdfz9ped 02-24
AR0360 12-23
Allspring VT International Equity Fund
Annual Report
December 31, 2023
The views expressed and any forward-looking statements are as of December 31, 2023, unless otherwise noted, and are those of the Fund’s portfolio managers and/or Allspring Global Investments. Discussions of individual securities or the markets generally are not intended as individual recommendations. Future events or results may vary significantly from those expressed in any forward-looking statements. The views expressed are subject to change at any time in response to changing circumstances in the market. Allspring Global Investments disclaims any obligation to publicly update or revise any views expressed or forward-looking statements.
Allspring VT International Equity Fund | 1
Letter to shareholders (unaudited)
Andrew Owen
President
Allspring Funds
Dear Shareholder:
We are pleased to offer you this annual report for the Allspring VT International Equity Fund for the 12-month period that ended December 31, 2023. Globally, stocks and bonds experienced high levels of volatility throughout the period but had positive overall results. The market was focused on persistently high inflation and the impact of ongoing aggressive central bank rate hikes. Compounding these concerns were the global reverberations of the Russia-Ukraine war. Riskier assets rallied in 2023, as investors anticipated an end to the tight monetary policy despite concerns of a possible recession. After suffering deep and broad losses through 2022, bonds now benefit from a base of higher yields that can help generate higher income.
For the 12-month period, stocks generally outperformed bonds—both domestic U.S. and global. For the period, U.S. stocks, based on the S&P 500 Index,1 gained 26.29%. International stocks, as measured by the MSCI ACWI ex USA Index (Net),2 returned 15.62%, while the MSCI EM Index (Net) (USD)3 had more modest performance, with a gain of 9.83%. Among bond indexes, the Bloomberg U.S. Aggregate Bond Index4 returned 5.53%, the Bloomberg Global Aggregate ex-USD Index (unhedged)5 gained 5.72%, the Bloomberg Municipal Bond Index6 returned 6.40%, and the ICE BofA U.S. High Yield Index7 gained 13.54%.
Despite high inflation and central bank rate hikes, markets rallied.
The year 2023 began with a rally across global equities and fixed income securities. Investor optimism rose in response to data indicating declining inflation rates and the reopening of China’s economy with the abrupt end to its zero-COVID-19 policy. The U.S. reported strong job gains and unemployment fell to 3.4%—the lowest level since 1969. Meanwhile, wage growth, seen as a potential contributor to ongoing high inflation, continued to moderate. All eyes remained on the Federal Reserve (Fed) and on how many more rate hikes remain in this tightening cycle. The 0.25% federal funds rate hike announced in January was the Fed’s smallest rate increase since March 2022.
Markets declined in February as investors responded unfavorably to resilient economic data. The takeaway: Central banks would likely continue their monetary tightening cycle for longer than markets had priced in. In this environment—where strong economic data is seen as bad news—the resilient U.S. labor market was taken as a negative, with inflation not falling quickly enough for the Fed, which raised interest rates by 0.25% in February. Meanwhile, the Bank of England (BoE) and the European Central Bank (ECB) both raised rates by 0.50%.
1
The S&P 500 Index consists of 500 stocks chosen for market size, liquidity, and industry group representation. It is a market-value-weighted index with each stock’s weight in the index proportionate to its market value. You cannot invest directly in an index.
2
The Morgan Stanley Capital International (MSCI) All Country World Index (ACWI) ex USA Index (Net) is a free-float-adjusted market-capitalization-weighted index that is designed to measure the equity market performance of developed and emerging markets, excluding the U.S. Source: MSCI. MSCI makes no express or implied warranties or representations and shall have no liability whatsoever with respect to any MSCI data contained herein. The MSCI data may not be further redistributed or used as a basis for other indexes or any securities or financial products. This report is not approved, reviewed, or produced by MSCI. You cannot invest directly in an index.
3
The MSCI Emerging Markets (EM) Index (Net) (USD) is a free-float-adjusted market-capitalization-weighted index that is designed to measure the equity market performance of emerging markets. You cannot invest directly in an index.
4
The Bloomberg U.S. Aggregate Bond Index is a broad-based benchmark that measures the investment-grade, U.S.-dollar-denominated, fixed-rate taxable bond market, including Treasuries, government-related and corporate securities, mortgage-backed securities (agency fixed-rate and hybrid adjustable-rate mortgage pass-throughs), asset-backed securities, and commercial mortgage-backed securities. You cannot invest directly in an index.
5
The Bloomberg Global Aggregate ex-USD Index (unhedged) is an unmanaged index that provides a broad-based measure of the global investment-grade fixed-income markets excluding the U.S.-dollar-denominated debt market. You cannot invest directly in an index.
6
The Bloomberg Municipal Bond Index is an unmanaged index composed of long-term tax-exempt bonds with a minimum credit rating of Baa. You cannot invest directly in an index.
7
The ICE BofA U.S. High Yield Index is a market-capitalization-weighted index of domestic and Yankee high yield bonds. The index tracks the performance of high yield securities traded in the U.S. bond market. You cannot invest directly in an index. Copyright 2024. ICE Data Indices, LLC. All rights reserved.
2 | Allspring VT International Equity Fund
Letter to shareholders (unaudited)
“ The collapse of Silicon Valley Bank in March—the second-largest banking failure in U.S. history—led to a bank run that spread to Europe, where Switzerland’s Credit Suisse was taken over by its rival, UBS. ”
The collapse of Silicon Valley Bank in March—the second-largest banking failure in U.S. history—led to a bank run that spread to Europe, where Switzerland’s Credit Suisse was taken over by its rival, UBS. The banking industry turmoil created an additional challenge for central banks in balancing inflationary concerns against potential economic weakening. Meanwhile, recent data pointed to economic strength in the U.S., Europe, and China. And China’s economy continued to rebound after the removal of its COVID-19 lockdown. Inflation rates in the U.S., the U.K., and the eurozone all remained higher than central bank targets, leading to additional rate hikes in March.
Economic data released in April pointed to global resilience, as Purchasing Managers Indexes1 in the U.S., U.K., and eurozone beat expectations and China reported first-quarter annualized economic growth of 4.5%. Despite banking industry stress, developed market stocks had monthly gains. The U.S. labor market remained strong, with a 3.5% jobless rate and monthly payroll gains above 200,000. However, uncertainty and inflationary concerns weighed on investors in the U.S. and abroad.
May was marked by a divergence between expanding activity in services and an overall contraction in manufacturing activity in the U.S., U.K., and eurozone. Core inflation remained elevated in the U.S. and Europe, despite the ongoing efforts of the Fed and the ECB, which included rate hikes of 0.25% by both in May. Stubborn inflation and the resilient U.S. labor market led to expectations of further interest rate hikes, overall monthly declines across bond indexes, and mixed results for stocks in May. Investor worries over a U.S. debt ceiling impasse were modest, and market confidence was buoyed by a deal in late May to avert a potential U.S. debt default.
June featured the Fed’s first pause on interest rate hikes since March 2022, when it began its aggressive campaign to rein in inflation. However, inflation, as measured by the Core Consumer Price Index (CPI)2, while continuing to decline, remained stubbornly high in June at 4.8%, well above the Fed’s 2.0% target rate. With the U.S. unemployment rate still at 3.6%, near a historical low, and U.S. payrolls growing in June for the 30th consecutive month, expectations of more Fed rate hikes were reinforced. However, U.S. and global stocks had strong returns in June.
July was a good month for stocks. However, bonds had more muted but positive monthly returns overall. Riskier sectors and regions tended to do well, as investors grew more optimistic regarding economic prospects. With strong second-quarter gross domestic product (GDP) growth—initially estimated at 2.4%—and U.S. annual inflation easing steadily to 3.2% in July, hopes for a soft economic landing grew. The Fed, the ECB, and the BoE all raised their respective key interest rates by 0.25% in July. In the Fed’s case, speculation grew that it could be very close to the end of its tightening cycle. Meanwhile, China’s economy showed signs of stagnation, renewing concerns of global fallout.
Stocks retreated in August while monthly bond returns were flat overall. Increased global market volatility reflected unease over the Chinese property market being stressed along with weak Chinese economic data. On a more positive note, speculation grew over a possible end to the Fed’s campaign of interest rate increases or at least a pause in September. U.S. economic data generally remained solid, with resilient job market data and inflation ticking up slightly in August, as the annual CPI3 rose 3.7%. However, the three-month trend for Core CPI stood at a more encouraging annualized 2.4%.
1
The Purchasing Managers Index (PMI) is an index of the prevailing direction of economic trends in the manufacturing and service sectors. You cannot invest directly in an index.
2
The Core Consumer Price Index (CPI) is a measure of the average change over time in the prices paid by urban consumers for a market basket of consumer goods and services excluding energy and food prices. You cannot invest directly in an index.
3
The CPI is a measure of the average change over time in the prices paid by urban consumers for a market basket of consumer goods and services. You cannot invest directly in an index.
Allspring VT International Equity Fund | 3
Letter to shareholders (unaudited)
Stocks and bonds both had negative overall returns in September as investors reluctantly recited the new chorus of “higher for longer,” led by the Fed’s determination not to lower interest rates until it knows it has vanquished its pesky opponent—higher-than-targeted inflation. As of September, the two primary gauges of U.S. inflation—the annual Core Personal Consumption Expenditures Price Index1 and the CPI—both stood at roughly 4%, twice as high as the Fed’s oft-stated 2% target. The month ended with the prospect of yet another U.S. government shutdown, averted at least temporarily but looming later this fall.
October was a tough month for stocks and bonds. Key global and domestic indexes all were pushed down by rising geopolitical tensions, particularly the Israel-Hamas conflict, and concerns over the Fed’s “higher for longer” monetary policy. The U.S. 10-year Treasury yield rose above 5% for the first time since 2007. Commodity prices did well as oil prices rallied in response to the prospect of oil supply disruptions from the Middle East. U.S. annualized third-quarter GDP was estimated at a healthier-than-anticipated 4.9%. China’s GDP indicated surprisingly strong industrial production and retail sales, offset by ongoing weakness in its real estate sector.
In November, the market mood turned positive as cooling inflation inspired confidence that central banks could hold off on further rate hikes. Overall annual inflation in the U.S. fell to 3.1% in November while 12-month inflation in the U.K. and eurozone eased to 4.6% and 2.4%, respectively—far below their peak levels of mid-2022. Third quarter annualized U.S. GDP growth was raised to an estimated 5.2% while U.S. job totals rose by just below 200,000 in November, indicating a slight cooling of the labor market. All of this fresh evidence added to confidence for a U.S. soft economic landing, leading to a more buoyant mood heading into winter as the Federal Open Market Committee held rates steady at its December meeting.
The broad year-end rally among stocks and bonds that began in November continued through December as investors became more confident that monetary policy would ease in 2024. Supporting the bubbly market mood were a series of reports confirming lower inflationary trends in the U.S. and Europe. During the period, it appeared more likely that the U.S. economy could achieve a soft landing, cooling enough to lower inflation without the pain of a recession. However, by year-end, an expectations gap developed. Capital markets priced in a total of 1.50 percentage points in federal funds rate cuts in 2024—twice as much as the three cuts of 0.25% hinted at by Fed officials.
“ In November, the market mood turned positive as cooling inflation inspired confidence that central banks could hold off on further rate hikes. ”
1
The Core Personal Consumption Expenditures Price Index (PCE) is a measure of prices that people living in the United States, or those buying on their behalf, pay for goods and services. It is sometimes called the core PCE price index, because two categories that can have price swings – food and energy – are left out to make underlying inflation easier to see. You cannot invest directly in an index.
4 | Allspring VT International Equity Fund
Letter to shareholders (unaudited)
For further information about your fund, contact your investment professional, visit our website at allspringglobal.com, or call us directly at 1-800-260-5969.
Don’t let short-term uncertainty derail long-term investment goals.
Periods of investment uncertainty can present challenges, but experience has taught us that maintaining long-term investment goals can be an effective way to plan for the future. To help you create a sound strategy based on your personal goals and risk tolerance, Allspring Funds offers more than 100 mutual funds spanning a wide range of asset classes and investment styles. Although diversification cannot guarantee an investment profit or prevent losses, we believe it can be an effective way to manage investment risk and potentially smooth out overall portfolio performance. We encourage investors to know their investments and to understand that appropriate levels of risk-taking may unlock opportunities.
Thank you for choosing to invest with Allspring Funds. We appreciate your confidence in us and remain committed to helping you meet your financial needs.
Sincerely,
Andrew Owen
President
Allspring Funds
Allspring VT International Equity Fund | 5
Letter to shareholders (unaudited)
|
At a meeting held October 19, 2023, the Board of Trustees of the Fund approved the Fund’s liquidation. The Fund will be closed to new direct investors and additional investments from existing shareholders effective at the close of business on April 26, 2024. The liquidation of the Fund is expected to occur on April 30, 2024. |
6 | Allspring VT International Equity Fund
This page is intentionally left blank.
Performance highlights (unaudited)
Performance highlights
| The Fund seeks long-term capital appreciation. |
| Allspring Funds Management, LLC |
| Allspring Global Investments, LLC |
| Jonathan Drexel, CFA†, Paige Henderson, CFA, CFP† |
Average annual total returns (%) as of December 31, 2023 |
| | | | | |
| | | | | | |
| | | | | | |
| | | | | | |
MSCI ACWI ex USA Index (Net)3 | | | | | | |
| | | | | | |
Figures quoted represent past performance, which is no guarantee of future results. Investment return and principal value of an investment will fluctuate so that an investor’s shares, when redeemed, may be worth more or less than their original cost. Current performance may be lower or higher than the performance data quoted and assumes the reinvestment of dividends and capital gains. Current month-end performance is available by calling 1-800-260-5969. Performance figures of the Fund do not reflect fees and expenses charged pursuant to the terms of variable life insurance policies and variable annuity contracts. If these fees and expenses had been reflected, performance would have been lower.
Index returns do not include transaction costs associated with buying and selling securities, any mutual fund fees or expenses, or any taxes. It is not possible to invest directly in an index.
Shares are sold without a front-end sales charge or contingent deferred sales charge.
|
| Total return differs from the return in the Financial Highlights in this report. The total return presented is calculated based on the Net Asset Value (NAV) at which the shareholder transactions were processed. The NAV and total return presented in the Financial Highlights reflects certain adjustments made to the net assets of the Fund that are necessary under U.S. generally accepted accounting principles. |
| Reflects the expense ratios as stated in the most recent prospectuses, which include the impact of 0.01% in acquired fund fees and expenses. The expense ratios shown are subject to change and may differ from the annualized expense ratios shown in the Financial Highlights of this report, which do not include acquired fund fees and expenses. |
| The manager has contractually committed through April 30, 2024, to waive fees and/or reimburse expenses to the extent necessary to cap total annual fund operating expenses after fee waivers at 0.69% for Class 1 shares and 0.94% for Class 2 shares. Brokerage commissions, stamp duty fees, interest, taxes, acquired fund fees and expenses (if any), and extraordinary expenses are excluded from the expense caps. Prior to or after the commitment expiration date, the caps may be increased or the commitment to maintain the caps may be terminated only with the approval of the Board of Trustees. Without these caps, the Fund’s returns would have been lower. The expense ratio paid by an investor is the net expense ratio (the total annual fund operating expenses after fee waivers) as stated in the prospectuses. |
| The Morgan Stanley Capital International (MSCI) All Country World Index (ACWI) ex USA Index (Net) is a free-float-adjusted market-capitalization-weighted index that is designed to measure the equity market performance of developed and emerging markets, excluding the U.S. Source: MSCI. MSCI makes no express or implied warranties or representations and shall have no liability whatsoever with respect to any MSCI data contained herein. The MSCI data may not be further redistributed or used as a basis for other indexes or any securities or financial products. This report is not approved, reviewed, or produced by MSCI. You cannot invest directly in an index. |
| The MSCI Europe, Australasia, Far East (EAFE) Index (Net) is a free-float-adjusted market capitalization-weighted index that is designed to measure the equity market performance of developed markets, excluding the U.S. and Canada. You cannot invest directly in an index. |
Stock values fluctuate in response to the activities of individual companies and general market and economic conditions. Foreign investments are especially volatile and can rise or fall dramatically due to differences in the political and economic conditions of the host country. These risks are generally intensified in emerging markets. The use of derivatives may reduce returns and/or increase volatility. Certain investment strategies tend to increase the total risk of an investment (relative to the broader market). This fund is exposed to smaller-company securities risk. Consult the Fund’s prospectus for additional information on these and other risks.
Please refer to the prospectus provided by your participating insurance company for detailed information describing the separate accounts for information regarding surrender charges, mortality and expense risk fees, and other charges that may be assessed by the participating insurance companies.
| Mr. Drexel and Ms. Henderson became portfolio managers of the Fund on October 20, 2023. |
CFA® and Chartered Financial Analyst® are trademarks owned by CFA Institute. |
8 | Allspring VT International Equity Fund
Performance highlights (unaudited)
Growth of $10,000 investment as of December 31, 20231 |
| The chart compares the performance of Class 2 shares for the most recent ten years with the MSCI ACWI ex USA Index (Net) and MSCI EAFE Index (Net). The chart assumes a hypothetical investment of $10,000 in Class 2 shares and reflects all operating expenses of the Fund but does not reflect fees and expenses charged pursuant to the terms of variable life insurance policies and variable annuity contracts. |
Allspring VT International Equity Fund | 9
Performance highlights (unaudited)
MANAGER’S DISCUSSION
Fund highlights
•The Fund (Class 2) underperformed its benchmark, the MSCI ACWI ex USA Index (Net), for the 12-month period that ended December 31, 2023.
•Positioning in information technology, consumer discretionary and real estate detracted from relative performance, primarily due to negative selection effects.
•Stock selection within the industrials, health care, and utilities sectors resulted in notable contributions to performance.
•The Fund was overweight North America due to the weighting in the U.S. while being underweight Canada. The Fund was underweight Asia Pacific overall. Country underweights included Taiwan, Australia, and India. Those were partly offset by overweights to Korea, Thailand, and China/Hong Kong. The Fund was underweight Europe, including Switzerland, Sweden, and Spain, partly offset by overweights to France, the Netherlands, and the U.K.
Moderating inflation fueled a market rally.
For 2023, developed markets rallied strongly given moderating inflation and falling interest rates as expectations for future growth improved. Hopes for a “soft landing” increased. Weakness in China remained a concern.
Expectations for rate cuts have come into focus as central banks across the globe have likely delivered their final interest rate hikes of this cycle. Market valuations reflect increased expectations for a “soft landing” for the U.S. economy as unemployment has remained low and U.S. consumer spending has been resilient despite the highest interest rates in 22 years. Tighter financing conditions helped get inflation under control while curtailing demand. However, there is the risk that central banks remain restrictive too long and induce a recession.
Ten largest holdings (%) as of December 31, 20231 |
| |
Samsung Electronics Co. Ltd. | |
| |
| |
| |
LVMH Moet Hennessy Louis Vuitton SE | |
| |
Coca-Cola Europacific Partners PLC | |
| |
| |
| Figures represent the percentage of the Fund’s net assets. Holdings are subject to change and may have changed since the date specified. |
The change in the Fund’s investment mandate led to a reduction in exposure to emerging market countries, including China/Hong Kong, Brazil, and Thailand, as well as reducing exposure to smaller-market-capitalization companies while increasing exposure to developed market countries, including France, Germany, the United Kingdom, and Switzerland. Allocations to consumer staples and information technology sectors increased, offset by reductions in the communication services, energy, and consumer discretionary sectors.
At year-end, the portfolio management team maintains a core equity style that emphasizes bottom-up stock selection based on rigorous, in-depth, fundamental company research. The team uses a bottom-up research process that targets companies with robust asset bases that produce sustainable cash flow growth throughout a market cycle, demonstrate efficient capital allocation, and exhibit a commitment to returning value to shareholders. The team also applies a disciplined process that seeks to drive incremental returns through stock selection while managing risk across multiple dimensions, including economic sector, country, and currency. The goal is that the focus on income and quality characteristics combined with portfolio construction will lead to less-volatile returns through a full market cycle. The strategy is focused primarily on larger-cap companies.
Detractors included stock selection in the U.K., Australia, and the Netherlands.
Entain plc, a U.K.-based global sports betting and gambling company operating in both online and retail sectors, was the largest detractor in the U.K. With questionable capital deployment, the potential of market share losses, poor execution, and slowing online growth, shares have performed poorly. Nomad Foods, Europe’s leading frozen-food company and one of the largest in the world, was another large detractor in the U.K. It underperformed the market primarily in the third quarter as it reported a modest and anticipated miss on second quarter results, with sales off by 3%. Earnings before interest, taxes, depreciation, and amortization (EBITDA) fell 1%. Earnings per share declined by 5% compared with consensus expectations. These positions were no longer held at period-
end.
10 | Allspring VT International Equity Fund
Performance highlights (unaudited)
Sector allocation as of December 31, 20231 |
| Figures represent the percentage of the Fund’s long-term investments. Allocations are subject to change and may have changed since the date specified. |
Stock selection in Japan, Canada, and Germany contributed to returns. Rheinmetall AG, a German industrial primarily engaged in the defense and automotive businesses, performed well given a generational shift in German defense spending following Russia’s invasion of Ukraine. The German government plans to raise its defense budget to more than 2% of gross domestic product per annum from 2023 onward, which could result in a doubling of sales in Germany. AtkinsRéalis, formerly SNC-Lavalin Group, is a Montreal-based engineering and consulting company with operations in Canada, the U.S., the U.K., and Europe. The company continues to perform well as it progresses down a strategic plan to allow large construction projects that suffered from cost overruns to mature with limited reinvestment and delays and focus on core engineering and consulting operations. These holdings were sold as part of a portfolio management shift to a team with a different investment approach.
Neutral outlook overall.
Our outlook is neutral over both the short and long term.
Easing of monetary policy through interest rate cuts typically leads to higher equity valuations, assuming market expectations have not exceeded the ultimate reality. Uncertainty around the timing and magnitude of interest rate cuts is likely one of the greatest risks to the
equity markets in 2024.
Geographic allocation as of December 31, 20231 |
| Figures represent the percentage of the Fund’s long-term investments. Allocations are subject to change and may have changed since the date specified. |
Continuing global conflicts, including Russia-Ukraine, the Middle East, and actions taken by China regarding Hong Kong and Taiwan, bear close watch.
The end of a decade of near-zero interest rates is expected to create disruption and opportunity as companies must adjust to a higher cost of capital and investors adjust to potentially more balanced outcomes along the risk/reward spectrum.
Allspring VT International Equity Fund | 11
Fund expenses (unaudited)
Fund expenses
As a shareholder of the Fund, you incur ongoing costs, including management fees, distribution (12b-1) fees and other Fund expenses. This example is intended to help you understand your ongoing costs (in dollars) of investing in the Fund and to compare these costs with the ongoing costs of investing in other mutual funds.
The example is based on an investment of $1,000 invested at the beginning of the six-month period and held for the entire period from July 1, 2023 to December 31, 2023.
Actual expenses
The “Actual” line of the table below provides information about actual account values and actual expenses. You may use the information in this line, together with the amount you invested, to estimate the expenses that you paid over the period. Simply divide your account value by $1,000 (for example, an $8,600 account value divided by $1,000= 8.6), then multiply the result by the number in the “Actual” line under the heading entitled “Expenses paid during period” for your applicable class of shares to estimate the expenses you paid on your account during this period.
Hypothetical example for comparison purposes
The “Hypothetical” line of the table below provides information about hypothetical account values and hypothetical expenses based on the Fund’s actual expense ratio and an assumed rate of return of 5% per year before expenses, which is not the Fund’s actual return. The hypothetical account values and expenses may not be used to estimate the actual ending account balance or expenses you paid for the period. You may use this information to compare the ongoing costs of investing in the Fund and other funds. To do so, compare this 5% hypothetical example with the 5% hypothetical examples that appear in the shareholder reports of the other funds.
Please note that the expenses shown in the table are meant to highlight your ongoing costs only and do not reflect any separate account charges assessed by participating insurance companies. Therefore, the “Hypothetical” line of the table is useful in comparing ongoing costs only, and will not help you determine the relative total costs of owning different funds. In addition, if these separate account charges assessed by participating insurance companies were included, your costs would have been higher.
| Beginning
account value
7-1-2023 | Ending
account value
12-31-2023 | | Annualized net
expense ratio |
| | | | |
| | | | |
Hypothetical (5% return before expenses) | | | | |
| | | | |
| | | | |
Hypothetical (5% return before expenses) | | | | |
| Expenses paid is equal to the annualized net expense ratio of each class multiplied by the average account value over the period, multiplied by 183 divided by 365 (to reflect the one-half-year period). |
12 | Allspring VT International Equity Fund
Portfolio of investments—December 31, 2023
| | | | | |
| | | | | | |
| | | | | | |
Restaurant Brands International, Inc. (Consumer discretionary, Hotels, restaurants & leisure) | | | | | | |
TC Energy Corp. (Energy, Oil, gas & consumable fuels) | | | | | | |
| | | | | | |
| | | | | | |
Nordea Bank Abp (Financials, Banks) | | | | | | |
| | | | | | |
Air Liquide SA (Materials, Chemicals) | | | | | | |
AXA SA (Financials, Insurance) | | | | | | |
Capgemini SE (Information technology, IT services) | | | | | | |
L’Oreal SA (Consumer staples, Personal care products) | | | | | | |
LVMH Moet Hennessy Louis Vuitton SE (Consumer discretionary, Textiles, apparel & luxury goods) | | | | | | |
Sanofi SA (Health care, Pharmaceuticals) | | | | | | |
Schneider Electric SE (Industrials, Electrical equipment) | | | | | | |
TotalEnergies SE (Energy, Oil, gas & consumable fuels) | | | | | | |
Veolia Environnement SA (Utilities, Multi-utilities) | | | | | | |
Vinci SA (Industrials, Construction & engineering) | | | | | | |
| | | | | | |
| | | | | | |
adidas AG (Consumer discretionary, Textiles, apparel & luxury goods) | | | | | | |
Allianz SE (Financials, Insurance) | | | | | | |
Deutsche Boerse AG (Financials, Capital markets) | | | | | | |
Deutsche Post AG (Industrials, Air freight & logistics) | | | | | | |
Deutsche Telekom AG (Communication services, Diversified telecommunication services) | | | | | | |
SAP SE (Information technology, Software) | | | | | | |
Siemens AG (Industrials, Industrial conglomerates) | | | | | | |
| | | | | | |
| | | | | | |
AIA Group Ltd. (Financials, Insurance) | | | | | | |
| | | | | | |
Check Point Software Technologies Ltd. (Information technology, Software)† | | | | | | |
| | | | | | |
Asahi Group Holdings Ltd. (Consumer staples, Beverages) | | | | | | |
FUJIFILM Holdings Corp. (Information technology, Technology hardware, storage & peripherals) | | | | | | |
Nintendo Co. Ltd. (Communication services, Entertainment) | | | | | | |
ORIX Corp. (Financials, Financial services) | | | | | | |
Seven & i Holdings Co. Ltd. (Consumer staples, Consumer staples distribution & retail) | | | | | | |
Sumitomo Mitsui Financial Group, Inc. (Financials, Banks) | | | | | | |
The accompanying notes are an integral part of these financial statements.
Allspring VT International Equity Fund | 13
Portfolio of investments—December 31, 2023
| | | | | |
| | | | | | |
Tokyo Electron Ltd. (Information technology, Semiconductors & semiconductor equipment) | | | | | | |
Toyota Motor Corp. (Consumer discretionary, Automobiles) | | | | | | |
| | | | | | |
| | | | | | |
America Movil SAB de CV Series B (Communication services, Wireless telecommunication services) | | | | | | |
| | | | | | |
Airbus SE (Industrials, Aerospace & defense) | | | | | | |
ING Groep NV (Financials, Banks) | | | | | | |
| | | | | | |
| | | | | | |
Samsung Electronics Co. Ltd. GDR (Information technology, Technology hardware, storage & peripherals) | | | | | | |
SK Telecom Co. Ltd. (Communication services, Wireless telecommunication services) | | | | | | |
| | | | | | |
| | | | | | |
Nestle SA (Consumer staples, Food products) | | | | | | |
Novartis AG (Health care, Pharmaceuticals) | | | | | | |
Roche Holding AG (Health care, Pharmaceuticals) | | | | | | |
TE Connectivity Ltd. (Information technology, Electronic equipment, instruments & components) | | | | | | |
| | | | | | |
| | | | | | |
AstraZeneca PLC (Health care, Pharmaceuticals) | | | | | | |
BAE Systems PLC (Industrials, Aerospace & defense) | | | | | | |
Coca-Cola Europacific Partners PLC (Consumer staples, Beverages) | | | | | | |
Diageo PLC (Consumer staples, Beverages) | | | | | | |
National Grid PLC (Utilities, Multi-utilities) | | | | | | |
Reckitt Benckiser Group PLC (Consumer staples, Household products) | | | | | | |
Rio Tinto PLC (Materials, Metals & mining) | | | | | | |
Shell PLC (Energy, Oil, gas & consumable fuels) | | | | | | |
Smith & Nephew PLC (Health care, Health care equipment & supplies) | | | | | | |
Unilever PLC (Consumer staples, Personal care products) | | | | | | |
| | | | | | |
| | | | | | |
EOG Resources, Inc. (Energy, Oil, gas & consumable fuels) | | | | | | |
Total common stocks (Cost $52,869,380) | | | | | | |
The accompanying notes are an integral part of these financial statements.
14 | Allspring VT International Equity Fund
Portfolio of investments—December 31, 2023
| | | | | |
Investment companies: 2.24% | | | | | | |
| | | | | | |
| | | | | | |
Total investment companies (Cost $1,251,257) | | | | | | |
| | | | | |
Short-term investments: 1.98% | | | | | | |
Investment companies: 1.98% | | | | | | |
Allspring Government Money Market Fund Select Class♠∞ | | | | | | |
Total short-term investments (Cost $1,213,056) | | | | | | |
Total investments in securities (Cost $55,333,693) | | | | | | |
Other assets and liabilities, net | | | | | | |
| | | | | | |
| Non-income-earning security |
| The issuer of the security is an affiliated person of the Fund as defined in the Investment Company Act of 1940. |
| The rate represents the 7-day annualized yield at period end. |
|
| Global depositary receipt |
Investments in affiliates
An affiliated investment is an investment in which the Fund owns at least 5% of the outstanding voting shares of the issuer or as a result of other relationships, such as the Fund and the issuer having the same investment manager. Transactions with issuers that were affiliates of the Fund at the end of the period were as follows:
| | | | | Net
change in
unrealized
gains
(losses) | | | Income
from
affiliated
securities |
| | | | | | | | |
Allspring Government Money Market Fund Select Class | | | | | | | | |
Investments in affiliates no longer held at end of period | | | | | | | | |
Securities Lending Cash Investments LLC | | | | | | | | |
| | | | | | | | |
| Amount shown represents income before fees and rebates. |
The accompanying notes are an integral part of these financial statements.
Allspring VT International Equity Fund | 15
Statement of assets and liabilities—December 31, 2023
Financial statements
Statement of assets and liabilities
| |
Investments in unaffiliated securities, at value (cost $54,120,637) | |
Investments in affiliated securities, at value (cost $1,213,056) | |
Foreign currency, at value (cost $27,337) | |
| |
Receivable for Fund shares sold | |
Prepaid expenses and other assets | |
| |
| |
Payable for investments purchased | |
Custody and accounting fees payable | |
Payable for Fund shares redeemed | |
| |
| |
Administration fees payable | |
Trustees’ fees and expenses payable | |
Accrued expenses and other liabilities | |
| |
| |
| |
| |
Total distributable earnings | |
| |
Computation of net asset value per share | |
| |
Shares outstanding–Class 11 | |
Net asset value per share–Class 1 | |
| |
Shares outstanding–Class 21 | |
Net asset value per share–Class 2 | |
1 The Fund has an unlimited number of authorized shares.
The accompanying notes are an integral part of these financial statements.
16 | Allspring VT International Equity Fund
Statement of operations—year ended December 31, 2023
Statement of operations
| |
Dividends (net of foreign withholdings taxes of $347,760) | |
Income from non-cash dividends | |
Income from affiliated securities | |
| |
| |
| |
| |
| |
| |
| |
| |
| |
Custody and accounting fees | |
| |
Shareholder report expenses | |
Trustees’ fees and expenses | |
| |
| |
Less: Fee waivers and/or expense reimbursements | |
| |
| |
| |
Realized and unrealized gains (losses) on investments | |
| |
| |
| |
Foreign currency and foreign currency translations | |
Net realized losses on investments | |
Net change in unrealized gains (losses) on | |
| |
Foreign currency and foreign currency translations | |
Net change in unrealized gains (losses) on investments | |
Net realized and unrealized gains (losses) on investments | |
Net increase in net assets resulting from operations | |
The accompanying notes are an integral part of these financial statements.
Allspring VT International Equity Fund | 17
Statement of changes in net assets
Statement of changes in net assets
| Year ended December 31, 2023 | Year ended December 31, 2022 |
| | | | |
| | | | |
Net realized gains (losses) on investments | | | | |
Net change in unrealized gains (losses) on investments | | | | |
Net increase (decrease) in net assets resulting from operations | | | | |
Distributions to shareholders from | | | | |
Net investment income and net realized gains | | | | |
| | | | |
| | | | |
Total distributions to shareholders | | | | |
Capital share transactions | | | | |
Proceeds from shares sold | | | | |
| | | | |
| | | | |
| | | | |
Reinvestment of distributions | | | | |
| | | | |
| | | | |
| | | | |
Payment for shares redeemed | | | | |
| | | | |
| | | | |
| | | | |
Net decrease in net assets resulting from capital share transactions | | | | |
Total increase (decrease) in net assets | | | | |
| | | | |
| | | | |
| | | | |
The accompanying notes are an integral part of these financial statements.
18 | Allspring VT International Equity Fund
Financial highlights
(For a share outstanding throughout each period)
| |
| | | | | |
Net asset value, beginning of period | | | | | |
| | | | | |
Net realized and unrealized gains (losses) on investments | | | | | |
Total from investment operations | | | | | |
Distributions to shareholders from | | | | | |
| | | | | |
| | | | | |
Total distributions to shareholders | | | | | |
Net asset value, end of period | | | | | |
| | | | | |
Ratios to average net assets (annualized) | | | | | |
| | | | | |
| | | | | |
| | | | | |
| | | | | |
| | | | | |
Net assets, end of period (000s omitted) | | | | | |
| Calculated based upon average shares outstanding |
| Returns do not reflect fees and expenses charged pursuant to the terms of variable life insurance policies and variable annuity contracts. |
The accompanying notes are an integral part of these financial statements.
Allspring VT International Equity Fund | 19
(For a share outstanding throughout each period)
| |
| | | | | |
Net asset value, beginning of period | | | | | |
| | | | | |
Net realized and unrealized gains (losses) on investments | | | | | |
Total from investment operations | | | | | |
Distributions to shareholders from | | | | | |
| | | | | |
| | | | | |
Total distributions to shareholders | | | | | |
Net asset value, end of period | | | | | |
| | | | | |
Ratios to average net assets (annualized) | | | | | |
| | | | | |
| | | | | |
| | | | | |
| | | | | |
| | | | | |
Net assets, end of period (000s omitted) | | | | | |
| Calculated based upon average shares outstanding |
| Returns do not reflect fees and expenses charged pursuant to the terms of variable life insurance policies and variable annuity contracts. |
The accompanying notes are an integral part of these financial statements.
20 | Allspring VT International Equity Fund
Notes to financial statements
Notes to financial statements
Allspring Variable Trust (the “Trust”), a Delaware statutory trust organized on March 10, 1999, is an open-end management investment company registered under the Investment Company Act of 1940, as amended (the “1940 Act”). As an investment company, the Trust follows the accounting and reporting guidance in Financial Accounting Standards Board (“FASB”) Accounting Standards Codification Topic 946, Financial Services – Investment Companies. These financial statements report on the Allspring VT International Equity Fund (the “Fund”) which is a diversified series of the Trust. The Trust offers shares of the Fund to separate accounts of various life insurance companies as funding vehicles for certain variable annuity contracts and variable life insurance policies.
At a meeting held October 19, 2023, the Board of Trustees of the Fund approved the Fund’s liquidation. The Fund will be closed to new direct investors and additional investments from existing shareholders effective at the close of business on April 26, 2024. The liquidation of the Fund is expected to occur on April 30, 2024.
2.
SIGNIFICANT ACCOUNTING POLICIES
The following significant accounting policies, which are consistently followed in the preparation of the financial statements of the Fund, are in conformity with U.S. generally accepted accounting principles which require management to make estimates and assumptions that affect the reported amounts of assets and liabilities, disclosure of contingent assets and liabilities at the date of the financial statements, and the reported amounts of income and expenses during the reporting period. Actual results could differ from those estimates.
Securities valuation
All investments are valued each business day as of the close of regular trading on the New York Stock Exchange (generally 4 p.m. Eastern Time), although the Fund may deviate from this calculation time under unusual or unexpected circumstances.
Equity securities and exchange-traded funds that are listed on a foreign or domestic exchange or market are valued at the official closing price or, if none, the last sales price.
The values of securities denominated in foreign currencies are translated into U.S. dollars at rates provided by an independent foreign currency pricing source at a time each business day specified by the Valuation Committee at Allspring Funds Management, LLC (“Allspring Funds Management”).
Many securities markets and exchanges outside the U.S. close prior to the close of the New York Stock Exchange and therefore may not fully reflect trading or events that occur after the close of the principal exchange in which the foreign securities are traded, but before the close of the New York Stock Exchange. If such trading or events are expected to materially affect the value of such securities, then fair value pricing procedures implemented by Allspring Funds Management are applied. These procedures take into account multiple factors including movements in U.S. securities markets after foreign exchanges close. Foreign securities that are fair valued under these procedures are categorized as Level 2 and the application of these procedures may result in transfers between Level 1 and Level 2. Depending on market activity, such fair valuations may be frequent. Such fair value pricing may result in net asset values that are higher or lower than net asset values based on the last reported sales price or latest quoted bid price. On December 31, 2023, such fair value pricing was used in pricing certain foreign securities.
Investments in registered open-end investment companies (other than those listed on a foreign or domestic exchange or market) are valued at net asset value.
Investments which are not valued using the methods discussed above are valued at their fair value, as determined in good faith by Allspring Funds Management, which was named the valuation designee by the Board of Trustees. As the valuation designee, Allspring Funds Management is responsible for day-to-day valuation activities for the Allspring Funds. In connection with these responsibilities, Allspring Funds Management has established a Valuation Committee and has delegated to it the authority to take any actions regarding the valuation of portfolio securities that the Valuation Committee deems necessary or appropriate, including determining the fair value of portfolio securities. On a quarterly basis, the Board of Trustees receives reports of valuation actions taken by the Valuation Committee. On at least an annual basis, the Board of Trustees receives an assessment of the adequacy and effectiveness of Allspring Funds Management’s process for determining the fair value of the portfolio of investments.
Foreign currency translation
The accounting records of the Fund are maintained in U.S. dollars. The values of other assets and liabilities denominated in foreign currencies are translated into U.S. dollars at rates provided by an independent foreign currency pricing source at a time each business day specified by the Valuation Committee. Purchases and sales of securities, and income and expenses are converted at the rate of exchange on the respective dates of such transactions. Net realized foreign exchange gains or losses arise from sales of foreign currencies, currency gains or losses realized between the trade and settlement dates on securities transactions, and the difference between the amounts of dividends, interest and foreign withholding taxes recorded and the U.S. dollar equivalent of the amounts actually paid or received. Net unrealized foreign exchange gains and losses arise from changes in the fair value of assets and liabilities other than investments in securities resulting from changes in exchange rates. The changes in net assets arising from changes in exchange rates of securities and the changes in net assets resulting from changes in market prices of securities are not separately presented. Such changes are included in net realized and unrealized gains or losses from investments.
Allspring VT International Equity Fund | 21
Notes to financial statements
Securities lending
During the period, the Fund participated in a program to lend its securities from time to time in order to earn additional income in the form of fees or interest on securities received as collateral or the investment of any cash received as collateral. When securities were on loan, the Fund received interest or dividends on those securities. Cash collateral received in connection with its securities lending transactions was invested in Securities Lending Cash Investments, LLC (the “Securities Lending Fund”), an affiliated non-registered investment company. Interests in the non-registered investment company that were redeemable at net asset value were fair valued normally at net asset value. Effective at the close of business on March 29, 2023, the Fund is no longer participating in the securities lending program and the Securities Lending Fund was liquidated. Securities Lending Fund was managed by Allspring Funds Management and was subadvised by Allspring Global Investments, LLC (“Allspring Investments”), an affiliate of Allspring Funds Management and wholly owned subsidiary of Allspring Global Investments Holdings, LLC. Allspring Funds Management received an advisory fee starting at 0.05% and declining to 0.01% as the average daily net assets of the Securities Lending Fund increased. All of the fees received by Allspring Funds Management were paid to Allspring Investments for its services as subadviser.
Income earned from investment in the Securities Lending Fund (net of fees and rebates), if any, is included in income from affiliated securities on the Statement of Operations.
Security transactions and income recognition
Securities transactions are recorded on a trade date basis. Realized gains or losses are recorded on the basis of identified cost.
Dividend income is recognized on the ex-dividend date, except for certain dividends from foreign securities, which are recorded as soon as the custodian verifies the ex-dividend date. Dividend income is recorded net of foreign taxes withheld where recovery of such taxes is not assured.
Interest earned on cash balances held at the custodian is recorded as interest income.
Distributions to shareholders
Distributions to shareholders from net investment income and any net realized gains are recorded on the ex-dividend date and paid at least annually. Such distributions are determined in accordance with income tax regulations and may differ from U.S. generally accepted accounting principles. Dividend sources are estimated at the time of declaration. The tax character of distributions is determined as of the Fund’s fiscal year end. Therefore, a portion of the Fund’s distributions made prior to the Fund’s fiscal year end may be categorized as a tax return of capital at year end.
Federal and other taxes
The Fund intends to continue to qualify as a regulated investment company by distributing substantially all of its investment company taxable income and any net realized capital gains (after reduction for capital loss carryforwards) sufficient to relieve it from all, or substantially all, federal income taxes. Accordingly, no provision for federal income taxes was required.
The Fund’s income and federal excise tax returns and all financial records supporting those returns for the prior three fiscal years are subject to examination by the federal and Delaware revenue authorities. Management has analyzed the Fund’s tax positions taken on federal, state, and foreign tax returns, as applicable, for all open tax years and does not believe that there are any uncertain tax positions that require recognition of a tax liability.
As of December 31, 2023, the aggregate cost of all investments for federal income tax purposes was $55,589,027 and the unrealized gains (losses) consisted of:
As of December 31, 2023, the Fund had capital loss carryforwards which consist of $2,870,632 in short-term capital losses and $1,844,942 in long-term capital losses.
Class allocations
The separate classes of shares offered by the Fund differ principally in distribution fees. Class specific expenses are charged directly to that share class. Investment income, common fund-level expenses, and realized and unrealized gains (losses) on investments are allocated daily to each class of shares based on the relative proportion of net assets of each class.
22 | Allspring VT International Equity Fund
Notes to financial statements
3.
FAIR VALUATION MEASUREMENTS
Fair value measurements of investments are determined within a framework that has established a fair value hierarchy based upon the various data inputs utilized in determining the value of the Fund’s investments. The three-level hierarchy gives the highest priority to unadjusted quoted prices in active markets for identical assets or liabilities (Level 1) and the lowest priority to unobservable inputs (Level 3). The Fund’s investments are classified within the fair value hierarchy based on the lowest level of input that is significant to the fair value measurement. The inputs are summarized into three broad levels as follows:
•Level 1—quoted prices in active markets for identical securities
•Level 2—other significant observable inputs (including quoted prices for similar securities, interest rates, prepayment speeds, credit risk, etc.)
•Level 3—significant unobservable inputs (including the Fund’s own assumptions in determining the fair value of investments)
The inputs or methodologies used for valuing investments in securities are not necessarily an indication of the risk associated with investing in those securities.
The following is a summary of the inputs used in valuing the Fund’s assets and liabilities as of December 31, 2023:
| | Other significant
observable inputs
(Level 2) | Significant
unobservable inputs
(Level 3) | |
| | | | |
| | | | |
| | | | |
| | | | |
| | | | |
| | | | |
| | | | |
| | | | |
| | | | |
| | | | |
| | | | |
| | | | |
| | | | |
| | | | |
| | | | |
| | | | |
| | | | |
| | | | |
| | | | |
| | | | |
Additional sector, industry or geographic detail, if any, is included in the Portfolio of Investments.
At December 31, 2023, the Fund did not have any transfers into/out of Level 3.
4.
TRANSACTIONS WITH AFFILIATES
Management fee
Allspring Funds Management, a wholly owned subsidiary of Allspring Global Investments Holdings, LLC, a holding company indirectly owned by certain private funds of GTCR LLC and Reverence Capital Partners, L.P., is the manager of the Fund and provides advisory and fund-level administrative services under an investment management agreement. Under the investment management agreement, Allspring Funds Management is responsible for, among other services, implementing the investment objectives and strategies of the Fund, supervising the subadviser and providing fund-level administrative
Allspring VT International Equity Fund | 23
Notes to financial statements
services in connection with the Fund’s operations. As compensation for its services under the investment management agreement, Allspring Funds Management is entitled to receive a management fee at the following annual rate based on the Fund’s average daily net assets:
For the year ended December 31, 2023, the management fee was equivalent to an annual rate of 0.80% of the Fund’s average daily net assets.
Allspring Funds Management has retained the services of a subadviser to provide daily portfolio management to the Fund. The fee for subadvisory services is borne by Allspring Funds Management. Allspring Investments is the subadviser to the Fund and is entitled to receive a fee from Allspring Funds Management at an annual rate starting at 0.45% and declining to 0.40% as the average daily net assets of the Fund increase.
Administration fees
Under a class-level administration agreement, Allspring Funds Management provides class-level administrative services to the Fund, which includes paying fees and expenses for services provided by the transfer agent, sub-transfer agents, omnibus account servicers and record-keepers. As compensation for its services under the class-level administration agreement, Allspring Funds Management receives an annual fee of 0.08% which is calculated based on the average daily net assets of each class.
Waivers and/or expense reimbursements
Allspring Funds Management has contractually committed to waive and/or reimburse management and administration fees to the extent necessary to maintain certain net operating expense ratios for the Fund. When each class of the Fund has exceeded its expense cap, Allspring Funds Management will waive fees and/or reimburse expenses from fund-level expenses on a proportionate basis and then from class specific expenses. When only certain classes exceed their expense caps, waivers and/or reimbursements are applied against class specific expenses before fund-level expenses. Allspring Funds Management has contractually committed through April 30, 2024 to waive fees and/or reimburse expenses to the extent necessary to cap the Fund’s expenses. Prior to or after the commitment expiration date, the cap may be increased or the commitment to maintain the cap may be terminated only with the approval of the Board of Trustees. As of December 31, 2023, the contractual expense caps are as follows:
Distribution fee
The Trust has adopted a distribution plan for Class 2 shares pursuant to Rule 12b-1 under the 1940 Act. A distribution fee is charged to Class 2 shares and paid to Allspring Funds Distributor, LLC, the principal underwriter, an affiliate of Allspring Funds Management, at an annual rate up to 0.25% of the average daily net assets of Class 2 shares.
Interfund transactions
The Fund may purchase or sell portfolio investment securities to certain affiliates pursuant to Rule 17a-7 under the 1940 Act and under procedures adopted by the Board of Trustees. The procedures have been designed to ensure that these interfund transactions, which do not incur broker commissions, are effected at current market prices. Pursuant to these procedures, the Fund did not have any interfund transactions during the year ended December 31, 2023.
5.
INVESTMENT PORTFOLIO TRANSACTIONS
Purchases and sales of investments, excluding U.S. government obligations (if any) and short-term securities, for the year ended December 31, 2023 were $78,315,320 and $82,411,197, respectively.
The Trust, Allspring Master Trust and Allspring Funds Trust (excluding the money market funds) are parties to a $350,000,000 revolving credit agreement whereby the Fund is permitted to use bank borrowings for temporary or emergency purposes, such as to fund shareholder redemption requests. Interest under the credit agreement is charged to the Fund based on borrowing rate equal to the higher of the Federal Funds rate or the overnight bank funding rate in effect on that day plus a spread. In addition, an annual commitment fee based on the unused balance is allocated to each participating fund.
24 | Allspring VT International Equity Fund
Notes to financial statements
For the year ended December 31, 2023, there were no borrowings by the Fund under the agreement.
7.
DISTRIBUTIONS TO SHAREHOLDERS
The tax character of distributions paid was $912,855 and $2,325,374 of ordinary income for the years ended December 31, 2023 and December 31, 2022, respectively.
As of December 31, 2023, the components of distributable earnings on a tax basis were as follows:
Undistributed
ordinary
income | | |
| | |
As of the end of the period, the Fund concentrated its portfolio of investments in Europe. A fund that invests a substantial portion of its assets in any geographic region may be more affected by changes in that geographic region than would be a fund whose investments are not heavily weighted in any geographic region.
Under the Fund’s organizational documents, the officers and Trustees have been granted certain indemnification rights against certain liabilities that may arise out of performance of their duties to the Fund. The Fund has entered into a separate agreement with each Trustee that converts indemnification rights currently existing under the Fund’s organizational documents into contractual rights that cannot be changed in the future without the consent of the Trustee. Additionally, in the normal course of business, the Fund may enter into contracts with service providers that contain a variety of indemnification clauses. The Fund’s maximum exposure under these arrangements is dependent on future claims that may be made against the Fund and, therefore, cannot be estimated.
Allspring VT International Equity Fund | 25
Report of independent registered public accounting firm
To the Shareholders of the Fund and Board of Trustees
Allspring Variable Trust:
Opinion on the Financial Statements
We have audited the accompanying statement of assets and liabilities of Allspring VT International Equity Fund (the Fund), one of the funds constituting Allspring Variable Trust, including the portfolio of investments, as of December 31, 2023, the related statement of operations for the year then ended, the statements of changes in net assets for each of the years in the two-year period then ended, and the related notes (collectively, the financial statements) and the financial highlights for each of the years in the five-year period then ended. In our opinion, the financial statements and financial highlights present fairly, in all material respects, the financial position of the Fund as of December 31, 2023, the results of its operations for the year then ended, the changes in its net assets for each of the years in the two-year period then ended, and the financial highlights for each of the years in the five-year period then ended, in conformity with U.S. generally accepted accounting principles.
Basis for Opinion
These financial statements and financial highlights are the responsibility of the Fund’s management. Our responsibility is to express an opinion on these financial statements and financial highlights based on our audits. We are a public accounting firm registered with the Public Company Accounting Oversight Board (United States) (PCAOB) and are required to be independent with respect to the Fund in accordance with the U.S. federal securities laws and the applicable rules and regulations of the Securities and Exchange Commission and the PCAOB.
We conducted our audits in accordance with the standards of the PCAOB. Those standards require that we plan and perform the audit to obtain reasonable assurance about whether the financial statements and financial highlights are free of material misstatement, whether due to error or fraud. Our audits included performing procedures to assess the risks of material misstatement of the financial statements and financial highlights, whether due to error or fraud, and performing procedures that respond to those risks. Such procedures included examining, on a test basis, evidence regarding the amounts and disclosures in the financial statements and financial highlights. Such procedures also included confirmation of securities owned as of December 31, 2023, by correspondence with the custodian, transfer agent and brokers, or by other appropriate auditing procedures. Our audits also included evaluating the accounting principles used and significant estimates made by management, as well as evaluating the overall presentation of the financial statements and financial highlights. We believe that our audits provide a reasonable basis for our opinion.

We have not been able to determine the specific year that we began serving as the auditor of one or more Allspring Funds investment companies; however, we are aware that we have served as the auditor of one or more Allspring Funds investment companies since at least 1955.
Boston, Massachusetts
February 26, 2024
26 | Allspring VT International Equity Fund
Other information (unaudited)
Other information
Tax information
For corporate shareholders, pursuant to Section 854 of the Internal Revenue Code, 6% of ordinary income dividends qualify for the corporate dividends-received deduction for the fiscal year ended December 31, 2023.
Pursuant to Section 853 of the Internal Revenue Code, the following amounts have been designated as foreign taxes paid for the fiscal year ended December 31, 2023. These amounts may be less than the actual foreign taxes paid for financial statement purposes. Foreign taxes paid or withheld should be included in taxable income with an offsetting deduction from gross income or as a credit for taxes paid to foreign governments. None of the income was derived from ineligible foreign sources as defined under Section 901(j) of the Internal Revenue Code.
Creditable
foreign taxes
paid | | Foreign
income as % of
ordinary income
distributions |
| | |
Proxy voting information
A description of the policies and procedures used to determine how to vote proxies relating to portfolio securities is available without charge, upon request, by calling 1-866-259-3305, visiting our website at allspringglobal.com, or visiting the SEC website at sec.gov. Information regarding how the proxies related to portfolio securities were voted during the most recent 12-month period ended June 30 is available on the website at allspringglobal.com or by visiting the SEC website at sec.gov.
Quarterly portfolio holdings information
The Fund files its complete schedule of portfolio holdings with the SEC for the first and third quarters of each fiscal year as an exhibit to its reports on Form N-PORT. Shareholders may view the filed Form N-PORT by visiting the SEC website at sec.gov.
Allspring VT International Equity Fund | 27
Other information (unaudited)
Board of trustees and officers
Each of the Trustees and Officers listed in the table below acts in identical capacities for each fund in the Allspring family of funds, which consists of 117 mutual funds comprising the Allspring Funds Trust, Allspring Variable Trust, Allspring Master Trust and four closed-end funds (collectively the “Fund Complex”). This table should be read in conjunction with the Prospectus and the Statement of Additional Information†. The mailing address of each Trustee and Officer is 1415 Vantage Park Drive, 3rd Floor, Charlotte, NC 28203. Each Trustee and Officer serves an indefinite term, however, each Trustee serves such term until reaching the mandatory retirement age established by the Trustees.
Independent Trustees
| | Principal occupations during past five years or longer | Current other
public company or
investment
company
directorships |
William R. Ebsworth
(Born 1957) | | Retired. From 1984 to 2013, equities analyst, portfolio manager, research director and chief investment officer at Fidelity Management and Research Company in Boston, Tokyo, and Hong Kong, and retired in 2013 as Chief Investment Officer of Fidelity Strategic Advisers, Inc. where he led a team of investment professionals managing client assets. Prior thereto, Board member of Hong Kong Securities Clearing Co., Hong Kong Options Clearing Corp., the Thailand International Fund, Ltd., Fidelity Investments Life Insurance Company, and Empire Fidelity Investments Life Insurance Company. Serves on the Investment Company Institute’s Board of Governors since 2022 and Executive Committee since 2023 as well as the Vice Chairman of the Governing Council of the Independent Directors Council since 2023. Audit Committee Chair and Investment Committee Chair of the Vincent Memorial Hospital Foundation (non-profit organization). Mr. Ebsworth is a CFA charterholder. | |
Jane A. Freeman
(Born 1953) | Trustee,
since 2015;
Chair Liaison,
| Retired. From 2012 to 2014 and 1999 to 2008, Chief Financial Officer of Scientific Learning Corporation. From 2008 to 2012, Ms. Freeman provided consulting services related to strategic business projects. Prior to 1999, Portfolio Manager at Rockefeller & Co. and Scudder, Stevens & Clark. Board member of the Harding Loevner Funds from 1996 to 2014, serving as both Lead Independent Director and chair of the Audit Committee. Board member of the Russell Exchange Traded Funds Trust from 2011 to 2012 and the chair of the Audit Committee. Ms. Freeman is also an inactive Chartered Financial Analyst. | |
Isaiah Harris, Jr.
(Born 1952) | Trustee,
since 2009;
Audit Committee Chair,
since 2019 | Retired. Member of the Advisory Board of CEF of East Central Florida. Chairman of the Board of CIGNA Corporation from 2009 to 2021, and Director from 2005 to 2008. From 2003 to 2011, Director of Deluxe Corporation. Prior thereto, President and CEO of BellSouth Advertising and Publishing Corp. from 2005 to 2007, President and CEO of BellSouth Enterprises from 2004 to 2005 and President of BellSouth Consumer Services from 2000 to 2003. Emeritus member of the Iowa State University Foundation Board of Governors. Emeritus Member of the Advisory board of Iowa State University School of Business. Advisory Board Member, Palm Harbor Academy (private school). Advisory Board Member, Fellowship of Christian Athletes. Mr. Harris is a certified public accountant (inactive status). | |
David F. Larcker
(Born 1950) | | Distinguished Visiting Fellow at the Hoover Institution since 2022. James Irvin Miller Professor of Accounting at the Graduate School of Business (Emeritus), Stanford University, Director of the Corporate Governance Research Initiative and Senior Faculty of The Rock Center for Corporate Governance since 2006. From 2005 to 2008, Professor of Accounting at the Graduate School of Business, Stanford University. Prior thereto, Ernst & Young Professor of Accounting at The Wharton School, University of Pennsylvania from 1985 to 2005. | |
Olivia S. Mitchell
(Born 1953) | | International Foundation of Employee Benefit Plans Professor since 1993, Wharton School of the University of Pennsylvania. Director of Wharton’s Pension Research Council and Boettner Center on Pensions & Retirement Research, and Research Associate at the National Bureau of Economic Research. Previously taught at Cornell University from 1978 to 1993. | |
Timothy J. Penny
(Born 1951) | Trustee,
since 1996;
Chair,
since 2018 | President and Chief Executive Officer of Southern Minnesota Initiative Foundation, a non-profit organization, since 2007. Vice Chair of the Economic Club of Minnesota, since 2007. Co-Chair of the Committee for a Responsible Federal Budget, since 1995. Member of the Board of Trustees of NorthStar Education Finance, Inc., a non-profit organization, from 2007-2022. Senior Fellow of the University of Minnesota Humphrey Institute from 1995 to 2017. | |
* Length of service dates reflect the Trustee’s commencement of service with the Trust’s predecessor entities, where applicable.
# Ms. Freeman will serve as Chair Liaison through June 2024, at which time Ms. Wheelock will assume the role.
†
The Statement of Additional Information includes additional information about the Trustees and is available, without charge, upon request, by calling 1-800-260-5969 or by visiting the website at allspringglobal.com.
28 | Allspring VT International Equity Fund
Other information (unaudited)
| Position held and length of service* | Principal occupations during past five years or longer | Current other public company or investment company directorships |
James G. Polisson
(Born 1959) | Trustee,
since 2018; Nominating and Governance Committee Chair, since 2024 | Retired. Chief Marketing Officer, Source (ETF) UK Services, Ltd, from 2015 to 2017. From 2012 to 2015, Principal of The Polisson Group, LLC, a management consulting, corporate advisory and principal investing company. Chief Executive Officer and Managing Director at Russell Investments, Global Exchange Traded Funds from 2010 to 2012. Managing Director of Barclays Global Investors from 1998 to 2010 and Global Chief Marketing Officer for iShares and Barclays Global Investors from 2000 to 2010. Trustee of the San Francisco Mechanics’ Institute, a non- profit organization, from 2013 to 2015. Board member of the Russell Exchange Traded Fund Trust from 2011 to 2012. Director of Barclays Global Investors Holdings Deutschland GmbH from 2006 to 2009. Mr. Polisson is an attorney and has a retired status with the Massachusetts and District of Columbia Bar Associations. | |
Pamela Wheelock
(Born 1959) | Trustee,
since January 2020;
previously Trustee from
January 2018 to
| Retired. Executive and Senior Financial leadership positions in the public, private and nonprofit sectors. Interim President and CEO, McKnight Foundation, 2020. Interim Commissioner, Minnesota Department of Human Services, 2019. Chief Operating Officer, Twin Cities Habitat for Humanity, 2017-2019. Vice President for University Services, University of Minnesota, 2012- 2016. Interim President and CEO, Blue Cross and Blue Shield of Minnesota, 2011-2012. Executive Vice-President and Chief Financial Officer, Minnesota Wild, 2002-2008. Commissioner, Minnesota Department of Finance, 1999-2002. Chair of the Board of Directors of Destination Medical Center Corporation. Board member of the Minnesota Wild Foundation. | |
* Length of service dates reflect the Trustee’s commencement of service with the Trust’s predecessor entities, where applicable.
# Ms. Freeman will serve as Chair Liaison through June 2024, at which time Ms. Wheelock will assume the role.
Allspring VT International Equity Fund | 29
Other information (unaudited)
Officers1
| Position held and
length of service | Principal occupations during past five years or longer |
| | President and Chief Executive Officer of Allspring Funds Management, LLC since 2017 and Head of Global Fund Governance of Allspring Global Investments since 2022. Prior thereto, co-president of Galliard Capital Management, LLC, an affiliate of Allspring Funds Management, LLC, from 2019 to 2022 and Head of Affiliated Managers, Allspring Global Investments, from 2014 to 2019 and Executive Vice President responsible for marketing, investments and product development for Allspring Funds Management, LLC, from 2009 to 2014. |
Jeremy DePalma
(Born 1974) | Treasurer,
since 2012
(for certain funds in
the Fund Complex);
since 2021 (for
the remaining funds in the Complex) | Senior Vice President of Allspring Funds Management, LLC since 2009. Senior Vice President of Evergreen Investment Management Company, LLC from 2008 to 2010 and head of the Fund Reporting and Control Team within Fund Administration from 2005 to 2010. |
Christopher Baker
(Born 1976) | Chief Compliance Officer,
since 2022 | Global Chief Compliance Officer for Allspring Global Investments since 2022. Prior thereto, Chief Compliance Officer for State Street Global Advisors from 2018 to 2021. Senior Compliance Officer for the State Street divisions of Alternative Investment Solutions, Sector Solutions, and Global Marketing from 2015 to 2018. From 2010 to 2015 Vice President, Global Head of Investment and Marketing Compliance for State Street Global Advisors. |
Matthew Prasse
(Born 1983) | Chief Legal Officer,
since 2022;
Secretary,
since 2021 | Senior Counsel of the Allspring Legal Department since 2021. Senior Counsel of the Wells Fargo Legal Department from 2018 to 2021. Previously, Counsel for Barings LLC from 2015 to 2018. Prior to joining Barings, Associate at Morgan, Lewis & Bockius LLP from 2008 to 2015. |
1 For those Officers with tenures at Allspring Global Investments and/or Allspring Funds Management, LLC that began prior to 2021, such tenures include years of service during which these businesses/entities were known as Wells Fargo Asset Management and Wells Fargo Funds Management, LLC, respectively.
30 | Allspring VT International Equity Fund
This page is intentionally left blank.
This page is intentionally left blank.
For more information
More information about Allspring Funds is available free upon request. To obtain literature, please write, visit the Fund’s website, or call:
Allspring Funds
P.O. Box 219967
Kansas City, MO 64121-9967
Website: allspringglobal.com
Individual investors: 1-800-260-5969
Retail investment professionals: 1-888-877-9275
Institutional investment professionals: 1-866-765-0778
This report and the financial statements contained herein are submitted for the general information of the shareholders of the Fund. If this report is used for promotional purposes, distribution of the report must be accompanied or preceded by a current prospectus. Before investing, please consider the investment objectives, risks, charges, and expenses of the investment. For a current prospectus and, if available, a summary prospectus, containing this information, call 1-800-260-5969 or visit the Fund’s website at allspringglobal.com. Read the prospectus carefully before you invest or send money.
Allspring Global InvestmentsTM is the trade name for the asset management firms of Allspring Global Investments Holdings, LLC, a holding company indirectly owned by certain private funds of GTCR LLC and Reverence Capital Partners, L.P. These firms include but are not limited to Allspring Global Investments, LLC, and Allspring Funds Management, LLC. Certain products managed by Allspring entities are distributed by Allspring Funds Distributor, LLC (a broker-dealer and Member FINRA/SIPC).
This material is for general informational and educational purposes only and is NOT intended to provide investment advice or a recommendation of any kind - including a recommendation for any specific investment, strategy, or plan.
© 2024 Allspring Global Investments Holdings, LLC. All rights reserved.
ALL-01052024-pmmfn61b 02-24
AR3008 12-23
Allspring VT Opportunity Fund
Annual Report
December 31, 2023
The views expressed and any forward-looking statements are as of December 31, 2023, unless otherwise noted, and are those of the Fund’s portfolio managers and/or Allspring Global Investments. Discussions of individual securities or the markets generally are not intended as individual recommendations. Future events or results may vary significantly from those expressed in any forward-looking statements. The views expressed are subject to change at any time in response to changing circumstances in the market. Allspring Global Investments disclaims any obligation to publicly update or revise any views expressed or forward-looking statements.
Allspring VT Opportunity Fund | 1
Letter to shareholders (unaudited)
Andrew Owen
President
Allspring Funds
Dear Shareholder:
We are pleased to offer you this annual report for the Allspring VT Opportunity Fund for the 12-month period that ended December 31, 2023. Globally, stocks and bonds experienced high levels of volatility throughout the period but had positive overall results. The market was focused on persistently high inflation and the impact of ongoing aggressive central bank rate hikes. Compounding these concerns were the global reverberations of the Russia-Ukraine war. Riskier assets rallied in 2023, as investors anticipated an end to the tight monetary policy despite concerns of a possible recession. After suffering deep and broad losses through 2022, bonds now benefit from a base of higher yields that can help generate higher income.
For the 12-month period, stocks generally outperformed bonds—both domestic U.S. and global. For the period, U.S. stocks, based on the S&P 500 Index,1 gained 26.29%. International stocks, as measured by the MSCI ACWI ex USA Index (Net),2 returned 15.62%, while the MSCI EM Index (Net) (USD)3 had more modest performance, with a gain of 9.83%. Among bond indexes, the Bloomberg U.S. Aggregate Bond Index4 returned 5.53%, the Bloomberg Global Aggregate ex-USD Index (unhedged)5 gained 5.72%, the Bloomberg Municipal Bond Index6 returned 6.40%, and the ICE BofA U.S. High Yield Index7 gained 13.54%.
Despite high inflation and central bank rate hikes, markets rallied.
The year 2023 began with a rally across global equities and fixed income securities. Investor optimism rose in response to data indicating declining inflation rates and the reopening of China’s economy with the abrupt end to its zero-COVID-19 policy. The U.S. reported strong job gains and unemployment fell to 3.4%—the lowest level since 1969. Meanwhile, wage growth, seen as a potential contributor to ongoing high inflation, continued to moderate. All eyes remained on the Federal Reserve (Fed) and on how many more rate hikes remain in this tightening cycle. The 0.25% federal funds rate hike announced in January was the Fed’s smallest rate increase since March 2022.
Markets declined in February as investors responded unfavorably to resilient economic data. The takeaway: Central banks would likely continue their monetary tightening cycle for longer than markets had priced in. In this environment—where strong economic data is seen as bad news—the resilient U.S. labor market was taken as a negative, with inflation not falling quickly enough for the Fed, which raised interest rates by 0.25% in February. Meanwhile, the Bank of England (BoE) and the European Central Bank (ECB) both raised rates by 0.50%.
1
The S&P 500 Index consists of 500 stocks chosen for market size, liquidity, and industry group representation. It is a market-value-weighted index with each stock’s weight in the index proportionate to its market value. You cannot invest directly in an index.
2
The Morgan Stanley Capital International (MSCI) All Country World Index (ACWI) ex USA Index (Net) is a free-float-adjusted market-capitalization-weighted index that is designed to measure the equity market performance of developed and emerging markets, excluding the U.S. Source: MSCI. MSCI makes no express or implied warranties or representations and shall have no liability whatsoever with respect to any MSCI data contained herein. The MSCI data may not be further redistributed or used as a basis for other indexes or any securities or financial products. This report is not approved, reviewed, or produced by MSCI. You cannot invest directly in an index.
3
The MSCI Emerging Markets (EM) Index (Net) (USD) is a free-float-adjusted market-capitalization-weighted index that is designed to measure the equity market performance of emerging markets. You cannot invest directly in an index.
4
The Bloomberg U.S. Aggregate Bond Index is a broad-based benchmark that measures the investment-grade, U.S.-dollar-denominated, fixed-rate taxable bond market, including Treasuries, government-related and corporate securities, mortgage-backed securities (agency fixed-rate and hybrid adjustable-rate mortgage pass-throughs), asset-backed securities, and commercial mortgage-backed securities. You cannot invest directly in an index.
5
The Bloomberg Global Aggregate ex-USD Index (unhedged) is an unmanaged index that provides a broad-based measure of the global investment-grade fixed-income markets excluding the U.S.-dollar-denominated debt market. You cannot invest directly in an index.
6
The Bloomberg Municipal Bond Index is an unmanaged index composed of long-term tax-exempt bonds with a minimum credit rating of Baa. You cannot invest directly in an index.
7
The ICE BofA U.S. High Yield Index is a market-capitalization-weighted index of domestic and Yankee high yield bonds. The index tracks the performance of high yield securities traded in the U.S. bond market. You cannot invest directly in an index. Copyright 2024. ICE Data Indices, LLC. All rights reserved.
2 | Allspring VT Opportunity Fund
Letter to shareholders (unaudited)
“ The collapse of Silicon Valley Bank in March—the second-largest banking failure in U.S. history—led to a bank run that spread to Europe, where Switzerland’s Credit Suisse was taken over by its rival, UBS. ”
The collapse of Silicon Valley Bank in March—the second-largest banking failure in U.S. history—led to a bank run that spread to Europe, where Switzerland’s Credit Suisse was taken over by its rival, UBS. The banking industry turmoil created an additional challenge for central banks in balancing inflationary concerns against potential economic weakening. Meanwhile, recent data pointed to economic strength in the U.S., Europe, and China. And China’s economy continued to rebound after the removal of its COVID-19 lockdown. Inflation rates in the U.S., the U.K., and the eurozone all remained higher than central bank targets, leading to additional rate hikes in March.
Economic data released in April pointed to global resilience, as Purchasing Managers Indexes1 in the U.S., U.K., and eurozone beat expectations and China reported first-quarter annualized economic growth of 4.5%. Despite banking industry stress, developed market stocks had monthly gains. The U.S. labor market remained strong, with a 3.5% jobless rate and monthly payroll gains above 200,000. However, uncertainty and inflationary concerns weighed on investors in the U.S. and abroad.
May was marked by a divergence between expanding activity in services and an overall contraction in manufacturing activity in the U.S., U.K., and eurozone. Core inflation remained elevated in the U.S. and Europe, despite the ongoing efforts of the Fed and the ECB, which included rate hikes of 0.25% by both in May. Stubborn inflation and the resilient U.S. labor market led to expectations of further interest rate hikes, overall monthly declines across bond indexes, and mixed results for stocks in May. Investor worries over a U.S. debt ceiling impasse were modest, and market confidence was buoyed by a deal in late May to avert a potential U.S. debt default.
June featured the Fed’s first pause on interest rate hikes since March 2022, when it began its aggressive campaign to rein in inflation. However, inflation, as measured by the Core Consumer Price Index (CPI)2, while continuing to decline, remained stubbornly high in June at 4.8%, well above the Fed’s 2.0% target rate. With the U.S. unemployment rate still at 3.6%, near a historical low, and U.S. payrolls growing in June for the 30th consecutive month, expectations of more Fed rate hikes were reinforced. However, U.S. and global stocks had strong returns in June.
July was a good month for stocks. However, bonds had more muted but positive monthly returns overall. Riskier sectors and regions tended to do well, as investors grew more optimistic regarding economic prospects. With strong second-quarter gross domestic product (GDP) growth—initially estimated at 2.4%—and U.S. annual inflation easing steadily to 3.2% in July, hopes for a soft economic landing grew. The Fed, the ECB, and the BoE all raised their respective key interest rates by 0.25% in July. In the Fed’s case, speculation grew that it could be very close to the end of its tightening cycle. Meanwhile, China’s economy showed signs of stagnation, renewing concerns of global fallout.
Stocks retreated in August while monthly bond returns were flat overall. Increased global market volatility reflected unease over the Chinese property market being stressed along with weak Chinese economic data. On a more positive note, speculation grew over a possible end to the Fed’s campaign of interest rate increases or at least a pause in September. U.S. economic data generally remained solid, with resilient job market data and inflation ticking up slightly in August, as the annual CPI3 rose 3.7%. However, the three-month trend for Core CPI stood at a more encouraging annualized 2.4%.
1
The Purchasing Managers Index (PMI) is an index of the prevailing direction of economic trends in the manufacturing and service sectors. You cannot invest directly in an index.
2
The Core Consumer Price Index (CPI) is a measure of the average change over time in the prices paid by urban consumers for a market basket of consumer goods and services excluding energy and food prices. You cannot invest directly in an index.
3
The CPI is a measure of the average change over time in the prices paid by urban consumers for a market basket of consumer goods and services. You cannot invest directly in an index.
Allspring VT Opportunity Fund | 3
Letter to shareholders (unaudited)
Stocks and bonds both had negative overall returns in September as investors reluctantly recited the new chorus of “higher for longer,” led by the Fed’s determination not to lower interest rates until it knows it has vanquished its pesky opponent—higher-than-targeted inflation. As of September, the two primary gauges of U.S. inflation—the annual Core Personal Consumption Expenditures Price Index1 and the CPI—both stood at roughly 4%, twice as high as the Fed’s oft-stated 2% target. The month ended with the prospect of yet another U.S. government shutdown, averted at least temporarily but looming later this fall.
October was a tough month for stocks and bonds. Key global and domestic indexes all were pushed down by rising geopolitical tensions, particularly the Israel-Hamas conflict, and concerns over the Fed’s “higher for longer” monetary policy. The U.S. 10-year Treasury yield rose above 5% for the first time since 2007. Commodity prices did well as oil prices rallied in response to the prospect of oil supply disruptions from the Middle East. U.S. annualized third-quarter GDP was estimated at a healthier-than-anticipated 4.9%. China’s GDP indicated surprisingly strong industrial production and retail sales, offset by ongoing weakness in its real estate sector.
In November, the market mood turned positive as cooling inflation inspired confidence that central banks could hold off on further rate hikes. Overall annual inflation in the U.S. fell to 3.1% in November while 12-month inflation in the U.K. and eurozone eased to 4.6% and 2.4%, respectively—far below their peak levels of mid-2022. Third quarter annualized U.S. GDP growth was raised to an estimated 5.2% while U.S. job totals rose by just below 200,000 in November, indicating a slight cooling of the labor market. All of this fresh evidence added to confidence for a U.S. soft economic landing, leading to a more buoyant mood heading into winter as the Federal Open Market Committee held rates steady at its December meeting.
The broad year-end rally among stocks and bonds that began in November continued through December as investors became more confident that monetary policy would ease in 2024. Supporting the bubbly market mood were a series of reports confirming lower inflationary trends in the U.S. and Europe. During the period, it appeared more likely that the U.S. economy could achieve a soft landing, cooling enough to lower inflation without the pain of a recession. However, by year-end, an expectations gap developed. Capital markets priced in a total of 1.50 percentage points in federal funds rate cuts in 2024—twice as much as the three cuts of 0.25% hinted at by Fed officials.
“ In November, the market mood turned positive as cooling inflation inspired confidence that central banks could hold off on further rate hikes. ”
1
The Core Personal Consumption Expenditures Price Index (PCE) is a measure of prices that people living in the United States, or those buying on their behalf, pay for goods and services. It is sometimes called the core PCE price index, because two categories that can have price swings – food and energy – are left out to make underlying inflation easier to see. You cannot invest directly in an index.
4 | Allspring VT Opportunity Fund
Letter to shareholders (unaudited)
For further information about your fund, contact your investment professional, visit our website at allspringglobal.com, or call us directly at 1-800-260-5969.
Don’t let short-term uncertainty derail long-term investment goals.
Periods of investment uncertainty can present challenges, but experience has taught us that maintaining long-term investment goals can be an effective way to plan for the future. To help you create a sound strategy based on your personal goals and risk tolerance, Allspring Funds offers more than 100 mutual funds spanning a wide range of asset classes and investment styles. Although diversification cannot guarantee an investment profit or prevent losses, we believe it can be an effective way to manage investment risk and potentially smooth out overall portfolio performance. We encourage investors to know their investments and to understand that appropriate levels of risk-taking may unlock opportunities.
Thank you for choosing to invest with Allspring Funds. We appreciate your confidence in us and remain committed to helping you meet your financial needs.
Sincerely,
Andrew Owen
President
Allspring Funds
Allspring VT Opportunity Fund | 5
Letter to shareholders (unaudited)
|
Beginning in July 2024, the Fund will be required by the Securities and Exchange Commission to send shareholders a paper copy of a new tailored shareholder report in place of the full shareholder report that you are now receiving. The tailored shareholder report will contain concise information about the Fund, including certain expense and performance information and fund statistics. If you wish to receive this new tailored shareholder report electronically, please follow the instructions on the back cover of this report. |
Other information that is currently included in the shareholder report, such as the Fund’s financial statements, will be available online and upon request, free of charge, in paper or electronic format. |
6 | Allspring VT Opportunity Fund
This page is intentionally left blank.
Performance highlights (unaudited)
Performance highlights
| The Fund seeks long-term capital appreciation |
| Allspring Funds Management, LLC |
| Allspring Global Investments, LLC |
| Christopher G. Miller, CFA |
Average annual total returns (%) as of December 31, 2023 |
| | | | | |
| | | | | | |
| | | | | | |
| | | | | | |
| | | | | | |
Figures quoted represent past performance, which is no guarantee of future results. Investment return and principal value of an investment will fluctuate so that an investor’s shares, when redeemed, may be worth more or less than their original cost. Current performance may be lower or higher than the performance data quoted and assumes the reinvestment of dividends and capital gains. Current month-end performance is available by calling 1-800-260-5969. Performance figures of the Fund do not reflect fees and expenses charged pursuant to the terms of variable life insurance policies and variable annuity contracts. If these fees and expenses had been reflected, performance would have been lower.
Index returns do not include transaction costs associated with buying and selling securities, any mutual fund fees or expenses, or any taxes. It is not possible to invest directly in an index.
Shares are sold without a front-end sales charge or contingent deferred sales charge.
|
| Reflects the expense ratios as stated in the most recent prospectuses. The expense ratios shown are subject to change and may differ from the annualized expense ratios shown in the Financial Highlights of this report. |
| The manager has contractually committed through April 30, 2024, to waive fees and/or reimburse expenses to the extent necessary to cap total annual fund operating expenses after fee waivers at 0.75% for Class 1 shares and 1.00% for Class 2 shares. Brokerage commissions, stamp duty fees, interest, taxes, acquired fund fees and expenses (if any), and extraordinary expenses are excluded from the expense caps. Prior to or after the commitment expiration date, the caps may be increased or the commitment to maintain the caps may be terminated only with the approval of the Board of Trustees. Without these caps, the Fund’s returns would have been lower. The expense ratio paid by an investor is the net expense ratio (the total annual fund operating expenses after fee waivers) as stated in the prospectuses. |
| The Russell 3000® Index measures the performance of the 3,000 largest U.S. companies based on total market capitalization, which represents approximately 98% of the investable U.S. equity market. You cannot invest directly in an index. |
Stock values fluctuate in response to the activities of individual companies and general market and economic conditions. Smaller-company stocks tend to be more volatile and less liquid than those of larger companies. Certain investment strategies tend to increase the total risk of an investment (relative to the broader market). This fund is exposed to foreign investment risk. Consult the Fund’s prospectus for additional information on these and other risks.
Please refer to the prospectus provided by your participating insurance company for detailed information describing the separate accounts for information regarding surrender charges, mortality and expense risk fees, and other charges that may be assessed by the participating insurance companies.
CFA® and Chartered Financial Analyst® are trademarks owned by CFA Institute. |
8 | Allspring VT Opportunity Fund
Performance highlights (unaudited)
Growth of $10,000 investment as of December 31, 20231 |
| The chart compares the performance of Class 2 shares for the most recent ten years with the Russell 3000® Index. The chart assumes a hypothetical investment of $10,000 in Class 2 shares and reflects all operating expenses of the Fund but does not reflect fees and expenses charged pursuant to the terms of variable life insurance policies and variable annuity contracts. |
Allspring VT Opportunity Fund | 9
Performance highlights (unaudited)
MANAGER’S DISCUSSION
Fund highlights
•The Fund outperformed its benchmark, the Russell 3000® Index, for the 12-month period that ended December 31, 2023.
•The communication services and health care sectors aided relative performance during the period.
•Stocks within the information technology (IT), real estate, materials, and consumer staples sectors hampered relative performance during the period.
Stocks soared in 2023, staging a dramatic comeback after a turbulent year.
Markets began 2023 on jittery footing as investors feared that the prolonged elevated interest rate backdrop would stifle consumer spending and in turn impede corporate earnings. However, as the year progressed, investors grew more confident in the consistency of lower inflation data as well as the consumer’s ability to withstand higher interest rates. Large-cap growth stocks were the demonstrative market leaders as exuberance around artificial intelligence (AI) sent the Nasdaq 100 Index† higher by 54%. By contrast, the Russell 2000® Index* struggled amid the collapse of Silicon Valley Bank in March and failed to regain its footing until the final two months of the year.
Ten largest holdings (%) as of December 31, 20231 |
| |
| |
| |
| |
| |
| |
Meta Platforms, Inc. Class A | |
| |
Teledyne Technologies, Inc. | |
| |
| Figures represent the percentage of the Fund’s net assets. Holdings are subject to change and may have changed since the date specified. |
After the sharp return disparity between large-cap/mega-cap stocks and small-cap/mid-cap stocks over the past several years, the valuation dispersion between the groups is at multi-decade extremes. Thus, our overweight to mid caps and small caps augurs well for our style on a prospective basis. We fully acknowledge that the path forward may be volatile, but we remain encouraged by the attractive private market values (PMVs) of our holdings and their respective catalysts in place.
Communication services and health care contributed while consumer discretionary, IT, and select consumer staples stocks hindered relative results.
Within communication services, Meta Inc. rose sharply as the company significantly improved its topline growth and profit margins as well as favorable engagement metrics driven by Reels. While we believe the company provides a best-in-class return on investment for advertisers within digital advertising, we trimmed our position as the stock has become more fully valued relative to our PMV. Within health care, our underweight to pharmaceuticals added to relative performance as large-cap pharma and other yield-sensitive sectors were adversely affected by the sharp rise in interest rates. One notable takeout in the Fund was Splunk Inc., which agreed to be acquired by Cisco Systems, Inc., for $157
per share or $28 billion in cash, a figure in line with our PMV.
Sector allocation as of December 31, 20231 |
| Figures represent the percentage of the Fund’s long-term investments. Allocations are subject to change and may have changed since the date specified. |
†The Nasdaq 100 Index is an unmanaged group of the 100 biggest companies listed on the Nasdaq Composite Index. The list is updated quarterly, and companies on this index are typically representative of technology-related industries, such as computer hardware and software products, telecommunications, biotechnology, and retail/wholesale trade. You cannot invest directly in an index.
*The Russell 2000® Index measures the performance of the 2,000 smallest companies in the Russell 3000® Index, which represents approximately 8% of the total market capitalization of the Russell 3000® Index. You cannot invest directly in an index.
10 | Allspring VT Opportunity Fund
Performance highlights (unaudited)
Within IT, the Fund’s underweight to key AI players, including NVIDIA and Microsoft, impeded relative performance as those stocks rallied sharply during the period. In the consumer staples sector, discount retailer Dollar General Inc. stock fell sharply after it reported weaker earnings results, citing softness from the low-end consumer. For much of the year, the company was burdened with higher labor costs and embattled lower markups and an increase in lost inventory. In general, we have witnessed that spending trends from the upper to middle-income consumer seem relatively stable, but the lower-income cohort has been adversely affected by less stimulus, higher inflation, and elevated interest rates, which has resulted in higher credit card balances. We have also noticed consumers start to trade down in retail as inflationary factors have continued to erode household budgets.
The case for companies exposed to the physical economy.
The post-COVID hangover has exposed the chronic underinvestment in U.S. infrastructure and has crystalized the need for companies to be more exposed to the physical economy. We believe firms that stand to benefit from the reshoring and infrastructure movement are not the digitally
oriented mega-cap behemoths that have dominated markets over the past decade. Rather, we contend that the winners in this new regime could be the small- and mid-cap industrials stocks tied to the physical capital expenditure movement. Although our portfolio remains well balanced with exposure to a panoply of sectors and industries, our overweight to the industrials and materials sectors could serve as a tailwind if investors focus on companies that can benefit from growing physical capital expenditures.
Our process, which goes back more than 30 years, has been successful over many market cycles. A key output of our bottom-up, active core approach is the ability to migrate to wherever the best opportunities in the market exist. Another key advantage to our PMV process is its ability to reconcile complex information through a standardized valuation framework that provides a consistent and transparent way to measure the value of diverse companies. This can help allay much of the noise in the marketplace and keep us focused on the long term by simplifying the decision-making process. Notwithstanding the market’s sanguine tone to finish the year, we are judiciously underwriting the PMVs of our stocks and searching for fresh investment opportunities that could serve as alpha drivers in the future.
Allspring VT Opportunity Fund | 11
Fund expenses (unaudited)
Fund expenses
As a shareholder of the Fund, you incur ongoing costs, including management fees, distribution (12b-1) fees and other Fund expenses. This example is intended to help you understand your ongoing costs (in dollars) of investing in the Fund and to compare these costs with the ongoing costs of investing in other mutual funds.
The example is based on an investment of $1,000 invested at the beginning of the six-month period and held for the entire period from July 1, 2023 to December 31, 2023.
Actual expenses
The “Actual” line of the table below provides information about actual account values and actual expenses. You may use the information in this line, together with the amount you invested, to estimate the expenses that you paid over the period. Simply divide your account value by $1,000 (for example, an $8,600 account value divided by $1,000= 8.6), then multiply the result by the number in the “Actual” line under the heading entitled “Expenses paid during period” for your applicable class of shares to estimate the expenses you paid on your account during this period.
Hypothetical example for comparison purposes
The “Hypothetical” line of the table below provides information about hypothetical account values and hypothetical expenses based on the Fund’s actual expense ratio and an assumed rate of return of 5% per year before expenses, which is not the Fund’s actual return. The hypothetical account values and expenses may not be used to estimate the actual ending account balance or expenses you paid for the period. You may use this information to compare the ongoing costs of investing in the Fund and other funds. To do so, compare this 5% hypothetical example with the 5% hypothetical examples that appear in the shareholder reports of the other funds.
Please note that the expenses shown in the table are meant to highlight your ongoing costs only and do not reflect any separate account charges assessed by participating insurance companies. Therefore, the “Hypothetical” line of the table is useful in comparing ongoing costs only, and will not help you determine the relative total costs of owning different funds. In addition, if these separate account charges assessed by participating insurance companies were included, your costs would have been higher.
| Beginning
account value
7-1-2023 | Ending
account value
12-31-2023 | | Annualized net
expense ratio |
| | | | |
| | | | |
Hypothetical (5% return before expenses) | | | | |
| | | | |
| | | | |
Hypothetical (5% return before expenses) | | | | |
| Expenses paid is equal to the annualized net expense ratio of each class multiplied by the average account value over the period, multiplied by 183 divided by 365 (to reflect the one-half-year period). |
12 | Allspring VT Opportunity Fund
Portfolio of investments—December 31, 2023
| | | | | |
| | | | | | |
Communication services: 6.97% | | | | | | |
Interactive media & services: 6.97% | | | | | | |
| | | | | | |
Meta Platforms, Inc. Class A† | | | | | | |
| | | | | | |
Consumer discretionary: 8.58% | | | | | | |
| | | | | | |
| | | | | | |
| | | | | | |
| | | | | | |
| | | | | | |
| | | | | | |
| | | | | | |
Consumer staples distribution & retail: 3.15% | | | | | | |
| | | | | | |
| | | | | | |
| | | | | | |
Household products: 1.30% | | | | | | |
Church & Dwight Co., Inc. | | | | | | |
| | | | | | |
| | | | | | |
| | | | | | |
Intercontinental Exchange, Inc. | | | | | | |
| | | | | | |
| | | | | | |
Financial services: 3.55% | | | | | | |
| | | | | | |
| | | | | | |
Marsh & McLennan Cos., Inc. | | | | | | |
| | | | | | |
Health care equipment & supplies: 4.14% | | | | | | |
| | | | | | |
| | | | | | |
| | | | | | |
| | | | | | |
| | | | | | |
Health care providers & services: 1.86% | | | | | | |
| | | | | | |
Life sciences tools & services: 4.71% | | | | | | |
Agilent Technologies, Inc. | | | | | | |
The accompanying notes are an integral part of these financial statements.
Allspring VT Opportunity Fund | 13
Portfolio of investments—December 31, 2023
| | | | | |
Life sciences tools & services(continued) | | | | | | |
Bio-Rad Laboratories, Inc. Class A† | | | | | | |
Thermo Fisher Scientific, Inc. | | | | | | |
| | | | | | |
| | | | | | |
Aerospace & defense: 4.08% | | | | | | |
| | | | | | |
| | | | | | |
| | | | | | |
| | | | | | |
| | | | | | |
| | | | | | |
| | | | | | |
| | | | | | |
Commercial services & supplies: 1.70% | | | | | | |
| | | | | | |
Electrical equipment: 2.16% | | | | | | |
| | | | | | |
| | | | | | |
| | | | | | |
| | | | | | |
| | | | | | |
Professional services: 2.54% | | | | | | |
Dun & Bradstreet Holdings, Inc. | | | | | | |
| | | | | | |
| | | | | | |
Trading companies & distributors: 1.46% | | | | | | |
| | | | | | |
Information technology: 24.50% | | | | | | |
Electronic equipment, instruments & components: 4.07% | | | | | | |
| | | | | | |
Teledyne Technologies, Inc.† | | | | | | |
| | | | | | |
Semiconductors & semiconductor equipment: 4.75% | | | | | | |
| | | | | | |
| | | | | | |
| | | | | | |
| | | | | | |
Palo Alto Networks, Inc.† | | | | | | |
| | | | | | |
| | | | | | |
The accompanying notes are an integral part of these financial statements.
14 | Allspring VT Opportunity Fund
Portfolio of investments—December 31, 2023
| | | | | |
| | | | | | |
| | | | | | |
| | | | | | |
| | | | | | |
Technology hardware, storage & peripherals: 5.25% | | | | | | |
| | | | | | |
| | | | | | |
| | | | | | |
| | | | | | |
| | | | | | |
| | | | | | |
| | | | | | |
| | | | | | |
| | | | | | |
| | | | | | |
Real estate management & development: 1.48% | | | | | | |
| | | | | | |
Residential REITs : 1.84% | | | | | | |
| | | | | | |
Specialized REITs : 4.36% | | | | | | |
| | | | | | |
| | | | | | |
| | | | | | |
| | | | | | |
Total common stocks (Cost $122,719,745) | | | | | | |
| | | | | |
Short-term investments: 3.44% | | | | | | |
Investment companies: 3.44% | | | | | | |
Allspring Government Money Market Fund Select Class♠∞ | | | | | | |
Total short-term investments (Cost $6,246,648) | | | | | | |
Total investments in securities (Cost $128,966,393) | | | | | | |
Other assets and liabilities, net | | | | | | |
| | | | | | |
| Non-income-earning security |
| The issuer of the security is an affiliated person of the Fund as defined in the Investment Company Act of 1940. |
| The rate represents the 7-day annualized yield at period end. |
|
| Real estate investment trust |
The accompanying notes are an integral part of these financial statements.
Allspring VT Opportunity Fund | 15
Portfolio of investments—December 31, 2023
Investments in affiliates
An affiliated investment is an investment in which the Fund owns at least 5% of the outstanding voting shares of the issuer or as a result of other relationships, such as the Fund and the issuer having the same investment manager. Transactions with issuers that were affiliates of the Fund at the end of the period were as follows:
| | | | | Net
change in
unrealized
gains
(losses) | | | Income
from
affiliated
securities |
| | | | | | | | |
Allspring Government Money Market Fund Select Class | | | | | | | | |
The accompanying notes are an integral part of these financial statements.
16 | Allspring VT Opportunity Fund
Statement of assets and liabilities—December 31, 2023
Financial statements
Statement of assets and liabilities
| |
Investments in unaffiliated securities, at value (cost $122,719,745) | |
Investments in affiliated securities, at value (cost $6,246,648) | |
| |
Receivable for Fund shares sold | |
Prepaid expenses and other assets | |
| |
| |
Payable for Fund shares redeemed | |
| |
| |
Administration fees payable | |
Trustees’ fees and expenses payable | |
Accrued expenses and other liabilities | |
| |
| |
| |
| |
Total distributable earnings | |
| |
Computation of net asset value per share | |
| |
Shares outstanding–Class 11 | |
Net asset value per share–Class 1 | |
| |
Shares outstanding–Class 21 | |
Net asset value per share–Class 2 | |
1 The Fund has an unlimited number of authorized shares.
The accompanying notes are an integral part of these financial statements.
Allspring VT Opportunity Fund | 17
Statement of operations—year ended December 31, 2023
Statement of operations
| |
Dividends (net of foreign withholdings taxes of $5,401) | |
Income from affiliated securities | |
| |
| |
| |
| |
| |
| |
| |
| |
| |
Custody and accounting fees | |
| |
Shareholder report expenses | |
Trustees’ fees and expenses | |
| |
| |
Less: Fee waivers and/or expense reimbursements | |
| |
| |
| |
Realized and unrealized gains (losses) on investments | |
Net realized gains (losses) on | |
| |
Foreign currency and foreign currency translations | |
Net realized gains on investments | |
Net change in unrealized gains (losses) on | |
| |
Foreign currency and foreign currency translations | |
Net change in unrealized gains (losses) on investments | |
Net realized and unrealized gains (losses) on investments | |
Net increase in net assets resulting from operations | |
The accompanying notes are an integral part of these financial statements.
18 | Allspring VT Opportunity Fund
Statement of changes in net assets
Statement of changes in net assets
| Year ended December 31, 2023 | Year ended December 31, 2022 |
| | | | |
Net investment income (loss) | | | | |
Net realized gains on investments | | | | |
Net change in unrealized gains (losses) on investments | | | | |
Net increase (decrease) in net assets resulting from operations | | | | |
Distributions to shareholders from | | | | |
Net investment income and net realized gains | | | | |
| | | | |
| | | | |
Total distributions to shareholders | | | | |
Capital share transactions | | | | |
Proceeds from shares sold | | | | |
| | | | |
| | | | |
| | | | |
Reinvestment of distributions | | | | |
| | | | |
| | | | |
| | | | |
Payment for shares redeemed | | | | |
| | | | |
| | | | |
| | | | |
Net increase (decrease) in net assets resulting from capital share transactions | | | | |
Total increase (decrease) in net assets | | | | |
| | | | |
| | | | |
| | | | |
The accompanying notes are an integral part of these financial statements.
Allspring VT Opportunity Fund | 19
Financial highlights
(For a share outstanding throughout each period)
| |
| | | | | |
Net asset value, beginning of period | | | | | |
Net investment income (loss) | | | | | |
Net realized and unrealized gains (losses) on investments | | | | | |
Total from investment operations | | | | | |
Distributions to shareholders from | | | | | |
| | | | | |
| | | | | |
Total distributions to shareholders | | | | | |
Net asset value, end of period | | | | | |
| | | | | |
Ratios to average net assets (annualized) | | | | | |
| | | | | |
| | | | | |
Net investment income (loss) | | | | | |
| | | | | |
| | | | | |
Net assets, end of period (000s omitted) | | | | | |
| Calculated based upon average shares outstanding |
| Returns do not reflect fees and expenses charged pursuant to the terms of variable life insurance policies and variable annuity contracts. |
The accompanying notes are an integral part of these financial statements.
20 | Allspring VT Opportunity Fund
(For a share outstanding throughout each period)
| |
| | | | | |
Net asset value, beginning of period | | | | | |
Net investment income (loss) | | | | | |
Net realized and unrealized gains (losses) on investments | | | | | |
Total from investment operations | | | | | |
Distributions to shareholders from | | | | | |
| | | | | |
| | | | | |
Total distributions to shareholders | | | | | |
Net asset value, end of period | | | | | |
| | | | | |
Ratios to average net assets (annualized) | | | | | |
| | | | | |
| | | | | |
Net investment income (loss) | | | | | |
| | | | | |
| | | | | |
Net assets, end of period (000s omitted) | | | | | |
| Calculated based upon average shares outstanding |
| Returns do not reflect fees and expenses charged pursuant to the terms of variable life insurance policies and variable annuity contracts. |
The accompanying notes are an integral part of these financial statements.
Allspring VT Opportunity Fund | 21
Notes to financial statements
Notes to financial statements
Allspring Variable Trust (the “Trust”), a Delaware statutory trust organized on March 10, 1999, is an open-end management investment company registered under the Investment Company Act of 1940, as amended (the “1940 Act”). As an investment company, the Trust follows the accounting and reporting guidance in Financial Accounting Standards Board (“FASB”) Accounting Standards Codification Topic 946, Financial Services – Investment Companies. These financial statements report on the Allspring VT Opportunity Fund (the “Fund”) which is a diversified series of the Trust. The Trust offers shares of the Fund to separate accounts of various life insurance companies as funding vehicles for certain variable annuity contracts and variable life insurance policies.
2.
SIGNIFICANT ACCOUNTING POLICIES
The following significant accounting policies, which are consistently followed in the preparation of the financial statements of the Fund, are in conformity with U.S. generally accepted accounting principles which require management to make estimates and assumptions that affect the reported amounts of assets and liabilities, disclosure of contingent assets and liabilities at the date of the financial statements, and the reported amounts of income and expenses during the reporting period. Actual results could differ from those estimates.
Securities valuation
All investments are valued each business day as of the close of regular trading on the New York Stock Exchange (generally 4 p.m. Eastern Time), although the Fund may deviate from this calculation time under unusual or unexpected circumstances.
Equity securities and exchange-traded funds that are listed on a foreign or domestic exchange or market are valued at the official closing price or, if none, the last sales price.
The values of securities denominated in foreign currencies are translated into U.S. dollars at rates provided by an independent foreign currency pricing source at a time each business day specified by the Valuation Committee at Allspring Funds Management, LLC (“Allspring Funds Management”).
Many securities markets and exchanges outside the U.S. close prior to the close of the New York Stock Exchange and therefore may not fully reflect trading or events that occur after the close of the principal exchange in which the foreign securities are traded, but before the close of the New York Stock Exchange. If such trading or events are expected to materially affect the value of such securities, then fair value pricing procedures implemented by Allspring Funds Management are applied. These procedures take into account multiple factors including movements in U.S. securities markets after foreign exchanges close. Foreign securities that are fair valued under these procedures are categorized as Level 2 and the application of these procedures may result in transfers between Level 1 and Level 2. Depending on market activity, such fair valuations may be frequent. Such fair value pricing may result in net asset values that are higher or lower than net asset values based on the last reported sales price or latest quoted bid price. On December 31, 2023, such fair value pricing was not used in pricing foreign securities.
Investments in registered open-end investment companies (other than those listed on a foreign or domestic exchange or market) are valued at net asset value.
Investments which are not valued using the methods discussed above are valued at their fair value, as determined in good faith by Allspring Funds Management, which was named the valuation designee by the Board of Trustees. As the valuation designee, Allspring Funds Management is responsible for day-to-day valuation activities for the Allspring Funds. In connection with these responsibilities, Allspring Funds Management has established a Valuation Committee and has delegated to it the authority to take any actions regarding the valuation of portfolio securities that the Valuation Committee deems necessary or appropriate, including determining the fair value of portfolio securities. On a quarterly basis, the Board of Trustees receives reports of valuation actions taken by the Valuation Committee. On at least an annual basis, the Board of Trustees receives an assessment of the adequacy and effectiveness of Allspring Funds Management’s process for determining the fair value of the portfolio of investments.
Foreign currency translation
The accounting records of the Fund are maintained in U.S. dollars. The values of other assets and liabilities denominated in foreign currencies are translated into U.S. dollars at rates provided by an independent foreign currency pricing source at a time each business day specified by the Valuation Committee. Purchases and sales of securities, and income and expenses are converted at the rate of exchange on the respective dates of such transactions. Net realized foreign exchange gains or losses arise from sales of foreign currencies, currency gains or losses realized between the trade and settlement dates on securities transactions, and the difference between the amounts of dividends, interest and foreign withholding taxes recorded and the U.S. dollar equivalent of the amounts actually paid or received. Net unrealized foreign exchange gains and losses arise from changes in the fair value of assets and liabilities other than investments in securities resulting from changes in exchange rates. The changes in net assets arising from changes in exchange rates of securities and the changes in net assets resulting from changes in market prices of securities are not separately presented. Such changes are included in net realized and unrealized gains or losses from investments.
Security transactions and income recognition
Securities transactions are recorded on a trade date basis. Realized gains or losses are recorded on the basis of identified cost.
22 | Allspring VT Opportunity Fund
Notes to financial statements
Dividend income is recognized on the ex-dividend date, except for certain dividends from foreign securities, which are recorded as soon as the custodian verifies the ex-dividend date. Dividend income is recorded net of foreign taxes withheld where recovery of such taxes is not assured.
Interest earned on cash balances held at the custodian is recorded as interest income.
Distributions received from REIT investments may be characterized as ordinary income, capital gains, or a return of capital to the Fund based on information provided by the REIT. The proper characterization of REIT distributions is generally not known until after the end of each calendar year. As such, estimates may be used in reporting the character of income and distributions for financial statement purposes.
Distributions to shareholders
Distributions to shareholders from net investment income and any net realized gains are recorded on the ex-dividend date and paid at least annually. Such distributions are determined in accordance with income tax regulations and may differ from U.S. generally accepted accounting principles. Dividend sources are estimated at the time of declaration. The tax character of distributions is determined as of the Fund’s fiscal year end. Therefore, a portion of the Fund’s distributions made prior to the Fund’s fiscal year end may be categorized as a tax return of capital at year end.
Federal and other taxes
The Fund intends to continue to qualify as a regulated investment company by distributing substantially all of its investment company taxable income and any net realized capital gains (after reduction for capital loss carryforwards) sufficient to relieve it from all, or substantially all, federal income taxes. Accordingly, no provision for federal income taxes was required.
The Fund’s income and federal excise tax returns and all financial records supporting those returns for the are subject to examination by the federal and Delaware revenue authorities. Management has analyzed the Fund’s tax positions taken on federal, state, and foreign tax returns, as applicable, for all open tax years and does not believe that there are any uncertain tax positions that require recognition of a tax liability.
As of December 31, 2023, the aggregate cost of all investments for federal income tax purposes was $129,106,977 and the unrealized gains (losses) consisted of:
Reclassifications are made to the Fund’s capital accounts for permanent tax differences to reflect income and gains available for distribution (or available capital loss carryforwards) under federal income tax regulations. U.S. generally accepted accounting principles require that certain components of net assets be adjusted to reflect permanent differences between financial and tax reporting. These reclassifications have no effect on net assets or net asset values per share. The primary permanent difference causing such reclassification is due to dividends from certain securities. At December 31, 2023, as a result of permanent book-to-tax differences, the following reclassification adjustments were made on the Statement of Assets and Liabilities:
| Total distributable
earnings |
| |
Class allocations
The separate classes of shares offered by the Fund differ principally in distribution fees. Class specific expenses are charged directly to that share class. Investment income, common fund-level expenses, and realized and unrealized gains (losses) on investments are allocated daily to each class of shares based on the relative proportion of net assets of each class.
3.
FAIR VALUATION MEASUREMENTS
Fair value measurements of investments are determined within a framework that has established a fair value hierarchy based upon the various data inputs utilized in determining the value of the Fund’s investments. The three-level hierarchy gives the highest priority to unadjusted quoted prices in active markets for identical assets or liabilities (Level 1) and the lowest priority to unobservable inputs (Level 3). The Fund’s investments are classified within the fair value hierarchy based on the lowest level of input that is significant to the fair value measurement. The inputs are summarized into three broad levels as follows:
•Level 1—quoted prices in active markets for identical securities
•Level 2—other significant observable inputs (including quoted prices for similar securities, interest rates, prepayment speeds, credit risk, etc.)
•Level 3—significant unobservable inputs (including the Fund’s own assumptions in determining the fair value of investments)
The inputs or methodologies used for valuing investments in securities are not necessarily an indication of the risk associated with investing in those securities.
Allspring VT Opportunity Fund | 23
Notes to financial statements
The following is a summary of the inputs used in valuing the Fund’s assets and liabilities as of December 31, 2023:
| | Other significant
observable inputs
(Level 2) | Significant
unobservable inputs
(Level 3) | |
| | | | |
| | | | |
| | | | |
| | | | |
| | | | |
| | | | |
| | | | |
| | | | |
| | | | |
| | | | |
| | | | |
| | | | |
| | | | |
| | | | |
| | | | |
Additional sector, industry or geographic detail, if any, is included in the Portfolio of Investments.
At December 31, 2023, the Fund did not have any transfers into/out of Level 3.
4.
TRANSACTIONS WITH AFFILIATES
Management fee
Allspring Funds Management, a wholly owned subsidiary of Allspring Global Investments Holdings, LLC, a holding company indirectly owned by certain private funds of GTCR LLC and Reverence Capital Partners, L.P., is the manager of the Fund and provides advisory and fund-level administrative services under an investment management agreement. Under the investment management agreement, Allspring Funds Management is responsible for, among other services, implementing the investment objectives and strategies of the Fund, supervising the subadviser and providing fund-level administrative services in connection with the Fund’s operations. As compensation for its services under the investment management agreement, Allspring Funds Management is entitled to receive a management fee at the following annual rate based on the Fund’s average daily net assets:
For the year ended December 31, 2023, the management fee was equivalent to an annual rate of 0.70% of the Fund’s average daily net assets.
Allspring Funds Management has retained the services of a subadviser to provide daily portfolio management to the Fund. The fee for subadvisory services is borne by Allspring Funds Management. Allspring Global Investments, LLC, an affiliate of Allspring Funds Management and a wholly owned subsidiary of Allspring Global Investments Holdings, LLC, is the subadviser to the Fund and is entitled to receive a fee from Allspring Funds Management at an annual rate starting at 0.45% and declining to 0.30% as the average daily net assets of the Fund increase.
Administration fees
Under a class-level administration agreement, Allspring Funds Management provides class-level administrative services to the Fund, which includes paying fees and expenses for services provided by the transfer agent, sub-transfer agents, omnibus account servicers and record-keepers. As compensation for its services under the class-level administration agreement, Allspring Funds Management receives an annual fee of 0.08% which is calculated based on the average daily net assets of each class.
Waivers and/or expense reimbursements
Allspring Funds Management has contractually committed to waive and/or reimburse management and administration fees to the extent necessary to maintain certain net operating expense ratios for the Fund. When each class of the Fund has exceeded its expense cap, Allspring Funds Management will waive fees and/or reimburse expenses from fund-level expenses on a proportionate basis and then from class specific expenses. When only certain
24 | Allspring VT Opportunity Fund
Notes to financial statements
classes exceed their expense caps, waivers and/or reimbursements are applied against class specific expenses before fund-level expenses. Allspring Funds Management has contractually committed through April 30, 2024 to waive fees and/or reimburse expenses to the extent necessary to cap the Fund’s expenses. Prior to or after the commitment expiration date, the cap may be increased or the commitment to maintain the cap may be terminated only with the approval of the Board of Trustees. As of December 31, 2023, the contractual expense caps are as follows:
Distribution fee
The Trust has adopted a distribution plan for Class 2 shares pursuant to Rule 12b-1 under the 1940 Act. A distribution fee is charged to Class 2 shares and paid to Allspring Funds Distributor, LLC, the principal underwriter, an affiliate of Allspring Funds Management, at an annual rate up to 0.25% of the average daily net assets of Class 2 shares.
Interfund transactions
The Fund may purchase or sell portfolio investment securities to certain affiliates pursuant to Rule 17a-7 under the 1940 Act and under procedures adopted by the Board of Trustees. The procedures have been designed to ensure that these interfund transactions, which do not incur broker commissions, are effected at current market prices. Pursuant to these procedures, the Fund did not have any interfund transactions during the year ended December 31, 2023.
5.
INVESTMENT PORTFOLIO TRANSACTIONS
Purchases and sales of investments, excluding U.S. government obligations (if any) and short-term securities, for the year ended December 31, 2023 were $40,230,745 and $60,043,825, respectively.
The Trust, Allspring Master Trust and Allspring Funds Trust (excluding the money market funds) are parties to a $350,000,000 revolving credit agreement whereby the Fund is permitted to use bank borrowings for temporary or emergency purposes, such as to fund shareholder redemption requests. Interest under the credit agreement is charged to the Fund based on borrowing rate equal to the higher of the Federal Funds rate or the overnight bank funding rate in effect on that day plus a spread. In addition, an annual commitment fee based on the unused balance is allocated to each participating fund.
For the year ended December 31, 2023, there were no borrowings by the Fund under the agreement.
7.
DISTRIBUTIONS TO SHAREHOLDERS
The tax character of distributions paid during the years ended December 31, 2023 and December 31, 2022 were as follows:
As of December 31, 2023, the components of distributable earnings on a tax basis were as follows:
Undistributed
ordinary
income | Undistributed
long-term
gain | |
| | |
As of the end of the period, the Fund concentrated its portfolio of investments in information technology sector. A fund that invests a substantial portion of its assets in any sector may be more affected by changes in that sector than would be a fund whose investments are not heavily weighted in any sector.
Under the Fund’s organizational documents, the officers and Trustees have been granted certain indemnification rights against certain liabilities that may arise out of performance of their duties to the Fund. The Fund has entered into a separate agreement with each Trustee that converts indemnification rights currently existing under the Fund’s organizational documents into contractual rights that cannot be changed in the future without
Allspring VT Opportunity Fund | 25
Notes to financial statements
the consent of the Trustee. Additionally, in the normal course of business, the Fund may enter into contracts with service providers that contain a variety of indemnification clauses. The Fund’s maximum exposure under these arrangements is dependent on future claims that may be made against the Fund and, therefore, cannot be estimated.
26 | Allspring VT Opportunity Fund
Report of independent registered public accounting firm
To the Shareholders of the Fund and Board of Trustees
Allspring Variable Trust:
Opinion on the Financial Statements
We have audited the accompanying statement of assets and liabilities of Allspring VT Opportunity Fund (the Fund), one of the funds constituting Allspring Variable Trust, including the portfolio of investments, as of December 31, 2023, the related statement of operations for the year then ended, the statements of changes in net assets for each of the years in the two-year period then ended, and the related notes (collectively, the financial statements) and the financial highlights for each of the years in the five-year period then ended. In our opinion, the financial statements and financial highlights present fairly, in all material respects, the financial position of the Fund as of December 31, 2023, the results of its operations for the year then ended, the changes in its net assets for each of the years in the two-year period then ended, and the financial highlights for each of the years in the five-year period then ended, in conformity with U.S. generally accepted accounting principles.
Basis for Opinion
These financial statements and financial highlights are the responsibility of the Fund’s management. Our responsibility is to express an opinion on these financial statements and financial highlights based on our audits. We are a public accounting firm registered with the Public Company Accounting Oversight Board (United States) (PCAOB) and are required to be independent with respect to the Fund in accordance with the U.S. federal securities laws and the applicable rules and regulations of the Securities and Exchange Commission and the PCAOB.
We conducted our audits in accordance with the standards of the PCAOB. Those standards require that we plan and perform the audit to obtain reasonable assurance about whether the financial statements and financial highlights are free of material misstatement, whether due to error or fraud. Our audits included performing procedures to assess the risks of material misstatement of the financial statements and financial highlights, whether due to error or fraud, and performing procedures that respond to those risks. Such procedures included examining, on a test basis, evidence regarding the amounts and disclosures in the financial statements and financial highlights. Such procedures also included confirmation of securities owned as of December 31, 2023, by correspondence with the custodian and transfer agent. Our audits also included evaluating the accounting principles used and significant estimates made by management, as well as evaluating the overall presentation of the financial statements and financial highlights. We believe that our audits provide a reasonable basis for our opinion.

We have not been able to determine the specific year that we began serving as the auditor of one or more Allspring Funds investment companies; however, we are aware that we have served as the auditor of one or more Allspring Funds investment companies since at least 1955.
Boston, Massachusetts
February 26, 2024
Allspring VT Opportunity Fund | 27
Other information (unaudited)
Other information
Tax information
Pursuant to Section 852 of the Internal Revenue Code, $14,329,503 was designated as a 20% rate gain distribution for the fiscal year ended
December 31, 2023.
Proxy voting information
A description of the policies and procedures used to determine how to vote proxies relating to portfolio securities is available without charge, upon request, by calling 1-866-259-3305, visiting our website at allspringglobal.com, or visiting the SEC website at sec.gov. Information regarding how the proxies related to portfolio securities were voted during the most recent 12-month period ended June 30 is available on the website at allspringglobal.com or by visiting the SEC website at sec.gov.
Quarterly portfolio holdings information
The Fund files its complete schedule of portfolio holdings with the SEC for the first and third quarters of each fiscal year as an exhibit to its reports on Form N-PORT. Shareholders may view the filed Form N-PORT by visiting the SEC website at sec.gov.
28 | Allspring VT Opportunity Fund
Other information (unaudited)
BOARD OF TRUSTEES AND OFFICERS
Each of the Trustees and Officers listed in the table below acts in identical capacities for each fund in the Allspring family of funds, which consists of 117 mutual funds comprising the Allspring Funds Trust, Allspring Variable Trust, Allspring Master Trust and four closed-end funds (collectively the “Fund Complex”). This table should be read in conjunction with the Prospectus and the Statement of Additional Information†. The mailing address of each Trustee and Officer is 1415 Vantage Park Drive, 3rd Floor, Charlotte, NC 28203. Each Trustee and Officer serves an indefinite term, however, each Trustee serves such term until reaching the mandatory retirement age established by the Trustees.
Independent Trustees
| | Principal occupations during past five years or longer | Current other
public company or
investment
company
directorships |
William R. Ebsworth
(Born 1957) | | Retired. From 1984 to 2013, equities analyst, portfolio manager, research director and chief investment officer at Fidelity Management and Research Company in Boston, Tokyo, and Hong Kong, and retired in 2013 as Chief Investment Officer of Fidelity Strategic Advisers, Inc. where he led a team of investment professionals managing client assets. Prior thereto, Board member of Hong Kong Securities Clearing Co., Hong Kong Options Clearing Corp., the Thailand International Fund, Ltd., Fidelity Investments Life Insurance Company, and Empire Fidelity Investments Life Insurance Company. Serves on the Investment Company Institute’s Board of Governors since 2022 and Executive Committee since 2023 as well as the Vice Chairman of the Governing Council of the Independent Directors Council since 2023. Audit Committee Chair and Investment Committee Chair of the Vincent Memorial Hospital Foundation (non-profit organization). Mr. Ebsworth is a CFA charterholder. | |
Jane A. Freeman
(Born 1953) | Trustee,
since 2015;
Chair Liaison,
| Retired. From 2012 to 2014 and 1999 to 2008, Chief Financial Officer of Scientific Learning Corporation. From 2008 to 2012, Ms. Freeman provided consulting services related to strategic business projects. Prior to 1999, Portfolio Manager at Rockefeller & Co. and Scudder, Stevens & Clark. Board member of the Harding Loevner Funds from 1996 to 2014, serving as both Lead Independent Director and chair of the Audit Committee. Board member of the Russell Exchange Traded Funds Trust from 2011 to 2012 and the chair of the Audit Committee. Ms. Freeman is also an inactive Chartered Financial Analyst. | |
Isaiah Harris, Jr.
(Born 1952) | Trustee,
since 2009;
Audit Committee Chair,
since 2019 | Retired. Member of the Advisory Board of CEF of East Central Florida. Chairman of the Board of CIGNA Corporation from 2009 to 2021, and Director from 2005 to 2008. From 2003 to 2011, Director of Deluxe Corporation. Prior thereto, President and CEO of BellSouth Advertising and Publishing Corp. from 2005 to 2007, President and CEO of BellSouth Enterprises from 2004 to 2005 and President of BellSouth Consumer Services from 2000 to 2003. Emeritus member of the Iowa State University Foundation Board of Governors. Emeritus Member of the Advisory board of Iowa State University School of Business. Advisory Board Member, Palm Harbor Academy (private school). Advisory Board Member, Fellowship of Christian Athletes. Mr. Harris is a certified public accountant (inactive status). | |
David F. Larcker
(Born 1950) | | Distinguished Visiting Fellow at the Hoover Institution since 2022. James Irvin Miller Professor of Accounting at the Graduate School of Business (Emeritus), Stanford University, Director of the Corporate Governance Research Initiative and Senior Faculty of The Rock Center for Corporate Governance since 2006. From 2005 to 2008, Professor of Accounting at the Graduate School of Business, Stanford University. Prior thereto, Ernst & Young Professor of Accounting at The Wharton School, University of Pennsylvania from 1985 to 2005. | |
Olivia S. Mitchell
(Born 1953) | | International Foundation of Employee Benefit Plans Professor since 1993, Wharton School of the University of Pennsylvania. Director of Wharton’s Pension Research Council and Boettner Center on Pensions & Retirement Research, and Research Associate at the National Bureau of Economic Research. Previously taught at Cornell University from 1978 to 1993. | |
Timothy J. Penny
(Born 1951) | Trustee,
since 1996;
Chair,
since 2018 | President and Chief Executive Officer of Southern Minnesota Initiative Foundation, a non-profit organization, since 2007. Vice Chair of the Economic Club of Minnesota, since 2007. Co-Chair of the Committee for a Responsible Federal Budget, since 1995. Member of the Board of Trustees of NorthStar Education Finance, Inc., a non-profit organization, from 2007-2022. Senior Fellow of the University of Minnesota Humphrey Institute from 1995 to 2017. | |
* Length of service dates reflect the Trustee’s commencement of service with the Trust’s predecessor entities, where applicable.
# Ms. Freeman will serve as Chair Liaison through June 2024, at which time Ms. Wheelock will assume the role.
†
The Statement of Additional Information includes additional information about the Trustees and is available, without charge, upon request, by calling 1-800-260-5969 or by visiting the website at allspringglobal.com.
Allspring VT Opportunity Fund | 29
Other information (unaudited)
| Position held and length of service* | Principal occupations during past five years or longer | Current other public company or investment company directorships |
James G. Polisson
(Born 1959) | Trustee,
since 2018; Nominating and Governance Committee Chair, since 2024 | Retired. Chief Marketing Officer, Source (ETF) UK Services, Ltd, from 2015 to 2017. From 2012 to 2015, Principal of The Polisson Group, LLC, a management consulting, corporate advisory and principal investing company. Chief Executive Officer and Managing Director at Russell Investments, Global Exchange Traded Funds from 2010 to 2012. Managing Director of Barclays Global Investors from 1998 to 2010 and Global Chief Marketing Officer for iShares and Barclays Global Investors from 2000 to 2010. Trustee of the San Francisco Mechanics’ Institute, a non- profit organization, from 2013 to 2015. Board member of the Russell Exchange Traded Fund Trust from 2011 to 2012. Director of Barclays Global Investors Holdings Deutschland GmbH from 2006 to 2009. Mr. Polisson is an attorney and has a retired status with the Massachusetts and District of Columbia Bar Associations. | |
Pamela Wheelock
(Born 1959) | Trustee,
since January 2020;
previously Trustee from
January 2018 to
| Retired. Executive and Senior Financial leadership positions in the public, private and nonprofit sectors. Interim President and CEO, McKnight Foundation, 2020. Interim Commissioner, Minnesota Department of Human Services, 2019. Chief Operating Officer, Twin Cities Habitat for Humanity, 2017-2019. Vice President for University Services, University of Minnesota, 2012- 2016. Interim President and CEO, Blue Cross and Blue Shield of Minnesota, 2011-2012. Executive Vice-President and Chief Financial Officer, Minnesota Wild, 2002-2008. Commissioner, Minnesota Department of Finance, 1999-2002. Chair of the Board of Directors of Destination Medical Center Corporation. Board member of the Minnesota Wild Foundation. | |
* Length of service dates reflect the Trustee’s commencement of service with the Trust’s predecessor entities, where applicable.
# Ms. Freeman will serve as Chair Liaison through June 2024, at which time Ms. Wheelock will assume the role.
30 | Allspring VT Opportunity Fund
Other information (unaudited)
Officers1
| Position held and
length of service | Principal occupations during past five years or longer |
| | President and Chief Executive Officer of Allspring Funds Management, LLC since 2017 and Head of Global Fund Governance of Allspring Global Investments since 2022. Prior thereto, co-president of Galliard Capital Management, LLC, an affiliate of Allspring Funds Management, LLC, from 2019 to 2022 and Head of Affiliated Managers, Allspring Global Investments, from 2014 to 2019 and Executive Vice President responsible for marketing, investments and product development for Allspring Funds Management, LLC, from 2009 to 2014. |
Jeremy DePalma
(Born 1974) | Treasurer,
since 2012
(for certain funds in
the Fund Complex);
since 2021 (for
the remaining funds in the Complex) | Senior Vice President of Allspring Funds Management, LLC since 2009. Senior Vice President of Evergreen Investment Management Company, LLC from 2008 to 2010 and head of the Fund Reporting and Control Team within Fund Administration from 2005 to 2010. |
Christopher Baker
(Born 1976) | Chief Compliance Officer,
since 2022 | Global Chief Compliance Officer for Allspring Global Investments since 2022. Prior thereto, Chief Compliance Officer for State Street Global Advisors from 2018 to 2021. Senior Compliance Officer for the State Street divisions of Alternative Investment Solutions, Sector Solutions, and Global Marketing from 2015 to 2018. From 2010 to 2015 Vice President, Global Head of Investment and Marketing Compliance for State Street Global Advisors. |
Matthew Prasse
(Born 1983) | Chief Legal Officer,
since 2022;
Secretary,
since 2021 | Senior Counsel of the Allspring Legal Department since 2021. Senior Counsel of the Wells Fargo Legal Department from 2018 to 2021. Previously, Counsel for Barings LLC from 2015 to 2018. Prior to joining Barings, Associate at Morgan, Lewis & Bockius LLP from 2008 to 2015. |
1 For those Officers with tenures at Allspring Global Investments and/or Allspring Funds Management, LLC that began prior to 2021, such tenures include years of service during which these businesses/entities were known as Wells Fargo Asset Management and Wells Fargo Funds Management, LLC, respectively.
Allspring VT Opportunity Fund | 31
This page is intentionally left blank.
For more information
More information about Allspring Funds is available free upon request. To obtain literature, please write, visit the Fund’s website, or call:
Allspring Funds
P.O. Box 219967
Kansas City, MO 64121-9967
Website: allspringglobal.com
Individual investors: 1-800-260-5969
Retail investment professionals: 1-888-877-9275
Institutional investment professionals: 1-866-765-0778
This report and the financial statements contained herein are submitted for the general information of the shareholders of the Fund. If this report is used for promotional purposes, distribution of the report must be accompanied or preceded by a current prospectus. Before investing, please consider the investment objectives, risks, charges, and expenses of the investment. For a current prospectus and, if available, a summary prospectus, containing this information, call 1-800-260-5969 or visit the Fund’s website at allspringglobal.com. Read the prospectus carefully before you invest or send money.
Allspring Global InvestmentsTM is the trade name for the asset management firms of Allspring Global Investments Holdings, LLC, a holding company indirectly owned by certain private funds of GTCR LLC and Reverence Capital Partners, L.P. These firms include but are not limited to Allspring Global Investments, LLC, and Allspring Funds Management, LLC. Certain products managed by Allspring entities are distributed by Allspring Funds Distributor, LLC (a broker-dealer and Member FINRA/SIPC).
This material is for general informational and educational purposes only and is NOT intended to provide investment advice or a recommendation of any kind - including a recommendation for any specific investment, strategy, or plan.
© 2024 Allspring Global Investments Holdings, LLC. All rights reserved.
ALL-01052024-llc9slch 02-24
AR3020 12-23
Allspring VT Small Cap Growth Fund
Annual Report
December 31, 2023
The views expressed and any forward-looking statements are as of December 31, 2023, unless otherwise noted, and are those of the Fund���s portfolio managers and/or Allspring Global Investments. Discussions of individual securities or the markets generally are not intended as individual recommendations. Future events or results may vary significantly from those expressed in any forward-looking statements. The views expressed are subject to change at any time in response to changing circumstances in the market. Allspring Global Investments disclaims any obligation to publicly update or revise any views expressed or forward-looking statements.
Allspring VT Small Cap Growth Fund | 1
Letter to shareholders (unaudited)
Andrew Owen
President
Allspring Funds
Dear Shareholder:
We are pleased to offer you this annual report for the Allspring VT Small Cap Growth Fund for the 12-month period that ended December 31, 2023. Globally, stocks and bonds experienced high levels of volatility throughout the period but had positive overall results. The market was focused on persistently high inflation and the impact of ongoing aggressive central bank rate hikes. Compounding these concerns were the global reverberations of the Russia-Ukraine war. Riskier assets rallied in 2023, as investors anticipated an end to the tight monetary policy despite concerns of a possible recession. After suffering deep and broad losses through 2022, bonds now benefit from a base of higher yields that can help generate higher income.
For the 12-month period, stocks generally outperformed bonds—both domestic U.S. and global. For the period, U.S. stocks, based on the S&P 500 Index,1 gained 26.29%. International stocks, as measured by the MSCI ACWI ex USA Index (Net),2 returned 15.62%, while the MSCI EM Index (Net) (USD)3 had more modest performance, with a gain of 9.83%. Among bond indexes, the Bloomberg U.S. Aggregate Bond Index4 returned 5.53%, the Bloomberg Global Aggregate ex-USD Index (unhedged)5 gained 5.72%, the Bloomberg Municipal Bond Index6 returned 6.40%, and the ICE BofA U.S. High Yield Index7 gained 13.54%.
Despite high inflation and central bank rate hikes, markets rallied.
The year 2023 began with a rally across global equities and fixed income securities. Investor optimism rose in response to data indicating declining inflation rates and the reopening of China’s economy with the abrupt end to its zero-COVID-19 policy. The U.S. reported strong job gains and unemployment fell to 3.4%—the lowest level since 1969. Meanwhile, wage growth, seen as a potential contributor to ongoing high inflation, continued to moderate. All eyes remained on the Federal Reserve (Fed) and on how many more rate hikes remain in this tightening cycle. The 0.25% federal funds rate hike announced in January was the Fed’s smallest rate increase since March 2022.
Markets declined in February as investors responded unfavorably to resilient economic data. The takeaway: Central banks would likely continue their monetary tightening cycle for longer than markets had priced in. In this environment—where strong economic data is seen as bad news—the resilient U.S. labor market was taken as a negative, with inflation not falling quickly enough for the Fed, which raised interest rates by 0.25% in February. Meanwhile, the Bank of England (BoE) and the European Central Bank (ECB) both raised rates by 0.50%.
1
The S&P 500 Index consists of 500 stocks chosen for market size, liquidity, and industry group representation. It is a market-value-weighted index with each stock’s weight in the index proportionate to its market value. You cannot invest directly in an index.
2
The Morgan Stanley Capital International (MSCI) All Country World Index (ACWI) ex USA Index (Net) is a free-float-adjusted market-capitalization-weighted index that is designed to measure the equity market performance of developed and emerging markets, excluding the U.S. Source: MSCI. MSCI makes no express or implied warranties or representations and shall have no liability whatsoever with respect to any MSCI data contained herein. The MSCI data may not be further redistributed or used as a basis for other indexes or any securities or financial products. This report is not approved, reviewed, or produced by MSCI. You cannot invest directly in an index.
3
The MSCI Emerging Markets (EM) Index (Net) (USD) is a free-float-adjusted market-capitalization-weighted index that is designed to measure the equity market performance of emerging markets. You cannot invest directly in an index.
4
The Bloomberg U.S. Aggregate Bond Index is a broad-based benchmark that measures the investment-grade, U.S.-dollar-denominated, fixed-rate taxable bond market, including Treasuries, government-related and corporate securities, mortgage-backed securities (agency fixed-rate and hybrid adjustable-rate mortgage pass-throughs), asset-backed securities, and commercial mortgage-backed securities. You cannot invest directly in an index.
5
The Bloomberg Global Aggregate ex-USD Index (unhedged) is an unmanaged index that provides a broad-based measure of the global investment-grade fixed-income markets excluding the U.S.-dollar-denominated debt market. You cannot invest directly in an index.
6
The Bloomberg Municipal Bond Index is an unmanaged index composed of long-term tax-exempt bonds with a minimum credit rating of Baa. You cannot invest directly in an index.
7
The ICE BofA U.S. High Yield Index is a market-capitalization-weighted index of domestic and Yankee high yield bonds. The index tracks the performance of high yield securities traded in the U.S. bond market. You cannot invest directly in an index. Copyright 2024. ICE Data Indices, LLC. All rights reserved.
2 | Allspring VT Small Cap Growth Fund
Letter to shareholders (unaudited)
“ The collapse of Silicon Valley Bank in March—the second-largest banking failure in U.S. history—led to a bank run that spread to Europe, where Switzerland’s Credit Suisse was taken over by its rival, UBS. ”
The collapse of Silicon Valley Bank in March—the second-largest banking failure in U.S. history—led to a bank run that spread to Europe, where Switzerland’s Credit Suisse was taken over by its rival, UBS. The banking industry turmoil created an additional challenge for central banks in balancing inflationary concerns against potential economic weakening. Meanwhile, recent data pointed to economic strength in the U.S., Europe, and China. And China’s economy continued to rebound after the removal of its COVID-19 lockdown. Inflation rates in the U.S., the U.K., and the eurozone all remained higher than central bank targets, leading to additional rate hikes in March.
Economic data released in April pointed to global resilience, as Purchasing Managers Indexes1 in the U.S., U.K., and eurozone beat expectations and China reported first-quarter annualized economic growth of 4.5%. Despite banking industry stress, developed market stocks had monthly gains. The U.S. labor market remained strong, with a 3.5% jobless rate and monthly payroll gains above 200,000. However, uncertainty and inflationary concerns weighed on investors in the U.S. and abroad.
May was marked by a divergence between expanding activity in services and an overall contraction in manufacturing activity in the U.S., U.K., and eurozone. Core inflation remained elevated in the U.S. and Europe, despite the ongoing efforts of the Fed and the ECB, which included rate hikes of 0.25% by both in May. Stubborn inflation and the resilient U.S. labor market led to expectations of further interest rate hikes, overall monthly declines across bond indexes, and mixed results for stocks in May. Investor worries over a U.S. debt ceiling impasse were modest, and market confidence was buoyed by a deal in late May to avert a potential U.S. debt default.
June featured the Fed’s first pause on interest rate hikes since March 2022, when it began its aggressive campaign to rein in inflation. However, inflation, as measured by the Core Consumer Price Index (CPI)2, while continuing to decline, remained stubbornly high in June at 4.8%, well above the Fed’s 2.0% target rate. With the U.S. unemployment rate still at 3.6%, near a historical low, and U.S. payrolls growing in June for the 30th consecutive month, expectations of more Fed rate hikes were reinforced. However, U.S. and global stocks had strong returns in June.
July was a good month for stocks. However, bonds had more muted but positive monthly returns overall. Riskier sectors and regions tended to do well, as investors grew more optimistic regarding economic prospects. With strong second-quarter gross domestic product (GDP) growth—initially estimated at 2.4%—and U.S. annual inflation easing steadily to 3.2% in July, hopes for a soft economic landing grew. The Fed, the ECB, and the BoE all raised their respective key interest rates by 0.25% in July. In the Fed’s case, speculation grew that it could be very close to the end of its tightening cycle. Meanwhile, China’s economy showed signs of stagnation, renewing concerns of global fallout.
Stocks retreated in August while monthly bond returns were flat overall. Increased global market volatility reflected unease over the Chinese property market being stressed along with weak Chinese economic data. On a more positive note, speculation grew over a possible end to the Fed’s campaign of interest rate increases or at least a pause in September. U.S. economic data generally remained solid, with resilient job market data and inflation ticking up slightly in August, as the annual CPI3 rose 3.7%. However, the three-month trend for Core CPI stood at a more encouraging annualized 2.4%.
1
The Purchasing Managers Index (PMI) is an index of the prevailing direction of economic trends in the manufacturing and service sectors. You cannot invest directly in an index.
2
The Core Consumer Price Index (CPI) is a measure of the average change over time in the prices paid by urban consumers for a market basket of consumer goods and services excluding energy and food prices. You cannot invest directly in an index.
3
The CPI is a measure of the average change over time in the prices paid by urban consumers for a market basket of consumer goods and services. You cannot invest directly in an index.
Allspring VT Small Cap Growth Fund | 3
Letter to shareholders (unaudited)
Stocks and bonds both had negative overall returns in September as investors reluctantly recited the new chorus of “higher for longer,” led by the Fed’s determination not to lower interest rates until it knows it has vanquished its pesky opponent—higher-than-targeted inflation. As of September, the two primary gauges of U.S. inflation—the annual Core Personal Consumption Expenditures Price Index1 and the CPI—both stood at roughly 4%, twice as high as the Fed’s oft-stated 2% target. The month ended with the prospect of yet another U.S. government shutdown, averted at least temporarily but looming later this fall.
October was a tough month for stocks and bonds. Key global and domestic indexes all were pushed down by rising geopolitical tensions, particularly the Israel-Hamas conflict, and concerns over the Fed’s “higher for longer” monetary policy. The U.S. 10-year Treasury yield rose above 5% for the first time since 2007. Commodity prices did well as oil prices rallied in response to the prospect of oil supply disruptions from the Middle East. U.S. annualized third-quarter GDP was estimated at a healthier-than-anticipated 4.9%. China’s GDP indicated surprisingly strong industrial production and retail sales, offset by ongoing weakness in its real estate sector.
In November, the market mood turned positive as cooling inflation inspired confidence that central banks could hold off on further rate hikes. Overall annual inflation in the U.S. fell to 3.1% in November while 12-month inflation in the U.K. and eurozone eased to 4.6% and 2.4%, respectively—far below their peak levels of mid-2022. Third quarter annualized U.S. GDP growth was raised to an estimated 5.2% while U.S. job totals rose by just below 200,000 in November, indicating a slight cooling of the labor market. All of this fresh evidence added to confidence for a U.S. soft economic landing, leading to a more buoyant mood heading into winter as the Federal Open Market Committee held rates steady at its December meeting.
The broad year-end rally among stocks and bonds that began in November continued through December as investors became more confident that monetary policy would ease in 2024. Supporting the bubbly market mood were a series of reports confirming lower inflationary trends in the U.S. and Europe. During the period, it appeared more likely that the U.S. economy could achieve a soft landing, cooling enough to lower inflation without the pain of a recession. However, by year-end, an expectations gap developed. Capital markets priced in a total of 1.50 percentage points in federal funds rate cuts in 2024—twice as much as the three cuts of 0.25% hinted at by Fed officials.
“ In November, the market mood turned positive as cooling inflation inspired confidence that central banks could hold off on further rate hikes. ”
1
The Core Personal Consumption Expenditures Price Index (PCE) is a measure of prices that people living in the United States, or those buying on their behalf, pay for goods and services. It is sometimes called the core PCE price index, because two categories that can have price swings – food and energy – are left out to make underlying inflation easier to see. You cannot invest directly in an index.
4 | Allspring VT Small Cap Growth Fund
Letter to shareholders (unaudited)
For further information about your fund, contact your investment professional, visit our website at allspringglobal.com, or call us directly at 1-800-260-5969.
Don’t let short-term uncertainty derail long-term investment goals.
Periods of investment uncertainty can present challenges, but experience has taught us that maintaining long-term investment goals can be an effective way to plan for the future. To help you create a sound strategy based on your personal goals and risk tolerance, Allspring Funds offers more than 100 mutual funds spanning a wide range of asset classes and investment styles. Although diversification cannot guarantee an investment profit or prevent losses, we believe it can be an effective way to manage investment risk and potentially smooth out overall portfolio performance. We encourage investors to know their investments and to understand that appropriate levels of risk-taking may unlock opportunities.
Thank you for choosing to invest with Allspring Funds. We appreciate your confidence in us and remain committed to helping you meet your financial needs.
Sincerely,
Andrew Owen
President
Allspring Funds
Allspring VT Small Cap Growth Fund | 5
Letter to shareholders (unaudited)
|
Beginning in July 2024, the Fund will be required by the Securities and Exchange Commission to send shareholders a paper copy of a new tailored shareholder report in place of the full shareholder report that you are now receiving. The tailored shareholder report will contain concise information about the Fund, including certain expense and performance information and fund statistics. If you wish to receive this new tailored shareholder report electronically, please follow the instructions on the back cover of this report. |
Other information that is currently included in the shareholder report, such as the Fund’s financial statements, will be available online and upon request, free of charge, in paper or electronic format. |
6 | Allspring VT Small Cap Growth Fund
This page is intentionally left blank.
Performance highlights (unaudited)
Performance highlights
| The Fund seeks long-term capital appreciation. |
| Allspring Funds Management, LLC |
| Allspring Global Investments, LLC |
| Robert Gruendyke, CFA, David Nazaret, CFA, Thomas C. Ognar, CFA |
Average annual total returns (%) as of December 31, 2023 |
| | | | | |
| | | | | | |
| | | | | | |
| | | | | | |
Russell 2000® Growth Index3 | | | | | | |
Figures quoted represent past performance, which is no guarantee of future results. Investment return and principal value of an investment will fluctuate so that an investor’s shares, when redeemed, may be worth more or less than their original cost. Current performance may be lower or higher than the performance data quoted and assumes the reinvestment of dividends and capital gains. Current month-end performance is available by calling 1-800-260-5969. Performance figures of the Fund do not reflect fees and expenses charged pursuant to the terms of variable life insurance policies and variable annuity contracts. If these fees and expenses had been reflected, performance would have been lower.
Index returns do not include transaction costs associated with buying and selling securities, any mutual fund fees or expenses, or any taxes. It is not possible to invest directly in an index.
Shares are sold without a front-end sales charge or contingent deferred sales charge.
|
| Reflects the expense ratios as stated in the most recent prospectuses. The expense ratios shown are subject to change and may differ from the annualized expense ratios shown in the Financial Highlights of this report. |
| The manager has contractually committed through April 30, 2024, to waive fees and/or reimburse expenses to the extent necessary to cap total annual fund operating expenses after fee waivers at 0.95% for Class 1 shares and 1.20% for Class 2 shares. Brokerage commissions, stamp duty fees, interest, taxes, acquired fund fees and expenses (if any), and extraordinary expenses are excluded from the expense caps. Prior to or after the commitment expiration date, the caps may be increased or the commitment to maintain the caps may be terminated only with the approval of the Board of Trustees. Without these caps, the Fund’s returns would have been lower. The expense ratio paid by an investor is the net expense ratio (the total annual fund operating expenses after fee waivers) as stated in the prospectuses. |
| The Russell 2000® Growth Index measures the performance of those Russell 2000 companies with higher price/book ratios and higher forecasted growth values. You cannot invest directly in an index. |
Stock values fluctuate in response to the activities of individual companies and general market and economic conditions. Smaller-company stocks tend to be more volatile and less liquid than those of larger companies. Consult the Fund’s prospectus for additional information on these and other risks.
Please refer to the prospectus provided by your participating insurance company for detailed information describing the separate accounts for information regarding surrender charges, mortality and expense risk fees, and other charges that may be assessed by the participating insurance companies.
CFA® and Chartered Financial Analyst® are trademarks owned by CFA Institute. |
8 | Allspring VT Small Cap Growth Fund
Performance highlights (unaudited)
Growth of $10,000 investment as of December 31, 20231 |
| The chart compares the performance of Class 2 shares for the most recent ten years with the Russell 2000® Growth Index. The chart assumes a hypothetical investment of $10,000 in Class 2 shares and reflects all operating expenses of the Fund but does not reflect fees and expenses charged pursuant to the terms of variable life insurance policies and variable annuity contracts. |
Allspring VT Small Cap Growth Fund | 9
Performance highlights (unaudited)
MANAGER’S DISCUSSION
Fund highlights
•The Fund underperformed its benchmark, the Russell 2000® Growth Index, for the 12-month period that ended December 31, 2023.
•Healthcare and Information technology (IT) were the primary detractors during the period.
•Consumer staples contributed due to strong stock selection.
While equities performed well overall in 2023, small caps lagged as investors focused on mega caps.
Equities staged a strong rally during the year, but it was largely driven by mega caps, specifically a group of seven stocks that collectively rose more than 70% during the period. That led to a significant performance gap, with the large-cap Russell 1000® Growth Index† outperforming the small-cap Russell 2000® Growth Index by 24%, a similar margin to 2021, which created a difficult environment for smaller stocks. Small caps were heavily influenced by interest rate moves, which swung widely in the last five months of the year, with rates rising sharply only to fall by the largest margin seen in years during the final two months. As interest rates declined, small caps raced ahead and significantly outperformed in December 2023 in a classic melt-up scenario that favored the most beaten-down names in what can be characterized as a low-quality rally.
Despite positive returns, small caps endured significant volatility over the period, which made it difficult to keep pace as sentiment constantly shifted around interest rates and the prospects of a recession.
Ten largest holdings (%) as of December 31, 20231 |
| |
| |
| |
| |
Casella Waste Systems, Inc. Class A | |
| |
| |
| |
Applied Industrial Technologies, Inc. | |
Kinsale Capital Group, Inc. | |
| Figures represent the percentage of the Fund’s net assets. Holdings are subject to change and may have changed since the date specified. |
Health care and IT were major detractors during the period.
Health care was an underperforming sector for the year. Even though we carried a slight underweight, weakness in portfolio holdings detracted from performance. Specifically, our holdings in the medical devices area—Treace Medical Concepts* (device for bunion correction) and Silk Road Medical* (transcarotid artery revascularization or TCAR procedures to reduce stroke risk)—simply did not perform as growth did not materialize as expected. There were strong performers, such as SI-Bone (up more than 50%), but not enough to offset the detractors. We generally are underweight biotech, a significant part of the Russell 2000® Growth Index. That worked for part of the year but held back the portfolio in the fourth quarter as many of these stocks had strong rallies on the basis of interest rates alone.
IT was an area of overweight in the portfolio, but small-cap tech stocks did not perform anywhere near what their large-cap counterparts did. While we had plenty of winners, including SPS Commerce (logistics software) and CyberArk Software (security), there weren’t enough to offset weakness in stocks such as Calix and Impinj*. We continue to find plenty of higher-growth names in IT, but this is one sector where we need the market to broaden out beyond the mega caps. We saw some of that late in the year, and if the trend persists, we expect the sector to perform strongly in
2024.
†The Russell 1000® Growth Index measures the performance of those Russell 1000 companies with higher price/book ratios and higher forecasted growth values. You cannot invest directly in an index.
*This security was no longer held at the end of the reporting period.
10 | Allspring VT Small Cap Growth Fund
Performance highlights (unaudited)
Sector allocation as of December 31, 20231 |
| Figures represent the percentage of the Fund’s long-term investments. Allocations are subject to change and may have changed since the date specified. |
The Fund benefited from an overweight to and strong stock selection within consumer staples.
Our positioning in consumer staples was a significant contributor. Our focus on high-growth stocks e.l.f. Beauty and Celsius Holdings contributed to overall returns as both companies put up strong growth throughout the year as they expanded shelf space across their distribution chains. This is yet another sector that differs substantially from large-cap indexes in that there are considerably more opportunities in the sector within the small-
cap segment. We expect to remain overweight given the quality of the businesses we’re currently invested in.
Small caps have lagged badly over the past three years and are poised to improve if market breadth broadens.
As we close the chapter on 2023, the prevailing market consensus points to a notable shift in Federal Reserve policy. The belief now is that the interest rate hike cycle is over, and the central bank is poised to cut rates in 2024 and adopt an easing stance. This shift in sentiment fueled a robust rally in the fourth quarter, amplified by the historical tendency of equities to thrive as inflation recedes at the end of a rate hike cycle. Small caps tend to lead coming out of such periods.
Adding a layer of complexity, 2024 is a U.S. election year. While historical trends suggest that election years tend to favor equities, the market will grapple with heightened volatility. The enduring themes of inflation and interest rates will continue to be pivotal drivers of market performance in the immediate future. Despite the economy’s remarkable resilience, investors should brace for sustained volatility given the wide range of potential outcomes as we face uncertainties that include an election, multiple global geopolitical conflicts, inflation trends, and the lingering impact of higher interest rates.
We hope the dominance of the “Magnificent Seven” that shaped market dynamics in 2023, particularly within large-cap growth, will wane. A broader market rally would certainly be welcome by many investors. We continue to believe in the merit of managing diversified and balanced portfolios as we navigate possibly choppier waters in 2024.
Allspring VT Small Cap Growth Fund | 11
Fund expenses (unaudited)
Fund expenses
As a shareholder of the Fund, you incur ongoing costs, including management fees, distribution (12b-1) fees and other Fund expenses. This example is intended to help you understand your ongoing costs (in dollars) of investing in the Fund and to compare these costs with the ongoing costs of investing in other mutual funds.
The example is based on an investment of $1,000 invested at the beginning of the six-month period and held for the entire period from July 1, 2023 to December 31, 2023.
Actual expenses
The “Actual” line of the table below provides information about actual account values and actual expenses. You may use the information in this line, together with the amount you invested, to estimate the expenses that you paid over the period. Simply divide your account value by $1,000 (for example, an $8,600 account value divided by $1,000= 8.6), then multiply the result by the number in the “Actual” line under the heading entitled “Expenses paid during period” for your applicable class of shares to estimate the expenses you paid on your account during this period.
Hypothetical example for comparison purposes
The “Hypothetical” line of the table below provides information about hypothetical account values and hypothetical expenses based on the Fund’s actual expense ratio and an assumed rate of return of 5% per year before expenses, which is not the Fund’s actual return. The hypothetical account values and expenses may not be used to estimate the actual ending account balance or expenses you paid for the period. You may use this information to compare the ongoing costs of investing in the Fund and other funds. To do so, compare this 5% hypothetical example with the 5% hypothetical examples that appear in the shareholder reports of the other funds.
Please note that the expenses shown in the table are meant to highlight your ongoing costs only and do not reflect any separate account charges assessed by participating insurance companies. Therefore, the “Hypothetical” line of the table is useful in comparing ongoing costs only, and will not help you determine the relative total costs of owning different funds. In addition, if these separate account charges assessed by participating insurance companies were included, your costs would have been higher.
| Beginning
account value
7-1-2023 | Ending
account value
12-31-2023 | | Annualized net
expense ratio |
| | | | |
| | | | |
Hypothetical (5% return before expenses) | | | | |
| | | | |
| | | | |
Hypothetical (5% return before expenses) | | | | |
| Expenses paid is equal to the annualized net expense ratio of each class multiplied by the average account value over the period, multiplied by 183 divided by 365 (to reflect the one-half-year period). |
12 | Allspring VT Small Cap Growth Fund
Portfolio of investments—December 31, 2023
| | | | | |
| | | | | | |
Communication services: 0.40% | | | | | | |
| | | | | | |
Madison Square Garden Entertainment Corp.† | | | | | | |
| | | | | | |
| | | | | | |
Consumer discretionary: 9.40% | | | | | | |
Automobile components: 0.96% | | | | | | |
Fox Factory Holding Corp.† | | | | | | |
Modine Manufacturing Co.† | | | | | | |
| | | | | | |
| | | | | | |
Diversified consumer services: 3.85% | | | | | | |
Bright Horizons Family Solutions, Inc.† | | | | | | |
| | | | | | |
| | | | | | |
| | | | | | |
| | | | | | |
Hotels, restaurants & leisure: 2.55% | | | | | | |
Dutch Bros, Inc. Class A† | | | | | | |
First Watch Restaurant Group, Inc.† | | | | | | |
Hilton Grand Vacations, Inc.† | | | | | | |
| | | | | | |
| | | | | | |
| | | | | | |
American Eagle Outfitters, Inc. | | | | | | |
Boot Barn Holdings, Inc.† | | | | | | |
| | | | | | |
| | | | | | |
| | | | | | |
| | | | | | |
| | | | | | |
| | | | | | |
| | | | | | |
Consumer staples distribution & retail : 0.41% | | | | | | |
| | | | | | |
| | | | | | |
| | | | | | |
| | | | | | |
| | | | | | |
The accompanying notes are an integral part of these financial statements.
Allspring VT Small Cap Growth Fund | 13
Portfolio of investments—December 31, 2023
| | | | | |
Personal care products: 4.89% | | | | | | |
| | | | | | |
| | | | | | |
| | | | | | |
| | | | | | |
Energy equipment & services: 0.43% | | | | | | |
| | | | | | |
Oil, gas & consumable fuels: 1.24% | | | | | | |
| | | | | | |
| | | | | | |
| | | | | | |
| | | | | | |
Financial services: 0.20% | | | | | | |
| | | | | | |
| | | | | | |
Goosehead Insurance, Inc. Class A† | | | | | | |
Kinsale Capital Group, Inc. | | | | | | |
Skyward Specialty Insurance Group, Inc.† | | | | | | |
| | | | | | |
| | | | | | |
| | | | | | |
Apellis Pharmaceuticals, Inc.† | | | | | | |
Immunocore Holdings PLC ADR† | | | | | | |
| | | | | | |
| | | | | | |
| | | | | | |
| | | | | | |
| | | | | | |
Health care equipment & supplies: 7.80% | | | | | | |
| | | | | | |
| | | | | | |
PROCEPT BioRobotics Corp.† | | | | | | |
| | | | | | |
| | | | | | |
| | | | | | |
| | | | | | |
| | | | | | |
Health care providers & services: 3.28% | | | | | | |
| | | | | | |
| | | | | | |
| | | | | | |
| | | | | | |
The accompanying notes are an integral part of these financial statements.
14 | Allspring VT Small Cap Growth Fund
Portfolio of investments—December 31, 2023
| | | | | |
| | | | | | |
Cymabay Therapeutics, Inc.† | | | | | | |
Ligand Pharmaceuticals, Inc.† | | | | | | |
Structure Therapeutics, Inc. ADR† | | | | | | |
Tarsus Pharmaceuticals, Inc.† | | | | | | |
| | | | | | |
| | | | | | |
Aerospace & defense: 1.27% | | | | | | |
| | | | | | |
| | | | | | |
| | | | | | |
| | | | | | |
| | | | | | |
Zurn Elkay Water Solutions Corp. | | | | | | |
| | | | | | |
Commercial services & supplies: 3.30% | | | | | | |
Casella Waste Systems, Inc. Class A† | | | | | | |
| | | | | | |
| | | | | | |
Construction & engineering: 2.52% | | | | | | |
Comfort Systems USA, Inc. | | | | | | |
Construction Partners, Inc. Class A† | | | | | | |
| | | | | | |
Electrical equipment: 0.89% | | | | | | |
NEXTracker, Inc. Class A† | | | | | | |
Shoals Technologies Group, Inc. Class A† | | | | | | |
| | | | | | |
Ground transportation: 2.48% | | | | | | |
| | | | | | |
| | | | | | |
| | | | | | |
| | | | | | |
| | | | | | |
| | | | | | |
| | | | | | |
| | | | | | |
Professional services: 1.90% | | | | | | |
| | | | | | |
| | | | | | |
| | | | | | |
The accompanying notes are an integral part of these financial statements.
Allspring VT Small Cap Growth Fund | 15
Portfolio of investments—December 31, 2023
| | | | | |
Trading companies & distributors: 3.54% | | | | | | |
Applied Industrial Technologies, Inc. | | | | | | |
SiteOne Landscape Supply, Inc.† | | | | | | |
| | | | | | |
Information technology: 35.13% | | | | | | |
Communications equipment: 1.22% | | | | | | |
| | | | | | |
| | | | | | |
| | | | | | |
Electronic equipment, instruments & components: 2.05% | | | | | | |
| | | | | | |
| | | | | | |
| | | | | | |
| | | | | | |
| | | | | | |
| | | | | | |
| | | | | | |
Semiconductors & semiconductor equipment: 6.91% | | | | | | |
ACM Research, Inc. Class A† | | | | | | |
Allegro MicroSystems, Inc.† | | | | | | |
Credo Technology Group Holding Ltd.† | | | | | | |
| | | | | | |
| | | | | | |
| | | | | | |
Silicon Laboratories, Inc.† | | | | | | |
| | | | | | |
| | | | | | |
| | | | | | |
| | | | | | |
| | | | | | |
| | | | | | |
Clearwater Analytics Holdings, Inc. Class A† | | | | | | |
| | | | | | |
Descartes Systems Group, Inc.† | | | | | | |
DoubleVerify Holdings, Inc.† | | | | | | |
| | | | | | |
| | | | | | |
| | | | | | |
PowerSchool Holdings, Inc. Class A† | | | | | | |
| | | | | | |
Sprout Social, Inc. Class A† | | | | | | |
| | | | | | |
| | | | | | |
| | | | | | |
| | | | | | |
The accompanying notes are an integral part of these financial statements.
16 | Allspring VT Small Cap Growth Fund
Portfolio of investments—December 31, 2023
| | | | | |
| | | | | | |
| | | | | | |
| | | | | | |
Total common stocks (Cost $241,906,260) | | | | | | |
| | | | | |
Short-term investments: 1.20% | | | | | | |
Investment companies: 1.20% | | | | | | |
Allspring Government Money Market Fund Select Class♠∞ | | | | | | |
Total short-term investments (Cost $3,515,301) | | | | | | |
Total investments in securities (Cost $245,421,561) | | | | | | |
Other assets and liabilities, net | | | | | | |
| | | | | | |
| Non-income-earning security |
| The issuer of the security is an affiliated person of the Fund as defined in the Investment Company Act of 1940. |
| The rate represents the 7-day annualized yield at period end. |
|
| American depositary receipt |
Investments in affiliates
An affiliated investment is an investment in which the Fund owns at least 5% of the outstanding voting shares of the issuer or as a result of other relationships, such as the Fund and the issuer having the same investment manager. Transactions with issuers that were affiliates of the Fund at the end of the period were as follows:
| | | | | Net
change in
unrealized
gains
(losses) | | | Income
from
affiliated
securities |
| | | | | | | | |
Allspring Government Money Market Fund Select Class | | | | | | | | |
Investments in affiliates no longer held at end of period | | | | | | | | |
Securities Lending Cash Investments LLC | | | | | | | | |
| | | | | | | | |
| Amount shown represents income before fees and rebates. |
The accompanying notes are an integral part of these financial statements.
Allspring VT Small Cap Growth Fund | 17
Statement of assets and liabilities—December 31, 2023
Financial statements
Statement of assets and liabilities
| |
Investments in unaffiliated securities, at value (cost $241,906,260) | |
Investments in affiliated securities, at value (cost $3,515,301) | |
Receivable for investments sold | |
Receivable for Fund shares sold | |
| |
Prepaid expenses and other assets | |
| |
| |
Payable for investments purchased | |
Payable for Fund shares redeemed | |
| |
| |
Administration fees payable | |
Trustees’ fees and expenses payable | |
Accrued expenses and other liabilities | |
| |
| |
| |
| |
Total distributable earnings | |
| |
Computation of net asset value per share | |
| |
Shares outstanding–Class 11 | |
Net asset value per share–Class 1 | |
| |
Shares outstanding–Class 21 | |
Net asset value per share–Class 2 | |
1 The Fund has an unlimited number of authorized shares.
The accompanying notes are an integral part of these financial statements.
18 | Allspring VT Small Cap Growth Fund
Statement of operations—year ended December 31, 2023
Statement of operations
| |
| |
Income from affiliated securities | |
| |
| |
| |
| |
| |
| |
| |
| |
| |
Custody and accounting fees | |
| |
Shareholder report expenses | |
Trustees’ fees and expenses | |
| |
| |
| |
Realized and unrealized gains (losses) on investments | |
Net realized gains (losses) on | |
| |
| |
Net realized losses on investments | |
Net change in unrealized gains (losses) on | |
| |
| |
Net change in unrealized gains (losses) on investments | |
Net realized and unrealized gains (losses) on investments | |
Net increase in net assets resulting from operations | |
The accompanying notes are an integral part of these financial statements.
Allspring VT Small Cap Growth Fund | 19
Statement of changes in net assets
Statement of changes in net assets
| Year ended December 31, 2023 | Year ended December 31, 2022 |
| | | | |
| | | | |
Net realized losses on investments | | | | |
Net change in unrealized gains (losses) on investments | | | | |
Net increase (decrease) in net assets resulting from operations | | | | |
Distributions to shareholders from | | | | |
Net investment income and net realized gains | | | | |
| | | | |
| | | | |
Total distributions to shareholders | | | | |
Capital share transactions | | | | |
Proceeds from shares sold | | | | |
| | | | |
| | | | |
| | | | |
Reinvestment of distributions | | | | |
| | | | |
| | | | |
| | | | |
Payment for shares redeemed | | | | |
| | | | |
| | | | |
| | | | |
Net increase (decrease) in net assets resulting from capital share transactions | | | | |
Total increase (decrease) in net assets | | | | |
| | | | |
| | | | |
| | | | |
The accompanying notes are an integral part of these financial statements.
20 | Allspring VT Small Cap Growth Fund
Financial highlights
(For a share outstanding throughout each period)
| |
| | | | | |
Net asset value, beginning of period | | | | | |
| | | | | |
Net realized and unrealized gains (losses) on investments | | | | | |
Total from investment operations | | | | | |
Distributions to shareholders from | | | | | |
| | | | | |
Net asset value, end of period | | | | | |
| | | | | |
Ratios to average net assets (annualized) | | | | | |
| | | | | |
| | | | | |
| | | | | |
| | | | | |
| | | | | |
Net assets, end of period (000s omitted) | | | | | |
| Calculated based upon average shares outstanding |
| Returns do not reflect fees and expenses charged pursuant to the terms of variable life insurance policies and variable annuity contracts. |
The accompanying notes are an integral part of these financial statements.
Allspring VT Small Cap Growth Fund | 21
(For a share outstanding throughout each period)
| |
| | | | | |
Net asset value, beginning of period | | | | | |
| | | | | |
Net realized and unrealized gains (losses) on investments | | | | | |
Total from investment operations | | | | | |
Distributions to shareholders from | | | | | |
| | | | | |
Net asset value, end of period | | | | | |
| | | | | |
Ratios to average net assets (annualized) | | | | | |
| | | | | |
| | | | | |
| | | | | |
| | | | | |
| | | | | |
Net assets, end of period (000s omitted) | | | | | |
| Calculated based upon average shares outstanding |
| Returns do not reflect fees and expenses charged pursuant to the terms of variable life insurance policies and variable annuity contracts. |
The accompanying notes are an integral part of these financial statements.
22 | Allspring VT Small Cap Growth Fund
Notes to financial statements
Notes to financial statements
Allspring Variable Trust (the “Trust”), a Delaware statutory trust organized on March 10, 1999, is an open-end management investment company registered under the Investment Company Act of 1940, as amended (the “1940 Act”). As an investment company, the Trust follows the accounting and reporting guidance in Financial Accounting Standards Board (“FASB”) Accounting Standards Codification Topic 946, Financial Services – Investment Companies. These financial statements report on the Allspring VT Small Cap Growth Fund (the “Fund”) which is a diversified series of the Trust. The Trust offers shares of the Fund to separate accounts of various life insurance companies as funding vehicles for certain variable annuity contracts and variable life insurance policies.
2.
SIGNIFICANT ACCOUNTING POLICIES
The following significant accounting policies, which are consistently followed in the preparation of the financial statements of the Fund, are in conformity with U.S. generally accepted accounting principles which require management to make estimates and assumptions that affect the reported amounts of assets and liabilities, disclosure of contingent assets and liabilities at the date of the financial statements, and the reported amounts of income and expenses during the reporting period. Actual results could differ from those estimates.
Securities valuation
All investments are valued each business day as of the close of regular trading on the New York Stock Exchange (generally 4 p.m. Eastern Time), although the Fund may deviate from this calculation time under unusual or unexpected circumstances.
Equity securities and exchange-traded funds that are listed on a foreign or domestic exchange or market are valued at the official closing price or, if none, the last sales price.
Investments in registered open-end investment companies (other than those listed on a foreign or domestic exchange or market) are valued at net asset value.
Investments which are not valued using the methods discussed above are valued at their fair value, as determined in good faith by Allspring Funds Management, LLC (“Allspring Funds Management”), which was named the valuation designee by the Board of Trustees. As the valuation designee, Allspring Funds Management is responsible for day-to-day valuation activities for the Allspring Funds. In connection with these responsibilities, Allspring Funds Management has established a Valuation Committee and has delegated to it the authority to take any actions regarding the valuation of portfolio securities that the Valuation Committee deems necessary or appropriate, including determining the fair value of portfolio securities. On a quarterly basis, the Board of Trustees receives reports of valuation actions taken by the Valuation Committee. On at least an annual basis, the Board of Trustees receives an assessment of the adequacy and effectiveness of Allspring Funds Management’s process for determining the fair value of the portfolio of investments.
Securities lending
During the period, the Fund participated in a program to lend its securities from time to time in order to earn additional income in the form of fees or interest on securities received as collateral or the investment of any cash received as collateral. When securities were on loan, the Fund received interest or dividends on those securities. Cash collateral received in connection with its securities lending transactions was invested in Securities Lending Cash Investments, LLC (the “Securities Lending Fund”), an affiliated non-registered investment company. Interests in the non-registered investment company that were redeemable at net asset value were fair valued normally at net asset value. Effective at the close of business on March 29, 2023, the Fund is no longer participating in the securities lending program and the Securities Lending Fund was liquidated. Securities Lending Fund was managed by Allspring Funds Management and was subadvised by Allspring Global Investments, LLC (“Allspring Investments”), an affiliate of Allspring Funds Management and wholly owned subsidiary of Allspring Global Investments Holdings, LLC. Allspring Funds Management received an advisory fee starting at 0.05% and declining to 0.01% as the average daily net assets of the Securities Lending Fund increased. All of the fees received by Allspring Funds Management were paid to Allspring Investments for its services as subadviser.
Income earned from investment in the Securities Lending Fund (net of fees and rebates), if any, is included in income from affiliated securities on the Statement of Operations.
Security transactions and income recognition
Securities transactions are recorded on a trade date basis. Realized gains or losses are recorded on the basis of identified cost.
Dividend income is recognized on the ex-dividend date.
Interest earned on cash balances held at the custodian is recorded as interest income.
Distributions to shareholders
Distributions to shareholders from net investment income and any net realized gains are recorded on the ex-dividend date and paid at least annually. Such distributions are determined in accordance with income tax regulations and may differ from U.S. generally accepted accounting principles. Dividend sources are estimated at the time of declaration. The tax character of distributions is determined as of the Fund’s fiscal year end. Therefore, a portion of the Fund’s distributions made prior to the Fund’s fiscal year end may be categorized as a tax return of capital at year end.
Allspring VT Small Cap Growth Fund | 23
Notes to financial statements
Federal and other taxes
The Fund intends to continue to qualify as a regulated investment company by distributing substantially all of its investment company taxable income and any net realized capital gains (after reduction for capital loss carryforwards) sufficient to relieve it from all, or substantially all, federal income taxes. Accordingly, no provision for federal income taxes was required.
The Fund’s income and federal excise tax returns and all financial records supporting those returns for the prior three fiscal years are subject to examination by the federal and Delaware revenue authorities. Management has analyzed the Fund’s tax positions taken on federal, state, and foreign tax returns, as applicable, for all open tax years and does not believe that there are any uncertain tax positions that require recognition of a tax liability.
As of December 31, 2023, the aggregate cost of all investments for federal income tax purposes was $245,946,567 and the unrealized gains (losses) consisted of:
Reclassifications are made to the Fund’s capital accounts for permanent tax differences to reflect income and gains available for distribution (or available capital loss carryforwards) under federal income tax regulations. U.S. generally accepted accounting principles require that certain components of net assets be adjusted to reflect permanent differences between financial and tax reporting. These reclassifications have no effect on net assets or net asset values per share. The primary permanent difference causing such reclassification are due to dividends from certain securities and net operating loss. At December 31, 2023, as a result of permanent book-to-tax differences, the following reclassification adjustments were made on the Statement of Assets and Liabilities:
| Total distributable
earnings |
| |
As of December 31, 2023, the Fund had capital loss carryforwards which consist of $28,434,363 in short-term capital losses.
Class allocations
The separate classes of shares offered by the Fund differ principally in distribution fees. Class specific expenses are charged directly to that share class. Investment income, common fund-level expenses, and realized and unrealized gains (losses) on investments are allocated daily to each class of shares based on the relative proportion of net assets of each class.
3.
FAIR VALUATION MEASUREMENTS
Fair value measurements of investments are determined within a framework that has established a fair value hierarchy based upon the various data inputs utilized in determining the value of the Fund’s investments. The three-level hierarchy gives the highest priority to unadjusted quoted prices in active markets for identical assets or liabilities (Level 1) and the lowest priority to unobservable inputs (Level 3). The Fund’s investments are classified within the fair value hierarchy based on the lowest level of input that is significant to the fair value measurement. The inputs are summarized into three broad levels as follows:
•Level 1—quoted prices in active markets for identical securities
•Level 2—other significant observable inputs (including quoted prices for similar securities, interest rates, prepayment speeds, credit risk, etc.)
•Level 3—significant unobservable inputs (including the Fund’s own assumptions in determining the fair value of investments)
The inputs or methodologies used for valuing investments in securities are not necessarily an indication of the risk associated with investing in those securities.
24 | Allspring VT Small Cap Growth Fund
Notes to financial statements
The following is a summary of the inputs used in valuing the Fund’s assets and liabilities as of December 31, 2023:
| | Other significant
observable inputs
(Level 2) | Significant
unobservable inputs
(Level 3) | |
| | | | |
| | | | |
| | | | |
| | | | |
| | | | |
| | | | |
| | | | |
| | | | |
| | | | |
| | | | |
| | | | |
| | | | |
| | | | |
| | | | |
| | | | |
Additional sector, industry or geographic detail, if any, is included in the Portfolio of Investments.
At December 31, 2023, the Fund did not have any transfers into/out of Level 3.
4.
TRANSACTIONS WITH AFFILIATES
Management fee
Allspring Funds Management, a wholly owned subsidiary of Allspring Global Investments Holdings, LLC, a holding company indirectly owned by certain private funds of GTCR LLC and Reverence Capital Partners, L.P., is the manager of the Fund and provides advisory and fund-level administrative services under an investment management agreement. Under the investment management agreement, Allspring Funds Management is responsible for, among other services, implementing the investment objectives and strategies of the Fund, supervising the subadviser and providing fund-level administrative services in connection with the Fund’s operations. As compensation for its services under the investment management agreement, Allspring Funds Management is entitled to receive a management fee at the following annual rate based on the Fund’s average daily net assets:
For the year ended December 31, 2023, the management fee was equivalent to an annual rate of 0.80% of the Fund’s average daily net assets.
Allspring Funds Management has retained the services of a subadviser to provide daily portfolio management to the Fund. The fee for subadvisory services is borne by Allspring Funds Management. Allspring Investments is the subadviser to the Fund and is entitled to receive a fee from Allspring Funds Management at an annual rate starting at 0.55% and declining to 0.40% as the average daily net assets of the Fund increase.
Administration fees
Under a class-level administration agreement, Allspring Funds Management provides class-level administrative services to the Fund, which includes paying fees and expenses for services provided by the transfer agent, sub-transfer agents, omnibus account servicers and record-keepers. As compensation for its services under the class-level administration agreement, Allspring Funds Management receives an annual fee of 0.08% which is calculated based on the average daily net assets of each class.
Waivers and/or expense reimbursements
Allspring Funds Management has contractually committed to waive and/or reimburse management and administration fees to the extent necessary to maintain certain net operating expense ratios for the Fund. When each class of the Fund has exceeded its expense cap, Allspring Funds Management will waive fees and/or reimburse expenses from fund-level expenses on a proportionate basis and then from class specific expenses. When only certain classes exceed their expense caps, waivers and/or reimbursements are applied against class specific expenses before fund-level expenses. Allspring
Allspring VT Small Cap Growth Fund | 25
Notes to financial statements
Funds Management has contractually committed through April 30, 2024 to waive fees and/or reimburse expenses to the extent necessary to cap the Fund’s expenses. Prior to or after the commitment expiration date, the cap may be increased or the commitment to maintain the cap may be terminated only with the approval of the Board of Trustees. As of December 31, 2023, the contractual expense caps are as follows:
Distribution fee
The Trust has adopted a distribution plan for Class 2 shares pursuant to Rule 12b-1 under the 1940 Act. A distribution fee is charged to Class 2 shares and paid to Allspring Funds Distributor, LLC, the principal underwriter, an affiliate of Allspring Funds Management, at an annual rate up to 0.25% of the average daily net assets of Class 2 shares.
Interfund transactions
The Fund may purchase or sell portfolio investment securities to certain affiliates pursuant to Rule 17a-7 under the 1940 Act and under procedures adopted by the Board of Trustees. The procedures have been designed to ensure that these interfund transactions, which do not incur broker commissions, are effected at current market prices. Pursuant to these procedures, the Fund did not have any interfund transactions during the year ended December 31, 2023.
5.
INVESTMENT PORTFOLIO TRANSACTIONS
Purchases and sales of investments, excluding U.S. government obligations (if any) and short-term securities, for the year ended December 31, 2023 were $271,919,273 and $276,189,950, respectively.
The Trust, Allspring Master Trust and Allspring Funds Trust (excluding the money market funds) are parties to a $350,000,000 revolving credit agreement whereby the Fund is permitted to use bank borrowings for temporary or emergency purposes, such as to fund shareholder redemption requests. Interest under the credit agreement is charged to the Fund based on borrowing rate equal to the higher of the Federal Funds rate or the overnight bank funding rate in effect on that day plus a spread. In addition, an annual commitment fee based on the unused balance is allocated to each participating fund.
For the year ended December 31, 2023, there were no borrowings by the Fund under the agreement.
7.
DISTRIBUTIONS TO SHAREHOLDERS
The tax character of distributions paid was $0 and $55,803,054 of long-term capital gain for the years ended December 31, 2023 and December 31, 2022, respectively.
As of December 31, 2023, the components of distributable earnings on a tax basis were as follows:
As of the end of the period, the Fund concentrated its portfolio of investments in the information technology sector. A fund that invests a substantial portion of its assets in any sector may be more affected by changes in that sector than would be a fund whose investments are not heavily weighted in any sector.
Under the Fund’s organizational documents, the officers and Trustees have been granted certain indemnification rights against certain liabilities that may arise out of performance of their duties to the Fund. The Fund has entered into a separate agreement with each Trustee that converts indemnification rights currently existing under the Fund’s organizational documents into contractual rights that cannot be changed in the future without the consent of the Trustee. Additionally, in the normal course of business, the Fund may enter into contracts with service providers that contain a variety of indemnification clauses. The Fund’s maximum exposure under these arrangements is dependent on future claims that may be made against the Fund and, therefore, cannot be estimated.
26 | Allspring VT Small Cap Growth Fund
Report of independent registered public accounting firm
To the Shareholders of the Fund and Board of Trustees
Allspring Variable Trust:
Opinion on the Financial Statements
We have audited the accompanying statement of assets and liabilities of Allspring VT Small Cap Growth Fund (the Fund), one of the funds constituting Allspring Variable Trust, including the portfolio of investments, as of December 31, 2023, the related statement of operations for the year then ended, the statements of changes in net assets for each of the years in the two-year period then ended, and the related notes (collectively, the financial statements) and the financial highlights for each of the years in the five-year period then ended. In our opinion, the financial statements and financial highlights present fairly, in all material respects, the financial position of the Fund as of December 31, 2023, the results of its operations for the year then ended, the changes in its net assets for each of the years in the two-year period then ended, and the financial highlights for each of the years in the five-year period then ended, in conformity with U.S. generally accepted accounting principles.
Basis for Opinion
These financial statements and financial highlights are the responsibility of the Fund’s management. Our responsibility is to express an opinion on these financial statements and financial highlights based on our audits. We are a public accounting firm registered with the Public Company Accounting Oversight Board (United States) (PCAOB) and are required to be independent with respect to the Fund in accordance with the U.S. federal securities laws and the applicable rules and regulations of the Securities and Exchange Commission and the PCAOB.
We conducted our audits in accordance with the standards of the PCAOB. Those standards require that we plan and perform the audit to obtain reasonable assurance about whether the financial statements and financial highlights are free of material misstatement, whether due to error or fraud. Our audits included performing procedures to assess the risks of material misstatement of the financial statements and financial highlights, whether due to error or fraud, and performing procedures that respond to those risks. Such procedures included examining, on a test basis, evidence regarding the amounts and disclosures in the financial statements and financial highlights. Such procedures also included confirmation of securities owned as of December 31, 2023, by correspondence with the custodian, transfer agent and brokers, or by other appropriate auditing procedures. Our audits also included evaluating the accounting principles used and significant estimates made by management, as well as evaluating the overall presentation of the financial statements and financial highlights. We believe that our audits provide a reasonable basis for our opinion.

We have not been able to determine the specific year that we began serving as the auditor of one or more Allspring Funds investment companies; however, we are aware that we have served as the auditor of one or more Allspring Funds investment companies since at least 1955.
Boston, Massachusetts
February 26, 2024
Allspring VT Small Cap Growth Fund | 27
Other information (unaudited)
Other information
Proxy voting information
A description of the policies and procedures used to determine how to vote proxies relating to portfolio securities is available without charge, upon request, by calling 1-866-259-3305, visiting our website at allspringglobal.com, or visiting the SEC website at sec.gov. Information regarding how the proxies related to portfolio securities were voted during the most recent 12-month period ended June 30 is available on the website at allspringglobal.com or by visiting the SEC website at sec.gov.
Quarterly portfolio holdings information
The Fund files its complete schedule of portfolio holdings with the SEC for the first and third quarters of each fiscal year as an exhibit to its reports on Form N-PORT. Shareholders may view the filed Form N-PORT by visiting the SEC website at sec.gov.
28 | Allspring VT Small Cap Growth Fund
Other information (unaudited)
BOARD OF TRUSTEES AND OFFICERS
Each of the Trustees and Officers listed in the table below acts in identical capacities for each fund in the Allspring family of funds, which consists of 117 mutual funds comprising the Allspring Funds Trust, Allspring Variable Trust, Allspring Master Trust and four closed-end funds (collectively the “Fund Complex”). This table should be read in conjunction with the Prospectus and the Statement of Additional Information†. The mailing address of each Trustee and Officer is 1415 Vantage Park Drive, 3rd Floor, Charlotte, NC 28203. Each Trustee and Officer serves an indefinite term, however, each Trustee serves such term until reaching the mandatory retirement age established by the Trustees.
Independent Trustees
| | Principal occupations during past five years or longer | Current other
public company or
investment
company
directorships |
William R. Ebsworth
(Born 1957) | | Retired. From 1984 to 2013, equities analyst, portfolio manager, research director and chief investment officer at Fidelity Management and Research Company in Boston, Tokyo, and Hong Kong, and retired in 2013 as Chief Investment Officer of Fidelity Strategic Advisers, Inc. where he led a team of investment professionals managing client assets. Prior thereto, Board member of Hong Kong Securities Clearing Co., Hong Kong Options Clearing Corp., the Thailand International Fund, Ltd., Fidelity Investments Life Insurance Company, and Empire Fidelity Investments Life Insurance Company. Serves on the Investment Company Institute’s Board of Governors since 2022 and Executive Committee since 2023 as well as the Vice Chairman of the Governing Council of the Independent Directors Council since 2023. Audit Committee Chair and Investment Committee Chair of the Vincent Memorial Hospital Foundation (non-profit organization). Mr. Ebsworth is a CFA charterholder. | |
Jane A. Freeman
(Born 1953) | Trustee,
since 2015;
Chair Liaison,
| Retired. From 2012 to 2014 and 1999 to 2008, Chief Financial Officer of Scientific Learning Corporation. From 2008 to 2012, Ms. Freeman provided consulting services related to strategic business projects. Prior to 1999, Portfolio Manager at Rockefeller & Co. and Scudder, Stevens & Clark. Board member of the Harding Loevner Funds from 1996 to 2014, serving as both Lead Independent Director and chair of the Audit Committee. Board member of the Russell Exchange Traded Funds Trust from 2011 to 2012 and the chair of the Audit Committee. Ms. Freeman is also an inactive Chartered Financial Analyst. | |
Isaiah Harris, Jr.
(Born 1952) | Trustee,
since 2009;
Audit Committee Chair,
since 2019 | Retired. Member of the Advisory Board of CEF of East Central Florida. Chairman of the Board of CIGNA Corporation from 2009 to 2021, and Director from 2005 to 2008. From 2003 to 2011, Director of Deluxe Corporation. Prior thereto, President and CEO of BellSouth Advertising and Publishing Corp. from 2005 to 2007, President and CEO of BellSouth Enterprises from 2004 to 2005 and President of BellSouth Consumer Services from 2000 to 2003. Emeritus member of the Iowa State University Foundation Board of Governors. Emeritus Member of the Advisory board of Iowa State University School of Business. Advisory Board Member, Palm Harbor Academy (private school). Advisory Board Member, Fellowship of Christian Athletes. Mr. Harris is a certified public accountant (inactive status). | |
David F. Larcker
(Born 1950) | | Distinguished Visiting Fellow at the Hoover Institution since 2022. James Irvin Miller Professor of Accounting at the Graduate School of Business (Emeritus), Stanford University, Director of the Corporate Governance Research Initiative and Senior Faculty of The Rock Center for Corporate Governance since 2006. From 2005 to 2008, Professor of Accounting at the Graduate School of Business, Stanford University. Prior thereto, Ernst & Young Professor of Accounting at The Wharton School, University of Pennsylvania from 1985 to 2005. | |
Olivia S. Mitchell
(Born 1953) | | International Foundation of Employee Benefit Plans Professor since 1993, Wharton School of the University of Pennsylvania. Director of Wharton’s Pension Research Council and Boettner Center on Pensions & Retirement Research, and Research Associate at the National Bureau of Economic Research. Previously taught at Cornell University from 1978 to 1993. | |
Timothy J. Penny
(Born 1951) | Trustee,
since 1996;
Chair,
since 2018 | President and Chief Executive Officer of Southern Minnesota Initiative Foundation, a non-profit organization, since 2007. Vice Chair of the Economic Club of Minnesota, since 2007. Co-Chair of the Committee for a Responsible Federal Budget, since 1995. Member of the Board of Trustees of NorthStar Education Finance, Inc., a non-profit organization, from 2007-2022. Senior Fellow of the University of Minnesota Humphrey Institute from 1995 to 2017. | |
* Length of service dates reflect the Trustee’s commencement of service with the Trust’s predecessor entities, where applicable.
# Ms. Freeman will serve as Chair Liaison through June 2024, at which time Ms. Wheelock will assume the role.
†
The Statement of Additional Information includes additional information about the Trustees and is available, without charge, upon request, by calling 1-800-260-5969 or by visiting the website at allspringglobal.com.
Allspring VT Small Cap Growth Fund | 29
Other information (unaudited)
| Position held and length of service* | Principal occupations during past five years or longer | Current other public company or investment company directorships |
James G. Polisson
(Born 1959) | Trustee,
since 2018; Nominating and Governance Committee Chair, since 2024 | Retired. Chief Marketing Officer, Source (ETF) UK Services, Ltd, from 2015 to 2017. From 2012 to 2015, Principal of The Polisson Group, LLC, a management consulting, corporate advisory and principal investing company. Chief Executive Officer and Managing Director at Russell Investments, Global Exchange Traded Funds from 2010 to 2012. Managing Director of Barclays Global Investors from 1998 to 2010 and Global Chief Marketing Officer for iShares and Barclays Global Investors from 2000 to 2010. Trustee of the San Francisco Mechanics’ Institute, a non- profit organization, from 2013 to 2015. Board member of the Russell Exchange Traded Fund Trust from 2011 to 2012. Director of Barclays Global Investors Holdings Deutschland GmbH from 2006 to 2009. Mr. Polisson is an attorney and has a retired status with the Massachusetts and District of Columbia Bar Associations. | |
Pamela Wheelock
(Born 1959) | Trustee,
since January 2020;
previously Trustee from
January 2018 to
| Retired. Executive and Senior Financial leadership positions in the public, private and nonprofit sectors. Interim President and CEO, McKnight Foundation, 2020. Interim Commissioner, Minnesota Department of Human Services, 2019. Chief Operating Officer, Twin Cities Habitat for Humanity, 2017-2019. Vice President for University Services, University of Minnesota, 2012- 2016. Interim President and CEO, Blue Cross and Blue Shield of Minnesota, 2011-2012. Executive Vice-President and Chief Financial Officer, Minnesota Wild, 2002-2008. Commissioner, Minnesota Department of Finance, 1999-2002. Chair of the Board of Directors of Destination Medical Center Corporation. Board member of the Minnesota Wild Foundation. | |
* Length of service dates reflect the Trustee’s commencement of service with the Trust’s predecessor entities, where applicable.
# Ms. Freeman will serve as Chair Liaison through June 2024, at which time Ms. Wheelock will assume the role.
30 | Allspring VT Small Cap Growth Fund
Other information (unaudited)
Officers1
| Position held and
length of service | Principal occupations during past five years or longer |
| | President and Chief Executive Officer of Allspring Funds Management, LLC since 2017 and Head of Global Fund Governance of Allspring Global Investments since 2022. Prior thereto, co-president of Galliard Capital Management, LLC, an affiliate of Allspring Funds Management, LLC, from 2019 to 2022 and Head of Affiliated Managers, Allspring Global Investments, from 2014 to 2019 and Executive Vice President responsible for marketing, investments and product development for Allspring Funds Management, LLC, from 2009 to 2014. |
Jeremy DePalma
(Born 1974) | Treasurer,
since 2012
(for certain funds in
the Fund Complex);
since 2021 (for
the remaining funds in the Complex) | Senior Vice President of Allspring Funds Management, LLC since 2009. Senior Vice President of Evergreen Investment Management Company, LLC from 2008 to 2010 and head of the Fund Reporting and Control Team within Fund Administration from 2005 to 2010. |
Christopher Baker
(Born 1976) | Chief Compliance Officer,
since 2022 | Global Chief Compliance Officer for Allspring Global Investments since 2022. Prior thereto, Chief Compliance Officer for State Street Global Advisors from 2018 to 2021. Senior Compliance Officer for the State Street divisions of Alternative Investment Solutions, Sector Solutions, and Global Marketing from 2015 to 2018. From 2010 to 2015 Vice President, Global Head of Investment and Marketing Compliance for State Street Global Advisors. |
Matthew Prasse
(Born 1983) | Chief Legal Officer,
since 2022;
Secretary,
since 2021 | Senior Counsel of the Allspring Legal Department since 2021. Senior Counsel of the Wells Fargo Legal Department from 2018 to 2021. Previously, Counsel for Barings LLC from 2015 to 2018. Prior to joining Barings, Associate at Morgan, Lewis & Bockius LLP from 2008 to 2015. |
1 For those Officers with tenures at Allspring Global Investments and/or Allspring Funds Management, LLC that began prior to 2021, such tenures include years of service during which these businesses/entities were known as Wells Fargo Asset Management and Wells Fargo Funds Management, LLC, respectively.
Allspring VT Small Cap Growth Fund | 31
This page is intentionally left blank.
For more information
More information about Allspring Funds is available free upon request. To obtain literature, please write, visit the Fund’s website, or call:
Allspring Funds
P.O. Box 219967
Kansas City, MO 64121-9967
Website: allspringglobal.com
Individual investors: 1-800-260-5969
Retail investment professionals: 1-888-877-9275
Institutional investment professionals: 1-866-765-0778
This report and the financial statements contained herein are submitted for the general information of the shareholders of the Fund. If this report is used for promotional purposes, distribution of the report must be accompanied or preceded by a current prospectus. Before investing, please consider the investment objectives, risks, charges, and expenses of the investment. For a current prospectus and, if available, a summary prospectus, containing this information, call 1-800-260-5969 or visit the Fund’s website at allspringglobal.com. Read the prospectus carefully before you invest or send money.
Allspring Global InvestmentsTM is the trade name for the asset management firms of Allspring Global Investments Holdings, LLC, a holding company indirectly owned by certain private funds of GTCR LLC and Reverence Capital Partners, L.P. These firms include but are not limited to Allspring Global Investments, LLC, and Allspring Funds Management, LLC. Certain products managed by Allspring entities are distributed by Allspring Funds Distributor, LLC (a broker-dealer and Member FINRA/SIPC).
This material is for general informational and educational purposes only and is NOT intended to provide investment advice or a recommendation of any kind - including a recommendation for any specific investment, strategy, or plan.
© 2024 Allspring Global Investments Holdings, LLC. All rights reserved.
ALL-01052024-ljmz3knh 02-24
AR3003 12-23
ITEM 2. CODE OF ETHICS
(a) As of the end of the period, covered by the report, Allspring Variable Trust has adopted a code of ethics that applies to its President and Treasurer. A copy of the code of ethics is filed as an exhibit to this Form N-CSR.
(c) During the period covered by this report, there were no amendments to the provisions of the code of ethics adopted in Item 2(a) above.
(d) During the period covered by this report, there were no implicit or explicit waivers to the provisions of the code of ethics adopted in Item 2(a) above.
ITEM 3. AUDIT COMMITTEE FINANCIAL EXPERT
The Board of Trustees of Allspring Variable Trust has determined that Isaiah Harris is an audit committee financial expert, as defined in Item 3 of Form N-CSR. Mr. Harris is independent for purposes of Item 3 of Form N-CSR.
ITEM 4. PRINCIPAL ACCOUNTANT FEES AND SERVICES
(a), (b), (c), (d) The following table presents aggregate fees billed in each of the last two fiscal years for services rendered to the registrant by the registrant’s principal accountant. These fees were billed to the registrant and were approved by the registrant’s audit committee.
| | | | | | | | |
| | | Fiscal year ended
December 31, 2023 | | | Fiscal year ended
December 31, 2022 | |
Audit fees | | $ | 208,230 | | | $ | 203,150 | |
Audit-related fees | | | — | | | | 14,050 | |
Tax fees (1) | | $ | 18,350 | | | $ | 17,920 | |
All other fees | | | — | | | | — | |
| | | | | | | | |
| | $ | 226,580 | | | $ | 235,120 | |
| (1) | Tax fees consist of fees for tax compliance, tax advice, tax planning and excise tax. |
(e)(1) The Chair of the Audit Committees is authorized to pre-approve: (1) audit services for the mutual funds of Allspring Variable Trust; (2) non-audit tax or compliance consulting or training services provided to the Funds by the independent auditors (“Auditors”) if the fees for any particular engagement are not anticipated to exceed $50,000; and (3) non-audit tax or compliance consulting or training services provided by the Auditors to a Fund’s investment adviser and its controlling entities (where pre-approval is required because the engagement relates directly to the operations and financial reporting of the Fund) if the fee to the Auditors for any particular engagement is not anticipated to exceed $50,000. For any such pre-approval sought from the Chair, Management shall prepare a brief description of the proposed services.
If the Chair approves of such service, he or she shall sign the statement prepared by Management. Such written statement shall be presented to the full Committees at their next regularly scheduled meetings.
(e)(2) Not applicable.
(f) Not applicable.
(g) Not applicable.
(h) Not applicable.
(i) Not applicable.
(j) Not applicable.
ITEM 5. AUDIT COMMITTEE OF LISTED REGISTRANTS
Not applicable.
ITEM 6. INVESTMENTS
A Portfolio of Investments for each series of Allspring Variable Trust is included as part of the report to shareholders filed under Item 1 of this Form.
ITEM 7. DISCLOSURE OF PROXY VOTING POLICIES AND PROCEDURES FOR CLOSED-END MANAGEMENT INVESTMENT COMPANIES
Not applicable.
ITEM 8. PORTFOLIO MANAGERS OF CLOSED-END MANAGEMENT INVESTMENT COMPANIES
Not applicable.
ITEM 9. PURCHASES OF EQUITY SECURITIES BY CLOSED-END MANAGEMENT INVESTMENT COMPANY AND AFFILIATED PURCHASERS
Not applicable.
ITEM 10. SUBMISSION OF MATTERS TO A VOTE OF SECURITY HOLDERS
There have been no material changes to the procedures by which shareholders may recommend nominees to the registrant’s Board of Trustees that have been implemented since the registrant’s last provided disclosure in response to the requirements of this Item.
ITEM 11. CONTROLS AND PROCEDURES
(a) The President and Treasurer have concluded that Allspring Variable Trust disclosure controls and procedures (as defined in Rule 30a-3(c) under the Investment Company Act of 1940) provide reasonable assurances that material information relating to the registrant is made known to them by the appropriate persons based on their evaluation of these controls and procedures as of a date within 90 days of the filing of this report.
(b) There were no significant changes in the registrant’s internal control over financial reporting (as defined in Rule 30a-3(d) under the Investment Company Act of 1940) that occurred during the period covered by this report that materially affected, or is reasonably likely to materially affect, the registrant’s internal control over financial reporting.
ITEM 12. DISCLOSURES OF SECURITIES LENDING ACTIVITES FOR CLOSED-END MANAGEMENT INVESTMENT COMPANIES
Not applicable.
ITEM 13. EXHIBITS
(a)(1) Code of Ethics.
(a)(2) Certifications pursuant to Section 302 of the Sarbanes-Oxley Act of 2002.
(a)(3) Not applicable.
(a)(4) Not applicable.
(b) Certifications pursuant to Section 906 of the Sarbanes-Oxley Act of 2002.
SIGNATURES
Pursuant to the requirements of the Securities Exchange Act of 1934 and the Investment Company Act of 1940, the registrant has duly caused this report to be signed on its behalf by the undersigned, thereunto duly authorized.
| | |
| Allspring Variable Trust |
| |
| By: | | /s/ Andrew Owen |
| | Andrew Owen |
| | President |
|
| Date: February 26, 2024 |
Pursuant to the requirements of the Securities Exchange Act of 1934 and the Investment Company Act of 1940, this report has been signed below by the following persons on behalf of the registrant and in the capacities and on the date indicated.
| | |
| Allspring Variable Trust |
| |
| By: | | /s/ Andrew Owen |
| | Andrew Owen |
| | President |
|
| Date: February 26, 2024 |
| |
| By: | | /s/ Jeremy DePalma |
| | Jeremy DePalma |
| | Treasurer |
|
| Date: February 26, 2024 |