UNITED STATES
SECURITIES AND EXCHANGE COMMISSION
Washington, D.C. 20549
FORM N-CSR
CERTIFIED SHAREHOLDER REPORT OF REGISTERED
MANAGEMENT INVESTMENT COMPANIES
Investment Company Act file number: 811-09255
Allspring Variable Trust
(Exact name of registrant as specified in charter)
1415 Vantage Park Drive, 3rd Floor, Charlotte, NC 28203
(Address of principal executive offices) (Zip code)
Matthew Prasse
Allspring Funds Management, LLC
1415 Vantage Park Drive, 3rd Floor, Charlotte, NC 28203
(Name and address of agent for service)
Registrant’s telephone number, including area code: 800-222-8222
Date of fiscal year end: December 31
Registrant is making a filing for 6 of its series:
Allspring VT Discovery Fund, Allspring VT Index Asset Allocation Fund, Allspring VT International Equity Fund, Allspring VT Omega Growth Fund, Allspring VT Opportunity Fund and Allspring VT Small Cap Growth Fund.
Date of reporting period: December 31, 2022
ITEM 1. REPORT TO STOCKHOLDERS
Annual Report
December 31, 2022
Allspring VT Discovery Fund
The views expressed and any forward-looking statements are as of December 31, 2022, unless otherwise noted, and are those of the Fund's portfolio managers and/or Allspring Global Investments. Discussions of individual securities or the markets generally are not intended as individual recommendations. Future events or results may vary significantly from those expressed in any forward-looking statements. The views expressed are subject to change at any time in response to changing circumstances in the market. Allspring Global Investments disclaims any obligation to publicly update or revise any views expressed or forward-looking statements.
Allspring VT Discovery Fund | 1
Letter to shareholders (unaudited)
Andrew Owen
President
Allspring Funds
Dear Shareholder:
We are pleased to offer you this annual report for the Allspring VT Discovery Fund for the 12-month period that ended December 31, 2022. Globally, stocks and bonds experienced heightened volatility and historically poor performance through the challenging period. Earlier tailwinds provided by global stimulus programs, vaccination rollouts, and recovering consumer and corporate sentiment were wiped away by the highest rate of inflation in four decades, the impact of ongoing aggressive central bank rate hikes and the prospect of more rate hikes. Compounding these concerns were the global reverberations of the Russia-Ukraine war and the impact of China’s strict COVID-19 lockdowns.
For the 12-month period, both stocks and bonds registered major losses, with even U.S. bonds suffering double-digit losses and other assets faring worse. For the period, U.S. stocks, based on the S&P 500 Index,1 returned -18.11%. International stocks, as measured by the MSCI ACWI ex USA Index (Net),2 returned -16.00%, while the MSCI EM Index (Net) (USD)3 had weaker performance with a decline of 20.09%. Among bond indexes, the Bloomberg U.S. Aggregate Bond Index4 returned -13.01%, the Bloomberg Global Aggregate ex-USD Index (unhedged)5 returned -18.70%, the Bloomberg Municipal Bond Index6 declined 8.53%, and the ICE BofA U.S. High Yield Index7 fell 11.17%.
Rising inflation, COVID, and the Russian invasion of Ukraine drove market performance.
In January 2022, concerns mounted about U.S. interest rate hikes and the Russia-Ukraine conflict. The Federal Reserve (Fed) hinted that a March interest rate hike was likely. Meanwhile, Russia threatened a potential invasion of Ukraine, which could disrupt Russia’s massive energy supplies and drive demand from non-Russian oil-producing countries. Elsewhere overseas, Europe saw food and energy prices spike, leading to rising inflation. Within fixed income, corporate bonds struggled in January, trailing government bonds, as investors focused on elevated inflation and the prospect of rising interest rates and tighter money supply.
The Russian invasion of Ukraine dominated the financial world in February and March. Equity, bond, and commodities markets were shaken by fear, uncertainty, and an upending of demand-supply dynamics. Major global stock indexes were down in February, along with global bonds overall, with heightened volatility in March and mixed results that favored U.S. large-cap stocks. Prices of commodities spiked, including crude oil, natural gas, wheat, and precious metals, on elevated concerns of supply shortages. All of this fueled inflation concerns and added to expectations of more aggressive central bank interest rate hikes. Sweeping sanctions against Russia and corporate pullouts contributed to market volatility. Despite the geopolitical turmoil, the U.S. economic outlook remained largely unchanged, with a healthy job market and signs of economic resilience accompanying higher prices.
“ The Russian invasion of Ukraine dominated the financial world in February and March. Equity, bond, and commodities markets were shaken by fear, uncertainty, and an upending of demand-supply dynamics.”
| 1 | The S&P 500 Index consists of 500 stocks chosen for market size, liquidity, and industry group representation. It is a market-value-weighted index with each stock's weight in the index proportionate to its market value. You cannot invest directly in an index. |
| 2 | The Morgan Stanley Capital International (MSCI) All Country World Index (ACWI) ex USA Index (Net) is a free-float-adjusted market-capitalization-weighted index that is designed to measure the equity market performance of developed and emerging markets, excluding the U.S. Source: MSCI. MSCI makes no express or implied warranties or representations and shall have no liability whatsoever with respect to any MSCI data contained herein. The MSCI data may not be further redistributed or used as a basis for other indexes or any securities or financial products. This report is not approved, reviewed, or produced by MSCI. You cannot invest directly in an index. |
| 3 | The MSCI Emerging Markets (EM) Index (Net) (USD) is a free-float-adjusted market-capitalization-weighted index that is designed to measure equity market performance of emerging markets. You cannot invest directly in an index. |
| 4 | The Bloomberg U.S. Aggregate Bond Index is a broad-based benchmark that measures the investment-grade, U.S.-dollar-denominated, fixed-rate taxable bond market, including Treasuries, government-related and corporate securities, mortgage-backed securities (agency fixed-rate and hybrid adjustable-rate mortgage pass-throughs), asset-backed securities, and commercial mortgage-backed securities. You cannot invest directly in an index. |
| 5 | The Bloomberg Global Aggregate ex-USD Index (unhedged) is an unmanaged index that provides a broad-based measure of the global investment-grade fixed-income markets excluding the U.S.-dollar-denominated debt market. You cannot invest directly in an index. |
| 6 | The Bloomberg Municipal Bond Index is an unmanaged index composed of long-term tax-exempt bonds with a minimum credit rating of Baa. You cannot invest directly in an index. |
| 7 | The ICE BofA U.S. High Yield Index is a market-capitalization-weighted index of domestic and Yankee high-yield bonds. The index tracks the performance of high-yield securities traded in the U.S. bond market. You cannot invest directly in an index. Copyright 2023. ICE Data Indices, LLC. All rights reserved. |
2 | Allspring VT Discovery Fund
Letter to shareholders (unaudited)
In April, market volatility continued, with deepening losses across major capital markets, as both the S&P 500 and MSCI ACWI (Net)1 fell 8% or more for the month. The Chinese economy struggled through a strict lockdown as the government tried to contain a major COVID-19 outbreak. The ensuing global ripple effect compounded existing supply shortages. This was exacerbated by the impact of the Russia-Ukraine war on global commodities. Meanwhile, U.S. annual inflation raged at 8.5%, its highest level since 1981, and investors braced themselves for aggressive Fed monetary tightening moves.
Market volatility continued in May, although markets recovered ground late in the month. Value stocks continued to outperform growth stocks. The concerns that had dominated markets for months continued, including high inflation and geopolitical tensions that added to high crude oil, gasoline, and food prices. In response, the Fed raised the federal funds rate by 0.50%, with widescale expectations of more rate hikes. Meanwhile, highly contagious COVID-19 variants persisted. However, labor markets in the U.S., the U.K., and Europe remained strong. U.S. retail sales for April, released in May, indicated a fourth consecutive monthly increase, reflecting continued consumer resilience.
In June, stocks posted further losses en route to their worst first half of a year in 50 years. Bonds didn’t fare much better. Driving the losses were the familiar factors: rising global inflation and fears of recession as central banks increased rates to try to curb soaring inflation. The Fed raised its short-term rate by another 0.75% in June. Meanwhile, the U.S. unemployment rate held firm at 3.6% and the housing market remained only marginally affected by sharply higher mortgage rates.
Markets rebounded in July, led by U.S. stocks. While evidence began to point to an economic slowdown after two consecutive quarters of declining gross domestic product (economic contraction), the U.S. labor market remained surprisingly robust: July nonfarm payrolls grew by more than 500,000 and U.S. unemployment dipped to 3.5%. Meanwhile, crude oil and retail gasoline prices, major contributors to recent overall inflation, fell substantially from earlier highs. And while U.S. home prices rose, home sales fell as houses became less affordable with mortgage rates at a 13-year high. The Fed raised the federal funds rate another 0.75% in July—to a range of 2.25% to 2.50%—and forecasts pointed to further rate hikes.
August was yet another broadly challenging month for financial markets, with more red ink flowing. High inflation persisted, cresting 9% in the eurozone on an annual basis and remaining above 8% in the U.S. despite the Fed’s aggressive monetary policy and a major drop in global crude oil and gasoline prices from their June peak. One positive note was the resilience of the U.S. job market. However, the Fed’s job was clearly not complete. One longer-term bright spot was the U.S. Congress’s passage of the Inflation Reduction Act. Its primary stated goals include: to reduce inflation (though not immediately) by curbing the deficit, capping health care spending by seniors, and investing in domestic sources of clean energy.
The market misery continued in September. There was nowhere to hide as all asset classes suffered major losses at the hands of persistent inflation. Central banks kept up their battle against rapidly rising prices with more rate hikes. The strength of the U.S. dollar made things even more difficult for investors holding assets in other currencies. U.S. mortgage rates jumped to near 7% on 30-year fixed-rate mortgages; the decreased housing affordability began to cool demand somewhat. The U.K. experienced a sharp sell-off of government bonds and the British pound in September as investors panicked in response to a new government budget that was seen as financially unsound. The market meltdown forced the Bank of England to step in and buy long-dated government bonds.
Equities had a reprieve in October after two months of sharp declines. Value stocks and small caps fared best. Globally, developed markets outpaced emerging market equities, which were hurt by weakness among Chinese stocks. Central banks continued to try to curtail high inflation with aggressive interest rate hikes. Geopolitical risks persisted, including the ongoing Russia-Ukraine war and economic, financial market, and political turmoil in the U.K., which led to a second prime ministerial change in six weeks, as Rishi Sunak replaced Liz Truss in late October. Concerns over Europe’s energy crisis eased thanks to unseasonably warm weather and plentiful gas on hand. The U.S. labor market continued its resilience against rising prices, as unemployment stood at 3.7%, near a record low.
“ In June, stocks posted further losses en route to their worst first half of a year in 50 years. Bonds didn’t fare much better. Driving the losses were the familiar factors: rising global inflation and fears of recession as central banks increased rates to try to curb soaring inflation.”
| 1 | The MSCI ACWI (Net) is a free-float-adjusted market-capitalization-weighted index that is designed to measure the equity market performance of developed and emerging markets. You cannot invest directly in an index. |
Allspring VT Discovery Fund | 3
Letter to shareholders (unaudited)
Stocks and bonds rallied in November, with emerging market equities gaining nearly 15% and developed market equities returning 7%. The S&P 500 Index rose 5.6% in November. Bonds also had positive monthly returns. Economic news was encouraging, driven by U.S. labor market strength. Although central banks kept raising rates, hopes rose for an easing in the pace of rate hikes and a possible end to central bank monetary tightening in 2023. Although inflation remained at record highs in the eurozone, we began to see signs of a possible decline in inflationary pressures as U.S. inflation moderated, with a 7.1% annual price rise in November and a monthly price increase of just 0.1%. China’s economic data remained weak, reflecting its zero-COVID-19 policy.
Financial markets cooled in December, with U.S. equities posting negative overall results in response to a weakening U.S. dollar. Fixed income securities ended one of their worst years ever with flat overall monthly returns as markets weighed the hopes for an end to the monetary tightening cycle with the reality that central banks had not completed their jobs yet. U.S. Consumer Price Index (CPI)1 data showed a strong consistent trend downward, which brought down the 12-month CPI to 6.5% in December from 9.1% in June. Other countries and regions reported still-high but declining inflation rates as the year winded down.
Don’t let short-term uncertainty derail long-term investment goals.
Periods of investment uncertainty can present challenges, but experience has taught us that maintaining long-term investment goals can be an effective way to plan for the future. To help you create a sound strategy based on your personal goals and risk tolerance, Allspring Funds offers more than 100 mutual funds spanning a wide range of asset classes and investment styles. Although diversification cannot guarantee an investment profit or prevent losses, we believe it can be an effective way to manage investment risk and potentially smooth out overall portfolio performance. We encourage investors to know their investments and to understand that appropriate levels of risk-taking may unlock opportunities.
Thank you for choosing to invest with Allspring Funds. We appreciate your confidence in us and remain committed to helping you meet your financial needs.
Sincerely,
Andrew Owen
President
Allspring Funds
Notice to Shareholders
At a meeting held November 16, 2022, the Board of Trustees of the Allspring Funds approved changing the name of the Fund from Allspring VT Discovery Fund to Allspring VT Discovery SMID Cap Value Fund to be effective on or about May 1, 2023. There will be no change to the Fund’s investment process because of the name change.
For further information about your fund, contact your investment professional, visit our website at allspringglobal.com, or call us directly at 1-800-222-8222.
| 1 | The Consumer Price Index (CPI) is a measure of the average change over time in the prices paid by urban consumers for a market basket of consumer goods and services. You cannot invest directly in an index. |
4 | Allspring VT Discovery Fund
This page is intentionally left blank.
Performance highlights (unaudited)
| Investment objective | The Fund seeks long-term capital appreciation. |
| Manager | Allspring Funds Management, LLC |
| Subadviser | Allspring Global Investments, LLC |
| Portfolio managers | Michael T. Smith, CFA®‡, Christopher J. Warner, CFA®‡ |
| Average annual total returns (%) as of December 31, 2022 |
| | | | | | Expense ratios1 (%) |
| | Inception date | 1 year | 5 year | 10 year | Gross | Net 2 |
| Class 2 | 5-8-1992 | -37.85 | 4.40 | 9.38 | 1.13 | 1.13 |
| Russell 2500™ Growth Index3 | – | -26.21 | 5.97 | 10.62 | – | – |
Figures quoted represent past performance, which is no guarantee of future results. Investment return and principal value of an investment will fluctuate so that an investor’s shares, when redeemed, may be worth more or less than their original cost. Current performance may be lower or higher than the performance data quoted and assumes the reinvestment of dividends and capital gains. Current month-end performance is available by calling 1-800-260-5969. Performance figures of the Fund do not reflect fees and expenses charged pursuant to the terms of variable life insurance policies and variable annuity contracts. If these fees and expenses had been reflected, performance would have been lower.
Index returns do not include transaction costs associated with buying and selling securities, any mutual fund fees or expenses, or any taxes. It is not possible to invest directly in an index.
Shares are sold without a front-end sales charge or contingent deferred sales charge.
| 1 | Reflects the expense ratios as stated in the most recent prospectus. The expense ratios shown are subject to change and may differ from the annualized expense ratios shown in the financial highlights of this report. |
| 2 | The manager has contractually committed through April 30, 2023, to waive fees and/or reimburse expenses to the extent necessary to cap total annual fund operating expenses after fee waivers at 1.15% for Class 2 shares. Brokerage commissions, stamp duty fees, interest, taxes, acquired fund fees and expenses (if any), and extraordinary expenses are excluded from the expense cap. Prior to or after the commitment expiration date, the cap may be increased or the commitment to maintain the cap may be terminated only with the approval of the Board of Trustees. Without this cap, the Fund’s returns would have been lower. The expense ratio paid by an investor is the net expense ratio (the total annual fund operating expenses after fee waivers) as stated in the prospectus. |
| 3 | The Russell 2500® Growth Index measures the performance of those Russell 2500 companies with higher price/book ratios and higher forecasted growth values. You cannot invest directly in an index. |
Stock values fluctuate in response to the activities of individual companies and general market and economic conditions. Smaller-company stocks tend to be more volatile and less liquid than those of larger companies. Certain investment strategies tend to increase the total risk of an investment (relative to the broader market). This fund is exposed to foreign investment risk. Consult the Fund’s prospectus for additional information on these and other risks.
Please refer to the prospectus provided by your participating insurance company for detailed information describing the separate accounts for information regarding surrender charges, mortality and expense risk fees, and other charges that may be assessed by the participating insurance companies.
| ‡ | CFA® and Chartered Financial Analyst® are trademarks owned by CFA Institute. |
6 | Allspring VT Discovery Fund
Performance highlights (unaudited)
Growth of $10,000 investment as of December 31, 20221
| 1 | The chart compares the performance of Class 2 shares for the most recent ten years with the Russell 2500™ Growth Index. The chart assumes a hypothetical investment of $10,000 in Class 2 shares and reflects all operating expenses of the Fund but does not reflect fees and expenses charged pursuant to the terms of variable life insurance policies and variable annuity contracts. |
Allspring VT Discovery Fund | 7
Performance highlights (unaudited)
MANAGER'S DISCUSSION
Fund highlights
| ■ | The Fund underperformed its benchmark, the Russell 2500™ Growth Index, for the 12-month period that ended December 31, 2022. |
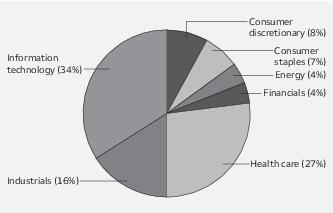
| ■ | Stock selection within the information technology (IT) and consumer discretionary sectors detracted from relative performance. |
| ■ | A material underweight to the energy sector was also a source of detraction during the year. |
| ■ | Security selection in the health care sector, along with a select industrials holding, contributed to the Fund’s results. |
Inflation and monetary policy dominated market sentiment.
Over the past year, a continual stream of macro headlines created high volatility for investors. Market sentiment fluctuated as investors grappled with high inflation, tightening Federal Reserve (Fed) policy, supply chain disruptions, and the war in Ukraine. Amid this uncertainty, the dominant storyline was persistently high inflation as the headline year-over-year Consumer Price Index* reached the highest levels in more than 40 years. In response, the Fed policy became hawkish and materially tightened financial conditions. The markets reacted swiftly and sharply. Volatility spiked over renewed concerns that the Fed may overshoot a soft landing, driving the economy into a recession. As a result, rising discount rates pressured valuations of long-duration growth stocks—those businesses with superior revenue growth projected years into the future. Additionally, investors rotated out of technology and e-commerce stocks due to concerns that a recession would reduce IT and consumer spending. For many companies with disruptive technologies, a disconnection emerged between stock prices and underlying fundamentals.
| Ten largest holdings (%) as of December 31, 20221 |
| Teledyne Technologies Incorporated | 3.43 |
| Casella Waste Systems Incorporated Class A | 2.60 |
| Bio-Techne Corporation | 2.47 |
| WNS Holdings Limited ADR | 2.45 |
| Axon Enterprise Incorporated | 2.33 |
| Rexford Industrial Realty Incorporated | 2.33 |
| Novanta Incorporated | 2.11 |
| Inspire Medical Systems Incorporated | 2.08 |
| Tetra Tech Incorporated | 1.96 |
| MercadoLibre Incorporated | 1.96 |
| 1 | Figures represent the percentage of the Fund's net assets. Holdings are subject to change and may have changed since the date specified. |
Stock selection within IT and consumer discretionary detracted from relative performance.
In consumer discretionary, Global-e Online Ltd. enables businesses to market internationally by localizing pricing, language, and payment methods. Macro fears have weighed on shares of Global-e. However, the company continues to attract large, global merchants and is seeing strong demand from consumers and retailers. We maintain conviction in Global-e’s long-term growth outlook.
MongoDB, Inc., a detractor in IT, provides a global cloud “database-as-a-service,” Atlas, that interfaces with the three largest public cloud providers. With revenue generated through a consumption model, MongoDB provided cautious guidance because of macro headwinds and increased operating expenses. While we have conviction in MongoDB’s role in the migration to the cloud, we are monitoring its fundamentals.
Security selection in health care, along with an industrials holding, contributed to relative performance.
A key contributor within the health care sector, Shockwave Medical, Inc., produces medical devices to treat cardiovascular diseases by traveling through tiny peripheral and coronary arteries to arrive directly at problematic areas. During the year, Shockwave received approvals for new treatments within the U.S. and Europe, which massively expanded its addressable market. Shockwave is in the early stages of adoption and is delivering innovative treatments across the world.
Within industrials, Axon Enterprise, Inc., manufactures cameras, software, and devices for law enforcement. During the year, Axon reported strong growth across most segments and improved profit margins within software. With a growing international client base and expanding product lineup, Axon is poised for continued strong results.
| * | The Consumer Price Index (CPI) is a measure of the average change over time in the prices paid by urban consumers for a market basket of consumer goods and services. You cannot invest directly in an index. |
8 | Allspring VT Discovery Fund
Performance highlights (unaudited)
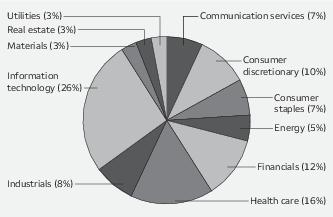
| Sector allocation as of December 31, 20221 |
| 1 | Figures represent the percentage of the Fund's long-term investments. Allocations are subject to change and may have changed since the date specified. |
The growth of a business remains our north star.
While the current outlook is challenging, we remain encouraged by the ability of innovators to create solutions. As the economy navigates rising interest rates and high inflation, companies that are creating efficiencies,
automating processes, or digitizing businesses will likely see strong demand for their products. Furthermore, we believe the “3 Ds” —high debt levels, changing demographics, and rapid disruption—will ultimately lead to slow long-term economic growth.
The severe volatility over the past year has caused stock prices to disconnect from underlying fundamentals. It is our experience that these periods are often temporary and can set the portfolio up for strong future performance. Therefore, it is important to remain disciplined and execute our investment process. Reacting to short-term volatility in a chaotic world is not the recipe for success. Deep fundamental research is needed to identify who is winning and losing in a world of rapid disruption and economic uncertainty.
While we did increase exposure to resilient core growth holdings during the year, we maintained balanced exposure to higher-growth “developing situations” with disruptive technologies. Over the long term, the growth of an underlying business is the dominant driver of equity returns and is the guiding principle of our investment philosophy. Therefore, we are confident that the fundamental growth of our portfolios will be unlocked and will reward the patience of our shareholders with strong future performance.
Allspring VT Discovery Fund | 9
Fund expenses (unaudited)
As a shareholder of the Fund, you incur ongoing costs, including management fees, distribution (12b-1) fees, and other Fund expenses. This example is intended to help you understand your ongoing costs (in dollars) of investing in the Fund and to compare these costs with the ongoing costs of investing in other mutual funds.
The example is based on an investment of $1,000 invested at the beginning of the six-month period and held for the entire period from July 1, 2022 to December 31, 2022.
Actual expenses
The “Actual” line of the table below provides information about actual account values and actual expenses. You may use the information in this line, together with the amount you invested, to estimate the expenses that you paid over the period. Simply divide your account value by $1,000 (for example, an $8,600 account value divided by $1,000 = 8.6), then multiply the result by the number in the “Actual” line under the heading entitled “Expenses paid during period” for your applicable class of shares to estimate the expenses you paid on your account during this period.
Hypothetical example for comparison purposes
The “Hypothetical” line of the table below provides information about hypothetical account values and hypothetical expenses based on the Fund’s actual expense ratio and an assumed rate of return of 5% per year before expenses, which is not the Fund’s actual return. The hypothetical account values and expenses may not be used to estimate the actual ending account balance or expenses you paid for the period. You may use this information to compare the ongoing costs of investing in the Fund and other funds. To do so, compare this 5% hypothetical example with the 5% hypothetical examples that appear in the shareholder reports of the other funds.
Please note that the expenses shown in the table are meant to highlight your ongoing costs only and do not reflect any separate account charges assessed by participating insurance companies. Therefore, the “Hypothetical” line of the table is useful in comparing ongoing costs only, and will not help you determine the relative total costs of owning different funds. In addition, if these separate account charges assessed by participating insurance companies were included, your costs would have been higher.
| | Beginning
account value
7-1-2022 | Ending
account value
12-31-2022 | Expenses
paid during
the period1 | Annualized net
expense ratio |
| Class 2 | | | | |
| Actual | $1,000.00 | $1,025.23 | $5.87 | 1.15% |
| Hypothetical (5% return before expenses) | $1,000.00 | $1,019.41 | $5.85 | 1.15% |
1 Expenses paid is equal to the annualized net expense ratio multiplied by the average account value over the period, multiplied by 184 divided by 365 (to reflect the one-half-year period).
10 | Allspring VT Discovery Fund
Portfolio of investments—December 31, 2022
| | | | | Shares | Value |
| Common stocks: 96.77% | | | | | |
| Communication services: 7.12% | | | | | |
| Entertainment: 3.68% | | | | | |
| Liberty Media Corporation † | | | | 41,100 | $ 2,456,958 |
| Warner Music Group Corporation Class A | | | | 63,600 | 2,227,272 |
| | | | | | 4,684,230 |
| Interactive media & services: 3.44% | | | | | |
| IAC/InterActiveCorp † | | | | 33,472 | 1,486,157 |
| Match Group Incorporated † | | | | 25,300 | 1,049,697 |
| ZoomInfo Technologies Incorporated † | | | | 61,200 | 1,842,732 |
| | | | | | 4,378,586 |
| Consumer discretionary: 12.21% | | | | | |
| Diversified consumer services: 0.79% | | | | | |
| Mister Car Wash Incorporated †« | | | | 108,030 | 997,117 |
| Hotels, restaurants & leisure: 6.20% | | | | | |
| Chipotle Mexican Grill Incorporated † | | | | 1,300 | 1,803,737 |
| Domino's Pizza Incorporated | | | | 4,294 | 1,487,442 |
| Hyatt Hotels Corporation Class A † | | | | 11,900 | 1,076,355 |
| MGM Resorts International | | | | 36,500 | 1,223,845 |
| Wingstop Incorporated | | | | 16,700 | 2,298,254 |
| | | | | | 7,889,633 |
| Internet & direct marketing retail: 2.99% | | | | | |
| Global-E Online Limited † | | | | 63,889 | 1,318,669 |
| MercadoLibre Incorporated † | | | | 2,943 | 2,490,484 |
| | | | | | 3,809,153 |
| Leisure products: 1.35% | | | | | |
| Callaway Golf Company † | | | | 87,010 | 1,718,448 |
| Textiles, apparel & luxury goods: 0.88% | | | | | |
| On Holding AG Class A † | | | | 65,200 | 1,118,832 |
| Financials: 4.10% | | | | | |
| Capital markets: 3.37% | | | | | |
| MarketAxess Holdings Incorporated | | | | 8,700 | 2,426,343 |
| Morningstar Incorporated | | | | 8,600 | 1,862,674 |
| | | | | | 4,289,017 |
| Insurance: 0.73% | | | | | |
| Goosehead Insurance Incorporated Class A | | | | 26,946 | 925,326 |
| Health care: 22.73% | | | | | |
| Biotechnology: 3.84% | | | | | |
| Ascendis Pharma AS ADR † | | | | 10,148 | 1,239,375 |
| CRISPR Therapeutics AG † | | | | 10,927 | 444,183 |
| Exact Sciences Corporation † | | | | 20,300 | 1,005,053 |
| Mirati Therapeutics Incorporated † | | | | 10,100 | 457,631 |
The accompanying notes are an integral part of these financial statements.
Allspring VT Discovery Fund | 11
Portfolio of investments—December 31, 2022
| | | | | Shares | Value |
| Biotechnology (continued) | | | | | |
| Sarepta Therapeutics Incorporated † | | | | 11,000 | $ 1,425,380 |
| Zentalis Pharmaceuticals Incorporated † | | | | 15,900 | 320,226 |
| | | | | | 4,891,848 |
| Health care equipment & supplies: 10.44% | | | | | |
| DexCom Incorporated † | | | | 20,700 | 2,344,068 |
| ICU Medical Incorporated † | | | | 9,400 | 1,480,312 |
| Inari Medical Incorporated † | | | | 27,600 | 1,754,256 |
| Inspire Medical Systems Incorporated † | | | | 10,500 | 2,644,740 |
| Insulet Corporation † | | | | 6,299 | 1,854,363 |
| iRhythm Technologies Incorporated † | | | | 12,200 | 1,142,774 |
| Shockwave Medical Incorporated † | | | | 10,052 | 2,066,792 |
| | | | | | 13,287,305 |
| Health care providers & services: 3.19% | | | | | |
| HealthEquity Incorporated † | | | | 28,400 | 1,750,576 |
| Option Care Health Incorporated † | | | | 76,600 | 2,304,894 |
| | | | | | 4,055,470 |
| Life sciences tools & services: 5.26% | | | | | |
| Azenta Incorporated † | | | | 25,500 | 1,484,610 |
| Bio-Rad Laboratories Incorporated Class A † | | | | 4,900 | 2,060,401 |
| Bio-Techne Corporation | | | | 37,900 | 3,141,152 |
| | | | | | 6,686,163 |
| Industrials: 18.95% | | | | | |
| Aerospace & defense: 2.33% | | | | | |
| Axon Enterprise Incorporated † | | | | 17,900 | 2,970,147 |
| Building products: 2.39% | | | | | |
| Advanced Drainage Systems Incorporated | | | | 20,214 | 1,656,942 |
| Trex Company Incorporated † | | | | 32,700 | 1,384,191 |
| | | | | | 3,041,133 |
| Commercial services & supplies: 6.76% | | | | | |
| Casella Waste Systems Incorporated Class A † | | | | 41,734 | 3,309,924 |
| Ritchie Bros. Auctioneers Incorporated | | | | 15,500 | 896,365 |
| Rollins Incorporated | | | | 52,100 | 1,903,734 |
| Tetra Tech Incorporated | | | | 17,200 | 2,497,268 |
| | | | | | 8,607,291 |
| Professional services: 1.76% | | | | | |
| Clarivate plc † | | | | 78,011 | 650,612 |
| FTI Consulting Incorporated † | | | | 10,000 | 1,588,000 |
| | | | | | 2,238,612 |
| Road & rail: 2.76% | | | | | |
| J.B. Hunt Transport Services Incorporated | | | | 9,400 | 1,638,984 |
| Saia Incorporated † | | | | 8,900 | 1,866,152 |
| | | | | | 3,505,136 |
The accompanying notes are an integral part of these financial statements.
12 | Allspring VT Discovery Fund
Portfolio of investments—December 31, 2022
| | | | | Shares | Value |
| Trading companies & distributors: 2.95% | | | | | |
| SiteOne Landscape Supply Incorporated † | | | | 15,861 | $ 1,860,813 |
| Watsco Incorporated | | | | 7,600 | 1,895,440 |
| | | | | | 3,756,253 |
| Information technology: 27.50% | | | | | |
| Electronic equipment, instruments & components: 6.37% | | | | | |
| Novanta Incorporated † | | | | 19,800 | 2,690,226 |
| Teledyne Technologies Incorporated † | | | | 10,900 | 4,359,019 |
| Zebra Technologies Corporation Class A † | | | | 4,100 | 1,051,281 |
| | | | | | 8,100,526 |
| IT services: 5.56% | | | | | |
| Globant SA † | | | | 12,000 | 2,017,920 |
| MongoDB Incorporated † | | | | 5,200 | 1,023,568 |
| StoneCo Limited Class A † | | | | 97,419 | 919,635 |
| WNS Holdings Limited ADR † | | | | 39,000 | 3,119,610 |
| | | | | | 7,080,733 |
| Semiconductors & semiconductor equipment: 4.71% | | | | | |
| Enphase Energy Incorporated † | | | | 6,200 | 1,642,752 |
| Impinj Incorporated † | | | | 20,700 | 2,260,026 |
| Monolithic Power Systems Incorporated | | | | 3,200 | 1,131,552 |
| Wolfspeed Incorporated † | | | | 13,900 | 959,656 |
| | | | | | 5,993,986 |
| Software: 10.86% | | | | | |
| Bill.com Holdings Incorporated † | | | | 17,566 | 1,913,991 |
| CCC Intelligent Solutions † | | | | 173,100 | 1,505,970 |
| Confluent Incorporated Class A † | | | | 42,100 | 936,304 |
| Fair Isaac Corporation † | | | | 3,100 | 1,855,598 |
| Five9 Incorporated † | | | | 30,300 | 2,056,158 |
| HubSpot Incorporated | | | | 4,400 | 1,272,172 |
| Olo Incorporated Class A † | | | | 128,800 | 805,000 |
| Tyler Technologies Incorporated † | | | | 6,500 | 2,095,665 |
| Zscaler Incorporated † | | | | 12,300 | 1,376,370 |
| | | | | | 13,817,228 |
| Real estate: 4.16% | | | | | |
| Equity REITs: 4.16% | | | | | |
| Equity Lifestyle Properties Incorporated | | | | 36,045 | 2,328,507 |
| Rexford Industrial Realty Incorporated | | | | 54,200 | 2,961,485 |
| | | | | | 5,289,992 |
| Total Common stocks (Cost $137,809,579) | | | | | 123,132,165 |
The accompanying notes are an integral part of these financial statements.
Allspring VT Discovery Fund | 13
Portfolio of investments—December 31, 2022
| | | Yield | | Shares | Value |
| Short-term investments: 4.10% | | | | | |
| Investment companies: 4.10% | | | | | |
| Allspring Government Money Market Fund Select Class ♠∞ | | 4.09% | | 4,203,560 | $ 4,203,560 |
| Securities Lending Cash Investments LLC ♠∩∞ | | 4.36 | | 1,012,703 | 1,012,703 |
| Total Short-term investments (Cost $5,216,255) | | | | | 5,216,263 |
| Total investments in securities (Cost $143,025,834) | 100.87% | | | | 128,348,428 |
| Other assets and liabilities, net | (0.87) | | | | (1,105,044) |
| Total net assets | 100.00% | | | | $127,243,384 |
| † | Non-income-earning security |
| « | All or a portion of this security is on loan. |
| ♠ | The issuer of the security is an affiliated person of the Fund as defined in the Investment Company Act of 1940. |
| ∩ | The investment is a non-registered investment company purchased with cash collateral received from securities on loan. |
| ∞ | The rate represents the 7-day annualized yield at period end. |
| Abbreviations: |
| ADR | American depositary receipt |
| REIT | Real estate investment trust |
Investments in affiliates
An affiliated investment is an investment in which the Fund owns at least 5% of the outstanding voting shares of the issuer or as a result of other relationships, such as the Fund and the issuer having the same investment manager. Transactions with issuers that were affiliates of the Fund at the end of the period were as follows:
| | Value,
beginning of
period | Purchases | Sales
proceeds | Net
realized
gains
(losses) | | Net
change in
unrealized
gains
(losses) | | Value,
end of
period | Shares,
end
of period | Income
from
affiliated
securities |
| Short-term investments | | | | | | | | | |
| Allspring Government Money Market Fund Select Class | $ 2,530,623 | $39,595,932 | $(37,922,995) | $ 0 | | $0 | | $ 4,203,560 | 4,203,560 | $ 75,077 |
| Securities Lending Cash Investments LLC | 11,352,850 | 43,814,010 | (54,154,160) | (5) | | 8 | | 1,012,703 | 1,012,703 | 36,412 # |
| | | | | $ (5) | | $8 | | $5,216,263 | | $111,489 |
| # | Amount shown represents income before fees and rebates. |
The accompanying notes are an integral part of these financial statements.
14 | Allspring VT Discovery Fund
Statement of assets and liabilities—December 31, 2022
| | |
| Assets | |
Investments in unaffiliated securities (including $983,918 of securities loaned), at value (cost $137,809,579)
| $ 123,132,165 |
Investments in affiliated securities, at value (cost $5,216,255)
| 5,216,263 |
Receivable for Fund shares sold
| 80,870 |
Receivable for dividends
| 47,811 |
Receivable for securities lending income, net
| 414 |
Prepaid expenses and other assets
| 1,543 |
Total assets
| 128,479,066 |
| Liabilities | |
Payable upon receipt of securities loaned
| 1,012,703 |
Management fee payable
| 86,803 |
Payable for Fund shares redeemed
| 77,126 |
Distribution fee payable
| 29,540 |
Administration fee payable
| 9,498 |
Trustees’ fees and expenses payable
| 1,514 |
Accrued expenses and other liabilities
| 18,498 |
Total liabilities
| 1,235,682 |
Total net assets
| $127,243,384 |
| Net assets consist of | |
Paid-in capital
| $ 150,094,567 |
Total distributable loss
| (22,851,183) |
Total net assets
| $127,243,384 |
| Computation of net asset value per share | |
Net assets – Class 2
| $ 127,243,384 |
Share outstanding – Class 21
| 7,470,868 |
Net asset value per share – Class 2
| $17.03 |
| 1 | The Fund has an unlimited number of authorized shares. |
The accompanying notes are an integral part of these financial statements.
Allspring VT Discovery Fund | 15
Statement of operations—year ended December 31, 2022
| | |
| Investment income | |
Dividends (net of foreign withholdings taxes of $628)
| $ 269,634 |
Income from affiliated securities
| 88,800 |
Total investment income
| 358,434 |
| Expenses | |
Management fee
| 1,117,100 |
Administration fee – Class 2
| 119,157 |
Distribution fee – Class 2
| 365,219 |
Custody and accounting fees
| 21,263 |
Professional fees
| 46,001 |
Shareholder report expenses
| 28,050 |
Trustees’ fees and expenses
| 21,078 |
Other fees and expenses
| 5,219 |
Total expenses
| 1,723,087 |
| Less: Fee waivers and/or expense reimbursements | |
Fund-level
| (15,284) |
Net expenses
| 1,707,803 |
Net investment loss
| (1,349,369) |
| Realized and unrealized gains (losses) on investments | |
| Net realized losses on | |
Unaffiliated securities
| (8,063,762) |
Affiliated securities
| (5) |
Net realized losses on investments
| (8,063,767) |
| Net change in unrealized gains (losses) on | |
Unaffiliated securities
| (72,996,290) |
Affiliated securities
| 8 |
Net change in unrealized gains (losses) on investments
| (72,996,282) |
Net realized and unrealized gains (losses) on investments
| (81,060,049) |
Net decrease in net assets resulting from operations
| $(82,409,418) |
The accompanying notes are an integral part of these financial statements.
16 | Allspring VT Discovery Fund
Statement of changes in net assets
| | | | | |
| | Year ended
December 31, 2022 | Year ended
December 31, 2021 |
| Operations | | | | |
Net investment loss
| | $ (1,349,369) | | $ (2,490,339) |
Net realized gains (losses) on investments
| | (8,063,767) | | 51,123,731 |
Net change in unrealized gains (losses) on investments
| | (72,996,282) | | (60,409,976) |
Net decrease in net assets resulting from operations
| | (82,409,418) | | (11,776,584) |
| Distributions to shareholders from | | | | |
Net investment income and net realized gains – Class 2
| | (51,108,273) | | (17,942,862) |
| Capital share transactions | Shares | | Shares | |
Proceeds from shares sold – Class 2
| 576,216 | 14,275,381 | 455,338 | 21,604,014 |
Reinvestment of distributions – Class 2
| 2,801,989 | 51,108,273 | 410,216 | 17,942,862 |
Payment for shares redeemed – Class 2
| (1,073,835) | (25,445,459) | (952,059) | (44,958,194) |
Net increase (decrease) in net assets resulting from capital share transactions
| | 39,938,195 | | (5,411,318) |
Total decrease in net assets
| | (93,579,496) | | (35,130,764) |
| Net assets | | | | |
Beginning of period
| | 220,822,880 | | 255,953,644 |
End of period
| | $127,243,384 | | $220,822,880 |
The accompanying notes are an integral part of these financial statements.
Allspring VT Discovery Fund | 17
Financial highlights
(For a share outstanding throughout each period)
| | Year ended December 31 |
| Class 2 | 2022 | 2021 | 2020 | 2019 | 2018 |
Net asset value, beginning of period
| $42.74 | $48.73 | $32.85 | $26.14 | $31.74 |
Net investment loss
| (0.18) | (0.48) | (0.34) | (0.25) | (0.17) |
Net realized and unrealized gains (losses) on investments
| (15.32) | (1.89) | 19.54 | 10.47 | (1.39) |
Total from investment operations
| (15.50) | (2.37) | 19.20 | 10.22 | (1.56) |
| Distributions to shareholders from | | | | | |
Net realized gains
| (10.21) | (3.62) | (3.32) | (3.51) | (4.04) |
Net asset value, end of period
| $17.03 | $42.74 | $48.73 | $32.85 | $26.14 |
Total return1
| (37.85)% | (5.04)% | 62.65% | 39.02% | (7.06)% |
| Ratios to average net assets (annualized) | | | | | |
Gross expenses
| 1.16% | 1.13% | 1.14% | 1.16% | 1.16% |
Net expenses
| 1.15% | 1.13% | 1.14% | 1.15% | 1.15% |
Net investment loss
| (0.91)% | (1.03)% | (0.93)% | (0.79)% | (0.55)% |
| Supplemental data | | | | | |
Portfolio turnover rate
| 51% | 57% | 47% | 71% | 60% |
Net assets, end of period (000s omitted)
| $127,243 | $220,823 | $255,954 | $168,489 | $125,806 |
| 1 | Returns do not reflect fees and expenses charged pursuant to the terms of variable life insurance policies and variable annuity contracts. |
The accompanying notes are an integral part of these financial statements.
18 | Allspring VT Discovery Fund
Notes to financial statements
1. ORGANIZATION
Allspring Variable Trust (the "Trust"), a Delaware statutory trust organized on March 10, 1999, is an open-end management investment company registered under the Investment Company Act of 1940, as amended (the "1940 Act"). As an investment company, the Trust follows the accounting and reporting guidance in Financial Accounting Standards Board ("FASB") Accounting Standards Codification Topic 946, Financial Services – Investment Companies. These financial statements report on the Allspring VT Discovery Fund (the "Fund") which is a diversified series of the Trust. The Trust offers shares of the Fund to separate accounts of various life insurance companies as funding vehicles for certain variable annuity contracts and variable life insurance policies.
2. SIGNIFICANT ACCOUNTING POLICIES
The following significant accounting policies, which are consistently followed in the preparation of the financial statements of the Fund, are in conformity with U.S. generally accepted accounting principles which require management to make estimates and assumptions that affect the reported amounts of assets and liabilities, disclosure of contingent assets and liabilities at the date of the financial statements, and the reported amounts of income and expenses during the reporting period. Actual results could differ from those estimates.
Securities valuation
All investments are valued each business day as of the close of regular trading on the New York Stock Exchange (generally 4 p.m. Eastern Time), although the Fund may deviate from this calculation time under unusual or unexpected circumstances.
Equity securities that are listed on a foreign or domestic exchange or market are valued at the official closing price or, if none, the last sales price.
Investments in registered open-end investment companies (other than those listed on a foreign or domestic exchange or market) are valued at net asset value. Interests in non-registered investment companies that are redeemable at net asset value are fair valued normally at net asset value.
Investments which are not valued using the methods discussed above are valued at their fair value, as determined in good faith by Allspring Funds Management, LLC ("Allspring Funds Management"), which was named the valuation designee by the Board of Trustees. As the valuation designee, Allspring Funds Management is responsible for day-to-day valuation activities for the Allspring Funds. In connection with these responsibilities, Allspring Funds Management has established a Valuation Committee and has delegated to it the authority to take any actions regarding the valuation of portfolio securities that the Valuation Committee deems necessary or appropriate, including determining the fair value of portfolio securities. On a quarterly basis, the Board of Trustees receives reports of valuation actions taken by the Valuation Committee. On at least an annual basis, the Board of Trustees receives an assessment of the adequacy and effectiveness of Allspring Funds Management's process for determining the fair value of the portfolio of investments.
Securities lending
The Fund may lend its securities from time to time in order to earn additional income in the form of fees or interest on securities received as collateral or the investment of any cash received as collateral. When securities are on loan, the Fund receives interest or dividends on those securities. Cash collateral received in connection with its securities lending transactions is invested in Securities Lending Cash Investments, LLC (the "Securities Lending Fund"), an affiliated non-registered investment company. Investments in Securities Lending Fund are valued at the evaluated bid price provided by an independent pricing service. Income earned from investment in the Securities Lending Fund (net of fees and rebates), if any, is included in income from affiliated securities on the Statement of Operations.
In a securities lending transaction, the net asset value of the Fund is affected by an increase or decrease in the value of the securities loaned and by an increase or decrease in the value of the instrument in which collateral is invested. The amount of securities lending activity undertaken by the Fund fluctuates from time to time. The Fund has the right under the lending agreement to recover the securities from the borrower on demand. In the event of default or bankruptcy by the borrower, the Fund may be prevented from recovering the loaned securities or gaining access to the collateral or may experience delays or costs in doing so. In such an event, the terms of the agreement allow the unaffiliated securities lending agent to use the collateral to purchase replacement securities on behalf of the Fund or pay the Fund the market value of the loaned securities. The Fund bears the risk of loss with respect to depreciation of its investment of the cash collateral.
Security transactions and income recognition
Securities transactions are recorded on a trade date basis. Realized gains or losses are recorded on the basis of identified cost.
Allspring VT Discovery Fund | 19
Notes to financial statements
Dividend income is recognized on the ex-dividend date. Dividend income is recorded net of foreign taxes withheld where recovery of such taxes is not assured.
Distributions to shareholders
Distributions to shareholders from net investment income and any net realized gains are recorded on the ex-dividend date and paid at least annually. Such distributions are determined in accordance with income tax regulations and may differ from U.S. generally accepted accounting principles. Dividend sources are estimated at the time of declaration. The tax character of distributions is determined as of the Fund's fiscal year end. Therefore, a portion of the Fund's distributions made prior to the Fund’s fiscal year end may be categorized as a tax return of capital at year end.
Federal and other taxes
The Fund intends to continue to qualify as a regulated investment company by distributing substantially all of its investment company taxable income and any net realized capital gains (after reduction for capital loss carryforwards) sufficient to relieve it from all, or substantially all, federal income taxes. Accordingly, no provision for federal income taxes was required.
The Fund’s income and federal excise tax returns and all financial records supporting those returns for the prior three fiscal years are subject to examination by the federal and Delaware revenue authorities. Management has analyzed the Fund's tax positions taken on federal, state, and foreign tax returns, as applicable, for all open tax years and does not believe that there are any uncertain tax positions that require recognition of a tax liability.
As of December 31, 2022, the aggregate cost of all investments for federal income tax purposes was $144,263,615 and the unrealized gains (losses) consisted of:
| Gross unrealized gains | $ 15,489,360 |
| Gross unrealized losses | (31,404,547) |
| Net unrealized losses | $(15,915,187) |
Reclassifications are made to the Fund’s capital accounts for permanent tax differences to reflect income and gains available for distribution (or available capital loss carryforwards) under federal income tax regulations. U.S. generally accepted accounting principles require that certain components of net assets be adjusted to reflect permanent differences between financial and tax reporting. These reclassifications have no effect on net assets or net asset values per share. The primary permanent difference causing such reclassification is due to net operating loss. At December 31, 2022, as a result of permanent book-to-tax differences, the following reclassification adjustments were made on the Statement of Assets and Liabilities:
| Paid-in capital | Total distributable
loss |
| $(1,353,434) | $1,353,434 |
As of December 31, 2022, the Fund had capital loss carryforwards which consisted of $6,935,996 in short-term capital losses.
3. FAIR VALUATION MEASUREMENTS
Fair value measurements of investments are determined within a framework that has established a fair value hierarchy based upon the various data inputs utilized in determining the value of the Fund’s investments. The three-level hierarchy gives the highest priority to unadjusted quoted prices in active markets for identical assets or liabilities (Level 1) and the lowest priority to unobservable inputs (Level 3). The Fund’s investments are classified within the fair value hierarchy based on the lowest level of input that is significant to the fair value measurement. The inputs are summarized into three broad levels as follows:
| ■ | Level 1 – quoted prices in active markets for identical securities |
| ■ | Level 2 – other significant observable inputs (including quoted prices for similar securities, interest rates, prepayment speeds, credit risk, etc.) |
| ■ | Level 3 – significant unobservable inputs (including the Fund’s own assumptions in determining the fair value of investments) |
The inputs or methodologies used for valuing investments in securities are not necessarily an indication of the risk associated with investing in those securities.
20 | Allspring VT Discovery Fund
Notes to financial statements
The following is a summary of the inputs used in valuing the Fund’s assets and liabilities as of December 31, 2022:
| | Quoted prices
(Level 1) | Other significant
observable inputs
(Level 2) | Significant
unobservable inputs
(Level 3) | Total |
| Assets | | | | |
| Investments in: | | | | |
| Common stocks | | | | |
| Communication services | $ 9,062,816 | $0 | $0 | $ 9,062,816 |
| Consumer discretionary | 15,533,183 | 0 | 0 | 15,533,183 |
| Financials | 5,214,343 | 0 | 0 | 5,214,343 |
| Health care | 28,920,786 | 0 | 0 | 28,920,786 |
| Industrials | 24,118,572 | 0 | 0 | 24,118,572 |
| Information technology | 34,992,473 | 0 | 0 | 34,992,473 |
| Real estate | 5,289,992 | 0 | 0 | 5,289,992 |
| Short-term investments | | | | |
| Investment companies | 5,216,263 | 0 | 0 | 5,216,263 |
| Total assets | $128,348,428 | $0 | $0 | $128,348,428 |
Additional sector, industry or geographic detail, if any, is included in the Portfolio of Investments.
For the year ended December 31, 2022, the Fund did not have any transfers into/out of Level 3.
4. TRANSACTIONS WITH AFFILIATES
Management fee
Allspring Funds Management, a wholly owned subsidiary of Allspring Global Investments Holdings, LLC, a holding company indirectly owned by certain private funds of GTCR LLC and Reverence Capital Partners, L.P., is the manager of the Fund and provides advisory and fund-level administrative services under an investment management agreement. Under the investment management agreement, Allspring Funds Management is responsible for, among other services, implementing the investment objectives and strategies of the Fund, supervising the subadviser and providing fund-level administrative services in connection with the Fund’s operations. As compensation for its services under the investment management agreement, Allspring Funds Management is entitled to receive a management fee at the following annual rate based on the Fund’s average daily net assets:
| Average daily net assets | Management fee |
| First $500 million | 0.750% |
| Next $500 million | 0.700 |
| Next $1 billion | 0.650 |
| Next $2 billion | 0.625 |
| Next $1 billion | 0.600 |
| Next $5 billion | 0.590 |
| Over $10 billion | 0.580 |
For the year ended December 31, 2022, the management fee was equivalent to an annual rate of 0.75% of the Fund’s average daily net assets.
Allspring Funds Management has retained the services of a subadviser to provide daily portfolio management to the Fund. The fee for subadvisory services is borne by Allspring Funds Management. Allspring Global Investments, LLC ("Allspring Investments"), an affiliate of Allspring Funds Management and a wholly owned subsidiary of Allspring Global Investments Holdings, LLC, is the subadviser to the Fund and is entitled to receive a fee from Allspring Funds Management at an annual rate starting at 0.45% and declining to 0.35% as the average daily net assets of the Fund increase.
Allspring VT Discovery Fund | 21
Notes to financial statements
Administration fee
Under a class-level administration agreement, Allspring Funds Management provides class-level administrative services to the Fund, which includes paying fees and expenses for services provided by the transfer agent, sub-transfer agents, omnibus account servicers and record-keepers. As compensation for its services under the class-level administration agreement, Allspring Funds Management receives an annual fee of 0.08% which is calculated based on the average daily net assets of Class 2 shares.
Waivers and/or expense reimbursements
Allspring Funds Management has contractually committed through April 30, 2023 to waive fees and/or reimburse management and administration fees to the extent necessary to cap the Fund’s expenses at 1.15% for Class 2 shares. Prior to or after the commitment expiration date, the cap may be increased or the commitment to maintain the cap may be terminated only with the approval of the Board of Trustees.
Distribution fee
The Trust has adopted a distribution plan for Class 2 shares pursuant to Rule 12b-1 under the 1940 Act. A distribution fee is charged to Class 2 shares and paid to Allspring Funds Distributor, LLC, the principal underwriter, an affiliate of Allspring Funds Management, at an annual rate up to 0.25% of the average daily net assets of Class 2 shares.
Interfund transactions
The Fund may purchase or sell portfolio investment securities to certain affiliates pursuant to Rule 17a-7 under the 1940 Act and under procedures adopted by the Board of Trustees. The procedures have been designed to ensure that these interfund transactions, which do not incur broker commissions, are effected at current market prices.
5. INVESTMENT PORTFOLIO TRANSACTIONS
Purchases and sales of investments, excluding U.S. government obligations (if any) and short-term securities, for the year ended December 31, 2022 were $75,043,637 and $90,129,622, respectively.
6. SECURITIES LENDING TRANSACTIONS
The Fund lends its securities through an unaffiliated securities lending agent and receives collateral in the form of cash or securities with a value at least equal to the value of the securities on loan. The value of the loaned securities is determined at the close of each business day and any increases or decreases in the required collateral are exchanged between the Fund and the counterparty on the next business day. Cash collateral received is invested in the Securities Lending Fund which seeks to provide a positive return compared to the daily Federal Funds Open Rate by investing in high-quality, U.S. dollar-denominated short-term money market instruments and is exempt from registration under Section 3(c)(7) of the 1940 Act. Securities Lending Fund is managed by Allspring Funds Management and is subadvised by Allspring Investments. Allspring Funds Management receives an advisory fee starting at 0.05% and declining to 0.01% as the average daily net assets of the Securities Lending Fund increase. All of the fees received by Allspring Funds Management are paid to Allspring Investments for its services as subadviser.
In the event of counterparty default or the failure of a borrower to return a loaned security, the Fund has the right to use the collateral to offset any losses incurred. As of December 31, 2022, the Fund had securities lending transactions with the following counterparties which are subject to offset:
| Counterparty | Value of
securities on
loan | Collateral
received1 | Net amount |
| National Financial Services LLC | $983,918 | $(983,918) | $0 |
1 Collateral disclosed within this table is limited to the net transaction with the counterparty.
7. BANK BORROWINGS
The Trust, Allspring Master Trust and Allspring Funds Trust (excluding the money market funds) are parties to a $350,000,000 revolving credit agreement whereby the Fund is permitted to use bank borrowings for temporary or emergency purposes, such as to fund shareholder redemption requests. Interest under the credit agreement is charged to the Fund based on a borrowing rate equal to the higher of the Federal Funds rate or the overnight bank funding rate in effect on that day plus a spread. In addition, an annual commitment fee equal based on the unused balance is allocated to each participating fund.
22 | Allspring VT Discovery Fund
Notes to financial statements
For the year ended December 31, 2022, there were no borrowings by the Fund under the agreement.
8. DISTRIBUTIONS TO SHAREHOLDERS
The tax character of distributions paid during the years ended December 31, 2022 and December 31, 2021 were as follows:
| | Year ended December 31 |
| | 2022 | 2021 |
| Long-term capital gain | $51,108,273 | $17,942,862 |
As of December 31, 2022, the components of distributable earnings on a tax basis were as follows:
Unrealized
losses | Capital loss
carryforward |
| $(15,915,187) | $(6,935,996) |
9. CONCENTRATION RISKS
As of the end of the period, the Fund concentrated its portfolio of investments in the information technology sector. A fund that invests a substantial portion of its assets in any sector may be more affected by changes in that sector than would be a fund whose investments are not heavily weighted in any sector.
10. MARKET RISKS
On March 11, 2020, the World Health Organization announced that it had made the assessment that coronavirus disease 2019 (“COVID-19”) is a pandemic. The impacts of COVID-19 are affecting the entire global economy, individual companies and investment products, the funds, and the market in general. There is significant uncertainty around the extent and duration of business disruptions related to COVID-19 and the impacts may last for an extended period of time. COVID-19 has led to significant uncertainty and volatility in the financial markets.
11. INDEMNIFICATION
Under the Fund's organizational documents, the officers and Trustees have been granted certain indemnification rights against certain liabilities that may arise out of performance of their duties to the Fund. The Fund has entered into a separate agreement with each Trustee that converts indemnification rights currently existing under the Fund’s organizational documents into contractual rights that cannot be changed in the future without the consent of the Trustee. Additionally, in the normal course of business, the Fund may enter into contracts with service providers that contain a variety of indemnification clauses. The Fund’s maximum exposure under these arrangements is dependent on future claims that may be made against the Fund and, therefore, cannot be estimated.
Allspring VT Discovery Fund | 23
Report of independent registered public accounting firm
To the Shareholders of the Fund and Board of Trustees
Allspring Variable Trust:
Opinion on the Financial Statements
We have audited the accompanying statement of assets and liabilities of Allspring VT Discovery Fund (the Fund), one of the funds constituting Allspring Variable Trust, including the portfolio of investments, as of December 31, 2022, the related statement of operations for the year then ended, the statements of changes in net assets for each of the years in the two-year period then ended, and the related notes (collectively, the financial statements) and the financial highlights for each of the years in the five-year period then ended. In our opinion, the financial statements and financial highlights present fairly, in all material respects, the financial position of the Fund as of December 31, 2022, the results of its operations for the year then ended, the changes in its net assets for each of the years in the two-year period then ended, and the financial highlights for each of the years in the five-year period then ended, in conformity with U.S. generally accepted accounting principles.
Basis for Opinion
These financial statements and financial highlights are the responsibility of the Fund’s management. Our responsibility is to express an opinion on these financial statements and financial highlights based on our audits. We are a public accounting firm registered with the Public Company Accounting Oversight Board (United States) (PCAOB) and are required to be independent with respect to the Fund in accordance with the U.S. federal securities laws and the applicable rules and regulations of the Securities and Exchange Commission and the PCAOB.
We conducted our audits in accordance with the standards of the PCAOB. Those standards require that we plan and perform the audit to obtain reasonable assurance about whether the financial statements and financial highlights are free of material misstatement, whether due to error or fraud. Our audits included performing procedures to assess the risks of material misstatement of the financial statements and financial highlights, whether due to error or fraud, and performing procedures that respond to those risks. Such procedures included examining, on a test basis, evidence regarding the amounts and disclosures in the financial statements and financial highlights. Such procedures also included confirmation of securities owned as of December 31, 2022, by correspondence with the custodian and transfer agent. Our audits also included evaluating the accounting principles used and significant estimates made by management, as well as evaluating the overall presentation of the financial statements and financial highlights. We believe that our audits provide a reasonable basis for our opinion.

We have not been able to determine the specific year that we began serving as the auditor of one or more Allspring Funds investment companies; however, we are aware that we have served as the auditor of one or more Allspring Funds investment companies since at least 1955.
Boston, Massachusetts
February 27, 2023
24 | Allspring VT Discovery Fund
Other information (unaudited)
TAX INFORMATION
Pursuant to Section 852 of the Internal Revenue Code, $51,108,273 was designated as a 20% rate gain distribution for the fiscal year ended December 31, 2022.
PROXY VOTING INFORMATION
A description of the policies and procedures used to determine how to vote proxies relating to portfolio securities is available without charge, upon request, by calling 1-800-260-5969, visiting our website at allspringglobal.com, or visiting the SEC website at sec.gov. Information regarding how the proxies related to portfolio securities were voted during the most recent 12-month period ended June 30 is available on the website at allspringglobal.com or by visiting the SEC website at sec.gov.
QUARTERLY PORTFOLIO HOLDINGS INFORMATION
The Fund files its complete schedule of portfolio holdings with the SEC for the first and third quarters of each fiscal year as an exhibit to its reports on Form N-PORT. Shareholders may view the filed Form N-PORT by visiting the SEC website at sec.gov.
Allspring VT Discovery Fund | 25
Other information (unaudited)
BOARD OF TRUSTEES AND OFFICERS
Each of the Trustees and Officers listed in the table below acts in identical capacities for each fund in the Allspring family of funds, which consists of 127 mutual funds comprising the Allspring Funds Trust, Allspring Variable Trust, Allspring Master Trust and four closed-end funds (collectively the “Fund Complex”). This table should be read in conjunction with the Prospectus and the Statement of Additional Information1. The mailing address of each Trustee and Officer is 1415 Vantage Park Drive, 3rd Floor, Charlotte, NC 28203. Each Trustee and Officer serves an indefinite term, however, each Trustee serves such term until reaching the mandatory retirement age established by the Trustees.
Independent Trustees
Name and
year of birth | Position held and
length of service* | Principal occupations during past five years or longer | Current other
public company or
investment
company
directorships |
William R. Ebsworth
(Born 1957) | Trustee,
since 2015 | Retired. From 1984 to 2013, equities analyst, portfolio manager, research director and chief investment officer at Fidelity Management and Research Company in Boston, Tokyo, and Hong Kong, and retired in 2013 as Chief Investment Officer of Fidelity Strategic Advisers, Inc. where he led a team of investment professionals managing client assets. Prior thereto, Board member of Hong Kong Securities Clearing Co., Hong Kong Options Clearing Corp., the Thailand International Fund, Ltd., Fidelity Investments Life Insurance Company, and Empire Fidelity Investments Life Insurance Company. Audit Committee Chair and Investment Committee Chair of the Vincent Memorial Hospital Foundation (non-profit organization). Mr. Ebsworth is a CFA® charterholder. | N/A |
Jane A. Freeman
(Born 1953) | Trustee,
since 2015;
Chair Liaison,
since 2018 | Retired. From 2012 to 2014 and 1999 to 2008, Chief Financial Officer of Scientific Learning Corporation. From 2008 to 2012, Ms. Freeman provided consulting services related to strategic business projects. Prior to 1999, Portfolio Manager at Rockefeller & Co. and Scudder, Stevens & Clark. Board member of the Harding Loevner Funds from 1996 to 2014, serving as both Lead Independent Director and chair of the Audit Committee. Board member of the Russell Exchange Traded Funds Trust from 2011 to 2012 and the chair of the Audit Committee. Ms. Freeman is also an inactive Chartered Financial Analyst. | N/A |
Isaiah Harris, Jr.
(Born 1952) | Trustee,
since 2009; Audit
Committee
Chair,
since 2019 | Retired. Member of the Advisory Board of CEF of East Central Florida. Chairman of the Board of CIGNA Corporation from 2009 to 2021, and Director from 2005 to 2008. From 2003 to 2011, Director of Deluxe Corporation. Prior thereto, President and CEO of BellSouth Advertising and Publishing Corp. from 2005 to 2007, President and CEO of BellSouth Enterprises from 2004 to 2005 and President of BellSouth Consumer Services from 2000 to 2003. Emeritus member of the Iowa State University Foundation Board of Governors. Emeritus Member of the Advisory Board of Iowa State University School of Business. Advisory Board Member, Palm Harbor Academy (private school). Advisory Board Member, Fellowship of Christian Athletes. Mr. Harris is a certified public accountant (inactive status). | N/A |
David F. Larcker
(Born 1950) | Trustee,
since 2009 | Distinguished Visiting Fellow at the Hoover Institution since 2022. James Irvin Miller Professor of Accounting at the Graduate School of Business (Emeritus), Stanford University, Director of the Corporate Governance Research Initiative and Senior Faculty of The Rock Center for Corporate Governance since 2006. From 2005 to 2008, Professor of Accounting at the Graduate School of Business, Stanford University. Prior thereto, Ernst & Young Professor of Accounting at The Wharton School, University of Pennsylvania from 1985 to 2005. | N/A |
26 | Allspring VT Discovery Fund
Other information (unaudited)
Name and
year of birth | Position held and
length of service* | Principal occupations during past five years or longer | Current other
public company or
investment
company
directorships |
Olivia S. Mitchell
(Born 1953) | Trustee,
since 2006;
Nominating and
Governance
Committee Chair,
since 2018 | International Foundation of Employee Benefit Plans Professor since 1993, Wharton School of the University of Pennsylvania. Director of Wharton’s Pension Research Council and Boettner Center on Pensions & Retirement Research, and Research Associate at the National Bureau of Economic Research. Previously taught at Cornell University from 1978 to 1993. | N/A |
Timothy J. Penny
(Born 1951) | Trustee,
since 1996;
Chair,
since 2018 | President and Chief Executive Officer of Southern Minnesota Initiative Foundation, a non-profit organization, since 2007. Vice Chair of the Economic Club of Minnesota, since 2007. Co-Chair of the Committee for a Responsible Federal Budget, since 1995. Member of the Board of Trustees of NorthStar Education Finance, Inc., a non-profit organization, from 2007-2022. Senior Fellow of the University of Minnesota Humphrey Institute from 1995 to 2017. | N/A |
James G. Polisson
(Born 1959) | Trustee,
since 2018 | Retired. Chief Marketing Officer, Source (ETF) UK Services, Ltd, from 2015 to 2017. From 2012 to 2015, Principal of The Polisson Group, LLC, a management consulting, corporate advisory and principal investing company. Chief Executive Officer and Managing Director at Russell Investments, Global Exchange Traded Funds from 2010 to 2012. Managing Director of Barclays Global Investors from 1998 to 2010 and Global Chief Marketing Officer for iShares and Barclays Global Investors from 2000 to 2010. Trustee of the San Francisco Mechanics’ Institute, a non-profit organization, from 2013 to 2015. Board member of the Russell Exchange Traded Fund Trust from 2011 to 2012. Director of Barclays Global Investors Holdings Deutschland GmbH from 2006 to 2009. Mr. Polisson is an attorney and has a retired status with the Massachusetts and District of Columbia Bar Associations. | N/A |
Pamela Wheelock
(Born 1959) | Trustee,
since January
2020; previously
Trustee from
January 2018 to
July 2019 | Retired. Executive and Senior Financial leadership positions in the public, private and nonprofit sectors. Interim President and CEO, McKnight Foundation, 2020. Interim Commissioner, Minnesota Department of Human Services, 2019. Chief Operating Officer, Twin Cities Habitat for Humanity, 2017-2019. Vice President for University Services, University of Minnesota, 2012-2016. Interim President and CEO, Blue Cross and Blue Shield of Minnesota, 2011-2012. Executive Vice-President and Chief Financial Officer, Minnesota Wild, 2002-2008. Commissioner, Minnesota Department of Finance, 1999-2002. Chair of the Board of Directors of Destination Medical Center Corporation. Board member of the Minnesota Wild Foundation. | N/A |
* Length of service dates reflect the Trustee’s commencement of service with the Trust’s predecessor entities, where applicable.
Allspring VT Discovery Fund | 27
Other information (unaudited)
Officers2
Name and
year of birth | Position held and
length of service | Principal occupations during past five years or longer |
Andrew Owen
(Born 1960) | President,
since 2017 | President and Chief Executive Officer of Allspring Funds Management, LLC since 2017 and Head of Global Fund Governance of Allspring Global Investments since 2022. Prior thereto, co-president of Galliard Capital Management, LLC, an affiliate of Allspring Funds Management, LLC, from 2019 to 2022 and Head of Affiliated Managers, Allspring Global Investments, from 2014 to 2019 and Executive Vice President responsible for marketing, investments and product development for Allspring Funds Management, LLC, from 2009 to 2014. |
Jeremy DePalma
(Born 1974) | Treasurer,
since 2012
(for certain funds in
the Fund Complex);
since 2021 (for
the remaining funds in the
Fund Complex) | Senior Vice President of Allspring Funds Management, LLC since 2009. Senior Vice President of Evergreen Investment Management Company, LLC from 2008 to 2010 and head of the Fund Reporting and Control Team within Fund Administration from 2005 to 2010. |
Christopher Baker
(Born 1976) | Chief Compliance Officer, since 2022 | Global Chief Compliance Officer for Allspring Global Investments since 2022. Prior thereto, Chief Compliance Officer for State Street Global Advisors from 2018 to 2021. Senior Compliance Officer for the State Street divisions of Alternative Investment Solutions, Sector Solutions, and Global Marketing from 2015 to 2018. From 2010 to 2015 Vice President, Global Head of Investment and Marketing Compliance for State Street Global Advisors. |
Matthew Prasse
(Born 1983) | Chief Legal Officer, since 2022; Secretary, since 2021 | Senior Counsel of the Allspring Legal Department since 2021. Senior Counsel of the Wells Fargo Legal Department from 2018 to 2021. Previously, Counsel for Barings LLC from 2015 to 2018. Prior to joining Barings, Associate at Morgan, Lewis & Bockius LLP from 2008 to 2015. |
1 The Statement of Additional Information includes additional information about the Trustees and is available, without charge, upon request, by calling 1-800-222-8222 or by visiting the website at allspringglobal.com.
2 For those Officers with tenures at Allspring Global Investments and/or Allspring Funds Management, LLC that began prior to 2021, such tenures include years of service during which these businesses/entities were known as Wells Fargo Asset Management and Wells Fargo Funds Management, LLC, respectively.
28 | Allspring VT Discovery Fund
For more information
More information about Allspring Funds is available free upon request. To obtain literature, please write, visit the Fund's website, or call:
Allspring Funds
P.O. Box 219967
Kansas City, MO 64121-9967
Website: allspringglobal.com
Individual investors: 1-800-260-5969
Retail investment professionals: 1-888-877-9275
Institutional investment professionals: 1-866-765-0778
This report and the financial statements contained herein are submitted for the general information of the shareholders of the Fund. If this report is used for promotional purposes, distribution of the report must be accompanied or preceded by a current prospectus. Before investing, please consider the investment objectives, risks, charges, and expenses of the investment. For a current prospectus and, if available, a summary prospectus, containing this information, call
1-800-260-5969 or visit the Fund's website at allspringglobal.com. Read the prospectus carefully before you invest or send money.
Allspring Global InvestmentsTM is the trade name for the asset management firms of Allspring Global Investments Holdings, LLC, a holding company indirectly owned by certain private funds of GTCR LLC and Reverence Capital Partners, L.P. These firms include but are not limited to Allspring Global Investments, LLC, and Allspring Funds Management, LLC. Certain products managed by Allspring entities are distributed by Allspring Funds Distributor, LLC (a broker-dealer and Member FINRA/SIPC).
This material is for general informational and educational purposes only and is NOT intended to provide investment advice or a recommendation of any kind - including a recommendation for any specific investment, strategy, or plan.
© 2023 Allspring Global Investments Holdings, LLC. All rights reserved.
ALL-01052023-mmuitxjy 02-23
AR3221 12-22
Annual Report
December 31, 2022
Allspring
VT Index Asset Allocation Fund
The views expressed and any forward-looking statements are as of December 31, 2022, unless otherwise noted, and are those of the Fund's portfolio managers and/or Allspring Global Investments. Discussions of individual securities or the markets generally are not intended as individual recommendations. Future events or results may vary significantly from those expressed in any forward-looking statements. The views expressed are subject to change at any time in response to changing circumstances in the market. Allspring Global Investments disclaims any obligation to publicly update or revise any views expressed or forward-looking statements.
Allspring VT Index Asset Allocation Fund | 1
Letter to shareholders (unaudited)
Andrew Owen
President
Allspring Funds
Dear Shareholder:
We are pleased to offer you this annual report for the Allspring VT Index Asset Allocation Fund for the 12-month period that ended December 31, 2022. Globally, stocks and bonds experienced heightened volatility and historically poor performance through the challenging period. Earlier tailwinds provided by global stimulus programs, vaccination rollouts, and recovering consumer and corporate sentiment were wiped away by the highest rate of inflation in four decades, the impact of ongoing aggressive central bank rate hikes and the prospect of more rate hikes. Compounding these concerns were the global reverberations of the Russia-Ukraine war and the impact of China’s strict COVID-19 lockdowns.
For the 12-month period, both stocks and bonds registered major losses, with even U.S. bonds suffering double-digit losses and other assets faring worse. For the period, U.S. stocks, based on the S&P 500 Index,1 returned -18.11%. International stocks, as measured by the MSCI ACWI ex USA Index (Net),2 returned -16.00%, while the MSCI EM Index (Net) (USD)3 had weaker performance with a decline of 20.09%. Among bond indexes, the Bloomberg U.S. Aggregate Bond Index4 returned -13.01%, the Bloomberg Global Aggregate ex-USD Index (unhedged)5 returned -18.70%, the Bloomberg Municipal Bond Index6 declined 8.53%, and the ICE BofA U.S. High Yield Index7 fell 11.17%.
Rising inflation, COVID, and the Russian invasion of Ukraine drove market performance.
In January 2022, concerns mounted about U.S. interest rate hikes and the Russia-Ukraine conflict. The Federal Reserve (Fed) hinted that a March interest rate hike was likely. Meanwhile, Russia threatened a potential invasion of Ukraine, which could disrupt Russia’s massive energy supplies and drive demand from non-Russian oil-producing countries. Elsewhere overseas, Europe saw food and energy prices spike, leading to rising inflation. Within fixed income, corporate bonds struggled in January, trailing government bonds, as investors focused on elevated inflation and the prospect of rising interest rates and tighter money supply.
The Russian invasion of Ukraine dominated the financial world in February and March. Equity, bond, and commodities markets were shaken by fear, uncertainty, and an upending of demand-supply dynamics. Major global stock indexes were down in February, along with global bonds overall, with heightened volatility in March and mixed results that favored U.S. large-cap stocks. Prices of commodities spiked, including crude oil, natural gas, wheat, and precious metals, on elevated concerns of supply shortages. All of this fueled inflation concerns and added to expectations of more aggressive central bank interest rate hikes. Sweeping sanctions against Russia and corporate pullouts contributed to market volatility. Despite the geopolitical turmoil, the U.S. economic outlook remained largely unchanged, with a healthy job market and signs of economic resilience accompanying higher prices.
“ The Russian invasion of Ukraine dominated the financial world in February and March. Equity, bond, and commodities markets were shaken by fear, uncertainty, and an upending of demand-supply dynamics.”
| 1 | The S&P 500 Index consists of 500 stocks chosen for market size, liquidity, and industry group representation. It is a market-value-weighted index with each stock's weight in the index proportionate to its market value. You cannot invest directly in an index. |
| 2 | The Morgan Stanley Capital International (MSCI) All Country World Index (ACWI) ex USA Index (Net) is a free-float-adjusted market-capitalization-weighted index that is designed to measure the equity market performance of developed and emerging markets, excluding the U.S. Source: MSCI. MSCI makes no express or implied warranties or representations and shall have no liability whatsoever with respect to any MSCI data contained herein. The MSCI data may not be further redistributed or used as a basis for other indexes or any securities or financial products. This report is not approved, reviewed, or produced by MSCI. You cannot invest directly in an index. |
| 3 | The MSCI Emerging Markets (EM) Index (Net) (USD) is a free-float-adjusted market-capitalization-weighted index that is designed to measure equity market performance of emerging markets. You cannot invest directly in an index. |
| 4 | The Bloomberg U.S. Aggregate Bond Index is a broad-based benchmark that measures the investment-grade, U.S.-dollar-denominated, fixed-rate taxable bond market, including Treasuries, government-related and corporate securities, mortgage-backed securities (agency fixed-rate and hybrid adjustable-rate mortgage pass-throughs), asset-backed securities, and commercial mortgage-backed securities. You cannot invest directly in an index. |
| 5 | The Bloomberg Global Aggregate ex-USD Index (unhedged) is an unmanaged index that provides a broad-based measure of the global investment-grade fixed-income markets excluding the U.S.-dollar-denominated debt market. You cannot invest directly in an index. |
| 6 | The Bloomberg Municipal Bond Index is an unmanaged index composed of long-term tax-exempt bonds with a minimum credit rating of Baa. You cannot invest directly in an index. |
| 7 | The ICE BofA U.S. High Yield Index is a market-capitalization-weighted index of domestic and Yankee high-yield bonds. The index tracks the performance of high-yield securities traded in the U.S. bond market. You cannot invest directly in an index. Copyright 2023. ICE Data Indices, LLC. All rights reserved. |
2 | Allspring VT Index Asset Allocation Fund
Letter to shareholders (unaudited)
In April, market volatility continued, with deepening losses across major capital markets, as both the S&P 500 and MSCI ACWI (Net)1 fell 8% or more for the month. The Chinese economy struggled through a strict lockdown as the government tried to contain a major COVID-19 outbreak. The ensuing global ripple effect compounded existing supply shortages. This was exacerbated by the impact of the Russia-Ukraine war on global commodities. Meanwhile, U.S. annual inflation raged at 8.5%, its highest level since 1981, and investors braced themselves for aggressive Fed monetary tightening moves.
Market volatility continued in May, although markets recovered ground late in the month. Value stocks continued to outperform growth stocks. The concerns that had dominated markets for months continued, including high inflation and geopolitical tensions that added to high crude oil, gasoline, and food prices. In response, the Fed raised the federal funds rate by 0.50%, with widescale expectations of more rate hikes. Meanwhile, highly contagious COVID-19 variants persisted. However, labor markets in the U.S., the U.K., and Europe remained strong. U.S. retail sales for April, released in May, indicated a fourth consecutive monthly increase, reflecting continued consumer resilience.
In June, stocks posted further losses en route to their worst first half of a year in 50 years. Bonds didn’t fare much better. Driving the losses were the familiar factors: rising global inflation and fears of recession as central banks increased rates to try to curb soaring inflation. The Fed raised its short-term rate by another 0.75% in June. Meanwhile, the U.S. unemployment rate held firm at 3.6% and the housing market remained only marginally affected by sharply higher mortgage rates.
Markets rebounded in July, led by U.S. stocks. While evidence began to point to an economic slowdown after two consecutive quarters of declining gross domestic product (economic contraction), the U.S. labor market remained surprisingly robust: July nonfarm payrolls grew by more than 500,000 and U.S. unemployment dipped to 3.5%. Meanwhile, crude oil and retail gasoline prices, major contributors to recent overall inflation, fell substantially from earlier highs. And while U.S. home prices rose, home sales fell as houses became less affordable with mortgage rates at a 13-year high. The Fed raised the federal funds rate another 0.75% in July—to a range of 2.25% to 2.50%—and forecasts pointed to further rate hikes.
August was yet another broadly challenging month for financial markets, with more red ink flowing. High inflation persisted, cresting 9% in the eurozone on an annual basis and remaining above 8% in the U.S. despite the Fed’s aggressive monetary policy and a major drop in global crude oil and gasoline prices from their June peak. One positive note was the resilience of the U.S. job market. However, the Fed’s job was clearly not complete. One longer-term bright spot was the U.S. Congress’s passage of the Inflation Reduction Act. Its primary stated goals include: to reduce inflation (though not immediately) by curbing the deficit, capping health care spending by seniors, and investing in domestic sources of clean energy.
The market misery continued in September. There was nowhere to hide as all asset classes suffered major losses at the hands of persistent inflation. Central banks kept up their battle against rapidly rising prices with more rate hikes. The strength of the U.S. dollar made things even more difficult for investors holding assets in other currencies. U.S. mortgage rates jumped to near 7% on 30-year fixed-rate mortgages; the decreased housing affordability began to cool demand somewhat. The U.K. experienced a sharp sell-off of government bonds and the British pound in September as investors panicked in response to a new government budget that was seen as financially unsound. The market meltdown forced the Bank of England to step in and buy long-dated government bonds.
Equities had a reprieve in October after two months of sharp declines. Value stocks and small caps fared best. Globally, developed markets outpaced emerging market equities, which were hurt by weakness among Chinese stocks. Central banks continued to try to curtail high inflation with aggressive interest rate hikes. Geopolitical risks persisted, including the ongoing Russia-Ukraine war and economic, financial market, and political turmoil in the U.K., which led to a second prime ministerial change in six weeks, as Rishi Sunak replaced Liz Truss in late October. Concerns over Europe’s energy crisis eased thanks to unseasonably warm weather and plentiful gas on hand. The U.S. labor market continued its resilience against rising prices, as unemployment stood at 3.7%, near a record low.
“ In June, stocks posted further losses en route to their worst first half of a year in 50 years. Bonds didn’t fare much better. Driving the losses were the familiar factors: rising global inflation and fears of recession as central banks increased rates to try to curb soaring inflation.”
| 1 | The MSCI ACWI (Net) is a free-float-adjusted market-capitalization-weighted index that is designed to measure the equity market performance of developed and emerging markets. You cannot invest directly in an index. |
Allspring VT Index Asset Allocation Fund | 3
Letter to shareholders (unaudited)
Stocks and bonds rallied in November, with emerging market equities gaining nearly 15% and developed market equities returning 7%. The S&P 500 Index rose 5.6% in November. Bonds also had positive monthly returns. Economic news was encouraging, driven by U.S. labor market strength. Although central banks kept raising rates, hopes rose for an easing in the pace of rate hikes and a possible end to central bank monetary tightening in 2023. Although inflation remained at record highs in the eurozone, we began to see signs of a possible decline in inflationary pressures as U.S. inflation moderated, with a 7.1% annual price rise in November and a monthly price increase of just 0.1%. China’s economic data remained weak, reflecting its zero-COVID-19 policy.
Financial markets cooled in December, with U.S. equities posting negative overall results in response to a weakening U.S. dollar. Fixed income securities ended one of their worst years ever with flat overall monthly returns as markets weighed the hopes for an end to the monetary tightening cycle with the reality that central banks had not completed their jobs yet. U.S. Consumer Price Index (CPI)1 data showed a strong consistent trend downward, which brought down the 12-month CPI to 6.5% in December from 9.1% in June. Other countries and regions reported still-high but declining inflation rates as the year winded down.
Don’t let short-term uncertainty derail long-term investment goals.
Periods of investment uncertainty can present challenges, but experience has taught us that maintaining long-term investment goals can be an effective way to plan for the future. To help you create a sound strategy based on your personal goals and risk tolerance, Allspring Funds offers more than 100 mutual funds spanning a wide range of asset classes and investment styles. Although diversification cannot guarantee an investment profit or prevent losses, we believe it can be an effective way to manage investment risk and potentially smooth out overall portfolio performance. We encourage investors to know their investments and to understand that appropriate levels of risk-taking may unlock opportunities.
Thank you for choosing to invest with Allspring Funds. We appreciate your confidence in us and remain committed to helping you meet your financial needs.
Sincerely,
Andrew Owen
President
Allspring Funds
For further information about your fund, contact your investment professional, visit our website at allspringglobal.com, or call us directly at 1-800-222-8222.
| 1 | The Consumer Price Index (CPI) is a measure of the average change over time in the prices paid by urban consumers for a market basket of consumer goods and services. You cannot invest directly in an index. |
4 | Allspring VT Index Asset Allocation Fund
This page is intentionally left blank.
Performance highlights (unaudited)
| Investment objective | The Fund seeks long-term total return, consisting of capital appreciation and current income. |
| Manager | Allspring Funds Management, LLC |
| Subadviser | Allspring Global Investments, LLC |
| Portfolio managers | Kandarp R. Acharya, CFA®, FRM‡, Manjunath Boraiah†, Petros N. Bocray, CFA®‡, FRM, John R. Campbell, CFA®‡†, Travis L. Keshemberg, CFA®‡, CIPM, FRM#, David Neal, CFA®‡†, Nick Toporkov, Ph.D., CFA®‡†, Robert M. Wicentowski, CFA®‡†, Limin Xiao, Ph.D., CFA®‡† |
| Average annual total returns (%) as of December 31, 2022 |
| | | | | | Expense ratios1 (%) |
| | Inception date | 1 year | 5 year | 10 year | Gross | Net 2 |
| Class 2 | 4-15-1994 | -17.02 | 5.54 | 8.51 | 1.13 | 1.00 |
| Index Asset Allocation Blended Index3 | – | -15.52 | 5.98 | 8.40 | – | – |
| Bloomberg U.S. Treasury Index4 | – | -12.46 | -0.10 | 0.58 | – | – |
| S&P 500 Index5 | – | -18.11 | 9.42 | 12.56 | – | – |
Figures quoted represent past performance, which is no guarantee of future results. Investment return and principal value of an investment will fluctuate so that an investor’s shares, when redeemed, may be worth more or less than their original cost. Current performance may be lower or higher than the performance data quoted and assumes the reinvestment of dividends and capital gains. Current month-end performance is available by calling 1-800-260-5969. Performance figures of the Fund do not reflect fees and expenses charged pursuant to the terms of variable life insurance policies and variable annuity contracts. If these fees and expenses had been reflected, performance would have been lower.
Index returns do not include transaction costs associated with buying and selling securities, any mutual fund fees or expenses, or any taxes. It is not possible to invest directly in an index.
Shares are sold without a front-end sales charge or contingent deferred sales charge.
| 1 | Reflects the expense ratios as stated in the most recent prospectus. The expense ratios shown are subject to change and may differ from the annualized expense ratios shown in the financial highlights of this report. |
| 2 | The manager has contractually committed through April 30, 2023, to waive fees and/or reimburse expenses to the extent necessary to cap total annual fund operating expenses after fee waivers at 1.00% for Class 2 shares. Brokerage commissions, stamp duty fees, interest, taxes, acquired fund fees and expenses (if any), and extraordinary expenses are excluded from the expense cap. Prior to or after the commitment expiration date, the cap may be increased or the commitment to maintain the cap may be terminated only with the approval of the Board of Trustees. Without this cap, the Fund’s returns would have been lower. The expense ratio paid by an investor is the net expense ratio (the total annual fund operating expenses after fee waivers) as stated in the prospectus. |
| 3 | Source: Allspring Funds Management, LLC. The Index Asset Allocation Blended Index is composed 60% of the S&P 500 Index and 40% of the Bloomberg U.S. Treasury Index. Prior to April 1, 2015, the Index Asset Allocation Blended Index was composed 60% of the S&P 500 Index and 40% of the Bloomberg U.S. Treasury 20+ Year Index. You cannot invest directly in an index. |
| 4 | The Bloomberg U.S. Treasury Index is an unmanaged index of prices of U.S. Treasury bonds with maturities of 1 to 30 years. You cannot invest directly in an index. |
| 5 | The S&P 500 Index consists of 500 stocks chosen for market size, liquidity, and industry group representation. It is a market-value weighted index with each stock’s weight in the index proportionate to its market value. You cannot invest directly in an index. |
Balanced funds may invest in stocks and bonds. Stock values fluctuate in response to the activities of individual companies and general market and economic conditions. Bond values fluctuate in response to the financial condition of individual issuers, general market and economic conditions, and changes in interest rates. Changes in market conditions and government policies may lead to periods of heightened volatility in the bond market and reduced liquidity for certain bonds held by the Fund. In general, when interest rates rise, bond values fall and investors may lose principal value. Interest rate changes and their impact on the Fund and its share price can be sudden and unpredictable. The use of derivatives may reduce returns and/or increase volatility. Consult the Fund’s prospectus for additional information on these and other risks.
Please refer to the prospectus provided by your participating insurance company for detailed information describing the separate accounts for information regarding surrender charges, mortality and expense risk fees, and other charges that may be assessed by the participating insurance companies.
| ‡ | CFA® and Chartered Financial Analyst® are trademarks owned by CFA Institute. |
| # | Mr. Keshemberg became a portfolio manager of the Fund on March 24, 2022. |
| † | Mr. Boraiah, Mr. Campbell, Mr. Neal, Mr. Toporkov, Mr. Wicentowski and Ms. Xiao became portfolio managers of the Fund on June 10, 2022. |
6 | Allspring VT Index Asset Allocation Fund
Performance highlights (unaudited)
Growth of $10,000 investment as of December 31, 20221
| 1 | The chart compares the performance of Class 2 shares for the most recent ten years with the Index Asset Allocation Blended Index, Bloomberg U.S. Treasury Index and S&P 500 Index. The chart assumes a hypothetical investment of $10,000 in Class 2 shares and reflects all operating expenses of the Fund but does not reflect fees and expenses charged pursuant to the terms of variable life insurance policies and variable annuity contracts. |
Allspring VT Index Asset Allocation Fund | 7
Performance highlights (unaudited)
MANAGER'S DISCUSSION
Fund highlights
| ■ | The Fund underperformed its benchmark, the Index Asset Allocation Blended Index, for the 12-month period that ended December 31, 2022. |
| ■ | The Fund’s tactical asset allocation overlay, which is implemented with liquid futures contracts, detracted from performance during the period. |
| ■ | The Fund’s stock and bond allocations performed in line with their respective benchmarks, the S&P 500 Index and the Bloomberg U.S. Treasury Index. |
Challenges included high inflation and rate hikes.
Most years are a mix of stories. This past year was no exception, though there were three recurring themes. First, the horrible invasion of Ukraine by Russia escalated quickly and persisted through the year with many twists. Ukraine has fought back valiantly. The West has imposed sanctions and tried to pivot toward other sources of energy other than Russian gas and oil. The invasion has killed thousands. It threatened food and fuel supplies. There are still energy supply shock risks, especially for Europe, but commodity prices have retreated toward where they were before Russia’s invasion.
The second major story was China’s zero-COVID policy. The Chinese government stuck with the policy much longer than many had hoped. That caused recurring supply chain strains, shocks, and uncertainties. In a rapid about-face near year-end, China’s policymakers quickly eased COVID-19 restrictions. The country basically went from zero-tolerance to full-tolerance.
| Ten largest holdings (%) as of December 31, 20221 |
| Apple Incorporated | 3.61 |
| Microsoft Corporation | 3.32 |
| U.S. Treasury Note, 1.38%, 10-31-2028 | 1.79 |
| Amazon.com Incorporated | 1.38 |
| U.S. Treasury Note, 1.38%, 11-15-2031 | 1.22 |
| U.S. Treasury Note, 0.50%, 10-31-2027 | 1.06 |
| Berkshire Hathaway Incorporated Class B | 1.03 |
| U.S. Treasury Note, 2.75%, 8-15-2032 | 0.99 |
| Alphabet Incorporated Class A | 0.98 |
| UnitedHealth Group Incorporated | 0.92 |
| 1 | Figures represent the percentage of the Fund's net assets. Holdings are subject to change and may have changed since the date specified. |
The third major story for 2022 was the central bank pivot toward hiking rates. In October 2021, the Federal Reserve (Fed) started talking about how it was (finally) beginning to take inflation seriously. By January, the Fed said it planned on hiking rates in March. Some central banks were ahead of the
Fed in tightening policy, but by March 2022, it seemed like every central bank (except Japan’s) was trying to regain credibility in fighting inflation after being about a year late to recognize that inflation might be a problem.
The financial markets seemed to have a few different phases in 2022. Panic set in when it looked like central bankers weren't taking inflation serious enough. Then markets rallied when central bankers pivoted to hiking, showing they were indeed going to take inflation seriously. Then panic set in again when it looked like central bankers were taking inflation too seriously. Now it feels like markets are rallying, saying policymakers are bluffing in their threats to hike to the moon.
| Sector allocation as of December 31, 20221 |
| 1 | Figures represent the percentage of the Fund's long-term investments. Allocations are subject to change and may have changed since the date specified. |
About nine months into a rapid tightening cycle, inflationary pressures are easing while broad swaths of the global economy are showing signs of tilting toward, or already being in, a recession. The Fed seems to have a love for labor market indicators even though the unemployment rate is an insufficient and unreliable indicator of future inflation. Housing activity has been falling for six consecutive quarters along with real spending on goods. Real wages have been falling. Demand destruction has been happening. Supply chains have been clearing. The inflation of 2022 was a consequence of bad policy decisions from 2021. A stagnant economy, if not an outright recession, in 2023 will likely be
8 | Allspring VT Index Asset Allocation Fund
Performance highlights (unaudited)
the consequence of bad policy decisions from 2022. Two wrongs don't make a right, especially with monetary policy.
The S&P 500 Index fell 18.11% in 2022 while the Bloomberg U.S. Aggregate Bond Index* lost 13.01%. Within the equity markets, energy was the high-flyer, with the S&P 500 Energy Index** returning 65.72% for the year. The worst-performing sector was communication services, with a 39.89% drop.
Tactical asset allocation shifts detracted from performance during the 12-month period.
The Fund’s stock holdings seek to replicate the holdings of the S&P 500 Index, while its bond holdings seek to replicate those of the Bloomberg U.S. Treasury Index. The Fund’s neutral target allocation is 60% stocks and 40% bonds. As of year-end, the Fund had an effective target allocation of 60% stocks, 50% bonds, and -10% effective cash. During the period, the portfolio management team implemented tactical shifts between stocks and bonds in order to adjust the Fund’s effective allocations based on the relative attractiveness of the two asset classes.
| Allocation (%) as of December 31, 2022 |
| | Neutral
allocation | Effective
allocation1 |
| Stock Funds | 60 | 60 |
| Bond Funds | 40 | 50 |
| Effective Cash | 0 | (10) |
| 1 | Effective allocation reflects the effect of the tactical futures overlay that may be in place. Effective cash, if any, represents the net offset to such future positions. Effective allocations are subject to change and may have changed since the date specified. |
On average, the team maintained an overweight to stocks during the first half of 2022. The tactical tilt toward equities—implemented with long positions in S&P 500 futures—detracted from performance amid a sharp sell-off in global equity markets during the first six months of the year. The team adopted a more defensive posture in early
summer and throughout the second half of the year by implementing a set of short positions in S&P 500 futures. During the period, the team also implemented various yield curve management strategies that added modestly to performance. On the whole, the tactical futures overlay positions implemented during the 12-month period detracted approximately 0.7% from the performance of the Fund.
Our outlook is neutral over both the short and long term.
Our short-term outlook remains neutral. Sentiment is neutral as the MSCI ACWI (Net)*** finished the year neither overbought nor oversold as it advanced 9.8% in the final quarter, inclusive of a 4.6% pull back at the end of the year, with the VIX Index† closing at 22, below its one-year average of 26, reflecting slightly lower market volatility. The market has rebounded 10.3% off a near two-year low. However, economic growth prospects continue to decelerate, illustrated by a further decline in the global composite Purchasing Managers’ Index†† from 49.7 in September to 48.2 and decelerating earnings growth from above-trend levels. Finally, while central banks may be approaching their respective peak interest rate levels, they continue to raise their policy rates, with cumulative 125-basis-point (bp; 100 bps equal 1.00%) hikes from the Fed, the European Central Bank, and the Bank of England during the quarter. They are all expected to maintain elevated rates longer while fiscal policy has stalled in light of recent multi-decade highs in inflation.
Our long-term outlook remains cautious. First, equity valuations are elevated with the MSCI ACWI (Net) trading at 2x price/book but off highs of 3x. Second, long-term economic growth is facing headwinds from elevated inflation, tightening monetary policy in developed markets, and geopolitical uncertainties, increasing the risk of an economic slowdown in Europe in the near term and possibly in the U.S. in the second half of 2023.
| * | The Bloomberg U.S. Aggregate Bond Index is a broad-based benchmark that measures the investment-grade, U.S.-dollar-denominated, fixed-rate taxable bond market, including Treasuries, government-related and corporate securities, mortgage-backed securities (agency fixed-rate and hybrid adjustable-rate mortgage pass-throughs), asset-backed securities, and commercial mortgage-backed securities. You cannot invest directly in an index. |
| ** | The S&P 500 Energy comprises those companies included in the S&P 500 that are classified as members of the GICS® energy sector. You cannot invest directly in an index. |
| * | The Bloomberg U.S. Aggregate Bond Index is a broad-based benchmark that measures the investment-grade, U.S.-dollar-denominated, fixed-rate taxable bond market, including Treasuries, government-related and corporate securities, mortgage-backed securities (agency fixed-rate and hybrid adjustable-rate mortgage pass-throughs), asset-backed securities, and commercial mortgage-backed securities. You cannot invest directly in an index. |
| *** | The Morgan Stanley Capital International (MSCI) All Country World Index (ACWI) (Net) is a free-float-adjusted market-capitalization-weighted index that is designed to measure the equity market performance of developed and emerging markets. You cannot invest directly in an index. Source: MSCI. MSCI makes no express or implied warranties or representations and shall have no liability whatsoever with respect to any MSCI data contained herein. The MSCI data may not be further redistributed or used as a basis for other indexes or any securities or financial products. This report is not approved, reviewed, or produced by MSCI. |
| * | The Bloomberg U.S. Aggregate Bond Index is a broad-based benchmark that measures the investment-grade, U.S.-dollar-denominated, fixed-rate taxable bond market, including Treasuries, government-related and corporate securities, mortgage-backed securities (agency fixed-rate and hybrid adjustable-rate mortgage pass-throughs), asset-backed securities, and commercial mortgage-backed securities. You cannot invest directly in an index. |
| † | The Chicago Board Options Exchange (CBOE) Market Volatility Index (VIX) is a popular measure of the implied volatility of S&P 500 Index options. It represents one measure of the market's expectation of stock market volatility over the next 30-day period. You cannot invest directly in an index. |
| * | The Bloomberg U.S. Aggregate Bond Index is a broad-based benchmark that measures the investment-grade, U.S.-dollar-denominated, fixed-rate taxable bond market, including Treasuries, government-related and corporate securities, mortgage-backed securities (agency fixed-rate and hybrid adjustable-rate mortgage pass-throughs), asset-backed securities, and commercial mortgage-backed securities. You cannot invest directly in an index. |
| †† | The PurchasingManagers' Index (PMI) is an index of the prevailing direction of economic trends in themanufacturing and service sectors. You cannot invest directly in an index. |
Allspring VT Index Asset Allocation Fund | 9
Fund expenses (unaudited)
As a shareholder of the Fund, you incur ongoing costs, including management fees, distribution (12b-1) fees, and other Fund expenses. This example is intended to help you understand your ongoing costs (in dollars) of investing in the Fund and to compare these costs with the ongoing costs of investing in other mutual funds.
The example is based on an investment of $1,000 invested at the beginning of the six-month period and held for the entire period from July 1, 2022 to December 31, 2022.
Actual expenses
The “Actual” line of the table below provides information about actual account values and actual expenses. You may use the information in this line, together with the amount you invested, to estimate the expenses that you paid over the period. Simply divide your account value by $1,000 (for example, an $8,600 account value divided by $1,000 = 8.6), then multiply the result by the number in the “Actual” line under the heading entitled “Expenses paid during period” for your applicable class of shares to estimate the expenses you paid on your account during this period.
Hypothetical example for comparison purposes
The “Hypothetical” line of the table below provides information about hypothetical account values and hypothetical expenses based on the Fund’s actual expense ratio and an assumed rate of return of 5% per year before expenses, which is not the Fund’s actual return. The hypothetical account values and expenses may not be used to estimate the actual ending account balance or expenses you paid for the period. You may use this information to compare the ongoing costs of investing in the Fund and other funds. To do so, compare this 5% hypothetical example with the 5% hypothetical examples that appear in the shareholder reports of the other funds.
Please note that the expenses shown in the table are meant to highlight your ongoing costs only and do not reflect any separate account charges assessed by participating insurance companies. Therefore, the “Hypothetical” line of the table is useful in comparing ongoing costs only, and will not help you determine the relative total costs of owning different funds. In addition, if these separate account charges assessed by participating insurance companies were included, your costs would have been higher.
| | Beginning
account value
7-1-2022 | Ending
account value
12-31-2022 | Expenses
paid during
the period1 | Annualized net
expense ratio |
| Class 2 | | | | |
| Actual | $1,000.00 | $ 994.17 | $5.03 | 1.00% |
| Hypothetical (5% return before expenses) | $1,000.00 | $1,020.16 | $5.09 | 1.00% |
1 Expenses paid is equal to the annualized net expense ratio multiplied by the average account value over the period, multiplied by 184 divided by 365 (to reflect the one-half-year period).
10 | Allspring VT Index Asset Allocation Fund
Portfolio of investments—December 31, 2022
| | | | | Shares | Value |
| Common stocks: 59.62% | | | | | |
| Communication services: 4.34% | | | | | |
| Diversified telecommunication services: 0.56% | | | | | |
| AT&T Incorporated | | | | 8,270 | $ 152,251 |
| Lumen Technologies Incorporated | | | | 1,104 | 5,763 |
| Verizon Communications Incorporated | | | | 4,873 | 191,996 |
| | | | | | 350,010 |
| Entertainment: 0.79% | | | | | |
| Activision Blizzard Incorporated | | | | 826 | 63,230 |
| Electronic Arts Incorporated | | | | 304 | 37,143 |
| Live Nation Entertainment Incorporated † | | | | 166 | 11,577 |
| Netflix Incorporated † | | | | 516 | 152,158 |
| Take-Two Interactive Software Incorporated † | | | | 183 | 19,056 |
| The Walt Disney Company | | | | 2,115 | 183,751 |
| Warner Bros. Discovery Incorporated † | | | | 2,564 | 24,307 |
| | | | | | 491,222 |
| Interactive media & services: 2.37% | | | | | |
| Alphabet Incorporated Class A † | | | | 6,931 | 611,522 |
| Alphabet Incorporated Class C † | | | | 6,144 | 545,157 |
| Match Group Incorporated † | | | | 324 | 13,443 |
| Meta Platforms Incorporated Class A † | | | | 2,609 | 313,967 |
| | | | | | 1,484,089 |
| Media: 0.47% | | | | | |
| Charter Communications Incorporated Class A † | | | | 125 | 42,388 |
| Comcast Corporation Class A | | | | 5,006 | 175,060 |
| DISH Network Corporation Class A † | | | | 292 | 4,100 |
| Fox Corporation Class A | | | | 351 | 10,660 |
| Fox Corporation Class B | | | | 162 | 4,609 |
| Interpublic Group of Companies Incorporated | | | | 451 | 15,023 |
| News Corporation Class A | | | | 444 | 8,081 |
| News Corporation Class B | | | | 137 | 2,526 |
| Omnicom Group Incorporated | | | | 237 | 19,332 |
| Paramount Global Class B | | | | 586 | 9,892 |
| | | | | | 291,671 |
| Wireless telecommunication services: 0.15% | | | | | |
| T-Mobile US Incorporated † | | | | 693 | 97,020 |
| Consumer discretionary: 5.84% | | | | | |
| Auto components: 0.06% | | | | | |
| Aptiv plc † | | | | 314 | 29,243 |
| BorgWarner Incorporated | | | | 272 | 10,948 |
| | | | | | 40,191 |
| Automobiles: 0.79% | | | | | |
| Ford Motor Company | | | | 4,583 | 53,300 |
| General Motors Company | | | | 1,648 | 55,439 |
| Tesla Motors Incorporated † | | | | 3,114 | 383,583 |
| | | | | | 492,322 |
The accompanying notes are an integral part of these financial statements.
Allspring VT Index Asset Allocation Fund | 11
Portfolio of investments—December 31, 2022
| | | | | Shares | Value |
| Distributors: 0.09% | | | | | |
| Genuine Parts Company | | | | 164 | $ 28,456 |
| LKQ Corporation | | | | 295 | 15,756 |
| Pool Corporation | | | | 45 | 13,605 |
| | | | | | 57,817 |
| Hotels, restaurants & leisure: 1.20% | | | | | |
| Booking Holdings Incorporated † | | | | 45 | 90,688 |
| Caesars Entertainment Incorporated † | | | | 249 | 10,358 |
| Carnival Corporation † | | | | 1,162 | 9,366 |
| Chipotle Mexican Grill Incorporated † | | | | 32 | 44,400 |
| Darden Restaurants Incorporated | | | | 142 | 19,643 |
| Domino's Pizza Incorporated | | | | 41 | 14,202 |
| Expedia Group Incorporated † | | | | 175 | 15,330 |
| Hilton Worldwide Holdings Incorporated | | | | 314 | 39,677 |
| Las Vegas Sands Corporation † | | | | 381 | 18,315 |
| Marriott International Incorporated Class A | | | | 312 | 46,454 |
| McDonald's Corporation | | | | 850 | 224,001 |
| MGM Resorts International | | | | 370 | 12,406 |
| Norwegian Cruise Line Holdings Limited † | | | | 489 | 5,985 |
| Royal Caribbean Cruises Limited † | | | | 255 | 12,605 |
| Starbucks Corporation | | | | 1,332 | 132,134 |
| Wynn Resorts Limited † | | | | 120 | 9,896 |
| Yum! Brands Incorporated | | | | 327 | 41,882 |
| | | | | | 747,342 |
| Household durables: 0.20% | | | | | |
| D.R. Horton Incorporated | | | | 363 | 32,358 |
| Garmin Limited | | | | 178 | 16,428 |
| Lennar Corporation Class A | | | | 296 | 26,788 |
| Mohawk Industries Incorporated † | | | | 61 | 6,235 |
| Newell Rubbermaid Incorporated | | | | 437 | 5,716 |
| NVR Incorporated | | | | 3 | 13,838 |
| PulteGroup Incorporated | | | | 264 | 12,020 |
| Whirlpool Corporation | | | | 63 | 8,912 |
| | | | | | 122,295 |
| Internet & direct marketing retail: 1.45% | | | | | |
| Amazon.com Incorporated † | | | | 10,298 | 865,032 |
| eBay Incorporated | | | | 630 | 26,126 |
| Etsy Incorporated † | | | | 146 | 17,488 |
| | | | | | 908,646 |
| Leisure products: 0.01% | | | | | |
| Hasbro Incorporated | | | | 151 | 9,213 |
| Multiline retail: 0.29% | | | | | |
| Dollar General Corporation | | | | 262 | 64,518 |
| Dollar Tree Incorporated | | | | 244 | 34,511 |
| Target Corporation | | | | 534 | 79,587 |
| | | | | | 178,616 |
| Specialty retail: 1.43% | | | | | |
| Advance Auto Parts Incorporated | | | | 70 | 10,292 |
| AutoZone Incorporated † | | | | 22 | 54,256 |
| Bath & Body Works Incorporated | | | | 265 | 11,167 |
The accompanying notes are an integral part of these financial statements.
12 | Allspring VT Index Asset Allocation Fund
Portfolio of investments—December 31, 2022
| | | | | Shares | Value |
| Specialty retail (continued) | | | | | |
| Best Buy Company Incorporated | | | | 232 | $ 18,609 |
| CarMax Incorporated † | | | | 183 | 11,143 |
| Lowe's Companies Incorporated | | | | 720 | 143,453 |
| O'Reilly Automotive Incorporated † | | | | 73 | 61,614 |
| Ross Stores Incorporated | | | | 403 | 46,776 |
| The Home Depot Incorporated | | | | 1,188 | 375,242 |
| The TJX Companies Incorporated | | | | 1,347 | 107,221 |
| Tractor Supply Company | | | | 128 | 28,796 |
| Ulta Beauty Incorporated † | | | | 59 | 27,675 |
| | | | | | 896,244 |
| Textiles, apparel & luxury goods: 0.32% | | | | | |
| Nike Incorporated Class B | | | | 1,462 | 171,069 |
| Ralph Lauren Corporation | | | | 48 | 5,072 |
| Tapestry Incorporated | | | | 280 | 10,662 |
| VF Corporation | | | | 383 | 10,575 |
| | | | | | 197,378 |
| Consumer staples: 4.29% | | | | | |
| Beverages: 1.16% | | | | | |
| Brown-Forman Corporation Class B | | | | 212 | 13,924 |
| Constellation Brands Incorporated Class A | | | | 188 | 43,569 |
| Keurig Dr. Pepper Incorporated | | | | 986 | 35,161 |
| Molson Coors Brewing Company Class B | | | | 218 | 11,231 |
| Monster Beverage Corporation † | | | | 442 | 44,876 |
| PepsiCo Incorporated | | | | 1,599 | 288,875 |
| The Coca-Cola Company | | | | 4,516 | 287,263 |
| | | | | | 724,899 |
| Food & staples retailing: 0.92% | | | | | |
| Costco Wholesale Corporation | | | | 514 | 234,641 |
| Sysco Corporation | | | | 588 | 44,953 |
| The Kroger Company | | | | 756 | 33,702 |
| Walgreens Boots Alliance Incorporated | | | | 833 | 31,121 |
| Walmart Incorporated | | | | 1,638 | 232,252 |
| | | | | | 576,669 |
| Food products: 0.72% | | | | | |
| Archer Daniels Midland Company | | | | 637 | 59,145 |
| Campbell Soup Company | | | | 233 | 13,223 |
| ConAgra Foods Incorporated | | | | 556 | 21,517 |
| General Mills Incorporated | | | | 689 | 57,773 |
| Hormel Foods Corporation | | | | 336 | 15,305 |
| Kellogg Company | | | | 297 | 21,158 |
| Lamb Weston Holdings Incorporated | | | | 167 | 14,923 |
| McCormick & Company Incorporated | | | | 291 | 24,121 |
| Mondelez International Incorporated Class A | | | | 1,585 | 105,640 |
| The Hershey Company | | | | 171 | 39,598 |
| The J.M. Smucker Company | | | | 124 | 19,649 |
| The Kraft Heinz Company | | | | 924 | 37,616 |
| Tyson Foods Incorporated Class A | | | | 336 | 20,916 |
| | | | | | 450,584 |
The accompanying notes are an integral part of these financial statements.
Allspring VT Index Asset Allocation Fund | 13
Portfolio of investments—December 31, 2022
| | | | | Shares | Value |
| Household products: 0.94% | | | | | |
| Church & Dwight Company Incorporated | | | | 283 | $ 22,813 |
| Colgate-Palmolive Company | | | | 969 | 76,348 |
| Kimberly-Clark Corporation | | | | 392 | 53,214 |
| The Clorox Company | | | | 143 | 20,067 |
| The Procter & Gamble Company | | | | 2,750 | 416,790 |
| | | | | | 589,232 |
| Personal products: 0.11% | | | | | |
| The Estee Lauder Companies Incorporated Class A | | | | 268 | 66,493 |
| Tobacco: 0.44% | | | | | |
| Altria Group Incorporated | | | | 2,079 | 95,031 |
| Philip Morris International Incorporated | | | | 1,799 | 182,077 |
| | | | | | 277,108 |
| Energy: 3.12% | | | | | |
| Energy equipment & services: 0.26% | | | | | |
| Baker Hughes Company | | | | 1,162 | 34,314 |
| Halliburton Company | | | | 1,054 | 41,475 |
| Schlumberger Limited | | | | 1,645 | 87,942 |
| | | | | | 163,731 |
| Oil, gas & consumable fuels: 2.86% | | | | | |
| APA Corporation | | | | 373 | 17,412 |
| Chevron Corporation | | | | 2,064 | 370,467 |
| ConocoPhillips | | | | 1,446 | 170,628 |
| Coterra Energy Incorporated | | | | 915 | 22,482 |
| Devon Energy Corporation | | | | 758 | 46,625 |
| Diamondback Energy Incorporated | | | | 204 | 27,903 |
| EOG Resources Incorporated | | | | 682 | 88,333 |
| EQT Corporation | | | | 426 | 14,412 |
| Exxon Mobil Corporation | | | | 4,779 | 527,124 |
| Hess Corporation | | | | 322 | 45,666 |
| Kinder Morgan Incorporated | | | | 2,295 | 41,494 |
| Marathon Oil Corporation | | | | 737 | 19,951 |
| Marathon Petroleum Corporation | | | | 544 | 63,316 |
| Occidental Petroleum Corporation | | | | 844 | 53,164 |
| ONEOK Incorporated | | | | 519 | 34,098 |
| Phillips 66 | | | | 548 | 57,036 |
| Pioneer Natural Resources Company | | | | 276 | 63,036 |
| Targa Resources Corporation | | | | 263 | 19,331 |
| The Williams Companies Incorporated | | | | 1,413 | 46,488 |
| Valero Energy Corporation | | | | 447 | 56,706 |
| | | | | | 1,785,672 |
| Financials: 6.95% | | | | | |
| Banks: 2.28% | | | | | |
| Bank of America Corporation | | | | 8,098 | 268,206 |
| Citigroup Incorporated | | | | 2,247 | 101,632 |
| Citizens Financial Group Incorporated | | | | 571 | 22,480 |
| Comerica Incorporated | | | | 152 | 10,161 |
| Fifth Third Bancorp | | | | 796 | 26,117 |
| First Republic Bank | | | | 212 | 25,841 |
| Huntington Bancshares Incorporated | | | | 1,674 | 23,603 |
The accompanying notes are an integral part of these financial statements.
14 | Allspring VT Index Asset Allocation Fund
Portfolio of investments—December 31, 2022
| | | | | Shares | Value |
| Banks (continued) | | | | | |
| JPMorgan Chase & Company | | | | 3,403 | $ 456,342 |
| KeyCorp | | | | 1,083 | 18,866 |
| M&T Bank Corporation | | | | 200 | 29,012 |
| PNC Financial Services Group Incorporated | | | | 468 | 73,916 |
| Regions Financial Corporation | | | | 1,084 | 23,371 |
| Signature Bank | | | | 73 | 8,411 |
| SVB Financial Group † | | | | 69 | 15,880 |
| Truist Financial Corporation | | | | 1,539 | 66,223 |
| US Bancorp | | | | 1,569 | 68,424 |
| Wells Fargo & Company | | | | 4,421 | 182,543 |
| Zions Bancorporation | | | | 174 | 8,554 |
| | | | | | 1,429,582 |
| Capital markets: 1.87% | | | | | |
| Ameriprise Financial Incorporated | | | | 123 | 38,299 |
| Bank of New York Mellon Corporation | | | | 853 | 38,829 |
| BlackRock Incorporated | | | | 174 | 123,302 |
| Cboe Global Markets Incorporated | | | | 123 | 15,433 |
| CME Group Incorporated | | | | 417 | 70,123 |
| FactSet Research Systems Incorporated | | | | 44 | 17,653 |
| Franklin Resources Incorporated | | | | 330 | 8,705 |
| Intercontinental Exchange Incorporated | | | | 648 | 66,478 |
| Invesco Limited | | | | 528 | 9,499 |
| MarketAxess Holdings Incorporated | | | | 44 | 12,271 |
| Moody's Corporation | | | | 183 | 50,987 |
| Morgan Stanley | | | | 1,530 | 130,081 |
| MSCI Incorporated | | | | 93 | 43,261 |
| Northern Trust Corporation | | | | 242 | 21,415 |
| Raymond James Financial Incorporated | | | | 225 | 24,041 |
| S&P Global Incorporated | | | | 386 | 129,287 |
| State Street Corporation | | | | 426 | 33,045 |
| T. Rowe Price Group Incorporated | | | | 259 | 28,247 |
| The Charles Schwab Corporation | | | | 1,770 | 147,370 |
| The Goldman Sachs Group Incorporated | | | | 393 | 134,948 |
| The NASDAQ Incorporated | | | | 393 | 24,111 |
| | | | | | 1,167,385 |
| Consumer finance: 0.31% | | | | | |
| American Express Company | | | | 694 | 102,539 |
| Capital One Financial Corporation | | | | 443 | 41,181 |
| Discover Financial Services | | | | 317 | 31,012 |
| Synchrony Financial | | | | 523 | 17,186 |
| | | | | | 191,918 |
| Diversified financial services: 1.03% | | | | | |
| Berkshire Hathaway Incorporated Class B † | | | | 2,091 | 645,910 |
| Insurance: 1.46% | | | | | |
| AFLAC Incorporated | | | | 657 | 47,265 |
| American International Group Incorporated | | | | 862 | 54,513 |
| Aon plc Class A | | | | 240 | 72,034 |
| Arch Capital Group Limited † | | | | 429 | 26,933 |
| Arthur J. Gallagher & Company | | | | 245 | 46,192 |
| Assurant Incorporated | | | | 61 | 7,629 |
| Brown & Brown Incorporated | | | | 273 | 15,553 |
| Chubb Limited | | | | 482 | 106,329 |
The accompanying notes are an integral part of these financial statements.
Allspring VT Index Asset Allocation Fund | 15
Portfolio of investments—December 31, 2022
| | | | | Shares | Value |
| Insurance (continued) | | | | | |
| Cincinnati Financial Corporation | | | | 182 | $ 18,635 |
| Everest Reinsurance Group Limited | | | | 45 | 14,907 |
| Globe Life Incorporated | | | | 105 | 12,658 |
| Lincoln National Corporation | | | | 179 | 5,499 |
| Loews Corporation | | | | 229 | 13,358 |
| Marsh & McLennan Companies Incorporated | | | | 576 | 95,316 |
| MetLife Incorporated | | | | 765 | 55,363 |
| Principal Financial Group Incorporated | | | | 264 | 22,155 |
| Progressive Corporation | | | | 679 | 88,073 |
| Prudential Financial Incorporated | | | | 427 | 42,469 |
| The Allstate Corporation | | | | 308 | 41,765 |
| The Hartford Financial Services Group Incorporated | | | | 369 | 27,981 |
| The Travelers Companies Incorporated | | | | 272 | 50,997 |
| W.R. Berkley Corporation | | | | 237 | 17,199 |
| Willis Towers Watson plc | | | | 126 | 30,817 |
| | | | | | 913,640 |
| Health care: 9.43% | | | | | |
| Biotechnology: 1.48% | | | | | |
| AbbVie Incorporated | | | | 2,052 | 331,624 |
| Amgen Incorporated | | | | 619 | 162,574 |
| Biogen Incorporated † | | | | 167 | 46,246 |
| Gilead Sciences Incorporated | | | | 1,455 | 124,912 |
| Incyte Corporation | | | | 214 | 17,188 |
| Moderna Incorporated † | | | | 383 | 68,794 |
| Regeneron Pharmaceuticals Incorporated † | | | | 124 | 89,465 |
| Vertex Pharmaceuticals Incorporated † | | | | 298 | 86,056 |
| | | | | | 926,859 |
| Health care equipment & supplies: 1.68% | | | | | |
| Abbott Laboratories | | | | 2,023 | 222,105 |
| Align Technology Incorporated † | | | | 84 | 17,716 |
| Baxter International Incorporated | | | | 585 | 29,817 |
| Becton Dickinson & Company | | | | 331 | 84,173 |
| Boston Scientific Corporation † | | | | 1,662 | 76,901 |
| Dentsply Sirona Incorporated | | | | 249 | 7,928 |
| DexCom Incorporated † | | | | 448 | 50,732 |
| Edwards Lifesciences Corporation † | | | | 717 | 53,495 |
| Hologic Incorporated | | | | 290 | 21,695 |
| IDEXX Laboratories Incorporated † | | | | 96 | 39,164 |
| Intuitive Surgical Incorporated † | | | | 410 | 108,794 |
| Medtronic plc | | | | 1,542 | 119,844 |
| ResMed Incorporated | | | | 170 | 35,382 |
| STERIS plc | | | | 116 | 21,424 |
| Stryker Corporation | | | | 391 | 95,596 |
| Teleflex Incorporated | | | | 54 | 13,480 |
| The Cooper Companies Incorporated | | | | 57 | 18,848 |
| Zimmer Biomet Holdings Incorporated | | | | 243 | 30,983 |
| | | | | | 1,048,077 |
| Health care providers & services: 2.20% | | | | | |
| AmerisourceBergen Corporation | | | | 188 | 31,153 |
| Cardinal Health Incorporated | | | | 304 | 23,368 |
| Centene Corporation † | | | | 657 | 53,881 |
The accompanying notes are an integral part of these financial statements.
16 | Allspring VT Index Asset Allocation Fund
Portfolio of investments—December 31, 2022
| | | | | Shares | Value |
| Health care providers & services (continued) | | | | | |
| Cigna Corporation | | | | 355 | $ 117,626 |
| CVS Health Corporation | | | | 1,525 | 142,115 |
| DaVita HealthCare Partners Incorporated † | | | | 64 | 4,779 |
| Elevance Health Incorporated | | | | 277 | 142,093 |
| HCA Healthcare Incorporated | | | | 246 | 59,030 |
| Henry Schein Incorporated † | | | | 157 | 12,540 |
| Humana Incorporated | | | | 147 | 75,292 |
| Laboratory Corporation of America Holdings | | | | 103 | 24,254 |
| McKesson Corporation | | | | 165 | 61,895 |
| Molina Healthcare Incorporated | | | | 68 | 22,455 |
| Quest Diagnostics Incorporated | | | | 132 | 20,650 |
| UnitedHealth Group Incorporated | | | | 1,084 | 574,715 |
| Universal Health Services Incorporated Class B | | | | 74 | 10,426 |
| | | | | | 1,376,272 |
| Life sciences tools & services: 1.16% | | | | | |
| Agilent Technologies Incorporated | | | | 344 | 51,480 |
| Bio-Rad Laboratories Incorporated Class A † | | | | 25 | 10,512 |
| Bio-Techne Corporation | | | | 182 | 15,084 |
| Charles River Laboratories International Incorporated † | | | | 59 | 12,856 |
| Danaher Corporation | | | | 760 | 201,719 |
| Illumina Incorporated † | | | | 183 | 37,003 |
| IQVIA Holdings Incorporated † | | | | 216 | 44,256 |
| Mettler-Toledo International Incorporated † | | | | 26 | 37,582 |
| PerkinElmer Incorporated | | | | 146 | 20,472 |
| Thermo Fisher Scientific Incorporated | | | | 455 | 250,564 |
| Waters Corporation † | | | | 69 | 23,638 |
| West Pharmaceutical Services Incorporated | | | | 86 | 20,240 |
| | | | | | 725,406 |
| Pharmaceuticals: 2.91% | | | | | |
| Bristol-Myers Squibb Company | | | | 2,467 | 177,501 |
| Catalent Incorporated † | | | | 209 | 9,407 |
| Eli Lilly & Company | | | | 915 | 334,744 |
| Johnson & Johnson | | | | 3,034 | 535,956 |
| Merck & Company Incorporated | | | | 2,942 | 326,415 |
| Organon & Company | | | | 295 | 8,239 |
| Pfizer Incorporated | | | | 6,513 | 333,726 |
| Viatris Incorporated | | | | 1,407 | 15,660 |
| Zoetis Incorporated | | | | 541 | 79,284 |
| | | | | | 1,820,932 |
| Industrials: 5.16% | | | | | |
| Aerospace & defense: 1.14% | | | | | |
| General Dynamics Corporation | | | | 261 | 64,757 |
| Howmet Aerospace Incorporated | | | | 427 | 16,828 |
| Huntington Ingalls Industries Incorporated | | | | 46 | 10,611 |
| L3Harris Technologies Incorporated | | | | 221 | 46,014 |
| Lockheed Martin Corporation | | | | 271 | 131,839 |
| Northrop Grumman Corporation | | | | 168 | 91,662 |
| Raytheon Technologies Corporation | | | | 1,706 | 172,170 |
| Textron Incorporated | | | | 242 | 17,134 |
The accompanying notes are an integral part of these financial statements.
Allspring VT Index Asset Allocation Fund | 17
Portfolio of investments—December 31, 2022
| | | | | Shares | Value |
| Aerospace & defense (continued) | | | | | |
| The Boeing Company † | | | | 650 | $ 123,819 |
| TransDigm Group Incorporated | | | | 60 | 37,779 |
| | | | | | 712,613 |
| Air freight & logistics: 0.36% | | | | | |
| C.H. Robinson Worldwide Incorporated | | | | 137 | 12,544 |
| Expeditors International of Washington Incorporated | | | | 185 | 19,225 |
| FedEx Corporation | | | | 278 | 48,150 |
| United Parcel Service Incorporated Class B | | | | 847 | 147,242 |
| | | | | | 227,161 |
| Airlines: 0.13% | | | | | |
| Alaska Air Group Incorporated † | | | | 147 | 6,312 |
| American Airlines Group Incorporated † | | | | 754 | 9,591 |
| Delta Air Lines Incorporated † | | | | 744 | 24,448 |
| Southwest Airlines Company † | | | | 689 | 23,199 |
| United Airlines Holdings Incorporated † | | | | 379 | 14,288 |
| | | | | | 77,838 |
| Building products: 0.27% | | | | | |
| A.O. Smith Corporation | | | | 147 | 8,414 |
| Allegion plc | | | | 102 | 10,737 |
| Carrier Global Corporation | | | | 970 | 40,013 |
| Johnson Controls International plc | | | | 799 | 51,136 |
| Masco Corporation | | | | 262 | 12,228 |
| Trane Technologies plc | | | | 267 | 44,880 |
| | | | | | 167,408 |
| Commercial services & supplies: 0.29% | | | | | |
| Cintas Corporation | | | | 100 | 45,162 |
| Copart Incorporated † | | | | 497 | 30,262 |
| Republic Services Incorporated | | | | 238 | 30,700 |
| Rollins Incorporated | | | | 269 | 9,829 |
| Waste Management Incorporated | | | | 433 | 67,929 |
| | | | | | 183,882 |
| Construction & engineering: 0.04% | | | | | |
| Quanta Services Incorporated | | | | 166 | 23,655 |
| Electrical equipment: 0.35% | | | | | |
| AMETEK Incorporated | | | | 266 | 37,166 |
| Eaton Corporation plc | | | | 461 | 72,354 |
| Emerson Electric Company | | | | 686 | 65,897 |
| Generac Holdings Incorporated † | | | | 74 | 7,449 |
| Rockwell Automation Incorporated | | | | 133 | 34,257 |
| | | | | | 217,123 |
| Industrial conglomerates: 0.56% | | | | | |
| 3M Company | | | | 641 | 76,869 |
| General Electric Company | | | | 1,268 | 106,246 |
| Honeywell International Incorporated | | | | 780 | 167,154 |
| | | | | | 350,269 |
| Machinery: 1.12% | | | | | |
| Caterpillar Incorporated | | | | 604 | 144,694 |
The accompanying notes are an integral part of these financial statements.
18 | Allspring VT Index Asset Allocation Fund
Portfolio of investments—December 31, 2022
| | | | | Shares | Value |
| Machinery (continued) | | | | | |
| Cummins Incorporated | | | | 164 | $ 39,736 |
| Deere & Company | | | | 319 | 136,774 |
| Dover Corporation | | | | 163 | 22,072 |
| Fortive Corporation | | | | 411 | 26,407 |
| IDEX Corporation | | | | 88 | 20,093 |
| Illinois Tool Works Incorporated | | | | 324 | 71,377 |
| Ingersoll Rand Incorporated | | | | 470 | 24,558 |
| Nordson Corporation | | | | 62 | 14,739 |
| Otis Worldwide Corporation | | | | 483 | 37,824 |
| PACCAR Incorporated | | | | 404 | 39,984 |
| Parker-Hannifin Corporation | | | | 149 | 43,359 |
| Pentair plc | | | | 191 | 8,591 |
| Snap-on Incorporated | | | | 62 | 14,166 |
| Stanley Black & Decker Incorporated | | | | 172 | 12,921 |
| Wabtec Corporation | | | | 211 | 21,060 |
| Xylem Incorporated | | | | 209 | 23,109 |
| | | | | | 701,464 |
| Professional services: 0.22% | | | | | |
| CoStar Group Incorporated † | | | | 472 | 36,476 |
| Equifax Incorporated | | | | 142 | 27,599 |
| Jacobs Solutions Incorporated | | | | 148 | 17,770 |
| Leidos Holdings Incorporated | | | | 159 | 16,725 |
| Robert Half International Incorporated | | | | 126 | 9,303 |
| Verisk Analytics Incorporated | | | | 181 | 31,932 |
| | | | | | 139,805 |
| Road & rail: 0.54% | | | | | |
| CSX Corporation | | | | 2,439 | 75,560 |
| J.B. Hunt Transport Services Incorporated | | | | 96 | 16,739 |
| Norfolk Southern Corporation | | | | 269 | 66,287 |
| Old Dominion Freight Line Incorporated | | | | 105 | 29,797 |
| Union Pacific Corporation | | | | 713 | 147,641 |
| | | | | | 336,024 |
| Trading companies & distributors: 0.14% | | | | | |
| Fastenal Company | | | | 665 | 31,468 |
| United Rentals Incorporated † | | | | 80 | 28,434 |
| W.W. Grainger Incorporated | | | | 52 | 28,925 |
| | | | | | 88,827 |
| Information technology: 15.35% | | | | | |
| Communications equipment: 0.54% | | | | | |
| Arista Networks Incorporated † | | | | 287 | 34,827 |
| Cisco Systems Incorporated | | | | 4,764 | 226,957 |
| F5 Networks Incorporated † | | | | 69 | 9,902 |
| Juniper Networks Incorporated | | | | 377 | 12,049 |
| Motorola Solutions Incorporated | | | | 194 | 49,996 |
| | | | | | 333,731 |
| Electronic equipment, instruments & components: 0.38% | | | | | |
| Amphenol Corporation Class A | | | | 690 | 52,537 |
| CDW Corporation of Delaware | | | | 157 | 28,037 |
| Corning Incorporated | | | | 883 | 28,203 |
The accompanying notes are an integral part of these financial statements.
Allspring VT Index Asset Allocation Fund | 19
Portfolio of investments—December 31, 2022
| | | | | Shares | Value |
| Electronic equipment, instruments & components (continued) | | | | | |
| Keysight Technologies Incorporated | | | | 207 | $ 35,411 |
| TE Connectivity Limited | | | | 369 | 42,361 |
| Teledyne Technologies Incorporated † | | | | 54 | 21,595 |
| Trimble Incorporated † | | | | 286 | 14,460 |
| Zebra Technologies Corporation Class A † | | | | 60 | 15,385 |
| | | | | | 237,989 |
| IT services: 2.66% | | | | | |
| Accenture plc Class A | | | | 731 | 195,060 |
| Akamai Technologies Incorporated † | | | | 182 | 15,343 |
| Automatic Data Processing Incorporated | | | | 481 | 114,892 |
| Broadridge Financial Solutions Incorporated | | | | 137 | 18,376 |
| Cognizant Technology Solutions Corporation Class A | | | | 596 | 34,085 |
| DXC Technology Company † | | | | 267 | 7,076 |
| EPAM Systems Incorporated † | | | | 67 | 21,959 |
| Fidelity National Information Services Incorporated | | | | 689 | 46,749 |
| Fiserv Incorporated † | | | | 737 | 74,489 |
| FleetCor Technologies Incorporated † | | | | 86 | 15,796 |
| Gartner Incorporated † | | | | 92 | 30,925 |
| Global Payments Incorporated | | | | 314 | 31,186 |
| International Business Machines Corporation | | | | 1,049 | 147,794 |
| Jack Henry & Associates Incorporated | | | | 85 | 14,923 |
| MasterCard Incorporated Class A | | | | 985 | 342,514 |
| Paychex Incorporated | | | | 372 | 42,988 |
| PayPal Holdings Incorporated † | | | | 1,323 | 94,224 |
| VeriSign Incorporated † | | | | 107 | 21,982 |
| Visa Incorporated Class A | | | | 1,897 | 394,121 |
| | | | | | 1,664,482 |
| Semiconductors & semiconductor equipment: 3.04% | | | | | |
| Advanced Micro Devices Incorporated † | | | | 1,871 | 121,185 |
| Analog Devices Incorporated | | | | 597 | 97,926 |
| Applied Materials Incorporated | | | | 998 | 97,185 |
| Broadcom Incorporated | | | | 470 | 262,791 |
| Enphase Energy Incorporated † | | | | 158 | 41,864 |
| First Solar Incorporated | | | | 115 | 17,226 |
| Intel Corporation | | | | 4,789 | 126,573 |
| KLA Corporation | | | | 164 | 61,833 |
| Lam Research Corporation | | | | 158 | 66,407 |
| Microchip Technology Incorporated | | | | 638 | 44,820 |
| Micron Technology Incorporated | | | | 1,261 | 63,025 |
| Monolithic Power Systems Incorporated | | | | 52 | 18,388 |
| NVIDIA Corporation | | | | 2,889 | 422,198 |
| NXP Semiconductors NV | | | | 301 | 47,567 |
| ON Semiconductor Corporation † | | | | 502 | 31,310 |
| Qorvo Incorporated † | | | | 118 | 10,696 |
| Qualcomm Incorporated | | | | 1,301 | 143,032 |
| Skyworks Solutions Incorporated | | | | 186 | 16,950 |
| Solaredge Technologies Incorporated † | | | | 65 | 18,413 |
| Teradyne Incorporated | | | | 181 | 15,810 |
| Texas Instruments Incorporated | | | | 1,053 | 173,977 |
| | | | | | 1,899,176 |
| Software: 4.98% | | | | | |
| Adobe Incorporated † | | | | 539 | 181,390 |
The accompanying notes are an integral part of these financial statements.
20 | Allspring VT Index Asset Allocation Fund
Portfolio of investments—December 31, 2022
| | | | | Shares | Value |
| Software (continued) | | | | | |
| ANSYS Incorporated † | | | | 101 | $ 24,401 |
| Autodesk Incorporated † | | | | 250 | 46,718 |
| Cadence Design Systems Incorporated † | | | | 318 | 51,084 |
| Ceridian HCM Holding Incorporated † | | | | 178 | 11,419 |
| Fortinet Incorporated † | | | | 752 | 36,765 |
| Intuit Incorporated | | | | 327 | 127,275 |
| Microsoft Corporation | | | | 8,650 | 2,074,443 |
| NortonLifeLock Incorporated | | | | 673 | 14,422 |
| Oracle Corporation | | | | 1,783 | 145,742 |
| Paycom Software Incorporated † | | | | 56 | 17,377 |
| PTC Incorporated | | | | 123 | 14,765 |
| Roper Technologies Incorporated | | | | 123 | 53,147 |
| Salesforce.com Incorporated † | | | | 1,160 | 153,804 |
| ServiceNow Incorporated † | | | | 234 | 90,855 |
| Synopsys Incorporated † | | | | 177 | 56,514 |
| Tyler Technologies Incorporated † | | | | 48 | 15,476 |
| | | | | | 3,115,597 |
| Technology hardware, storage & peripherals: 3.75% | | | | | |
| Apple Incorporated | | | | 17,351 | 2,254,391 |
| Hewlett Packard Enterprise Company | | | | 1,493 | 23,828 |
| HP Incorporated | | | | 1,027 | 27,595 |
| NetApp Incorporated | | | | 252 | 15,135 |
| Seagate Technology Holdings plc | | | | 223 | 11,732 |
| Western Digital Corporation | | | | 369 | 11,642 |
| | | | | | 2,344,323 |
| Materials: 1.63% | | | | | |
| Chemicals: 1.12% | | | | | |
| Air Products & Chemicals Incorporated | | | | 257 | 79,223 |
| Albemarle Corporation | | | | 136 | 29,493 |
| Celanese Corporation Series A | | | | 116 | 11,860 |
| CF Industries Holdings Incorporated | | | | 228 | 19,426 |
| Corteva Incorporated | | | | 829 | 48,729 |
| Dow Incorporated | | | | 817 | 41,169 |
| DuPont de Nemours Incorporated | | | | 576 | 39,531 |
| Eastman Chemical Company | | | | 139 | 11,320 |
| Ecolab Incorporated | | | | 288 | 41,921 |
| FMC Corporation | | | | 146 | 18,221 |
| International Flavors & Fragrances Incorporated | | | | 296 | 31,033 |
| Linde plc | | | | 574 | 187,227 |
| LyondellBasell Industries NV Class A | | | | 295 | 24,494 |
| PPG Industries Incorporated | | | | 273 | 34,327 |
| The Mosaic Company | | | | 395 | 17,329 |
| The Sherwin-Williams Company | | | | 274 | 65,028 |
| | | | | | 700,331 |
| Construction materials: 0.08% | | | | | |
| Martin Marietta Materials Incorporated | | | | 72 | 24,334 |
| Vulcan Materials Company | | | | 154 | 26,967 |
| | | | | | 51,301 |
| Containers & packaging: 0.17% | | | | | |
| Amcor plc | | | | 1,728 | 20,580 |
The accompanying notes are an integral part of these financial statements.
Allspring VT Index Asset Allocation Fund | 21
Portfolio of investments—December 31, 2022
| | | | | Shares | Value |
| Containers & packaging (continued) | | | | | |
| Avery Dennison Corporation | | | | 94 | $ 17,014 |
| Ball Corporation | | | | 364 | 18,615 |
| International Paper Company | | | | 413 | 14,302 |
| Packaging Corporation of America | | | | 107 | 13,686 |
| Sealed Air Corporation | | | | 168 | 8,380 |
| WestRock Company | | | | 295 | 10,372 |
| | | | | | 102,949 |
| Metals & mining: 0.26% | | | | | |
| Freeport-McMoRan Incorporated | | | | 1,658 | 63,004 |
| Newmont Corporation | | | | 921 | 43,471 |
| Nucor Corporation | | | | 298 | 39,279 |
| Steel Dynamics Incorporated | | | | 194 | 18,954 |
| | | | | | 164,708 |
| Real estate: 1.61% | | | | | |
| Equity REITs: 1.57% | | | | | |
| Alexandria Real Estate Equities Incorporated | | | | 173 | 25,201 |
| American Tower Corporation | | | | 540 | 114,404 |
| AvalonBay Communities Incorporated | | | | 162 | 26,166 |
| Boston Properties Incorporated | | | | 166 | 11,218 |
| Camden Property Trust | | | | 124 | 13,873 |
| Crown Castle International Corporation | | | | 502 | 68,091 |
| Digital Realty Trust Incorporated | | | | 334 | 33,490 |
| Equinix Incorporated | | | | 107 | 70,088 |
| Equity Residential | | | | 395 | 23,305 |
| Essex Property Trust Incorporated | | | | 75 | 15,894 |
| Extra Space Storage Incorporated | | | | 155 | 22,813 |
| Federal Realty Investment Trust | | | | 85 | 8,588 |
| Healthpeak Properties Incorporated | | | | 624 | 15,644 |
| Host Hotels & Resorts Incorporated | | | | 830 | 13,322 |
| Invitation Homes Incorporated | | | | 674 | 19,977 |
| Iron Mountain Incorporated | | | | 337 | 16,799 |
| Kimco Realty Corporation | | | | 718 | 15,207 |
| Mid-America Apartment Communities Incorporated | | | | 134 | 21,037 |
| Prologis Incorporated | | | | 1,071 | 120,734 |
| Public Storage Incorporated | | | | 183 | 51,275 |
| Realty Income Corporation | | | | 728 | 46,177 |
| Regency Centers Corporation | | | | 179 | 11,188 |
| SBA Communications Corporation | | | | 125 | 35,039 |
| Simon Property Group Incorporated | | | | 379 | 44,525 |
| UDR Incorporated | | | | 355 | 13,749 |
| Ventas Incorporated | | | | 464 | 20,903 |
| VICI Properties Incorporated | | | | 1,117 | 36,191 |
| Vornado Realty Trust | | | | 187 | 3,891 |
| Welltower Incorporated | | | | 548 | 35,921 |
| Weyerhaeuser Company | | | | 854 | 26,474 |
| | | | | | 981,184 |
| Real estate management & development: 0.04% | | | | | |
| CBRE Group Incorporated Class A † | | | | 367 | 28,244 |
The accompanying notes are an integral part of these financial statements.
22 | Allspring VT Index Asset Allocation Fund
Portfolio of investments—December 31, 2022
| | | | | Shares | Value |
| Utilities: 1.90% | | | | | |
| Electric utilities: 1.25% | | | | | |
| Alliant Energy Corporation | | | | 291 | $ 16,066 |
| American Electric Power Company Incorporated | | | | 596 | 56,590 |
| Constellation Energy Corporation | | | | 379 | 32,674 |
| Duke Energy Corporation | | | | 894 | 92,073 |
| Edison International | | | | 443 | 28,184 |
| Entergy Corporation | | | | 236 | 26,550 |
| Evergy Incorporated | | | | 266 | 16,739 |
| Eversource Energy | | | | 404 | 33,871 |
| Exelon Corporation | | | | 1,153 | 49,844 |
| FirstEnergy Corporation | | | | 630 | 26,422 |
| NextEra Energy Incorporated | | | | 2,306 | 192,782 |
| NRG Energy Incorporated | | | | 267 | 8,496 |
| PG&E Corporation | | | | 1,868 | 30,374 |
| Pinnacle West Capital Corporation | | | | 131 | 9,961 |
| PPL Corporation | | | | 854 | 24,954 |
| The Southern Company | | | | 1,263 | 90,191 |
| Xcel Energy Incorporated | | | | 635 | 44,520 |
| | | | | | 780,291 |
| Gas utilities: 0.03% | | | | | |
| Atmos Energy Corporation | | | | 162 | 18,155 |
| Independent power & renewable electricity producers: 0.04% | | | | | |
| AES Corporation | | | | 775 | 22,289 |
| Multi-utilities: 0.53% | | | | | |
| Ameren Corporation | | | | 300 | 26,676 |
| CenterPoint Energy Incorporated | | | | 730 | 21,893 |
| CMS Energy Corporation | | | | 337 | 21,342 |
| Consolidated Edison Incorporated | | | | 412 | 39,268 |
| Dominion Energy Incorporated | | | | 967 | 59,296 |
| DTE Energy Company | | | | 225 | 26,444 |
| NiSource Incorporated | | | | 471 | 12,915 |
| Public Service Enterprise Group Incorporated | | | | 579 | 35,475 |
| Sempra Energy | | | | 365 | 56,407 |
| WEC Energy Group Incorporated | | | | 366 | 34,316 |
| | | | | | 334,032 |
| Water utilities: 0.05% | | | | | |
| American Water Works Company Incorporated | | | | 211 | 32,161 |
| Total Common stocks (Cost $20,187,941) | | | | | 37,281,457 |
| | | Interest
rate | Maturity
date | Principal | |
| U.S. Treasury securities: 35.96% | | | | | |
| U.S. Treasury Bond | | 1.13% | 5-15-2040 | $ 199,000 | 124,546 |
| U.S. Treasury Bond | | 1.13 | 8-15-2040 | 145,000 | 90,047 |
| U.S. Treasury Bond | | 1.25 | 5-15-2050 | 60,000 | 32,290 |
| U.S. Treasury Bond | | 1.38 | 11-15-2040 | 87,000 | 56,560 |
| U.S. Treasury Bond | | 1.38 | 8-15-2050 | 151,000 | 83,905 |
| U.S. Treasury Bond | | 1.63 | 11-15-2050 | 87,000 | 51,765 |
| U.S. Treasury Bond | | 1.88 | 2-15-2041 | 208,000 | 147,014 |
| U.S. Treasury Bond | | 1.88 | 2-15-2051 | 221,000 | 140,456 |
The accompanying notes are an integral part of these financial statements.
Allspring VT Index Asset Allocation Fund | 23
Portfolio of investments—December 31, 2022
| | | Interest
rate | Maturity
date | Principal | Value |
| U.S. Treasury securities (continued) | | | | | |
| U.S. Treasury Bond | | 2.00% | 8-15-2051 | $ 629,000 | $ 411,848 |
| U.S. Treasury Bond | | 2.25 | 5-15-2041 | 201,000 | 151,103 |
| U.S. Treasury Bond | | 2.25 | 8-15-2046 | 106,000 | 75,016 |
| U.S. Treasury Bond | | 2.25 | 8-15-2049 | 108,000 | 75,921 |
| U.S. Treasury Bond | | 2.38 | 5-15-2051 | 224,000 | 160,703 |
| U.S. Treasury Bond | | 2.50 | 2-15-2045 | 116,000 | 87,331 |
| U.S. Treasury Bond | | 2.50 | 2-15-2046 | 106,000 | 79,310 |
| U.S. Treasury Bond | | 2.50 | 5-15-2046 | 105,000 | 78,328 |
| U.S. Treasury Bond | | 2.75 | 8-15-2047 | 101,000 | 78,800 |
| U.S. Treasury Bond | | 2.75 | 11-15-2047 | 100,000 | 78,004 |
| U.S. Treasury Bond | | 2.88 | 8-15-2045 | 115,000 | 92,593 |
| U.S. Treasury Bond | | 2.88 | 11-15-2046 | 154,000 | 123,399 |
| U.S. Treasury Bond | | 3.00 | 5-15-2042 | 40,000 | 33,631 |
| U.S. Treasury Bond | | 3.00 | 11-15-2044 | 114,000 | 94,086 |
| U.S. Treasury Bond | | 3.00 | 5-15-2045 | 116,000 | 95,564 |
| U.S. Treasury Bond | | 3.00 | 11-15-2045 | 115,000 | 94,596 |
| U.S. Treasury Bond | | 3.00 | 2-15-2047 | 106,000 | 86,767 |
| U.S. Treasury Bond | | 3.00 | 5-15-2047 | 104,000 | 85,077 |
| U.S. Treasury Bond | | 3.00 | 2-15-2048 | 114,000 | 93,440 |
| U.S. Treasury Bond | | 3.00 | 8-15-2048 | 121,000 | 99,362 |
| U.S. Treasury Bond | | 3.00 | 2-15-2049 | 140,000 | 115,292 |
| U.S. Treasury Bond | | 3.13 | 11-15-2041 | 37,000 | 31,972 |
| U.S. Treasury Bond | | 3.13 | 2-15-2042 | 46,000 | 39,637 |
| U.S. Treasury Bond | | 3.13 | 2-15-2043 | 79,000 | 67,397 |
| U.S. Treasury Bond | | 3.13 | 8-15-2044 | 115,000 | 97,171 |
| U.S. Treasury Bond | | 3.13 | 5-15-2048 | 123,000 | 103,373 |
| U.S. Treasury Bond | | 3.38 | 5-15-2044 | 110,000 | 96,993 |
| U.S. Treasury Bond | | 3.38 | 11-15-2048 | 135,000 | 119,085 |
| U.S. Treasury Bond | | 3.50 | 2-15-2039 | 29,000 | 27,238 |
| U.S. Treasury Bond | | 3.63 | 8-15-2043 | 88,000 | 80,898 |
| U.S. Treasury Bond | | 3.63 | 2-15-2044 | 113,000 | 103,647 |
| U.S. Treasury Bond | | 3.75 | 8-15-2041 | 36,000 | 34,142 |
| U.S. Treasury Bond | | 3.88 | 8-15-2040 | 37,000 | 36,092 |
| U.S. Treasury Bond | | 4.25 | 5-15-2039 | 31,000 | 31,928 |
| U.S. Treasury Bond | | 4.25 | 11-15-2040 | 40,000 | 40,866 |
| U.S. Treasury Bond | | 4.38 | 2-15-2038 | 18,000 | 18,846 |
| U.S. Treasury Bond | | 4.38 | 11-15-2039 | 35,000 | 36,494 |
| U.S. Treasury Bond | | 4.38 | 5-15-2040 | 35,000 | 36,403 |
| U.S. Treasury Bond | | 4.38 | 5-15-2041 | 33,000 | 34,186 |
| U.S. Treasury Bond | | 4.50 | 2-15-2036 | 26,000 | 27,744 |
| U.S. Treasury Bond | | 4.50 | 5-15-2038 | 21,000 | 22,304 |
| U.S. Treasury Bond | | 4.50 | 8-15-2039 | 33,000 | 34,992 |
| U.S. Treasury Bond | | 4.63 | 2-15-2040 | 38,000 | 40,837 |
| U.S. Treasury Bond | | 4.75 | 2-15-2037 | 13,000 | 14,201 |
| U.S. Treasury Bond | | 4.75 | 2-15-2041 | 44,000 | 47,840 |
| U.S. Treasury Bond | | 5.00 | 5-15-2037 | 17,000 | 18,986 |
| U.S. Treasury Bond | | 5.25 | 11-15-2028 | 45,000 | 47,672 |
| U.S. Treasury Bond | | 5.25 | 2-15-2029 | 33,000 | 35,032 |
| U.S. Treasury Bond | | 5.38 | 2-15-2031 | 31,000 | 34,024 |
| U.S. Treasury Bond | | 5.50 | 8-15-2028 | 35,000 | 37,442 |
| U.S. Treasury Bond | | 6.13 | 11-15-2027 | 49,000 | 53,425 |
| U.S. Treasury Bond | | 6.13 | 8-15-2029 | 25,000 | 27,941 |
| U.S. Treasury Bond | | 6.25 | 5-15-2030 | 21,000 | 23,942 |
| U.S. Treasury Bond | | 6.38 | 8-15-2027 | 21,000 | 22,987 |
| U.S. Treasury Bond | | 6.88 | 8-15-2025 | 251,000 | 266,560 |
The accompanying notes are an integral part of these financial statements.
24 | Allspring VT Index Asset Allocation Fund
Portfolio of investments—December 31, 2022
| | | Interest
rate | Maturity
date | Principal | Value |
| U.S. Treasury securities (continued) | | | | | |
| U.S. Treasury Note | | 0.13% | 12-15-2023 | $ 272,000 | $ 260,557 |
| U.S. Treasury Note | | 0.13 | 1-15-2024 | 154,000 | 146,837 |
| U.S. Treasury Note | | 0.13 | 2-15-2024 | 185,000 | 175,772 |
| U.S. Treasury Note | | 0.25 | 3-15-2024 | 185,000 | 175,381 |
| U.S. Treasury Note | | 0.25 | 5-15-2024 | 185,000 | 174,124 |
| U.S. Treasury Note | | 0.25 | 5-31-2025 | 132,000 | 119,831 |
| U.S. Treasury Note | | 0.25 | 6-30-2025 | 142,000 | 128,638 |
| U.S. Treasury Note | | 0.25 | 7-31-2025 | 147,000 | 132,650 |
| U.S. Treasury Note | | 0.25 | 8-31-2025 | 153,000 | 137,580 |
| U.S. Treasury Note | | 0.25 | 10-31-2025 | 176,000 | 157,376 |
| U.S. Treasury Note | | 0.38 | 4-15-2024 | 184,000 | 174,110 |
| U.S. Treasury Note | | 0.38 | 4-30-2025 | 126,000 | 114,995 |
| U.S. Treasury Note | | 0.38 | 11-30-2025 | 181,000 | 161,896 |
| U.S. Treasury Note | | 0.38 | 1-31-2026 | 191,000 | 169,938 |
| U.S. Treasury Note | | 0.38 | 7-31-2027 | 134,000 | 113,680 |
| U.S. Treasury Note | | 0.38 | 9-30-2027 | 155,000 | 130,672 |
| U.S. Treasury Note | | 0.50 | 3-31-2025 | 120,000 | 110,213 |
| U.S. Treasury Note | | 0.50 | 2-28-2026 | 193,000 | 171,974 |
| U.S. Treasury Note | | 0.50 | 4-30-2027 | 98,000 | 84,383 |
| U.S. Treasury Note | | 0.50 | 5-31-2027 | 111,000 | 95,165 |
| U.S. Treasury Note | | 0.50 | 6-30-2027 | 122,000 | 104,358 |
| U.S. Treasury Note | | 0.50 | 8-31-2027 | 142,000 | 120,850 |
| U.S. Treasury Note | | 0.50 | 10-31-2027 | 783,000 | 662,277 |
| U.S. Treasury Note | | 0.63 | 3-31-2027 | 81,000 | 70,286 |
| U.S. Treasury Note | | 0.63 | 11-30-2027 | 574,000 | 487,407 |
| U.S. Treasury Note | | 0.63 | 5-15-2030 | 178,000 | 140,877 |
| U.S. Treasury Note | | 0.63 | 8-15-2030 | 222,000 | 174,747 |
| U.S. Treasury Note | | 0.75 | 3-31-2026 | 191,000 | 171,191 |
| U.S. Treasury Note | | 0.75 | 4-30-2026 | 194,000 | 173,425 |
| U.S. Treasury Note | | 0.75 | 5-31-2026 | 194,000 | 173,016 |
| U.S. Treasury Note | | 0.88 | 11-15-2030 | 132,000 | 105,507 |
| U.S. Treasury Note | | 1.13 | 2-28-2025 | 118,000 | 110,150 |
| U.S. Treasury Note | | 1.13 | 2-28-2027 | 17,000 | 15,113 |
| U.S. Treasury Note | | 1.25 | 8-31-2024 | 104,000 | 98,455 |
| U.S. Treasury Note | | 1.25 | 8-15-2031 | 351,000 | 284,612 |
| U.S. Treasury Note | | 1.38 | 1-31-2025 | 105,000 | 98,684 |
| U.S. Treasury Note | | 1.38 | 8-31-2026 | 95,000 | 86,127 |
| U.S. Treasury Note | | 1.38 | 10-31-2028 | 1,300,000 | 1,122,113 |
| U.S. Treasury Note | | 1.38 | 11-15-2031 | 940,000 | 765,072 |
| U.S. Treasury Note | | 1.50 | 11-30-2024 | 477,000 | 451,361 |
| U.S. Treasury Note | | 1.50 | 8-15-2026 | 102,000 | 92,971 |
| U.S. Treasury Note | | 1.50 | 1-31-2027 | 98,000 | 88,479 |
| U.S. Treasury Note | | 1.50 | 2-15-2030 | 209,000 | 178,107 |
| U.S. Treasury Note | | 1.63 | 2-15-2026 | 168,000 | 155,374 |
| U.S. Treasury Note | | 1.63 | 5-15-2026 | 105,000 | 96,637 |
| U.S. Treasury Note | | 1.63 | 10-31-2026 | 94,000 | 85,801 |
| U.S. Treasury Note | | 1.63 | 11-30-2026 | 97,000 | 88,456 |
| U.S. Treasury Note | | 1.63 | 8-15-2029 | 157,000 | 136,240 |
| U.S. Treasury Note | | 1.75 | 6-30-2024 | 106,000 | 101,578 |
| U.S. Treasury Note | | 1.75 | 7-31-2024 | 110,000 | 105,218 |
| U.S. Treasury Note | | 1.75 | 12-31-2026 | 99,000 | 90,635 |
| U.S. Treasury Note | | 1.75 | 11-15-2029 | 178,000 | 155,173 |
| U.S. Treasury Note | | 1.88 | 8-31-2024 | 125,000 | 119,561 |
| U.S. Treasury Note | | 1.88 | 6-30-2026 | 98,000 | 90,922 |
| U.S. Treasury Note | | 1.88 | 7-31-2026 | 99,000 | 91,560 |
The accompanying notes are an integral part of these financial statements.
Allspring VT Index Asset Allocation Fund | 25
Portfolio of investments—December 31, 2022
| | | Interest
rate | Maturity
date | Principal | Value |
| U.S. Treasury securities (continued) | | | | | |
| U.S. Treasury Note | | 1.88% | 11-15-2051 | $ 105,000 | $ 66,503 |
| U.S. Treasury Note | | 2.00 | 4-30-2024 | 123,000 | 118,676 |
| U.S. Treasury Note | | 2.00 | 5-31-2024 | 123,000 | 118,508 |
| U.S. Treasury Note | | 2.00 | 6-30-2024 | 123,000 | 118,296 |
| U.S. Treasury Note | | 2.00 | 2-15-2025 | 289,000 | 274,979 |
| U.S. Treasury Note | | 2.00 | 8-15-2025 | 220,000 | 207,737 |
| U.S. Treasury Note | | 2.00 | 11-15-2026 | 170,000 | 157,177 |
| U.S. Treasury Note | | 2.13 | 2-29-2024 | 128,000 | 124,265 |
| U.S. Treasury Note | | 2.13 | 3-31-2024 | 127,000 | 123,031 |
| U.S. Treasury Note | | 2.13 | 7-31-2024 | 123,000 | 118,306 |
| U.S. Treasury Note | | 2.13 | 11-30-2024 | 119,000 | 113,910 |
| U.S. Treasury Note | | 2.13 | 5-15-2025 | 234,000 | 222,364 |
| U.S. Treasury Note | | 2.13 | 5-31-2026 | 97,000 | 90,763 |
| U.S. Treasury Note | | 2.25 | 12-31-2023 | 127,000 | 123,871 |
| U.S. Treasury Note | | 2.25 | 1-31-2024 | 127,000 | 123,651 |
| U.S. Treasury Note | | 2.25 | 4-30-2024 | 120,000 | 116,194 |
| U.S. Treasury Note | | 2.25 | 10-31-2024 | 121,000 | 116,217 |
| U.S. Treasury Note | | 2.25 | 11-15-2024 | 290,000 | 278,525 |
| U.S. Treasury Note | | 2.25 | 12-31-2024 | 33,000 | 31,626 |
| U.S. Treasury Note | | 2.25 | 11-15-2025 | 219,000 | 207,280 |
| U.S. Treasury Note | | 2.25 | 3-31-2026 | 99,000 | 93,296 |
| U.S. Treasury Note | | 2.25 | 2-15-2027 | 196,000 | 182,395 |
| U.S. Treasury Note | | 2.25 | 8-15-2027 | 101,000 | 93,429 |
| U.S. Treasury Note | | 2.25 | 11-15-2027 | 99,000 | 91,227 |
| U.S. Treasury Note | | 2.38 | 2-29-2024 | 34,000 | 33,114 |
| U.S. Treasury Note | | 2.38 | 8-15-2024 | 289,000 | 278,840 |
| U.S. Treasury Note | | 2.38 | 4-30-2026 | 98,000 | 92,572 |
| U.S. Treasury Note | | 2.38 | 5-15-2027 | 164,000 | 152,898 |
| U.S. Treasury Note | | 2.38 | 5-15-2029 | 90,000 | 81,816 |
| U.S. Treasury Note | | 2.50 | 1-31-2024 | 103,000 | 100,566 |
| U.S. Treasury Note | | 2.50 | 5-15-2024 | 281,000 | 272,746 |
| U.S. Treasury Note | | 2.50 | 1-31-2025 | 116,000 | 111,596 |
| U.S. Treasury Note | | 2.50 | 2-28-2026 | 97,000 | 92,131 |
| U.S. Treasury Note | | 2.63 | 12-31-2023 | 97,000 | 95,008 |
| U.S. Treasury Note | | 2.63 | 3-31-2025 | 114,000 | 109,832 |
| U.S. Treasury Note | | 2.63 | 12-31-2025 | 97,000 | 92,756 |
| U.S. Treasury Note | | 2.63 | 1-31-2026 | 95,000 | 90,770 |
| U.S. Treasury Note | | 2.63 | 2-15-2029 | 181,000 | 167,284 |
| U.S. Treasury Note | | 2.75 | 2-15-2024 | 217,000 | 212,304 |
| U.S. Treasury Note | | 2.75 | 2-28-2025 | 121,000 | 116,916 |
| U.S. Treasury Note | | 2.75 | 6-30-2025 | 119,000 | 114,640 |
| U.S. Treasury Note | | 2.75 | 8-31-2025 | 122,000 | 117,268 |
| U.S. Treasury Note | | 2.75 | 2-15-2028 | 189,000 | 177,712 |
| U.S. Treasury Note | | 2.75 | 8-15-2032 | 680,000 | 619,225 |
| U.S. Treasury Note | | 2.88 | 4-30-2025 | 114,000 | 110,317 |
| U.S. Treasury Note | | 2.88 | 5-31-2025 | 117,000 | 113,111 |
| U.S. Treasury Note | | 2.88 | 7-31-2025 | 118,000 | 113,994 |
| U.S. Treasury Note | | 2.88 | 11-30-2025 | 96,000 | 92,370 |
| U.S. Treasury Note | | 2.88 | 5-15-2028 | 178,000 | 167,953 |
| U.S. Treasury Note | | 2.88 | 8-15-2028 | 190,000 | 178,919 |
| U.S. Treasury Note | | 3.00 | 10-31-2025 | 76,000 | 73,399 |
| U.S. Treasury Note | | 3.13 | 11-15-2028 | 226,000 | 215,556 |
| U.S. Treasury Note | | 6.00 | 2-15-2026 | 42,000 | 44,157 |
| U.S. Treasury Note | | 6.50 | 11-15-2026 | 28,000 | 30,326 |
| U.S. Treasury Note | | 6.63 | 2-15-2027 | 18,000 | 19,668 |
The accompanying notes are an integral part of these financial statements.
26 | Allspring VT Index Asset Allocation Fund
Portfolio of investments—December 31, 2022
| | | Interest
rate | Maturity
date | Principal | Value |
| U.S. Treasury securities (continued) | | | | | |
| U.S. Treasury Note | | 6.75% | 8-15-2026 | $ 21,000 | $ 22,803 |
| U.S. Treasury Note | | 7.63 | 2-15-2025 | 20,000 | 21,272 |
| Total U.S. Treasury securities (Cost $25,131,389) | | | | | 22,483,228 |
| | | Yield | | Shares | |
| Short-term investments: 3.58% | | | | | |
| Investment companies: 3.58% | | | | | |
| Allspring Government Money Market Fund Select Class ♠∞ | | 4.09 | | 2,238,925 | 2,238,925 |
| Total Short-term investments (Cost $2,238,925) | | | | | 2,238,925 |
| Total investments in securities (Cost $47,558,255) | 99.16% | | | | 62,003,610 |
| Other assets and liabilities, net | 0.84 | | | | 524,158 |
| Total net assets | 100.00% | | | | $62,527,768 |
| † | Non-income-earning security |
| ♠ | The issuer of the security is an affiliated person of the Fund as defined in the Investment Company Act of 1940. |
| ∞ | The rate represents the 7-day annualized yield at period end. |
| Abbreviations: |
| REIT | Real estate investment trust |
Investments in affiliates
An affiliated investment is an investment in which the Fund owns at least 5% of the outstanding voting shares of the issuer or as a result of other relationships, such as the Fund and the issuer having the same investment manager. Transactions with issuers that were affiliates of the Fund at the end of the period were as follows:
| | Value,
beginning of
period | Purchases | Sales
proceeds | Net
realized
gains
(losses) | Net
change in
unrealized
gains
(losses) | Value,
end of
period | Shares,
end
of period | Income
from
affiliated
securities |
| Short-term investments | | | | | | | |
| Allspring Government Money Market Fund Select Class | $737,613 | $13,026,479 | $(11,525,167) | $0 | $0 | $2,238,925 | 2,238,925 | $30,532 |
Futures contracts
| Description | Number of
contracts | Expiration
date | Notional
cost | Notional
value | Unrealized
gains | | Unrealized
losses |
| Long | | | | | | | |
| Micro E-Mini S&P 500 Index | 15 | 3-17-2023 | $ 293,705 | $ 289,575 | $ 0 | | $ (4,130) |
| 10-Year U.S. Treasury Notes | 86 | 3-22-2023 | 9,686,413 | 9,657,531 | 0 | | (28,882) |
| U.S. Long Term Bonds | 1 | 3-22-2023 | 125,307 | 125,343 | 36 | | 0 |
| 2-Year U.S. Treasury Notes | 1 | 3-31-2023 | 204,807 | 205,078 | 271 | | 0 |
| 5-Year U.S. Treasury Notes | 6 | 3-31-2023 | 649,063 | 647,578 | 0 | | (1,485) |
| Short | | | | | | | |
| U.S. Ultra Treasury Bonds | (22) | 3-22-2023 | (2,948,168) | (2,954,875) | 0 | | (6,707) |
| | | | | | $307 | | $(41,204) |
The accompanying notes are an integral part of these financial statements.
Allspring VT Index Asset Allocation Fund | 27
Statement of assets and liabilities—December 31, 2022
| | |
| Assets | |
Investments in unaffiliated securities, at value (cost $45,319,330)
| $ 59,764,685 |
Investments in affiliated securities, at value (cost $2,238,925)
| 2,238,925 |
Cash
| 220 |
Cash at broker segregated for futures contracts
| 434,731 |
Receivable for dividends and interest
| 176,002 |
Receivable for Fund shares sold
| 18,197 |
Total assets
| 62,632,760 |
| Liabilities | |
Payable for Fund shares redeemed
| 34,026 |
Management fee payable
| 24,985 |
Distribution fee payable
| 14,162 |
Custody and accounting fees payable
| 13,824 |
Shareholder report expenses payable
| 9,130 |
Administration fee payable
| 4,616 |
Payable for daily variation margin on open futures contracts
| 3,013 |
Accrued expenses and other liabilities
| 1,236 |
Total liabilities
| 104,992 |
Total net assets
| $62,527,768 |
| Net assets consist of | |
Paid-in capital
| $ 47,444,526 |
Total distributable earnings
| 15,083,242 |
Total net assets
| $62,527,768 |
| Computation of net asset value per share | |
Net assets - Class 2
| $ 62,527,768 |
Share outstanding - Class 21
| 3,752,404 |
Net asset value per share - Class 2
| $16.66 |
| 1 | The Fund has an unlimited number of authorized shares. |
The accompanying notes are an integral part of these financial statements.
28 | Allspring VT Index Asset Allocation Fund
Statement of operations—year ended December 31, 2022
| | |
| Investment income | |
Dividends (net of foreign withholdings taxes of $161)
| $ 683,555 |
Interest
| 479,563 |
Income from affiliated securities
| 30,532 |
Total investment income
| 1,193,650 |
| Expenses | |
Management fee
| 416,198 |
Administration fee - Class 2
| 55,493 |
Distribution fee - Class 2
| 167,137 |
Custody and accounting fees
| 27,374 |
Professional fees
| 47,031 |
Shareholder report expenses
| 36,624 |
Trustees’ fees and expenses
| 21,078 |
Other fees and expenses
| 25,156 |
Total expenses
| 796,091 |
| Less: Fee waivers and/or expense reimbursements | |
Fund-level
| (102,212) |
Net expenses
| 693,879 |
Net investment income
| 499,771 |
| Realized and unrealized gains (losses) on investments | |
| Net realized gains (losses) on | |
Unaffiliated securities
| 2,683,051 |
Futures contracts
| (729,261) |
Net realized gains on investments
| 1,953,790 |
| Net change in unrealized gains (losses) on | |
Unaffiliated securities
| (16,055,044) |
Futures contracts
| (115,027) |
Net change in unrealized gains (losses) on investments
| (16,170,071) |
Net realized and unrealized gains (losses) on investments
| (14,216,281) |
Net decrease in net assets resulting from operations
| $(13,716,510) |
The accompanying notes are an integral part of these financial statements.
Allspring VT Index Asset Allocation Fund | 29
Statement of changes in net assets
| | | | | |
| | Year ended
December 31, 2022 | Year ended
December 31, 2021 |
| Operations | | | | |
Net investment income
| | $ 499,771 | | $ 372,368 |
Net realized gains on investments
| | 1,953,790 | | 8,285,341 |
Net change in unrealized gains (losses) on investments
| | (16,170,071) | | 3,385,077 |
Net increase (decrease) in net assets resulting from operations
| | (13,716,510) | | 12,042,786 |
| Distributions to shareholders from | | | | |
Net investment income and net realized gains - Class 2
| | (8,395,776) | | (8,048,930) |
| Capital share transactions | Shares | | Shares | |
Proceeds from shares sold - Class 2
| 49,560 | 962,547 | 70,413 | 1,564,527 |
Reinvestment of distributions - Class 2
| 483,089 | 8,395,776 | 371,846 | 8,048,930 |
Payment for shares redeemed - Class 2
| (406,491) | (7,787,408) | (416,528) | (9,329,422) |
Net increase in net assets resulting from capital share transactions
| | 1,570,915 | | 284,035 |
Total increase (decrease) in net assets
| | (20,541,371) | | 4,277,891 |
| Net assets | | | | |
Beginning of period
| | 83,069,139 | | 78,791,248 |
End of period
| | $ 62,527,768 | | $83,069,139 |
The accompanying notes are an integral part of these financial statements.
30 | Allspring VT Index Asset Allocation Fund
Financial highlights
(For a share outstanding throughout each period)
| | Year ended December 31 |
| Class 2 | 2022 | 2021 | 2020 | 2019 | 2018 |
Net asset value, beginning of period
| $22.91 | $21.88 | $20.55 | $18.42 | $20.45 |
Net investment income
| 0.14 | 0.10 | 0.16 | 0.22 | 0.20 |
Net realized and unrealized gains (losses) on investments
| (3.95) | 3.25 | 3.04 | 3.42 | (0.70) |
Total from investment operations
| (3.81) | 3.35 | 3.20 | 3.64 | (0.50) |
| Distributions to shareholders from | | | | | |
Net investment income
| (0.12) | (0.13) | (0.17) | (0.22) | (0.20) |
Net realized gains
| (2.32) | (2.19) | (1.70) | (1.29) | (1.33) |
Total distributions to shareholders
| (2.44) | (2.32) | (1.87) | (1.51) | (1.53) |
Net asset value, end of period
| $16.66 | $22.91 | $21.88 | $20.55 | $18.42 |
Total return1
| (17.02)% | 16.00% | 16.59% | 20.16% | (2.90)% |
| Ratios to average net assets (annualized) | | | | | |
Gross expenses
| 1.15% | 1.13% | 1.14% | 1.05% | 1.05% |
Net expenses
| 1.00% | 1.00% | 1.00% | 1.00% | 1.00% |
Net investment income
| 0.72% | 0.46% | 0.78% | 1.07% | 0.94% |
| Supplemental data | | | | | |
Portfolio turnover rate
| 9% | 7% | 21% | 4% | 10% |
Net assets, end of period (000s omitted)
| $62,528 | $83,069 | $78,791 | $72,193 | $68,851 |
| 1 | Returns do not reflect fees and expenses charged pursuant to the terms of variable life insurance policies and variable annuity contracts. |
The accompanying notes are an integral part of these financial statements.
Allspring VT Index Asset Allocation Fund | 31
Notes to financial statements
1. ORGANIZATION
Allspring Variable Trust (the "Trust"), a Delaware statutory trust organized on March 10, 1999, is an open-end management investment company registered under the Investment Company Act of 1940, as amended (the "1940 Act"). As an investment company, the Trust follows the accounting and reporting guidance in Financial Accounting Standards Board ("FASB") Accounting Standards Codification Topic 946, Financial Services – Investment Companies. These financial statements report on the Allspring VT Index Asset Allocation Fund (the "Fund") which is a diversified series of the Trust. The Trust offers shares of the Fund to separate accounts of various life insurance companies as funding vehicles for certain variable annuity contracts and variable life insurance policies.
2. SIGNIFICANT ACCOUNTING POLICIES
The following significant accounting policies, which are consistently followed in the preparation of the financial statements of the Fund, are in conformity with U.S. generally accepted accounting principles which require management to make estimates and assumptions that affect the reported amounts of assets and liabilities, disclosure of contingent assets and liabilities at the date of the financial statements, and the reported amounts of income and expenses during the reporting period. Actual results could differ from those estimates.
Securities valuation
All investments are valued each business day as of the close of regular trading on the New York Stock Exchange (generally 4 p.m. Eastern Time), although the Fund may deviate from this calculation time under unusual or unexpected circumstances.
Equity securities and futures contracts that are listed on a foreign or domestic exchange or market are valued at the official closing price or, if none, the last sales price.
Debt securities are valued at the evaluated bid price provided by an independent pricing service (e.g. taking into account various factors, including yields, maturities, or credit ratings) or, if a reliable price is not available, the quoted bid price from an independent broker-dealer.
Investments in registered open-end investment companies (other than those listed on a foreign or domestic exchange or market) are valued at net asset value. Interests in non-registered investment companies that are redeemable at net asset value are fair valued normally at net asset value.
Investments which are not valued using the methods discussed above are valued at their fair value, as determined in good faith by Allspring Funds Management, LLC ("Allspring Funds Management"), which was named the valuation designee by the Board of Trustees. As the valuation designee, Allspring Funds Management is responsible for day-to-day valuation activities for the Allspring Funds. In connection with these responsibilities, Allspring Funds Management has established a Valuation Committee and has delegated to it the authority to take any actions regarding the valuation of portfolio securities that the Valuation Committee deems necessary or appropriate, including determining the fair value of portfolio securities. On a quarterly basis, the Board of Trustees receives reports of valuation actions taken by the Valuation Committee. On at least an annual basis, the Board of Trustees receives an assessment of the adequacy and effectiveness of Allspring Funds Management's process for determining the fair value of the portfolio of investments.
Securities lending
The Fund may lend its securities from time to time in order to earn additional income in the form of fees or interest on securities received as collateral or the investment of any cash received as collateral. When securities are on loan, the Fund receives interest or dividends on those securities. Cash collateral received in connection with its securities lending transactions is invested in Securities Lending Cash Investments, LLC (the "Securities Lending Fund"), an affiliated non-registered investment company. Investments in Securities Lending Fund are valued at the evaluated bid price provided by an independent pricing service. Income earned from investment in the Securities Lending Fund (net of fees and rebates), if any, is included in income from affiliated securities on the Statement of Operations.
In a securities lending transaction, the net asset value of the Fund is affected by an increase or decrease in the value of the securities loaned and by an increase or decrease in the value of the instrument in which collateral is invested. The amount of securities lending activity undertaken by the Fund fluctuates from time to time. The Fund has the right under the lending agreement to recover the securities from the borrower on demand. In the event of default or bankruptcy by the borrower, the Fund may be prevented from recovering the loaned securities or gaining access to the collateral or may experience delays or costs in doing so. In such an event, the terms of the agreement allow the unaffiliated securities lending agent to use the collateral to purchase replacement securities on behalf of the Fund or pay the Fund the market value of the loaned securities. The Fund bears the risk of loss with respect to depreciation of its investment of the cash collateral.
32 | Allspring VT Index Asset Allocation Fund
Notes to financial statements
Futures contracts
Futures contracts are agreements between the Fund and a counterparty to buy or sell a specific amount of a commodity, financial instrument or currency at a specified price on a specified date. The Fund may buy and sell futures contracts in order to gain exposure to, or protect against, changes in interest rates and security values and is subject to interest rate risk and equity price risk. The primary risks associated with the use of futures contracts are the imperfect correlation between changes in market values of securities held by the Fund and the prices of futures contracts, and the possibility of an illiquid market. Futures contracts are generally entered into on a regulated futures exchange and cleared through a clearinghouse associated with the exchange. With futures contracts, there is minimal counterparty risk to the Fund since futures contracts are exchange traded and the exchange’s clearinghouse, as the counterparty to all exchange-traded futures, guarantees the futures contracts against default.
Upon entering into a futures contract, the Fund is required to deposit either cash or securities (initial margin) with the broker in an amount equal to a certain percentage of the contract value. Subsequent payments (variation margin) are paid to or from the broker each day equal to the daily changes in the contract value. Such payments are recorded as unrealized gains or losses and, if any, shown as variation margin receivable (payable) in the Statement of Assets and Liabilities. Should the Fund fail to make requested variation margin payments, the broker can gain access to the initial margin to satisfy the Fund’s payment obligations. When the contracts are closed, a realized gain or loss is recorded in the Statement of Operations.
Security transactions and income recognition
Securities transactions are recorded on a trade date basis. Realized gains or losses are recorded on the basis of identified cost.
Dividend income is recognized on the ex-dividend date.
Interest income is accrued daily and bond discounts are accreted and premiums are amortized daily. To the extent debt obligations are placed on non-accrual status, any related interest income may be reduced by writing off interest receivables when the collection of all or a portion of interest has been determined to be doubtful based on consistently applied procedures and the fair value has decreased. If the issuer subsequently resumes interest payments or when the collectability of interest is reasonably assured, the debt obligation is removed from non-accrual status.
Income is recorded net of foreign taxes withheld where recovery of such taxes is not assured.
Distributions to shareholders
Distributions to shareholders are recorded on the ex-dividend date and paid from net investment income quarterly and any net realized gains are paid at least annually. Such distributions are determined in accordance with income tax regulations and may differ from U.S. generally accepted accounting principles. Dividend sources are estimated at the time of declaration. The tax character of distributions is determined as of the Fund's fiscal year end. Therefore, a portion of the Fund's distributions made prior to the Fund’s fiscal year end may be categorized as a tax return of capital at year end.
Federal and other taxes
The Fund intends to continue to qualify as a regulated investment company by distributing substantially all of its investment company taxable income and any net realized capital gains (after reduction for capital loss carryforwards) sufficient to relieve it from all, or substantially all, federal income taxes. Accordingly, no provision for federal income taxes was required.
The Fund’s income and federal excise tax returns and all financial records supporting those returns for the prior three fiscal years are subject to examination by the federal and Delaware revenue authorities. Management has analyzed the Fund's tax positions taken on federal, state, and foreign tax returns, as applicable, for all open tax years and does not believe that there are any uncertain tax positions that require recognition of a tax liability.
As of December 31, 2022, the aggregate cost of all investments for federal income tax purposes was $48,961,346 and the unrealized gains (losses) consisted of:
| Gross unrealized gains | $16,812,615 |
| Gross unrealized losses | (3,811,248) |
| Net unrealized gains | $13,001,367 |
Allspring VT Index Asset Allocation Fund | 33
Notes to financial statements
3. FAIR VALUATION MEASUREMENTS
Fair value measurements of investments are determined within a framework that has established a fair value hierarchy based upon the various data inputs utilized in determining the value of the Fund’s investments. The three-level hierarchy gives the highest priority to unadjusted quoted prices in active markets for identical assets or liabilities (Level 1) and the lowest priority to unobservable inputs (Level 3). The Fund’s investments are classified within the fair value hierarchy based on the lowest level of input that is significant to the fair value measurement. The inputs are summarized into three broad levels as follows:
| ■ | Level 1 – quoted prices in active markets for identical securities |
| ■ | Level 2 – other significant observable inputs (including quoted prices for similar securities, interest rates, prepayment speeds, credit risk, etc.) |
| ■ | Level 3 – significant unobservable inputs (including the Fund’s own assumptions in determining the fair value of investments) |
The inputs or methodologies used for valuing investments in securities are not necessarily an indication of the risk associated with investing in those securities.
The following is a summary of the inputs used in valuing the Fund’s assets and liabilities as of December 31, 2022:
| | Quoted prices
(Level 1) | Other significant
observable inputs
(Level 2) | Significant
unobservable inputs
(Level 3) | Total |
| Assets | | | | |
| Investments in: | | | | |
| Common stocks | | | | |
| Communication services | $ 2,714,012 | $0 | $0 | $ 2,714,012 |
| Consumer discretionary | 3,650,064 | 0 | 0 | 3,650,064 |
| Consumer staples | 2,684,985 | 0 | 0 | 2,684,985 |
| Energy | 1,949,403 | 0 | 0 | 1,949,403 |
| Financials | 4,348,435 | 0 | 0 | 4,348,435 |
| Health care | 5,897,546 | 0 | 0 | 5,897,546 |
| Industrials | 3,226,069 | 0 | 0 | 3,226,069 |
| Information technology | 9,595,298 | 0 | 0 | 9,595,298 |
| Materials | 1,019,289 | 0 | 0 | 1,019,289 |
| Real estate | 1,009,428 | 0 | 0 | 1,009,428 |
| Utilities | 1,186,928 | 0 | 0 | 1,186,928 |
| U.S. Treasury securities | 22,483,228 | 0 | 0 | 22,483,228 |
| Short-term investments | | | | |
| Investment companies | 2,238,925 | 0 | 0 | 2,238,925 |
| | 62,003,610 | 0 | 0 | 62,003,610 |
| Futures contracts | 307 | 0 | 0 | 307 |
| Total assets | $62,003,917 | $0 | $0 | $62,003,917 |
| Liabilities | | | | |
| Futures contracts | $ 41,204 | $0 | $0 | $ 41,204 |
| Total liabilities | $ 41,204 | $0 | $0 | $ 41,204 |
Futures contracts are reported at their cumulative unrealized gains (losses) at measurement date as reported in the table following the Portfolio of Investments. For futures contracts, the current day’s variation margin is reported on the Statement of Assets and Liabilities. All other assets and liabilities are reported at their market value at measurement date.
Additional sector, industry or geographic detail, if any, is included in the Portfolio of Investments.
For the year ended December 31, 2022, the Fund did not have any transfers into/out of Level 3.
34 | Allspring VT Index Asset Allocation Fund
Notes to financial statements
4. TRANSACTIONS WITH AFFILIATES
Management fee
Allspring Funds Management, a wholly owned subsidiary of Allspring Global Investments Holdings, LLC, a holding company indirectly owned by certain private funds of GTCR LLC and Reverence Capital Partners, L.P., is the manager of the Fund and provides advisory and fund-level administrative services under an investment management agreement. Under the investment management agreement, Allspring Funds Management is responsible for, among other services, implementing the investment objectives and strategies of the Fund, supervising the subadviser and providing fund-level administrative services in connection with the Fund’s operations. As compensation for its services under the investment management agreement, Allspring Funds Management is entitled to receive a management fee at the following annual rate based on the Fund’s average daily net assets:
| Average daily net assets | Management fee |
| First $500 million | 0.600% |
| Next $500 million | 0.550 |
| Next $2 billion | 0.500 |
| Next $2 billion | 0.475 |
| Next $5 billion | 0.440 |
| Over $10 billion | 0.430 |
For the year ended December 31, 2022, the management fee was equivalent to an annual rate of 0.60% of the Fund’s average daily net assets.
Allspring Funds Management has retained the services of a subadviser to provide daily portfolio management to the Fund. The fee for subadvisory services is borne by Allspring Funds Management. Allspring Global Investments, LLC ("Allspring Investments"), an affiliate of Allspring Funds Management and a wholly owned subsidiary of Allspring Global Investments Holdings, LLC, is the subadviser to the Fund and is entitled to receive a fee from Allspring Funds Management at an annual rate starting at 0.15% and declining to 0.10% as the average daily net assets of the Fund increase.
Administration fee
Under a class-level administration agreement, Allspring Funds Management provides class-level administrative services to the Fund, which includes paying fees and expenses for services provided by the transfer agent, sub-transfer agents, omnibus account servicers and record-keepers. As compensation for its services under the class-level administration agreement, Allspring Funds Management receives an annual fee of 0.08% which is calculated based on the average daily net assets of Class 2 shares.
Waivers and/or expense reimbursements
Allspring Funds Management has contractually committed through April 30, 2023 to waive fees and/or reimburse management and administration fees to the extent necessary to cap the Fund’s expenses at 1.00% for Class 2 shares. Prior to or after the commitment expiration date, the cap may be increased or the commitment to maintain the cap may be terminated only with the approval of the Board of Trustees.
Distribution fee
The Trust has adopted a distribution plan for Class 2 shares pursuant to Rule 12b-1 under the 1940 Act. A distribution fee is charged to Class 2 shares and paid to Allspring Funds Distributor, LLC, the principal underwriter, an affiliate of Allspring Funds Management, at an annual rate up to 0.25% of the average daily net assets of Class 2 shares.
Interfund transactions
The Fund may purchase or sell portfolio investment securities to certain affiliates pursuant to Rule 17a-7 under the 1940 Act and under procedures adopted by the Board of Trustees. The procedures have been designed to ensure that these interfund transactions, which do not incur broker commissions, are effected at current market prices.
Allspring VT Index Asset Allocation Fund | 35
Notes to financial statements
5. INVESTMENT PORTFOLIO TRANSACTIONS
Purchases and sales of investments, excluding short-term securities, for the year ended December 31, 2022 were as follows:
| Purchases at cost | | Sales proceeds |
U.S.
government | Non-U.S.
government | | U.S.
government | Non-U.S.
government |
| $4,835,002 | $1,546,918 | | $8,916,137 | $4,678,432 |
6. SECURITIES LENDING TRANSACTIONS
The Fund lends its securities through an unaffiliated securities lending agent and receives collateral in the form of cash or securities with a value at least equal to the value of the securities on loan. The value of the loaned securities is determined at the close of each business day and any increases or decreases in the required collateral are exchanged between the Fund and the counterparty on the next business day. Cash collateral received is invested in the Securities Lending Fund which seeks to provide a positive return compared to the daily Federal Funds Open Rate by investing in high-quality, U.S. dollar-denominated short-term money market instruments and is exempt from registration under Section 3(c)(7) of the 1940 Act. Securities Lending Fund is managed by Allspring Funds Management and is subadvised by Allspring Investments. Allspring Funds Management receives an advisory fee starting at 0.05% and declining to 0.01% as the average daily net assets of the Securities Lending Fund increase. All of the fees received by Allspring Funds Management are paid to Allspring Investments for its services as subadviser.
In the event of counterparty default or the failure of a borrower to return a loaned security, the Fund has the right to use the collateral to offset any losses incurred. As of December 31, 2022, the Fund did not have any securities on loan.
7. DERIVATIVE TRANSACTIONS
During the year ended December 31, 2022, the Fund entered into futures contracts to manage market exposure to certain asset classes consistent with an active asset allocation strategy. The Fund had an average notional amount of $11,669,203 in long futures contracts and $6,044,929 in short futures contracts during the year ended December 31, 2022.
The fair value of derivative instruments as of December 31, 2022 by primary risk type was as follows for the Fund:
| | Asset derivatives | | Liability derivatives |
| | Statement of Assets and Liabilities location | Fair value | | Statement of Assets and Liabilities location | Fair value |
| Interest rate risk | Unrealized gains on futures contracts | $307* | | Unrealized losses on futures contracts | $ 37,074* |
| Equity risk | Unrealized gains on futures contracts | 0* | | Unrealized losses on futures contracts | 4,130* |
| | | $307 | | | $41,204 |
* Amount represents the cumulative unrealized gains (losses) as reported in the table following the Portfolio of Investments. For futures contracts, only the current day's variation margin as of December 31, 2022 is reported separately on the Statement of Assets and Liabilities.
The effect of derivative instruments on the Statement of Operations for the year ended December 31, 2022 was as follows:
| | Net realized
gains (losses) on
derivatives | Net change in unrealized
gains (losses) on
derivatives |
| Interest rate risk | $ (34,614) | $ (46,999) |
| Equity risk | (694,647) | (68,028) |
| | $(729,261) | $(115,027) |
8. BANK BORROWINGS
The Trust, Allspring Master Trust and Allspring Funds Trust (excluding the money market funds) are parties to a $350,000,000 revolving credit agreement whereby the Fund is permitted to use bank borrowings for temporary or emergency purposes, such as to fund shareholder redemption requests. Interest under the credit agreement is charged to the Fund based on a borrowing
36 | Allspring VT Index Asset Allocation Fund
Notes to financial statements
rate equal to the higher of the Federal Funds rate or the overnight bank funding rate in effect on that day plus a spread. In addition, an annual commitment fee equal based on the unused balance is allocated to each participating fund.
For the year ended December 31, 2022, there were no borrowings by the Fund under the agreement.
9. DISTRIBUTIONS TO SHAREHOLDERS
The tax character of distributions paid during the years ended December 31, 2022 and December 31, 2021 were as follows:
| | Year ended December 31 |
| | 2022 | 2021 |
| Ordinary income | $ 935,859 | $1,113,680 |
| Long-term capital gain | 7,459,917 | 6,935,250 |
As of December 31, 2022, the components of distributable earnings on a tax basis were as follows:
Undistributed
ordinary
income | Undistributed
long-term
gain | Unrealized
gains |
| $79,523 | $2,002,352 | $13,001,367 |
10. CONCENTRATION RISKS
As of the end of the period, the Fund concentrated its portfolio of investments in the information technology sector. A fund that invests a substantial portion of its assets in any sector may be more affected by changes in that sector than would be a fund whose investments are not heavily weighted in any sector.
11. MARKET RISKS
On March 11, 2020, the World Health Organization announced that it had made the assessment that coronavirus disease 2019 (“COVID-19”) is a pandemic. The impacts of COVID-19 are affecting the entire global economy, individual companies and investment products, the funds, and the market in general. There is significant uncertainty around the extent and duration of business disruptions related to COVID-19 and the impacts may last for an extended period of time. COVID-19 has led to significant uncertainty and volatility in the financial markets.
12. INDEMNIFICATION
Under the Fund's organizational documents, the officers and Trustees have been granted certain indemnification rights against certain liabilities that may arise out of performance of their duties to the Fund. The Fund has entered into a separate agreement with each Trustee that converts indemnification rights currently existing under the Fund’s organizational documents into contractual rights that cannot be changed in the future without the consent of the Trustee. Additionally, in the normal course of business, the Fund may enter into contracts with service providers that contain a variety of indemnification clauses. The Fund’s maximum exposure under these arrangements is dependent on future claims that may be made against the Fund and, therefore, cannot be estimated.
Allspring VT Index Asset Allocation Fund | 37
Report of independent registered public accounting firm
To the Shareholders of the Fund and Board of Trustees
Allspring Variable Trust:
Opinion on the Financial Statements
We have audited the accompanying statement of assets and liabilities of Allspring VT Index Asset Allocation Fund (the Fund), one of the funds constituting Allspring Variable Trust, including the portfolio of investments, as of December 31, 2022, the related statement of operations for the year then ended, the statements of changes in net assets for each of the years in the two-year period then ended, and the related notes (collectively, the financial statements) and the financial highlights for each of the years in the five-year period then ended. In our opinion, the financial statements and financial highlights present fairly, in all material respects, the financial position of the Fund as of December 31, 2022, the results of its operations for the year then ended, the changes in its net assets for each of the years in the two-year period then ended, and the financial highlights for each of the years in the five-year period then ended, in conformity with U.S. generally accepted accounting principles.
Basis for Opinion
These financial statements and financial highlights are the responsibility of the Fund’s management. Our responsibility is to express an opinion on these financial statements and financial highlights based on our audits. We are a public accounting firm registered with the Public Company Accounting Oversight Board (United States) (PCAOB) and are required to be independent with respect to the Fund in accordance with the U.S. federal securities laws and the applicable rules and regulations of the Securities and Exchange Commission and the PCAOB.
We conducted our audits in accordance with the standards of the PCAOB. Those standards require that we plan and perform the audit to obtain reasonable assurance about whether the financial statements and financial highlights are free of material misstatement, whether due to error or fraud. Our audits included performing procedures to assess the risks of material misstatement of the financial statements and financial highlights, whether due to error or fraud, and performing procedures that respond to those risks. Such procedures included examining, on a test basis, evidence regarding the amounts and disclosures in the financial statements and financial highlights. Such procedures also included confirmation of securities owned as of December 31, 2022, by correspondence with the custodian, transfer agent and brokers. Our audits also included evaluating the accounting principles used and significant estimates made by management, as well as evaluating the overall presentation of the financial statements and financial highlights. We believe that our audits provide a reasonable basis for our opinion.

We have not been able to determine the specific year that we began serving as the auditor of one or more Allspring Funds investment companies; however, we are aware that we have served as the auditor of one or more Allspring Funds investment companies since at least 1955.
Boston, Massachusetts
February 27, 2023
38 | Allspring VT Index Asset Allocation Fund
Other information (unaudited)
TAX INFORMATION
For corporate shareholders, pursuant to Section 854 of the Internal Revenue Code, 86% of ordinary income dividends qualify for the corporate dividends-received deduction for the fiscal year ended December 31, 2022.
Pursuant to Section 852 of the Internal Revenue Code, $7,459,917 was designated as a 20% rate gain distribution for the fiscal year ended December 31, 2022.
For the fiscal year ended December 31, 2022, $501,149 has been designated as short-term capital gain dividends for nonresident alien shareholders pursuant to Section 871 of the Internal Revenue Code.
For the fiscal year ended December 31, 2022, 19% of the ordinary income distributed was derived from interest on U.S. government securities.
For corporate shareholders, pursuant to Section 163(j) of the Internal Revenue Code, 21% of ordinary income dividends qualify as interest dividends for the fiscal year ended December 31, 2022.
PROXY VOTING INFORMATION
A description of the policies and procedures used to determine how to vote proxies relating to portfolio securities is available without charge, upon request, by calling 1-800-260-5969, visiting our website at allspringglobal.com, or visiting the SEC website at sec.gov. Information regarding how the proxies related to portfolio securities were voted during the most recent 12-month period ended June 30 is available on the website at allspringglobal.com or by visiting the SEC website at sec.gov.
QUARTERLY PORTFOLIO HOLDINGS INFORMATION
The Fund files its complete schedule of portfolio holdings with the SEC for the first and third quarters of each fiscal year as an exhibit to its reports on Form N-PORT. Shareholders may view the filed Form N-PORT by visiting the SEC website at sec.gov.
Allspring VT Index Asset Allocation Fund | 39
Other information (unaudited)
BOARD OF TRUSTEES AND OFFICERS
Each of the Trustees and Officers listed in the table below acts in identical capacities for each fund in the Allspring family of funds, which consists of 127 mutual funds comprising the Allspring Funds Trust, Allspring Variable Trust, Allspring Master Trust and four closed-end funds (collectively the “Fund Complex”). This table should be read in conjunction with the Prospectus and the Statement of Additional Information1. The mailing address of each Trustee and Officer is 1415 Vantage Park Drive, 3rd Floor, Charlotte, NC 28203. Each Trustee and Officer serves an indefinite term, however, each Trustee serves such term until reaching the mandatory retirement age established by the Trustees.
Independent Trustees
Name and
year of birth | Position held and
length of service* | Principal occupations during past five years or longer | Current other
public company or
investment
company
directorships |
William R. Ebsworth
(Born 1957) | Trustee,
since 2015 | Retired. From 1984 to 2013, equities analyst, portfolio manager, research director and chief investment officer at Fidelity Management and Research Company in Boston, Tokyo, and Hong Kong, and retired in 2013 as Chief Investment Officer of Fidelity Strategic Advisers, Inc. where he led a team of investment professionals managing client assets. Prior thereto, Board member of Hong Kong Securities Clearing Co., Hong Kong Options Clearing Corp., the Thailand International Fund, Ltd., Fidelity Investments Life Insurance Company, and Empire Fidelity Investments Life Insurance Company. Audit Committee Chair and Investment Committee Chair of the Vincent Memorial Hospital Foundation (non-profit organization). Mr. Ebsworth is a CFA® charterholder. | N/A |
Jane A. Freeman
(Born 1953) | Trustee,
since 2015;
Chair Liaison,
since 2018 | Retired. From 2012 to 2014 and 1999 to 2008, Chief Financial Officer of Scientific Learning Corporation. From 2008 to 2012, Ms. Freeman provided consulting services related to strategic business projects. Prior to 1999, Portfolio Manager at Rockefeller & Co. and Scudder, Stevens & Clark. Board member of the Harding Loevner Funds from 1996 to 2014, serving as both Lead Independent Director and chair of the Audit Committee. Board member of the Russell Exchange Traded Funds Trust from 2011 to 2012 and the chair of the Audit Committee. Ms. Freeman is also an inactive Chartered Financial Analyst. | N/A |
Isaiah Harris, Jr.
(Born 1952) | Trustee,
since 2009; Audit
Committee
Chair,
since 2019 | Retired. Member of the Advisory Board of CEF of East Central Florida. Chairman of the Board of CIGNA Corporation from 2009 to 2021, and Director from 2005 to 2008. From 2003 to 2011, Director of Deluxe Corporation. Prior thereto, President and CEO of BellSouth Advertising and Publishing Corp. from 2005 to 2007, President and CEO of BellSouth Enterprises from 2004 to 2005 and President of BellSouth Consumer Services from 2000 to 2003. Emeritus member of the Iowa State University Foundation Board of Governors. Emeritus Member of the Advisory Board of Iowa State University School of Business. Advisory Board Member, Palm Harbor Academy (private school). Advisory Board Member, Fellowship of Christian Athletes. Mr. Harris is a certified public accountant (inactive status). | N/A |
David F. Larcker
(Born 1950) | Trustee,
since 2009 | Distinguished Visiting Fellow at the Hoover Institution since 2022. James Irvin Miller Professor of Accounting at the Graduate School of Business (Emeritus), Stanford University, Director of the Corporate Governance Research Initiative and Senior Faculty of The Rock Center for Corporate Governance since 2006. From 2005 to 2008, Professor of Accounting at the Graduate School of Business, Stanford University. Prior thereto, Ernst & Young Professor of Accounting at The Wharton School, University of Pennsylvania from 1985 to 2005. | N/A |
40 | Allspring VT Index Asset Allocation Fund
Other information (unaudited)
Name and
year of birth | Position held and
length of service* | Principal occupations during past five years or longer | Current other
public company or
investment
company
directorships |
Olivia S. Mitchell
(Born 1953) | Trustee,
since 2006;
Nominating and
Governance
Committee Chair,
since 2018 | International Foundation of Employee Benefit Plans Professor since 1993, Wharton School of the University of Pennsylvania. Director of Wharton’s Pension Research Council and Boettner Center on Pensions & Retirement Research, and Research Associate at the National Bureau of Economic Research. Previously taught at Cornell University from 1978 to 1993. | N/A |
Timothy J. Penny
(Born 1951) | Trustee,
since 1996;
Chair,
since 2018 | President and Chief Executive Officer of Southern Minnesota Initiative Foundation, a non-profit organization, since 2007. Vice Chair of the Economic Club of Minnesota, since 2007. Co-Chair of the Committee for a Responsible Federal Budget, since 1995. Member of the Board of Trustees of NorthStar Education Finance, Inc., a non-profit organization, from 2007-2022. Senior Fellow of the University of Minnesota Humphrey Institute from 1995 to 2017. | N/A |
James G. Polisson
(Born 1959) | Trustee,
since 2018 | Retired. Chief Marketing Officer, Source (ETF) UK Services, Ltd, from 2015 to 2017. From 2012 to 2015, Principal of The Polisson Group, LLC, a management consulting, corporate advisory and principal investing company. Chief Executive Officer and Managing Director at Russell Investments, Global Exchange Traded Funds from 2010 to 2012. Managing Director of Barclays Global Investors from 1998 to 2010 and Global Chief Marketing Officer for iShares and Barclays Global Investors from 2000 to 2010. Trustee of the San Francisco Mechanics’ Institute, a non-profit organization, from 2013 to 2015. Board member of the Russell Exchange Traded Fund Trust from 2011 to 2012. Director of Barclays Global Investors Holdings Deutschland GmbH from 2006 to 2009. Mr. Polisson is an attorney and has a retired status with the Massachusetts and District of Columbia Bar Associations. | N/A |
Pamela Wheelock
(Born 1959) | Trustee,
since January
2020; previously
Trustee from
January 2018 to
July 2019 | Retired. Executive and Senior Financial leadership positions in the public, private and nonprofit sectors. Interim President and CEO, McKnight Foundation, 2020. Interim Commissioner, Minnesota Department of Human Services, 2019. Chief Operating Officer, Twin Cities Habitat for Humanity, 2017-2019. Vice President for University Services, University of Minnesota, 2012-2016. Interim President and CEO, Blue Cross and Blue Shield of Minnesota, 2011-2012. Executive Vice-President and Chief Financial Officer, Minnesota Wild, 2002-2008. Commissioner, Minnesota Department of Finance, 1999-2002. Chair of the Board of Directors of Destination Medical Center Corporation. Board member of the Minnesota Wild Foundation. | N/A |
* Length of service dates reflect the Trustee’s commencement of service with the Trust’s predecessor entities, where applicable.
Allspring VT Index Asset Allocation Fund | 41
Other information (unaudited)
Officers2
Name and
year of birth | Position held and
length of service | Principal occupations during past five years or longer |
Andrew Owen
(Born 1960) | President,
since 2017 | President and Chief Executive Officer of Allspring Funds Management, LLC since 2017 and Head of Global Fund Governance of Allspring Global Investments since 2022. Prior thereto, co-president of Galliard Capital Management, LLC, an affiliate of Allspring Funds Management, LLC, from 2019 to 2022 and Head of Affiliated Managers, Allspring Global Investments, from 2014 to 2019 and Executive Vice President responsible for marketing, investments and product development for Allspring Funds Management, LLC, from 2009 to 2014. |
Jeremy DePalma
(Born 1974) | Treasurer,
since 2012
(for certain funds in
the Fund Complex);
since 2021 (for
the remaining funds in the
Fund Complex) | Senior Vice President of Allspring Funds Management, LLC since 2009. Senior Vice President of Evergreen Investment Management Company, LLC from 2008 to 2010 and head of the Fund Reporting and Control Team within Fund Administration from 2005 to 2010. |
Christopher Baker
(Born 1976) | Chief Compliance Officer, since 2022 | Global Chief Compliance Officer for Allspring Global Investments since 2022. Prior thereto, Chief Compliance Officer for State Street Global Advisors from 2018 to 2021. Senior Compliance Officer for the State Street divisions of Alternative Investment Solutions, Sector Solutions, and Global Marketing from 2015 to 2018. From 2010 to 2015 Vice President, Global Head of Investment and Marketing Compliance for State Street Global Advisors. |
Matthew Prasse
(Born 1983) | Chief Legal Officer, since 2022; Secretary, since 2021 | Senior Counsel of the Allspring Legal Department since 2021. Senior Counsel of the Wells Fargo Legal Department from 2018 to 2021. Previously, Counsel for Barings LLC from 2015 to 2018. Prior to joining Barings, Associate at Morgan, Lewis & Bockius LLP from 2008 to 2015. |
1 The Statement of Additional Information includes additional information about the Trustees and is available, without charge, upon request, by calling 1-800-222-8222 or by visiting the website at allspringglobal.com.
2 For those Officers with tenures at Allspring Global Investments and/or Allspring Funds Management, LLC that began prior to 2021, such tenures include years of service during which these businesses/entities were known as Wells Fargo Asset Management and Wells Fargo Funds Management, LLC, respectively.
42 | Allspring VT Index Asset Allocation Fund
For more information
More information about Allspring Funds is available free upon request. To obtain literature, please write, visit the Fund's website, or call:
Allspring Funds
P.O. Box 219967
Kansas City, MO 64121-9967
Website: allspringglobal.com
Individual investors: 1-800-260-5969
Retail investment professionals: 1-888-877-9275
Institutional investment professionals: 1-866-765-0778
This report and the financial statements contained herein are submitted for the general information of the shareholders of the Fund. If this report is used for promotional purposes, distribution of the report must be accompanied or preceded by a current prospectus. Before investing, please consider the investment objectives, risks, charges, and expenses of the investment. For a current prospectus and, if available, a summary prospectus, containing this information, call
1-800-260-5969 or visit the Fund's website at allspringglobal.com. Read the prospectus carefully before you invest or send money.
Allspring Global InvestmentsTM is the trade name for the asset management firms of Allspring Global Investments Holdings, LLC, a holding company indirectly owned by certain private funds of GTCR LLC and Reverence Capital Partners, L.P. These firms include but are not limited to Allspring Global Investments, LLC, and Allspring Funds Management, LLC. Certain products managed by Allspring entities are distributed by Allspring Funds Distributor, LLC (a broker-dealer and Member FINRA/SIPC).
This material is for general informational and educational purposes only and is NOT intended to provide investment advice or a recommendation of any kind - including a recommendation for any specific investment, strategy, or plan.
© 2023 Allspring Global Investments Holdings, LLC. All rights reserved.
ALL-01052023-zkny1afq 02-23
AR0360 12-22
Annual Report
December 31, 2022
Allspring
VT International Equity Fund
The views expressed and any forward-looking statements are as of December 31, 2022, unless otherwise noted, and are those of the Fund's portfolio managers and/or Allspring Global Investments. Discussions of individual securities or the markets generally are not intended as individual recommendations. Future events or results may vary significantly from those expressed in any forward-looking statements. The views expressed are subject to change at any time in response to changing circumstances in the market. Allspring Global Investments disclaims any obligation to publicly update or revise any views expressed or forward-looking statements.
Allspring VT International Equity Fund | 1
Letter to shareholders (unaudited)
Andrew Owen
President
Allspring Funds
Dear Shareholder:
We are pleased to offer you this annual report for the Allspring VT International Equity Fund for the 12-month period that ended December 31, 2022. Globally, stocks and bonds experienced heightened volatility and historically poor performance through the challenging period. Earlier tailwinds provided by global stimulus programs, vaccination rollouts, and recovering consumer and corporate sentiment were wiped away by the highest rate of inflation in four decades, the impact of ongoing aggressive central bank rate hikes and the prospect of more rate hikes. Compounding these concerns were the global reverberations of the Russia-Ukraine war and the impact of China’s strict COVID-19 lockdowns.
For the 12-month period, both stocks and bonds registered major losses, with even U.S. bonds suffering double-digit losses and other assets faring worse. For the period, U.S. stocks, based on the S&P 500 Index,1 returned -18.11%. International stocks, as measured by the MSCI ACWI ex USA Index (Net),2 returned -16.00%, while the MSCI EM Index (Net) (USD)3 had weaker performance with a decline of 20.09%. Among bond indexes, the Bloomberg U.S. Aggregate Bond Index4 returned -13.01%, the Bloomberg Global Aggregate ex-USD Index (unhedged)5 returned -18.70%, the Bloomberg Municipal Bond Index6 declined 8.53%, and the ICE BofA U.S. High Yield Index7 fell 11.17%.
Rising inflation, COVID, and the Russian invasion of Ukraine drove market performance.
In January 2022, concerns mounted about U.S. interest rate hikes and the Russia-Ukraine conflict. The Federal Reserve (Fed) hinted that a March interest rate hike was likely. Meanwhile, Russia threatened a potential invasion of Ukraine, which could disrupt Russia’s massive energy supplies and drive demand from non-Russian oil-producing countries. Elsewhere overseas, Europe saw food and energy prices spike, leading to rising inflation. Within fixed income, corporate bonds struggled in January, trailing government bonds, as investors focused on elevated inflation and the prospect of rising interest rates and tighter money supply.
The Russian invasion of Ukraine dominated the financial world in February and March. Equity, bond, and commodities markets were shaken by fear, uncertainty, and an upending of demand-supply dynamics. Major global stock indexes were down in February, along with global bonds overall, with heightened volatility in March and mixed results that favored U.S. large-cap stocks. Prices of commodities spiked, including crude oil, natural gas, wheat, and precious metals, on elevated concerns of supply shortages. All of this fueled inflation concerns and added to expectations of more aggressive central bank interest rate hikes. Sweeping sanctions against Russia and corporate pullouts contributed to market volatility. Despite the geopolitical turmoil, the U.S. economic outlook remained largely unchanged, with a healthy job market and signs of economic resilience accompanying higher prices.
“ The Russian invasion of Ukraine dominated the financial world in February and March. Equity, bond, and commodities markets were shaken by fear, uncertainty, and an upending of demand-supply dynamics.”
| 1 | The S&P 500 Index consists of 500 stocks chosen for market size, liquidity, and industry group representation. It is a market-value-weighted index with each stock's weight in the index proportionate to its market value. You cannot invest directly in an index. |
| 2 | The Morgan Stanley Capital International (MSCI) All Country World Index (ACWI) ex USA Index (Net) is a free-float-adjusted market-capitalization-weighted index that is designed to measure the equity market performance of developed and emerging markets, excluding the U.S. Source: MSCI. MSCI makes no express or implied warranties or representations and shall have no liability whatsoever with respect to any MSCI data contained herein. The MSCI data may not be further redistributed or used as a basis for other indexes or any securities or financial products. This report is not approved, reviewed, or produced by MSCI. You cannot invest directly in an index. |
| 3 | The MSCI Emerging Markets (EM) Index (Net) (USD) is a free-float-adjusted market-capitalization-weighted index that is designed to measure equity market performance of emerging markets. You cannot invest directly in an index. |
| 4 | The Bloomberg U.S. Aggregate Bond Index is a broad-based benchmark that measures the investment-grade, U.S.-dollar-denominated, fixed-rate taxable bond market, including Treasuries, government-related and corporate securities, mortgage-backed securities (agency fixed-rate and hybrid adjustable-rate mortgage pass-throughs), asset-backed securities, and commercial mortgage-backed securities. You cannot invest directly in an index. |
| 5 | The Bloomberg Global Aggregate ex-USD Index (unhedged) is an unmanaged index that provides a broad-based measure of the global investment-grade fixed-income markets excluding the U.S.-dollar-denominated debt market. You cannot invest directly in an index. |
| 6 | The Bloomberg Municipal Bond Index is an unmanaged index composed of long-term tax-exempt bonds with a minimum credit rating of Baa. You cannot invest directly in an index. |
| 7 | The ICE BofA U.S. High Yield Index is a market-capitalization-weighted index of domestic and Yankee high-yield bonds. The index tracks the performance of high-yield securities traded in the U.S. bond market. You cannot invest directly in an index. Copyright 2023. ICE Data Indices, LLC. All rights reserved. |
2 | Allspring VT International Equity Fund
Letter to shareholders (unaudited)
In April, market volatility continued, with deepening losses across major capital markets, as both the S&P 500 and MSCI ACWI (Net)1 fell 8% or more for the month. The Chinese economy struggled through a strict lockdown as the government tried to contain a major COVID-19 outbreak. The ensuing global ripple effect compounded existing supply shortages. This was exacerbated by the impact of the Russia-Ukraine war on global commodities. Meanwhile, U.S. annual inflation raged at 8.5%, its highest level since 1981, and investors braced themselves for aggressive Fed monetary tightening moves.
Market volatility continued in May, although markets recovered ground late in the month. Value stocks continued to outperform growth stocks. The concerns that had dominated markets for months continued, including high inflation and geopolitical tensions that added to high crude oil, gasoline, and food prices. In response, the Fed raised the federal funds rate by 0.50%, with widescale expectations of more rate hikes. Meanwhile, highly contagious COVID-19 variants persisted. However, labor markets in the U.S., the U.K., and Europe remained strong. U.S. retail sales for April, released in May, indicated a fourth consecutive monthly increase, reflecting continued consumer resilience.
In June, stocks posted further losses en route to their worst first half of a year in 50 years. Bonds didn’t fare much better. Driving the losses were the familiar factors: rising global inflation and fears of recession as central banks increased rates to try to curb soaring inflation. The Fed raised its short-term rate by another 0.75% in June. Meanwhile, the U.S. unemployment rate held firm at 3.6% and the housing market remained only marginally affected by sharply higher mortgage rates.
Markets rebounded in July, led by U.S. stocks. While evidence began to point to an economic slowdown after two consecutive quarters of declining gross domestic product (economic contraction), the U.S. labor market remained surprisingly robust: July nonfarm payrolls grew by more than 500,000 and U.S. unemployment dipped to 3.5%. Meanwhile, crude oil and retail gasoline prices, major contributors to recent overall inflation, fell substantially from earlier highs. And while U.S. home prices rose, home sales fell as houses became less affordable with mortgage rates at a 13-year high. The Fed raised the federal funds rate another 0.75% in July—to a range of 2.25% to 2.50%—and forecasts pointed to further rate hikes.
August was yet another broadly challenging month for financial markets, with more red ink flowing. High inflation persisted, cresting 9% in the eurozone on an annual basis and remaining above 8% in the U.S. despite the Fed’s aggressive monetary policy and a major drop in global crude oil and gasoline prices from their June peak. One positive note was the resilience of the U.S. job market. However, the Fed’s job was clearly not complete. One longer-term bright spot was the U.S. Congress’s passage of the Inflation Reduction Act. Its primary stated goals include: to reduce inflation (though not immediately) by curbing the deficit, capping health care spending by seniors, and investing in domestic sources of clean energy.
The market misery continued in September. There was nowhere to hide as all asset classes suffered major losses at the hands of persistent inflation. Central banks kept up their battle against rapidly rising prices with more rate hikes. The strength of the U.S. dollar made things even more difficult for investors holding assets in other currencies. U.S. mortgage rates jumped to near 7% on 30-year fixed-rate mortgages; the decreased housing affordability began to cool demand somewhat. The U.K. experienced a sharp sell-off of government bonds and the British pound in September as investors panicked in response to a new government budget that was seen as financially unsound. The market meltdown forced the Bank of England to step in and buy long-dated government bonds.
Equities had a reprieve in October after two months of sharp declines. Value stocks and small caps fared best. Globally, developed markets outpaced emerging market equities, which were hurt by weakness among Chinese stocks. Central banks continued to try to curtail high inflation with aggressive interest rate hikes. Geopolitical risks persisted, including the ongoing Russia-Ukraine war and economic, financial market, and political turmoil in the U.K., which led to a second prime ministerial change in six weeks, as Rishi Sunak replaced Liz Truss in late October. Concerns over Europe’s energy crisis eased thanks to unseasonably warm weather and plentiful gas on hand. The U.S. labor market continued its resilience against rising prices, as unemployment stood at 3.7%, near a record low.
“ In June, stocks posted further losses en route to their worst first half of a year in 50 years. Bonds didn’t fare much better. Driving the losses were the familiar factors: rising global inflation and fears of recession as central banks increased rates to try to curb soaring inflation.”
| 1 | The MSCI ACWI (Net) is a free-float-adjusted market-capitalization-weighted index that is designed to measure the equity market performance of developed and emerging markets. You cannot invest directly in an index. |
Allspring VT International Equity Fund | 3
Letter to shareholders (unaudited)
Stocks and bonds rallied in November, with emerging market equities gaining nearly 15% and developed market equities returning 7%. The S&P 500 Index rose 5.6% in November. Bonds also had positive monthly returns. Economic news was encouraging, driven by U.S. labor market strength. Although central banks kept raising rates, hopes rose for an easing in the pace of rate hikes and a possible end to central bank monetary tightening in 2023. Although inflation remained at record highs in the eurozone, we began to see signs of a possible decline in inflationary pressures as U.S. inflation moderated, with a 7.1% annual price rise in November and a monthly price increase of just 0.1%. China’s economic data remained weak, reflecting its zero-COVID-19 policy.
Financial markets cooled in December, with U.S. equities posting negative overall results in response to a weakening U.S. dollar. Fixed income securities ended one of their worst years ever with flat overall monthly returns as markets weighed the hopes for an end to the monetary tightening cycle with the reality that central banks had not completed their jobs yet. U.S. Consumer Price Index (CPI)1 data showed a strong consistent trend downward, which brought down the 12-month CPI to 6.5% in December from 9.1% in June. Other countries and regions reported still-high but declining inflation rates as the year winded down.
Don’t let short-term uncertainty derail long-term investment goals.
Periods of investment uncertainty can present challenges, but experience has taught us that maintaining long-term investment goals can be an effective way to plan for the future. To help you create a sound strategy based on your personal goals and risk tolerance, Allspring Funds offers more than 100 mutual funds spanning a wide range of asset classes and investment styles. Although diversification cannot guarantee an investment profit or prevent losses, we believe it can be an effective way to manage investment risk and potentially smooth out overall portfolio performance. We encourage investors to know their investments and to understand that appropriate levels of risk-taking may unlock opportunities.
Thank you for choosing to invest with Allspring Funds. We appreciate your confidence in us and remain committed to helping you meet your financial needs.
Sincerely,
Andrew Owen
President
Allspring Funds
For further information about your fund, contact your investment professional, visit our website at allspringglobal.com, or call us directly at 1-800-222-8222.
| 1 | The Consumer Price Index (CPI) is a measure of the average change over time in the prices paid by urban consumers for a market basket of consumer goods and services. You cannot invest directly in an index. |
4 | Allspring VT International Equity Fund
This page is intentionally left blank.
Performance highlights (unaudited)
| Investment objective | The Fund seeks long-term capital appreciation. |
| Manager | Allspring Funds Management, LLC |
| Subadviser | Allspring Global Investments, LLC |
| Portfolio managers | Venkateshwar (Venk) Lal, Dale A. Winner, CFA®‡ |
| Average annual total returns (%) as of December 31, 2022 |
| | | | | | Expense ratios1 (%) |
| | Inception date | 1 year | 5 year | 10 year | Gross | Net 2 |
| Class 1 | 8-17-1998 | -11.48 ♠ | -0.87 | 3.67 | 1.13 | 0.69 |
| Class 2 | 7-31-2002 | -11.88 ♠ | -1.15 | 3.39 | 1.38 | 0.94 |
| MSCI ACWI ex USA Index (Net)3 | – | -16.00 | 0.88 | 3.80 | – | – |
| MSCI ACWI ex USA Value Index (Net)4 | – | -8.59 | -0.05 | 2.72 | – | – |
Figures quoted represent past performance, which is no guarantee of future results. Investment return and principal value of an investment will fluctuate so that an investor’s shares, when redeemed, may be worth more or less than their original cost. Current performance may be lower or higher than the performance data quoted and assumes the reinvestment of dividends and capital gains. Current month-end performance is available by calling 1-800-260-5969. Performance figures of the Fund do not reflect fees and expenses charged pursuant to the terms of variable life insurance policies and variable annuity contracts. If these fees and expenses had been reflected, performance would have been lower.
Index returns do not include transaction costs associated with buying and selling securities, any mutual fund fees or expenses, or any taxes. It is not possible to invest directly in an index.
Shares are sold without a front-end sales charge or contingent deferred sales charge.
| ♠ | Total return differs from the return in the Financial Highlights in this report. The total return presented is calculated based on the Net Asset Value (NAV) at which the shareholder transactions were processed. The NAV and total return presented in the Financial Highlights reflects certain adjustments made to the net assets of the Fund that are necessary under U.S. generally accepted accounting principles. |
| 1 | Reflects the expense ratios as stated in the most recent prospectuses. The expense ratios shown are subject to change and may differ from the annualized expense ratios shown in the financial highlights of this report. |
| 2 | The manager has contractually committed through April 30, 2023, to waive fees and/or reimburse expenses to the extent necessary to cap total annual fund operating expenses after fee waivers at 0.69% for Class 1 shares and 0.94% for Class 2 shares. Brokerage commissions, stamp duty fees, interest, taxes, acquired fund fees and expenses (if any), and extraordinary expenses are excluded from the expense caps. Prior to or after the commitment expiration date, the caps may be increased or the commitment to maintain the caps may be terminated only with the approval of the Board of Trustees. Without these caps, the Fund’s returns would have been lower. The expense ratio paid by an investor is the net expense ratio (the total annual fund operating expenses after fee waivers) as stated in the prospectuses. |
| 3 | The Morgan Stanley Capital International (MSCI) All Country World Index (ACWI) ex USA Index (Net) is a free-float-adjusted market- capitalization-weighted index that is designed to measure the equity market performance of developed and emerging markets, excluding the U.S. Source: MSCI. MSCI makes no express or implied warranties or representations and shall have no liability whatsoever with respect to any MSCI data contained herein. The MSCI data may not be further redistributed or used as a basis for other indexes or any securities or financial products. This report is not approved, reviewed, or produced by MSCI. You cannot invest directly in an index. |
| 4 | The MSCI ACWI ex USA Value Index (Net) measures the equity market performance of large- and mid-cap securities exhibiting overall value style characteristics across developed and emerging market countries, excluding the U.S. The value investment style characteristics for index construction are defined using three variables: book value to price, 12-month forward earnings to price, and dividend yield. You cannot invest directly in an index. |
Stock values fluctuate in response to the activities of individual companies and general market and economic conditions. Foreign investments are especially volatile and can rise or fall dramatically due to differences in the political and economic conditions of the host country. These risks are generally intensified in emerging markets. The use of derivatives may reduce returns and/or increase volatility. Certain investment strategies tend to increase the total risk of an investment (relative to the broader market). This fund is exposed to smaller-company securities risk. Consult the Fund’s prospectus for additional information on these and other risks.
Please refer to the prospectus provided by your participating insurance company for detailed information describing the separate accounts for information regarding surrender charges, mortality and expense risk fees, and other charges that may be assessed by the participating insurance companies.
| ‡ | CFA® and Chartered Financial Analyst® are trademarks owned by CFA Institute. |
6 | Allspring VT International Equity Fund
Performance highlights (unaudited)
Growth of $10,000 investment as of December 31, 20221
| 1 | The chart compares the performance of Class 2 shares for the most recent ten years with the MSCI ACWI ex USA Index (Net) and MSCI ACWI ex USA Value Index (Net). The chart assumes a hypothetical investment of $10,000 in Class 2 shares and reflects all operating expenses of the Fund but does not reflect fees and expenses charged pursuant to the terms of variable life insurance policies and variable annuity contracts. |
Allspring VT International Equity Fund | 7
Performance highlights (unaudited)
MANAGER'S DISCUSSION
Fund highlights
| ■ | The Fund outperformed the MSCI ACWI ex USA Index (Net) but underperformed the MSCI ACWI ex USA Value Index (Net) for the 12-month period that ended December 31, 2022. |
| ■ | Stock selection within the industrials and communication services sectors resulted in notable contributions to performance, as did an average underweight to information technology (IT). Positioning in consumer staples and materials were relative performance laggards due primarily to negative selection effects. |
| ■ | The Fund was overweight North America, including both the U.S. and Canada. The Fund was underweight Asia-Pacific on a regional basis, including Taiwan, Australia, India, and Japan, partly offset by overweights to Korea, Thailand, and China/Hong Kong. The Fund was underweight Europe, including Switzerland, Sweden, Germany, and Denmark, partly offset by overweights to the U.K., Italy, the Netherlands, and Norway. |
Our investment and risk management process of finding non-consensus undervalued equities and marrying core micro stock picking with macro risk management in each region of the globe resulted in shifts to sector and country allocations. This included an increase in exposure to the IT, communication services, and energy sectors and Thailand, Japan, and Mexico. This was offset by reduced allocations to the consumer discretionary, industrials, and materials sectors and the U.S., the Netherlands, and Switzerland. Notable position changes during the period included the addition of Shell, a major integrated oil and gas company; Minor International, an international hotelier and restaurant owner; and America Movil, Mexico’s largest mobile network operator. The Fund notably exited Stellantis, (the world’s fourth-largest automaker by volume); Kingfisher, a U.K.-based home improvement retailer; and Melrose Industries, a U.K.-domiciled investment company that seeks to buy, improve, and sell manufacturing businesses for a profit.
| Ten largest holdings (%) as of December 31, 20221 |
| Mitsubishi UFJ Financial Group Incorporated | 3.66 |
| Shell plc | 3.32 |
| SK Telecom Company Limited | 3.21 |
| ING Groep NV | 2.98 |
| Midea Group Company Limited Class A | 2.95 |
| Sanofi SA | 2.93 |
| Asahi Group Holdings Limited | 2.86 |
| Hitachi Limited | 2.85 |
| SCB X PCL | 2.71 |
| Samsonite International SA | 2.65 |
| 1 | Figures represent the percentage of the Fund's net assets. Holdings are subject to change and may have changed since the date specified. |
Stock selection in Germany, Japan, and the Netherlands contributed to returns.
Over the past 12 months, contributions to performance were driven largely by stock selection in Germany, Japan, and the Netherlands. Rheinmetall AG, a German industrial primarily engaged in the defense and automotive businesses, performed well given a generational shift in German defense spending following Russia’s invasion of Ukraine. The German government committed €100 billion to a special fund to fill existing gaps in its armed forces, versus its prior 2021 budget of €53 billion, and plans to raise its defense budget to more than 2% of gross domestic product per annum from 2023 onward, which could result in a doubling of sales in Germany. Mitsubishi UFJ Financial Group, a leading global financial services group and Japan’s largest bank, was the leading relative contributor in Japan as it reported first-half consolidated net profits ahead of estimates due primarily to strong pre-provision operating profits up 40% year over year. The firm announced an additional share buyback of ¥150 billion following the sale of MUFG Union Bank, taking its total fiscal-year 2022 buyback to ¥450 billion, with the potential for even more buybacks and dividends as it approaches the upper end of its common equity tier 1 target range.
Detractors included stock selection in the U.K., India, and Canada.
Nomad Foods, Europe’s leading frozen-food company and one of the largest in the world, was the largest detractor in the U.K. It underperformed primarily in the third quarter as it reported a modest and anticipated miss on second-quarter results with sales off by 3%; earnings before interest, taxes, depreciation, and amortization (EBITDA) off by 1%; and earnings per share off by 5% compared with consensus expectations. We maintain a position in the company given its likely pricing power, unchanged normalized earnings power, and upside optionality/downside protection as the founders filed form 13Ds stating an intent to “explore and evaluate potential strategic alternatives.”
8 | Allspring VT International Equity Fund
Performance highlights (unaudited)
| Sector allocation as of December 31, 20221 |
| 1 | Figures represent the percentage of the Fund's long-term investments. Allocations are subject to change and may have changed since the date specified. |
Tech Mahindra, a leading Indian IT services firm providing digital transformation, consulting, and business process engineering and outsourcing services, reported second-quarter results with revenues up 7.2% quarterly/15.5% annually, EBIT margins of 15.2% (+1% year over year), and a commitment of 15% EBIT margins over the next several quarters. Revenue growth was balanced among segments and regions and deal wins amounted to $750 million, versus a quarterly deal win rate of $500 million over the past year. However, the stock performed poorly, given pressures on the Indian IT services sector from 1) sharper global stagflation concerns in Europe and the U.S., 2) risk-off investor rotations out of higher-growth/higher-valuation sectors as interest rates appreciated more than expected, and 3) weaker-than-expected quarterly results/guidance by select IT services sector peers.
Our outlook is neutral over both the short and long term.
Our short-term outlook remains neutral. Sentiment is neutral as the MSCI ACWI (Net)* finished the year neither overbought nor oversold as it advanced 9.8% in the final quarter, inclusive of a 4.6% pull back at the end of the year, with the VIX Index** closing at 22, below its one-year average
of 26, reflecting slightly lower market volatility. The market has rebounded 10.3% off a near two-year low. However, economic growth prospects continue to decelerate, illustrated by a further decline in the global composite Purchasing Managers’ Index*** from 49.7 in September to 48.2 and decelerating earnings growth from above-trend levels. Finally, while central banks may be approaching their respective peak interest rate levels, they continue to raise their policy rates, with cumulative 125-basis-point (bp; 100 bps equal 1.00%) hikes from the Federal Reserve, the European Central Bank, and the Bank of England during the quarter. They are all expected to maintain elevated rates longer while fiscal policy has stalled in light of multi-decade highs in inflation.
| Geographic allocation as of December 31, 20221 |
| 1 | Figures represent the percentage of the Fund's long-term investments. Allocations are subject to change and may have changed since the date specified. |
Our long-term outlook remains cautious. First, equity valuations are elevated with the MSCI ACWI (Net) trading at 2x price/book but off highs of 3x. Second, long-term economic growth is facing headwinds from elevated inflation, tightening monetary policy in developed markets, and geopolitical uncertainties, increasing the risk of an economic slowdown in Europe in the near term and possibly in the U.S. in the second half of 2023.
| * | The Morgan Stanley Capital International (MSCI) All Country World Index (ACWI) (Net) is a free-float-adjusted market-capitalization-weighted index that is designed to measure the equity market performance of developed and emerging markets. You cannot invest directly in an index. |
| ** | The Chicago Board Options Exchange (CBOE) Market Volatility Index (VIX) is a popular measure of the implied volatility of S&P 500 Index options. It represents one measure of the market's expectation of stock market volatility over the next 30-day period. You cannot invest directly in an index." |
| * | The Morgan Stanley Capital International (MSCI) All Country World Index (ACWI) (Net) is a free-float-adjusted market-capitalization-weighted index that is designed to measure the equity market performance of developed and emerging markets. You cannot invest directly in an index. |
| *** | The Purchasing Managers' Index (PMI) is an index of the prevailing direction of economic trends in the manufacturing and service sectors. You cannot invest directly in an index. |
Allspring VT International Equity Fund | 9
Fund expenses (unaudited)
As a shareholder of the Fund, you incur ongoing costs, including management fees, distribution (12b-1) fees, and other Fund expenses. This example is intended to help you understand your ongoing costs (in dollars) of investing in the Fund and to compare these costs with the ongoing costs of investing in other mutual funds.
The example is based on an investment of $1,000 invested at the beginning of the six-month period and held for the entire period from July 1, 2022 to December 31, 2022.
Actual expenses
The “Actual” line of the table below provides information about actual account values and actual expenses. You may use the information in this line, together with the amount you invested, to estimate the expenses that you paid over the period. Simply divide your account value by $1,000 (for example, an $8,600 account value divided by $1,000 = 8.6), then multiply the result by the number in the “Actual” line under the heading entitled “Expenses paid during period” for your applicable class of shares to estimate the expenses you paid on your account during this period.
Hypothetical example for comparison purposes
The “Hypothetical” line of the table below provides information about hypothetical account values and hypothetical expenses based on the Fund’s actual expense ratio and an assumed rate of return of 5% per year before expenses, which is not the Fund’s actual return. The hypothetical account values and expenses may not be used to estimate the actual ending account balance or expenses you paid for the period. You may use this information to compare the ongoing costs of investing in the Fund and other funds. To do so, compare this 5% hypothetical example with the 5% hypothetical examples that appear in the shareholder reports of the other funds.
Please note that the expenses shown in the table are meant to highlight your ongoing costs only and do not reflect any separate account charges assessed by participating insurance companies. Therefore, the “Hypothetical” line of the table is useful in comparing ongoing costs only, and will not help you determine the relative total costs of owning different funds. In addition, if these separate account charges assessed by participating insurance companies were included, your costs would have been higher.
| | Beginning
account value
7-1-2022 | Ending
account value
12-31-2022 | Expenses
paid during
the period1 | Annualized net
expense ratio |
| Class 1 | | | | |
| Actual | $1,000.00 | $1,038.88 | $3.55 | 0.69% |
| Hypothetical (5% return before expenses) | $1,000.00 | $1,021.73 | $3.52 | 0.69% |
| Class 2 | | | | |
| Actual | $1,000.00 | $1,039.98 | $4.83 | 0.94% |
| Hypothetical (5% return before expenses) | $1,000.00 | $1,020.47 | $4.79 | 0.94% |
1 Expenses paid is equal to the annualized net expense ratio of each class multiplied by the average account value over the period, multiplied by 184 divided by 365 (to reflect the one-half-year period).
10 | Allspring VT International Equity Fund
Portfolio of investments—December 31, 2022
| | | | | | Shares | Value |
| Common stocks: 93.94% | | | | | | |
| Australia: 2.24% | | | | | | |
| Qantas Airways Limited (Industrials, Airlines) | | | | | 323,270 | $ 1,322,792 |
| Brazil: 1.51% | | | | | | |
| CPFL Energia SA (Utilities, Electric utilities) | | | | | 142,100 | 893,067 |
| Canada: 2.02% | | | | | | |
| Quebecor Incorporated Class B (Communication services, Media) | | | | | 5,000 | 111,521 |
| SNC-Lavalin Group Incorporated (Industrials, Construction & engineering) | | | | | 61,300 | 1,080,220 |
| | | | | | | 1,191,741 |
| China: 9.17% | | | | | | |
| China Resources Land Limited (Real estate, Real estate management & development) | | | | | 188,000 | 861,065 |
| LONGi Green Energy Technology Company Limited Class A (Information technology, Semiconductors & semiconductor equipment) | | | | | 180,618 | 1,097,993 |
| Midea Group Company Limited Class A (Consumer discretionary, Household durables) | | | | | 233,998 | 1,743,616 |
| Oppein Home Group Incorporated Class A (Consumer discretionary, Household durables) | | | | | 43,640 | 762,917 |
| Topsports International Holdings Limited (Consumer discretionary, Specialty retail) 144A† | | | | | 1,202,000 | 953,229 |
| | | | | | | 5,418,820 |
| France: 6.42% | | | | | | |
| Compagnie de Saint-Gobain SA (Industrials, Building products) | | | | | 4,192 | 204,846 |
| Sanofi SA (Health care, Pharmaceuticals) | | | | | 18,022 | 1,733,161 |
| Sodexho Alliance SA (Consumer discretionary, Hotels, restaurants & leisure) | | | | | 9,697 | 928,816 |
| Worldline SA (Information technology, IT services) 144A† | | | | | 23,640 | 924,407 |
| | | | | | | 3,791,230 |
| Germany: 2.57% | | | | | | |
| Rheinmetall AG (Industrials, Aerospace & defense) | | | | | 6,201 | 1,234,973 |
| Siemens AG (Industrials, Industrial conglomerates) | | | | | 1,715 | 237,996 |
| Siemens Energy AG (Industrials, Electrical equipment) | | | | | 2,465 | 46,374 |
| | | | | | | 1,519,343 |
| Hong Kong: 0.94% | | | | | | |
| Xinyi Glass Holdings Limited (Industrials, Building products) | | | | | 298,000 | 555,115 |
| India: 1.51% | | | | | | |
| Tech Mahindra Limited (Information technology, IT services) | | | | | 72,513 | 890,877 |
| Ireland: 2.05% | | | | | | |
| Greencore Group plc (Consumer staples, Food products) † | | | | | 440,166 | 341,367 |
| ICON plc ADR (Health care, Life sciences tools & services) | | | | | 4,473 | 868,880 |
| | | | | | | 1,210,247 |
| Israel: 1.49% | | | | | | |
| Check Point Software Technologies Limited (Information technology, Software) † | | | | | 6,979 | 880,471 |
The accompanying notes are an integral part of these financial statements.
Allspring VT International Equity Fund | 11
Portfolio of investments—December 31, 2022
| | | | | | Shares | Value |
| Italy: 3.89% | | | | | | |
| Prysmian SpA (Industrials, Electrical equipment) | | | | | 35,631 | $ 1,321,974 |
| UniCredit SpA (Financials, Banks) | | | | | 68,484 | 972,953 |
| | | | | | | 2,294,927 |
| Japan: 12.93% | | | | | | |
| Asahi Group Holdings Limited (Consumer staples, Beverages) | | | | | 53,900 | 1,691,665 |
| Hitachi Limited (Industrials, Industrial conglomerates) | | | | | 33,000 | 1,682,437 |
| Mitsubishi UFJ Financial Group Incorporated (Financials, Banks) | | | | | 319,200 | 2,162,213 |
| ORIX Corporation (Financials, Diversified financial services) | | | | | 58,000 | 936,247 |
| Showa Denko KK (Materials, Chemicals) | | | | | 75,600 | 1,163,609 |
| | | | | | | 7,636,171 |
| Mexico: 2.16% | | | | | | |
| America Movil SAB de CV Series L (Communication services, Wireless telecommunication services) † | | | | | 1,410,900 | 1,274,307 |
| Netherlands: 5.42% | | | | | | |
| CNH Industrial NV (Industrials, Machinery) | | | | | 37,697 | 603,879 |
| ING Groep NV (Financials, Banks) | | | | | 144,292 | 1,758,960 |
| NN Group NV (Financials, Insurance) | | | | | 20,561 | 839,883 |
| | | | | | | 3,202,722 |
| Norway: 2.15% | | | | | | |
| DNB Bank ASA (Financials, Banks) † | | | | | 64,063 | 1,271,543 |
| South Korea: 8.37% | | | | | | |
| Coway Company Limited (Consumer discretionary, Household durables) | | | | | 11,137 | 494,481 |
| Hana Financial Group Incorporated (Financials, Banks) | | | | | 36,671 | 1,221,112 |
| Samsung Electronics Company Limited GDR (Information technology, Technology hardware, storage & peripherals) 144A† | | | | | 1,204 | 1,330,420 |
| SK Telecom Company Limited (Communication services, Wireless telecommunication services) | | | | | 50,588 | 1,897,751 |
| | | | | | | 4,943,764 |
| Thailand: 5.32% | | | | | | |
| Minor International PCL (Consumer discretionary, Hotels, restaurants & leisure) | | | | | 1,642,100 | 1,540,876 |
| SCB X PCL (Financials, Banks) † | | | | | 519,300 | 1,604,305 |
| | | | | | | 3,145,181 |
| United Kingdom: 13.91% | | | | | | |
| ConvaTec Group plc (Health care, Health care equipment & supplies) 144A | | | | | 333,472 | 937,729 |
| Entain plc (Consumer discretionary, Hotels, restaurants & leisure) | | | | | 53,004 | 846,807 |
| Informa plc (Communication services, Media) † | | | | | 205,896 | 1,542,296 |
| NatWest Group plc (Financials, Banks) † | | | | | 468,450 | 1,501,914 |
| Nomad Foods Limited (Consumer staples, Food products) † | | | | | 83,043 | 1,431,661 |
| Shell plc (Energy, Oil, gas & consumable fuels) | | | | | 69,649 | 1,958,542 |
| | | | | | | 8,218,949 |
| United States: 9.87% | | | | | | |
| Axalta Coating Systems Limited (Materials, Chemicals) | | | | | 46,551 | 1,185,654 |
| Baker Hughes Company (Energy, Energy equipment & services) | | | | | 32,885 | 971,094 |
| Berry Global Group Incorporated (Materials, Containers & packaging) | | | | | 11,182 | 675,728 |
| Cognex Corporation (Information technology, Electronic equipment, instruments & components) | | | | | 17,603 | 829,277 |
The accompanying notes are an integral part of these financial statements.
12 | Allspring VT International Equity Fund
Portfolio of investments—December 31, 2022
| | | | | | Shares | Value |
| United States: (continued) | | | | | | |
| Gentex Corporation (Consumer discretionary, Auto components) | | | | | 22,185 | $ 604,985 |
| Samsonite International SA (Consumer discretionary, Textiles, apparel & luxury goods) 144A† | | | | | 594,500 | 1,565,185 |
| | | | | | | 5,831,923 |
| Total Common stocks (Cost $58,538,050) | | | | | | 55,493,190 |
| Investment companies: 2.37% | | | | | | |
| United States: 2.37% | | | | | | |
| iShares MSCI ACWI ex US ETF « | | | | | 30,802 | 1,401,491 |
| Total Investment companies (Cost $1,382,165) | | | | | | 1,401,491 |
| | | Yield | | | | |
| Short-term investments: 4.76% | | | | | | |
| Investment companies: 4.76% | | | | | | |
| Allspring Government Money Market Fund Select Class ♠∞ | | 4.09% | | | 1,439,313 | 1,439,313 |
| Securities Lending Cash Investments LLC ♠∩∞ | | 4.36 | | | 1,372,447 | 1,372,447 |
| Total Short-term investments (Cost $2,811,760) | | | | | | 2,811,760 |
| Total investments in securities (Cost $62,731,975) | 101.07% | | | | | 59,706,441 |
| Other assets and liabilities, net | (1.07) | | | | | (634,303) |
| Total net assets | 100.00% | | | | | $59,072,138 |
| 144A | The security may be resold in transactions exempt from registration, normally to qualified institutional buyers, pursuant to Rule 144A under the Securities Act of 1933. |
| † | Non-income-earning security |
| « | All or a portion of this security is on loan. |
| ♠ | The issuer of the security is an affiliated person of the Fund as defined in the Investment Company Act of 1940. |
| ∩ | The investment is a non-registered investment company purchased with cash collateral received from securities on loan. |
| ∞ | The rate represents the 7-day annualized yield at period end. |
| Abbreviations: |
| ADR | American depositary receipt |
| GDR | Global depositary receipt |
The accompanying notes are an integral part of these financial statements.
Allspring VT International Equity Fund | 13
Portfolio of investments—December 31, 2022
Investments in affiliates
An affiliated investment is an investment in which the Fund owns at least 5% of the outstanding voting shares of the issuer or as a result of other relationships, such as the Fund and the issuer having the same investment manager. Transactions with issuers that were affiliates of the Fund at the end of the period were as follows:
| | Value,
beginning of
period | Purchases | Sales
proceeds | Net
realized
gains
(losses) | | Net
change in
unrealized
gains
(losses) | | Value,
end of
period | Shares,
end
of period | Income
from
affiliated
securities |
| Short-term investments | | | | | | | | | |
| Allspring Government Money Market Fund Select Class | $474,235 | $25,527,052 | $(24,561,974) | $ 0 | | $0 | | $ 1,439,313 | 1,439,313 | $ 26,491 |
| Securities Lending Cash Investments LLC | 0 | 15,663,231 | (14,290,831) | 47 | | 0 | | 1,372,447 | 1,372,447 | 15,605 # |
| | | | | $47 | | $0 | | $2,811,760 | | $42,096 |
| # | Amount shown represents income before fees and rebates. |
The accompanying notes are an integral part of these financial statements.
14 | Allspring VT International Equity Fund
Statement of assets and liabilities—December 31, 2022
| | |
| Assets | |
Investments in unaffiliated securities (including $1,328,600 of securities loaned), at value (cost $59,920,215)
| $ 56,894,681 |
Investments in affiliated securities, at value (cost $2,811,760)
| 2,811,760 |
Foreign currency, at value (cost $357,962)
| 357,112 |
Receivable for dividends
| 347,843 |
Receivable for investments sold
| 333,127 |
Receivable for securities lending income, net
| 965 |
Prepaid expenses and other assets
| 678 |
Total assets
| 60,746,166 |
| Liabilities | |
Payable upon receipt of securities loaned
| 1,372,447 |
Payable for investments purchased
| 158,400 |
Payable for Fund shares redeemed
| 55,137 |
Overdraft due to custodian bank
| 27,075 |
Management fee payable
| 13,505 |
Distribution fee payable
| 10,523 |
Administration fees payable
| 4,278 |
Trustees’ fees and expenses payable
| 2,646 |
Accrued expenses and other liabilities
| 30,017 |
Total liabilities
| 1,674,028 |
Total net assets
| $59,072,138 |
| Net assets consist of | |
Paid-in capital
| $ 64,210,047 |
Total distributable loss
| (5,137,909) |
Total net assets
| $59,072,138 |
| Computation of net asset value per share | |
Net assets – Class 1
| $ 12,509,314 |
Shares outstanding – Class 11
| 7,512,266 |
Net asset value per share – Class 1
| $1.67 |
Net assets – Class 2
| $ 46,562,824 |
Shares outstanding – Class 21
| 26,949,479 |
Net asset value per share – Class 2
| $1.73 |
| 1 | The Fund has an unlimited number of authorized shares. |
The accompanying notes are an integral part of these financial statements.
Allspring VT International Equity Fund | 15
Statement of operations—year ended December 31, 2022
| | |
| Investment income | |
Dividends (net of foreign withholdings taxes of $149,156)
| $ 1,737,531 |
Income from affiliated securities
| 34,672 |
Total investment income
| 1,772,203 |
| Expenses | |
Management fee
| 499,462 |
| Administration fees | |
Class 1
| 10,719 |
Class 2
| 39,228 |
| Distribution fee | |
Class 2
| 122,404 |
Custody and accounting fees
| 63,913 |
Professional fees
| 55,175 |
Shareholder report expenses
| 47,375 |
Trustees’ fees and expenses
| 21,078 |
Other fees and expenses
| 27,942 |
Total expenses
| 887,296 |
| Less: Fee waivers and/or expense reimbursements | |
Fund-level
| (333,592) |
Net expenses
| 553,704 |
Net investment income
| 1,218,499 |
| Realized and unrealized gains (losses) on investments | |
| Net realized gains on | |
Unaffiliated securities
| 49,400 |
Affiliated securities
| 47 |
Net realized gains on investments
| 49,447 |
Net change in unrealized gains (losses) on investments
| (9,529,985) |
Net realized and unrealized gains (losses) on investments
| (9,480,538) |
Net decrease in net assets resulting from operations
| $(8,262,039) |
The accompanying notes are an integral part of these financial statements.
16 | Allspring VT International Equity Fund
Statement of changes in net assets
| | | | | |
| | Year ended
December 31, 2022 | Year ended
December 31, 2021 |
| Operations | | | | |
Net investment income
| | $ 1,218,499 | | $ 1,438,545 |
Net realized gains on investments
| | 49,447 | | 8,785,320 |
Net change in unrealized gains (losses) on investments
| | (9,529,985) | | (4,975,819) |
Net increase (decrease) in net assets resulting from operations
| | (8,262,039) | | 5,248,046 |
| Distributions to shareholders from | | | | |
| Net investment income and net realized gains | | | | |
Class 1
| | (541,184) | | (234,100) |
Class 2
| | (1,784,190) | | (636,482) |
Total distributions to shareholders
| | (2,325,374) | | (870,582) |
| Capital share transactions | Shares | | Shares | |
| Proceeds from shares sold | | | | |
Class 1
| 333,410 | 598,170 | 428,824 | 852,667 |
Class 2
| 733,332 | 1,309,787 | 1,124,312 | 2,325,463 |
| | | 1,907,957 | | 3,178,130 |
| Reinvestment of distributions | | | | |
Class 1
| 342,521 | 541,184 | 117,638 | 234,100 |
Class 2
| 1,087,921 | 1,784,190 | 307,479 | 636,482 |
| | | 2,325,374 | | 870,582 |
| Payment for shares redeemed | | | | |
Class 1
| (1,347,073) | (2,306,169) | (1,801,937) | (3,540,869) |
Class 2
| (2,880,110) | (5,031,532) | (3,293,961) | (6,748,163) |
| | | (7,337,701) | | (10,289,032) |
Net decrease in net assets resulting from capital share transactions
| | (3,104,370) | | (6,240,320) |
Total decrease in net assets
| | (13,691,783) | | (1,862,856) |
| Net assets | | | | |
Beginning of period
| | 72,763,921 | | 74,626,777 |
End of period
| | $ 59,072,138 | | $ 72,763,921 |
The accompanying notes are an integral part of these financial statements.
Allspring VT International Equity Fund | 17
Financial highlights
(For a share outstanding throughout each period)
| | Year ended December 31 |
| Class 1 | 2022 | 2021 | 2020 | 2019 | 2018 |
Net asset value, beginning of period
| $1.96 | $1.85 | $1.83 | $2.85 | $5.34 |
Net investment income
| 0.04 | 0.04 | 0.03 1 | 0.06 1 | 0.10 1 |
Net realized and unrealized gains (losses) on investments
| (0.26) | 0.10 | 0.04 | 0.34 | (0.77) |
Total from investment operations
| (0.22) | 0.14 | 0.07 | 0.40 | (0.67) |
| Distributions to shareholders from | | | | | |
Net investment income
| (0.07) | (0.03) | (0.05) | (0.13) | (0.61) |
Net realized gains
| 0.00 | 0.00 | 0.00 | (1.29) | (1.21) |
Total distributions to shareholders
| (0.07) | (0.03) | (0.05) | (1.42) | (1.82) |
Net asset value, end of period
| $1.67 | $1.96 | $1.85 | $1.83 | $2.85 |
Total return2
| (10.95)% | 7.39% | 4.31% | 16.14% | (16.86)% |
| Ratios to average net assets (annualized) | | | | | |
Gross expenses
| 1.22% | 1.13% | 1.13% | 1.13% | 1.12% |
Net expenses
| 0.69% | 0.69% | 0.69% | 0.69% | 0.69% |
Net investment income
| 2.15% | 2.07% | 1.59% | 2.55% | 2.41% |
| Supplemental data | | | | | |
Portfolio turnover rate
| 63% | 65% | 80% | 48% | 51% |
Net assets, end of period (000s omitted)
| $12,509 | $16,019 | $17,459 | $19,872 | $19,315 |
| 1 | Calculated based upon average shares outstanding |
| 2 | Returns do not reflect fees and expenses charged pursuant to the terms of variable life insurance policies and variable annuity contracts. |
The accompanying notes are an integral part of these financial statements.
18 | Allspring VT International Equity Fund
Financial highlights
(For a share outstanding throughout each period)
| | Year ended December 31 |
| Class 2 | 2022 | 2021 | 2020 | 2019 | 2018 |
Net asset value, beginning of period
| $2.03 | $1.91 | $1.89 | $2.89 | $5.38 |
Net investment income
| 0.04 | 0.04 | 0.03 1 | 0.05 1 | 0.09 1 |
Net realized and unrealized gains (losses) on investments
| (0.27) | 0.10 | 0.03 | 0.36 | (0.78) |
Total from investment operations
| (0.23) | 0.14 | 0.06 | 0.41 | (0.69) |
| Distributions to shareholders from | | | | | |
Net investment income
| (0.07) | (0.02) | (0.04) | (0.12) | (0.59) |
Net realized gains
| 0.00 | 0.00 | 0.00 | (1.29) | (1.21) |
Total distributions to shareholders
| (0.07) | (0.02) | (0.04) | (1.41) | (1.80) |
Net asset value, end of period
| $1.73 | $2.03 | $1.91 | $1.89 | $2.89 |
Total return2
| (11.37)% | 7.43% | 3.83% | 16.10% | (17.28)% |
| Ratios to average net assets (annualized) | | | | | |
Gross expenses
| 1.47% | 1.38% | 1.38% | 1.38% | 1.30% |
Net expenses
| 0.94% | 0.94% | 0.94% | 0.94% | 0.94% |
Net investment income
| 1.90% | 1.83% | 1.34% | 2.30% | 1.82% |
| Supplemental data | | | | | |
Portfolio turnover rate
| 63% | 65% | 80% | 48% | 51% |
Net assets, end of period (000s omitted)
| $46,563 | $56,744 | $57,167 | $61,907 | $59,004 |
| 1 | Calculated based upon average shares outstanding |
| 2 | Returns do not reflect fees and expenses charged pursuant to the terms of variable life insurance policies and variable annuity contracts. |
The accompanying notes are an integral part of these financial statements.
Allspring VT International Equity Fund | 19
Notes to financial statements
1. ORGANIZATION
Allspring Variable Trust (the "Trust"), a Delaware statutory trust organized on March 10, 1999, is an open-end management investment company registered under the Investment Company Act of 1940, as amended (the "1940 Act"). As an investment company, the Trust follows the accounting and reporting guidance in Financial Accounting Standards Board ("FASB") Accounting Standards Codification Topic 946, Financial Services – Investment Companies. These financial statements report on the Allspring VT International Equity Fund (the "Fund") which is a diversified series of the Trust. The Trust offers shares of the Fund to separate accounts of various life insurance companies as funding vehicles for certain variable annuity contracts and variable life insurance policies.
2. SIGNIFICANT ACCOUNTING POLICIES
The following significant accounting policies, which are consistently followed in the preparation of the financial statements of the Fund, are in conformity with U.S. generally accepted accounting principles which require management to make estimates and assumptions that affect the reported amounts of assets and liabilities, disclosure of contingent assets and liabilities at the date of the financial statements, and the reported amounts of income and expenses during the reporting period. Actual results could differ from those estimates.
Securities valuation
All investments are valued each business day as of the close of regular trading on the New York Stock Exchange (generally 4 p.m. Eastern Time), although the Fund may deviate from this calculation time under unusual or unexpected circumstances.
Equity securities and exchange-traded funds that are listed on a foreign or domestic exchange or market are valued at the official closing price or, if none, the last sales price.
The values of securities denominated in foreign currencies are translated into U.S. dollars at rates provided by an independent foreign currency pricing source at a time each business day specified by the Allspring Global Investments Valuation Committee at Allspring Funds Management, LLC ("Allspring Funds Management").
Many securities markets and exchanges outside the U.S. close prior to the close of the New York Stock Exchange and therefore may not fully reflect trading or events that occur after the close of the principal exchange in which the foreign securities are traded, but before the close of the New York Stock Exchange. If such trading or events are expected to materially affect the value of such securities, then fair value pricing procedures implemented by Allspring Funds Management are applied. These procedures take into account multiple factors including movements in U.S. securities markets after foreign exchanges close. Foreign securities that are fair valued under these procedures are categorized as Level 2 and the application of these procedures may result in transfers between Level 1 and Level 2. Depending on market activity, such fair valuations may be frequent. Such fair value pricing may result in net asset values that are higher or lower than net asset values based on the last reported sales price or latest quoted bid price. On December 31, 2022, such fair value pricing was used in pricing certain foreign securities.
Forward foreign currency contracts are recorded at the forward rate provided by an independent foreign currency pricing source at a time each business day specified by the Allspring Global Investments Valuation Committee.
Investments in registered open-end investment companies (other than those listed on a foreign or domestic exchange or market) are valued at net asset value. Interests in non-registered investment companies that are redeemable at net asset value are fair valued normally at net asset value.
Investments which are not valued using the methods discussed above are valued at their fair value, as determined in good faith by Allspring Funds Management, which was named the valuation designee by the Board of Trustees. As the valuation designee, Allspring Funds Management is responsible for day-to-day valuation activities for the Allspring Funds. In connection with these responsibilities, Allspring Funds Management has established a Valuation Committee and has delegated to it the authority to take any actions regarding the valuation of portfolio securities that the Valuation Committee deems necessary or appropriate, including determining the fair value of portfolio securities. On a quarterly basis, the Board of Trustees receives reports of valuation actions taken by the Valuation Committee. On at least an annual basis, the Board of Trustees receives an assessment of the adequacy and effectiveness of Allspring Funds Management's process for determining the fair value of the portfolio of investments.
Foreign currency translation
The accounting records of the Fund are maintained in U.S. dollars. The values of other assets and liabilities denominated in foreign currencies are translated into U.S. dollars at rates provided by an independent foreign currency pricing source at a time each business day specified by the Allspring Global Investments Valuation Committee. Purchases and sales of securities, and
20 | Allspring VT International Equity Fund
Notes to financial statements
income and expenses are converted at the rate of exchange on the respective dates of such transactions. Net realized foreign exchange gains or losses arise from sales of foreign currencies, currency gains or losses realized between the trade and settlement dates on securities transactions, and the difference between the amounts of dividends, interest and foreign withholding taxes recorded and the U.S. dollar equivalent of the amounts actually paid or received. Net unrealized foreign exchange gains and losses arise from changes in the fair value of assets and liabilities other than investments in securities resulting from changes in exchange rates. The changes in net assets arising from changes in exchange rates of securities and the changes in net assets resulting from changes in market prices of securities are not separately presented. Such changes are included in net realized and unrealized gains or losses from investments.
Forward foreign currency contracts
A forward foreign currency contract is an agreement between two parties to purchase or sell a specific currency for an agreed-upon price at a future date. The Fund enters into forward foreign currency contracts to facilitate transactions in foreign-denominated securities and to attempt to minimize the risk to the Fund from adverse changes in the relationship between currencies. Forward foreign currency contracts are recorded at the forward rate and marked-to-market daily. When the contracts are closed, realized gains and losses arising from such transactions are recorded as realized gains or losses on forward foreign currency contracts. The Fund is subject to foreign currency risk and may be exposed to risks if the counterparties to the contracts are unable to meet the terms of their contracts or if the value of the foreign currency changes unfavorably. The Fund's maximum risk of loss from counterparty credit risk is the unrealized gains on the contracts. This risk may be mitigated if there is a master netting arrangement between the Fund and the counterparty.
Securities lending
The Fund may lend its securities from time to time in order to earn additional income in the form of fees or interest on securities received as collateral or the investment of any cash received as collateral. When securities are on loan, the Fund receives interest or dividends on those securities. Cash collateral received in connection with its securities lending transactions is invested in Securities Lending Cash Investments, LLC (the "Securities Lending Fund"), an affiliated non-registered investment company. Investments in Securities Lending Fund are valued at the evaluated bid price provided by an independent pricing service. Income earned from investment in the Securities Lending Fund (net of fees and rebates), if any, is included in income from affiliated securities on the Statement of Operations.
In a securities lending transaction, the net asset value of the Fund is affected by an increase or decrease in the value of the securities loaned and by an increase or decrease in the value of the instrument in which collateral is invested. The amount of securities lending activity undertaken by the Fund fluctuates from time to time. The Fund has the right under the lending agreement to recover the securities from the borrower on demand. In the event of default or bankruptcy by the borrower, the Fund may be prevented from recovering the loaned securities or gaining access to the collateral or may experience delays or costs in doing so. In such an event, the terms of the agreement allow the unaffiliated securities lending agent to use the collateral to purchase replacement securities on behalf of the Fund or pay the Fund the market value of the loaned securities. The Fund bears the risk of loss with respect to depreciation of its investment of the cash collateral.
Security transactions and income recognition
Securities transactions are recorded on a trade date basis. Realized gains or losses are recorded on the basis of identified cost.
Dividend income is recognized on the ex-dividend date, except for certain dividends from foreign securities, which are recorded as soon as the custodian verifies the ex-dividend date. Dividend income is recorded net of foreign taxes withheld where recovery of such taxes is not assured.
Distributions to shareholders
Distributions to shareholders from net investment income and any net realized gains are recorded on the ex-dividend date and paid at least annually. Such distributions are determined in accordance with income tax regulations and may differ from U.S. generally accepted accounting principles. Dividend sources are estimated at the time of declaration. The tax character of distributions is determined as of the Fund's fiscal year end. Therefore, a portion of the Fund's distributions made prior to the Fund’s fiscal year end may be categorized as a tax return of capital at year end.
Federal and other taxes
The Fund intends to continue to qualify as a regulated investment company by distributing substantially all of its investment company taxable income and any net realized capital gains (after reduction for capital loss carryforwards) sufficient to relieve it from all, or substantially all, federal income taxes. Accordingly, no provision for federal income taxes was required.
The Fund’s income and federal excise tax returns and all financial records supporting those returns for the prior three fiscal years are subject to examination by the federal and Delaware revenue authorities. Management has analyzed the Fund's tax
Allspring VT International Equity Fund | 21
Notes to financial statements
positions taken on federal, state, and foreign tax returns, as applicable, for all open tax years and does not believe that there are any uncertain tax positions that require recognition of a tax liability.
As of December 31, 2022, the aggregate cost of all investments for federal income tax purposes was $63,620,310 and the unrealized gains (losses) consisted of:
| Gross unrealized gains | $ 3,968,247 |
| Gross unrealized losses | (7,882,116) |
| Net unrealized losses | $(3,913,869) |
As of December 31, 2022, the Fund had capital loss carryforwards which consisted of $2,114,887 in short-term capital losses.
Class allocations
The separate classes of shares offered by the Fund differ principally in distribution fees. Class specific expenses are charged directly to that share class. Investment income, common fund-level expenses, and realized and unrealized gains (losses) on investments are allocated daily to each class of shares based on the relative proportion of net assets of each class.
3. FAIR VALUATION MEASUREMENTS
Fair value measurements of investments are determined within a framework that has established a fair value hierarchy based upon the various data inputs utilized in determining the value of the Fund’s investments. The three-level hierarchy gives the highest priority to unadjusted quoted prices in active markets for identical assets or liabilities (Level 1) and the lowest priority to unobservable inputs (Level 3). The Fund’s investments are classified within the fair value hierarchy based on the lowest level of input that is significant to the fair value measurement. The inputs are summarized into three broad levels as follows:
| ■ | Level 1 – quoted prices in active markets for identical securities |
| ■ | Level 2 – other significant observable inputs (including quoted prices for similar securities, interest rates, prepayment speeds, credit risk, etc.) |
| ■ | Level 3 – significant unobservable inputs (including the Fund’s own assumptions in determining the fair value of investments) |
The inputs or methodologies used for valuing investments in securities are not necessarily an indication of the risk associated with investing in those securities.
22 | Allspring VT International Equity Fund
Notes to financial statements
The following is a summary of the inputs used in valuing the Fund’s assets and liabilities as of December 31, 2022:
| | Quoted prices
(Level 1) | Other significant
observable inputs
(Level 2) | Significant
unobservable inputs
(Level 3) | Total |
| Assets | | | | |
| Investments in: | | | | |
| Common stocks | | | | |
| Australia | $ 1,322,792 | $ 0 | $0 | $ 1,322,792 |
| Brazil | 0 | 893,067 | 0 | 893,067 |
| Canada | 1,191,741 | 0 | 0 | 1,191,741 |
| China | 5,418,820 | 0 | 0 | 5,418,820 |
| France | 3,791,230 | 0 | 0 | 3,791,230 |
| Germany | 1,519,343 | 0 | 0 | 1,519,343 |
| Hong Kong | 555,115 | 0 | 0 | 555,115 |
| India | 890,877 | 0 | 0 | 890,877 |
| Ireland | 1,210,247 | 0 | 0 | 1,210,247 |
| Israel | 880,471 | 0 | 0 | 880,471 |
| Italy | 2,294,927 | 0 | 0 | 2,294,927 |
| Japan | 7,636,171 | 0 | 0 | 7,636,171 |
| Mexico | 1,274,307 | 0 | 0 | 1,274,307 |
| Netherlands | 3,202,722 | 0 | 0 | 3,202,722 |
| Norway | 1,271,543 | 0 | 0 | 1,271,543 |
| South Korea | 1,330,420 | 3,613,344 | 0 | 4,943,764 |
| Thailand | 3,145,181 | 0 | 0 | 3,145,181 |
| United Kingdom | 8,218,949 | 0 | 0 | 8,218,949 |
| United States | 5,831,923 | 0 | 0 | 5,831,923 |
| Investment companies | 1,401,491 | 0 | 0 | 1,401,491 |
| Short-term investments | | | | |
| Investment companies | 2,811,760 | 0 | 0 | 2,811,760 |
| Total assets | $55,200,030 | $4,506,411 | $0 | $59,706,441 |
Additional sector, industry or geographic detail, if any, is included in the Portfolio of Investments.
For the year ended December 31, 2022, the Fund did not have any transfers into/out of Level 3.
4. TRANSACTIONS WITH AFFILIATES
Management fee
Allspring Funds Management, a wholly owned subsidiary of Allspring Global Investments Holdings, LLC, a holding company indirectly owned by certain private funds of GTCR LLC and Reverence Capital Partners, L.P., is the manager of the Fund and provides advisory and fund-level administrative services under an investment management agreement. Under the investment management agreement, Allspring Funds Management is responsible for, among other services, implementing the investment objectives and strategies of the Fund, supervising the subadviser and providing fund-level administrative services in connection with the Fund’s operations. As compensation for its services under the investment management agreement, Allspring Funds Management is entitled to receive a management fee at the following annual rate based on the Fund’s average daily net assets:
Allspring VT International Equity Fund | 23
Notes to financial statements
| Average daily net assets | Management fee |
| First $500 million | 0.800% |
| Next $500 million | 0.750 |
| Next $1 billion | 0.700 |
| Next $2 billion | 0.675 |
| Next $1 billion | 0.650 |
| Next $5 billion | 0.640 |
| Over $10 billion | 0.630 |
For the year ended December 31, 2022, the management fee was equivalent to an annual rate of 0.80% of the Fund’s average daily net assets.
Allspring Funds Management has retained the services of a subadviser to provide daily portfolio management to the Fund. The fee for subadvisory services is borne by Allspring Funds Management. Allspring Global Investments, LLC ("Allspring Investments"), an affiliate of Allspring Funds Management and a wholly owned subsidiary of Allspring Global Investments Holdings, LLC, is the subadviser to the Fund and is entitled to receive a fee from Allspring Funds Management at an annual rate starting at 0.45% and declining to 0.40% as the average daily net assets of the Fund increase.
Administration fees
Under a class-level administration agreement, Allspring Funds Management provides class-level administrative services to the Fund, which includes paying fees and expenses for services provided by the transfer agent, sub-transfer agents, omnibus account services and record-keepers. As compensation for its services under the class-level administration agreement, Allspring Funds Management receives an annual fee of 0.08% which is calculated based on the average daily net assets of each class.
Waivers and/or expense reimbursements
Allspring Funds Management has contractually committed to waive and/or reimburse management and administration fees to the extent necessary to maintain certain net operating expense ratios for the Fund. When each class of the Fund has exceeded its expense cap, Allspring Funds Management will waive fees and/or reimburse expenses from fund-level expenses on a proportionate basis and then from class specific expenses. When only certain classes exceed their expense caps, waivers and/or reimbursements are applied against class specific expenses before fund-level expenses. Allspring Funds Management has contractually committed through April 30, 2023 to waive fees and/or reimburse expenses to the extent necessary to cap expenses. Prior to or after the commitment expiration date, the caps may be increased or the commitment to maintain the caps may be terminated only with the approval of the Board of Trustees. As of December 31, 2022, the contractual expense caps are as follows:
| | Expense ratio caps |
| Class 1 | 0.69% |
| Class 2 | 0.94 |
Distribution fee
The Trust has adopted a distribution plan for Class 2 shares pursuant to Rule 12b-1 under the 1940 Act. A distribution fee is charged to Class 2 shares and paid to Allspring Funds Distributor, LLC, the principal underwriter, an affiliate of Allspring Funds Management, at an annual rate up to 0.25% of the average daily net assets of Class 2 shares.
Interfund transactions
The Fund may purchase or sell portfolio investment securities to certain affiliates pursuant to Rule 17a-7 under the 1940 Act and under procedures adopted by the Board of Trustees. The procedures have been designed to ensure that these interfund transactions, which do not incur broker commissions, are effected at current market prices.
5. INVESTMENT PORTFOLIO TRANSACTIONS
Purchases and sales of investments, excluding U.S. government obligations (if any) and short-term securities, for the year ended December 31, 2022 were $38,626,781 and $44,027,179, respectively.
24 | Allspring VT International Equity Fund
Notes to financial statements
6. SECURITIES LENDING TRANSACTIONS
The Fund lends its securities through an unaffiliated securities lending agent and receives collateral in the form of cash or securities with a value at least equal to the value of the securities on loan. The value of the loaned securities is determined at the close of each business day and any increases or decreases in the required collateral are exchanged between the Fund and the counterparty on the next business day. Cash collateral received is invested in the Securities Lending Fund which seeks to provide a positive return compared to the daily Federal Funds Open Rate by investing in high-quality, U.S. dollar-denominated short-term money market instruments and is exempt from registration under Section 3(c)(7) of the 1940 Act. Securities Lending Fund is managed by Allspring Funds Management and is subadvised by Allspring Investments. Allspring Funds Management receives an advisory fee starting at 0.05% and declining to 0.01% as the average daily net assets of the Securities Lending Fund increase. All of the fees received by Allspring Funds Management are paid to Allspring Investments for its services as subadviser.
In the event of counterparty default or the failure of a borrower to return a loaned security, the Fund has the right to use the collateral to offset any losses incurred. As of December 31, 2022, the Fund had securities lending transactions with the following counterparties which are subject to offset:
| Counterparty | Value of
securities on
loan | Collateral
received1 | Net amount |
| Bank of America Securities Incorporated | $855,400 | $(855,400) | $0 |
| JPMorgan Securities LLC | 36,400 | (36,400) | 0 |
| Morgan Stanley & Company LLC | 436,800 | (436,800) | 0 |
1 Collateral disclosed within this table is limited to the net transaction with the counterparty.
7. BANK BORROWINGS
The Trust, Allspring Master Trust and Allspring Funds Trust (excluding the money market funds) are parties to a $350,000,000 revolving credit agreement whereby the Fund is permitted to use bank borrowings for temporary or emergency purposes, such as to fund shareholder redemption requests. Interest under the credit agreement is charged to the Fund based on a borrowing rate equal to the higher of the Federal Funds rate or the overnight bank funding rate in effect on that day plus a spread. In addition, an annual commitment fee equal based on the unused balance is allocated to each participating fund.
For the year ended December 31, 2022, there were no borrowings by the Fund under the agreement.
8. DISTRIBUTIONS TO SHAREHOLDERS
The tax character of distributions paid was $2,325,374 and $870,582 of ordinary income for the years ended December 31, 2022 and December 31, 2021, respectively.
As of December 31, 2022, the components of distributable earnings on a tax basis were as follows:
Undistributed
ordinary
income | Unrealized
losses | Capital loss
carryforward |
| $912,472 | $(3,931,091) | $(2,114,887) |
9. CONCENTRATION RISKS
As of the end of the period, the Fund concentrated its portfolio of investments in Asia/Pacific ex-Japan and Europe. A fund that invests a substantial portion of its assets in any geographic region may be more affected by changes in that geographic region than would be a fund whose investments are not heavily weighted in any geographic region.
10. MARKET RISKS
On March 11, 2020, the World Health Organization announced that it had made the assessment that coronavirus disease 2019 (“COVID-19”) is a pandemic. The impacts of COVID-19 are affecting the entire global economy, individual companies and investment products, the funds, and the market in general. There is significant uncertainty around the extent and duration of
Allspring VT International Equity Fund | 25
Notes to financial statements
business disruptions related to COVID-19 and the impacts may last for an extended period of time. COVID-19 has led to significant uncertainty and volatility in the financial markets.
11. INDEMNIFICATION
Under the Fund's organizational documents, the officers and Trustees have been granted certain indemnification rights against certain liabilities that may arise out of performance of their duties to the Fund. The Fund has entered into a separate agreement with each Trustee that converts indemnification rights currently existing under the Fund’s organizational documents into contractual rights that cannot be changed in the future without the consent of the Trustee. Additionally, in the normal course of business, the Fund may enter into contracts with service providers that contain a variety of indemnification clauses. The Fund’s maximum exposure under these arrangements is dependent on future claims that may be made against the Fund and, therefore, cannot be estimated.
26 | Allspring VT International Equity Fund
Report of independent registered public accounting firm
To the Shareholders of the Fund and Board of Trustees
Allspring Variable Trust:
Opinion on the Financial Statements
We have audited the accompanying statement of assets and liabilities of Allspring VT International Equity Fund (the Fund), one of the funds constituting Allspring Variable Trust, including the portfolio of investments, as of December 31, 2022, the related statement of operations for the year then ended, the statements of changes in net assets for each of the years in the two-year period then ended, and the related notes (collectively, the financial statements) and the financial highlights for each of the years in the five-year period then ended. In our opinion, the financial statements and financial highlights present fairly, in all material respects, the financial position of the Fund as of December 31, 2022, the results of its operations for the year then ended, the changes in its net assets for each of the years in the two-year period then ended, and the financial highlights for each of the years in the five-year period then ended, in conformity with U.S. generally accepted accounting principles.
Basis for Opinion
These financial statements and financial highlights are the responsibility of the Fund’s management. Our responsibility is to express an opinion on these financial statements and financial highlights based on our audits. We are a public accounting firm registered with the Public Company Accounting Oversight Board (United States) (PCAOB) and are required to be independent with respect to the Fund in accordance with the U.S. federal securities laws and the applicable rules and regulations of the Securities and Exchange Commission and the PCAOB.
We conducted our audits in accordance with the standards of the PCAOB. Those standards require that we plan and perform the audit to obtain reasonable assurance about whether the financial statements and financial highlights are free of material misstatement, whether due to error or fraud. Our audits included performing procedures to assess the risks of material misstatement of the financial statements and financial highlights, whether due to error or fraud, and performing procedures that respond to those risks. Such procedures included examining, on a test basis, evidence regarding the amounts and disclosures in the financial statements and financial highlights. Such procedures also included confirmation of securities owned as of December 31, 2022, by correspondence with the custodian, transfer agent and brokers, or by other appropriate auditing procedures. Our audits also included evaluating the accounting principles used and significant estimates made by management, as well as evaluating the overall presentation of the financial statements and financial highlights. We believe that our audits provide a reasonable basis for our opinion.

We have not been able to determine the specific year that we began serving as the auditor of one or more Allspring Funds investment companies; however, we are aware that we have served as the auditor of one or more Allspring Funds investment companies since at least 1955.
Boston, Massachusetts
February 27, 2023
Allspring VT International Equity Fund | 27
Other information (unaudited)
TAX INFORMATION
For corporate shareholders, pursuant to Section 854 of the Internal Revenue Code, 2% of ordinary income dividends qualify for the corporate dividends-received deduction for the fiscal year ended December 31, 2022.
Pursuant to Section 853 of the Internal Revenue Code, the following amounts have been designated as foreign taxes paid for the fiscal year ended December 31, 2022. These amounts may be less than the actual foreign taxes paid for financial statement purposes. Foreign taxes paid or withheld should be included in taxable income with an offsetting deduction from gross income or as a credit for taxes paid to foreign governments. None of the income was derived from ineligible foreign sources as defined under Section 901(j) of the Internal Revenue Code.
Creditable
foreign taxes
paid | Per share
amount | Foreign
income as % of
ordinary income
distributions |
| $145,300 | $0.0042 | 100% |
PROXY VOTING INFORMATION
A description of the policies and procedures used to determine how to vote proxies relating to portfolio securities is available without charge, upon request, by calling 1-800-260-5969, visiting our website at allspringglobal.com, or visiting the SEC website at sec.gov. Information regarding how the proxies related to portfolio securities were voted during the most recent 12-month period ended June 30 is available on the website at allspringglobal.com or by visiting the SEC website at sec.gov.
QUARTERLY PORTFOLIO HOLDINGS INFORMATION
The Fund files its complete schedule of portfolio holdings with the SEC for the first and third quarters of each fiscal year as an exhibit to its reports on Form N-PORT. Shareholders may view the filed Form N-PORT by visiting the SEC website at sec.gov.
28 | Allspring VT International Equity Fund
Other information (unaudited)
BOARD OF TRUSTEES AND OFFICERS
Each of the Trustees and Officers listed in the table below acts in identical capacities for each fund in the Allspring family of funds, which consists of 127 mutual funds comprising the Allspring Funds Trust, Allspring Variable Trust, Allspring Master Trust and four closed-end funds (collectively the “Fund Complex”). This table should be read in conjunction with the Prospectus and the Statement of Additional Information1. The mailing address of each Trustee and Officer is 1415 Vantage Park Drive, 3rd Floor, Charlotte, NC 28203. Each Trustee and Officer serves an indefinite term, however, each Trustee serves such term until reaching the mandatory retirement age established by the Trustees.
Independent Trustees
Name and
year of birth | Position held and
length of service* | Principal occupations during past five years or longer | Current other
public company or
investment
company
directorships |
William R. Ebsworth
(Born 1957) | Trustee,
since 2015 | Retired. From 1984 to 2013, equities analyst, portfolio manager, research director and chief investment officer at Fidelity Management and Research Company in Boston, Tokyo, and Hong Kong, and retired in 2013 as Chief Investment Officer of Fidelity Strategic Advisers, Inc. where he led a team of investment professionals managing client assets. Prior thereto, Board member of Hong Kong Securities Clearing Co., Hong Kong Options Clearing Corp., the Thailand International Fund, Ltd., Fidelity Investments Life Insurance Company, and Empire Fidelity Investments Life Insurance Company. Audit Committee Chair and Investment Committee Chair of the Vincent Memorial Hospital Foundation (non-profit organization). Mr. Ebsworth is a CFA® charterholder. | N/A |
Jane A. Freeman
(Born 1953) | Trustee,
since 2015;
Chair Liaison,
since 2018 | Retired. From 2012 to 2014 and 1999 to 2008, Chief Financial Officer of Scientific Learning Corporation. From 2008 to 2012, Ms. Freeman provided consulting services related to strategic business projects. Prior to 1999, Portfolio Manager at Rockefeller & Co. and Scudder, Stevens & Clark. Board member of the Harding Loevner Funds from 1996 to 2014, serving as both Lead Independent Director and chair of the Audit Committee. Board member of the Russell Exchange Traded Funds Trust from 2011 to 2012 and the chair of the Audit Committee. Ms. Freeman is also an inactive Chartered Financial Analyst. | N/A |
Isaiah Harris, Jr.
(Born 1952) | Trustee,
since 2009; Audit
Committee
Chair,
since 2019 | Retired. Member of the Advisory Board of CEF of East Central Florida. Chairman of the Board of CIGNA Corporation from 2009 to 2021, and Director from 2005 to 2008. From 2003 to 2011, Director of Deluxe Corporation. Prior thereto, President and CEO of BellSouth Advertising and Publishing Corp. from 2005 to 2007, President and CEO of BellSouth Enterprises from 2004 to 2005 and President of BellSouth Consumer Services from 2000 to 2003. Emeritus member of the Iowa State University Foundation Board of Governors. Emeritus Member of the Advisory Board of Iowa State University School of Business. Advisory Board Member, Palm Harbor Academy (private school). Advisory Board Member, Fellowship of Christian Athletes. Mr. Harris is a certified public accountant (inactive status). | N/A |
David F. Larcker
(Born 1950) | Trustee,
since 2009 | Distinguished Visiting Fellow at the Hoover Institution since 2022. James Irvin Miller Professor of Accounting at the Graduate School of Business (Emeritus), Stanford University, Director of the Corporate Governance Research Initiative and Senior Faculty of The Rock Center for Corporate Governance since 2006. From 2005 to 2008, Professor of Accounting at the Graduate School of Business, Stanford University. Prior thereto, Ernst & Young Professor of Accounting at The Wharton School, University of Pennsylvania from 1985 to 2005. | N/A |
Allspring VT International Equity Fund | 29
Other information (unaudited)
Name and
year of birth | Position held and
length of service* | Principal occupations during past five years or longer | Current other
public company or
investment
company
directorships |
Olivia S. Mitchell
(Born 1953) | Trustee,
since 2006;
Nominating and
Governance
Committee Chair,
since 2018 | International Foundation of Employee Benefit Plans Professor since 1993, Wharton School of the University of Pennsylvania. Director of Wharton’s Pension Research Council and Boettner Center on Pensions & Retirement Research, and Research Associate at the National Bureau of Economic Research. Previously taught at Cornell University from 1978 to 1993. | N/A |
Timothy J. Penny
(Born 1951) | Trustee,
since 1996;
Chair,
since 2018 | President and Chief Executive Officer of Southern Minnesota Initiative Foundation, a non-profit organization, since 2007. Vice Chair of the Economic Club of Minnesota, since 2007. Co-Chair of the Committee for a Responsible Federal Budget, since 1995. Member of the Board of Trustees of NorthStar Education Finance, Inc., a non-profit organization, from 2007-2022. Senior Fellow of the University of Minnesota Humphrey Institute from 1995 to 2017. | N/A |
James G. Polisson
(Born 1959) | Trustee,
since 2018 | Retired. Chief Marketing Officer, Source (ETF) UK Services, Ltd, from 2015 to 2017. From 2012 to 2015, Principal of The Polisson Group, LLC, a management consulting, corporate advisory and principal investing company. Chief Executive Officer and Managing Director at Russell Investments, Global Exchange Traded Funds from 2010 to 2012. Managing Director of Barclays Global Investors from 1998 to 2010 and Global Chief Marketing Officer for iShares and Barclays Global Investors from 2000 to 2010. Trustee of the San Francisco Mechanics’ Institute, a non-profit organization, from 2013 to 2015. Board member of the Russell Exchange Traded Fund Trust from 2011 to 2012. Director of Barclays Global Investors Holdings Deutschland GmbH from 2006 to 2009. Mr. Polisson is an attorney and has a retired status with the Massachusetts and District of Columbia Bar Associations. | N/A |
Pamela Wheelock
(Born 1959) | Trustee,
since January
2020; previously
Trustee from
January 2018 to
July 2019 | Retired. Executive and Senior Financial leadership positions in the public, private and nonprofit sectors. Interim President and CEO, McKnight Foundation, 2020. Interim Commissioner, Minnesota Department of Human Services, 2019. Chief Operating Officer, Twin Cities Habitat for Humanity, 2017-2019. Vice President for University Services, University of Minnesota, 2012-2016. Interim President and CEO, Blue Cross and Blue Shield of Minnesota, 2011-2012. Executive Vice-President and Chief Financial Officer, Minnesota Wild, 2002-2008. Commissioner, Minnesota Department of Finance, 1999-2002. Chair of the Board of Directors of Destination Medical Center Corporation. Board member of the Minnesota Wild Foundation. | N/A |
* Length of service dates reflect the Trustee’s commencement of service with the Trust’s predecessor entities, where applicable.
30 | Allspring VT International Equity Fund
Other information (unaudited)
Officers2
Name and
year of birth | Position held and
length of service | Principal occupations during past five years or longer |
Andrew Owen
(Born 1960) | President,
since 2017 | President and Chief Executive Officer of Allspring Funds Management, LLC since 2017 and Head of Global Fund Governance of Allspring Global Investments since 2022. Prior thereto, co-president of Galliard Capital Management, LLC, an affiliate of Allspring Funds Management, LLC, from 2019 to 2022 and Head of Affiliated Managers, Allspring Global Investments, from 2014 to 2019 and Executive Vice President responsible for marketing, investments and product development for Allspring Funds Management, LLC, from 2009 to 2014. |
Jeremy DePalma
(Born 1974) | Treasurer,
since 2012
(for certain funds in
the Fund Complex);
since 2021 (for
the remaining funds in the
Fund Complex) | Senior Vice President of Allspring Funds Management, LLC since 2009. Senior Vice President of Evergreen Investment Management Company, LLC from 2008 to 2010 and head of the Fund Reporting and Control Team within Fund Administration from 2005 to 2010. |
Christopher Baker
(Born 1976) | Chief Compliance Officer, since 2022 | Global Chief Compliance Officer for Allspring Global Investments since 2022. Prior thereto, Chief Compliance Officer for State Street Global Advisors from 2018 to 2021. Senior Compliance Officer for the State Street divisions of Alternative Investment Solutions, Sector Solutions, and Global Marketing from 2015 to 2018. From 2010 to 2015 Vice President, Global Head of Investment and Marketing Compliance for State Street Global Advisors. |
Matthew Prasse
(Born 1983) | Chief Legal Officer, since 2022; Secretary, since 2021 | Senior Counsel of the Allspring Legal Department since 2021. Senior Counsel of the Wells Fargo Legal Department from 2018 to 2021. Previously, Counsel for Barings LLC from 2015 to 2018. Prior to joining Barings, Associate at Morgan, Lewis & Bockius LLP from 2008 to 2015. |
1 The Statement of Additional Information includes additional information about the Trustees and is available, without charge, upon request, by calling 1-800-222-8222 or by visiting the website at allspringglobal.com.
2 For those Officers with tenures at Allspring Global Investments and/or Allspring Funds Management, LLC that began prior to 2021, such tenures include years of service during which these businesses/entities were known as Wells Fargo Asset Management and Wells Fargo Funds Management, LLC, respectively.
Allspring VT International Equity Fund | 31
For more information
More information about Allspring Funds is available free upon request. To obtain literature, please write, visit the Fund's website, or call:
Allspring Funds
P.O. Box 219967
Kansas City, MO 64121-9967
Website: allspringglobal.com
Individual investors: 1-800-260-5969
Retail investment professionals: 1-888-877-9275
Institutional investment professionals: 1-866-765-0778
This report and the financial statements contained herein are submitted for the general information of the shareholders of the Fund. If this report is used for promotional purposes, distribution of the report must be accompanied or preceded by a current prospectus. Before investing, please consider the investment objectives, risks, charges, and expenses of the investment. For a current prospectus and, if available, a summary prospectus, containing this information, call
1-800-260-5969 or visit the Fund's website at allspringglobal.com. Read the prospectus carefully before you invest or send money.
Allspring Global InvestmentsTM is the trade name for the asset management firms of Allspring Global Investments Holdings, LLC, a holding company indirectly owned by certain private funds of GTCR LLC and Reverence Capital Partners, L.P. These firms include but are not limited to Allspring Global Investments, LLC, and Allspring Funds Management, LLC. Certain products managed by Allspring entities are distributed by Allspring Funds Distributor, LLC (a broker-dealer and Member FINRA/SIPC).
This material is for general informational and educational purposes only and is NOT intended to provide investment advice or a recommendation of any kind - including a recommendation for any specific investment, strategy, or plan.
© 2023 Allspring Global Investments Holdings, LLC. All rights reserved.
ALL-01052023-zr5qtvkb 02-23
AR3008 12-22
Annual Report
December 31, 2022
Allspring
VT Omega Growth Fund
The views expressed and any forward-looking statements are as of December 31, 2022, unless otherwise noted, and are those of the Fund's portfolio managers and/or Allspring Global Investments. Discussions of individual securities or the markets generally are not intended as individual recommendations. Future events or results may vary significantly from those expressed in any forward-looking statements. The views expressed are subject to change at any time in response to changing circumstances in the market. Allspring Global Investments disclaims any obligation to publicly update or revise any views expressed or forward-looking statements.
Allspring VT Omega Growth Fund | 1
Letter to shareholders (unaudited)
Andrew Owen
President
Allspring Funds
Dear Shareholder:
We are pleased to offer you this annual report for the Allspring VT Omega Growth Fund for the 12-month period that ended December 31, 2022. Globally, stocks and bonds experienced heightened volatility and historically poor performance through the challenging period. Earlier tailwinds provided by global stimulus programs, vaccination rollouts, and recovering consumer and corporate sentiment were wiped away by the highest rate of inflation in four decades, the impact of ongoing aggressive central bank rate hikes and the prospect of more rate hikes. Compounding these concerns were the global reverberations of the Russia-Ukraine war and the impact of China’s strict COVID-19 lockdowns.
For the 12-month period, both stocks and bonds registered major losses, with even U.S. bonds suffering double-digit losses and other assets faring worse. For the period, U.S. stocks, based on the S&P 500 Index,1 returned -18.11%. International stocks, as measured by the MSCI ACWI ex USA Index (Net),2 returned -16.00%, while the MSCI EM Index (Net) (USD)3 had weaker performance with a decline of 20.09%. Among bond indexes, the Bloomberg U.S. Aggregate Bond Index4 returned -13.01%, the Bloomberg Global Aggregate ex-USD Index (unhedged)5 returned -18.70%, the Bloomberg Municipal Bond Index6 declined 8.53%, and the ICE BofA U.S. High Yield Index7 fell 11.17%.
Rising inflation, COVID, and the Russian invasion of Ukraine drove market performance.
In January 2022, concerns mounted about U.S. interest rate hikes and the Russia-Ukraine conflict. The Federal Reserve (Fed) hinted that a March interest rate hike was likely. Meanwhile, Russia threatened a potential invasion of Ukraine, which could disrupt Russia’s massive energy supplies and drive demand from non-Russian oil-producing countries. Elsewhere overseas, Europe saw food and energy prices spike, leading to rising inflation. Within fixed income, corporate bonds struggled in January, trailing government bonds, as investors focused on elevated inflation and the prospect of rising interest rates and tighter money supply.
The Russian invasion of Ukraine dominated the financial world in February and March. Equity, bond, and commodities markets were shaken by fear, uncertainty, and an upending of demand-supply dynamics. Major global stock indexes were down in February, along with global bonds overall, with heightened volatility in March and mixed results that favored U.S. large-cap stocks. Prices of commodities spiked, including crude oil, natural gas, wheat, and precious metals, on elevated concerns of supply shortages. All of this fueled inflation concerns and added to expectations of more aggressive central bank interest rate hikes. Sweeping sanctions against Russia and corporate pullouts contributed to market volatility. Despite the geopolitical turmoil, the U.S. economic outlook remained largely unchanged, with a healthy job market and signs of economic resilience accompanying higher prices.
“ The Russian invasion of Ukraine dominated the financial world in February and March. Equity, bond, and commodities markets were shaken by fear, uncertainty, and an upending of demand-supply dynamics.”
| 1 | The S&P 500 Index consists of 500 stocks chosen for market size, liquidity, and industry group representation. It is a market-value-weighted index with each stock's weight in the index proportionate to its market value. You cannot invest directly in an index. |
| 2 | The Morgan Stanley Capital International (MSCI) All Country World Index (ACWI) ex USA Index (Net) is a free-float-adjusted market-capitalization-weighted index that is designed to measure the equity market performance of developed and emerging markets, excluding the U.S. Source: MSCI. MSCI makes no express or implied warranties or representations and shall have no liability whatsoever with respect to any MSCI data contained herein. The MSCI data may not be further redistributed or used as a basis for other indexes or any securities or financial products. This report is not approved, reviewed, or produced by MSCI. You cannot invest directly in an index. |
| 3 | The MSCI Emerging Markets (EM) Index (Net) (USD) is a free-float-adjusted market-capitalization-weighted index that is designed to measure equity market performance of emerging markets. You cannot invest directly in an index. |
| 4 | The Bloomberg U.S. Aggregate Bond Index is a broad-based benchmark that measures the investment-grade, U.S.-dollar-denominated, fixed-rate taxable bond market, including Treasuries, government-related and corporate securities, mortgage-backed securities (agency fixed-rate and hybrid adjustable-rate mortgage pass-throughs), asset-backed securities, and commercial mortgage-backed securities. You cannot invest directly in an index. |
| 5 | The Bloomberg Global Aggregate ex-USD Index (unhedged) is an unmanaged index that provides a broad-based measure of the global investment-grade fixed-income markets excluding the U.S.-dollar-denominated debt market. You cannot invest directly in an index. |
| 6 | The Bloomberg Municipal Bond Index is an unmanaged index composed of long-term tax-exempt bonds with a minimum credit rating of Baa. You cannot invest directly in an index. |
| 7 | The ICE BofA U.S. High Yield Index is a market-capitalization-weighted index of domestic and Yankee high-yield bonds. The index tracks the performance of high-yield securities traded in the U.S. bond market. You cannot invest directly in an index. Copyright 2023. ICE Data Indices, LLC. All rights reserved. |
2 | Allspring VT Omega Growth Fund
Letter to shareholders (unaudited)
In April, market volatility continued, with deepening losses across major capital markets, as both the S&P 500 and MSCI ACWI (Net)1 fell 8% or more for the month. The Chinese economy struggled through a strict lockdown as the government tried to contain a major COVID-19 outbreak. The ensuing global ripple effect compounded existing supply shortages. This was exacerbated by the impact of the Russia-Ukraine war on global commodities. Meanwhile, U.S. annual inflation raged at 8.5%, its highest level since 1981, and investors braced themselves for aggressive Fed monetary tightening moves.
Market volatility continued in May, although markets recovered ground late in the month. Value stocks continued to outperform growth stocks. The concerns that had dominated markets for months continued, including high inflation and geopolitical tensions that added to high crude oil, gasoline, and food prices. In response, the Fed raised the federal funds rate by 0.50%, with widescale expectations of more rate hikes. Meanwhile, highly contagious COVID-19 variants persisted. However, labor markets in the U.S., the U.K., and Europe remained strong. U.S. retail sales for April, released in May, indicated a fourth consecutive monthly increase, reflecting continued consumer resilience.
In June, stocks posted further losses en route to their worst first half of a year in 50 years. Bonds didn’t fare much better. Driving the losses were the familiar factors: rising global inflation and fears of recession as central banks increased rates to try to curb soaring inflation. The Fed raised its short-term rate by another 0.75% in June. Meanwhile, the U.S. unemployment rate held firm at 3.6% and the housing market remained only marginally affected by sharply higher mortgage rates.
Markets rebounded in July, led by U.S. stocks. While evidence began to point to an economic slowdown after two consecutive quarters of declining gross domestic product (economic contraction), the U.S. labor market remained surprisingly robust: July nonfarm payrolls grew by more than 500,000 and U.S. unemployment dipped to 3.5%. Meanwhile, crude oil and retail gasoline prices, major contributors to recent overall inflation, fell substantially from earlier highs. And while U.S. home prices rose, home sales fell as houses became less affordable with mortgage rates at a 13-year high. The Fed raised the federal funds rate another 0.75% in July—to a range of 2.25% to 2.50%—and forecasts pointed to further rate hikes.
August was yet another broadly challenging month for financial markets, with more red ink flowing. High inflation persisted, cresting 9% in the eurozone on an annual basis and remaining above 8% in the U.S. despite the Fed’s aggressive monetary policy and a major drop in global crude oil and gasoline prices from their June peak. One positive note was the resilience of the U.S. job market. However, the Fed’s job was clearly not complete. One longer-term bright spot was the U.S. Congress’s passage of the Inflation Reduction Act. Its primary stated goals include: to reduce inflation (though not immediately) by curbing the deficit, capping health care spending by seniors, and investing in domestic sources of clean energy.
The market misery continued in September. There was nowhere to hide as all asset classes suffered major losses at the hands of persistent inflation. Central banks kept up their battle against rapidly rising prices with more rate hikes. The strength of the U.S. dollar made things even more difficult for investors holding assets in other currencies. U.S. mortgage rates jumped to near 7% on 30-year fixed-rate mortgages; the decreased housing affordability began to cool demand somewhat. The U.K. experienced a sharp sell-off of government bonds and the British pound in September as investors panicked in response to a new government budget that was seen as financially unsound. The market meltdown forced the Bank of England to step in and buy long-dated government bonds.
Equities had a reprieve in October after two months of sharp declines. Value stocks and small caps fared best. Globally, developed markets outpaced emerging market equities, which were hurt by weakness among Chinese stocks. Central banks continued to try to curtail high inflation with aggressive interest rate hikes. Geopolitical risks persisted, including the ongoing Russia-Ukraine war and economic, financial market, and political turmoil in the U.K., which led to a second prime ministerial change in six weeks, as Rishi Sunak replaced Liz Truss in late October. Concerns over Europe’s energy crisis eased thanks to unseasonably warm weather and plentiful gas on hand. The U.S. labor market continued its resilience against rising prices, as unemployment stood at 3.7%, near a record low.
“ In June, stocks posted further losses en route to their worst first half of a year in 50 years. Bonds didn’t fare much better. Driving the losses were the familiar factors: rising global inflation and fears of recession as central banks increased rates to try to curb soaring inflation.”
| 1 | The MSCI ACWI (Net) is a free-float-adjusted market-capitalization-weighted index that is designed to measure the equity market performance of developed and emerging markets. You cannot invest directly in an index. |
Allspring VT Omega Growth Fund | 3
Letter to shareholders (unaudited)
Stocks and bonds rallied in November, with emerging market equities gaining nearly 15% and developed market equities returning 7%. The S&P 500 Index rose 5.6% in November. Bonds also had positive monthly returns. Economic news was encouraging, driven by U.S. labor market strength. Although central banks kept raising rates, hopes rose for an easing in the pace of rate hikes and a possible end to central bank monetary tightening in 2023. Although inflation remained at record highs in the eurozone, we began to see signs of a possible decline in inflationary pressures as U.S. inflation moderated, with a 7.1% annual price rise in November and a monthly price increase of just 0.1%. China’s economic data remained weak, reflecting its zero-COVID-19 policy.
Financial markets cooled in December, with U.S. equities posting negative overall results in response to a weakening U.S. dollar. Fixed income securities ended one of their worst years ever with flat overall monthly returns as markets weighed the hopes for an end to the monetary tightening cycle with the reality that central banks had not completed their jobs yet. U.S. Consumer Price Index (CPI)1 data showed a strong consistent trend downward, which brought down the 12-month CPI to 6.5% in December from 9.1% in June. Other countries and regions reported still-high but declining inflation rates as the year winded down.
Don’t let short-term uncertainty derail long-term investment goals.
Periods of investment uncertainty can present challenges, but experience has taught us that maintaining long-term investment goals can be an effective way to plan for the future. To help you create a sound strategy based on your personal goals and risk tolerance, Allspring Funds offers more than 100 mutual funds spanning a wide range of asset classes and investment styles. Although diversification cannot guarantee an investment profit or prevent losses, we believe it can be an effective way to manage investment risk and potentially smooth out overall portfolio performance. We encourage investors to know their investments and to understand that appropriate levels of risk-taking may unlock opportunities.
Thank you for choosing to invest with Allspring Funds. We appreciate your confidence in us and remain committed to helping you meet your financial needs.
Sincerely,
Andrew Owen
President
Allspring Funds
Notice to Shareholders
At a meeting held November 16, 2022, the Board of Trustees of the Allspring Funds approved changing the name of the Fund from Allspring VT Omega Growth Fund to Allspring VT Discovery All Cap Growth Fund to be effective on or about May 1, 2023. There will be no change to the Fund’s investment process because of the name change.
For further information about your fund, contact your investment professional, visit our website at allspringglobal.com, or call us directly at 1-800-222-8222.
| 1 | The Consumer Price Index (CPI) is a measure of the average change over time in the prices paid by urban consumers for a market basket of consumer goods and services. You cannot invest directly in an index. |
4 | Allspring VT Omega Growth Fund
This page is intentionally left blank.
Performance highlights (unaudited)
| Investment objective | The Fund seeks long-term capital appreciation. |
| Manager | Allspring Funds Management, LLC |
| Subadviser | Allspring Global Investments, LLC |
| Portfolio managers | Michael T. Smith, CFA®‡, Christopher J. Warner, CFA®‡ |
| Average annual total returns (%) as of December 31, 2022 |
| | | | | | Expense ratios1 (%) |
| | Inception date | 1 year | 5 year | 10 year | Gross | Net 2 |
| Class 1 | 3-6-1997 | -37.04 | 7.52 | 11.23 | 0.78 | 0.75 |
| Class 2 | 7-31-2002 | -37.20 | 7.28 | 10.96 | 1.03 | 1.00 |
| Russell 3000® Growth Index3 | – | -28.97 | 10.45 | 13.75 | – | – |
Figures quoted represent past performance, which is no guarantee of future results. Investment return and principal value of an investment will fluctuate so that an investor’s shares, when redeemed, may be worth more or less than their original cost. Current performance may be lower or higher than the performance data quoted and assumes the reinvestment of dividends and capital gains. Current month-end performance is available by calling 1-800-260-5969. Performance figures of the Fund do not reflect fees and expenses charged pursuant to the terms of variable life insurance policies and variable annuity contracts. If these fees and expenses had been reflected, performance would have been lower.
Index returns do not include transaction costs associated with buying and selling securities, any mutual fund fees or expenses, or any taxes. It is not possible to invest directly in an index.
Shares are sold without a front-end sales charge or contingent deferred sales charge.
| 1 | Reflects the expense ratios as stated in the most recent prospectuses. The expense ratios shown are subject to change and may differ from the annualized expense ratios shown in the financial highlights of this report. |
| 2 | The manager has contractually committed through April 30, 2023, to waive fees and/or reimburse expenses to the extent necessary to cap total annual fund operating expenses after fee waivers at 0.75% for Class 1 shares and 1.00% for Class 2 shares. Brokerage commissions, stamp duty fees, interest, taxes, acquired fund fees and expenses (if any), and extraordinary expenses are excluded from the expense caps. Prior to or after the commitment expiration date, the caps may be increased or the commitment to maintain the caps may be terminated only with the approval of the Board of Trustees. Without these caps, the Fund’s returns would have been lower. The expense ratio paid by an investor is the net expense ratio (the total annual fund operating expenses after fee waivers) as stated in the prospectuses. |
| 3 | The Russell 3000® Growth Index measures the performance of those Russell 3000® Index companies with higher price/book ratios and higher forecasted growth values. You cannot invest directly in an index. |
Stock values fluctuate in response to the activities of individual companies and general market and economic conditions. Certain investment strategies tend to increase the total risk of an investment (relative to the broader market). Foreign investments are especially volatile and can rise or fall dramatically due to differences in the political and economic conditions of the host country. These risks are generally intensified in emerging markets. This fund is exposed to smaller-company securities risk. Consult the Fund’s prospectus for additional information on these and other risks.
Please refer to the prospectus provided by your participating insurance company for detailed information describing the separate accounts for information regarding surrender charges, mortality and expense risk fees, and other charges that may be assessed by the participating insurance companies.
| ‡ | CFA® and Chartered Financial Analyst® are trademarks owned by CFA Institute. |
6 | Allspring VT Omega Growth Fund
Performance highlights (unaudited)
Growth of $10,000 investment as of December 31, 20221
| 1 | The chart compares the performance of Class 2 shares for the most recent ten years with the Russell 3000® Growth Index. The chart assumes a hypothetical investment of $10,000 in Class 2 shares and reflects all operating expenses of the Fund but does not reflect fees and expenses charged pursuant to the terms of variable life insurance policies and variable annuity contracts. |
Allspring VT Omega Growth Fund | 7
Performance highlights (unaudited)
MANAGER'S DISCUSSION
Fund highlights
| ■ | The Fund underperformed its benchmark, the Russell 3000® Growth Index, for the 12-month period that ended December 31, 2022. |
| ■ | Stock selection within the information technology (IT) and communication services sectors detracted from relative performance. |
| ■ | Allocation within the consumer discretionary sector, along with select holdings in IT services and communications equipment, contributed to the Fund’s results. |
Inflation and monetary policy dominated market sentiment.
Over the past year, a continual stream of macro headlines created high volatility for investors. Market sentiment fluctuated as investors grappled with high inflation, tightening Federal Reserve (Fed) policy, supply chain disruptions, and the war in Ukraine. Amid this uncertainty, the dominant storyline was persistently high inflation as the headline year-over-year Consumer Price Index* reached the highest levels in more than 40 years. In response, the Fed policy became hawkish and materially tightened financial conditions. The markets reacted swiftly and sharply. Volatility spiked over renewed concerns that the Fed may overshoot a soft landing, driving the economy into a recession. As a result, rising discount rates pressured valuations of long-duration growth stocks—those businesses with superior revenue growth projected years into the future. Additionally, investors rotated out of IT and e-commerce stocks due to concerns that a recession would reduce IT and consumer spending. For many companies with disruptive technologies, a disconnection emerged between stock prices and underlying fundamentals.
| Ten largest holdings (%) as of December 31, 20221 |
| Microsoft Corporation | 10.18 |
| Alphabet Incorporated Class A | 5.57 |
| Visa Incorporated Class A | 5.47 |
| Amazon.com Incorporated | 5.35 |
| UnitedHealth Group Incorporated | 3.42 |
| Cadence Design Systems Incorporated | 2.48 |
| Waste Connections Incorporated | 2.47 |
| The Home Depot Incorporated | 2.33 |
| Intuitive Surgical Incorporated | 2.26 |
| Union Pacific Corporation | 2.23 |
| 1 | Figures represent the percentage of the Fund's net assets. Holdings are subject to change and may have changed since the date specified. |
Security selection within the IT and communication services sectors detracted from returns.
Within communication services, Spotify Technology SA lowered gross margin guidance due to investments in new products and platform upgrades. Spotify has exhibited pricing power without diminishing customer loyalty and has steadily converted users from freemium to paid subscription models. With industry-leading innovation and a growing subscriber base, we are confident in Spotify’s long-term outlook.
MongoDB, Inc., a detractor in IT, provides a global cloud “database-as-a-service,” Atlas, that interfaces with the three largest public cloud providers. With revenue generated through a consumption model, MongoDB provided cautious guidance because of macro headwinds and increased operating expenses. While we have conviction in MongoDB’s role in the migration to the cloud, we are monitoring its fundamentals.
Holdings in IT services and communications equipment contributed to relative performance.
While the overall IT sector detracted from returns, several IT companies meaningfully outperformed during the year. Within IT services, Visa Inc. released strong earnings with both top- and bottom-line results beating expectations. With nearly 4 billion debit and credit cards issued across the globe, Visa processes a significant percentage of digital payment transactions. The company has shown resilience to recent economic headwinds as the increased costs of consumer staples offset the slowdown in consumer discretionary spending. As a toll booth on global consumption, Visa’s expansive customer base and broad range of services position the company well for steady growth.
| * | The Consumer Price Index (CPI) is a measure of the average change over time in the prices paid by urban consumers for a market basket of consumer goods and services. You cannot invest directly in an index |
8 | Allspring VT Omega Growth Fund
Performance highlights (unaudited)
As a leading provider of communication devices and software for first responders, Motorola Solutions, Inc., has benefited from increased spending to improve public safety. The company has become instrumental in digitizing emergency command centers, such as law enforcement, fire, and emergency medical teams. This has enabled Motorola to shift from a hardware business to a software-as-a-service revenue model. During the year, Motorola reported strong retention within U.S. federal contracts as well as municipalities. With an expanding platform of mission-critical services and a stable client base, we hold conviction in Motorola’s long-term growth prospects.
| Sector allocation as of December 31, 20221 |
| 1 | Figures represent the percentage of the Fund's long-term investments. Allocations are subject to change and may have changed since the date specified. |
The growth of a business remains our north star.
While the current outlook is challenging, we remain encouraged by the ability of innovators to create solutions. As the economy navigates rising interest rates and high inflation, companies that are creating efficiencies, automating processes, or digitizing businesses will likely see strong demand for their products. Furthermore, we believe the “3 Ds” —high debt levels, changing demographics, and rapid disruption—will ultimately lead to slow long-term economic growth.
The severe volatility over the past year has caused stock prices to disconnect from underlying fundamentals. It is our experience that these periods are often temporary and can set the portfolio up for strong future performance. Therefore, it is important to remain disciplined and execute our investment process. Reacting to short-term volatility in a chaotic world is not the recipe for success. Deep fundamental research is needed to identify who is winning and losing in a world of rapid disruption and economic uncertainty.
While we increased exposure to resilient core growth holdings during the year, we maintained balanced exposure to higher-growth “developing situations” with disruptive technologies. Over the long term, the growth of an underlying business is the dominant driver of equity returns and is the guiding principle of our investment philosophy. Therefore, we are confident that the fundamental growth of our portfolios will be unlocked and will reward the patience of our shareholders with strong future performance.
Allspring VT Omega Growth Fund | 9
Fund expenses (unaudited)
As a shareholder of the Fund, you incur ongoing costs, including management fees, distribution (12b-1) fees, and other Fund expenses. This example is intended to help you understand your ongoing costs (in dollars) of investing in the Fund and to compare these costs with the ongoing costs of investing in other mutual funds.
The example is based on an investment of $1,000 invested at the beginning of the six-month period and held for the entire period from July 1, 2022 to December 31, 2022.
Actual expenses
The “Actual” line of the table below provides information about actual account values and actual expenses. You may use the information in this line, together with the amount you invested, to estimate the expenses that you paid over the period. Simply divide your account value by $1,000 (for example, an $8,600 account value divided by $1,000 = 8.6), then multiply the result by the number in the “Actual” line under the heading entitled “Expenses paid during period” for your applicable class of shares to estimate the expenses you paid on your account during this period.
Hypothetical example for comparison purposes
The “Hypothetical” line of the table below provides information about hypothetical account values and hypothetical expenses based on the Fund’s actual expense ratio and an assumed rate of return of 5% per year before expenses, which is not the Fund’s actual return. The hypothetical account values and expenses may not be used to estimate the actual ending account balance or expenses you paid for the period. You may use this information to compare the ongoing costs of investing in the Fund and other funds. To do so, compare this 5% hypothetical example with the 5% hypothetical examples that appear in the shareholder reports of the other funds.
Please note that the expenses shown in the table are meant to highlight your ongoing costs only and do not reflect any separate account charges assessed by participating insurance companies. Therefore, the “Hypothetical” line of the table is useful in comparing ongoing costs only, and will not help you determine the relative total costs of owning different funds. In addition, if these separate account charges assessed by participating insurance companies were included, your costs would have been higher.
| | Beginning
account value
7-1-2022 | Ending
account value
12-31-2022 | Expenses
paid during
the period1 | Annualized net
expense ratio |
| Class 1 | | | | |
| Actual | $1,000.00 | $ 988.91 | $3.76 | 0.75% |
| Hypothetical (5% return before expenses) | $1,000.00 | $1,021.42 | $3.82 | 0.75% |
| Class 2 | | | | |
| Actual | $1,000.00 | $ 987.24 | $5.01 | 1.00% |
| Hypothetical (5% return before expenses) | $1,000.00 | $1,020.16 | $5.09 | 1.00% |
1 Expenses paid is equal to the annualized net expense ratio of each class multiplied by the average account value over the period, multiplied by 184 divided by 365 (to reflect the one-half-year period).
10 | Allspring VT Omega Growth Fund
Portfolio of investments—December 31, 2022
| | | | | Shares | Value |
| Common stocks: 96.25% | | | | | |
| Communication services: 10.69% | | | | | |
| Entertainment: 2.72% | | | | | |
| Spotify Technology SA † | | | | 8,600 | $ 678,970 |
| Warner Music Group Corporation Class A | | | | 27,500 | 963,050 |
| | | | | | 1,642,020 |
| Interactive media & services: 7.97% | | | | | |
| Alphabet Incorporated Class A † | | | | 38,100 | 3,361,563 |
| Alphabet Incorporated Class C † | | | | 3,480 | 308,780 |
| Match Group Incorporated † | | | | 12,187 | 505,639 |
| ZoomInfo Technologies Incorporated † | | | | 21,100 | 635,321 |
| | | | | | 4,811,303 |
| Consumer discretionary: 15.65% | | | | | |
| Auto components: 1.18% | | | | | |
| Aptiv plc † | | | | 7,600 | 707,788 |
| Automobiles: 1.56% | | | | | |
| Ferrari NV | | | | 4,400 | 942,568 |
| Hotels, restaurants & leisure: 1.86% | | | | | |
| Chipotle Mexican Grill Incorporated † | | | | 810 | 1,123,867 |
| Internet & direct marketing retail: 7.34% | | | | | |
| Amazon.com Incorporated † | | | | 38,440 | 3,228,960 |
| Doordash Incorporated † | | | | 5,000 | 244,100 |
| MercadoLibre Incorporated † | | | | 1,133 | 958,790 |
| | | | | | 4,431,850 |
| Specialty retail: 2.33% | | | | | |
| The Home Depot Incorporated | | | | 4,451 | 1,405,893 |
| Textiles, apparel & luxury goods: 1.38% | | | | | |
| lululemon athletica Incorporated † | | | | 2,600 | 832,988 |
| Financials: 5.05% | | | | | |
| Capital markets: 3.05% | | | | | |
| Intercontinental Exchange Incorporated | | | | 9,800 | 1,005,382 |
| MarketAxess Holdings Incorporated | | | | 2,999 | 836,391 |
| | | | | | 1,841,773 |
| Insurance: 2.00% | | | | | |
| Progressive Corporation | | | | 9,300 | 1,206,303 |
| Health care: 14.78% | | | | | |
| Health care equipment & supplies: 6.67% | | | | | |
| Align Technology Incorporated † | | | | 2,900 | 611,610 |
| DexCom Incorporated † | | | | 11,800 | 1,336,232 |
| Edwards Lifesciences Corporation † | | | | 9,600 | 716,256 |
| Intuitive Surgical Incorporated † | | | | 5,140 | 1,363,899 |
| | | | | | 4,027,997 |
The accompanying notes are an integral part of these financial statements.
Allspring VT Omega Growth Fund | 11
Portfolio of investments—December 31, 2022
| | | | | Shares | Value |
| Health care providers & services: 5.18% | | | | | |
| Centene Corporation † | | | | 12,900 | $ 1,057,929 |
| UnitedHealth Group Incorporated | | | | 3,896 | 2,065,581 |
| | | | | | 3,123,510 |
| Life sciences tools & services: 2.93% | | | | | |
| Bio-Techne Corporation | | | | 9,300 | 770,784 |
| Illumina Incorporated † | | | | 2,400 | 485,280 |
| Waters Corporation † | | | | 1,500 | 513,870 |
| | | | | | 1,769,934 |
| Industrials: 8.44% | | | | | |
| Commercial services & supplies: 2.47% | | | | | |
| Waste Connections Incorporated | | | | 11,246 | 1,490,770 |
| Machinery: 1.99% | | | | | |
| Deere & Company | | | | 2,800 | 1,200,528 |
| Professional services: 1.75% | | | | | |
| Equifax Incorporated | | | | 5,450 | 1,059,262 |
| Road & rail: 2.23% | | | | | |
| Union Pacific Corporation | | | | 6,500 | 1,345,955 |
| Information technology: 37.77% | | | | | |
| Communications equipment: 2.22% | | | | | |
| Motorola Solutions Incorporated | | | | 5,200 | 1,340,092 |
| Electronic equipment, instruments & components: 3.06% | | | | | |
| Teledyne Technologies Incorporated † | | | | 2,700 | 1,079,757 |
| Zebra Technologies Corporation Class A † | | | | 3,000 | 769,230 |
| | | | | | 1,848,987 |
| IT services: 12.26% | | | | | |
| Adyen NV ADR † | | | | 61,100 | 843,180 |
| Fiserv Incorporated † | | | | 9,660 | 976,336 |
| Globant SA † | | | | 2,600 | 437,216 |
| MongoDB Incorporated † | | | | 2,400 | 472,416 |
| PayPal Holdings Incorporated † | | | | 11,541 | 821,950 |
| Snowflake Incorporated Class A † | | | | 3,800 | 545,452 |
| Visa Incorporated Class A | | | | 15,890 | 3,301,306 |
| | | | | | 7,397,856 |
| Semiconductors & semiconductor equipment: 1.89% | | | | | |
| Advanced Micro Devices Incorporated † | | | | 9,400 | 608,838 |
| Monolithic Power Systems Incorporated | | | | 1,500 | 530,415 |
| | | | | | 1,139,253 |
| Software: 18.34% | | | | | |
| Atlassian Corporation Class A † | | | | 4,193 | 539,555 |
| Bill.com Holdings Incorporated † | | | | 5,900 | 642,864 |
| Cadence Design Systems Incorporated † | | | | 9,300 | 1,493,952 |
| Crowdstrike Holdings Incorporated Class A † | | | | 5,700 | 600,153 |
| Datadog Incorporated Class A † | | | | 7,100 | 521,850 |
The accompanying notes are an integral part of these financial statements.
12 | Allspring VT Omega Growth Fund
Portfolio of investments—December 31, 2022
| | | | | Shares | Value |
| Software (continued) | | | | | |
| Microsoft Corporation | | | | 25,623 | $ 6,144,908 |
| ServiceNow Incorporated † | | | | 2,910 | 1,129,866 |
| | | | | | 11,073,148 |
| Materials: 2.15% | | | | | |
| Chemicals: 2.15% | | | | | |
| The Sherwin-Williams Company | | | | 5,470 | 1,298,195 |
| Real estate: 1.72% | | | | | |
| Equity REITs: 1.72% | | | | | |
| SBA Communications Corporation | | | | 3,700 | 1,037,147 |
| Total Common stocks (Cost $39,226,293) | | | | | 58,098,987 |
| | | Yield | | | |
| Short-term investments: 3.78% | | | | | |
| Investment companies: 3.78% | | | | | |
| Allspring Government Money Market Fund Select Class ♠∞ | | 4.09% | | 2,283,520 | 2,283,520 |
| Total Short-term investments (Cost $2,283,520) | | | | | 2,283,520 |
| Total investments in securities (Cost $41,509,813) | 100.03% | | | | 60,382,507 |
| Other assets and liabilities, net | (0.03) | | | | (20,822) |
| Total net assets | 100.00% | | | | $60,361,685 |
| † | Non-income-earning security |
| ♠ | The issuer of the security is an affiliated person of the Fund as defined in the Investment Company Act of 1940. |
| ∞ | The rate represents the 7-day annualized yield at period end. |
| Abbreviations: |
| ADR | American depositary receipt |
| REIT | Real estate investment trust |
The accompanying notes are an integral part of these financial statements.
Allspring VT Omega Growth Fund | 13
Portfolio of investments—December 31, 2022
Investments in affiliates
An affiliated investment is an investment in which the Fund owns at least 5% of the outstanding voting shares of the issuer or as a result of other relationships, such as the Fund and the issuer having the same investment manager. Transactions with issuers that were affiliates of the Fund at the end of the period were as follows:
| | Value,
beginning of
period | Purchases | Sales
proceeds | Net
realized
gains
(losses) | | Net
change in
unrealized
gains
(losses) | | Value,
end of
period | Shares,
end
of period | Income
from
affiliated
securities |
| Short-term investments | | | | | | | | | |
| Allspring Government Money Market Fund Select Class | $1,155,987 | $18,017,552 | $(16,890,019) | $0 | | $0 | | $ 2,283,520 | 2,283,520 | $ 21,470 |
Investments in affiliates no
longer held at end of period | | | | | | | | | | |
| Securities Lending Cash Investments LLC | 606,100 | 715,650 | (1,321,750) | 0 | | 0 | | 0 | 0 | 179 # |
| | | | | $0 | | $0 | | $2,283,520 | | $21,649 |
| # | Amount shown represents income before fees and rebates. |
The accompanying notes are an integral part of these financial statements.
14 | Allspring VT Omega Growth Fund
Statement of assets and liabilities—December 31, 2022
| | |
| Assets | |
Investments in unaffiliated securities, at value (cost $39,226,293)
| $ 58,098,987 |
Investments in affiliated securities, at value (cost $2,283,520)
| 2,283,520 |
Receivable for Fund shares sold
| 37,876 |
Receivable for dividends
| 19,253 |
Prepaid expenses and other assets
| 1,604 |
Total assets
| 60,441,240 |
| Liabilities | |
Management fee payable
| 27,572 |
Payable for Fund shares redeemed
| 18,516 |
Distribution fee payable
| 7,185 |
Custody and accounting fees payable
| 5,619 |
Shareholder report expenses payable
| 4,849 |
Administration fees payable
| 4,471 |
Trustees’ fees and expenses payable
| 915 |
Accrued expenses and other liabilities
| 10,428 |
Total liabilities
| 79,555 |
Total net assets
| $60,361,685 |
| Net assets consist of | |
Paid-in capital
| $ 34,930,642 |
Total distributable earnings
| 25,431,043 |
Total net assets
| $60,361,685 |
| Computation of net asset value per share | |
Net assets – Class 1
| $ 26,748,016 |
Shares outstanding – Class 11
| 1,281,247 |
Net asset value per share – Class 1
| $20.88 |
Net assets – Class 2
| $ 33,613,669 |
Shares outstanding – Class 21
| 1,691,632 |
Net asset value per share – Class 2
| $19.87 |
| 1 | The Fund has an unlimited number of authorized shares. |
The accompanying notes are an integral part of these financial statements.
Allspring VT Omega Growth Fund | 15
Statement of operations—year ended December 31, 2022
| | |
| Investment income | |
Dividends (net of foreign withholdings taxes of $2,232)
| $ 312,681 |
Income from affiliated securities
| 21,576 |
Total investment income
| 334,257 |
| Expenses | |
Management fee
| 430,923 |
| Administration fees | |
Class 1
| 26,330 |
Class 2
| 31,126 |
| Distribution fee | |
Class 2
| 79,526 |
Custody and accounting fees
| 12,337 |
Professional fees
| 48,862 |
Shareholder report expenses
| 29,922 |
Trustees’ fees and expenses
| 21,078 |
Other fees and expenses
| 2,040 |
Total expenses
| 682,144 |
| Less: Fee waivers and/or expense reimbursements | |
Fund-level
| (53,433) |
Net expenses
| 628,711 |
Net investment loss
| (294,454) |
| Realized and unrealized gains (losses) on investments | |
Net realized gains on investments
| 6,653,356 |
Net change in unrealized gains (losses) on investments
| (44,084,645) |
Net realized and unrealized gains (losses) on investments
| (37,431,289) |
Net decrease in net assets resulting from operations
| $(37,725,743) |
The accompanying notes are an integral part of these financial statements.
16 | Allspring VT Omega Growth Fund
Statement of changes in net assets
| | | | | |
| | Year ended
December 31, 2022 | Year ended
December 31, 2021 |
| Operations | | | | |
Net investment loss
| | $ (294,454) | | $ (615,444) |
Net realized gains on investments
| | 6,653,356 | | 16,445,379 |
Net change in unrealized gains (losses) on investments
| | (44,084,645) | | (345,019) |
Net increase (decrease) in net assets resulting from operations
| | (37,725,743) | | 15,484,916 |
| Distributions to shareholders from | | | | |
| Net investment income and net realized gains | | | | |
Class 1
| | (7,399,134) | | (5,286,804) |
Class 2
| | (9,021,680) | | (6,226,350) |
Total distributions to shareholders
| | (16,420,814) | | (11,513,154) |
| Capital share transactions | Shares | | Shares | |
| Proceeds from shares sold | | | | |
Class 1
| 22,220 | 566,861 | 39,946 | 1,745,185 |
Class 2
| 142,485 | 4,023,820 | 78,152 | 3,228,891 |
| | | 4,590,681 | | 4,974,076 |
| Reinvestment of distributions | | | | |
Class 1
| 326,384 | 7,399,134 | 126,388 | 5,286,804 |
Class 2
| 417,671 | 9,021,680 | 155,815 | 6,226,350 |
| | | 16,420,814 | | 11,513,154 |
| Payment for shares redeemed | | | | |
Class 1
| (187,569) | (5,315,386) | (231,730) | (10,127,284) |
Class 2
| (305,040) | (10,025,192) | (228,150) | (9,466,450) |
| | | (15,340,578) | | (19,593,734) |
Net increase (decrease) in net assets resulting from capital share transactions
| | 5,670,917 | | (3,106,504) |
Total increase (decrease) in net assets
| | (48,475,640) | | 865,258 |
| Net assets | | | | |
Beginning of period
| | 108,837,325 | | 107,972,067 |
End of period
| | $ 60,361,685 | | $108,837,325 |
The accompanying notes are an integral part of these financial statements.
Allspring VT Omega Growth Fund | 17
Financial highlights
(For a share outstanding throughout each period)
| | Year ended December 31 |
| Class 1 | 2022 | 2021 | 2020 | 2019 | 2018 |
Net asset value, beginning of period
| $43.70 | $42.28 | $31.89 | $26.27 | $28.99 |
Net investment loss
| (0.08) 1 | (0.19) 1 | (0.07) | (0.03) 1 | (0.03) 1 |
Net realized and unrealized gains (losses) on investments
| (15.54) | 6.43 | 13.27 | 9.69 | 0.62 |
Total from investment operations
| (15.62) | 6.24 | 13.20 | 9.66 | 0.59 |
| Distributions to shareholders from | | | | | |
Net realized gains
| (7.20) | (4.82) | (2.81) | (4.04) | (3.31) |
Net asset value, end of period
| $20.88 | $43.70 | $42.28 | $31.89 | $26.27 |
Total return2
| (37.04)% | 15.27% | 43.41% | 37.39% | 0.52% |
| Ratios to average net assets (annualized) | | | | | |
Gross expenses
| 0.84% | 0.78% | 0.80% | 0.82% | 0.81% |
Net expenses
| 0.75% | 0.75% | 0.75% | 0.75% | 0.75% |
Net investment loss
| (0.29)% | (0.43)% | (0.27)% | (0.08)% | (0.10)% |
| Supplemental data | | | | | |
Portfolio turnover rate
| 22% | 25% | 24% | 31% | 46% |
Net assets, end of period (000s omitted)
| $26,748 | $48,949 | $50,122 | $40,001 | $33,043 |
| 1 | Calculated based upon average shares outstanding |
| 2 | Returns do not reflect fees and expenses charged pursuant to the terms of variable life insurance policies and variable annuity contracts. |
The accompanying notes are an integral part of these financial statements.
18 | Allspring VT Omega Growth Fund
Financial highlights
(For a share outstanding throughout each period)
| | Year ended December 31 |
| Class 2 | 2022 | 2021 | 2020 | 2019 | 2018 |
Net asset value, beginning of period
| $41.69 | $40.43 | $30.55 | $25.23 | $27.91 |
Net investment loss
| (0.14) 1 | (0.28) | (0.17) 1 | (0.10) 1 | (0.11) |
Net realized and unrealized gains (losses) on investments
| (14.82) | 6.14 | 12.73 | 9.29 | 0.61 |
Total from investment operations
| (14.96) | 5.86 | 12.56 | 9.19 | 0.50 |
| Distributions to shareholders from | | | | | |
Net realized gains
| (6.86) | (4.60) | (2.68) | (3.87) | (3.18) |
Net asset value, end of period
| $19.87 | $41.69 | $40.43 | $30.55 | $25.23 |
Total return2
| (37.20)% | 14.97% | 43.18% | 37.04% | 0.28% |
| Ratios to average net assets (annualized) | | | | | |
Gross expenses
| 1.04% | 1.02% | 1.04% | 1.06% | 1.06% |
Net expenses
| 0.98% | 1.00% | 1.00% | 1.00% | 1.00% |
Net investment loss
| (0.51)% | (0.68)% | (0.52)% | (0.33)% | (0.35)% |
| Supplemental data | | | | | |
Portfolio turnover rate
| 22% | 25% | 24% | 31% | 46% |
Net assets, end of period (000s omitted)
| $33,614 | $59,888 | $57,850 | $50,843 | $48,500 |
| 1 | Calculated based upon average shares outstanding |
| 2 | Returns do not reflect fees and expenses charged pursuant to the terms of variable life insurance policies and variable annuity contracts. |
The accompanying notes are an integral part of these financial statements.
Allspring VT Omega Growth Fund | 19
Notes to financial statements
1. ORGANIZATION
Allspring Variable Trust (the "Trust"), a Delaware statutory trust organized on March 10, 1999, is an open-end management investment company registered under the Investment Company Act of 1940, as amended (the "1940 Act"). As an investment company, the Trust follows the accounting and reporting guidance in Financial Accounting Standards Board ("FASB") Accounting Standards Codification Topic 946, Financial Services – Investment Companies. These financial statements report on the Allspring VT Omega Growth Fund (the "Fund") which is a diversified series of the Trust. The Trust offers shares of the Fund to separate accounts of various life insurance companies as funding vehicles for certain variable annuity contracts and variable life insurance policies.
2. SIGNIFICANT ACCOUNTING POLICIES
The following significant accounting policies, which are consistently followed in the preparation of the financial statements of the Fund, are in conformity with U.S. generally accepted accounting principles which require management to make estimates and assumptions that affect the reported amounts of assets and liabilities, disclosure of contingent assets and liabilities at the date of the financial statements, and the reported amounts of income and expenses during the reporting period. Actual results could differ from those estimates.
Securities valuation
All investments are valued each business day as of the close of regular trading on the New York Stock Exchange (generally 4 p.m. Eastern Time), although the Fund may deviate from this calculation time under unusual or unexpected circumstances.
Equity securities that are listed on a foreign or domestic exchange or market are valued at the official closing price or, if none, the last sales price.
Investments in registered open-end investment companies (other than those listed on a foreign or domestic exchange or market) are valued at net asset value. Interests in non-registered investment companies that are redeemable at net asset value are fair valued normally at net asset value.
Investments which are not valued using the methods discussed above are valued at their fair value, as determined in good faith by Allspring Funds Management, LLC ("Allspring Funds Management"), which was named the valuation designee by the Board of Trustees. As the valuation designee, Allspring Funds Management is responsible for day-to-day valuation activities for the Allspring Funds. In connection with these responsibilities, Allspring Funds Management has established a Valuation Committee and has delegated to it the authority to take any actions regarding the valuation of portfolio securities that the Valuation Committee deems necessary or appropriate, including determining the fair value of portfolio securities. On a quarterly basis, the Board of Trustees receives reports of valuation actions taken by the Valuation Committee. On at least an annual basis, the Board of Trustees receives an assessment of the adequacy and effectiveness of Allspring Funds Management's process for determining the fair value of the portfolio of investments.
Securities lending
The Fund may lend its securities from time to time in order to earn additional income in the form of fees or interest on securities received as collateral or the investment of any cash received as collateral. When securities are on loan, the Fund receives interest or dividends on those securities. Cash collateral received in connection with its securities lending transactions is invested in Securities Lending Cash Investments, LLC (the "Securities Lending Fund"), an affiliated non-registered investment company. Investments in Securities Lending Fund are valued at the evaluated bid price provided by an independent pricing service. Income earned from investment in the Securities Lending Fund (net of fees and rebates), if any, is included in income from affiliated securities on the Statement of Operations.
In a securities lending transaction, the net asset value of the Fund is affected by an increase or decrease in the value of the securities loaned and by an increase or decrease in the value of the instrument in which collateral is invested. The amount of securities lending activity undertaken by the Fund fluctuates from time to time. The Fund has the right under the lending agreement to recover the securities from the borrower on demand. In the event of default or bankruptcy by the borrower, the Fund may be prevented from recovering the loaned securities or gaining access to the collateral or may experience delays or costs in doing so. In such an event, the terms of the agreement allow the unaffiliated securities lending agent to use the collateral to purchase replacement securities on behalf of the Fund or pay the Fund the market value of the loaned securities. The Fund bears the risk of loss with respect to depreciation of its investment of the cash collateral.
Security transactions and income recognition
Securities transactions are recorded on a trade date basis. Realized gains or losses are recorded on the basis of identified cost.
20 | Allspring VT Omega Growth Fund
Notes to financial statements
Dividend income is recognized on the ex-dividend date. Dividend income is recorded net of foreign taxes withheld where recovery of such taxes is not assured.
Distributions to shareholders
Distributions to shareholders from net investment income and any net realized gains are recorded on the ex-dividend date and paid at least annually. Such distributions are determined in accordance with income tax regulations and may differ from U.S. generally accepted accounting principles. Dividend sources are estimated at the time of declaration. The tax character of distributions is determined as of the Fund's fiscal year end. Therefore, a portion of the Fund's distributions made prior to the Fund’s fiscal year end may be categorized as a tax return of capital at year end.
Federal and other taxes
The Fund intends to continue to qualify as a regulated investment company by distributing substantially all of its investment company taxable income and any net realized capital gains (after reduction for capital loss carryforwards) sufficient to relieve it from all, or substantially all, federal income taxes. Accordingly, no provision for federal income taxes was required.
The Fund’s income and federal excise tax returns and all financial records supporting those returns for the prior three fiscal years are subject to examination by the federal and Delaware revenue authorities. Management has analyzed the Fund's tax positions taken on federal, state, and foreign tax returns, as applicable, for all open tax years and does not believe that there are any uncertain tax positions that require recognition of a tax liability.
As of December 31, 2022, the aggregate cost of all investments for federal income tax purposes was $41,657,485 and the unrealized gains (losses) consisted of:
| Gross unrealized gains | $25,859,305 |
| Gross unrealized losses | (7,134,283) |
| Net unrealized gains | $18,725,022 |
Reclassifications are made to the Fund’s capital accounts for permanent tax differences to reflect income and gains available for distribution (or available capital loss carryforwards) under federal income tax regulations. U.S. generally accepted accounting principles require that certain components of net assets be adjusted to reflect permanent differences between financial and tax reporting. These reclassifications have no effect on net assets or net asset values per share. The primary permanent difference causing such reclassification is due to net operating loss. At December 31, 2022, as a result of permanent book-to-tax differences, the following reclassification adjustments were made on the Statement of Assets and Liabilities:
| Paid-in capital | Total distributable
earnings |
| $(294,564) | $294,564 |
Class allocations
The separate classes of shares offered by the Fund differ principally in distribution fees. Class specific expenses are charged directly to that share class. Investment income, common fund-level expenses, and realized and unrealized gains (losses) on investments are allocated daily to each class of shares based on the relative proportion of net assets of each class.
3. FAIR VALUATION MEASUREMENTS
Fair value measurements of investments are determined within a framework that has established a fair value hierarchy based upon the various data inputs utilized in determining the value of the Fund’s investments. The three-level hierarchy gives the highest priority to unadjusted quoted prices in active markets for identical assets or liabilities (Level 1) and the lowest priority to unobservable inputs (Level 3). The Fund’s investments are classified within the fair value hierarchy based on the lowest level of input that is significant to the fair value measurement. The inputs are summarized into three broad levels as follows:
| ■ | Level 1 – quoted prices in active markets for identical securities |
| ■ | Level 2 – other significant observable inputs (including quoted prices for similar securities, interest rates, prepayment speeds, credit risk, etc.) |
| ■ | Level 3 – significant unobservable inputs (including the Fund’s own assumptions in determining the fair value of investments) |
The inputs or methodologies used for valuing investments in securities are not necessarily an indication of the risk associated with investing in those securities.
Allspring VT Omega Growth Fund | 21
Notes to financial statements
The following is a summary of the inputs used in valuing the Fund’s assets and liabilities as of December 31, 2022:
| | Quoted prices
(Level 1) | Other significant
observable inputs
(Level 2) | Significant
unobservable inputs
(Level 3) | Total |
| Assets | | | | |
| Investments in: | | | | |
| Common stocks | | | | |
| Communication services | $ 6,453,323 | $0 | $0 | $ 6,453,323 |
| Consumer discretionary | 9,444,954 | 0 | 0 | 9,444,954 |
| Financials | 3,048,076 | 0 | 0 | 3,048,076 |
| Health care | 8,921,441 | 0 | 0 | 8,921,441 |
| Industrials | 5,096,515 | 0 | 0 | 5,096,515 |
| Information technology | 22,799,336 | 0 | 0 | 22,799,336 |
| Materials | 1,298,195 | 0 | 0 | 1,298,195 |
| Real estate | 1,037,147 | 0 | 0 | 1,037,147 |
| Short-term investments | | | | |
| Investment companies | 2,283,520 | 0 | 0 | 2,283,520 |
| Total assets | $60,382,507 | $0 | $0 | $60,382,507 |
Additional sector, industry or geographic detail, if any, is included in the Portfolio of Investments.
For the year ended December 31, 2022, the Fund did not have any transfers into/out of Level 3.
4. TRANSACTIONS WITH AFFILIATES
Management fee
Allspring Funds Management, a wholly owned subsidiary of Allspring Global Investments Holdings, LLC, a holding company indirectly owned by certain private funds of GTCR LLC and Reverence Capital Partners, L.P., is the manager of the Fund and provides advisory and fund-level administrative services under an investment management agreement. Under the investment management agreement, Allspring Funds Management is responsible for, among other services, implementing the investment objectives and strategies of the Fund, supervising the subadviser and providing fund-level administrative services in connection with the Fund’s operations. As compensation for its services under the investment management agreement, Allspring Funds Management is entitled to receive a management fee at the following annual rate based on the Fund’s average daily net assets:
| Average daily net assets | Management fee |
| First $500 million | 0.600% |
| Next $500 million | 0.550 |
| Next $1 billion | 0.500 |
| Next $2 billion | 0.475 |
| Next $1 billion | 0.450 |
| Next $5 billion | 0.440 |
| Over $10 billion | 0.430 |
For the year ended December 31, 2022, the management fee was equivalent to an annual rate of 0.60% of the Fund’s average daily net assets.
Allspring Funds Management has retained the services of a subadviser to provide daily portfolio management to the Fund. The fee for subadvisory services is borne by Allspring Funds Management. Allspring Global Investments, LLC ("Allspring Investments"), an affiliate of Allspring Funds Management and a wholly owned subsidiary of Allspring Global Investments Holdings, LLC, is the subadviser to the Fund and is entitled to receive a fee from Allspring Funds Management at an annual rate starting at 0.45% and declining to 0.30% as the average daily net assets of the Fund increase.
22 | Allspring VT Omega Growth Fund
Notes to financial statements
Administration fees
Under a class-level administration agreement, Allspring Funds Management provides class-level administrative services to the Fund, which includes paying fees and expenses for services provided by the transfer agent, sub-transfer agents, omnibus account services and record-keepers. As compensation for its services under the class-level administration agreement, Allspring Funds Management receives an annual fee of 0.08% which is calculated based on the average daily net assets of each class.
Waivers and/or expense reimbursements
Allspring Funds Management has contractually committed to waive and/or reimburse management and administration fees to the extent necessary to maintain certain net operating expense ratios for the Fund. When each class of the Fund has exceeded its expense cap, Allspring Funds Management will waive fees and/or reimburse expenses from fund-level expenses on a proportionate basis and then from class specific expenses. When only certain classes exceed their expense caps, waivers and/or reimbursements are applied against class specific expenses before fund-level expenses. Allspring Funds Management has contractually committed through April 30, 2023 to waive fees and/or reimburse expenses to the extent necessary to cap expenses. Prior to or after the commitment expiration date, the caps may be increased or the commitment to maintain the caps may be terminated only with the approval of the Board of Trustees. As of December 31, 2022, the contractual expense caps are as follows:
| | Expense ratio caps |
| Class 1 | 0.75% |
| Class 2 | 1.00 |
Distribution fee
The Trust has adopted a distribution plan for Class 2 shares pursuant to Rule 12b-1 under the 1940 Act. A distribution fee is charged to Class 2 shares and paid to Allspring Funds Distributor, LLC, the principal underwriter, an affiliate of Allspring Funds Management, at an annual rate up to 0.25% of the average daily net assets of Class 2 shares.
Interfund transactions
The Fund may purchase or sell portfolio investment securities to certain affiliates pursuant to Rule 17a-7 under the 1940 Act and under procedures adopted by the Board of Trustees. The procedures have been designed to ensure that these interfund transactions, which do not incur broker commissions, are effected at current market prices.
5. INVESTMENT PORTFOLIO TRANSACTIONS
Purchases and sales of investments, excluding U.S. government obligations (if any) and short-term securities, for the year ended December 31, 2022 were $16,087,545 and $28,374,696, respectively.
6. SECURITIES LENDING TRANSACTIONS
The Fund lends its securities through an unaffiliated securities lending agent and receives collateral in the form of cash or securities with a value at least equal to the value of the securities on loan. The value of the loaned securities is determined at the close of each business day and any increases or decreases in the required collateral are exchanged between the Fund and the counterparty on the next business day. Cash collateral received is invested in the Securities Lending Fund which seeks to provide a positive return compared to the daily Federal Funds Open Rate by investing in high-quality, U.S. dollar-denominated short-term money market instruments and is exempt from registration under Section 3(c)(7) of the 1940 Act. Securities Lending Fund is managed by Allspring Funds Management and is subadvised by Allspring Investments. Allspring Funds Management receives an advisory fee starting at 0.05% and declining to 0.01% as the average daily net assets of the Securities Lending Fund increase. All of the fees received by Allspring Funds Management are paid to Allspring Investments for its services as subadviser.
In the event of counterparty default or the failure of a borrower to return a loaned security, the Fund has the right to use the collateral to offset any losses incurred. As of December 31, 2022, the Fund did not have any securities on loan.
7. BANK BORROWINGS
The Trust, Allspring Master Trust and Allspring Funds Trust (excluding the money market funds) are parties to a $350,000,000 revolving credit agreement whereby the Fund is permitted to use bank borrowings for temporary or emergency purposes, such as to fund shareholder redemption requests. Interest under the credit agreement is charged to the Fund based on a borrowing
Allspring VT Omega Growth Fund | 23
Notes to financial statements
rate equal to the higher of the Federal Funds rate or the overnight bank funding rate in effect on that day plus a spread. In addition, an annual commitment fee equal based on the unused balance is allocated to each participating fund.
For the year ended December 31, 2022, there were no borrowings by the Fund under the agreement.
8. DISTRIBUTIONS TO SHAREHOLDERS
The tax character of distributions paid during the years ended December 31, 2022 and December 31, 2021 were as follows:
| | Year ended December 31 |
| | 2022 | 2021 |
| Ordinary income | $ 0 | $ 1,131,692 |
| Long-term capital gain | 16,420,814 | 10,381,462 |
As of December 31, 2022, the components of distributable earnings on a tax basis were as follows:
Undistributed
long-term
gain | Unrealized
gains |
| $6,707,044 | $18,725,022 |
9. CONCENTRATION RISKS
As of the end of the period, the Fund concentrated its portfolio of investments in the information technology sector. A fund that invests a substantial portion of its assets in any sector may be more affected by changes in that sector than would be a fund whose investments are not heavily weighted in any sector.
10. MARKET RISKS
On March 11, 2020, the World Health Organization announced that it had made the assessment that coronavirus disease 2019 (“COVID-19”) is a pandemic. The impacts of COVID-19 are affecting the entire global economy, individual companies and investment products, the funds, and the market in general. There is significant uncertainty around the extent and duration of business disruptions related to COVID-19 and the impacts may last for an extended period of time. COVID-19 has led to significant uncertainty and volatility in the financial markets.
11. INDEMNIFICATION
Under the Fund's organizational documents, the officers and Trustees have been granted certain indemnification rights against certain liabilities that may arise out of performance of their duties to the Fund. The Fund has entered into a separate agreement with each Trustee that converts indemnification rights currently existing under the Fund’s organizational documents into contractual rights that cannot be changed in the future without the consent of the Trustee. Additionally, in the normal course of business, the Fund may enter into contracts with service providers that contain a variety of indemnification clauses. The Fund’s maximum exposure under these arrangements is dependent on future claims that may be made against the Fund and, therefore, cannot be estimated.
24 | Allspring VT Omega Growth Fund
Report of independent registered public accounting firm
To the Shareholders of the Fund and Board of Trustees
Allspring Variable Trust:
Opinion on the Financial Statements
We have audited the accompanying statement of assets and liabilities of Allspring VT Omega Growth Fund (the Fund), one of the funds constituting Allspring Variable Trust, including the portfolio of investments, as of December 31, 2022, the related statement of operations for the year then ended, the statements of changes in net assets for each of the years in the two-year period then ended, and the related notes (collectively, the financial statements) and the financial highlights for each of the years in the five-year period then ended. In our opinion, the financial statements and financial highlights present fairly, in all material respects, the financial position of the Fund as of December 31, 2022, the results of its operations for the year then ended, the changes in its net assets for each of the years in the two-year period then ended, and the financial highlights for each of the years in the five-year period then ended, in conformity with U.S. generally accepted accounting principles.
Basis for Opinion
These financial statements and financial highlights are the responsibility of the Fund’s management. Our responsibility is to express an opinion on these financial statements and financial highlights based on our audits. We are a public accounting firm registered with the Public Company Accounting Oversight Board (United States) (PCAOB) and are required to be independent with respect to the Fund in accordance with the U.S. federal securities laws and the applicable rules and regulations of the Securities and Exchange Commission and the PCAOB.
We conducted our audits in accordance with the standards of the PCAOB. Those standards require that we plan and perform the audit to obtain reasonable assurance about whether the financial statements and financial highlights are free of material misstatement, whether due to error or fraud. Our audits included performing procedures to assess the risks of material misstatement of the financial statements and financial highlights, whether due to error or fraud, and performing procedures that respond to those risks. Such procedures included examining, on a test basis, evidence regarding the amounts and disclosures in the financial statements and financial highlights. Such procedures also included confirmation of securities owned as of December 31, 2022, by correspondence with the custodian and transfer agent. Our audits also included evaluating the accounting principles used and significant estimates made by management, as well as evaluating the overall presentation of the financial statements and financial highlights. We believe that our audits provide a reasonable basis for our opinion.

We have not been able to determine the specific year that we began serving as the auditor of one or more Allspring Funds investment companies; however, we are aware that we have served as the auditor of one or more Allspring Funds investment companies since at least 1955.
Boston, Massachusetts
February 27, 2023
Allspring VT Omega Growth Fund | 25
Other information (unaudited)
TAX INFORMATION
Pursuant to Section 852 of the Internal Revenue Code, $16,420,814 was designated as a 20% rate gain distribution for the fiscal year ended December 31, 2022.
PROXY VOTING INFORMATION
A description of the policies and procedures used to determine how to vote proxies relating to portfolio securities is available without charge, upon request, by calling 1-800-260-5969, visiting our website at allspringglobal.com, or visiting the SEC website at sec.gov. Information regarding how the proxies related to portfolio securities were voted during the most recent 12-month period ended June 30 is available on the website at allspringglobal.com or by visiting the SEC website at sec.gov.
QUARTERLY PORTFOLIO HOLDINGS INFORMATION
The Fund files its complete schedule of portfolio holdings with the SEC for the first and third quarters of each fiscal year as an exhibit to its reports on Form N-PORT. Shareholders may view the filed Form N-PORT by visiting the SEC website at sec.gov.
26 | Allspring VT Omega Growth Fund
Other information (unaudited)
BOARD OF TRUSTEES AND OFFICERS
Each of the Trustees and Officers listed in the table below acts in identical capacities for each fund in the Allspring family of funds, which consists of 127 mutual funds comprising the Allspring Funds Trust, Allspring Variable Trust, Allspring Master Trust and four closed-end funds (collectively the “Fund Complex”). This table should be read in conjunction with the Prospectus and the Statement of Additional Information1. The mailing address of each Trustee and Officer is 1415 Vantage Park Drive, 3rd Floor, Charlotte, NC 28203. Each Trustee and Officer serves an indefinite term, however, each Trustee serves such term until reaching the mandatory retirement age established by the Trustees.
Independent Trustees
Name and
year of birth | Position held and
length of service* | Principal occupations during past five years or longer | Current other
public company or
investment
company
directorships |
William R. Ebsworth
(Born 1957) | Trustee,
since 2015 | Retired. From 1984 to 2013, equities analyst, portfolio manager, research director and chief investment officer at Fidelity Management and Research Company in Boston, Tokyo, and Hong Kong, and retired in 2013 as Chief Investment Officer of Fidelity Strategic Advisers, Inc. where he led a team of investment professionals managing client assets. Prior thereto, Board member of Hong Kong Securities Clearing Co., Hong Kong Options Clearing Corp., the Thailand International Fund, Ltd., Fidelity Investments Life Insurance Company, and Empire Fidelity Investments Life Insurance Company. Audit Committee Chair and Investment Committee Chair of the Vincent Memorial Hospital Foundation (non-profit organization). Mr. Ebsworth is a CFA® charterholder. | N/A |
Jane A. Freeman
(Born 1953) | Trustee,
since 2015;
Chair Liaison,
since 2018 | Retired. From 2012 to 2014 and 1999 to 2008, Chief Financial Officer of Scientific Learning Corporation. From 2008 to 2012, Ms. Freeman provided consulting services related to strategic business projects. Prior to 1999, Portfolio Manager at Rockefeller & Co. and Scudder, Stevens & Clark. Board member of the Harding Loevner Funds from 1996 to 2014, serving as both Lead Independent Director and chair of the Audit Committee. Board member of the Russell Exchange Traded Funds Trust from 2011 to 2012 and the chair of the Audit Committee. Ms. Freeman is also an inactive Chartered Financial Analyst. | N/A |
Isaiah Harris, Jr.
(Born 1952) | Trustee,
since 2009; Audit
Committee
Chair,
since 2019 | Retired. Member of the Advisory Board of CEF of East Central Florida. Chairman of the Board of CIGNA Corporation from 2009 to 2021, and Director from 2005 to 2008. From 2003 to 2011, Director of Deluxe Corporation. Prior thereto, President and CEO of BellSouth Advertising and Publishing Corp. from 2005 to 2007, President and CEO of BellSouth Enterprises from 2004 to 2005 and President of BellSouth Consumer Services from 2000 to 2003. Emeritus member of the Iowa State University Foundation Board of Governors. Emeritus Member of the Advisory Board of Iowa State University School of Business. Advisory Board Member, Palm Harbor Academy (private school). Advisory Board Member, Fellowship of Christian Athletes. Mr. Harris is a certified public accountant (inactive status). | N/A |
David F. Larcker
(Born 1950) | Trustee,
since 2009 | Distinguished Visiting Fellow at the Hoover Institution since 2022. James Irvin Miller Professor of Accounting at the Graduate School of Business (Emeritus), Stanford University, Director of the Corporate Governance Research Initiative and Senior Faculty of The Rock Center for Corporate Governance since 2006. From 2005 to 2008, Professor of Accounting at the Graduate School of Business, Stanford University. Prior thereto, Ernst & Young Professor of Accounting at The Wharton School, University of Pennsylvania from 1985 to 2005. | N/A |
Allspring VT Omega Growth Fund | 27
Other information (unaudited)
Name and
year of birth | Position held and
length of service* | Principal occupations during past five years or longer | Current other
public company or
investment
company
directorships |
Olivia S. Mitchell
(Born 1953) | Trustee,
since 2006;
Nominating and
Governance
Committee Chair,
since 2018 | International Foundation of Employee Benefit Plans Professor since 1993, Wharton School of the University of Pennsylvania. Director of Wharton’s Pension Research Council and Boettner Center on Pensions & Retirement Research, and Research Associate at the National Bureau of Economic Research. Previously taught at Cornell University from 1978 to 1993. | N/A |
Timothy J. Penny
(Born 1951) | Trustee,
since 1996;
Chair,
since 2018 | President and Chief Executive Officer of Southern Minnesota Initiative Foundation, a non-profit organization, since 2007. Vice Chair of the Economic Club of Minnesota, since 2007. Co-Chair of the Committee for a Responsible Federal Budget, since 1995. Member of the Board of Trustees of NorthStar Education Finance, Inc., a non-profit organization, from 2007-2022. Senior Fellow of the University of Minnesota Humphrey Institute from 1995 to 2017. | N/A |
James G. Polisson
(Born 1959) | Trustee,
since 2018 | Retired. Chief Marketing Officer, Source (ETF) UK Services, Ltd, from 2015 to 2017. From 2012 to 2015, Principal of The Polisson Group, LLC, a management consulting, corporate advisory and principal investing company. Chief Executive Officer and Managing Director at Russell Investments, Global Exchange Traded Funds from 2010 to 2012. Managing Director of Barclays Global Investors from 1998 to 2010 and Global Chief Marketing Officer for iShares and Barclays Global Investors from 2000 to 2010. Trustee of the San Francisco Mechanics’ Institute, a non-profit organization, from 2013 to 2015. Board member of the Russell Exchange Traded Fund Trust from 2011 to 2012. Director of Barclays Global Investors Holdings Deutschland GmbH from 2006 to 2009. Mr. Polisson is an attorney and has a retired status with the Massachusetts and District of Columbia Bar Associations. | N/A |
Pamela Wheelock
(Born 1959) | Trustee,
since January
2020; previously
Trustee from
January 2018 to
July 2019 | Retired. Executive and Senior Financial leadership positions in the public, private and nonprofit sectors. Interim President and CEO, McKnight Foundation, 2020. Interim Commissioner, Minnesota Department of Human Services, 2019. Chief Operating Officer, Twin Cities Habitat for Humanity, 2017-2019. Vice President for University Services, University of Minnesota, 2012-2016. Interim President and CEO, Blue Cross and Blue Shield of Minnesota, 2011-2012. Executive Vice-President and Chief Financial Officer, Minnesota Wild, 2002-2008. Commissioner, Minnesota Department of Finance, 1999-2002. Chair of the Board of Directors of Destination Medical Center Corporation. Board member of the Minnesota Wild Foundation. | N/A |
* Length of service dates reflect the Trustee’s commencement of service with the Trust’s predecessor entities, where applicable.
28 | Allspring VT Omega Growth Fund
Other information (unaudited)
Officers2
Name and
year of birth | Position held and
length of service | Principal occupations during past five years or longer |
Andrew Owen
(Born 1960) | President,
since 2017 | President and Chief Executive Officer of Allspring Funds Management, LLC since 2017 and Head of Global Fund Governance of Allspring Global Investments since 2022. Prior thereto, co-president of Galliard Capital Management, LLC, an affiliate of Allspring Funds Management, LLC, from 2019 to 2022 and Head of Affiliated Managers, Allspring Global Investments, from 2014 to 2019 and Executive Vice President responsible for marketing, investments and product development for Allspring Funds Management, LLC, from 2009 to 2014. |
Jeremy DePalma
(Born 1974) | Treasurer,
since 2012
(for certain funds in
the Fund Complex);
since 2021 (for
the remaining funds in the
Fund Complex) | Senior Vice President of Allspring Funds Management, LLC since 2009. Senior Vice President of Evergreen Investment Management Company, LLC from 2008 to 2010 and head of the Fund Reporting and Control Team within Fund Administration from 2005 to 2010. |
Christopher Baker
(Born 1976) | Chief Compliance Officer, since 2022 | Global Chief Compliance Officer for Allspring Global Investments since 2022. Prior thereto, Chief Compliance Officer for State Street Global Advisors from 2018 to 2021. Senior Compliance Officer for the State Street divisions of Alternative Investment Solutions, Sector Solutions, and Global Marketing from 2015 to 2018. From 2010 to 2015 Vice President, Global Head of Investment and Marketing Compliance for State Street Global Advisors. |
Matthew Prasse
(Born 1983) | Chief Legal Officer, since 2022; Secretary, since 2021 | Senior Counsel of the Allspring Legal Department since 2021. Senior Counsel of the Wells Fargo Legal Department from 2018 to 2021. Previously, Counsel for Barings LLC from 2015 to 2018. Prior to joining Barings, Associate at Morgan, Lewis & Bockius LLP from 2008 to 2015. |
1 The Statement of Additional Information includes additional information about the Trustees and is available, without charge, upon request, by calling 1-800-222-8222 or by visiting the website at allspringglobal.com.
2 For those Officers with tenures at Allspring Global Investments and/or Allspring Funds Management, LLC that began prior to 2021, such tenures include years of service during which these businesses/entities were known as Wells Fargo Asset Management and Wells Fargo Funds Management, LLC, respectively.
Allspring VT Omega Growth Fund | 29
For more information
More information about Allspring Funds is available free upon request. To obtain literature, please write, visit the Fund's website, or call:
Allspring Funds
P.O. Box 219967
Kansas City, MO 64121-9967
Website: allspringglobal.com
Individual investors: 1-800-260-5969
Retail investment professionals: 1-888-877-9275
Institutional investment professionals: 1-866-765-0778
This report and the financial statements contained herein are submitted for the general information of the shareholders of the Fund. If this report is used for promotional purposes, distribution of the report must be accompanied or preceded by a current prospectus. Before investing, please consider the investment objectives, risks, charges, and expenses of the investment. For a current prospectus and, if available, a summary prospectus, containing this information, call
1-800-260-5969 or visit the Fund's website at allspringglobal.com. Read the prospectus carefully before you invest or send money.
Allspring Global InvestmentsTM is the trade name for the asset management firms of Allspring Global Investments Holdings, LLC, a holding company indirectly owned by certain private funds of GTCR LLC and Reverence Capital Partners, L.P. These firms include but are not limited to Allspring Global Investments, LLC, and Allspring Funds Management, LLC. Certain products managed by Allspring entities are distributed by Allspring Funds Distributor, LLC (a broker-dealer and Member FINRA/SIPC).
This material is for general informational and educational purposes only and is NOT intended to provide investment advice or a recommendation of any kind - including a recommendation for any specific investment, strategy, or plan.
© 2023 Allspring Global Investments Holdings, LLC. All rights reserved.
ALL-01052023-telndelo 02-23
AR0578 12-22
Annual Report
December 31, 2022
Allspring VT Opportunity Fund
The views expressed and any forward-looking statements are as of December 31, 2022, unless otherwise noted, and are those of the Fund's portfolio managers and/or Allspring Global Investments. Discussions of individual securities or the markets generally are not intended as individual recommendations. Future events or results may vary significantly from those expressed in any forward-looking statements. The views expressed are subject to change at any time in response to changing circumstances in the market. Allspring Global Investments disclaims any obligation to publicly update or revise any views expressed or forward-looking statements.
Allspring VT Opportunity Fund | 1
Letter to shareholders (unaudited)
Andrew Owen
President
Allspring Funds
Dear Shareholder:
We are pleased to offer you this annual report for the Allspring VT Opportunity Fund for the 12-month period that ended December 31, 2022. Globally, stocks and bonds experienced heightened volatility and historically poor performance through the challenging period. Earlier tailwinds provided by global stimulus programs, vaccination rollouts, and recovering consumer and corporate sentiment were wiped away by the highest rate of inflation in four decades, the impact of ongoing aggressive central bank rate hikes and the prospect of more rate hikes. Compounding these concerns were the global reverberations of the Russia-Ukraine war and the impact of China’s strict COVID-19 lockdowns.
For the 12-month period, both stocks and bonds registered major losses, with even U.S. bonds suffering double-digit losses and other assets faring worse. For the period, U.S. stocks, based on the S&P 500 Index,1 returned -18.11%. International stocks, as measured by the MSCI ACWI ex USA Index (Net),2 returned -16.00%, while the MSCI EM Index (Net) (USD)3 had weaker performance with a decline of 20.09%. Among bond indexes, the Bloomberg U.S. Aggregate Bond Index4 returned -13.01%, the Bloomberg Global Aggregate ex-USD Index (unhedged)5 returned -18.70%, the Bloomberg Municipal Bond Index6 declined 8.53%, and the ICE BofA U.S. High Yield Index7 fell 11.17%.
Rising inflation, COVID, and the Russian invasion of Ukraine drove market performance.
In January 2022, concerns mounted about U.S. interest rate hikes and the Russia-Ukraine conflict. The Federal Reserve (Fed) hinted that a March interest rate hike was likely. Meanwhile, Russia threatened a potential invasion of Ukraine, which could disrupt Russia’s massive energy supplies and drive demand from non-Russian oil-producing countries. Elsewhere overseas, Europe saw food and energy prices spike, leading to rising inflation. Within fixed income, corporate bonds struggled in January, trailing government bonds, as investors focused on elevated inflation and the prospect of rising interest rates and tighter money supply.
The Russian invasion of Ukraine dominated the financial world in February and March. Equity, bond, and commodities markets were shaken by fear, uncertainty, and an upending of demand-supply dynamics. Major global stock indexes were down in February, along with global bonds overall, with heightened volatility in March and mixed results that favored U.S. large-cap stocks. Prices of commodities spiked, including crude oil, natural gas, wheat, and precious metals, on elevated concerns of supply shortages. All of this fueled inflation concerns and added to expectations of more aggressive central bank interest rate hikes. Sweeping sanctions against Russia and corporate pullouts contributed to market volatility. Despite the geopolitical turmoil, the U.S. economic outlook remained largely unchanged, with a healthy job market and signs of economic resilience accompanying higher prices.
“ The Russian invasion of Ukraine dominated the financial world in February and March. Equity, bond, and commodities markets were shaken by fear, uncertainty, and an upending of demand-supply dynamics.”
| 1 | The S&P 500 Index consists of 500 stocks chosen for market size, liquidity, and industry group representation. It is a market-value-weighted index with each stock's weight in the index proportionate to its market value. You cannot invest directly in an index. |
| 2 | The Morgan Stanley Capital International (MSCI) All Country World Index (ACWI) ex USA Index (Net) is a free-float-adjusted market-capitalization-weighted index that is designed to measure the equity market performance of developed and emerging markets, excluding the U.S. Source: MSCI. MSCI makes no express or implied warranties or representations and shall have no liability whatsoever with respect to any MSCI data contained herein. The MSCI data may not be further redistributed or used as a basis for other indexes or any securities or financial products. This report is not approved, reviewed, or produced by MSCI. You cannot invest directly in an index. |
| 3 | The MSCI Emerging Markets (EM) Index (Net) (USD) is a free-float-adjusted market-capitalization-weighted index that is designed to measure equity market performance of emerging markets. You cannot invest directly in an index. |
| 4 | The Bloomberg U.S. Aggregate Bond Index is a broad-based benchmark that measures the investment-grade, U.S.-dollar-denominated, fixed-rate taxable bond market, including Treasuries, government-related and corporate securities, mortgage-backed securities (agency fixed-rate and hybrid adjustable-rate mortgage pass-throughs), asset-backed securities, and commercial mortgage-backed securities. You cannot invest directly in an index. |
| 5 | The Bloomberg Global Aggregate ex-USD Index (unhedged) is an unmanaged index that provides a broad-based measure of the global investment-grade fixed-income markets excluding the U.S.-dollar-denominated debt market. You cannot invest directly in an index. |
| 6 | The Bloomberg Municipal Bond Index is an unmanaged index composed of long-term tax-exempt bonds with a minimum credit rating of Baa. You cannot invest directly in an index. |
| 7 | The ICE BofA U.S. High Yield Index is a market-capitalization-weighted index of domestic and Yankee high-yield bonds. The index tracks the performance of high-yield securities traded in the U.S. bond market. You cannot invest directly in an index. Copyright 2023. ICE Data Indices, LLC. All rights reserved. |
2 | Allspring VT Opportunity Fund
Letter to shareholders (unaudited)
In April, market volatility continued, with deepening losses across major capital markets, as both the S&P 500 and MSCI ACWI (Net)1 fell 8% or more for the month. The Chinese economy struggled through a strict lockdown as the government tried to contain a major COVID-19 outbreak. The ensuing global ripple effect compounded existing supply shortages. This was exacerbated by the impact of the Russia-Ukraine war on global commodities. Meanwhile, U.S. annual inflation raged at 8.5%, its highest level since 1981, and investors braced themselves for aggressive Fed monetary tightening moves.
Market volatility continued in May, although markets recovered ground late in the month. Value stocks continued to outperform growth stocks. The concerns that had dominated markets for months continued, including high inflation and geopolitical tensions that added to high crude oil, gasoline, and food prices. In response, the Fed raised the federal funds rate by 0.50%, with widescale expectations of more rate hikes. Meanwhile, highly contagious COVID-19 variants persisted. However, labor markets in the U.S., the U.K., and Europe remained strong. U.S. retail sales for April, released in May, indicated a fourth consecutive monthly increase, reflecting continued consumer resilience.
In June, stocks posted further losses en route to their worst first half of a year in 50 years. Bonds didn’t fare much better. Driving the losses were the familiar factors: rising global inflation and fears of recession as central banks increased rates to try to curb soaring inflation. The Fed raised its short-term rate by another 0.75% in June. Meanwhile, the U.S. unemployment rate held firm at 3.6% and the housing market remained only marginally affected by sharply higher mortgage rates.
Markets rebounded in July, led by U.S. stocks. While evidence began to point to an economic slowdown after two consecutive quarters of declining gross domestic product (economic contraction), the U.S. labor market remained surprisingly robust: July nonfarm payrolls grew by more than 500,000 and U.S. unemployment dipped to 3.5%. Meanwhile, crude oil and retail gasoline prices, major contributors to recent overall inflation, fell substantially from earlier highs. And while U.S. home prices rose, home sales fell as houses became less affordable with mortgage rates at a 13-year high. The Fed raised the federal funds rate another 0.75% in July—to a range of 2.25% to 2.50%—and forecasts pointed to further rate hikes.
August was yet another broadly challenging month for financial markets, with more red ink flowing. High inflation persisted, cresting 9% in the eurozone on an annual basis and remaining above 8% in the U.S. despite the Fed’s aggressive monetary policy and a major drop in global crude oil and gasoline prices from their June peak. One positive note was the resilience of the U.S. job market. However, the Fed’s job was clearly not complete. One longer-term bright spot was the U.S. Congress’s passage of the Inflation Reduction Act. Its primary stated goals include: to reduce inflation (though not immediately) by curbing the deficit, capping health care spending by seniors, and investing in domestic sources of clean energy.
The market misery continued in September. There was nowhere to hide as all asset classes suffered major losses at the hands of persistent inflation. Central banks kept up their battle against rapidly rising prices with more rate hikes. The strength of the U.S. dollar made things even more difficult for investors holding assets in other currencies. U.S. mortgage rates jumped to near 7% on 30-year fixed-rate mortgages; the decreased housing affordability began to cool demand somewhat. The U.K. experienced a sharp sell-off of government bonds and the British pound in September as investors panicked in response to a new government budget that was seen as financially unsound. The market meltdown forced the Bank of England to step in and buy long-dated government bonds.
Equities had a reprieve in October after two months of sharp declines. Value stocks and small caps fared best. Globally, developed markets outpaced emerging market equities, which were hurt by weakness among Chinese stocks. Central banks continued to try to curtail high inflation with aggressive interest rate hikes. Geopolitical risks persisted, including the ongoing Russia-Ukraine war and economic, financial market, and political turmoil in the U.K., which led to a second prime ministerial change in six weeks, as Rishi Sunak replaced Liz Truss in late October. Concerns over Europe’s energy crisis eased thanks to unseasonably warm weather and plentiful gas on hand. The U.S. labor market continued its resilience against rising prices, as unemployment stood at 3.7%, near a record low.
“ In June, stocks posted further losses en route to their worst first half of a year in 50 years. Bonds didn’t fare much better. Driving the losses were the familiar factors: rising global inflation and fears of recession as central banks increased rates to try to curb soaring inflation.”
| 1 | The MSCI ACWI (Net) is a free-float-adjusted market-capitalization-weighted index that is designed to measure the equity market performance of developed and emerging markets. You cannot invest directly in an index. |
Allspring VT Opportunity Fund | 3
Letter to shareholders (unaudited)
Stocks and bonds rallied in November, with emerging market equities gaining nearly 15% and developed market equities returning 7%. The S&P 500 Index rose 5.6% in November. Bonds also had positive monthly returns. Economic news was encouraging, driven by U.S. labor market strength. Although central banks kept raising rates, hopes rose for an easing in the pace of rate hikes and a possible end to central bank monetary tightening in 2023. Although inflation remained at record highs in the eurozone, we began to see signs of a possible decline in inflationary pressures as U.S. inflation moderated, with a 7.1% annual price rise in November and a monthly price increase of just 0.1%. China’s economic data remained weak, reflecting its zero-COVID-19 policy.
Financial markets cooled in December, with U.S. equities posting negative overall results in response to a weakening U.S. dollar. Fixed income securities ended one of their worst years ever with flat overall monthly returns as markets weighed the hopes for an end to the monetary tightening cycle with the reality that central banks had not completed their jobs yet. U.S. Consumer Price Index (CPI)1 data showed a strong consistent trend downward, which brought down the 12-month CPI to 6.5% in December from 9.1% in June. Other countries and regions reported still-high but declining inflation rates as the year winded down.
Don’t let short-term uncertainty derail long-term investment goals.
Periods of investment uncertainty can present challenges, but experience has taught us that maintaining long-term investment goals can be an effective way to plan for the future. To help you create a sound strategy based on your personal goals and risk tolerance, Allspring Funds offers more than 100 mutual funds spanning a wide range of asset classes and investment styles. Although diversification cannot guarantee an investment profit or prevent losses, we believe it can be an effective way to manage investment risk and potentially smooth out overall portfolio performance. We encourage investors to know their investments and to understand that appropriate levels of risk-taking may unlock opportunities.
Thank you for choosing to invest with Allspring Funds. We appreciate your confidence in us and remain committed to helping you meet your financial needs.
Sincerely,
Andrew Owen
President
Allspring Funds
For further information about your fund, contact your investment professional, visit our website at allspringglobal.com, or call us directly at 1-800-222-8222.
| 1 | The Consumer Price Index (CPI) is a measure of the average change over time in the prices paid by urban consumers for a market basket of consumer goods and services. You cannot invest directly in an index. |
4 | Allspring VT Opportunity Fund
This page is intentionally left blank.
Performance highlights (unaudited)
| Investment objective | The Fund seeks long-term capital appreciation. |
| Manager | Allspring Funds Management, LLC |
| Subadviser | Allspring Global Investments, LLC |
| Portfolio managers | Kurt Gunderson, Christopher G. Miller, CFA®‡ |
| Average annual total returns (%) as of December 31, 2022 |
| | | | | | Expense ratios1 (%) |
| | Inception date | 1 year | 5 year | 10 year | Gross | Net 2 |
| Class 1 | 8-26-2011 | -20.61 | 8.12 | 10.96 | 0.85 | 0.75 |
| Class 2 | 5-8-1992 | -20.81 | 7.86 | 10.68 | 1.10 | 1.00 |
| Russell 3000® Index3 | – | -19.21 | 8.79 | 12.13 | – | – |
Figures quoted represent past performance, which is no guarantee of future results. Investment return and principal value of an investment will fluctuate so that an investor’s shares, when redeemed, may be worth more or less than their original cost. Current performance may be lower or higher than the performance data quoted and assumes the reinvestment of dividends and capital gains. Current month-end performance is available by calling 1-800-260-5969. Performance figures of the Fund do not reflect fees and expenses charged pursuant to the terms of variable life insurance policies and variable annuity contracts. If these fees and expenses had been reflected, performance would have been lower.
Index returns do not include transaction costs associated with buying and selling securities, any mutual fund fees or expenses, or any taxes. It is not possible to invest directly in an index.
Shares are sold without a front-end sales charge or contingent deferred sales charge.
| 1 | Reflects the expense ratios as stated in the most recent prospectuses. The expense ratios shown are subject to change and may differ from the annualized expense ratios shown in the financial highlights of this report. |
| 2 | The manager has contractually committed through April 30, 2023, to waive fees and/or reimburse expenses to the extent necessary to cap total annual fund operating expenses after fee waivers at 0.75% for Class 1 shares and 1.00% for Class 2 shares. Brokerage commissions, stamp duty fees, interest, taxes, acquired fund fees and expenses (if any), and extraordinary expenses are excluded from the expense caps. Prior to or after the commitment expiration date, the caps may be increased or the commitment to maintain the caps may be terminated only with the approval of the Board of Trustees. Without these caps, the Fund’s returns would have been lower. The expense ratio paid by an investor is the net expense ratio (the total annual fund operating expenses after fee waivers) as stated in the prospectuses. |
| 3 | The Russell 3000® Index measures the performance of the 3,000 largest U.S. companies based on total market capitalization, which represents approximately 98% of the investable U.S. equity market. You cannot invest directly in an index. |
Stock values fluctuate in response to the activities of individual companies and general market and economic conditions. Smaller-company stocks tend to be more volatile and less liquid than those of larger companies. Certain investment strategies tend to increase the total risk of an investment (relative to the broader market). This fund is exposed to foreign investment risk. Consult the Fund’s prospectus for additional information on these and other risks.
Please refer to the prospectus provided by your participating insurance company for detailed information describing the separate accounts for information regarding surrender charges, mortality and expense risk fees, and other charges that may be assessed by the participating insurance companies.
| ‡ | CFA® and Chartered Financial Analyst® are trademarks owned by CFA Institute. |
6 | Allspring VT Opportunity Fund
Performance highlights (unaudited)
Growth of $10,000 investment as of December 31, 20221
| 1 | The chart compares the performance of Class 2 shares for the most recent ten years with the Russell 3000® Index. The chart assumes a hypothetical investment of $10,000 in Class 2 shares and reflects all operating expenses of the Fund but does not reflect fees and expenses charged pursuant to the terms of variable life insurance policies and variable annuity contracts. |
Allspring VT Opportunity Fund | 7
Performance highlights (unaudited)
MANAGER'S DISCUSSION
Fund highlights
| ■ | The Fund lagged its benchmark, the Russell 3000® Index, for the 12-month period that ended December 31, 2022. |
| ■ | Health care and the Fund’s underweight to consumer staples, utilities, and energy were relative detractors during the year. |
| ■ | Stocks within the information technology (IT), consumer discretionary, and materials sectors contributed during the period. |
2022 was a challenging year for equities.
Notwithstanding the rally in the last three months of the year, 2022 marked the steepest decline for equities since 2008. Sustained inflation, an unprecedented Federal Reserve (Fed) interest rate-hiking cycle, constricting liquidity conditions, and the unwinding of COVID-19-era economic distortions exacerbated the pressure with long-duration assets, including growth stocks, bearing the brunt of the declines. Elevated inflation and higher interest rates plundered many of the mega-cap technology names in 2022, raising the question as to whether their prolonged leadership is sustainable. Small- and mid-cap stocks, an area where we are overweight, have traded at multi-decade valuation lows relative to their large-cap counterparts. We believe that this dynamic, coupled with the changing economic landscape, bodes well for our portfolio on a relative basis going forward. We also believe it is reasonable to assume that volatility is here for the foreseeable future and that the need for valuation-centric active management is critical.
| Ten largest holdings (%) as of December 31, 20221 |
| Apple Incorporated | 4.44 |
| Alphabet Incorporated Class C | 3.77 |
| MasterCard Incorporated Class A | 2.92 |
| Amazon.com Incorporated | 2.92 |
| Texas Instruments Incorporated | 2.72 |
| Burlington Stores Incorporated | 2.39 |
| Salesforce.com Incorporated | 2.34 |
| The Home Depot Incorporated | 2.33 |
| Equinix Incorporated | 2.33 |
| MTU Aero Engines AG | 2.31 |
| 1 | Figures represent the percentage of the Fund's net assets. Holdings are subject to change and may have changed since the date specified. |
Stocks within health care and the Fund’s underweight to consumer staples, utilities, and energy impeded performance.
The Fund’s underweight to consumer staples and utilities hampered relative performance as investors gravitated
toward defensive names amid the risk-off environment. Additionally, the Fund’s underweight to energy was a relative headwind as the sector rallied 63% during the period. Within health care, diagnostics company Bio-Rad Laboratories, Inc., retraced sharply as it cited weakness in COVID-19-related demand and supply chain issues while LivaNova shares were plundered in concert with weakening fundamentals over the course of the year. Elsewhere in the Fund, semiconductor holding Marvell Technology Inc. retraced sharply in conjunction with the overall semiconductor industry as it cited an increase in inventory spurred by weakness in data center demand amid a deteriorating economic backdrop.
| Sector allocation as of December 31, 20221 |
| 1 | Figures represent the percentage of the Fund's long-term investments. Allocations are subject to change and may have changed since the date specified. |
IT, consumer discretionary, and materials stocks aided relative performance.
Within IT, software data analytics company Fair Isaac Corporation* rose 47% as strong pricing from its Scores segment drove robust cash flow growth. In the consumer discretionary sector, Deckers Outdoor Corporation delivered strong earnings metrics abetted by its HOKA and UGG brands. Elsewhere in the Fund, materials holding Steel Dynamics rose 60% as demand for metal increased sharply amid the inflationary backdrop. Other contributors in the Fund came from a smattering of industries, including telecommunications, real estate software, retail, industrial
| * | This security was no longer held at the end of the reporting period. |
8 | Allspring VT Opportunity Fund
Performance highlights (unaudited)
manufacturing, and medical devices. Stocks within health care and the Fund’s underweight to consumer staples, utilities, and energy impeded performance.
Although near-term economic growth is expected to decelerate, we remain optimistic.
Within the current backdrop of a global tightening cycle and geopolitical tensions, we expect near-term economic growth to decelerate. This appears to be discounted by markets as investor sentiment sits at historically low levels. While timing an inflection point is always difficult, the reset in expectations illustrated by a sharp contraction in valuations gives us confidence that the market has digested much of the slowdown to come.
We continue to maintain diversified exposure across sectors in both growth and value stocks. A key outcome of our bottom-up, flexible, active core approach is the ability to migrate to wherever the best opportunities in the market exist. Our style-agnostic focus provides access to a broader opportunity set of stocks that can often be overlooked by style-based managers. Additionally, our core approach enables us to adeptly navigate volatility that arises when different investment styles come in and fall out of favor. Our Private Market Value process, which goes back more than 30 years, has proven to be successful over many market cycles. It is this type of market environment, when sentiment is dour, volatility is elevated, and market noise is resounding, that has historically been a good opportunity for clients with long-term investing horizons.
Allspring VT Opportunity Fund | 9
Fund expenses (unaudited)
As a shareholder of the Fund, you incur ongoing costs, including management fees, distribution (12b-1) fees, and other Fund expenses. This example is intended to help you understand your ongoing costs (in dollars) of investing in the Fund and to compare these costs with the ongoing costs of investing in other mutual funds.
The example is based on an investment of $1,000 invested at the beginning of the six-month period and held for the entire period from July 1, 2022 to December 31, 2022.
Actual expenses
The “Actual” line of the table below provides information about actual account values and actual expenses. You may use the information in this line, together with the amount you invested, to estimate the expenses that you paid over the period. Simply divide your account value by $1,000 (for example, an $8,600 account value divided by $1,000 = 8.6), then multiply the result by the number in the “Actual” line under the heading entitled “Expenses paid during period” for your applicable class of shares to estimate the expenses you paid on your account during this period.
Hypothetical example for comparison purposes
The “Hypothetical” line of the table below provides information about hypothetical account values and hypothetical expenses based on the Fund’s actual expense ratio and an assumed rate of return of 5% per year before expenses, which is not the Fund’s actual return. The hypothetical account values and expenses may not be used to estimate the actual ending account balance or expenses you paid for the period. You may use this information to compare the ongoing costs of investing in the Fund and other funds. To do so, compare this 5% hypothetical example with the 5% hypothetical examples that appear in the shareholder reports of the other funds.
Please note that the expenses shown in the table are meant to highlight your ongoing costs only and do not reflect any separate account charges assessed by participating insurance companies. Therefore, the “Hypothetical” line of the table is useful in comparing ongoing costs only, and will not help you determine the relative total costs of owning different funds. In addition, if these separate account charges assessed by participating insurance companies were included, your costs would have been higher.
| | Beginning
account value
7-1-2022 | Ending
account value
12-31-2022 | Expenses
paid during
the period1 | Annualized net
expense ratio |
| Class 1 | | | | |
| Actual | $1,000.00 | $1,030.64 | $3.84 | 0.75% |
| Hypothetical (5% return before expenses) | $1,000.00 | $1,021.42 | $3.82 | 0.75% |
| Class 2 | | | | |
| Actual | $1,000.00 | $1,029.16 | $5.11 | 1.00% |
| Hypothetical (5% return before expenses) | $1,000.00 | $1,020.16 | $5.09 | 1.00% |
1 Expenses paid is equal to the annualized net expense ratio of each class multiplied by the average account value over the period, multiplied by 184 divided by 365 (to reflect the one-half-year period).
10 | Allspring VT Opportunity Fund
Portfolio of investments—December 31, 2022
| | | | | Shares | Value |
| Common stocks: 98.39% | | | | | |
| Communication services: 7.70% | | | | | |
| Entertainment: 1.04% | | | | | |
| Activision Blizzard Incorporated | | | | 21,600 | $ 1,653,476 |
| Interactive media & services: 5.60% | | | | | |
| Alphabet Incorporated Class C † | | | | 67,776 | 6,013,764 |
| Meta Platforms Incorporated Class A † | | | | 24,275 | 2,921,254 |
| | | | | | 8,935,018 |
| Wireless telecommunication services: 1.06% | | | | | |
| T-Mobile US Incorporated † | | | | 12,092 | 1,692,880 |
| Consumer discretionary: 11.42% | | | | | |
| Internet & direct marketing retail: 2.92% | | | | | |
| Amazon.com Incorporated † | | | | 55,445 | 4,657,380 |
| Multiline retail: 1.76% | | | | | |
| Dollar General Corporation | | | | 11,375 | 2,801,094 |
| Specialty retail: 5.46% | | | | | |
| Burlington Stores Incorporated † | | | | 18,760 | 3,803,778 |
| The Home Depot Incorporated | | | | 11,788 | 3,723,358 |
| Ulta Beauty Incorporated † | | | | 2,516 | 1,180,180 |
| | | | | | 8,707,316 |
| Textiles, apparel & luxury goods: 1.28% | | | | | |
| Deckers Outdoor Corporation † | | | | 5,107 | 2,038,510 |
| Consumer staples: 2.69% | | | | | |
| Food & staples retailing: 1.16% | | | | | |
| Sysco Corporation | | | | 24,248 | 1,853,760 |
| Household products: 1.53% | | | | | |
| Church & Dwight Company Incorporated | | | | 30,277 | 2,440,629 |
| Financials: 6.63% | | | | | |
| Capital markets: 4.99% | | | | | |
| Intercontinental Exchange Incorporated | | | | 23,646 | 2,425,843 |
| S&P Global Incorporated | | | | 7,620 | 2,552,243 |
| The Charles Schwab Corporation | | | | 35,796 | 2,980,375 |
| | | | | | 7,958,461 |
| Insurance: 1.64% | | | | | |
| Marsh & McLennan Companies Incorporated | | | | 15,768 | 2,609,289 |
| Health care: 11.52% | | | | | |
| Health care equipment & supplies: 5.00% | | | | | |
| Align Technology Incorporated † | | | | 5,188 | 1,094,149 |
| Boston Scientific Corporation † | | | | 65,561 | 3,033,507 |
| LivaNova plc † | | | | 36,283 | 2,015,158 |
| Medtronic plc | | | | 23,561 | 1,831,161 |
| | | | | | 7,973,975 |
The accompanying notes are an integral part of these financial statements.
Allspring VT Opportunity Fund | 11
Portfolio of investments—December 31, 2022
| | | | | Shares | Value |
| Health care providers & services: 1.87% | | | | | |
| UnitedHealth Group Incorporated | | | | 5,635 | $ 2,987,564 |
| Health care technology: 0.33% | | | | | |
| Schrodinger Incorporated † | | | | 27,733 | 518,330 |
| Life sciences tools & services: 4.32% | | | | | |
| Agilent Technologies Incorporated | | | | 14,435 | 2,160,198 |
| Bio-Rad Laboratories Incorporated Class A † | | | | 4,487 | 1,886,739 |
| Thermo Fisher Scientific Incorporated | | | | 5,157 | 2,839,908 |
| | | | | | 6,886,845 |
| Industrials: 17.14% | | | | | |
| Aerospace & defense: 2.31% | | | | | |
| MTU Aero Engines AG | | | | 17,009 | 3,681,511 |
| Building products: 3.11% | | | | | |
| Carlisle Companies Incorporated | | | | 13,565 | 3,196,592 |
| Trex Company Incorporated † | | | | 41,654 | 1,763,214 |
| | | | | | 4,959,806 |
| Commercial services & supplies: 1.50% | | | | | |
| Republic Services Incorporated | | | | 18,499 | 2,386,186 |
| Machinery: 4.35% | | | | | |
| Fortive Corporation | | | | 49,380 | 3,172,665 |
| Ingersoll Rand Incorporated | | | | 44,192 | 2,309,032 |
| SPX Technologies Incorporated † | | | | 22,069 | 1,448,830 |
| | | | | | 6,930,527 |
| Professional services: 2.55% | | | | | |
| CoStar Group Incorporated † | | | | 28,003 | 2,164,072 |
| Dun & Bradstreet Holdings Incorporated | | | | 155,252 | 1,903,390 |
| | | | | | 4,067,462 |
| Trading companies & distributors: 3.32% | | | | | |
| Air Lease Corporation | | | | 62,617 | 2,405,745 |
| United Rentals Incorporated † | | | | 8,121 | 2,886,366 |
| | | | | | 5,292,111 |
| Information technology: 26.76% | | | | | |
| Electronic equipment, instruments & components: 4.13% | | | | | |
| Amphenol Corporation Class A | | | | 40,089 | 3,052,376 |
| Teledyne Technologies Incorporated † | | | | 8,835 | 3,533,205 |
| | | | | | 6,585,581 |
| IT services: 5.61% | | | | | |
| Fiserv Incorporated † | | | | 22,554 | 2,279,533 |
| Genpact Limited | | | | 43,248 | 2,003,247 |
| MasterCard Incorporated Class A | | | | 13,414 | 4,664,450 |
| | | | | | 8,947,230 |
The accompanying notes are an integral part of these financial statements.
12 | Allspring VT Opportunity Fund
Portfolio of investments—December 31, 2022
| | | | | Shares | Value |
| Semiconductors & semiconductor equipment: 4.05% | | | | | |
| Marvell Technology Incorporated | | | | 57,313 | $ 2,122,874 |
| Texas Instruments Incorporated | | | | 26,225 | 4,332,895 |
| | | | | | 6,455,769 |
| Software: 8.53% | | | | | |
| Black Knight Incorporated † | | | | 24,994 | 1,543,380 |
| Palo Alto Networks Incorporated † | | | | 12,053 | 1,681,876 |
| Salesforce.com Incorporated † | | | | 28,083 | 3,723,525 |
| ServiceNow Incorporated † | | | | 5,321 | 2,065,985 |
| Splunk Incorporated † | | | | 24,906 | 2,144,158 |
| Workday Incorporated Class A † | | | | 14,592 | 2,441,679 |
| | | | | | 13,600,603 |
| Technology hardware, storage & peripherals: 4.44% | | | | | |
| Apple Incorporated | | | | 54,441 | 7,073,519 |
| Materials: 5.90% | | | | | |
| Chemicals: 4.82% | | | | | |
| Ashland Global Holdings Incorporated | | | | 20,105 | 2,161,891 |
| Olin Corporation | | | | 52,021 | 2,753,992 |
| The Sherwin-Williams Company | | | | 11,690 | 2,774,388 |
| | | | | | 7,690,271 |
| Metals & mining: 1.08% | | | | | |
| Steel Dynamics Incorporated | | | | 17,626 | 1,722,060 |
| Real estate: 8.63% | | | | | |
| Equity REITs: 8.63% | | | | | |
| American Tower Corporation | | | | 11,281 | 2,389,993 |
| Equinix Incorporated | | | | 5,655 | 3,704,195 |
| Prologis Incorporated | | | | 21,358 | 2,407,687 |
| Sun Communities Incorporated | | | | 22,626 | 3,235,518 |
| VICI Properties Incorporated | | | | 62,086 | 2,011,586 |
| | | | | | 13,748,979 |
| Total Common stocks (Cost $125,368,364) | | | | | 156,856,142 |
| | | Yield | | | |
| Short-term investments: 1.64% | | | | | |
| Investment companies: 1.64% | | | | | |
| Allspring Government Money Market Fund Select Class ♠∞ | | 4.09% | | 2,607,162 | 2,607,162 |
| Total Short-term investments (Cost $2,607,162) | | | | | 2,607,162 |
| Total investments in securities (Cost $127,975,526) | 100.03% | | | | 159,463,304 |
| Other assets and liabilities, net | (0.03) | | | | (43,397) |
| Total net assets | 100.00% | | | | $159,419,907 |
| † | Non-income-earning security |
| ♠ | The issuer of the security is an affiliated person of the Fund as defined in the Investment Company Act of 1940. |
| ∞ | The rate represents the 7-day annualized yield at period end. |
The accompanying notes are an integral part of these financial statements.
Allspring VT Opportunity Fund | 13
Portfolio of investments—December 31, 2022
| Abbreviations: |
| REIT | Real estate investment trust |
Investments in affiliates
An affiliated investment is an investment in which the Fund owns at least 5% of the outstanding voting shares of the issuer or as a result of other relationships, such as the Fund and the issuer having the same investment manager. Transactions with issuers that were affiliates of the Fund at the end of the period were as follows:
| | Value,
beginning of
period | Purchases | Sales
proceeds | Net
realized
gains
(losses) | | Net
change in
unrealized
gains
(losses) | | Value,
end of
period | Shares,
end
of period | Income
from
affiliated
securities |
| Short-term investments | | | | | | | | | |
| Allspring Government Money Market Fund Select Class | $1,561,097 | $27,721,181 | $(26,675,116) | $0 | | $0 | | $ 2,607,162 | 2,607,162 | $ 30,570 |
Investments in affiliates no longer
held at end of period | | | | | | | | | | |
| Securities Lending Cash Investments LLC | 4,058,435 | 4,721,892 | (8,780,327) | 0 | | 0 | | 0 | 0 | 3,390 # |
| | | | | $0 | | $0 | | $2,607,162 | | $33,960 |
| # | Amount shown represents income before fees and rebates. |
The accompanying notes are an integral part of these financial statements.
14 | Allspring VT Opportunity Fund
Statement of assets and liabilities—December 31, 2022
| | |
| Assets | |
Investments in unaffiliated securities, at value (cost $125,368,364)
| $ 156,856,142 |
Investments in affiliated securities, at value (cost $2,607,162)
| 2,607,162 |
Cash
| 5,937 |
Receivable for dividends
| 188,419 |
Receivable for Fund shares sold
| 5,398 |
Receivable for securities lending income, net
| 8 |
Prepaid expenses and other assets
| 1,034 |
Total assets
| 159,664,100 |
| Liabilities | |
Management fee payable
| 97,346 |
Payable for Fund shares redeemed
| 61,268 |
Distribution fee payable
| 30,940 |
Shareholder report expenses payable
| 21,961 |
Administration fees payable
| 11,762 |
Trustees’ fees and expenses payable
| 2,763 |
Accrued expenses and other liabilities
| 18,153 |
Total liabilities
| 244,193 |
Total net assets
| $159,419,907 |
| Net assets consist of | |
Paid-in capital
| $ 114,064,111 |
Total distributable earnings
| 45,355,796 |
Total net assets
| $159,419,907 |
| Computation of net asset value per share | |
Net assets – Class 1
| $ 25,149,390 |
Shares outstanding – Class 11
| 1,130,877 |
Net asset value per share – Class 1
| $22.24 |
Net assets – Class 2
| $ 134,270,517 |
Shares outstanding – Class 21
| 6,016,698 |
Net asset value per share – Class 2
| $22.32 |
| 1 | The Fund has an unlimited number of authorized shares. |
The accompanying notes are an integral part of these financial statements.
Allspring VT Opportunity Fund | 15
Statement of operations—year ended December 31, 2022
| | |
| Investment income | |
Dividends (net of foreign withholdings taxes of $3,978)
| $ 1,481,405 |
Income from affiliated securities
| 33,298 |
Total investment income
| 1,514,703 |
| Expenses | |
Management fee
| 1,232,615 |
| Administration fees | |
Class 1
| 22,168 |
Class 2
| 118,703 |
| Distribution fee | |
Class 2
| 368,756 |
Custody and accounting fees
| 16,899 |
Professional fees
| 50,343 |
Shareholder report expenses
| 48,717 |
Trustees’ fees and expenses
| 21,407 |
Other fees and expenses
| 20,467 |
Total expenses
| 1,900,075 |
| Less: Fee waivers and/or expense reimbursements | |
Fund-level
| (208,908) |
Net expenses
| 1,691,167 |
Net investment loss
| (176,464) |
| Realized and unrealized gains (losses) on investments | |
Net realized gains on investments
| 14,366,380 |
Net change in unrealized gains (losses) on investments
| (58,993,467) |
Net realized and unrealized gains (losses) on investments
| (44,627,087) |
Net decrease in net assets resulting from operations
| $(44,803,551) |
The accompanying notes are an integral part of these financial statements.
16 | Allspring VT Opportunity Fund
Statement of changes in net assets
| | | | | |
| | Year ended
December 31, 2022 | Year ended
December 31, 2021 |
| Operations | | | | |
Net investment loss
| | $ (176,464) | | $ (488,072) |
Net realized gains on investments
| | 14,366,380 | | 34,674,337 |
Net change in unrealized gains (losses) on investments
| | (58,993,467) | | 12,426,757 |
Net increase (decrease) in net assets resulting from operations
| | (44,803,551) | | 46,613,022 |
| Distributions to shareholders from | | | | |
| Net investment income and net realized gains | | | | |
Class 1
| | (5,397,089) | | (1,721,579) |
Class 2
| | (28,508,608) | | (8,980,638) |
Total distributions to shareholders
| | (33,905,697) | | (10,702,217) |
| Capital share transactions | Shares | | Shares | |
| Proceeds from shares sold | | | | |
Class 1
| 19,855 | 524,201 | 14,838 | 488,248 |
Class 2
| 65,477 | 1,762,168 | 92,298 | 3,047,866 |
| | | 2,286,369 | | 3,536,114 |
| Reinvestment of distributions | | | | |
Class 1
| 235,167 | 5,397,089 | 53,415 | 1,721,579 |
Class 2
| 1,236,279 | 28,508,608 | 276,924 | 8,980,638 |
| | | 33,905,697 | | 10,702,217 |
| Payment for shares redeemed | | | | |
Class 1
| (107,448) | (2,803,006) | (172,775) | (5,602,343) |
Class 2
| (599,805) | (16,380,805) | (701,988) | (22,829,650) |
| | | (19,183,811) | | (28,431,993) |
Net increase (decrease) in net assets resulting from capital share transactions
| | 17,008,255 | | (14,193,662) |
Total increase (decrease) in net assets
| | (61,700,993) | | 21,717,143 |
| Net assets | | | | |
Beginning of period
| | 221,120,900 | | 199,403,757 |
End of period
| | $159,419,907 | | $221,120,900 |
The accompanying notes are an integral part of these financial statements.
Allspring VT Opportunity Fund | 17
Financial highlights
(For a share outstanding throughout each period)
| | Year ended December 31 |
| Class 1 | 2022 | 2021 | 2020 | 2019 | 2018 |
Net asset value, beginning of period
| $34.96 | $29.48 | $26.56 | $22.76 | $27.05 |
Net investment income (loss)
| 0.03 | (0.01) | 0.09 | 0.17 | 0.15 |
Net realized and unrealized gains (losses) on investments
| (7.06) | 7.25 | 5.03 | 6.84 | (1.69) |
Total from investment operations
| (7.03) | 7.24 | 5.12 | 7.01 | (1.54) |
| Distributions to shareholders from | | | | | |
Net investment income
| 0.00 | (0.08) | (0.19) | (0.15) | (0.12) |
Net realized gains
| (5.69) | (1.68) | (2.01) | (3.06) | (2.63) |
Total distributions to shareholders
| (5.69) | (1.76) | (2.20) | (3.21) | (2.75) |
Net asset value, end of period
| $22.24 | $34.96 | $29.48 | $26.56 | $22.76 |
Total return1
| (20.61)% | 25.06% | 21.32% | 31.81% | (6.93)% |
| Ratios to average net assets (annualized) | | | | | |
Gross expenses
| 0.87% | 0.84% | 0.86% | 0.85% | 0.84% |
Net expenses
| 0.75% | 0.75% | 0.75% | 0.75% | 0.75% |
Net investment income (loss)
| 0.11% | (0.02)% | 0.31% | 0.67% | 0.52% |
| Supplemental data | | | | | |
Portfolio turnover rate
| 26% | 27% | 42% | 25% | 31% |
Net assets, end of period (000s omitted)
| $25,149 | $34,376 | $32,066 | $30,811 | $27,165 |
| 1 | Returns do not reflect fees and expenses charged pursuant to the terms of variable life insurance policies and variable annuity contracts. |
The accompanying notes are an integral part of these financial statements.
18 | Allspring VT Opportunity Fund
Financial highlights
(For a share outstanding throughout each period)
| | Year ended December 31 |
| Class 2 | 2022 | 2021 | 2020 | 2019 | 2018 |
Net asset value, beginning of period
| $35.14 | $29.63 | $26.68 | $22.85 | $27.14 |
Net investment income (loss)
| (0.03) | (0.09) | 0.03 | 0.11 | 0.08 |
Net realized and unrealized gains (losses) on investments
| (7.10) | 7.29 | 5.05 | 6.86 | (1.69) |
Total from investment operations
| (7.13) | 7.20 | 5.08 | 6.97 | (1.61) |
| Distributions to shareholders from | | | | | |
Net investment income
| 0.00 | (0.01) | (0.12) | (0.08) | (0.05) |
Net realized gains
| (5.69) | (1.68) | (2.01) | (3.06) | (2.63) |
Total distributions to shareholders
| (5.69) | (1.69) | (2.13) | (3.14) | (2.68) |
Net asset value, end of period
| $22.32 | $35.14 | $29.63 | $26.68 | $22.85 |
Total return1
| (20.81)% | 24.78% | 21.00% | 31.46% | (7.15)% |
| Ratios to average net assets (annualized) | | | | | |
Gross expenses
| 1.12% | 1.10% | 1.11% | 1.10% | 1.09% |
Net expenses
| 1.00% | 1.00% | 1.00% | 1.00% | 1.00% |
Net investment income (loss)
| (0.14)% | (0.27)% | 0.06% | 0.42% | 0.27% |
| Supplemental data | | | | | |
Portfolio turnover rate
| 26% | 27% | 42% | 25% | 31% |
Net assets, end of period (000s omitted)
| $134,271 | $186,745 | $167,338 | $158,216 | $134,972 |
| 1 | Returns do not reflect fees and expenses charged pursuant to the terms of variable life insurance policies and variable annuity contracts. |
The accompanying notes are an integral part of these financial statements.
Allspring VT Opportunity Fund | 19
Notes to financial statements
1. ORGANIZATION
Allspring Variable Trust (the "Trust"), a Delaware statutory trust organized on March 10, 1999, is an open-end management investment company registered under the Investment Company Act of 1940, as amended (the "1940 Act"). As an investment company, the Trust follows the accounting and reporting guidance in Financial Accounting Standards Board ("FASB") Accounting Standards Codification Topic 946, Financial Services – Investment Companies. These financial statements report on the Allspring VT Opportunity Fund (the "Fund") which is a diversified series of the Trust. The Trust offers shares of the Fund to separate accounts of various life insurance companies as funding vehicles for certain variable annuity contracts and variable life insurance policies.
2. SIGNIFICANT ACCOUNTING POLICIES
The following significant accounting policies, which are consistently followed in the preparation of the financial statements of the Fund, are in conformity with U.S. generally accepted accounting principles which require management to make estimates and assumptions that affect the reported amounts of assets and liabilities, disclosure of contingent assets and liabilities at the date of the financial statements, and the reported amounts of income and expenses during the reporting period. Actual results could differ from those estimates.
Securities valuation
All investments are valued each business day as of the close of regular trading on the New York Stock Exchange (generally 4 p.m. Eastern Time), although the Fund may deviate from this calculation time under unusual or unexpected circumstances.
Equity securities that are listed on a foreign or domestic exchange or market are valued at the official closing price or, if none, the last sales price.
The values of securities denominated in foreign currencies are translated into U.S. dollars at rates provided by an independent foreign currency pricing source at a time each business day specified by the Allspring Global Investments Valuation Committee at Allspring Funds Management, LLC ("Allspring Funds Management").
Many securities markets and exchanges outside the U.S. close prior to the close of the New York Stock Exchange and therefore may not fully reflect trading or events that occur after the close of the principal exchange in which the foreign securities are traded, but before the close of the New York Stock Exchange. If such trading or events are expected to materially affect the value of such securities, then fair value pricing procedures implemented by Allspring Funds Management are applied. These procedures take into account multiple factors including movements in U.S. securities markets after foreign exchanges close. Foreign securities that are fair valued under these procedures are categorized as Level 2 and the application of these procedures may result in transfers between Level 1 and Level 2. Depending on market activity, such fair valuations may be frequent. Such fair value pricing may result in net asset values that are higher or lower than net asset values based on the last reported sales price or latest quoted bid price. On December 31, 2022, such fair value pricing was not used in pricing foreign securities.
Investments in registered open-end investment companies (other than those listed on a foreign or domestic exchange or market) are valued at net asset value. Interests in non-registered investment companies that are redeemable at net asset value are fair valued normally at net asset value.
Investments which are not valued using the methods discussed above are valued at their fair value, as determined in good faith by Allspring Funds Management, which was named the valuation designee by the Board of Trustees. As the valuation designee, Allspring Funds Management is responsible for day-to-day valuation activities for the Allspring Funds. In connection with these responsibilities, Allspring Funds Management has established a Valuation Committee and has delegated to it the authority to take any actions regarding the valuation of portfolio securities that the Valuation Committee deems necessary or appropriate, including determining the fair value of portfolio securities. On a quarterly basis, the Board of Trustees receives reports of valuation actions taken by the Valuation Committee. On at least an annual basis, the Board of Trustees receives an assessment of the adequacy and effectiveness of Allspring Funds Management's process for determining the fair value of the portfolio of investments.
Foreign currency translation
The accounting records of the Fund are maintained in U.S. dollars. The values of other assets and liabilities denominated in foreign currencies are translated into U.S. dollars at rates provided by an independent foreign currency pricing source at a time each business day specified by the Allspring Global Investments Valuation Committee. Purchases and sales of securities, and income and expenses are converted at the rate of exchange on the respective dates of such transactions. Net realized foreign exchange gains or losses arise from sales of foreign currencies, currency gains or losses realized between the trade and settlement dates on securities transactions, and the difference between the amounts of dividends, interest and foreign
20 | Allspring VT Opportunity Fund
Notes to financial statements
withholding taxes recorded and the U.S. dollar equivalent of the amounts actually paid or received. Net unrealized foreign exchange gains and losses arise from changes in the fair value of assets and liabilities other than investments in securities resulting from changes in exchange rates. The changes in net assets arising from changes in exchange rates of securities and the changes in net assets resulting from changes in market prices of securities are not separately presented. Such changes are included in net realized and unrealized gains or losses from investments.
Securities lending
The Fund may lend its securities from time to time in order to earn additional income in the form of fees or interest on securities received as collateral or the investment of any cash received as collateral. When securities are on loan, the Fund receives interest or dividends on those securities. Cash collateral received in connection with its securities lending transactions is invested in Securities Lending Cash Investments, LLC (the "Securities Lending Fund"), an affiliated non-registered investment company. Investments in Securities Lending Fund are valued at the evaluated bid price provided by an independent pricing service. Income earned from investment in the Securities Lending Fund (net of fees and rebates), if any, is included in income from affiliated securities on the Statement of Operations.
In a securities lending transaction, the net asset value of the Fund is affected by an increase or decrease in the value of the securities loaned and by an increase or decrease in the value of the instrument in which collateral is invested. The amount of securities lending activity undertaken by the Fund fluctuates from time to time. The Fund has the right under the lending agreement to recover the securities from the borrower on demand. In the event of default or bankruptcy by the borrower, the Fund may be prevented from recovering the loaned securities or gaining access to the collateral or may experience delays or costs in doing so. In such an event, the terms of the agreement allow the unaffiliated securities lending agent to use the collateral to purchase replacement securities on behalf of the Fund or pay the Fund the market value of the loaned securities. The Fund bears the risk of loss with respect to depreciation of its investment of the cash collateral.
Security transactions and income recognition
Securities transactions are recorded on a trade date basis. Realized gains or losses are recorded on the basis of identified cost.
Dividend income is recognized on the ex-dividend date, except for certain dividends from foreign securities, which are recorded as soon as the custodian verifies the ex-dividend date. Dividend income is recorded net of foreign taxes withheld where recovery of such taxes is not assured.
Distributions to shareholders
Distributions to shareholders from net investment income and any net realized gains are recorded on the ex-dividend date and paid at least annually. Such distributions are determined in accordance with income tax regulations and may differ from U.S. generally accepted accounting principles. Dividend sources are estimated at the time of declaration. The tax character of distributions is determined as of the Fund's fiscal year end. Therefore, a portion of the Fund's distributions made prior to the Fund’s fiscal year end may be categorized as a tax return of capital at year end.
Federal and other taxes
The Fund intends to continue to qualify as a regulated investment company by distributing substantially all of its investment company taxable income and any net realized capital gains (after reduction for capital loss carryforwards) sufficient to relieve it from all, or substantially all, federal income taxes. Accordingly, no provision for federal income taxes was required.
The Fund’s income and federal excise tax returns and all financial records supporting those returns for the prior three fiscal years are subject to examination by the federal and Delaware revenue authorities. Management has analyzed the Fund's tax positions taken on federal, state, and foreign tax returns, as applicable, for all open tax years and does not believe that there are any uncertain tax positions that require recognition of a tax liability.
As of December 31, 2022, the aggregate cost of all investments for federal income tax purposes was $128,431,269 and the unrealized gains (losses) consisted of:
| Gross unrealized gains | $38,685,085 |
| Gross unrealized losses | (7,653,050) |
| Net unrealized gains | $31,032,035 |
Allspring VT Opportunity Fund | 21
Notes to financial statements
Reclassifications are made to the Fund’s capital accounts for permanent tax differences to reflect income and gains available for distribution (or available capital loss carryforwards) under federal income tax regulations. U.S. generally accepted accounting principles require that certain components of net assets be adjusted to reflect permanent differences between financial and tax reporting. These reclassifications have no effect on net assets or net asset values per share. The primary permanent difference causing such reclassification is due to net operating loss. At December 31, 2022, as a result of permanent book-to-tax differences, the following reclassification adjustments were made on the Statement of Assets and Liabilities:
| Paid-in capital | Total distributable
earnings |
| $(202,623) | $202,623 |
Class allocations
The separate classes of shares offered by the Fund differ principally in distribution fees. Class specific expenses are charged directly to that share class. Investment income, common fund-level expenses, and realized and unrealized gains (losses) on investments are allocated daily to each class of shares based on the relative proportion of net assets of each class.
3. FAIR VALUATION MEASUREMENTS
Fair value measurements of investments are determined within a framework that has established a fair value hierarchy based upon the various data inputs utilized in determining the value of the Fund’s investments. The three-level hierarchy gives the highest priority to unadjusted quoted prices in active markets for identical assets or liabilities (Level 1) and the lowest priority to unobservable inputs (Level 3). The Fund’s investments are classified within the fair value hierarchy based on the lowest level of input that is significant to the fair value measurement. The inputs are summarized into three broad levels as follows:
| ■ | Level 1 – quoted prices in active markets for identical securities |
| ■ | Level 2 – other significant observable inputs (including quoted prices for similar securities, interest rates, prepayment speeds, credit risk, etc.) |
| ■ | Level 3 – significant unobservable inputs (including the Fund’s own assumptions in determining the fair value of investments) |
The inputs or methodologies used for valuing investments in securities are not necessarily an indication of the risk associated with investing in those securities.
The following is a summary of the inputs used in valuing the Fund’s assets and liabilities as of December 31, 2022:
| | Quoted prices
(Level 1) | Other significant
observable inputs
(Level 2) | Significant
unobservable inputs
(Level 3) | Total |
| Assets | | | | |
| Investments in: | | | | |
| Common stocks | | | | |
| Communication services | $ 12,281,374 | $0 | $0 | $ 12,281,374 |
| Consumer discretionary | 18,204,300 | 0 | 0 | 18,204,300 |
| Consumer staples | 4,294,389 | 0 | 0 | 4,294,389 |
| Financials | 10,567,750 | 0 | 0 | 10,567,750 |
| Health care | 18,366,714 | 0 | 0 | 18,366,714 |
| Industrials | 27,317,603 | 0 | 0 | 27,317,603 |
| Information technology | 42,662,702 | 0 | 0 | 42,662,702 |
| Materials | 9,412,331 | 0 | 0 | 9,412,331 |
| Real estate | 13,748,979 | 0 | 0 | 13,748,979 |
| Short-term investments | | | | |
| Investment companies | 2,607,162 | 0 | 0 | 2,607,162 |
| Total assets | $159,463,304 | $0 | $0 | $159,463,304 |
Additional sector, industry or geographic detail, if any, is included in the Portfolio of Investments.
For the year ended December 31, 2022, the Fund did not have any transfers into/out of Level 3.
22 | Allspring VT Opportunity Fund
Notes to financial statements
4. TRANSACTIONS WITH AFFILIATES
Management fee
Allspring Funds Management, a wholly owned subsidiary of Allspring Global Investments Holdings, LLC, a holding company indirectly owned by certain private funds of GTCR LLC and Reverence Capital Partners, L.P., is the manager of the Fund and provides advisory and fund-level administrative services under an investment management agreement. Under the investment management agreement, Allspring Funds Management is responsible for, among other services, implementing the investment objectives and strategies of the Fund, supervising the subadviser and providing fund-level administrative services in connection with the Fund’s operations. As compensation for its services under the investment management agreement, Allspring Funds Management is entitled to receive a management fee at the following annual rate based on the Fund’s average daily net assets:
| Average daily net assets | Management fee |
| First $500 million | 0.700% |
| Next $500 million | 0.675 |
| Next $1 billion | 0.650 |
| Next $2 billion | 0.625 |
| Next $1 billion | 0.600 |
| Next $5 billion | 0.590 |
| Over $10 billion | 0.580 |
For the year ended December 31, 2022, the management fee was equivalent to an annual rate of 0.70% of the Fund’s average daily net assets.
Allspring Funds Management has retained the services of a subadviser to provide daily portfolio management to the Fund. The fee for subadvisory services is borne by Allspring Funds Management. Allspring Global Investments, LLC ("Allspring Investments"), an affiliate of Allspring Funds Management and a wholly owned subsidiary of Allspring Global Investments Holdings, LLC, is the subadviser to the Fund and is entitled to receive a fee from Allspring Funds Management at an annual rate starting at 0.45% and declining to 0.30% as the average daily net assets of the Fund increase.
Administration fees
Under a class-level administration agreement, Allspring Funds Management provides class-level administrative services to the Fund, which includes paying fees and expenses for services provided by the transfer agent, sub-transfer agents, omnibus account services and record-keepers. As compensation for its services under the class-level administration agreement, Allspring Funds Management receives an annual fee of 0.08% which is calculated based on the average daily net assets of each class.
Waivers and/or expense reimbursements
Allspring Funds Management has contractually committed to waive and/or reimburse management and administration fees to the extent necessary to maintain certain net operating expense ratios for the Fund. When each class of the Fund has exceeded its expense cap, Allspring Funds Management will waive fees and/or reimburse expenses from fund-level expenses on a proportionate basis and then from class specific expenses. When only certain classes exceed their expense caps, waivers and/or reimbursements are applied against class specific expenses before fund-level expenses. Allspring Funds Management has contractually committed through April 30, 2023 to waive fees and/or reimburse expenses to the extent necessary to cap expenses. Prior to or after the commitment expiration date, the caps may be increased or the commitment to maintain the caps may be terminated only with the approval of the Board of Trustees. As of December 31, 2022, the contractual expense caps are as follows:
| | Expense ratio caps |
| Class 1 | 0.75% |
| Class 2 | 1.00 |
Allspring VT Opportunity Fund | 23
Notes to financial statements
Distribution fee
The Trust has adopted a distribution plan for Class 2 shares pursuant to Rule 12b-1 under the 1940 Act. A distribution fee is charged to Class 2 shares and paid to Allspring Funds Distributor, LLC, the principal underwriter, an affiliate of Allspring Funds Management, at an annual rate up to 0.25% of the average daily net assets of Class 2 shares.
Interfund transactions
The Fund may purchase or sell portfolio investment securities to certain affiliates pursuant to Rule 17a-7 under the 1940 Act and under procedures adopted by the Board of Trustees. The procedures have been designed to ensure that these interfund transactions, which do not incur broker commissions, are effected at current market prices.
5. INVESTMENT PORTFOLIO TRANSACTIONS
Purchases and sales of investments, excluding U.S. government obligations (if any) and short-term securities, for the year ended December 31, 2022 were $45,085,133 and $63,159,652, respectively.
6. SECURITIES LENDING TRANSACTIONS
The Fund lends its securities through an unaffiliated securities lending agent and receives collateral in the form of cash or securities with a value at least equal to the value of the securities on loan. The value of the loaned securities is determined at the close of each business day and any increases or decreases in the required collateral are exchanged between the Fund and the counterparty on the next business day. Cash collateral received is invested in the Securities Lending Fund which seeks to provide a positive return compared to the daily Federal Funds Open Rate by investing in high-quality, U.S. dollar-denominated short-term money market instruments and is exempt from registration under Section 3(c)(7) of the 1940 Act. Securities Lending Fund is managed by Allspring Funds Management and is subadvised by Allspring Investments. Allspring Funds Management receives an advisory fee starting at 0.05% and declining to 0.01% as the average daily net assets of the Securities Lending Fund increase. All of the fees received by Allspring Funds Management are paid to Allspring Investments for its services as subadviser.
In the event of counterparty default or the failure of a borrower to return a loaned security, the Fund has the right to use the collateral to offset any losses incurred. As of December 31, 2022, the Fund did not have any securities on loan.
7. BANK BORROWINGS
The Trust, Allspring Master Trust and Allspring Funds Trust (excluding the money market funds) are parties to a $350,000,000 revolving credit agreement whereby the Fund is permitted to use bank borrowings for temporary or emergency purposes, such as to fund shareholder redemption requests. Interest under the credit agreement is charged to the Fund based on a borrowing rate equal to the higher of the Federal Funds rate or the overnight bank funding rate in effect on that day plus a spread. In addition, an annual commitment fee equal based on the unused balance is allocated to each participating fund.
For the year ended December 31, 2022, there were no borrowings by the Fund under the agreement.
8. DISTRIBUTIONS TO SHAREHOLDERS
The tax character of distributions paid during the years ended December 31, 2022 and December 31, 2021 were as follows:
| | Year ended December 31 |
| | 2022 | 2021 |
| Ordinary income | $ 4,301,723 | $ 155,690 |
| Long-term capital gain | 29,603,974 | 10,546,527 |
As of December 31, 2022, the components of distributable earnings on a tax basis were as follows:
Undistributed
long-term
gain | Unrealized
gains |
| $14,328,087 | $31,031,887 |
24 | Allspring VT Opportunity Fund
Notes to financial statements
9. CONCENTRATION RISKS
As of the end of the period, the Fund concentrated its portfolio of investments in the information technology sector. A fund that invests a substantial portion of its assets in any sector may be more affected by changes in that sector than would be a fund whose investments are not heavily weighted in any sector.
10. MARKET RISKS
On March 11, 2020, the World Health Organization announced that it had made the assessment that coronavirus disease 2019 (“COVID-19”) is a pandemic. The impacts of COVID-19 are affecting the entire global economy, individual companies and investment products, the funds, and the market in general. There is significant uncertainty around the extent and duration of business disruptions related to COVID-19 and the impacts may last for an extended period of time. COVID-19 has led to significant uncertainty and volatility in the financial markets.
11. INDEMNIFICATION
Under the Fund's organizational documents, the officers and Trustees have been granted certain indemnification rights against certain liabilities that may arise out of performance of their duties to the Fund. The Fund has entered into a separate agreement with each Trustee that converts indemnification rights currently existing under the Fund’s organizational documents into contractual rights that cannot be changed in the future without the consent of the Trustee. Additionally, in the normal course of business, the Fund may enter into contracts with service providers that contain a variety of indemnification clauses. The Fund’s maximum exposure under these arrangements is dependent on future claims that may be made against the Fund and, therefore, cannot be estimated.
Allspring VT Opportunity Fund | 25
Report of independent registered public accounting firm
To the Shareholders of the Fund and Board of Trustees
Allspring Variable Trust:
Opinion on the Financial Statements
We have audited the accompanying statement of assets and liabilities of Allspring VT Opportunity Fund (the Fund), one of the funds constituting Allspring Variable Trust, including the portfolio of investments, as of December 31, 2022, the related statement of operations for the year then ended, the statements of changes in net assets for each of the years in the two-year period then ended, and the related notes (collectively, the financial statements) and the financial highlights for each of the years in the five-year period then ended. In our opinion, the financial statements and financial highlights present fairly, in all material respects, the financial position of the Fund as of December 31, 2022, the results of its operations for the year then ended, the changes in its net assets for each of the years in the two-year period then ended, and the financial highlights for each of the years in the five-year period then ended, in conformity with U.S. generally accepted accounting principles.
Basis for Opinion
These financial statements and financial highlights are the responsibility of the Fund’s management. Our responsibility is to express an opinion on these financial statements and financial highlights based on our audits. We are a public accounting firm registered with the Public Company Accounting Oversight Board (United States) (PCAOB) and are required to be independent with respect to the Fund in accordance with the U.S. federal securities laws and the applicable rules and regulations of the Securities and Exchange Commission and the PCAOB.
We conducted our audits in accordance with the standards of the PCAOB. Those standards require that we plan and perform the audit to obtain reasonable assurance about whether the financial statements and financial highlights are free of material misstatement, whether due to error or fraud. Our audits included performing procedures to assess the risks of material misstatement of the financial statements and financial highlights, whether due to error or fraud, and performing procedures that respond to those risks. Such procedures included examining, on a test basis, evidence regarding the amounts and disclosures in the financial statements and financial highlights. Such procedures also included confirmation of securities owned as of December 31, 2022, by correspondence with the custodian and transfer agent. Our audits also included evaluating the accounting principles used and significant estimates made by management, as well as evaluating the overall presentation of the financial statements and financial highlights. We believe that our audits provide a reasonable basis for our opinion.

We have not been able to determine the specific year that we began serving as the auditor of one or more Allspring Funds investment companies; however, we are aware that we have served as the auditor of one or more Allspring Funds investment companies since at least 1955.
Boston, Massachusetts
February 27, 2023
26 | Allspring VT Opportunity Fund
Other information (unaudited)
TAX INFORMATION
For corporate shareholders, pursuant to Section 854 of the Internal Revenue Code, 24% of ordinary income dividends qualify for the corporate dividends-received deduction for the fiscal year ended December 31, 2022.
Pursuant to Section 852 of the Internal Revenue Code, $29,603,974 was designated as a 20% rate gain distribution for the fiscal year ended December 31, 2022.
For the fiscal year ended December 31, 2022, $4,301,723 has been designated as short-term capital gain dividends for nonresident alien shareholders pursuant to Section 871 of the Internal Revenue Code.
PROXY VOTING INFORMATION
A description of the policies and procedures used to determine how to vote proxies relating to portfolio securities is available without charge, upon request, by calling 1-800-260-5969, visiting our website at allspringglobal.com, or visiting the SEC website at sec.gov. Information regarding how the proxies related to portfolio securities were voted during the most recent 12-month period ended June 30 is available on the website at allspringglobal.com or by visiting the SEC website at sec.gov.
QUARTERLY PORTFOLIO HOLDINGS INFORMATION
The Fund files its complete schedule of portfolio holdings with the SEC for the first and third quarters of each fiscal year as an exhibit to its reports on Form N-PORT. Shareholders may view the filed Form N-PORT by visiting the SEC website at sec.gov.
Allspring VT Opportunity Fund | 27
Other information (unaudited)
BOARD OF TRUSTEES AND OFFICERS
Each of the Trustees and Officers listed in the table below acts in identical capacities for each fund in the Allspring family of funds, which consists of 127 mutual funds comprising the Allspring Funds Trust, Allspring Variable Trust, Allspring Master Trust and four closed-end funds (collectively the “Fund Complex”). This table should be read in conjunction with the Prospectus and the Statement of Additional Information1. The mailing address of each Trustee and Officer is 1415 Vantage Park Drive, 3rd Floor, Charlotte, NC 28203. Each Trustee and Officer serves an indefinite term, however, each Trustee serves such term until reaching the mandatory retirement age established by the Trustees.
Independent Trustees
Name and
year of birth | Position held and
length of service* | Principal occupations during past five years or longer | Current other
public company or
investment
company
directorships |
William R. Ebsworth
(Born 1957) | Trustee,
since 2015 | Retired. From 1984 to 2013, equities analyst, portfolio manager, research director and chief investment officer at Fidelity Management and Research Company in Boston, Tokyo, and Hong Kong, and retired in 2013 as Chief Investment Officer of Fidelity Strategic Advisers, Inc. where he led a team of investment professionals managing client assets. Prior thereto, Board member of Hong Kong Securities Clearing Co., Hong Kong Options Clearing Corp., the Thailand International Fund, Ltd., Fidelity Investments Life Insurance Company, and Empire Fidelity Investments Life Insurance Company. Audit Committee Chair and Investment Committee Chair of the Vincent Memorial Hospital Foundation (non-profit organization). Mr. Ebsworth is a CFA® charterholder. | N/A |
Jane A. Freeman
(Born 1953) | Trustee,
since 2015;
Chair Liaison,
since 2018 | Retired. From 2012 to 2014 and 1999 to 2008, Chief Financial Officer of Scientific Learning Corporation. From 2008 to 2012, Ms. Freeman provided consulting services related to strategic business projects. Prior to 1999, Portfolio Manager at Rockefeller & Co. and Scudder, Stevens & Clark. Board member of the Harding Loevner Funds from 1996 to 2014, serving as both Lead Independent Director and chair of the Audit Committee. Board member of the Russell Exchange Traded Funds Trust from 2011 to 2012 and the chair of the Audit Committee. Ms. Freeman is also an inactive Chartered Financial Analyst. | N/A |
Isaiah Harris, Jr.
(Born 1952) | Trustee,
since 2009; Audit
Committee
Chair,
since 2019 | Retired. Member of the Advisory Board of CEF of East Central Florida. Chairman of the Board of CIGNA Corporation from 2009 to 2021, and Director from 2005 to 2008. From 2003 to 2011, Director of Deluxe Corporation. Prior thereto, President and CEO of BellSouth Advertising and Publishing Corp. from 2005 to 2007, President and CEO of BellSouth Enterprises from 2004 to 2005 and President of BellSouth Consumer Services from 2000 to 2003. Emeritus member of the Iowa State University Foundation Board of Governors. Emeritus Member of the Advisory Board of Iowa State University School of Business. Advisory Board Member, Palm Harbor Academy (private school). Advisory Board Member, Fellowship of Christian Athletes. Mr. Harris is a certified public accountant (inactive status). | N/A |
David F. Larcker
(Born 1950) | Trustee,
since 2009 | Distinguished Visiting Fellow at the Hoover Institution since 2022. James Irvin Miller Professor of Accounting at the Graduate School of Business (Emeritus), Stanford University, Director of the Corporate Governance Research Initiative and Senior Faculty of The Rock Center for Corporate Governance since 2006. From 2005 to 2008, Professor of Accounting at the Graduate School of Business, Stanford University. Prior thereto, Ernst & Young Professor of Accounting at The Wharton School, University of Pennsylvania from 1985 to 2005. | N/A |
28 | Allspring VT Opportunity Fund
Other information (unaudited)
Name and
year of birth | Position held and
length of service* | Principal occupations during past five years or longer | Current other
public company or
investment
company
directorships |
Olivia S. Mitchell
(Born 1953) | Trustee,
since 2006;
Nominating and
Governance
Committee Chair,
since 2018 | International Foundation of Employee Benefit Plans Professor since 1993, Wharton School of the University of Pennsylvania. Director of Wharton’s Pension Research Council and Boettner Center on Pensions & Retirement Research, and Research Associate at the National Bureau of Economic Research. Previously taught at Cornell University from 1978 to 1993. | N/A |
Timothy J. Penny
(Born 1951) | Trustee,
since 1996;
Chair,
since 2018 | President and Chief Executive Officer of Southern Minnesota Initiative Foundation, a non-profit organization, since 2007. Vice Chair of the Economic Club of Minnesota, since 2007. Co-Chair of the Committee for a Responsible Federal Budget, since 1995. Member of the Board of Trustees of NorthStar Education Finance, Inc., a non-profit organization, from 2007-2022. Senior Fellow of the University of Minnesota Humphrey Institute from 1995 to 2017. | N/A |
James G. Polisson
(Born 1959) | Trustee,
since 2018 | Retired. Chief Marketing Officer, Source (ETF) UK Services, Ltd, from 2015 to 2017. From 2012 to 2015, Principal of The Polisson Group, LLC, a management consulting, corporate advisory and principal investing company. Chief Executive Officer and Managing Director at Russell Investments, Global Exchange Traded Funds from 2010 to 2012. Managing Director of Barclays Global Investors from 1998 to 2010 and Global Chief Marketing Officer for iShares and Barclays Global Investors from 2000 to 2010. Trustee of the San Francisco Mechanics’ Institute, a non-profit organization, from 2013 to 2015. Board member of the Russell Exchange Traded Fund Trust from 2011 to 2012. Director of Barclays Global Investors Holdings Deutschland GmbH from 2006 to 2009. Mr. Polisson is an attorney and has a retired status with the Massachusetts and District of Columbia Bar Associations. | N/A |
Pamela Wheelock
(Born 1959) | Trustee,
since January
2020; previously
Trustee from
January 2018 to
July 2019 | Retired. Executive and Senior Financial leadership positions in the public, private and nonprofit sectors. Interim President and CEO, McKnight Foundation, 2020. Interim Commissioner, Minnesota Department of Human Services, 2019. Chief Operating Officer, Twin Cities Habitat for Humanity, 2017-2019. Vice President for University Services, University of Minnesota, 2012-2016. Interim President and CEO, Blue Cross and Blue Shield of Minnesota, 2011-2012. Executive Vice-President and Chief Financial Officer, Minnesota Wild, 2002-2008. Commissioner, Minnesota Department of Finance, 1999-2002. Chair of the Board of Directors of Destination Medical Center Corporation. Board member of the Minnesota Wild Foundation. | N/A |
* Length of service dates reflect the Trustee’s commencement of service with the Trust’s predecessor entities, where applicable.
Allspring VT Opportunity Fund | 29
Other information (unaudited)
Officers2
Name and
year of birth | Position held and
length of service | Principal occupations during past five years or longer |
Andrew Owen
(Born 1960) | President,
since 2017 | President and Chief Executive Officer of Allspring Funds Management, LLC since 2017 and Head of Global Fund Governance of Allspring Global Investments since 2022. Prior thereto, co-president of Galliard Capital Management, LLC, an affiliate of Allspring Funds Management, LLC, from 2019 to 2022 and Head of Affiliated Managers, Allspring Global Investments, from 2014 to 2019 and Executive Vice President responsible for marketing, investments and product development for Allspring Funds Management, LLC, from 2009 to 2014. |
Jeremy DePalma
(Born 1974) | Treasurer,
since 2012
(for certain funds in
the Fund Complex);
since 2021 (for
the remaining funds in the
Fund Complex) | Senior Vice President of Allspring Funds Management, LLC since 2009. Senior Vice President of Evergreen Investment Management Company, LLC from 2008 to 2010 and head of the Fund Reporting and Control Team within Fund Administration from 2005 to 2010. |
Christopher Baker
(Born 1976) | Chief Compliance Officer, since 2022 | Global Chief Compliance Officer for Allspring Global Investments since 2022. Prior thereto, Chief Compliance Officer for State Street Global Advisors from 2018 to 2021. Senior Compliance Officer for the State Street divisions of Alternative Investment Solutions, Sector Solutions, and Global Marketing from 2015 to 2018. From 2010 to 2015 Vice President, Global Head of Investment and Marketing Compliance for State Street Global Advisors. |
Matthew Prasse
(Born 1983) | Chief Legal Officer, since 2022; Secretary, since 2021 | Senior Counsel of the Allspring Legal Department since 2021. Senior Counsel of the Wells Fargo Legal Department from 2018 to 2021. Previously, Counsel for Barings LLC from 2015 to 2018. Prior to joining Barings, Associate at Morgan, Lewis & Bockius LLP from 2008 to 2015. |
1 The Statement of Additional Information includes additional information about the Trustees and is available, without charge, upon request, by calling 1-800-222-8222 or by visiting the website at allspringglobal.com.
2 For those Officers with tenures at Allspring Global Investments and/or Allspring Funds Management, LLC that began prior to 2021, such tenures include years of service during which these businesses/entities were known as Wells Fargo Asset Management and Wells Fargo Funds Management, LLC, respectively.
30 | Allspring VT Opportunity Fund
For more information
More information about Allspring Funds is available free upon request. To obtain literature, please write, visit the Fund's website, or call:
Allspring Funds
P.O. Box 219967
Kansas City, MO 64121-9967
Website: allspringglobal.com
Individual investors: 1-800-260-5969
Retail investment professionals: 1-888-877-9275
Institutional investment professionals: 1-866-765-0778
This report and the financial statements contained herein are submitted for the general information of the shareholders of the Fund. If this report is used for promotional purposes, distribution of the report must be accompanied or preceded by a current prospectus. Before investing, please consider the investment objectives, risks, charges, and expenses of the investment. For a current prospectus and, if available, a summary prospectus, containing this information, call
1-800-260-5969 or visit the Fund's website at allspringglobal.com. Read the prospectus carefully before you invest or send money.
Allspring Global InvestmentsTM is the trade name for the asset management firms of Allspring Global Investments Holdings, LLC, a holding company indirectly owned by certain private funds of GTCR LLC and Reverence Capital Partners, L.P. These firms include but are not limited to Allspring Global Investments, LLC, and Allspring Funds Management, LLC. Certain products managed by Allspring entities are distributed by Allspring Funds Distributor, LLC (a broker-dealer and Member FINRA/SIPC).
This material is for general informational and educational purposes only and is NOT intended to provide investment advice or a recommendation of any kind - including a recommendation for any specific investment, strategy, or plan.
© 2023 Allspring Global Investments Holdings, LLC. All rights reserved.
ALL-01052023-icyy79mm 02-23
AR3020 12-22
Annual Report
December 31, 2022
Allspring
VT Small Cap Growth Fund
The views expressed and any forward-looking statements are as of December 31, 2022, unless otherwise noted, and are those of the Fund's portfolio managers and/or Allspring Global Investments. Discussions of individual securities or the markets generally are not intended as individual recommendations. Future events or results may vary significantly from those expressed in any forward-looking statements. The views expressed are subject to change at any time in response to changing circumstances in the market. Allspring Global Investments disclaims any obligation to publicly update or revise any views expressed or forward-looking statements.
Allspring VT Small Cap Growth Fund | 1
Letter to shareholders (unaudited)
Andrew Owen
President
Allspring Funds
Dear Shareholder:
We are pleased to offer you this annual report for the Allspring VT Small Cap Growth Fund for the 12-month period that ended December 31, 2022. Globally, stocks and bonds experienced heightened volatility and historically poor performance through the challenging period. Earlier tailwinds provided by global stimulus programs, vaccination rollouts, and recovering consumer and corporate sentiment were wiped away by the highest rate of inflation in four decades, the impact of ongoing aggressive central bank rate hikes and the prospect of more rate hikes. Compounding these concerns were the global reverberations of the Russia-Ukraine war and the impact of China’s strict COVID-19 lockdowns.
For the 12-month period, both stocks and bonds registered major losses, with even U.S. bonds suffering double-digit losses and other assets faring worse. For the period, U.S. stocks, based on the S&P 500 Index,1 returned -18.11%. International stocks, as measured by the MSCI ACWI ex USA Index (Net),2 returned -16.00%, while the MSCI EM Index (Net) (USD)3 had weaker performance with a decline of 20.09%. Among bond indexes, the Bloomberg U.S. Aggregate Bond Index4 returned -13.01%, the Bloomberg Global Aggregate ex-USD Index (unhedged)5 returned -18.70%, the Bloomberg Municipal Bond Index6 declined 8.53%, and the ICE BofA U.S. High Yield Index7 fell 11.17%.
Rising inflation, COVID, and the Russian invasion of Ukraine drove market performance.
In January 2022, concerns mounted about U.S. interest rate hikes and the Russia-Ukraine conflict. The Federal Reserve (Fed) hinted that a March interest rate hike was likely. Meanwhile, Russia threatened a potential invasion of Ukraine, which could disrupt Russia’s massive energy supplies and drive demand from non-Russian oil-producing countries. Elsewhere overseas, Europe saw food and energy prices spike, leading to rising inflation. Within fixed income, corporate bonds struggled in January, trailing government bonds, as investors focused on elevated inflation and the prospect of rising interest rates and tighter money supply.
The Russian invasion of Ukraine dominated the financial world in February and March. Equity, bond, and commodities markets were shaken by fear, uncertainty, and an upending of demand-supply dynamics. Major global stock indexes were down in February, along with global bonds overall, with heightened volatility in March and mixed results that favored U.S. large-cap stocks. Prices of commodities spiked, including crude oil, natural gas, wheat, and precious metals, on elevated concerns of supply shortages. All of this fueled inflation concerns and added to expectations of more aggressive central bank interest rate hikes. Sweeping sanctions against Russia and corporate pullouts contributed to market volatility. Despite the geopolitical turmoil, the U.S. economic outlook remained largely unchanged, with a healthy job market and signs of economic resilience accompanying higher prices.
“ The Russian invasion of Ukraine dominated the financial world in February and March. Equity, bond, and commodities markets were shaken by fear, uncertainty, and an upending of demand-supply dynamics.”
| 1 | The S&P 500 Index consists of 500 stocks chosen for market size, liquidity, and industry group representation. It is a market-value-weighted index with each stock's weight in the index proportionate to its market value. You cannot invest directly in an index. |
| 2 | The Morgan Stanley Capital International (MSCI) All Country World Index (ACWI) ex USA Index (Net) is a free-float-adjusted market-capitalization-weighted index that is designed to measure the equity market performance of developed and emerging markets, excluding the U.S. Source: MSCI. MSCI makes no express or implied warranties or representations and shall have no liability whatsoever with respect to any MSCI data contained herein. The MSCI data may not be further redistributed or used as a basis for other indexes or any securities or financial products. This report is not approved, reviewed, or produced by MSCI. You cannot invest directly in an index. |
| 3 | The MSCI Emerging Markets (EM) Index (Net) (USD) is a free-float-adjusted market-capitalization-weighted index that is designed to measure equity market performance of emerging markets. You cannot invest directly in an index. |
| 4 | The Bloomberg U.S. Aggregate Bond Index is a broad-based benchmark that measures the investment-grade, U.S.-dollar-denominated, fixed-rate taxable bond market, including Treasuries, government-related and corporate securities, mortgage-backed securities (agency fixed-rate and hybrid adjustable-rate mortgage pass-throughs), asset-backed securities, and commercial mortgage-backed securities. You cannot invest directly in an index. |
| 5 | The Bloomberg Global Aggregate ex-USD Index (unhedged) is an unmanaged index that provides a broad-based measure of the global investment-grade fixed-income markets excluding the U.S.-dollar-denominated debt market. You cannot invest directly in an index. |
| 6 | The Bloomberg Municipal Bond Index is an unmanaged index composed of long-term tax-exempt bonds with a minimum credit rating of Baa. You cannot invest directly in an index. |
| 7 | The ICE BofA U.S. High Yield Index is a market-capitalization-weighted index of domestic and Yankee high-yield bonds. The index tracks the performance of high-yield securities traded in the U.S. bond market. You cannot invest directly in an index. Copyright 2023. ICE Data Indices, LLC. All rights reserved. |
2 | Allspring VT Small Cap Growth Fund
Letter to shareholders (unaudited)
In April, market volatility continued, with deepening losses across major capital markets, as both the S&P 500 and MSCI ACWI (Net)1 fell 8% or more for the month. The Chinese economy struggled through a strict lockdown as the government tried to contain a major COVID-19 outbreak. The ensuing global ripple effect compounded existing supply shortages. This was exacerbated by the impact of the Russia-Ukraine war on global commodities. Meanwhile, U.S. annual inflation raged at 8.5%, its highest level since 1981, and investors braced themselves for aggressive Fed monetary tightening moves.
Market volatility continued in May, although markets recovered ground late in the month. Value stocks continued to outperform growth stocks. The concerns that had dominated markets for months continued, including high inflation and geopolitical tensions that added to high crude oil, gasoline, and food prices. In response, the Fed raised the federal funds rate by 0.50%, with widescale expectations of more rate hikes. Meanwhile, highly contagious COVID-19 variants persisted. However, labor markets in the U.S., the U.K., and Europe remained strong. U.S. retail sales for April, released in May, indicated a fourth consecutive monthly increase, reflecting continued consumer resilience.
In June, stocks posted further losses en route to their worst first half of a year in 50 years. Bonds didn’t fare much better. Driving the losses were the familiar factors: rising global inflation and fears of recession as central banks increased rates to try to curb soaring inflation. The Fed raised its short-term rate by another 0.75% in June. Meanwhile, the U.S. unemployment rate held firm at 3.6% and the housing market remained only marginally affected by sharply higher mortgage rates.
Markets rebounded in July, led by U.S. stocks. While evidence began to point to an economic slowdown after two consecutive quarters of declining gross domestic product (economic contraction), the U.S. labor market remained surprisingly robust: July nonfarm payrolls grew by more than 500,000 and U.S. unemployment dipped to 3.5%. Meanwhile, crude oil and retail gasoline prices, major contributors to recent overall inflation, fell substantially from earlier highs. And while U.S. home prices rose, home sales fell as houses became less affordable with mortgage rates at a 13-year high. The Fed raised the federal funds rate another 0.75% in July—to a range of 2.25% to 2.50%—and forecasts pointed to further rate hikes.
August was yet another broadly challenging month for financial markets, with more red ink flowing. High inflation persisted, cresting 9% in the eurozone on an annual basis and remaining above 8% in the U.S. despite the Fed’s aggressive monetary policy and a major drop in global crude oil and gasoline prices from their June peak. One positive note was the resilience of the U.S. job market. However, the Fed’s job was clearly not complete. One longer-term bright spot was the U.S. Congress’s passage of the Inflation Reduction Act. Its primary stated goals include: to reduce inflation (though not immediately) by curbing the deficit, capping health care spending by seniors, and investing in domestic sources of clean energy.
The market misery continued in September. There was nowhere to hide as all asset classes suffered major losses at the hands of persistent inflation. Central banks kept up their battle against rapidly rising prices with more rate hikes. The strength of the U.S. dollar made things even more difficult for investors holding assets in other currencies. U.S. mortgage rates jumped to near 7% on 30-year fixed-rate mortgages; the decreased housing affordability began to cool demand somewhat. The U.K. experienced a sharp sell-off of government bonds and the British pound in September as investors panicked in response to a new government budget that was seen as financially unsound. The market meltdown forced the Bank of England to step in and buy long-dated government bonds.
Equities had a reprieve in October after two months of sharp declines. Value stocks and small caps fared best. Globally, developed markets outpaced emerging market equities, which were hurt by weakness among Chinese stocks. Central banks continued to try to curtail high inflation with aggressive interest rate hikes. Geopolitical risks persisted, including the ongoing Russia-Ukraine war and economic, financial market, and political turmoil in the U.K., which led to a second prime ministerial change in six weeks, as Rishi Sunak replaced Liz Truss in late October. Concerns over Europe’s energy crisis eased thanks to unseasonably warm weather and plentiful gas on hand. The U.S. labor market continued its resilience against rising prices, as unemployment stood at 3.7%, near a record low.
“ In June, stocks posted further losses en route to their worst first half of a year in 50 years. Bonds didn’t fare much better. Driving the losses were the familiar factors: rising global inflation and fears of recession as central banks increased rates to try to curb soaring inflation.”
| 1 | The MSCI ACWI (Net) is a free-float-adjusted market-capitalization-weighted index that is designed to measure the equity market performance of developed and emerging markets. You cannot invest directly in an index. |
Allspring VT Small Cap Growth Fund | 3
Letter to shareholders (unaudited)
Stocks and bonds rallied in November, with emerging market equities gaining nearly 15% and developed market equities returning 7%. The S&P 500 Index rose 5.6% in November. Bonds also had positive monthly returns. Economic news was encouraging, driven by U.S. labor market strength. Although central banks kept raising rates, hopes rose for an easing in the pace of rate hikes and a possible end to central bank monetary tightening in 2023. Although inflation remained at record highs in the eurozone, we began to see signs of a possible decline in inflationary pressures as U.S. inflation moderated, with a 7.1% annual price rise in November and a monthly price increase of just 0.1%. China’s economic data remained weak, reflecting its zero-COVID-19 policy.
Financial markets cooled in December, with U.S. equities posting negative overall results in response to a weakening U.S. dollar. Fixed income securities ended one of their worst years ever with flat overall monthly returns as markets weighed the hopes for an end to the monetary tightening cycle with the reality that central banks had not completed their jobs yet. U.S. Consumer Price Index (CPI)1 data showed a strong consistent trend downward, which brought down the 12-month CPI to 6.5% in December from 9.1% in June. Other countries and regions reported still-high but declining inflation rates as the year winded down.
Don’t let short-term uncertainty derail long-term investment goals.
Periods of investment uncertainty can present challenges, but experience has taught us that maintaining long-term investment goals can be an effective way to plan for the future. To help you create a sound strategy based on your personal goals and risk tolerance, Allspring Funds offers more than 100 mutual funds spanning a wide range of asset classes and investment styles. Although diversification cannot guarantee an investment profit or prevent losses, we believe it can be an effective way to manage investment risk and potentially smooth out overall portfolio performance. We encourage investors to know their investments and to understand that appropriate levels of risk-taking may unlock opportunities.
Thank you for choosing to invest with Allspring Funds. We appreciate your confidence in us and remain committed to helping you meet your financial needs.
Sincerely,
Andrew Owen
President
Allspring Funds
For further information about your fund, contact your investment professional, visit our website at allspringglobal.com, or call us directly at 1-800-222-8222.
| 1 | The Consumer Price Index (CPI) is a measure of the average change over time in the prices paid by urban consumers for a market basket of consumer goods and services. You cannot invest directly in an index. |
4 | Allspring VT Small Cap Growth Fund
This page is intentionally left blank.
Performance highlights (unaudited)
| Investment objective | The Fund seeks long-term capital appreciation. |
| Manager | Allspring Funds Management, LLC |
| Subadviser | Allspring Global Investments, LLC |
| Portfolio managers | Robert Gruendyke, CFA®‡, David Nazaret, CFA®‡, Thomas C. Ognar, CFA®‡ |
| Average annual total returns (%) as of December 31, 2022 |
| | | | | | Expense ratios1 (%) |
| | Inception date | 1 year | 5 year | 10 year | Gross | Net 2 |
| Class 1 | 7-16-2010 | -34.30 | 7.35 | 10.85 | 0.92 | 0.92 |
| Class 2 | 5-1-1995 | -34.42 | 7.09 | 10.58 | 1.17 | 1.17 |
| Russell 2000® Growth Index3 | – | -26.36 | 3.51 | 9.20 | – | – |
Figures quoted represent past performance, which is no guarantee of future results. Investment return and principal value of an investment will fluctuate so that an investor’s shares, when redeemed, may be worth more or less than their original cost. Current performance may be lower or higher than the performance data quoted and assumes the reinvestment of dividends and capital gains. Current month-end performance is available by calling 1-800-260-5969. Performance figures of the Fund do not reflect fees and expenses charged pursuant to the terms of variable life insurance policies and variable annuity contracts. If these fees and expenses had been reflected, performance would have been lower.
Index returns do not include transaction costs associated with buying and selling securities, any mutual fund fees or expenses, or any taxes. It is not possible to invest directly in an index.
Shares are sold without a front-end sales charge or contingent deferred sales charge.
| 1 | Reflects the expense ratios as stated in the most recent prospectuses. The expense ratios shown are subject to change and may differ from the annualized expense ratios shown in the financial highlights of this report. |
| 2 | The manager has contractually committed through April 30, 2023, to waive fees and/or reimburse expenses to the extent necessary to cap total annual fund operating expenses after fee waivers at 0.95% for Class 1 shares and 1.20% for Class 2 shares. Brokerage commissions, stamp duty fees, interest, taxes, acquired fund fees and expenses (if any), and extraordinary expenses are excluded from the expense caps. Prior to or after the commitment expiration date, the caps may be increased or the commitment to maintain the caps may be terminated only with the approval of the Board of Trustees. Without these caps, the Fund’s returns would have been lower. The expense ratio paid by an investor is the net expense ratio (the total annual fund operating expenses after fee waivers) as stated in the prospectuses. |
| 3 | The Russell 2000® Growth Index measures the performance of those Russell 2000 companies with higher price/book ratios and higher forecasted growth values. You cannot invest directly in an index. |
Stock values fluctuate in response to the activities of individual companies and general market and economic conditions. Smaller-company stocks tend to be more volatile and less liquid than those of larger companies. Consult the Fund’s prospectus for additional information on these and other risks.
Please refer to the prospectus provided by your participating insurance company for detailed information describing the separate accounts for information regarding surrender charges, mortality and expense risk fees, and other charges that may be assessed by the participating insurance companies.
| ‡ | CFA® and Chartered Financial Analyst® are trademarks owned by CFA Institute. |
6 | Allspring VT Small Cap Growth Fund
Performance highlights (unaudited)
Growth of $10,000 investment as of December 31, 20221
| 1 | The chart compares the performance of Class 2 shares for the most recent ten years with the Russell 2000® Growth Index. The chart assumes a hypothetical investment of $10,000 in Class 2 shares and reflects all operating expenses of the Fund but does not reflect fees and expenses charged pursuant to the terms of variable life insurance policies and variable annuity contracts. |
Allspring VT Small Cap Growth Fund | 7
Performance highlights (unaudited)
MANAGER'S DISCUSSION
Fund highlights
| ■ | The Fund underperformed its benchmark, the Russell 2000® Growth Index, for the 12-month period that ended December 31, 2022. |
| ■ | Information technology (IT) and industrials detracted during the period. |
| ■ | Financials and health care contributed due to strong stock selection. |
2022 was a difficult year as markets struggled with high inflation and aggressive monetary tightening.
Over the past year, investors have toiled with myriad headwinds, including high inflation, rising interest rates, and Russia’s invasion of Ukraine. The confluence of these issues has permeated the entire market, with growth stocks bearing the brunt of the damage. Value stocks significantly outperformed growth stocks in 2022. This can largely be explained by the high starting valuations for growth stocks, some growth disappointments, and the effects of rising interest rates. The market remains heavily top-down focused, perhaps appropriate given the highest inflation rate in more than four decades. The furious monetary tightening cycle that followed wreaked havoc across all assets, with the most pronounced negative impact on longer-duration assets such as growth equities. Persistent COVID-19 disruptions also led to global supply chain issues. The invasion of Ukraine amplified geopolitical risks and led to significantly higher energy prices (energy stocks were the only winners during 2022). The increasingly uncertain economic and business environment constrained risk appetite and led to a downward rerating of asset prices across the market. With our pure growth focus and emphasis on top-quartile growers, our style was at a significant disadvantage against an already-difficult market backdrop.
| Ten largest holdings (%) as of December 31, 20221 |
| SPS Commerce Incorporated | 3.77 |
| Kinsale Capital Group Incorporated | 3.37 |
| Calix Incorporated | 3.30 |
| Casella Waste Systems Incorporated Class A | 3.00 |
| TransMedics Group Incorporated | 2.85 |
| Novanta Incorporated | 2.67 |
| ASGN Incorporated | 2.56 |
| Axonics Incorporated | 2.18 |
| Diodes Incorporated | 2.07 |
| The Chef's Warehouse Incorporated | 2.01 |
| 1 | Figures represent the percentage of the Fund's net assets. Holdings are subject to change and may have changed since the date specified. |
An overweight to IT and stock selection within industrials inhibited performance.
IT stocks broadly declined as interest rates spiked. Valuation compressed dramatically throughout the year. Within the software industry, Rapid7, Inc, a cybersecurity company that specializes in intrusion management, saw its shares fall 71% after reporting weaker growth as customers cut back spending due to the challenging economic environment. Its end markets may not be as big as we anticipated, so we exited the position. Within industrials, top position Zurn Elkay Water Solutions Corporation, a pure play in water solutions and management with products for drinking water, water safety, and control and flow systems, hindered performance. Zurn Elkay underperformed after reporting a disappointing outlook and performance as the residential exposure became a larger-than-expected headwind near term.
| Sector allocation as of December 31, 20221 |
| 1 | Figures represent the percentage of the Fund's long-term investments. Allocations are subject to change and may have changed since the date specified. |
The Fund benefited from stock selection within financials and health care.
Within financials, Kinsale Capital Group, Inc., was rewarded with shares up 10% for its durable business model and strong growth. The company is the only publically traded pure play excess and surplus (E&S) insurer. The E&S insurance market is growing strongly and Kinsale continues to take market share from competitors that don’t specialize in E&S. The
8 | Allspring VT Small Cap Growth Fund
Performance highlights (unaudited)
company is well positioned given its favorable cost structure derived from a home-grown technology platform and lower commission payouts to brokers. Within health care, Shockwave Medical, Inc., a developer of intravascular lithotripsy to treat severely calcified cardiovascular disease, aided relative performance due to strong traction from both its coronary and peripheral segments. Shares were up 10% during the year. Additionally, shares of Halozyme Therapeutics gained more than 40% after its acquisition of Antares Pharma and its auto-injection drug delivery platform was well received by investors.
The setup for small-cap growth stocks is attractive.
We continue to put greater emphasis on companies that can sustainably generate earnings and cash flow in the present versus years down the road. We believe that those that are aggressive and adept at managing through the current environment will emerge as winners. Our job is to identify
companies where estimates have reset enough where the gap on what’s underappreciated has widened, as those represent the best opportunities to drive strong long-term returns for our clients. The relative valuation among smaller-cap stocks continues to be attractive after years of underperformance relative to large growth. Today’s environment draws parallels to the 1970s in terms of high inflation. Market data from that period shows that smaller-cap stocks outperformed against a high but decelerating inflation environment. Given how much compression we’ve seen in small caps, particularly growth, we think the setup going forward looks much more favorable.
We believe that investors would be well served to take a longer perspective, stay invested in sustainable growth businesses, and allow the long-term compounding to drive returns. We believe that the long-term prospects of our companies are setting up a strong base for much-improved performance in the years ahead.
Allspring VT Small Cap Growth Fund | 9
Fund expenses (unaudited)
As a shareholder of the Fund, you incur ongoing costs, including management fees, distribution (12b-1) fees, and other Fund expenses. This example is intended to help you understand your ongoing costs (in dollars) of investing in the Fund and to compare these costs with the ongoing costs of investing in other mutual funds.
The example is based on an investment of $1,000 invested at the beginning of the six-month period and held for the entire period from July 1, 2022 to December 31, 2022.
Actual expenses
The “Actual” line of the table below provides information about actual account values and actual expenses. You may use the information in this line, together with the amount you invested, to estimate the expenses that you paid over the period. Simply divide your account value by $1,000 (for example, an $8,600 account value divided by $1,000 = 8.6), then multiply the result by the number in the “Actual” line under the heading entitled “Expenses paid during period” for your applicable class of shares to estimate the expenses you paid on your account during this period.
Hypothetical example for comparison purposes
The “Hypothetical” line of the table below provides information about hypothetical account values and hypothetical expenses based on the Fund’s actual expense ratio and an assumed rate of return of 5% per year before expenses, which is not the Fund’s actual return. The hypothetical account values and expenses may not be used to estimate the actual ending account balance or expenses you paid for the period. You may use this information to compare the ongoing costs of investing in the Fund and other funds. To do so, compare this 5% hypothetical example with the 5% hypothetical examples that appear in the shareholder reports of the other funds.
Please note that the expenses shown in the table are meant to highlight your ongoing costs only and do not reflect any separate account charges assessed by participating insurance companies. Therefore, the “Hypothetical” line of the table is useful in comparing ongoing costs only, and will not help you determine the relative total costs of owning different funds. In addition, if these separate account charges assessed by participating insurance companies were included, your costs would have been higher.
| | Beginning
account value
7-1-2022 | Ending
account value
12-31-2022 | Expenses
paid during
the period1 | Annualized net
expense ratio |
| Class 1 | | | | |
| Actual | $1,000.00 | $1,027.28 | $4.79 | 0.94% |
| Hypothetical (5% return before expenses) | $1,000.00 | $1,020.48 | $4.77 | 0.94% |
| Class 2 | | | | |
| Actual | $1,000.00 | $1,026.45 | $6.06 | 1.19% |
| Hypothetical (5% return before expenses) | $1,000.00 | $1,019.23 | $6.04 | 1.19% |
1 Expenses paid is equal to the annualized net expense ratio of each class multiplied by the average account value over the period, multiplied by 184 divided by 365 (to reflect the one-half-year period).
10 | Allspring VT Small Cap Growth Fund
Portfolio of investments—December 31, 2022
| | | | | Shares | Value |
| Common stocks: 98.62% | | | | | |
| Communication services: 0.37% | | | | | |
| Media: 0.37% | | | | | |
| TechTarget Incorporated | | | | 23,700 | $ 1,044,222 |
| Consumer discretionary: 8.17% | | | | | |
| Auto components: 1.53% | | | | | |
| Fox Factory Holding Corporation | | | | 47,810 | 4,361,706 |
| Hotels, restaurants & leisure: 4.67% | | | | | |
| First Watch Restaurant Group † | | | | 92,004 | 1,244,814 |
| Hilton Grand Vacations Incorporated | | | | 112,000 | 4,316,480 |
| Papa John's International Incorporated | | | | 68,920 | 5,672,805 |
| Wingstop Incorporated | | | | 15,252 | 2,098,980 |
| | | | | | 13,333,079 |
| Specialty retail: 0.76% | | | | | |
| Boot Barn Holdings Incorporated | | | | 15,340 | 959,057 |
| Leslie's Incorporated † | | | | 98,792 | 1,206,250 |
| | | | | | 2,165,307 |
| Textiles, apparel & luxury goods: 1.21% | | | | | |
| Crocs Incorporated † | | | | 24,880 | 2,697,738 |
| Deckers Outdoor Corporation † | | | | 1,880 | 750,421 |
| | | | | | 3,448,159 |
| Consumer staples: 6.46% | | | | | |
| Beverages: 2.21% | | | | | |
| Celsius Holdings Incorporated † | | | | 23,900 | 2,486,556 |
| Duckhorn Portfolio Incorporated † | | | | 177,865 | 2,947,223 |
| MGP Ingredients Incorporated | | | | 8,200 | 872,316 |
| | | | | | 6,306,095 |
| Food & staples retailing: 2.01% | | | | | |
| The Chef's Warehouse Incorporated † | | | | 171,670 | 5,713,178 |
| Food products: 1.16% | | | | | |
| The Simply Good Foods Company † | | | | 86,968 | 3,307,393 |
| Personal products: 1.08% | | | | | |
| e.l.f. Beauty Incorporated | | | | 55,804 | 3,085,961 |
| Energy: 3.74% | | | | | |
| Energy equipment & services: 1.45% | | | | | |
| Helmerich & Payne Incorporated | | | | 83,200 | 4,124,224 |
| Oil, gas & consumable fuels: 2.29% | | | | | |
| Matador Resources Company | | | | 47,900 | 2,741,796 |
| Talos Energy Incorporated † | | | | 43,700 | 825,056 |
| Viper Energy Partners LP | | | | 93,300 | 2,966,007 |
| | | | | | 6,532,859 |
The accompanying notes are an integral part of these financial statements.
Allspring VT Small Cap Growth Fund | 11
Portfolio of investments—December 31, 2022
| | | | | Shares | Value |
| Financials: 4.34% | | | | | |
| Capital markets: 0.97% | | | | | |
| Stifel Financial Corporation | | | | 47,335 | $ 2,762,944 |
| Insurance: 3.37% | | | | | |
| Kinsale Capital Group Incorporated | | | | 36,776 | 9,617,660 |
| Health care: 26.26% | | | | | |
| Biotechnology: 4.58% | | | | | |
| Apellis Pharmaceuticals Incorporated | | | | 23,300 | 1,204,843 |
| Arcutis Biotherapeutics Incorporated † | | | | 249,046 | 3,685,881 |
| Cytokinetics Incorporated † | | | | 42,800 | 1,961,096 |
| Halozyme Therapeutics Incorporated † | | | | 69,939 | 3,979,529 |
| Immunocore Holdings PLC ADR | | | | 21,900 | 1,249,833 |
| Vericel Corporation | | | | 36,890 | 971,683 |
| | | | | | 13,052,865 |
| Health care equipment & supplies: 15.85% | | | | | |
| Axonics Incorporated † | | | | 99,300 | 6,209,229 |
| Inari Medical Incorporated † | | | | 68,600 | 4,360,216 |
| Inspire Medical Systems Incorporated † | | | | 20,174 | 5,081,427 |
| iRhythm Technologies Incorporated † | | | | 35,300 | 3,306,551 |
| Lantheus Holdings Incorporated † | | | | 38,563 | 1,965,170 |
| Orthopediatrics Corporation † | | | | 60,501 | 2,403,705 |
| Outset Medical Incorporated † | | | | 64,368 | 1,661,982 |
| Shockwave Medical Incorporated † | | | | 18,244 | 3,751,149 |
| SI-BONE Incorporated | | | | 163,498 | 2,223,573 |
| Silk Road Medical Incorporated † | | | | 79,841 | 4,219,597 |
| TransMedics Group Incorporated † | | | | 131,532 | 8,118,151 |
| Treace Medical Concepts Incorporated † | | | | 81,600 | 1,875,984 |
| | | | | | 45,176,734 |
| Health care providers & services: 2.53% | | | | | |
| Castle Biosciences Incorporated | | | | 82,418 | 1,940,120 |
| HealthEquity Incorporated † | | | | 63,300 | 3,901,812 |
| Privia Health Group Incorporated | | | | 60,594 | 1,376,090 |
| | | | | | 7,218,022 |
| Health care technology: 0.76% | | | | | |
| Evolent Health Incorporated Class A | | | | 77,054 | 2,163,676 |
| Life sciences tools & services: 0.14% | | | | | |
| Akoya Biosciences Incorporated † | | | | 43,452 | 415,836 |
| Pharmaceuticals: 2.40% | | | | | |
| Amylyx Pharmaceuticals Incorporated « | | | | 61,681 | 2,279,113 |
| Harmony Biosciences Holdings | | | | 44,400 | 2,446,440 |
| Revance Therapeutics Incorporated | | | | 114,107 | 2,106,415 |
| | | | | | 6,831,968 |
| Industrials: 16.21% | | | | | |
| Building products: 1.51% | | | | | |
| Zurn Elkay Water Solutions Corporation | | | | 203,850 | 4,311,428 |
The accompanying notes are an integral part of these financial statements.
12 | Allspring VT Small Cap Growth Fund
Portfolio of investments—December 31, 2022
| | | | | Shares | Value |
| Commercial services & supplies: 3.00% | | | | | |
| Casella Waste Systems Incorporated Class A † | | | | 107,990 | $ 8,564,687 |
| Construction & engineering: 0.84% | | | | | |
| Construction Partners Incorporated Class A † | | | | 47,300 | 1,262,437 |
| Dycom Industries Incorporated † | | | | 12,006 | 1,123,762 |
| | | | | | 2,386,199 |
| Electrical equipment: 1.58% | | | | | |
| Array Technologies Incorporated † | | | | 13,600 | 262,888 |
| Regal Rexnord Corporation | | | | 5,803 | 696,244 |
| Shoals Technologies Group Class A † | | | | 143,807 | 3,547,719 |
| | | | | | 4,506,851 |
| Machinery: 2.83% | | | | | |
| Evoqua Water Technologies Company | | | | 114,300 | 4,526,280 |
| SPX Technologies Incorporated † | | | | 54,147 | 3,554,751 |
| | | | | | 8,081,031 |
| Professional services: 2.56% | | | | | |
| ASGN Incorporated | | | | 89,441 | 7,287,652 |
| Road & rail: 1.06% | | | | | |
| Marten Transport Limited | | | | 57,800 | 1,143,284 |
| Saia Incorporated † | | | | 8,992 | 1,885,443 |
| | | | | | 3,028,727 |
| Trading companies & distributors: 2.83% | | | | | |
| Applied Industrial Technologies Incorporated | | | | 36,400 | 4,587,492 |
| SiteOne Landscape Supply Incorporated † | | | | 29,570 | 3,469,152 |
| | | | | | 8,056,644 |
| Information technology: 33.07% | | | | | |
| Communications equipment: 3.70% | | | | | |
| Calix Incorporated † | | | | 137,600 | 9,415,968 |
| Harmonic Incorporated † | | | | 87,100 | 1,141,010 |
| | | | | | 10,556,978 |
| Electronic equipment, instruments & components: 2.67% | | | | | |
| Novanta Incorporated † | | | | 56,108 | 7,623,394 |
| IT services: 10.06% | | | | | |
| DigitalOcean Holdings Incorporated † | | | | 125,705 | 3,201,706 |
| Endava plc ADR † | | | | 39,834 | 3,047,301 |
| EVO Payments Incorporated Class A | | | | 134,001 | 4,534,594 |
| ExlService Holdings Incorporated † | | | | 33,600 | 5,692,848 |
| Flywire Corporation † | | | | 178,331 | 4,363,760 |
| Shift4 Payments Incorporated Class A † | | | | 79,500 | 4,446,435 |
| WNS Holdings Limited ADR † | | | | 42,400 | 3,391,576 |
| | | | | | 28,678,220 |
| Semiconductors & semiconductor equipment: 6.63% | | | | | |
| Allegro MicroSystems Incorporated † | | | | 185,116 | 5,557,182 |
| Diodes Incorporated | | | | 77,390 | 5,892,475 |
The accompanying notes are an integral part of these financial statements.
Allspring VT Small Cap Growth Fund | 13
Portfolio of investments—December 31, 2022
| | | | | Shares | Value |
| Semiconductors & semiconductor equipment (continued) | | | | | |
| Semtech Corporation † | | | | 159,650 | $ 4,580,359 |
| Silicon Laboratories Incorporated | | | | 21,170 | 2,872,134 |
| | | | | | 18,902,150 |
| Software: 10.01% | | | | | |
| CyberArk Software Limited † | | | | 25,829 | 3,348,730 |
| EngageSmart Incorporated † | | | | 94,100 | 1,656,160 |
| Jamf Holding Corporation † | | | | 113,058 | 2,408,135 |
| Paycor HCM Incorporated † | | | | 174,661 | 4,273,955 |
| Sprout Social Incorporated Class A † | | | | 68,513 | 3,868,244 |
| SPS Commerce Incorporated † | | | | 83,774 | 10,759,095 |
| Verint Systems Incorporated † | | | | 7,900 | 286,612 |
| Workiva Incorporated † | | | | 23,000 | 1,931,310 |
| | | | | | 28,532,241 |
| Total Common stocks (Cost $259,027,236) | | | | | 281,178,090 |
| | | Yield | | | |
| Short-term investments: 2.24% | | | | | |
| Investment companies: 2.24% | | | | | |
| Allspring Government Money Market Fund Select Class ♠∞ | | 4.09% | | 4,239,144 | 4,239,144 |
| Securities Lending Cash Investments LLC ♠∩∞ | | 4.36 | | 2,138,297 | 2,138,297 |
| Total Short-term investments (Cost $6,377,369) | | | | | 6,377,441 |
| Total investments in securities (Cost $265,404,605) | 100.86% | | | | 287,555,531 |
| Other assets and liabilities, net | (0.86) | | | | (2,456,904) |
| Total net assets | 100.00% | | | | $285,098,627 |
| † | Non-income-earning security |
| « | All or a portion of this security is on loan. |
| ♠ | The issuer of the security is an affiliated person of the Fund as defined in the Investment Company Act of 1940. |
| ∩ | The investment is a non-registered investment company purchased with cash collateral received from securities on loan. |
| ∞ | The rate represents the 7-day annualized yield at period end. |
| Abbreviations: |
| ADR | American depositary receipt |
The accompanying notes are an integral part of these financial statements.
14 | Allspring VT Small Cap Growth Fund
Portfolio of investments—December 31, 2022
Investments in affiliates
An affiliated investment is an investment in which the Fund owns at least 5% of the outstanding voting shares of the issuer or as a result of other relationships, such as the Fund and the issuer having the same investment manager. Transactions with issuers that were affiliates of the Fund at the end of the period were as follows:
| | Value,
beginning of
period | Purchases | Sales
proceeds | Net
realized
gains
(losses) | | Net
change in
unrealized
gains
(losses) | | Value,
end of
period | Shares,
end
of period | Income
from
affiliated
securities |
| Short-term investments | | | | | | | | | |
| Allspring Government Money Market Fund Select Class | $ 6,232,112 | $106,940,649 | $(108,933,617) | $ 0 | | $ 0 | | $ 4,239,144 | 4,239,144 | $ 136,378 |
| Securities Lending Cash Investments LLC | 11,274,475 | 109,494,411 | (118,630,711) | 50 | | 72 | | 2,138,297 | 2,138,297 | 97,266 # |
| | | | | $50 | | $72 | | $6,377,441 | | $233,644 |
| # | Amount shown represents income before fees and rebates. |
The accompanying notes are an integral part of these financial statements.
Allspring VT Small Cap Growth Fund | 15
Statement of assets and liabilities—December 31, 2022
| | |
| Assets | |
Investments in unaffiliated securities (including $2,161,575 of securities loaned), at value (cost $259,027,236)
| $ 281,178,090 |
Investments in affiliated securities, at value (cost $6,377,369)
| 6,377,441 |
Cash
| 38,435 |
Receivable for Fund shares sold
| 91,076 |
Receivable for dividends
| 28,281 |
Receivable for securities lending income, net
| 923 |
Prepaid expenses and other assets
| 5,451 |
Total assets
| 287,719,697 |
| Liabilities | |
Payable upon receipt of securities loaned
| 2,138,175 |
Management fee payable
| 211,754 |
Payable for Fund shares redeemed
| 95,035 |
Distribution fee payable
| 61,256 |
Payable for investments purchased
| 30,156 |
Administration fees payable
| 21,176 |
Trustees’ fees and expenses payable
| 239 |
Accrued expenses and other liabilities
| 63,279 |
Total liabilities
| 2,621,070 |
Total net assets
| $285,098,627 |
| Net assets consist of | |
Paid-in capital
| $ 279,160,247 |
Total distributable earnings
| 5,938,380 |
Total net assets
| $285,098,627 |
| Computation of net asset value per share | |
Net assets – Class 1
| $ 20,160,202 |
Shares outstanding – Class 11
| 2,506,301 |
Net asset value per share – Class 1
| $8.04 |
Net assets – Class 2
| $ 264,938,425 |
Shares outstanding – Class 21
| 35,094,400 |
Net asset value per share – Class 2
| $7.55 |
| 1 | The Fund has an unlimited number of authorized shares. |
The accompanying notes are an integral part of these financial statements.
16 | Allspring VT Small Cap Growth Fund
Statement of operations—year ended December 31, 2022
| | |
| Investment income | |
Dividends
| $ 717,204 |
Securities lending income (including from affiliate), net
| 157,387 |
Income from affiliated securities
| 136,378 |
Total investment income
| 1,010,969 |
| Expenses | |
Management fee
| 2,582,375 |
| Administration fees | |
Class 1
| 19,254 |
Class 2
| 238,983 |
| Distribution fee | |
Class 2
| 738,420 |
Custody and accounting fees
| 38,408 |
Professional fees
| 54,470 |
Shareholder report expenses
| 71,189 |
Trustees’ fees and expenses
| 21,078 |
Other fees and expenses
| 8,556 |
Total expenses
| 3,772,733 |
| Less: Fee waivers and/or expense reimbursements | |
Fund-level
| (3,166) |
Net expenses
| 3,769,567 |
Net investment loss
| (2,758,598) |
| Realized and unrealized gains (losses) on investments | |
| Net realized gains (losses) on | |
Unaffiliated securities
| (16,006,935) |
Affiliated securities
| 50 |
Net realized losses on investments
| (16,006,885) |
| Net change in unrealized gains (losses) on | |
Unaffiliated securities
| (135,569,742) |
Affiliated securities
| 72 |
Net change in unrealized gains (losses) on investments
| (135,569,670) |
Net realized and unrealized gains (losses) on investments
| (151,576,555) |
Net decrease in net assets resulting from operations
| $(154,335,153) |
The accompanying notes are an integral part of these financial statements.
Allspring VT Small Cap Growth Fund | 17
Statement of changes in net assets
| | | | | |
| | Year ended
December 31, 2022 | Year ended
December 31, 2021 |
| Operations | | | | |
Net investment loss
| | $ (2,758,598) | | $ (4,602,420) |
Net realized gains (losses) on investments
| | (16,006,885) | | 55,782,072 |
Net change in unrealized gains (losses) on investments
| | (135,569,670) | | (18,991,009) |
Net increase (decrease) in net assets resulting from operations
| | (154,335,153) | | 32,188,643 |
| Distributions to shareholders from | | | | |
| Net investment income and net realized gains | | | | |
Class 1
| | (4,061,029) | | (3,835,125) |
Class 2
| | (51,742,025) | | (46,253,009) |
Total distributions to shareholders
| | (55,803,054) | | (50,088,134) |
| Capital share transactions | Shares | | Shares | |
| Proceeds from shares sold | | | | |
Class 1
| 354,012 | 3,588,220 | 403,806 | 6,327,801 |
Class 2
| 3,506,997 | 35,910,165 | 3,593,609 | 54,641,517 |
| | | 39,498,385 | | 60,969,318 |
| Reinvestment of distributions | | | | |
Class 1
| 484,032 | 4,061,029 | 270,842 | 3,835,125 |
Class 2
| 6,566,247 | 51,742,025 | 3,428,689 | 46,253,009 |
| | | 55,803,054 | | 50,088,134 |
| Payment for shares redeemed | | | | |
Class 1
| (717,144) | (6,701,122) | (577,421) | (9,014,167) |
Class 2
| (4,508,339) | (43,250,183) | (4,137,781) | (61,701,252) |
| | | (49,951,305) | | (70,715,419) |
Net increase in net assets resulting from capital share transactions
| | 45,350,134 | | 40,342,033 |
Total increase (decrease) in net assets
| | (164,788,073) | | 22,442,542 |
| Net assets | | | | |
Beginning of period
| | 449,886,700 | | 427,444,158 |
End of period
| | $ 285,098,627 | | $449,886,700 |
The accompanying notes are an integral part of these financial statements.
18 | Allspring VT Small Cap Growth Fund
Financial highlights
(For a share outstanding throughout each period)
| | Year ended December 31 |
| Class 1 | 2022 | 2021 | 2020 | 2019 | 2018 |
Net asset value, beginning of period
| $14.76 | $15.35 | $10.29 | $9.66 | $10.43 |
Net investment loss
| (0.07) 1 | (0.12) 1 | (0.09) | (0.07) 1 | (0.05) |
Net realized and unrealized gains (losses) on investments
| (4.92) | 1.26 | 5.80 | 2.51 | 0.40 |
Total from investment operations
| (4.99) | 1.14 | 5.71 | 2.44 | 0.35 |
| Distributions to shareholders from | | | | | |
Net realized gains
| (1.73) | (1.73) | (0.65) | (1.81) | (1.12) |
Net asset value, end of period
| $8.04 | $14.76 | $15.35 | $10.29 | $9.66 |
Total return2
| (34.30)% | 7.93% | 58.09% | 25.31% | 1.48% |
| Ratios to average net assets (annualized) | | | | | |
Gross expenses
| 0.94% | 0.92% | 0.93% | 0.93% | 0.92% |
Net expenses
| 0.94% | 0.92% | 0.93% | 0.93% | 0.92% |
Net investment loss
| (0.63)% | (0.78)% | (0.76)% | (0.69)% | (0.59)% |
| Supplemental data | | | | | |
Portfolio turnover rate
| 61% | 46% | 51% | 62% | 68% |
Net assets, end of period (000s omitted)
| $20,160 | $35,204 | $35,128 | $22,925 | $19,801 |
| 1 | Calculated based upon average shares outstanding |
| 2 | Returns do not reflect fees and expenses charged pursuant to the terms of variable life insurance policies and variable annuity contracts. |
The accompanying notes are an integral part of these financial statements.
Allspring VT Small Cap Growth Fund | 19
Financial highlights
(For a share outstanding throughout each period)
| | Year ended December 31 |
| Class 2 | 2022 | 2021 | 2020 | 2019 | 2018 |
Net asset value, beginning of period
| $14.04 | $14.72 | $9.91 | $9.38 | $10.18 |
Net investment loss
| (0.09) 1 | (0.14) | (0.11) | (0.09) | (0.09) |
Net realized and unrealized gains (losses) on investments
| (4.67) | 1.19 | 5.57 | 2.43 | 0.41 |
Total from investment operations
| (4.76) | 1.05 | 5.46 | 2.34 | 0.32 |
| Distributions to shareholders from | | | | | |
Net realized gains
| (1.73) | (1.73) | (0.65) | (1.81) | (1.12) |
Net asset value, end of period
| $7.55 | $14.04 | $14.72 | $9.91 | $9.38 |
Total return2
| (34.42)% | 7.64% | 57.78% | 24.83% | 1.20% |
| Ratios to average net assets (annualized) | | | | | |
Gross expenses
| 1.19% | 1.17% | 1.18% | 1.18% | 1.17% |
Net expenses
| 1.19% | 1.17% | 1.18% | 1.18% | 1.17% |
Net investment loss
| (0.87)% | (1.03)% | (1.00)% | (0.95)% | (0.84)% |
| Supplemental data | | | | | |
Portfolio turnover rate
| 61% | 46% | 51% | 62% | 68% |
Net assets, end of period (000s omitted)
| $264,938 | $414,683 | $392,316 | $269,657 | $243,038 |
| 1 | Calculated based upon average shares outstanding |
| 2 | Returns do not reflect fees and expenses charged pursuant to the terms of variable life insurance policies and variable annuity contracts. |
The accompanying notes are an integral part of these financial statements.
20 | Allspring VT Small Cap Growth Fund
Notes to financial statements
1. ORGANIZATION
Allspring Variable Trust (the "Trust"), a Delaware statutory trust organized on March 10, 1999, is an open-end management investment company registered under the Investment Company Act of 1940, as amended (the "1940 Act"). As an investment company, the Trust follows the accounting and reporting guidance in Financial Accounting Standards Board ("FASB") Accounting Standards Codification Topic 946, Financial Services – Investment Companies. These financial statements report on the Allspring VT Small Cap Growth Fund (the "Fund") which is a diversified series of the Trust. The Trust offers shares of the Fund to separate accounts of various life insurance companies as funding vehicles for certain variable annuity contracts and variable life insurance policies.
2. SIGNIFICANT ACCOUNTING POLICIES
The following significant accounting policies, which are consistently followed in the preparation of the financial statements of the Fund, are in conformity with U.S. generally accepted accounting principles which require management to make estimates and assumptions that affect the reported amounts of assets and liabilities, disclosure of contingent assets and liabilities at the date of the financial statements, and the reported amounts of income and expenses during the reporting period. Actual results could differ from those estimates.
Securities valuation
All investments are valued each business day as of the close of regular trading on the New York Stock Exchange (generally 4 p.m. Eastern Time), although the Fund may deviate from this calculation time under unusual or unexpected circumstances.
Equity securities that are listed on a foreign or domestic exchange or market are valued at the official closing price or, if none, the last sales price.
Investments in registered open-end investment companies (other than those listed on a foreign or domestic exchange or market) are valued at net asset value. Interests in non-registered investment companies that are redeemable at net asset value are fair valued normally at net asset value.
Investments which are not valued using the methods discussed above are valued at their fair value, as determined in good faith by Allspring Funds Management, LLC ("Allspring Funds Management"), which was named the valuation designee by the Board of Trustees. As the valuation designee, Allspring Funds Management is responsible for day-to-day valuation activities for the Allspring Funds. In connection with these responsibilities, Allspring Funds Management has established a Valuation Committee and has delegated to it the authority to take any actions regarding the valuation of portfolio securities that the Valuation Committee deems necessary or appropriate, including determining the fair value of portfolio securities. On a quarterly basis, the Board of Trustees receives reports of valuation actions taken by the Valuation Committee. On at least an annual basis, the Board of Trustees receives an assessment of the adequacy and effectiveness of Allspring Funds Management's process for determining the fair value of the portfolio of investments.
Securities lending
The Fund may lend its securities from time to time in order to earn additional income in the form of fees or interest on securities received as collateral or the investment of any cash received as collateral. When securities are on loan, the Fund receives interest or dividends on those securities. Cash collateral received in connection with its securities lending transactions is invested in Securities Lending Cash Investments, LLC (the "Securities Lending Fund"), an affiliated non-registered investment company. Investments in Securities Lending Fund are valued at the evaluated bid price provided by an independent pricing service. Income earned from investment in the Securities Lending Fund, if any, is included in securities lending income (including from affiliate) (net of fees and rebates) on the Statement of Operations.
In a securities lending transaction, the net asset value of the Fund is affected by an increase or decrease in the value of the securities loaned and by an increase or decrease in the value of the instrument in which collateral is invested. The amount of securities lending activity undertaken by the Fund fluctuates from time to time. The Fund has the right under the lending agreement to recover the securities from the borrower on demand. In the event of default or bankruptcy by the borrower, the Fund may be prevented from recovering the loaned securities or gaining access to the collateral or may experience delays or costs in doing so. In such an event, the terms of the agreement allow the unaffiliated securities lending agent to use the collateral to purchase replacement securities on behalf of the Fund or pay the Fund the market value of the loaned securities. The Fund bears the risk of loss with respect to depreciation of its investment of the cash collateral.
Security transactions and income recognition
Securities transactions are recorded on a trade date basis. Realized gains or losses are recorded on the basis of identified cost.
Dividend income is recognized on the ex-dividend date.
Allspring VT Small Cap Growth Fund | 21
Notes to financial statements
Distributions to shareholders
Distributions to shareholders from net investment income and any net realized gains are recorded on the ex-dividend date and paid at least annually. Such distributions are determined in accordance with income tax regulations and may differ from U.S. generally accepted accounting principles. Dividend sources are estimated at the time of declaration. The tax character of distributions is determined as of the Fund's fiscal year end. Therefore, a portion of the Fund's distributions made prior to the Fund’s fiscal year end may be categorized as a tax return of capital at year end.
Federal and other taxes
The Fund intends to continue to qualify as a regulated investment company by distributing substantially all of its investment company taxable income and any net realized capital gains (after reduction for capital loss carryforwards) sufficient to relieve it from all, or substantially all, federal income taxes. Accordingly, no provision for federal income taxes was required.
The Fund’s income and federal excise tax returns and all financial records supporting those returns for the prior three fiscal years are subject to examination by the federal and Delaware revenue authorities. Management has analyzed the Fund's tax positions taken on federal, state, and foreign tax returns, as applicable, for all open tax years and does not believe that there are any uncertain tax positions that require recognition of a tax liability.
As of December 31, 2022, the aggregate cost of all investments for federal income tax purposes was $266,140,520 and the unrealized gains (losses) consisted of:
| Gross unrealized gains | $ 48,425,968 |
| Gross unrealized losses | (27,010,957) |
| Net unrealized gains | $ 21,415,011 |
As of December 31, 2022, the Fund had capital loss carryforwards which consisted of $15,475,956 in short-term capital losses.
Reclassifications are made to the Fund’s capital accounts for permanent tax differences to reflect income and gains available for distribution (or available capital loss carryforwards) under federal income tax regulations. U.S. generally accepted accounting principles require that certain components of net assets be adjusted to reflect permanent differences between financial and tax reporting. These reclassifications have no effect on net assets or net asset values per share. The primary permanent difference causing such reclassification is due to net operating loss. At December 31, 2022, as a result of permanent book-to-tax differences, the following reclassification adjustments were made on the Statement of Assets and Liabilities:
| Paid-in capital | Total distributable
earnings |
| $(2,809,523) | $2,809,523 |
Class allocations
The separate classes of shares offered by the Fund differ principally in distribution fees. Class specific expenses are charged directly to that share class. Investment income, common fund-level expenses, and realized and unrealized gains (losses) on investments are allocated daily to each class of shares based on the relative proportion of net assets of each class.
3. FAIR VALUATION MEASUREMENTS
Fair value measurements of investments are determined within a framework that has established a fair value hierarchy based upon the various data inputs utilized in determining the value of the Fund’s investments. The three-level hierarchy gives the highest priority to unadjusted quoted prices in active markets for identical assets or liabilities (Level 1) and the lowest priority to unobservable inputs (Level 3). The Fund’s investments are classified within the fair value hierarchy based on the lowest level of input that is significant to the fair value measurement. The inputs are summarized into three broad levels as follows:
| ■ | Level 1 – quoted prices in active markets for identical securities |
| ■ | Level 2 – other significant observable inputs (including quoted prices for similar securities, interest rates, prepayment speeds, credit risk, etc.) |
| ■ | Level 3 – significant unobservable inputs (including the Fund’s own assumptions in determining the fair value of investments) |
The inputs or methodologies used for valuing investments in securities are not necessarily an indication of the risk associated with investing in those securities.
22 | Allspring VT Small Cap Growth Fund
Notes to financial statements
The following is a summary of the inputs used in valuing the Fund’s assets and liabilities as of December 31, 2022:
| | Quoted prices
(Level 1) | Other significant
observable inputs
(Level 2) | Significant
unobservable inputs
(Level 3) | Total |
| Assets | | | | |
| Investments in: | | | | |
| Common stocks | | | | |
| Communication services | $ 1,044,222 | $0 | $0 | $ 1,044,222 |
| Consumer discretionary | 23,308,251 | 0 | 0 | 23,308,251 |
| Consumer staples | 18,412,627 | 0 | 0 | 18,412,627 |
| Energy | 10,657,083 | 0 | 0 | 10,657,083 |
| Financials | 12,380,604 | 0 | 0 | 12,380,604 |
| Health care | 74,859,101 | 0 | 0 | 74,859,101 |
| Industrials | 46,223,219 | 0 | 0 | 46,223,219 |
| Information technology | 94,292,983 | 0 | 0 | 94,292,983 |
| Short-term investments | | | | |
| Investment companies | 6,377,441 | 0 | 0 | 6,377,441 |
| Total assets | $287,555,531 | $0 | $0 | $287,555,531 |
Additional sector, industry or geographic detail, if any, is included in the Portfolio of Investments.
For the year ended December 31, 2022, the Fund did not have any transfers into/out of Level 3.
4. TRANSACTIONS WITH AFFILIATES
Management fee
Allspring Funds Management, a wholly owned subsidiary of Allspring Global Investments Holdings, LLC, a holding company indirectly owned by certain private funds of GTCR LLC and Reverence Capital Partners, L.P., is the manager of the Fund and provides advisory and fund-level administrative services under an investment management agreement. Under the investment management agreement, Allspring Funds Management is responsible for, among other services, implementing the investment objectives and strategies of the Fund, supervising the subadviser and providing fund-level administrative services in connection with the Fund’s operations. As compensation for its services under the investment management agreement, Allspring Funds Management is entitled to receive a management fee at the following annual rate based on the Fund’s average daily net assets:
| Average daily net assets | Management fee |
| First $500 million | 0.800% |
| Next $500 million | 0.750 |
| Next $1 billion | 0.700 |
| Next $1 billion | 0.675 |
| Next $2 billion | 0.650 |
| Next $5 billion | 0.640 |
| Over $10 billion | 0.630 |
For the year ended December 31, 2022, the management fee was equivalent to an annual rate of 0.80% of the Fund’s average daily net assets.
Allspring Funds Management has retained the services of a subadviser to provide daily portfolio management to the Fund. The fee for subadvisory services is borne by Allspring Funds Management. Allspring Global Investments, LLC ("Allspring Investments"), an affiliate of Allspring Funds Management and a wholly owned subsidiary of Allspring Global Investments Holdings, LLC, is the subadviser to the Fund and is entitled to receive a fee from Allspring Funds Management at an annual rate starting at 0.55% and declining to 0.40% as the average daily net assets of the Fund increase.
Allspring VT Small Cap Growth Fund | 23
Notes to financial statements
Administration fees
Under a class-level administration agreement, Allspring Funds Management provides class-level administrative services to the Fund, which includes paying fees and expenses for services provided by the transfer agent, sub-transfer agents, omnibus account services and record-keepers. As compensation for its services under the class-level administration agreement, Allspring Funds Management receives an annual fee of 0.08% which is calculated based on the average daily net assets of each class.
Waivers and/or expense reimbursements
Allspring Funds Management has contractually committed to waive and/or reimburse management and administration fees to the extent necessary to maintain certain net operating expense ratios for the Fund. When each class of the Fund has exceeded its expense cap, Allspring Funds Management will waive fees and/or reimburse expenses from fund-level expenses on a proportionate basis and then from class specific expenses. When only certain classes exceed their expense caps, waivers and/or reimbursements are applied against class specific expenses before fund-level expenses. Allspring Funds Management has contractually committed through April 30, 2023 to waive fees and/or reimburse expenses to the extent necessary to cap expenses. Prior to or after the commitment expiration date, the caps may be increased or the commitment to maintain the caps may be terminated only with the approval of the Board of Trustees. As of December 31, 2022, the contractual expense caps are as follows:
| | Expense ratio caps |
| Class 1 | 0.95% |
| Class 2 | 1.20 |
Distribution fee
The Trust has adopted a distribution plan for Class 2 shares pursuant to Rule 12b-1 under the 1940 Act. A distribution fee is charged to Class 2 shares and paid to Allspring Funds Distributor, LLC, the principal underwriter, an affiliate of Allspring Funds Management, at an annual rate up to 0.25% of the average daily net assets of Class 2 shares.
Interfund transactions
The Fund may purchase or sell portfolio investment securities to certain affiliates pursuant to Rule 17a-7 under the 1940 Act and under procedures adopted by the Board of Trustees. The procedures have been designed to ensure that these interfund transactions, which do not incur broker commissions, are effected at current market prices.
5. INVESTMENT PORTFOLIO TRANSACTIONS
Purchases and sales of investments, excluding U.S. government obligations (if any) and short-term securities, for the year ended December 31, 2022 were $196,394,889 and $207,433,204, respectively.
6. SECURITIES LENDING TRANSACTIONS
The Fund lends its securities through an unaffiliated securities lending agent and receives collateral in the form of cash or securities with a value at least equal to the value of the securities on loan. The value of the loaned securities is determined at the close of each business day and any increases or decreases in the required collateral are exchanged between the Fund and the counterparty on the next business day. Cash collateral received is invested in the Securities Lending Fund which seeks to provide a positive return compared to the daily Federal Funds Open Rate by investing in high-quality, U.S. dollar-denominated short-term money market instruments and is exempt from registration under Section 3(c)(7) of the 1940 Act. Securities Lending Fund is managed by Allspring Funds Management and is subadvised by Allspring Investments. Allspring Funds Management receives an advisory fee starting at 0.05% and declining to 0.01% as the average daily net assets of the Securities Lending Fund increase. All of the fees received by Allspring Funds Management are paid to Allspring Investments for its services as subadviser.
In the event of counterparty default or the failure of a borrower to return a loaned security, the Fund has the right to use the collateral to offset any losses incurred. As of December 31, 2022, the Fund had securities lending transactions with the following counterparties which are subject to offset:
24 | Allspring VT Small Cap Growth Fund
Notes to financial statements
| Counterparty | Value of
securities on
loan | Collateral
received1 | Net amount |
| Citigroup Global Markets Incorporated | $2,161,575 | $(2,138,175) | $23,400 |
1 Collateral disclosed within this table is limited to the net transaction with the counterparty.
7. BANK BORROWINGS
The Trust, Allspring Master Trust and Allspring Funds Trust (excluding the money market funds) are parties to a $350,000,000 revolving credit agreement whereby the Fund is permitted to use bank borrowings for temporary or emergency purposes, such as to fund shareholder redemption requests. Interest under the credit agreement is charged to the Fund based on a borrowing rate equal to the higher of the Federal Funds rate or the overnight bank funding rate in effect on that day plus a spread. In addition, an annual commitment fee equal based on the unused balance is allocated to each participating fund.
For the year ended December 31, 2022, there were no borrowings by the Fund under the agreement.
8. DISTRIBUTIONS TO SHAREHOLDERS
The tax character of distributions paid during the years ended December 31, 2022 and December 31, 2021 were as follows:
| | Year ended December 31 |
| | 2022 | 2021 |
| Ordinary income | $ 0 | $ 5,641,030 |
| Long-term capital gain | 55,803,054 | 44,447,104 |
As of December 31, 2022, the components of distributable earnings on a tax basis were as follows:
Unrealized
gains | Capital loss
carryforward |
| $21,415,011 | $(15,475,956) |
9. CONCENTRATION RISKS
As of the end of the period, the Fund concentrated its portfolio of investments in the health care and information technology sectors. A fund that invests a substantial portion of its assets in any sector may be more affected by changes in that sector than would be a fund whose investments are not heavily weighted in any sector.
10. MARKET RISKS
On March 11, 2020, the World Health Organization announced that it had made the assessment that coronavirus disease 2019 (“COVID-19”) is a pandemic. The impacts of COVID-19 are affecting the entire global economy, individual companies and investment products, the funds, and the market in general. There is significant uncertainty around the extent and duration of business disruptions related to COVID-19 and the impacts may last for an extended period of time. COVID-19 has led to significant uncertainty and volatility in the financial markets.
11. INDEMNIFICATION
Under the Fund's organizational documents, the officers and Trustees have been granted certain indemnification rights against certain liabilities that may arise out of performance of their duties to the Fund. The Fund has entered into a separate agreement with each Trustee that converts indemnification rights currently existing under the Fund’s organizational documents into contractual rights that cannot be changed in the future without the consent of the Trustee. Additionally, in the normal course of business, the Fund may enter into contracts with service providers that contain a variety of indemnification clauses. The Fund’s maximum exposure under these arrangements is dependent on future claims that may be made against the Fund and, therefore, cannot be estimated.
Allspring VT Small Cap Growth Fund | 25
Report of independent registered public accounting firm
To the Shareholders of the Fund and Board of Trustees
Allspring Variable Trust:
Opinion on the Financial Statements
We have audited the accompanying statement of assets and liabilities of Allspring VT Small Cap Growth Fund (the Fund), one of the funds constituting Allspring Variable Trust, including the portfolio of investments, as of December 31, 2022, the related statement of operations for the year then ended, the statements of changes in net assets for each of the years in the two-year period then ended, and the related notes (collectively, the financial statements) and the financial highlights for each of the years in the five-year period then ended. In our opinion, the financial statements and financial highlights present fairly, in all material respects, the financial position of the Fund as of December 31, 2022, the results of its operations for the year then ended, the changes in its net assets for each of the years in the two-year period then ended, and the financial highlights for each of the years in the five-year period then ended, in conformity with U.S. generally accepted accounting principles.
Basis for Opinion
These financial statements and financial highlights are the responsibility of the Fund’s management. Our responsibility is to express an opinion on these financial statements and financial highlights based on our audits. We are a public accounting firm registered with the Public Company Accounting Oversight Board (United States) (PCAOB) and are required to be independent with respect to the Fund in accordance with the U.S. federal securities laws and the applicable rules and regulations of the Securities and Exchange Commission and the PCAOB.
We conducted our audits in accordance with the standards of the PCAOB. Those standards require that we plan and perform the audit to obtain reasonable assurance about whether the financial statements and financial highlights are free of material misstatement, whether due to error or fraud. Our audits included performing procedures to assess the risks of material misstatement of the financial statements and financial highlights, whether due to error or fraud, and performing procedures that respond to those risks. Such procedures included examining, on a test basis, evidence regarding the amounts and disclosures in the financial statements and financial highlights. Such procedures also included confirmation of securities owned as of December 31, 2022, by correspondence with the custodian, transfer agent and brokers, or by other appropriate auditing procedures. Our audits also included evaluating the accounting principles used and significant estimates made by management, as well as evaluating the overall presentation of the financial statements and financial highlights. We believe that our audits provide a reasonable basis for our opinion.

We have not been able to determine the specific year that we began serving as the auditor of one or more Allspring Funds investment companies; however, we are aware that we have served as the auditor of one or more Allspring Funds investment companies since at least 1955.
Boston, Massachusetts
February 27, 2023
26 | Allspring VT Small Cap Growth Fund
Other information (unaudited)
TAX INFORMATION
Pursuant to Section 852 of the Internal Revenue Code, $55,803,054 was designated as a 20% rate gain distribution for the fiscal year ended December 31, 2022.
PROXY VOTING INFORMATION
A description of the policies and procedures used to determine how to vote proxies relating to portfolio securities is available without charge, upon request, by calling 1-800-260-5969, visiting our website at allspringglobal.com, or visiting the SEC website at sec.gov. Information regarding how the proxies related to portfolio securities were voted during the most recent 12-month period ended June 30 is available on the website at allspringglobal.com or by visiting the SEC website at sec.gov.
QUARTERLY PORTFOLIO HOLDINGS INFORMATION
The Fund files its complete schedule of portfolio holdings with the SEC for the first and third quarters of each fiscal year as an exhibit to its reports on Form N-PORT. Shareholders may view the filed Form N-PORT by visiting the SEC website at sec.gov.
Allspring VT Small Cap Growth Fund | 27
Other information (unaudited)
BOARD OF TRUSTEES AND OFFICERS
Each of the Trustees and Officers listed in the table below acts in identical capacities for each fund in the Allspring family of funds, which consists of 127 mutual funds comprising the Allspring Funds Trust, Allspring Variable Trust, Allspring Master Trust and four closed-end funds (collectively the “Fund Complex”). This table should be read in conjunction with the Prospectus and the Statement of Additional Information1. The mailing address of each Trustee and Officer is 1415 Vantage Park Drive, 3rd Floor, Charlotte, NC 28203. Each Trustee and Officer serves an indefinite term, however, each Trustee serves such term until reaching the mandatory retirement age established by the Trustees.
Independent Trustees
Name and
year of birth | Position held and
length of service* | Principal occupations during past five years or longer | Current other
public company or
investment
company
directorships |
William R. Ebsworth
(Born 1957) | Trustee,
since 2015 | Retired. From 1984 to 2013, equities analyst, portfolio manager, research director and chief investment officer at Fidelity Management and Research Company in Boston, Tokyo, and Hong Kong, and retired in 2013 as Chief Investment Officer of Fidelity Strategic Advisers, Inc. where he led a team of investment professionals managing client assets. Prior thereto, Board member of Hong Kong Securities Clearing Co., Hong Kong Options Clearing Corp., the Thailand International Fund, Ltd., Fidelity Investments Life Insurance Company, and Empire Fidelity Investments Life Insurance Company. Audit Committee Chair and Investment Committee Chair of the Vincent Memorial Hospital Foundation (non-profit organization). Mr. Ebsworth is a CFA® charterholder. | N/A |
Jane A. Freeman
(Born 1953) | Trustee,
since 2015;
Chair Liaison,
since 2018 | Retired. From 2012 to 2014 and 1999 to 2008, Chief Financial Officer of Scientific Learning Corporation. From 2008 to 2012, Ms. Freeman provided consulting services related to strategic business projects. Prior to 1999, Portfolio Manager at Rockefeller & Co. and Scudder, Stevens & Clark. Board member of the Harding Loevner Funds from 1996 to 2014, serving as both Lead Independent Director and chair of the Audit Committee. Board member of the Russell Exchange Traded Funds Trust from 2011 to 2012 and the chair of the Audit Committee. Ms. Freeman is also an inactive Chartered Financial Analyst. | N/A |
Isaiah Harris, Jr.
(Born 1952) | Trustee,
since 2009; Audit
Committee
Chair,
since 2019 | Retired. Member of the Advisory Board of CEF of East Central Florida. Chairman of the Board of CIGNA Corporation from 2009 to 2021, and Director from 2005 to 2008. From 2003 to 2011, Director of Deluxe Corporation. Prior thereto, President and CEO of BellSouth Advertising and Publishing Corp. from 2005 to 2007, President and CEO of BellSouth Enterprises from 2004 to 2005 and President of BellSouth Consumer Services from 2000 to 2003. Emeritus member of the Iowa State University Foundation Board of Governors. Emeritus Member of the Advisory Board of Iowa State University School of Business. Advisory Board Member, Palm Harbor Academy (private school). Advisory Board Member, Fellowship of Christian Athletes. Mr. Harris is a certified public accountant (inactive status). | N/A |
David F. Larcker
(Born 1950) | Trustee,
since 2009 | Distinguished Visiting Fellow at the Hoover Institution since 2022. James Irvin Miller Professor of Accounting at the Graduate School of Business (Emeritus), Stanford University, Director of the Corporate Governance Research Initiative and Senior Faculty of The Rock Center for Corporate Governance since 2006. From 2005 to 2008, Professor of Accounting at the Graduate School of Business, Stanford University. Prior thereto, Ernst & Young Professor of Accounting at The Wharton School, University of Pennsylvania from 1985 to 2005. | N/A |
28 | Allspring VT Small Cap Growth Fund
Other information (unaudited)
Name and
year of birth | Position held and
length of service* | Principal occupations during past five years or longer | Current other
public company or
investment
company
directorships |
Olivia S. Mitchell
(Born 1953) | Trustee,
since 2006;
Nominating and
Governance
Committee Chair,
since 2018 | International Foundation of Employee Benefit Plans Professor since 1993, Wharton School of the University of Pennsylvania. Director of Wharton’s Pension Research Council and Boettner Center on Pensions & Retirement Research, and Research Associate at the National Bureau of Economic Research. Previously taught at Cornell University from 1978 to 1993. | N/A |
Timothy J. Penny
(Born 1951) | Trustee,
since 1996;
Chair,
since 2018 | President and Chief Executive Officer of Southern Minnesota Initiative Foundation, a non-profit organization, since 2007. Vice Chair of the Economic Club of Minnesota, since 2007. Co-Chair of the Committee for a Responsible Federal Budget, since 1995. Member of the Board of Trustees of NorthStar Education Finance, Inc., a non-profit organization, from 2007-2022. Senior Fellow of the University of Minnesota Humphrey Institute from 1995 to 2017. | N/A |
James G. Polisson
(Born 1959) | Trustee,
since 2018 | Retired. Chief Marketing Officer, Source (ETF) UK Services, Ltd, from 2015 to 2017. From 2012 to 2015, Principal of The Polisson Group, LLC, a management consulting, corporate advisory and principal investing company. Chief Executive Officer and Managing Director at Russell Investments, Global Exchange Traded Funds from 2010 to 2012. Managing Director of Barclays Global Investors from 1998 to 2010 and Global Chief Marketing Officer for iShares and Barclays Global Investors from 2000 to 2010. Trustee of the San Francisco Mechanics’ Institute, a non-profit organization, from 2013 to 2015. Board member of the Russell Exchange Traded Fund Trust from 2011 to 2012. Director of Barclays Global Investors Holdings Deutschland GmbH from 2006 to 2009. Mr. Polisson is an attorney and has a retired status with the Massachusetts and District of Columbia Bar Associations. | N/A |
Pamela Wheelock
(Born 1959) | Trustee,
since January
2020; previously
Trustee from
January 2018 to
July 2019 | Retired. Executive and Senior Financial leadership positions in the public, private and nonprofit sectors. Interim President and CEO, McKnight Foundation, 2020. Interim Commissioner, Minnesota Department of Human Services, 2019. Chief Operating Officer, Twin Cities Habitat for Humanity, 2017-2019. Vice President for University Services, University of Minnesota, 2012-2016. Interim President and CEO, Blue Cross and Blue Shield of Minnesota, 2011-2012. Executive Vice-President and Chief Financial Officer, Minnesota Wild, 2002-2008. Commissioner, Minnesota Department of Finance, 1999-2002. Chair of the Board of Directors of Destination Medical Center Corporation. Board member of the Minnesota Wild Foundation. | N/A |
* Length of service dates reflect the Trustee’s commencement of service with the Trust’s predecessor entities, where applicable.
Allspring VT Small Cap Growth Fund | 29
Other information (unaudited)
Officers2
Name and
year of birth | Position held and
length of service | Principal occupations during past five years or longer |
Andrew Owen
(Born 1960) | President,
since 2017 | President and Chief Executive Officer of Allspring Funds Management, LLC since 2017 and Head of Global Fund Governance of Allspring Global Investments since 2022. Prior thereto, co-president of Galliard Capital Management, LLC, an affiliate of Allspring Funds Management, LLC, from 2019 to 2022 and Head of Affiliated Managers, Allspring Global Investments, from 2014 to 2019 and Executive Vice President responsible for marketing, investments and product development for Allspring Funds Management, LLC, from 2009 to 2014. |
Jeremy DePalma
(Born 1974) | Treasurer,
since 2012
(for certain funds in
the Fund Complex);
since 2021 (for
the remaining funds in the
Fund Complex) | Senior Vice President of Allspring Funds Management, LLC since 2009. Senior Vice President of Evergreen Investment Management Company, LLC from 2008 to 2010 and head of the Fund Reporting and Control Team within Fund Administration from 2005 to 2010. |
Christopher Baker
(Born 1976) | Chief Compliance Officer, since 2022 | Global Chief Compliance Officer for Allspring Global Investments since 2022. Prior thereto, Chief Compliance Officer for State Street Global Advisors from 2018 to 2021. Senior Compliance Officer for the State Street divisions of Alternative Investment Solutions, Sector Solutions, and Global Marketing from 2015 to 2018. From 2010 to 2015 Vice President, Global Head of Investment and Marketing Compliance for State Street Global Advisors. |
Matthew Prasse
(Born 1983) | Chief Legal Officer, since 2022; Secretary, since 2021 | Senior Counsel of the Allspring Legal Department since 2021. Senior Counsel of the Wells Fargo Legal Department from 2018 to 2021. Previously, Counsel for Barings LLC from 2015 to 2018. Prior to joining Barings, Associate at Morgan, Lewis & Bockius LLP from 2008 to 2015. |
1 The Statement of Additional Information includes additional information about the Trustees and is available, without charge, upon request, by calling 1-800-222-8222 or by visiting the website at allspringglobal.com.
2 For those Officers with tenures at Allspring Global Investments and/or Allspring Funds Management, LLC that began prior to 2021, such tenures include years of service during which these businesses/entities were known as Wells Fargo Asset Management and Wells Fargo Funds Management, LLC, respectively.
30 | Allspring VT Small Cap Growth Fund
For more information
More information about Allspring Funds is available free upon request. To obtain literature, please write, visit the Fund's website, or call:
Allspring Funds
P.O. Box 219967
Kansas City, MO 64121-9967
Website: allspringglobal.com
Individual investors: 1-800-260-5969
Retail investment professionals: 1-888-877-9275
Institutional investment professionals: 1-866-765-0778
This report and the financial statements contained herein are submitted for the general information of the shareholders of the Fund. If this report is used for promotional purposes, distribution of the report must be accompanied or preceded by a current prospectus. Before investing, please consider the investment objectives, risks, charges, and expenses of the investment. For a current prospectus and, if available, a summary prospectus, containing this information, call
1-800-260-5969 or visit the Fund's website at allspringglobal.com. Read the prospectus carefully before you invest or send money.
Allspring Global InvestmentsTM is the trade name for the asset management firms of Allspring Global Investments Holdings, LLC, a holding company indirectly owned by certain private funds of GTCR LLC and Reverence Capital Partners, L.P. These firms include but are not limited to Allspring Global Investments, LLC, and Allspring Funds Management, LLC. Certain products managed by Allspring entities are distributed by Allspring Funds Distributor, LLC (a broker-dealer and Member FINRA/SIPC).
This material is for general informational and educational purposes only and is NOT intended to provide investment advice or a recommendation of any kind - including a recommendation for any specific investment, strategy, or plan.
© 2023 Allspring Global Investments Holdings, LLC. All rights reserved.
ALL-01052023-xreifkjx 02-23
AR3003 12-22
ITEM 2. CODE OF ETHICS
(a) As of the end of the period, covered by the report, Allspring Variable Trust has adopted a code of ethics that applies to its President and Treasurer. A copy of the code of ethics is filed as an exhibit to this Form N-CSR.
(c) During the period covered by this report, there were no amendments to the provisions of the code of ethics adopted in Item 2(a) above.
(d) During the period covered by this report, there were no implicit or explicit waivers to the provisions of the code of ethics adopted in Item 2(a) above.
ITEM 3. AUDIT COMMITTEE FINANCIAL EXPERT
The Board of Trustees of Allspring Variable Trust has determined that Isaiah Harris is an audit committee financial expert, as defined in Item 3 of Form N-CSR. Mr. Harris is independent for purposes of Item 3 of Form N-CSR.
ITEM 4. PRINCIPAL ACCOUNTANT FEES AND SERVICES
(a), (b), (c), (d) The following table presents aggregate fees billed in each of the last two fiscal years for services rendered
to the Registrant by the Registrant’s principal accountant. These fees were billed to the registrant and were approved by
the Registrant’s audit committee.
| | | | | | | | |
| | | Fiscal | | | Fiscal | |
| | | year ended | | | year ended | |
| | | December 31,
2022 | | | December 31,
2021 | |
Audit fees | | $ | 203,150 | | | $ | 195,810 | |
Audit-related fees | | | 14,050 | | | | — | |
Tax fees (1) | | | 17,920 | | | | 17,300 | |
All other fees | | | — | | | | — | |
| | | | | | | | |
| | $ | 235,120 | | | $ | 213,110 | |
| | | | | | | | |
| (1) | Tax fees consist of fees for tax compliance, tax advice, tax planning and excise tax. |
(e) The Chair of the Audit Committees is authorized to pre-approve: (1) audit services to the mutual funds of the Allspring Variable Trust; (2) non-audit tax or compliance consulting or training services provided to the Allspring Multi-Sector Income Fund by the independent auditors (“Auditors”) if the fees for any particular engagement are not anticipated to exceed $50,000; and (3) non-audit tax or compliance consulting or training services provided by the Auditors to a Allspring Multi-Sector Income Fund’s investment adviser and its controlling entities (where pre-approval is required because the engagement relates directly to the operations and financial reporting of the Allspring Multi-Sector Income Fund) if the fee to the Auditors for any particular engagement is not anticipated to exceed $50,000. For any such pre-approval sought from the Chair, Management shall prepare a brief description of the proposed services. If the Chair approves of such service, he or she shall sign the statement prepared by Management. Such written statement shall be presented to the full Committees at their next regularly scheduled meetings.
(f) Not applicable
(g) Not applicable
(h) Not applicable
ITEM 5. AUDIT COMMITTEE OF LISTED REGISTRANTS
Not applicable.
ITEM 6. INVESTMENTS
A Portfolio of Investments for each series of Allspring Variable Trust is included as part of the report to shareholders filed under Item 1 of this Form.
ITEM 7. DISCLOSURE OF PROXY VOTING POLICIES AND PROCEDURES FOR CLOSED-END MANAGEMENT INVESTMENT COMPANIES
Not applicable.
ITEM 8. PORTFOLIO MANAGERS OF CLOSED-END MANAGEMENT INVESTMENT COMPANIES
Not applicable.
ITEM 9. PURCHASES OF EQUITY SECURITIES BY CLOSED-END MANAGEMENT INVESTMENT COMPANY AND AFFILIATED PURCHASERS
Not applicable.
ITEM 10. SUBMISSION OF MATTERS TO A VOTE OF SECURITY HOLDERS
There have been no material changes to the procedures by which shareholders may recommend nominees to the registrant’s Board of Trustees that have been implemented since the registrant’s last provided disclosure in response to the requirements of this Item.
ITEM 11. CONTROLS AND PROCEDURES
(a) The President and Treasurer have concluded that Allspring Variable Trust disclosure controls and procedures (as defined in Rule 30a-3(c) under the Investment Company Act of 1940) provide reasonable assurances that material information relating to the registrant is made known to them by the appropriate persons based on their evaluation of these controls and procedures as of a date within 90 days of the filing of this report.
(b) There were no significant changes in the registrant’s internal controls over financial reporting (as defined in Rule 30a-3(d) under the Investment Company Act of 1940) that occurred during the most recent fiscal half-year of the period covered by this report that materially affected, or is reasonably likely to materially affect, the registrant’s internal control over financial reporting.
ITEM 12. DISCLOSURES OF SECURITIES LENDING ACTIVITES FOR CLOSED-END MANAGEMENT INVESTMENT COMPANIES
Not applicable.
ITEM 13. EXHIBITS
SIGNATURES
Pursuant to the requirements of the Securities Exchange Act of 1934 and the Investment Company Act of 1940, the registrant has duly caused this report to be signed on its behalf by the undersigned, thereunto duly authorized.
| | |
| Allspring Variable Trust |
| |
| By: | | |
| |
| | /s/ Andrew Owen |
| |
| | Andrew Owen |
| | President |
|
| Date: February 27, 2023 |
Pursuant to the requirements of the Securities Exchange Act of 1934 and the Investment Company Act of 1940, this report has been signed below by the following persons on behalf of the registrant and in the capacities and on the date indicated.
| | |
| Allspring Variable Trust |
| |
| By: | | |
| |
| | /s/ Andrew Owen |
| |
| | Andrew Owen |
| | President |
|
| Date: February 27, 2023 |
| |
| By: | | |
| |
| | /s/ Jeremy DePalma |
| |
| | Jeremy DePalma |
| | Treasurer |
|
| Date: February 27, 2023 |