
UNITED STATES
SECURITIES AND EXCHANGE COMMISSION
Washington, D.C. 20549
FORM N-CSR
CERTIFIED SHAREHOLDER REPORT OF REGISTERED
MANAGEMENT INVESTMENT COMPANIES
Investment Company Act file number: 811-09255
Wells Fargo Variable Trust
(Exact name of registrant as specified in charter)
525 Market St., San Francisco, CA 94105
(Address of principal executive offices) (Zip code)
C. David Messman
Wells Fargo Funds Management, LLC
525 Market St., San Francisco, CA 94105
(Name and address of agent for service)
Registrant’s telephone number, including area code: 800-222-8222
| | |
| Date of fiscal year end: | | December 31, 2011 |
| |
| Date of reporting period: | | December 31, 2011 |
| ITEM 1. | REPORT TO SHAREHOLDERS |

Wells Fargo Advantage VT Discovery FundSM

Annual Report
December 31, 2011
Reduce clutter. Save trees.
Sign up for electronic delivery of prospectuses and shareholder reports at www.wellsfargo.com/advantagedelivery
Contents
The views expressed and any forward-looking statements are as of December 31, 2011, unless otherwise noted, and are those of the Fund managers and/or Wells Fargo Funds Management, LLC. Discussions of individual securities, or the markets generally, or any Wells Fargo Advantage Fund are not intended as individual recommendations. Future events or results may vary significantly from those expressed in any forward-looking statements; the views expressed are subject to change at any time in response to changing circumstances in the market. Wells Fargo Funds Management, LLC, disclaims any obligation to publicly update or revise any views expressed or forward-looking statements.
NOT FDIC INSURED ¡ NO BANK GUARANTEE ¡ MAY LOSE VALUE

WELLS FARGO INVESTMENT HISTORY
| | |
| |
| 1932 | | Keystone creates one of the first mutual fund families. |
| |
| 1971 | | Wells Fargo & Company introduces one of the first institutional index funds. |
| |
| 1978 | | Wells Fargo applies Markowitz and Sharpe’s research on Modern Portfolio Theory to introduce one of the industry’s first Tactical Asset Allocation (TAA) models in institutional separately managed accounts. |
| |
| 1984 | | Wells Fargo Stagecoach Funds launches its first asset allocation fund. |
| |
| 1989 | | The Tactical Asset Allocation (TAA) Model is first applied to Wells Fargo’s asset allocation mutual funds. |
| |
| 1994 | | Wells Fargo introduces the LifePath Funds, one of the first suites of target date funds (now the Wells Fargo Advantage Dow Jones Target Date FundsSM ). |
| |
| 1996 | | Evergreen Investments and Keystone Funds merge. |
| |
| 1997 | | Wells Fargo launches Wells Fargo Advantage WealthBuilder PortfoliosSM, a fund-of-funds suite of products that includes the use of quantitative models to shift assets among investment styles. |
| |
| 1999 | | Norwest Advantage Funds and Stagecoach Funds are reorganized into Wells Fargo Funds after the merger of Norwest and Wells Fargo. |
| |
| 2002 | | Evergreen Retail and Evergreen Institutional companies form the umbrella asset management company, Evergreen Investments. |
| |
| 2005 | | The integration of Strong Funds with Wells Fargo Funds creates Wells Fargo Advantage Funds, resulting in one of the top 20 mutual fund companies in the United States. |
| |
| 2006 | | Wells Fargo Advantage Funds relaunches the target date product line as Wells Fargo Advantage Dow Jones Target Date Funds. |
| |
| 2010 | | The mergers and reorganizations of Evergreen and Wells Fargo Advantage mutual funds are completed, unifying the families under the brand of Wells Fargo Advantage Funds. |
Wells Fargo Advantage Funds®
Wells Fargo Advantage Funds skillfully guides institutions, financial advisors, and individuals through the investment terrain to help them reach their financial objectives. Everything we do on behalf of investors is backed by our unique combination of qualifications.
Strength
Our organization is built on the standards of integrity and service established by our parent company—Wells Fargo & Company—more than 150 years ago. And, because we’re part of a highly diversified financial enterprise, we offer the depth of resources to help investors succeed.
Expertise
Our multi-boutique model offers investors access to the independent thinking of premier investment managers that have been chosen for their time-tested strategies. While each team specializes in a specific investment strategy, collectively they provide investors a wide choice of distinct investment styles. Our dedication to investment excellence doesn’t end with our expertise in manager selection—risk management, analysis, and rigorous ongoing review seek to ensure each manager’s investment process remains consistent.
Partnership
Our collaborative approach is built around understanding the needs and goals of our clients. By adhering to core principles of sound judgment and steady guidance, we support you through every stage of the investment decision process.
Carefully consider a fund’s investment objectives, risks, charges, and expenses before investing. For a current prospectus and, if available, a summary prospectus, containing this and other information, visit wellsfargo.com/advantagefunds. Read it carefully before investing.
Wells Fargo Funds Management, LLC, a wholly owned subsidiary of Wells Fargo & Company, provides investment advisory and administrative services for Wells Fargo Advantage Funds®. Other affiliates of Wells Fargo & Company provide subadvisory and other services for the Funds. The Funds are distributed by Wells Fargo Funds Distributor, LLC, Member FINRA/SIPC, an affiliate of Wells Fargo & Company.
“Dow Jones®” and “Dow Jones Target Date IndexesSM” are service marks of Dow Jones Trademark Holdings, LLC (“Dow Jones”), have been licensed to CME Group Index Services LLC (“CME Indexes”) and have been sublicensed for use for certain purposes by Global Index Advisors, Inc, and Wells Fargo Funds Management, LLC. The Wells Fargo Advantage Dow Jones Target Date FundsSM based on the Dow Jones Target Date IndexesSM, are not sponsored, endorsed, sold or promoted by Dow Jones, CME Indexes or their respective affiliates and none of them makes any representation regarding the advisability of investing in such product(s).
NOT FDIC INSURED ¡ NO BANK GUARANTEE ¡ MAY LOSE VALUE
Not part of the annual report.
Wells Fargo Advantage Funds offers more than 110 mutual funds across a wide range of asset classes, representing over $216 billion in assets under management, as of December 31, 2011.
| | | | |
| Equity Funds | | | | |
Asia Pacific Fund | | Global Opportunities Fund | | Premier Large Company Growth Fund |
C&B Large Cap Value Fund | | Growth Fund | | Small Cap Opportunities Fund |
C&B Mid Cap Value Fund | | Health Care Fund | | Small Cap Value Fund |
Capital Growth Fund | | Index Fund | | Small Company Growth Fund |
Common Stock Fund | | International Equity Fund | | Small Company Value Fund |
Disciplined U.S. Core Fund | | International Value Fund | | Small/Mid Cap Core Fund |
Discovery Fund† | | Intrinsic Small Cap Value Fund | | Small/Mid Cap Value Fund |
Diversified Equity Fund | | Intrinsic Value Fund | | Social Sustainability Fund† |
Diversified International Fund | | Intrinsic World Equity Fund | | Special Mid Cap Value Fund |
Diversified Small Cap Fund | | Large Cap Core Fund | | Special Small Cap Value Fund |
Emerging Growth Fund | | Large Cap Growth Fund | | Specialized Technology Fund |
Emerging Markets Equity Fund | | Large Company Value Fund | | Strategic Large Cap Growth Fund |
Endeavor Select Fund† | | Omega Growth Fund | | Traditional Small Cap Growth Fund |
Enterprise Fund† | | Opportunity Fund† | | Utility and Telecommunications Fund |
Equity Value Fund | | Precious Metals Fund | | |
| Bond Funds | | | | |
Adjustable Rate Government Fund | | Inflation-Protected Bond Fund | | Short-Term Bond Fund |
California Limited-Term Tax-Free Fund | | Intermediate Tax/AMT-Free Fund | | Short-Term High Yield Bond Fund |
California Tax-Free Fund | | International Bond Fund | | Short-Term Municipal Bond Fund |
Colorado Tax-Free Fund | | Minnesota Tax-Free Fund | | Strategic Municipal Bond Fund |
Government Securities Fund | | Municipal Bond Fund | | Total Return Bond Fund |
High Income Fund | | North Carolina Tax-Free Fund | | Ultra Short-Term Income Fund |
High Yield Bond Fund | | Pennsylvania Tax-Free Fund | | Ultra Short-Term Municipal Income Fund |
Income Plus Fund | | Short Duration Government Bond Fund | | Wisconsin Tax-Free Fund |
| Asset Allocation Funds | | | | |
Asset Allocation Fund | | WealthBuilder Equity Portfolio† | | Target 2020 Fund† |
Conservative Allocation Fund | | WealthBuilder Growth Allocation Portfolio† | | Target 2025 Fund† |
Diversified Capital Builder Fund | | WealthBuilder Growth Balanced Portfolio† | | Target 2030 Fund† |
Diversified Income Builder Fund | | WealthBuilder Moderate Balanced Portfolio† | | Target 2035 Fund† |
Growth Balanced Fund | | WealthBuilder Tactical Equity Portfolio† | | Target 2040 Fund† |
Index Asset Allocation Fund | | Target Today Fund† | | Target 2045 Fund† |
Moderate Balanced Fund | | Target 2010 Fund† | | Target 2050 Fund† |
WealthBuilder Conservative Allocation Portfolio† | | Target 2015 Fund† | | Target 2055 Fund† |
| Money Market Funds | | | | |
100% Treasury Money Market Fund | | Heritage Money Market Fund† | | National Tax-Free Money Market Fund |
California Municipal Money Market Fund | | Money Market Fund | | Prime Investment Money Market Fund |
Cash Investment Money Market Fund | | Municipal Cash Management Money Market Fund | | Treasury Plus Money Market Fund |
Government Money Market Fund | | Municipal Money Market Fund | | |
| Variable Trust Funds1 | | | | |
VT Discovery Fund† | | VT Intrinsic Value Fund | | VT Small Cap Growth Fund |
VT Index Asset Allocation Fund | | VT Omega Growth Fund | | VT Small Cap Value Fund |
VT International Equity Fund | | VT Opportunity Fund† | | VT Total Return Bond Fund |
An investment in a money market fund is not insured or guaranteed by the Federal Deposit Insurance Corporation or any other government agency. Although the Wells Fargo Advantage Money Market Funds seek to preserve the value of your investment at $1.00 per share, it is possible to lose money by investing in a money market fund.
| 1. | The Variable Trust Funds are generally available only through insurance company variable contracts. |
| † | In this report, the Wells Fargo Advantage Discovery FundSM, Wells Fargo Advantage Endeavor Select FundSM, Wells Fargo Advantage Enterprise FundSM, Wells Fargo Advantage Opportunity FundSM, Wells Fargo Advantage Social Sustainability FundSM, Wells Fargo Advantage WealthBuilder Conservative Allocation PortfolioSM, Wells Fargo Advantage WealthBuilder Equity PortfolioSM, Wells Fargo Advantage WealthBuilder Growth Allocation PortfolioSM, Wells Fargo Advantage WealthBuilder Growth Balanced PortfolioSM, Wells Fargo Advantage WealthBuilder Moderate Balanced PortfolioSM, Wells Fargo Advantage WealthBuilder Tactical Equity PortfolioSM, Wells Fargo Advantage Dow Jones Target Today FundSM, Wells Fargo Advantage Dow Jones Target 2010 FundSM, Wells Fargo Advantage Dow Jones Target 2015 FundSM, Wells Fargo Advantage Dow Jones Target 2020 FundSM, Wells Fargo Advantage Dow Jones Target 2025 FundSM, Wells Fargo Advantage Dow Jones Target 2030 FundSM, Wells Fargo Advantage Dow Jones Target 2035 FundSM, Wells Fargo Advantage Dow Jones Target 2040 FundSM, Wells Fargo Advantage Dow Jones Target 2045 FundSM, Wells Fargo Advantage Dow Jones Target 2050 FundSM, Wells Fargo Advantage Dow Jones Target 2055 FundSM, Wells Fargo Advantage Heritage Money Market FundSM, Wells Fargo Advantage VT Discovery FundSM, and Wells Fargo Advantage VT Opportunity FundSM are referred to as the Discovery Fund, Endeavor Select Fund, Enterprise Fund, Opportunity Fund, Social Sustainability Fund, WealthBuilder Conservative Allocation Portfolio, WealthBuilder Equity Portfolio, WealthBuilder Growth Allocation Portfolio, WealthBuilder Growth Balanced Portfolio, WealthBuilder Moderate Balanced Portfolio, WealthBuilder Tactical Equity Portfolio, Target Today Fund, Target 2010 Fund, Target 2015 Fund, Target 2020 Fund, Target 2025 Fund, Target 2030 Fund, Target 2035 Fund, Target 2040 Fund, Target 2045 Fund, Target 2050 Fund, Target 2055 Fund, Heritage Money Market Fund, VT Discovery Fund, and VT Opportunity Fund, respectively. |
Not part of the annual report.
| | | | |
| 2 | | Wells Fargo Advantage VT Discovery Fund | | Letter to Shareholders |

Karla M. Rabusch,
President
Wells Fargo Advantage Funds
The U.S. economic recovery that began in mid-2009 progressed throughout the 12-month period, yet the rate of growth remained subpar compared with most previous recovery cycles.
Dear Valued Shareholder:
We’re pleased to offer you this annual report for the Wells Fargo Advantage VT Discovery Fund for the 12-month period that ended December 31, 2011.
For the full 12-month period, most of the major domestic equity indexes posted either modest gains or relatively mild losses. However, the market’s 12-month return figures mask the uneven path that it traced throughout the year as investors had to contend with a variety of global and domestic headwinds. Whatever the future holds, we continue to believe that most investors can benefit from adhering to a well-diversified investment strategy. Over the long-term, such a strategy may allow you to balance risks and opportunities as you pursue your financial goals in a dynamic market landscape.
The economic recovery gained traction as the year progressed.
The U.S. economic recovery that began in mid-2009 progressed throughout the 12-month period, yet the rate of growth remained subpar compared with most previous recovery cycles.
2011 opened on a note of mounting optimism regarding the strength of the recovery, yet a batch of disappointing economic data in the spring and summer cast renewed doubts on the sustainability of the recovery. In September, it was reported that U.S. gross domestic product (GDP) grew at a mere 1.3% annual rate in the second quarter of 2011, following anemic growth at an annual rate of 0.4% in the first quarter. According to the December estimate, GDP growth accelerated to an annual rate of 1.8% in the third quarter, reigniting hopes for a sustainable recovery. Those hopes were buoyed by widespread anticipation of even stronger GDP growth in the fourth quarter. By the end of the 12-month period, few economists believed that the U.S. economy was in danger of sliding back into recession, although many expected a sluggish growth environment in 2012.
The struggling housing and labor markets slowed growth.
As has been the case throughout the recovery, the housing and labor markets continued to restrain economic momentum during 2011.
The beleaguered housing market has arguably exerted the biggest drag on growth. Despite intermittent signs of improvement, ongoing weakness in sales of both new and existing homes has put considerable downward pressure on prices. On the other hand, the labor market took a decided turn for the better in the latter half of the year: initial unemployment claims have eased in recent months, and the private sector has been steadily adding jobs. The pace of hiring, while not brisk, was sufficient to push the U.S. unemployment rate down to 8.5% as of December 2011—still well above its historical average, but at its lowest level since February 2009. Many observers expect the unemployment rate to decline further in 2012, which could act as a tailwind for consumer spending—widely viewed as one of the keys to long-term economic growth.
The Federal Reserve announced that it will keep rates low until 2013.
Consumers have already demonstrated some resilience in their spending—even in the face of higher energy costs. Oil prices skyrocketed in early 2011 before retreating later in the year, only to spike again during the fourth quarter. Yet “core” inflation, which excludes volatile energy and food prices, remained fairly benign throughout the year.
| | | | | | |
| Letter to Shareholders | | Wells Fargo Advantage VT Discovery Fund | | | 3 | |
With inflation in check, the Federal Reserve (Fed) held its target range for the federal funds rate—a proxy for short-term interest rates—steady at 0% to 0.25%. Following its August 9 meeting, the Federal Open Market Committee (FOMC) issued a statement explaining that economic conditions were likely to warrant exceptionally low levels for the federal funds rate through at least mid-2013. In addition, the Fed carried out its second round of quantitative easing (QE2) in an effort to promote a more robust economic expansion. The stimulus program was completed as scheduled in June 2011. In September, the Fed launched yet another stimulus program—dubbed “Operation Twist”—that is designed to keep intermediate- and longer-term yields relatively low. The goal with keeping longer-term rates low is to encourage lending activity to spark business investments and home purchases, which, in turn, may provide support for a more sustainable economic recovery.
Market volatility was a dominant theme throughout most of 2011.
Despite pockets of turbulence sparked by the natural disasters in Japan and geopolitical turmoil in North Africa and the Middle East, the U.S. equity market performed very well from January through April of 2011. Some upbeat economic news, better-than-expected corporate profits, and investor enthusiasm about QE2 were among the catalysts for the market’s four-month advance.
In May and June, the market climate shifted to one of anxiety over the increasingly fragile state of the U.S. and global economies. As spring gave way to summer, investors not only worried that the U.S. might be on the brink of recession, they also feared that Europe’s sovereign debt problems could spiral out of control if a Greek default triggered financial contagion across the continent. In July and August, investor sentiment was further undermined by partisan wrangling over the federal debt ceiling and the Standard & Poor’s downgrade of the U.S. credit rating. The barrage of unsettling headlines led to heightened market volatility and sharply falling stock prices in the third quarter of 2011. Although volatility persisted into the fourth quarter, the market was able to rebound amid improved economic data and hopes for a resolution to the European crisis.
For the full 12-month period, the S&P 500 Index1 of large-cap stocks achieved a total return of 2.1%. The Russell Midcap® Index2 and the Russell 2000® Index3 of small-cap stocks lost 1.6% and 4.2%, respectively. International stocks fared worse than their U.S. counterparts, with the MSCI EAFE Index4 shedding 14.8%.
| 1. | The S&P 500 Index consists of 500 stocks chosen for market size, liquidity, and industry group representation. It is a market-value weighted index with each stock's weight in the index proportionate to its market value. You cannot invest directly in an index. |
| 2. | The Russell Midcap® Index measures the performance of the 800 smallest companies in the Russell 1000 Index, which represent approximately 25% of the total market capitalization of the Russell 1000® Index. You cannot invest directly in an index. |
| 3. | The Russell 2000® Index measures the performance of the 2,000 smallest companies in the Russell 3000® Index, which represents approximately 8% of the total market capitalization of the Russell 3000 Index. You cannot invest directly in an index. |
| 4. | The Morgan Stanley Capital International Europe, Australasia, and Far East (“MSCI EAFE”) Stock Index is an unmanaged group of securities widely regarded by investors to be representations of the stock markets of Europe, Australasia, and the Far East. You cannot invest directly in an index. Source: MSCI. MSCI makes no express or implied warranties or representations and shall have no liability whatsoever with respect to any MSCI data contained herein. The MSCI data may not be further redistributed or used as a basis for other indexes or any securities or financial products. This report is not approved, reviewed or produced by MSCI. |
| | | | |
| 4 | | Wells Fargo Advantage VT Discovery Fund | | Letter to Shareholders |
The market turmoil of 2011 and an uncertain outlook going forward have left many investors questioning their resolve—and their investments. Yet, it is precisely at such times that the market may present opportunities—as well as challenges—for prudent investors.
Recent events have not altered our message to shareholders.
The market turmoil of 2011 and an uncertain outlook going forward have left many investors questioning their resolve—and their investments. Yet, it is precisely at such times that the market may present opportunities—as well as challenges—for prudent investors. Bear in mind that many investors who indiscriminately sold their equity investments during the severe market downturn of 2008 to 2009 missed out on the impressive two-year rally that followed. In our opinion, the lesson to be learned from these dramatic market events is that, for many investors, simply building and maintaining a well-diversified5 investment plan is the best long-term strategy.
To help you create a sound strategy based on your personal goals and risk tolerance, Wells Fargo Advantage Funds offers more than 110 mutual funds and other investments spanning a broad range of asset classes and investment styles. While diversification cannot guarantee an investment profit or prevent losses, we believe it can be an effective way to manage investment risk and potentially smooth out overall portfolio performance.
Thank you for choosing to invest with Wells Fargo Advantage Funds. We appreciate your confidence in us and remain committed to helping you meet your financial needs. For current information about your fund investments, contact your investment professional, visit our website at www.wellsfargo.com/advantagefunds, or call us directly at 1-800-222-8222. We are available 24 hours a day, 7 days a week.
Sincerely,

Karla M. Rabusch
President
Wells Fargo Advantage Funds
| 5. | Diversification does not assure or guarantee better performance and cannot eliminate the risk of investment losses. |
| | | | | | |
| Performance Highlights (Unaudited) | | Wells Fargo Advantage VT Discovery Fund | | | 5 | |
INVESTMENT OBJECTIVE
The Fund seeks long-term capital appreciation.
ADVISER
Wells Fargo Funds Management, LLC
SUB-ADVISER
Wells Capital Management Incorporated
PORTFOLIO MANAGERS
Thomas J. Pence, CFA
Michael T. Smith, CFA
Chris Warner, CFA2
FUND INCEPTION
May 8, 1992
| | | | |
| 12 MONTH TOTAL RETURN AS OF DECEMBER 31, 2011 | |
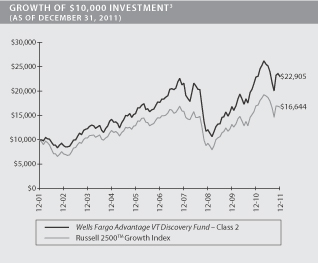
Class 2 | | | 0.42% | |
Russell 2500TM Growth Index1 | | | (1.57)% | |
Figures quoted represent past performance, which is no guarantee of future results and do not reflect the deduction of taxes that a shareholder may pay on fund distributions or the redemption of fund shares. Investment return and principal value of an investment will fluctuate so that an investor’s shares, when redeemed, may be worth more or less than their original cost. Current performance may be lower or higher than the performance data quoted and assumes the reinvestment of dividends and capital gains. Current month-end performance is available by calling 1-866-765-0778. Performance figures of the Fund do not reflect fees charged pursuant to the terms of variable life insurance policies and variable annuity contracts.
Index returns do not include transaction costs associated with buying and selling securities, any mutual fund fees or expenses or any taxes. It is not possible to invest directly in an index.
The Adviser has committed through April 30, 2012 to waive fees and/or reimburse expenses to the extent necessary to cap the Fund’s Total Annual Fund Operating Expenses After Fee Waiver, excluding certain other expenses at 1.15% for Class 2. The Fund’s gross and net expense ratios are 1.23% and 1.16%, respectively, for Class 2 shares. Without these reductions, the Fund’s returns would have been lower.
| 1. | The Russell 2500™ Growth Index measures the performance of those Russell 2500 companies with higher price-to-book ratios and higher forecasted growth values. You cannot invest directly in an index. |
| 2. | Effective January 10, 2012, Chris Warner became a co-portfolio manager of the Fund. |
| 3. | The chart compares the performance of the Wells Fargo Advantage VT Discovery Fund Class 2 for the most recent ten years of the Fund with the Russell 2500™ Growth Index. The chart assumes a hypothetical $10,000 investment and reflects all operating expenses of the Fund. Performance figures of the Fund do not reflect fees charged pursuant to the terms of variable life insurance policies and variable annuity contracts. |
| | | | |
| 6 | | Wells Fargo Advantage VT Discovery Fund | | Performance Highlights (Unaudited) |
MANAGER’S DISCUSSION
Fund highlights
| n | | The Fund outperformed its benchmark, the Russell 2500™ Growth Index, over the 12-month period that ended December 31, 2011. |
| n | | Effective stock selection in the health care and information technology (IT) sectors contributed to performance, while consumer discretionary positioning and a lack of exposure to consumer staples were slight headwinds. |
| n | | Equity prices ebbed and flowed with a “risk on/risk off” mentality throughout the year, driven largely by investors’ reactions to the news flow out of Europe. |
| n | | In the current market environment, we remain dedicated to our bottom-up stock selection process in seeking to maintain an optimal risk/reward balance. |
Macro-driven volatility limited equity market returns for 2011.
The year began on a high note as the equity market continued its rally from late 2010 amid greater confidence in the sustainability of the U.S. economic recovery. While there were pockets of turbulence sparked by the geopolitical turmoil in North Africa and the Middle East and natural disasters in Japan, the market performed well through April 2011.
In the late spring and summer, however, investors’ spirits began to dampen as a string of discouraging economic data reignited fears of a recession. Investor confidence was further damaged by bickering over the federal debt ceiling, the downgrade of the U.S. credit rating by Standard & Poor’s, and the risk of financial contagion in Europe. Despite continued strength in corporate profits, investors’ intense focus on the negative macro headlines, particularly out of Europe, led to heightened market volatility and a broad-based sell-off in equities during the third quarter. Although volatility persisted into the fourth quarter, most of the major equity indexes rebounded and managed to finish 2011 with either modest gains or relatively mild losses.
Effective stock selection and merger and acquisition activity enabled the Fund to outperform its benchmark.
Effective stock selection in the health care and IT sectors contributed significantly to the Fund’s outperformance during the period. In health care, Pharmasset Incorporated’s innovative treatment for hepatitis C and HealthSpring Incorporated’s strong position in the health insurance industry were recognized by strategic buyers, as both stocks were acquired at sizable premiums. Meanwhile, Alexion Pharmaceuticals Incorporated, broadened the indications of use and geographic distribution for its rare-disease therapies. In IT, the acquisitions of both NetLogic Microsystems Incorporated, and SuccessFactors Incorporated, commanded healthy premiums, while the solid fundamentals of our holdings in the internet software and services and semiconductor industries also contributed to outperformance.
Stock selection in the consumer discretionary sector and a lack of exposure to consumer staples were performance headwinds. Shutterfly Incorporated, a leading online photo provider, was the largest individual detractor due to the impact of increased pricing competition on the company’s results during the busy holiday season. Investors’ rotation into more defensive market segments enabled many consumer staples stocks to outperform the market. In keeping with our stock selection discipline, we generally avoided the sector, as we found few consumer staples companies with growth profiles that met our criteria.
| | | | | | |
| Performance Highlights (Unaudited) | | Wells Fargo Advantage VT Discovery Fund | | | 7 | |
| | | | |
TEN LARGEST EQUITY HOLDINGS4
(AS OF DECEMBER 31, 2011) | |
Kansas City Southern | | | 3.70% | |
Transdigm Group Incorporated | | | 2.89% | |
Airgas Incorporated | | | 2.67% | |
Equinix Incorporated | | | 2.01% | |
Gartner Incorporated | | | 1.97% | |
Alexion Pharmaceuticals Incorporated | | | 1.90% | |
Graco Incorporated | | | 1.87% | |
Oil States International Incorporated | | | 1.86% | |
WESCO International Incorporated | | | 1.79% | |
Triumph Group Incorporated | | | 1.78% | |
We have taken advantage of the opportunity to upgrade the quality of the portfolio.
Although the Fund outperformed on a relative basis, its absolute return for the 12-month period was only slightly positive. The third-quarter market sell-off caused many companies with predictable, visible earnings growth—”core” holdings within our portfolio construction framework—to be unfairly punished along with more economically sensitive companies. In addition, as the year progressed, we took steps to optimize our mix of cyclical positions within our “developing situations” category in light of the macro backdrop.
Time has shown that the best response to volatile, irrational markets is to be adaptive in your thinking but consistent in your investment process. Accordingly, while we have continued to execute our time-tested process, we have taken advantage of the opportunity to upgrade the quality of the portfolio by exchanging stocks with lower earnings visibility (meaning that we find it difficult to project future earnings) for those with higher earnings visibility. The challenge is to construct a portfolio with the optimal balance of secular and cyclical growth exposures. We believe that our “surround the company” approach has allowed us to achieve such balance and that the portfolio should be well positioned to outperform once company-specific fundamentals reassert themselves as the primary driver of equity returns.
| | |
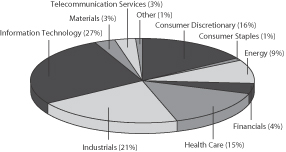
SECTOR DISTRIBUTION5
(AS OF DECEMBER 31, 2011) |
|
 |
A balanced portfolio strategy may help investors navigate the 2012 market landscape.
Some equity market observers share a bullish outlook for 2012, while other forecasts are more bearish. In our view, there are compelling arguments to support both sides of the debate. On the positive side, the labor market has taken a turn for the better in recent months, while consumer spending has been fairly resilient. Even the long-struggling housing market has shown tentative signs of stabilization. Corporate fundamentals remain generally strong, and equity valuations appear quite attractive in many cases.
On the negative side, a European recession looks increasingly likely and could be a source of market turmoil, especially given its implications for export-dependent China. After years of inflating financial and real estate markets, China may need to use other means of stimulus. In addition, ongoing political gamesmanship and fiscal austerity in developed nations could slow global economic growth.
Considering all of these factors, we expect moderate U.S. economic growth in 2012 and a trendless market characterized by bouts of volatility. In such an environment, we believe that balanced portfolio positioning is the most prudent approach.
| 4. | The ten largest equity holdings are calculated based on the value of the securities divided by total net assets of the Fund. Holdings are subject to change and may have changed since the date specified. |
| 5. | Sector distribution is subject to change and is calculated based on the total long-term investments of the Fund. |
| | | | |
| 8 | | Wells Fargo Advantage VT Discovery Fund | | Performance Highlights (Unaudited) |
AVERAGE ANNUAL TOTAL RETURN (%) (AS OF DECEMBER 31, 2011)
| | | | | | | | | | | | | | | | | | | | | | | | | | | | |
| | | | | | | | | | | | | | | | | | Expense Ratios6 | |
| | | Inception Date | | | 6 Months* | | | 1 Year | | | 5 Year | | | 10 Year | | | Gross | | | Net6,7 | |
Class 2 | | | 05/08/1992 | | | | (8.75 | ) | | | 0.42 | | | | 5.39 | | | | 8.64 | | | | 1.23% | | | | 1.16% | |
Russell 2500™ Growth Index | | | | | | | (10.72 | ) | | | (1.57 | ) | | | 2.89 | | | | 5.23 | | | | | | | | | |
| * | Returns for periods of less than one year are not annualized. |
Figures quoted represent past performance, which is no guarantee of future results and do not reflect the deduction of taxes that a shareholder may pay on fund distributions or the redemption of fund shares. Investment return and principal value of an investment will fluctuate so that an investor’s shares, when redeemed, may be worth more or less than their original cost. Current performance may be lower or higher than the performance data quoted and assumes the reinvestment of dividends and capital gains. Current month-end performance is available by calling 1-866-765-0778. Performance figures of the Fund do not reflect fees charged pursuant to the terms of variable life insurance policies and variable annuity contracts.
Index returns do not include transaction costs associated with buying and selling securities, any mutual fund fees or expenses or any taxes. It is not possible to invest directly in an index.
Stock fund values fluctuate in response to the activities of individual companies and general market and economic conditions. Smaller-company stocks tend to be more volatile and less liquid than those of larger companies. The use of derivatives may reduce returns and/or increase volatility. Certain investment strategies tend to increase the total risk of an investment (relative to the broader market). This Fund is exposed to foreign investment risk. Consult the Fund’s prospectus for additional information on these and other risks.
Please refer to the prospectus provided by your participating insurance company for detailed information describing the separate accounts for information regarding surrender charges, mortality and expense risk fees and other charges that may be assessed by the participating insurance companies.
| 6. | Reflects the expense ratios as stated in the most recent prospectus. |
| 7. | The Adviser has committed through April 30, 2012 to waive fees and/or reimburse expenses to the extent necessary to cap the Fund’s Total Annual Fund Operating Expenses After Fee Waiver, excluding certain expenses, at 1.15% for Class 2. Without this cap, the Fund’s returns would have been lower. |
| | | | | | |
| Fund Expenses (Unaudited) | | Wells Fargo Advantage VT Discovery Fund | | | 9 | |
As a shareholder of the Fund, you incur ongoing costs, including management fees; distribution (12b-1) fees; and other Fund expenses. This example is intended to help you understand your ongoing costs (in dollars) of investing in the Fund and to compare these costs with the ongoing costs of investing in other mutual funds.
The example is based on an investment of $1,000 invested at the beginning of the six-month period and held for the entire period from July 1, 2011 to December 31, 2011.
Actual Expenses
The “Actual” line of the table below provides information about actual account values and actual expenses. You may use the information in this line, together with the amount you invested, to estimate the expenses that you paid over the period. Simply divide your account value by $1,000 (for example, an $8,600 account value divided by $1,000 = 8.6), then multiply the result by the number in the “Actual” line under the heading entitled “Expenses Paid During Period” for your applicable class of shares to estimate the expenses you paid on your account during this period.
Hypothetical Example for Comparison Purposes
The “Hypothetical” line of the table below provides information about hypothetical account values and hypothetical expenses based on the Fund’s actual expense ratio and an assumed rate of return of 5% per year before expenses, which is not the Fund’s actual return. The hypothetical account values and expenses may not be used to estimate the actual ending account balance or expenses you paid for the period. You may use this information to compare the ongoing costs of investing in the Fund and other funds. To do so, compare this 5% hypothetical example with the 5% hypothetical examples that appear in the shareholder reports of the other funds.
Please note that the expenses shown in the table are meant to highlight your ongoing costs only and do not reflect any separate account charges assessed by participating insurance companies. Therefore, the “Hypothetical” line of the table is useful in comparing ongoing costs only, and will not help you determine the relative total costs of owning different funds. In addition, if these separate account charges assessed by participating insurance companies were included, your costs would have been higher.
| | | | | | | | | | | | | | | | |
| | | Beginning
Account Value
07-01-2011 | | | Ending
Account Value
12-31-2011 | | | Expenses
Paid During
the Period¹ | | | Net Annual
Expense Ratio | |
Class 2 | | | | | | | | | | | | | | | | |
Actual | | $ | 1,000.00 | | | $ | 912.47 | | | $ | 5.54 | | | | 1.15 | % |
Hypothetical (5% return before expenses) | | $ | 1,000.00 | | | $ | 1,019.41 | | | $ | 5.85 | | | | 1.15 | % |
| 1. | Expenses paid is equal to the annualized expense ratio multiplied by the average account value over the period, multiplied by the number of days in the most recent fiscal half-year divided by the number of days in the fiscal year (to reflect the one-half year period). |
| | | | |
| 10 | | Wells Fargo Advantage VT Discovery Fund | | Portfolio of Investments—December 31, 2011 |
| | | | | | | | | | | | |
| Security Name | | | | | | Shares | | | Value | |
| | | | | | | | | | | | |
| | | |
Common Stocks: 98.32% | | | | | | | | | | |
| | | |
Consumer Discretionary: 16.24% | | | | | | | | | | |
| | | |
| Auto Components: 1.38% | | | | | | | | | | |
BorgWarner Incorporated†« | | | | | | | 21,200 | | | $ | 1,351,288 | |
| | | | | | | | | | | | |
| | | |
| Automobiles: 1.28% | | | | | | | | | | |
Tesla Motors Incorporated†« | | | | | | | 44,088 | | | | 1,259,153 | |
| | | | | | | | | | | | |
| | | |
| Diversified Consumer Services: 1.18% | | | | | | | | | | |
Weight Watchers International Incorporated | | | | | | | 21,100 | | | | 1,160,711 | |
| | | | | | | | | | | | |
| | | |
| Hotels, Restaurants & Leisure: 2.40% | | | | | | | | | | |
Arcos Dorados Holdings Incorporated | | | | | | | 43,517 | | | | 893,404 | |
Buffalo Wild Wings Incorporated† | | | | | | | 21,600 | | | | 1,458,216 | |
| | | | |
| | | | | | | | | | | 2,351,620 | |
| | | | | | | | | | | | |
| | | |
| Household Durables: 1.30% | | | | | | | | | | |
Tempur-Pedic International Incorporated† | | | | | | | 24,200 | | | | 1,271,226 | |
| | | | | | | | | | | | |
| | | |
| Internet & Catalog Retail: 0.68% | | | | | | | | | | |
Shutterfly Incorporated†« | | | | | | | 29,500 | | | | 671,420 | |
| | | | | | | | | | | | |
| | | |
| Media: 0.69% | | | | | | | | | | |
National Cinemedia Incorporated« | | | | | | | 54,195 | | | | 672,018 | |
| | | | | | | | | | | | |
| | | |
| Specialty Retail: 3.53% | | | | | | | | | | |
Ross Stores Incorporated | | | | | | | 21,400 | | | | 1,017,142 | |
Vitamin Shoppe Incorporated† | | | | | | | 29,200 | | | | 1,164,496 | |
Williams-Sonoma Incorporated | | | | | | | 33,300 | | | | 1,282,050 | |
| | | | |
| | | | | | | | | | | 3,463,688 | |
| | | | | | | | | | | | |
| | | |
| Textiles, Apparel & Luxury Goods: 3.80% | | | | | | | | | | |
Deckers Outdoor Corporation†« | | | | | | | 16,400 | | | | 1,239,348 | |
Michael Kors Holdings Limited | | | | | | | 6,667 | | | | 181,676 | |
Under Armour Incorporated† | | | | | | | 15,800 | | | | 1,134,282 | |
Vera Bradley Incorporated†« | | | | | | | 36,400 | | | | 1,173,900 | |
| | | | |
| | | | | | | | | | | 3,729,206 | |
| | | | | | | | | | | | |
| | | |
Consumer Staples: 1.36% | | | | | | | | | | |
| | | |
| Food Products: 1.36% | | | | | | | | | | |
Hain Celestial Group Incorporated†« | | | | | | | 36,300 | | | | 1,330,758 | |
| | | | | | | | | | | | |
| | | |
Energy: 9.30% | | | | | | | | | | |
| | | |
| Energy Equipment & Services: 3.71% | | | | | | | | | | |
Atwood Oceanics Incorporated†« | | | | | | | 25,300 | | | | 1,006,687 | |
Nabors Industries Limited† | | | | | | | 46,900 | | | | 813,246 | |
Oil States International Incorporated†« | | | | | | | 23,900 | | | | 1,825,243 | |
| | | | |
| | | | | | | | | | | 3,645,176 | |
| | | | | | | | | | | | |
| | | |
| Oil, Gas & Consumable Fuels: 5.59% | | | | | | | | | | |
Approach Resources Incorporated† | | | | | | | 33,541 | | | | 986,441 | |
Cabot Oil & Gas Corporation | | | | | | | 12,700 | | | | 963,930 | |
| | | | | | |
| Portfolio of Investments—December 31, 2011 | | Wells Fargo Advantage VT Discovery Fund | | | 11 | |
| | | | | | | | | | | | |
| Security Name | | | | | | Shares | | | Value | |
| | | | | | | | | | | | |
| | | |
| Oil, Gas & Consumable Fuels (continued) | | | | | | | | | | |
Concho Resources Incorporated† | | | | | | | 13,900 | | | $ | 1,303,125 | |
Gulfport Energy Corporation† | | | | | | | 23,900 | | | | 703,855 | |
Pioneer Natural Resources Company | | | | | | | 11,800 | | | | 1,055,864 | |
SandRidge Energy Incorporated† | | | | | | | 57,200 | | | | 466,752 | |
| | | | |
| | | | | | | | | | | 5,479,967 | |
| | | | | | | | | | | | |
| | | |
Financials: 4.07% | | | | | | | | | | |
| | | |
| Capital Markets: 2.25% | | | | | | | | | | |
Affiliated Managers Group Incorporated† | | | | | | | 17,100 | | | | 1,640,745 | |
LPL Investment Holdings Incorporated† | | | | | | | 18,691 | | | | 570,823 | |
| | | | |
| | | | | | | | | | | 2,211,568 | |
| | | | | | | | | | | | |
| | | |
| Diversified Financial Services: 0.77% | | | | | | | | | | |
MSCI Incorporated† | | | | | | | 22,800 | | | | 750,804 | |
| | | | | | | | | | | | |
| | | |
| Real Estate Management & Development: 1.05% | | | | | | | | | | |
CBRE Group Incorporated† | | | | | | | 67,900 | | | | 1,033,438 | |
| | | | | | | | | | | | |
| | | |
Health Care: 15.02% | | | | | | | | | | |
| | | |
| Biotechnology: 3.62% | | | | | | | | | | |
Alexion Pharmaceuticals Incorporated† | | | | | | | 26,100 | | | | 1,866,150 | |
Cubist Pharmaceuticals Incorporated† | | | | | | | 31,400 | | | | 1,244,068 | |
Inhibitex Incorporated† | | | | | | | 40,000 | | | | 437,600 | |
| | | | |
| | | | | | | | | | | 3,547,818 | |
| | | | | | | | | | | | |
| | | |
| Health Care Equipment & Supplies: 2.40% | | | | | | | | | | |
Alere Incorporated† | | | | | | | 38,998 | | | | 900,464 | |
Gen-Probe Incorporated† | | | | | | | 13,700 | | | | 809,944 | |
HeartWare International Incorporated†« | | | | | | | 9,400 | | | | 648,600 | |
| | | | |
| | | | | | | | | | | 2,359,008 | |
| | | | | | | | | | | | |
| | | |
| Health Care Providers & Services: 3.77% | | | | | | | | | | |
AmerisourceBergen Corporation | | | | | | | 25,200 | | | | 937,188 | |
Catalyst Health Solutions Incorporated† | | | | | | | 18,900 | | | | 982,800 | |
MEDNAX Incorporated† | | | | | | | 23,900 | | | | 1,721,039 | |
Team Health Holdings LLC† | | | | | | | 2,413 | | | | 53,255 | |
| | | | |
| | | | | | | | | | | 3,694,282 | |
| | | | | | | | | | | | |
| | | |
| Health Care Technology: 1.37% | | | | | | | | | | |
athenahealth Incorporated†« | | | | | | | 27,300 | | | | 1,340,976 | |
| | | | | | | | | | | | |
| | | |
| Life Sciences Tools & Services: 1.84% | | | | | | | | | | |
Bruker BioSciences Corporation†« | | | | | | | 71,700 | | | | 890,514 | |
Covance Incorporated† | | | | | | | 20,078 | | | | 917,966 | |
| | | | |
| | | | | | | | | | | 1,808,480 | |
| | | | | | | | | | | | |
| | | |
| Pharmaceuticals: 2.02% | | | | | | | | | | |
BioMarin Pharmaceutical Incorporated†« | | | | | | | 30,357 | | | | 1,043,674 | |
Impax Laboratories Incorporated†« | | | | | | | 46,600 | | | | 939,922 | |
| | | | |
| | | | | | | | | | | 1,983,596 | |
| | | | | | | | | | | | |
| | | | |
| 12 | | Wells Fargo Advantage VT Discovery Fund | | Portfolio of Investments—December 31, 2011 |
| | | | | | | | | | | | |
| Security Name | | | | | | Shares | | | Value | |
| | | | | | | | | | | | |
| | | |
Industrials: 20.38% | | | | | | | | | | |
| | | |
| Aerospace & Defense: 4.66% | | | | | | | | | | |
Transdigm Group Incorporated† | | | | | | | 29,600 | | | $ | 2,832,128 | |
Triumph Group Incorporated | | | | | | | 29,800 | | | | 1,741,810 | |
| | | | |
| | | | | | | | | | | 4,573,938 | |
| | | | | | | | | | | | |
| | | |
| Commercial Services & Supplies: 0.96% | | | | | | | | | | |
Verisk Analytics Incorporated Class A† | | | | | | | 23,394 | | | | 938,801 | |
| | | | | | | | | | | | |
| | | |
| Machinery: 6.65% | | | | | | | | | | |
AGCO Corporation† | | | | | | | 5,100 | | | | 219,147 | |
Chart Industries Incorporated†« | | | | | | | 28,100 | | | | 1,519,367 | |
Graco Incorporated | | | | | | | 44,900 | | | | 1,835,961 | |
Robbins & Myers Incorporated | | | | | | | 25,200 | | | | 1,223,460 | |
Wabtec Corporation | | | | | | | 14,810 | | | | 1,035,960 | |
Westport Innovations Incorporated†« | | | | | | | 20,600 | | | | 684,744 | |
| | | | |
| | | | | | | | | | | 6,518,639 | |
| | | | | | | | | | | | |
| | | |
| Road & Rail: 5.04% | | | | | | | | | | |
Hertz Global Holdings Incorporated† | | | | | | | 112,200 | | | | 1,314,984 | |
Kansas City Southern† | | | | | | | 53,400 | | | | 3,631,734 | |
| | | | |
| | | | | | | | | | | 4,946,718 | |
| | | | | | | | | | | | |
| | | |
| Trading Companies & Distributors: 1.79% | | | | | | | | | | |
WESCO International Incorporated†« | | | | | | | 33,200 | | | | 1,759,932 | |
| | | | | | | | | | | | |
| | | |
| Transportation Infrastructure: 1.28% | | | | | | | | | | |
Wesco Aircraft Holdings Incorporated† | | | | | | | 89,449 | | | | 1,251,392 | |
| | | | | | | | | | | | |
| | | |
Information Technology: 26.45% | | | | | | | | | | |
| | | |
| Communications Equipment: 2.46% | | | | | | | | | | |
Acme Packet Incorporated† | | | | | | | 34,600 | | | | 1,069,486 | |
F5 Networks Incorporated† | | | | | | | 8,400 | | | | 891,408 | |
Ubiquiti Networks Incorporated†« | | | | | | | 24,986 | | | | 455,495 | |
| | | | |
| | | | | | | | | | | 2,416,389 | |
| | | | | | | | | | | | |
| | | |
| Electronic Equipment, Instruments & Components: 1.02% | | | | | | | | | | |
Trimble Navigation Limited† | | | | | | | 23,100 | | | | 1,002,540 | |
| | | | | | | | | | | | |
| | | |
| Internet Software & Services: 6.18% | | | | | | | | | | |
Angie’s List Incorporated†« | | | | | | | 39,179 | | | | 630,782 | |
DealerTrack Holdings Incorporated† | | | | | | | 37,589 | | | | 1,024,676 | |
Equinix Incorporated†« | | | | | | | 19,463 | | | | 1,973,548 | |
LogMeIn Incorporated†« | | | | | | | 23,979 | | | | 924,390 | |
Mercadolibre Incorporated« | | | | | | | 19,000 | | | | 1,511,260 | |
| | | | |
| | | | | | | | | | | 6,064,656 | |
| | | | | | | | | | | | |
| | | |
| IT Services: 3.26% | | | | | | | | | | |
Gartner Incorporated† | | | | | | | 55,700 | | | | 1,936,689 | |
ServiceSource International Incorporated† | | | | | | | 80,427 | | | | 1,261,900 | |
| | | | |
| | | | | | | | | | | 3,198,589 | |
| | | | | | | | | | | | |
| | | | | | |
| Portfolio of Investments—December 31, 2011 | | Wells Fargo Advantage VT Discovery Fund | | | 13 | |
| | | | | | | | | | | | | | |
| Security Name | | | | | | | Shares | | | Value | |
| | | |
| Semiconductors & Semiconductor Equipment: 4.47% | | | | | | | | | | | | |
Atmel Corporation† | | | | | | | | | 85,800 | | | $ | 694,980 | |
Avago Technologies Limited | | | | | | | | | 52,100 | | | | 1,503,606 | |
Ceva Incorporated†« | | | | | | | | | 21,400 | | | | 647,564 | |
EZchip Semiconductor Limited† | | | | | | | | | 19,800 | | | | 560,934 | |
Microchip Technology Incorporated« | | | | | | | | | 26,600 | | | | 974,358 | |
| | | | |
| | | | | | | | | | | | | 4,381,442 | |
| | | | | | | | | | | | | | |
| | | |
| Software: 9.06% | | | | | | | | | | | | |
Aspen Technology Incorporated†« | | | | | | | | | 92,300 | | | | 1,601,405 | |
Broadsoft Incorporated†« | | | | | | | | | 49,600 | | | | 1,497,920 | |
Fortinet Incorporated† | | | | | | | | | 57,234 | | | | 1,248,274 | |
Qlik Technologies Incorporated† | | | | | | | | | 44,938 | | | | 1,087,500 | |
Red Hat Incorporated† | | | | | | | | | 20,300 | | | | 838,187 | |
SuccessFactors Incorporated†« | | | | | | | | | 25,338 | | | | 1,010,226 | |
TIBCO Software Incorporated† | | | | | | | | | 67,100 | | | | 1,604,361 | |
| | | | |
| | | | | | | | | | | | | 8,887,873 | |
| | | | | | | | | | | | | | |
| | | |
Materials: 2.67% | | | | | | | | | | | | |
| | | |
| Chemicals: 2.67% | | | | | | | | | | | | |
Airgas Incorporated | | | | | | | | | 33,500 | | | | 2,615,680 | |
| | | | | | | | | | | | | | |
| | | |
Telecommunication Services: 2.83% | | | | | | | | | | | | |
| | | |
| Diversified Telecommunication Services: 1.16% | | | | | | | | | | | | |
Iridium Communications Incorporated†« | | | | | | | | | 147,900 | | | | 1,140,309 | |
| | | | | | | | | | | | | | |
| | | |
| Wireless Telecommunication Services: 1.67% | | | | | | | | | | | | |
SBA Communications Corporation Class A†« | | | | | | | | | 38,100 | | | | 1,636,774 | |
| | | | | | | | | | | | | | |
| | | |
Total Common Stocks (Cost $92,653,238) | | | | | | | | | | | 96,449,873 | |
| | | | | | | | | | | | | | |
| | | | |
| | | | | | | | Principal | | | | |
| | | |
Other: 0.49% | | | | | | | | | | | | |
Gryphon Funding Limited, Pass-Through Entity(a)(i)(v) | | | | | | | | | $ 626,739 | | | | 175,487 | |
VFNC Corporation, Pass-Through Entity, 0.30%(a)(i)(v)144A± | | | | | | | | | 713,417 | | | | 306,769 | |
| | | | |
Total Other (Cost $230,573) | | | | | | | | | | | | | 482,256 | |
| | | | | | | | | | | | | | |
| | | | |
| | | | | Yield | | | Shares | | | | |
| Short-Term Investments: 29.28% | | | | | | | | | | | | | | |
| | | | |
| Investment Companies: 29.28% | | | | | | | | | | | | | | |
Wells Fargo Advantage Cash Investment Money Market Fund, Institutional Class(l)(u) | | | | | 0.04 | % | | | 1,383,165 | | | | 1,383,165 | |
Wells Fargo Securities Lending Cash Investments, LLC(v)(l)(u)(r) | | | | | 0.12 | | | | 27,344,177 | | | | 27,344,177 | |
| | | |
Total Short-Term Investments (Cost $28,727,342) | | | | | | | | | | | 28,727,342 | |
| | | | | | | | | | | | | | |
| | | | | | | | |
| Total Investments in Securities | | | | | | | | |
| (Cost $121,611,153)* | | | 128.09 | % | | | 125,659,471 | |
Other Assets and Liabilities, Net | | | (28.09 | ) | | | (27,559,978 | ) |
| | | | | | | | |
| Total Net Assets | | | 100.00 | % | | $ | 98,099,493 | |
| | | | | | | | |
| | | | |
| 14 | | Wells Fargo Advantage VT Discovery Fund | | Portfolio of Investments—December 31, 2011 |
| † | Non-income earning security. |
| « | All or a portion of this security is on loan. |
| (a) | Security is fair valued by the Management Valuation Team, and in certain instances by the Board of Trustees, in accordance with procedures approved by the Board of Trustees. |
| (i) | Illiquid security for which the designation as illiquid is unaudited. |
| (v) | Security represents investment of cash collateral received from securities on loan. |
| 144A | Security that may be resold to “qualified institutional buyers” under Rule 144A or security offered pursuant to Section 4(2) of the Securities Act of 1933, as amended. |
| ± | Variable rate investment. |
| (l) | Investment in an affiliate. |
| (u) | Rate shown is the 7-day annualized yield at period end. |
| (r) | The investment company is exempt from registration under Section 3(c)(7) of the 1940 Act. |
| * | Cost for federal income tax purposes is $122,437,848 and net unrealized appreciation (depreciation) consists of: |
| | | | |
Gross unrealized appreciation | | $ | 10,258,147 | |
Gross unrealized depreciation | | | (7,036,524 | ) |
| | | | |
Net unrealized appreciation | | $ | 3,221,623 | |
The accompanying notes are an integral part of these financial statements.
| | | | | | |
| Statement of Assets and Liabilities—December 31, 2011 | | Wells Fargo Advantage VT Discovery Fund | | | 15 | |
| | | | |
| | | | |
| |
Assets | | | | |
Investments | | | | |
In unaffiliated securities (including securities on loan), at value | | $ | 96,932,129 | |
In affiliated securities, at value | | | 28,727,342 | |
| | | | |
Total investments, at value (see cost below) | | | 125,659,471 | |
Receivable for investments sold | | | 916,076 | |
Receivable for Fund shares sold | | | 21,923 | |
Receivable for dividends | | | 18,330 | |
Receivable for securities lending income | | | 22,332 | |
Prepaid expenses and other assets | | | 604 | |
| | | | |
Total assets | | | 126,638,736 | |
| | | | |
| |
Liabilities | | | | |
Payable for investments purchased | | | 786,651 | |
Payable for Fund shares redeemed | | | 52,316 | |
Payable upon receipt of securities loaned | | | 27,574,750 | |
Advisory fee payable | | | 58,922 | |
Distribution fees payable | | | 22,469 | |
Due to other related parties | | | 10,681 | |
Accrued expenses and other liabilities | | | 33,454 | |
| | | | |
Total liabilities | | | 28,539,243 | |
| | | | |
Total net assets | | $ | 98,099,493 | |
| | | | |
| |
NET ASSETS CONSIST OF | | | | |
Paid-in capital | | $ | 99,684,137 | |
Accumulated net realized losses on investments | | | (5,632,962 | ) |
Net unrealized gains on investments | | | 4,048,318 | |
| | | | |
Total net assets | | $ | 98,099,493 | |
| | | | |
| |
COMPUTATION OF NET ASSET VALUE PER SHARE1 | | | | |
Net assets – Class 2 | | $ | 98,099,493 | |
Shares outstanding – Class 2 | | | 4,590,157 | |
Net asset value per share – Class 2 | | | $21.37 | |
| |
Total investments, at cost | | $ | 121,611,153 | |
| | | | |
Securities on loan, at value | | $ | 26,863,306 | |
| | | | |
| 1. | The Fund has an unlimited number of authorized shares. |
The accompanying notes are an integral part of these financial statements.
| | | | |
| 16 | | Wells Fargo Advantage VT Discovery Fund | | Statement of Operations—Year Ended December 31, 2011 |
| | | | |
| | | | |
| |
Investment income | | | | |
Dividends* | | $ | 337,927 | |
Income from affiliated securities | | | 2,711 | |
Securities lending income, net | | | 83,600 | |
| | | | |
Total investment income | | | 424,238 | |
| | | | |
| |
Expenses | | | | |
Advisory fee | | | 754,752 | |
Administration fees | | | | |
Fund level | | | 53,911 | |
Class 2 | | | 86,257 | |
Distribution fees | | | | |
Class 2 | | | 269,554 | |
Custody and accounting fees | | | 18,913 | |
Professional fees | | | 35,419 | |
Shareholder report expenses | | | 37,856 | |
Trustees’ fees and expenses | | | 10,578 | |
Other fees and expenses | | | 4,250 | |
| | | | |
Total expenses | | | 1,271,490 | |
Less: Fee waivers and/or expense reimbursements | | | (35,032 | ) |
| | | | |
Net expenses | | | 1,236,458 | |
| | | | |
Net investment loss | | | (812,220 | ) |
| | | | |
| |
REALIZED AND UNREALIZED GAINS (LOSSES) ON INVESTMENTS | | | | |
Net realized gains on investments | | | 27,863,306 | |
Net change in unrealized gains (losses) on investments | | | (26,402,344 | ) |
| | | | |
Net realized and unrealized gains (losses) on investments | | | 1,460,962 | |
| | | | |
Net increase in net assets resulting from operations | | $ | 648,742 | |
| | | | |
| |
* Net of foreign dividend withholding taxes of | | | $5,954 | |
The accompanying notes are an integral part of these financial statements.
| | | | | | |
| Statements of Changes in Net Assets | | Wells Fargo Advantage VT Discovery Fund | | | 17 | |
| | | | | | | | | | | | | | | | |
| | | Year Ended December 31, 2011 | | | Year Ended December 31, 2010 | |
| | | | |
Operations | | | | | | | | | | | | | | | | |
Net investment loss | | | | | | $ | (812,220 | ) | | | | | | $ | (661,558 | ) |
Net realized gains on investments | | | | | | | 27,863,306 | | | | | | | | 15,071,192 | |
Net change in unrealized gains (losses) on investments | | | | | | | (26,402,344 | ) | | | | | | | 14,985,606 | |
| | | | | | | | | | | | | | | | |
Net increase in net assets resulting from operations | | | | | | | 648,742 | | | | | | | | 29,395,240 | |
| | | | | | | | | | | | | | | | |
| | | | |
| | | Shares | | | | | | | | Shares | | | | | |
| | | | |
Capital share transactions | | | | | | | | | | | | | | | | |
Proceeds from shares sold – Class 2 | | | 665,598 | | | | 14,494,199 | | | | 796,770 | 1 | | | 14,304,397 | 1 |
Payment for shares redeemed – Class 2 | | | (1,279,927 | ) | | | (27,798,666 | ) | | | (1,076,715 | )1 | | | (19,068,998 | )1 |
| | | | | | | | | | | | | | | | |
Net decrease in net assets resulting
from capital share transactions | | | | | | | (13,304,467 | ) | | | | | | | (4,764,601 | ) |
| | | | | | | | | | | | | | | | |
Total increase (decrease) in net assets | | | | | | | (12,655,725 | ) | | | | | | | 24,630,639 | |
| | | | | | | | | | | | | | | | |
| | | | |
Net assets | | | | | | | | | | | | | | | | |
Beginning of period | | | | | | | 110,755,218 | | | | | | | | 86,124,579 | |
| | | | | | | | | | | | | | | | |
End of period | | | | | | $ | 98,099,493 | | | | | | | $ | 110,755,218 | |
| | | | | | | | | | | | | | | | |
Undistributed net investment income | | | | | | $ | 0 | | | | | | | $ | 0 | |
| | | | | | | | | | | | | | | | |
| 1. | After the close of business on July 16, 2010, existing shares of the Fund were renamed Class 2 shares. |
The accompanying notes are an integral part of these financial statements.
| | | | |
| 18 | | Wells Fargo Advantage VT Discovery Fund | | Financial Highlights |
(For a share outstanding throughout each period)
| | | | | | | | | | | | | | | | | | | | |
| | | Year Ended December 31, | |
| Class 21 | | 2011 | | | 2010 | | | 2009 | | | 2008 | | | 2007 | |
Net asset value, beginning of period | | $ | 21.28 | | | $ | 15.70 | | | $ | 11.19 | | | $ | 20.11 | | | $ | 16.44 | |
Net investment loss | | | (0.18 | ) | | | (0.13 | ) | | | (0.11 | ) | | | (0.11 | ) | | | (0.15 | ) |
Net realized and unrealized gains (losses) on investments | | | 0.27 | | | | 5.71 | | | | 4.62 | | | | (8.81 | ) | | | 3.82 | |
| | | | | | | | | | | | | | | | | | | | |
Total from investment operations | | | 0.09 | | | | 5.58 | | | | 4.51 | | | | (8.92 | ) | | | 3.67 | |
Net asset value, end of period | | | $21.37 | | | | $21.28 | | | | $15.70 | | | | $11.19 | | | | $20.11 | |
Total return | | | 0.42 | % | | | 35.54 | % | | | 40.30 | % | | | (44.36 | )% | | | 22.32 | % |
Ratios to average net assets (annualized) | | | | | | | | | | | | | | | | | | | | |
Gross expenses | | | 1.18 | % | | | 1.26 | % | | | 1.35 | % | | | 1.27 | % | | | 1.21 | % |
Net expenses | | | 1.15 | % | | | 1.15 | % | | | 1.15 | % | | | 1.15 | % | | | 1.15 | % |
Net investment loss | | | (0.75 | )% | | | (0.71 | )% | | | (0.61 | )% | | | (0.63 | )% | | | (0.72 | )% |
Supplemental data | | | | | | | | | | | | | | | | | | | | |
Portfolio turnover rate | | | 113 | % | | | 101 | % | | | 208 | % | | | 166 | % | | | 135 | % |
Net assets, end of period (000’s omitted) | | | $98,099 | | | | $110,755 | | | | $86,125 | | | | $113,149 | | | | $238,894 | |
| 1. | After the close of business on July 16, 2010, existing shares of the Fund were renamed Class 2 shares. |
The accompanying notes are an integral part of these financial statements.
| | | | | | |
| Notes to Financial Statements | | Wells Fargo Advantage VT Discovery Fund | | | 19 | |
1. ORGANIZATION
Wells Fargo Variable Trust (the “Trust”), a Delaware statutory trust organized on March 10, 1999, is an open-end management investment company registered under the Investment Company Act of 1940, as amended (the “1940 Act”). These financial statements report on Wells Fargo Advantage VT Discovery Fund (the “Fund”) which is a diversified series of the Trust.
2. SIGNIFICANT ACCOUNTING POLICIES
The following significant accounting policies, which are consistently followed in the preparation of the financial statements of the Fund, are in conformity with U.S. generally accepted accounting principles which require management to make estimates and assumptions that affect the reported amounts of assets and liabilities, disclosure of contingent assets and liabilities at the date of the financial statements, and the reported amounts of revenues and expenses during the reporting period. Actual results could differ from those estimates.
Securities valuation
Investments in equity securities are valued each business day as of the close of regular trading on the New York Stock Exchange, which is usually 4:00 p.m. (Eastern Time). Securities which are traded on a national or foreign securities exchange are valued at the last reported sales price, except that securities listed on The Nasdaq Stock Market, Inc. (“Nasdaq”) are valued at the Nasdaq Official Closing Price (“NOCP”), and if no NOCP is available, then at the last reported sales price. If no sales price is shown on the Nasdaq, the bid price will be used. In the absence of any sale of securities listed on the Nasdaq, and in the case of other securities (including U.S. Government obligations, but excluding debt securities maturing in 60 days or less), the price will be deemed “stale” and the valuations will be determined in accordance with the Fund’s Fair Value Procedures.
Fixed income securities with maturities exceeding 60 days are valued based on available evaluated prices received from an independent pricing service approved by the Board of Trustees which may utilize both transaction data and market information such as yield, prices of securities of comparable quality, coupon rate, maturity, type of issue, trading characteristics and other market data. If valuations are not available from the pricing service or values received are deemed not representative of market value, values will be obtained from a third party broker-dealer or determined based on the Fund’s Fair Value Procedures.
Debt securities of sufficient credit quality with original maturities of 60 days or less generally are valued at amortized cost which approximates fair value. The amortized cost method involves valuing a security at its cost, plus accretion of discount or minus amortization of premium over the period until maturity.
Investments in open-end mutual funds and non-registered investment companies are generally valued at net asset value.
Investments which are not valued using any of the methods discussed above, are valued at their fair value, as determined by procedures established in good faith and approved by the Board of Trustees.
Security loans
The Fund may lend its securities from time to time in order to earn additional income in the form of fees or interest on securities received as collateral or the investment of any cash received as collateral. The Fund continues to receive interest or dividends on the securities loaned. The Fund receives collateral in the form of cash or securities with a value at least equal to the value of the securities on loan. The value of the loaned securities is determined at the close of each business day and any additional required collateral is delivered to the Fund on the next business day. In a securities lending transaction, the net asset value of the Fund will be affected by an increase or decrease in the value of the securities loaned and by an increase or decrease in the value of the instrument in which collateral is invested. The amount of securities lending activity undertaken by the Fund fluctuates from time to time. In the event of default or bankruptcy by the borrower, the Fund may be prevented from recovering the loaned securities or gaining access to the collateral or may experience delays or costs in doing so. In addition, the investment of any cash collateral received may lose all or part of its value. The Fund has the right under the lending agreement to recover the securities from the borrower on demand.
The Fund lends its securities through an unaffiliated securities lending agent. Cash collateral received in connection with its securities lending transactions is invested in Wells Fargo Securities Lending Cash Investments, LLC (the “Cash Collateral Fund”). The Cash Collateral Fund is exempt from registration under Section 3(c)(7) of the 1940 Act and is managed by
| | | | |
| 20 | | Wells Fargo Advantage VT Discovery Fund | | Notes to Financial Statements |
Wells Fargo Funds Management LLC (“Funds Management”) and is sub-advised by Wells Capital Management Incorporated (“Wells Capital Management”). Funds Management receives an advisory fee starting at 0.05% and declining to 0.01% as the average daily net assets of the Cash Collateral Fund increase. All of the fees received by Funds Management are paid to Wells Capital Management for its services as sub-adviser. The Cash Collateral Fund seeks to provide a positive return compared to the daily Fed Funds Open rate by investing in high-quality, U.S. dollar-denominated short-term money market instruments. Cash Collateral Fund investments are fair valued based upon the amortized cost valuation technique. Income earned from investment in the Cash Collateral Fund is included in securities lending income on the Statement of Operations.
For Wells Fargo Advantage Funds that participated in securities lending activity prior to February 13, 2009, certain structured investment vehicles purchased in a joint account by the former securities lending agent defaulted or were impaired. Certain of the Wells Fargo Advantage Funds still hold ownership interest in these structured investment vehicles, which have since been restructured as pass-through securities. If the Fund holds an ownership interest in such pass-through securities, information regarding this ownership interest can be found in the Portfolio of Investments under the category “Other”.
Security transactions and income recognition
Securities transactions are recorded on a trade date basis. Realized gains or losses are reported on the basis of identified cost of securities delivered.
Dividend income is recognized on the ex-dividend date. Dividend income is recorded net of foreign taxes withheld where recovery of such taxes is not assured.
Distributions to shareholders
Distributions to shareholders from net investment income and net realized gains, if any, are recorded on the ex-dividend date. Such distributions are determined in conformity with income tax regulations, which may differ from generally accepted accounting principles.
The timing and character of distributions made during the period from net investment income or net realized gains may differ from their ultimate characterization for federal income tax purposes. To the extent that these differences are permanent in nature, such amounts are reclassified within the capital accounts based on their federal tax-basis treatment. Temporary differences do not require reclassifications. The primary permanent differences causing such reclassifications are due to net operating losses and recognition of partnership income. At December 31, 2011, as a result of permanent book-to-tax differences, the following reclassification adjustments were made on the Statement of Assets and Liabilities:
| | | | | | | | | | |
Paid-in
Capital | | | Undistributed
Net Investment
Loss | | | Accumulated
Net Realized
Losses on
Investments | |
| $ | (768,203 | ) | | $ | 812,220 | | | $ | (44,017 | ) |
Federal and other taxes
The Fund intends to continue to qualify as a regulated investment company by distributing substantially all of its investment company taxable income and any net realized capital gains (after reduction for capital loss carryforwards) sufficient to relieve it from all, or substantially all, federal income taxes. Accordingly, no provision for federal income taxes was required.
The Fund’s income and federal excise tax returns and all financial records supporting those returns for the prior three fiscal years are subject to examination by the federal and Delaware revenue authorities.
Under the recently enacted Regulated Investment Company Modernization Act of 2010, the Fund is permitted to carry forward capital losses incurred in taxable years which began after December 22, 2010 for an unlimited period. However, any losses incurred are required to be utilized prior to the losses incurred in pre-enactment taxable years. As a result of this ordering rule, pre-enactment capital loss carryforwards may be more likely to expire unused. Additionally, post-enactment capital losses that are carried forward will retain their character as either short-term or long-term capital losses rather than being considered all short-term as under previous law.
| | | | | | |
| Notes to Financial Statements | | Wells Fargo Advantage VT Discovery Fund | | | 21 | |
As of December 31, 2011, the Fund had net capital loss carryforwards, which are available to offset future net realized capital gains, in the amount of $4,806,267 expiring in 2017.
3. FAIR VALUATION MEASUREMENTS
Fair value measurements of investments are determined within a framework that has established a fair value hierarchy based upon the various data inputs utilized in determining the value of the Fund’s investments. The three-level hierarchy gives the highest priority to unadjusted quoted prices in active markets for identical assets or liabilities (Level 1) and the lowest priority to significant unobservable inputs (Level 3). The Fund’s investments are classified within the fair value hierarchy based on the lowest level of input that is significant to the fair value measurement. The inputs are summarized into three broad levels as follows:
| n | | Level 1 – quoted prices in active markets for identical securities |
| n | | Level 2 – other significant observable inputs (including quoted prices for similar securities, interest rates, prepayment speeds, credit risk, etc.) |
| n | | Level 3 – significant unobservable inputs (including the Fund’s own assumptions in determining the fair value of investments) |
The inputs or methodologies used for valuing securities are not necessarily an indication of the risk associated with investing in those securities.
As of December 31, 2011, the inputs used in valuing the Fund’s assets, which are carried at fair value, were as follows:
| | | | | | | | | | | | | | | | |
| Investments in Securities | | Quoted Prices
(Level 1) | | | Significant Other
Observable Inputs
(Level 2) | | | Significant
Unobservable Inputs
(Level 3) | | | Total | |
| | | | |
Equity securities | | | | | | | | | | | | | | | | |
Common stocks | | $ | 96,449,873 | | | $ | 0 | | | $ | 0 | | | $ | 96,449,873 | |
| | | | |
Other | | | 0 | | | | 0 | | | | 482,256 | | | | 482,256 | |
| | | | |
Short-term investments | | | | | | | | | | | | | | | | |
Investment companies | | | 1,383,165 | | | | 27,344,177 | | | | 0 | | | | 28,727,342 | |
| | | $ | 97,833,038 | | | $ | 27,344,177 | | | $ | 482,256 | | | $ | 125,659,471 | |
Further details on the major security types listed above can be found in the Portfolio of Investments.
Transfers in and transfers out are recognized at the end of the reporting period. For the year ended December 31, 2011, the Fund did not have any significant transfers into/out of Level 1 and Level 2.
The following is a reconciliation of assets in which significant unobservable inputs (Level 3) were used in determining fair value:
| | | | |
| | | Other | |
Balance as of December 31, 2010 | | $ | 794,517 | |
Accrued discounts (premiums) | | | 0 | |
Realized gains (losses) | | | 0 | |
Change in unrealized gains (losses) | | | (42,696 | ) |
Purchases | | | 0 | |
Sales | | | (269,565 | ) |
Transfers into Level 3 | | | 0 | |
Transfers out of Level 3 | | | 0 | |
Balance as of December 31, 2011 | | $ | 482,256 | |
Change in unrealized gains (losses)
relating to securities still held at December 31, 2011 | | $ | (171,839 | ) |
| | | | |
| 22 | | Wells Fargo Advantage VT Discovery Fund | | Notes to Financial Statements |
4. TRANSACTIONS WITH AFFILIATES AND OTHER EXPENSES
Advisory fee
The Trust has entered into an advisory contract with Funds Management, an indirect wholly owned subsidiary of Wells Fargo & Company (“Wells Fargo”). The adviser is responsible for implementing investment policies and guidelines and for supervising the sub-adviser, who is responsible for day-to-day portfolio management of the Fund.
Pursuant to the contract, Funds Management is entitled to receive an annual advisory fee starting at 0.70% and declining to 0.55% as the average daily net assets of the Fund increase. For the year ended December 31, 2011, the advisory fee was equivalent to an annual rate of 0.70% of the Fund’s average daily net assets.
Funds Management may retain the services of certain sub-advisers to provide daily portfolio management to the Fund. The fees related to sub-advisory services are borne directly by Funds Management and do not increase the overall fees paid by the Fund. Wells Capital Management, an affiliate of Funds Management, is the sub-adviser to the Fund and is entitled to receive a fee from Funds Management at an annual rate starting at 0.45% and declining to 0.35% as the average daily net assets of the Fund increase.
Administration and transfer agent fees
The Trust has entered into an administration agreement with Funds Management. Under this agreement, for providing administrative services, which includes paying fees and expenses for services provided by the transfer agent, sub-transfer agents, omnibus account servicers and record-keepers, Funds Management is entitled to receive from the Fund an annual fund level administration fee starting at 0.05% and declining to 0.03% as the average daily net assets of the Fund increase and for Class 2 shares, a class level administration fee of 0.08% of its average daily net assets.
Funds Management has contractually waived and/or reimbursed advisory and administration fees to the extent necessary to maintain certain net operating expense ratios for the Fund. Waiver of fees and/or reimbursement of expenses by Funds Management were made first from fund level expenses on a proportionate basis and then from class specific expenses.
Distribution fees
The Trust has adopted a Distribution Plan for Class 2 shares of the Fund pursuant to Rule 12b-1 under the 1940 Act. Distribution fees are charged to Class 2 shares and paid to Wells Fargo Funds Distributor, LLC, the principal underwriter, at an annual rate of 0.25% of its average daily net assets.
5. INVESTMENT PORTFOLIO TRANSACTIONS
Purchases and sales of investments, excluding U.S. Government obligations (if any) and short-term securities (securities with maturities of one year or less at purchase date), for the year ended December 31, 2011 were $121,272,749 and $134,327,960, respectively.
6. BANK BORROWINGS
The Trust and Wells Fargo Funds Trust (excluding the money market funds) are parties to a $150,000,000 revolving credit agreement with State Street Bank and Trust Company, whereby the Fund is permitted to use bank borrowings for temporary or emergency purposes, such as to fund shareholder redemption requests. Interest under the credit agreement is charged to the Fund based on a borrowing rate equal to the higher of the Federal Funds rate in effect on that day plus 1.25% or the overnight LIBOR rate in effect on that day plus 1.25%. In addition, under the credit agreement, the Fund pays an annual commitment fee equal to 0.10% of the unused balance, which is allocated pro rata. Prior to September 6, 2011, the revolving credit agreement was for $125,000,000 and the annual commitment fee paid by the Fund was 0.125% of the unused balance. For the year ended December 31, 2011, the Fund paid $216 in commitment fees.
For the year ended December 31, 2011, there were no borrowings by the Fund under the agreement.
7. DISTRIBUTIONS TO SHAREHOLDERS
As of December 31, 2011, the components of distributable earnings on a tax basis were as follows:
| | | | | | |
Unrealized
Gains (Losses) | | | Capital Loss
Carryforward | |
| $ | 3,221,623 | | | $ | (4,806,267 | ) |
| | | | | | |
| Notes to Financial Statements | | Wells Fargo Advantage VT Discovery Fund | | | 23 | |
8. INDEMNIFICATION
Under the Trust’s organizational documents, the officers and directors are indemnified against certain liabilities that may arise out of performance of their duties to the Trust. Additionally, in the normal course of business, the Trust may enter into contracts with service providers that contain a variety of indemnification clauses. The Trust’s maximum exposure under these arrangements is dependent on future claims that may be made against the Fund and, therefore, cannot be estimated.
9. NEW ACCOUNTING PRONOUNCEMENTS
In May 2011, the Financial Accounting Standards Board (“FASB”) issued Accounting Standards Update (“ASU”) No. 2011-04 “Amendments to Achieve Common Fair Value Measurement and Disclosure Requirements in U.S. GAAP and IFRSs”. ASU No. 2011-04 amends FASB ASC Topic 820, Fair Value Measurements and Disclosures, to establish common requirements for measuring fair value and for disclosing information about fair value measurements in accordance with GAAP. The ASU is effective prospectively for interim and annual periods beginning after December 15, 2011. Management expects that adoption of the ASU will result in additional disclosures in the financial statements, as applicable.
In April 2011, FASB issued ASU No. 2011-03 “Reconsideration of Effective Control for Repurchase Agreements”. ASU No. 2011-03 amends FASB ASC Topic 860, Transfers and Servicing, specifically the criteria required to determine whether a repurchase agreement (repo) and similar agreements should be accounted for as sales of financial assets or secured borrowings with commitments. ASU No. 2011-03 changes the assessment of effective control by focusing on the transferor’s contractual rights and obligations and removing the criterion to assess its ability to exercise those rights or honor those obligations. This could result in changes to the way entities account for certain transactions including repurchase agreements, mortgage dollar rolls and reverse repurchase agreements. The ASU will become effective on a prospective basis for new transfers and modifications to existing transactions as of the beginning of the first interim or annual period beginning on or after December 15, 2011. Management has evaluated the impact of adopting the ASU and expects no significant changes.
| | | | |
| 24 | | Wells Fargo Advantage VT Discovery Fund | | Report of Independent Registered Public Accounting Firm |
BOARD OF TRUSTEES AND SHAREHOLDERS OF WELLS FARGO VARIABLE TRUST:
We have audited the accompanying statement of assets and liabilities, including the portfolio of investments, of the Wells Fargo Advantage VT Discovery Fund (the “Fund”), one of the funds constituting the Wells Fargo Variable Trust, as of December 31, 2011, and the related statement of operations for the year then ended, statements of changes in net assets for each of the years in the two-year period then ended, and the financial highlights for each of the years in the five-year period then ended. These financial statements and financial highlights are the responsibility of the Fund’s management. Our responsibility is to express an opinion on these financial statements and financial highlights based on our audits.
We conducted our audits in accordance with the standards of the Public Company Accounting Oversight Board (United States). Those standards require that we plan and perform the audit to obtain reasonable assurance about whether the financial statements and financial highlights are free of material misstatement. An audit includes examining, on a test basis, evidence supporting the amounts and disclosures in the financial statements. Our procedures included confirmation of securities owned as of December 31, 2011, by correspondence with custodian and brokers, or by other appropriate auditing procedures. An audit also includes assessing the accounting principles used and significant estimates made by management, as well as evaluating the overall financial statement presentation. We believe that our audits provide a reasonable basis for our opinion.
In our opinion, the financial statements and financial highlights referred to above present fairly, in all material respects, the financial position of the Wells Fargo Advantage VT Discovery Fund as of December 31, 2011, the results of its operations for the year then ended, changes in its net assets for each of the years in the two-year period then ended, and the financial highlights for each of the years in the five-year period then ended, in conformity with U.S. generally accepted accounting principles.

Boston, Massachusetts
February 24, 2012
| | | | | | |
| Other Information (Unaudited) | | Wells Fargo Advantage VT Discovery Fund | | | 25 | |
PROXY VOTING INFORMATION
A description of the policies and procedures that the Fund uses to determine how to vote proxies relating to portfolio securities is available without charge, upon request, by calling 1-800-222-8222, visiting our Web site at www.wellsfargo.com/advantagefunds, or visiting the SEC Web site at www.sec.gov. Information regarding how the Fund voted proxies relating to portfolio securities during the most recent 12-month period ended June 30 is available without charge on the Fund’s Web site at www.wellsfargo.com/advantagefunds or by visiting the SEC Web site at www.sec.gov.
PORTFOLIO HOLDINGS INFORMATION
The complete portfolio holdings for the Fund are publicly available on the Fund’s Web site (www.wellsfargo.com/advantagefunds) on a monthly, 30-day or more delayed basis. In addition, top ten holdings information for the Fund is publicly available on the Fund’s Web site on a monthly, seven-day or more delayed basis. The Fund files its complete schedule of portfolio holdings with the SEC for the first and third quarters of each fiscal year on Form N-Q, which is available without charge by visiting the SEC Web site at www.sec.gov. In addition, the Fund’s Form N-Q may be reviewed and copied at the SEC’s Public Reference Room in Washington, DC, and at regional offices in New York City, at 233 Broadway, and in Chicago, at 175 West Jackson Boulevard, Suite 900. Information about the Public Reference Room may be obtained by calling 1-800-SEC-0330.
| | | | |
| 26 | | Wells Fargo Advantage VT Discovery Fund | | Other Information (Unaudited) |
BOARD OF TRUSTEES
The following table provides basic information about the Board of Trustees (the “Trustees”) of the Trust and Officers of the Trust. This table should be read in conjunction with the Prospectus and the Statement of Additional Information1 of the Fund. Each of the Trustees and Officers listed below acts in identical capacities for the Wells Fargo Advantage family of funds, which consists of 138 funds comprising the Wells Fargo Funds Trust, Wells Fargo Variable Trust, Wells Fargo Master Trust and four closed-end funds (collectively the “Fund Complex”). All of the Trustees are also Members of the Audit and Governance Committees of each Trust in the Fund Complex. The mailing address of each Trustee and Officer is 525 Market Street, 12th Floor, San Francisco, CA 94105. Each Trustee and Officer serves an indefinite term, however, each Trustee serves such term until reaching the mandatory retirement age established by the Trustees.
Independent Trustees
| | | | | | |
Name and Year of Birth | | Position Held and Length of Service | | Principal Occupations During Past Five Years | | Other Directorships During
Past Five Years |
Peter G. Gordon
(Born 1942) | | Trustee, since 1998; Chairman, since 2005 (Lead Trustee since 2001) | | Co-Founder, Retired Chairman, President and CEO of Crystal Geyser Water Company. Trustee Emeritus, Colby College | | Asset Allocation Trust |
Isaiah Harris, Jr.
(Born 1952) | | Trustee, since 2009 | | Retired. Prior thereto, President and CEO of BellSouth Advertising and Publishing Corp. from 2005 to 2007, President and CEO of BellSouth Enterprises from 2004 to 2005 and President of BellSouth Consumer Services from 2000 to 2003. Emeritus member of the Iowa State University Foundation Board of Governors. Emeritus Member of the Advisory Board of Iowa State University School of Business. Mr. Harris is a certified public accountant. | | CIGNA Corporation; Deluxe Corporation; Asset Allocation Trust |
Judith M. Johnson
(Born 1949) | | Trustee, since 2008 | | Retired. Prior thereto, Chief Executive Officer and Chief Investment Officer of Minneapolis Employees Retirement Fund from 1996 to 2008. Ms. Johnson is an attorney, certified public accountant and a certified managerial accountant. | | Asset Allocation Trust |
Leroy Keith, Jr.
(Born 1939) | | Trustee, since 2010 | | Chairman, Bloc Global Services (development and construction). Trustee of the Evergreen Funds from 1983 to 2010. Former Managing Director, Almanac Capital Management (commodities firm), former Partner, Stonington Partners, Inc. (private equity fund), former Director, Obagi Medical Products Co. and former Director, Lincoln Educational Services. | | Trustee, Virtus Fund Complex (consisting of 40 portfolios as of 12/31/11); Asset Allocation Trust |
David F. Larcker
(Born 1950) | | Trustee, since 2009 | | James Irvin Miller Professor of Accounting at the Graduate School of Business, Stanford University, Director of Corporate Governance Research Program and Senior Faculty of The Rock Center for Corporate Governance since 2006. From 2005 to 2008, Professor of Accounting at the Graduate School of Business, Stanford University. Prior thereto, Ernst & Young Professor of Accounting at The Wharton School, University of Pennsylvania from 1985 to 2005. | | Asset Allocation Trust |
Olivia S. Mitchell
(Born 1953) | | Trustee, since 2006 | | International Foundation of Employee Benefit Plans Professor, Wharton School of the University of Pennsylvania since 1993. Director of Wharton’s Pension Research Council and Boettner Center on Pensions & Retirement Research, and Research Associate at the National Bureau of Economic Research. Previously, Cornell University Professor from 1978 to 1993. | | Asset Allocation Trust |
| | | | | | |
| Other Information (Unaudited) | | Wells Fargo Advantage VT Discovery Fund | | | 27 | |
| | | | | | |
Name and Year of Birth | | Position Held and Length of Service | | Principal Occupations During Past Five Years | | Other Directorships During
Past Five Years |
Timothy J. Penny
(Born 1951) | | Trustee, since 1996 | | President and CEO of Southern Minnesota Initiative Foundation, a non-profit organization, since 2007 and Senior Fellow at the Humphrey Institute Policy Forum at the University of Minnesota since 1995. Member of the Board of Trustees of NorthStar Education Finance, Inc., a non-profit organization, since 2007. | | Asset Allocation Trust |
Michael S. Scofield
(Born 1943) | | Trustee, since 2010 | | Served on the Investment Company Institute’s Board of Governors and Executive Committee from 2008-2011 as well the Governing Council of the Independent Directors Council from 2006-2011 and the Independent Directors Council Executive Committee from 2008-2011. Chairman of the IDC from 2008-2010. Institutional Investor (Fund Directions) Trustee of Year in 2007. Trustee of the Evergreen Funds (and its predecessors) from 1984 to 2010. Chairman of the Evergreen Funds from 2000-2010. Former Trustee of the Mentor Funds. Retired Attorney, Law Offices of Michael S. Scofield and former Director and Chairman, Branded Media Corporation (multi-media branding company). | | Asset Allocation Trust |
Donald C. Willeke
(Born 1940) | | Trustee, since 1996 | | Principal of the law firm of Willeke & Daniels. General Counsel of the Minneapolis Employees Retirement Fund from 1984 until its consolidation into the Minnesota Public Employees Retirement Association on June 30, 2010. Director and Vice Chair of The Free Trust (non-profit corporation). Director of the American Chestnut Foundation (non-profit corporation). | | Asset Allocation Trust |
Officers
| | | | | | |
Name and Year of Birth | | Position Held and
Length of Service | | Principal Occupations During Past Five Years | | |
Karla M. Rabusch
(Born 1959) | | President, since 2003 | | Executive Vice President of Wells Fargo Bank, N.A. and President of Wells Fargo Funds Management, LLC since 2003. Senior Vice President and Chief Administrative Officer of Wells Fargo Funds Management, LLC from 2001 to 2003. | | |
C. David Messman
(Born 1960) | | Secretary, since 2000; Chief Legal Counsel, since 2003 | | Senior Vice President and Secretary of Wells Fargo Funds Management, LLC since 2001. Vice President and Managing Senior Counsel of Wells Fargo Bank, N.A. since 1996. | | |
Kasey Phillips
(Born 1970) | | Treasurer, since 2009 | | Senior Vice President of Wells Fargo Funds Management, LLC since 2009. Senior Vice President of Evergreen Investment Management Company, LLC from 2006 to 2010. Treasurer of the Evergreen Funds from 2005 to 2010. | | |
David Berardi
(Born 1975) | | Assistant Treasurer, since 2009 | | Vice President of Wells Fargo Funds Management, LLC since 2009. Vice President of Evergreen Investment Management Company, LLC from 2008 to 2010. Assistant Vice President of Evergreen Investment Services, Inc. from 2004 to 2008. Manager of Fund Reporting and Control for Evergreen Investment Management Company, LLC from 2004 to 2010. | | |
Jeremy DePalma
(Born 1974) | | Assistant Treasurer, since 2009 | | Senior Vice President of Wells Fargo Funds Management, LLC since 2009. Senior Vice President of Evergreen Investment Management Company, LLC from 2008 to 2010. Vice President, Evergreen Investment Services, Inc. from 2004 to 2007. Head of the Fund Reporting and Control Team within Fund Administration from 2005 to 2010. | | |
Debra Ann Early
(Born 1964) | | Chief Compliance Officer, since 2007 | | Chief Compliance Officer of Wells Fargo Funds Management, LLC since 2007. Chief Compliance Officer of Parnassus Investments from 2005 to 2007. Chief Financial Officer of Parnassus Investments from 2004 to 2007 and Senior Audit Manager of PricewaterhouseCoopers LLP from 1998 to 2004. | | |
| 1. | The Statement of Additional Information includes additional information about the Trustees and is available, without charge, upon request, by calling 1-800-222-8222 or by visiting the Web site at www.wellsfargo.com/advantagefunds. |
| | | | |
| 28 | | Wells Fargo Advantage VT Discovery Fund | | List of Abbreviations |
The following is a list of common abbreviations for terms and entities which may have appeared in this report.
| ACB | — Agricultural Credit Bank |
| ADR | — American Depository Receipt |
| ADS | — American Depository Shares |
| AGC-ICC | — Assured Guaranty Corporation - Insured Custody Certificates |
| AGM | — Assured Guaranty Municipal |
| AMBAC | — American Municipal Bond Assurance Corporation |
| AMT | — Alternative Minimum Tax |
| BAN | — Bond Anticipation Notes |
| BHAC | — Berkshire Hathaway Assurance Corporation |
| CAB | — Capital Appreciation Bond |
| CCAB | — Convertible Capital Appreciation Bond |
| CDA | — Community Development Authority |
| CDO | — Collateralized Debt Obligation |
| COP | — Certificate of Participation |
| DRIVER | — Derivative Inverse Tax-Exempt Receipts |
| DW&P | — Department of Water & Power |
| DWR | — Department of Water Resources |
| ECFA | — Educational & Cultural Facilities Authority |
| EDA | — Economic Development Authority |
| EDFA | — Economic Development Finance Authority |
| ETF | — Exchange-Traded Fund |
| FFCB | — Federal Farm Credit Bank |
| FGIC | — Financial Guaranty Insurance Corporation |
| FHA | — Federal Housing Authority |
| FHLB | — Federal Home Loan Bank |
| FHLMC | — Federal Home Loan Mortgage Corporation |
| FNMA | — Federal National Mortgage Association |
| GDR | — Global Depository Receipt |
| GNMA | — Government National Mortgage Association |
| HCFR | — Healthcare Facilities Revenue |
| HEFA | — Health & Educational Facilities Authority |
| HEFAR | — Higher Education Facilities Authority Revenue |
| HFA | — Housing Finance Authority |
| HFFA | — Health Facilities Financing Authority |
| IBC | — Insured Bond Certificate |
| IDA | — Industrial Development Authority |
| IDAG | — Industrial Development Agency |
| IDR | — Industrial Development Revenue |
| KRW | — Republic of Korea Won |
| LIBOR | — London Interbank Offered Rate |
| LLC | — Limited Liability Company |
| LLP | — Limited Liability Partnership |
| MBIA | — Municipal Bond Insurance Association |
| MFHR | — Multi-Family Housing Revenue |
| MUD | — Municipal Utility District |
| NATL-RE | — National Public Finance Guarantee Corporation |
| PCFA | — Pollution Control Finance Authority |
| PCR | — Pollution Control Revenue |
| PFA | — Public Finance Authority |
| PFFA | — Public Facilities Financing Authority |
| PFOTER | — Puttable Floating Option Tax-Exempt Receipts |
| plc | — Public Limited Company |
| PUTTER | — Puttable Tax-Exempt Receipts |
| R&D | — Research & Development |
| RDA | — Redevelopment Authority |
| RDFA | — Redevelopment Finance Authority |
| REIT | — Real Estate Investment Trust |
| ROC | — Reset Option Certificates |
| SAVRS | — Select Auction Variable Rate Securities |
| SBA | — Small Business Authority |
| SFHR | — Single Family Housing Revenue |
| SFMR | — Single Family Mortgage Revenue |
| SPDR | — Standard & Poor’s Depositary Receipts |
| TAN | — Tax Anticipation Notes |
| TIPS | — Treasury Inflation-Protected Securities |
| TRAN | — Tax Revenue Anticipation Notes |
| TCR | — Transferable Custody Receipts |
| TTFA | — Transportation Trust Fund Authority |
| TVA | — Tennessee Valley Authority |
| XLCA | — XL Capital Assurance |
This page is intentionally left blank.
This page is intentionally left blank.


FOR MORE INFORMATION
More information about Wells Fargo Advantage Funds is available free upon request. To obtain literature, please write, e-mail, visit the Fund’s Web site, or call:
Wells Fargo Advantage Funds
P.O. Box 8266
Boston, MA 02266-8266
E-mail: wfaf@wellsfargo.com
Web site: www.wellsfargo.com/advantagefunds
Individual investors: 1-800-222-8222
Retail investment professionals: 1-888-877-9275
Institutional investment professionals: 1-866-765-0778
This report and the financial statements contained herein are submitted for the general information of the shareholders of Wells Fargo Advantage Funds. If this report is used for promotional purposes, distribution of the report must be accompanied or preceded by a current prospectus. For a prospectus containing more complete information, including charges and expenses, call 1-800-222-8222 or visit the Fund’s Web site at www.wellsfargo.com/advantagefunds. Please consider the investment objectives, risks, charges, and expenses of the investment carefully before investing. This and other information about Wells Fargo Advantage Funds can be found in the current prospectus. Read the prospectus carefully before you invest or send money.
Wells Fargo Funds Management, LLC, a wholly owned subsidiary of Wells Fargo & Company, provides investment advisory and administrative services for Wells Fargo Advantage Funds. Other affiliates of Wells Fargo & Company provide subadvisory and other services for the Funds. The Funds are distributed by Wells Fargo Funds Distributor, LLC, Member FINRA/SIPC, an affiliate of Wells Fargo & Company.
NOT FDIC INSURED ¡ NO BANK GUARANTEE ¡ MAY LOSE VALUE
© 2012 Wells Fargo Funds Management, LLC. All rights reserved.
| | |
| | 207571 02-12 AVT1/AR147 12-11 |

Wells Fargo Advantage
VT Index Asset Allocation Fund

Annual Report
December 31, 2011
Reduce clutter. Save trees.
Sign up for electronic delivery of prospectuses and shareholder reports at www.wellsfargo.com/advantagedelivery
Contents
The views expressed and any forward-looking statements are as of December 31, 2011, unless otherwise noted, and are those of the Fund managers and/or Wells Fargo Funds Management, LLC. Discussions of individual securities, or the markets generally, or any Wells Fargo Advantage Fund are not intended as individual recommendations. Future events or results may vary significantly from those expressed in any forward-looking statements; the views expressed are subject to change at any time in response to changing circumstances in the market. Wells Fargo Funds Management, LLC, disclaims any obligation to publicly update or revise any views expressed or forward-looking statements.
NOT FDIC INSURED ¡ NO BANK GUARANTEE ¡ MAY LOSE VALUE

WELLS FARGO INVESTMENT HISTORY
| | |
| |
| 1932 | | Keystone creates one of the first mutual fund families. |
| |
| 1971 | | Wells Fargo & Company introduces one of the first institutional index funds. |
| |
| 1978 | | Wells Fargo applies Markowitz and Sharpe’s research on Modern Portfolio Theory to introduce one of the industry’s first Tactical Asset Allocation (TAA) models in institutional separately managed accounts. |
| |
| 1984 | | Wells Fargo Stagecoach Funds launches its first asset allocation fund. |
| |
| 1989 | | The Tactical Asset Allocation (TAA) Model is first applied to Wells Fargo’s asset allocation mutual funds. |
| |
| 1994 | | Wells Fargo introduces the LifePath Funds, one of the first suites of target date funds (now the Wells Fargo Advantage Dow Jones Target Date FundsSM ). |
| |
| 1996 | | Evergreen Investments and Keystone Funds merge. |
| |
| 1997 | | Wells Fargo launches Wells Fargo Advantage WealthBuilder PortfoliosSM, a fund-of-funds suite of products that includes the use of quantitative models to shift assets among investment styles. |
| |
| 1999 | | Norwest Advantage Funds and Stagecoach Funds are reorganized into Wells Fargo Funds after the merger of Norwest and Wells Fargo. |
| |
| 2002 | | Evergreen Retail and Evergreen Institutional companies form the umbrella asset management company, Evergreen Investments. |
| |
| 2005 | | The integration of Strong Funds with Wells Fargo Funds creates Wells Fargo Advantage Funds, resulting in one of the top 20 mutual fund companies in the United States. |
| |
| 2006 | | Wells Fargo Advantage Funds relaunches the target date product line as Wells Fargo Advantage Dow Jones Target Date Funds. |
| |
| 2010 | | The mergers and reorganizations of Evergreen and Wells Fargo Advantage mutual funds are completed, unifying the families under the brand of Wells Fargo Advantage Funds. |
Wells Fargo Advantage Funds®
Wells Fargo Advantage Funds skillfully guides institutions, financial advisors, and individuals through the investment terrain to help them reach their financial objectives. Everything we do on behalf of investors is backed by our unique combination of qualifications.
Strength
Our organization is built on the standards of integrity and service established by our parent company—Wells Fargo & Company—more than 150 years ago. And, because we’re part of a highly diversified financial enterprise, we offer the depth of resources to help investors succeed.
Expertise
Our multi-boutique model offers investors access to the independent thinking of premier investment managers that have been chosen for their time-tested strategies. While each team specializes in a specific investment strategy, collectively they provide investors a wide choice of distinct investment styles. Our dedication to investment excellence doesn’t end with our expertise in manager selection—risk management, analysis, and rigorous ongoing review seek to ensure each manager’s investment process remains consistent.
Partnership
Our collaborative approach is built around understanding the needs and goals of our clients. By adhering to core principles of sound judgment and steady guidance, we support you through every stage of the investment decision process.
Carefully consider a fund’s investment objectives, risks, charges, and expenses before investing. For a current prospectus and, if available, a summary prospectus, containing this and other information, visit wellsfargo.com/advantagefunds. Read it carefully before investing.
Wells Fargo Funds Management, LLC, a wholly owned subsidiary of Wells Fargo & Company, provides investment advisory and administrative services for Wells Fargo Advantage Funds®. Other affiliates of Wells Fargo & Company provide subadvisory and other services for the Funds. The Funds are distributed by Wells Fargo Funds Distributor, LLC, Member FINRA/SIPC, an affiliate of Wells Fargo & Company.
“Dow Jones®” and “Dow Jones Target Date IndexesSM” are service marks of Dow Jones Trademark Holdings, LLC (“Dow Jones”), have been licensed to CME Group Index Services LLC (“CME Indexes”) and have been sublicensed for use for certain purposes by Global Index Advisors, Inc, and Wells Fargo Funds Management, LLC. The Wells Fargo Advantage Dow Jones Target Date FundsSM based on the Dow Jones Target Date IndexesSM, are not sponsored, endorsed, sold or promoted by Dow Jones, CME Indexes or their respective affiliates and none of them makes any representation regarding the advisability of investing in such product(s).
NOT FDIC INSURED ¡ NO BANK GUARANTEE ¡ MAY LOSE VALUE
Not part of the annual report.
Wells Fargo Advantage Funds offers more than 110 mutual funds across a wide range of asset classes, representing over $216 billion in assets under management, as of December 31, 2011.
| | | | |
| Equity Funds | | | | |
Asia Pacific Fund | | Global Opportunities Fund | | Premier Large Company Growth Fund |
C&B Large Cap Value Fund | | Growth Fund | | Small Cap Opportunities Fund |
C&B Mid Cap Value Fund | | Health Care Fund | | Small Cap Value Fund |
Capital Growth Fund | | Index Fund | | Small Company Growth Fund |
Common Stock Fund | | International Equity Fund | | Small Company Value Fund |
Disciplined U.S. Core Fund | | International Value Fund | | Small/Mid Cap Core Fund |
Discovery Fund† | | Intrinsic Small Cap Value Fund | | Small/Mid Cap Value Fund |
Diversified Equity Fund | | Intrinsic Value Fund | | Social Sustainability Fund† |
Diversified International Fund | | Intrinsic World Equity Fund | | Special Mid Cap Value Fund |
Diversified Small Cap Fund | | Large Cap Core Fund | | Special Small Cap Value Fund |
Emerging Growth Fund | | Large Cap Growth Fund | | Specialized Technology Fund |
Emerging Markets Equity Fund | | Large Company Value Fund | | Strategic Large Cap Growth Fund |
Endeavor Select Fund† | | Omega Growth Fund | | Traditional Small Cap Growth Fund |
Enterprise Fund† | | Opportunity Fund† | | Utility and Telecommunications Fund |
Equity Value Fund | | Precious Metals Fund | | |
| Bond Funds | | | | |
Adjustable Rate Government Fund | | Inflation-Protected Bond Fund | | Short-Term Bond Fund |
California Limited-Term Tax-Free Fund | | Intermediate Tax/AMT-Free Fund | | Short-Term High Yield Bond Fund |
California Tax-Free Fund | | International Bond Fund | | Short-Term Municipal Bond Fund |
Colorado Tax-Free Fund | | Minnesota Tax-Free Fund | | Strategic Municipal Bond Fund |
Government Securities Fund | | Municipal Bond Fund | | Total Return Bond Fund |
High Income Fund | | North Carolina Tax-Free Fund | | Ultra Short-Term Income Fund |
High Yield Bond Fund | | Pennsylvania Tax-Free Fund | | Ultra Short-Term Municipal Income Fund |
Income Plus Fund | | Short Duration Government Bond Fund | | Wisconsin Tax-Free Fund |
| Asset Allocation Funds | | | | |
Asset Allocation Fund | | WealthBuilder Equity Portfolio† | | Target 2020 Fund† |
Conservative Allocation Fund | | WealthBuilder Growth Allocation Portfolio† | | Target 2025 Fund† |
Diversified Capital Builder Fund | | WealthBuilder Growth Balanced Portfolio† | | Target 2030 Fund† |
Diversified Income Builder Fund | | WealthBuilder Moderate Balanced Portfolio† | | Target 2035 Fund† |
Growth Balanced Fund | | WealthBuilder Tactical Equity Portfolio† | | Target 2040 Fund† |
Index Asset Allocation Fund | | Target Today Fund† | | Target 2045 Fund† |
Moderate Balanced Fund | | Target 2010 Fund† | | Target 2050 Fund† |
WealthBuilder Conservative Allocation Portfolio† | | Target 2015 Fund† | | Target 2055 Fund† |
| Money Market Funds | | | | |
100% Treasury Money Market Fund | | Heritage Money Market Fund† | | National Tax-Free Money Market Fund |
California Municipal Money Market Fund | | Money Market Fund | | Prime Investment Money Market Fund |
Cash Investment Money Market Fund | | Municipal Cash Management Money Market Fund | | Treasury Plus Money Market Fund |
Government Money Market Fund | | Municipal Money Market Fund | | |
| Variable Trust Funds1 | | | | |
VT Discovery Fund† | | VT Intrinsic Value Fund | | VT Small Cap Growth Fund |
VT Index Asset Allocation Fund | | VT Omega Growth Fund | | VT Small Cap Value Fund |
VT International Equity Fund | | VT Opportunity Fund† | | VT Total Return Bond Fund |
An investment in a money market fund is not insured or guaranteed by the Federal Deposit Insurance Corporation or any other government agency. Although the Wells Fargo Advantage Money Market Funds seek to preserve the value of your investment at $1.00 per share, it is possible to lose money by investing in a money market fund.
| 1. | The Variable Trust Funds are generally available only through insurance company variable contracts. |
| † | In this report, the Wells Fargo Advantage Discovery FundSM, Wells Fargo Advantage Endeavor Select FundSM, Wells Fargo Advantage Enterprise FundSM, Wells Fargo Advantage Opportunity FundSM, Wells Fargo Advantage Social Sustainability FundSM, Wells Fargo Advantage WealthBuilder Conservative Allocation PortfolioSM, Wells Fargo Advantage WealthBuilder Equity PortfolioSM, Wells Fargo Advantage WealthBuilder Growth Allocation PortfolioSM, Wells Fargo Advantage WealthBuilder Growth Balanced PortfolioSM, Wells Fargo Advantage WealthBuilder Moderate Balanced PortfolioSM, Wells Fargo Advantage WealthBuilder Tactical Equity PortfolioSM, Wells Fargo Advantage Dow Jones Target Today FundSM, Wells Fargo Advantage Dow Jones Target 2010 FundSM, Wells Fargo Advantage Dow Jones Target 2015 FundSM, Wells Fargo Advantage Dow Jones Target 2020 FundSM, Wells Fargo Advantage Dow Jones Target 2025 FundSM, Wells Fargo Advantage Dow Jones Target 2030 FundSM, Wells Fargo Advantage Dow Jones Target 2035 FundSM, Wells Fargo Advantage Dow Jones Target 2040 FundSM, Wells Fargo Advantage Dow Jones Target 2045 FundSM, Wells Fargo Advantage Dow Jones Target 2050 FundSM, Wells Fargo Advantage Dow Jones Target 2055 FundSM, Wells Fargo Advantage Heritage Money Market FundSM, Wells Fargo Advantage VT Discovery FundSM, and Wells Fargo Advantage VT Opportunity FundSM are referred to as the Discovery Fund, Endeavor Select Fund, Enterprise Fund, Opportunity Fund, Social Sustainability Fund, WealthBuilder Conservative Allocation Portfolio, WealthBuilder Equity Portfolio, WealthBuilder Growth Allocation Portfolio, WealthBuilder Growth Balanced Portfolio, WealthBuilder Moderate Balanced Portfolio, WealthBuilder Tactical Equity Portfolio, Target Today Fund, Target 2010 Fund, Target 2015 Fund, Target 2020 Fund, Target 2025 Fund, Target 2030 Fund, Target 2035 Fund, Target 2040 Fund, Target 2045 Fund, Target 2050 Fund, Target 2055 Fund, Heritage Money Market Fund, VT Discovery Fund, and VT Opportunity Fund, respectively. |
Not part of the annual report.
| | | | |
| 2 | | Wells Fargo Advantage VT Index Asset Allocation Fund | | Letter to Shareholders |

Karla M. Rabusch,
President
Wells Fargo Advantage Funds
The U.S. economic recovery that began in mid-2009 progressed throughout the 12-month period, yet the rate of growth remained subpar compared with most previous recovery cycles.
Dear Valued Shareholder:
We’re pleased to offer you this annual report for the Wells Fargo Advantage VT Index Asset Allocation Fund for the 12-month period that ended December 31, 2011. For the full 12-month period, most of the major domestic equity indexes posted either modest gains or relatively mild losses. However, the market’s 12-month return figures mask the uneven path that it traced throughout the year as investors had to contend with a variety of global and domestic headwinds. Whatever the future holds, we continue to believe that most investors can benefit from adhering to a well-diversified investment strategy. Over the long-term, such a strategy may allow you to balance risks and opportunities as you pursue your financial goals in a dynamic market landscape.
The economic recovery gained traction as the year progressed.
The U.S. economic recovery that began in mid-2009 progressed throughout the 12-month period, yet the rate of growth remained subpar compared with most previous recovery cycles.
2011 opened on a note of mounting optimism regarding the strength of the recovery, yet a batch of disappointing economic data in the spring and summer cast renewed doubts on the sustainability of the recovery. In September, it was reported that U.S. gross domestic product (GDP) grew at a mere 1.3% annual rate in the second quarter of 2011, following anemic growth at an annual rate of 0.4% in the first quarter. According to the December estimate, GDP growth accelerated to an annual rate of 1.8% in the third quarter, reigniting hopes for a sustainable recovery. Those hopes were buoyed by widespread anticipation of even stronger GDP growth in the fourth quarter. By the end of the 12-month period, few economists believed that the U.S. economy was in danger of sliding back into recession, although many expected a sluggish growth environment in 2012.
The struggling housing and labor markets slowed growth.
As has been the case throughout the recovery, the housing and labor markets continued to restrain economic momentum during 2011.
The beleaguered housing market has arguably exerted the biggest drag on growth. Despite intermittent signs of improvement, ongoing weakness in sales of both new and existing homes has put considerable downward pressure on prices. On the other hand, the labor market took a decided turn for the better in the latter half of the year: initial unemployment claims have eased in recent months, and the private sector has been steadily adding jobs. The pace of hiring, while not brisk, was sufficient to push the U.S. unemployment rate down to 8.5% as of December 2011—still well above its historical average, but at its lowest level since February 2009. Many observers expect the unemployment rate to decline further in 2012, which could act as a tailwind for consumer spending—widely viewed as one of the keys to long-term economic growth.
The Federal Reserve announced that it will keep rates low until 2013.
Consumers have already demonstrated some resilience in their spending—even in the face of higher energy costs. Oil prices skyrocketed in early 2011 before retreating later in the year, only to spike again during the fourth quarter. Yet “core” inflation, which excludes volatile energy and food prices, remained fairly benign throughout the year.
| | | | | | |
| Letter to Shareholders | | Wells Fargo Advantage VT Index Asset Allocation Fund | | | 3 | |
With inflation in check, the Federal Reserve (Fed) held its target range for the federal funds rate—a proxy for short-term interest rates—steady at 0% to 0.25%. Following its August 9 meeting, the Federal Open Market Committee (FOMC) issued a statement explaining that economic conditions were likely to warrant exceptionally low levels for the federal funds rate through at least mid-2013. In addition, the Fed carried out its second round of quantitative easing (QE2) in an effort to promote a more robust economic expansion. The stimulus program was completed as scheduled in June 2011. In September, the Fed launched yet another stimulus program—dubbed “Operation Twist”—that is designed to keep intermediate- and longer-term yields relatively low. The goal with keeping longer-term rates low is to encourage lending activity to spark business investments and home purchases, which, in turn, may provide support for a more sustainable economic recovery.
Market volatility was a dominant theme throughout most of 2011.
Despite pockets of turbulence sparked by the natural disasters in Japan and geopolitical turmoil in North Africa and the Middle East, the U.S. equity market performed very well from January through April of 2011. Some upbeat economic news, better-than-expected corporate profits, and investor enthusiasm about QE2 were among the catalysts for the market’s four-month advance.
In May and June, the market climate shifted to one of anxiety over the increasingly fragile state of the U.S. and global economies. As spring gave way to summer, investors not only worried that the U.S. might be on the brink of recession, they also feared that Europe’s sovereign debt problems could spiral out of control if a Greek default triggered financial contagion across the continent. In July and August, investor sentiment was further undermined by partisan wrangling over the federal debt ceiling and the Standard & Poor’s downgrade of the U.S. credit rating. The barrage of unsettling headlines led to heightened market volatility and sharply falling stock prices in the third quarter of 2011. Although volatility persisted into the fourth quarter, the market was able to rebound amid improved economic data and hopes for a resolution to the European crisis.
For the full 12-month period, the S&P 500 Index1 of large-cap stocks achieved a total return of 2.1%. The Russell Midcap® Index2 and the Russell 2000® Index3 of small-cap stocks lost 1.6% and 4.2%, respectively. International stocks fared worse than their U.S. counterparts, with the MSCI EAFE Index4 shedding 14.8%.
Economic outlook shifts and European uncertainty swayed bond investors.
Throughout 2011, the bond markets were roiled by changes to the global economic outlook and the ongoing fiscal challenges facing many countries in the
| 1. | The S&P 500 Index consists of 500 stocks chosen for market size, liquidity, and industry group representation. It is a market-value weighted index with each stock’s weight in the index proportionate to its market value. You cannot invest directly in an index. |
| 2. | The Russell Midcap® Index measures the performance of the 800 smallest companies in the Russell 1000 Index, which represent approximately 25% of the total market capitalization of the Russell 1000® Index. You cannot invest directly in an index. |
| 3. | The Russell 2000® Index measures the performance of the 2,000 smallest companies in the Russell 3000® Index, which represents approximately 8% of the total market capitalization of the Russell 3000 Index. You cannot invest directly in an index. |
| 4. | The Morgan Stanley Capital International Europe, Australasia, and Far East (“MSCI EAFE”) Stock Index is an unmanaged group of securities widely regarded by investors to be representations of the stock markets of Europe, Australasia, and the Far East. You cannot invest directly in an index. Source: MSCI. MSCI makes no express or implied warranties or representations and shall have no liability whatsoever with respect to any MSCI data contained herein. The MSCI data may not be further redistributed or used as a basis for other indexes or any securities or financial products. This report is not approved, reviewed or produced by MSCI. |
| | | | |
| 4 | | Wells Fargo Advantage VT Index Asset Allocation Fund | | Letter to Shareholders |
The market turmoil of 2011 and an uncertain outlook going forward have left many investors questioning their resolve—and their investments. Yet, it is precisely at such times that the market may present opportunities—as well as challenges—for prudent investors.
eurozone. In the spring and summer, U.S. economic activity slowed, prompting forecasts of a double-dip recession. Then, in the fall, many of the most closely watched indicators, such as GDP growth and the unemployment rate, improved, and the talk of recession ceased. Nonetheless, the European markets continued to struggle with managing the risk of contagion from countries such as Greece teetering on financial collapse.
This changing and challenging landscape only heightened volatility and investor risk aversion, which subsided somewhat toward the end of 2011 as the U.S. economic outlook gained some momentum and the European credit crisis appeared to move closer to containment within the region.
The performance across the different bond markets varied widely, depending on the level of volatility and risk aversion in the market, with Treasuries rallying during the spring and summer when the U.S. economy appeared to be slipping backward and high-yield performing best as both the economy and Europe seemed to regain their footing at year-end.
For the full 12-month period, the Barclays Capital U.S. Aggregate Bond Index5, representing the universe of investment-grade bonds, posted a total return of 7.84%, while the Barclays Capital U.S. Corporate High Yield Bond Index6 added 4.98%. By comparison, the Barclays Capital U.S. Treasury Index7. returned 9.81%, with maturities of 20 years and longer performing best by returning 33.84% for the year.
Recent events have not altered our message to shareholders.
The market turmoil of 2011 and an uncertain outlook going forward have left many investors questioning their resolve—and their investments. Yet, it is precisely at such times that the market may present opportunities—as well as challenges—for prudent investors. Bear in mind that many investors who indiscriminately sold their equity investments during the severe market downturn of 2008 to 2009 missed out on the impressive two-year rally that followed. In our opinion, the lesson to be learned from these dramatic market events is that, for many investors, simply building and maintaining a well-diversified8 investment plan is the best long-term strategy.
| 5. | The Barclays Capital U.S. Aggregate Bond Index is composed of the Barclays Capital Government/Credit Index and the Mortgage-Backed Securities Index and includes U.S. Treasury issues, agency issues, corporate bond issues, and mortgage-backed securities. You cannot invest directly in an index. |
| 6. | The Barclays Capital U.S. Corporate High Yield Bond Index is an unmanaged, U.S. dollar denominated, nonconvertible, non-investment grade debt index. The Index consists of domestic and corporate bonds rated Ba and below with a minimum outstanding amount of $150 million. You cannot invest directly in an index. |
| 7. | The Barclays Capital U.S. Treasury Index is an index of U.S. Treasury securities. You cannot invest directly in an index |
| 8. | Diversification does not assure or guarantee better performance and cannot eliminate the risk of investment losses. |
| | | | | | |
| Letter to Shareholders | | Wells Fargo Advantage VT Index Asset Allocation Fund | | | 5 | |
Thank you for choosing to invest with Wells Fargo Advantage Funds. We appreciate your confidence in us and remain committed to helping you meet your financial needs. For current information about your fund investments, contact your investment professional, visit our website at www.wellsfargo.com/advantagefunds, or call us directly at 1-800-222-8222. We are available 24 hours a day, 7 days a week.
Sincerely,

Karla M. Rabusch
President
Wells Fargo Advantage Funds
| | | | |
| 6 | | Wells Fargo Advantage VT Index Asset Allocation Fund | | Performance Highlights (Unaudited) |
INVESTMENT OBJECTIVE
The Fund seeks long-term total return, consisting of capital appreciation and current income.
ADVISER
Wells Fargo Funds Management, LLC
SUB-ADVISER
Wells Capital Management Incorporated
PORTFOLIO MANAGERS
Gregory T. Genung, CFA, CAIA
Jeffrey P. Mellas, CAIA
FUND INCEPTION
April 15, 1994
| | | | |
| 12 MONTH TOTAL RETURN AS OF DECEMBER 31, 2011 | |
Class 2 | | | 6.48% | |
Index Asset Allocation Composite Index1 | | | 15.06% | |
S&P 500 Index2 | | | 2.11% | |
Barclays Capital U.S. Treasury 20+ Year Index3 | | | 33.84% | |
Figures quoted represent past performance, which is no guarantee of future results and do not reflect the deduction of taxes that a shareholder may pay on fund distributions or the redemption of fund shares. Investment return and principal value of an investment will fluctuate so that an investor’s shares, when redeemed, may be worth more or less than their original cost. Current performance may be lower or higher than the performance data quoted and assumes the reinvestment of dividends and capital gains. Current month-end performance is available by calling 1-866-765-0778. Performance figures of the Fund do not reflect fees charged pursuant to the terms of variable life insurance policies and variable annuity contracts.
Index returns do not include transaction costs associated with buying and selling securities, any mutual fund fees or expenses or any taxes. It is not possible to invest directly in an index.
The Adviser has committed through April 30, 2012 to waive fees and/or reimburse expenses to the extent necessary to cap the Fund’s Total Annual Fund Operating Expenses After Fee Waiver, excluding certain other expenses at 1.00% for Class 2. The Fund’s gross and net expense ratios are 1.08% and 1.00%, respectively, for Class 2 shares. Without these reductions, the Fund’s returns would have been lower.
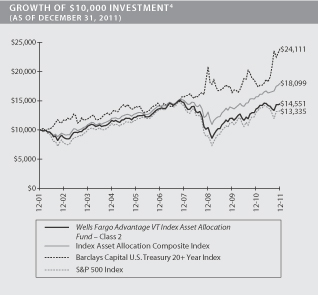
| 1. | The Index Asset Allocation Composite Index is weighted 60% in the S&P 500 Index and 40% in the Barclays Capital U.S. Treasury 20+ Year Index. You cannot invest directly in an index. |
| 2. | The S&P 500 Index consists of 500 stocks chosen for market size, liquidity, and industry group representation. It is a market valueweighted index with each stock’s weight in the index proportionate to its market value. You cannot invest directly in an index. |
| 3. | The Barclays Capital U.S. Treasury 20+ Year Index is an unmanaged index composed of securities in the U.S. Treasury Index with maturities of 20 years or greater. You cannot invest directly in an index. |
| 4. | The chart compares the performance of the Wells Fargo Advantage VT Index Asset Allocation Fund Class 2 for the most recent ten years of the Fund with the S&P 500 Index, the Barclays Capital U.S. Treasury 20+ Year Index, and the Index Asset Allocation Composite Index. The chart assumes a hypothetical $10,000 investment and reflects all operating expenses of the Fund. Performance figures of the Fund do not reflect fees charged pursuant to the terms of variable life insurance policies and variable annuity contracts. |
| | | | | | |
| Performance Highlights (Unaudited) | | Wells Fargo Advantage VT Index Asset Allocation Fund | | | 7 | |
MANAGER’S DISCUSSION
Fund highlights
| n | | The Fund underperformed its benchmark, the Index Asset Allocation Composite Index, for the 12-month period that ended December 31, 2011. While the Fund outperformed the S&P 500, it underperformed the Barclays Capital U.S. Treasury 20+ Year Index, as longer-term Treasuries rallied significantly over the year. |
| n | | At the end of the period, the Fund was at a maximum equity overweighting, with an effective target allocation of 85% stocks and 15% bonds. |
| n | | Because stocks underperformed bonds over the period, Fund performance was hindered by its equity overweight. |
| | | | |
TEN LARGEST HOLDINGS5
(AS OF DECEMBER 31, 2011) | |
US Treasury Bond, 4.38%, 05/15/2041 | | | 3.23% | |
US Treasury Bond, 4.38%, 05/15/2040 | | | 3.02% | |
US Treasury Bond, 4.25%, 11/11/2040 | | | 2.99% | |
US Treasury Bond, 3.75%, 08/15/2041 | | | 2.99% | |
US Treasury Bond, 4.75%, 02/15/2041 | | | 2.97% | |
US Treasury Bond, 4.38%, 11/15/2039 | | | 2.91% | |
US Treasury Bond, 4.63%, 02/15/2040 | | | 2.90% | |
US Treasury Bond, 3.88%, 08/15/2040 | | | 2.89% | |
US Treasury Bond, 4.50%, 08/15/2039 | | | 2.23% | |
US Treasury Bond, 4.25%, 05/15/2039 | | | 2.11% | |
While the total return of the S&P 500 was positive over the 12-month period, the year was characterized more by volatility than performance. At one point, the S&P 500 Index fell 17% in a four-week period, only to close the year flat on a price appreciation basis. Investors who increased their portfolio weights to equities during upward swings within the markets had to rely on timing to produce large gains. However, those who employed a buy-and-hold strategy were able to capture the full total return of 2.11%, including dividends, that was posted by the S&P 500. By comparison, U.S. bonds benefited from the “risk on/risk off” environment as investors flocked from equities during times of heightened instability.
There were a number of reasons for the extraordinary volatility, both domestically and abroad: continued decline of the U.S. housing market, lackluster global economic growth, and stubbornly high domestic unemployment, to name a few. In August, the credit rating on U.S. government debt was downgraded one notch from its AAA6 rating by Standard & Poor’s, which cited the current budget deficit and political inability to find debt-reduction measures as reasons for the move. The U.S. rating was not the only sovereign debt rating to be jeopardized, as increasing strain fell on the European Union to deal with the fiscal standing of Greece, Italy, France, and Spain. Political unrest rose in the Middle East as governments battled residents for stability in Tunisia, Egypt, Yemen, and Libya. Global equities were also weighed down by challenges from the major earthquake and tsunami in Japan, which slowed supply chains and ultimately hurt sales for companies around the world.
In the end, seven of the 10 sectors in the S&P 500 Index contributed positively to the index’s return, with the perceived defensive sectors of utilities, consumer staples, and health care leading the way. The political turmoil overseas and market volatility drew investors toward the U.S. dollar and U.S. Treasury products, which drove domestic interest rates lower across the curve. For the year, the S&P 500 Index returned 2.11%, and the Barclays Capital U.S. Treasury 20+ Year Index returned 33.84%.
The Fund underpaced the benchmark, the Index Asset Allocation Composite Index, for the 12-month period primarily due to the Fund’s overweight in equities which underperformed Treasuries during the year. Because the Fund is an indexed portfolio, our goal is to have the Fund’s performance closely track that of the benchmark.
| 5. | The ten largest holdings are calculated based on the value of the securities divided by total net assets of the Fund. Holdings are subject to change and may have changed since the date specified. |
| 6. | The ratings indicated are from Standard & Poor’s. Credit-quality ratings apply to underlying holdings of the fund and not the fund itself. Standard and Poor’s rates the creditworthiness of bonds, ranging from AAA (highest) to D (lowest). Ratings from A to CCC may be modified by the addition of a plus (+) or minus (-) sign to show relative standing within the rating categories. |
| | | | |
| 8 | | Wells Fargo Advantage VT Index Asset Allocation Fund | | Performance Highlights (Unaudited) |
|
SECTOR DISTRIBUTION7
(AS OF DECEMBER 31, 2011) |
|
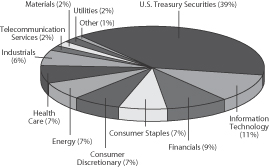 |
|
NEUTRAL ALLOCATION8
(AS OF DECEMBER 31, 2011) |
|
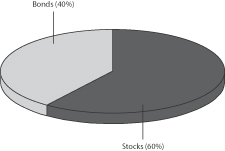 |
|
CURRENT TARGET ALLOCATION8
(AS OF DECEMBER 31, 2011) |
|
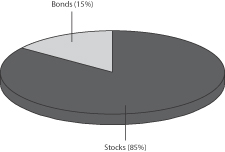 |
In the underlying portfolio, the Fund invests a neutral allocation of 60% stocks and 40% bonds and employs futures contracts to tactically make adjustments to that allocation. The Tactical Asset Allocation (TAA) Model shifted to its maximum overweight equity position in late 2007, and we maintained that effective allocation of 85% stocks and 15% bonds throughout 2011. The underperformance of stocks relative to bonds detracted from the Fund’s performance when compared with the neutral benchmark allocation.
There were no changes to the Fund’s tactical allocation.
While there were no changes to the Fund’s tactical allocation, there were changes to the underlying indexes, and we made those adjustments congruently with the S&P 500 Index and the Barclays Capital U.S. Treasury 20+ Year Index throughout the year.
The TAA Model continues to favor stocks relative to bonds.
We believe that the U.S. economy will continue to recover. While the European economic situation has yet to be resolved, the issues have been acknowledged. Job creation should progress as companies re-engage under the assumption that the economy advances, which, in turn, should lead to higher consumer and investor confidence. Corporate earnings were strong again throughout 2011, and currently the S&P 500 Index earnings yield greatly exceeds the yield on the 10-year U.S. Treasury note. Both of these metrics have historically pointed positively toward stocks. We see higher risk of a potential sell-off in bonds, given the low-yield environment and the inverse relationship of fixed-coupon bond prices to interest rates. With this backdrop, we plan to remain overweight in stocks until such time that we see relative valuation between stocks and bonds return to more normal levels.
| | 7. | Sector distribution is subject to change and is calculated based on the total long-term investments of the Fund. |
| | 8. | Portfolio allocations are subject to change. Cash and cash equivalents are not reflected in the calculations of the portfolio allocations. Neutral allocation is the target allocation of the Fund as stated in the Fund’s prospectus. Current target allocation is the current allocation of the Fund based on our Tactical Asset Allocation Model as of the date specified and is subject to change. |
| | | | | | |
| Performance Highlights (Unaudited) | | Wells Fargo Advantage VT Index Asset Allocation Fund | | | 9 | |
AVERAGE ANNUAL TOTAL RETURN (%) (AS OF DECEMBER 31, 2011)
| | | | | | | | | | | | | | | | | | | | | | | | | | | | |
| | | | | | | | | Expense Ratios9 | |
| | | Inception Date | | | 6 Months* | | | 1 Year | | | 5 Year | | | 10 Year | | | Gross | | | Net10 | |
Class 2 | | | 04/15/1994 | | | | 1.93 | | | | 6.48 | | | | 1.22 | | | | 3.82 | | | | 1.08% | | | | 1.00% | |
Index Asset Allocation Composite Index | | | | | | | 10.26 | | | | 15.06 | | | | 5.15 | | | | 6.11 | | | | | | | | | |
S&P 500 Index | | | | | | | (3.69 | ) | | | 2.11 | | | | (0.25 | ) | | | 2.92 | | | | | | | | | |
Barclays Capital U.S. Treasury 20+ Year Index | | | | | | | 31.57 | | | | 33.84 | | | | 11.13 | | | | 9.20 | | | | | | | | | |
| * | Returns for periods of less than one year are not annualized. |
Figures quoted represent past performance, which is no guarantee of future results and do not reflect the deduction of taxes that a shareholder may pay on fund distributions or the redemption of fund shares. Investment return and principal value of an investment will fluctuate so that an investor’s shares, when redeemed, may be worth more or less than their original cost. Current performance may be lower or higher than the performance data quoted and assumes the reinvestment of dividends and capital gains. Current month-end performance is available by calling 1-866-765-0778. Performance figures of the Fund do not reflect fees charged pursuant to the terms of variable life insurance policies and variable annuity contracts.
Index returns do not include transaction costs associated with buying and selling securities, any mutual fund fees or expenses or any taxes. It is not possible to invest directly in an index.
Balanced funds may invest in stocks and bonds. Stock values fluctuate in response to the activities of individual companies and general market and economic conditions. Bond values fluctuate in response to the financial condition of individual issuers, general market and economic conditions, and changes in interest rates. In general, when interest rates rise, bond values fall and investors may lose principal value. The use of derivatives may reduce returns and/or increase volatility. Consult the Fund’s prospectus for additional information on these and other risks.
Please refer to the prospectus provided by your participating insurance company for detailed information describing the separate accounts for information regarding surrender charges, mortality and expense risk fees and other charges that may be assessed by the participating insurance companies.
| 9. | Reflects the expense ratios as stated in the most recent prospectus. |
| 10. | The Adviser has committed through April 30, 2012 to waive fees and/or reimburse expenses to the extent necessary to cap the Fund’s Total Annual Fund Operating Expenses After Fee Waiver, excluding certain expenses at the amounts shown above. Without this cap, the Fund’s returns would have been lower. |
| | | | |
| 10 | | Wells Fargo Advantage VT Index Asset Allocation Fund | | Fund Expenses (Unaudited) |
As a shareholder of the Fund, you incur ongoing costs, including management fees; distribution (12b-1) fees; and other Fund expenses. This example is intended to help you understand your ongoing costs (in dollars) of investing in the Fund and to compare these costs with the ongoing costs of investing in other mutual funds.
The example is based on an investment of $1,000 invested at the beginning of the six-month period and held for the entire period from July 1, 2011 to December 31, 2011.
Actual Expenses
The “Actual” line of the table below provides information about actual account values and actual expenses. You may use the information in this line, together with the amount you invested, to estimate the expenses that you paid over the period. Simply divide your account value by $1,000 (for example, an $8,600 account value divided by $1,000 = 8.6), then multiply the result by the number in the “Actual” line under the heading entitled “Expenses Paid During Period” for your applicable class of shares to estimate the expenses you paid on your account during this period.
Hypothetical Example for Comparison Purposes
The “Hypothetical” line of the table below provides information about hypothetical account values and hypothetical expenses based on the Fund’s actual expense ratio and an assumed rate of return of 5% per year before expenses, which is not the Fund’s actual return. The hypothetical account values and expenses may not be used to estimate the actual ending account balance or expenses you paid for the period. You may use this information to compare the ongoing costs of investing in the Fund and other funds. To do so, compare this 5% hypothetical example with the 5% hypothetical examples that appear in the shareholder reports of the other funds.
Please note that the expenses shown in the table are meant to highlight your ongoing costs only and do not reflect any separate account charges assessed by participating insurance companies. Therefore, the “Hypothetical” line of the table is useful in comparing ongoing costs only, and will not help you determine the relative total costs of owning different funds. In addition, if these separate account charges assessed by participating insurance companies were included, your costs would have been higher.
| | | | | | | | | | | | | | | | |
| | | Beginning
Account Value
07-01-2011 | | | Ending
Account Value
12-31-2011 | | | Expenses
Paid During
the Period1 | | | Net Annual
Expense Ratio | |
Class 2 | | | | | | | | | | | | | | | | |
Actual | | $ | 1,000.00 | | | $ | 1,019.32 | | | $ | 5.09 | | | | 1.00 | % |
Hypothetical (5% return before expenses) | | $ | 1,000.00 | | | $ | 1,020.16 | | | $ | 5.09 | | | | 1.00 | % |
| 1. | Expenses paid is equal to the annualized expense ratio multiplied by the average account value over the period, multiplied by the number of days in the most recent fiscal half-year divided by the number of days in the fiscal year (to reflect the one-half year period). |
| | | | | | |
| Portfolio of Investments—December 31, 2011 | | Wells Fargo Advantage VT Index Asset Allocation Fund | | | 11 | |
| | | | | | | | | | | | |
| Security Name | | | | | | Shares | | | Value | |
| | | | | | | | | | | | |
| | | | |
Common Stocks: 56.97% | | | | | | | | | | | | |
| | | | |
Consumer Discretionary: 6.16% | | | | | | | | | | | | |
| | | | |
| Auto Components: 0.16% | | | | | | | | | | | | |
BorgWarner Incorporated† | | | | | | | 490 | | | $ | 31,233 | |
Johnson Controls Incorporated | | | | | | | 3,043 | | | | 95,124 | |
The Goodyear Tire & Rubber Company† | | | | | | | 1,092 | | | | 15,474 | |
| | | | |
| | | | | | | | | | | 141,831 | |
| | | | | | | | | | | | |
| | | |
| Automobiles: 0.25% | | | | | | | | | | |
Ford Motor Company | | | | | | | 16,997 | | | | 182,888 | |
Harley-Davidson Incorporated« | | | | | | | 1,039 | | | | 40,386 | |
| | | | |
| | | | | | | | | | | 223,274 | |
| | | | | | | | | | | | |
| | | |
| Distributors: 0.05% | | | | | | | | | | |
Genuine Parts Company | | | | | | | 696 | | | | 42,595 | |
| | | | | | | | | | | | |
| | | |
| Diversified Consumer Services: 0.07% | | | | | | | | | | |
Apollo Group Incorporated Class A† | | | | | | | 519 | | | | 27,959 | |
DeVry Incorporated | | | | | | | 270 | | | | 10,384 | |
H&R Block Incorporated | | | | | | | 1,310 | | | | 21,392 | |
| | | | |
| | | | | | | | | | | 59,735 | |
| | | | | | | | | | | | |
| | | |
| Hotels, Restaurants & Leisure: 1.16% | | | | | | | | | | |
Carnival Corporation | | | | | | | 2,024 | | | | 66,063 | |
Chipotle Mexican Grill Incorporated† | | | | | | | 139 | | | | 46,946 | |
Darden Restaurants Incorporated | | | | | | | 589 | | | | 26,847 | |
International Game Technology | | | | | | | 1,331 | | | | 22,893 | |
Marriott International Incorporated Class A« | | | | | | | 1,199 | | | | 34,975 | |
McDonald’s Corporation | | | | | | | 4,576 | | | | 459,110 | |
Starbucks Corporation« | | | | | | | 3,334 | | | | 153,397 | |
Starwood Hotels & Resorts Worldwide Incorporated | | | | | | | 859 | | | | 41,206 | |
Wyndham Worldwide Corporation | | | | | | | 682 | | | | 25,800 | |
Wynn Resorts Limited« | | | | | | | 354 | | | | 39,113 | |
Yum! Brands Incorporated | | | | | | | 2,059 | | | | 121,502 | |
| | | | |
| | | | | | | | | | | 1,037,852 | |
| | | | | | | | | | | | |
| | | |
| Household Durables: 0.17% | | | | | | | | | | |
D.R. Horton Incorporated | | | | | | | 1,244 | | | | 15,687 | |
Harman International Industries Incorporated | | | | | | | 313 | | | | 11,907 | |
Leggett & Platt Incorporated« | | | | | | | 622 | | | | 14,331 | |
Lennar Corporation | | | | | | | 719 | | | | 14,128 | |
Newell Rubbermaid Incorporated | | | | | | | 1,294 | | | | 20,898 | |
Pulte Homes Incorporated† | | | | | | | 1,506 | | | | 9,503 | |
Stanley Black & Decker Incorporated« | | | | | | | 755 | | | | 51,038 | |
Whirlpool Corporation« | | | | | | | 341 | | | | 16,180 | |
| | | | |
| | | | | | | | | | | 153,672 | |
| | | | | | | | | | | | |
| | | |
| Internet & Catalog Retail: 0.47% | | | | | | | | | | |
Amazon.com Incorporated† | | | | | | | 1,627 | | | | 281,634 | |
Expedia Incorporated | | | | | | | 424 | | | | 12,304 | |
| | | | |
| 12 | | Wells Fargo Advantage VT Index Asset Allocation Fund | | Portfolio of Investments—December 31, 2011 |
| | | | | | | | | | | | |
| Security Name | | | | | | Shares | | | Value | |
| | | | | | | | | | | | |
| | | |
| Internet & Catalog Retail (continued) | | | | | | | | | | |
Netflix Incorporated† | | | | | | | 247 | | | $ | 17,115 | |
Priceline.com Incorporated† | | | | | | | 222 | | | | 103,832 | |
Tripadvisor Incorporated | | | | | | | 424 | | | | 10,689 | |
| | | | |
| | | | | | | | | | | 425,574 | |
| | | | | | | | | | | | |
| | | | |
| Leisure Equipment & Products: 0.06% | | | | | | | | | | | | |
Hasbro Incorporated | | | | | | | 519 | | | | 16,551 | |
Mattel Incorporated« | | | | | | | 1,514 | | | | 42,029 | |
| | | | |
| | | | | | | | | | | 58,580 | |
| | | | | | | | | | | | |
| | | | |
| Media: 1.77% | | | | | | | | | | | | |
Cablevision Systems Corporation New York Group Class A | | | | | | | 987 | | | | 14,035 | |
CBS Corporation Class B | | | | | | | 2,927 | | | | 79,439 | |
Comcast Corporation Class A | | | | | | | 12,188 | | | | 288,977 | |
DIRECTV Group Incorporated†« | | | | | | | 3,156 | | | | 134,951 | |
Discovery Communications Incorporated Class C†« | | | | | | | 1,182 | | | | 48,427 | |
Gannett Company Incorporated | | | | | | | 1,065 | | | | 14,239 | |
Interpublic Group of Companies Incorporated | | | | | | | 2,062 | | | | 20,063 | |
McGraw-Hill Companies Incorporated | | | | | | | 1,312 | | | | 59,001 | |
News Corporation Class A | | | | | | | 9,808 | | | | 174,975 | |
Omnicom Group Incorporated« | | | | | | | 1,233 | | | | 54,967 | |
Scripps Networks Interactive Incorporated« | | | | | | | 435 | | | | 18,453 | |
Time Warner Cable Incorporated | | | | | | | 1,427 | | | | 90,714 | |
Time Warner Incorporated« | | | | | | | 4,476 | | | | 161,763 | |
Viacom Incorporated Class B | | | | | | | 2,470 | | | | 112,163 | |
Walt Disney Company | | | | | | | 8,035 | | | | 301,313 | |
Washington Post Company Class B | | | | | | | 21 | | | | 7,913 | |
| | | | |
| | | | | | | | | | | 1,581,393 | |
| | | | | | | | | | | | |
| | | | |
| Multiline Retail: 0.47% | | | | | | | | | | | | |
Big Lots Incorporated† | | | | | | | 293 | | | | 11,064 | |
Dollar Tree Incorporated† | | | | | | | 532 | | | | 44,215 | |
Family Dollar Stores Incorporated | | | | | | | 525 | | | | 30,272 | |
JCPenney Company Incorporated« | | | | | | | 639 | | | | 22,461 | |
Kohl’s Corporation | | | | | | | 1,133 | | | | 55,914 | |
Macy’s Incorporated | | | | | | | 1,877 | | | | 60,402 | |
Nordstrom Incorporated | | | | | | | 723 | | | | 35,940 | |
Sears Holdings Corporation†« | | | | | | | 172 | | | | 5,466 | |
Target Corporation | | | | | | | 3,004 | | | | 153,865 | |
| | | | |
| | | | | | | | | | | 419,599 | |
| | | | | | | | | | | | |
| | | | |
| Specialty Retail: 1.16% | | | | | | | | | | | | |
Abercrombie & Fitch Company Class A | | | | | | | 384 | | | | 18,755 | |
AutoNation Incorporated†« | | | | | | | 212 | | | | 7,816 | |
AutoZone Incorporated† | | | | | | | 124 | | | | 40,296 | |
Bed Bath & Beyond Incorporated† | | | | | | | 1,073 | | | | 62,202 | |
Best Buy Company Incorporated | | | | | | | 1,312 | | | | 30,661 | |
CarMax Incorporated†« | | | | | | | 1,012 | | | | 30,846 | |
GameStop Corporation Class A† | | | | | | | 619 | | | | 14,936 | |
Gap Incorporated | | | | | | | 1,551 | | | | 28,771 | |
| | | | | | |
| Portfolio of Investments—December 31, 2011 | | Wells Fargo Advantage VT Index Asset Allocation Fund | | | 13 | |
| | | | | | | | | | | | |
| Security Name | | | | | | Shares | | | Value | |
| | | | | | | | | | | | |
| | | | |
| Specialty Retail (continued) | | | | | | | | | | | | |
Home Depot Incorporated | | | | | | | 6,895 | | | $ | 289,866 | |
Limited Brands Incorporated« | | | | | | | 1,100 | | | | 44,385 | |
Lowe’s Companies Incorporated | | | | | | | 5,602 | | | | 142,179 | |
O’Reilly Automotive Incorporated† | | | | | | | 574 | | | | 45,891 | |
Orchard Supply Hardware Corporation Class A†(a) | | | | | | | 7 | | | | 26 | |
Ross Stores Incorporated | | | | | | | 1,549 | | | | 73,624 | |
Staples Incorporated | | | | | | | 3,128 | | | | 43,448 | |
Tiffany & Company | | | | | | | 567 | | | | 37,569 | |
TJX Companies Incorporated | | | | | | | 1,686 | | | | 108,831 | |
Urban Outfitters Incorporated† | | | | | | | 496 | | | | 13,670 | |
| | | | |
| | | | | | | | | | | 1,033,772 | |
| | | | | | | | | | | | |
| | | | |
| Textiles, Apparel & Luxury Goods: 0.37% | | | | | | | | | | | | |
Coach Incorporated | | | | | | | 1,305 | | | | 79,657 | |
Nike Incorporated Class B | | | | | | | 1,659 | | | | 159,878 | |
Ralph Lauren Corporation | | | | | | | 288 | | | | 39,767 | |
VF Corporation | | | | | | | 389 | | | | 49,399 | |
| | | | |
| | | | | | | | | | | 328,701 | |
| | | | | | | | | | | | |
| | | | |
Consumer Staples: 6.57% | | | | | | | | | | | | |
| | | | |
| Beverages: 1.53% | | | | | | | | | | | | |
Beam Incorporated | | | | | | | 695 | | | | 35,605 | |
Brown-Forman Corporation Class B | | | | | | | 451 | | | | 36,310 | |
Coca-Cola Enterprises Incorporated | | | | | | | 1,395 | | | | 35,963 | |
Constellation Brands Incorporated Class A† | | | | | | | 778 | | | | 16,081 | |
Dr Pepper Snapple Group Incorporated | | | | | | | 958 | | | | 37,822 | |
Molson Coors Brewing Company« | | | | | | | 704 | | | | 30,652 | |
PepsiCo Incorporated | | | | | | | 6,993 | | | | 463,986 | |
The Coca-Cola Company | | | | | | | 10,159 | | | | 710,825 | |
| | | | |
| | | | | | | | | | | 1,367,244 | |
| | | | | | | | | | | | |
| | | | |
| Food & Staples Retailing: 1.38% | | | | | | | | | | | | |
Costco Wholesale Corporation | | | | | | | 1,938 | | | | 161,474 | |
CVS Caremark Corporation | | | | | | | 5,822 | | | | 237,421 | |
Kroger Company« | | | | | | | 2,671 | | | | 64,692 | |
Safeway Incorporated« | | | | | | | 1,520 | | | | 31,981 | |
SUPERVALU Incorporated« | | | | | | | 949 | | | | 7,706 | |
Sysco Corporation« | | | | | | | 2,638 | | | | 77,373 | |
Wal-Mart Stores Incorporated | | | | | | | 7,812 | | | | 466,845 | |
Walgreen Company | | | | | | | 3,977 | | | | 131,480 | |
Whole Foods Market Incorporated | | | | | | | 714 | | | | 49,680 | |
| | | | |
| | | | | | | | | | | 1,228,652 | |
| | | | | | | | | | | | |
| | | | |
| Food Products: 1.10% | | | | | | | | | | | | |
Archer Daniels Midland Company | | | | | | | 2,987 | | | | 85,428 | |
Campbell Soup Company« | | | | | | | 802 | | | | 26,658 | |
ConAgra Foods Incorporated | | | | | | | 1,854 | | | | 48,946 | |
Dean Foods Company† | | | | | | | 821 | | | | 9,195 | |
General Mills Incorporated | | | | | | | 2,878 | | | | 116,300 | |
H.J. Heinz Company | | | | | | | 1,432 | | | | 77,385 | |
| | | | |
| 14 | | Wells Fargo Advantage VT Index Asset Allocation Fund | | Portfolio of Investments—December 31, 2011 |
| | | | | | | | | | | | |
| Security Name | | | | | | Shares | | | Value | |
| | | | | | | | | | | | |
| | | | |
| Food Products (continued) | | | | | | | | | | | | |
Hormel Foods Corporation« | | | | | | | 616 | | | $ | 18,043 | |
JM Smucker Company | | | | | | | 509 | | | | 39,789 | |
Kellogg Company« | | | | | | | 1,108 | | | | 56,032 | |
Kraft Foods Incorporated Class A | | | | | | | 7,902 | | | | 295,219 | |
McCormick & Company Incorporated | | | | | | | 593 | | | | 29,899 | |
Mead Johnson & Company« | | | | | | | 910 | | | | 62,544 | |
Sara Lee Corporation | | | | | | | 2,642 | | | | 49,987 | |
The Hershey Company« | | | | | | | 684 | | | | 42,258 | |
Tyson Foods Incorporated Class A | | | | | | | 1,306 | | | | 26,956 | |
| | | | |
| | | | | | | | | | | 984,639 | |
| | | | | | | | | | | | |
| | | | |
| Household Products: 1.33% | | | | | | | | | | | | |
Clorox Company | | | | | | | 590 | | | | 39,270 | |
Colgate-Palmolive Company« | | | | | | | 2,164 | | | | 199,932 | |
Kimberly-Clark Corporation« | | | | | | | 1,762 | | | | 129,613 | |
Procter & Gamble Company | | | | | | | 12,306 | | | | 820,933 | |
| | | | |
| | | | | | | | | | | 1,189,748 | |
| | | | | | | | | | | | |
| | | | |
| Personal Products: 0.10% | | | | | | | | | | | | |
Avon Products Incorporated | | | | | | | 1,926 | | | | 33,647 | |
Estee Lauder Companies Incorporated Class A | | | | | | | 499 | | | | 56,048 | |
| | | | |
| | | | | | | | | | | 89,695 | |
| | | | | | | | | | | | |
| | | | |
| Tobacco: 1.13% | | | | | | | | | | | | |
Altria Group Incorporated« | | | | | | | 9,198 | | | | 272,721 | |
Lorillard Incorporated | | | | | | | 603 | | | | 68,742 | |
Philip Morris International | | | | | | | 7,769 | | | | 609,711 | |
Reynolds American Incorporated | | | | | | | 1,512 | | | | 62,627 | |
| | | | |
| | | | | | | | | | | 1,013,801 | |
| | | | | | | | | | | | |
| | | | |
Energy: 6.99% | | | | | | | | | | | | |
| | | | |
| Energy Equipment & Services: 1.13% | | | | | | | | | | | | |
Baker Hughes Incorporated | | | | | | | 1,952 | | | | 94,945 | |
Cameron International Corporation†« | | | | | | | 1,096 | | | | 53,912 | |
Diamond Offshore Drilling Incorporated« | | | | | | | 310 | | | | 17,131 | |
FMC Technologies Incorporated†« | | | | | | | 1,065 | | | | 55,625 | |
Halliburton Company | | | | | | | 4,115 | | | | 142,009 | |
Helmerich & Payne Incorporated« | | | | | | | 479 | | | | 27,954 | |
Nabors Industries Limited† | | | | | | | 1,286 | | | | 22,299 | |
National Oilwell Varco Incorporated« | | | | | | | 1,895 | | | | 128,841 | |
Noble Corporation« | | | | | | | 1,129 | | | | 34,118 | |
Rowan Companies Incorporated† | | | | | | | 559 | | | | 16,954 | |
Schlumberger Limited | | | | | | | 6,003 | | | | 410,065 | |
| | | | |
| | | | | | | | | | | 1,003,853 | |
| | | | | | | | | | | | |
| | | | |
| Oil, Gas & Consumable Fuels: 5.86% | | | | | | | | | | | | |
Alpha Natural Resources Incorporated† | | | | | | | 983 | | | | 20,083 | |
Anadarko Petroleum Corporation | | | | | | | 2,227 | | | | 169,987 | |
Apache Corporation | | | | | | | 1,717 | | | | 155,526 | |
Cabot Oil & Gas Corporation | | | | | | | 467 | | | | 35,445 | |
| | | | | | |
| Portfolio of Investments—December 31, 2011 | | Wells Fargo Advantage VT Index Asset Allocation Fund | | | 15 | |
| | | | | | | | | | | | |
| Security Name | | | | | | Shares | | | Value | |
| | | | | | | | | | | | |
| | | | |
| Oil, Gas & Consumable Fuels (continued) | | | | | | | | | | | | |
Chesapeake Energy Corporation« | | | | | | | 2,948 | | | $ | 65,711 | |
Chevron Corporation | | | | | | | 8,907 | | | | 947,705 | |
ConocoPhillips Company | | | | | | | 5,938 | | | | 432,702 | |
CONSOL Energy Incorporated | | | | | | | 1,014 | | | | 37,214 | |
Denbury Resources Incorporated†« | | | | | | | 1,776 | | | | 26,818 | |
Devon Energy Corporation | | | | | | | 1,806 | | | | 111,972 | |
El Paso Corporation | | | | | | | 3,449 | | | | 91,640 | |
EOG Resources Incorporated | | | | | | | 1,202 | | | | 118,409 | |
EQT Corporation | | | | | | | 668 | | | | 36,600 | |
Exxon Mobil Corporation | | | | | | | 21,439 | | | | 1,817,170 | |
Hess Corporation | | | | | | | 1,332 | | | | 75,658 | |
Marathon Oil Corporation | | | | | | | 3,147 | | | | 92,113 | |
Marathon Petroleum Corporation | | | | | | | 1,594 | | | | 53,064 | |
Murphy Oil Corporation | | | | | | | 865 | | | | 48,215 | |
Newfield Exploration Company† | | | | | | | 592 | | | | 22,336 | |
Noble Energy Incorporated« | | | | | | | 785 | | | | 74,096 | |
Occidental Petroleum Corporation | | | | | | | 3,631 | | | | 340,225 | |
Peabody Energy Corporation« | | | | | | | 1,211 | | | | 40,096 | |
Pioneer Natural Resources Company | | | | | | | 547 | | | | 48,946 | |
QEP Resources Incorporated | | | | | | | 791 | | | | 23,176 | |
Range Resources Corporation | | | | | | | 699 | | | | 43,286 | |
Southwestern Energy Company† | | | | | | | 1,553 | | | | 49,603 | |
Spectra Energy Corporation | | | | | | | 2,908 | | | | 89,421 | |
Sunoco Incorporated | | | | | | | 477 | | | | 19,567 | |
Tesoro Petroleum Corporation† | | | | | | | 636 | | | | 14,857 | |
The Williams Companies Incorporated | | | | | | | 2,636 | | | | 87,041 | |
Valero Energy Corporation | | | | | | | 2,503 | | | | 52,688 | |
| | | | |
| | | | | | | | | | | 5,241,370 | |
| | | | | | | | | | | | |
| | | | |
Financials: 8.16% | | | | | | | | | | | | |
| | | | |
| Capital Markets: 1.03% | | | | | | | | | | | | |
Ameriprise Financial Incorporated | | | | | | | 1,012 | | | | 50,236 | |
Bank of New York Mellon Corporation | | | | | | | 5,424 | | | | 107,992 | |
BlackRock Incorporated | | | | | | | 448 | | | | 79,852 | |
Charles Schwab Corporation | | | | | | | 4,828 | | | | 54,363 | |
E*TRADE Financial Corporation† | | | | | | | 1,135 | | | | 9,035 | |
Federated Investors Incorporated Class B | | | | | | | 413 | | | | 6,257 | |
Franklin Resources Incorporated | | | | | | | 651 | | | | 62,535 | |
Goldman Sachs Group Incorporated | | | | | | | 2,202 | | | | 199,127 | |
Invesco Limited | | | | | | | 2,017 | | | | 40,522 | |
Legg Mason Incorporated | | | | | | | 556 | | | | 13,372 | |
Morgan Stanley | | | | | | | 6,638 | | | | 100,433 | |
Northern Trust Corporation« | | | | | | | 1,077 | | | | 42,714 | |
State Street Corporation | | | | | | | 2,200 | | | | 88,682 | |
T. Rowe Price Group Incorporated« | | | | | | | 1,130 | | | | 64,354 | |
| | | | |
| | | | | | | | | | | 919,474 | |
| | | | | | | | | | | | |
| | | | |
| Commercial Banks: 1.52% | | | | | | | | | | | | |
Branch Banking & Trust Corporation | | | | | | | 3,118 | | | | 78,480 | |
Comerica Incorporated | | | | | | | 888 | | | | 22,910 | |
| | | | |
| 16 | | Wells Fargo Advantage VT Index Asset Allocation Fund | | Portfolio of Investments—December 31, 2011 |
| | | | | | | | | | | | |
| Security Name | | | | | | Shares | | | Value | |
| | | | | | | | | | | | |
| | | | |
| Commercial Banks (continued) | | | | | | | | | | | | |
Fifth Third Bancorp | | | | | | | 4,114 | | | $ | 52,330 | |
First Horizon National Corporation | | | | | | | 1,179 | | | | 9,432 | |
Huntington Bancshares Incorporated | | | | | | | 3,864 | | | | 21,213 | |
KeyCorp Incorporated | | | | | | | 4,262 | | | | 32,775 | |
M&T Bank Corporation« | | | | | | | 561 | | | | 42,827 | |
PNC Financial Services Group Incorporated | | | | | | | 2,353 | | | | 135,698 | |
Regions Financial Corporation | | | | | | | 5,630 | | | | 24,209 | |
SunTrust Banks Incorporated | | | | | | | 2,401 | | | | 42,498 | |
US Bancorp | | | | | | | 8,536 | | | | 230,899 | |
Wells Fargo & Company(l) | | | | | | | 23,588 | | | | 650,085 | |
Zions Bancorporation | | | | | | | 824 | | | | 13,415 | |
| | | | |
| | | | | | | | | | | 1,356,771 | |
| | | | | | | | | | | | |
| | | | |
| Consumer Finance: 0.95% | | | | | | | | | | | | |
American Express Company | | | | | | | 4,519 | | | | 213,161 | |
Capital One Financial Corporation« | | | | | | | 2,056 | | | | 86,948 | |
Discover Financial Services | | | | | | | 2,458 | | | | 58,992 | |
MasterCard Incorporated | | | | | | | 476 | | | | 177,462 | |
SLM Corporation | | | | | | | 2,275 | | | | 30,485 | |
Visa Incorporated Class A« | | | | | | | 2,274 | | | | 230,879 | |
Western Union Company« | | | | | | | 2,769 | | | | 50,562 | |
| | | | |
| | | | | | | | | | | 848,489 | |
| | | | | | | | | | | | |
| | | | |
| Diversified Financial Services: 2.20% | | | | | | | | | | | | |
Bank of America Corporation | | | | | | | 45,337 | | | | 252,074 | |
Berkshire Hathaway Incorporated Class B† | | | | | | | 7,863 | | | | 599,947 | |
Citigroup Incorporated | | | | | | | 13,077 | | | | 344,056 | |
CME Group Incorporated | | | | | | | 296 | | | | 72,126 | |
InterContinental Exchange Incorporated†« | | | | | | | 324 | | | | 39,058 | |
JPMorgan Chase & Company | | | | | | | 16,996 | | | | 565,117 | |
Leucadia National Corporation« | | | | | | | 886 | | | | 20,148 | |
Moody’s Corporation« | | | | | | | 873 | | | | 29,403 | |
NASDAQ Stock Market Incorporated† | | | | | | | 570 | | | | 13,971 | |
NYSE Euronext Incorporated | | | | | | | 1,171 | | | | 30,563 | |
| | | | |
| | | | | | | | | | | 1,966,463 | |
| | | | | | | | | | | | |
| | | | |
| Insurance: 1.37% | | | | | | | | | | | | |
ACE Limited | | | | | | | 1,506 | | | | 105,601 | |
AFLAC Incorporated | | | | | | | 2,087 | | | | 90,284 | |
Allstate Corporation | | | | | | | 2,260 | | | | 61,947 | |
American International Group Incorporated† | | | | | | | 1,953 | | | | 45,310 | |
AON Corporation | | | | | | | 1,446 | | | | 67,673 | |
Assurant Incorporated | | | | | | | 411 | | | | 16,876 | |
Chubb Corporation« | | | | | | | 1,243 | | | | 86,040 | |
Cincinnati Financial Corporation | | | | | | | 725 | | | | 22,084 | |
Genworth Financial Incorporated† | | | | | | | 2,195 | | | | 14,377 | |
Hartford Financial Services Group Incorporated | | | | | | | 1,993 | | | | 32,386 | |
Lincoln National Corporation | | | | | | | 1,349 | | | | 26,198 | |
Loews Corporation | | | | | | | 1,365 | | | | 51,392 | |
Marsh & McLennan Companies Incorporated | | | | | | | 2,406 | | | | 76,078 | |
| | | | | | |
| Portfolio of Investments—December 31, 2011 | | Wells Fargo Advantage VT Index Asset Allocation Fund | | | 17 | |
| | | | | | | | | | | | |
| Security Name | | | | | | Shares | | | Value | |
| | | | | | | | | | | | |
| | | | |
| Insurance (continued) | | | | | | | | | | | | |
MetLife Incorporated | | | | | | | 4,730 | | | $ | 147,481 | |
Principal Financial Group Incorporated | | | | | | | 1,364 | | | | 33,554 | |
Prudential Financial Incorporated« | | | | | | | 2,111 | | | | 105,803 | |
The Progressive Corporation | | | | | | | 2,758 | | | | 53,809 | |
The Travelers Companies Incorporated | | | | | | | 1,846 | | | | 109,228 | |
Torchmark Corporation | | | | | | | 455 | | | | 19,742 | |
UnumProvident Corporation | | | | | | | 1,307 | | | | 27,538 | |
XL Group plc | | | | | | | 1,433 | | | | 28,330 | |
| | | | |
| | | | | | | | | | | 1,221,731 | |
| | | | | | | | | | | | |
| | | | |
| Real Estate Management & Development: 0.02% | | | | | | | | | | | | |
CBRE Group Incorporated† | | | | | | | 1,450 | | | | 22,069 | |
| | | | | | | | | | | | |
| | | | |
| REIT: 1.03% | | | | | | | | | | | | |
Apartment Investment & Management Company Class A | | | | | | | 540 | | | | 12,371 | |
AvalonBay Communities Incorporated | | | | | | | 425 | | | | 55,505 | |
Boston Properties Incorporated | | | | | | | 660 | | | | 65,736 | |
Equity Residential Corporation« | | | | | | | 1,326 | | | | 75,622 | |
HCP Incorporated« | | | | | | | 1,824 | | | | 75,568 | |
Health Care REIT Incorporated« | | | | | | | 848 | | | | 46,241 | |
Host Hotels & Resorts Incorporated« | | | | | | | 3,158 | | | | 46,644 | |
Kimco Realty Corporation | | | | | | | 1,820 | | | | 29,557 | |
Plum Creek Timber Company« | | | | | | | 721 | | | | 26,360 | |
Prologis Incorporated | | | | | | | 2,049 | | | | 58,581 | |
Public Storage Incorporated« | | | | | | | 635 | | | | 85,382 | |
Simon Property Group Incorporated | | | | | | | 1,314 | | | | 169,427 | |
Ventas Incorporated« | | | | | | | 1,287 | | | | 70,952 | |
Vornado Realty Trust | | | | | | | 825 | | | | 63,410 | |
Weyerhaeuser Company | | | | | | | 2,399 | | | | 44,789 | |
| | | | |
| | | | | | | | | | | 926,145 | |
| | | | | | | | | | | | |
| | | | |
| Thrifts & Mortgage Finance: 0.04% | | | | | | | | | | | | |
Hudson City Bancorp Incorporated | | | | | | | 2,359 | | | | 14,744 | |
People’s United Financial Incorporated« | | | | | | | 1,613 | | | | 20,727 | |
| | | | |
| | | | | | | | | | | 35,471 | |
| | | | | | | | | | | | |
| | | | |
Health Care: 6.69% | | | | | | | | | | | | |
| | | | |
| Biotechnology: 0.69% | | | | | | | | | | | | |
Amgen Incorporated | | | | | | | 3,548 | | | | 227,817 | |
Biogen Idec Incorporated† | | | | | | | 1,086 | | | | 119,514 | |
Celgene Corporation† | | | | | | | 1,985 | | | | 134,186 | |
Gilead Sciences Incorporated† | | | | | | | 3,359 | | | | 137,484 | |
| | | | |
| | | | | | | | | | | 619,001 | |
| | | | | | | | | | | | |
| | | | |
| Health Care Equipment & Supplies: 1.01% | | | | | | | | | | | | |
Baxter International Incorporated | | | | | | | 2,522 | | | | 124,789 | |
Becton Dickinson & Company | | | | | | | 961 | | | | 71,806 | |
Boston Scientific Corporation† | | | | | | | 6,626 | | | | 35,383 | |
C.R. Bard Incorporated | | | | | | | 383 | | | | 32,747 | |
CareFusion Corporation† | | | | | | | 1,004 | | | | 25,512 | |
| | | | |
| 18 | | Wells Fargo Advantage VT Index Asset Allocation Fund | | Portfolio of Investments—December 31, 2011 |
| | | | | | | | | | | | |
| Security Name | | | | | | Shares | | | Value | |
| | | | | | | | | | | | |
| | | | |
| Health Care Equipment & Supplies (continued) | | | | | | | | | | | | |
Covidien plc | | | | | | | 2,157 | | | $ | 97,087 | |
DENTSPLY International Incorporated« | | | | | | | 633 | | | | 22,149 | |
Edwards Lifesciences Corporation† | | | | | | | 510 | | | | 36,057 | |
Intuitive Surgical Incorporated† | | | | | | | 174 | | | | 80,564 | |
Medtronic Incorporated | | | | | | | 4,720 | | | | 180,540 | |
St. Jude Medical Incorporated | | | | | | | 1,426 | | | | 48,912 | |
Stryker Corporation | | | | | | | 1,454 | | | | 72,278 | |
Varian Medical Systems Incorporated†« | | | | | | | 503 | | | | 33,766 | |
Zimmer Holdings Incorporated« | | | | | | | 801 | | | | 42,789 | |
| | | | |
| | | | | | | | | | | 904,379 | |
| | | | | | | | | | | | |
| | | | |
| Health Care Providers & Services: 1.20% | | | | | | | | | | | | |
Aetna Incorporated | | | | | | | 1,620 | | | | 68,348 | |
AmerisourceBergen Corporation | | | | | | | 1,155 | | | | 42,954 | |
Cardinal Health Incorporated | | | | | | | 1,545 | | | | 62,742 | |
CIGNA Corporation | | | | | | | 1,276 | | | | 53,592 | |
Coventry Health Care Incorporated† | | | | | | | 645 | | | | 19,589 | |
DaVita Incorporated†« | | | | | | | 418 | | | | 31,689 | |
Express Scripts Incorporated† | | | | | | | 2,176 | | | | 97,245 | |
Humana Incorporated | | | | | | | 731 | | | | 64,043 | |
Laboratory Corporation of America Holdings†« | | | | | | | 443 | | | | 38,085 | |
McKesson Corporation | | | | | | | 1,098 | | | | 85,545 | |
Medco Health Solutions Incorporated† | | | | | | | 1,731 | | | | 96,763 | |
Patterson Companies Incorporated« | | | | | | | 392 | | | | 11,572 | |
Quest Diagnostics Incorporated | | | | | | | 705 | | | | 40,932 | |
Tenet Healthcare Corporation†« | | | | | | | 1,942 | | | | 9,962 | |
UnitedHealth Group Incorporated« | | | | | | | 4,768 | | | | 241,642 | |
WellPoint Incorporated | | | | | | | 1,555 | | | | 103,019 | |
| | | | |
| | | | | | | | | | | 1,067,722 | |
| | | | | | | | | | | | |
| | | | |
| Health Care Technology: 0.05% | | | | | | | | | | | | |
Cerner Corporation†« | | | | | | | 651 | | | | 39,874 | |
| | | | | | | | | | | | |
| | | | |
| Life Sciences Tools & Services: 0.16% | | | | | | | | | | | | |
Life Technologies Corporation† | | | | | | | 797 | | | | 31,011 | |
PerkinElmer Incorporated | | | | | | | 505 | | | | 10,100 | |
Thermo Fisher Scientific Incorporated† | | | | | | | 1,692 | | | | 76,089 | |
Waters Corporation†« | | | | | | | 400 | | | | 29,620 | |
| | | | |
| | | | | | | | | | | 146,820 | |
| | | | | | | | | | | | |
| | | | |
| Pharmaceuticals: 3.58% | | | | | | | | | | | | |
Abbott Laboratories | | | | | | | 6,967 | | | | 391,754 | |
Allergan Incorporated | | | | | | | 1,364 | | | | 119,677 | |
Bristol-Myers Squibb Company | | | | | | | 7,579 | | | | 267,084 | |
Eli Lilly & Company | | | | | | | 4,557 | | | | 189,389 | |
Forest Laboratories Incorporated† | | | | | | | 1,194 | | | | 36,130 | |
Hospira Incorporated†« | | | | | | | 736 | | | | 22,352 | |
Johnson & Johnson Services Incorporated« | | | | | | | 12,214 | | | | 800,994 | |
Merck & Company Incorporated | | | | | | | 13,633 | | | | 513,964 | |
Mylan Laboratories Incorporated† | | | | | | | 1,907 | | | | 40,924 | |
Perrigo Company | | | | | | | 416 | | | | 40,477 | |
| | | | | | |
| Portfolio of Investments—December 31, 2011 | | Wells Fargo Advantage VT Index Asset Allocation Fund | | | 19 | |
| | | | | | | | | | | | |
| Security Name | | | | | | Shares | | | Value | |
| | | | | | | | | | | | |
| | | | |
| Pharmaceuticals (continued) | | | | | | | | | | | | |
Pfizer Incorporated | | | | | | | 34,383 | | | $ | 744,048 | |
Watson Pharmaceuticals Incorporated† | | | | | | | 568 | | | | 34,273 | |
| | | | |
| | | | | | | | | | | 3,201,066 | |
| | | | | | | | | | | | |
| | | | |
Industrials: 6.03% | | | | | | | | | | | | |
| | | | |
| Aerospace & Defense: 1.47% | | | | | | | | | | | | |
Boeing Company | | | | | | | 3,324 | | | | 243,815 | |
General Dynamics Corporation | | | | | | | 1,592 | | | | 105,725 | |
Goodrich Corporation | | | | | | | 560 | | | | 69,272 | |
Honeywell International Incorporated« | | | | | | | 3,459 | | | | 187,997 | |
L-3 Communications Holdings Incorporated | | | | | | | 446 | | | | 29,739 | |
Lockheed Martin Corporation | | | | | | | 1,186 | | | | 95,947 | |
Northrop Grumman Corporation« | | | | | | | 1,168 | | | | 68,305 | |
Precision Castparts Corporation« | | | | | | | 644 | | | | 106,125 | |
Raytheon Company | | | | | | | 1,548 | | | | 74,892 | |
Rockwell Collins Incorporated« | | | | | | | 676 | | | | 37,430 | |
United Technologies Corporation | | | | | | | 4,052 | | | | 296,161 | |
| | | | |
| | | | | | | | | | | 1,315,408 | |
| | | | | | | | | | | | |
| | | | |
| Air Freight & Logistics: 0.59% | | | | | | | | | | | | |
C.H. Robinson Worldwide Incorporated« | | | | | | | 734 | | | | 51,219 | |
Expeditors International of Washington Incorporated | | | | | | | 948 | | | | 38,830 | |
FedEx Corporation | | | | | | | 1,418 | | | | 118,417 | |
United Parcel Service Incorporated Class B | | | | | | | 4,316 | | | | 315,888 | |
| | | | |
| | | | | | | | | | | 524,354 | |
| | | | | | | | | | | | |
| | | | |
| Airlines: 0.03% | | | | | | | | | | | | |
Southwest Airlines Company« | | | | | | | 3,482 | | | | 29,806 | |
| | | | | | | | | | | | |
| | | | |
| Building Products: 0.02% | | | | | | | | | | | | |
Masco Corporation | | | | | | | 1,600 | | | | 16,768 | |
| | | | | | | | | | | | |
| | | | |
| Commercial Services & Supplies: 0.31% | | | | | | | | | | | | |
Avery Dennison Corporation | | | | | | | 470 | | | | 13,480 | |
Cintas Corporation | | | | | | | 493 | | | | 17,161 | |
Dun & Bradstreet Corporation | | | | | | | 217 | | | | 16,238 | |
Equifax Incorporated | | | | | | | 541 | | | | 20,958 | |
Iron Mountain Incorporated« | | | | | | | 830 | | | | 25,564 | |
Pitney Bowes Incorporated« | | | | | | | 892 | | | | 16,538 | |
Republic Services Incorporated | | | | | | | 1,408 | | | | 38,790 | |
Robert Half International Incorporated | | | | | | | 639 | | | | 18,186 | |
RR Donnelley & Sons Company« | | | | | | | 840 | | | | 12,121 | |
Stericycle Incorporated†« | | | | | | | 380 | | | | 29,610 | |
Waste Management Incorporated« | | | | | | | 2,059 | | | | 67,350 | |
| | | | |
| | | | | | | | | | | 275,996 | |
| | | | | | | | | | | | |
| | | | |
| Construction & Engineering: 0.09% | | | | | | | | | | | | |
Fluor Corporation | | | | | | | 758 | | | | 38,090 | |
Jacobs Engineering Group Incorporated†« | | | | | | | 573 | | | | 23,252 | |
Quanta Services Incorporated†« | | | | | | | 939 | | | | 20,226 | |
| | | | |
| | | | | | | | | | | 81,568 | |
| | | | | | | | | | | | |
| | | | |
| 20 | | Wells Fargo Advantage VT Index Asset Allocation Fund | | Portfolio of Investments—December 31, 2011 |
| | | | | | | | | | | | |
| Security Name | | | | | | Shares | | | Value | |
| | | | | | | | | | | | |
| | | | |
| Electrical Equipment: 0.31% | | | | | | | | | | | | |
Cooper Industries plc | | | | | | | 707 | | | $ | 38,284 | |
Emerson Electric Company« | | | | | | | 3,290 | | | | 153,281 | |
Rockwell Automation Incorporated« | | | | | | | 634 | | | | 46,517 | |
Roper Industries Incorporated | | | | | | | 431 | | | | 37,441 | |
| | | | |
| | | | | | | | | | | 275,523 | |
| | | | | | | | | | | | |
| | | | |
| Industrial Conglomerates: 1.37% | | | | | | | | | | | | |
3M Company | | | | | | | 3,134 | | | | 256,142 | |
General Electric Company | | | | | | | 47,222 | | | | 845,746 | |
Textron Incorporated | | | | | | | 1,244 | | | | 23,002 | |
Tyco International Limited | | | | | | | 2,066 | | | | 96,503 | |
| | | | |
| | | | | | | | | | | 1,221,393 | |
| | | | | | | | | | | | |
| | | | |
| Machinery: 1.22% | | | | | | | | | | | | |
Caterpillar Incorporated | | | | | | | 2,892 | | | | 262,015 | |
Cummins Incorporated« | | | | | | | 862 | | | | 75,873 | |
Danaher Corporation | | | | | | | 2,548 | | | | 119,858 | |
Deere & Company« | | | | | | | 1,851 | | | | 143,175 | |
Dover Corporation | | | | | | | 829 | | | | 48,123 | |
Eaton Corporation | | | | | | | 1,494 | | | | 65,034 | |
Flowserve Corporation | | | | | | | 248 | | | | 24,631 | |
Illinois Tool Works Incorporated« | | | | | | | 2,161 | | | | 100,940 | |
Ingersoll-Rand plc« | | | | | | | 1,396 | | | | 42,536 | |
Joy Global Incorporated« | | | | | | | 470 | | | | 35,236 | |
Paccar Incorporated« | | | | | | | 1,602 | | | | 60,027 | |
Pall Corporation« | | | | | | | 515 | | | | 29,432 | |
Parker Hannifin Corporation | | | | | | | 675 | | | | 51,469 | |
Snap-On Incorporated | | | | | | | 260 | | | | 13,161 | |
Xylem Incorporated | | | | | | | 825 | | | | 21,194 | |
| | | | |
| | | | | | | | | | | 1,092,704 | |
| | | | | | | | | | | | |
| | | | |
| Road & Rail: 0.50% | | | | | | | | | | | | |
CSX Corporation | | | | | | | 4,696 | | | | 98,898 | |
Norfolk Southern Corporation« | | | | | | | 1,503 | | | | 109,509 | |
Ryder System Incorporated | | | | | | | 228 | | | | 12,116 | |
Union Pacific Corporation | | | | | | | 2,160 | | | | 228,830 | |
| | | | |
| | | | | | | | | | | 449,353 | |
| | | | | | | | | | | | |
| | | | |
| Trading Companies & Distributors: 0.12% | | | | | | | | | | | | |
Fastenal Company« | | | | | | | 1,320 | | | | 57,565 | |
W.W. Grainger Incorporated« | | | | | | | 271 | | | | 50,728 | |
| | | | |
| | | | | | | | | | | 108,293 | |
| | | | | | | | | | | | |
| | | | |
Information Technology: 10.37% | | | | | | | | | | | | |
| | | | |
| Communications Equipment: 1.19% | | | | | | | | | | | | |
Cisco Systems Incorporated | | | | | | | 24,045 | | | | 434,734 | |
F5 Networks Incorporated† | | | | | | | 355 | | | | 37,673 | |
Harris Corporation« | | | | | | | 517 | | | | 18,633 | |
JDS Uniphase Corporation† | | | | | | | 1,024 | | | | 10,691 | |
Juniper Networks Incorporated† | | | | | | | 2,352 | | | | 48,004 | |
| | | | | | |
| Portfolio of Investments—December 31, 2011 | | Wells Fargo Advantage VT Index Asset Allocation Fund | | | 21 | |
| | | | | | | | | | | | |
| Security Name | | | | | | Shares | | | Value | |
| | | | | | | | | | | | |
| | | | |
| Communications Equipment (continued) | | | | | | | | | | | | |
Motorola Mobility Holdings Incorporated† | | | | | | | 1,179 | | | $ | 45,745 | |
Motorola Solutions Incorporated | | | | | | | 1,281 | | | | 59,297 | |
QUALCOMM Incorporated | | | | | | | 7,518 | | | | 411,235 | |
| | | | |
| | | | | | | | | | | 1,066,012 | |
| | | | | | | | | | | | |
| | | | |
| Computers & Peripherals: 2.64% | | | | | | | | | | | | |
Apple Incorporated† | | | | | | | 4,157 | | | | 1,683,585 | |
Dell Incorporated† | | | | | | | 6,830 | | | | 99,923 | |
EMC Corporation†« | | | | | | | 9,124 | | | | 196,531 | |
Hewlett-Packard Company | | | | | | | 8,887 | | | | 228,929 | |
Lexmark International Incorporated« | | | | | | | 321 | | | | 10,615 | |
NetApp Incorporated†« | | | | | | | 1,604 | | | | 58,177 | |
SanDisk Corporation† | | | | | | | 1,074 | | | | 52,852 | |
Western Digital Corporation† | | | | | | | 1,045 | | | | 32,343 | |
| | | | |
| | | | | | | | | | | 2,362,955 | |
| | | | | | | | | | | | |
| | | | |
| Electronic Equipment, Instruments & Components: 0.32% | | | | | | | | | | | | |
Agilent Technologies Incorporated† | | | | | | | 1,553 | | | | 54,246 | |
Amphenol Corporation Class A | | | | | | | 741 | | | | 33,634 | |
Corning Incorporated | | | | | | | 7,029 | | | | 91,236 | |
FLIR Systems Incorporated« | | | | | | | 697 | | | | 17,474 | |
Jabil Circuit Incorporated | | | | | | | 819 | | | | 16,102 | |
Molex Incorporated | | | | | | | 613 | | | | 14,626 | |
TE Connectivity Limited | | | | | | | 1,898 | | | | 58,477 | |
| | | | |
| | | | | | | | | | | 285,795 | |
| | | | | | | | | | | | |
| | | | |
| Internet Software & Services: 1.15% | | | | | | | | | | | | |
Akamai Technologies Incorporated† | | | | | | | 802 | | | | 25,889 | |
eBay Incorporated† | | | | | | | 5,139 | | | | 155,866 | |
Google Incorporated Class A† | | | | | | | 1,130 | | | | 729,867 | |
VeriSign Incorporated | | | | | | | 711 | | | | 25,397 | |
Yahoo! Incorporated† | | | | | | | 5,547 | | | | 89,473 | |
| | | | |
| | | | | | | | | | | 1,026,492 | |
| | | | | | | | | | | | |
| | | | |
| IT Services: 1.70% | | | | | | | | | | | | |
Accenture plc« | | | | | | | 2,866 | | | | 152,557 | |
Automatic Data Processing Incorporated | | | | | | | 2,185 | | | | 118,012 | |
Cognizant Technology Solutions Corporation Class A† | | | | | | | 1,351 | | | | 86,883 | |
Computer Sciences Corporation | | | | | | | 693 | | | | 16,424 | |
Fidelity National Information Services Incorporated | | | | | | | 1,085 | | | | 28,850 | |
Fiserv Incorporated† | | | | | | | 630 | | | | 37,006 | |
International Business Machines Corporation« | | | | | | | 5,271 | | | | 969,231 | |
Paychex Incorporated | | | | | | | 1,442 | | | | 43,419 | |
SAIC Incorporated† | | | | | | | 1,235 | | | | 15,178 | |
Teradata Corporation†« | | | | | | | 748 | | | | 36,285 | |
Total System Services Incorporated | | | | | | | 725 | | | | 14,181 | |
| | | | |
| | | | | | | | | | | 1,518,026 | |
| | | | | | | | | | | | |
| | | | |
| Office Electronics: 0.06% | | | | | | | | | | | | |
Xerox Corporation | | | | | | | 6,204 | | | | 49,384 | |
| | | | | | | | | | | | |
| | | | |
| 22 | | Wells Fargo Advantage VT Index Asset Allocation Fund | | Portfolio of Investments—December 31, 2011 |
| | | | | | | | | | | | |
| Security Name | | | | | | Shares | | | Value | |
| | | | | | | | | | | | |
| | | | |
| Semiconductors & Semiconductor Equipment: 1.33% | | | | | | | | | | | | |
Advanced Micro Devices Incorporated† | | | | | | | 2,618 | | | $ | 14,137 | |
Altera Corporation | | | | | | | 1,435 | | | | 53,239 | |
Analog Devices Incorporated | | | | | | | 1,332 | | | | 47,659 | |
Applied Materials Incorporated | | | | | | | 5,840 | | | | 62,546 | |
Broadcom Corporation Class A | | | | | | | 2,169 | | | | 63,682 | |
First Solar Incorporated† | | | | | | | 262 | | | | 8,845 | |
Intel Corporation« | | | | | | | 22,776 | | | | 552,318 | |
KLA-Tencor Corporation« | | | | | | | 745 | | | | 35,946 | |
Linear Technology Corporation | | | | | | | 1,018 | | | | 30,571 | |
LSI Logic Corporation† | | | | | | | 2,520 | | | | 14,994 | |
Microchip Technology Incorporated« | | | | | | | 854 | | | | 31,282 | |
Micron Technology Incorporated† | | | | | | | 4,417 | | | | 27,783 | |
Novellus Systems Incorporated† | | | | | | | 297 | | | | 12,263 | |
NVIDIA Corporation† | | | | | | | 2,731 | | | | 37,852 | |
Teradyne Incorporated† | | | | | | | 823 | | | | 11,217 | |
Texas Instruments Incorporated | | | | | | | 5,111 | | | | 148,781 | |
Xilinx Incorporated« | | | | | | | 1,173 | | | | 37,606 | |
| | | | |
| | | | | | | | | | | 1,190,721 | |
| | | | | | | | | | | | |
| | | | |
| Software: 1.98% | | | | | | | | | | | | |
Adobe Systems Incorporated† | | | | | | | 2,195 | | | | 62,053 | |
Autodesk Incorporated† | | | | | | | 1,014 | | | | 30,755 | |
BMC Software Incorporated† | | | | | | | 761 | | | | 24,946 | |
CA Incorporated | | | | | | | 1,655 | | | | 33,456 | |
Citrix Systems Incorporated† | | | | | | | 834 | | | | 50,640 | |
Electronic Arts Incorporated† | | | | | | | 1,482 | | | | 30,529 | |
Intuit Incorporated | | | | | | | 1,329 | | | | 69,892 | |
Microsoft Corporation | | | | | | | 33,488 | | | | 869,348 | |
Oracle Corporation | | | | | | | 17,600 | | | | 451,440 | |
Red Hat Incorporated†« | | | | | | | 862 | | | | 35,592 | |
Salesforce.com Incorporated†« | | | | | | | 608 | | | | 61,688 | |
Symantec Corporation† | | | | | | | 3,297 | | | | 51,598 | |
| | | | |
| | | | | | | | | | | 1,771,937 | |
| | | | | | | | | | | | |
| | | | |
Materials: 1.99% | | | | | | | | | | | | |
| | | | |
| Chemicals: 1.27% | | | | | | | | | | | | |
Air Products & Chemicals Incorporated | | | | | | | 941 | | | | 80,164 | |
Airgas Incorporated | | | | | | | 305 | | | | 23,814 | |
CF Industries Holdings Incorporated | | | | | | | 292 | | | | 42,334 | |
Dow Chemical Company | | | | | | | 5,286 | | | | 152,025 | |
E.I. du Pont de Nemours & Company | | | | | | | 4,132 | | | | 189,163 | |
Eastman Chemical Company | | | | | | | 615 | | | | 24,022 | |
Ecolab Incorporated | | | | | | | 1,342 | | | | 77,581 | |
FMC Corporation | | | | | | | 314 | | | | 27,017 | |
International Flavors & Fragrances Incorporated | | | | | | | 361 | | | | 18,924 | |
Monsanto Company | | | | | | | 2,394 | | | | 167,748 | |
Mosaic Company | | | | | | | 1,331 | | | | 67,122 | |
PPG Industries Incorporated | | | | | | | 690 | | | | 57,608 | |
Praxair Incorporated | | | | | | | 1,340 | | | | 143,246 | |
Sherwin-Williams Company | | | | | | | 385 | | | | 34,369 | |
| | | | | | |
| Portfolio of Investments—December 31, 2011 | | Wells Fargo Advantage VT Index Asset Allocation Fund | | | 23 | |
| | | | | | | | | | | | |
| Security Name | | | | | | Shares | | | Value | |
| | | | | | | | | | | | |
| | | | |
| Chemicals (continued) | | | | | | | | | | | | |
Sigma-Aldrich Corporation« | | | | | | | 538 | | | $ | 33,603 | |
| | | | |
| | | | | | | | | | | 1,138,740 | |
| | | | | | | | | | | | |
| | | | |
| Construction Materials: 0.02% | | | | | | | | | | | | |
Vulcan Materials Company | | | | | | | 578 | | | | 22,744 | |
| | | | | | | | | | | | |
| | | | |
| Containers & Packaging: 0.08% | | | | | | | | | | | | |
Ball Corporation | | | | | | | 727 | | | | 25,961 | |
Bemis Company Incorporated | | | | | | | 460 | | | | 13,837 | |
Owens-Illinois Incorporated† | | | | | | | 734 | | | | 14,225 | |
Sealed Air Corporation | | | | | | | 859 | | | | 14,783 | |
| | | | |
| | | | | | | | | | | 68,806 | |
| | | | | | | | | | | | |
| | | | |
| Metals & Mining: 0.53% | | | | | | | | | | | | |
Alcoa Incorporated | | | | | | | 4,760 | | | | 41,174 | |
Allegheny Technologies Incorporated« | | | | | | | 475 | | | | 22,705 | |
Cliffs Natural Resources Incorporated | | | | | | | 639 | | | | 39,842 | |
Freeport-McMoRan Copper & Gold Incorporated Class B | | | | | | | 4,239 | | | | 155,953 | |
Newmont Mining Corporation | | | | | | | 2,213 | | | | 132,802 | |
Nucor Corporation« | | | | | | | 1,416 | | | | 56,031 | |
Titanium Metals Corporation | | | | | | | 368 | | | | 5,513 | |
United States Steel Corporation | | | | | | | 644 | | | | 17,040 | |
| | | | |
| | | | | | | | | | | 471,060 | |
| | | | | | | | | | | | |
| | | | |
| Paper & Forest Products: 0.09% | | | | | | | | | | | | |
International Paper Company« | | | | | | | 1,954 | | | | 57,838 | |
MeadWestvaco Corporation | | | | | | | 763 | | | | 22,852 | |
| | | | |
| | | | | | | | | | | 80,690 | |
| | | | | | | | | | | | |
| | | | |
Telecommunication Services: 1.81% | | | | | | | | | | | | |
| | | | |
| Diversified Telecommunication Services: 1.64% | | | | | | | | | | | | |
AT&T Incorporated | | | | | | | 26,506 | | | | 801,541 | |
CenturyTel Incorporated | | | | | | | 2,762 | | | | 102,746 | |
Frontier Communications Corporation« | | | | | | | 4,451 | | | | 22,923 | |
Verizon Communications Incorporated« | | | | | | | 12,663 | | | | 508,040 | |
Windstream Corporation« | | | | | | | 2,606 | | | | 30,594 | |
| | | | |
| | | | | | | | | | | 1,465,844 | |
| | | | | | | | | | | | |
| | | | |
| Wireless Telecommunication Services: 0.17% | | | | | | | | | | | | |
American Tower Corporation Class A | | | | | | | 1,757 | | | | 105,438 | |
MetroPCS Communications Incorporated† | | | | | | | 1,312 | | | | 11,388 | |
Sprint Nextel Corporation† | | | | | | | 13,400 | | | | 31,356 | |
| | | | |
| | | | | | | | | | | 148,182 | |
| | | | | | | | | | | | |
| | | | |
Utilities: 2.20% | | | | | | | | | | | | |
| | | | |
| Electric Utilities: 1.28% | | | | | | | | | | | | |
American Electric Power Company Incorporated | | | | | | | 2,160 | | | | 89,230 | |
Consolidated Edison Incorporated« | | | | | | | 1,310 | | | | 81,259 | |
Duke Energy Corporation« | | | | | | | 5,961 | | | | 131,142 | |
| | | | |
| 24 | | Wells Fargo Advantage VT Index Asset Allocation Fund | | Portfolio of Investments—December 31, 2011 |
| | | | | | | | | | | | | | |
| Security Name | | | | | | | Shares | | | Value | |
| | | | | | | | | | | | | | |
| | | | |
| Electric Utilities (continued) | | | | | | | | | | | | | | |
Edison International | | | | | | | | | 1,457 | | | $ | 60,320 | |
Entergy Corporation« | | | | | | | | | 787 | | | | 57,490 | |
Exelon Corporation« | | | | | | | | | 2,965 | | | | 128,592 | |
FirstEnergy Corporation« | | | | | | | | | 1,870 | | | | 82,841 | |
Nextera Energy Incorporated | | | | | | | | | 1,889 | | | | 115,002 | |
Northeast Utilities | | | | | | | | | 791 | | | | 28,531 | |
Pepco Holdings Incorporated« | | | | | | | | | 1,015 | | | | 20,605 | |
Pinnacle West Capital Corporation | | | | | | | | | 488 | | | | 23,512 | |
PPL Corporation | | | | | | | | | 2,586 | | | | 76,080 | |
Progress Energy Incorporated | | | | | | | | | 1,319 | | | | 73,890 | |
The Southern Company« | | | | | | | | | 3,855 | | | | 178,448 | |
| | | | |
| | | | | | | | | | | | | 1,146,942 | |
| | | | | | | | | | | | | | |
| | | | |
| Gas Utilities: 0.07% | | | | | | | | | | | | | | |
AGL Resources Incorporated | | | | | | | | | 523 | | | | 22,102 | |
ONEOK Incorporated | | | | | | | | | 460 | | | | 39,877 | |
| | | | |
| | | | | | | | | | | | | 61,979 | |
| | | | | | | | | | | | | | |
| | | | |
| Independent Power Producers & Energy Traders: 0.10% | | | | | | | | | | | | | | |
AES Corporation† | | | | | | | | | 2,883 | | | | 34,135 | |
Constellation Energy Group Incorporated | | | | | | | | | 901 | | | | 35,743 | |
NRG Energy Incorporated† | | | | | | | | | 1,028 | | | | 18,627 | |
| | | | |
| | | | | | | | | | | | | 88,505 | |
| | | | | | | | | | | | | | |
| | | | |
| Multi-Utilities: 0.75% | | | | | | | | | | | | | | |
Ameren Corporation | | | | | | | | | 1,083 | | | | 35,880 | |
CenterPoint Energy Incorporated | | | | | | | | | 1,905 | | | | 38,271 | |
CMS Energy Corporation« | | | | | | | | | 1,127 | | | | 24,884 | |
Dominion Resources Incorporated« | | | | | | | | | 2,547 | | | | 135,195 | |
DTE Energy Company | | | | | | | | | 757 | | | | 41,219 | |
Integrys Energy Group Incorporated | | | | | | | | | 348 | | | | 18,855 | |
NiSource Incorporated« | | | | | | | | | 1,257 | | | | 29,929 | |
PG&E Corporation | | | | | | | | | 1,815 | | | | 74,814 | |
Public Service Enterprise Group Incorporated | | | | | | | | | 2,262 | | | | 74,669 | |
SCANA Corporation | | | | | | | | | 516 | | | | 23,251 | |
Sempra Energy | | | | | | | | | 1,071 | | | | 58,905 | |
TECO Energy Incorporated | | | | | | | | | 965 | | | | 18,470 | |
Wisconsin Energy Corporation« | | | | | | | | | 1,047 | | | | 36,603 | |
Xcel Energy Incorporated | | | | | | | | | 2,169 | | | | 59,951 | |
| | | | |
| | | | | | | | | | | | | 670,896 | |
| | | | | | | | | | | | | | |
| | | | |
Total Common Stocks (Cost $44,371,757) | | | | | | | | | | | | | 50,927,931 | |
| | | | | | | | | | | | | | |
| | | | |
| | | Dividend Yield | | | | | | | | | |
| Preferred Stocks: 0.00% | | | | | | | | | | | | | | |
| | | | |
Consumer Discretionary: 0.00% | | | | | | | | | | | | | | |
| | | | |
| Specialty Retail: 0.00% | | | | | | | | | | | | | | |
Orchard Supply Hardware Corporation Series A(a)† | | | 0.00 | % | | | | | 7 | | | | 26 | |
| | | | | | | | | | | | | | |
| | | | |
Total Preferred Stocks (Cost $25) | | | | | | | | | | | | | 26 | |
| | | | | | | | | | | | | | |
| | | | | | |
| Portfolio of Investments—December 31, 2011 | | Wells Fargo Advantage VT Index Asset Allocation Fund | | | 25 | |
| | | | | | | | | | | | | | | | |
| Security Name | | Interest Rate | | | Maturity Date | | | Principal | | | Value | |
| | | | | | | | | | | | | | | | |
| | | | |
U.S. Treasury Securities: 36.22% | | | | | | | | | | | | | | | | |
U.S. Treasury Bond | | | 3.50 | % | | | 02/15/2039 | | | $ | 1,289,000 | | | $ | 1,447,104 | |
U.S. Treasury Bond | | | 3.75 | | | | 08/15/2041 | | | | 2,276,000 | | | | 2,670,388 | |
U.S. Treasury Bond | | | 3.88 | | | | 08/15/2040 | | | | 2,163,000 | | | | 2,587,151 | |
U.S. Treasury Bond | | | 4.25 | | | | 05/15/2039 | | | | 1,484,000 | | | | 1,884,449 | |
U.S. Treasury Bond | | | 4.25 | | | | 11/15/2040 | | | | 2,104,000 | | | | 2,677,340 | |
U.S. Treasury Bond | | | 4.38 | | | | 02/15/2038 | | | | 736,000 | | | | 950,360 | |
U.S. Treasury Bond | | | 4.38 | | | | 11/15/2039 | | | | 2,010,000 | | | | 2,604,520 | |
U.S. Treasury Bond | | | 4.38 | | | | 05/15/2040 | | | | 2,084,000 | | | | 2,701,385 | |
U.S. Treasury Bond | | | 4.25 | | | | 05/15/2041 | | | | 2,224,000 | | | | 2,891,200 | |
U.S. Treasury Bond | | | 4.50 | | | | 02/15/2036 | | | | 1,195,000 | | | | 1,562,463 | |
U.S. Treasury Bond | | | 4.50 | | | | 05/15/2038 | | | | 920,000 | | | | 1,211,094 | |
U.S. Treasury Bond | | | 4.50 | | | | 08/15/2039 | | | | 1,509,000 | | | | 1,991,645 | |
U.S. Treasury Bond | | | 4.63 | | | | 02/15/2040 | | | | 1,925,000 | | | | 2,591,231 | |
U.S. Treasury Bond | | | 4.75 | | | | 02/15/2037 | | | | 668,000 | | | | 906,706 | |
U.S. Treasury Bond | | | 4.75 | | | | 02/15/2041 | | | | 1,930,000 | | | | 2,654,655 | |
U.S. Treasury Bond | | | 5.00 | | | | 05/15/2037 | | | | 748,000 | | | | 1,051,642 | |
| | | | |
Total U.S. Treasury Securities (Cost $25,917,313) | | | | | | | | | | | | | | | 32,383,333 | |
| | | | | | | | | | | | | | | | |
| | | | |
Other: 0.65% | | | | | | | | | | | | | | | | |
Gryphon Funding Limited, Pass-Through Entity(a)(i)(v) | | | | | | | | | | | 406,693 | | | | 113,874 | |
VFNC Corporation, Pass-Through Entity, 0.30%(a)(i)(v)144A± | | | | | | | | | | | 1,092,611 | | | | 469,823 | |
| | | | |
Total Other (Cost $262,519) | | | | | | | | | | | | | | | 583,697 | |
| | | | | | | | | | | | | | | | |
| | | | |
| | | Yield | | | | | | Shares | | | | |
| Short-Term Investments: 17.20% | | | | | | | | | | | | | | | | |
| | | | |
| Investment Companies: 14.61% | | | | | | | | | | | | | | | | |
Wells Fargo Advantage Cash Investment Money Market Fund, Institutional Class(l)(u) | | | 0.04 | | | | | | | | 3,329,088 | | | | 3,329,088 | |
Wells Fargo Securities Lending Cash Investments, LLC(l)(v)(u)(r) | | | 0.12 | | | | | | | | 9,730,579 | | | | 9,730,579 | |
| | | | |
| | | | | | | | | | | | | | | 13,059,667 | |
| | | | | | | | | | | | | | | | |
| | | | |
| | | | | | Maturity Date | | | Principal | | | | |
| U.S. Treasury Securities: 2.59% | | | | | | | | | | | | | | | | |
U.S. Treasury Bill# | | | 0.01 | | | | 02/02/2012 | | | $ | 840,000 | | | | 839,992 | |
U.S. Treasury Bill# | | | 0.02 | | | | 04/05/2012 | | | | 30,000 | | | | 29,999 | |
U.S. Treasury Bill# | | | 0.12 | | | | 05/03/2012 | | | | 1,450,000 | | | | 1,449,878 | |
| | | | |
| | | | | | | | | | | | | | | 2,319,869 | |
| | | | | | | | | | | | | | | | |
| | | | |
Total Short-Term Investments (Cost $15,379,442) | | | | | | | | | | | | | | | 15,379,536 | |
| | | | | | | | | | | | | | | | |
| | | | | | | | |
| Total Investments in Securities | | | | | | | | |
| (Cost $85,931,056)* | | | 111.04 | % | | | 99,274,523 | |
Other Assets and Liabilities, Net | | | (11.04 | ) | | | (9,872,234 | ) |
| | | | | | | | |
| Total Net Assets | | | 100.00 | % | | $ | 89,402,289 | |
| | | | | | | | |
| | | | |
| 26 | | Wells Fargo Advantage VT Index Asset Allocation Fund | | Portfolio of Investments—December 31, 2011 |
| † | Non-income earning security. |
| « | All or a portion of this security is on loan. |
| (a) | Security is fair valued by the Management Valuation Team, and in certain instances by the Board of Trustees, in accordance with procedures approved by the Board of Trustees. |
| (l) | Investment in an affiliate. The total cost of affiliated investments is $14,041,272. |
| 144A | Security that may be resold to “qualified institutional buyers” under Rule 144A or security offered pursuant to Section 4(2) of the Securities Act of 1933, as amended. |
| ± | Variable rate investment. |
| (i) | Illiquid security for which the designation as illiquid is unaudited. |
| (v) | Security represents investment of cash collateral received from securities on loan. |
| (u) | Rate shown is the 7-day annualized yield at period end. |
| (r) | The investment company is exempt from registration under Section 3(c)(7) of the 1940 Act. |
| # | All or a portion of this security is segregated as collateral for investments in derivative instruments. |
| * | Cost for federal income tax purposes is $88,561,894 and net unrealized appreciation (depreciation) consists of: |
| | | | |
Gross unrealized appreciation | | $ | 24,568,661 | |
Gross unrealized depreciation | | | (13,856,032 | ) |
| | | | |
Net unrealized appreciation | | $ | 10,712,629 | |
The accompanying notes are an integral part of these financial statements.
| | | | | | |
| Statement of Assets and Liabilities—December 31, 2011 | | Wells Fargo Advantage VT Index Asset Allocation Fund | | | 27 | |
| | | | |
| | | | |
| |
Assets | | | | |
Investments | | | | |
In unaffiliated securities (including securities on loan), at value | | $ | 85,564,771 | |
In affiliated securities, at value | | | 13,709,752 | |
| | | | |
Total investments, at value (see cost below) | | | 99,274,523 | |
Receivable for investments sold | | | 8,120 | |
Receivable for Fund shares sold | | | 28,517 | |
Receivable for dividends and interest | | | 368,103 | |
Receivable for securities lending income | | | 986 | |
Prepaid expenses and other assets | | | 828 | |
| | | | |
Total assets | | | 99,681,077 | |
| | | | |
| |
Liabilities | | | | |
Payable for Fund shares redeemed | | | 51,469 | |
Payable upon receipt of securities loaned | | | 9,993,099 | |
Payable for daily variation margin on open futures contracts | | | 139,225 | |
Advisory fee payable | | | 26,599 | |
Distribution fees payable | | | 19,491 | |
Due to other related parties | | | 10,069 | |
Accrued expenses and other liabilities | | | 38,836 | |
| | | | |
Total liabilities | | | 10,278,788 | |
| | | | |
Total net assets | | $ | 89,402,289 | |
| | | | |
| |
NET ASSETS CONSIST OF | | | | |
Paid-in capital | | $ | 107,354,986 | |
Accumulated net realized losses on investments | | | (31,785,134 | ) |
Net unrealized gains on investments | | | 13,832,437 | |
| | | | |
Total net assets | | $ | 89,402,289 | |
| | | | |
| |
COMPUTATION OF NET ASSET VALUE PER SHARE1 | | | | |
Net assets – Class 2 | | $ | 89,402,289 | |
Shares outstanding – Class 2 | | | 7,396,366 | |
Net asset value per share – Class 2 | | | $12.09 | |
| |
Total investments, at cost | | $ | 85,931,056 | |
| | | | |
Securities on loan, at value | | $ | 9,707,881 | |
| | | | |
| 1. | The Fund has an unlimited number of authorized shares. |
The accompanying notes are an integral part of these financial statements.
| | | | |
| 28 | | Wells Fargo Advantage VT Index Asset Allocation Fund | | Statement of Operations—Year Ended December 31, 2011 |
| | | | |
| | | | |
| |
Investment income | | | | |
Interest | | $ | 1,359,065 | |
Dividends | | | 1,170,808 | |
Securities lending income, net | | | 19,693 | |
Income from affiliated securities | | | 15,039 | |
| | | | |
Total investment income | | | 2,564,605 | |
| | | | |
| |
Expenses | | | | |
Advisory fee | | | 523,480 | |
Administration fees | | | | |
Fund level | | | 47,588 | |
Class 2 | | | 76,143 | |
Distribution fees | | | | |
Class 2 | | | 237,945 | |
Custody and accounting fees | | | 47,545 | |
Professional fees | | | 36,361 | |
Shareholder report expenses | | | 11,342 | |
Trustees’ fees and expenses | | | 16,312 | |
Other fees and expenses | | | 9,045 | |
| | | | |
Total expenses | | | 1,005,761 | |
Less: Fee waivers and/or expense reimbursements | | | (59,589 | ) |
| | | | |
Net expenses | | | 946,172 | |
| | | | |
Net investment income | | | 1,618,433 | |
| | | | |
| |
REALIZED AND UNREALIZED GAINS (LOSSES) ON INVESTMENTS | | | | |
| |
Net realized gains (losses) on: | | | | |
Unaffiliated securities | | | 3,762,024 | |
Affiliated securities | | | (78,827 | ) |
Futures transactions | | | (3,425,674 | ) |
| | | | |
Net realized gains on investments | | | 257,523 | |
| | | | |
| |
Net change in unrealized gains (losses) on: | | | | |
Unaffiliated securities | | | 5,137,125 | |
Affiliated securities | | | (16,257 | ) |
Futures transactions | | | (1,021,496 | ) |
| | | | |
Net change in unrealized gains (losses) on investments | | | 4,099,372 | |
| | | | |
Net realized and unrealized gains (losses) on investments | | | 4,356,895 | |
| | | | |
Net increase in net assets resulting from operations | | $ | 5,975,328 | |
| | | | |
The accompanying notes are an integral part of these financial statements.
| | | | | | |
| Statements of Changes in Net Assets | | Wells Fargo Advantage VT Index Asset Allocation Fund | | | 29 | |
| | | | | | | | | | | | | | | | |
| | | Year Ended
December 31,2011 | | | Year Ended
December 31, 2010 | |
| | | | |
Operations | | | | | | | | | | | | | | | | |
Net investment income | | | | | | $ | 1,618,433 | | | | | | | $ | 1,836,429 | |
Net realized gains on investments | | | | | | | 257,523 | | | | | | | | 160,010 | |
Net change in unrealized gains (losses) on investments | | | | | | | 4,099,372 | | | | | | | | 10,765,649 | |
| | | | | | | | | | | | | | | | |
Net increase in net assets resulting from operations | | | | | | | 5,975,328 | | | | | | | | 12,762,088 | |
| | | | | | | | | | | | | | | | |
| | | | |
Distributions to shareholders from | | | | | | | | | | | | | | | | |
Net investment income – Class 2 | | | | | | | (2,862,036 | ) | | | | | | | (1,839,244 | )1 |
| | | | | | | | | | | | | | | | |
| | | | |
Capital share transactions | | | Shares | | | | | | | | Shares | | | | | |
Proceeds from shares sold – Class 2 | | | 112,473 | | | | 1,333,493 | | | | 139,292 | 1 | | | 1,515,929 | 1 |
Reinvestment of distributions – Class 2 | | | 242,703 | | | | 2,862,036 | | | | 168,941 | 1 | | | 1,839,244 | 1 |
Payment for shares redeemed – Class 2 | | | (1,742,779 | ) | | | (20,852,107 | ) | | | (2,281,355 | )1 | | | (24,603,284 | )1 |
| | | | | | | | | | | | | | | | |
Net decrease in net assets resulting
from capital share transactions | | | | | | | (16,656,578 | ) | | | | | | | (21,248,111 | ) |
| | | | | | | | | | | | | | | | |
Total decrease in net assets | | | | | | | (13,543,286 | ) | | | | | | | (10,325,267 | ) |
| | | | | | | | | | | | | | | | |
| | | | |
Net assets | | | | | | | | | | | | | | | | |
Beginning of period | | | | | | | 102,945,575 | | | | | | | | 113,270,842 | |
| | | | | | | | | | | | | | | | |
End of period | | | | | | $ | 89,402,289 | | | | | | | $ | 102,945,575 | |
| | | | | | | | | | | | | | | | |
Undistributed net investment income | | | | | | $ | 0 | | | | | | | $ | 87,874 | |
| | | | | | | | | | | | | | | | |
| 1. | After the close of business on July 16, 2010, existing shares of the Fund were renamed Class 2 shares. |
The accompanying notes are an integral part of these financial statements.
| | | | |
| 30 | | Wells Fargo Advantage VT Index Asset Allocation Fund | | Financial Highlights |
(For a share outstanding throughout each period)
| | | | | | | | | | | | | | | | | | | | |
| | | Year Ended December 31, | |
| Class 21 | | 2011 | | | 2010 | | | 2009 | | | 2008 | | | 2007 | |
Net asset value, beginning of period | | $ | 11.72 | | | $ | 10.53 | | | $ | 9.31 | | | $ | 14.64 | | | $ | 14.13 | |
Net investment income | | | 0.21 | | | | 0.20 | | | | 0.19 | | | | 0.30 | | | | 0.34 | |
Net realized and unrealized gains (losses) on investments | | | 0.54 | | | | 1.18 | | | | 1.22 | | | | (4.32 | ) | | | 0.73 | |
| | | | | | | | | | | | | | | | | | | | |
Total from investment operations | | | 0.75 | | | | 1.38 | | | | 1.41 | | | | (4.02 | ) | | | 1.07 | |
Distributions to shareholders from | | | | | | | | | | | | | | | | | | | | |
Net investment income | | | (0.38 | ) | | | (0.19 | ) | | | (0.19 | ) | | | (0.30 | ) | | | (0.33 | ) |
Net realized gains | | | 0.00 | | | | 0.00 | | | | 0.00 | | | | (1.01 | ) | | | (0.23 | ) |
| | | | | | | | | | | | | | | | | | | | |
Total distributions to shareholders | | | (0.38 | ) | | | (0.19 | ) | | | (0.19 | ) | | | (1.31 | ) | | | (0.56 | ) |
Net asset value, end of period | | | $12.09 | | | | $11.72 | | | | $10.53 | | | | $9.31 | | | | $14.64 | |
Total return | | | 6.48 | % | | | 13.29 | % | | | 15.46 | % | | | (29.11 | )% | | | 7.60 | % |
Ratios to average net assets (annualized) | | | | | | | | | | | | | | | | | | | | |
Gross expenses | | | 1.06 | % | | | 1.10 | % | | | 1.07 | % | | | 1.07 | % | | | 1.02 | % |
Net expenses | | | 0.99 | % | | | 1.00 | % | | | 1.00 | % | | | 1.00 | % | | | 1.00 | % |
Net investment income | | | 1.70 | % | | | 1.76 | % | | | 2.01 | % | | | 2.37 | % | | | 2.26 | % |
Supplemental data | | | | | | | | | | | | | | | | | | | | |
Portfolio turnover rate | | | 17 | % | | | 25 | % | | | 43 | % | | | 21 | % | | | 25 | % |
Net assets, end of period (000’s omitted) | | | $89,402 | | | | $102,946 | | | | $113,271 | | | | $125,958 | | | | $254,054 | |
| 1. | After the close of business on July 16, 2010, existing shares of the Fund were renamed Class 2 shares. |
The accompanying notes are an integral part of these financial statements.
| | | | | | |
| Notes to Financial Statements | | Wells Fargo Advantage VT Index Asset Allocation Fund | | | 31 | |
1. ORGANIZATION
Wells Fargo Variable Trust (the “Trust”), a Delaware statutory trust organized on March 10, 1999, is an open-end management investment company registered under the Investment Company Act of 1940, as amended (the “1940 Act”). These financial statements report on Wells Fargo Advantage VT Index Asset Allocation Fund (the “Fund”) which is a diversified series of the Trust.
2. SIGNIFICANT ACCOUNTING POLICIES
The following significant accounting policies, which are consistently followed in the preparation of the financial statements of the Fund, are in conformity with U.S. generally accepted accounting principles which require management to make estimates and assumptions that affect the reported amounts of assets and liabilities, disclosure of contingent assets and liabilities at the date of the financial statements, and the reported amounts of revenues and expenses during the reporting period. Actual results could differ from those estimates.
Securities valuation
Investments in equity securities are valued each business day as of the close of regular trading on the New York Stock Exchange, which is usually 4:00 p.m. (Eastern Time). Securities which are traded on a national or foreign securities exchange are valued at the last reported sales price, except that securities listed on The Nasdaq Stock Market, Inc. (“Nasdaq”) are valued at the Nasdaq Official Closing Price (“NOCP”), and if no NOCP is available, then at the last reported sales price. If no sales price is shown on the Nasdaq, the bid price will be used. In the absence of any sale of securities listed on the Nasdaq, and in the case of other securities (including U.S. Government obligations, but excluding debt securities maturing in 60 days or less), the price will be deemed “stale” and the valuations will be determined in accordance with the Fund’s Fair Value Procedures.
Fixed income securities with maturities exceeding 60 days are valued based on available evaluated prices received from an independent pricing service approved by the Board of Trustees which may utilize both transaction data and market information such as yield, prices of securities of comparable quality, coupon rate, maturity, type of issue, trading characteristics and other market data. If valuations are not available from the pricing service or values received are deemed not representative of market value, values will be obtained from a third party broker-dealer or determined based on the Fund’s Fair Value Procedures.
Debt securities of sufficient credit quality with original maturities of 60 days or less generally are valued at amortized cost which approximates fair value. The amortized cost method involves valuing a security at its cost, plus accretion of discount or minus amortization of premium over the period until maturity.
Investments in open-end mutual funds and non-registered investment companies are generally valued at net asset value.
Investments which are not valued using any of the methods discussed above, are valued at their fair value, as determined by procedures established in good faith and approved by the Board of Trustees.
Security loans
The Fund may lend its securities from time to time in order to earn additional income in the form of fees or interest on securities received as collateral or the investment of any cash received as collateral. The Fund continues to receive interest or dividends on the securities loaned. The Fund receives collateral in the form of cash or securities with a value at least equal to the value of the securities on loan. The value of the loaned securities is determined at the close of each business day and any additional required collateral is delivered to the Fund on the next business day. In a securities lending transaction, the net asset value of the Fund will be affected by an increase or decrease in the value of the securities loaned and by an increase or decrease in the value of the instrument in which collateral is invested. The amount of securities lending activity undertaken by the Fund fluctuates from time to time. In the event of default or bankruptcy by the borrower, the Fund may be prevented from recovering the loaned securities or gaining access to the collateral or may experience delays or costs in doing so. In addition, the investment of any cash collateral received may lose all or part of its value. The Fund has the right under the lending agreement to recover the securities from the borrower on demand.
The Fund lends its securities through an unaffiliated securities lending agent. Cash collateral received in connection with its securities lending transactions is invested in Wells Fargo Securities Lending Cash Investments, LLC (the “Cash Collateral Fund”). The Cash Collateral Fund is exempt from registration under Section 3(c)(7) of the 1940 Act and is managed by Wells Fargo Funds Management LLC (“Funds Management”) and is sub-advised by Wells Capital Management Incorporated (“Wells Capital Management”). Funds Management receives an advisory fee starting at 0.05% and declining
| | | | |
| 32 | | Wells Fargo Advantage VT Index Asset Allocation Fund | | Notes to Financial Statements |
to 0.01% as the average daily net assets of the Cash Collateral Fund increase. All of the fees received by Funds Management are paid to Wells Capital Management for its services as sub-adviser. The Cash Collateral Fund seeks to provide a positive return compared to the daily Fed Funds Open rate by investing in high-quality, U.S. dollar-denominated short-term money market instruments. Cash Collateral Fund investments are fair valued based upon the amortized cost valuation technique. Income earned from investment in the Cash Collateral Fund is included in securities lending income on the Statement of Operations.
For Wells Fargo Advantage Funds that participated in securities lending activity prior to February 13, 2009, certain structured investment vehicles purchased in a joint account by the former securities lending agent defaulted or were impaired. Certain of the Wells Fargo Advantage Funds still hold ownership interest in these structured investment vehicles, which have since been restructured as pass-through securities. If the Fund holds an ownership interest in such pass-through securities, information regarding this ownership interest can be found in the Portfolio of Investments under the category “Other”.
Futures contracts
The Fund may be subject to interest rate risk and equity price risk in the normal course of pursuing its investment objectives. The Fund may buy and sell futures contracts in order to gain exposure to, or protect against changes in, security values and interest rates. The primary risks associated with the use of futures contracts are the imperfect correlation between changes in market values of securities held by the Fund and the prices of futures contracts, and the possibility of an illiquid market.
Futures contracts are valued based upon their quoted daily settlement prices when available. The aggregate principal amounts of the contracts are not recorded in the financial statements. Fluctuations in the value of the contracts are recorded in the Statement of Assets and Liabilities as an asset or liability and in the Statement of Operations as unrealized gains or losses until the contracts are closed, at which point they are recorded as net realized gains or losses on futures contracts. With futures contracts, there is minimal counterparty risk to the Fund since futures are exchange traded and the exchange’s clearinghouse, as counterparty to all exchange traded futures, guarantees the futures against default.
Security transactions and income recognition
Securities transactions are recorded on a trade date basis. Realized gains or losses are reported on the basis of identified cost of securities delivered.
Interest income is accrued daily and bond discounts are accreted and premiums are amortized daily based on the effective interest method. To the extent debt obligations are placed on non-accrual status, any related interest income may be reduced by writing off interest receivables when the collection of all or a portion of interest has become doubtful based on consistently applied procedures. If the issuer subsequently resumes interest payments or when the collectability of interest is reasonably assured, the debt obligation is removed from non-accrual status.
Dividend income is recognized on the ex-dividend date.
Distributions to shareholders
Distributions to shareholders from net investment income and net realized gains, if any, are recorded on the ex-dividend date. Such distributions are determined in conformity with income tax regulations, which may differ from generally accepted accounting principles.
The timing and character of distributions made during the period from net investment income or net realized gains may differ from their ultimate characterization for federal income tax purposes. To the extent that these differences are permanent in nature, such amounts are reclassified within the capital accounts based on their federal tax-basis treatment. Temporary differences do not require reclassifications. The primary permanent differences causing such reclassifications are due to recognition of partnership income and dividends from certain securities. At December 31, 2011, as a result of permanent book-to-tax differences, the following reclassification adjustments were made on the Statement of Assets and Liabilities:
| | | | | | | | | | |
Paid-in Capital | | | Overdistributed Net Investment Income | | | Accumulated Net Realized
Losses on Investments | |
| $ | (1,134,474 | ) | | $ | 1,155,729 | | | $ | (21,255 | ) |
| | | | | | |
| Notes to Financial Statements | | Wells Fargo Advantage VT Index Asset Allocation Fund | | | 33 | |
Federal and other taxes
The Fund intends to continue to qualify as a regulated investment company by distributing substantially all of its investment company taxable income and any net realized capital gains (after reduction for capital loss carryforwards) sufficient to relieve it from all, or substantially all, federal income taxes. Accordingly, no provision for federal income taxes was required.
The Fund’s income and federal excise tax returns and all financial records supporting those returns for the prior three fiscal years are subject to examination by the federal and Delaware revenue authorities.
Under the recently enacted Regulated Investment Company Modernization Act of 2010, the Fund is permitted to carry forward capital losses incurred in taxable years which began after December 22, 2010 for an unlimited period. However, any losses incurred are required to be utilized prior to the losses incurred in pre-enactment taxable years. As a result of this ordering rule, pre-enactment capital loss carryforwards may be more likely to expire unused. Additionally, post-enactment capital losses that are carried forward will retain their character as either short-term or long-term capital losses rather than being considered all short-term as under previous law.
As of December 31, 2011, the Fund had net capital loss carryforwards, which are available to offset future net realized capital gains, in the amount of $23,800,005 with $20,075,438 expiring in 2016 and $3,724,567 expiring in 2017.
3. FAIR VALUATION MEASUREMENTS
Fair value measurements of investments are determined within a framework that has established a fair value hierarchy based upon the various data inputs utilized in determining the value of the Fund’s investments. The three-level hierarchy gives the highest priority to unadjusted quoted prices in active markets for identical assets or liabilities (Level 1) and the lowest priority to significant unobservable inputs (Level 3). The Fund’s investments are classified within the fair value hierarchy based on the lowest level of input that is significant to the fair value measurement. The inputs are summarized into three broad levels as follows:
| n | | Level 1 – quoted prices in active markets for identical securities |
| n | | Level 2 – other significant observable inputs (including quoted prices for similar securities, interest rates, prepayment speeds, credit risk, etc.) |
| n | | Level 3 – significant unobservable inputs (including the Fund’s own assumptions in determining the fair value of investments) |
The inputs or methodologies used for valuing securities are not necessarily an indication of the risk associated with investing in those securities.
As of December 31, 2011, the inputs used in valuing the Fund’s assets, which are carried at fair value, were as follows:
| | | | | | | | | | | | | | | | |
| Investments in Securities | | Quoted Prices (Level 1) | | | Significant Other
Observable Inputs (Level 2) | | | Significant Unobservable Inputs (Level 3) | | | Total | |
Equity securities | | | | | | | | | | | | | | | | |
Common stocks | | $ | 50,927,905 | | | $ | 26 | | | $ | 0 | | | $ | 50,927,931 | |
Preferred stocks | | | 0 | | | | 26 | | | | 0 | | | | 26 | |
U.S. Treasury securities | | | 32,383,333 | | | | 0 | | | | 0 | | | | 32,383,333 | |
Other | | | 0 | | | | 0 | | | | 583,697 | | | | 583,697 | |
Short-term investments | | | | | | | | | | | | | | | | |
Investment companies | | | 3,329,088 | | | | 9,730,579 | | | | 0 | | | | 13,059,667 | |
U.S. Treasury securities | | | 2,319,869 | | | | 0 | | | | 0 | | | | 2,319,869 | |
| | | $ | 88,960,195 | | | $ | 9,730,631 | | | $ | 583,697 | | | $ | 99,274,523 | |
Further details on the major security types listed above can be found in the Portfolio of Investments.
| | | | |
| 34 | | Wells Fargo Advantage VT Index Asset Allocation Fund | | Notes to Financial Statements |
As of December 31, 2011, the inputs used in valuing the Fund’s other financial instruments, which are carried at fair value, were as follows:
| | | | | | | | | | | | | | | | |
| Other financial instruments | | Quoted Prices (Level 1) | | | Significant Other
Observable Inputs (Level 2) | | | Significant Unobservable Inputs (Level 3) | | | Total | |
Futures contracts+ | | $ | 488,970 | | | $ | 0 | | | $ | 0 | | | $ | 488,970 | |
| + | Futures contracts are presented at the unrealized gains or losses on the instrument. |
Transfers in and transfers out are recognized at the end of the reporting period. For the year ended December 31, 2011, the Fund did not have any significant transfers into/out of Level 1 and Level 2.
The following is a reconciliation of assets in which significant unobservable inputs (Level 3) were used in determining fair value:
| | | | |
| | | Other | |
Balance as of December 31, 2010 | | $ | 967,562 | |
Accrued discounts (premiums) | | | 0 | |
Realized gains (losses) | | | 0 | |
Change in unrealized gains (losses) | | | (31,477 | ) |
Purchases | | | 0 | |
Sales | | | (352,388 | ) |
Transfers into Level 3 | | | 0 | |
Transfers out of Level 3 | | | 0 | |
Balance as of December 31, 2011 | | $ | 583,697 | |
Change in unrealized gains (losses)
relating to securities still held at December 31, 2011 | | $ | (193,364 | ) |
4. TRANSACTIONS WITH AFFILIATES AND OTHER EXPENSES
Advisory fee
The Trust has entered into an advisory contract with Funds Management, an indirect wholly owned subsidiary of Wells Fargo & Company (“Wells Fargo”). The adviser is responsible for implementing investment policies and guidelines and for supervising the sub-adviser, who is responsible for day-to-day portfolio management of the Fund.
Pursuant to the contract, Funds Management is entitled to receive an annual advisory fee starting at 0.55% and declining to 0.40% as the average daily net assets of the Fund increase. For the year ended December 31, 2011, the advisory fee was equivalent to an annual rate of 0.55% of the Fund’s average daily net assets.
Funds Management may retain the services of certain sub-advisers to provide daily portfolio management to the Fund. The fees related to sub-advisory services are borne directly by Funds Management and do not increase the overall fees paid by the Fund. Wells Capital Management, an affiliate of Funds Management, is the sub-adviser to the Fund and is entitled to receive a fee from Funds Management at an annual rate starting at 0.15% and declining to 0.10% as the average daily net assets of the Fund increase.
Administration and transfer agent fees
The Trust has entered into an administration agreement with Funds Management. Under this agreement, for providing administrative services, which includes paying fees and expenses for services provided by the transfer agent, sub-transfer agents, omnibus account servicers and record-keepers, Funds Management is entitled to receive from the Fund an annual fund level administration fee starting at 0.05% and declining to 0.03% as the average daily net assets of the Fund increase and for Class 2 shares a class level administration fee of 0.08% of its average daily net assets.
Funds Management has contractually waived and/or reimbursed advisory and administration fees to the extent necessary to maintain certain net operating expense ratios for the Fund. Waiver of fees and/or reimbursement of expenses by Funds Management were made first from fund level expenses on a proportionate basis and then from class specific expenses.
| | | | | | |
| Notes to Financial Statements | | Wells Fargo Advantage VT Index Asset Allocation Fund | | | 35 | |
Distribution fees
The Trust has adopted a Distribution Plan for Class 2 shares of the Fund pursuant to Rule 12b-1 under the 1940 Act. Distribution fees are charged to Class 2 shares and paid to Wells Fargo Funds Distributor, LLC, the principal underwriter, at an annual rate of 0.25% of its average daily net assets.
5. INVESTMENT PORTFOLIO TRANSACTIONS
Purchases and sales of investments, excluding short-term securities (securities with maturities of one year or less at purchase date), for the year ended December 31, 2011 were as follows:
| | | | | | | | | | | | |
Purchases at Cost | | | Sales Proceeds | |
U.S. Government | | Non-U.S. Government | | | U.S. Government | | | Non-U.S. Government | |
| $10,490,999 | | $ | 5,126,236 | | | $ | 7,460,472 | | | $ | 31,415,700 | |
6. DERIVATIVE TRANSACTIONS
During the year ended December 31, 2011, the Fund entered into futures contracts to gain market exposure to certain asset classes consistent with an active asset allocative strategy.
At December 31, 2011, the Fund had long and short futures contracts outstanding as follows:
| | | | | | | | | | | | |
| Expiration Date | | Contracts | | Type | | Contract Value at December 31, 2011 | | | Net Unrealized
Gains (Losses) | |
| March 2012 | | 3 Long | | 30-Year U.S. Treasury Bonds | | $ | 434,438 | | | $ | 1,562 | |
| March 2012 | | 149 Short | | 30-Year U.S. Treasury Bonds | | | 21,577,063 | | | | 52,383 | |
| March 2012 | | 78 Long | | S&P 500 Index | | | 24,425,700 | | | | 435,025 | |
The Fund had average contract amounts of $25,647,588 and $23,749,685 in long and short futures contracts, respectively, during the year ended December 31, 2011.
A summary of derivative instruments by primary risk exposure is outlined in the following tables.
The fair value of derivative instruments as of December 31, 2011 was as follows for the Fund:
| | | | | | |
| | | Asset Derivatives | |
| | | Balance Sheet Location | | Fair Value | |
Interest rate contracts | | Net assets – Net unrealized gains on investments | | $ | 53,945 | * |
Equity contracts | | Net assets – Net unrealized gains on investments | | | 435,025 | * |
| | | | | $ | 488,970 | |
| * | Amount represents cumulative unrealized gains (losses) on futures contracts. Only the variation margin as of December 31, 2011 is reported separately on the Statement of Assets and Liabilities. |
The effect of derivative instruments on the Statement of Operations for the year ended December 31, 2010 was as follows for the Fund:
| | | | | | | | |
| | | Amount of Realized
Gains (Losses) on
Derivatives | | | Change in Unrealized
Gains (Losses) on
Derivatives | |
Interest rate contracts | | $ | (3,966,239 | ) | | $ | (931,846 | ) |
Equity contracts | | | 540,565 | | | | (89,650 | ) |
| | | $ | (3,425,674 | ) | | $ | (1,021,496 | ) |
| | | | |
| 36 | | Wells Fargo Advantage VT Index Asset Allocation Fund | | Notes to Financial Statements |
7. BANK BORROWINGS
The Trust and Wells Fargo Funds Trust (excluding the money market funds) are parties to a $150,000,000 revolving credit agreement with State Street Bank and Trust Company, whereby the Fund is permitted to use bank borrowings for temporary or emergency purposes, such as to fund shareholder redemption requests. Interest under the credit agreement is charged to the Fund based on a borrowing rate equal to the higher of the Federal Funds rate in effect on that day plus 1.25% or the overnight LIBOR rate in effect on that day plus 1.25%. In addition, under the credit agreement, the Fund pays an annual commitment fee equal to 0.10% of the unused balance, which is allocated pro rata. Prior to September 6, 2011, the revolving credit agreement was for $125,000,000 and the annual commitment fee paid by the Fund was 0.125% of the unused balance. For the year ended December 31, 2011, the Fund paid $195 in commitment fees.
For the year ended December 31, 2011, there were no borrowings by the Fund under the agreement.
8. DISTRIBUTIONS TO SHAREHOLDERS
The tax character of distributions paid was $2,862,036 and $1,839,244 of ordinary income for the years ended December 31, 2011 and December 31, 2010, respectively.
As of December 31, 2011, the components of distributable earnings on a tax basis were as follows:
| | |
Unrealized Gains | | Capital Loss
Carryforward |
| $5,847,308 | | $(23,800,005) |
9. INDEMNIFICATION
Under the Trust’s organizational documents, the officers and directors are indemnified against certain liabilities that may arise out of performance of their duties to the Trust. Additionally, in the normal course of business, the Trust may enter into contracts with service providers that contain a variety of indemnification clauses. The Trust’s maximum exposure under these arrangements is dependent on future claims that may be made against the Fund and, therefore, cannot be estimated.
10. NEW ACCOUNTING PRONOUNCEMENTS
In May 2011, the Financial Accounting Standards Board (“FASB”) issued Accounting Standards Update (“ASU”) No. 2011-04 “Amendments to Achieve Common Fair Value Measurement and Disclosure Requirements in U.S. GAAP and IFRSs”. ASU No. 2011-04 amends FASB ASC Topic 820, Fair Value Measurements and Disclosures, to establish common requirements for measuring fair value and for disclosing information about fair value measurements in accordance with GAAP. The ASU is effective prospectively for interim and annual periods beginning after December 15, 2011. Management expects that adoption of the ASU will result in additional disclosures in the financial statements, as applicable.
In April 2011, FASB issued ASU No. 2011-03 “Reconsideration of Effective Control for Repurchase Agreements”. ASU No. 2011-03 amends FASB ASC Topic 860, Transfers and Servicing, specifically the criteria required to determine whether a repurchase agreement (repo) and similar agreements should be accounted for as sales of financial assets or secured borrowings with commitments. ASU No. 2011-03 changes the assessment of effective control by focusing on the transferor’s contractual rights and obligations and removing the criterion to assess its ability to exercise those rights or honor those obligations. This could result in changes to the way entities account for certain transactions including repurchase agreements, mortgage dollar rolls and reverse repurchase agreements. The ASU will become effective on a prospective basis for new transfers and modifications to existing transactions as of the beginning of the first interim or annual period beginning on or after December 15, 2011. Management has evaluated the impact of adopting the ASU and expects no significant changes.
| | | | | | |
| Report of Independent Registered Public Accounting Firm | | Wells Fargo Advantage VT Index Asset Allocation Fund | | | 37 | |
BOARD OF TRUSTEES AND SHAREHOLDERS OF WELLS FARGO VARIABLE TRUST:
We have audited the accompanying statement of assets and liabilities, including the portfolio of investments, of the Wells Fargo Advantage VT Index Asset Allocation Fund (the “Fund”), one of the funds constituting the Wells Fargo Variable Trust, as of December 31, 2011, and the related statement of operations for the year then ended, statements of changes in net assets for each of the years in the two-year period then ended, and the financial highlights for each of the years in the five-year period then ended. These financial statements and financial highlights are the responsibility of the Fund’s management. Our responsibility is to express an opinion on these financial statements and financial highlights based on our audits.
We conducted our audits in accordance with the standards of the Public Company Accounting Oversight Board (United States). Those standards require that we plan and perform the audit to obtain reasonable assurance about whether the financial statements and financial highlights are free of material misstatement. An audit includes examining, on a test basis, evidence supporting the amounts and disclosures in the financial statements. Our procedures included confirmation of securities owned as of December 31, 2011, by correspondence with custodian and brokers. An audit also includes assessing the accounting principles used and significant estimates made by management, as well as evaluating the overall financial statement presentation. We believe that our audits provide a reasonable basis for our opinion.
In our opinion, the financial statements and financial highlights referred to above present fairly, in all material respects, the financial position of the Wells Fargo Advantage VT Index Asset Allocation Fund as of December 31, 2011, the results of its operations for the year then ended, changes in its net assets for each of the years in the two-year period then ended, and the financial highlights for each of the years in the five-year period then ended, in conformity with U.S. generally accepted accounting principles.

Boston, Massachusetts
February 24, 2012
| | | | |
| 38 | | Wells Fargo Advantage VT Index Asset Allocation Fund | | Other Information (Unaudited) |
TAX INFORMATION
For corporate shareholders, pursuant to Section 854 of the Internal Revenue Code, 38.69% of ordinary income dividends qualify for the corporate dividends-received deduction for the fiscal year ended December 31, 2011.
PROXY VOTING INFORMATION
A description of the policies and procedures that the Fund uses to determine how to vote proxies relating to portfolio securities is available without charge, upon request, by calling 1-800-222-8222, visiting our Web site at www.wellsfargo.com/advantagefunds, or visiting the SEC Web site at www.sec.gov. Information regarding how the Fund voted proxies relating to portfolio securities during the most recent 12-month period ended June 30 is available without charge on the Fund’s Web site at www.wellsfargo.com/advantagefunds or by visiting the SEC Web site at www.sec.gov.
PORTFOLIO HOLDINGS INFORMATION
The complete portfolio holdings for the Fund are publicly available on the Fund’s Web site (www.wellsfargo.com/advantagefunds) on a monthly, 30-day or more delayed basis. In addition, top ten holdings information for the Fund is publicly available on the Fund’s Web site on a monthly, seven-day or more delayed basis. The Fund files its complete schedule of portfolio holdings with the SEC for the first and third quarters of each fiscal year on Form N-Q, which is available without charge by visiting the SEC Web site at www.sec.gov. In addition, the Fund’s Form N-Q may be reviewed and copied at the SEC’s Public Reference Room in Washington, DC, and at regional offices in New York City, at 233 Broadway, and in Chicago, at 175 West Jackson Boulevard, Suite 900. Information about the Public Reference Room may be obtained by calling 1-800-SEC-0330.
| | | | | | |
| Other Information (Unaudited) | | Wells Fargo Advantage VT Index Asset Allocation Fund | | | 39 | |
BOARD OF TRUSTEES
The following table provides basic information about the Board of Trustees (the “Trustees”) of the Trust and Officers of the Trust. This table should be read in conjunction with the Prospectus and the Statement of Additional Information1 of the Fund. Each of the Trustees and Officers listed below acts in identical capacities for the Wells Fargo Advantage family of funds, which consists of 138 funds comprising the Wells Fargo Funds Trust, Wells Fargo Variable Trust, Wells Fargo Master Trust and four closed-end funds (collectively the “Fund Complex”). All of the Trustees are also Members of the Audit and Governance Committees of each Trust in the Fund Complex. The mailing address of each Trustee and Officer is 525 Market Street, 12th Floor, San Francisco, CA 94105. Each Trustee and Officer serves an indefinite term, however, each Trustee serves such term until reaching the mandatory retirement age established by the Trustees.
Independent Trustees
| | | | | | |
Name and Year of Birth | | Position Held and Length of Service | | Principal Occupations During Past Five Years | | Other Directorships During
Past Five Years |
Peter G. Gordon
(Born 1942) | | Trustee, since 1998; Chairman, since 2005 (Lead Trustee since 2001) | | Co-Founder, Retired Chairman, President and CEO of Crystal Geyser Water Company. Trustee Emeritus, Colby College | | Asset Allocation Trust |
Isaiah Harris, Jr.
(Born 1952) | | Trustee, since 2009 | | Retired. Prior thereto, President and CEO of BellSouth Advertising and Publishing Corp. from 2005 to 2007, President and CEO of BellSouth Enterprises from 2004 to 2005 and President of BellSouth Consumer Services from 2000 to 2003. Emeritus member of the Iowa State University Foundation Board of Governors. Emeritus Member of the Advisory Board of Iowa State University School of Business. Mr. Harris is a certified public accountant. | | CIGNA Corporation; Deluxe Corporation; Asset Allocation Trust |
Judith M. Johnson
(Born 1949) | | Trustee, since 2008 | | Retired. Prior thereto, Chief Executive Officer and Chief Investment Officer of Minneapolis Employees Retirement Fund from 1996 to 2008. Ms. Johnson is an attorney, certified public accountant and a certified managerial accountant. | | Asset Allocation Trust |
Leroy Keith, Jr.
(Born 1939) | | Trustee, since 2010 | | Chairman, Bloc Global Services (development and construction). Trustee of the Evergreen Funds from 1983 to 2010. Former Managing Director, Almanac Capital Management (commodities firm), former Partner, Stonington Partners, Inc. (private equity fund), former Director, Obagi Medical Products Co. and former Director, Lincoln Educational Services. | | Trustee, Virtus Fund Complex (consisting of 40 portfolios as of 12/31/11); Asset Allocation Trust |
David F. Larcker
(Born 1950) | | Trustee, since 2009 | | James Irvin Miller Professor of Accounting at the Graduate School of Business, Stanford University, Director of Corporate Governance Research Program and Senior Faculty of The Rock Center for Corporate Governance since 2006. From 2005 to 2008, Professor of Accounting at the Graduate School of Business, Stanford University. Prior thereto, Ernst & Young Professor of Accounting at The Wharton School, University of Pennsylvania from 1985 to 2005. | | Asset Allocation Trust |
Olivia S. Mitchell
(Born 1953) | | Trustee, since 2006 | | International Foundation of Employee Benefit Plans Professor, Wharton School of the University of Pennsylvania since 1993. Director of Wharton’s Pension Research Council and Boettner Center on Pensions & Retirement Research, and Research Associate at the National Bureau of Economic Research. Previously, Cornell University Professor from 1978 to 1993. | | Asset Allocation Trust |
| | | | |
| 40 | | Wells Fargo Advantage VT Index Asset Allocation Fund | | Other Information (Unaudited) |
| | | | | | |
Name and Year of Birth | | Position Held and Length of Service | | Principal Occupations During Past Five Years | | Other Directorships During
Past Five Years |
Timothy J. Penny
(Born 1951) | | Trustee, since 1996 | | President and CEO of Southern Minnesota Initiative Foundation, a non-profit organization, since 2007 and Senior Fellow at the Humphrey Institute Policy Forum at the University of Minnesota since 1995. Member of the Board of Trustees of NorthStar Education Finance, Inc., a non-profit organization, since 2007. | | Asset Allocation Trust |
Michael S. Scofield
(Born 1943) | | Trustee, since 2010 | | Served on the Investment Company Institute’s Board of Governors and Executive Committee from 2008-2011 as well the Governing Council of the Independent Directors Council from 2006-2011 and the Independent Directors Council Executive Committee from 2008-2011. Chairman of the IDC from 2008-2010. Institutional Investor (Fund Directions) Trustee of Year in 2007. Trustee of the Evergreen Funds (and its predecessors) from 1984 to 2010. Chairman of the Evergreen Funds from 2000-2010. Former Trustee of the Mentor Funds. Retired Attorney, Law Offices of Michael S. Scofield and former Director and Chairman, Branded Media Corporation (multi-media branding company). | | Asset Allocation Trust |
Donald C. Willeke
(Born 1940) | | Trustee, since 1996 | | Principal of the law firm of Willeke & Daniels. General Counsel of the Minneapolis Employees Retirement Fund from 1984 until its consolidation into the Minnesota Public Employees Retirement Association on June 30, 2010. Director and Vice Chair of The Free Trust (non-profit corporation). Director of the American Chestnut Foundation (non-profit corporation). | | Asset Allocation Trust |
Officers
| | | | | | |
Name and Year of Birth | | Position Held and
Length of Service | | Principal Occupations During Past Five Years | | |
Karla M. Rabusch
(Born 1959) | | President, since 2003 | | Executive Vice President of Wells Fargo Bank, N.A. and President of Wells Fargo Funds Management, LLC since 2003. Senior Vice President and Chief Administrative Officer of Wells Fargo Funds Management, LLC from 2001 to 2003. | | |
C. David Messman
(Born 1960) | | Secretary, since 2000; Chief Legal Counsel, since 2003 | | Senior Vice President and Secretary of Wells Fargo Funds Management, LLC since 2001. Vice President and Managing Senior Counsel of Wells Fargo Bank, N.A. since 1996. | | |
Kasey Phillips
(Born 1970) | | Treasurer, since 2009 | | Senior Vice President of Wells Fargo Funds Management, LLC since 2009. Senior Vice President of Evergreen Investment Management Company, LLC from 2006 to 2010. Treasurer of the Evergreen Funds from 2005 to 2010. | | |
David Berardi
(Born 1975) | | Assistant Treasurer, since 2009 | | Vice President of Wells Fargo Funds Management, LLC since 2009. Vice President of Evergreen Investment Management Company, LLC from 2008 to 2010. Assistant Vice President of Evergreen Investment Services, Inc. from 2004 to 2008. Manager of Fund Reporting and Control for Evergreen Investment Management Company, LLC from 2004 to 2010. | | |
Jeremy DePalma
(Born 1974) | | Assistant Treasurer, since 2009 | | Senior Vice President of Wells Fargo Funds Management, LLC since 2009. Senior Vice President of Evergreen Investment Management Company, LLC from 2008 to 2010. Vice President, Evergreen Investment Services, Inc. from 2004 to 2007. Head of the Fund Reporting and Control Team within Fund Administration from 2005 to 2010. | | |
Debra Ann Early
(Born 1964) | | Chief Compliance Officer, since 2007 | | Chief Compliance Officer of Wells Fargo Funds Management, LLC since 2007. Chief Compliance Officer of Parnassus Investments from 2005 to 2007. Chief Financial Officer of Parnassus Investments from 2004 to 2007 and Senior Audit Manager of PricewaterhouseCoopers LLP from 1998 to 2004. | | |
| 1. | The Statement of Additional Information includes additional information about the Trustees and is available, without charge, upon request, by calling 1-800-222-8222 or by visiting the Web site at www.wellsfargo.com/advantagefunds. |
| | | | | | |
| List of Abbreviations | | Wells Fargo Advantage VT Index Asset Allocation Fund | | | 41 | |
The following is a list of common abbreviations for terms and entities which may have appeared in this report.
| ACB | — Agricultural Credit Bank |
| ADR | — American Depository Receipt |
| ADS | — American Depository Shares |
| AGC-ICC | — Assured Guaranty Corporation - Insured Custody Certificates |
| AGM | — Assured Guaranty Municipal |
| AMBAC | — American Municipal Bond Assurance Corporation |
| AMT | — Alternative Minimum Tax |
| BAN | — Bond Anticipation Notes |
| BHAC | — Berkshire Hathaway Assurance Corporation |
| CAB | — Capital Appreciation Bond |
| CCAB | — Convertible Capital Appreciation Bond |
| CDA | — Community Development Authority |
| CDO | — Collateralized Debt Obligation |
| COP | — Certificate of Participation |
| DRIVER | — Derivative Inverse Tax-Exempt Receipts |
| DW&P | — Department of Water & Power |
| DWR | — Department of Water Resources |
| ECFA | — Educational & Cultural Facilities Authority |
| EDA | — Economic Development Authority |
| EDFA | — Economic Development Finance Authority |
| ETF | — Exchange-Traded Fund |
| FFCB | — Federal Farm Credit Bank |
| FGIC | — Financial Guaranty Insurance Corporation |
| FHA | — Federal Housing Authority |
| FHLB | — Federal Home Loan Bank |
| FHLMC | — Federal Home Loan Mortgage Corporation |
| FNMA | — Federal National Mortgage Association |
| GDR | — Global Depository Receipt |
| GNMA | — Government National Mortgage Association |
| HCFR | — Healthcare Facilities Revenue |
| HEFA | — Health & Educational Facilities Authority |
| HEFAR | — Higher Education Facilities Authority Revenue |
| HFA | — Housing Finance Authority |
| HFFA | — Health Facilities Financing Authority |
| IBC | — Insured Bond Certificate |
| IDA | — Industrial Development Authority |
| IDAG | — Industrial Development Agency |
| IDR | — Industrial Development Revenue |
| KRW | — Republic of Korea Won |
| LIBOR | — London Interbank Offered Rate |
| LLC | — Limited Liability Company |
| LLP | — Limited Liability Partnership |
| MBIA | — Municipal Bond Insurance Association |
| MFHR | — Multi-Family Housing Revenue |
| MUD | — Municipal Utility District |
| NATL-RE | — National Public Finance Guarantee Corporation |
| PCFA | — Pollution Control Finance Authority |
| PCR | — Pollution Control Revenue |
| PFA | — Public Finance Authority |
| PFFA | — Public Facilities Financing Authority |
| PFOTER | — Puttable Floating Option Tax-Exempt Receipts |
| plc | — Public Limited Company |
| PUTTER | — Puttable Tax-Exempt Receipts |
| R&D | — Research & Development |
| RDA | — Redevelopment Authority |
| RDFA | — Redevelopment Finance Authority |
| REIT | — Real Estate Investment Trust |
| ROC | — Reset Option Certificates |
| SAVRS | — Select Auction Variable Rate Securities |
| SBA | — Small Business Authority |
| SFHR | — Single Family Housing Revenue |
| SFMR | — Single Family Mortgage Revenue |
| SPDR | — Standard & Poor’s Depositary Receipts |
| TAN | — Tax Anticipation Notes |
| TIPS | — Treasury Inflation-Protected Securities |
| TRAN | — Tax Revenue Anticipation Notes |
| TCR | — Transferable Custody Receipts |
| TTFA | — Transportation Trust Fund Authority |
| TVA | — Tennessee Valley Authority |
| XLCA | — XL Capital Assurance |
This page is intentionally left blank.


FOR MORE INFORMATION
More information about Wells Fargo Advantage Funds is available free upon request. To obtain literature, please write, e-mail, visit the Fund’s Web site, or call:
Wells Fargo Advantage Funds
P.O. Box 8266
Boston, MA 02266-8266
E-mail: wfaf@wellsfargo.com
Web site: www.wellsfargo.com/advantagefunds
Individual investors: 1-800-222-8222
Retail investment professionals: 1-888-877-9275
Institutional investment professionals: 1-866-765-0778
This report and the financial statements contained herein are submitted for the general information of the shareholders of Wells Fargo Advantage Funds. If this report is used for promotional purposes, distribution of the report must be accompanied or preceded by a current prospectus. For a prospectus containing more complete information, including charges and expenses, call 1-800-222-8222 or visit the Fund’s Web site at www.wellsfargo.com/advantagefunds. Please consider the investment objectives, risks, charges, and expenses of the investment carefully before investing. This and other information about Wells Fargo Advantage Funds can be found in the current prospectus. Read the prospectus carefully before you invest or send money.
Wells Fargo Funds Management, LLC, a wholly owned subsidiary of Wells Fargo & Company, provides investment advisory and administrative services for Wells Fargo Advantage Funds. Other affiliates of Wells Fargo & Company provide subadvisory and other services for the Funds. The Funds are distributed by Wells Fargo Funds Distributor, LLC, Member FINRA/SIPC, an affiliate of Wells Fargo & Company.
NOT FDIC INSURED ¡ NO BANK GUARANTEE ¡ MAY LOSE VALUE
© 2012 Wells Fargo Funds Management, LLC. All rights reserved.
| | |
| | 207572 02-12 AVT2/AR148 12-11 |

Wells Fargo Advantage
VT International Equity Fund

Annual Report
December 31, 2011
Reduce clutter. Save trees.
Sign up for electronic delivery of prospectuses and shareholder reports at www.wellsfargo.com/advantagedelivery
Contents
The views expressed and any forward-looking statements are as of December 31, 2011, unless otherwise noted, and are those of the Fund managers and/or Wells Fargo Funds Management, LLC. Discussions of individual securities, or the markets generally, or any Wells Fargo Advantage Fund are not intended as individual recommendations. Future events or results may vary significantly from those expressed in any forward-looking statements; the views expressed are subject to change at any time in response to changing circumstances in the market. Wells Fargo Funds Management, LLC, disclaims any obligation to publicly update or revise any views expressed or forward-looking statements.
NOT FDIC INSURED ¡ NO BANK GUARANTEE ¡ MAY LOSE VALUE

WELLS FARGO INVESTMENT HISTORY
| | |
| |
| 1932 | | Keystone creates one of the first mutual fund families. |
| |
| 1971 | | Wells Fargo & Company introduces one of the first institutional index funds. |
| |
| 1978 | | Wells Fargo applies Markowitz and Sharpe’s research on Modern Portfolio Theory to introduce one of the industry’s first Tactical Asset Allocation (TAA) models in institutional separately managed accounts. |
| |
| 1984 | | Wells Fargo Stagecoach Funds launches its first asset allocation fund. |
| |
| 1989 | | The Tactical Asset Allocation (TAA) Model is first applied to Wells Fargo’s asset allocation mutual funds. |
| |
| 1994 | | Wells Fargo introduces the LifePath Funds, one of the first suites of target date funds (now the Wells Fargo Advantage Dow Jones Target Date FundsSM ). |
| |
| 1996 | | Evergreen Investments and Keystone Funds merge. |
| |
| 1997 | | Wells Fargo launches Wells Fargo Advantage WealthBuilder PortfoliosSM, a fund-of-funds suite of products that includes the use of quantitative models to shift assets among investment styles. |
| |
| 1999 | | Norwest Advantage Funds and Stagecoach Funds are reorganized into Wells Fargo Funds after the merger of Norwest and Wells Fargo. |
| |
| 2002 | | Evergreen Retail and Evergreen Institutional companies form the umbrella asset management company, Evergreen Investments. |
| |
| 2005 | | The integration of Strong Funds with Wells Fargo Funds creates Wells Fargo Advantage Funds, resulting in one of the top 20 mutual fund companies in the United States. |
| |
| 2006 | | Wells Fargo Advantage Funds relaunches the target date product line as Wells Fargo Advantage Dow Jones Target Date Funds. |
| |
| 2010 | | The mergers and reorganizations of Evergreen and Wells Fargo Advantage mutual funds are completed, unifying the families under the brand of Wells Fargo Advantage Funds. |
Wells Fargo Advantage Funds®
Wells Fargo Advantage Funds skillfully guides institutions, financial advisors, and individuals through the investment terrain to help them reach their financial objectives. Everything we do on behalf of investors is backed by our unique combination of qualifications.
Strength
Our organization is built on the standards of integrity and service established by our parent company—Wells Fargo & Company—more than 150 years ago. And, because we’re part of a highly diversified financial enterprise, we offer the depth of resources to help investors succeed.
Expertise
Our multi-boutique model offers investors access to the independent thinking of premier investment managers that have been chosen for their time-tested strategies. While each team specializes in a specific investment strategy, collectively they provide investors a wide choice of distinct investment styles. Our dedication to investment excellence doesn’t end with our expertise in manager selection—risk management, analysis, and rigorous ongoing review seek to ensure each manager’s investment process remains consistent.
Partnership
Our collaborative approach is built around understanding the needs and goals of our clients. By adhering to core principles of sound judgment and steady guidance, we support you through every stage of the investment decision process.
Carefully consider a fund’s investment objectives, risks, charges, and expenses before investing. For a current prospectus and, if available, a summary prospectus, containing this and other information, visit wellsfargo.com/advantagefunds. Read it carefully before investing.
Wells Fargo Funds Management, LLC, a wholly owned subsidiary of Wells Fargo & Company, provides investment advisory and administrative services for Wells Fargo Advantage Funds®. Other affiliates of Wells Fargo & Company provide subadvisory and other services for the Funds. The Funds are distributed by Wells Fargo Funds Distributor, LLC, Member FINRA/SIPC, an affiliate of Wells Fargo & Company.
“Dow Jones®” and “Dow Jones Target Date IndexesSM” are service marks of Dow Jones Trademark Holdings, LLC (“Dow Jones”), have been licensed to CME Group Index Services LLC (“CME Indexes”) and have been sublicensed for use for certain purposes by Global Index Advisors, Inc, and Wells Fargo Funds Management, LLC. The Wells Fargo Advantage Dow Jones Target Date FundsSM based on the Dow Jones Target Date IndexesSM, are not sponsored, endorsed, sold or promoted by Dow Jones, CME Indexes or their respective affiliates and none of them makes any representation regarding the advisability of investing in such product(s).
NOT FDIC INSURED ¡ NO BANK GUARANTEE ¡ MAY LOSE VALUE
Not part of the annual report.
Wells Fargo Advantage Funds offers more than 110 mutual funds across a wide range of asset classes, representing over $216 billion in assets under management, as of December 31, 2011.
| | | | |
| Equity Funds | | | | |
Asia Pacific Fund | | Global Opportunities Fund | | Premier Large Company Growth Fund |
C&B Large Cap Value Fund | | Growth Fund | | Small Cap Opportunities Fund |
C&B Mid Cap Value Fund | | Health Care Fund | | Small Cap Value Fund |
Capital Growth Fund | | Index Fund | | Small Company Growth Fund |
Common Stock Fund | | International Equity Fund | | Small Company Value Fund |
Disciplined U.S. Core Fund | | International Value Fund | | Small/Mid Cap Core Fund |
Discovery Fund† | | Intrinsic Small Cap Value Fund | | Small/Mid Cap Value Fund |
Diversified Equity Fund | | Intrinsic Value Fund | | Social Sustainability Fund† |
Diversified International Fund | | Intrinsic World Equity Fund | | Special Mid Cap Value Fund |
Diversified Small Cap Fund | | Large Cap Core Fund | | Special Small Cap Value Fund |
Emerging Growth Fund | | Large Cap Growth Fund | | Specialized Technology Fund |
Emerging Markets Equity Fund | | Large Company Value Fund | | Strategic Large Cap Growth Fund |
Endeavor Select Fund† | | Omega Growth Fund | | Traditional Small Cap Growth Fund |
Enterprise Fund† | | Opportunity Fund† | | Utility and Telecommunications Fund |
Equity Value Fund | | Precious Metals Fund | | |
| Bond Funds | | | | |
Adjustable Rate Government Fund | | Inflation-Protected Bond Fund | | Short-Term Bond Fund |
California Limited-Term Tax-Free Fund | | Intermediate Tax/AMT-Free Fund | | Short-Term High Yield Bond Fund |
California Tax-Free Fund | | International Bond Fund | | Short-Term Municipal Bond Fund |
Colorado Tax-Free Fund | | Minnesota Tax-Free Fund | | Strategic Municipal Bond Fund |
Government Securities Fund | | Municipal Bond Fund | | Total Return Bond Fund |
High Income Fund | | North Carolina Tax-Free Fund | | Ultra Short-Term Income Fund |
High Yield Bond Fund | | Pennsylvania Tax-Free Fund | | Ultra Short-Term Municipal Income Fund |
Income Plus Fund | | Short Duration Government Bond Fund | | Wisconsin Tax-Free Fund |
| Asset Allocation Funds | | | | |
Asset Allocation Fund | | WealthBuilder Equity Portfolio† | | Target 2020 Fund† |
Conservative Allocation Fund | | WealthBuilder Growth Allocation Portfolio† | | Target 2025 Fund† |
Diversified Capital Builder Fund | | WealthBuilder Growth Balanced Portfolio† | | Target 2030 Fund† |
Diversified Income Builder Fund | | WealthBuilder Moderate Balanced Portfolio† | | Target 2035 Fund† |
Growth Balanced Fund | | WealthBuilder Tactical Equity Portfolio† | | Target 2040 Fund† |
Index Asset Allocation Fund | | Target Today Fund† | | Target 2045 Fund† |
Moderate Balanced Fund | | Target 2010 Fund† | | Target 2050 Fund† |
WealthBuilder Conservative Allocation Portfolio† | | Target 2015 Fund† | | Target 2055 Fund† |
| Money Market Funds | | | | |
100% Treasury Money Market Fund | | Heritage Money Market Fund† | | National Tax-Free Money Market Fund |
California Municipal Money Market Fund | | Money Market Fund | | Prime Investment Money Market Fund |
Cash Investment Money Market Fund | | Municipal Cash Management Money Market Fund | | Treasury Plus Money Market Fund |
Government Money Market Fund | | Municipal Money Market Fund | | |
| Variable Trust Funds1 | | | | |
VT Discovery Fund† | | VT Intrinsic Value Fund | | VT Small Cap Growth Fund |
VT Index Asset Allocation Fund | | VT Omega Growth Fund | | VT Small Cap Value Fund |
VT International Equity Fund | | VT Opportunity Fund† | | VT Total Return Bond Fund |
An investment in a money market fund is not insured or guaranteed by the Federal Deposit Insurance Corporation or any other government agency. Although the Wells Fargo Advantage Money Market Funds seek to preserve the value of your investment at $1.00 per share, it is possible to lose money by investing in a money market fund.
| 1. | The Variable Trust Funds are generally available only through insurance company variable contracts. |
| † | In this report, the Wells Fargo Advantage Discovery FundSM, Wells Fargo Advantage Endeavor Select FundSM, Wells Fargo Advantage Enterprise FundSM, Wells Fargo Advantage Opportunity FundSM, Wells Fargo Advantage Social Sustainability FundSM, Wells Fargo Advantage WealthBuilder Conservative Allocation PortfolioSM, Wells Fargo Advantage WealthBuilder Equity PortfolioSM, Wells Fargo Advantage WealthBuilder Growth Allocation PortfolioSM, Wells Fargo Advantage WealthBuilder Growth Balanced PortfolioSM, Wells Fargo Advantage WealthBuilder Moderate Balanced PortfolioSM, Wells Fargo Advantage WealthBuilder Tactical Equity PortfolioSM, Wells Fargo Advantage Dow Jones Target Today FundSM, Wells Fargo Advantage Dow Jones Target 2010 FundSM, Wells Fargo Advantage Dow Jones Target 2015 FundSM, Wells Fargo Advantage Dow Jones Target 2020 FundSM, Wells Fargo Advantage Dow Jones Target 2025 FundSM, Wells Fargo Advantage Dow Jones Target 2030 FundSM, Wells Fargo Advantage Dow Jones Target 2035 FundSM, Wells Fargo Advantage Dow Jones Target 2040 FundSM, Wells Fargo Advantage Dow Jones Target 2045 FundSM, Wells Fargo Advantage Dow Jones Target 2050 FundSM, Wells Fargo Advantage Dow Jones Target 2055 FundSM, Wells Fargo Advantage Heritage Money Market FundSM, Wells Fargo Advantage VT Discovery FundSM, and Wells Fargo Advantage VT Opportunity FundSM are referred to as the Discovery Fund, Endeavor Select Fund, Enterprise Fund, Opportunity Fund, Social Sustainability Fund, WealthBuilder Conservative Allocation Portfolio, WealthBuilder Equity Portfolio, WealthBuilder Growth Allocation Portfolio, WealthBuilder Growth Balanced Portfolio, WealthBuilder Moderate Balanced Portfolio, WealthBuilder Tactical Equity Portfolio, Target Today Fund, Target 2010 Fund, Target 2015 Fund, Target 2020 Fund, Target 2025 Fund, Target 2030 Fund, Target 2035 Fund, Target 2040 Fund, Target 2045 Fund, Target 2050 Fund, Target 2055 Fund, Heritage Money Market Fund, VT Discovery Fund, and VT Opportunity Fund, respectively. |
Not part of the annual report.
| | | | |
| 2 | | Wells Fargo Advantage VT International Equity Fund | | Letter to Shareholders |

Karla M. Rabusch,
President
Wells Fargo Advantage Funds
The U.S. economic recovery that began in mid-2009 progressed throughout the 12-month period, yet the rate of growth remained subpar compared with most previous recovery cycles.
Dear Valued Shareholder:
We’re pleased to offer you this annual report for the Wells Fargo Advantage VT International Equity Fund for the 12-month period that ended December 31, 2011.
For the full 12-month period, most of the major domestic equity indexes posted either modest gains or relatively mild losses. However, the market’s 12-month return figures mask the uneven path that it traced throughout the year as investors had to contend with a variety of global and domestic headwinds. Whatever the future holds, we continue to believe that most investors can benefit from adhering to a well-diversified investment strategy. Over the long-term, such a strategy may allow you to balance risks and opportunities as you pursue your financial goals in a dynamic market landscape.
The economic recovery gained traction as the year progressed.
The U.S. economic recovery that began in mid-2009 progressed throughout the 12-month period, yet the rate of growth remained subpar compared with most previous recovery cycles.
2011 opened on a note of mounting optimism regarding the strength of the recovery, yet a batch of disappointing economic data in the spring and summer cast renewed doubts on the sustainability of the recovery. In September, it was reported that U.S. gross domestic product (GDP) grew at a mere 1.3% annual rate in the second quarter of 2011, following anemic growth at an annual rate of 0.4% in the first quarter. According to the December estimate, GDP growth accelerated to an annual rate of 1.8% in the third quarter, reigniting hopes for a sustainable recovery. Those hopes were buoyed by widespread anticipation of even stronger GDP growth in the fourth quarter. By the end of the 12-month period, few economists believed that the U.S. economy was in danger of sliding back into recession, although many expected a sluggish growth environment in 2012.
The struggling housing and labor markets slowed growth.
As has been the case throughout the recovery, the housing and labor markets continued to restrain economic momentum during 2011.
The beleaguered housing market has arguably exerted the biggest drag on growth. Despite intermittent signs of improvement, ongoing weakness in sales of both new and existing homes has put considerable downward pressure on prices. On the other hand, the labor market took a decided turn for the better in the latter half of the year: initial unemployment claims have eased in recent months, and the private sector has been steadily adding jobs. The pace of hiring, while not brisk, was sufficient to push the U.S. unemployment rate down to 8.5% as of December 2011—still well above its historical average, but at its lowest level since February 2009. Many observers expect the unemployment rate to decline further in 2012, which could act as a tailwind for consumer spending—widely viewed as one of the keys to long-term economic growth.
The Federal Reserve announced that it will keep rates low until 2013.
Consumers have already demonstrated some resilience in their spending—even in the face of higher energy costs. Oil prices skyrocketed in early 2011 before retreating later in the year, only to spike again during the fourth quarter. Yet
| | | | | | |
| Letter to Shareholders | | Wells Fargo Advantage VT International Equity Fund | | | 3 | |
“core” inflation, which excludes volatile energy and food prices, remained fairly benign throughout the year.
With inflation in check, the Federal Reserve (Fed) held its target range for the federal funds rate—a proxy for short-term interest rates—steady at 0% to 0.25%. Following its August 9 meeting, the Federal Open Market Committee (FOMC) issued a statement explaining that economic conditions were likely to warrant exceptionally low levels for the federal funds rate through at least mid-2013. In addition, the Fed carried out its second round of quantitative easing (QE2) in an effort to promote a more robust economic expansion. The stimulus program was completed as scheduled in June 2011. In September, the Fed launched yet another stimulus program—dubbed “Operation Twist”—that is designed to keep intermediate- and longer-term yields relatively low. The goal with keeping longer-term rates low is to encourage lending activity to spark business investments and home purchases, which, in turn, may provide support for a more sustainable economic recovery.
Market volatility was a dominant theme throughout most of 2011.
Despite pockets of turbulence sparked by the natural disasters in Japan and geopolitical turmoil in North Africa and the Middle East, the U.S. equity market performed very well from January through April of 2011. Some upbeat economic news, better-than-expected corporate profits, and investor enthusiasm about QE2 were among the catalysts for the market’s four-month advance.
In May and June, the market climate shifted to one of anxiety over the increasingly fragile state of the U.S. and global economies. As spring gave way to summer, investors not only worried that the U.S. might be on the brink of recession, they also feared that Europe’s sovereign debt problems could spiral out of control if a Greek default triggered financial contagion across the continent. In July and August, investor sentiment was further undermined by partisan wrangling over the federal debt ceiling and the Standard & Poor’s downgrade of the U.S. credit rating. The barrage of unsettling headlines led to heightened market volatility and sharply falling stock prices in the third quarter of 2011. Although volatility persisted into the fourth quarter, the market was able to rebound amid improved economic data and hopes for a resolution to the European crisis.
For the full 12-month period, the S&P 500 Index1 of large-cap stocks achieved a total return of 2.1%. The Russell Midcap® Index2 and the Russell 2000® Index3 of small-cap stocks lost 1.6% and 4.2%, respectively. International stocks fared worse than their U.S. counterparts, with the MSCI EAFE Index4 shedding 14.8%.
| 1. | The S&P 500 Index consists of 500 stocks chosen for market size, liquidity, and industry group representation. It is a market-value weighted index with each stock’s weight in the index proportionate to its market value. You cannot invest directly in an index. |
| 2. | The Russell Midcap® Index measures the performance of the 800 smallest companies in the Russell 1000 Index, which represent approximately 25% of the total market capitalization of the Russell 1000® Index. You cannot invest directly in an index. |
| 3. | The Russell 2000® Index measures the performance of the 2,000 smallest companies in the Russell 3000® Index, which represents approximately 8% of the total market capitalization of the Russell 3000 Index. You cannot invest directly in an index. |
| 4. | The Morgan Stanley Capital International Europe, Australasia, and Far East (“MSCI EAFE”) Stock Index is an unmanaged group of securities widely regarded by investors to be representations of the stock markets of Europe, Australasia, and the Far East. You cannot invest directly in an index. Source: MSCI. MSCI makes no express or implied warranties or representations and shall have no liability whatsoever with respect to any MSCI data contained herein. The MSCI data may not be further redistributed or used as a basis for other indexes or any securities or financial products. This report is not approved, reviewed or produced by MSCI. |
| | | | |
| 4 | | Wells Fargo Advantage VT International Equity Fund | | Letter to Shareholders |
The market turmoil of 2011 and an uncertain outlook going forward have left many investors questioning their resolve—and their investments. Yet, it is precisely at such times that the market may present opportunities—as well as challenges—for prudent investors.
Recent events have not altered our message to shareholders.
The market turmoil of 2011 and an uncertain outlook going forward have left many investors questioning their resolve—and their investments. Yet, it is precisely at such times that the market may present opportunities—as well as challenges—for prudent investors. Bear in mind that many investors who indiscriminately sold their equity investments during the severe market downturn of 2008 to 2009 missed out on the impressive two-year rally that followed. In our opinion, the lesson to be learned from these dramatic market events is that, for many investors, simply building and maintaining a well-diversified5 investment plan is the best long-term strategy.
To help you create a sound strategy based on your personal goals and risk tolerance, Wells Fargo Advantage Funds offers more than 110 mutual funds and other investments spanning a broad range of asset classes and investment styles. While diversification cannot guarantee an investment profit or prevent losses, we believe it can be an effective way to manage investment risk and potentially smooth out overall portfolio performance.
Thank you for choosing to invest with Wells Fargo Advantage Funds. We appreciate your confidence in us and remain committed to helping you meet your financial needs. For current information about your fund investments, contact your investment professional, visit our website at www.wellsfargo.com/advantagefunds, or call us directly at 1-800-222-8222. We are available 24 hours a day, 7 days a week.
Sincerely,

Karla M. Rabusch
President
Wells Fargo Advantage Funds
|
|
Notice to Shareholders Effective March 1, 2012, the Fund’s permitted investment limit in emerging market equity securities changed from 20% of the Fund’s total assets to 30%. |
| 5. | Diversification does not assure or guarantee better performance and cannot eliminate the risk of investment losses. |
| | | | | | |
| Performance Highlights (Unaudited) | | Wells Fargo Advantage VT International Equity Fund | | | 5 | |
INVESTMENT OBJECTIVE
The Fund seeks long-term capital appreciation.
ADVISER
Wells Fargo Funds Management, LLC
SUB-ADVISER
Wells Capital Management Incorporated
PORTFOLIO MANAGERS
Francis X. Claró, CFA2
Jeffrey Everett, CFA2
Dale A. Winner, CFA2
FUND INCEPTION
August 17, 1998
| | | | |
| 12 MONTH TOTAL RETURN AS OF DECEMBER 31, 2011 | |
Class 2 | | | (12.91)% | |
MSCI EAFE Free Index (Net)1 | | | (12.14)% | |
Figures quoted represent past performance, which is no guarantee of future results and do not reflect the deduction of taxes that a shareholder may pay on fund distributions or the redemption of fund shares. Investment return and principal value of an investment will fluctuate so that an investor’s shares, when redeemed, may be worth more or less than their original cost. Current performance may be lower or higher than the performance data quoted and assumes the reinvestment of dividends and capital gains. Current month-end performance is available by calling 1-866-765-0778. Performance figures of the Fund do not reflect fees charged pursuant to the terms of variable life insurance policies and variable annuity contracts.
Index returns do not include transaction costs associated with buying and selling securities, any mutual fund fees or expenses or any taxes. It is not possible to invest directly in an index.
The Adviser has committed through July 18, 2013 to waive fees and/or reimburse expenses to the extent necessary to cap the Fund’s Total Annual Fund Operating Expenses After Fee Waiver, excluding certain other expenses at 0.94% for Class 2. The Fund’s gross and net expense ratios are 1.27% and 0.95%, respectively, for Class 2 shares. Without these reductions, the Fund’s returns would have been lower.
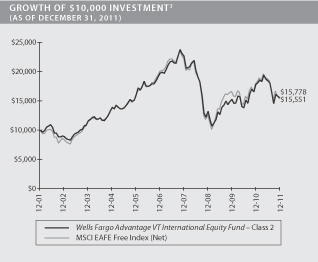
| 1. | The Morgan Stanley Capital International Europe, Australasia, and Far East (“MSCI EAFE Free”) Free Index (Net) is an unmanaged group of securities widely regarded by investors to be representative of the stock markets of Europe, Australasia, and the Far East. MSCI Free Indexes (Net) are constructed to reflect investment opportunities for global investors to account for local market restrictions on stock ownership by international investors. You cannot invest directly in an index. Source: MSCI. MSCI makes no express or implied warranties or representations and shall have no liability whatsoever with respect to any MSCI data contained herein. The MSCI data may not be further redistributed or used as a basis for other indexes or any securities or financial products. This report is not approved, reviewed, or produced by MSCI. |
| 2. | Effective March 1, 2012, Jeffrey Everett and Dale Winner replaced Francis Claró as Portfolio Managers of the Fund. |
| 3. | The chart compares the performance of the Wells Fargo Advantage VT International Equity Fund Class 2 for the most recent ten years of the Fund with the MSCI EAFE Free Index (Net). The chart assumes a hypothetical $10,000 investment and reflects all operating expenses of the Fund. Performance figures of the Fund do not reflect fees charged pursuant to the terms of variable life insurance policies and variable annuity contracts. |
| | | | |
| 6 | | Wells Fargo Advantage VT International Equity Fund | | Performance Highlights (Unaudited) |
MANAGER’S DISCUSSION
Fund highlights
| n | | The Fund lagged its benchmark, the MSCI EAFE Free Index (Net), for the 12-month period that ended December 31, 2011, largely due to positions within the industrials, consumer staples, and materials sectors. |
| n | | Our bottom-up focus on stock selection resulted in overweights to the consumer discretionary and information technology (IT) sectors at the expense of allocations to financials and utilities. In total, our sector positioning aided relative performance. |
| n | | Individual stock and sector positionings were reflected in geographic overweights to emerging markets and Canada and underweights to Japan and Asia excluding Japan. We saw positive performance within emerging markets, while holdings in Canada detracted. |
| | | | |
TEN LARGEST EQUITY HOLDINGS4 (AS OF DECEMBER 31, 2011) | | | |
Vodafone Group plc | | | 2.61% | |
Nestle SA | | | 2.34% | |
Toyota Motor Corporation | | | 2.27% | |
Royal Dutch Shell plc Class A | | | 2.22% | |
Roche Holdings AG | | | 1.98% | |
Repsol YPF SA | | | 1.93% | |
Novartis AG | | | 1.89% | |
Fresenius SE & Company KGaA | | | 1.80% | |
Diageo plc | | | 1.79% | |
Shanghai Electric Group Company Limited | | | 1.72% | |
2011 proved to be a difficult year for international equity markets.
The MSCI EAFE Free Index (Net) returned -12.14% during the period as sovereign debt concerns in Europe dominated much of the year. European bank stocks led the decline, reflecting their direct exposure to such countries as Greece and Portugal as well as higher funding costs and concerns about the need to meet tough new capital requirements. In the face of a hesitant response from European policymakers, sovereign bond yields soared and bank funding became increasingly difficult. Most asset classes displayed exceptional volatility, including stocks, bonds, and currencies. Reflecting these uncertainties, global economic growth slowed and earnings projections were revised downward. In addition, within the Asia Pacific region, Japan was hit by the effects of the tsunami early in the year, while policy tightening and slower export growth dampened Chinese economic prospects.
Macroeconomic factors largely affected the portfolio during the period, particularly exposure to cyclical businesses such as professional staffing firms. The Fund’s cash position, which averaged 5.6% of assets, was the strongest contributor to relative performance. In terms of sector exposures, the portfolio benefited from IT, utilities, and telecommunication services holdings. Specifically, stock performance within IT and telecommunication services more than offset the negative effects of overweighting the first sector and underweighting the second. We had only one position within the utilities sector, German-based E.ON AG; the Fund benefited from our underweight to the sector, which underperformed.
Detractors during the period included holdings within the industrials, consumer staples, and materials sectors. Within industrials, professional staffing companies sold off due to fears that a European recession would lead to reduced demand for staffing, a major detractor that was partially offset by a position in U.K. equipment rental company Ashtead Group plc. Within consumer staples, positions in brewer Carlsberg Breweries A/S and food retailer Metro AG detracted, while exposure to mining stocks led to underperformance within materials as commodities prices softened during the latter half of the year.
| 4. | The ten largest equity holdings are calculated based on the value of the securities divided by total net assets of the Fund. Holdings are subject to change and may have changed since the date specified. |
| | | | | | |
| Performance Highlights (Unaudited) | | Wells Fargo Advantage VT International Equity Fund | | | 7 | |
On a geographic basis, we saw positive performance within emerging markets, particularly China and South Korea. Europe also contributed, as our positions within France and Spain boosted returns within the region. Holdings within the U.K. and Canada detracted.
| | |
SECTOR DISTRIBUTION5 (AS OF DECEMBER 31, 2011) |
| |
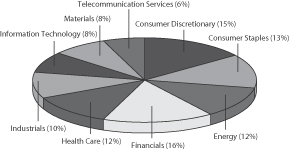 | | |
Moving into 2012, markets remain unsettled.
The new year is likely to prove critical in determining the outcome of many of the risk factors that markets grappled with during 2011. Outcomes related to the viability of the eurozone, the sustainability of Chinese growth rates, and the political direction of the U.S. will all affect investor confidence in 2012. The year is also beginning with generally weaker global economic growth, particularly in Europe, and continued fears in both bond and equity markets. Financials continue to deleverage globally and are suffering from high funding costs, a lack of sources for capital, a challenging operating environment, and a harsh regulatory environment. The situation within the financials sector is another hurdle to spurring global economic growth. On the positive side, the European Central Bank’s injection of $600 billion in three-year loans has helped increase liquidity within the eurozone’s banking system.
We believe that equities are inexpensive relative to virtually any other investment and fairly inexpensive relative to their own history. In our view, investors are demanding too high of a risk premium to own stocks in an environment of low borrowing costs, healthy balance sheets, lean corporate operations, and high profitability. We believe that most companies are in a good position to successfully overcome any upcoming challenges. If that happens, we could see a strong wave of capital expenditures, corporate hiring, and merger and acquisition activity. Such a scenario seems a long way off, as confidence has eroded in every area of the economy—from consumers to corporate management to investors. Historically, though, it has generally paid to buy equities when they were inexpensive and unpopular, and we are seeing attractive equity valuations across the globe, including in Europe and China. We hope that our discipline of buying stocks when they’re out of favor will ultimately bode well for the strategy’s returns, but in the near term, we believe that market turbulence is likely to persist.
| 5. | Sector distribution is subject to change and is calculated based on the total long-term investments of the Fund. |
| | | | |
| 8 | | Wells Fargo Advantage VT International Equity Fund | | Performance Highlights (Unaudited) |
AVERAGE ANNUAL TOTAL RETURN6 (%) (AS OF DECEMBER 31, 2011)
| | | | | | | | | | | | | | | | | | | | | | | | | | | | |
| | | | | | | | | | | | | | | | | | Expense Ratios7 | |
| | | Inception Date | | | 6 Months* | | | 1 Year | | | 5 Year | | | 10 Year | | | Gross | | | Net8 | |
Class 1 | | | 08/17/1998 | | | | (15.86 | ) | | | (12.79 | ) | | | (4.49 | ) | | | 4.75 | | | | 1.02% | | | | 0.70% | |
Class 2 | | | 07/31/2002 | | | | (15.98 | ) | | | (12.91 | ) | | | (4.73 | ) | | | 4.51 | | | | 1.27% | | | | 0.95% | |
MSCI EAFE Free Index (Net)1 | | | | | | | (16.31 | ) | | | (12.14 | ) | | | (4.72 | ) | | | 4.67 | | | | | | | | | |
| * | Returns for periods of less than one year are not annualized. |
Figures quoted represent past performance, which is no guarantee of future results and do not reflect the deduction of taxes that a shareholder may pay on fund distributions or the redemption of fund shares. Investment return and principal value of an investment will fluctuate so that an investor’s shares, when redeemed, may be worth more or less than their original cost. Current performance may be lower or higher than the performance data quoted and assumes the reinvestment of dividends and capital gains. Current month-end performance is available by calling 1-866-765-0778. Performance figures of the Fund do not reflect fees charged pursuant to the terms of variable life insurance policies and variable annuity contracts.
Index returns do not include transaction costs associated with buying and selling securities, any mutual fund fees or expenses or any taxes. It is not possible to invest directly in an index.
Stock fund values fluctuate in response to the activities of individual companies and general market and economic conditions. Foreign investments are especially volatile and can rise or fall dramatically due to differences in the political and economic conditions of the host country. These risks are generally intensified in emerging markets. The use of derivatives may reduce returns and/or increase volatility. Certain investment strategies tend to increase the total risk of an investment (relative to the broader market). This Fund is exposed to active trading risk and smaller company securities risk. Consult the Fund’s prospectus for additional information on these and other risks.
Please refer to the prospectus provided by your participating insurance company for detailed information describing the separate accounts for information regarding surrender charges, mortality and expense risk fees and other charges that may be assessed by the participating insurance companies.
| 6. | Performance shown for Class 2 shares prior to its inception reflects the performance of Class 1 shares, adjusted to reflect the higher expenses applicable to Class 2 shares. Historical performance shown for all classes of the Fund prior to July 19, 2010 is based on the performance of the fund’s predecessor, Evergreen VA International Equity Fund. Effective July 16, 2010, the Fund changed its name from Wells Fargo Advantage VT International Core Fund to Wells Fargo Advantage VT International Equity Fund. |
| 7. | Reflects the expense ratios as stated in the most recent prospectuses. |
| 8. | The Adviser has committed through July 18, 2013 to waive fees and/or reimburse expenses to the extent necessary to cap the Fund’s Total Annual Fund Operating Expenses After Fee Waiver, excluding certain expenses, at 0.69% for Class 1 and 0.94% for Class 2 shares. Without this cap, the Fund’s returns would have been lower. |
| | | | | | |
| Fund Expenses (Unaudited) | | Wells Fargo Advantage VT International Equity Fund | | | 9 | |
As a shareholder of the Fund, you incur ongoing costs, including management fees; distribution (12b-1) fees; and other Fund expenses. This example is intended to help you understand your ongoing costs (in dollars) of investing in the Fund and to compare these costs with the ongoing costs of investing in other mutual funds.
The example is based on an investment of $1,000 invested at the beginning of the six-month period and held for the entire period from July 1, 2011 to December 31, 2011.
Actual Expenses
The “Actual” line of the table below provides information about actual account values and actual expenses. You may use the information in this line, together with the amount you invested, to estimate the expenses that you paid over the period. Simply divide your account value by $1,000 (for example, an $8,600 account value divided by $1,000 = 8.6), then multiply the result by the number in the “Actual” line under the heading entitled “Expenses Paid During Period” for your applicable class of shares to estimate the expenses you paid on your account during this period.
Hypothetical Example for Comparison Purposes
The “Hypothetical” line of the table below provides information about hypothetical account values and hypothetical expenses based on the Fund’s actual expense ratio and an assumed rate of return of 5% per year before expenses, which is not the Fund’s actual return. The hypothetical account values and expenses may not be used to estimate the actual ending account balance or expenses you paid for the period. You may use this information to compare the ongoing costs of investing in the Fund and other funds. To do so, compare this 5% hypothetical example with the 5% hypothetical examples that appear in the shareholder reports of the other funds.
Please note that the expenses shown in the table are meant to highlight your ongoing costs only and do not reflect any separate account charges assessed by participating insurance companies. Therefore, the “Hypothetical” line of the table is useful in comparing ongoing costs only, and will not help you determine the relative total costs of owning different funds. In addition, if these separate account charges assessed by participating insurance companies were included, your costs would have been higher.
| | | | | | | | | | | | | | | | |
| | | Beginning
Account Value
07-01-2011 | | | Ending
Account Value
12-31-2011 | | | Expenses
Paid During
the Period¹ | | | Net Annual
Expense Ratio | |
Class 1 | | | | | | | | | | | | | | | | |
Actual | | $ | 1,000.00 | | | $ | 841.38 | | | $ | 3.20 | | | | 0.69 | % |
Hypothetical (5% return before expenses) | | $ | 1,000.00 | | | $ | 1,021.73 | | | $ | 3.52 | | | | 0.69 | % |
Class 2 | | | | | | | | | | | | | | | | |
Actual | | $ | 1,000.00 | | | $ | 840.16 | | | $ | 4.36 | | | | 0.94 | % |
Hypothetical (5% return before expenses) | | $ | 1,000.00 | | | $ | 1,020.47 | | | $ | 4.79 | | | | 0.94 | % |
| 1. | Expenses paid is equal to the annualized expense ratio of each class multiplied by the average account value over the period, multiplied by the number of days in the most recent fiscal half-year divided by the number of days in the fiscal year (to reflect the one-half year period). |
| | | | |
| 10 | | Wells Fargo Advantage VT International Equity Fund | | Portfolio of Investments—December 31, 2011 |
| | | | | | | | | | | | |
| Security Name | | | | | | Shares | | | Value | |
| | | | | | | | | | | | |
| | | | |
Common Stocks: 95.48% | | | | | | | | | | | | |
| | | | |
| Argentina: 0.86% | | | | | | | | | | | | |
Irsa Inversiones y Representaciones SA ADR (Financials, Real Estate Management & Development) | | | | | | | 156,020 | | | $ | 1,617,927 | |
YPF SA ADR (Energy, Oil, Gas & Consumable Fuels) | | | | | | | 20,995 | | | | 728,107 | |
| | | | |
| | | | | | | | | | | 2,346,034 | |
| | | | | | | | | | | | |
| | | | |
| Australia: 2.75% | | | | | | | | | | | | |
AMP Limited (Financials, Insurance) | | | | | | | 257,298 | | | | 1,071,079 | |
Commonwealth Bank of Australia (Financials, Commercial Banks) | | | | | | | 51,759 | | | | 2,605,663 | |
Newcrest Mining Limited (Materials, Metals & Mining) | | | | | | | 74,164 | | | | 2,245,307 | |
Westpac Banking Corporation (Financials, Commercial Banks) | | | | | | | 78,249 | | | | 1,600,662 | |
| | | | |
| | | | | | | | | | | 7,522,711 | |
| | | | | | | | | | | | |
| | | | |
| Belgium: 1.18% | | | | | | | | | | | | |
Anheuser-Busch InBev NV (Consumer Staples, Beverages) | | | | | | | 52,590 | | | | 3,219,797 | |
| | | | | | | | | | | | |
| | | | |
| Canada: 4.52% | | | | | | | | | | | | |
Brookfield Asset Management Incorporated (Financials, Real Estate Management & Development) | | | | | | | 80,763 | | | | 2,219,367 | |
Canadian Natural Resources Limited (Energy, Oil, Gas & Consumable Fuels) | | | | | | | 66,941 | | | | 2,506,797 | |
Goldcorp Incorporated (Materials, Metals & Mining) | | | | | | | 51,236 | | | | 2,273,747 | |
Ivanhoe Mines Limited (Materials, Metals & Mining)† | | | | | | | 64,400 | | | | 1,143,554 | |
Suncor Energy Incorporated (Energy, Oil, Gas & Consumable Fuels) | | | | | | | 69,422 | | | | 2,002,079 | |
Teck Cominco Incorporated Limited (Materials, Metals & Mining) | | | | | | | 62,867 | | | | 2,216,004 | |
| | | | |
| | | | | | | | | | | 12,361,548 | |
| | | | | | | | | | | | |
| | | | |
| China: 5.30% | | | | | | | | | | | | |
Baidu.com Incorporated ADR (Information Technology, Internet Software & Services)† | | | | | | | 14,126 | | | | 1,645,255 | |
China Mobile Limited ADR (Telecommunication Services, Wireless Telecommunication Services)« | | | | | | | 66,352 | | | | 3,217,408 | |
Shanghai Electric Group Company Limited (Industrials, Electrical Equipment) | | | | | | | 10,188,000 | | | | 4,709,258 | |
SINA Corporation (Information Technology, Internet Software & Services)†« | | | | | | | 33,045 | | | | 1,718,340 | |
Tencent Holdings Limited (Information Technology, Internet Software & Services) | | | | | | | 63,900 | | | | 1,284,319 | |
ZTE Corporation (Telecommunication Services, Wireless Telecommunication Services) | | | | | | | 619,600 | | | | 1,942,582 | |
| | | | |
| | | | | | | | | | | 14,517,162 | |
| | | | | | | | | | | | |
| | | | |
| Denmark: 0.72% | | | | | | | | | | | | |
Carlsberg A/S (Consumer Staples, Beverages) | | | | | | | 28,037 | | | | 1,977,084 | |
| | | | | | | | | | | | |
| | | | |
| France: 9.10% | | | | | | | | | | | | |
BNP Paribas SA (Financials, Commercial Banks) | | | | | | | 12,298 | | | | 483,072 | |
Compagnie de Saint-Gobain (Industrials, Building Products) | | | | | | | 21,237 | | | | 815,372 | |
Groupe Danone (Consumer Staples, Food Products) | | | | | | | 55,913 | | | | 3,514,789 | |
LVMH Moet Hennessy Louis Vuitton SA (Consumer Discretionary, Textiles, Apparel & Luxury Goods) | | | | | | | 27,494 | | | | 3,892,903 | |
Pernod-Ricard (Consumer Staples, Beverages) | | | | | | | 38,686 | | | | 3,587,971 | |
Pinault-Printempts-Redoute SA (Consumer Discretionary, Multiline Retail) | | | | | | | 12,468 | | | | 1,785,527 | |
Publicis Groupe (Consumer Discretionary, Media) | | | | | | | 31,940 | | | | 1,469,372 | |
Sanofi-Aventis SA (Health Care, Pharmaceuticals) | | | | | | | 33,623 | | | | 2,469,566 | |
Technip SA (Energy, Energy Equipment & Services) | | | | | | | 42,856 | | | | 4,027,970 | |
Total SA (Energy, Oil, Gas & Consumable Fuels) | | | | | | | 55,921 | | | | 2,858,843 | |
| | | | |
| | | | | | | | | | | 24,905,385 | |
| | | | | | | | | | | | |
| | | | | | |
| Portfolio of Investments—December 31, 2011 | | Wells Fargo Advantage VT International Equity Fund | | | 11 | |
| | | | | | | | | | | | |
| Security Name | | | | | | Shares | | | Value | |
| | | | | | | | | | | | |
| | | | |
| Germany: 7.60% | | | | | | | | | | | | |
Adidas-Salomon AG (Consumer Discretionary, Textiles, Apparel & Luxury Goods) | | | | | | | 25,408 | | | $ | 1,652,766 | |
Allianz AG (Financials, Insurance) | | | | | | | 23,787 | | | | 2,275,418 | |
Bayer AG (Health Care, Pharmaceuticals) | | | | | | | 57,652 | | | | 3,686,037 | |
Daimler AG (Consumer Discretionary, Automobiles) | | | | | | | 31,040 | | | | 1,362,686 | |
E.ON AG (Utilities, Electric Utilities) | | | | | | | 48,242 | | | | 1,040,829 | |
Fresenius SE & Company KGaA (Health Care, Health Care Equipment & Supplies) | | | | | | | 53,206 | | | | 4,922,248 | |
Hochtief AG (Industrials, Construction & Engineering) | | | | | | | 23,813 | | | | 1,377,499 | |
Muenchener Rueckversicherungs-Gesellschaft AG (Financials, Insurance) | | | | | | | 13,075 | | | | 1,603,898 | |
SAP AG (Information Technology, Software) | | | | | | | 40,412 | | | | 2,136,588 | |
Siemens AG (Industrials, Industrial Conglomerates) | | | | | | | 7,880 | | | | 754,091 | |
| | | | |
| | | | | | | | | | | 20,812,060 | |
| | | | | | | | | | | | |
| | | | |
| Israel: 1.12% | | | | | | | | | | | | |
Check Point Software Technologies Limited (Information Technology, Software)†« | | | | | | | 29,587 | | | | 1,554,501 | |
Teva Pharmaceutical Industries Limited ADR (Health Care, Pharmaceuticals) | | | | | | | 37,535 | | | | 1,514,913 | |
| | | | |
| | | | | | | | | | | 3,069,414 | |
| | | | | | | | | | | | |
| | | | |
| Italy: 0.94% | | | | | | | | | | | | |
ENI SpA (Energy, Oil, Gas & Consumable Fuels) | | | | | | | 123,756 | | | | 2,564,342 | |
| | | | | | | | | | | | |
| | | | |
| Japan: 10.75% | | | | | | | | | | | | |
Canon Incorporated (Information Technology, Office Electronics) | | | | | | | 58,400 | | | | 2,587,294 | |
Isuzu Motors Limited (Consumer Discretionary, Automobiles) | | | | | | | 699,000 | | | | 3,233,000 | |
Japan Tobacco Incorporated (Consumer Staples, Tobacco) | | | | | | | 209 | | | | 982,954 | |
Komatsu Limited (Industrials, Machinery) | | | | | | | 28,300 | | | | 661,449 | |
Makita Corporation (Industrials, Machinery) | | | | | | | 32,800 | | | | 1,061,515 | |
Mitsubishi UFJ Financial Group Incorporated (Financials, Commercial Banks) | | | | | | | 567,600 | | | | 2,411,397 | |
Nintendo Company Limited (Information Technology, Software) | | | | | | | 13,000 | | | | 1,790,308 | |
NKSJ Holdings Incorporated (Financials, Insurance) | | | | | | | 111,500 | | | | 2,187,411 | |
Sumitomo Heavy Industries Limited (Industrials, Machinery) | | | | | | | 532,000 | | | | 3,103,391 | |
Sumitomo Mitsui Financial Group Incorporated (Financials, Commercial Banks) | | | | | | | 64,300 | | | | 1,791,077 | |
Tokyo Electron Limited (Information Technology, Semiconductors & Semiconductor Equipment) | | | | | | | 27,400 | | | | 1,393,673 | |
Toshiba Corporation (Information Technology, Computers & Peripherals) | | | | | | | 224,000 | | | | 916,721 | |
Toyota Motor Corporation (Consumer Discretionary, Automobiles) | | | | | | | 186,800 | | | | 6,225,049 | |
Yahoo! Japan Corporation (Information Technology, Internet Software & Services) | | | | | | | 3,388 | | | | 1,091,185 | |
| | | | |
| | | | | | | | | | | 29,436,424 | |
| | | | | | | | | | | | |
| | | | |
| Luxembourg: 0.63% | | | | | | | | | | | | |
Acergy SA (Energy, Energy Equipment & Services) | | | | | | | 67,213 | | | | 1,247,422 | |
ArcelorMittal (Materials, Metals & Mining) | | | | | | | 26,134 | | | | 477,932 | |
| | | | |
| | | | | | | | | | | 1,725,354 | |
| | | | | | | | | | | | |
| | | | |
| Netherlands: 4.40% | | | | | | | | | | | | |
ASML Holding NV (Information Technology, Semiconductors & Semiconductor Equipment) | | | | | | | 54,015 | | | | 2,270,293 | |
ING Groep NV (Financials, Diversified Financial Services)† | | | | | | | 101,648 | | | | 731,462 | |
Nielsen Holdings NV (Industrials, Professional Services)† | | | | | | | 86,007 | | | | 2,553,548 | |
Unilever NV (Consumer Staples, Food Products) | | | | | | | 124,345 | | | | 4,276,005 | |
USG People NV (Industrials, Commercial Services & Supplies) | | | | | | | 266,718 | | | | 2,212,731 | |
| | | | |
| | | | | | | | | | | 12,044,039 | |
| | | | | | | | | | | | |
| | | | |
| 12 | | Wells Fargo Advantage VT International Equity Fund | | Portfolio of Investments—December 31, 2011 |
| | | | | | | | | | | | |
| Security Name | | | | | | Shares | | | Value | |
| | | | | | | | | | | | |
| | | | |
| Norway: 1.68% | | | | | | | | | | | | |
Telenor ASA (Telecommunication Services, Diversified Telecommunication Services) | | | | | | | 280,089 | | | $ | 4,594,118 | |
| | | | | | | | | | | | |
| | | | |
| Singapore: 0.48% | | | | | | | | | | | | |
DBS Group Holdings Limited (Financials, Commercial Banks) | | | | | | | 149,000 | | | | 1,323,372 | |
| | | | | | | | | | | | |
| | | | |
| South Korea: 2.21% | | | | | | | | | | | | |
Hyundai Motor Company Limited (Consumer Discretionary, Automobiles) | | | | | | | 11,019 | | | | 2,037,367 | |
Samsung Electronics Company Limited (Information Technology, Semiconductors & Semiconductor Equipment) | | | | | | | 4,372 | | | | 4,015,257 | |
| | | | |
| | | | | | | | | | | 6,052,624 | |
| | | | | | | | | | | | |
| | | | |
| Spain: 2.83% | | | | | | | | | | | | |
Banco Santander Central Hispano SA (Financials, Commercial Banks) | | | | | | | 108,411 | | | | 823,625 | |
Industria de Diseno Textil SA (Consumer Discretionary, Specialty Retail) | | | | | | | 19,910 | | | | 1,630,632 | |
Repsol YPF SA (Energy, Oil, Gas & Consumable Fuels) | | | | | | | 172,237 | | | | 5,290,954 | |
| | | | |
| | | | | | | | | | | 7,745,211 | |
| | | | | | | | | | | | |
| | | | |
| Sweden: 0.58% | | | | | | | | | | | | |
Swedbank AB (Financials, Commercial Banks) | | | | | | | 121,827 | | | | 1,578,146 | |
| | | | | | | | | | | | |
| | | | |
| Switzerland: 11.43% | | | | | | | | | | | | |
ABB Limited (Industrials, Electrical Equipment) | | | | | | | 78,976 | | | | 1,486,528 | |
Adecco SA (Industrials, Professional Services) | | | | | | | 25,761 | | | | 1,079,203 | |
Compagnie Financiere Richemont SA (Consumer Discretionary, Textiles, Apparel & Luxury Goods) | | | | | | | 76,684 | | | | 3,878,694 | |
Credit Suisse Group AG (Financials, Capital Markets) | | | | | | | 45,404 | | | | 1,066,822 | |
Nestle SA (Consumer Staples, Food Products) | | | | | | | 111,527 | | | | 6,411,645 | |
Novartis AG (Health Care, Pharmaceuticals) | | | | | | | 90,619 | | | | 5,180,709 | |
Roche Holdings AG (Health Care, Pharmaceuticals) | | | | | | | 31,951 | | | | 5,415,308 | |
Swatch Group AG Class B (Consumer Discretionary, Textiles, Apparel & Luxury Goods) | | | | | | | 8,397 | | | | 3,142,282 | |
UBS AG (Financials, Capital Markets) | | | | | | | 68,418 | | | | 814,344 | |
Zurich Financial Services AG (Financials, Insurance) | | | | | | | 12,386 | | | | 2,802,113 | |
| | | | |
| | | | | | | | | | | 31,277,648 | |
| | | | | | | | | | | | |
| | | | |
| United Kingdom: 26.40% | | | | | | | | | | | | |
Anglo American plc (Materials, Metals & Mining) | | | | | | | 51,652 | | | | 1,908,328 | |
Antofagasta plc (Materials, Metals & Mining) | | | | | | | 130,812 | | | | 2,468,285 | |
Ashtead Group plc (Industrials, Trading Companies & Distributors) | | | | | | | 624,917 | | | | 2,193,321 | |
Barclays plc (Financials, Commercial Banks) | | | | | | | 418,014 | | | | 1,142,874 | |
BG Group plc (Health Care, Health Care Providers & Services) | | | | | | | 151,671 | | | | 3,242,278 | |
BHP Billiton plc (Materials, Metals & Mining) | | | | | | | 112,282 | | | | 3,273,871 | |
BP plc (Energy, Oil, Gas & Consumable Fuels) | | | | | | | 372,655 | | | | 2,665,066 | |
Burberry Group plc (Consumer Discretionary, Textiles, Apparel & Luxury Goods) | | | | | | | 119,453 | | | | 2,198,300 | |
Diageo plc (Consumer Staples, Beverages) | | | | | | | 223,777 | | | | 4,887,949 | |
Experian Group Limited (Financials, Diversified Financial Services) | | | | | | | 183,252 | | | | 2,491,589 | |
GlaxoSmithKline plc (Health Care, Pharmaceuticals) | | | | | | | 180,298 | | | | 4,120,241 | |
HSBC Holdings plc (Financials, Commercial Banks) | | | | | | | 577,896 | | | | 4,407,039 | |
Imperial Tobacco Group plc (Consumer Staples, Tobacco) | | | | | | | 76,773 | | | | 2,903,213 | |
Intertek Group plc (Industrials, Commercial Services & Supplies) | | | | | | | 48,520 | | | | 1,533,404 | |
Kingfisher plc (Consumer Discretionary, Specialty Retail) | | | | | | | 454,937 | | | | 1,771,239 | |
Land Securities Group plc (Financials, REIT) | | | | | | | 67,636 | | | | 667,521 | |
New World Resources plc (Materials, Metals & Mining) | | | | | | | 128,760 | | | | 885,642 | |
Persimmon plc (Consumer Discretionary, Household Durables) | | | | | | | 325,405 | | | | 2,375,164 | |
| | | | | | |
| Portfolio of Investments—December 31, 2011 | | Wells Fargo Advantage VT International Equity Fund | | | 13 | |
| | | | | | | | | | | | | | |
| Security Name | | | | | | | Shares | | | Value | |
| | | | | | | | | | | | | | |
| | | | |
| United Kingdom (continued) | | | | | | | | | | | | | | |
Rio Tinto plc (Materials, Metals & Mining) | | | | | | | | | 32,461 | | | $ | 1,575,373 | |
Royal Dutch Shell plc Class A (Energy, Oil, Gas & Consumable Fuels) | | | | | | | | | 165,131 | | | | 6,080,393 | |
SABMiller plc (Consumer Staples, Beverages) | | | | | | | | | 69,831 | | | | 2,457,964 | |
Standard Chartered plc (Financials, Commercial Banks) | | | | | | | | | 145,794 | | | | 3,190,231 | |
Travis Perkins plc (Industrials, Trading Companies & Distributors) | | | | | | | | | 153,637 | | | | 1,898,049 | |
Vodafone Group plc (Telecommunication Services, Wireless Telecommunication Services) | | | | | | | | | 2,575,160 | | | | 7,154,611 | |
WPP plc (Consumer Discretionary, Media) | | | | | | | | | 172,597 | | | | 1,810,631 | |
Xstrata plc (Materials, Metals & Mining) | | | | | | | | | 195,183 | | | | 2,964,503 | |
| | | | |
| | | | | | | | | | | | | 72,267,079 | |
| | | | | | | | | | | | | | |
| | | | |
Total Common Stocks (Cost $256,096,109) | | | | | | | | | | | | | 261,339,552 | |
| | | | | | | | | | | | | | |
| | | | |
Investment Companies: 0.46% | | | | | | | | | | | | | | |
iShares MSCI China Index ETF | | | | | | | | | 25,508 | | | | 1,263,411 | |
| | | | | | | | | | | | | | |
| | | | |
Total Investment Companies (Cost $1,410,245) | | | | | | | | | | | | | 1,263,411 | |
| | | | | | | | | | | | | | |
| | | | |
| | | Yield | | | | | | | | | |
| Short-Term Investments: 4.91% | | | | | | | | | | | | | | |
| | | | |
| Investment Companies: 4.91% | | | | | | | | | | | | | | |
Wells Fargo Advantage Cash Investment Money Market Fund, Institutional Class(u)(l) | | | 0.04 | % | | | | | 9,735,355 | | | | 9,735,355 | |
Wells Fargo Securities Lending Cash Investments, LLC(r)(v)(u)(l) | | | 0.12 | | | | | | 3,700,279 | | | | 3,700,279 | |
| | | | |
Total Short-Term Investments (Cost $13,435,634) | | | | | | | | | | | | | 13,435,634 | |
| | | | | | | | | | | | | | |
| | | | | | | | |
| Total Investments in Securities | | | | | | | | |
| (Cost $270,941,988)* | | | 100.85 | % | | | 276,038,597 | |
Other Assets and Liabilities, Net | | | (0.85 | ) | | | (2,329,320 | ) |
| | | | | | | | |
| Total Net Assets | | | 100.00 | % | | $ | 273,709,277 | |
| | | | | | | | |
| † | Non-income earning security. |
| « | All or a portion of this security is on loan. |
| (r) | The investment company is exempt from registration under Section 3(c)(7) of the 1940 Act. |
| (v) | Security represents investment of cash collateral received from securities on loan. |
| (u) | Rate shown is the 7-day annualized yield at period end. |
| (l) | Investment in an affiliate. |
| * | Cost for federal income tax purposes is $272,239,178 and net unrealized appreciation (depreciation) consists of: |
| | | | |
Gross unrealized appreciation | | $ | 21,183,084 | |
Gross unrealized depreciation | | | (17,383,665 | ) |
| | | | |
Net unrealized appreciation | | $ | 3,799,419 | |
The accompanying notes are an integral part of these financial statements.
| | | | |
| 14 | | Wells Fargo Advantage VT International Equity Fund | | Statement of Assets and Liabilities—December 31, 2011 |
| | | | |
| | | | |
| |
Assets | | | | |
Investments | | | | |
In unaffiliated securities (including securities on loan), at value | | $ | 262,602,963 | |
In affiliated securities, at value | | | 13,435,634 | |
| | | | |
Total investments, at value (see cost below) | | | 276,038,597 | |
Foreign currency, at value (see cost below) | | | 178,498 | |
Receivable for Fund shares sold | | | 590,834 | |
Receivable for dividends | | | 1,159,772 | |
Receivable for securities lending income | | | 7,113 | |
| | | | |
Total assets | | | 277,974,814 | |
| | | | |
| |
Liabilities | | | | |
Payable for investments purchased | | | 148,609 | |
Payable for Fund shares redeemed | | | 8,789 | |
Unrealized losses on forward foreign currency contracts | | | 133,104 | |
Payable upon receipt of securities loaned | | | 3,700,279 | |
Advisory fee payable | | | 97,497 | |
Distribution fees payable | | | 51,072 | |
Due to other related parties | | | 31,962 | |
Accrued expenses and other liabilities | | | 94,225 | |
| | | | |
Total liabilities | | | 4,265,537 | |
| | | | |
Total net assets | | $ | 273,709,277 | |
| | | | |
| |
NET ASSETS CONSIST OF | | | | |
Paid-in capital | | $ | 248,369,566 | |
Undistributed net investment income | | | 4,511,173 | |
Accumulated net realized gains on investments | | | 15,797,762 | |
Net unrealized gains on investments | | | 5,030,776 | |
| | | | |
Total net assets | | $ | 273,709,277 | |
| | | | |
| |
COMPUTATION OF NET ASSET VALUE PER SHARE1 | | | | |
Net assets – Class 1 | | $ | 46,016,787 | |
Shares outstanding – Class 1 | | | 9,647,118 | |
Net asset value per share – Class 1 | | | $4.77 | |
Net assets – Class 2 | | $ | 227,692,490 | |
Shares outstanding – Class 2 | | | 47,625,082 | |
Net asset value per share – Class 2 | | | $4.78 | |
| |
Total investments, at cost | | $ | 270,941,988 | |
| | | | |
Securities on loan, at value | | $ | 3,590,395 | |
| | | | |
Foreign currency, at cost | | $ | 171,481 | |
| | | | |
| 1. | The Fund has an unlimited number of authorized shares. |
The accompanying notes are an integral part of these financial statements.
| | | | | | |
| Statement of Operations—Year Ended December 31, 2011 | | Wells Fargo Advantage VT International Equity Fund | | | 15 | |
| | | | |
| | | | |
| |
Investment income | | | | |
Dividends* | | $ | 7,277,725 | |
Securities lending income, net | | | 293,675 | |
Income from affiliated securities | | | 19,923 | |
Interest | | | 264 | |
| | | | |
Total investment income | | | 7,591,587 | |
| | | | |
| |
Expenses | | | | |
Advisory fee | | | 2,106,559 | |
Administration fees | | | | |
Fund level | | | 140,437 | |
Class 1 | | | 46,678 | |
Class 2 | | | 178,022 | |
Distribution fees | | | | |
Class 2 | | | 556,316 | |
Custody and accounting fees | | | 53,167 | |
Professional fees | | | 66,044 | |
Shareholder report expenses | | | 82,707 | |
Trustees’ fees and expenses | | | 8,642 | |
Other fees and expenses | | | 31,747 | |
| | | | |
Total expenses | | | 3,270,319 | |
Less: Fee waivers and/or expense reimbursements | | | (775,968 | ) |
| | | | |
Net expenses | | | 2,494,351 | |
| | | | |
Net investment income | | | 5,097,236 | |
| | | | |
| |
REALIZED AND UNREALIZED GAINS (LOSSES) ON INVESTMENTS | | | | |
| |
Net realized gains (losses) | | | | |
Unaffiliated securities | | | 22,278,348 | |
Forward foreign currency contract transactions | | | (2,187 | ) |
| | | | |
Net realized gains on investments | | | 22,276,161 | |
| | | | |
| |
Net change in unrealized gains (losses) on: | | | | |
Unaffiliated securities | | | (65,299,204 | ) |
Forward foreign currency contract transactions | | | (133,104 | ) |
| | | | |
Net change in unrealized gains (losses) on investments | | | (65,432,308 | ) |
| | | | |
Net realized and unrealized gains (losses) on investments | | | (43,156,147 | ) |
| | | | |
Net decrease in net assets resulting from operations | | $ | (38,058,911 | ) |
| | | | |
| |
* Net of foreign dividend withholding taxes of | | | $702,322 | |
The accompanying notes are an integral part of these financial statements.
| | | | |
| 16 | | Wells Fargo Advantage VT International Equity Fund | | Statements of Changes in Net Assets |
| | | | | | | | | | | | | | | | |
| | | Year Ended
December 31, 2011 | | | Year Ended
December 31, 20101 | |
| | | | |
Operations | | | | | | | | | | | | | | | | |
Net investment income | | | | | | $ | 5,097,236 | | | | | | | $ | 6,461,379 | |
Net realized gains on investments | | | | | | | 22,276,161 | | | | | | | | 51,294,037 | |
Net change in unrealized gains (losses) on investments | | | | | | | (65,432,308 | ) | | | | | | | (68,183,867 | ) |
| | | | | | | | | | | | | | | | |
Net decrease in net assets resulting from operations | | | | | | | (38,058,911 | ) | | | | | | | (10,428,451 | ) |
| | | | | | | | | | | | | | | | |
| | | | |
Distributions to shareholders from | | | | | | | | | | | | | | | | |
Net investment income | | | | | | | | | | | | | | | | |
Class 1 | | | | | | | (366,876 | ) | | | | | | | (634,631 | ) |
Class 2 | | | | | | | (233,091 | ) | | | | | | | (6,829,353 | ) |
Net realized gains | | | | | | | | | | | | | | | | |
Class 1 | | | | | | | (2,581,647 | ) | | | | | | | (2,275,564 | ) |
Class 2 | | | | | | | (9,844,118 | ) | | | | | | | (14,614,363 | ) |
| | | | | | | | | | | | | | | | |
Total distributions to shareholders | | | | | | | (13,025,732 | ) | | | | | | | (24,353,911 | ) |
| | | | | | | | | | | | | | | | |
| | | | |
Capital share transactions | | | Shares | | | | | | | | Shares | | | | | |
Proceeds from shares sold | | | | | | | | | | | | | | | | |
Class 1 | | | 745,197 | | | | 4,050,134 | | | | 1,134,578 | | | | 8,695,259 | |
Class 2 | | | 13,140,189 | | | | 69,270,290 | | | | 9,758,149 | | | | 75,995,758 | |
| | | | | | | | | | | | | | | | |
| | | | | | | 73,320,424 | | | | | | | | 84,691,017 | |
| | | | | | | | | | | | | | | | |
Reinvestment of distributions | | | | | | | | | | | | | | | | |
Class 1 | | | 533,187 | | | | 2,948,523 | | | | 285,379 | | | | 2,910,195 | |
Class 2 | | | 1,815,713 | | | | 10,077,209 | | | | 2,088,525 | | | | 21,443,716 | |
| | | | | | | | | | | | | | | | |
| | | | | | | 13,025,732 | | | | | | | | 24,353,911 | |
| | | | | | | | | | | | | | | | |
Payment for shares redeemed | | | | | | | | | | | | | | | | |
Class 1 | | | (3,400,121 | ) | | | (18,259,790 | ) | | | (2,836,858 | ) | | | (20,254,823 | ) |
Class 2 | | | (5,339,924 | ) | | | (29,300,042 | ) | | | (79,487,176 | ) | | | (745,184,963 | ) |
| | | | | | | | | | | | | | | | |
| | | | | | | (47,559,832 | ) | | | | | | | (765,439,786 | ) |
| | | | | | | | | | | | | | | | |
Net asset value of shares issued in acquisition | | | | | | | | | | | | | | | | |
Class 2 | | | | | | | 0 | | | | | | | | 16,640,001 | |
| | | | | | | | | | | | | | | | |
Net increase (decrease) in net assets resulting from capital share transactions | | | | | | | 38,786,324 | | | | | | | | (639,754,857 | ) |
| | | | | | | | | | | | | | | | |
Total decrease in net assets | | | | | | | (12,298,319 | ) | | | | | | | (674,537,219 | ) |
| | | | | | | | | | | | | | | | |
| | | | |
Net assets | | | | | | | | | | | | | | | | |
Beginning of period | | | | | | | 286,007,596 | | | | | | | | 960,544,815 | |
| | | | | | | | | | | | | | | | |
End of period | | | | | | $ | 273,709,277 | | | | | | | $ | 286,007,596 | |
| | | | | | | | | | | | | | | | |
Undistributed net investment income | | | | | | $ | 4,511,173 | | | | | | | $ | 585,247 | |
| | | | | | | | | | | | | | | | |
| 1. | After the close of business on July 16, 2010, the Fund acquired the net assets of Evergreen VA International Equity Fund which became the accounting and performance survivor in the transaction. The information for the period prior to July 19, 2010 is that of Evergreen VA International Equity Fund. |
The accompanying notes are an integral part of these financial statements.
| | | | | | |
| Financial Highlights | | Wells Fargo Advantage VT International Equity Fund | | | 17 | |
(For a share outstanding throughout each period)
| | | | | | | | | | | | | | | | | | | | |
| | | Year Ended December 31, | |
| Class 1 | | 2011 | | | 20101 | | | 20091 | | | 20081 | | | 20071 | |
Net asset value, beginning of period | | $ | 5.75 | | | $ | 5.15 | | | $ | 4.64 | | | $ | 8.14 | | | $ | 7.82 | |
Net investment income | | | 0.11 | 2 | | | 0.05 | 2 | | | 0.11 | 2 | | | 0.20 | 2 | | | 0.16 | |
Net realized and unrealized gains (losses) on investments | | | (0.80 | ) | | | 0.78 | | | | 0.55 | | | | (3.52 | ) | | | 1.02 | |
| | | | | | | | | | | | | | | | | | | | |
Total from investment operations | | | (0.69 | ) | | | 0.83 | | | | 0.66 | | | | (3.32 | ) | | | 1.18 | |
Distributions to shareholders from | | | | | | | | | | | | | | | | | | | | |
Net investment income | | | (0.04 | ) | | | (0.05 | ) | | | (0.15 | ) | | | 0.00 | | | | (0.20 | ) |
Net realized gains | | | (0.25 | ) | | | (0.18 | ) | | | 0.00 | | | | (0.18 | ) | | | (0.66 | ) |
| | | | | | | | | | | | | | | | | | | | |
Total distributions to shareholders | | | (0.29 | ) | | | (0.23 | ) | | | (0.15 | ) | | | (0.18 | ) | | | (0.86 | ) |
Net asset value, end of period | | $ | 4.77 | | | $ | 5.75 | | | $ | 5.15 | | | $ | 4.64 | | | $ | 8.14 | |
Total return | | | (12.79 | )% | | | 16.79 | % | | | 15.95 | % | | | (41.49 | )% | | | 15.00 | % |
Ratios to average net assets (annualized) | | | | | | | | | | | | | | | | | | | | |
Gross expenses | | | 0.97 | % | | | 0.85 | % | | | 0.68 | % | | | 0.67 | % | | | 0.63 | % |
Net expenses | | | 0.69 | % | | | 0.66 | % | | | 0.68 | % | | | 0.67 | % | | | 0.63 | % |
Net investment income | | | 2.06 | % | | | 1.04 | % | | | 2.31 | % | | | 3.02 | % | | | 2.01 | % |
Supplemental data | | | | | | | | | | | | | | | | | | | | |
Portfolio turnover rate | | | 66 | % | | | 60 | % | | | 205 | % | | | 127 | % | | | 58 | % |
Net assets, end of period (000’s omitted) | | | $46,017 | | | | $67,659 | | | | $69,407 | | | | $71,286 | | | | $190,766 | |
| 1. | After the close of business on July 16, 2010, the Fund acquired the net assets of Evergreen VA International Equity Fund which became the accounting and performance survivor in the transaction. The information for the periods prior to July 19, 2010 is that of Class 1 of Evergreen VA International Equity Fund. The per share information has been adjusted to give effect to this transaction. |
| 2. | Calculated based upon average shares outstanding |
The accompanying notes are an integral part of these financial statements.
| | | | |
| 18 | | Wells Fargo Advantage VT International Equity Fund | | Financial Highlights |
(For a share outstanding throughout each period)
| | | | | | | | | | | | | | | | | | | | |
| | | Year Ended December 31, | |
| Class 2 | | 2011 | | | 20101 | | | 20091 | | | 20081 | | | 20071 | |
Net asset value, beginning of period | | $ | 5.74 | | | $ | 5.15 | | | $ | 4.64 | | | $ | 8.15 | | | $ | 7.84 | |
Net investment income | | | 0.09 | 2 | | | 0.06 | 2 | | | 0.04 | 2 | | | 0.18 | 2 | | | 0.14 | |
Net realized and unrealized gains (losses) on investments | | | (0.79 | ) | | | 0.75 | | | | 0.62 | | | | (3.51 | ) | | | 1.01 | |
| | | | | | | | | | | | | | | | | | | | |
Total from investment operations | | | (0.70 | ) | | | 0.81 | | | | 0.66 | | | | (3.33 | ) | | | 1.15 | |
Distributions to shareholders from | | | | | | | | | | | | | | | | | | | | |
Net investment income | | | (0.01 | ) | | | (0.04 | ) | | | (0.15 | ) | | | 0.00 | | | | (0.18 | ) |
Net realized gains | | | (0.25 | ) | | | (0.18 | ) | | | 0.00 | | | | (0.18 | ) | | | (0.66 | ) |
| | | | | | | | | | | | | | | | | | | | |
Total distributions to shareholders | | | (0.26 | ) | | | (0.22 | ) | | | (0.15 | ) | | | (0.18 | ) | | | (0.84 | ) |
Net asset value, end of period | | $ | 4.78 | | | $ | 5.74 | | | $ | 5.15 | | | $ | 4.64 | | | $ | 8.15 | |
Total return | | | (12.91 | )% | | | 16.50 | % | | | 15.47 | % | | | (41.60 | )% | | | 14.73 | % |
Ratios to average net assets (annualized) | | | | | | | | | | | | | | | | | | | | |
Gross expenses | | | 1.22 | % | | | 0.97 | % | | | 0.89 | % | | | 0.92 | % | | | 0.88 | % |
Net expenses | | | 0.94 | % | | | 0.89 | % | | | 0.89 | % | | | 0.92 | % | | | 0.88 | % |
Net investment income | | | 1.75 | % | | | 1.22 | % | | | 0.70 | % | | | 2.74 | % | | | 1.75 | % |
Supplemental data | | | | | | | | | | | | | | | | | | | | |
Portfolio turnover rate | | | 66 | % | | | 60 | % | | | 205 | % | | | 127 | % | | | 58 | % |
Net assets, end of period (000’s omitted) | | | $227,692 | | | | $218,348 | | | | $891,137 | | | | $56,692 | | | | $118,843 | |
| 1. | After the close of business on July 16, 2010, the Fund acquired the net assets of Evergreen VA International Equity Fund which became the accounting and performance survivor in the transaction. The information for the periods prior to July 19, 2010 is that of Class 2 of Evergreen VA International Equity Fund. The per share information has been adjusted to give effect to this transaction. |
| 2. | Calculated based upon average shares outstanding |
The accompanying notes are an integral part of these financial statements.
| | | | | | |
| Notes to Financial Statements | | Wells Fargo Advantage VT International Equity Fund | | | 19 | |
1. ORGANIZATION
Wells Fargo Variable Trust (the “Trust”), a Delaware statutory trust organized on March 10, 1999, is an open-end management investment company registered under the Investment Company Act of 1940, as amended (the “1940 Act”). These financial statements report on Wells Fargo Advantage VT International Equity Fund (the “Fund”) which is a diversified series of the Trust.
2. SIGNIFICANT ACCOUNTING POLICIES
The following significant accounting policies, which are consistently followed in the preparation of the financial statements of the Fund, are in conformity with U.S. generally accepted accounting principles which require management to make estimates and assumptions that affect the reported amounts of assets and liabilities, disclosure of contingent assets and liabilities at the date of the financial statements, and the reported amounts of revenues and expenses during the reporting period. Actual results could differ from those estimates.
Securities valuation
Investments in equity securities are valued each business day as of the close of regular trading on the New York Stock Exchange, which is usually 4:00 p.m. (Eastern Time). Securities which are traded on a national or foreign securities exchange are valued at the last reported sales price, except that securities listed on The Nasdaq Stock Market, Inc. (“Nasdaq”) are valued at the Nasdaq Official Closing Price (“NOCP”), and if no NOCP is available, then at the last reported sales price. If no sales price is shown on the Nasdaq, the bid price will be used. In the absence of any sale of securities listed on the Nasdaq, and in the case of other securities (including U.S. Government obligations, but excluding debt securities maturing in 60 days or less), the price will be deemed “stale” and the valuations will be determined in accordance with the Fund’s Fair Value Procedures.
Securities denominated in foreign currencies are translated into U.S. dollars using the closing rates of exchange in effect on the day of valuation.
Many securities markets and exchanges outside the U.S. close prior to the close of the New York Stock Exchange and therefore may not fully reflect trading or events that occur after the close of the principal exchange in which the foreign investments are traded but before the close of the New York Stock Exchange. If such trading or events are expected to materially affect the value of the investments, then those investments are fair valued following procedures approved by the Board of Trustees. These procedures take into account multiple factors including movements in U.S. securities markets after foreign exchanges close. Depending on market activity, such fair valuations may be frequent. Such fair value pricing may result in NAVs that are higher or lower than NAVs based on the closing price or latest quoted bid price.
Debt securities of sufficient credit quality with original maturities of 60 days or less generally are valued at amortized cost which approximates fair value. The amortized cost method involves valuing a security at its cost, plus accretion of discount or minus amortization of premium over the period until maturity.
Investments in open-end mutual funds and non-registered investment companies are generally valued at net asset value.
Investments which are not valued using any of the methods discussed above, are valued at their fair value, as determined by procedures established in good faith and approved by the Board of Trustees.
Foreign currency translation
The accounting records of the Fund are maintained in U.S. dollars. Assets, including investment securities, and liabilities denominated in foreign currency are translated into U.S. dollars at the prevailing rates of exchange at the date of valuation. Purchases and sales of securities, and income and expenses are translated at the prevailing rate of exchange on the respective dates of such transactions. Reported net realized foreign exchange gains or losses arise from sales of foreign currencies, currency gains or losses realized between the trade and settlement dates on securities transactions, and the difference between the amounts of dividends, interest and foreign withholding taxes recorded and the U.S. dollar equivalent of the amounts actually paid or received. Net unrealized foreign exchange gains and losses arise from changes in the fair value of assets and liabilities other than investments in securities resulting in changes in exchange rates.
The changes in net assets arising from changes in exchange rates and the changes in net assets resulting from changes in market prices of securities are not separately presented. Such changes are recorded with net realized and unrealized gains or losses from investments. Gains and losses from certain foreign currency transactions are treated as ordinary income for U.S. federal income tax purposes.
| | | | |
| 20 | | Wells Fargo Advantage VT International Equity Fund | | Notes to Financial Statements |
Forward foreign currency contracts
The Fund may be subject to foreign currency exchange rate risk in the normal course of pursuing its investment objectives. A forward foreign currency contract is an agreement between two parties to purchase or sell a specific currency for an agreed-upon price at a future date. The Fund enters into forward foreign currency contracts to facilitate transactions in foreign-denominated securities and to attempt to minimize the risk to the Fund from adverse changes in the relationship between currencies. Forward foreign currency contracts are recorded at the forward rate and marked-to-market daily. When the contracts are closed, realized gains and losses arising from such transactions are recorded as realized gains or losses on foreign currency related transactions. The Fund could be exposed to risks if the counterparties to the contracts are unable to meet the terms of their contracts or if the value of the foreign currency changes unfavorably. The Fund’s maximum risk of loss from counterparty credit risk is the unrealized gains or losses on the contracts. This risk is mitigated by having a master netting arrangement between the Fund and the counterparty.
Security loans
The Fund may lend its securities from time to time in order to earn additional income in the form of fees or interest on securities received as collateral or the investment of any cash received as collateral. The Fund continues to receive interest or dividends on the securities loaned. The Fund receives collateral in the form of cash or securities with a value at least equal to the value of the securities on loan. The value of the loaned securities is determined at the close of each business day and any additional required collateral is delivered to the Fund on the next business day. In a securities lending transaction, the net asset value of the Fund will be affected by an increase or decrease in the value of the securities loaned and by an increase or decrease in the value of the instrument in which collateral is invested. The amount of securities lending activity undertaken by the Fund fluctuates from time to time. In the event of default or bankruptcy by the borrower, the Fund may be prevented from recovering the loaned securities or gaining access to the collateral or may experience delays or costs in doing so. In addition, the investment of any cash collateral received may lose all or part of its value. The Fund has the right under the lending agreement to recover the securities from the borrower on demand.
The Fund lends its securities through an unaffiliated securities lending agent. Cash collateral received in connection with its securities lending transactions is invested in Wells Fargo Securities Lending Cash Investments, LLC (the “Cash Collateral Fund”). The Cash Collateral Fund is exempt from registration under Section 3(c)(7) of the 1940 Act and is managed by Wells Fargo Funds Management LLC (“Funds Management”) and is sub-advised by Wells Capital Management Incorporated (“Wells Capital Management”). Funds Management receives an advisory fee starting at 0.05% and declining to 0.01% as the average daily net assets of the Cash Collateral Fund increase. All of the fees received by Funds Management are paid to Wells Capital Management for its services as sub-adviser. The Cash Collateral Fund seeks to provide a positive return compared to the daily Fed Funds Open rate by investing in high-quality, U.S. dollar-denominated short-term money market instruments. Cash Collateral Fund investments are fair valued based upon the amortized cost valuation technique. Income earned from investment in the Cash Collateral Fund is included in securities lending income on the Statement of Operations.
Security transactions and income recognition
Securities transactions are recorded on a trade date basis. Realized gains or losses are reported on the basis of identified cost of securities delivered.
Dividend income is recognized on the ex-dividend date, except for certain dividends from foreign securities, which are recorded as soon as the Fund is informed of the ex-dividend date. Dividend income from foreign securities is recorded net of foreign taxes withheld where recovery of such taxes is not assured.
Distributions to shareholders
Distributions to shareholders from net investment income and net realized gains, if any, are recorded on the ex-dividend date. Such distributions are determined in conformity with income tax regulations, which may differ from generally accepted accounting principles.
The timing and character of distributions made during the period from net investment income or net realized gains may differ from their ultimate characterization for federal income tax purposes. To the extent that these differences are permanent in nature, such amounts are reclassified within the capital accounts based on their federal tax-basis treatment. Temporary differences do not require reclassifications. The primary permanent differences causing such reclassifications
| | | | | | |
| Notes to Financial Statements | | Wells Fargo Advantage VT International Equity Fund | | | 21 | |
are due to foreign currency transactions. At December 31, 2011, as a result of permanent book-to-tax differences, the following reclassification adjustments were made on the Statement of Assets and Liabilities:
| | | | | | |
Undistributed
Net Investment
Income | | | Accumulated
Net Realized
Gains on
Investments | |
| $ | (571,343 | ) | | $ | 571,343 | |
Federal and other taxes
The Fund intends to continue to qualify as a regulated investment company by distributing substantially all of its investment company taxable income and any net realized capital gains (after reduction for capital loss carryforwards) sufficient to relieve it from all, or substantially all, federal income taxes. Accordingly, no provision for federal income taxes was required.
The Fund’s income and federal excise tax returns and all financial records supporting those returns for the prior three fiscal years are subject to examination by the federal and Delaware revenue authorities.
Under the recently enacted Regulated Investment Company Modernization Act of 2010, the Fund is permitted to carry forward capital losses incurred in taxable years which began after December 22, 2010 for an unlimited period. However, any losses incurred are required to be utilized prior to the losses incurred in pre-enactment taxable years. As a result of this ordering rule, pre-enactment capital loss carryforwards may be more likely to expire unused. Additionally, post-enactment capital losses that are carried forward will retain their character as either short-term or long-term capital losses rather than being considered all short-term as under previous law.
As of December 31, 2011, the Fund had net capital loss carryforwards, which are available to offset future net realized capital gains, in the amount of $4,003,584 expiring in 2017.
Class allocations
The separate classes of shares offered by the Fund differ principally in distribution fees. Shareholders of each class bear certain expenses that pertain to that particular class. All shareholders bear the common expenses of the Fund, earn income from the portfolio, and are allocated unrealized gains and losses pro rata based on the average daily net assets of each class, without distinction between share classes. Dividends are determined separately for each class based on income and expenses allocable to each class. Realized gains and losses are allocated to each class pro rata based upon the net assets of each class on the date realized. Differences in per share dividend rates generally result from the relative weightings of pro rata income and realized gain allocations and from differences in separate class expenses, including distribution fees.
3. FAIR VALUATION MEASUREMENTS
Fair value measurements of investments are determined within a framework that has established a fair value hierarchy based upon the various data inputs utilized in determining the value of the Fund’s investments. The three-level hierarchy gives the highest priority to unadjusted quoted prices in active markets for identical assets or liabilities (Level 1) and the lowest priority to significant unobservable inputs (Level 3). The Fund’s investments are classified within the fair value hierarchy based on the lowest level of input that is significant to the fair value measurement. The inputs are summarized into three broad levels as follows:
| n | | Level 1 – quoted prices in active markets for identical securities |
| n | | Level 2 – other significant observable inputs (including quoted prices for similar securities, interest rates, prepayment speeds, credit risk, etc.) |
| n | | Level 3 – significant unobservable inputs (including the Fund’s own assumptions in determining the fair value of investments) |
The inputs or methodologies used for valuing securities are not necessarily an indication of the risk associated with investing in those securities.
| | | | |
| 22 | | Wells Fargo Advantage VT International Equity Fund | | Notes to Financial Statements |
As of December 31, 2011, the inputs used in valuing the Fund’s assets, which are carried at fair value, were as follows:
| | | | | | | | | | | | | | | | |
| Investments in Securities | | Quoted Prices (Level 1) | | | Significant Other
Observable Inputs (Level 2) | | | Significant Unobservable Inputs (Level 3) | | | Total | |
Equity securities | | | | | | | | | | | | | | | | |
Common stocks | | $ | 261,339,552 | | | $ | 0 | | | $ | 0 | | | $ | 261,339,552 | |
Investment companies | | | 1,263,411 | | | | 0 | | | | 0 | | | | 1,263,411 | |
Short-term investments | | | | | | | | | | | | | | | | |
Investment companies | | | 9,735,355 | | | | 3,700,279 | | | | 0 | | | | 13,435,634 | |
| | | $ | 272,338,318 | | | $ | 3,700,279 | | | $ | 0 | | | $ | 276,038,597 | |
Further details on the major security types listed above can be found in the Portfolio of Investments.
As of December 31, 2011, the inputs used in valuing the Fund’s other financial instruments, which are carried at fair value, were as follows:
| | | | | | | | | | | | | | | | |
| Other Financial Instruments | | Quoted Prices (Level 1) | | | Significant Other
Observable Inputs (Level 2) | | | Significant Unobservable Inputs (Level 3) | | | Total | |
Forward foreign currency contracts+ | | $ | 0 | | | $ | (133,104 | ) | | $ | 0 | | | $ | (133,104 | ) |
| + | Forward foreign currency contracts are presented at the unrealized gains or losses on the instrument. |
Transfers in and transfers out are recognized at the end of the reporting period. For the year ended December 31, 2011, the Fund did not have any significant transfers into/out of Level 1 and Level 2.
4. TRANSACTIONS WITH AFFILIATES AND OTHER EXPENSES
Advisory fee
The Trust has entered into an advisory contract with Funds Management, an indirect wholly owned subsidiary of Wells Fargo & Company (“Wells Fargo”). The adviser is responsible for implementing investment policies and guidelines and for supervising the sub-adviser, who is responsible for day-to-day portfolio management of the Fund.
Pursuant to the contract, Funds Management is entitled to receive an annual advisory fee starting at 0.75% and declining to 0.60% as the average daily net assets of the Fund increase. For the year ended December 31, 2011, the advisory fee was equivalent to an annual rate of 0.75% of the Fund’s average daily net assets.
Funds Management may retain the services of certain sub-advisers to provide daily portfolio management to the Fund. The fees related to sub-advisory services are borne directly by Funds Management and do not increase the overall fees paid by the Fund. Wells Capital Management, an affiliate of Funds Management, is the sub-adviser to the Fund and is entitled to receive a fee from Funds Management at an annual rate starting at 0.45% and declining to 0.40% as the average daily net assets of the Fund increase.
Administration and transfer agent fees
The Trust has entered into an administration agreement with Funds Management. Under this agreement, for providing administrative services, which includes paying fees and expenses for services provided by the transfer agent, sub-transfer agents, omnibus account servicers and record-keepers, Funds Management is entitled to receive from the Fund an annual fund level administration fee starting at 0.05% and declining to 0.03% as the average daily net assets of the Fund increase and a class level administration fee of 0.08% of the average daily net assets of each class.
Funds Management has contractually waived and/or reimbursed advisory and administration fees to the extent necessary to maintain certain net operating expense ratios for the Fund. Waiver of fees and/or reimbursement of expenses by Funds Management were made first from fund level expenses on a proportionate basis and then from class specific expenses.
| | | | | | |
| Notes to Financial Statements | | Wells Fargo Advantage VT International Equity Fund | | | 23 | |
Distribution fees
The Trust has adopted a Distribution Plan for Class 2 shares of the Fund pursuant to Rule 12b-1 under the 1940 Act. Distribution fees are charged to the Class 2 shares and paid to Wells Fargo Funds Distributor, LLC, the principal underwriter, at an annual rate of 0.25% of its average daily net assets.
5. INVESTMENT PORTFOLIO TRANSACTIONS
Purchases and sales of investments, excluding U.S. Government obligations (if any) and short-term securities (securities with maturities of one year or less at purchase date), for the year ended December 31, 2011 were $201,772,991 and $177,723,213, respectively.
6. DERIVATIVE TRANSACTIONS
During the year ended December 31, 2011, the Fund entered into forward foreign currency exchange contracts for economic hedging purposes.
At December 31, 2011, the Fund had forward foreign currency contracts outstanding as follows:
Forward foreign currency contracts to buy:
| | | | | | | | | | | | | | | | | | |
| Exchange Date | | Counterparty | | Contracts to
Receive | | | U.S. Value at
December 31, 2011 | | | In Exchange
for U.S. $ | | | Net Unrealized
Gains
(Losses) | |
| 01/05/2012 | | Barclays | | | 4,800,000 | GBP | | $ | 7,454,336 | | | $ | 7,576,176 | | | $ | (121,840 | ) |
Forward foreign currency contracts to sell:
| | | | | | | | | | | | | | | | | | |
| Exchange Date | | Counterparty | | Contracts to
Deliver | | | U.S. Value at
December 31, 2011 | | | In Exchange
for U.S. $ | | | Net Unrealized
Gains
(Losses) | |
| 01/05/2012 | | Barclays | | | 4,800,000 | GBP | | $ | 7,454,336 | | | $ | 7,443,072 | | | $ | (11,264 | ) |
The Fund had average contract amounts of $5,461,465 and $10,760,943 in forward foreign currency exchange contracts to buy and forward foreign currency exchange contracts to sell, respectively, during the year ended December 31, 2011.
The fair value, realized gains or losses and change in unrealized gains or losses, if any, on derivative instruments are reflected in the appropriate financial statements.
7. ACQUISTION
After the close of business July 16, 2010, the Fund (named Wells Fargo Advantage VT International Core Fund at the time of the reorganization), which is the legal survivor, acquired the net assets of Evergreen VA International Equity Fund, the accounting and performance survivor. The purpose of the transaction was to combine two funds with similar investment objectives and strategies. The acquisition was accomplished by a tax-free exchange of all of the shares of Evergreen VA International Equity Fund. Shareholders holding Class 1 and Class 2 shares of Evergreen VA International Equity Fund received Class 1 and Class 2, respectively, of the Fund in the reorganization. The exchange ratios and number of shares issued to the Evergreen VA International Equity Fund were as follows:
| | | | | | | | | | | | |
| Acquired Fund | | Exchange
Ratio | | | Number of Shares Issued | |
Evergreen VA International Equity | | | 2.07 | | | | 12,919,350 | | | | Class 1 | |
| | | 2.06 | | | | 35,012,685 | | | | Class 2 | |
The investment portfolio of the Fund with a fair value of $16,596,518, identified cost of $15,909,494 and unrealized gains of $687,024 at July 16, 2010 was the principal assets acquired by the accounting and performance survivor. The shares and net assets of the Fund immediately prior to the acquisition were 3,526,065 shares and $16,640,001, respectively. The aggregate net assets of Evergreen VA International Equity Fund immediately prior to the acquisition was $226,195,623. The aggregate net assets of the Fund immediately after the acquisition was $242,835,624. For financial reporting purposes, assets received and shares issued by the Fund were recorded at fair value; however, the cost basis of the investments received from the Fund was carried forward to align ongoing reporting the Fund’s realized and unrealized gains and losses with amounts distributable to shareholders for tax purposes.
| | | | |
| 24 | | Wells Fargo Advantage VT International Equity Fund | | Notes to Financial Statements |
Assuming the acquisition had been completed January 1, 2010, the beginning of the annual reporting period for the Fund, the pro forma results of operations for the year ended December 31, 2010 would have been:
| | | | |
Net investment income | | $ | 6,329,569 | |
Net realized and unrealized losses on investments | | $ | (18,715,027 | ) |
Net decrease in net assets resulting from operations | | $ | (12,385,458 | ) |
8. BANK BORROWINGS
The Trust and Wells Fargo Funds Trust (excluding the money market funds) are parties to a $150,000,000 revolving credit agreement with State Street Bank and Trust Company, whereby the Fund is permitted to use bank borrowings for temporary or emergency purposes, such as to fund shareholder redemption requests. Interest under the credit agreement is charged to the Fund based on a borrowing rate equal to the higher of the Federal Funds rate in effect on that day plus 1.25% or the overnight LIBOR rate in effect on that day plus 1.25%. In addition, under the credit agreement, the Fund pays an annual commitment fee equal to 0.10% of the unused balance, which is allocated pro rata. Prior to September 6, 2011, the revolving credit agreement was for $125,000,000 and the annual commitment fee paid by the Fund was 0.125% of the unused balance. For the year ended December 31, 2011, the Fund paid $704 in commitment fees.
For the year ended December 31, 2011, there were no borrowings by the Fund under the agreement.
9. DISTRIBUTIONS TO SHAREHOLDERS
The tax character of distributions paid during the years ended December 31, 2011 and December 31, 2010 were as follows:
| | | | | | | | |
| | | Year ended December 31, | |
| | | 2011 | | | 2010 | |
Ordinary Income | | $ | 2,217,673 | | | $ | 7,463,984 | |
Long-term Capital Gain | | | 10,808,059 | | | | 16,889,927 | |
As of December 31, 2011, the components of distributable earnings on a tax basis were as follows:
| | | | | | |
Undistributed
Ordinary
Income | | Undistributed
Long-Term
Gain | | Unrealized
Gains (Losses) | | Capital Loss
Carryforward |
| $4,389,860 | | $21,230,540 | | $3,733,586 | | $(4,003,584) |
10. INDEMNIFICATION
Under the Trust’s organizational documents, the officers and directors are indemnified against certain liabilities that may arise out of performance of their duties to the Trust. Additionally, in the normal course of business, the Trust may enter into contracts with service providers that contain a variety of indemnification clauses. The Trust’s maximum exposure under these arrangements is dependent on future claims that may be made against the Fund and, therefore, cannot be estimated.
11. NEW ACCOUNTING PRONOUNCEMENTS
In May 2011, the Financial Accounting Standards Board (“FASB”) issued Accounting Standards Update (“ASU”) No. 2011-04 “Amendments to Achieve Common Fair Value Measurement and Disclosure Requirements in U.S. GAAP and IFRSs”. ASU No. 2011-04 amends FASB ASC Topic 820, Fair Value Measurements and Disclosures, to establish common requirements for measuring fair value and for disclosing information about fair value measurements in accordance with GAAP. The ASU is effective prospectively for interim and annual periods beginning after December 15, 2011. Management expects that adoption of the ASU will result in additional disclosures in the financial statements, as applicable.
In April 2011, FASB issued ASU No. 2011-03 “Reconsideration of Effective Control for Repurchase Agreements”. ASU No. 2011-03 amends FASB ASC Topic 860, Transfers and Servicing, specifically the criteria required to determine whether a
| | | | | | |
| Notes to Financial Statements | | Wells Fargo Advantage VT International Equity Fund | | | 25 | |
repurchase agreement (repo) and similar agreements should be accounted for as sales of financial assets or secured borrowings with commitments. ASU No. 2011-03 changes the assessment of effective control by focusing on the transferor’s contractual rights and obligations and removing the criterion to assess its ability to exercise those rights or honor those obligations. This could result in changes to the way entities account for certain transactions including repurchase agreements, mortgage dollar rolls and reverse repurchase agreements. The ASU will become effective on a prospective basis for new transfers and modifications to existing transactions as of the beginning of the first interim or annual period beginning on or after December 15, 2011. Management has evaluated the impact of adopting the ASU and expects no significant changes.
| | | | |
| 26 | | Wells Fargo Advantage VT International Equity Fund | | Report of Independent Registered Public Accounting Firm |
BOARD OF TRUSTEES AND SHAREHOLDERS OF WELLS FARGO VARIABLE TRUST:
We have audited the accompanying statement of assets and liabilities, including the portfolio of investments, of the Wells Fargo Advantage VT International Equity Fund (the “Fund”), one of the funds constituting the Wells Fargo Variable Trust, as of December 31, 2011, and the related statement of operations for the year then ended, statements of changes in net assets for each of the years in the two-year period then ended, and the financial highlights for each of the years in the five-year period then ended. These financial statements and financial highlights are the responsibility of the Fund’s management. Our responsibility is to express an opinion on these financial statements and financial highlights based on our audits.
We conducted our audits in accordance with the standards of the Public Company Accounting Oversight Board (United States). Those standards require that we plan and perform the audit to obtain reasonable assurance about whether the financial statements and financial highlights are free of material misstatement. An audit includes examining, on a test basis, evidence supporting the amounts and disclosures in the financial statements. Our procedures included confirmation of securities owned as of December 31, 2011, by correspondence with custodian and brokers, or by other appropriate auditing procedures. An audit also includes assessing the accounting principles used and significant estimates made by management, as well as evaluating the overall financial statement presentation. We believe that our audits provide a reasonable basis for our opinion.
In our opinion, the financial statements and financial highlights referred to above present fairly, in all material respects, the financial position of the Wells Fargo Advantage VT International Equity Fund as of December 31, 2011, the results of its operations for the year then ended, changes in its net assets for each of the years in the two-year period then ended, and the financial highlights for each of the years in the five-year period then ended, in conformity with U.S. generally accepted accounting principles.

Boston, Massachusetts
February 24, 2012
| | | | | | |
| Other Information (Unaudited) | | Wells Fargo Advantage VT International Equity Fund | | | 27 | |
TAX INFORMATION
Pursuant to Section 852 of the Internal Revenue Code, $10,808,059 was designated as long-term capital gain distributions for the fiscal year ended December 31, 2011.
Pursuant to Section 853 of the Internal Revenue Code, the following amounts have been designated as foreign taxes paid for the fiscal year ended December 31, 2011. These amounts may be less than the actual foreign taxes paid for financial statement purposes. Foreign taxes paid or withheld should be included in taxable income with an offsetting deduction from gross income or as a credit for taxes paid to foreign governments. None of the income was derived from ineligible foreign sources as defined under Section 901(j) of the Internal Revenue Code.
| | | | | | | | | | |
Creditable
Foreign Taxes
Paid | | | Per Share
Amount | | | Foreign Income as % of
Ordinary Income
Distributions | |
| $ | 655,512 | | | $ | 0.0114 | | | | 43.46 | % |
PROXY VOTING INFORMATION
A description of the policies and procedures that the Fund uses to determine how to vote proxies relating to portfolio securities is available without charge, upon request, by calling 1-800-222-8222, visiting our Web site at www.wellsfargo.com/advantagefunds, or visiting the SEC Web site at www.sec.gov. Information regarding how the Fund voted proxies relating to portfolio securities during the most recent 12-month period ended June 30 is available without charge on the Fund’s Web site at www.wellsfargo.com/advantagefunds or by visiting the SEC Web site at www.sec.gov.
PORTFOLIO HOLDINGS INFORMATION
The complete portfolio holdings for the Fund are publicly available on the Fund’s Web site (www.wellsfargo.com/advantagefunds) on a monthly, 30-day or more delayed basis. In addition, top ten holdings information for the Fund is publicly available on the Fund’s Web site on a monthly, seven-day or more delayed basis. The Fund files its complete schedule of portfolio holdings with the SEC for the first and third quarters of each fiscal year on Form N-Q, which is available without charge by visiting the SEC Web site at www.sec.gov. In addition, the Fund’s Form N-Q may be reviewed and copied at the SEC’s Public Reference Room in Washington, DC, and at regional offices in New York City, at 233 Broadway, and in Chicago, at 175 West Jackson Boulevard, Suite 900. Information about the Public Reference Room may be obtained by calling 1-800-SEC-0330.
| | | | |
| 28 | | Wells Fargo Advantage VT International Equity Fund | | Other Information (Unaudited) |
BOARD OF TRUSTEES
The following table provides basic information about the Board of Trustees (the “Trustees”) of the Trust and Officers of the Trust. This table should be read in conjunction with the Prospectus and the Statement of Additional Information1 of the Fund. Each of the Trustees and Officers listed below acts in identical capacities for the Wells Fargo Advantage family of funds, which consists of 138 funds comprising the Wells Fargo Funds Trust, Wells Fargo Variable Trust, Wells Fargo Master Trust and four closed-end funds (collectively the “Fund Complex”). All of the Trustees are also Members of the Audit and Governance Committees of each Trust in the Fund Complex. The mailing address of each Trustee and Officer is 525 Market Street, 12th Floor, San Francisco, CA 94105. Each Trustee and Officer serves an indefinite term, however, each Trustee serves such term until reaching the mandatory retirement age established by the Trustees.
Independent Trustees
| | | | | | |
Name and Year of Birth | | Position Held and Length of Service | | Principal Occupations During Past Five Years | | Other Directorships During
Past Five Years |
Peter G. Gordon
(Born 1942) | | Trustee, since 1998; Chairman, since 2005 (Lead Trustee since 2001) | | Co-Founder, Retired Chairman, President and CEO of Crystal Geyser Water Company. Trustee Emeritus, Colby College | | Asset Allocation Trust |
Isaiah Harris, Jr.
(Born 1952) | | Trustee, since 2009 | | Retired. Prior thereto, President and CEO of BellSouth Advertising and Publishing Corp. from 2005 to 2007, President and CEO of BellSouth Enterprises from 2004 to 2005 and President of BellSouth Consumer Services from 2000 to 2003. Emeritus member of the Iowa State University Foundation Board of Governors. Emeritus Member of the Advisory Board of Iowa State University School of Business. Mr. Harris is a certified public accountant. | | CIGNA Corporation; Deluxe Corporation; Asset Allocation Trust |
Judith M. Johnson
(Born 1949) | | Trustee, since 2008 | | Retired. Prior thereto, Chief Executive Officer and Chief Investment Officer of Minneapolis Employees Retirement Fund from 1996 to 2008. Ms. Johnson is an attorney, certified public accountant and a certified managerial accountant. | | Asset Allocation Trust |
Leroy Keith, Jr.
(Born 1939) | | Trustee, since 2010 | | Chairman, Bloc Global Services (development and construction). Trustee of the Evergreen Funds from 1983 to 2010. Former Managing Director, Almanac Capital Management (commodities firm), former Partner, Stonington Partners, Inc. (private equity fund), former Director, Obagi Medical Products Co. and former Director, Lincoln Educational Services. | | Trustee, Virtus Fund Complex (consisting of 40 portfolios as of 12/31/11); Asset Allocation Trust |
David F. Larcker
(Born 1950) | | Trustee, since 2009 | | James Irvin Miller Professor of Accounting at the Graduate School of Business, Stanford University, Director of Corporate Governance Research Program and Senior Faculty of The Rock Center for Corporate Governance since 2006. From 2005 to 2008, Professor of Accounting at the Graduate School of Business, Stanford University. Prior thereto, Ernst & Young Professor of Accounting at The Wharton School, University of Pennsylvania from 1985 to 2005. | | Asset Allocation Trust |
Olivia S. Mitchell
(Born 1953) | | Trustee, since 2006 | | International Foundation of Employee Benefit Plans Professor, Wharton School of the University of Pennsylvania since 1993. Director of Wharton’s Pension Research Council and Boettner Center on Pensions & Retirement Research, and Research Associate at the National Bureau of Economic Research. Previously, Cornell University Professor from 1978 to 1993. | | Asset Allocation Trust |
| | | | | | |
| Other Information (Unaudited) | | Wells Fargo Advantage VT International Equity Fund | | | 29 | |
| | | | | | |
Name and Year of Birth | | Position Held and Length of Service | | Principal Occupations During Past Five Years | | Other Directorships During
Past Five Years |
Timothy J. Penny
(Born 1951) | | Trustee, since 1996 | | President and CEO of Southern Minnesota Initiative Foundation, a non-profit organization, since 2007 and Senior Fellow at the Humphrey Institute Policy Forum at the University of Minnesota since 1995. Member of the Board of Trustees of NorthStar Education Finance, Inc., a non-profit organization, since 2007. | | Asset Allocation Trust |
Michael S. Scofield
(Born 1943) | | Trustee, since 2010 | | Served on the Investment Company Institute’s Board of Governors and Executive Committee from 2008-2011 as well the Governing Council of the Independent Directors Council from 2006-2011 and the Independent Directors Council Executive Committee from 2008-2011. Chairman of the IDC from 2008-2010. Institutional Investor (Fund Directions) Trustee of Year in 2007. Trustee of the Evergreen Funds (and its predecessors) from 1984 to 2010. Chairman of the Evergreen Funds from 2000-2010. Former Trustee of the Mentor Funds. Retired Attorney, Law Offices of Michael S. Scofield and former Director and Chairman, Branded Media Corporation (multi-media branding company). | | Asset Allocation Trust |
Donald C. Willeke
(Born 1940) | | Trustee, since 1996 | | Principal of the law firm of Willeke & Daniels. General Counsel of the Minneapolis Employees Retirement Fund from 1984 until its consolidation into the Minnesota Public Employees Retirement Association on June 30, 2010. Director and Vice Chair of The Free Trust (non-profit corporation). Director of the American Chestnut Foundation (non-profit corporation). | | Asset Allocation Trust |
Officers
| | | | | | |
Name and Year of Birth | | Position Held and
Length of Service | | Principal Occupations During Past Five Years | | |
Karla M. Rabusch
(Born 1959) | | President, since 2003 | | Executive Vice President of Wells Fargo Bank, N.A. and President of Wells Fargo Funds Management, LLC since 2003. Senior Vice President and Chief Administrative Officer of Wells Fargo Funds Management, LLC from 2001 to 2003. | | |
C. David Messman
(Born 1960) | | Secretary, since 2000; Chief Legal Counsel, since 2003 | | Senior Vice President and Secretary of Wells Fargo Funds Management, LLC since 2001. Vice President and Managing Senior Counsel of Wells Fargo Bank, N.A. since 1996. | | |
Kasey Phillips
(Born 1970) | | Treasurer, since 2009 | | Senior Vice President of Wells Fargo Funds Management, LLC since 2009. Senior Vice President of Evergreen Investment Management Company, LLC from 2006 to 2010. Treasurer of the Evergreen Funds from 2005 to 2010. | | |
David Berardi
(Born 1975) | | Assistant Treasurer, since 2009 | | Vice President of Wells Fargo Funds Management, LLC since 2009. Vice President of Evergreen Investment Management Company, LLC from 2008 to 2010. Assistant Vice President of Evergreen Investment Services, Inc. from 2004 to 2008. Manager of Fund Reporting and Control for Evergreen Investment Management Company, LLC from 2004 to 2010. | | |
Jeremy DePalma
(Born 1974) | | Assistant Treasurer, since 2009 | | Senior Vice President of Wells Fargo Funds Management, LLC since 2009. Senior Vice President of Evergreen Investment Management Company, LLC from 2008 to 2010. Vice President, Evergreen Investment Services, Inc. from 2004 to 2007. Head of the Fund Reporting and Control Team within Fund Administration from 2005 to 2010. | | |
Debra Ann Early
(Born 1964) | | Chief Compliance Officer, since 2007 | | Chief Compliance Officer of Wells Fargo Funds Management, LLC since 2007. Chief Compliance Officer of Parnassus Investments from 2005 to 2007. Chief Financial Officer of Parnassus Investments from 2004 to 2007 and Senior Audit Manager of PricewaterhouseCoopers LLP from 1998 to 2004. | | |
| 1. | The Statement of Additional Information includes additional information about the Trustees and is available, without charge, upon request, by calling 1-800-222-8222 or by visiting the Web site at www.wellsfargo.com/advantagefunds. |
| | | | |
| 30 | | Wells Fargo Advantage VT International Equity Fund | | List of Abbreviations |
The following is a list of common abbreviations for terms and entities which may have appeared in this report.
| ACB | — Agricultural Credit Bank |
| ADR | — American Depository Receipt |
| ADS | — American Depository Shares |
| AGC-ICC | — Assured Guaranty Corporation - Insured Custody Certificates |
| AGM | — Assured Guaranty Municipal |
| AMBAC | — American Municipal Bond Assurance Corporation |
| AMT | — Alternative Minimum Tax |
| BAN | — Bond Anticipation Notes |
| BHAC | — Berkshire Hathaway Assurance Corporation |
| CAB | — Capital Appreciation Bond |
| CCAB | — Convertible Capital Appreciation Bond |
| CDA | — Community Development Authority |
| CDO | — Collateralized Debt Obligation |
| COP | — Certificate of Participation |
| DRIVER | — Derivative Inverse Tax-Exempt Receipts |
| DW&P | — Department of Water & Power |
| DWR | — Department of Water Resources |
| ECFA | — Educational & Cultural Facilities Authority |
| EDA | — Economic Development Authority |
| EDFA | — Economic Development Finance Authority |
| ETF | — Exchange-Traded Fund |
| FFCB | — Federal Farm Credit Bank |
| FGIC | — Financial Guaranty Insurance Corporation |
| FHA | — Federal Housing Authority |
| FHLB | — Federal Home Loan Bank |
| FHLMC | — Federal Home Loan Mortgage Corporation |
| FNMA | — Federal National Mortgage Association |
| GDR | — Global Depository Receipt |
| GNMA | — Government National Mortgage Association |
| HCFR | — Healthcare Facilities Revenue |
| HEFA | — Health & Educational Facilities Authority |
| HEFAR | — Higher Education Facilities Authority Revenue |
| HFA | — Housing Finance Authority |
| HFFA | — Health Facilities Financing Authority |
| IBC | — Insured Bond Certificate |
| IDA | — Industrial Development Authority |
| IDAG | — Industrial Development Agency |
| IDR | — Industrial Development Revenue |
| KRW | — Republic of Korea Won |
| LIBOR | — London Interbank Offered Rate |
| LLC | — Limited Liability Company |
| LLP | — Limited Liability Partnership |
| MBIA | — Municipal Bond Insurance Association |
| MFHR | — Multi-Family Housing Revenue |
| MUD | — Municipal Utility District |
| NATL-RE | — National Public Finance Guarantee Corporation |
| PCFA | — Pollution Control Finance Authority |
| PCR | — Pollution Control Revenue |
| PFA | — Public Finance Authority |
| PFFA | — Public Facilities Financing Authority |
| PFOTER | — Puttable Floating Option Tax-Exempt Receipts |
| plc | — Public Limited Company |
| PUTTER | — Puttable Tax-Exempt Receipts |
| R&D | — Research & Development |
| RDA | — Redevelopment Authority |
| RDFA | — Redevelopment Finance Authority |
| REIT | — Real Estate Investment Trust |
| ROC | — Reset Option Certificates |
| SAVRS | — Select Auction Variable Rate Securities |
| SBA | — Small Business Authority |
| SFHR | — Single Family Housing Revenue |
| SFMR | — Single Family Mortgage Revenue |
| SPDR | — Standard & Poor’s Depositary Receipts |
| TAN | — Tax Anticipation Notes |
| TIPS | — Treasury Inflation-Protected Securities |
| TRAN | — Tax Revenue Anticipation Notes |
| TCR | — Transferable Custody Receipts |
| TTFA | — Transportation Trust Fund Authority |
| TVA | — Tennessee Valley Authority |
| XLCA | — XL Capital Assurance |


FOR MORE INFORMATION
More information about Wells Fargo Advantage Funds is available free upon request. To obtain literature, please write, e-mail, visit the Fund’s Web site, or call:
Wells Fargo Advantage Funds
P.O. Box 8266
Boston, MA 02266-8266
E-mail: wfaf@wellsfargo.com
Web site: www.wellsfargo.com/advantagefunds
Individual investors: 1-800-222-8222
Retail investment professionals: 1-888-877-9275
Institutional investment professionals: 1-866-765-0778
This report and the financial statements contained herein are submitted for the general information of the shareholders of Wells Fargo Advantage Funds. If this report is used for promotional purposes, distribution of the report must be accompanied or preceded by a current prospectus. For a prospectus containing more complete information, including charges and expenses, call 1-800-222-8222 or visit the Fund’s Web site at www.wellsfargo.com/advantagefunds. Please consider the investment objectives, risks, charges, and expenses of the investment carefully before investing. This and other information about Wells Fargo Advantage Funds can be found in the current prospectus. Read the prospectus carefully before you invest or send money.
Wells Fargo Funds Management, LLC, a wholly owned subsidiary of Wells Fargo & Company, provides investment advisory and administrative services for Wells Fargo Advantage Funds. Other affiliates of Wells Fargo & Company provide subadvisory and other services for the Funds. The Funds are distributed by Wells Fargo Funds Distributor, LLC, Member FINRA/SIPC, an affiliate of Wells Fargo & Company.
NOT FDIC INSURED ¡ NO BANK GUARANTEE ¡ MAY LOSE VALUE
© 2012 Wells Fargo Funds Management, LLC. All rights reserved.
| | |
| | 207573 02-12 AVT3/AR149 12-11 |

Wells Fargo Advantage
VT Intrinsic Value Fund

Annual Report
December 31, 2011
Reduce clutter. Save trees.
Sign up for electronic delivery of prospectuses and shareholder reports at www.wellsfargo.com/advantagedelivery
Contents
The views expressed and any forward-looking statements are as of December 31, 2011, unless otherwise noted, and are those of the Fund managers and/or Wells Fargo Funds Management, LLC. Discussions of individual securities, or the markets generally, or any Wells Fargo Advantage Fund are not intended as individual recommendations. Future events or results may vary significantly from those expressed in any forward-looking statements; the views expressed are subject to change at any time in response to changing circumstances in the market. Wells Fargo Funds Management, LLC, disclaims any obligation to publicly update or revise any views expressed or forward-looking statements.
NOT FDIC INSURED ¡ NO BANK GUARANTEE ¡ MAY LOSE VALUE

WELLS FARGO INVESTMENT HISTORY
| | |
| |
| 1932 | | Keystone creates one of the first mutual fund families. |
| |
| 1971 | | Wells Fargo & Company introduces one of the first institutional index funds. |
| |
| 1978 | | Wells Fargo applies Markowitz and Sharpe’s research on Modern Portfolio Theory to introduce one of the industry’s first Tactical Asset Allocation (TAA) models in institutional separately managed accounts. |
| |
| 1984 | | Wells Fargo Stagecoach Funds launches its first asset allocation fund. |
| |
| 1989 | | The Tactical Asset Allocation (TAA) Model is first applied to Wells Fargo’s asset allocation mutual funds. |
| |
| 1994 | | Wells Fargo introduces the LifePath Funds, one of the first suites of target date funds (now the Wells Fargo Advantage Dow Jones Target Date FundsSM ). |
| |
| 1996 | | Evergreen Investments and Keystone Funds merge. |
| |
| 1997 | | Wells Fargo launches Wells Fargo Advantage WealthBuilder PortfoliosSM, a fund-of-funds suite of products that includes the use of quantitative models to shift assets among investment styles. |
| |
| 1999 | | Norwest Advantage Funds and Stagecoach Funds are reorganized into Wells Fargo Funds after the merger of Norwest and Wells Fargo. |
| |
| 2002 | | Evergreen Retail and Evergreen Institutional companies form the umbrella asset management company, Evergreen Investments. |
| |
| 2005 | | The integration of Strong Funds with Wells Fargo Funds creates Wells Fargo Advantage Funds, resulting in one of the top 20 mutual fund companies in the United States. |
| |
| 2006 | | Wells Fargo Advantage Funds relaunches the target date product line as Wells Fargo Advantage Dow Jones Target Date Funds. |
| |
| 2010 | | The mergers and reorganizations of Evergreen and Wells Fargo Advantage mutual funds are completed, unifying the families under the brand of Wells Fargo Advantage Funds. |
Wells Fargo Advantage Funds®
Wells Fargo Advantage Funds skillfully guides institutions, financial advisors, and individuals through the investment terrain to help them reach their financial objectives. Everything we do on behalf of investors is backed by our unique combination of qualifications.
Strength
Our organization is built on the standards of integrity and service established by our parent company—Wells Fargo & Company—more than 150 years ago. And, because we’re part of a highly diversified financial enterprise, we offer the depth of resources to help investors succeed.
Expertise
Our multi-boutique model offers investors access to the independent thinking of premier investment managers that have been chosen for their time-tested strategies. While each team specializes in a specific investment strategy, collectively they provide investors a wide choice of distinct investment styles. Our dedication to investment excellence doesn’t end with our expertise in manager selection—risk management, analysis, and rigorous ongoing review seek to ensure each manager’s investment process remains consistent.
Partnership
Our collaborative approach is built around understanding the needs and goals of our clients. By adhering to core principles of sound judgment and steady guidance, we support you through every stage of the investment decision process.
Carefully consider a fund’s investment objectives, risks, charges, and expenses before investing. For a current prospectus and, if available, a summary prospectus, containing this and other information, visit wellsfargo.com/advantagefunds. Read it carefully before investing.
Wells Fargo Funds Management, LLC, a wholly owned subsidiary of Wells Fargo & Company, provides investment advisory and administrative services for Wells Fargo Advantage Funds®. Other affiliates of Wells Fargo & Company provide subadvisory and other services for the Funds. The Funds are distributed by Wells Fargo Funds Distributor, LLC, Member FINRA/SIPC, an affiliate of Wells Fargo & Company.
“Dow Jones®” and “Dow Jones Target Date IndexesSM” are service marks of Dow Jones Trademark Holdings, LLC (“Dow Jones”), have been licensed to CME Group Index Services LLC (“CME Indexes”) and have been sublicensed for use for certain purposes by Global Index Advisors, Inc, and Wells Fargo Funds Management, LLC. The Wells Fargo Advantage Dow Jones Target Date FundsSM based on the Dow Jones Target Date IndexesSM, are not sponsored, endorsed, sold or promoted by Dow Jones, CME Indexes or their respective affiliates and none of them makes any representation regarding the advisability of investing in such product(s).
NOT FDIC INSURED ¡ NO BANK GUARANTEE ¡ MAY LOSE VALUE
Not part of the annual report.
Wells Fargo Advantage Funds offers more than 110 mutual funds across a wide range of asset classes, representing over $216 billion in assets under management, as of December 31, 2011.
| | | | |
| Equity Funds | | | | |
Asia Pacific Fund | | Global Opportunities Fund | | Premier Large Company Growth Fund |
C&B Large Cap Value Fund | | Growth Fund | | Small Cap Opportunities Fund |
C&B Mid Cap Value Fund | | Health Care Fund | | Small Cap Value Fund |
Capital Growth Fund | | Index Fund | | Small Company Growth Fund |
Common Stock Fund | | International Equity Fund | | Small Company Value Fund |
Disciplined U.S. Core Fund | | International Value Fund | | Small/Mid Cap Core Fund |
Discovery Fund† | | Intrinsic Small Cap Value Fund | | Small/Mid Cap Value Fund |
Diversified Equity Fund | | Intrinsic Value Fund | | Social Sustainability Fund† |
Diversified International Fund | | Intrinsic World Equity Fund | | Special Mid Cap Value Fund |
Diversified Small Cap Fund | | Large Cap Core Fund | | Special Small Cap Value Fund |
Emerging Growth Fund | | Large Cap Growth Fund | | Specialized Technology Fund |
Emerging Markets Equity Fund | | Large Company Value Fund | | Strategic Large Cap Growth Fund |
Endeavor Select Fund† | | Omega Growth Fund | | Traditional Small Cap Growth Fund |
Enterprise Fund† | | Opportunity Fund† | | Utility and Telecommunications Fund |
Equity Value Fund | | Precious Metals Fund | | |
| Bond Funds | | | | |
Adjustable Rate Government Fund | | Inflation-Protected Bond Fund | | Short-Term Bond Fund |
California Limited-Term Tax-Free Fund | | Intermediate Tax/AMT-Free Fund | | Short-Term High Yield Bond Fund |
California Tax-Free Fund | | International Bond Fund | | Short-Term Municipal Bond Fund |
Colorado Tax-Free Fund | | Minnesota Tax-Free Fund | | Strategic Municipal Bond Fund |
Government Securities Fund | | Municipal Bond Fund | | Total Return Bond Fund |
High Income Fund | | North Carolina Tax-Free Fund | | Ultra Short-Term Income Fund |
High Yield Bond Fund | | Pennsylvania Tax-Free Fund | | Ultra Short-Term Municipal Income Fund |
Income Plus Fund | | Short Duration Government Bond Fund | | Wisconsin Tax-Free Fund |
| Asset Allocation Funds | | | | |
Asset Allocation Fund | | WealthBuilder Equity Portfolio† | | Target 2020 Fund† |
Conservative Allocation Fund | | WealthBuilder Growth Allocation Portfolio† | | Target 2025 Fund† |
Diversified Capital Builder Fund | | WealthBuilder Growth Balanced Portfolio† | | Target 2030 Fund† |
Diversified Income Builder Fund | | WealthBuilder Moderate Balanced Portfolio† | | Target 2035 Fund† |
Growth Balanced Fund | | WealthBuilder Tactical Equity Portfolio† | | Target 2040 Fund† |
Index Asset Allocation Fund | | Target Today Fund† | | Target 2045 Fund† |
Moderate Balanced Fund | | Target 2010 Fund† | | Target 2050 Fund† |
WealthBuilder Conservative Allocation Portfolio† | | Target 2015 Fund† | | Target 2055 Fund† |
| Money Market Funds | | | | |
100% Treasury Money Market Fund | | Heritage Money Market Fund† | | National Tax-Free Money Market Fund |
California Municipal Money Market Fund | | Money Market Fund | | Prime Investment Money Market Fund |
Cash Investment Money Market Fund | | Municipal Cash Management Money Market Fund | | Treasury Plus Money Market Fund |
Government Money Market Fund | | Municipal Money Market Fund | | |
| Variable Trust Funds1 | | | | |
VT Discovery Fund† | | VT Intrinsic Value Fund | | VT Small Cap Growth Fund |
VT Index Asset Allocation Fund | | VT Omega Growth Fund | | VT Small Cap Value Fund |
VT International Equity Fund | | VT Opportunity Fund† | | VT Total Return Bond Fund |
An investment in a money market fund is not insured or guaranteed by the Federal Deposit Insurance Corporation or any other government agency. Although the Wells Fargo Advantage Money Market Funds seek to preserve the value of your investment at $1.00 per share, it is possible to lose money by investing in a money market fund.
| 1. | The Variable Trust Funds are generally available only through insurance company variable contracts. |
| † | In this report, the Wells Fargo Advantage Discovery FundSM, Wells Fargo Advantage Endeavor Select FundSM, Wells Fargo Advantage Enterprise FundSM, Wells Fargo Advantage Opportunity FundSM, Wells Fargo Advantage Social Sustainability FundSM, Wells Fargo Advantage WealthBuilder Conservative Allocation PortfolioSM, Wells Fargo Advantage WealthBuilder Equity PortfolioSM, Wells Fargo Advantage WealthBuilder Growth Allocation PortfolioSM, Wells Fargo Advantage WealthBuilder Growth Balanced PortfolioSM, Wells Fargo Advantage WealthBuilder Moderate Balanced PortfolioSM, Wells Fargo Advantage WealthBuilder Tactical Equity PortfolioSM, Wells Fargo Advantage Dow Jones Target Today FundSM, Wells Fargo Advantage Dow Jones Target 2010 FundSM, Wells Fargo Advantage Dow Jones Target 2015 FundSM, Wells Fargo Advantage Dow Jones Target 2020 FundSM, Wells Fargo Advantage Dow Jones Target 2025 FundSM, Wells Fargo Advantage Dow Jones Target 2030 FundSM, Wells Fargo Advantage Dow Jones Target 2035 FundSM, Wells Fargo Advantage Dow Jones Target 2040 FundSM, Wells Fargo Advantage Dow Jones Target 2045 FundSM, Wells Fargo Advantage Dow Jones Target 2050 FundSM, Wells Fargo Advantage Dow Jones Target 2055 FundSM, Wells Fargo Advantage Heritage Money Market FundSM, Wells Fargo Advantage VT Discovery FundSM, and Wells Fargo Advantage VT Opportunity FundSM are referred to as the Discovery Fund, Endeavor Select Fund, Enterprise Fund, Opportunity Fund, Social Sustainability Fund, WealthBuilder Conservative Allocation Portfolio, WealthBuilder Equity Portfolio, WealthBuilder Growth Allocation Portfolio, WealthBuilder Growth Balanced Portfolio, WealthBuilder Moderate Balanced Portfolio, WealthBuilder Tactical Equity Portfolio, Target Today Fund, Target 2010 Fund, Target 2015 Fund, Target 2020 Fund, Target 2025 Fund, Target 2030 Fund, Target 2035 Fund, Target 2040 Fund, Target 2045 Fund, Target 2050 Fund, Target 2055 Fund, Heritage Money Market Fund, VT Discovery Fund, and VT Opportunity Fund, respectively. |
Not part of the annual report.
| | | | |
| 2 | | Wells Fargo Advantage VT Intrinsic Value Fund | | Letter to Shareholders |

Karla M. Rabusch,
President
Wells Fargo Advantage Funds
The U.S. economic recovery that began in mid-2009 progressed throughout the 12-month period, yet the rate of growth remained subpar compared with most previous recovery cycles.
Dear Valued Shareholder:
We’re pleased to offer you this annual report for the Wells Fargo Advantage VT Intrinsic Value Fund for the 12-month period that ended December 31, 2011.
For the full 12-month period, most of the major domestic equity indexes posted either modest gains or relatively mild losses. However, the market’s 12-month return figures mask the uneven path that it traced throughout the year as investors had to contend with a variety of global and domestic headwinds. Whatever the future holds, we continue to believe that most investors can benefit from adhering to a well-diversified investment strategy. Over the long-term, such a strategy may allow you to balance risks and opportunities as you pursue your financial goals in a dynamic market landscape.
The economic recovery gained traction as the year progressed.
The U.S. economic recovery that began in mid-2009 progressed throughout the 12-month period, yet the rate of growth remained subpar compared with most previous recovery cycles.
2011 opened on a note of mounting optimism regarding the strength of the recovery, yet a batch of disappointing economic data in the spring and summer cast renewed doubts on the sustainability of the recovery. In September, it was reported that U.S. gross domestic product (GDP) grew at a mere 1.3% annual rate in the second quarter of 2011, following anemic growth at an annual rate of 0.4% in the first quarter. According to the December estimate, GDP growth accelerated to an annual rate of 1.8% in the third quarter, reigniting hopes for a sustainable recovery. Those hopes were buoyed by widespread anticipation of even stronger GDP growth in the fourth quarter. By the end of the 12-month period, few economists believed that the U.S. economy was in danger of sliding back into recession, although many expected a sluggish growth environment in 2012.
The struggling housing and labor markets slowed growth.
As has been the case throughout the recovery, the housing and labor markets continued to restrain economic momentum during 2011.
The beleaguered housing market has arguably exerted the biggest drag on growth. Despite intermittent signs of improvement, ongoing weakness in sales of both new and existing homes has put considerable downward pressure on prices. On the other hand, the labor market took a decided turn for the better in the latter half of the year: initial unemployment claims have eased in recent months, and the private sector has been steadily adding jobs. The pace of hiring, while not brisk, was sufficient to push the U.S. unemployment rate down to 8.5% as of December 2011—still well above its historical average, but at its lowest level since February 2009. Many observers expect the unemployment rate to decline further in 2012, which could act as a tailwind for consumer spending—widely viewed as one of the keys to long-term economic growth.
The Federal Reserve announced that it will keep rates low until 2013.
Consumers have already demonstrated some resilience in their spending—even in the face of higher energy costs. Oil prices skyrocketed in early 2011 before retreating later in the year, only to spike again during the fourth quarter. Yet “core” inflation, which excludes volatile energy and food prices, remained fairly benign throughout the year.
| | | | | | |
| Letter to Shareholders | | Wells Fargo Advantage VT Intrinsic Value Fund | | | 3 | |
With inflation in check, the Federal Reserve (Fed) held its target range for the federal funds rate—a proxy for short-term interest rates—steady at 0% to 0.25%. Following its August 9 meeting, the Federal Open Market Committee (FOMC) issued a statement explaining that economic conditions were likely to warrant exceptionally low levels for the federal funds rate through at least mid-2013. In addition, the Fed carried out its second round of quantitative easing (QE2) in an effort to promote a more robust economic expansion. The stimulus program was completed as scheduled in June 2011. In September, the Fed launched yet another stimulus program—dubbed “Operation Twist”—that is designed to keep intermediate- and longer-term yields relatively low. The goal with keeping longer-term rates low is to encourage lending activity to spark business investments and home purchases, which, in turn, may provide support for a more sustainable economic recovery.
Market volatility was a dominant theme throughout most of 2011.
Despite pockets of turbulence sparked by the natural disasters in Japan and geopolitical turmoil in North Africa and the Middle East, the U.S. equity market performed very well from January through April of 2011. Some upbeat economic news, better-than-expected corporate profits, and investor enthusiasm about QE2 were among the catalysts for the market’s four-month advance.
In May and June, the market climate shifted to one of anxiety over the increasingly fragile state of the U.S. and global economies. As spring gave way to summer, investors not only worried that the U.S. might be on the brink of recession, they also feared that Europe’s sovereign debt problems could spiral out of control if a Greek default triggered financial contagion across the continent. In July and August, investor sentiment was further undermined by partisan wrangling over the federal debt ceiling and the Standard & Poor’s downgrade of the U.S. credit rating. The barrage of unsettling headlines led to heightened market volatility and sharply falling stock prices in the third quarter of 2011. Although volatility persisted into the fourth quarter, the market was able to rebound amid improved economic data and hopes for a resolution to the European crisis.
For the full 12-month period, the S&P 500 Index1 of large-cap stocks achieved a total return of 2.1%. The Russell Midcap® Index2 and the Russell 2000® Index3 of small-cap stocks lost 1.6% and 4.2%, respectively. International stocks fared worse than their U.S. counterparts, with the MSCI EAFE Index4 shedding 14.8%.
| 1. | The S&P 500 Index consists of 500 stocks chosen for market size, liquidity, and industry group representation. It is a market-value weighted index with each stock’s weight in the index proportionate to its market value. You cannot invest directly in an index. |
| 2. | The Russell Midcap® Index measures the performance of the 800 smallest companies in the Russell 1000 Index, which represent approximately 25% of the total market capitalization of the Russell 1000® Index. You cannot invest directly in an index. |
| 3. | The Russell 2000® Index measures the performance of the 2,000 smallest companies in the Russell 3000® Index, which represents approximately 8% of the total market capitalization of the Russell 3000 Index. You cannot invest directly in an index. |
| 4. | The Morgan Stanley Capital International Europe, Australasia, and Far East (“MSCI EAFE”) Stock Index is an unmanaged group of securities widely regarded by investors to be representations of the stock markets of Europe, Australasia, and the Far East. You cannot invest directly in an index. Source: MSCI. MSCI makes no express or implied warranties or representations and shall have no liability whatsoever with respect to any MSCI data contained herein. The MSCI data may not be further redistributed or used as a basis for other indexes or any securities or financial products. This report is not approved, reviewed or produced by MSCI. |
| | | | |
| 4 | | Wells Fargo Advantage VT Intrinsic Value Fund | | Letter to Shareholders |
The market turmoil of 2011 and an uncertain outlook going forward have left many investors questioning their resolve—and their investments. Yet, it is precisely at such times that the market may present opportunities—as well as challenges—for prudent investors.
Recent events have not altered our message to shareholders.
The market turmoil of 2011 and an uncertain outlook going forward have left many investors questioning their resolve—and their investments. Yet, it is precisely at such times that the market may present opportunities—as well as challenges—for prudent investors. Bear in mind that many investors who indiscriminately sold their equity investments during the severe market downturn of 2008 to 2009 missed out on the impressive two-year rally that followed. In our opinion, the lesson to be learned from these dramatic market events is that, for many investors, simply building and maintaining a well-diversified5 investment plan is the best long-term strategy.
To help you create a sound strategy based on your personal goals and risk tolerance, Wells Fargo Advantage Funds offers more than 110 mutual funds and other investments spanning a broad range of asset classes and investment styles. While diversification cannot guarantee an investment profit or prevent losses, we believe it can be an effective way to manage investment risk and potentially smooth out overall portfolio performance.
Thank you for choosing to invest with Wells Fargo Advantage Funds. We appreciate your confidence in us and remain committed to helping you meet your financial needs. For current information about your fund investments, contact your investment professional, visit our website at www.wellsfargo.com/advantagefunds, or call us directly at 1-800-222-8222. We are available 24 hours a day, 7 days a week.
Sincerely,

Karla M. Rabusch
President
Wells Fargo Advantage Funds
| 5. | Diversification does not assure or guarantee better performance and cannot eliminate the risk of investment losses. |
| | | | | | |
| Performance Highlights (Unaudited) | | Wells Fargo Advantage VT Intrinsic Value Fund | | | 5 | |
INVESTMENT OBJECTIVE
The Fund seeks long-term capital appreciation.
ADVISER
Wells Fargo Funds Management, LLC
SUB-ADVISER
Metropolitan West Capital Management, LLC
PORTFOLIO MANAGERS
Gary Lisenbee
Jeffrey Peck
David Graham2
FUND INCEPTION
May 6, 1996
| | | | |
| 12 MONTH TOTAL RETURN AS OF DECEMBER 31, 2011 | |
Class 2 | | | (2.15)% | |
Russell 1000® Value Index1 | | | 0.39% | |
Figures quoted represent past performance, which is no guarantee of future results and do not reflect the deduction of taxes that a shareholder may pay on fund distributions or the redemption of fund shares. Investment return and principal value of an investment will fluctuate so that an investor’s shares, when redeemed, may be worth more or less than their original cost. Current performance may be lower or higher than the performance data quoted and assumes the reinvestment of dividends and capital gains. Current month-end performance is available by calling 1-866-765-0778. Performance figures of the Fund do not reflect fees charged pursuant to the terms of variable life insurance policies and variable annuity contracts.
Index returns do not include transaction costs associated with buying and selling securities, any mutual fund fees or expenses or any taxes. It is not possible to invest directly in an index.
The Adviser has committed through July 18, 2013 to waive fees and/or reimburse expenses to the extent necessary to cap the Fund’s Total Annual Fund Operating Expenses After Fee Waiver, excluding certain other expenses at 1.00% for Class 2. The Fund’s gross and net expense ratios are 1.10% and 1.01%, respectively, for Class 2 shares. Without these reductions, the Fund’s returns would have been lower.
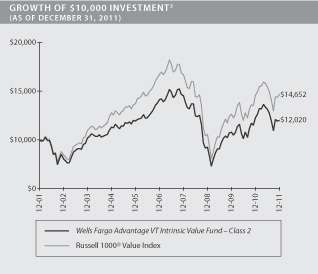
| 1. | The Russell 1000® Value Index measures the performance of those Russell 1000 companies with lower price-to-book ratios and lower forecasted growth values. You cannot invest directly in an index. |
| 2. | Effective March 30, 2012, David Graham, retired from Metropolitan West Capital Management, LLC. The Fund will continue to be managed by Gary Lisenbee and Jeffrey Peck. |
| 3. | The chart compares the performance of the Wells Fargo Advantage VT Intrinsic Value Fund Class 2 for the most recent ten years of the Fund with the Russell 1000 Value Index. The chart assumes a hypothetical $10,000 investment and reflects all operating expenses of the Fund. Performance figures of the Fund do not reflect fees charged pursuant to the terms of variable life insurance policies and variable annuity contracts. |
| | | | |
| 6 | | Wells Fargo Advantage VT Intrinsic Value Fund | | Performance Highlights (Unaudited) |
MANAGER’S DISCUSSION
Fund highlights
| n | | For the 12-month period that ended December 31, 2011, the Fund underperformed the Russell 1000® Value Index, largely because of unfavorable security selection. |
| n | | Stock selection in the health care, energy, and financials sectors detracted from relative returns. An underweight in utilities subtracted additional value. Security selection in the consumer discretionary and information technology (IT) sectors aided relative results, as did an overweight in consumer staples and an underweight in financials. |
| n | | Amid market volatility, we adhered to our disciplined investment process. We continued to focus on individual companies rather than on broad, top-down macroeconomic or sector forecasts. To help manage risk, we maintained the Fund’s broad diversification by sector, industry, and position. |
| | | | |
TEN LARGEST EQUITY HOLDINGS4
(AS OF DECEMBER 31, 2011) | |
Apple Incorporated | | | 3.28% | |
International Business Machines Corporation | | | 3.14% | |
Abbott Laboratories | | | 3.10% | |
Home Depot Incorporated | | | 3.04% | |
Diageo plc ADR | | | 3.02% | |
Hess Corporation | | | 3.01% | |
Time Warner Incorporated | | | 2.85% | |
Intuit Incorported | | | 2.84% | |
EMC Corporation | | | 2.78% | |
Boeing Company | | | 2.74% | |
Stock selection generally detracted from relative results during the 12-month period.
Notable detractors included holdings in the health care, energy, and financials sectors. An underweight in the top-performing utilities sector also subtracted from relative performance. (Sector weights are the result of our bottom-up stock selection process and do not represent tactical allocation decisions.)
Primary detractors across the portfolio included injectable pharmaceutical developer Hospira Incorporated, in the health care sector; integrated energy company Hess Corporation and oilfield services provider Weatherford International Limited in the energy sector; and Utah-based regional bank Zions Bancorporation in the financials sector. Conversely, security selection in the consumer discretionary and IT sectors aided relative results. An overweight to the relatively strong consumer staples sector and an underweight to the worst performer, financials, also contributed to relative returns. Top contributors within the Fund included luxury designer Ralph Lauren Corporation in consumer discretionary and technology solutions provider International Business Machines Corporation in the IT sector.
Many of the Fund’s non-U.S. holdings added value relative to the Russell 1000 Value Index over the past 12 months. We continue to maintain our global research perspective, which we believe allows us to better understand the companies in which we invest by providing context on their worldwide competitors, suppliers, and customers.
| 4. | The ten largest equity holdings are calculated based on the value of the securities divided by total net assets of the Fund. Holdings are subject to change and may have changed since the date specified. |
| | | | | | |
| Performance Highlights (Unaudited) | | Wells Fargo Advantage VT Intrinsic Value Fund | | | 7 | |
During the past 12 months, we added a few high-quality investments to the Fund’s holdings and divested a few positions according to our disciplined sale criteria.
| | |
SECTOR DISTRIBUTION5
(AS OF DECEMBER 31, 2011) |
|
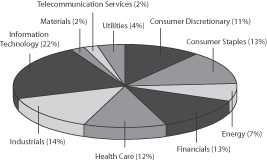 |
Consistent with our long-term investment perspective, portfolio turnover remained less than 30%, and the Fund’s positioning relative to the benchmark shifted moderately. The Fund’s underweight in energy increased significantly as we sold the Fund’s position in integrated energy company ConocoPhillips Company and swapped a holding in oil service provider Weatherford International for what we view as its higher-quality competitor, Schlumberger Limited. Within the health care sector, a new investment in health insurance benefit provider Cigna Corporation decreased the Fund’s underweight to this sector. Meanwhile, the Fund’s overweight in industrials increased modestly due to the purchase of package delivery company United Parcel Service Incorporated. Finally, the sale of retailer J. C. Penney Company, Incorporated, decreased the Fund’s overweight to the consumer discretionary sector. In all cases, trades were made based on fundamental, bottom-up research.
We have consistently noted that short-term stock market movements are influenced heavily by the media and investors’ focus on macroeconomic events, of which there are no shortage.
In 2011, there were many headlines vying for our attention, including (in no particular order): the earthquake and subsequent tsunami and nuclear accident in Japan, the uprising in the Middle East and North Africa, the U.S. debt-ceiling debate, the downgrade of the U.S. government’s credit rating by Standard & Poor’s, and the continuing European sovereign debt crisis. Some of the events will have longer-term economic implications, while many will not. Furthermore, with the presidential election this fall, the media will again have plenty to discuss. Of one thing we can be certain—the year 2012 will bring its share of unexpected events to which the market will react.
Consequently, we remain committed to seeking out high-quality businesses in great industries that trade at discounts to our estimate of intrinsic value and, in our view, possess catalysts to unlock that value within our multiyear investment horizon. We believe such businesses should provide exceptional opportunities for superior investment returns, regardless of what the markets may bring.
| 5. | Sector distribution is subject to change and is calculated based on the total long-term investments of the Fund. |
| | | | |
| 8 | | Wells Fargo Advantage VT Intrinsic Value Fund | | Performance Highlights (Unaudited) |
AVERAGE ANNUAL TOTAL RETURN6 (%) (AS OF DECEMBER 31, 2011)
| | | | | | | | | | | | | | | | | | | | | | | | | | | | |
| | | | | | | | | | | | | | | | | | Expense Ratios7 | |
| | | Inception Date | | | 6 Months* | | | 1 Year | | | 5 Year | | | 10 Year | | | Gross | | | Net8 | |
Class 2 | | | 05/06/1996 | | | | (8.60 | ) | | | (2.15 | ) | | | (3.20 | ) | | | 1.86 | | | | 1.10% | | | | 1.01% | |
Russell 1000® Value Index | | | | | | | (5.22 | ) | | | 0.39 | | | | (2.64 | ) | | | 3.89 | | | | | | | | | |
| * | Returns for periods of less than one year are not annualized. |
Figures quoted represent past performance, which is no guarantee of future results and do not reflect the deduction of taxes that a shareholder may pay on fund distributions or the redemption of fund shares. Investment return and principal value of an investment will fluctuate so that an investor’s shares, when redeemed, may be worth more or less than their original cost. Current performance may be lower or higher than the performance data quoted and assumes the reinvestment of dividends and capital gains. Current month-end performance is available by calling 1-866-765-0778. Performance figures of the Fund do not reflect fees charged pursuant to the terms of variable life insurance policies and variable annuity contracts.
Index returns do not include transaction costs associated with buying and selling securities, any mutual fund fees or expenses or any taxes. It is not possible to invest directly in an index.
Stock fund values fluctuate in response to the activities of individual companies and general market and economic conditions. The use of derivatives may reduce returns and/or increase volatility. Certain investment strategies tend to increase the total risk of an investment (relative to the broader market). This Fund is exposed to foreign investment risk. Consult the Fund’s prospectus for additional information on these and other risks.
Please refer to the prospectus provided by your participating insurance company for detailed information describing the separate accounts for information regarding surrender charges, mortality and expense risk fees and other charges that may be assessed by the participating insurance companies.
| 6. | Historical performance shown for Class 2 of the Fund prior to July 19, 2010 is based on the performance of the Fund’s predecessor, Wells Fargo Advantage VT Equity Income Fund. |
| 7. | Reflects the expense ratios as stated in the most recent prospectus. |
| 8. | The Adviser has committed through July 18, 2013 to waive fees and/or reimburse expenses to the extent necessary to cap the Fund’s Total Annual Fund Operating Expenses After Fee Waiver, excluding certain expenses, at 1.00% for Class 2. Without this cap, the Fund’s returns would have been lower. |
| | | | | | |
| Fund Expenses (Unaudited) | | Wells Fargo Advantage VT Intrinsic Value Fund | | | 9 | |
As a shareholder of the Fund, you incur ongoing costs, including management fees; distribution (12b-1) fees; and other Fund expenses. This example is intended to help you understand your ongoing costs (in dollars) of investing in the Fund and to compare these costs with the ongoing costs of investing in other mutual funds.
The example is based on an investment of $1,000 invested at the beginning of the six-month period and held for the entire period from July 1, 2011 to December 31, 2011.
Actual Expenses
The “Actual” line of the table below provides information about actual account values and actual expenses. You may use the information in this line, together with the amount you invested, to estimate the expenses that you paid over the period. Simply divide your account value by $1,000 (for example, an $8,600 account value divided by $1,000 = 8.6), then multiply the result by the number in the “Actual” line under the heading entitled “Expenses Paid During Period” for your applicable class of shares to estimate the expenses you paid on your account during this period.
Hypothetical Example for Comparison Purposes
The “Hypothetical” line of the table below provides information about hypothetical account values and hypothetical expenses based on the Fund’s actual expense ratio and an assumed rate of return of 5% per year before expenses, which is not the Fund’s actual return. The hypothetical account values and expenses may not be used to estimate the actual ending account balance or expenses you paid for the period. You may use this information to compare the ongoing costs of investing in the Fund and other funds. To do so, compare this 5% hypothetical example with the 5% hypothetical examples that appear in the shareholder reports of the other funds.
Please note that the expenses shown in the table are meant to highlight your ongoing costs only and do not reflect any separate account charges assessed by participating insurance companies. Therefore, the “Hypothetical” line of the table is useful in comparing ongoing costs only, and will not help you determine the relative total costs of owning different funds. In addition, if these separate account charges assessed by participating insurance companies were included, your costs would have been higher.
| | | | | | | | | | | | | | | | |
| | | Beginning
Account Value
07-01-2011 | | | Ending
Account Value
12-31-2011 | | | Expenses
Paid During
the Period1 | | | Net Annual
Expense Ratio | |
Class 2 | | | | | | | | | | | | | | | | |
Actual | | $ | 1,000.00 | | | $ | 913.99 | | | $ | 4.82 | | | | 1.00 | % |
Hypothetical (5% return before expenses) | | $ | 1,000.00 | | | $ | 1,020.16 | | | $ | 5.09 | | | | 1.00 | % |
| 1. | Expenses paid is equal to the annualized expense ratio multiplied by the average account value over the period, multiplied by the number of days in the most recent fiscal half-year divided by the number of days in the fiscal year (to reflect the one-half year period). |
| | | | |
| 10 | | Wells Fargo Advantage VT Intrinsic Value Fund | | Portfolio of Investments—December 31, 2011 |
| | | | | | | | | | | | |
| Security Name | | | | | | Shares | | | Value | |
| | | | | | | | | | | | |
| | | | |
Common Stocks: 96.24% | | | | | | | | | | | | |
| | | | |
Consumer Discretionary: 10.74% | | | | | | | | | | | | |
| | | | |
| Media: 2.85% | | | | | | | | | | | | |
Time Warner Incorporated« | | | | | | | 36,500 | | | $ | 1,319,110 | |
| | | | | | | | | | | | |
| | | | |
| Multiline Retail: 2.52% | | | | | | | | | | | | |
Nordstrom Incorporated | | | | | | | 23,450 | | | | 1,165,700 | |
| | | | | | | | | | | | |
| | | | |
| Specialty Retail: 3.04% | | | | | | | | | | | | |
Home Depot Incorporated | | | | | | | 33,500 | | | | 1,408,340 | |
| | | | | | | | | | | | |
| | | | |
| Textiles, Apparel & Luxury Goods: 2.33% | | | | | | | | | | | | |
Ralph Lauren Corporation | | | | | | | 7,800 | | | | 1,077,024 | |
| | | | | | | | | | | | |
| | | | |
Consumer Staples: 12.14% | | | | | | | | | | | | |
| | | | |
| Beverages: 3.02% | | | | | | | | | | | | |
Diageo plc ADR | | | | | | | 16,000 | | | | 1,398,720 | |
| | | | | | | | | | | | |
| | | | |
| Food & Staples Retailing: 1.84% | | | | | | | | | | | | |
Safeway Incorporated« | | | | | | | 40,500 | | | | 852,120 | |
| | | | | | | | | | | | |
| | | | |
| Food Products: 7.28% | | | | | | | | | | | | |
H.J. Heinz Company« | | | | | | | 21,300 | | | | 1,151,052 | |
The Hershey Company« | | | | | | | 19,500 | | | | 1,204,710 | |
Unilever NV | | | | | | | 29,500 | | | | 1,013,915 | |
| | | | |
| | | | | | | | | | | 3,369,677 | |
| | | | | | | | | | | | |
| | | | |
Energy: 6.61% | | | | | | | | | | | | |
| | | | |
| Energy Equipment & Services: 1.77% | | | | | | | | | | | | |
Schlumberger Limited | | | | | | | 12,000 | | | | 819,720 | |
| | | | | | | | | | | | |
| | | | |
| Oil, Gas & Consumable Fuels: 4.84% | | | | | | | | | | | | |
Hess Corporation | | | | | | | 24,500 | | | | 1,391,600 | |
QEP Resources Incorporated | | | | | | | 29,000 | | | | 849,700 | |
| | | | |
| | | | | | | | | | | 2,241,300 | |
| | | | | | | | | | | | |
| | | | |
Financials: 12.89% | | | | | | | | | | | | |
| | | | |
| Capital Markets: 6.45% | | | | | | | | | | | | |
Charles Schwab Corporation | | | | | | | 78,500 | | | | 883,910 | |
Franklin Resources Incorporated | | | | | | | 9,500 | | | | 912,570 | |
Northern Trust Corporation« | | | | | | | 30,000 | | | | 1,189,800 | |
| | | | |
| | | | | | | | | | | 2,986,280 | |
| | | | | | | | | | | | |
| | | | |
| Commercial Banks: 4.39% | | | | | | | | | | | | |
M&T Bank Corporation« | | | | | | | 14,000 | | | | 1,068,760 | |
Zions Bancorporation« | | | | | | | 59,000 | | | | 960,520 | |
| | | | |
| | | | | | | | | | | 2,029,280 | |
| | | | | | | | | | | | |
| | | | |
| Diversified Financial Services: 2.05% | | | | | | | | | | | | |
JPMorgan Chase & Company | | | | | | | 28,500 | | | | 947,625 | |
| | | | | | | | | | | | |
| | | | | | |
| Portfolio of Investments—December 31, 2011 | | Wells Fargo Advantage VT Intrinsic Value Fund | | | 11 | |
| | | | | | | | | | | | |
| Security Name | | | | | | Shares | | | Value | |
| | | | | | | | | | | | |
| | | | |
Health Care: 11.16% | | | | | | | | | | | | |
| | | | |
| Health Care Equipment & Supplies: 2.22% | | | | | | | | | | | | |
Baxter International Incorporated | | | | | | | 20,800 | | | $ | 1,029,184 | |
| | | | | | | | | | | | |
| | | | |
| Health Care Providers & Services: 2.00% | | | | | | | | | | | | |
CIGNA Corporation | | | | | | | 22,000 | | | | 924,000 | |
| | | | | | | | | | | | |
| | | | |
| Pharmaceuticals: 6.94% | | | | | | | | | | | | |
Abbott Laboratories | | | | | | | 25,500 | | | | 1,433,865 | |
Eli Lilly & Company | | | | | | | 26,000 | | | | 1,080,560 | |
Hospira IncorporatedǠ | | | | | | | 23,000 | | | | 698,510 | |
| | | | |
| | | | | | | | | | | 3,212,935 | |
| | | | | | | | | | | | |
| | | | |
Industrials: 12.96% | | | | | | | | | | | | |
| | | | |
| Aerospace & Defense: 6.39% | | | | | | | | | | | | |
Boeing Company | | | | | | | 17,300 | | | | 1,268,955 | |
Huntington Ingalls Industries IncorporatedǠ | | | | | | | 16,000 | | | | 500,480 | |
Northrop Grumman Corporation« | | | | | | | 20,300 | | | | 1,187,144 | |
| | | | |
| | | | | | | | | | | 2,956,579 | |
| | | | | | | | | | | | |
| | | | |
| Air Freight & Logistics: 2.29% | | | | | | | | | | | | |
United Parcel Service Incorporated Class B | | | | | | | 14,500 | | | | 1,061,255 | |
| | | | | | | | | | | | |
| | | | |
| Machinery: 4.28% | | | | | | | | | | | | |
Deere & Company« | | | | | | | 14,300 | | | | 1,106,105 | |
SPX Corporation | | | | | | | 14,500 | | | | 873,915 | |
| | | | |
| | | | | | | | | | | 1,980,020 | |
| | | | | | | | | | | | |
| | | | |
Information Technology: 21.27% | | | | | | | | | | | | |
| | | | |
| Communications Equipment: 2.25% | | | | | | | | | | | | |
QUALCOMM Incorporated | | | | | | | 19,000 | | | | 1,039,300 | |
| | | | | | | | | | | | |
| | | | |
| Computers & Peripherals: 6.06% | | | | | | | | | | | | |
Apple Incorporated† | | | | | | | 3,750 | | | | 1,518,750 | |
EMC Corporation† | | | | | | | 59,700 | | | | 1,285,938 | |
| | | | |
| | | | | | | | | | | 2,804,688 | |
| | | | | | | | | | | | |
| | | | |
| Internet Software & Services: 2.39% | | | | | | | | | | | | |
eBay Incorporated† | | | | | | | 36,500 | | | | 1,107,045 | |
| | | | | | | | | | | | |
| | | | |
| IT Services: 3.14% | | | | | | | | | | | | |
International Business Machines Corporation | | | | | | | 7,900 | | | | 1,452,652 | |
| | | | | | | | | | | | |
| | | | |
| Semiconductors & Semiconductor Equipment: 2.01% | | | | | | | | | | | | |
Texas Instruments Incorporated | | | | | | | 32,000 | | | | 931,520 | |
| | | | | | | | | | | | |
| | | | |
| Software: 5.42% | | | | | | | | | | | | |
Intuit Incorporated | | | | | | | 25,000 | | | | 1,314,750 | |
Oracle Corporation | | | | | | | 46,500 | | | | 1,192,725 | |
| | | | |
| | | | | | | | | | | 2,507,475 | |
| | | | | | | | | | | | |
| | | | |
| 12 | | Wells Fargo Advantage VT Intrinsic Value Fund | | Portfolio of Investments—December 31, 2011 |
| | | | | | | | | | | | | | |
| Security Name | | | | | | | Shares | | | Value | |
| | | | | | | | | | | | | | |
| | | | |
Materials: 1.99% | | | | | | | | | | | | | | |
| | | | |
| Chemicals: 1.99% | | | | | | | | | | | | | | |
Dow Chemical Company | | | | | | | | | 32,000 | | | $ | 920,320 | |
| | | | | | | | | | | | | | |
| | | | |
Telecommunication Services: 2.39% | | | | | | | | | | | | | | |
| | | | |
| Wireless Telecommunication Services: 2.39% | | | | | | | | | | | | | | |
Vodafone Group plc ADR | | | | | | | | | 39,500 | | | | 1,107,184 | |
| | | | | | | | | | | | | | |
| | | | |
Utilities: 4.09% | | | | | | | | | | | | | | |
| | | | |
| Electric Utilities: 2.63% | | | | | | | | | | | | | | |
Nextera Energy Incorporated | | | | | | | | | 20,000 | | | | 1,217,600 | |
| | | | | | | | | | | | | | |
| | | | |
| Gas Utilities: 1.46% | | | | | | | | | | | | | | |
Questar Corporation | | | | | | | | | 34,000 | | | | 675,242 | |
| | | | | | | | | | | | | | |
| | | | |
Total Common Stocks (Cost $39,900,513) | | | | | | | | | | | | | 44,541,895 | |
| | | | | | | | | | | | | | |
| | | | |
| | | | | | | | Principal | | | | |
| Other: 0.05% | | | | | | | | | | | | | | |
Gryphon Funding Limited, Pass-Through Entity(v)(i)(a) | | | | | | | | $ | 32,930 | | | | 9,220 | |
VFNC Corporation, Pass-Through Entity, 0.30%(v)(i)(a)±144A | | | | | | | | | 37,484 | | | | 16,118 | |
| | | | |
Total Other (Cost $12,115) | | | | | | | | | | | | | 25,338 | |
| | | | | | | | | | | | | | |
| | | | |
| | | | | Yield | | | Shares | | | | |
| Short-Term Investments: 27.63% | | | | | | | | | | | | | | |
| | | | |
| Investment Companies: 27.63% | | | | | | | | | | | | | | |
Wells Fargo Advantage Cash Investment Money Market Fund, Institutional Class(l)(u) | | | | | 0.04 | % | | | 1,443,207 | | | | 1,443,207 | |
Wells Fargo Securities Lending Cash Investments LLC(v)(l)(u)(r) | | | | | 0.12 | | | | 11,344,595 | | | | 11,344,595 | |
| | | | |
Total Short-Term Investments (Cost $12,787,802) | | | | | | | | | | | | | 12,787,802 | |
| | | | | | | | | | | | | | |
| | | | | | | | |
| Total Investments in Securities | | | | | | | | |
| (Cost $52,700,430)* | | | 123.92 | % | | | 57,355,035 | |
Other Assets and Liabilities, Net | | | (23.92 | ) | | | (11,070,490 | ) |
| | | | | | | | |
| Total Net Assets | | | 100.00 | % | | $ | 46,284,545 | |
| | | | | | | | |
| « | All or a portion of this security is on loan. |
| † | Non-income earning security. |
| (v) | Security represents investment of cash collateral received from securities on loan. |
| (i) | Illiquid security for which the designation as illiquid is unaudited. |
| (a) | Security is fair valued by the Management Valuation Team, and in certain instances by the Board of Trustees, in accordance with procedures approved by the Board of Trustees. |
| ± | Variable rate investment. |
| 144A | Security that may be resold to “qualified institutional buyers” under Rule 144A or security offered pursuant to Section 4(2) of the Securities Act of 1933, as amended. |
| (l) | Investment in an affiliate. |
| (u) | Rate shown is the 7-day annualized yield at period end. |
| (r) | The investment company is exempt from registration under Section 3(c)(7) of the 1940 Act. |
| * | Cost for federal income tax purposes is $52,764,924 and net unrealized appreciation (depreciation) consists of: |
| | | | |
Gross unrealized appreciation | | $ | 6,668,147 | |
Gross unrealized depreciation | | | (2,078,036 | ) |
| | | | |
Net unrealized appreciation | | $ | 4,590,111 | |
The accompanying notes are an integral part of these financial statements.
| | | | | | |
| Statement of Assets and Liabilities—December 31, 2011 | | Wells Fargo Advantage VT Intrinsic Value Fund | | | 13 | |
| | | | |
| | | | |
| |
Assets | | | | |
Investments | | | | |
In unaffiliated securities (including securities on loan), at value | | $ | 44,567,233 | |
In affiliated securities, at value | | | 12,787,802 | |
| | | | |
Total investments, at value (see cost below) | | | 57,355,035 | |
Receivable for investments sold | | | 276,441 | |
Receivable for dividends | | | 102,469 | |
Receivable for securities lending income | | | 865 | |
Prepaid expenses and other assets | | | 840 | |
| | | | |
Total assets | | | 57,735,650 | |
| | | | |
| |
Liabilities | | | | |
Payable for Fund shares redeemed | | | 28,022 | |
Payable upon receipt of securities loaned | | | 11,356,710 | |
Advisory fee payable | | | 1,320 | |
Distribution fees payable | | | 10,466 | |
Due to other related parties | | | 5,441 | |
Accrued expenses and other liabilities | | | 49,146 | |
| | | | |
Total liabilities | | | 11,451,105 | |
| | | | |
Total net assets | | $ | 46,284,545 | |
| | | | |
| |
NET ASSETS CONSIST OF | | | | |
Paid-in capital | | $ | 51,823,742 | |
Undistributed net investment income | | | 637,451 | |
Accumulated net realized losses on investments | | | (10,831,253 | ) |
Net unrealized gains on investments | | | 4,654,605 | |
| | | | |
Total net assets | | $ | 46,284,545 | |
| | | | |
| |
COMPUTATION OF NET ASSET VALUE PER SHARE1 | | | | |
Net assets – Class 2 | | $ | 46,284,545 | |
Shares outstanding – Class 2 | | | 3,726,328 | |
Net asset value per share – Class 2 | | | $12.42 | |
| |
Total investments, at cost | | $ | 52,700,430 | |
| | | | |
Securities on loan, at value | | $ | 11,024,463 | |
| | | | |
| 1. | The Fund has an unlimited number of authorized shares. |
The accompanying notes are an integral part of these financial statements.
| | | | |
| 14 | | Wells Fargo Advantage VT Intrinsic Value Fund | | Statement of Operations—Year Ended December 31, 2011 |
| | | | |
| | | | |
| |
Investment income | | | | |
Dividends* | | $ | 1,159,169 | |
Securities lending income, net | | | 20,915 | |
Income from affiliated securities | | | 2,109 | |
| | | | |
Total investment income | | | 1,182,193 | |
| | | | |
| |
Expenses | | | | |
Advisory fee | | | 299,601 | |
Administration fees | | | | |
Fund level | | | 27,236 | |
Class 2 | | | 43,578 | |
Distribution fees | | | | |
Class 2 | | | 136,182 | |
Custody and accounting fees | | | 12,100 | |
Professional fees | | | 39,953 | |
Shareholder report expenses | | | 57,265 | |
Trustees’ fees and expenses | | | 14,279 | |
Other fees and expenses | | | 5,291 | |
| | | | |
Total expenses | | | 635,485 | |
Less: Fee waivers and/or expense reimbursements | | | (90,757 | ) |
| | | | |
Net expenses | | | 544,728 | |
| | | | |
Net investment income | | | 637,465 | |
| | | | |
| |
REALIZED AND UNREALIZED GAINS (LOSSES) ON INVESTMENTS | | | | |
Net realized gains on investments | | | 1,243,561 | |
Net change in unrealized gains (losses) on investments | | | (2,810,230 | ) |
| | | | |
Net realized and unrealized gains (losses) on investments | | | (1,566,669 | ) |
| | | | |
Net decrease in net assets resulting from operations | | $ | (929,204 | ) |
| | | | |
| |
* Net of foreign dividend withholding taxes of | | | $15,697 | |
The accompanying notes are an integral part of these financial statements.
| | | | | | |
| Statements of Changes in Net Assets | | Wells Fargo Advantage VT Intrinsic Value Fund | | | 15 | |
| | | | | | | | | | | | | | | | |
| | | Year Ended December 31, 2011 | | | Year Ended December 31, 20101 | |
| | | | |
Operations | | | | | | | | | | | | | | | | |
Net investment income | | | | | | $ | 637,465 | | | | | | | $ | 682,537 | |
Net realized gains (losses) on investments | | | | | | | 1,243,561 | | | | | | | | (1,767,637 | ) |
Net change in unrealized gains (losses) on investments | | | | | | | (2,810,230 | ) | | | | | | | 9,056,350 | |
| | | | | | | | | | | | | | | | |
Net increase (decrease) in net assets resulting from operations | | | | | | | (929,204 | ) | | | | | | | 7,971,250 | |
| | | | | | | | | | | | | | | | |
| | | | |
Distributions to shareholders from | | | | | | | | | | | | | | | | |
Net investment income – Class 2 | | | | | | | (287,742 | ) | | | | | | | (413,858 | )2 |
| | | | | | | | | | | | | | | | |
| | | | |
| | | Shares | | | | | | Shares | | | | |
Capital share transactions | | | | | | | | | | | | | | | | |
Proceeds from shares sold – Class 2 | | | 404,649 | | | | 5,353,142 | | | | 4,130,068 | 2 | | | 45,177,175 | 2 |
Reinvestment of distributions – Class 2 | | | 21,619 | | | | 287,742 | | | | 36,555 | 2 | | | 413,858 | 2 |
Payment for shares redeemed – Class 2 | | | (1,311,539 | ) | | | (16,971,260 | ) | | | (5,578,424 | )2 | | | (61,920,948 | )2 |
Net asset value of shares issued in acquisitions – Class 2 | | | 0 | | | | 0 | | | | 1,211,148 | | | | 13,163,306 | |
| | | | | | | | | | | | | | | | |
Net decrease in net assets resulting
from capital share transactions | | | | | | | (11,330,376 | ) | | | | | | | (3,166,609 | ) |
| | | | | | | | | | | | | | | | |
Total increase (decrease) in net assets | | | | | | | (12,547,322 | ) | | | | | | | 4,390,783 | |
| | | | | | | | | | | | | | | | |
| | | | |
Net assets | | | | | | | | | | | | | | | | |
Beginning of period | | | | | | | 58,831,867 | | | | | | | | 54,441,084 | |
| | | | | | | | | | | | | | | | |
End of period | | | | | | $ | 46,284,545 | | | | | | | $ | 58,831,867 | |
| | | | | | | | | | | | | | | | |
Undistributed net investment income | | | | | | $ | 637,451 | | | | | | | $ | 285,415 | |
| | | | | | | | | | | | | | | | |
| 1. | After the close of business on July 16, 2010, the Fund acquired the net assets of Wells Fargo Advantage VT Equity Income Fund and Wells Fargo Advantage VT C&B Large Cap Value Fund. Wells Fargo Advantage VT Equity Income Fund became the accounting and performance survivor in the transaction. The information for the period prior to July 19, 2010 is that of Wells Fargo Advantage VT Equity Income Fund. |
| 2. | After the close of business on July 16, 2010, existing shares of Wells Fargo Advantage VT Equity Income Fund were renamed Class 2 shares. |
The accompanying notes are an integral part of these financial statements.
| | | | |
| 16 | | Wells Fargo Advantage VT Intrinsic Value Fund | | Financial Highlights |
(For a share outstanding throughout each period)
| | | | | | | | | | | | | | | | | | | | |
| | | Year Ended December 31, | |
| Class 22 | | 2011 | | | 20101 | | | 20091 | | | 20081 | | | 20071 | |
Net asset value, beginning of period | | | $12.76 | | | | $11.31 | | | | $9.88 | | | | $18.74 | | | | $19.75 | |
Net investment income | | | 0.18 | | | | 0.16 | | | | 0.19 | | | | 0.30 | | | | 0.30 | |
Net realized and unrealized gains (losses) on investments | | | (0.45 | ) | | | 1.39 | | | | 1.44 | | | | (6.46 | ) | | | 0.33 | |
| | | | | | | | | | | | | | | | | | | | |
Total from investment operations | | | (0.27 | ) | | | 1.55 | | | | 1.63 | | | | (6.16 | ) | | | 0.63 | |
Distributions to shareholders from | | | | | | | | | | | | | | | | | | | | |
Net investment income | | | (0.07 | ) | | | (0.10 | ) | | | (0.20 | ) | | | (0.28 | ) | | | (0.30 | ) |
Net realized gains | | | 0.00 | | | | 0.00 | | | | 0.00 | | | | (2.42 | ) | | | (1.34 | ) |
| | | | | | | | | | | | | | | | | | | | |
Total distributions to shareholders | | | (0.07 | ) | | | (0.10 | ) | | | (0.20 | ) | | | (2.70 | ) | | | (1.64 | ) |
Net asset value, end of period | | $ | 12.42 | | | $ | 12.76 | | | $ | 11.31 | | | $ | 9.88 | | | $ | 18.74 | |
Total return | | | (2.15 | )% | | | 13.83 | % | | | 16.86 | % | | | (36.47 | )% | | | 2.80 | % |
Ratios to average net assets (annualized) | | | | | | | | | | | | | | | | | | | | |
Gross expenses | | | 1.17 | % | | | 1.10 | % | | | 1.18 | % | | | 1.15 | % | | | 1.05 | % |
Net expenses | | | 1.00 | % | | | 1.00 | % | | | 1.00 | % | | | 1.00 | % | | | 1.00 | % |
Net investment income | | | 1.17 | % | | | 1.29 | % | | | 1.94 | % | | | 1.95 | % | | | 1.49 | % |
Supplemental data | | | | | | | | | | | | | | | | | | | | |
Portfolio turnover rate | | | 26 | % | | | 72 | % | | | 16 | % | | | 9 | % | | | 20 | % |
Net assets, end of period (000’s omitted) | | | $46,285 | | | | $58,832 | | | | $54,441 | | | | $43,452 | | | | $94,097 | |
| 1. | After the close of business on July 16, 2010, the Fund acquired the net assets of Wells Fargo Advantage VT Equity Income Fund and Wells Fargo Advantage VT C&B Large Cap Value Fund. Wells Fargo Advantage VT Equity Income Fund became the accounting and performance survivor in the transaction. The information for the periods prior to July 19, 2010 is that of Wells Fargo Advantage VT Equity Income Fund. |
| 2. | After the close of business on July 16, 2010, existing shares of Wells Fargo Advantage VT Equity Income Fund were renamed Class 2 shares. |
The accompanying notes are an integral part of these financial statements.
| | | | | | |
| Notes to Financial Statements | | Wells Fargo Advantage VT Intrinsic Value Fund | | | 17 | |
1. ORGANIZATION
Wells Fargo Variable Trust (the “Trust”), a Delaware statutory trust organized on March 10, 1999, is an open-end management investment company registered under the Investment Company Act of 1940, as amended (the “1940 Act”). These financial statements report on Wells Fargo Advantage VT Intrinsic Value Fund (the “Fund”) which is a diversified series of the Trust.
2. SIGNIFICANT ACCOUNTING POLICIES
The following significant accounting policies, which are consistently followed in the preparation of the financial statements of the Fund, are in conformity with U.S. generally accepted accounting principles which require management to make estimates and assumptions that affect the reported amounts of assets and liabilities, disclosure of contingent assets and liabilities at the date of the financial statements, and the reported amounts of revenues and expenses during the reporting period. Actual results could differ from those estimates.
Securities valuation
Investments in equity securities are valued each business day as of the close of regular trading on the New York Stock Exchange, which is usually 4:00 p.m. (Eastern Time). Securities which are traded on a national or foreign securities exchange are valued at the last reported sales price, except that securities listed on The Nasdaq Stock Market, Inc. (“Nasdaq”) are valued at the Nasdaq Official Closing Price (“NOCP”), and if no NOCP is available, then at the last reported sales price. If no sales price is shown on the Nasdaq, the bid price will be used. In the absence of any sale of securities listed on the Nasdaq, and in the case of other securities (including U.S. Government obligations, but excluding debt securities maturing in 60 days or less), the price will be deemed “stale” and the valuations will be determined in accordance with the Fund’s Fair Value Procedures.
Fixed income securities with maturities exceeding 60 days are valued based on available evaluated prices received from an independent pricing service approved by the Board of Trustees which may utilize both transaction data and market information such as yield, prices of securities of comparable quality, coupon rate, maturity, type of issue, trading characteristics and other market data. If valuations are not available from the pricing service or values received are deemed not representative of market value, values will be obtained from a third party broker-dealer or determined based on the Fund’s Fair Value Procedures.
Debt securities of sufficient credit quality with original maturities of 60 days or less generally are valued at amortized cost which approximates fair value. The amortized cost method involves valuing a security at its cost, plus accretion of discount or minus amortization of premium over the period until maturity.
Investments in open-end mutual funds and non-registered investment companies are generally valued at net asset value.
Investments which are not valued using any of the methods discussed above, are valued at their fair value, as determined by procedures established in good faith and approved by the Board of Trustees.
Security loans
The Fund may lend its securities from time to time in order to earn additional income in the form of fees or interest on securities received as collateral or the investment of any cash received as collateral. The Fund continues to receive interest or dividends on the securities loaned. The Fund receives collateral in the form of cash or securities with a value at least equal to the value of the securities on loan. The value of the loaned securities is determined at the close of each business day and any additional required collateral is delivered to the Fund on the next business day. In a securities lending transaction, the net asset value of the Fund will be affected by an increase or decrease in the value of the securities loaned and by an increase or decrease in the value of the instrument in which collateral is invested. The amount of securities lending activity undertaken by the Fund fluctuates from time to time. In the event of default or bankruptcy by the borrower, the Fund may be prevented from recovering the loaned securities or gaining access to the collateral or may experience delays or costs in doing so. In addition, the investment of any cash collateral received may lose all or part of its value. The Fund has the right under the lending agreement to recover the securities from the borrower on demand.
The Fund lends its securities through an unaffiliated securities lending agent. Cash collateral received in connection with its securities lending transactions is invested in Wells Fargo Securities Lending Cash Investments, LLC (the “Cash Collateral Fund”). The Cash Collateral Fund is exempt from registration under Section 3(c)(7) of the 1940 Act and is managed by
| | | | |
| 18 | | Wells Fargo Advantage VT Intrinsic Value Fund | | Notes to Financial Statements |
Wells Fargo Funds Management LLC (“Funds Management”) and is sub-advised by Wells Capital Management Incorporated (“Wells Capital Management”). Funds Management receives an advisory fee starting at 0.05% and declining to 0.01% as the average daily net assets of the Cash Collateral Fund increase. All of the fees received by Funds Management are paid to Wells Capital Management for its services as sub-adviser. The Cash Collateral Fund seeks to provide a positive return compared to the daily Fed Funds Open rate by investing in high-quality, U.S. dollar-denominated short-term money market instruments. Cash Collateral Fund investments are fair valued based upon the amortized cost valuation technique. Income earned from investment in the Cash Collateral Fund is included in securities lending income on the Statement of Operations.
For Wells Fargo Advantage Funds that participated in securities lending activity prior to February 13, 2009, certain structured investment vehicles purchased in a joint account by the former securities lending agent defaulted or were impaired. Certain of the Wells Fargo Advantage Funds still hold ownership interest in these structured investment vehicles, which have since been restructured as pass-through securities. If the Fund holds an ownership interest in such pass-through securities, information regarding this ownership interest can be found in the Portfolio of Investments under the category “Other”.
Security transactions and income recognition
Securities transactions are recorded on a trade date basis. Realized gains or losses are reported on the basis of identified cost of securities delivered.
Dividend income is recognized on the ex-dividend date. Dividend income is recorded net of foreign taxes withheld where recovery of such taxes is not assured.
Distributions to shareholders
Distributions to shareholders from net investment income and net realized gains, if any, are recorded on the ex-dividend date. Such distributions are determined in conformity with income tax regulations, which may differ from generally accepted accounting principles.
The timing and character of distributions made during the period from net investment income or net realized gains may differ from their ultimate characterization for federal income tax purposes. To the extent that these differences are permanent in nature, such amounts are reclassified within the capital accounts based on their federal tax-basis treatment. Temporary differences do not require reclassifications. At December 31, 2011, as a result of permanent book-to-tax differences, the following reclassification adjustments were made on the Statement of Assets and Liabilities:
| | |
Undistributed Net
Investment Income | | Accumulated Net
Realized Losses
on Investments |
| $2,313 | | $(2,313) |
Federal and other taxes
The Fund intends to continue to qualify as a regulated investment company by distributing substantially all of its investment company taxable income and any net realized capital gains (after reduction for capital loss carryforwards) sufficient to relieve it from all, or substantially all, federal income taxes. Accordingly, no provision for federal income taxes was required.
The Fund’s income and federal excise tax returns and all financial records supporting those returns for the prior three fiscal years are subject to examination by the federal and Delaware revenue authorities.
Under the recently enacted Regulated Investment Company Modernization Act of 2010, the Fund is permitted to carry forward capital losses incurred in taxable years which began after December 22, 2010 for an unlimited period. However, any losses incurred are required to be utilized prior to the losses incurred in pre-enactment taxable years. As a result of this ordering rule, pre-enactment capital loss carryforwards may be more likely to expire unused. Additionally, post-enactment capital losses that are carried forward will retain their character as either short-term or long-term capital losses rather than being considered all short-term as under previous law.
As of December 31, 2011, the Fund had net capital loss carryforwards, which are available to offset future net realized capital gains, in the amount of $10,766,757 with $2,708,874 expiring in 2015, $4,073,329 expiring in 2016 and $3,984,554 expiring in 2017.
| | | | | | |
| Notes to Financial Statements | | Wells Fargo Advantage VT Intrinsic Value Fund | | | 19 | |
3. FAIR VALUATION MEASUREMENTS
Fair value measurements of investments are determined within a framework that has established a fair value hierarchy based upon the various data inputs utilized in determining the value of the Fund’s investments. The three-level hierarchy gives the highest priority to unadjusted quoted prices in active markets for identical assets or liabilities (Level 1) and the lowest priority to significant unobservable inputs (Level 3). The Fund’s investments are classified within the fair value hierarchy based on the lowest level of input that is significant to the fair value measurement. The inputs are summarized into three broad levels as follows:
| n | | Level 1 – quoted prices in active markets for identical securities |
| n | | Level 2 – other significant observable inputs (including quoted prices for similar securities, interest rates, prepayment speeds, credit risk, etc.) |
| n | | Level 3 – significant unobservable inputs (including the Fund’s own assumptions in determining the fair value of investments) |
The inputs or methodologies used for valuing securities are not necessarily an indication of the risk associated with investing in those securities.
As of December 31. 2011, the inputs used in valuing the Fund’s assets, which are carried at fair value, were as follows:
| | | | | | | | | | | | | | | | |
| Investments in Securities | | Quoted Prices (Level 1) | | | Significant Other
Observable Inputs (Level 2) | | | Significant Unobservable Inputs (Level 3) | | | Total | |
Equity securities | | | | | | | | | | | | | | | | |
Common stocks | | $ | 44,541,895 | | | $ | 0 | | | $ | 0 | | | $ | 44,541,895 | |
Other | | | 0 | | | | 0 | | | | 25,338 | | | | 25,338 | |
Short-term investments | | | | | | | | | | | | | | | | |
Investment companies | | | 1,443,207 | | | | 11,344,595 | | | | 0 | | | | 12,787,802 | |
| | | $ | 45,985,102 | | | $ | 11,344,595 | | | $ | 25,338 | | | $ | 57,355,035 | |
Further details on the major security types listed above can be found in the Portfolio of Investments.
Transfers in and transfers out are recognized at the end of the reporting period. For the year ended December 31, 2011, the Fund did not have any significant transfers into/out of Level 1 and Level 2.
The following is a reconciliation of assets in which significant unobservable inputs (Level 3) were used in determining fair value:
| | | | |
| | | Other | |
Balance as of December 31, 2010 | | $ | 41,745 | |
Accrued discounts (premiums) | | | 0 | |
Realized gains (losses) | | | 0 | |
Change in unrealized gains (losses) | | | (2,244 | ) |
Purchases | | | 0 | |
Sales | | | (14,163 | ) |
Transfers into Level 3 | | | 0 | |
Transfers out of Level 3 | | | 0 | |
Balance as of December 31, 2011 | | $ | 25,338 | |
Change in unrealized gains (losses)
relating to securities still held at December 31, 2011 | | $ | (9,029 | ) |
4. TRANSACTIONS WITH AFFILIATES AND OTHER EXPENSES
Advisory fee
The Trust has entered into an advisory contract with Funds Management, an indirect wholly owned subsidiary of Wells Fargo & Company (“Wells Fargo”). The adviser is responsible for implementing investment policies and guidelines and for supervising the sub-adviser, who is responsible for day-to-day portfolio management of the Fund.
| | | | |
| 20 | | Wells Fargo Advantage VT Intrinsic Value Fund | | Notes to Financial Statements |
Pursuant to the contract, Funds Management is entitled to receive an annual advisory fee starting at 0.55% and declining to 0.40% as the average daily net assets of the Fund increase. For the year ended December 31, 2011, the advisory fee was equivalent to an annual rate of 0.55% of the Fund’s average daily net assets.
Funds Management may retain the services of certain sub-advisers to provide daily portfolio management to the Fund. The fees related to sub-advisory services are borne directly by Funds Management and do not increase the overall fees paid by the Fund. Metropolitan West Capital Management, LLC, an affiliate of Funds Management, is the sub-adviser to the Fund and is entitled to receive a fee from Funds Management at an annual rate starting at 0.35% and declining to 0.25% as the average daily net assets of the Fund increase.
Administration and transfer agent fees
The Trust has entered into an administration agreement with Funds Management. Under this agreement, for providing administrative services, which includes paying fees and expenses for services provided by the transfer agent, sub-transfer agents, omnibus account servicers and record-keepers, Funds Management is entitled to receive from the Fund an annual fund level administration fee starting at 0.05% and declining to 0.03% as the average daily net assets of the Fund increase and for Class 2 shares, a class level administration fee of 0.08% of its average daily net assets.
Funds Management has contractually waived and/or reimbursed advisory and administration fees to the extent necessary to maintain certain net operating expense ratios for the Fund. Waiver of fees and/or reimbursement of expenses by Funds Management were made first from fund level expenses on a proportionate basis and then from class specific expenses.
Distribution fees
The Trust has adopted a Distribution Plan for Class 2 shares of the Fund pursuant to Rule 12b-1 under the 1940 Act. Distribution fees are charged to Class 2 shares and paid to Wells Fargo Funds Distributor, LLC, the principal underwriter, at an annual rate of 0.25% of its average daily net assets.
5. INVESTMENT PORTFOLIO TRANSACTIONS
Purchases and sales of investments, excluding U.S. Government obligations (if any) and short-term securities (securities with maturities of one year or less at purchase date), for the year ended December 31, 2011 were $13,833,150 and $23,463,792, respectively.
6. ACQUISITIONS
After the close of business on July 16, 2010, the Fund acquired the net assets of Wells Fargo Advantage VT Equity Income Fund and Wells Fargo Advantage VT C&B Large Cap Value Fund. The purpose of the transactions was to combine three funds with similar investment objectives and strategies. The acquisitions were accomplished by a tax-free exchange of all of the shares of Wells Fargo Advantage VT Equity Income Fund and Wells Fargo Advantage VT C&B Large Cap Value Fund. Existing shareholders of Wells Fargo Advantage VT Equity Income Fund and Wells Fargo Advantage VT C&B Large Cap Value Fund received Class 2 shares of the Fund in the reorganizations. The Fund was newly created to receive the assets and shares of Wells Fargo Advantage VT Equity Income Fund and Wells Fargo Advantage VT C&B Large Cap Value Fund. Wells Fargo Advantage VT Equity Income Fund became the accounting and performance survivor in the reorganizations. The investment portfolio of Wells Fargo Advantage VT Equity Income Fund and Wells Fargo Advantage VT C&B Large Cap Value Fund with fair values of $40,288,244 and $13,109,804, respectively, and identified costs of $40,252,417 and $13,443,290, respectively, at July 16, 2010, were the principal assets acquired by the Fund. For financial reporting purposes, assets received and shares issued by the Fund were recorded at fair value; however, the cost basis of the investments received from Wells Fargo Advantage VT Equity Income Fund and Wells Fargo Advantage VT C&B Large Cap Value Fund were carried forward to align ongoing reporting of the Fund’s realized and unrealized gains and losses with amounts distributable to shareholders for tax purposes. The value of net assets acquired, unrealized gains and losses acquired, exchange ratio and number of shares issued were as follows:
| | | | | | | | | | | | | | | | | | |
| Acquired Fund | | Value of Net
Assets Acquired | | | Unrealized
Gains (Losses) | | | Exchange
Ratio | | | Number of Shares Issued |
Wells Fargo Advantage
VT Equity Income Fund | | $ | 40,386,838 | | | $ | 35,827 | | | | 1.00 | | | | 3,715,958 | | | Class 2 |
Wells Fargo Advantage
VT C&B Large Cap Value | | | 13,163,306 | | | | (333,486 | ) | | | 0.79 | | | | 1,211,148 | | | Class 2 |
| | | | | | |
| Notes to Financial Statements | | Wells Fargo Advantage VT Intrinsic Value Fund | | | 21 | |
The aggregate net assets of the Fund immediately after the acquisitions were $53,550,144.
Assuming the acquisitions had been completed January 1, 2010, the beginning of the annual reporting period for the Fund, the pro forma results of operations for the year ended December 31, 2010 would have been
| | | | |
Net investment income | | $ | 772,583 | |
Net realized and unrealized gains (losses) on investments | | $ | 7,077,595 | |
Net increase in net assets resulting from operations | | $ | 7,850,178 | |
7. BANK BORROWINGS
The Trust and Wells Fargo Funds Trust (excluding the money market funds) are parties to a $150,000,000 revolving credit agreement with State Street Bank and Trust Company, whereby the Fund is permitted to use bank borrowings for temporary or emergency purposes, such as to fund shareholder redemption requests. Interest under the credit agreement is charged to the Fund based on a borrowing rate equal to the higher of the Federal Funds rate in effect on that day plus 1.25% or the overnight LIBOR rate in effect on that day plus 1.25%. In addition, under the credit agreement, the Fund pays an annual commitment fee equal to 0.10% of the unused balance, which is allocated pro rata. Prior to September 6, 2011, the revolving credit agreement was for $125,000,000 and the annual commitment fee paid by the Fund was 0.125% of the unused balance. For the year ended December 31, 2011, the Fund paid $114 in commitment fees.
For the year ended December 31, 2011, there were no borrowings by the Fund under the agreement
8. DISTRIBUTIONS TO SHAREHOLDERS
The tax character of distributions paid was $287,742 and $413,858 of ordinary income for the years ended December 31, 2011 and December 31, 2010, respectively.
As of December 31, 2011, the components of distributable earnings on a tax basis were as follows:
| | | | | | | | |
Undistributed
Ordinary Income | | Unrealized
Gains | | | Capital Loss
Carryforward | |
| $637,449 | | $ | 4,590,111 | | | $ | (10,766,757 | ) |
9. INDEMNIFICATION
Under the Trust’s organizational documents, the officers and directors are indemnified against certain liabilities that may arise out of performance of their duties to the Trust. Additionally, in the normal course of business, the Trust may enter into contracts with service providers that contain a variety of indemnification clauses. The Trust’s maximum exposure under these arrangements is dependent on future claims that may be made against the Fund and, therefore, cannot be estimated.
10. NEW ACCOUNTING PRONOUNCEMENTS
In May 2011, the Financial Accounting Standards Board (“FASB”) issued Accounting Standards Update (“ASU”) No. 2011-04 “Amendments to Achieve Common Fair Value Measurement and Disclosure Requirements in U.S. GAAP and IFRSs”. ASU No. 2011-04 amends FASB ASC Topic 820, Fair Value Measurements and Disclosures, to establish common requirements for measuring fair value and for disclosing information about fair value measurements in accordance with GAAP. The ASU is effective prospectively for interim and annual periods beginning after December 15, 2011. Management expects that adoption of the ASU will result in additional disclosures in the financial statements, as applicable.
In April 2011, FASB issued ASU No. 2011-03 “Reconsideration of Effective Control for Repurchase Agreements”. ASU No. 2011-03 amends FASB ASC Topic 860, Transfers and Servicing, specifically the criteria required to determine whether a repurchase agreement (repo) and similar agreements should be accounted for as sales of financial assets or secured borrowings with commitments. ASU No. 2011-03 changes the assessment of effective control by focusing on the transferor’s contractual rights and obligations and removing the criterion to assess its ability to exercise those rights or honor those obligations. This could result in changes to the way entities account for certain transactions including repurchase agreements, mortgage dollar rolls and reverse repurchase agreements. The ASU will become effective on a prospective basis for new transfers and modifications to existing transactions as of the beginning of the first interim or annual period beginning on or after December 15, 2011. Management has evaluated the impact of adopting the ASU and expects no significant changes.
| | | | |
| 22 | | Wells Fargo Advantage VT Intrinsic Value Fund | | Report of Independent Registered Public Accounting Firm |
BOARD OF TRUSTEES AND SHAREHOLDERS OF WELLS FARGO VARIABLE TRUST:
We have audited the accompanying statement of assets and liabilities, including the portfolio of investments, of the Wells Fargo Advantage VT Intrinsic Value Fund (the “Fund”), one of the funds constituting the Wells Fargo Variable Trust, as of December 31, 2011, and the related statement of operations for the year then ended, statements of changes in net assets for each of the years in the two-year period then ended, and the financial highlights for each of the years in the five-year period then ended. These financial statements and financial highlights are the responsibility of the Fund’s management. Our responsibility is to express an opinion on these financial statements and financial highlights based on our audits.
We conducted our audits in accordance with the standards of the Public Company Accounting Oversight Board (United States). Those standards require that we plan and perform the audit to obtain reasonable assurance about whether the financial statements and financial highlights are free of material misstatement. An audit includes examining, on a test basis, evidence supporting the amounts and disclosures in the financial statements. Our procedures included confirmation of securities owned as of December 31, 2011, by correspondence with custodian and brokers. An audit also includes assessing the accounting principles used and significant estimates made by management, as well as evaluating the overall financial statement presentation. We believe that our audits provide a reasonable basis for our opinion.
In our opinion, the financial statements and financial highlights referred to above present fairly, in all material respects, the financial position of the Wells Fargo Advantage VT Intrinsic Value Fund as of December 31, 2011, the results of its operations for the year then ended, changes in its net assets for each of the years in the two-year period then ended, and the financial highlights for each of the years in the five-year period then ended, in conformity with U.S. generally accepted accounting principles.

Boston, Massachusetts
February 24, 2012
| | | | | | |
| Other Information (Unaudited) | | Wells Fargo Advantage VT Intrinsic Value Fund | | | 23 | |
TAX INFORMATION
For corporate shareholders, pursuant to Section 854 of the Internal Revenue Code, 100% of ordinary income dividends qualify for the corporate dividends-received deduction for the fiscal year ended December 31, 2011
PROXY VOTING INFORMATION
A description of the policies and procedures that the Fund uses to determine how to vote proxies relating to portfolio securities is available without charge, upon request, by calling 1-800-222-8222, visiting our Web site at www.wellsfargo.com/advantagefunds, or visiting the SEC Web site at www.sec.gov. Information regarding how the Fund voted proxies relating to portfolio securities during the most recent 12-month period ended June 30 is available without charge on the Fund’s Web site at www.wellsfargo.com/advantagefunds or by visiting the SEC Web site at www.sec.gov.
PORTFOLIO HOLDINGS INFORMATION
The complete portfolio holdings for the Fund are publicly available on the Fund’s Web site (www.wellsfargo.com/advantagefunds) on a monthly, 30-day or more delayed basis. In addition, top ten holdings information for the Fund is publicly available on the Fund’s Web site on a monthly, seven-day or more delayed basis. The Fund files its complete schedule of portfolio holdings with the SEC for the first and third quarters of each fiscal year on Form N-Q, which is available without charge by visiting the SEC Web site at www.sec.gov. In addition, the Fund’s Form N-Q may be reviewed and copied at the SEC’s Public Reference Room in Washington, DC, and at regional offices in New York City, at 233 Broadway, and in Chicago, at 175 West Jackson Boulevard, Suite 900. Information about the Public Reference Room may be obtained by calling 1-800-SEC-0330.
| | | | |
| 24 | | Wells Fargo Advantage VT Intrinsic Value Fund | | Other Information (Unaudited) |
BOARD OF TRUSTEES
The following table provides basic information about the Board of Trustees (the “Trustees”) of the Trust and Officers of the Trust. This table should be read in conjunction with the Prospectus and the Statement of Additional Information1 of the Fund. Each of the Trustees and Officers listed below acts in identical capacities for the Wells Fargo Advantage family of funds, which consists of 138 funds comprising the Wells Fargo Funds Trust, Wells Fargo Variable Trust, Wells Fargo Master Trust and four closed-end funds (collectively the “Fund Complex”). All of the Trustees are also Members of the Audit and Governance Committees of each Trust in the Fund Complex. The mailing address of each Trustee and Officer is 525 Market Street, 12th Floor, San Francisco, CA 94105. Each Trustee and Officer serves an indefinite term, however, each Trustee serves such term until reaching the mandatory retirement age established by the Trustees.
Independent Trustees
| | | | | | |
Name and Year of Birth | | Position Held and Length of Service | | Principal Occupations During Past Five Years | | Other Directorships During
Past Five Years |
Peter G. Gordon
(Born 1942) | | Trustee, since 1998; Chairman, since 2005 (Lead Trustee since 2001) | | Co-Founder, Retired Chairman, President and CEO of Crystal Geyser Water Company. Trustee Emeritus, Colby College | | Asset Allocation Trust |
Isaiah Harris, Jr.
(Born 1952) | | Trustee, since 2009 | | Retired. Prior thereto, President and CEO of BellSouth Advertising and Publishing Corp. from 2005 to 2007, President and CEO of BellSouth Enterprises from 2004 to 2005 and President of BellSouth Consumer Services from 2000 to 2003. Emeritus member of the Iowa State University Foundation Board of Governors. Emeritus Member of the Advisory Board of Iowa State University School of Business. Mr. Harris is a certified public accountant. | | CIGNA Corporation; Deluxe Corporation; Asset Allocation Trust |
Judith M. Johnson
(Born 1949) | | Trustee, since 2008 | | Retired. Prior thereto, Chief Executive Officer and Chief Investment Officer of Minneapolis Employees Retirement Fund from 1996 to 2008. Ms. Johnson is an attorney, certified public accountant and a certified managerial accountant. | | Asset Allocation Trust |
Leroy Keith, Jr.
(Born 1939) | | Trustee, since 2010 | | Chairman, Bloc Global Services (development and construction). Trustee of the Evergreen Funds from 1983 to 2010. Former Managing Director, Almanac Capital Management (commodities firm), former Partner, Stonington Partners, Inc. (private equity fund), former Director, Obagi Medical Products Co. and former Director, Lincoln Educational Services. | | Trustee, Virtus Fund Complex (consisting of 40 portfolios as of 12/31/11); Asset Allocation Trust |
David F. Larcker
(Born 1950) | | Trustee, since 2009 | | James Irvin Miller Professor of Accounting at the Graduate School of Business, Stanford University, Director of Corporate Governance Research Program and Senior Faculty of The Rock Center for Corporate Governance since 2006. From 2005 to 2008, Professor of Accounting at the Graduate School of Business, Stanford University. Prior thereto, Ernst & Young Professor of Accounting at The Wharton School, University of Pennsylvania from 1985 to 2005. | | Asset Allocation Trust |
Olivia S. Mitchell
(Born 1953) | | Trustee, since 2006 | | International Foundation of Employee Benefit Plans Professor, Wharton School of the University of Pennsylvania since 1993. Director of Wharton’s Pension Research Council and Boettner Center on Pensions & Retirement Research, and Research Associate at the National Bureau of Economic Research. Previously, Cornell University Professor from 1978 to 1993. | | Asset Allocation Trust |
| | | | | | |
| Other Information (Unaudited) | | Wells Fargo Advantage VT Intrinsic Value Fund | | | 25 | |
| | | | | | |
Name and Year of Birth | | Position Held and Length of Service | | Principal Occupations During Past Five Years | | Other Directorships During
Past Five Years |
Timothy J. Penny
(Born 1951) | | Trustee, since 1996 | | President and CEO of Southern Minnesota Initiative Foundation, a non-profit organization, since 2007 and Senior Fellow at the Humphrey Institute Policy Forum at the University of Minnesota since 1995. Member of the Board of Trustees of NorthStar Education Finance, Inc., a non-profit organization, since 2007. | | Asset Allocation Trust |
Michael S. Scofield
(Born 1943) | | Trustee, since 2010 | | Served on the Investment Company Institute’s Board of Governors and Executive Committee from 2008-2011 as well the Governing Council of the Independent Directors Council from 2006-2011 and the Independent Directors Council Executive Committee from 2008-2011. Chairman of the IDC from 2008-2010. Institutional Investor (Fund Directions) Trustee of Year in 2007. Trustee of the Evergreen Funds (and its predecessors) from 1984 to 2010. Chairman of the Evergreen Funds from 2000-2010. Former Trustee of the Mentor Funds. Retired Attorney, Law Offices of Michael S. Scofield and former Director and Chairman, Branded Media Corporation (multi-media branding company). | | Asset Allocation Trust |
Donald C. Willeke
(Born 1940) | | Trustee, since 1996 | | Principal of the law firm of Willeke & Daniels. General Counsel of the Minneapolis Employees Retirement Fund from 1984 until its consolidation into the Minnesota Public Employees Retirement Association on June 30, 2010. Director and Vice Chair of The Free Trust (non-profit corporation). Director of the American Chestnut Foundation (non-profit corporation). | | Asset Allocation Trust |
Officers
| | | | | | |
Name and Year of Birth | | Position Held and
Length of Service | | Principal Occupations During Past Five Years | | |
Karla M. Rabusch
(Born 1959) | | President, since 2003 | | Executive Vice President of Wells Fargo Bank, N.A. and President of Wells Fargo Funds Management, LLC since 2003. Senior Vice President and Chief Administrative Officer of Wells Fargo Funds Management, LLC from 2001 to 2003. | | |
C. David Messman
(Born 1960) | | Secretary, since 2000; Chief Legal Counsel, since 2003 | | Senior Vice President and Secretary of Wells Fargo Funds Management, LLC since 2001. Vice President and Managing Senior Counsel of Wells Fargo Bank, N.A. since 1996. | | |
Kasey Phillips
(Born 1970) | | Treasurer, since 2009 | | Senior Vice President of Wells Fargo Funds Management, LLC since 2009. Senior Vice President of Evergreen Investment Management Company, LLC from 2006 to 2010. Treasurer of the Evergreen Funds from 2005 to 2010. | | |
David Berardi
(Born 1975) | | Assistant Treasurer, since 2009 | | Vice President of Wells Fargo Funds Management, LLC since 2009. Vice President of Evergreen Investment Management Company, LLC from 2008 to 2010. Assistant Vice President of Evergreen Investment Services, Inc. from 2004 to 2008. Manager of Fund Reporting and Control for Evergreen Investment Management Company, LLC from 2004 to 2010. | | |
Jeremy DePalma
(Born 1974) | | Assistant Treasurer, since 2009 | | Senior Vice President of Wells Fargo Funds Management, LLC since 2009. Senior Vice President of Evergreen Investment Management Company, LLC from 2008 to 2010. Vice President, Evergreen Investment Services, Inc. from 2004 to 2007. Head of the Fund Reporting and Control Team within Fund Administration from 2005 to 2010. | | |
Debra Ann Early
(Born 1964) | | Chief Compliance Officer, since 2007 | | Chief Compliance Officer of Wells Fargo Funds Management, LLC since 2007. Chief Compliance Officer of Parnassus Investments from 2005 to 2007. Chief Financial Officer of Parnassus Investments from 2004 to 2007 and Senior Audit Manager of PricewaterhouseCoopers LLP from 1998 to 2004. | | |
| 1. | The Statement of Additional Information includes additional information about the Trustees and is available, without charge, upon request, by calling 1-800-222-8222 or by visiting the Web site at www.wellsfargo.com/advantagefunds. |
| | | | |
| 26 | | Wells Fargo Advantage VT Intrinsic Value Fund | | List of Abbreviations |
The following is a list of common abbreviations for terms and entities which may have appeared in this report.
| ACB | — Agricultural Credit Bank |
| ADR | — American Depository Receipt |
| ADS | — American Depository Shares |
| AGC-ICC | — Assured Guaranty Corporation - Insured Custody Certificates |
| AGM | — Assured Guaranty Municipal |
| AMBAC | — American Municipal Bond Assurance Corporation |
| AMT | — Alternative Minimum Tax |
| BAN | — Bond Anticipation Notes |
| BHAC | — Berkshire Hathaway Assurance Corporation |
| CAB | — Capital Appreciation Bond |
| CCAB | — Convertible Capital Appreciation Bond |
| CDA | — Community Development Authority |
| CDO | — Collateralized Debt Obligation |
| COP | — Certificate of Participation |
| DRIVER | — Derivative Inverse Tax-Exempt Receipts |
| DW&P | — Department of Water & Power |
| DWR | — Department of Water Resources |
| ECFA | — Educational & Cultural Facilities Authority |
| EDA | — Economic Development Authority |
| EDFA | — Economic Development Finance Authority |
| ETF | — Exchange-Traded Fund |
| FFCB | — Federal Farm Credit Bank |
| FGIC | — Financial Guaranty Insurance Corporation |
| FHA | — Federal Housing Authority |
| FHLB | — Federal Home Loan Bank |
| FHLMC | — Federal Home Loan Mortgage Corporation |
| FNMA | — Federal National Mortgage Association |
| GDR | — Global Depository Receipt |
| GNMA | — Government National Mortgage Association |
| HCFR | — Healthcare Facilities Revenue |
| HEFA | — Health & Educational Facilities Authority |
| HEFAR | — Higher Education Facilities Authority Revenue |
| HFA | — Housing Finance Authority |
| HFFA | — Health Facilities Financing Authority |
| IBC | — Insured Bond Certificate |
| IDA | — Industrial Development Authority |
| IDAG | — Industrial Development Agency |
| IDR | — Industrial Development Revenue |
| KRW | — Republic of Korea Won |
| LIBOR | — London Interbank Offered Rate |
| LLC | — Limited Liability Company |
| LLP | — Limited Liability Partnership |
| MBIA | — Municipal Bond Insurance Association |
| MFHR | — Multi-Family Housing Revenue |
| MUD | — Municipal Utility District |
| NATL-RE | — National Public Finance Guarantee Corporation |
| PCFA | — Pollution Control Finance Authority |
| PCR | — Pollution Control Revenue |
| PFA | — Public Finance Authority |
| PFFA | — Public Facilities Financing Authority |
| PFOTER | — Puttable Floating Option Tax-Exempt Receipts |
| plc | — Public Limited Company |
| PUTTER | — Puttable Tax-Exempt Receipts |
| R&D | — Research & Development |
| RDA | — Redevelopment Authority |
| RDFA | — Redevelopment Finance Authority |
| REIT | — Real Estate Investment Trust |
| ROC | — Reset Option Certificates |
| SAVRS | — Select Auction Variable Rate Securities |
| SBA | — Small Business Authority |
| SFHR | — Single Family Housing Revenue |
| SFMR | — Single Family Mortgage Revenue |
| SPDR | — Standard & Poor’s Depositary Receipts |
| TAN | — Tax Anticipation Notes |
| TIPS | — Treasury Inflation-Protected Securities |
| TRAN | — Tax Revenue Anticipation Notes |
| TCR | — Transferable Custody Receipts |
| TTFA | — Transportation Trust Fund Authority |
| TVA | — Tennessee Valley Authority |
| XLCA | — XL Capital Assurance |


FOR MORE INFORMATION
More information about Wells Fargo Advantage Funds is available free upon request. To obtain literature, please write, e-mail, visit the Fund’s Web site, or call:
Wells Fargo Advantage Funds
P.O. Box 8266
Boston, MA 02266-8266
E-mail: wfaf@wellsfargo.com
Web site: www.wellsfargo.com/advantagefunds
Individual investors: 1-800-222-8222
Retail investment professionals: 1-888-877-9275
Institutional investment professionals: 1-866-765-0778
This report and the financial statements contained herein are submitted for the general information of the shareholders of Wells Fargo Advantage Funds. If this report is used for promotional purposes, distribution of the report must be accompanied or preceded by a current prospectus. For a prospectus containing more complete information, including charges and expenses, call 1-800-222-8222 or visit the Fund’s Web site at www.wellsfargo.com/advantagefunds. Please consider the investment objectives, risks, charges, and expenses of the investment carefully before investing. This and other information about Wells Fargo Advantage Funds can be found in the current prospectus. Read the prospectus carefully before you invest or send money.
Wells Fargo Funds Management, LLC, a wholly owned subsidiary of Wells Fargo & Company, provides investment advisory and administrative services for Wells Fargo Advantage Funds. Other affiliates of Wells Fargo & Company provide subadvisory and other services for the Funds. The Funds are distributed by Wells Fargo Funds Distributor, LLC, Member FINRA/SIPC, an affiliate of Wells Fargo & Company.
NOT FDIC INSURED ¡ NO BANK GUARANTEE ¡ MAY LOSE VALUE
© 2012 Wells Fargo Funds Management, LLC. All rights reserved.
| | |
| | 207574 02-12 AVT4/AR150 12-11 |

Wells Fargo Advantage
VT Omega Growth Fund

Annual Report
December 31, 2011
Reduce clutter. Save trees.
Sign up for electronic delivery of prospectuses and shareholder reports at www.wellsfargo.com/advantagedelivery
Contents
The views expressed and any forward-looking statements are as of December 31, 2011, unless otherwise noted, and are those of the Fund managers and/or Wells Fargo Funds Management, LLC. Discussions of individual securities, or the markets generally, or any Wells Fargo Advantage Fund are not intended as individual recommendations. Future events or results may vary significantly from those expressed in any forward-looking statements; the views expressed are subject to change at any time in response to changing circumstances in the market. Wells Fargo Funds Management, LLC, disclaims any obligation to publicly update or revise any views expressed or forward-looking statements.
NOT FDIC INSURED ¡ NO BANK GUARANTEE ¡ MAY LOSE VALUE

WELLS FARGO INVESTMENT HISTORY
| | |
| |
| 1932 | | Keystone creates one of the first mutual fund families. |
| |
| 1971 | | Wells Fargo & Company introduces one of the first institutional index funds. |
| |
| 1978 | | Wells Fargo applies Markowitz and Sharpe’s research on Modern Portfolio Theory to introduce one of the industry’s first Tactical Asset Allocation (TAA) models in institutional separately managed accounts. |
| |
| 1984 | | Wells Fargo Stagecoach Funds launches its first asset allocation fund. |
| |
| 1989 | | The Tactical Asset Allocation (TAA) Model is first applied to Wells Fargo’s asset allocation mutual funds. |
| |
| 1994 | | Wells Fargo introduces the LifePath Funds, one of the first suites of target date funds (now the Wells Fargo Advantage Dow Jones Target Date FundsSM ). |
| |
| 1996 | | Evergreen Investments and Keystone Funds merge. |
| |
| 1997 | | Wells Fargo launches Wells Fargo Advantage WealthBuilder PortfoliosSM, a fund-of-funds suite of products that includes the use of quantitative models to shift assets among investment styles. |
| |
| 1999 | | Norwest Advantage Funds and Stagecoach Funds are reorganized into Wells Fargo Funds after the merger of Norwest and Wells Fargo. |
| |
| 2002 | | Evergreen Retail and Evergreen Institutional companies form the umbrella asset management company, Evergreen Investments. |
| |
| 2005 | | The integration of Strong Funds with Wells Fargo Funds creates Wells Fargo Advantage Funds, resulting in one of the top 20 mutual fund companies in the United States. |
| |
| 2006 | | Wells Fargo Advantage Funds relaunches the target date product line as Wells Fargo Advantage Dow Jones Target Date Funds. |
| |
| 2010 | | The mergers and reorganizations of Evergreen and Wells Fargo Advantage mutual funds are completed, unifying the families under the brand of Wells Fargo Advantage Funds. |
Wells Fargo Advantage Funds®
Wells Fargo Advantage Funds skillfully guides institutions, financial advisors, and individuals through the investment terrain to help them reach their financial objectives. Everything we do on behalf of investors is backed by our unique combination of qualifications.
Strength
Our organization is built on the standards of integrity and service established by our parent company—Wells Fargo & Company—more than 150 years ago. And, because we’re part of a highly diversified financial enterprise, we offer the depth of resources to help investors succeed.
Expertise
Our multi-boutique model offers investors access to the independent thinking of premier investment managers that have been chosen for their time-tested strategies. While each team specializes in a specific investment strategy, collectively they provide investors a wide choice of distinct investment styles. Our dedication to investment excellence doesn’t end with our expertise in manager selection—risk management, analysis, and rigorous ongoing review seek to ensure each manager’s investment process remains consistent.
Partnership
Our collaborative approach is built around understanding the needs and goals of our clients. By adhering to core principles of sound judgment and steady guidance, we support you through every stage of the investment decision process.
Carefully consider a fund’s investment objectives, risks, charges, and expenses before investing. For a current prospectus and, if available, a summary prospectus, containing this and other information, visit wellsfargo.com/advantagefunds. Read it carefully before investing.
Wells Fargo Funds Management, LLC, a wholly owned subsidiary of Wells Fargo & Company, provides investment advisory and administrative services for Wells Fargo Advantage Funds®. Other affiliates of Wells Fargo & Company provide subadvisory and other services for the Funds. The Funds are distributed by Wells Fargo Funds Distributor, LLC, Member FINRA/SIPC, an affiliate of Wells Fargo & Company.
“Dow Jones®” and “Dow Jones Target Date IndexesSM” are service marks of Dow Jones Trademark Holdings, LLC (“Dow Jones”), have been licensed to CME Group Index Services LLC (“CME Indexes”) and have been sublicensed for use for certain purposes by Global Index Advisors, Inc, and Wells Fargo Funds Management, LLC. The Wells Fargo Advantage Dow Jones Target Date FundsSM based on the Dow Jones Target Date IndexesSM, are not sponsored, endorsed, sold or promoted by Dow Jones, CME Indexes or their respective affiliates and none of them makes any representation regarding the advisability of investing in such product(s).
NOT FDIC INSURED ¡ NO BANK GUARANTEE ¡ MAY LOSE VALUE
Not part of the annual report.
Wells Fargo Advantage Funds offers more than 110 mutual funds across a wide range of asset classes, representing over $216 billion in assets under management, as of December 31, 2011.
| | | | |
| Equity Funds | | | | |
Asia Pacific Fund | | Global Opportunities Fund | | Premier Large Company Growth Fund |
C&B Large Cap Value Fund | | Growth Fund | | Small Cap Opportunities Fund |
C&B Mid Cap Value Fund | | Health Care Fund | | Small Cap Value Fund |
Capital Growth Fund | | Index Fund | | Small Company Growth Fund |
Common Stock Fund | | International Equity Fund | | Small Company Value Fund |
Disciplined U.S. Core Fund | | International Value Fund | | Small/Mid Cap Core Fund |
Discovery Fund† | | Intrinsic Small Cap Value Fund | | Small/Mid Cap Value Fund |
Diversified Equity Fund | | Intrinsic Value Fund | | Social Sustainability Fund† |
Diversified International Fund | | Intrinsic World Equity Fund | | Special Mid Cap Value Fund |
Diversified Small Cap Fund | | Large Cap Core Fund | | Special Small Cap Value Fund |
Emerging Growth Fund | | Large Cap Growth Fund | | Specialized Technology Fund |
Emerging Markets Equity Fund | | Large Company Value Fund | | Strategic Large Cap Growth Fund |
Endeavor Select Fund† | | Omega Growth Fund | | Traditional Small Cap Growth Fund |
Enterprise Fund† | | Opportunity Fund† | | Utility and Telecommunications Fund |
Equity Value Fund | | Precious Metals Fund | | |
| Bond Funds | | | | |
Adjustable Rate Government Fund | | Inflation-Protected Bond Fund | | Short-Term Bond Fund |
California Limited-Term Tax-Free Fund | | Intermediate Tax/AMT-Free Fund | | Short-Term High Yield Bond Fund |
California Tax-Free Fund | | International Bond Fund | | Short-Term Municipal Bond Fund |
Colorado Tax-Free Fund | | Minnesota Tax-Free Fund | | Strategic Municipal Bond Fund |
Government Securities Fund | | Municipal Bond Fund | | Total Return Bond Fund |
High Income Fund | | North Carolina Tax-Free Fund | | Ultra Short-Term Income Fund |
High Yield Bond Fund | | Pennsylvania Tax-Free Fund | | Ultra Short-Term Municipal Income Fund |
Income Plus Fund | | Short Duration Government Bond Fund | | Wisconsin Tax-Free Fund |
| Asset Allocation Funds | | | | |
Asset Allocation Fund | | WealthBuilder Equity Portfolio† | | Target 2020 Fund† |
Conservative Allocation Fund | | WealthBuilder Growth Allocation Portfolio† | | Target 2025 Fund† |
Diversified Capital Builder Fund | | WealthBuilder Growth Balanced Portfolio† | | Target 2030 Fund† |
Diversified Income Builder Fund | | WealthBuilder Moderate Balanced Portfolio† | | Target 2035 Fund† |
Growth Balanced Fund | | WealthBuilder Tactical Equity Portfolio† | | Target 2040 Fund† |
Index Asset Allocation Fund | | Target Today Fund† | | Target 2045 Fund† |
Moderate Balanced Fund | | Target 2010 Fund† | | Target 2050 Fund† |
WealthBuilder Conservative Allocation Portfolio† | | Target 2015 Fund† | | Target 2055 Fund† |
| Money Market Funds | | | | |
100% Treasury Money Market Fund | | Heritage Money Market Fund† | | National Tax-Free Money Market Fund |
California Municipal Money Market Fund | | Money Market Fund | | Prime Investment Money Market Fund |
Cash Investment Money Market Fund | | Municipal Cash Management Money Market Fund | | Treasury Plus Money Market Fund |
Government Money Market Fund | | Municipal Money Market Fund | | |
| Variable Trust Funds1 | | | | |
VT Discovery Fund† | | VT Intrinsic Value Fund | | VT Small Cap Growth Fund |
VT Index Asset Allocation Fund | | VT Omega Growth Fund | | VT Small Cap Value Fund |
VT International Equity Fund | | VT Opportunity Fund† | | VT Total Return Bond Fund |
An investment in a money market fund is not insured or guaranteed by the Federal Deposit Insurance Corporation or any other government agency. Although the Wells Fargo Advantage Money Market Funds seek to preserve the value of your investment at $1.00 per share, it is possible to lose money by investing in a money market fund.
| 1. | The Variable Trust Funds are generally available only through insurance company variable contracts. |
| † | In this report, the Wells Fargo Advantage Discovery FundSM, Wells Fargo Advantage Endeavor Select FundSM, Wells Fargo Advantage Enterprise FundSM, Wells Fargo Advantage Opportunity FundSM, Wells Fargo Advantage Social Sustainability FundSM, Wells Fargo Advantage WealthBuilder Conservative Allocation PortfolioSM, Wells Fargo Advantage WealthBuilder Equity PortfolioSM, Wells Fargo Advantage WealthBuilder Growth Allocation PortfolioSM, Wells Fargo Advantage WealthBuilder Growth Balanced PortfolioSM, Wells Fargo Advantage WealthBuilder Moderate Balanced PortfolioSM, Wells Fargo Advantage WealthBuilder Tactical Equity PortfolioSM, Wells Fargo Advantage Dow Jones Target Today FundSM, Wells Fargo Advantage Dow Jones Target 2010 FundSM, Wells Fargo Advantage Dow Jones Target 2015 FundSM, Wells Fargo Advantage Dow Jones Target 2020 FundSM, Wells Fargo Advantage Dow Jones Target 2025 FundSM, Wells Fargo Advantage Dow Jones Target 2030 FundSM, Wells Fargo Advantage Dow Jones Target 2035 FundSM, Wells Fargo Advantage Dow Jones Target 2040 FundSM, Wells Fargo Advantage Dow Jones Target 2045 FundSM, Wells Fargo Advantage Dow Jones Target 2050 FundSM, Wells Fargo Advantage Dow Jones Target 2055 FundSM, Wells Fargo Advantage Heritage Money Market FundSM, Wells Fargo Advantage VT Discovery FundSM, and Wells Fargo Advantage VT Opportunity FundSM are referred to as the Discovery Fund, Endeavor Select Fund, Enterprise Fund, Opportunity Fund, Social Sustainability Fund, WealthBuilder Conservative Allocation Portfolio, WealthBuilder Equity Portfolio, WealthBuilder Growth Allocation Portfolio, WealthBuilder Growth Balanced Portfolio, WealthBuilder Moderate Balanced Portfolio, WealthBuilder Tactical Equity Portfolio, Target Today Fund, Target 2010 Fund, Target 2015 Fund, Target 2020 Fund, Target 2025 Fund, Target 2030 Fund, Target 2035 Fund, Target 2040 Fund, Target 2045 Fund, Target 2050 Fund, Target 2055 Fund, Heritage Money Market Fund, VT Discovery Fund, and VT Opportunity Fund, respectively. |
Not part of the annual report.
| | | | |
| 2 | | Wells Fargo Advantage VT Omega Growth Fund | | Letter to Shareholders |

Karla M. Rabusch,
President
Wells Fargo Advantage Funds
The U.S. economic recovery that began in mid-2009 progressed throughout the 12-month period, yet the rate of growth remained subpar compared with most previous recovery cycles.
Dear Valued Shareholder:
We’re pleased to offer you this annual report for the Wells Fargo Advantage VT Omega Growth Fund for the 12-month period that ended December 31, 2011.
For the full 12-month period, most of the major domestic equity indexes posted either modest gains or relatively mild losses. However, the market’s 12-month return figures mask the uneven path that it traced throughout the year as investors had to contend with a variety of global and domestic headwinds. Whatever the future holds, we continue to believe that most investors can benefit from adhering to a well-diversified investment strategy. Over the long-term, such a strategy may allow you to balance risks and opportunities as you pursue your financial goals in a dynamic market landscape.
The economic recovery gained traction as the year progressed.
The U.S. economic recovery that began in mid-2009 progressed throughout the 12-month period, yet the rate of growth remained subpar compared with most previous recovery cycles.
2011 opened on a note of mounting optimism regarding the strength of the recovery, yet a batch of disappointing economic data in the spring and summer cast renewed doubts on the sustainability of the recovery. In September, it was reported that U.S. gross domestic product (GDP) grew at a mere 1.3% annual rate in the second quarter of 2011, following anemic growth at an annual rate of 0.4% in the first quarter. According to the December estimate, GDP growth accelerated to an annual rate of 1.8% in the third quarter, reigniting hopes for a sustainable recovery. Those hopes were buoyed by widespread anticipation of even stronger GDP growth in the fourth quarter. By the end of the 12-month period, few economists believed that the U.S. economy was in danger of sliding back into recession, although many expected a sluggish growth environment in 2012.
The struggling housing and labor markets slowed growth.
As has been the case throughout the recovery, the housing and labor markets continued to restrain economic momentum during 2011.
The beleaguered housing market has arguably exerted the biggest drag on growth. Despite intermittent signs of improvement, ongoing weakness in sales of both new and existing homes has put considerable downward pressure on prices. On the other hand, the labor market took a decided turn for the better in the latter half of the year: initial unemployment claims have eased in recent months, and the private sector has been steadily adding jobs. The pace of hiring, while not brisk, was sufficient to push the U.S. unemployment rate down to 8.5% as of December 2011—still well above its historical average, but at its lowest level since February 2009. Many observers expect the unemployment rate to decline further in 2012, which could act as a tailwind for consumer spending—widely viewed as one of the keys to long-term economic growth.
The Federal Reserve announced that it will keep rates low until 2013.
Consumers have already demonstrated some resilience in their spending—even in the face of higher energy costs. Oil prices skyrocketed in early 2011 before retreating later in the year, only to spike again during the fourth quarter. Yet “core” inflation, which excludes volatile energy and food prices, remained fairly benign throughout the year.
| | | | | | |
| Letter to Shareholders | | Wells Fargo Advantage VT Omega Growth Fund | | | 3 | |
With inflation in check, the Federal Reserve (Fed) held its target range for the federal funds rate—a proxy for short-term interest rates—steady at 0% to 0.25%. Following its August 9 meeting, the Federal Open Market Committee (FOMC) issued a statement explaining that economic conditions were likely to warrant exceptionally low levels for the federal funds rate through at least mid-2013. In addition, the Fed carried out its second round of quantitative easing (QE2) in an effort to promote a more robust economic expansion. The stimulus program was completed as scheduled in June 2011. In September, the Fed launched yet another stimulus program—dubbed “Operation Twist”—that is designed to keep intermediate- and longer-term yields relatively low. The goal with keeping longer-term rates low is to encourage lending activity to spark business investments and home purchases, which, in turn, may provide support for a more sustainable economic recovery.
Market volatility was a dominant theme throughout most of 2011.
Despite pockets of turbulence sparked by the natural disasters in Japan and geopolitical turmoil in North Africa and the Middle East, the U.S. equity market performed very well from January through April of 2011. Some upbeat economic news, better-than-expected corporate profits, and investor enthusiasm about QE2 were among the catalysts for the market’s four-month advance.
In May and June, the market climate shifted to one of anxiety over the increasingly fragile state of the U.S. and global economies. As spring gave way to summer, investors not only worried that the U.S. might be on the brink of recession, they also feared that Europe’s sovereign debt problems could spiral out of control if a Greek default triggered financial contagion across the continent. In July and August, investor sentiment was further undermined by partisan wrangling over the federal debt ceiling and the Standard & Poor’s downgrade of the U.S. credit rating. The barrage of unsettling headlines led to heightened market volatility and sharply falling stock prices in the third quarter of 2011. Although volatility persisted into the fourth quarter, the market was able to rebound amid improved economic data and hopes for a resolution to the European crisis.
For the full 12-month period, the S&P 500 Index1 of large-cap stocks achieved a total return of 2.1%. The Russell Midcap® Index2 and the Russell 2000® Index3 of small-cap stocks lost 1.6% and 4.2%, respectively. International stocks fared worse than their U.S. counterparts, with the MSCI EAFE Index4 shedding 14.8%.
| 1. | The S&P 500 Index consists of 500 stocks chosen for market size, liquidity, and industry group representation. It is a market-value weighted index with each stock’s weight in the index proportionate to its market value. You cannot invest directly in an index. |
| 2. | The Russell Midcap® Index measures the performance of the 800 smallest companies in the Russell 1000 Index, which represent approximately 25% of the total market capitalization of the Russell 1000® Index. You cannot invest directly in an index. |
| 3. | The Russell 2000® Index measures the performance of the 2,000 smallest companies in the Russell 3000® Index, which represents approximately 8% of the total market capitalization of the Russell 3000 Index. You cannot invest directly in an index. |
| 4. | The Morgan Stanley Capital International Europe, Australasia, and Far East (“MSCI EAFE”) Stock Index is an unmanaged group of securities widely regarded by investors to be representations of the stock markets of Europe, Australasia, and the Far East. You cannot invest directly in an index. Source: MSCI. MSCI makes no express or implied warranties or representations and shall have no liability whatsoever with respect to any MSCI data contained herein. The MSCI data may not be further redistributed or used as a basis for other indexes or any securities or financial products. This report is not approved, reviewed or produced by MSCI. |
| | | | |
| 4 | | Wells Fargo Advantage VT Omega Growth Fund | | Letter to Shareholders |
The market turmoil of 2011 and an uncertain outlook going forward have left many investors questioning their resolve—and their investments. Yet, it is precisely at such times that the market may present opportunities—as well as challenges—for prudent investors.
Recent events have not altered our message to shareholders.
The market turmoil of 2011 and an uncertain outlook going forward have left many investors questioning their resolve—and their investments. Yet, it is precisely at such times that the market may present opportunities—as well as challenges—for prudent investors. Bear in mind that many investors who indiscriminately sold their equity investments during the severe market downturn of 2008 to 2009 missed out on the impressive two-year rally that followed. In our opinion, the lesson to be learned from these dramatic market events is that, for many investors, simply building and maintaining a well-diversified5 investment plan is the best long-term strategy.
To help you create a sound strategy based on your personal goals and risk tolerance, Wells Fargo Advantage Funds offers more than 110 mutual funds and other investments spanning a broad range of asset classes and investment styles. While diversification cannot guarantee an investment profit or prevent losses, we believe it can be an effective way to manage investment risk and potentially smooth out overall portfolio performance.
Thank you for choosing to invest with Wells Fargo Advantage Funds. We appreciate your confidence in us and remain committed to helping you meet your financial needs. For current information about your fund investments, contact your investment professional, visit our website at www.wellsfargo.com/advantagefunds, or call us directly at 1-800-222-8222. We are available 24 hours a day, 7 days a week.
Sincerely,

Karla M. Rabusch
President
Wells Fargo Advantage Funds
| 5. | Diversification does not assure or guarantee better performance and cannot eliminate the risk of investment losses. |
| | | | | | |
| Performance Highlights (Unaudited) | | Wells Fargo Advantage VT Omega Growth Fund | | | 5 | |
INVESTMENT OBJECTIVE
The Fund seeks long-term capital appreciation.
ADVISER
Wells Fargo Funds Management, LLC
SUB-ADVISER
Wells Capital Management Incorporated
PORTFOLIO MANAGERS
Thomas J. Pence, CFA
Michael T. Smith, CFA
FUND INCEPTION
March 6, 1997
| | | | |
| 12 MONTH TOTAL RETURN AS OF DECEMBER 31, 2011 | |
Class 2 | | | (5.54)% | |
Russell 3000® Growth Index1 | | | 2.18% | |
Figures quoted represent past performance, which is no guarantee of future results and do not reflect the deduction of taxes that a shareholder may pay on fund distributions or the redemption of fund shares. Investment return and principal value of an investment will fluctuate so that an investor’s shares, when redeemed, may be worth more or less than their original cost. Current performance may be lower or higher than the performance data quoted and assumes the reinvestment of dividends and capital gains. Current month-end performance is available by calling 1-866-765-0778. Performance figures of the Fund do not reflect fees charged pursuant to the terms of variable life insurance policies and variable annuity contracts.
Index returns do not include transaction costs associated with buying and selling securities, any mutual fund fees or expenses or any taxes. It is not possible to invest directly in an index.
The Adviser has committed through July 18, 2013 to waive fees and/or reimburse expenses to the extent necessary to cap the Fund’s Total Annual Fund Operating Expenses After Fee Waiver, excluding certain other expenses at 1.00% for Class 2. The Fund’s gross and net expense ratios are 1.03% and 1.00%, respectively, for Class 2 shares. Without these reductions, the Fund’s returns would have been lower.
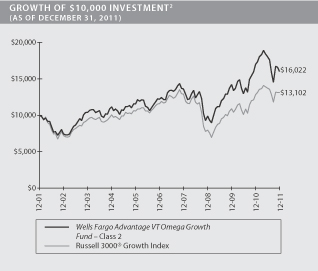
| 1. | The Russell 3000® Growth Index measures the performance of those Russell 3000 Index companies with higher price-to-book ratios and higher forecasted growth values. The stocks in this index are also members of either the Russell 1000® Growth Index or the Russell 2000® Growth Index. You cannot invest directly in an index. |
| 2. | The chart compares the performance of the Wells Fargo Advantage VT Omega Growth Fund Class 2 for the most recent ten years of the Fund with the Russell 3000 Growth Index. The chart assumes a hypothetical $10,000 investment and reflects all operating expenses of the Fund. Performance figures of the Fund do not reflect fees charged pursuant to the terms of variable life insurance policies and variable annuity contracts. |
| | | | |
| 6 | | Wells Fargo Advantage VT Omega Growth Fund | | Performance Highlights (Unaudited) |
MANAGER’S DISCUSSION
Fund highlights
| n | | The Fund underperformed its benchmark, the Russell 3000® Growth Index, for the 12-month period that ended December 31, 2011. |
| n | | Unfavorable stock selection in the information technology (IT), consumer discretionary, and energy sectors and an underweight to consumer staples were key reasons for the Fund’s underperformance. |
| n | | The U.S. equity market experienced dramatic performance swings driven by a “risk on/risk off” investor mentality, resulting in frequent disconnects between stock prices and underlying company fundamentals. |
| n | | In the current environment, we remain dedicated to our bottom-up stock selection process that seeks to maintain an optimal risk/reward balance. |
Macro-driven volatility limited equity market returns for 2011.
The year began on a high note as the equity market continued its rally from late 2010 amid greater confidence in the sustainability of the U.S. economic recovery. While there were pockets of turbulence sparked by the geopolitical turmoil in North Africa and the Middle East and natural disasters in Japan, the market performed well through April 2011. In the spring and summer, however, investors’ spirits began to dampen as a string of discouraging economic data reignited fears of a recession. Investor confidence was further damaged by bickering over the federal debt ceiling, the downgrade of the U.S. credit rating by Standard & Poor’s, and the risk of financial contagion in Europe. Despite continued strength in corporate profits, investors’ intense focus on the negative macro headlines, particularly out of Europe, led to heightened market volatility and a broad-based sell-off in equities during the third quarter. Although volatility persisted into the fourth quarter, most of the major equity indexes rebounded and managed to finish 2011 with either modest gains or relatively mild losses.
The Fund underperformed its benchmark against a challenging market backdrop.
The macro-driven, highly correlated market environment of 2011 presented a major challenge to our bottom-up, fundamentally based investment process. While we successfully identified companies with strong earnings growth, stock prices were disconnected from underlying fundamentals for much of the year. Underperformance primarily stemmed from unfavorable stock selection in the information technology, consumer discretionary, and energy sectors, and an underweight to consumer staples.
Traditional growth sectors such as IT and consumer discretionary struggled in 2011. Shares of Micron Technology Incorporated fell sharply due to supply chain disruptions caused by the natural disasters in Japan and weaker-than-expected demand for the company’s memory chips. Communications equipment providers Juniper Networks Incorporated and Ciena Corporation also weighed on the Fund’s returns amid worries about inventory issues and the timing of orders related to a worldwide optical upgrade cycle at large telecommunication companies. In the consumer discretionary sector, Shutterfly Incorporated, a leading online photo publisher, declined after releasing disappointing results during the fourth quarter. High-end retailers Deckers Outdoor Corporation and lululemon athletica encountered late-year weakness on concerns over inventory levels and margin pressures.
| | | | | | |
| Performance Highlights (Unaudited) | | Wells Fargo Advantage VT Omega Growth Fund | | | 7 | |
| | | | |
TEN LARGEST EQUITY HOLDINGS3 (AS OF DECEMBER 31, 2011) | |
Apple Incorporated | | | 7.12% | |
Visa Incorporated Class A | | | 2.62% | |
TransDign Group Incorporated | | | 2.45% | |
Alexion Pharmaceuticals Incorporated | | | 2.19% | |
Kansas City Southern | | | 2.05% | |
Airgas Incorporated | | | 2.02% | |
American Tower Corporation Class A | | | 2.00% | |
Precision Castparts Corporation | | | 1.96% | |
Exxon Mobil Corporation | | | 1.82% | |
Oil States International Incorporated | | | 1.81% | |
As macro fears and uncertainty mounted, many investors fled stocks in economically sensitive sectors and reallocated capital to more defensive areas. Therefore, our positioning in the energy sector and an underweight to consumer staples also detracted from the Fund’s returns. Exploration and production companies SandRidge Energy Incorporated and Newfield Exploration Company were the largest detractors as crude oil prices plunged late in the year. We underweighted consumer staples based on our belief that the sector generally offers fewer attractive growth opportunities than other market sectors.
We have taken advantage of the opportunity to upgrade the quality of the portfolio.
The market’s absolute returns for 2011 were lackluster, dragged down by periods of elevated risk aversion. In particular, the third-quarter market sell-off caused many companies with predictable, visible earnings growth—“core” holdings within our portfolio construction framework—to be in our view unfairly punished along with more cyclical companies. As the year progressed, we took steps to optimize the mix of cyclical positions within our “developing situations” category in light of the macro backdrop.
Time has shown that the best response to volatile, irrational markets is to be adaptive in your thinking, but consistent in your investment process. Accordingly, while we have continued to execute our time-tested process, we have taken advantage of the opportunity to upgrade the quality of the portfolio by exchanging stocks with lower earnings visibility for those with higher earnings visibility. The challenge is to construct a portfolio with the optimal balance of secular and cyclical growth exposures. We believe that our “surround the company” approach has allowed us to achieve such balance and that the portfolio should be well positioned to outperform once company-specific fundamentals reassert themselves as the primary driver of equity returns.
|
SECTOR DISTRIBUTION4 (AS OF DECEMBER 31, 2011) |
|
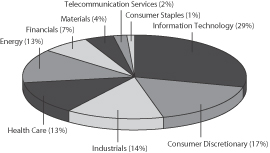 |
A balanced portfolio strategy may help investors navigate the 2012 market landscape.
Some equity market observers share a bullish outlook for 2012, while other forecasts are more bearish. In our view, there are compelling arguments to support both sides of the debate. On the positive side, the labor market has taken a turn for the better in recent months, while consumer spending has been fairly resilient. Even the long-struggling housing market has shown tentative signs of stabilization. Corporate fundamentals remain generally strong, and equity valuations appear reasonable in many cases.
| 3. | The ten largest equity holdings are calculated based on the value of the securities divided by total net assets of the Fund. Holdings are subject to change and may have changed since the date specified. |
| 4. | Sector distribution is subject to change and is calculated based on the total long-term investments of the Fund. |
| | | | |
| 8 | | Wells Fargo Advantage VT Omega Growth Fund | | Performance Highlights (Unaudited) |
On the negative side, a European recession looks increasingly likely and could be a source of market turmoil, especially given its implications for export-dependent China. After years of inflating financial and real estate markets, China may need to use other means of stimulus. In addition, ongoing political gamesmanship and fiscal austerity in developed nations could slow global economic growth.
Considering all of these factors, we expect moderate U.S. economic growth in 2012 and a trendless market characterized by bouts of volatility. In such an environment, we believe that balanced portfolio positioning is the most prudent approach.
| | | | | | |
| Performance Highlights (Unaudited) | | Wells Fargo Advantage VT Omega Growth Fund | | | 9 | |
AVERAGE ANNUAL TOTAL RETURN5 (%) (AS OF DECEMBER 31, 2011)
| | | | | | | | | | | | | | | | | | | | | | | | | | | | |
| | | | | | | | | Expense Ratios6 | |
| | | Inception Date | | | 6 Months* | | | 1 Year | | | 5 Year | | | 10 Year | | | Gross | | | Net7 | |
Class 1 | | | 03/06/1997 | | | | (11.28 | ) | | | (5.36 | ) | | | 5.88 | | | | 5.08 | | | | 0.78% | | | | 0.75% | |
Class 2 | | | 07/31/2002 | | | | (11.34 | ) | | | (5.54 | ) | | | 5.62 | | | | 4.83 | | | | 1.03% | | | | 1.00% | |
Russell 3000 Growth Index | | | | | | | (4.49 | ) | | | 2.18 | | | | 2.46 | | | | 2.74 | | | | | | | | | |
| * | Returns for periods of less than one year are not annualized. |
Figures quoted represent past performance, which is no guarantee of future results and do not reflect the deduction of taxes that a shareholder may pay on fund distributions or the redemption of fund shares. Investment return and principal value of an investment will fluctuate so that an investor’s shares, when redeemed, may be worth more or less than their original cost. Current performance may be lower or higher than the performance data quoted and assumes the reinvestment of dividends and capital gains. Current month-end performance is available by calling 1-866-765-0778. Performance figures of the Fund do not reflect fees charged pursuant to the terms of variable life insurance policies and variable annuity contracts.
Index returns do not include transaction costs associated with buying and selling securities, any mutual fund fees or expenses or any taxes. It is not possible to invest directly in an index.
Stock fund values fluctuate in response to the activities of individual companies and general market and economic conditions. The use of derivatives may reduce returns and/or increase volatility. Certain investment strategies tend to increase the total risk of an investment (relative to the broader market). This Fund is exposed to smaller company securities risk. Consult the Fund’s prospectus for additional information on these and other risks.
Please refer to the prospectus provided by your participating insurance company for detailed information describing the separate accounts for information regarding surrender charges, mortality and expense risk fees and other charges that may be assessed by the participating insurance companies.
| 5. | Performance shown for Class 2 shares prior to its inception reflects the performance of Class 1 shares, adjusted to reflect the higher expenses applicable to Class 2 shares. Historical performance shown for all classes of the Fund prior to July 19, 2010 is based on the performance of the Fund’s predecessor, Evergreen VA Omega Fund. |
| 6. | Reflects the expense ratios as stated in the most recent prospectuses. |
| 7. | The Adviser has committed through July 18, 2013 to waive fees and/or reimburse expenses to the extent necessary to cap the Fund’s Total Annual Fund Operating Expenses After Fee Waiver, excluding certain expenses, at the amounts shown above. Without this cap, the Fund’s returns would have been lower. |
| | | | |
| 10 | | Wells Fargo Advantage VT Omega Growth Fund | | Fund Expenses (Unaudited) |
As a shareholder of the Fund, you incur ongoing costs, including management fees; distribution (12b-1) fees; and other Fund expenses. This example is intended to help you understand your ongoing costs (in dollars) of investing in the Fund and to compare these costs with the ongoing costs of investing in other mutual funds.
The example is based on an investment of $1,000 invested at the beginning of the six-month period and held for the entire period from July 1, 2011 to December 31, 2011.
Actual Expenses
The “Actual” line of the table below provides information about actual account values and actual expenses. You may use the information in this line, together with the amount you invested, to estimate the expenses that you paid over the period. Simply divide your account value by $1,000 (for example, an $8,600 account value divided by $1,000 = 8.6), then multiply the result by the number in the “Actual” line under the heading entitled “Expenses Paid During Period” for your applicable class of shares to estimate the expenses you paid on your account during this period.
Hypothetical Example for Comparison Purposes
The “Hypothetical” line of the table below provides information about hypothetical account values and hypothetical expenses based on the Fund’s actual expense ratio and an assumed rate of return of 5% per year before expenses, which is not the Fund’s actual return. The hypothetical account values and expenses may not be used to estimate the actual ending account balance or expenses you paid for the period. You may use this information to compare the ongoing costs of investing in the Fund and other funds. To do so, compare this 5% hypothetical example with the 5% hypothetical examples that appear in the shareholder reports of the other funds.
Please note that the expenses shown in the table are meant to highlight your ongoing costs only and do not reflect any separate account charges assessed by participating insurance companies. Therefore, the “Hypothetical” line of the table is useful in comparing ongoing costs only, and will not help you determine the relative total costs of owning different funds. In addition, if these separate account charges assessed by participating insurance companies were included, your costs would have been higher.
| | | | | | | | | | | | | | | | |
| | | Beginning
Account Value
07-01-2011 | | | Ending
Account Value
12-31-2011 | | | Expenses
Paid During
the Period1 | | | Net Annual
Expense Ratio | |
Class 1 | | | | | | | | | | | | | | | | |
Actual | | $ | 1,000.00 | | | $ | 887.18 | | | $ | 3.57 | | | | 0.75 | % |
Hypothetical (5% return before expenses) | | $ | 1,000.00 | | | $ | 1,021.42 | | | $ | 3.82 | | | | 0.75 | % |
Class 2 | | | | | | | | | | | | | | | | |
Actual | | $ | 1,000.00 | | | $ | 886.60 | | | $ | 4.76 | | | | 1.00 | % |
Hypothetical (5% return before expenses) | | $ | 1,000.00 | | | $ | 1,020.16 | | | $ | 5.09 | | | | 1.00 | % |
| 1. | Expenses paid is equal to the annualized expense ratio of each class multiplied by the average account value over the period, multiplied by the number of days in the most recent fiscal half-year divided by the number of days in the fiscal year (to reflect the one-half year period). |
| | | | | | |
| Portfolio of Investments—December 31, 2011 | | Wells Fargo Advantage VT Omega Growth Fund | | | 11 | |
| | | | | | | | | | | | |
| Security Name | | | | | | Shares | | | Value | |
| | | | | | | | | | | | |
| | | | |
Common Stocks: 97.69% | | | | | | | | | | | | |
| | | | |
Consumer Discretionary: 16.64% | | | | | | | | | | | | |
| | | | |
| Auto Components: 1.47% | | | | | | | | | | | | |
BorgWarner IncorporatedǠ | | | | | | | 25,800 | | | $ | 1,644,492 | |
| | | | | | | | | | | | |
| | | | |
| Diversified Consumer Services: 1.04% | | | | | | | | | | | | |
Weight Watchers International Incorporated | | | | | | | 21,100 | | | | 1,160,711 | |
| | | | | | | | | | | | |
| | | | |
| Hotels, Restaurants & Leisure: 1.31% | | | | | | | | | | | | |
Starbucks Corporation« | | | | | | | 31,822 | | | | 1,464,130 | |
| | | | | | | | | | | | |
| | | | |
| Household Durables: 0.99% | | | | | | | | | | | | |
Tempur-Pedic International IncorporatedǠ | | | | | | | 21,000 | | | | 1,103,130 | |
| | | | | | | | | | | | |
| | | | |
| Internet & Catalog Retail: 4.03% | | | | | | | | | | | | |
Amazon.com Incorporated† | | | | | | | 11,400 | | | | 1,973,340 | |
Priceline.com Incorporated† | | | | | | | 4,300 | | | | 2,011,153 | |
Shutterfly IncorporatedǠ | | | | | | | 23,300 | | | | 530,308 | |
| | | | |
| | | | | | | | | | | 4,514,801 | |
| | | | | | | | | | | | |
| | | | |
| Media: 2.66% | | | | | | | | | | | | |
CBS Corporation Class B | | | | | | | 59,400 | | | | 1,612,116 | |
DIRECTV Group Incorporated† | | | | | | | 32,100 | | | | 1,372,596 | |
| | | | |
| | | | | | | | | | | 2,984,712 | |
| | | | | | | | | | | | |
| | | | |
| Multiline Retail: 1.17% | | | | | | | | | | | | |
Dollar General Corporation† | | | | | | | 31,970 | | | | 1,315,246 | |
| | | | | | | | | | | | |
| | | | |
| Specialty Retail: 2.28% | | | | | | | | | | | | |
Ross Stores Incorporated | | | | | | | 25,800 | | | | 1,226,274 | |
Williams-Sonoma Incorporated | | | | | | | 34,600 | | | | 1,332,100 | |
| | | | |
| | | | | | | | | | | 2,558,374 | |
| | | | | | | | | | | | |
| | | | |
| Textiles, Apparel & Luxury Goods: 1.69% | | | | | | | | | | | | |
Deckers Outdoor Corporation† | | | | | | | 7,131 | | | | 538,890 | |
lululemon athletica incorporatedǠ | | | | | | | 29,100 | | | | 1,357,806 | |
| | | | |
| | | | | | | | | | | 1,896,696 | |
| | | | | | | | | | | | |
| | | | |
Consumer Staples: 1.27% | | | | | | | | | | | | |
| | | | |
| Food & Staples Retailing: 1.27% | | | | | | | | | | | | |
Whole Foods Market Incorporated | | | | | | | 20,400 | | | | 1,419,432 | |
| | | | | | | | | | | | |
| | | | |
Energy: 12.55% | | | | | | | | | | | | |
| | | | |
| Energy Equipment & Services: 5.40% | | | | | | | | | | | | |
Cameron International Corporation† | | | | | | | 24,100 | | | | 1,185,479 | |
Ensco International plc ADR | | | | | | | 23,300 | | | | 1,093,236 | |
Oil States International Incorporated† | | | | | | | 26,500 | | | | 2,023,805 | |
Schlumberger Limited | | | | | | | 25,600 | | | | 1,748,736 | |
| | | | |
| | | | | | | | | | | 6,051,256 | |
| | | | | | | | | | | | |
| | | | |
| 12 | | Wells Fargo Advantage VT Omega Growth Fund | | Portfolio of Investments—December 31, 2011 |
| | | | | | | | | | | | |
| Security Name | | | | | | Shares | | | Value | |
| | | | | | | | | | | | |
| | | | |
| Oil, Gas & Consumable Fuels: 7.15% | | | | | | | | | | | | |
Cabot Oil & Gas Corporation | | | | | | | 15,300 | | | $ | 1,161,270 | |
Concho Resources IncorporatedǠ | | | | | | | 18,844 | | | | 1,766,625 | |
Exxon Mobil Corporation | | | | | | | 24,000 | | | | 2,034,240 | |
Pioneer Natural Resources Company | | | | | | | 22,200 | | | | 1,986,456 | |
SandRidge Energy IncorporatedǠ | | | | | | | 129,500 | | | | 1,056,720 | |
| | | | |
| | | | | | | | | | | 8,005,311 | |
| | | | | | | | | | | | |
| | | | |
Financials: 6.28% | | | | | | | | | | | | |
| | | | |
| Capital Markets: 1.12% | | | | | | | | | | | | |
TD Ameritrade Holding Corporation | | | | | | | 80,300 | | | | 1,256,695 | |
| | | | | | | | | | | | |
| | | | |
| Consumer Finance: 4.08% | | | | | | | | | | | | |
MasterCard Incorporated | | | | | | | 4,400 | | | | 1,640,408 | |
Visa Incorporated Class A | | | | | | | 28,900 | | | | 2,934,217 | |
| | | | |
| | | | | | | | | | | 4,574,625 | |
| | | | | | | | | | | | |
| | | | |
| Real Estate Management & Development: 1.08% | | | | | | | | | | | | |
CBRE Group Incorporated† | | | | | | | 79,400 | | | | 1,208,468 | |
| | | | | | | | | | | | |
| | | | |
Health Care: 12.86% | | | | | | | | | | | | |
| | | | |
| Biotechnology: 3.71% | | | | | | | | | | | | |
Alexion Pharmaceuticals Incorporated† | | | | | | | 34,292 | | | | 2,451,878 | |
BioMarin Pharmaceutical IncorporatedǠ | | | | | | | 33,030 | | | | 1,135,571 | |
Gilead Sciences Incorporated† | | | | | | | 13,913 | | | | 569,351 | |
| | | | |
| | | | | | | | | | | 4,156,800 | |
| | | | | | | | | | | | |
| | | | |
| Health Care Equipment & Supplies: 0.98% | | | | | | | | | | | | |
Alere Incorporated† | | | | | | | 47,419 | | | | 1,094,905 | |
| | | | | | | | | | | | |
| | | | |
| Health Care Providers & Services: 3.44% | | | | | | | | | | | | |
Cardinal Health Incorporated | | | | | | | 31,400 | | | | 1,275,154 | |
Humana Incorporated | | | | | | | 15,200 | | | | 1,331,672 | |
UnitedHealth Group Incorporated | | | | | | | 24,700 | | | | 1,251,796 | |
| | | | |
| | | | | | | | | | | 3,858,622 | |
| | | | | | | | | | | | |
| | | | |
| Health Care Technology: 1.44% | | | | | | | | | | | | |
Cerner Corporation† | | | | | | | 26,400 | | | | 1,617,000 | |
| | | | | | | | | | | | |
| | | | |
| Life Sciences Tools & Services: 0.71% | | | | | | | | | | | | |
Bruker CorporationǠ | | | | | | | 64,000 | | | | 794,880 | |
| | | | | | | | | | | | |
| | | | |
| Pharmaceuticals: 2.58% | | | | | | | | | | | | |
Allergan Incorporated | | | | | | | 18,400 | | | | 1,614,416 | |
Shire plc ADR | | | | | | | 12,300 | | | | 1,277,970 | |
| | | | |
| | | | | | | | | | | 2,892,386 | |
| | | | | | | | | | | | |
| | | | |
Industrials: 13.91% | | | | | | | | | | | | |
| | | | |
| Aerospace & Defense: 4.41% | | | | | | | | | | | | |
Precision Castparts Corporation« | | | | | | | 13,300 | | | | 2,191,707 | |
TransDign Group Incorporated† | | | | | | | 28,700 | | | | 2,746,016 | |
| | | | |
| | | | | | | | | | | 4,937,723 | |
| | | | | | | | | | | | |
| | | | | | |
| Portfolio of Investments—December 31, 2011 | | Wells Fargo Advantage VT Omega Growth Fund | | | 13 | |
| | | | | | | | | | | | |
| Security Name | | | | | | Shares | | | Value | |
| | | | | | | | | | | | |
| | | | |
| Machinery: 3.92% | | | | | | | | | | | | |
AGCO Corporation† | | | | | | | 7,900 | | | $ | 339,463 | |
Chart Industries IncorporatedǠ | | | | | | | 19,000 | | | | 1,027,330 | |
Cummins Incorporated | | | | | | | 14,464 | | | | 1,273,121 | |
Gardner Denver Incorporated | | | | | | | 22,800 | | | | 1,756,968 | |
| | | | |
| | | | | | | | | | | 4,396,882 | |
| | | | | | | | | | | | |
| | | | |
| Road & Rail: 3.46% | | | | | | | | | | | | |
Hertz Global Holdings IncorporatedǠ | | | | | | | 134,200 | | | | 1,572,824 | |
Kansas City SouthernǠ | | | | | | | 33,800 | | | | 2,298,738 | |
| | | | |
| | | | | | | | | | | 3,871,562 | |
| | | | | | | | | | | | |
| | | | |
| Trading Companies & Distributors: 2.12% | | | | | | | | | | | | |
W.W. Grainger Incorporated | | | | | | | 3,387 | | | | 634,013 | |
WESCO International IncorporatedǠ | | | | | | | 32,900 | | | | 1,744,029 | |
| | | | |
| | | | | | | | | | | 2,378,042 | |
| | | | | | | | | | | | |
| | | | |
Information Technology: 28.51% | | | | | | | | | | | | |
| | | | |
| Communications Equipment: 1.01% | | | | | | | | | | | | |
Acme Packet IncorporatedǠ | | | | | | | 36,500 | | | | 1,128,215 | |
| | | | | | | | | | | | |
| | | | |
| Computers & Peripherals: 8.62% | | | | | | | | | | | | |
Apple Incorporated† | | | | | | | 19,700 | | | | 7,978,500 | |
EMC Corporation† | | | | | | | 78,200 | | | | 1,684,428 | |
| | | | |
| | | | | | | | | | | 9,662,928 | |
| | | | | | | | | | | | |
| | | | |
| Internet Software & Services: 3.41% | | | | | | | | | | | | |
eBay Incorporated† | | | | | | | 47,600 | | | | 1,443,708 | |
F5 Networks Incorporated† | | | | | | | 11,938 | | | | 1,266,861 | |
MercadoLibre Incorporated | | | | | | | 13,900 | | | | 1,105,606 | |
| | | | |
| | | | | | | | | | | 3,816,175 | |
| | | | | | | | | | | | |
| | | | |
| IT Services: 3.14% | | | | | | | | | | | | |
Cognizant Technology Solutions Corporation Class A† | | | | | | | 26,500 | | | | 1,704,215 | |
Gartner Incorporated† | | | | | | | 52,219 | | | | 1,815,655 | |
| | | | |
| | | | | | | | | | | 3,519,870 | |
| | | | | | | | | | | | |
| | | | |
| Semiconductors & Semiconductor Equipment: 4.00% | | | | | | | | | | | | |
ARM Holdings plc ADR | | | | | | | 45,400 | | | | 1,256,218 | |
Atmel CorporationǠ | | | | | | | 72,700 | | | | 588,870 | |
Avago Technologies Limited | | | | | | | 48,400 | | | | 1,396,822 | |
Microchip Technology Incorporated« | | | | | | | 33,900 | | | | 1,241,757 | |
| | | | |
| | | | | | | | | | | 4,483,667 | |
| | | | | | | | | | | | |
| | | | |
| Software: 8.33% | | | | | | | | | | | | |
Check Point Software Technologies Limited† | | | | | | | 24,900 | | | | 1,308,246 | |
Citrix Systems Incorporated† | | | | | | | 20,600 | | | | 1,250,832 | |
Oracle Corporation | | | | | | | 61,300 | | | | 1,572,345 | |
Qlik Technologies Incorporated† | | | | | | | 48,875 | | | | 1,182,775 | |
Red Hat Incorporated† | | | | | | | 34,500 | | | | 1,424,505 | |
| | | | |
| 14 | | Wells Fargo Advantage VT Omega Growth Fund | | Portfolio of Investments—December 31, 2011 |
| | | | | | | | | | | | | | |
| Security Name | | | | | | | Shares | | | Value | |
| | | | | | | | | | | | | | |
| | | | |
| Software (continued) | | | | | | | | | | | | | | |
Salesforce.com IncorporatedǠ | | | | | | | | | 9,700 | | | $ | 984,162 | |
TIBCO Software Incorporated† | | | | | | | | | 67,500 | | | | 1,613,925 | |
| | | | |
| | | | | | | | | | | | | 9,336,790 | |
| | | | | | | | | | | | | | |
| | | | |
Materials: 3.67% | | | | | | | | | | | | | | |
| | | | |
| Chemicals: 3.67% | | | | | | | | | | | | | | |
Airgas Incorporated | | | | | | | | | 29,000 | | | | 2,264,320 | |
Monsanto Company | | | | | | | | | 26,400 | | | | 1,849,848 | |
| | | | |
| | | | | | | | | | | | | 4,114,168 | |
| | | | | | | | | | | | | | |
| | | | |
Telecommunication Services: 2.00% | | | | | | | | | | | | | | |
| | | | |
| Wireless Telecommunication Services: 2.00% | | | | | | | | | | | | | | |
American Tower Corporation Class A | | | | | | | | | 37,300 | | | | 2,238,373 | |
| | | | | | | | | | | | | | |
| | | |
Total Common Stocks (Cost $96,998,340) | | | | | | | | | | | 109,457,067 | |
| | | | | | | | | | | | | | |
| | | | |
| | | | | | | | Principal | | | | |
| Other: 0.13% | | | | | | | | | | | | | | |
Gryphon Funding Limited, Pass-Through Entity(a)(i)(v) | | | | | | | | $ | 188,548 | | | | 52,793 | |
VFNC Corporation, Pass-Through Entity, 0.30%(a)(i)(v)±144A | | | | | | | | | 214,624 | | | | 92,288 | |
| | | | |
Total Other (Cost $69,365) | | | | | | | | | | | | | 145,081 | |
| | | | | | | | | | | | | | |
| | | | |
| | | | | Yield | | | Shares | | | | |
| Short-Term Investments: 19.35% | | | | | | | | | | | | | | |
| | | | |
| Investment Companies: 19.35% | | | | | | | | | | | | | | |
Wells Fargo Advantage Cash Investment Money Market Fund, Institutional Class(l)(u) | | | | | 0.04 | % | | | 2,090,801 | | | | 2,090,801 | |
Wells Fargo Securities Lending Cash Investments, LLC(v)(l)(u)(r) | | | | | 0.12 | | | | 19,595,896 | | | | 19,595,896 | |
| | | |
Total Short-Term Investments (Cost $21,686,697) | | | | | | | | | | | 21,686,697 | |
| | | | | | | | | | | | | | |
| | | | | | | | |
| Total Investments in Securities | | | | | | | | |
| (Cost $118,754,402)* | | | 117.17 | % | | | 131,288,845 | |
Other Assets and Liabilities, Net | | | (17.17 | ) | | | (19,239,471 | ) |
| | | | | | | | |
| Total Net Assets | | | 100.00 | % | | $ | 112,049,374 | |
| | | | | | | | |
| « | All or a portion of this security is on loan. |
| † | Non-income earning security. |
| (a) | Security is fair valued by the Management Valuation Team, and in certain instances by the Board of Trustees, in accordance with procedures approved by the Board of Trustees. |
| (i) | Illiquid security for which the designation as illiquid is unaudited. |
| (v) | Security represents investment of cash collateral received from securities on loan. |
| ± | Variable rate investment. |
| 144A | Security that may be resold to “qualified institutional buyers” under Rule 144A or security offered pursuant to Section 4(2) of the Securities Act of 1933, as amended. |
| (l) | Investment in an affiliate. |
| (u) | Rate shown is the 7-day annualized yield at period end. |
| (r) | The investment company is exempt from registration under Section 3(c)(7) of the 1940 Act. |
| * | Cost for federal income tax purposes is $118,997,791 and net unrealized appreciation (depreciation) consists of: |
| | | | |
Gross unrealized appreciation | | $ | 17,911,281 | |
Gross unrealized depreciation | | | (5,620,227 | ) |
| | | | |
Net unrealized appreciation | | $ | 12,291,054 | |
The accompanying notes are an integral part of these financial statements.
| | | | | | |
| Statement of Assets and Liabilities—December 31, 2011 | | Wells Fargo Advantage VT Omega Growth Fund | | | 15 | |
| | | | |
| | | | |
| |
Assets | | | | |
Investments | | | | |
In unaffiliated securities (including securities on loan), at value | | $ | 109,602,148 | |
In affiliated securities, at value | | | 21,686,697 | |
| | | | |
Total investments, at value (see cost below) | | | 131,288,845 | |
Receivable for investments sold | | | 1,344,379 | |
Receivable for Fund shares sold | | | 260 | |
Receivable for dividends | | | 41,576 | |
Receivable for securities lending income | | | 2,042 | |
Prepaid expenses and other assets | | | 1,461 | |
| | | | |
Total assets | | | 132,678,563 | |
| | | | |
| |
Liabilities | | | | |
Payable for investments purchased | | | 721,486 | |
Payable for Fund shares redeemed | | | 105,335 | |
Payable upon receipt of securities loaned | | | 19,665,261 | |
Advisory fee payable | | | 51,452 | |
Distribution fees payable | | | 15,298 | |
Due to other related parties | | | 13,836 | |
Accrued expenses and other liabilities | | | 56,521 | |
| | | | |
Total liabilities | | | 20,629,189 | |
| | | | |
Total net assets | | $ | 112,049,374 | |
| | | | |
| |
NET ASSETS CONSIST OF | | | | |
Paid-in capital | | $ | 101,912,656 | |
Undistributed net investment loss | | | (2,483 | ) |
Accumulated net realized losses on investments | | | (2,395,242 | ) |
Net unrealized gains on investments | | | 12,534,443 | |
| | | | |
Total net assets | | $ | 112,049,374 | |
| | | | |
| |
COMPUTATION OF NET ASSET VALUE PER SHARE1 | | | | |
Net assets – Class 1 | | $ | 45,293,257 | |
Shares outstanding – Class 1 | | | 1,988,704 | |
Net asset value per share – Class 1 | | | $22.78 | |
Net assets – Class 2 | | $ | 66,756,117 | |
Shares outstanding – Class 2 | | | 2,970,030 | |
Net asset value per share – Class 2 | | | $22.48 | |
| |
Total investments, at cost | | $ | 118,754,402 | |
| | | | |
Securities on loan, at value | | $ | 19,115,220 | |
| | | | |
| 1. | The Fund has an unlimited number of authorized shares. |
The accompanying notes are an integral part of these financial statements.
| | | | |
| 16 | | Wells Fargo Advantage VT Omega Growth Fund | | Statement of Operations—Year Ended December 31, 2011 |
| | | | |
| | | | |
| |
Investment income | | | | |
Dividends* | | $ | 552,708 | |
Securities lending income, net | | | 58,505 | |
Income from affiliated securities | | | 1,705 | |
| | | | |
Total investment income | | | 612,918 | |
| | | | |
| |
Expenses | | | | |
Advisory fee | | | 706,005 | |
Administration fees | | | | |
Fund level | | | 64,182 | |
Class 1 | | | 42,664 | |
Class 2 | | | 60,028 | |
Distribution fees | | | | |
Class 2 | | | 187,588 | |
Custody and accounting fees | | | 30,541 | |
Professional fees | | | 48,011 | |
Shareholder report expenses | | | 59,719 | |
Trustees’ fees and expenses | | | 11,603 | |
Other fees and expenses | | | 2,496 | |
| | | | |
Total expenses | | | 1,212,837 | |
Less: Fee waivers and/or expense reimbursements | | | (62,515 | ) |
| | | | |
Net expenses | | | 1,150,322 | |
| | | | |
Net investment loss | | | (537,404 | ) |
| | | | |
| |
REALIZED AND UNREALIZED GAINS (LOSSES) ON INVESTMENTS | | | | |
Net realized gains on investments | | | 10,208,867 | |
Net change in unrealized gains (losses) on investments | | | (16,548,843 | ) |
| | | | |
Net realized and unrealized gains (losses) on investments | | | (6,339,976 | ) |
| | | | |
Net decrease in net assets resulting from operations | | $ | (6,877,380 | ) |
| | | | |
| |
* Net of foreign dividend withholding taxes of | | | $20,629 | |
The accompanying notes are an integral part of these financial statements.
| | | | | | |
| Statements of Changes in Net Assets | | Wells Fargo Advantage VT Omega Growth Fund | | | 17 | |
| | | | | | | | | | | | | | | | |
| | | Year Ended
December 31, 2011 | | | Year Ended
December 31, 20101 | |
| | | | |
Operations | | | | | | | | | | | | | | | | |
Net investment loss | | | | | | $ | (537,404 | ) | | | | | | $ | (163,947 | ) |
Net realized gains on investments | | | | | | | 10,208,867 | | | | | | | | 13,266,207 | |
Net change in unrealized gains (losses) on investments | | | | | | | (16,548,843 | ) | | | | | | | 12,283,320 | |
| | | | | | | | | | | | | | | | |
Net increase (decrease) in net assets resulting from operations | | | | | | | (6,877,380 | ) | | | | | | | 25,385,580 | |
| | | | | | | | | | | | | | | | |
| | | | |
Distributions to shareholders from | | | | | | | | | | | | | | | | |
Net investment income | | | | | | | | | | | | | | | | |
Class 1 | | | | | | | 0 | | | | | | | | (439,899 | ) |
Class 2 | | | | | | | 0 | | | | | | | | (140,680 | ) |
Net realized gains | | | | | | | | | | | | | | | | |
Class 1 | | | | | | | (478,304 | ) | | | | | | | 0 | |
Class 2 | | | | | | | (638,543 | ) | | | | | | | 0 | |
| | | | | | | | | | | | | | | | |
Total distributions to shareholders | | | | | | | (1,116,847 | ) | | | | | | | (580,579 | ) |
| | | | | | | | | | | | | | | | |
| | | | |
Capital share transactions | | | Shares | | | | | | | | Shares | | | | | |
Proceeds from shares sold | | | | | | | | | | | | | | | | |
Class 1 | | | 475,258 | | | | 11,982,674 | | | | 428,669 | | | | 8,952,888 | |
Class 2 | | | 258,675 | | | | 6,051,791 | | | | 494,435 | | | | 9,722,414 | |
| | | | | | | | | | | | | | | | |
| | | | | | | 18,034,465 | | | | | | | | 18,675,302 | |
| | | | | | | | | | | | | | | | |
Reinvestment of distributions | | | | | | | | | | | | | | | | |
Class 1 | | | 18,928 | | | | 478,304 | | | | 21,311 | | | | 439,899 | |
Class 2 | | | 25,582 | | | | 638,543 | | | | 6,845 | | | | 140,680 | |
| | | | | | | | | | | | | | | | |
| | | | | | | 1,116,847 | | | | | | | | 580,579 | |
| | | | | | | | | | | | | | | | |
Payment for shares redeemed | | | | | | | | | | | | | | | | |
Class 1 | | | (741,540 | ) | | | (17,562,839 | ) | | | (1,143,173 | ) | | | (23,005,725 | ) |
Class 2 | | | (782,129 | ) | | | (19,014,915 | ) | | | (1,245,566 | ) | | | (25,157,874 | ) |
| | | | | | | | | | | | | | | | |
| | | | | | | (36,577,754 | ) | | | | | | | (48,163,599 | ) |
| | | | | | | | | | | | | | | | |
Net asset value of shares issued in acquisitions | | | | | | | | | | | | | | | | |
Class 2 | | | 0 | | | | 0 | | | | 2,586,116 | | | | 48,569,090 | |
| | | | | | | | | | | | | | | | |
Net increase (decrease) in net assets resulting
from capital share transactions | | | | | | | (17,426,442 | ) | | | | | | | 19,661,372 | |
| | | | | | | | | | | | | | | | |
Total increase (decrease) in net assets | | | | | | | (25,420,669 | ) | | | | | | | 44,466,373 | |
| | | | | | | | | | | | | | | | |
| | | | |
Net assets | | | | | | | | | | | | | | | | |
Beginning of period | | | | | | | 137,470,043 | | | | | | | | 93,003,670 | |
| | | | | | | | | | | | | | | | |
End of period | | | | | | $ | 112,049,374 | | | | | | | $ | 137,470,043 | |
| | | | | | | | | | | | | | | | |
Undistributed (accumulated) net investment loss | | | | | | $ | (2,483 | ) | | | | | | $ | (3,029 | ) |
| | | | | | | | | | | | | | | | |
| 1. | After the close of business on July 16, 2010, the Fund acquired the net assets of Evergreen VA Omega Fund and Wells Fargo Advantage VT Large Company Growth Fund. Evergreen VA Omega Fund became the accounting and performance survivor in the transaction. The information for the period prior to July 19, 2010 is that of Evergreen VA Omega Fund. |
The accompanying notes are an integral part of these financial statements.
| | | | |
| 18 | | Wells Fargo Advantage VT Omega Growth Fund | | Financial Highlights |
(For a share outstanding throughout each period)
| | | | | | | | | | | | | | | | | | | | |
| | | Year Ended December 31, | |
| Class 1 | | 2011 | | | 20101 | | | 20091 | | | 20081 | | | 20071 | |
Net asset value, beginning of period | | | $24.26 | | | | $20.42 | | | | $14.43 | | | | $19.82 | | | | $17.80 | |
Net investment income (loss) | | | (0.06 | ) | | | 0.03 | | | | 0.13 | | | | 0.23 | | | | 0.08 | |
Net realized and unrealized gains (losses) on investments | | | (1.21 | ) | | | 3.98 | | | | 6.09 | | | | (5.62 | ) | | | 2.05 | |
| | | | | | | | | | | | | | | | | | | | |
Total from investment operations | | | (1.27 | ) | | | 4.01 | | | | 6.22 | | | | (5.39 | ) | | | 2.13 | |
Distributions to shareholders from | | | | | | | | | | | | | | | | | | | | |
Net investment income | | | 0.00 | | | | (0.17 | ) | | | (0.23 | ) | | | 0.00 | | | | (0.11 | ) |
Net realized gains | | | (0.21 | ) | | | 0.00 | | | | 0.00 | | | | 0.00 | | | | 0.00 | |
| | | | | | | | | | | | | | | | | | | | |
Total distributions to shareholders | | | (0.21 | ) | | | (0.17 | ) | | | (0.23 | ) | | | 0.00 | | | | (0.11 | ) |
Net asset value, end of period | | | $22.78 | | | | $24.26 | | | | $20.42 | | | | $14.43 | | | | $19.82 | |
Total return | | | (5.36 | )% | | | 19.79 | % | | | 43.97 | % | | | (27.19 | )% | | | 11.96 | % |
Ratios to average net assets (annualized) | | | | | | | | | | | | | | | | | | | | |
Gross expenses | | | 0.80 | % | | | 0.75 | % | | | 0.76 | % | | | 0.72 | % | | | 0.71 | % |
Net expenses | | | 0.75 | % | | | 0.74 | % | | | 0.76 | % | | | 0.72 | % | | | 0.71 | % |
Net investment income (loss) | | | (0.27 | )% | | | 0.01 | % | | | 0.86 | % | | | 1.11 | % | | | 0.32 | % |
Supplemental data | | | | | | | | | | | | | | | | | | | | |
Portfolio turnover rate | | | 110 | % | | | 160 | % | | | 28 | % | | | 46 | % | | | 31 | % |
Net assets, end of period (000’s omitted) | | $ | 45,293 | | | $ | 54,246 | | | $ | 59,807 | | | $ | 35,952 | | | $ | 67,773 | |
| 1. | After the close of business on July 16, 2010, the Fund acquired the net assets of Evergreen VA Omega Fund and Wells Fargo Advantage VT Large Company Growth Fund. Evergreen VA Omega Fund became the accounting and performance survivor in the transaction. The information for the periods prior to July 19, 2010 is that of Class 1 of Evergreen VA Omega Fund. |
The accompanying notes are an integral part of these financial statements.
| | | | | | |
| Financial Highlights | | Wells Fargo Advantage VT Omega Growth Fund | | | 19 | |
(For a share outstanding throughout each period)
| | | | | | | | | | | | | | | | | | | | |
| | | Year Ended December 31, | |
| Class 2 | | 2011 | | | 20101 | | | 20091 | | | 20081 | | | 20071 | |
Net asset value, beginning of period | | | $24.00 | | | | $20.19 | | | | $14.25 | | | | $19.63 | | | | $17.62 | |
Net investment income (loss) | | | (0.14 | ) | | | (0.07 | )2 | | | 0.11 | | | | 0.15 | | | | 0.01 | |
Net realized and unrealized gains (losses) on investments | | | (1.17 | ) | | | 3.99 | | | | 6.00 | | | | (5.53 | ) | | | 2.05 | |
| | | | | | | | | | | | | | | | | | | | |
Total from investment operations | | | (1.31 | ) | | | 3.92 | | | | 6.11 | | | | (5.38 | ) | | | 2.06 | |
Distributions to shareholders from | | | | | | | | | | | | | | | | | | | | |
Net investment income | | | 0.00 | | | | (0.11 | ) | | | (0.17 | ) | | | 0.00 | | | | (0.05 | ) |
Net realized gains | | | (0.21 | ) | | | 0.00 | | | | 0.00 | | | | 0.00 | | | | 0.00 | |
| | | | | | | | | | | | | | | | | | | | |
Total distributions to shareholders | | | (0.21 | ) | | | (0.11 | ) | | | (0.17 | ) | | | 0.00 | | | | (0.05 | ) |
Net asset value, end of period | | | $22.48 | | | | $24.00 | | | | $20.19 | | | | $14.25 | | | | $19.63 | |
Total return | | | (5.54 | )% | | | 19.48 | % | | | 43.58 | % | | | (27.41 | )% | | | 11.74 | % |
Ratios to average net assets (annualized) | | | | | | | | | | | | | | | | | | | | |
Gross expenses | | | 1.05 | % | | | 1.01 | % | | | 1.00 | % | | | 0.97 | % | | | 0.96 | % |
Net expenses | | | 1.00 | % | | | 1.00 | % | | | 1.00 | % | | | 0.97 | % | | | 0.96 | % |
Net investment income (loss) | | | (0.52 | )% | | | (0.34 | )% | | | 0.63 | % | | | 0.86 | % | | | 0.07 | % |
Supplemental data | | | | | | | | | | | | | | | | | | | | |
Portfolio turnover rate | | | 110 | % | | | 160 | % | | | 28 | % | | | 46 | % | | | 31 | % |
Net assets, end of period (000’s omitted) | | $ | 66,756 | | | $ | 83,224 | | | $ | 33,196 | | | $ | 22,910 | | | $ | 38,137 | |
| 1. | After the close of business on July 16, 2010, the Fund acquired the net assets of Evergreen VA Omega Fund and Wells Fargo Advantage VT Large Company Growth Fund. Evergreen VA Omega Fund became the accounting and performance survivor in the transaction. The information for the periods prior to July 19, 2010 is that of Class 2 of Evergreen VA Omega Fund. |
| 2. | Calculated based upon average shares outstanding |
The accompanying notes are an integral part of these financial statements.
| | | | |
| 20 | | Wells Fargo Advantage VT Omega Growth Fund | | Notes to Financial Statements |
1. ORGANIZATION
Wells Fargo Variable Trust (the “Trust”), a Delaware statutory trust organized on March 10, 1999, is an open-end management investment company registered under the Investment Company Act of 1940, as amended (the “1940 Act”). These financial statements report on Wells Fargo Advantage VT Omega Growth Fund (the “Fund”) which is a diversified series of the Trust.
2. SIGNIFICANT ACCOUNTING POLICIES
The following significant accounting policies, which are consistently followed in the preparation of the financial statements of the Fund, are in conformity with U.S. generally accepted accounting principles which require management to make estimates and assumptions that affect the reported amounts of assets and liabilities, disclosure of contingent assets and liabilities at the date of the financial statements, and the reported amounts of revenues and expenses during the reporting period. Actual results could differ from those estimates.
Securities valuation
Investments in equity securities are valued each business day as of the close of regular trading on the New York Stock Exchange, which is usually 4:00 p.m. (Eastern Time). Securities which are traded on a national or foreign securities exchange are valued at the last reported sales price, except that securities listed on The Nasdaq Stock Market, Inc. (“Nasdaq”) are valued at the Nasdaq Official Closing Price (“NOCP”), and if no NOCP is available, then at the last reported sales price. If no sales price is shown on the Nasdaq, the bid price will be used. In the absence of any sale of securities listed on the Nasdaq, and in the case of other securities (including U.S. Government obligations, but excluding debt securities maturing in 60 days or less), the price will be deemed “stale” and the valuations will be determined in accordance with the Fund’s Fair Value Procedures.
Fixed income securities with maturities exceeding 60 days are valued based on available evaluated prices received from an independent pricing service approved by the Board of Trustees which may utilize both transaction data and market information such as yield, prices of securities of comparable quality, coupon rate, maturity, type of issue, trading characteristics and other market data. If valuations are not available from the pricing service or values received are deemed not representative of market value, values will be obtained from a third party broker-dealer or determined based on the Fund’s Fair Value Procedures.
Debt securities of sufficient credit quality with original maturities of 60 days or less generally are valued at amortized cost which approximates fair value. The amortized cost method involves valuing a security at its cost, plus accretion of discount or minus amortization of premium over the period until maturity.
Investments in open-end mutual funds and non-registered investment companies are generally valued at net asset value.
Investments which are not valued using any of the methods discussed above, are valued at their fair value, as determined by procedures established in good faith and approved by the Board of Trustees.
Security loans
The Fund may lend its securities from time to time in order to earn additional income in the form of fees or interest on securities received as collateral or the investment of any cash received as collateral. The Fund continues to receive interest or dividends on the securities loaned. The Fund receives collateral in the form of cash or securities with a value at least equal to the value of the securities on loan. The value of the loaned securities is determined at the close of each business day and any additional required collateral is delivered to the Fund on the next business day. In a securities lending transaction, the net asset value of the Fund will be affected by an increase or decrease in the value of the securities loaned and by an increase or decrease in the value of the instrument in which collateral is invested. The amount of securities lending activity undertaken by the Fund fluctuates from time to time. In the event of default or bankruptcy by the borrower, the Fund may be prevented from recovering the loaned securities or gaining access to the collateral or may experience delays or costs in doing so. In addition, the investment of any cash collateral received may lose all or part of its value. The Fund has the right under the lending agreement to recover the securities from the borrower on demand.
The Fund lends its securities through an unaffiliated securities lending agent. Cash collateral received in connection with its securities lending transactions is invested in Wells Fargo Securities Lending Cash Investments, LLC (the “Cash Collateral Fund”). The Cash Collateral Fund is exempt from registration under Section 3(c)(7) of the 1940 Act and is managed by
| | | | | | |
| Notes to Financial Statements | | Wells Fargo Advantage VT Omega Growth Fund | | | 21 | |
Wells Fargo Funds Management LLC (“Funds Management”) and is sub-advised by Wells Capital Management Incorporated (“Wells Capital Management”). Funds Management receives an advisory fee starting at 0.05% and declining to 0.01% as the average daily net assets of the Cash Collateral Fund increase. All of the fees received by Funds Management are paid to Wells Capital Management for its services as sub-adviser. The Cash Collateral Fund seeks to provide a positive return compared to the daily Fed Funds Open rate by investing in high-quality, U.S. dollar-denominated short-term money market instruments. Cash Collateral Fund investments are fair valued based upon the amortized cost valuation technique. Income earned from investment in the Cash Collateral Fund is included in securities lending income on the Statement of Operations.
For Wells Fargo Advantage Funds that participated in securities lending activity prior to February 13, 2009, certain structured investment vehicles purchased in a joint account by the former securities lending agent defaulted or were impaired. Certain of the Wells Fargo Advantage Funds still hold ownership interest in these structured investment vehicles, which have since been restructured as pass-through securities. If the Fund holds an ownership interest in such pass-through securities, information regarding this ownership interest can be found in the Portfolio of Investments under the category “Other”.
Security transactions and income recognition
Securities transactions are recorded on a trade date basis. Realized gains or losses are reported on the basis of identified cost of securities delivered.
Dividend income is recognized on the ex-dividend date. Dividend income is recorded net of foreign taxes withheld where recovery of such taxes is not assured.
Distributions to shareholders
Distributions to shareholders from net investment income and net realized gains, if any, are recorded on the ex-dividend date. Such distributions are determined in conformity with income tax regulations, which may differ from generally accepted accounting principles.
The timing and character of distributions made during the period from net investment income or net realized gains may differ from their ultimate characterization for federal income tax purposes. To the extent that these differences are permanent in nature, such amounts are reclassified within the capital accounts based on their federal tax-basis treatment. Temporary differences do not require reclassifications. The primary permanent differences causing such reclassifications are due to net operating losses. At December 31, 2011, as a result of permanent book-to-tax differences, the following reclassification adjustments were made on the Statement of Assets and Liabilities:
| | | | | | | | | | |
Paid-in
Capital | | Undistributed
Net Investment
Loss | | Accumulated
Net Realized
Losses on
Investments |
| $5,909 | | | $ | 537,950 | | | | $ | (543,859 | ) |
Federal and other taxes
The Fund intends to continue to qualify as a regulated investment company by distributing substantially all of its investment company taxable income and any net realized capital gains (after reduction for capital loss carryforwards) sufficient to relieve it from all, or substantially all, federal income taxes. Accordingly, no provision for federal income taxes was required.
The Fund’s income and federal excise tax returns and all financial records supporting those returns for the prior three fiscal years are subject to examination by the federal and Delaware revenue authorities.
Under the recently enacted Regulated Investment Company Modernization Act of 2010, the Fund is permitted to carry forward capital losses incurred in taxable years which began after December 22, 2010 for an unlimited period. However, any losses incurred are required to be utilized prior to the losses incurred in pre-enactment taxable years. As a result of this ordering rule, pre-enactment capital loss carryforwards may be more likely to expire unused. Additionally, post-enactment capital losses that are carried forward will retain their character as either short-term or long-term capital losses rather than being considered all short-term as under previous law.
| | | | |
| 22 | | Wells Fargo Advantage VT Omega Growth Fund | | Notes to Financial Statements |
At December 31, 2011, net capital loss carryforwards, which are available to offset future net realized capital gains, were as follows:
| | | | | | | | | | | | | | | | |
Expiration | |
| 2012 | | 2013 | | | 2015 | | | 2016 | | | 2017 | |
| $1,078,104 | | $ | 1,615,063 | | | $ | 4,132,177 | | | $ | 2,303,740 | | | $ | 771,379 | |
Class allocations
The separate classes of shares offered by the Fund differ principally in distribution fees. Shareholders of each class bear certain expenses that pertain to that particular class. All shareholders bear the common expenses of the Fund, earn income from the portfolio, and are allocated unrealized gains and losses pro rata based on the average daily net assets of each class, without distinction between share classes. Dividends are determined separately for each class based on income and expenses allocable to each class. Realized gains and losses are allocated to each class pro rata based upon the net assets of each class on the date realized. Differences in per share dividend rates generally result from the relative weightings of pro rata income and realized gain allocations and from differences in separate class expenses, including distribution fees.
3. FAIR VALUATION MEASUREMENTS
Fair value measurements of investments are determined within a framework that has established a fair value hierarchy based upon the various data inputs utilized in determining the value of the Fund’s investments. The three-level hierarchy gives the highest priority to unadjusted quoted prices in active markets for identical assets or liabilities (Level 1) and the lowest priority to significant unobservable inputs (Level 3). The Fund’s investments are classified within the fair value hierarchy based on the lowest level of input that is significant to the fair value measurement. The inputs are summarized into three broad levels as follows:
| n | | Level 1 – quoted prices in active markets for identical securities |
| n | | Level 2 – other significant observable inputs (including quoted prices for similar securities, interest rates, prepayment speeds, credit risk, etc.) |
| n | | Level 3 – significant unobservable inputs (including the Fund’s own assumptions in determining the fair value of investments) |
The inputs or methodologies used for valuing securities are not necessarily an indication of the risk associated with investing in those securities.
As of December 31, 2011, the inputs used in valuing the Fund’s assets, which are carried at fair value, were as follows:
| | | | | | | | | | | | | | | | |
| Investments in Securities | | Quoted Prices (Level 1) | | | Significant Other
Observable Inputs (Level 2) | | | Significant Unobservable Inputs (Level 3) | | | Total | |
Equity securities | | | | | | | | | | | | | | | | |
Common stocks | | $ | 109,457,067 | | | $ | 0 | | | $ | 0 | | | $ | 109,457,067 | |
Other | | | 0 | | | | 0 | | | | 145,081 | | | | 145,081 | |
Short-term investments | | | | | | | | | | | | | | | | |
Investment companies | | | 2,090,801 | | | | 19,595,896 | | | | 0 | | | | 21,686,697 | |
| | | $ | 111,547,868 | | | $ | 19,595,896 | | | $ | 145,081 | | | $ | 131,288,845 | |
Further details on the major security types listed above can be found in the Portfolio of Investments.
Transfers in and transfers out are recognized at the end of the reporting period. For the year ended December 31, 2011, the Fund did not have any significant transfers into/out of Level 1 and Level 2.
| | | | | | |
| Notes to Financial Statements | | Wells Fargo Advantage VT Omega Growth Fund | | | 23 | |
The following is a reconciliation of assets in which significant unobservable inputs (Level 3) were used in determining fair value:
| | | | |
| | | Other | |
Balance as of December 31, 2010 | | $ | 239,022 | |
Accrued discounts (premiums) | | | 0 | |
Realized gains (losses) | | | 0 | |
Change in unrealized gains (losses) | | | (12,845 | ) |
Purchases | | | 0 | |
Sales | | | (81,096 | ) |
Transfers into Level 3 | | | 0 | |
Transfers out of Level 3 | | | 0 | |
Balance as of December 31, 2011 | | $ | 145,081 | |
Change in unrealized gains (losses)
relating to securities still held at December 31, 2011 | | $ | (51,696 | ) |
4. TRANSACTIONS WITH AFFILIATES AND OTHER EXPENSES
Advisory fee
The Trust has entered into an advisory contract with Funds Management, an indirect wholly owned subsidiary of Wells Fargo & Company (“Wells Fargo”). The adviser is responsible for implementing investment policies and guidelines and for supervising the sub-adviser, who is responsible for day-to-day portfolio management of the Fund.
Pursuant to the contract, Funds Management is entitled to receive an annual advisory fee starting at 0.55% and declining to 0.40% as the average daily net assets of the Fund increase. For the year ended December 31, 2011, the advisory fee was equivalent to an annual rate of 0.55% of the Fund’s average daily net assets.
Funds Management may retain the services of certain sub-advisers to provide daily portfolio management to the Fund. The fees related to sub-advisory services are borne directly by Funds Management and do not increase the overall fees paid by the Fund. Wells Capital Management, an affiliate of Funds Management, is the sub-adviser to the Fund and is entitled to receive a fee from Funds Management at an annual rate starting at 0.35% and declining to 0.15% as the average daily net assets of the Fund increase.
Administration and transfer agent fees
The Trust has entered into an administration agreement with Funds Management. Under this agreement, for providing administrative services, which includes paying fees and expenses for services provided by the transfer agent, sub-transfer agents, omnibus account servicers and record-keepers, Funds Management is entitled to receive from the Fund an annual fund level administration fee starting at 0.05% and declining to 0.03% as the average daily net assets of the Fund increase and a class level administration fee of 0.08% of the average daily net assets of each class.
Funds Management has contractually waived and/or reimbursed advisory and administration fees to the extent necessary to maintain certain net operating expense ratios for the Fund. Waiver of fees and/or reimbursement of expenses by Funds Management were made first from fund level expenses on a proportionate basis and then from class specific expenses.
Distribution fees
The Trust has adopted a Distribution Plan for Class 2 shares of the Fund pursuant to Rule 12b-1 under the 1940 Act. Distribution fees are charged to Class 2 shares and paid to Wells Fargo Funds Distributor, LLC, the principal underwriter, at an annual rate of 0.25% of its average daily net assets.
5. INVESTMENT PORTFOLIO TRANSACTIONS
Purchases and sales of investments, excluding U.S. Government obligations (if any) and short-term securities (securities with maturities of one year or less at purchase date), for the year ended December 31, 2011 were $141,507,856 and $161,721,692, respectively.
| | | | |
| 24 | | Wells Fargo Advantage VT Omega Growth Fund | | Notes to Financial Statements |
6. ACQUISITIONS
After the close of business on July 16, 2010, the Fund acquired the net assets of Evergreen VA Omega Fund and Wells Fargo Advantage VT Large Company Growth Fund. The purpose of the transactions was to combine three funds with similar investment objectives and strategies. The acquisitions were accomplished by a tax-free exchange of all of the shares of Evergreen VA Omega Fund and Wells Fargo Advantage VT Large Company Growth Fund. Shareholders holding Class 1 and Class 2 shares of Evergreen VA Omega Fund received Class 1 and Class 2 shares, respectively, of the Fund in the reorganization. Existing shareholders of Wells Fargo Advantage VT Large Company Growth Fund received Class 2 shares of the Fund in the reorganization. The Fund was newly created to receive the assets of shares of Evergreen VA Omega Fund and Wells Fargo Advantage VT Large Company Growth Fund. Evergreen VA Omega Fund became the accounting and performance survivor in the reorganizations. The investment portfolio of Evergreen VA Omega Fund and Wells Fargo Advantage VT Large Company Growth Fund with fair values of $71,682,578 and $48,538,258, respectively, and identified costs of $69,920,349 and $46,062,243, respectively, at July 16, 2010 were the principal assets acquired by the Fund. For financial reporting purposes, assets received and shares issued by the Fund were recorded at fair value; however, the cost basis of the investments received from Evergreen VA Omega Fund and Wells Fargo Advantage VT Large Company Growth Fund were carried forward to align ongoing reporting of the Fund’s realized and unrealized gains and losses with amounts distributable to shareholders for tax purposes. The value of net assets acquired, unrealized gains (losses) acquired, exchange ratio and number of shares issued were as follows:
| | | | | | | | | | | | | | | | | | |
| Acquired Fund | | Value of Net
Assets Acquired | | | Unrealized
Gains | | | Exchange
Ratio | | | Number of Shares Issued |
Evergreen VA Omega Fund | | $ | 70,210,006 | | | $ | 1,762,229 | | | | 1.00 | | | | 2,457,511 | | | Class 1 |
| | | | | | | | | | | 1.00 | | | | 1,231,817 | | | Class 2 |
Wells Fargo Advantage VT Large Company Growth Fund | | $ | 48,569,090 | | | $ | 2,476,015 | | | | 0.43 | | | | 2,568,116 | | | Class 2 |
The aggregate net assets of the Fund immediately after the acquisitions were $118,779,096.
Assuming the acquisitions had been completed January 1, 2010, the beginning of the annual reporting period for the Fund, the pro forma results of operations for the year ended December 31, 2010 would have been:
| | | | |
Net investment loss | | $ | (116,783 | ) |
Net realized and unrealized gains on investments | | $ | 17,879,551 | |
Net increase in net assets resulting from operations | | $ | 17,762,768 | |
7. BANK BORROWINGS
The Trust and Wells Fargo Funds Trust (excluding the money market funds) are parties to a $150,000,000 revolving credit agreement with State Street Bank and Trust Company, whereby the Fund is permitted to use bank borrowings for temporary or emergency purposes, such as to fund shareholder redemption requests. Interest under the credit agreement is charged to the Fund based on a borrowing rate equal to the higher of the Federal Funds rate in effect on that day plus 1.25% or the overnight LIBOR rate in effect on that day plus 1.25%. In addition, under the credit agreement, the Fund pays an annual commitment fee equal to 0.10% of the unused balance, which is allocated pro rata. Prior to September 6, 2011, the revolving credit agreement was for $125,000,000 and the annual commitment fee paid by the Fund was 0.125% of the unused balance. For the year ended December 31, 2011, the Fund paid $264 in commitment fees.
For the year ended December 31, 2011, there were no borrowings by the Fund under the agreement.
8. DISTRIBUTIONS TO SHAREHOLDERS
The tax character of distributions paid during the years ended December 31, 2011 and December 31, 2010 were as follows:
| | | | | | | | |
| | | Year ended December 31, | |
| | | 2011 | | | 2010 | |
Ordinary Income | | $ | 0 | | | $ | 580,579 | |
Long-term Capital Gain | | | 1,116,847 | | | | 0 | |
| | | | | | |
| Notes to Financial Statements | | Wells Fargo Advantage VT Omega Growth Fund | | | 25 | |
As of December 31, 2011, the components of distributable earnings on a tax basis were as follows:
| | | | | | | | | | | | | | |
Undistributed
Ordinary
Income | | | Undistributed
Long-Term
Gain | | | Unrealized
Gains (Losses) | | | Capital Loss
Carryforward | |
| $ | 2,432,944 | | | $ | 5,315,666 | | | $ | 12,291,054 | | | $ | (9,900,463 | ) |
9. INDEMNIFICATION
Under the Trust’s organizational documents, the officers and directors are indemnified against certain liabilities that may arise out of performance of their duties to the Trust. Additionally, in the normal course of business, the Trust may enter into contracts with service providers that contain a variety of indemnification clauses. The Trust’s maximum exposure under these arrangements is dependent on future claims that may be made against the Fund and, therefore, cannot be estimated.
10. NEW ACCOUNTING PRONOUNCEMENTS
In May 2011, the Financial Accounting Standards Board (“FASB”) issued Accounting Standards Update (“ASU”) No. 2011-04 “Amendments to Achieve Common Fair Value Measurement and Disclosure Requirements in U.S. GAAP and IFRSs”. ASU No. 2011-04 amends FASB ASC Topic 820, Fair Value Measurements and Disclosures, to establish common requirements for measuring fair value and for disclosing information about fair value measurements in accordance with GAAP. The ASU is effective prospectively for interim and annual periods beginning after December 15, 2011. Management expects that adoption of the ASU will result in additional disclosures in the financial statements, as applicable.
In April 2011, FASB issued ASU No. 2011-03 “Reconsideration of Effective Control for Repurchase Agreements”. ASU No. 2011-03 amends FASB ASC Topic 860, Transfers and Servicing, specifically the criteria required to determine whether a repurchase agreement (repo) and similar agreements should be accounted for as sales of financial assets or secured borrowings with commitments. ASU No. 2011-03 changes the assessment of effective control by focusing on the transferor’s contractual rights and obligations and removing the criterion to assess its ability to exercise those rights or honor those obligations. This could result in changes to the way entities account for certain transactions including repurchase agreements, mortgage dollar rolls and reverse repurchase agreements. The ASU will become effective on a prospective basis for new transfers and modifications to existing transactions as of the beginning of the first interim or annual period beginning on or after December 15, 2011. Management has evaluated the impact of adopting the ASU and expects no significant changes.
| | | | |
| 26 | | Wells Fargo Advantage VT Omega Growth Fund | | Report of Independent Registered Public Accounting Firm |
BOARD OF TRUSTEES AND SHAREHOLDERS OF WELLS FARGO VARIABLE TRUST:
We have audited the accompanying statement of assets and liabilities, including the portfolio of investments, of the Wells Fargo Advantage VT Omega Growth Fund (the “Fund”), one of the funds constituting the Wells Fargo Variable Trust, as of December 31, 2011, and the related statement of operations for the year then ended, statements of changes in net assets for each of the years in the two-year period then ended, and the financial highlights for each of the years in the five-year period then ended. These financial statements and financial highlights are the responsibility of the Fund’s management. Our responsibility is to express an opinion on these financial statements and financial highlights based on our audits.
We conducted our audits in accordance with the standards of the Public Company Accounting Oversight Board (United States). Those standards require that we plan and perform the audit to obtain reasonable assurance about whether the financial statements and financial highlights are free of material misstatement. An audit includes examining, on a test basis, evidence supporting the amounts and disclosures in the financial statements. Our procedures included confirmation of securities owned as of December 31, 2011, by correspondence with custodian and brokers, or by other appropriate auditing procedures. An audit also includes assessing the accounting principles used and significant estimates made by management, as well as evaluating the overall financial statement presentation. We believe that our audits provide a reasonable basis for our opinion.
In our opinion, the financial statements and financial highlights referred to above present fairly, in all material respects, the financial position of the Wells Fargo Advantage VT Omega Growth Fund as of December 31, 2011, the results of its operations for the year then ended, changes in its net assets for each of the years in the two-year period then ended, and the financial highlights for each of the years in the five-year period then ended, in conformity with U.S. generally accepted accounting principles.

Boston, Massachusetts
February 24, 2012
| | | | | | |
| Other Information (Unaudited) | | Wells Fargo Advantage VT Omega Growth Fund | | | 27 | |
TAX INFORMATION
Pursuant to Section 852 of the Internal Revenue Code, $1,116,847 was designated as long-term capital gain distributions for the fiscal year ended December 31, 2011.
PROXY VOTING INFORMATION
A description of the policies and procedures that the Fund uses to determine how to vote proxies relating to portfolio securities is available without charge, upon request, by calling 1-800-222-8222, visiting our Web site at www.wellsfargo.com/advantagefunds, or visiting the SEC Web site at www.sec.gov. Information regarding how the Fund voted proxies relating to portfolio securities during the most recent 12-month period ended June 30 is available without charge on the Fund’s Web site at www.wellsfargo.com/advantagefunds or by visiting the SEC Web site at www.sec.gov.
PORTFOLIO HOLDINGS INFORMATION
The complete portfolio holdings for the Fund are publicly available on the Fund’s Web site (www.wellsfargo.com/advantagefunds) on a monthly, 30-day or more delayed basis. In addition, top ten holdings information for the Fund is publicly available on the Fund’s Web site on a monthly, seven-day or more delayed basis. The Fund files its complete schedule of portfolio holdings with the SEC for the first and third quarters of each fiscal year on Form N-Q, which is available without charge by visiting the SEC Web site at www.sec.gov. In addition, the Fund’s Form N-Q may be reviewed and copied at the SEC’s Public Reference Room in Washington, DC, and at regional offices in New York City, at 233 Broadway, and in Chicago, at 175 West Jackson Boulevard, Suite 900. Information about the Public Reference Room may be obtained by calling 1-800-SEC-0330.
| | | | |
| 28 | | Wells Fargo Advantage VT Omega Growth Fund | | Other Information (Unaudited) |
BOARD OF TRUSTEES
The following table provides basic information about the Board of Trustees (the “Trustees”) of the Trust and Officers of the Trust. This table should be read in conjunction with the Prospectus and the Statement of Additional Information1 of the Fund. Each of the Trustees and Officers listed below acts in identical capacities for the Wells Fargo Advantage family of funds, which consists of 138 funds comprising the Wells Fargo Funds Trust, Wells Fargo Variable Trust, Wells Fargo Master Trust and four closed-end funds (collectively the “Fund Complex”). All of the Trustees are also Members of the Audit and Governance Committees of each Trust in the Fund Complex. The mailing address of each Trustee and Officer is 525 Market Street, 12th Floor, San Francisco, CA 94105. Each Trustee and Officer serves an indefinite term, however, each Trustee serves such term until reaching the mandatory retirement age established by the Trustees.
Independent Trustees
| | | | | | |
Name and Year of Birth | | Position Held and Length of Service | | Principal Occupations During Past Five Years | | Other Directorships During
Past Five Years |
Peter G. Gordon
(Born 1942) | | Trustee, since 1998; Chairman, since 2005 (Lead Trustee since 2001) | | Co-Founder, Retired Chairman, President and CEO of Crystal Geyser Water Company. Trustee Emeritus, Colby College | | Asset Allocation Trust |
Isaiah Harris, Jr.
(Born 1952) | | Trustee, since 2009 | | Retired. Prior thereto, President and CEO of BellSouth Advertising and Publishing Corp. from 2005 to 2007, President and CEO of BellSouth Enterprises from 2004 to 2005 and President of BellSouth Consumer Services from 2000 to 2003. Emeritus member of the Iowa State University Foundation Board of Governors. Emeritus Member of the Advisory Board of Iowa State University School of Business. Mr. Harris is a certified public accountant. | | CIGNA Corporation; Deluxe Corporation; Asset Allocation Trust |
Judith M. Johnson
(Born 1949) | | Trustee, since 2008 | | Retired. Prior thereto, Chief Executive Officer and Chief Investment Officer of Minneapolis Employees Retirement Fund from 1996 to 2008. Ms. Johnson is an attorney, certified public accountant and a certified managerial accountant. | | Asset Allocation Trust |
Leroy Keith, Jr.
(Born 1939) | | Trustee, since 2010 | | Chairman, Bloc Global Services (development and construction). Trustee of the Evergreen Funds from 1983 to 2010. Former Managing Director, Almanac Capital Management (commodities firm), former Partner, Stonington Partners, Inc. (private equity fund), former Director, Obagi Medical Products Co. and former Director, Lincoln Educational Services. | | Trustee, Virtus Fund Complex (consisting of 40 portfolios as of 12/31/11); Asset Allocation Trust |
David F. Larcker
(Born 1950) | | Trustee, since 2009 | | James Irvin Miller Professor of Accounting at the Graduate School of Business, Stanford University, Director of Corporate Governance Research Program and Senior Faculty of The Rock Center for Corporate Governance since 2006. From 2005 to 2008, Professor of Accounting at the Graduate School of Business, Stanford University. Prior thereto, Ernst & Young Professor of Accounting at The Wharton School, University of Pennsylvania from 1985 to 2005. | | Asset Allocation Trust |
Olivia S. Mitchell
(Born 1953) | | Trustee, since 2006 | | International Foundation of Employee Benefit Plans Professor, Wharton School of the University of Pennsylvania since 1993. Director of Wharton’s Pension Research Council and Boettner Center on Pensions & Retirement Research, and Research Associate at the National Bureau of Economic Research. Previously, Cornell University Professor from 1978 to 1993. | | Asset Allocation Trust |
| | | | | | |
| Other Information (Unaudited) | | Wells Fargo Advantage VT Omega Growth Fund | | | 29 | |
| | | | | | |
Name and Year of Birth | | Position Held and Length of Service | | Principal Occupations During Past Five Years | | Other Directorships During
Past Five Years |
Timothy J. Penny
(Born 1951) | | Trustee, since 1996 | | President and CEO of Southern Minnesota Initiative Foundation, a non-profit organization, since 2007 and Senior Fellow at the Humphrey Institute Policy Forum at the University of Minnesota since 1995. Member of the Board of Trustees of NorthStar Education Finance, Inc., a non-profit organization, since 2007. | | Asset Allocation Trust |
Michael S. Scofield
(Born 1943) | | Trustee, since 2010 | | Served on the Investment Company Institute’s Board of Governors and Executive Committee from 2008-2011 as well the Governing Council of the Independent Directors Council from 2006-2011 and the Independent Directors Council Executive Committee from 2008-2011. Chairman of the IDC from 2008-2010. Institutional Investor (Fund Directions) Trustee of Year in 2007. Trustee of the Evergreen Funds (and its predecessors) from 1984 to 2010. Chairman of the Evergreen Funds from 2000-2010. Former Trustee of the Mentor Funds. Retired Attorney, Law Offices of Michael S. Scofield and former Director and Chairman, Branded Media Corporation (multi-media branding company). | | Asset Allocation Trust |
Donald C. Willeke
(Born 1940) | | Trustee, since 1996 | | Principal of the law firm of Willeke & Daniels. General Counsel of the Minneapolis Employees Retirement Fund from 1984 until its consolidation into the Minnesota Public Employees Retirement Association on June 30, 2010. Director and Vice Chair of The Free Trust (non-profit corporation). Director of the American Chestnut Foundation (non-profit corporation). | | Asset Allocation Trust |
Officers
| | | | | | |
Name and Year of Birth | | Position Held and
Length of Service | | Principal Occupations During Past Five Years | | |
Karla M. Rabusch
(Born 1959) | | President, since 2003 | | Executive Vice President of Wells Fargo Bank, N.A. and President of Wells Fargo Funds Management, LLC since 2003. Senior Vice President and Chief Administrative Officer of Wells Fargo Funds Management, LLC from 2001 to 2003. | | |
C. David Messman
(Born 1960) | | Secretary, since 2000; Chief Legal Counsel, since 2003 | | Senior Vice President and Secretary of Wells Fargo Funds Management, LLC since 2001. Vice President and Managing Senior Counsel of Wells Fargo Bank, N.A. since 1996. | | |
Kasey Phillips
(Born 1970) | | Treasurer, since 2009 | | Senior Vice President of Wells Fargo Funds Management, LLC since 2009. Senior Vice President of Evergreen Investment Management Company, LLC from 2006 to 2010. Treasurer of the Evergreen Funds from 2005 to 2010. | | |
David Berardi
(Born 1975) | | Assistant Treasurer, since 2009 | | Vice President of Wells Fargo Funds Management, LLC since 2009. Vice President of Evergreen Investment Management Company, LLC from 2008 to 2010. Assistant Vice President of Evergreen Investment Services, Inc. from 2004 to 2008. Manager of Fund Reporting and Control for Evergreen Investment Management Company, LLC from 2004 to 2010. | | |
Jeremy DePalma
(Born 1974) | | Assistant Treasurer, since 2009 | | Senior Vice President of Wells Fargo Funds Management, LLC since 2009. Senior Vice President of Evergreen Investment Management Company, LLC from 2008 to 2010. Vice President, Evergreen Investment Services, Inc. from 2004 to 2007. Head of the Fund Reporting and Control Team within Fund Administration from 2005 to 2010. | | |
Debra Ann Early
(Born 1964) | | Chief Compliance Officer, since 2007 | | Chief Compliance Officer of Wells Fargo Funds Management, LLC since 2007. Chief Compliance Officer of Parnassus Investments from 2005 to 2007. Chief Financial Officer of Parnassus Investments from 2004 to 2007 and Senior Audit Manager of PricewaterhouseCoopers LLP from 1998 to 2004. | | |
| 1. | The Statement of Additional Information includes additional information about the Trustees and is available, without charge, upon request, by calling 1-800-222-8222 or by visiting the Web site at www.wellsfargo.com/advantagefunds. |
| | | | |
| 30 | | Wells Fargo Advantage VT Omega Growth Fund | | List of Abbreviations |
The following is a list of common abbreviations for terms and entities which may have appeared in this report.
| ACB | — Agricultural Credit Bank |
| ADR | — American Depository Receipt |
| ADS | — American Depository Shares |
| AGC-ICC | — Assured Guaranty Corporation - Insured Custody Certificates |
| AGM | — Assured Guaranty Municipal |
| AMBAC | — American Municipal Bond Assurance Corporation |
| AMT | — Alternative Minimum Tax |
| BAN | — Bond Anticipation Notes |
| BHAC | — Berkshire Hathaway Assurance Corporation |
| CAB | — Capital Appreciation Bond |
| CCAB | — Convertible Capital Appreciation Bond |
| CDA | — Community Development Authority |
| CDO | — Collateralized Debt Obligation |
| COP | — Certificate of Participation |
| DRIVER | — Derivative Inverse Tax-Exempt Receipts |
| DW&P | — Department of Water & Power |
| DWR | — Department of Water Resources |
| ECFA | — Educational & Cultural Facilities Authority |
| EDA | — Economic Development Authority |
| EDFA | — Economic Development Finance Authority |
| ETF | — Exchange-Traded Fund |
| FFCB | — Federal Farm Credit Bank |
| FGIC | — Financial Guaranty Insurance Corporation |
| FHA | — Federal Housing Authority |
| FHLB | — Federal Home Loan Bank |
| FHLMC | — Federal Home Loan Mortgage Corporation |
| FNMA | — Federal National Mortgage Association |
| GDR | — Global Depository Receipt |
| GNMA | — Government National Mortgage Association |
| HCFR | — Healthcare Facilities Revenue |
| HEFA | — Health & Educational Facilities Authority |
| HEFAR | — Higher Education Facilities Authority Revenue |
| HFA | — Housing Finance Authority |
| HFFA | — Health Facilities Financing Authority |
| IBC | — Insured Bond Certificate |
| IDA | — Industrial Development Authority |
| IDAG | — Industrial Development Agency |
| IDR | — Industrial Development Revenue |
| KRW | — Republic of Korea Won |
| LIBOR | — London Interbank Offered Rate |
| LLC | — Limited Liability Company |
| LLP | — Limited Liability Partnership |
| MBIA | — Municipal Bond Insurance Association |
| MFHR | — Multi-Family Housing Revenue |
| MUD | — Municipal Utility District |
| NATL-RE | — National Public Finance Guarantee Corporation |
| PCFA | — Pollution Control Finance Authority |
| PCR | — Pollution Control Revenue |
| PFA | — Public Finance Authority |
| PFFA | — Public Facilities Financing Authority |
| PFOTER | — Puttable Floating Option Tax-Exempt Receipts |
| plc | — Public Limited Company |
| PUTTER | — Puttable Tax-Exempt Receipts |
| R&D | — Research & Development |
| RDA | — Redevelopment Authority |
| RDFA | — Redevelopment Finance Authority |
| REIT | — Real Estate Investment Trust |
| ROC | — Reset Option Certificates |
| SAVRS | — Select Auction Variable Rate Securities |
| SBA | — Small Business Authority |
| SFHR | — Single Family Housing Revenue |
| SFMR | — Single Family Mortgage Revenue |
| SPDR | — Standard & Poor’s Depositary Receipts |
| TAN | — Tax Anticipation Notes |
| TIPS | — Treasury Inflation-Protected Securities |
| TRAN | — Tax Revenue Anticipation Notes |
| TCR | —�� Transferable Custody Receipts |
| TTFA | — Transportation Trust Fund Authority |
| TVA | — Tennessee Valley Authority |
| XLCA | — XL Capital Assurance |


FOR MORE INFORMATION
More information about Wells Fargo Advantage Funds is available free upon request. To obtain literature, please write, e-mail, visit the Fund’s Web site, or call:
Wells Fargo Advantage Funds
P.O. Box 8266
Boston, MA 02266-8266
E-mail: wfaf@wellsfargo.com
Web site: www.wellsfargo.com/advantagefunds
Individual investors: 1-800-222-8222
Retail investment professionals: 1-888-877-9275
Institutional investment professionals: 1-866-765-0778
This report and the financial statements contained herein are submitted for the general information of the shareholders of Wells Fargo Advantage Funds. If this report is used for promotional purposes, distribution of the report must be accompanied or preceded by a current prospectus. For a prospectus containing more complete information, including charges and expenses, call 1-800-222-8222 or visit the Fund’s Web site at www.wellsfargo.com/advantagefunds. Please consider the investment objectives, risks, charges, and expenses of the investment carefully before investing. This and other information about Wells Fargo Advantage Funds can be found in the current prospectus. Read the prospectus carefully before you invest or send money.
Wells Fargo Funds Management, LLC, a wholly owned subsidiary of Wells Fargo & Company, provides investment advisory and administrative services for Wells Fargo Advantage Funds. Other affiliates of Wells Fargo & Company provide subadvisory and other services for the Funds. The Funds are distributed by Wells Fargo Funds Distributor, LLC, Member FINRA/SIPC, an affiliate of Wells Fargo & Company.
NOT FDIC INSURED ¡ NO BANK GUARANTEE ¡ MAY LOSE VALUE
© 2012 Wells Fargo Funds Management, LLC. All rights reserved.
| | |
| | 207575 02-12 AVT5/AR151 12-11 |

Wells Fargo Advantage
VT Opportunity FundSM

Annual Report
December 31, 2011
Reduce clutter. Save trees.
Sign up for electronic delivery of prospectuses and shareholder reports at www.wellsfargo.com/advantagedelivery
Contents
The views expressed and any forward-looking statements are as of December 31, 2011, unless otherwise noted, and are those of the Fund managers and/or Wells Fargo Funds Management, LLC. Discussions of individual securities, or the markets generally, or any Wells Fargo Advantage Fund are not intended as individual recommendations. Future events or results may vary significantly from those expressed in any forward-looking statements; the views expressed are subject to change at any time in response to changing circumstances in the market. Wells Fargo Funds Management, LLC, disclaims any obligation to publicly update or revise any views expressed or forward-looking statements.
NOT FDIC INSURED ¡ NO BANK GUARANTEE ¡ MAY LOSE VALUE

WELLS FARGO INVESTMENT HISTORY
| | |
| |
| 1932 | | Keystone creates one of the first mutual fund families. |
| |
| 1971 | | Wells Fargo & Company introduces one of the first institutional index funds. |
| |
| 1978 | | Wells Fargo applies Markowitz and Sharpe’s research on Modern Portfolio Theory to introduce one of the industry’s first Tactical Asset Allocation (TAA) models in institutional separately managed accounts. |
| |
| 1984 | | Wells Fargo Stagecoach Funds launches its first asset allocation fund. |
| |
| 1989 | | The Tactical Asset Allocation (TAA) Model is first applied to Wells Fargo’s asset allocation mutual funds. |
| |
| 1994 | | Wells Fargo introduces the LifePath Funds, one of the first suites of target date funds (now the Wells Fargo Advantage Dow Jones Target Date FundsSM ). |
| |
| 1996 | | Evergreen Investments and Keystone Funds merge. |
| |
| 1997 | | Wells Fargo launches Wells Fargo Advantage WealthBuilder PortfoliosSM, a fund-of-funds suite of products that includes the use of quantitative models to shift assets among investment styles. |
| |
| 1999 | | Norwest Advantage Funds and Stagecoach Funds are reorganized into Wells Fargo Funds after the merger of Norwest and Wells Fargo. |
| |
| 2002 | | Evergreen Retail and Evergreen Institutional companies form the umbrella asset management company, Evergreen Investments. |
| |
| 2005 | | The integration of Strong Funds with Wells Fargo Funds creates Wells Fargo Advantage Funds, resulting in one of the top 20 mutual fund companies in the United States. |
| |
| 2006 | | Wells Fargo Advantage Funds relaunches the target date product line as Wells Fargo Advantage Dow Jones Target Date Funds. |
| |
| 2010 | | The mergers and reorganizations of Evergreen and Wells Fargo Advantage mutual funds are completed, unifying the families under the brand of Wells Fargo Advantage Funds. |
Wells Fargo Advantage Funds®
Wells Fargo Advantage Funds skillfully guides institutions, financial advisors, and individuals through the investment terrain to help them reach their financial objectives. Everything we do on behalf of investors is backed by our unique combination of qualifications.
Strength
Our organization is built on the standards of integrity and service established by our parent company—Wells Fargo & Company—more than 150 years ago. And, because we’re part of a highly diversified financial enterprise, we offer the depth of resources to help investors succeed.
Expertise
Our multi-boutique model offers investors access to the independent thinking of premier investment managers that have been chosen for their time-tested strategies. While each team specializes in a specific investment strategy, collectively they provide investors a wide choice of distinct investment styles. Our dedication to investment excellence doesn’t end with our expertise in manager selection—risk management, analysis, and rigorous ongoing review seek to ensure each manager’s investment process remains consistent.
Partnership
Our collaborative approach is built around understanding the needs and goals of our clients. By adhering to core principles of sound judgment and steady guidance, we support you through every stage of the investment decision process.
Carefully consider a fund’s investment objectives, risks, charges, and expenses before investing. For a current prospectus and, if available, a summary prospectus, containing this and other information, visit wellsfargo.com/advantagefunds. Read it carefully before investing.
Wells Fargo Funds Management, LLC, a wholly owned subsidiary of Wells Fargo & Company, provides investment advisory and administrative services for Wells Fargo Advantage Funds®. Other affiliates of Wells Fargo & Company provide subadvisory and other services for the Funds. The Funds are distributed by Wells Fargo Funds Distributor, LLC, Member FINRA/SIPC, an affiliate of Wells Fargo & Company.
“Dow Jones®” and “Dow Jones Target Date IndexesSM” are service marks of Dow Jones Trademark Holdings, LLC (“Dow Jones”), have been licensed to CME Group Index Services LLC (“CME Indexes”) and have been sublicensed for use for certain purposes by Global Index Advisors, Inc, and Wells Fargo Funds Management, LLC. The Wells Fargo Advantage Dow Jones Target Date FundsSM based on the Dow Jones Target Date IndexesSM, are not sponsored, endorsed, sold or promoted by Dow Jones, CME Indexes or their respective affiliates and none of them makes any representation regarding the advisability of investing in such product(s).
NOT FDIC INSURED ¡ NO BANK GUARANTEE ¡ MAY LOSE VALUE
Not part of the annual report.
Wells Fargo Advantage Funds offers more than 110 mutual funds across a wide range of asset classes, representing over $216 billion in assets under management, as of December 31, 2011.
| | | | |
| Equity Funds | | | | |
Asia Pacific Fund | | Global Opportunities Fund | | Premier Large Company Growth Fund |
C&B Large Cap Value Fund | | Growth Fund | | Small Cap Opportunities Fund |
C&B Mid Cap Value Fund | | Health Care Fund | | Small Cap Value Fund |
Capital Growth Fund | | Index Fund | | Small Company Growth Fund |
Common Stock Fund | | International Equity Fund | | Small Company Value Fund |
Disciplined U.S. Core Fund | | International Value Fund | | Small/Mid Cap Core Fund |
Discovery Fund† | | Intrinsic Small Cap Value Fund | | Small/Mid Cap Value Fund |
Diversified Equity Fund | | Intrinsic Value Fund | | Social Sustainability Fund† |
Diversified International Fund | | Intrinsic World Equity Fund | | Special Mid Cap Value Fund |
Diversified Small Cap Fund | | Large Cap Core Fund | | Special Small Cap Value Fund |
Emerging Growth Fund | | Large Cap Growth Fund | | Specialized Technology Fund |
Emerging Markets Equity Fund | | Large Company Value Fund | | Strategic Large Cap Growth Fund |
Endeavor Select Fund† | | Omega Growth Fund | | Traditional Small Cap Growth Fund |
Enterprise Fund† | | Opportunity Fund† | | Utility and Telecommunications Fund |
Equity Value Fund | | Precious Metals Fund | | |
| Bond Funds | | | | |
Adjustable Rate Government Fund | | Inflation-Protected Bond Fund | | Short-Term Bond Fund |
California Limited-Term Tax-Free Fund | | Intermediate Tax/AMT-Free Fund | | Short-Term High Yield Bond Fund |
California Tax-Free Fund | | International Bond Fund | | Short-Term Municipal Bond Fund |
Colorado Tax-Free Fund | | Minnesota Tax-Free Fund | | Strategic Municipal Bond Fund |
Government Securities Fund | | Municipal Bond Fund | | Total Return Bond Fund |
High Income Fund | | North Carolina Tax-Free Fund | | Ultra Short-Term Income Fund |
High Yield Bond Fund | | Pennsylvania Tax-Free Fund | | Ultra Short-Term Municipal Income Fund |
Income Plus Fund | | Short Duration Government Bond Fund | | Wisconsin Tax-Free Fund |
| Asset Allocation Funds | | | | |
Asset Allocation Fund | | WealthBuilder Equity Portfolio† | | Target 2020 Fund† |
Conservative Allocation Fund | | WealthBuilder Growth Allocation Portfolio† | | Target 2025 Fund† |
Diversified Capital Builder Fund | | WealthBuilder Growth Balanced Portfolio† | | Target 2030 Fund† |
Diversified Income Builder Fund | | WealthBuilder Moderate Balanced Portfolio† | | Target 2035 Fund† |
Growth Balanced Fund | | WealthBuilder Tactical Equity Portfolio† | | Target 2040 Fund† |
Index Asset Allocation Fund | | Target Today Fund† | | Target 2045 Fund† |
Moderate Balanced Fund | | Target 2010 Fund† | | Target 2050 Fund† |
WealthBuilder Conservative Allocation Portfolio† | | Target 2015 Fund† | | Target 2055 Fund† |
| Money Market Funds | | | | |
100% Treasury Money Market Fund | | Heritage Money Market Fund† | | National Tax-Free Money Market Fund |
California Municipal Money Market Fund | | Money Market Fund | | Prime Investment Money Market Fund |
Cash Investment Money Market Fund | | Municipal Cash Management Money Market Fund | | Treasury Plus Money Market Fund |
Government Money Market Fund | | Municipal Money Market Fund | | |
| Variable Trust Funds1 | | | | |
VT Discovery Fund† | | VT Intrinsic Value Fund | | VT Small Cap Growth Fund |
VT Index Asset Allocation Fund | | VT Omega Growth Fund | | VT Small Cap Value Fund |
VT International Equity Fund | | VT Opportunity Fund† | | VT Total Return Bond Fund |
An investment in a money market fund is not insured or guaranteed by the Federal Deposit Insurance Corporation or any other government agency. Although the Wells Fargo Advantage Money Market Funds seek to preserve the value of your investment at $1.00 per share, it is possible to lose money by investing in a money market fund.
| 1. | The Variable Trust Funds are generally available only through insurance company variable contracts. |
| † | In this report, the Wells Fargo Advantage Discovery FundSM, Wells Fargo Advantage Endeavor Select FundSM, Wells Fargo Advantage Enterprise FundSM, Wells Fargo Advantage Opportunity FundSM, Wells Fargo Advantage Social Sustainability FundSM, Wells Fargo Advantage WealthBuilder Conservative Allocation PortfolioSM, Wells Fargo Advantage WealthBuilder Equity PortfolioSM, Wells Fargo Advantage WealthBuilder Growth Allocation PortfolioSM, Wells Fargo Advantage WealthBuilder Growth Balanced PortfolioSM, Wells Fargo Advantage WealthBuilder Moderate Balanced PortfolioSM, Wells Fargo Advantage WealthBuilder Tactical Equity PortfolioSM, Wells Fargo Advantage Dow Jones Target Today FundSM, Wells Fargo Advantage Dow Jones Target 2010 FundSM, Wells Fargo Advantage Dow Jones Target 2015 FundSM, Wells Fargo Advantage Dow Jones Target 2020 FundSM, Wells Fargo Advantage Dow Jones Target 2025 FundSM, Wells Fargo Advantage Dow Jones Target 2030 FundSM, Wells Fargo Advantage Dow Jones Target 2035 FundSM, Wells Fargo Advantage Dow Jones Target 2040 FundSM, Wells Fargo Advantage Dow Jones Target 2045 FundSM, Wells Fargo Advantage Dow Jones Target 2050 FundSM, Wells Fargo Advantage Dow Jones Target 2055 FundSM, Wells Fargo Advantage Heritage Money Market FundSM, Wells Fargo Advantage VT Discovery FundSM, and Wells Fargo Advantage VT Opportunity FundSM are referred to as the Discovery Fund, Endeavor Select Fund, Enterprise Fund, Opportunity Fund, Social Sustainability Fund, WealthBuilder Conservative Allocation Portfolio, WealthBuilder Equity Portfolio, WealthBuilder Growth Allocation Portfolio, WealthBuilder Growth Balanced Portfolio, WealthBuilder Moderate Balanced Portfolio, WealthBuilder Tactical Equity Portfolio, Target Today Fund, Target 2010 Fund, Target 2015 Fund, Target 2020 Fund, Target 2025 Fund, Target 2030 Fund, Target 2035 Fund, Target 2040 Fund, Target 2045 Fund, Target 2050 Fund, Target 2055 Fund, Heritage Money Market Fund, VT Discovery Fund, and VT Opportunity Fund, respectively. |
Not part of the annual report.
| | | | |
| 2 | | Wells Fargo Advantage VT Opportunity Fund | | Letter to Shareholders |

Karla M. Rabusch,
President
Wells Fargo Advantage Funds
The U.S. economic recovery that began in mid-2009 progressed throughout the 12-month period, yet the rate of growth remained subpar compared with most previous recovery cycles.
Dear Valued Shareholder:
We’re pleased to offer you this annual report for the Wells Fargo Advantage VT Opportunity Fund for the 12-month period that ended December 31, 2011.
For the full 12-month period, most of the major domestic equity indexes posted either modest gains or relatively mild losses. However, the market’s 12-month return figures mask the uneven path that it traced throughout the year as investors had to contend with a variety of global and domestic headwinds. Whatever the future holds, we continue to believe that most investors can benefit from adhering to a well-diversified investment strategy. Over the long-term, such a strategy may allow you to balance risks and opportunities as you pursue your financial goals in a dynamic market landscape.
The economic recovery gained traction as the year progressed.
The U.S. economic recovery that began in mid-2009 progressed throughout the 12-month period, yet the rate of growth remained subpar compared with most previous recovery cycles.
2011 opened on a note of mounting optimism regarding the strength of the recovery, yet a batch of disappointing economic data in the spring and summer cast renewed doubts on the sustainability of the recovery. In September, it was reported that U.S. gross domestic product (GDP) grew at a mere 1.3% annual rate in the second quarter of 2011, following anemic growth at an annual rate of 0.4% in the first quarter. According to the December estimate, GDP growth accelerated to an annual rate of 1.8% in the third quarter, reigniting hopes for a sustainable recovery. Those hopes were buoyed by widespread anticipation of even stronger GDP growth in the fourth quarter. By the end of the 12-month period, few economists believed that the U.S. economy was in danger of sliding back into recession, although many expected a sluggish growth environment in 2012.
The struggling housing and labor markets slowed growth.
As has been the case throughout the recovery, the housing and labor markets continued to restrain economic momentum during 2011.
The beleaguered housing market has arguably exerted the biggest drag on growth. Despite intermittent signs of improvement, ongoing weakness in sales of both new and existing homes has put considerable downward pressure on prices. On the other hand, the labor market took a decided turn for the better in the latter half of the year: initial unemployment claims have eased in recent months, and the private sector has been steadily adding jobs. The pace of hiring, while not brisk, was sufficient to push the U.S. unemployment rate down to 8.5% as of December 2011—still well above its historical average, but at its lowest level since February 2009. Many observers expect the unemployment rate to decline further in 2012, which could act as a tailwind for consumer spending—widely viewed as one of the keys to long-term economic growth.
The Federal Reserve announced that it will keep rates low until 2013.
Consumers have already demonstrated some resilience in their spending—even in the face of higher energy costs. Oil prices skyrocketed in early 2011 before retreating later in the year, only to spike again during the fourth quarter. Yet “core” inflation, which excludes volatile energy and food prices, remained fairly benign throughout the year.
| | | | | | |
| Letter to Shareholders | | Wells Fargo Advantage VT Opportunity Fund | | | 3 | |
With inflation in check, the Federal Reserve (Fed) held its target range for the federal funds rate—a proxy for short-term interest rates—steady at 0% to 0.25%. Following its August 9 meeting, the Federal Open Market Committee (FOMC) issued a statement explaining that economic conditions were likely to warrant exceptionally low levels for the federal funds rate through at least mid-2013. In addition, the Fed carried out its second round of quantitative easing (QE2) in an effort to promote a more robust economic expansion. The stimulus program was completed as scheduled in June 2011. In September, the Fed launched yet another stimulus program—dubbed “Operation Twist”—that is designed to keep intermediate- and longer-term yields relatively low. The goal with keeping longer-term rates low is to encourage lending activity to spark business investments and home purchases, which, in turn, may provide support for a more sustainable economic recovery.
Market volatility was a dominant theme throughout most of 2011.
Despite pockets of turbulence sparked by the natural disasters in Japan and geopolitical turmoil in North Africa and the Middle East, the U.S. equity market performed very well from January through April of 2011. Some upbeat economic news, better-than-expected corporate profits, and investor enthusiasm about QE2 were among the catalysts for the market’s four-month advance.
In May and June, the market climate shifted to one of anxiety over the increasingly fragile state of the U.S. and global economies. As spring gave way to summer, investors not only worried that the U.S. might be on the brink of recession, they also feared that Europe’s sovereign debt problems could spiral out of control if a Greek default triggered financial contagion across the continent. In July and August, investor sentiment was further undermined by partisan wrangling over the federal debt ceiling and the Standard & Poor’s downgrade of the U.S. credit rating. The barrage of unsettling headlines led to heightened market volatility and sharply falling stock prices in the third quarter of 2011. Although volatility persisted into the fourth quarter, the market was able to rebound amid improved economic data and hopes for a resolution to the European crisis.
For the full 12-month period, the S&P 500 Index1 of large-cap stocks achieved a total return of 2.1%. The Russell Midcap® Index2 and the Russell 2000® Index3 of small-cap stocks lost 1.6% and 4.2%, respectively. International stocks fared worse than their U.S. counterparts, with the MSCI EAFE Index4 shedding 14.8%.
| 1. | The S&P 500 Index consists of 500 stocks chosen for market size, liquidity, and industry group representation. It is a market-value weighted index with each stock’s weight in the index proportionate to its market value. You cannot invest directly in an index. |
| 2. | The Russell Midcap® Index measures the performance of the 800 smallest companies in the Russell 1000 Index, which represent approximately 25% of the total market capitalization of the Russell 1000® Index. You cannot invest directly in an index. |
| 3. | The Russell 2000® Index measures the performance of the 2,000 smallest companies in the Russell 3000® Index, which represents approximately 8% of the total market capitalization of the Russell 3000 Index. You cannot invest directly in an index. |
| 4. | The Morgan Stanley Capital International Europe, Australasia, and Far East (“MSCI EAFE”) Stock Index is an unmanaged group of securities widely regarded by investors to be representations of the stock markets of Europe, Australasia, and the Far East. You cannot invest directly in an index. Source: MSCI. MSCI makes no express or implied warranties or representations and shall have no liability whatsoever with respect to any MSCI data contained herein. The MSCI data may not be further redistributed or used as a basis for other indexes or any securities or financial products. This report is not approved, reviewed or produced by MSCI. |
| | | | |
| 4 | | Wells Fargo Advantage VT Opportunity Fund | | Letter to Shareholders |
The market turmoil of 2011 and an uncertain outlook going forward have left many investors questioning their resolve—and their investments. Yet, it is precisely at such times that the market may present opportunities—as well as challenges—for prudent investors.
Recent events have not altered our message to shareholders.
The market turmoil of 2011 and an uncertain outlook going forward have left many investors questioning their resolve—and their investments. Yet, it is precisely at such times that the market may present opportunities—as well as challenges—for prudent investors. Bear in mind that many investors who indiscriminately sold their equity investments during the severe market downturn of 2008 to 2009 missed out on the impressive two-year rally that followed. In our opinion, the lesson to be learned from these dramatic market events is that, for many investors, simply building and maintaining a well-diversified5 investment plan is the best long-term strategy.
To help you create a sound strategy based on your personal goals and risk tolerance, Wells Fargo Advantage Funds offers more than 110 mutual funds and other investments spanning a broad range of asset classes and investment styles. While diversification cannot guarantee an investment profit or prevent losses, we believe it can be an effective way to manage investment risk and potentially smooth out overall portfolio performance.
Thank you for choosing to invest with Wells Fargo Advantage Funds. We appreciate your confidence in us and remain committed to helping you meet your financial needs. For current information about your fund investments, contact your investment professional, visit our website at www.wellsfargo.com/advantagefunds, or call us directly at 1-800-222-8222. We are available 24 hours a day, 7 days a week.
Sincerely,

Karla M. Rabusch
President
Wells Fargo Advantage Funds
| 5. | Diversification does not assure or guarantee better performance and cannot eliminate the risk of investment losses. |
| | | | | | |
| Performance Highlights (Unaudited) | | Wells Fargo Advantage VT Opportunity Fund | | | 5 | |
INVESTMENT OBJECTIVE
The Fund seeks long-term capital appreciation.
ADVISER
Wells Fargo Funds Management, LLC
SUB-ADVISER
Wells Capital Management Incorporated
PORTFOLIO MANAGERS
Ann M. Miletti
Thomas D. Wooden, CFA
FUND INCEPTION
May 8, 1992
| | | | |
| 12 MONTH TOTAL RETURN AS OF DECEMBER 31, 2011 | |
Class 2 | | | (5.52)% | |
Russell Midcap® Index1 | | | (1.55)% | |
Figures quoted represent past performance, which is no guarantee of future results and do not reflect the deduction of taxes that a shareholder may pay on fund distributions or the redemption of fund shares. Investment return and principal value of an investment will fluctuate so that an investor’s shares, when redeemed, may be worth more or less than their original cost. Current performance may be lower or higher than the performance data quoted and assumes the reinvestment of dividends and capital gains. Current month-end performance is available by calling 1-866-765-0778. Performance figures of the Fund do not reflect fees charged pursuant to the terms of variable life insurance policies and variable annuity contracts.
Index returns do not include transaction costs associated with buying and selling securities, any mutual fund fees or expenses or any taxes. It is not possible to invest directly in an index.
The Adviser has committed through July 18, 2013 to waive fees and/or reimburse expenses to the extent necessary to cap the Fund’s Total Annual Fund Operating Expenses After Fee Waiver, excluding certain other expenses at 1.00% for Class 2. The Fund’s gross and net expense ratios are 1.12% and 1.01%, respectively, for Class 2 shares. Without these reductions, the Fund’s returns would have been lower.
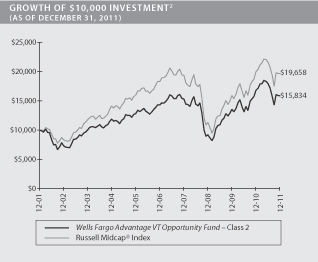
| 1. | The Russell Midcap® Index measures the performance of the 800 smallest companies in the Russell 1000® Index, which represent approximately 25% of the total market capitalization of the Russell 1000 Index. You cannot invest directly in an index. |
| 2. | The chart compares the performance of the Wells Fargo Advantage VT Opportunity Fund Class 2 for the most recent ten years of the Fund with the Russell Midcap Index. The chart assumes a hypothetical $10,000 investment and reflects all operating expenses of the Fund. Performance figures of the Fund do not reflect fees charged pursuant to the terms of variable life insurance policies and variable annuity contracts. |
| | | | |
| 6 | | Wells Fargo Advantage VT Opportunity Fund | | Performance Highlights (Unaudited) |
MANAGER’S DISCUSSION
Fund highlights
| n | | The Fund underperformed its benchmark, the Russell Midcap® Index, for the 12-month period that ended December 31, 2011. |
| n | | Holdings in the consumer discretionary, industrials, and health care sectors detracted from relative returns, more than offsetting positive stock selection in the information technology (IT) and financials sectors. A lack of exposure to utilities—which typically do not have much in the way of growth potential but do well in defensive markets—also hindered relative results. |
| n | | Economic concerns fostered stock market volatility, particularly in cyclical areas of the market. Nevertheless, our process remained disciplined. We continued to look for well-positioned businesses with solid business models, strong management teams, and favorable trends that trade at attractive discounts to our estimated private market value (PMV). |
| | | | |
TEN LARGEST EQUITY HOLDINGS3
(AS OF DECEMBER 31, 2011) | |
Praxair Incorporated | | | 1.89% | |
Global Payments Incorporated | | | 1.67% | |
Kroger Company | | | 1.67% | |
Branch Banking & Trust Corporation | | | 1.66% | |
Apollo Group Incorporated Class A | | | 1.65% | |
National Oilwell Varco Incorporated | | | 1.65% | |
Fifth Third Bancorp | | | 1.61% | |
Kohl’s Corporation | | | 1.60% | |
Equinix Incorporated | | | 1.59% | |
RenaissanceRe Holdings Limited | | | 1.59% | |
Stock selection and sector weights both contributed to the Fund’s investment results.
The IT sector was again the top contributor to relative performance during the 12-month period. Positive stock selection—especially in areas related to the continuing move toward digital mobility, storage, and cloud computing—aided results. Additionally, key holdings in companies that focus on data processing added value, including MasterCard Incorporated and Alliance Data Systems Incorporated. Both companies benefited from increased usage of credit and debit payments in lieu of cash.
In the industrials sector, broad-based fears of another recession in the U.S. depressed the performance of a number of industrials holdings, though renewed economic optimism did help the group later in the year. Overall stock selection in the group detracted from results, with Hertz Global Holdings Incorporated among the detractors. We continue to like Hertz; Hertz rents equipment for new construction and benefits from a trend toward renting versus owning equipment, as many firms liquidated their equipment inventories during the last economic downturn and are not yet ready to commit long-term capital for repurchases.
The Fund’s consumer discretionary holdings detracted from overall results, with mixed performance in the retail group. Retailers targeting higher-end consumers fared relatively well. Partly as a result, Fund holding Nordstrom Incorporated gained nearly 19% for the year. However, other retailers with more exposure to middle-income buyers, including holdings in Kohl’s Corporation and Target Corporation, posted losses as economic concerns stunted consumer spending. Similarly, office supply retailer Staples Incorporated posted weak revenue growth because of fierce competition and customers’ budgetary cutbacks. As a result, we sold the position in November 2011.
| 3. | The ten largest equity holdings are calculated based on the value of the securities divided by total net assets of the Fund. Holdings are subject to change and may have changed since the date specified. |
| | | | | | |
| Performance Highlights (Unaudited) | | Wells Fargo Advantage VT Opportunity Fund | | | 7 | |
| | |
SECTOR DISTRIBUTION4
(AS OF DECEMBER 31, 2011) |
|
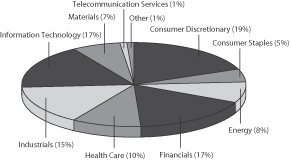 |
Our methodology of buying stocks that are selling at a discount to their PMVs and selling stocks that approach their PMVs continues.
Our discipline allows us to be patient with stocks that are out of favor with the market. When we entered 2011, we believed that we would see a slow-growth economic environment, with growth in gross domestic product (GDP) in the range of 0%–2%. That scenario largely came to pass, and, in fact, GDP forecasts for the full year are probably better than we would have expected at the beginning of the year. If someone had told us that GDP in the U.S. would be near 2% and that many companies
would report double-digit earnings growth in 2011, we would not have anticipated the extreme market movements that we saw during the year. It seemed that the market was driven less by fundamentals and more by macroeconomic news and fears of what would happen if a country such as Greece or Italy were to default on its sovereign debt.
Uncertainty remains, but opportunities remain as well.
Looking ahead, we remain cautiously optimistic. Based on our 2012 assessment of PMVs for the companies we own, the Fund appears attractively valued with an approximate 34% undervaluation. This number doesn’t mean that we expect the portfolio to appreciate by 34% in a year, because each individual company is at a different stage in its cycle and it can take years for a stock to reach full valuation. However, we do think this level of undervaluation suggests that our portfolio has solid potential for future appreciation.
At the same time, remaining market headwinds will likely create some investor uneasiness in the near term as we face the need for European sovereign debt refinancing, probable additional downgrades by rating agencies, and even political bickering in the U.S. and abroad. We believe that stocks are attractively valued, and if earnings results remain positive, at some point the market should reward growth through higher stock prices. Most of the Fund’s holdings have attractive balance sheets, have posted solid earnings, are flush with cash, and have improved their cost structures. We acknowledge that it will probably take a bit more confidence and visibility before investors react positively to those factors.
| 4. | Sector distribution is subject to change and is calculated based on the total long-term investments of the Fund. |
| | | | |
| 8 | | Wells Fargo Advantage VT Opportunity Fund | | Performance Highlights (Unaudited) |
AVERAGE ANNUAL TOTAL RETURN5 (%) (AS OF DECEMBER 31, 2011)
| | | | | | | | | | | | | | | | | | | | | | | | | | | | |
| | | | | | | | | | | | | | | | | | Expense Ratios6 | |
| | | Inception Date | | | 6 Months* | | | 1 Year | | | 5 Year | | | 10 Year | | | Gross | | | Net7 | |
Class 1 | | | 08/26/2011 | | | | (11.69 | ) | | | (5.41 | ) | | | 2.01 | | | | 4.72 | | | | 0.87% | | | | 0.76% | |
Class 2 | | | 05/08/1992 | | | | (11.79 | ) | | | (5.52 | ) | | | 1.99 | | | | 4.70 | | | | 1.12% | | | | 1.01% | |
Russell Midcap® Index | | | | | | | (8.91 | ) | | | (1.55 | ) | | | 1.41 | | | | 6.99 | | | | | | | | | |
| * | Returns for periods of less than one year are not annualized. |
Figures quoted represent past performance, which is no guarantee of future results and do not reflect the deduction of taxes that a shareholder may pay on fund distributions or the redemption of fund shares. Investment return and principal value of an investment will fluctuate so that an investor’s shares, when redeemed, may be worth more or less than their original cost. Current performance may be lower or higher than the performance data quoted and assumes the reinvestment of dividends and capital gains. Current month-end performance is available by calling 1-866-765-0778. Performance figures of the Fund do not reflect fees charged pursuant to the terms of variable life insurance policies and variable annuity contracts.
Index returns do not include transaction costs associated with buying and selling securities, any mutual fund fees or expenses or any taxes. It is not possible to invest directly in an index.
Stock fund values fluctuate in response to the activities of individual companies and general market and economic conditions. Smaller company stocks tend to be more volatile and less liquid than those of larger companies. The use of derivatives may reduce returns and/or increase volatility. Certain investment strategies tend to increase the total risk of an investment (relative to the broader market). This Fund is exposed to foreign investment risk. Consult the Fund’s prospectus for additional information on these and other risks.
Please refer to the prospectus provided by your participating insurance company for detailed information describing the separate accounts for information regarding surrender charges, mortality and expense risk fees and other charges that may be assessed by the participating insurance companies.
| 5. | Historical performance shown for Class 1 shares prior to their inception reflects the performance of Class 2 shares, and includes the higher expenses applicable to Class 2 shares. If these expenses had not been included, returns would be higher. |
| 6. | Reflects the expense ratios as stated in the most recent prospectuses. |
| 7. | The Adviser has committed through July 18, 2013 to waive fees and/or reimburse expenses to the extent necessary to cap the Fund’s Total Annual Fund Operating Expenses After Fee Waiver, excluding certain expenses, at 0.75% for Class 1 and 1.00% for Class 2 shares. Without this cap, the Fund’s returns would have been lower. |
| | | | | | |
| Fund Expenses (Unaudited) | | Wells Fargo Advantage VT Opportunity Fund | | | 9 | |
As a shareholder of the Fund, you incur ongoing costs, including management fees; distribution (12b-1) fees; and other Fund expenses. This example is intended to help you understand your ongoing costs (in dollars) of investing in the Fund and to compare these costs with the ongoing costs of investing in other mutual funds.
The example is based on an investment of $1,000 invested at the beginning of the six-month period and held for the entire period from July 1, 2011 to December 31, 2011.
Actual Expenses
The “Actual” line of the table below provides information about actual account values and actual expenses. You may use the information in this line, together with the amount you invested, to estimate the expenses that you paid over the period. Simply divide your account value by $1,000 (for example, an $8,600 account value divided by $1,000 = 8.6), then multiply the result by the number in the “Actual” line under the heading entitled “Expenses Paid During Period” for your applicable class of shares to estimate the expenses you paid on your account during this period.
Hypothetical Example for Comparison Purposes
The “Hypothetical” line of the table below provides information about hypothetical account values and hypothetical expenses based on the Fund’s actual expense ratio and an assumed rate of return of 5% per year before expenses, which is not the Fund’s actual return. The hypothetical account values and expenses may not be used to estimate the actual ending account balance or expenses you paid for the period. You may use this information to compare the ongoing costs of investing in the Fund and other funds. To do so, compare this 5% hypothetical example with the 5% hypothetical examples that appear in the shareholder reports of the other funds.
Please note that the expenses shown in the table are meant to highlight your ongoing costs only and do not reflect any separate account charges assessed by participating insurance companies. Therefore, the “Hypothetical” line of the table is useful in comparing ongoing costs only, and will not help you determine the relative total costs of owning different funds. In addition, if these separate account charges assessed by participating insurance companies were included, your costs would have been higher.
| | | | | | | | | | | | | | | | |
| | | Beginning
Account Value
07-01-2011 | | | Ending
Account Value
12-31-2011 | | | Expenses
Paid During
the Period¹ | | | Net Annual
Expense Ratio | |
Class 1 | | | | | | | | | | | | | | | | |
Actual | | $ | 1,000.00 | | | $ | 883.10 | | | $ | 3.56 | | | | 0.75 | % |
Hypothetical (5% return before expenses) | | $ | 1,000.00 | | | $ | 1,021.42 | | | $ | 3.82 | | | | 0.75 | % |
Class 2 | | | | | | | | | | | | | | | | |
Actual | | $ | 1,000.00 | | | $ | 882.08 | | | $ | 4.84 | | | | 1.02 | % |
Hypothetical (5% return before expenses) | | $ | 1,000.00 | | | $ | 1,020.06 | | | $ | 5.19 | | | | 1.02 | % |
| 1. | Expenses paid is equal to the annualized expense ratio of each class multiplied by the average account value over the period, multiplied by the number of days in the most recent fiscal half-year divided by the number of days in the fiscal year (to reflect the one-half year period). |
| | | | |
| 10 | | Wells Fargo Advantage VT Opportunity Fund | | Portfolio of Investments—December 31, 2011 |
| | | | | | | | | | | | |
| Security Name | | | | | | Shares | | | Value | |
| | | | | | | | | | | | |
| | | | |
Common Stocks: 97.78% | | | | | | | | | | | | |
| | | | |
Consumer Discretionary: 18.87% | | | | | | | | | | | | |
| | | | |
| Auto Components: 1.31% | | | | | | | | | | | | |
Johnson Controls Incorporated | | | | | | | 102,249 | | | $ | 3,196,304 | |
| | | | | | | | | | | | |
| | | | |
| Diversified Consumer Services: 1.65% | | | | | | | | | | | | |
Apollo Group Incorporated Class A†« | | | | | | | 74,798 | | | | 4,029,368 | |
| | | | | | | | | | | | |
| | | | |
| Hotels, Restaurants & Leisure: 1.27% | | | | | | | | | | | | |
Carnival Corporation | | | | | | | 94,788 | | | | 3,093,880 | |
| | | | | | | | | | | | |
| | | | |
| Household Durables: 1.50% | | | | | | | | | | | | |
Tempur-Pedic International Incorporated† | | | | | | | 16,619 | | | | 872,996 | |
Whirlpool Corporation« | | | | | | | 58,915 | | | | 2,795,517 | |
| | | | |
| | | | | | | | | | | 3,668,513 | |
| | | | | | | | | | | | |
| | | | |
| Internet & Catalog Retail: 1.29% | | | | | | | | | | | | |
Liberty Interactive Corporation Series A† | | | | | | | 193,390 | | | | 3,135,819 | |
| | | | | | | | | | | | |
| | | | |
| Media: 6.19% | | | | | | | | | | | | |
Cablevision Systems Corporation New York Group Class A | | | | | | | 177,319 | | | | 2,521,476 | |
Comcast Corporation Class A | | | | | | | 148,877 | | | | 3,507,542 | |
Discovery Communications Incorporated† | | | | | | | 73,405 | | | | 2,767,369 | |
Liberty Global Incorporated Class A† | | | | | | | 64,618 | | | | 2,651,277 | |
Omnicom Group Incorporated« | | | | | | | 81,475 | | | | 3,632,156 | |
| | | | |
| | | | | | | | | | | 15,079,820 | |
| | | | | | | | | | | | |
| | | | |
| Multiline Retail: 4.55% | | | | | | | | | | | | |
Kohl’s Corporation« | | | | | | | 78,790 | | | | 3,888,287 | |
Nordstrom Incorporated | | | | | | | 70,305 | | | | 3,494,862 | |
Target Corporation | | | | | | | 72,291 | | | | 3,702,745 | |
| | | | |
| | | | | | | | | | | 11,085,894 | |
| | | | | | | | | | | | |
| | | | |
| Specialty Retail: 1.11% | | | | | | | | | | | | |
Best Buy Company Incorporated« | | | | | | | 115,315 | | | | 2,694,912 | |
| | | | | | | | | | | | |
| | | | |
Consumer Staples: 4.50% | | | | | | | | | | | | |
| | | | |
| Food & Staples Retailing: 1.67% | | | | | | | | | | | | |
Kroger Company | | | | | | | 167,739 | | | | 4,062,639 | |
| | | | | | | | | | | | |
| | | | |
| Food Products: 1.36% | | | | | | | | | | | | |
General Mills Incorporated | | | | | | | 82,164 | | | | 3,320,247 | |
| | | | | | | | | | | | |
| | | | |
| Household Products: 1.47% | | | | | | | | | | | | |
Church & Dwight Company Incorporated | | | | | | | 78,151 | | | | 3,576,190 | |
| | | | | | | | | | | | |
| | | | |
Energy: 7.62% | | | | | | | | | | | | |
| | | | |
| Energy Equipment & Services: 3.64% | | | | | | | | | | | | |
McDermott International Incorporated† | | | | | | | 174,490 | | | | 2,008,380 | |
National Oilwell Varco Incorporated | | | | | | | 59,072 | | | | 4,016,305 | |
Weatherford International Limited† | | | | | | | 194,511 | | | | 2,847,641 | |
| | | | |
| | | | | | | | | | | 8,872,326 | |
| | | | | | | | | | | | |
| | | | | | |
| Portfolio of Investments—December 31, 2011 | | Wells Fargo Advantage VT Opportunity Fund | | | 11 | |
| | | | | | | | | | | | |
| Security Name | | | | | | Shares | | | Value | |
| | | | | | | | | | | | |
| | | | |
| Oil, Gas & Consumable Fuels: 3.98% | | | | | | | | | | | | |
Apache Corporation | | | | | | | 25,605 | | | $ | 2,319,301 | |
Newfield Exploration Company† | | | | | | | 82,121 | | | | 3,098,425 | |
Peabody Energy Corporation« | | | | | | | 51,103 | | | | 1,692,020 | |
Southwestern Energy Company† | | | | | | | 80,921 | | | | 2,584,617 | |
| | | | |
| | | | | | | | | | | 9,694,363 | |
| | | | | | | | | | | | |
| | | | |
Financials: 17.00% | | | | | | | | | | | | |
| | | | |
| Capital Markets: 2.71% | | | | | | | | | | | | |
Invesco Limited | | | | | | | 161,282 | | | | 3,240,155 | |
TD Ameritrade Holding Corporation | | | | | | | 215,602 | | | | 3,374,171 | |
| | | | |
| | | | | | | | | | | 6,614,326 | |
| | | | | | | | | | | | |
| | | | |
| Commercial Banks: 4.51% | | | | | | | | | | | | |
Branch Banking & Trust Corporation« | | | | | | | 160,830 | | | | 4,048,091 | |
City National Corporation« | | | | | | | 68,328 | | | | 3,018,731 | |
Fifth Third Bancorp | | | | | | | 308,782 | | | | 3,927,707 | |
| | | | |
| | | | | | | | | | | 10,994,529 | |
| | | | | | | | | | | | |
| | | | |
| Consumer Finance: 1.40% | | | | | | | | | | | | |
MasterCard Incorporated | | | | | | | 9,142 | | | | 3,408,320 | |
| | | | | | | | | | | | |
| | | | |
| Diversified Financial Services: 0.76% | | | | | | | | | | | | |
InterContinental Exchange Incorporated† | | | | | | | 15,290 | | | | 1,843,210 | |
| | | | | | | | | | | | |
| | | | |
| Insurance: 5.42% | | | | | | | | | | | | |
ACE Limited | | | | | | | 49,025 | | | | 3,437,633 | |
Reinsurance Group of America Incorporated | | | | | | | 59,919 | | | | 3,130,768 | |
RenaissanceRe Holdings Limited« | | | | | | | 52,098 | | | | 3,874,528 | |
Willis Group Holdings plc | | | | | | | 71,002 | | | | 2,754,878 | |
| | | | |
| | | | | | | | | | | 13,197,807 | |
| | | | | | | | | | | | |
| | | | |
| REIT: 2.20% | | | | | | | | | | | | |
BioMed Realty Trust Incorporated« | | | | | | | 177,320 | | | | 3,205,946 | |
LaSalle Hotel Properties | | | | | | | 89,315 | | | | 2,162,316 | |
| | | | |
| | | | | | | | | | | 5,368,262 | |
| | | | | | | | | | | | |
| | | | |
Health Care: 10.24% | | | | | | | | | | | | |
| | | | |
| Health Care Equipment & Supplies: 3.90% | | | | | | | | | | | | |
C.R. Bard Incorporated | | | | | | | 33,864 | | | | 2,895,372 | |
Covidien plc | | | | | | | 78,627 | | | | 3,539,001 | |
Zimmer Holdings Incorporated« | | | | | | | 57,647 | | | | 3,079,503 | |
| | | | |
| | | | | | | | | | | 9,513,876 | |
| | | | | | | | | | | | |
| | | | |
| Health Care Providers & Services: 2.44% | | | | | | | | | | | | |
Health Management Associates Incorporated Class A† | | | | | | | 424,223 | | | | 3,126,524 | |
McKesson Corporation | | | | | | | 36,163 | | | | 2,817,459 | |
| | | | |
| | | | | | | | | | | 5,943,983 | |
| | | | | | | | | | | | |
| | | | |
| 12 | | Wells Fargo Advantage VT Opportunity Fund | | Portfolio of Investments—December 31, 2011 |
| | | | | | | | | | | | |
| Security Name | | | | | | Shares | | | Value | |
| | | | | | | | | | | | |
| | | | |
| Life Sciences Tools & Services: 3.90% | | | | | | | | | | | | |
Covance Incorporated† | | | | | | | 71,424 | | | $ | 3,265,505 | |
Thermo Fisher Scientific Incorporated† | | | | | | | 71,808 | | | | 3,229,206 | |
Waters Corporation†« | | | | | | | 40,522 | | | | 3,000,654 | |
| | | | |
| | | | | | | | | | | 9,495,365 | |
| | | | | | | | | | | | |
| | | | |
Industrials: 14.95% | | | | | | | | | | | | |
| | | | |
| Airlines: 1.94% | | | | | | | | | | | | |
Delta Air Lines Incorporated† | | | | | | | 387,484 | | | | 3,134,746 | |
United Continental Holdings Incorporated†« | | | | | | | 84,721 | | | | 1,598,685 | |
| | | | |
| | | | | | | | | | | 4,733,431 | |
| | | | | | | | | | | | |
| | | | |
| Commercial Services & Supplies: 1.47% | | | | | | | | | | | | |
Republic Services Incorporated | | | | | | | 130,196 | | | | 3,586,900 | |
| | | | | | | | | | | | |
| | | | |
| Construction & Engineering: 0.84% | | | | | | | | | | | | |
Quanta Services Incorporated†« | | | | | | | 94,997 | | | | 2,046,235 | |
| | | | | | | | | | | | |
| | | | |
| Electrical Equipment: 4.18% | | | | | | | | | | | | |
AMETEK Incorporated | | | | | | | 74,972 | | | | 3,156,321 | |
Babcock & Wilcox Company† | | | | | | | 118,429 | | | | 2,858,876 | |
Regal-Beloit Corporation | | | | | | | 37,288 | | | | 1,900,569 | |
Rockwell Automation Incorporated | | | | | | | 30,943 | | | | 2,270,288 | |
| | | | |
| | | | | | | | | | | 10,186,054 | |
| | | | | | | | | | | | |
| | | | |
| Machinery: 2.70% | | | | | | | | | | | | |
Dover Corporation« | | | | | | | 57,837 | | | | 3,357,438 | |
Pall Corporation« | | | | | | | 56,270 | | | | 3,215,831 | |
| | | | |
| | | | | | | | | | | 6,573,269 | |
| | | | | | | | | | | | |
| | | | |
| Professional Services: 1.10% | | | | | | | | | | | | |
Manpower Incorporated | | | | | | | 74,555 | | | | 2,665,341 | |
| | | | | | | | | | | | |
| | | | |
| Road & Rail: 2.72% | | | | | | | | | | | | |
Hertz Global Holdings Incorporated†« | | | | | | | 313,573 | | | | 3,675,076 | |
J.B. Hunt Transport Services Incorporated« | | | | | | | 65,534 | | | | 2,953,617 | |
| | | | |
| | | | | | | | | | | 6,628,693 | |
| | | | | | | | | | | | |
| | | | |
Information Technology: 16.74% | | | | | | | | | | | | |
| | | | |
| Communications Equipment: 1.15% | | | | | | | | | | | | |
Polycom Incorporated† | | | | | | | 172,064 | | | | 2,804,643 | |
| | | | | | | | | | | | |
| | | | |
| Computers & Peripherals: 1.35% | | | | | | | | | | | | |
NetApp Incorporated†« | | | | | | | 91,045 | | | | 3,302,202 | |
| | | | | | | | | | | | |
| | | | |
| Electronic Equipment, Instruments & Components: 1.29% | | | | | | | | | | | | |
Amphenol Corporation Class A | | | | | | | 69,318 | | | | 3,146,344 | |
| | | | | | | | | | | | |
| | | | |
| Internet Software & Services: 1.59% | | | | | | | | | | | | |
Equinix Incorporated† | | | | | | | 38,137 | | | | 3,867,092 | |
| | | | | | | | | | | | |
| | | | | | |
| Portfolio of Investments—December 31, 2011 | | Wells Fargo Advantage VT Opportunity Fund | | | 13 | |
| | | | | | | | | | | | |
| Security Name | | | | | | Shares | | | Value | |
| | | | | | | | | | | | |
| | | | |
| IT Services: 3.90% | | | | | | | | | | | | |
Alliance Data Systems Corporation†« | | | | | | | 27,320 | | | $ | 2,836,909 | |
Cognizant Technology Solutions Corporation Class A† | | | | | | | 40,318 | | | | 2,592,851 | |
Global Payments Incorporated | | | | | | | 85,920 | | | | 4,070,890 | |
| | | | |
| | | | | | | | | | | 9,500,650 | |
| | | | | | | | | | | | |
| | | | |
| Semiconductors & Semiconductor Equipment: 5.06% | | | | | | | | | | | | |
Altera Corporation | | | | | | | 80,420 | | | | 2,983,582 | |
ARM Holdings plc | | | | | | | 330,325 | | | | 3,036,929 | |
Avago Technologies Limited | | | | | | | 102,873 | | | | 2,968,915 | |
ON Semiconductor Corporation† | | | | | | | 431,273 | | | | 3,329,428 | |
| | | | |
| | | | | | | | | | | 12,318,854 | |
| | | | | | | | | | | | |
| | | | |
| Software: 2.40% | | | | | | | | | | | | |
Autodesk Incorporated† | | | | | | | 101,415 | | | | 3,075,917 | |
Red Hat Incorporated† | | | | | | | 66,878 | | | | 2,761,393 | |
| | | | |
| | | | | | | | | | | 5,837,310 | |
| | | | | | | | | | | | |
| | | | |
Materials: 6.72% | | | | | | | | | | | | |
| | | | |
| Chemicals: 1.89% | | | | | | | | | | | | |
Praxair Incorporated | | | | | | | 42,991 | | | | 4,595,738 | |
| | | | | | | | | | | | |
| | | | |
| Containers & Packaging: 4.35% | | | | | | | | | | | | |
Bemis Company Incorporated« | | | | | | | 125,830 | | | | 3,784,966 | |
Crown Holdings Incorporated†« | | | | | | | 99,068 | | | | 3,326,703 | |
Owens-Illinois Incorporated† | | | | | | | 179,732 | | | | 3,483,206 | |
| | | | |
| | | | | | | | | | | 10,594,875 | |
| | | | | | | | | | | | |
| | | | |
| Metals & Mining: 0.48% | | | | | | | | | | | | |
Agnico-Eagle Mines Limited | | | | | | | 32,529 | | | | 1,181,453 | |
| | | | | | | | | | | | |
| | | | |
Telecommunication Services: 1.14% | | | | | | | | | | | | |
| | | | |
| Wireless Telecommunication Services: 1.14% | | | | | | | | | | | | |
American Tower Corporation Class A | | | | | | | 46,241 | | | | 2,774,919 | |
| | | | | | | | | | | | |
| | | | |
Total Common Stocks (Cost $226,811,384) | | | | | | | | | | | 238,233,956 | |
| | | | | | | | | | | | |
| | | | |
| | | | | | | Principal | | | | |
| | | | |
Other: 0.63% | | | | | | | | | | | | |
Gryphon Funding Limited, Pass-Through Entity(a)(i)(v) | | | | | | $ | 2,010,641 | | | | 562,980 | |
VFNC Corporation, Pass-Through Entity, 0.30%(a)(i)(v)±144A | | | | | | | 2,288,715 | | | | 984,147 | |
| | | | |
Total Other (Cost $739,701) | | | | | | | | | | | 1,547,127 | |
| | | | | | | | | | | | |
| | | | |
| 14 | | Wells Fargo Advantage VT Opportunity Fund | | Portfolio of Investments—December 31, 2011 |
| | | | | | | | | | | | | | |
| Security Name | | | | Yield | | | Shares | | | Value | |
| | | | | | | | | | | | | | |
| | | | |
Short-Term Investments: 22.08% | | | | | | | | | | | | | | |
| | | | |
| Investment Companies: 22.08% | | | | | | | | | | | | | | |
Wells Fargo Advantage Cash Investment Money Market Fund, Institutional Class(l)(u) | | | | | 0.04 | % | | | 4,870,568 | | | $ | 4,870,568 | |
Wells Fargo Securities Lending Cash Investments, LLC(v)(l)(u)(r) | | | | | 0.12 | | | | 48,927,267 | | | | 48,927,267 | |
| | | | |
Total Short-Term Investments (Cost $53,797,835) | | | | | | | | | | | | | 53,797,835 | |
| | | | | | | | | | | | | | |
| | | | | | | | |
Total Investments in Securities
(Cost $281,348,920)* | | | 120.49 | % | | | 293,578,918 | |
Other Assets and Liabilities, Net | | | (20.49 | ) | | | (49,927,195 | ) |
| | | | | | | | |
| Total Net Assets | | | 100.00 | % | | $ | 243,651,723 | |
| | | | | | | | |
| † | Non-income earning security. |
| « | All or a portion of this security is on loan. |
| (a) | Security is fair valued by the Management Valuation Team, and in certain instances by the Board of Trustees, in accordance with procedures approved by the Board of Trustees. |
| (i) | Illiquid security for which the designation as illiquid is unaudited. |
| (v) | Security represents investment of cash collateral received from securities on loan. |
| ± | Variable rate investment. |
| 144A | Security that may be resold to “qualified institutional buyers” under Rule 144A or security offered pursuant to Section 4(2) of the Securities Act of 1933, as amended. |
| (l) | Investment in an affiliate. |
| (u) | Rate shown is the 7-day annualized yield at period end. |
| (r) | The investment company is exempt from registration under Section 3(c)(7) of the 1940 Act. |
| * | Cost for federal income tax purposes is $285,256,848 and net unrealized appreciation (depreciation) consists of: |
| | | | |
Gross unrealized appreciation | | $ | 26,708,339 | |
Gross unrealized depreciation | | | (18,386,269 | ) |
| | | | |
Net unrealized appreciation | | $ | 8,322,070 | |
The accompanying notes are an integral part of these financial statements.
| | | | | | |
| Statement of Assets and Liabilities—December 31, 2011 | | Wells Fargo Advantage VT Opportunity Fund | | | 15 | |
| | | | |
| | | | |
| |
Assets | | | | |
Investments | | | | |
In unaffiliated securities (including securities on loan), at value | | $ | 239,781,083 | |
In affiliated securities, at value | | | 53,797,835 | |
| | | | |
Total investments, at value (see cost below) | | | 293,578,918 | |
Receivable for investments sold | | | 809,863 | |
Receivable for Fund shares sold | | | 5,998 | |
Receivable for dividends | | | 211,467 | |
Receivable for securities lending income | | | 4,484 | |
| | | | |
Total assets | | | 294,610,730 | |
| | | | |
| |
Liabilities | | | | |
Payable for investments purchased | | | 96,302 | |
Payable for Fund shares redeemed | | | 932,421 | |
Payable upon receipt of securities loaned | | | 49,666,968 | |
Advisory fee payable | | | 139,498 | |
Distribution fees payable | | | 46,667 | |
Due to other related parties | | | 25,985 | |
Accrued expenses and other liabilities | | | 51,166 | |
| | | | |
Total liabilities | | | 50,959,007 | |
| | | | |
Total net assets | | $ | 243,651,723 | |
| | | | |
| |
NET ASSETS CONSIST OF | | | | |
Paid-in capital | | $ | 287,088,524 | |
Undistributed net investment income | | | 331,116 | |
Accumulated net realized losses on investments | | | (55,997,915 | ) |
Net unrealized gains on investments | | | 12,229,998 | |
| | | | |
Total net assets | | $ | 243,651,723 | |
| | | | |
| |
COMPUTATION OF NET ASSET VALUE PER SHARE1 | | | | |
Net assets – Class 1 | | $ | 42,116,424 | |
Shares outstanding – Class 1 | | | 2,420,549 | |
Net asset value per share – Class 1 | | | $17.40 | |
Net assets – Class 2 | | $ | 201,535,299 | |
Shares outstanding – Class 2 | | | 11,592,957 | |
Net asset value per share – Class 2 | | | $17.38 | |
| |
Total investments, at cost | | $ | 281,348,920 | |
| | | | |
Securities on loan, at value | | $ | 48,435,704 | |
| | | | |
| 1. | The Fund has an unlimited number of authorized shares. |
The accompanying notes are an integral part of these financial statements.
| | | | |
| 16 | | Wells Fargo Advantage VT Opportunity Fund | | Statement of Operations—Year Ended December 31, 2011 |
| | | | |
| | | | |
| |
Investment income | | | | |
Dividends* | | $ | 2,345,751 | |
Income from affiliated securities | | | 6,874 | |
Securities lending income, net | | | 73,170 | |
| | | | |
Total investment income | | | 2,425,795 | |
| | | | |
| |
Expenses | | | | |
Advisory fee | | | 1,286,490 | |
Administration fees | | | | |
Fund level | | | 98,961 | |
Class 11 | | | 11,770 | |
Class 2 | | | 146,567 | |
Distribution fees | | | | |
Class 2 | | | 458,022 | |
Custody and accounting fees | | | 20,029 | |
Professional fees | | | 25,736 | |
Shareholder report expenses | | | 15,836 | |
Trustees’ fees and expenses | | | 10,578 | |
Other fees and expenses | | | 7,900 | |
| | | | |
Total expenses | | | 2,081,889 | |
Less: Fee waivers and/or expense reimbursements | | | (71,738 | ) |
| | | | |
Net expenses | | | 2,010,151 | |
| | | | |
Net investment income | | | 415,644 | |
| | | | |
| |
REALIZED AND UNREALIZED GAINS (LOSSES) ON INVESTMENTS | | | | |
Net realized gains on investments | | | 12,647,751 | |
Net change in unrealized gains (losses) on investments | | | (16,138,693 | ) |
| | | | |
Net realized and unrealized gains (losses) on investments | | | (3,490,942 | ) |
| | | | |
Net decrease in net assets resulting from operations | | $ | (3,075,298 | ) |
| | | | |
| |
* Net of foreign dividend withholding taxes of | | | $2,417 | |
| 1. | Class commenced operations on August 26, 2011. |
The accompanying notes are an integral part of these financial statements.
| | | | | | |
| Statements of Changes in Net Assets | | Wells Fargo Advantage VT Opportunity Fund | | | 17 | |
| | | | | | | | | | | | | | | | |
| | | Year Ended
December 31, 2011 | | | Year Ended
December 31, 2010 | |
| | | | |
Operations | | | | | | | | | | | | | | | | |
Net investment income | | | | | | $ | 415,644 | | | | | | | $ | 120,866 | |
Net realized gains on investments | | | | | | | 12,647,751 | | | | | | | | 19,746,984 | |
Net change in unrealized gains (losses) on investments | | | | | | | (16,138,693 | ) | | | | | | | 14,072,322 | |
| | | | | | | | | | | | | | | | |
Net increase (decrease) in net assets resulting from operations | | | | | | | (3,075,298 | ) | | | | | | | 33,940,172 | |
| | | | | | | | | | | | | | | | |
| | | | |
Distributions to shareholders from | | | | | | | | | | | | | | | | |
Net investment income – Class 2 | | | | | | | (228,148 | ) | | | | | | | (1,195,940 | )1 |
| | | | | | | | | | | | | | | | |
| | | | |
| | | Shares | | | | | | Shares | | | | |
Capital share transactions | | | | | | | | | | | | | | | | |
Proceeds from shares sold | | | | | | | | | | | | | | | | |
Class 1 | | | 78,783 | 2 | | | 1,305,075 | 2 | | | N/A | | | | N/A | |
Class 2 | | | 721,399 | | | | 13,833,446 | | | | 826,626 | 1 | | | 13,114,185 | 1 |
| | | | | | | | | | | | | | | | |
| | | | | | | 15,138,521 | | | | | | | | 13,114,185 | |
| | | | | | | | | | | | | | | | |
Reinvestment of distributions | | | | | | | | | | | | | | | | |
Class 2 | | | 11,742 | | | | 228,148 | | | | 82,938 | 1 | | | 1,195,940 | 1 |
| | | | | | | | | | | | | | | | |
Payment for shares redeemed | | | | | | | | | | | | | | | | |
Class 1 | | | (201,134 | )2 | | | (3,415,950 | )2 | | | N/A | | | | N/A | |
Class 2 | | | (2,739,789 | ) | | | (49,078,548 | ) | | | (2,085,400 | )1 | | | (33,529,757 | )1 |
| | | | | | | | | | | | | | | | |
| | | | | | | (52,494,498 | ) | | | | | | | (33,529,757 | ) |
| | | | | | | | | | | | | | | | |
Net asset value of shares issued in acquisition | | | | | | | | | | | | | | | | |
Class 1 | | | 2,542,900 | | | | 42,011,395 | | | | N/A | | | | N/A | |
Class 2 | | | 4,464,853 | | | | 73,764,505 | | | | 0 | | | | 0 | |
| | | | | | | | | | | | | | | | |
| | | | | | | 115,775,900 | | | | | | | | 0 | |
| | | | | | | | | | | | | | | | |
Net increase (decrease) in net assets resulting
from capital share transactions | | | | | | | 78,648,071 | | | | | | | | (19,219,632 | ) |
| | | | | | | | | | | | | | | | |
Total increase in net assets | | | | | | | 75,344,625 | | | | | | | | 13,524,600 | |
| | | | | | | | | | | | | | | | |
| | | | |
Net assets | | | | | | | | | | | | | | | | |
Beginning of period | | | | | | | 168,307,098 | | | | | | | | 154,782,498 | |
| | | | | | | | | | | | | | | | |
End of period | | | | | | $ | 243,651,723 | | | | | | | $ | 168,307,098 | |
| | | | | | | | | | | | | | | | |
Undistributed net investment income | | | | | | $ | 331,116 | | | | | | | $ | 88,428 | |
| | | | | | | | | | | | | | | | |
| 1. | After the close of business on July 16, 2010, existing shares of the Fund were renamed Class 2 shares. |
| 2. | Class commenced operations on August 26, 2011. |
The accompanying notes are an integral part of these financial statements.
| | | | |
| 18 | | Wells Fargo Advantage VT Opportunity Fund | | Financial Highlights |
(For a share outstanding throughout the period)
| | | | |
| Class 1 | | Year Ended December 31, 20111 | |
Net asset value, beginning of period | | | $16.52 | |
Net investment income | | | 0.04 | |
Net realized and unrealized gains (losses) on investments | | | 0.84 | |
| | | | |
Total from investment operations | | | 0.88 | |
Net asset value, end of period | | | $17.40 | |
Total return2 | | | 5.33 | % |
Ratios to average net assets (annualized) | | | | |
Gross expenses | | | 0.83 | % |
Net expenses | | | 0.75 | % |
Net investment income | | | 0.61 | % |
Supplemental data | | | | |
Portfolio turnover rate | | | 35 | % |
Net assets, end of period (000’s omitted) | | $ | 42,116 | |
| 1. | For the period from August 26, 2011 (commencement of class operations) to December 31, 2011. |
| 2. | Returns for periods of less than one year are not annualized. |
The accompanying notes are an integral part of these financial statements.
| | | | | | |
| Financial Highlights | | Wells Fargo Advantage VT Opportunity Fund | | | 19 | |
(For a share outstanding throughout each period)
| | | | | | | | | | | | | | | | | | | | |
| | | Year Ended December 31, | |
| Class 21 | | 2011 | | | 2010 | | | 2009 | | | 2008 | | | 2007 | |
Net asset value, beginning of period | | $ | 18.42 | | | $ | 15.01 | | | $ | 10.16 | | | $ | 22.03 | | | $ | 24.02 | |
Net investment income | | | 0.03 | | | | 0.02 | | | | 0.11 | | | | 0.12 | | | | 0.21 | |
Net realized and unrealized gains (losses) on investments | | | (1.04 | ) | | | 3.51 | | | | 4.74 | | | | (7.30 | ) | | | 1.60 | |
| | | | | | | | | | | | | | | | | | | | |
Total from investment operations | | | (1.01 | ) | | | 3.53 | | | | 4.85 | | | | (7.18 | ) | | | 1.81 | |
Distributions to shareholders from | | | | | | | | | | | | | | | | | | | | |
Net investment income | | | (0.03 | ) | | | (0.12 | ) | | | 0.00 | | | | (0.37 | ) | | | (0.16 | ) |
Net realized gains | | | 0.00 | | | | 0.00 | | | | 0.00 | | | | (4.32 | ) | | | (3.64 | ) |
| | | | | | | | | | | | | | | | | | | | |
Total distributions to shareholders | | | (0.03 | ) | | | (0.12 | ) | | | 0.00 | | | | (4.69 | ) | | | (3.80 | ) |
Net asset value, end of period | | $ | 17.38 | | | $ | 18.42 | | | $ | 15.01 | | | $ | 10.16 | | | $ | 22.03 | |
Total return | | | (5.52 | )% | | | 23.76 | % | | | 47.74 | % | | | (40.10 | )% | | | 6.63 | % |
Ratios to average net assets (annualized) | | | | | | | | | | | | | | | | | | | | |
Gross expenses | | | 1.07 | % | | | 1.18 | % | | | 1.32 | % | | | 1.21 | % | | | 1.19 | % |
Net expenses | | | 1.04 | % | | | 1.07 | % | | | 1.07 | % | | | 1.07 | % | | | 1.07 | % |
Net investment income | | | 0.18 | % | | | 0.08 | % | | | 0.39 | % | | | 0.47 | % | | | 0.74 | % |
Supplemental data | | | | | | | | | | | | | | | | | | | | |
Portfolio turnover rate | | | 35 | % | | | 40 | % | | | 50 | % | | | 70 | % | | | 64 | % |
Net assets, end of period (000’s omitted) | | | $201,535 | | | | $168,307 | | | | $154,782 | | | | $378,197 | | | | $779,286 | |
| 1. | After the close of business on July 16, 2010, existing shares of the Fund were renamed Class 2 shares. |
The accompanying notes are an integral part of these financial statements.
| | | | |
| 20 | | Wells Fargo Advantage VT Opportunity Fund | | Notes to Financial Statements |
1. ORGANIZATION
Wells Fargo Variable Trust (the “Trust”), a Delaware statutory trust organized on March 10, 1999, is an open-end management investment company registered under the Investment Company Act of 1940, as amended (the “1940 Act”). These financial statements report on Wells Fargo Advantage VT Opportunity Fund (the “Fund”) which is a diversified series of the Trust.
2. SIGNIFICANT ACCOUNTING POLICIES
The following significant accounting policies, which are consistently followed in the preparation of the financial statements of the Fund, are in conformity with U.S. generally accepted accounting principles which require management to make estimates and assumptions that affect the reported amounts of assets and liabilities, disclosure of contingent assets and liabilities at the date of the financial statements, and the reported amounts of revenues and expenses during the reporting period. Actual results could differ from those estimates.
Securities valuation
Investments in equity securities are valued each business day as of the close of regular trading on the New York Stock Exchange, which is usually 4:00 p.m. (Eastern Time). Securities which are traded on a national or foreign securities exchange are valued at the last reported sales price, except that securities listed on The Nasdaq Stock Market, Inc. (“Nasdaq”) are valued at the Nasdaq Official Closing Price (“NOCP”), and if no NOCP is available, then at the last reported sales price. If no sales price is shown on the Nasdaq, the bid price will be used. In the absence of any sale of securities listed on the Nasdaq, and in the case of other securities (including U.S. Government obligations, but excluding debt securities maturing in 60 days or less), the price will be deemed “stale” and the valuations will be determined in accordance with the Fund’s Fair Value Procedures.
Fixed income securities with maturities exceeding 60 days are valued based on available evaluated prices received from an independent pricing service approved by the Board of Trustees which may utilize both transaction data and market information such as yield, prices of securities of comparable quality, coupon rate, maturity, type of issue, trading characteristics and other market data. If valuations are not available from the pricing service or values received are deemed not representative of market value, values will be obtained from a third party broker-dealer or determined based on the Fund’s Fair Value Procedures.
Debt securities of sufficient credit quality with original maturities of 60 days or less generally are valued at amortized cost which approximates fair value. The amortized cost method involves valuing a security at its cost, plus accretion of discount or minus amortization of premium over the period until maturity.
Investments in open-end mutual funds and non-registered investment companies are generally valued at net asset value.
Investments which are not valued using any of the methods discussed above, are valued at their fair value, as determined by procedures established in good faith and approved by the Board of Trustees.
Foreign currency translation
The accounting records of the Fund are maintained in U.S. dollars. Assets, including investment securities, and liabilities denominated in foreign currency are translated into U.S. dollars at the prevailing rates of exchange at the date of valuation. Purchases and sales of securities, and income and expenses are translated at the prevailing rate of exchange on the respective dates of such transactions. Reported net realized foreign exchange gains or losses arise from sales of foreign currencies, currency gains or losses realized between the trade and settlement dates on securities transactions, and the difference between the amounts of dividends, interest and foreign withholding taxes recorded and the U.S. dollar equivalent of the amounts actually paid or received. Net unrealized foreign exchange gains and losses arise from changes in the fair value of assets and liabilities other than investments in securities resulting in changes in exchange rates.
The changes in net assets arising from changes in exchange rates and the changes in net assets resulting from changes in market prices of securities are not separately presented. Such changes are recorded with net realized and unrealized gains or losses from investments. Gains and losses from certain foreign currency transactions are treated as ordinary income for U.S. federal income tax purposes.
| | | | | | |
| Notes to Financial Statements | | Wells Fargo Advantage VT Opportunity Fund | | | 21 | |
Security loans
The Fund may lend its securities from time to time in order to earn additional income in the form of fees or interest on securities received as collateral or the investment of any cash received as collateral. The Fund continues to receive interest or dividends on the securities loaned. The Fund receives collateral in the form of cash or securities with a value at least equal to the value of the securities on loan. The value of the loaned securities is determined at the close of each business day and any additional required collateral is delivered to the Fund on the next business day. In a securities lending transaction, the net asset value of the Fund will be affected by an increase or decrease in the value of the securities loaned and by an increase or decrease in the value of the instrument in which collateral is invested. The amount of securities lending activity undertaken by the Fund fluctuates from time to time. In the event of default or bankruptcy by the borrower, the Fund may be prevented from recovering the loaned securities or gaining access to the collateral or may experience delays or costs in doing so. In addition, the investment of any cash collateral received may lose all or part of its value. The Fund has the right under the lending agreement to recover the securities from the borrower on demand.
The Fund lends its securities through an unaffiliated securities lending agent. Cash collateral received in connection with its securities lending transactions is invested in Wells Fargo Securities Lending Cash Investments, LLC (the “Cash Collateral Fund”). The Cash Collateral Fund is exempt from registration under Section 3(c)(7) of the 1940 Act and is managed by Wells Fargo Funds Management LLC (“Funds Management”) and is sub-advised by Wells Capital Management Incorporated (“Wells Capital Management”). Funds Management receives an advisory fee starting at 0.05% and declining to 0.01% as the average daily net assets of the Cash Collateral Fund increase. All of the fees received by Funds Management are paid to Wells Capital Management for its services as sub-adviser. The Cash Collateral Fund seeks to provide a positive return compared to the daily Fed Funds Open rate by investing in high-quality, U.S. dollar-denominated short-term money market instruments. Cash Collateral Fund investments are fair valued based upon the amortized cost valuation technique. Income earned from investment in the Cash Collateral Fund is included in securities lending income on the Statement of Operations.
For Wells Fargo Advantage Funds that participated in securities lending activity prior to February 13, 2009, certain structured investment vehicles purchased in a joint account by the former securities lending agent defaulted or were impaired. Certain of the Wells Fargo Advantage Funds still hold ownership interest in these structured investment vehicles, which have since been restructured as pass-through securities. If the Fund holds an ownership interest in such pass-through securities, information regarding this ownership interest can be found in the Portfolio of Investments under the category “Other”.
Security transactions and income recognition
Securities transactions are recorded on a trade date basis. Realized gains or losses are reported on the basis of identified cost of securities delivered.
Dividend income is recognized on the ex-dividend date. Dividend income is recorded net of foreign taxes withheld where recovery of such taxes is not assured.
Distributions to shareholders
Distributions to shareholders from net investment income and net realized gains, if any, are recorded on the ex-dividend date. Such distributions are determined in conformity with income tax regulations, which may differ from generally accepted accounting principles.
The timing and character of distributions made during the period from net investment income or net realized gains may differ from their ultimate characterization for federal income tax purposes. To the extent that these differences are permanent in nature, such amounts are reclassified within the capital accounts based on their federal tax-basis treatment. Temporary differences do not require reclassifications. The primary permanent differences causing such reclassifications are due to dividends from certain securities, expiration of capital loss carryforwards and recognition of partnership income. At December 31, 2011, as a result of permanent book-to-tax differences, the following reclassification adjustments were made on the Statement of Assets and Liabilities:
| | | | | | | | |
Paid-in
Capital | | Undistributed
Net Investment
Income | | | Accumulated
Net Realized
Losses on
Investments | |
| $(360,675) | | $ | 66,302 | | | $ | 294,373 | |
| | | | |
| 22 | | Wells Fargo Advantage VT Opportunity Fund | | Notes to Financial Statements |
Federal and other taxes
The Fund intends to continue to qualify as a regulated investment company by distributing substantially all of its investment company taxable income and any net realized capital gains (after reduction for capital loss carryforwards) sufficient to relieve it from all, or substantially all, federal income taxes. Accordingly, no provision for federal income taxes was required.
The Fund’s income and federal excise tax returns and all financial records supporting those returns for the prior three fiscal years are subject to examination by the federal and Delaware revenue authorities.
Under the recently enacted Regulated Investment Company Modernization Act of 2010, the Fund is permitted to carry forward capital losses incurred in taxable years which began after December 22, 2010 for an unlimited period. However, any losses incurred are required to be utilized prior to the losses incurred in pre-enactment taxable years. As a result of this ordering rule, pre-enactment capital loss carryforwards may be more likely to expire unused. Additionally, post-enactment capital losses that are carried forward will retain their character as either short-term or long-term capital losses rather than being considered all short-term as under previous law.
At December 31, 2011, net capital loss carryforwards, which are available to offset future net realized capital gains, were as follows:.
| | | | | | | | |
Pre-enactment Capital Loss Expiration | | Post-enactment Capital Losses |
| 2015 | | 2016 | | 2017 | | Short-term | | Long-term |
| $1,442,700 | | $360,675 | | $47,818,946 | | $2,181,517 | | $286,150 |
Class allocations
The separate classes of shares offered by the Fund differ principally in distribution fees. Shareholders of each class bear certain expenses that pertain to that particular class. All shareholders bear the common expenses of the Fund, earn income from the portfolio, and are allocated unrealized gains and losses pro rata based on the average daily net assets of each class, without distinction between share classes. Dividends are determined separately for each class based on income and expenses allocable to each class. Realized gains and losses are allocated to each class pro rata based upon the net assets of each class on the date realized. Differences in per share dividend rates generally result from the relative weightings of pro rata income and realized gain allocations and from differences in separate class expenses, including distribution fees.
3. FAIR VALUATION MEASUREMENTS
Fair value measurements of investments are determined within a framework that has established a fair value hierarchy based upon the various data inputs utilized in determining the value of the Fund’s investments. The three-level hierarchy gives the highest priority to significant unadjusted quoted prices in active markets for identical assets or liabilities (Level 1) and the lowest priority to unobservable inputs (Level 3). The Fund’s investments are classified within the fair value hierarchy based on the lowest level of input that is significant to the fair value measurement. The inputs are summarized into three broad levels as follows:
| n | | Level 1 – quoted prices in active markets for identical securities |
| n | | Level 2 – other significant observable inputs (including quoted prices for similar securities, interest rates, prepayment speeds, credit risk, etc.) |
| n | | Level 3 – significant unobservable inputs (including the Fund’s own assumptions in determining the fair value of investments) |
The inputs or methodologies used for valuing securities are not necessarily an indication of the risk associated with investing in those securities.
| | | | | | |
| Notes to Financial Statements | | Wells Fargo Advantage VT Opportunity Fund | | | 23 | |
As of December 31, 2011, the inputs used in valuing the Fund’s assets, which are carried at fair value, were as follows:
| | | | | | | | | | | | | | | | |
| Investments in Securities | | Quoted Prices (Level 1) | | | Significant Other Observable Inputs (Level 2) | | | Significant Unobservable Inputs (Level 3) | | | Total | |
Equity securities | | | | | | | | | | | | | | | | |
Common stocks | | $ | 238,233,956 | | | $ | 0 | | | $ | 0 | | | $ | 238,233,956 | |
Other | | | 0 | | | | 0 | | | | 1,547,127 | | | | 1,547,127 | |
Short-term investments | | | | | | | | | | | | | | | | |
Investment companies | | | 4,870,568 | | | | 48,927,267 | | | | 0 | | | | 53,797,835 | |
| | | $ | 243,104,524 | | | $ | 48,927,267 | | | $ | 1,547,127 | | | $ | 293,578,918 | |
Further details on the major security types listed above can be found in the Portfolio of Investments.
Transfers in and transfers out are recognized at the end of the reporting period. For the year ended December 31, 2011, the Fund did not have any significant transfers into/out of Level 1 and Level 2.
The following is a reconciliation of assets in which significant unobservable inputs (Level 3) were used in determining fair value:
| | | | |
| | | Other | |
Balance as of December 31, 2010 | | $ | 2,520,461 | |
Accrued discounts (premiums) | | | 0 | |
Realized gains (losses) | | | 0 | |
Change in unrealized gains (losses) | | | (166,140 | ) |
Purchases | | | 0 | |
Sales | | | (807,194 | ) |
Transfers into Level 3 | | | 0 | |
Transfers out of Level 3 | | | 0 | |
Balance as of December 31, 2011 | | $ | 1,547,127 | |
Change in unrealized gains (losses)
relating to securities still held at December 31, 2011 | | $ | (551,276 | ) |
4. TRANSACTIONS WITH AFFILIATES AND OTHER EXPENSES
Advisory fee
The Trust has entered into an advisory contract with Funds Management, an indirect wholly owned subsidiary of Wells Fargo & Company (“Wells Fargo”). The adviser is responsible for implementing investment policies and guidelines and for supervising the sub-adviser, who is responsible for day-to-day portfolio management of the Fund.
Pursuant to the contract, Funds Management is entitled to receive an annual advisory fee starting at 0.65% and declining to 0.55% as the average daily net assets of the Fund increase. For the year ended December 31, 2011, the advisory fee was equivalent to an annual rate of 0.65% of the Fund’s average daily net assets.
Funds Management may retain the services of certain sub-advisers to provide daily portfolio management to the Fund. The fees related to sub-advisory services are borne directly by Funds Management and do not increase the overall fees paid by the Fund. Wells Capital Management, an affiliate of Funds Management, is the sub-adviser to the Fund and is entitled to receive a fee from Funds Management at an annual rate starting at 0.45% and declining to 0.30% as the average daily net assets of the Fund increase.
Administration and transfer agent fees
The Trust has entered into an administration agreement with Funds Management. Under this agreement, for providing administrative services, which includes paying fees and expenses for services provided by the transfer agent, sub-transfer agents, omnibus account servicers and record-keepers, Funds Management is entitled to receive from the Fund an annual fund level administration fee starting at 0.05% and declining to 0.03% as the average daily net assets of the Fund increase and a class level administration fee of 0.08% of the average daily net assets of each class.
| | | | |
| 24 | | Wells Fargo Advantage VT Opportunity Fund | | Notes to Financial Statements |
Funds Management has contractually waived and/or reimbursed advisory and administration fees to the extent necessary to maintain certain net operating expense ratios for the Fund. Waiver of fees and/or reimbursement of expenses by Funds Management were made first from fund level expenses on a proportionate basis and then from class specific expenses.
Distribution fees
The Trust has adopted a Distribution Plan for Class 2 shares of the Fund pursuant to Rule 12b-1 under the 1940 Act. Distribution fees are charged to Class 2 shares and paid to Wells Fargo Funds Distributor, LLC, the principal underwriter, at an annual rate of 0.25% of its average daily net assets.
5. INVESTMENT PORTFOLIO TRANSACTIONS
Purchases and sales of investments, excluding U.S. Government obligations (if any) and short-term securities (securities with maturities of one year or less at purchase date), for the year ended December 31, 2011 were $69,348,447 and $99,226,161, respectively.
6. ACQUISITION
After the close of business on August 26, 2011, the Fund acquired the net assets of Wells Fargo Advantage VT Core Equity Fund. The purpose of the transaction was to combine two funds with similar investment objectives and strategies. Shareholders holding Class 1 and Class 2 shares of Wells Fargo Advantage VT Core Equity Fund received Class 1 and Class 2 shares, respectively, of the Fund in the reorganization. The acquisition was accomplished by a tax-free exchange of all of the shares of Wells Fargo Advantage VT Core Equity Fund for 7,007,753 shares of the Fund valued at $115,775,900 at an exchange ratio of 0.77 and 0.76 for Class 1 and Class 2 shares, respectively. The investment portfolio of Wells Fargo Advantage VT Core Equity Fund with a fair value of $115,698,003, identified cost of $130,800,975 and unrealized losses of $15,102,972 at August 26, 2011 were the principal assets acquired by the Fund. The aggregate net assets of Wells Fargo Advantage VT Core Equity Fund and the Fund immediately prior to the acquisition were $115,775,900 and $138,830,614, respectively. The aggregate net assets of the Fund immediately after the acquisition were $254,606,514. For financial reporting purposes, assets received and shares issued by the Fund were recorded at fair value; however, the cost basis of the investments received from Wells Fargo Advantage VT Core Equity Fund was carried forward to align ongoing reporting of the Fund’s realized and unrealized gains and losses with amounts distributable to shareholders for tax purposes.
Assuming the acquisition had been completed January 1, 2011, the beginning of the annual reporting period for the Fund, the pro forma results of operations for the year ended December 31, 2011 would have been:
| | | | |
Net investment income | | $ | 1,159,297 | |
Net realized and unrealized losses on investments | | $ | (2,976,757 | ) |
Net decrease in net assets resulting from operations | | $ | (1,817,460 | ) |
Because the combined investment portfolios have been managed as a single integrated portfolio since the acquisition was completed, it is not practicable to separate the amounts of revenue and earnings of Wells Fargo Advantage VT Core Equity Fund that have been included in the Fund’s Statement of Operations since August 29, 2011.
7. BANK BORROWINGS
The Trust and Wells Fargo Funds Trust (excluding the money market funds) are parties to a $150,000,000 revolving credit agreement with State Street Bank and Trust Company, whereby the Fund is permitted to use bank borrowings for temporary or emergency purposes, such as to fund shareholder redemption requests. Interest under the credit agreement is charged to the Fund based on a borrowing rate equal to the higher of the Federal Funds rate in effect on that day plus 1.25% or the overnight LIBOR rate in effect on that day plus 1.25%. In addition, under the credit agreement, the Fund pays an annual commitment fee equal to 0.10% of the unused balance, which is allocated pro rata. Prior to September 6, 2011, the revolving credit agreement was for $125,000,000 and the annual commitment fee paid by the Fund was 0.125% of the unused balance. For the year ended December 31, 2011, the Fund paid $348 in commitment fees.
For the year ended December 31, 2011, there were no borrowings by the Fund under the agreement.
| | | | | | |
| Notes to Financial Statements | | Wells Fargo Advantage VT Opportunity Fund | | | 25 | |
8. DISTRIBUTIONS TO SHAREHOLDERS
The tax character of distributions paid was $228,148 and $1,195,940 of ordinary income for the years ended December 31, 2011 and December 31, 2010, respectively.
As of December 31, 2011, the components of distributable earnings on a tax basis were as follows:
| | | | | | | | |
Undistributed
Ordinary
Income | | Unrealized
Gains (Losses) | | | Capital Loss
Carryforward | |
| $341,265 | | $ | 8,322,070 | | | $ | (52,089,988 | ) |
9. INDEMNIFICATION
Under the Trust’s organizational documents, the officers and directors are indemnified against certain liabilities that may arise out of performance of their duties to the Trust. Additionally, in the normal course of business, the Trust may enter into contracts with service providers that contain a variety of indemnification clauses. The Trust’s maximum exposure under these arrangements is dependent on future claims that may be made against the Fund and, therefore, cannot be estimated.
10. NEW ACCOUNTING PRONOUNCEMENTS
In May 2011, the Financial Accounting Standards Board (“FASB”) issued Accounting Standards Update (“ASU”) No. 2011-04 “Amendments to Achieve Common Fair Value Measurement and Disclosure Requirements in U.S. GAAP and IFRSs”. ASU No. 2011-04 amends FASB ASC Topic 820, Fair Value Measurements and Disclosures, to establish common requirements for measuring fair value and for disclosing information about fair value measurements in accordance with GAAP. The ASU is effective prospectively for interim and annual periods beginning after December 15, 2011. Management expects that adoption of the ASU will result in additional disclosures in the financial statements, as applicable.
In April 2011, FASB issued ASU No. 2011-03 “Reconsideration of Effective Control for Repurchase Agreements”. ASU No. 2011-03 amends FASB ASC Topic 860, Transfers and Servicing, specifically the criteria required to determine whether a repurchase agreement (repo) and similar agreements should be accounted for as sales of financial assets or secured borrowings with commitments. ASU No. 2011-03 changes the assessment of effective control by focusing on the transferor’s contractual rights and obligations and removing the criterion to assess its ability to exercise those rights or honor those obligations. This could result in changes to the way entities account for certain transactions including repurchase agreements, mortgage dollar rolls and reverse repurchase agreements. The ASU will become effective on a prospective basis for new transfers and modifications to existing transactions as of the beginning of the first interim or annual period beginning on or after December 15, 2011. Management has evaluated the impact of adopting the ASU and expects no significant changes.
| | | | |
| 26 | | Wells Fargo Advantage VT Opportunity Fund | | Report of Independent Registered Public Accounting Firm |
BOARD OF TRUSTEES AND SHAREHOLDERS OF WELLS FARGO VARIABLE TRUST:
We have audited the accompanying statement of assets and liabilities, including the portfolio of investments, of the Wells Fargo Advantage VT Opportunity Fund (the “Fund”), one of the funds constituting the Wells Fargo Variable Trust, as of December 31, 2011, and the related statement of operations for the year then ended, statements of changes in net assets for each of the years in the two-year period then ended, and the financial highlights for each of the years or periods in the five-year period then ended. These financial statements and financial highlights are the responsibility of the Fund’s management. Our responsibility is to express an opinion on these financial statements and financial highlights based on our audits.
We conducted our audits in accordance with the standards of the Public Company Accounting Oversight Board (United States). Those standards require that we plan and perform the audit to obtain reasonable assurance about whether the financial statements and financial highlights are free of material misstatement. An audit includes examining, on a test basis, evidence supporting the amounts and disclosures in the financial statements. Our procedures included confirmation of securities owned as of December 31, 2011, by correspondence with custodian and brokers, or by other appropriate auditing procedures. An audit also includes assessing the accounting principles used and significant estimates made by management, as well as evaluating the overall financial statement presentation. We believe that our audits provide a reasonable basis for our opinion.
In our opinion, the financial statements and financial highlights referred to above present fairly, in all material respects, the financial position of the Wells Fargo Advantage VT Opportunity Fund as of December 31, 2011, the results of its operations for the year then ended, changes in its net assets for each of the years in the two-year period then ended, and the financial highlights for each of the years or periods in the five-year period then ended, in conformity with U.S. generally accepted accounting principles.

Boston, Massachusetts
February 24, 2012
| | | | | | |
| Other Information (Unaudited) | | Wells Fargo Advantage VT Opportunity Fund | | | 27 | |
TAX INFORMATION
For corporate shareholders, pursuant to Section 854 of the Internal Revenue Code, 100% of ordinary income dividends qualify for the corporate dividends-received deduction for the fiscal year ended December 31, 2011.
PROXY VOTING INFORMATION
A description of the policies and procedures that the Fund uses to determine how to vote proxies relating to portfolio securities is available without charge, upon request, by calling 1-800-222-8222, visiting our Web site at www.wellsfargo.com/advantagefunds, or visiting the SEC Web site at www.sec.gov. Information regarding how the Fund voted proxies relating to portfolio securities during the most recent 12-month period ended June 30 is available without charge on the Fund’s Web site at www.wellsfargo.com/advantagefunds or by visiting the SEC Web site at www.sec.gov.
PORTFOLIO HOLDINGS INFORMATION
The complete portfolio holdings for the Fund are publicly available on the Fund’s Web site (www.wellsfargo.com/advantagefunds) on a monthly, 30-day or more delayed basis. In addition, top ten holdings information for the Fund is publicly available on the Fund’s Web site on a monthly, seven-day or more delayed basis. The Fund files its complete schedule of portfolio holdings with the SEC for the first and third quarters of each fiscal year on Form N-Q, which is available without charge by visiting the SEC Web site at www.sec.gov. In addition, the Fund’s Form N-Q may be reviewed and copied at the SEC’s Public Reference Room in Washington, DC, and at regional offices in New York City, at 233 Broadway, and in Chicago, at 175 West Jackson Boulevard, Suite 900. Information about the Public Reference Room may be obtained by calling 1-800-SEC-0330.
| | | | |
| 28 | | Wells Fargo Advantage VT Opportunity Fund | | Other Information (Unaudited) |
BOARD OF TRUSTEES
The following table provides basic information about the Board of Trustees (the “Trustees”) of the Trust and Officers of the Trust. This table should be read in conjunction with the Prospectus and the Statement of Additional Information1 of the Fund. Each of the Trustees and Officers listed below acts in identical capacities for the Wells Fargo Advantage family of funds, which consists of 138 funds comprising the Wells Fargo Funds Trust, Wells Fargo Variable Trust, Wells Fargo Master Trust and four closed-end funds (collectively the “Fund Complex”). All of the Trustees are also Members of the Audit and Governance Committees of each Trust in the Fund Complex. The mailing address of each Trustee and Officer is 525 Market Street, 12th Floor, San Francisco, CA 94105. Each Trustee and Officer serves an indefinite term, however, each Trustee serves such term until reaching the mandatory retirement age established by the Trustees.
Independent Trustees
| | | | | | |
Name and Year of Birth | | Position Held and Length of Service | | Principal Occupations During Past Five Years | | Other Directorships During
Past Five Years |
Peter G. Gordon
(Born 1942) | | Trustee, since 1998; Chairman, since 2005 (Lead Trustee since 2001) | | Co-Founder, Retired Chairman, President and CEO of Crystal Geyser Water Company. Trustee Emeritus, Colby College | | Asset Allocation Trust |
Isaiah Harris, Jr.
(Born 1952) | | Trustee, since 2009 | | Retired. Prior thereto, President and CEO of BellSouth Advertising and Publishing Corp. from 2005 to 2007, President and CEO of BellSouth Enterprises from 2004 to 2005 and President of BellSouth Consumer Services from 2000 to 2003. Emeritus member of the Iowa State University Foundation Board of Governors. Emeritus Member of the Advisory Board of Iowa State University School of Business. Mr. Harris is a certified public accountant. | | CIGNA Corporation; Deluxe Corporation; Asset Allocation Trust |
Judith M. Johnson
(Born 1949) | | Trustee, since 2008 | | Retired. Prior thereto, Chief Executive Officer and Chief Investment Officer of Minneapolis Employees Retirement Fund from 1996 to 2008. Ms. Johnson is an attorney, certified public accountant and a certified managerial accountant. | | Asset Allocation Trust |
Leroy Keith, Jr.
(Born 1939) | | Trustee, since 2010 | | Chairman, Bloc Global Services (development and construction). Trustee of the Evergreen Funds from 1983 to 2010. Former Managing Director, Almanac Capital Management (commodities firm), former Partner, Stonington Partners, Inc. (private equity fund), former Director, Obagi Medical Products Co. and former Director, Lincoln Educational Services. | | Trustee, Virtus Fund Complex (consisting of 40 portfolios as of 12/31/11); Asset Allocation Trust |
David F. Larcker
(Born 1950) | | Trustee, since 2009 | | James Irvin Miller Professor of Accounting at the Graduate School of Business, Stanford University, Director of Corporate Governance Research Program and Senior Faculty of The Rock Center for Corporate Governance since 2006. From 2005 to 2008, Professor of Accounting at the Graduate School of Business, Stanford University. Prior thereto, Ernst & Young Professor of Accounting at The Wharton School, University of Pennsylvania from 1985 to 2005. | | Asset Allocation Trust |
Olivia S. Mitchell
(Born 1953) | | Trustee, since 2006 | | International Foundation of Employee Benefit Plans Professor, Wharton School of the University of Pennsylvania since 1993. Director of Wharton’s Pension Research Council and Boettner Center on Pensions & Retirement Research, and Research Associate at the National Bureau of Economic Research. Previously, Cornell University Professor from 1978 to 1993. | | Asset Allocation Trust |
| | | | | | |
| Other Information (Unaudited) | | Wells Fargo Advantage VT Opportunity Fund | | | 29 | |
| | | | | | |
Name and Year of Birth | | Position Held and Length of Service | | Principal Occupations During Past Five Years | | Other Directorships During
Past Five Years |
Timothy J. Penny
(Born 1951) | | Trustee, since 1996 | | President and CEO of Southern Minnesota Initiative Foundation, a non-profit organization, since 2007 and Senior Fellow at the Humphrey Institute Policy Forum at the University of Minnesota since 1995. Member of the Board of Trustees of NorthStar Education Finance, Inc., a non-profit organization, since 2007. | | Asset Allocation Trust |
Michael S. Scofield
(Born 1943) | | Trustee, since 2010 | | Served on the Investment Company Institute’s Board of Governors and Executive Committee from 2008-2011 as well the Governing Council of the Independent Directors Council from 2006-2011 and the Independent Directors Council Executive Committee from 2008-2011. Chairman of the IDC from 2008-2010. Institutional Investor (Fund Directions) Trustee of Year in 2007. Trustee of the Evergreen Funds (and its predecessors) from 1984 to 2010. Chairman of the Evergreen Funds from 2000-2010. Former Trustee of the Mentor Funds. Retired Attorney, Law Offices of Michael S. Scofield and former Director and Chairman, Branded Media Corporation (multi-media branding company). | | Asset Allocation Trust |
Donald C. Willeke
(Born 1940) | | Trustee, since 1996 | | Principal of the law firm of Willeke & Daniels. General Counsel of the Minneapolis Employees Retirement Fund from 1984 until its consolidation into the Minnesota Public Employees Retirement Association on June 30, 2010. Director and Vice Chair of The Free Trust (non-profit corporation). Director of the American Chestnut Foundation (non-profit corporation). | | Asset Allocation Trust |
Officers
| | | | | | |
Name and Year of Birth | | Position Held and
Length of Service | | Principal Occupations During Past Five Years | | |
Karla M. Rabusch
(Born 1959) | | President, since 2003 | | Executive Vice President of Wells Fargo Bank, N.A. and President of Wells Fargo Funds Management, LLC since 2003. Senior Vice President and Chief Administrative Officer of Wells Fargo Funds Management, LLC from 2001 to 2003. | | |
C. David Messman
(Born 1960) | | Secretary, since 2000; Chief Legal Counsel, since 2003 | | Senior Vice President and Secretary of Wells Fargo Funds Management, LLC since 2001. Vice President and Managing Senior Counsel of Wells Fargo Bank, N.A. since 1996. | | |
Kasey Phillips
(Born 1970) | | Treasurer, since 2009 | | Senior Vice President of Wells Fargo Funds Management, LLC since 2009. Senior Vice President of Evergreen Investment Management Company, LLC from 2006 to 2010. Treasurer of the Evergreen Funds from 2005 to 2010. | | |
David Berardi
(Born 1975) | | Assistant Treasurer, since 2009 | | Vice President of Wells Fargo Funds Management, LLC since 2009. Vice President of Evergreen Investment Management Company, LLC from 2008 to 2010. Assistant Vice President of Evergreen Investment Services, Inc. from 2004 to 2008. Manager of Fund Reporting and Control for Evergreen Investment Management Company, LLC from 2004 to 2010. | | |
Jeremy DePalma
(Born 1974) | | Assistant Treasurer, since 2009 | | Senior Vice President of Wells Fargo Funds Management, LLC since 2009. Senior Vice President of Evergreen Investment Management Company, LLC from 2008 to 2010. Vice President, Evergreen Investment Services, Inc. from 2004 to 2007. Head of the Fund Reporting and Control Team within Fund Administration from 2005 to 2010. | | |
Debra Ann Early
(Born 1964) | | Chief Compliance Officer, since 2007 | | Chief Compliance Officer of Wells Fargo Funds Management, LLC since 2007. Chief Compliance Officer of Parnassus Investments from 2005 to 2007. Chief Financial Officer of Parnassus Investments from 2004 to 2007 and Senior Audit Manager of PricewaterhouseCoopers LLP from 1998 to 2004. | | |
| 1. | The Statement of Additional Information includes additional information about the Trustees and is available, without charge, upon request, by calling 1-800-222-8222 or by visiting the Web site at www.wellsfargo.com/advantagefunds. |
| | | | |
| 30 | | Wells Fargo Advantage VT Opportunity Fund | | List of Abbreviations |
The following is a list of common abbreviations for terms and entities which may have appeared in this report.
| ACB | — Agricultural Credit Bank |
| ADR | — American Depository Receipt |
| ADS | — American Depository Shares |
| AGC-ICC | — Assured Guaranty Corporation - Insured Custody Certificates |
| AGM | — Assured Guaranty Municipal |
| AMBAC | — American Municipal Bond Assurance Corporation |
| AMT | — Alternative Minimum Tax |
| BAN | — Bond Anticipation Notes |
| BHAC | — Berkshire Hathaway Assurance Corporation |
| CAB | — Capital Appreciation Bond |
| CCAB | — Convertible Capital Appreciation Bond |
| CDA | — Community Development Authority |
| CDO | — Collateralized Debt Obligation |
| COP | — Certificate of Participation |
| DRIVER | — Derivative Inverse Tax-Exempt Receipts |
| DW&P | — Department of Water & Power |
| DWR | — Department of Water Resources |
| ECFA | — Educational & Cultural Facilities Authority |
| EDA | — Economic Development Authority |
| EDFA | — Economic Development Finance Authority |
| ETF | — Exchange-Traded Fund |
| FFCB | — Federal Farm Credit Bank |
| FGIC | — Financial Guaranty Insurance Corporation |
| FHA | — Federal Housing Authority |
| FHLB | — Federal Home Loan Bank |
| FHLMC | — Federal Home Loan Mortgage Corporation |
| FNMA | — Federal National Mortgage Association |
| GDR | — Global Depository Receipt |
| GNMA | — Government National Mortgage Association |
| HCFR | — Healthcare Facilities Revenue |
| HEFA | — Health & Educational Facilities Authority |
| HEFAR | — Higher Education Facilities Authority Revenue |
| HFA | — Housing Finance Authority |
| HFFA | — Health Facilities Financing Authority |
| IBC | — Insured Bond Certificate |
| IDA | — Industrial Development Authority |
| IDAG | — Industrial Development Agency |
| IDR | — Industrial Development Revenue |
| KRW | — Republic of Korea Won |
| LIBOR | — London Interbank Offered Rate |
| LLC | — Limited Liability Company |
| LLP | — Limited Liability Partnership |
| MBIA | — Municipal Bond Insurance Association |
| MFHR | — Multi-Family Housing Revenue |
| MUD | — Municipal Utility District |
| NATL-RE | — National Public Finance Guarantee Corporation |
| PCFA | — Pollution Control Finance Authority |
| PCR | — Pollution Control Revenue |
| PFA | — Public Finance Authority |
| PFFA | — Public Facilities Financing Authority |
| PFOTER | — Puttable Floating Option Tax-Exempt Receipts |
| plc | — Public Limited Company |
| PUTTER | — Puttable Tax-Exempt Receipts |
| R&D | — Research & Development |
| RDA | — Redevelopment Authority |
| RDFA | — Redevelopment Finance Authority |
| REIT | — Real Estate Investment Trust |
| ROC | — Reset Option Certificates |
| SAVRS | — Select Auction Variable Rate Securities |
| SBA | — Small Business Authority |
| SFHR | — Single Family Housing Revenue |
| SFMR | — Single Family Mortgage Revenue |
| SPDR | — Standard & Poor’s Depositary Receipts |
| TAN | — Tax Anticipation Notes |
| TIPS | — Treasury Inflation-Protected Securities |
| TRAN | — Tax Revenue Anticipation Notes |
| TCR | — Transferable Custody Receipts |
| TTFA | — Transportation Trust Fund Authority |
| TVA | — Tennessee Valley Authority |
| XLCA | — XL Capital Assurance |


FOR MORE INFORMATION
More information about Wells Fargo Advantage Funds is available free upon request. To obtain literature, please write, e-mail, visit the Fund’s Web site, or call:
Wells Fargo Advantage Funds
P.O. Box 8266
Boston, MA 02266-8266
E-mail: wfaf@wellsfargo.com
Web site: www.wellsfargo.com/advantagefunds
Individual investors: 1-800-222-8222
Retail investment professionals: 1-888-877-9275
Institutional investment professionals: 1-866-765-0778
This report and the financial statements contained herein are submitted for the general information of the shareholders of Wells Fargo Advantage Funds. If this report is used for promotional purposes, distribution of the report must be accompanied or preceded by a current prospectus. For a prospectus containing more complete information, including charges and expenses, call 1-800-222-8222 or visit the Fund’s Web site at www.wellsfargo.com/advantagefunds. Please consider the investment objectives, risks, charges, and expenses of the investment carefully before investing. This and other information about Wells Fargo Advantage Funds can be found in the current prospectus. Read the prospectus carefully before you invest or send money.
Wells Fargo Funds Management, LLC, a wholly owned subsidiary of Wells Fargo & Company, provides investment advisory and administrative services for Wells Fargo Advantage Funds. Other affiliates of Wells Fargo & Company provide subadvisory and other services for the Funds. The Funds are distributed by Wells Fargo Funds Distributor, LLC, Member FINRA/SIPC, an affiliate of Wells Fargo & Company.
NOT FDIC INSURED ¡ NO BANK GUARANTEE ¡ MAY LOSE VALUE
© 2012 Wells Fargo Funds Management, LLC. All rights reserved.
| | |
| | 207576 02-12 AVT6/AR152 12-11 |

Wells Fargo Advantage
VT Small Cap Growth Fund

Annual Report
December 31, 2011
Reduce clutter. Save trees.
Sign up for electronic delivery of prospectuses and shareholder reports at www.wellsfargo.com/advantagedelivery
Contents
The views expressed and any forward-looking statements are as of December 31, 2011, unless otherwise noted, and are those of the Fund managers and/or Wells Fargo Funds Management, LLC. Discussions of individual securities, or the markets generally, or any Wells Fargo Advantage Fund are not intended as individual recommendations. Future events or results may vary significantly from those expressed in any forward-looking statements; the views expressed are subject to change at any time in response to changing circumstances in the market. Wells Fargo Funds Management, LLC, disclaims any obligation to publicly update or revise any views expressed or forward-looking statements.
NOT FDIC INSURED ¡ NO BANK GUARANTEE ¡ MAY LOSE VALUE

WELLS FARGO INVESTMENT HISTORY
| | |
| |
| 1932 | | Keystone creates one of the first mutual fund families. |
| |
| 1971 | | Wells Fargo & Company introduces one of the first institutional index funds. |
| |
| 1978 | | Wells Fargo applies Markowitz and Sharpe’s research on Modern Portfolio Theory to introduce one of the industry’s first Tactical Asset Allocation (TAA) models in institutional separately managed accounts. |
| |
| 1984 | | Wells Fargo Stagecoach Funds launches its first asset allocation fund. |
| |
| 1989 | | The Tactical Asset Allocation (TAA) Model is first applied to Wells Fargo’s asset allocation mutual funds. |
| |
| 1994 | | Wells Fargo introduces the LifePath Funds, one of the first suites of target date funds (now the Wells Fargo Advantage Dow Jones Target Date FundsSM ). |
| |
| 1996 | | Evergreen Investments and Keystone Funds merge. |
| |
| 1997 | | Wells Fargo launches Wells Fargo Advantage WealthBuilder PortfoliosSM, a fund-of-funds suite of products that includes the use of quantitative models to shift assets among investment styles. |
| |
| 1999 | | Norwest Advantage Funds and Stagecoach Funds are reorganized into Wells Fargo Funds after the merger of Norwest and Wells Fargo. |
| |
| 2002 | | Evergreen Retail and Evergreen Institutional companies form the umbrella asset management company, Evergreen Investments. |
| |
| 2005 | | The integration of Strong Funds with Wells Fargo Funds creates Wells Fargo Advantage Funds, resulting in one of the top 20 mutual fund companies in the United States. |
| |
| 2006 | | Wells Fargo Advantage Funds relaunches the target date product line as Wells Fargo Advantage Dow Jones Target Date Funds. |
| |
| 2010 | | The mergers and reorganizations of Evergreen and Wells Fargo Advantage mutual funds are completed, unifying the families under the brand of Wells Fargo Advantage Funds. |
Wells Fargo Advantage Funds®
Wells Fargo Advantage Funds skillfully guides institutions, financial advisors, and individuals through the investment terrain to help them reach their financial objectives. Everything we do on behalf of investors is backed by our unique combination of qualifications.
Strength
Our organization is built on the standards of integrity and service established by our parent company—Wells Fargo & Company—more than 150 years ago. And, because we’re part of a highly diversified financial enterprise, we offer the depth of resources to help investors succeed.
Expertise
Our multi-boutique model offers investors access to the independent thinking of premier investment managers that have been chosen for their time-tested strategies. While each team specializes in a specific investment strategy, collectively they provide investors a wide choice of distinct investment styles. Our dedication to investment excellence doesn’t end with our expertise in manager selection—risk management, analysis, and rigorous ongoing review seek to ensure each manager’s investment process remains consistent.
Partnership
Our collaborative approach is built around understanding the needs and goals of our clients. By adhering to core principles of sound judgment and steady guidance, we support you through every stage of the investment decision process.
Carefully consider a fund’s investment objectives, risks, charges, and expenses before investing. For a current prospectus and, if available, a summary prospectus, containing this and other information, visit wellsfargo.com/advantagefunds. Read it carefully before investing.
Wells Fargo Funds Management, LLC, a wholly owned subsidiary of Wells Fargo & Company, provides investment advisory and administrative services for Wells Fargo Advantage Funds®. Other affiliates of Wells Fargo & Company provide subadvisory and other services for the Funds. The Funds are distributed by Wells Fargo Funds Distributor, LLC, Member FINRA/SIPC, an affiliate of Wells Fargo & Company.
“Dow Jones®” and “Dow Jones Target Date IndexesSM” are service marks of Dow Jones Trademark Holdings, LLC (“Dow Jones”), have been licensed to CME Group Index Services LLC (“CME Indexes”) and have been sublicensed for use for certain purposes by Global Index Advisors, Inc, and Wells Fargo Funds Management, LLC. The Wells Fargo Advantage Dow Jones Target Date FundsSM based on the Dow Jones Target Date IndexesSM, are not sponsored, endorsed, sold or promoted by Dow Jones, CME Indexes or their respective affiliates and none of them makes any representation regarding the advisability of investing in such product(s).
NOT FDIC INSURED ¡ NO BANK GUARANTEE ¡ MAY LOSE VALUE
Not part of the annual report.
Wells Fargo Advantage Funds offers more than 110 mutual funds across a wide range of asset classes, representing over $216 billion in assets under management, as of December 31, 2011.
| | | | |
| Equity Funds | | | | |
Asia Pacific Fund | | Global Opportunities Fund | | Premier Large Company Growth Fund |
C&B Large Cap Value Fund | | Growth Fund | | Small Cap Opportunities Fund |
C&B Mid Cap Value Fund | | Health Care Fund | | Small Cap Value Fund |
Capital Growth Fund | | Index Fund | | Small Company Growth Fund |
Common Stock Fund | | International Equity Fund | | Small Company Value Fund |
Disciplined U.S. Core Fund | | International Value Fund | | Small/Mid Cap Core Fund |
Discovery Fund† | | Intrinsic Small Cap Value Fund | | Small/Mid Cap Value Fund |
Diversified Equity Fund | | Intrinsic Value Fund | | Social Sustainability Fund† |
Diversified International Fund | | Intrinsic World Equity Fund | | Special Mid Cap Value Fund |
Diversified Small Cap Fund | | Large Cap Core Fund | | Special Small Cap Value Fund |
Emerging Growth Fund | | Large Cap Growth Fund | | Specialized Technology Fund |
Emerging Markets Equity Fund | | Large Company Value Fund | | Strategic Large Cap Growth Fund |
Endeavor Select Fund† | | Omega Growth Fund | | Traditional Small Cap Growth Fund |
Enterprise Fund† | | Opportunity Fund† | | Utility and Telecommunications Fund |
Equity Value Fund | | Precious Metals Fund | | |
| Bond Funds | | | | |
Adjustable Rate Government Fund | | Inflation-Protected Bond Fund | | Short-Term Bond Fund |
California Limited-Term Tax-Free Fund | | Intermediate Tax/AMT-Free Fund | | Short-Term High Yield Bond Fund |
California Tax-Free Fund | | International Bond Fund | | Short-Term Municipal Bond Fund |
Colorado Tax-Free Fund | | Minnesota Tax-Free Fund | | Strategic Municipal Bond Fund |
Government Securities Fund | | Municipal Bond Fund | | Total Return Bond Fund |
High Income Fund | | North Carolina Tax-Free Fund | | Ultra Short-Term Income Fund |
High Yield Bond Fund | | Pennsylvania Tax-Free Fund | | Ultra Short-Term Municipal Income Fund |
Income Plus Fund | | Short Duration Government Bond Fund | | Wisconsin Tax-Free Fund |
| Asset Allocation Funds | | | | |
Asset Allocation Fund | | WealthBuilder Equity Portfolio† | | Target 2020 Fund† |
Conservative Allocation Fund | | WealthBuilder Growth Allocation Portfolio† | | Target 2025 Fund† |
Diversified Capital Builder Fund | | WealthBuilder Growth Balanced Portfolio† | | Target 2030 Fund† |
Diversified Income Builder Fund | | WealthBuilder Moderate Balanced Portfolio† | | Target 2035 Fund† |
Growth Balanced Fund | | WealthBuilder Tactical Equity Portfolio† | | Target 2040 Fund† |
Index Asset Allocation Fund | | Target Today Fund† | | Target 2045 Fund† |
Moderate Balanced Fund | | Target 2010 Fund† | | Target 2050 Fund† |
WealthBuilder Conservative Allocation Portfolio† | | Target 2015 Fund† | | Target 2055 Fund† |
| Money Market Funds | | | | |
100% Treasury Money Market Fund | | Heritage Money Market Fund† | | National Tax-Free Money Market Fund |
California Municipal Money Market Fund | | Money Market Fund | | Prime Investment Money Market Fund |
Cash Investment Money Market Fund | | Municipal Cash Management Money Market Fund | | Treasury Plus Money Market Fund |
Government Money Market Fund | | Municipal Money Market Fund | | |
| Variable Trust Funds1 | | | | |
VT Discovery Fund† | | VT Intrinsic Value Fund | | VT Small Cap Growth Fund |
VT Index Asset Allocation Fund | | VT Omega Growth Fund | | VT Small Cap Value Fund |
VT International Equity Fund | | VT Opportunity Fund† | | VT Total Return Bond Fund |
An investment in a money market fund is not insured or guaranteed by the Federal Deposit Insurance Corporation or any other government agency. Although the Wells Fargo Advantage Money Market Funds seek to preserve the value of your investment at $1.00 per share, it is possible to lose money by investing in a money market fund.
| 1. | The Variable Trust Funds are generally available only through insurance company variable contracts. |
| † | In this report, the Wells Fargo Advantage Discovery FundSM, Wells Fargo Advantage Endeavor Select FundSM, Wells Fargo Advantage Enterprise FundSM, Wells Fargo Advantage Opportunity FundSM, Wells Fargo Advantage Social Sustainability FundSM, Wells Fargo Advantage WealthBuilder Conservative Allocation PortfolioSM, Wells Fargo Advantage WealthBuilder Equity PortfolioSM, Wells Fargo Advantage WealthBuilder Growth Allocation PortfolioSM, Wells Fargo Advantage WealthBuilder Growth Balanced PortfolioSM, Wells Fargo Advantage WealthBuilder Moderate Balanced PortfolioSM, Wells Fargo Advantage WealthBuilder Tactical Equity PortfolioSM, Wells Fargo Advantage Dow Jones Target Today FundSM, Wells Fargo Advantage Dow Jones Target 2010 FundSM, Wells Fargo Advantage Dow Jones Target 2015 FundSM, Wells Fargo Advantage Dow Jones Target 2020 FundSM, Wells Fargo Advantage Dow Jones Target 2025 FundSM, Wells Fargo Advantage Dow Jones Target 2030 FundSM, Wells Fargo Advantage Dow Jones Target 2035 FundSM, Wells Fargo Advantage Dow Jones Target 2040 FundSM, Wells Fargo Advantage Dow Jones Target 2045 FundSM, Wells Fargo Advantage Dow Jones Target 2050 FundSM, Wells Fargo Advantage Dow Jones Target 2055 FundSM, Wells Fargo Advantage Heritage Money Market FundSM, Wells Fargo Advantage VT Discovery FundSM, and Wells Fargo Advantage VT Opportunity FundSM are referred to as the Discovery Fund, Endeavor Select Fund, Enterprise Fund, Opportunity Fund, Social Sustainability Fund, WealthBuilder Conservative Allocation Portfolio, WealthBuilder Equity Portfolio, WealthBuilder Growth Allocation Portfolio, WealthBuilder Growth Balanced Portfolio, WealthBuilder Moderate Balanced Portfolio, WealthBuilder Tactical Equity Portfolio, Target Today Fund, Target 2010 Fund, Target 2015 Fund, Target 2020 Fund, Target 2025 Fund, Target 2030 Fund, Target 2035 Fund, Target 2040 Fund, Target 2045 Fund, Target 2050 Fund, Target 2055 Fund, Heritage Money Market Fund, VT Discovery Fund, and VT Opportunity Fund, respectively. |
Not part of the annual report.
| | | | |
| 2 | | Wells Fargo Advantage VT Small Cap Growth Fund | | Letter to Shareholders |

Karla M. Rabusch,
President
Wells Fargo Advantage Funds
The U.S. economic recovery that began in mid-2009 progressed throughout the 12-month period, yet the rate of growth remained subpar compared with most previous recovery cycles.
Dear Valued Shareholder:
We’re pleased to offer you this annual report for the Wells Fargo Advantage VT Small Cap Growth Fund for the 12-month period that ended December 31, 2011.
For the full 12-month period, most of the major domestic equity indexes posted either modest gains or relatively mild losses. However, the market’s 12-month return figures mask the uneven path that it traced throughout the year as investors had to contend with a variety of global and domestic headwinds. Whatever the future holds, we continue to believe that most investors can benefit from adhering to a well-diversified investment strategy. Over the long-term, such a strategy may allow you to balance risks and opportunities as you pursue your financial goals in a dynamic market landscape.
The economic recovery gained traction as the year progressed.
The U.S. economic recovery that began in mid-2009 progressed throughout the 12-month period, yet the rate of growth remained subpar compared with most previous recovery cycles.
2011 opened on a note of mounting optimism regarding the strength of the recovery, yet a batch of disappointing economic data in the spring and summer cast renewed doubts on the sustainability of the recovery. In September, it was reported that U.S. gross domestic product (GDP) grew at a mere 1.3% annual rate in the second quarter of 2011, following anemic growth at an annual rate of 0.4% in the first quarter. According to the December estimate, GDP growth accelerated to an annual rate of 1.8% in the third quarter, reigniting hopes for a sustainable recovery. Those hopes were buoyed by widespread anticipation of even stronger GDP growth in the fourth quarter. By the end of the 12-month period, few economists believed that the U.S. economy was in danger of sliding back into recession, although many expected a sluggish growth environment in 2012.
The struggling housing and labor markets slowed growth.
As has been the case throughout the recovery, the housing and labor markets continued to restrain economic momentum during 2011.
The beleaguered housing market has arguably exerted the biggest drag on growth. Despite intermittent signs of improvement, ongoing weakness in sales of both new and existing homes has put considerable downward pressure on prices. On the other hand, the labor market took a decided turn for the better in the latter half of the year: initial unemployment claims have eased in recent months, and the private sector has been steadily adding jobs. The pace of hiring, while not brisk, was sufficient to push the U.S. unemployment rate down to 8.5% as of December 2011—still well above its historical average, but at its lowest level since February 2009. Many observers expect the unemployment rate to decline further in 2012, which could act as a tailwind for consumer spending—widely viewed as one of the keys to long-term economic growth.
The Federal Reserve announced that it will keep rates low until 2013.
Consumers have already demonstrated some resilience in their spending—even in the face of higher energy costs. Oil prices skyrocketed in early 2011 before retreating later in the year, only to spike again during the fourth quarter. Yet
| | | | | | |
| Letter to Shareholders | | Wells Fargo Advantage VT Small Cap Growth Fund | | | 3 | |
“core” inflation, which excludes volatile energy and food prices, remained fairly benign throughout the year.
With inflation in check, the Federal Reserve (Fed) held its target range for the federal funds rate—a proxy for short-term interest rates—steady at 0% to 0.25%. Following its August 9 meeting, the Federal Open Market Committee (FOMC) issued a statement explaining that economic conditions were likely to warrant exceptionally low levels for the federal funds rate through at least mid-2013. In addition, the Fed carried out its second round of quantitative easing (QE2) in an effort to promote a more robust economic expansion. The stimulus program was completed as scheduled in June 2011. In September, the Fed launched yet another stimulus program—dubbed “Operation Twist”—that is designed to keep intermediate- and longer-term yields relatively low. The goal with keeping longer-term rates low is to encourage lending activity to spark business investments and home purchases, which, in turn, may provide support for a more sustainable economic recovery.
Market volatility was a dominant theme throughout most of 2011.
Despite pockets of turbulence sparked by the natural disasters in Japan and geopolitical turmoil in North Africa and the Middle East, the U.S. equity market performed very well from January through April of 2011. Some upbeat economic news, better-than-expected corporate profits, and investor enthusiasm about QE2 were among the catalysts for the market’s four-month advance.
In May and June, the market climate shifted to one of anxiety over the increasingly fragile state of the U.S. and global economies. As spring gave way to summer, investors not only worried that the U.S. might be on the brink of recession, they also feared that Europe’s sovereign debt problems could spiral out of control if a Greek default triggered financial contagion across the continent. In July and August, investor sentiment was further undermined by partisan wrangling over the federal debt ceiling and the Standard & Poor’s downgrade of the U.S. credit rating. The barrage of unsettling headlines led to heightened market volatility and sharply falling stock prices in the third quarter of 2011. Although volatility persisted into the fourth quarter, the market was able to rebound amid improved economic data and hopes for a resolution to the European crisis.
For the full 12-month period, the S&P 500 Index1 of large-cap stocks achieved a total return of 2.1%. The Russell Midcap® Index2 and the Russell 2000® Index3 of
| 1. | The S&P 500 Index consists of 500 stocks chosen for market size, liquidity, and industry group representation. It is a market-value weighted index with each stock’s weight in the index proportionate to its market value. You cannot invest directly in an index. |
| 2. | The Russell Midcap® Index measures the performance of the 800 smallest companies in the Russell 1000 Index, which represent approximately 25% of the total market capitalization of the Russell 1000® Index. You cannot invest directly in an index. |
| 3. | The Russell 2000® Index measures the performance of the 2,000 smallest companies in the Russell 3000® Index, which represents approximately 8% of the total market capitalization of the Russell 3000 Index. You cannot invest directly in an index. |
| | | | |
| 4 | | Wells Fargo Advantage VT Small Cap Growth Fund | | Letter to Shareholders |
The market turmoil of 2011 and an uncertain outlook going forward have left many investors questioning their resolve—and their investments. Yet, it is precisely at such times that the market may present opportunities—as well as challenges—for prudent investors.
small-cap stocks lost 1.6% and 4.2%, respectively. International stocks fared worse than their U.S. counterparts, with the MSCI EAFE Index4 shedding 14.8%.
Recent events have not altered our message to shareholders.
The market turmoil of 2011 and an uncertain outlook going forward have left many investors questioning their resolve—and their investments. Yet, it is precisely at such times that the market may present opportunities—as well as challenges—for prudent investors. Bear in mind that many investors who indiscriminately sold their equity investments during the severe market downturn of 2008 to 2009 missed out on the impressive two-year rally that followed. In our opinion, the lesson to be learned from these dramatic market events is that, for many investors, simply building and maintaining a well-diversified5 investment plan is the best long-term strategy.
To help you create a sound strategy based on your personal goals and risk tolerance, Wells Fargo Advantage Funds offers more than 110 mutual funds and other investments spanning a broad range of asset classes and investment styles. While diversification cannot guarantee an investment profit or prevent losses, we believe it can be an effective way to manage investment risk and potentially smooth out overall portfolio performance.
Thank you for choosing to invest with Wells Fargo Advantage Funds. We appreciate your confidence in us and remain committed to helping you meet your financial needs. For current information about your fund investments, contact your investment professional, visit our website at www.wellsfargo.com/advantagefunds, or call us directly at 1-800-222-8222. We are available 24 hours a day, 7 days a week.
Sincerely,

Karla M. Rabusch
President
Wells Fargo Advantage Funds
| 4. | The Morgan Stanley Capital International Europe, Australasia, and Far East (“MSCI EAFE”) Stock Index is an unmanaged group of securities widely regarded by investors to be representations of the stock markets of Europe, Australasia, and the Far East. You cannot invest directly in an index. Source: MSCI. MSCI makes no express or implied warranties or representations and shall have no liability whatsoever with respect to any MSCI data contained herein. The MSCI data may not be further redistributed or used as a basis for other indexes or any securities or financial products. This report is not approved, reviewed or produced by MSCI. |
| 5. | Diversification does not assure or guarantee better performance and cannot eliminate the risk of investment losses. |
| | | | | | |
| Performance Highlights (Unaudited) | | Wells Fargo Advantage VT Small Cap Growth Fund1 | | | 5 | |
INVESTMENT OBJECTIVE
The Fund seeks long-term capital appreciation.
ADVISER
Wells Fargo Funds Management, LLC
SUB-ADVISER
Wells Capital Management Incorporated
PORTFOLIO MANAGERS
Thomas C. Ognar, CFA
Bruce C. Olson, CFA
Joseph M. Eberhardy, CFA, CFP
FUND INCEPTION
May 1, 1995
| | | | |
| 12 MONTH TOTAL RETURN AS OF DECEMBER 31, 2011 | |
Class 2 | | | (4.60)% | |
Russell 2000® Growth Index2 | | | (2.91)% | |
Figures quoted represent past performance, which is no guarantee of future results and do not reflect the deduction of taxes that a shareholder may pay on fund distributions or the redemption of fund shares. Investment return and principal value of an investment will fluctuate so that an investor’s shares, when redeemed, may be worth more or less than their original cost. Current performance may be lower or higher than the performance data quoted and assumes the reinvestment of dividends and capital gains. Current month-end performance is available by calling 1-866-765-0778. Performance figures of the Fund do not reflect fees charged pursuant to the terms of variable life insurance policies and variable annuity contracts.
Index returns do not include transaction costs associated with buying and selling securities, any mutual fund fees or expenses or any taxes. It is not possible to invest directly in an index.
The Adviser has committed through July 18, 2013 to waive fees and/or reimburse expenses to the extent necessary to cap the Fund’s Total Annual Fund Operating Expenses After Fee Waiver, excluding certain other expenses at 1.20% for Class 2. The Fund’s gross and net expense ratios are 1.20% and 1.20%, respectively, for Class 2 shares. Without these reductions, the Fund’s returns would have been lower.
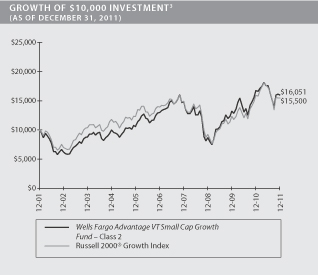
| 1. | The Fund is only open to certain insurance companies as described in the Statement of Additional information. The Fund is closed to all other investors. |
| 2. | The Russell 2000® Growth Index measures the performance of those Russell 2000 companies with higher price-to-book ratios and higher forecasted growth values. You cannot invest directly in an index. |
| 3. | The chart compares the performance of the Wells Fargo Advantage VT Small Cap Growth Fund Class 2 for the most recent ten years of the Fund with the Russell 2000 Growth Index. The chart assumes a hypothetical $10,000 investment and reflects all operating expenses of the Fund. Performance figures of the Fund do not reflect fees charged pursuant to the terms of variable life insurance policies and variable annuity contracts. |
| | | | |
| 6 | | Wells Fargo Advantage VT Small Cap Growth Fund | | Performance Highlights (Unaudited) |
MANAGER’S DISCUSSION
Fund highlights
| n | | The Fund underperformed its benchmark, the Russell 2000® Growth Index, for the 12-month period that ended December 31, 2011. |
| n | | An underweight in energy and overweights in consumer discretionary and information technology (IT) detracted from relative performance, while stock selection in health care aided performance. |
| n | | We have continued to employ a bottom-up investment process based on individual company fundamentals, rather than top-down trends, when making portfolio decisions. |
Macro-driven volatility limited equity market returns for 2011.
The year began on a high note as the equity market continued its rally from late 2010 amid greater confidence in the sustainability of the U.S. economic recovery. While there were pockets of turbulence sparked by the geopolitical turmoil in North Africa and the Middle East and natural disasters in Japan, the market performed well through April 2011. In the spring and summer, however, investors’ spirits began to dampen as a string of discouraging economic data reignited recession fears. Investor confidence was further damaged by bickering over the federal debt ceiling, the downgrade of the U.S. credit rating by Standard & Poor’s, and the risk of financial contagion in Europe. Despite continued strength in corporate profits, investors’ intense focus on the negative macro headlines, particularly in Europe, led to heightened market volatility and a broad-based sell-off in equities during the third quarter. Although volatility persisted into the fourth quarter, most of the major equity indexes rebounded amid improved economic data and managed to finish 2011 with either modest gains or relatively mild losses.
| | | | |
TEN LARGEST EQUITY HOLDINGS4 (AS OF DECEMBER 31, 2011) | | | |
Akorn Incorporated | | | 3.03% | |
Wright Express Corporation | | | 2.83% | |
HMS Holdings Corporation | | | 2.53% | |
Northern Oil & Gas Incorporated | | | 2.36% | |
Chart Industries Incorporated | | | 2.31% | |
Polypore International Incorporated | | | 2.24% | |
Financial Engines Incorporated | | | 2.22% | |
Life Time Fitness Incorporated | | | 2.22% | |
Centene Corporation | | | 2.20% | |
Synchronoss Technologies Incorporated | | | 2.17% | |
Portfolio results varied by sector.
During 2011, favorable stock selection was particularly evident in the health care sector. A number of our holdings in the sector posted strong quarterly results, including pharmaceutical companies Akorn Incorporated, which targets ophthalmology and injectable markets, and Jazz Pharmaceuticals Incorporated, which focuses on narcolepsy and anxiety disorders. In addition, SonoSite Incorporated, a manufacturer of portable ultrasound technology, was recently acquired by Fujifilm at a sizable premium.
Our industrials holdings also delivered solid relative performance, with many companies in the sector posting strong results for the year in spite of macroeconomic
uncertainty. We identified particularly attractive opportunities in companies leveraged to drilling activity in North American shale. Specifically, Robbins & Myers Incorporated, a fluid management and process solutions company, achieved a 36% return for the year. Additionally, Chart Industries Incorporated, a manufacturer of engineered storage solutions, benefited from the ongoing development of liquid natural gas infrastructure.
| 4. | The ten largest equity holdings are calculated based on the value of the securities divided by total net assets of the Fund. Holdings are subject to change and may have changed since the dates specified. |
| | | | | | |
| Performance Highlights (Unaudited) | | Wells Fargo Advantage VT Small Cap Growth Fund | | | 7 | |
Stock selection in the IT sector was a source of weakness for the Fund in 2011. In particular, our internet software and services holdings detracted from performance. After a strong start to the year, IT stocks in general underperformed amid macro headwinds and concerns over slowing capital expenditures by large financial and government customers. One example is Vistaprint N.V. (a stock no longer held in the portfolio), which in July announced a change to its business model designed to increase revenues by sacrificing cash flow and earnings for several years. While expanding revenue growth is desirable, we look for robust revenue and earnings growth, and therefore sold the stock after modeling in the earnings decline.
| | |
SECTOR DISTRIBUTION5 (AS OF DECEMBER 31, 2011) | | |
| |
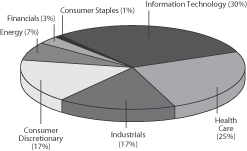 | | |
Our consumer discretionary holdings as a whole underperformed in 2011 as well. Bucking the trend was Life Time Fitness Incorporated, an operator of family-oriented fitness centers, which continued to deliver solid results and facilities expansion. Unfortunately, the gains were offset by holdings in Shutterfly Incorporated, and IMAX Corporation. Shutterfly moved higher in early 2011, driven by the company’s strong results and the integration of Tiny Prints Incorporated, a key competitor. However, increased competitive pressures later in the year threatened profit margins and weighed on the share price. Consistent with our discipline, we reduced our position in the stock in early 2011 and then added to it later in the year as our growth expectations “gap” widened. IMAX suffered from higher costs associated with new theatre openings and converting traditional films into IMAX format. While we believe the company’s growth prospects remain attractive, we materially reduced our position as our expectations “gap” narrowed.
We are confident in our companies’ growth prospects for 2012.
Our outlook for the coming year can best be described as cautiously optimistic. We believe that several factors could help boost business confidence and lead to a more stable investing environment in 2012, including the potential for greater clarity with regard to Europe, further improvements in U.S. employment trends and economic growth, and less partisan wrangling in Washington. Moreover, we continue to view small-cap growth stocks as an attractive asset class and remain committed to finding companies that offer robust, sustainable, and underappreciated growth.
| 5. | Sector distribution is subject to change and is calculated based on the total long-term investments of the Fund. |
| | | | |
| 8 | | Wells Fargo Advantage VT Small Cap Growth Fund | | Performance Highlights (Unaudited) |
AVERAGE ANNUAL TOTAL RETURN6 (%) (AS OF DECEMBER 31, 2011)
| | | | | | | | | | | | | | | | | | | | | | | | | | | | |
| | | | | | | | | | | | | | | | | | Expense Ratios7 | |
| | | Inception Date | | | 6 Months* | | | 1 Year | | | 5 Year | | | 10 Year | | | Gross | | | Net8 | |
Class 1 | | | 07/16/2010 | | | | (8.97 | ) | | | (4.34 | ) | | | 4.32 | | | | 4.89 | | | | 0.95% | | | | 0.95% | |
Class 2 | | | 05/01/1995 | | | | (9.11 | ) | | | (4.60 | ) | | | 4.24 | | | | 4.85 | | | | 1.20% | | | | 1.20% | |
Russell 2000 Growth Index | | | | | | | (10.59 | ) | | | (2.91 | ) | | | 2.09 | | | | 4.48 | | | | | | | | | |
| * | Returns for periods of less than one year are not annualized. |
Figures quoted represent past performance, which is no guarantee of future results and do not reflect the deduction of taxes that a shareholder may pay on fund distributions or the redemption of fund shares. Investment return and principal value of an investment will fluctuate so that an investor’s shares, when redeemed, may be worth more or less than their original cost. Current performance may be lower or higher than the performance data quoted and assumes the reinvestment of dividends and capital gains. Current month-end performance is available by calling 1-866-765-0778. Performance figures of the Fund do not reflect fees charged pursuant to the terms of variable life insurance policies and variable annuity contracts.
Index returns do not include transaction costs associated with buying and selling securities, any mutual fund fees or expenses or any taxes. It is not possible to invest directly in an index.
Stock fund values fluctuate in response to the activities of individual companies and general market and economic conditions. Smaller company stocks tend to be more volatile and less liquid than those of larger companies. The use of derivatives may reduce returns and/or increase volatility. Consult the Fund’s prospectus for additional information on these and other risks.
Please refer to the prospectus provided by your participating insurance company for detailed information describing the separate accounts for information regarding surrender charges, mortality and expense risk fees and other charges that may be assessed by the participating insurance companies.
| 6. | Historical performance shown for Class 1 shares prior to their inception reflects the performance of Class 2 shares, and includes the higher expenses applicable to Class 2 shares. If these expenses had not been included, returns would be higher. |
| 7. | Reflects the expense ratios as stated in the most recent prospectuses. |
| 8. | The Adviser has committed through July 18, 2013 to waive fees and/or reimburse expenses to the extent necessary to cap the Fund’s Total Annual Fund Operating Expenses After Fee Waiver, excluding certain expenses, at the amounts shown above. Without this cap, the Fund’s returns would have been lower. |
| | | | | | |
| Fund Expenses (Unaudited) | | Wells Fargo Advantage VT Small Cap Growth Fund | | | 9 | |
As a shareholder of the Fund, you incur ongoing costs, including management fees; distribution (12b-1) fees; and other Fund expenses. This example is intended to help you understand your ongoing costs (in dollars) of investing in the Fund and to compare these costs with the ongoing costs of investing in other mutual funds.
The example is based on an investment of $1,000 invested at the beginning of the six-month period and held for the entire period from July 1, 2011 to December 31, 2011.
Actual Expenses
The “Actual” line of the table below provides information about actual account values and actual expenses. You may use the information in this line, together with the amount you invested, to estimate the expenses that you paid over the period. Simply divide your account value by $1,000 (for example, an $8,600 account value divided by $1,000 = 8.6), then multiply the result by the number in the “Actual” line under the heading entitled “Expenses Paid During Period” for your applicable class of shares to estimate the expenses you paid on your account during this period.
Hypothetical Example for Comparison Purposes
The “Hypothetical” line of the table below provides information about hypothetical account values and hypothetical expenses based on the Fund’s actual expense ratio and an assumed rate of return of 5% per year before expenses, which is not the Fund’s actual return. The hypothetical account values and expenses may not be used to estimate the actual ending account balance or expenses you paid for the period. You may use this information to compare the ongoing costs of investing in the Fund and other funds. To do so, compare this 5% hypothetical example with the 5% hypothetical examples that appear in the shareholder reports of the other funds.
Please note that the expenses shown in the table are meant to highlight your ongoing costs only and do not reflect any separate account charges assessed by participating insurance companies. Therefore, the “Hypothetical” line of the table is useful in comparing ongoing costs only, and will not help you determine the relative total costs of owning different funds. In addition, if these separate account charges assessed by participating insurance companies were included, your costs would have been higher.
| | | | | | | | | | | | | | | | |
| | | Beginning
Account Value
07-01-2011 | | | Ending
Account Value
12-31-2011 | | | Expenses
Paid During
the Period¹ | | | Net Annual
Expense Ratio | |
Class 1 | | | | | | | | | | | | | | | | |
Actual | | $ | 1,000.00 | | | $ | 910.27 | | | $ | 4.57 | | | | 0.95 | % |
Hypothetical (5% return before expenses) | | $ | 1,000.00 | | | $ | 1,020.42 | | | $ | 4.84 | | | | 0.95 | % |
Class 2 | | | | | | | | | | | | | | | | |
Actual | | $ | 1,000.00 | | | $ | 908.88 | | | $ | 5.77 | | | | 1.20 | % |
Hypothetical (5% return before expenses) | | $ | 1,000.00 | | | $ | 1,019.16 | | | $ | 6.11 | | | | 1.20 | % |
| 1. | Expenses paid is equal to the annualized expense ratio of each class multiplied by the average account value over the period, multiplied by the number of days in the most recent fiscal half-year divided by the number of days in the fiscal year (to reflect the one-half year period). |
| | | | |
| 10 | | Wells Fargo Advantage VT Small Cap Growth Fund | | Portfolio of Investments—December 31, 2011 |
| | | | | | | | | | | | |
| Security Name | | | | | | Shares | | | Value | |
| | | | | | | | | | | | |
| | | | |
Common Stocks: 95.53% | | | | | | | | | | | | |
| | | | |
Consumer Discretionary: 16.08% | | | | | | | | | | | | |
| | | | |
| Hotels, Restaurants & Leisure: 5.98% | | | | | | | | | | | | |
BJ’s Restaurants Incorporated«† | | | | | | | 94,380 | | | $ | 4,277,302 | |
Bravo Brio Restaurant Group Incorporated† | | | | | | | 66,066 | | | | 1,133,032 | |
Life Time Fitness IncorporatedǠ | | | | | | | 110,700 | | | | 5,175,225 | |
Scientific Games Corporation Class A† | | | | | | | 175,000 | | | | 1,697,500 | |
Shuffle Master Incorporated† | | | | | | | 138,442 | | | | 1,622,540 | |
| | | | |
| | | | | | | | | | | 13,905,599 | |
| | | | | | | | | | | | |
| | | | |
| Household Durables: 0.75% | | | | | | | | | | | | |
Sodastream International LimitedǠ | | | | | | | 53,400 | | | | 1,745,646 | |
| | | | | | | | | | | | |
| | | | |
| Internet & Catalog Retail: 2.03% | | | | | | | | | | | | |
Homeaway IncorporatedǠ | | | | | | | 89,201 | | | | 2,073,923 | |
Shutterfly Incorporated† | | | | | | | 116,753 | | | | 2,657,298 | |
| | | | |
| | | | | | | | | | | 4,731,221 | |
| | | | | | | | | | | | |
| | | | |
| Media: 0.89% | | | | | | | | | | | | |
IMAX Corporation† | | | | | | | 57,700 | | | | 1,057,641 | |
MDC Partners Incorporated | | | | | | | 74,800 | | | | 1,011,296 | |
| | | | |
| | | | | | | | | | | 2,068,937 | |
| | | | | | | | | | | | |
| | | | |
| Specialty Retail: 4.45% | | | | | | | | | | | | |
Hibbett Sports IncorporatedǠ | | | | | | | 51,200 | | | | 2,313,216 | |
Mattress Firm Holding Corporation† | | | | | | | 30,148 | | | | 699,132 | |
Tractor Supply Company | | | | | | | 28,700 | | | | 2,013,305 | |
Ulta Salon Cosmetics & Fragrance Incorporated† | | | | | | | 46,700 | | | | 3,031,764 | |
Vitamin Shoppe Incorporated† | | | | | | | 57,400 | | | | 2,289,112 | |
| | | | |
| | | | | | | | | | | 10,346,529 | |
| | | | | | | | | | | | |
| | | | |
| Textiles, Apparel & Luxury Goods: 1.98% | | | | | | | | | | | | |
Vera Bradley IncorporatedǠ | | | | | | | 104,693 | | | | 3,376,349 | |
Warnaco Group IncorporatedǠ | | | | | | | 24,800 | | | | 1,240,992 | |
| | | | |
| | | | | | | | | | | 4,617,341 | |
| | | | | | | | | | | | |
| | | | |
Consumer Staples: 1.31% | | | | | | | | | | | | |
| | | | |
| Food & Staples Retailing: 1.31% | | | | | | | | | | | | |
Fresh Market IncorporatedǠ | | | | | | | 76,400 | | | | 3,048,360 | |
| | | | | | | | | | | | |
| | | | |
Energy: 6.29% | | | | | | | | | | | | |
| | | | |
| Oil, Gas & Consumable Fuels: 6.29% | | | | | | | | | | | | |
Approach Resources IncorporatedǠ | | | | | | | 108,900 | | | | 3,202,749 | |
Carrizo Oil & Gas IncorporatedǠ | | | | | | | 67,756 | | | | 1,785,371 | |
Laredo Petroleum Holdings Incorporated† | | | | | | | 72,659 | | | | 1,620,296 | |
Northern Oil & Gas IncorporatedǠ | | | | | | | 228,600 | | | | 5,481,828 | |
Oasis Petroleum IncorporatedǠ | | | | | | | 87,300 | | | | 2,539,557 | |
| | | | |
| | | | | | | | | | | 14,629,801 | |
| | | | | | | | | | | | |
| | | | | | |
| Portfolio of Investments—December 31, 2011 | | Wells Fargo Advantage VT Small Cap Growth Fund | | | 11 | |
| | | | | | | | | | | | |
| Security Name | | | | | | Shares | | | Value | |
| | | | | | | | | | | | |
| | | | |
Financials: 2.60% | | | | | | | | | | | | |
| | | | |
| Capital Markets: 2.22% | | | | | | | | | | | | |
Financial Engines IncorporatedǠ | | | | | | | 231,800 | | | $ | 5,176,094 | |
| | | | | | | | | | | | |
| | | | |
| Diversified Financial Services: 0.38% | | | | | | | | | | | | |
MarketAxess Holdings Incorporated | | | | | | | 29,100 | | | | 876,201 | |
| | | | | | | | | | | | |
| | | | |
Health Care: 24.00% | | | | | | | | | | | | |
| | | | |
| Biotechnology: 1.15% | | | | | | | | | | | | |
Cepheid IncorporatedǠ | | | | | | | 50,200 | | | | 1,727,382 | |
Exact Sciences Corporation† | | | | | | | 117,920 | | | | 957,510 | |
| | | | |
| | | | | | | | | | | 2,684,892 | |
| | | | | | | | | | | | |
| | | | |
| Health Care Equipment & Supplies: 9.92% | | | | | | | | | | | | |
DexCom Incorporated† | | | | | | | 160,200 | | | | 1,491,462 | |
Endologix Incorporated† | | | | | | | 312,100 | | | | 3,582,908 | |
Masimo Corporation« | | | | | | | 94,940 | | | | 1,773,954 | |
NxStage Medical Incorporated† | | | | | | | 258,320 | | | | 4,592,930 | |
SonoSite Incorporated† | | | | | | | 82,310 | | | | 4,433,217 | |
Volcano Corporation† | | | | | | | 193,000 | | | | 4,591,470 | |
Zoll Medical Corporation† | | | | | | | 41,400 | | | | 2,615,652 | |
| | | | |
| | | | | | | | | | | 23,081,593 | |
| | | | | | | | | | | | |
| | | | |
| Health Care Providers & Services: 7.02% | | | | | | | | | | | | |
Catalyst Health Solutions Incorporated† | | | | | | | 63,837 | | | | 3,319,524 | |
Centene Corporation† | | | | | | | 129,300 | | | | 5,118,987 | |
HMS Holdings CorporationǠ | | | | | | | 183,950 | | | | 5,882,721 | |
IPC The Hospitalist Company† | | | | | | | 44,100 | | | | 2,016,252 | |
| | | | |
| | | | | | | | | | | 16,337,484 | |
| | | | | | | | | | | | |
| | | | |
| Health Care Technology: 1.43% | | | | | | | | | | | | |
Merge Healthcare Incorporated† | | | | | | | 89,915 | | | | 436,088 | |
SXC Health Solutions Corporation† | | | | | | | 51,040 | | | | 2,882,739 | |
| | | | |
| | | | | | | | | | | 3,318,827 | |
| | | | | | | | | | | | |
| | | | |
| Life Sciences Tools & Services: 0.43% | | | | | | | | | | | | |
Luminex Corporation† | | | | | | | 46,526 | | | | 987,747 | |
| | | | | | | | | | | | |
| | | | |
| Pharmaceuticals: 4.05% | | | | | | | | | | | | |
Akorn IncorporatedǠ | | | | | | | 634,115 | | | | 7,051,359 | |
Impax Laboratories Incorporated† | | | | | | | 44,400 | | | | 895,548 | |
Jazz Pharmaceuticals Incorporated† | | | | | | | 38,500 | | | | 1,487,255 | |
| | | | |
| | | | | | | | | | | 9,434,162 | |
| | | | | | | | | | | | |
| | | | |
Industrials: 16.08% | | | | | | | | | | | | |
| | | | |
| Commercial Services & Supplies: 2.43% | | | | | | | | | | | | |
InnerWorkings Incorporated† | | | | | | | 262,889 | | | | 2,447,497 | |
On Assignment Incorporated† | | | | | | | 287,381 | | | | 3,212,920 | |
| | | | |
| | | | | | | | | | | 5,660,417 | |
| | | | | | | | | | | | |
| | | | |
| 12 | | Wells Fargo Advantage VT Small Cap Growth Fund | | Portfolio of Investments—December 31, 2011 |
| | | | | | | | | | | | |
| Security Name | | | | | | Shares | | | Value | |
| | | | | | | | | | | | |
| | | | |
| Electrical Equipment: 2.54% | | | | | | | | | | | | |
Altra Holdings Incorporated† | | | | | | | 37,240 | | | $ | 701,229 | |
Polypore International Incorporated† | | | | | | | 118,400 | | | | 5,208,416 | |
| | | | |
| | | | | | | | | | | 5,909,645 | |
| | | | | | | | | | | | |
| | | | |
| Machinery: 5.70% | | | | | | | | | | | | |
Chart Industries Incorporated† | | | | | | | 99,292 | | | | 5,368,718 | |
Robbins & Myers Incorporated | | | | | | | 83,100 | | | | 4,034,505 | |
The Middleby CorporationǠ | | | | | | | 40,999 | | | | 3,855,546 | |
| | | | |
| | | | | | | | | | | 13,258,769 | |
| | | | | | | | | | | | |
| | | | |
| Professional Services: 0.27% | | | | | | | | | | | | |
Mistras Group Incorporated† | | | | | | | 24,900 | | | | 634,701 | |
| | | | | | | | | | | | |
| | | | |
| Road & Rail: 2.37% | | | | | | | | | | | | |
Genesee & Wyoming Incorporated† | | | | | | | 73,400 | | | | 4,446,572 | |
Greenbrier Companies IncorporatedǠ | | | | | | | 44,100 | | | | 1,070,748 | |
| | | | |
| | | | | | | | | | | 5,517,320 | |
| | | | | | | | | | | | |
| | | | |
| Trading Companies & Distributors: 2.77% | | | | | | | | | | | | |
DXP Enterprises Incorporated† | | | | | | | 70,897 | | | | 2,282,883 | |
Titan Machinery Incorporated† | | | | | | | 191,073 | | | | 4,152,016 | |
| | | | |
| | | | | | | | | | | 6,434,899 | |
| | | | | | | | | | | | |
| | | | |
Information Technology: 28.95% | | | | | | | | | | | | |
| | | | |
| Communications Equipment: 2.00% | | | | | | | | | | | | |
Aruba Networks IncorporatedǠ | | | | | | | 117,800 | | | | 2,181,656 | |
Ixia† | | | | | | | 234,531 | | | | 2,464,921 | |
| | | | |
| | | | | | | | | | | 4,646,577 | |
| | | | | | | | | | | | |
| | | | |
| Electronic Equipment, Instruments & Components: 0.75% | | | | | | | | | | | | |
Maxwell Technologies IncorporatedǠ | | | | | | | 107,100 | | | | 1,739,304 | |
| | | | | | | | | | | | |
| | | | |
| Internet Software & Services: 6.70% | | | | | | | | | | | | |
Envestnet Incorporated† | | | | | | | 230,200 | | | | 2,753,192 | |
Liveperson Incorporated† | | | | | | | 110,500 | | | | 1,386,775 | |
LogMeIn IncorporatedǠ | | | | | | | 118,200 | | | | 4,556,610 | |
LoopNet Incorporated† | | | | | | | 6,537 | | | | 119,496 | |
Marchex Incorporated Class B | | | | | | | 127,000 | | | | 793,750 | |
Mercadolibre Incorporated« | | | | | | | 38,500 | | | | 3,062,290 | |
SciQuest Incorporated† | | | | | | | 205,554 | | | | 2,933,256 | |
| | | | |
| | | | | | | | | | | 15,605,369 | |
| | | | | | | | | | | | |
| | | | |
| IT Services: 3.82% | | | | | | | | | | | | |
Gartner Incorporated† | | | | | | | 48,294 | | | | 1,679,182 | |
ServiceSource International Incorporated† | | | | | | | 38,900 | | | | 610,341 | |
Wright Express Corporation† | | | | | | | 121,494 | | | | 6,594,694 | |
| | | | |
| | | | | | | | | | | 8,884,217 | |
| | | | | | | | | | | | |
| | | | | | |
| Portfolio of Investments—December 31, 2011 | | Wells Fargo Advantage VT Small Cap Growth Fund | | | 13 | |
| | | | | | | | | | | | | | |
| Security Name | | | | | | | Shares | | | Value | |
| | | | | | | | | | | | | | |
| | | | |
| Semiconductors & Semiconductor Equipment: 2.53% | | | | | | | | | | | | | | |
Cavium Incorporated† | | | | | | | | | 56,100 | | | $ | 1,594,923 | |
Entegris Incorporated† | | | | | | | | | 331,600 | | | | 2,893,210 | |
EZchip Semiconductor Limited† | | | | | | | | | 49,900 | | | | 1,413,667 | |
| | | | |
| | | | | | | | | | | | | 5,901,800 | |
| | | | | | | | | | | | | | |
| | | | |
| Software: 13.15% | | | | | | | | | | | | | | |
Allot Communications Limited† | | | | | | | | | 139,494 | | | | 2,120,309 | |
Broadsoft Incorporated† | | | | | | | | | 106,576 | | | | 3,218,595 | |
Fortinet Incorporated† | | | | | | | | | 159,600 | | | | 3,480,876 | |
Imperva Incorporated† | | | | | | | | | 8,336 | | | | 290,176 | |
Kenexa Corporation† | | | | | | | | | 6,904 | | | | 184,337 | |
Mitek Systems IncorporatedǠ | | | | | | | | | 95,600 | | | | 693,100 | |
Opnet Technologies Incorporated | | | | | | | | | 45,700 | | | | 1,675,819 | |
PROS Holdings Incorporated† | | | | | | | | | 58,827 | | | | 875,346 | |
Qlik Technologies Incorporated† | | | | | | | | | 69,300 | | | | 1,677,060 | |
Realpage IncorporatedǠ | | | | | | | | | 63,000 | | | | 1,592,010 | |
Solarwinds Incorporated† | | | | | | | | | 60,600 | | | | 1,693,770 | |
SuccessFactors IncorporatedǠ | | | | | | | | | 29,190 | | | | 1,163,805 | |
Synchronoss Technologies Incorporated† | | | | | | | | | 166,858 | | | | 5,040,780 | |
Taleo Corporation Class A† | | | | | | | | | 90,473 | | | | 3,500,400 | |
Ultimate Software Group Incorporated† | | | | | | | | | 52,100 | | | | 3,392,752 | |
| | | | |
| | | | | | | | | | | | | 30,599,135 | |
| | | | | | | | | | | | | | |
| | | | |
Materials: 0.22% | | | | | | | | | | | | | | |
| | | | |
| Chemicals: 0.22% | | | | | | | | | | | | | | |
LSB Industries Incorporated† | | | | | | | | | 18,600 | | | | 521,359 | |
| | | | | | | | | | | | | | |
| | | | |
Total Common Stocks (Cost $209,256,606) | | | | | | | | | | | | | 222,303,946 | |
| | | | | | | | | | | | | | |
| | | | |
Investment Companies: 0.71% | | | | | | | | | | | | | | |
iShares Russell 2000 Growth Index Fund ETF« | | | | | | | | | 19,643 | | | | 1,654,530 | |
| | | | | | | | | | | | | | |
| | | | |
Total Investment Companies (Cost $1,664,002) | | | | | | | | | | | | | 1,654,530 | |
| | | | | | | | | | | | | | |
| | | | |
| | | | | | | | Principal | | | | |
| Other: 0.29% | | | | | | | | | | | | | | |
Gryphon Funding Limited, Pass-Through Entity(a)(i)(v) | | | | | | | | $ | 869,626 | | | | 243,495 | |
VFNC Corporation, Pass-Through Entity, 0.30%(a)(i)(v)144A± | | | | | | | | | 989,896 | | | | 425,655 | |
| | | | |
Total Other (Cost $319,929) | | | | | | | | | | | | | 669,150 | |
| | | | | | | | | | | | | | |
| | | | |
| | | Yield | | | | | Shares | | | | |
| Short-Term Investments: 28.72% | | | | | | | | | | | | | | |
| | | | |
| Investment Companies: 28.72% | | | | | | | | | | | | | | |
Wells Fargo Advantage Cash Investment Money Market Fund, Institutional Class(l)(u) | | | 0.04 | % | | | | | 8,556,778 | | | | 8,556,778 | |
Wells Fargo Securities Lending Cash Investments, LLC(v)(l)(u)(r) | | | 0.12 | | | | | | 58,280,776 | | | | 58,280,776 | |
| | | | |
Total Short-Term Investments (Cost $66,837,554) | | | | | | | | | | | | | 66,837,554 | |
| | | | | | | | | | | | | | |
| | | | | | | | |
Total Investments in Securities
| | | | | | | | |
| (Cost $278,078,091)* | | | 125.25 | % | | | 291,465,180 | |
Other Assets and Liabilities, Net | | | (25.25 | ) | | | (58,766,202 | ) |
| | | | | | | | |
| Total Net Assets | | | 100.00 | % | | $ | 232,698,978 | |
| | | | | | | | |
| | | | |
| 14 | | Wells Fargo Advantage VT Small Cap Growth Fund | | Portfolio of Investments—December 31, 2011 |
| « | All or a portion of this security is on loan. |
| † | Non-income earning security. |
| (a) | Security is fair valued by the Management Valuation Team, and in certain instances by the Board of Trustees, in accordance with procedures approved by the Board of Trustees. |
| (i) | Illiquid security for which the designation as illiquid is unaudited. |
| (v) | Security represents investment of cash collateral received from securities on loan. |
| 144A | Security that may be resold to “qualified institutional buyers” under Rule 144A or security offered pursuant to Section 4(2) of the Securities Act of 1933, as amended. |
| ± | Variable rate investment. |
| (l) | Investment in an affiliate. |
| (u) | Rate shown is the 7-day annualized yield at period end. |
| (r) | The investment company is exempt from registration under Section 3(c)(7) of the 1940 Act. |
| * | Cost for federal income tax purposes is $280,079,575 and net unrealized appreciation (depreciation) consists of: |
| | | | |
Gross unrealized appreciation | | $ | 28,977,823 | |
Gross unrealized depreciation | | | (17,592,218 | ) |
| | | | |
Net unrealized appreciation | | $ | 11,385,605 | |
The accompanying notes are an integral part of these financial statements.
| | | | | | |
| Statement of Assets and Liabilities—December 31, 2011 | | Wells Fargo Advantage VT Small Cap Growth Fund | | | 15 | |
| | | | |
| | | | |
| |
Assets | | | | |
Investments | | | | |
In unaffiliated securities (including securities on loan), at value | | $ | 224,627,626 | |
In affiliated securities, at value | | | 66,837,554 | |
| | | | |
Total investments, at value (see cost below) | | | 291,465,180 | |
Receivable for investments sold | | | 1,922,691 | |
Receivable for Fund shares sold | | | 294,388 | |
Receivable for dividends | | | 3,591 | |
Receivable for securities lending income | | | 22,187 | |
Prepaid expenses and other assets | | | 5,911 | |
| | | | |
Total assets | | | 293,713,948 | |
| | | | |
| |
Liabilities | | | | |
Payable for investments purchased | | | 291,979 | |
Payable for Fund shares redeemed | | | 206,380 | |
Payable upon receipt of securities loaned | | | 58,600,705 | |
Advisory fee payable | | | 177,394 | |
Distribution fees payable | | | 52,330 | |
Due to other related parties | | | 30,700 | |
Due to custodian bank | | | 1,589,575 | |
Accrued expenses and other liabilities | | | 65,907 | |
| | | | |
Total liabilities | | | 61,014,970 | |
| | | | |
Total net assets | | $ | 232,698,978 | |
| | | | |
| |
NET ASSETS CONSIST OF | | | | |
Paid-in capital | | $ | 211,755,608 | |
Undistributed net investment loss | | | (1,639 | ) |
Accumulated net realized gains on investments | | | 7,557,920 | |
Net unrealized gains on investments | | | 13,387,089 | |
| | | | |
Total net assets | | $ | 232,698,978 | |
| | | | |
| |
COMPUTATION OF NET ASSET VALUE PER SHARE1 | | | | |
Net assets – Class 1 | | $ | 29,350,512 | |
Shares outstanding – Class 1 | | | 3,808,527 | |
Net asset value per share – Class 1 | | | $7.71 | |
Net assets – Class 2 | | $ | 203,348,466 | |
Shares outstanding – Class 2 | | | 26,472,040 | |
Net asset value per share – Class 2 | | | $7.68 | |
| |
Total investments, at cost | | $ | 278,078,091 | |
| | | | |
Securities on loan, at value | | $ | 57,073,444 | |
| | | | |
| 1. | The Fund has an unlimited number of authorized shares. |
The accompanying notes are an integral part of these financial statements.
| | | | |
| 16 | | Wells Fargo Advantage VT Small Cap Growth Fund | | Statement of Operations—Year Ended December 31, 2011 |
| | | | |
| | | | |
| |
Investment income | | | | |
Dividends* | | $ | 301,694 | |
Securities lending income, net | | | 240,193 | |
Income from affiliated securities | | | 10,114 | |
| | | | |
Total investment income | | | 552,001 | |
| | | | |
| |
Expenses | | | | |
Advisory fee | | | 1,971,805 | |
Administration fees | | | | |
Fund level | | | 131,454 | |
Class 1 | | | 28,279 | |
Class 2 | | | 182,047 | |
Distribution fees | | | | |
Class 2 | | | 568,898 | |
Custody and accounting fees | | | 48,637 | |
Professional fees | | | 24,316 | |
Shareholder report expenses | | | 80,964 | |
Trustees’ fees and expenses | | | 14,067 | |
Other fees and expenses | | | 5,234 | |
| | | | |
Total expenses | | | 3,055,701 | |
Less: Fee waivers and/or expense reimbursements | | | (5,227 | ) |
| | | | |
Net expenses | | | 3,050,474 | |
| | | | |
Net investment loss | | | (2,498,473 | ) |
| | | | |
| |
REALIZED AND UNREALIZED GAINS (LOSSES) ON INVESTMENTS | | | | |
Net realized gains on investments | | | 19,985,502 | |
Net change in unrealized gains (losses) on investments | | | (30,858,077 | ) |
| | | | |
Net realized and unrealized gains (losses) on investments | | | (10,872,575 | ) |
| | | | |
Net decrease in net assets resulting from operations | | $ | (13,371,048 | ) |
| | | | |
| |
* Net of foreign dividend withholding taxes of | | | $4,319 | |
The accompanying notes are an integral part of these financial statements.
| | | | | | |
| Statements of Changes in Net Assets | | Wells Fargo Advantage VT Small Cap Growth Fund | | | 17 | |
| | | | | | | | | | | | | | | | |
| | | Year Ended
December 31, 2011 | | | Year Ended
December 31, 2010 | |
| | | | |
Operations | | | | | | | | | | | | | | | | |
Net investment loss | | | | | | $ | (2,498,473 | ) | | | | | | $ | (1,839,556 | ) |
Net realized gains on investments | | | | | | | 19,985,502 | | | | | | | | 27,159,838 | |
Net change in unrealized gains (losses) on investments | | | | | | | (30,858,077 | ) | | | | | | | 34,892,151 | |
| | | | | | | | | | | | | | | | |
Net increase (decrease) in net assets resulting from operations | | | | | | | (13,371,048 | ) | | | | | | | 60,212,433 | |
| | | | | | | | | | | | | | | | |
| | | | |
Capital share transactions | | | Shares | | | | | | | | Shares | | | | | |
Proceeds from shares sold | | | | | | | | | | | | | | | | |
Class 1 | | | 392,602 | | | | 3,135,719 | | | | 345,312 | 1 | | | 2,449,216 | 1 |
Class 2 | | | 8,793,012 | | | | 69,683,930 | | | | 9,158,617 | 2 | | | 64,586,061 | 2 |
| | | | | | | | | | | | | | | | |
| | | | | | | 72,819,649 | | | | | | | | 67,035,277 | |
| | | | | | | | | | | | | | | | |
Payment for shares redeemed | | | | | | | | | | | | | | | | |
Class 1 | | | (1,848,297 | ) | | | (14,311,440 | ) | | | (831,507 | )1 | | | (5,663,229 | )1 |
Class 2 | | | (13,028,327 | ) | | | (102,117,549 | ) | | | (8,891,344 | )2 | | | (61,045,657 | )2 |
| | | | | | | | | | | | | | | | |
| | | | | | | (116,428,989 | ) | | | | | | | (66,708,886 | ) |
| | | | | | | | | | | | | | | | |
Net asset value of shares issued in acquisition | | | | | | | | | | | | | | | | |
Class 1 | | | 0 | | | | 0 | | | | 5,750,417 | | | | 36,024,647 | |
Class 2 | | | 0 | | | | 0 | | | | 1,240,431 | | | | 7,770,923 | |
| | | | | | | | | | | | | | | | |
| | | | | | | 0 | | | | | | | | 43,795,570 | |
| | | | | | | | | | | | | | | | |
Net increase (decrease) in net assets resulting
from capital share transactions | | | | | | | (43,609,340 | ) | | | | | | | 44,121,961 | |
| | | | | | | | | | | | | | | | |
Total increase (decrease) in net assets | | | | | | | (56,980,388 | ) | | | | | | | 104,334,394 | |
| | | | | | | | | | | | | | | | |
| | | | |
Net assets | | | | | | | | | | | | | | | | |
Beginning of period | | | | | | | 289,679,366 | | | | | | | | 185,344,972 | |
| | | | | | | | | | | | | | | | |
End of period | | | | | | $ | 232,698,978 | | | | | | | $ | 289,679,366 | |
| | | | | | | | | | | | | | | | |
Undistributed net investment loss | | | | | | $ | (1,639 | ) | | | | | | $ | (1,998 | ) |
| | | | | | | | | | | | | | | | |
| 1. | Class commenced operations on July 16, 2010. |
| 2. | After the close of business on July 16, 2010, existing shares of the Fund were renamed Class 2 shares. |
The accompanying notes are an integral part of these financial statements.
| | | | |
| 18 | | Wells Fargo Advantage VT Small Cap Growth Fund | | Financial Highlights |
(For a share outstanding throughout each period)
| | | | | | | | |
| | | Year Ended December 31, | |
| Class 1 | | 2011 | | | 20101 | |
Net asset value, beginning of period | | $ | 8.06 | | | $ | 6.26 | |
Net investment loss | | | (0.06 | ) | | | (0.02 | ) |
Net realized and unrealized gains (losses) on investments | | | (0.29 | ) | | | 1.82 | |
| | | | | | | | |
Total from investment operations | | | (0.35 | ) | | | 1.80 | |
Net asset value, end of period | | $ | 7.71 | | | $ | 8.06 | |
Total return2 | | | (4.34 | )% | | | 26.93 | % |
Ratios to average net assets (annualized) | | | | | | | | |
Gross expenses | | | 0.94 | % | | | 0.95 | % |
Net expenses | | | 0.94 | % | | | 0.95 | % |
Net investment loss | | | (0.73 | )% | | | (0.58 | )% |
Supplemental data | | | | | | | | |
Portfolio turnover rate | | | 118 | % | | | 71 | % |
Net assets, end of period (000’s omitted) | | | $29,351 | | | | $42,434 | |
| 1. | For the period from July 16, 2010 (commencement of class operations) to December 31, 2010. |
| 2. | Returns for periods less than one year are not annualized. |
The accompanying notes are an integral part of these financial statements.
| | | | | | |
| Financial Highlights | | Wells Fargo Advantage VT Small Cap Growth Fund | | | 19 | |
(For a share outstanding throughout each period)
| | | | | | | | | | | | | | | | | | | | |
| | | Year Ended December 31, | |
| Class 21 | | 2011 | | | 2010 | | | 2009 | | | 2008 | | | 2007 | |
Net asset value, beginning of period | | $ | 8.05 | | | $ | 6.35 | | | $ | 4.16 | | | $ | 9.69 | | | $ | 9.96 | |
Net investment loss | | | (0.09 | ) | | | (0.06 | ) | | | (0.03 | ) | | | (0.05 | ) | | | (0.07 | ) |
Net realized and unrealized gains (losses) on investments | | | (0.28 | ) | | | 1.76 | | | | 2.22 | | | | (3.31 | ) | | | 1.52 | |
| | | | | | | | | | | | | | | | �� | | | | |
Total from investment operations | | | (0.37 | ) | | | 1.70 | | | | 2.19 | | | | (3.36 | ) | | | 1.45 | |
Distributions to shareholders from | | | | | | | | | | | | | | | | | | | | |
Net realized gains | | | 0.00 | | | | 0.00 | | | | 0.00 | | | | (2.17 | ) | | | (1.72 | ) |
Net asset value, end of period | | $ | 7.68 | | | $ | 8.05 | | | $ | 6.35 | | | $ | 4.16 | | | $ | 9.69 | |
Total return | | | (4.60 | )% | | | 26.77 | % | | | 52.64 | % | | | (41.42 | )% | | | 13.81 | % |
Ratios to average net assets (annualized) | | | | | | | | | | | | | | | | | | | | |
Gross expenses | | | 1.20 | % | | | 1.22 | % | | | 1.26 | % | | | 1.26 | % | | | 1.22 | % |
Net expenses | | | 1.19 | % | | | 1.20 | % | | | 1.20 | % | | | 1.20 | % | | | 1.20 | % |
Net investment loss | | | (0.98 | )% | | | (0.82 | )% | | | (0.69 | )% | | | (0.73 | )% | | | (0.73 | )% |
Supplemental data | | | | | | | | | | | | | | | | | | | | |
Portfolio turnover rate | | | 118 | % | | | 71 | % | | | 75 | % | | | 76 | % | | | 121 | % |
Net assets, end of period (000’s omitted) | | | $203,348 | | | | $247,246 | | | | $185,345 | | | | $109,996 | | | | $221,394 | |
| 1. | After the close of business on July 16, 2010, existing shares of the Fund were renamed Class 2 shares. |
The accompanying notes are an integral part of these financial statements.
| | | | |
| 20 | | Wells Fargo Advantage VT Small Cap Growth Fund | | Notes to Financial Statements |
1. ORGANIZATION
Wells Fargo Variable Trust (the “Trust”), a Delaware statutory trust organized on March 10, 1999, is an open-end management investment company registered under the Investment Company Act of 1940, as amended (the “1940 Act”). These financial statements report on Wells Fargo Advantage VT Small Cap Growth Fund (the “Fund”) which is a diversified series of the Trust.
2. SIGNIFICANT ACCOUNTING POLICIES
The following significant accounting policies, which are consistently followed in the preparation of the financial statements of the Fund, are in conformity with U.S. generally accepted accounting principles which require management to make estimates and assumptions that affect the reported amounts of assets and liabilities, disclosure of contingent assets and liabilities at the date of the financial statements, and the reported amounts of revenues and expenses during the reporting period. Actual results could differ from those estimates.
Securities valuation
Investments in equity securities are valued each business day as of the close of regular trading on the New York Stock Exchange, which is usually 4:00 p.m. (Eastern Time). Securities which are traded on a national or foreign securities exchange are valued at the last reported sales price, except that securities listed on The Nasdaq Stock Market, Inc. (“Nasdaq”) are valued at the Nasdaq Official Closing Price (“NOCP”), and if no NOCP is available, then at the last reported sales price. If no sales price is shown on the Nasdaq, the bid price will be used. In the absence of any sale of securities listed on the Nasdaq, and in the case of other securities (including U.S. Government obligations, but excluding debt securities maturing in 60 days or less), the price will be deemed “stale” and the valuations will be determined in accordance with the Fund’s Fair Value Procedures.
Fixed income securities with maturities exceeding 60 days are valued based on available evaluated prices received from an independent pricing service approved by the Board of Trustees which may utilize both transaction data and market information such as yield, prices of securities of comparable quality, coupon rate, maturity, type of issue, trading characteristics and other market data. If valuations are not available from the pricing service or values received are deemed not representative of market value, values will be obtained from a third party broker-dealer or determined based on the Fund’s Fair Value Procedures.
Debt securities of sufficient credit quality with original maturities of 60 days or less generally are valued at amortized cost which approximates fair value. The amortized cost method involves valuing a security at its cost, plus accretion of discount or minus amortization of premium over the period until maturity.
Investments in open-end mutual funds and non-registered investment companies are generally valued at net asset value.
Investments which are not valued using any of the methods discussed above, are valued at their fair value, as determined by procedures established in good faith and approved by the Board of Trustees.
Security loans
The Fund may lend its securities from time to time in order to earn additional income in the form of fees or interest on securities received as collateral or the investment of any cash received as collateral. The Fund continues to receive interest or dividends on the securities loaned. The Fund receives collateral in the form of cash or securities with a value at least equal to the value of the securities on loan. The value of the loaned securities is determined at the close of each business day and any additional required collateral is delivered to the Fund on the next business day. In a securities lending transaction, the net asset value of the Fund will be affected by an increase or decrease in the value of the securities loaned and by an increase or decrease in the value of the instrument in which collateral is invested. The amount of securities lending activity undertaken by the Fund fluctuates from time to time. In the event of default or bankruptcy by the borrower, the Fund may be prevented from recovering the loaned securities or gaining access to the collateral or may experience delays or costs in doing so. In addition, the investment of any cash collateral received may lose all or part of its value. The Fund has the right under the lending agreement to recover the securities from the borrower on demand.
The Fund lends its securities through an unaffiliated securities lending agent. Cash collateral received in connection with its securities lending transactions is invested in Wells Fargo Securities Lending Cash Investments, LLC (the “Cash Collateral Fund”). The Cash Collateral Fund is exempt from registration under Section 3(c)(7) of the 1940 Act and is managed by
| | | | | | |
| Notes to Financial Statements | | Wells Fargo Advantage VT Small Cap Growth Fund | | | 21 | |
Wells Fargo Funds Management LLC (“Funds Management”) and is sub-advised by Wells Capital Management Incorporated (“Wells Capital Management”). Funds Management receives an advisory fee starting at 0.05% and declining to 0.01% as the average daily net assets of the Cash Collateral Fund increase. All of the fees received by Funds Management are paid to Wells Capital Management for its services as sub-adviser. The Cash Collateral Fund seeks to provide a positive return compared to the daily Fed Funds Open rate by investing in high-quality, U.S. dollar-denominated short-term money market instruments. Cash Collateral Fund investments are fair valued based upon the amortized cost valuation technique. Income earned from investment in the Cash Collateral Fund is included in securities lending income on the Statement of Operations.
For Wells Fargo Advantage Funds that participated in securities lending activity prior to February 13, 2009, certain structured investment vehicles purchased in a joint account by the former securities lending agent defaulted or were impaired. Certain of the Wells Fargo Advantage Funds still hold ownership interest in these structured investment vehicles, which have since been restructured as pass-through securities. If the Fund holds an ownership interest in such pass-through securities, information regarding this ownership interest can be found in the Portfolio of Investments under the category “Other”.
Security transactions and income recognition
Securities transactions are recorded on a trade date basis. Realized gains or losses are reported on the basis of identified cost of securities delivered.
Dividend income is recognized on the ex-dividend date. Dividend income is recorded net of foreign taxes withheld where recovery of such taxes is not assured.
Distributions to shareholders
Distributions to shareholders from net investment income and net realized gains, if any, are recorded on the ex-dividend date. Such distributions are determined in conformity with income tax regulations, which may differ from generally accepted accounting principles.
The timing and character of distributions made during the period from net investment income or net realized gains may differ from their ultimate characterization for federal income tax purposes. To the extent that these differences are permanent in nature, such amounts are reclassified within the capital accounts based on their federal tax-basis treatment. Temporary differences do not require reclassifications. The primary permanent differences causing such reclassifications are due to net operating losses and recognition of partnership income. At December 31, 2011, as a result of permanent book-to-tax differences, the following reclassification adjustments were made on the Statement of Assets and Liabilities:
| | | | |
| Paid-in Capital | | Undistributed Net Investment Loss | | Accumulated Net Realized Gains on Investments |
| $(2,437,757) | | $2,498,832 | | $(61,075) |
Federal and other taxes
The Fund intends to continue to qualify as a regulated investment company by distributing substantially all of its investment company taxable income and any net realized capital gains (after reduction for capital loss carryforwards) sufficient to relieve it from all, or substantially all, federal income taxes. Accordingly, no provision for federal income taxes was required.
The Fund’s income and federal excise tax returns and all financial records supporting those returns for the prior three fiscal years are subject to examination by the federal and Delaware revenue authorities.
Under the recently enacted Regulated Investment Company Modernization Act of 2010, the Fund is permitted to carry forward capital losses incurred in taxable years which began after December 22, 2010 for an unlimited period. However, any losses incurred are required to be utilized prior to the losses incurred in pre-enactment taxable years. As a result of this ordering rule, pre-enactment capital loss carryforwards may be more likely to expire unused. Additionally, post-enactment capital losses that are carried forward will retain their character as either short-term or long-term capital losses rather than being considered all short-term as under previous law.
| | | | |
| 22 | | Wells Fargo Advantage VT Small Cap Growth Fund | | Notes to Financial Statements |
As of December 31, 2011, the Fund had net capital loss carryforwards, which are available to offset future net realized capital gains, in the amount of $1,304,250 expiring in 2016.
Class allocations
The separate classes of shares offered by the Fund differ principally in distribution fees. Shareholders of each class bear certain expenses that pertain to that particular class. All shareholders bear the common expenses of the Fund, earn income from the portfolio, and are allocated unrealized gains and losses pro rata based on the average daily net assets of each class, without distinction between share classes. Dividends are determined separately for each class based on income and expenses allocable to each class. Realized gains and losses are allocated to each class pro rata based upon the net assets of each class on the date realized. Differences in per share dividend rates generally result from the relative weightings of pro rata income and realized gain allocations and from differences in separate class expenses, including distribution fees.
3. FAIR VALUATION MEASUREMENTS
Fair value measurements of investments are determined within a framework that has established a fair value hierarchy based upon the various data inputs utilized in determining the value of the Fund’s investments. The three-level hierarchy gives the highest priority to unadjusted quoted prices in active markets for identical assets or liabilities (Level 1) and the lowest priority to significant unobservable inputs (Level 3). The Fund’s investments are classified within the fair value hierarchy based on the lowest level of input that is significant to the fair value measurement. The inputs are summarized into three broad levels as follows:
| n | | Level 1 – quoted prices in active markets for identical securities |
| n | | Level 2 – other significant observable inputs (including quoted prices for similar securities, interest rates, prepayment speeds, credit risk, etc.) |
| n | | Level 3 – significant unobservable inputs (including the Fund’s own assumptions in determining the fair value of investments) |
The inputs or methodologies used for valuing securities are not necessarily an indication of the risk associated with investing in those securities.
As of December 31, 2011, the inputs used in valuing the Fund’s assets, which are carried at fair value, were as follows:
| | | | | | | | | | | | | | | | |
| Investments in Securities | | Quoted Prices (Level 1) | | | Significant Other
Observable Inputs (Level 2) | | | Significant Unobservable Inputs (Level 3) | | | Total | |
Equity securities | | | | | | | | | | | | | | | | |
Common stocks | | $ | 222,303,946 | | | $ | 0 | | | $ | 0 | | | $ | 222,303,946 | |
Investment companies | | | 1,654,530 | | | | 0 | | | | 0 | | | | 1,654,530 | |
Other | | | 0 | | | | 0 | | | | 669,150 | | | | 669,150 | |
Short-term investments | | | | | | | | | | | | | | | | |
Investment companies | | | 8,556,778 | | | | 58,280,776 | | | | 0 | | | | 66,837,554 | |
| | | $ | 232,515,254 | | | $ | 58,280,776 | | | $ | 669,150 | | | $ | 291,465,180 | |
Further details on the major security types listed above can be found in the Portfolio of Investments.
Transfers in and transfers out are recognized at the end of the reporting period. For the year ended December 31, 2011, the Fund did not have any significant transfers into/out of Level 1 and Level 2.
| | | | | | |
| Notes to Financial Statements | | Wells Fargo Advantage VT Small Cap Growth Fund | | | 23 | |
The following is a reconciliation of assets in which significant unobservable inputs (Level 3) were used in determining fair value:
| | | | |
| | | Other | |
Balance as of December 31, 2010 | | $ | 1,102,424 | |
Accrued discounts (premiums) | | | 0 | |
Realized gains (losses) | | | 0 | |
Change in unrealized gains (losses) | | | (59,242 | ) |
Purchases | | | 0 | |
Sales | | | (374,032 | ) |
Transfers into Level 3 | | | 0 | |
Transfers out of Level 3 | | | 0 | |
Balance as of December 31, 2011 | | $ | 669,150 | |
Change in unrealized gains (losses)
relating to securities still held at December 31, 2011 | | $ | (238,433 | ) |
4. TRANSACTIONS WITH AFFILIATES AND OTHER EXPENSES
Advisory fee
The Trust has entered into an advisory contract with Funds Management, an indirect wholly owned subsidiary of Wells Fargo & Company (“Wells Fargo”). The adviser is responsible for implementing investment policies and guidelines and for supervising the sub-adviser, who is responsible for day-to-day portfolio management of the Fund.
Pursuant to the contract, Funds Management is entitled to receive an annual advisory fee starting at 0.75% and declining to 0.60% as the average daily net assets of the Fund increase. For the year ended December 31, 2011, the advisory fee was equivalent to an annual rate of 0.75% of the Fund’s average daily net assets.
Funds Management may retain the services of certain sub-advisers to provide daily portfolio management to the Fund. The fees related to sub-advisory services are borne directly by Funds Management and do not increase the overall fees paid by the Fund. Wells Capital Management, an affiliate of Funds Management, is the sub-adviser to the Fund and is entitled to receive a fee from Funds Management at an annual rate starting at 0.55% and declining to 0.40% as the average daily net assets of the Fund increase.
Administration and transfer agent fees
The Trust has entered into an administration agreement with Funds Management. Under this agreement, for providing administrative services, which includes paying fees and expenses for services provided by the transfer agent, sub-transfer agents, omnibus account servicers and record-keepers, Funds Management is entitled to receive from the Fund an annual fund level administration fee starting at 0.05% and declining to 0.03% as the average daily net assets of the Fund increase and a class level administration fee of 0.08% of the average daily net assets of each class.
Funds Management has contractually waived and/or reimbursed advisory and administration fees to the extent necessary to maintain certain net operating expense ratios for the Fund. Waiver of fees and/or reimbursement of expenses by Funds Management were made first from fund level expenses on a proportionate basis and then from class specific expenses.
Distribution fees
The Trust has adopted a Distribution Plan for Class 2 shares of the Fund pursuant to Rule 12b-1 under the 1940 Act. Distribution fees are charged to Class 2 shares and paid to Wells Fargo Funds Distributor, LLC, the principal underwriter, at an annual rate of 0.25% of its average daily net assets.
5. INVESTMENT PORTFOLIO TRANSACTIONS
Purchases and sales of investments, excluding U.S. Government obligations (if any) and short-term securities (securities with maturities of one year or less at purchase date), for the year ended December 31, 2011 were $305,876,878 and $341,865,856, respectively.
| | | | |
| 24 | | Wells Fargo Advantage VT Small Cap Growth Fund | | Notes to Financial Statements |
6. ACQUISITION
After the close of business on July 16, 2010, the Fund acquired the net assets of Evergreen VA Growth Fund and renamed its existing shares as Class 2 shares. The purpose of the transaction was to combine two funds with similar investment objectives and strategies. Shareholders holding Class 1 and Class 2 shares of Evergreen VA Growth Fund received Class 1 and Class 2 shares of the Fund in the reorganization. The acquisition was accomplished by a tax-free exchange of all of the shares of Evergreen VA Growth Fund for 6,990,848 shares of the Fund valued at $43,795,570 at an exchange ratio of 1.82 and 1.78 for Class 1 and Class 2 shares, respectively. The investment portfolio of Evergreen VA Growth Fund with a fair value of $43,824,635, identified cost of $43,592,498 and unrealized gains of $232,137 at July 16, 2010 were the principal assets acquired by the Fund. The aggregate net assets of Evergreen VA Growth Fund and the Fund immediately prior to the acquisition were $43,795,570 and $198,568,568, respectively. The aggregate net assets of the Fund immediately after the acquisition were $242,364,138. For financial reporting purposes, assets received and shares issued by the Fund were recorded at fair value; however, the cost basis of the investments received from Evergreen VA Growth Fund was carried forward to align ongoing reporting of the Fund’s realized and unrealized gains and losses with amounts distributable to shareholders for tax purposes.
Assuming the acquisition had been completed January 1, 2010, the beginning of the annual reporting period for the Fund, the pro forma results of operations for the year ended December 31, 2010 would have been:
| | | | |
Net investment loss | | $ | (2,025,264 | ) |
Net realized and unrealized gains on investments | | $ | 61,432,964 | |
Net increase in net assets resulting from operations | | $ | 59,407,700 | |
7. BANK BORROWINGS
The Trust and Wells Fargo Funds Trust (excluding the money market funds) are parties to a $150,000,000 revolving credit agreement with State Street Bank and Trust Company, whereby the Fund is permitted to use bank borrowings for temporary or emergency purposes, such as to fund shareholder redemption requests. Interest under the credit agreement is charged to the Fund based on a borrowing rate equal to the higher of the Federal Funds rate in effect on that day plus 1.25% or the overnight LIBOR rate in effect on that day plus 1.25%. In addition, under the credit agreement, the Fund pays an annual commitment fee equal to 0.10% of the unused balance, which is allocated pro rata. Prior to September 6, 2011, the revolving credit agreement was for $125,000,000 and the annual commitment fee paid by the Fund was 0.125% of the unused balance. For the year ended December 31, 2011, the Fund paid $678 in commitment fees.
For the year ended December 31, 2011, there were no borrowings by the Fund under the agreement.
8. DISTRIBUTIONS TO SHAREHOLDERS
As of December 31, 2011, the components of distributable earnings on a tax basis were as follows:
| | | | |
Undistributed
Long-Term
Gain | | Unrealized
Gains (Losses) | | Capital Loss
Carryforward |
| $10,863,653 | | $11,385,605 | | $(1,304,250) |
9. INDEMNIFICATION
Under the Trust’s organizational documents, the officers and directors are indemnified against certain liabilities that may arise out of performance of their duties to the Trust. Additionally, in the normal course of business, the Trust may enter into contracts with service providers that contain a variety of indemnification clauses. The Trust’s maximum exposure under these arrangements is dependent on future claims that may be made against the Fund and, therefore, cannot be estimated.
10. NEW ACCOUNTING PRONOUNCEMENTS
In May 2011, the Financial Accounting Standards Board (“FASB”) issued Accounting Standards Update (“ASU”) No. 2011-04 “Amendments to Achieve Common Fair Value Measurement and Disclosure Requirements in U.S. GAAP and IFRSs”. ASU No. 2011-04 amends FASB ASC Topic 820, Fair Value Measurements and Disclosures, to establish common requirements for measuring fair value and for disclosing information about fair value measurements in accordance with GAAP. The ASU is
| | | | | | |
| Notes to Financial Statements | | Wells Fargo Advantage VT Small Cap Growth Fund | | | 25 | |
effective prospectively for interim and annual periods beginning after December 15, 2011. Management expects that adoption of the ASU will result in additional disclosures in the financial statements, as applicable.
In April 2011, FASB issued ASU No. 2011-03 “Reconsideration of Effective Control for Repurchase Agreements”. ASU No. 2011-03 amends FASB ASC Topic 860, Transfers and Servicing, specifically the criteria required to determine whether a repurchase agreement (repo) and similar agreements should be accounted for as sales of financial assets or secured borrowings with commitments. ASU No. 2011-03 changes the assessment of effective control by focusing on the transferor’s contractual rights and obligations and removing the criterion to assess its ability to exercise those rights or honor those obligations. This could result in changes to the way entities account for certain transactions including repurchase agreements, mortgage dollar rolls and reverse repurchase agreements. The ASU will become effective on a prospective basis for new transfers and modifications to existing transactions as of the beginning of the first interim or annual period beginning on or after December 15, 2011. Management has evaluated the impact of adopting the ASU and expects no significant changes.
| | | | |
| 26 | | Wells Fargo Advantage VT Small Cap Growth Fund | | Report of Independent Registered Public Accounting Firm |
BOARD OF TRUSTEES AND SHAREHOLDERS OF WELLS FARGO VARIABLE TRUST:
We have audited the accompanying statement of assets and liabilities, including the portfolio of investments, of the Wells Fargo Advantage VT Small Cap Growth Fund (the “Fund”), one of the funds constituting the Wells Fargo Variable Trust, as of December 31, 2011, and the related statement of operations for the year then ended, statements of changes in net assets for each of the years in the two-year period then ended, and the financial highlights for each of the years or periods in the five-year period then ended. These financial statements and financial highlights are the responsibility of the Fund’s management. Our responsibility is to express an opinion on these financial statements and financial highlights based on our audits.
We conducted our audits in accordance with the standards of the Public Company Accounting Oversight Board (United States). Those standards require that we plan and perform the audit to obtain reasonable assurance about whether the financial statements and financial highlights are free of material misstatement. An audit includes examining, on a test basis, evidence supporting the amounts and disclosures in the financial statements. Our procedures included confirmation of securities owned as of December 31, 2011, by correspondence with custodian and brokers, or by other appropriate auditing procedures. An audit also includes assessing the accounting principles used and significant estimates made by management, as well as evaluating the overall financial statement presentation. We believe that our audits provide a reasonable basis for our opinion.
In our opinion, the financial statements and financial highlights referred to above present fairly, in all material respects, the financial position of the Wells Fargo Advantage VT Small Cap Growth Fund as of December 31, 2011, the results of its operations for the year then ended, changes in its net assets for each of the years in the two-year period then ended, and the financial highlights for each of the years or periods in the five-year period then ended, in conformity with U.S. generally accepted accounting principles.

Boston, Massachusetts
February 24, 2012
| | | | | | |
| Other Information (Unaudited) | | Wells Fargo Advantage VT Small Cap Growth Fund | | | 27 | |
PROXY VOTING INFORMATION
A description of the policies and procedures that the Fund uses to determine how to vote proxies relating to portfolio securities is available without charge, upon request, by calling 1-800-222-8222, visiting our Web site at www.wellsfargo.com/advantagefunds, or visiting the SEC Web site at www.sec.gov. Information regarding how the Fund voted proxies relating to portfolio securities during the most recent 12-month period ended June 30 is available without charge on the Fund’s Web site at www.wellsfargo.com/advantagefunds or by visiting the SEC Web site at www.sec.gov.
PORTFOLIO HOLDINGS INFORMATION
The complete portfolio holdings for the Fund are publicly available on the Fund’s Web site (www.wellsfargo.com/advantagefunds) on a monthly, 30-day or more delayed basis. In addition, top ten holdings information for the Fund is publicly available on the Fund’s Web site on a monthly, seven-day or more delayed basis. The Fund files its complete schedule of portfolio holdings with the SEC for the first and third quarters of each fiscal year on Form N-Q, which is available without charge by visiting the SEC Web site at www.sec.gov. In addition, the Fund’s Form N-Q may be reviewed and copied at the SEC’s Public Reference Room in Washington, DC, and at regional offices in New York City, at 233 Broadway, and in Chicago, at 175 West Jackson Boulevard, Suite 900. Information about the Public Reference Room may be obtained by calling 1-800-SEC-0330.
| | | | |
| 28 | | Wells Fargo Advantage VT Small Cap Growth Fund | | Other Information (Unaudited) |
BOARD OF TRUSTEES
The following table provides basic information about the Board of Trustees (the “Trustees”) of the Trust and Officers of the Trust. This table should be read in conjunction with the Prospectus and the Statement of Additional Information1 of the Fund. Each of the Trustees and Officers listed below acts in identical capacities for the Wells Fargo Advantage family of funds, which consists of 138 funds comprising the Wells Fargo Funds Trust, Wells Fargo Variable Trust, Wells Fargo Master Trust and four closed-end funds (collectively the “Fund Complex”). All of the Trustees are also Members of the Audit and Governance Committees of each Trust in the Fund Complex. The mailing address of each Trustee and Officer is 525 Market Street, 12th Floor, San Francisco, CA 94105. Each Trustee and Officer serves an indefinite term, however, each Trustee serves such term until reaching the mandatory retirement age established by the Trustees.
Independent Trustees
| | | | | | |
Name and Year of Birth | | Position Held and Length of Service | | Principal Occupations During Past Five Years | | Other Directorships During
Past Five Years |
Peter G. Gordon
(Born 1942) | | Trustee, since 1998; Chairman, since 2005 (Lead Trustee since 2001) | | Co-Founder, Retired Chairman, President and CEO of Crystal Geyser Water Company. Trustee Emeritus, Colby College | | Asset Allocation Trust |
Isaiah Harris, Jr.
(Born 1952) | | Trustee, since 2009 | | Retired. Prior thereto, President and CEO of BellSouth Advertising and Publishing Corp. from 2005 to 2007, President and CEO of BellSouth Enterprises from 2004 to 2005 and President of BellSouth Consumer Services from 2000 to 2003. Emeritus member of the Iowa State University Foundation Board of Governors. Emeritus Member of the Advisory Board of Iowa State University School of Business. Mr. Harris is a certified public accountant. | | CIGNA Corporation; Deluxe Corporation; Asset Allocation Trust |
Judith M. Johnson
(Born 1949) | | Trustee, since 2008 | | Retired. Prior thereto, Chief Executive Officer and Chief Investment Officer of Minneapolis Employees Retirement Fund from 1996 to 2008. Ms. Johnson is an attorney, certified public accountant and a certified managerial accountant. | | Asset Allocation Trust |
Leroy Keith, Jr.
(Born 1939) | | Trustee, since 2010 | | Chairman, Bloc Global Services (development and construction). Trustee of the Evergreen Funds from 1983 to 2010. Former Managing Director, Almanac Capital Management (commodities firm), former Partner, Stonington Partners, Inc. (private equity fund), former Director, Obagi Medical Products Co. and former Director, Lincoln Educational Services. | | Trustee, Virtus Fund Complex (consisting of 40 portfolios as of 12/31/11); Asset Allocation Trust |
David F. Larcker
(Born 1950) | | Trustee, since 2009 | | James Irvin Miller Professor of Accounting at the Graduate School of Business, Stanford University, Director of Corporate Governance Research Program and Senior Faculty of The Rock Center for Corporate Governance since 2006. From 2005 to 2008, Professor of Accounting at the Graduate School of Business, Stanford University. Prior thereto, Ernst & Young Professor of Accounting at The Wharton School, University of Pennsylvania from 1985 to 2005. | | Asset Allocation Trust |
Olivia S. Mitchell
(Born 1953) | | Trustee, since 2006 | | International Foundation of Employee Benefit Plans Professor, Wharton School of the University of Pennsylvania since 1993. Director of Wharton’s Pension Research Council and Boettner Center on Pensions & Retirement Research, and Research Associate at the National Bureau of Economic Research. Previously, Cornell University Professor from 1978 to 1993. | | Asset Allocation Trust |
| | | | | | |
| Other Information (Unaudited) | | Wells Fargo Advantage VT Small Cap Growth Fund | | | 29 | |
| | | | | | |
Name and Year of Birth | | Position Held and Length of Service | | Principal Occupations During Past Five Years | | Other Directorships During
Past Five Years |
Timothy J. Penny
(Born 1951) | | Trustee, since 1996 | | President and CEO of Southern Minnesota Initiative Foundation, a non-profit organization, since 2007 and Senior Fellow at the Humphrey Institute Policy Forum at the University of Minnesota since 1995. Member of the Board of Trustees of NorthStar Education Finance, Inc., a non-profit organization, since 2007. | | Asset Allocation Trust |
Michael S. Scofield
(Born 1943) | | Trustee, since 2010 | | Served on the Investment Company Institute’s Board of Governors and Executive Committee from 2008-2011 as well the Governing Council of the Independent Directors Council from 2006-2011 and the Independent Directors Council Executive Committee from 2008-2011. Chairman of the IDC from 2008-2010. Institutional Investor (Fund Directions) Trustee of Year in 2007. Trustee of the Evergreen Funds (and its predecessors) from 1984 to 2010. Chairman of the Evergreen Funds from 2000-2010. Former Trustee of the Mentor Funds. Retired Attorney, Law Offices of Michael S. Scofield and former Director and Chairman, Branded Media Corporation (multi-media branding company). | | Asset Allocation Trust |
Donald C. Willeke
(Born 1940) | | Trustee, since 1996 | | Principal of the law firm of Willeke & Daniels. General Counsel of the Minneapolis Employees Retirement Fund from 1984 until its consolidation into the Minnesota Public Employees Retirement Association on June 30, 2010. Director and Vice Chair of The Free Trust (non-profit corporation). Director of the American Chestnut Foundation (non-profit corporation). | | Asset Allocation Trust |
Officers
| | | | | | |
Name and Year of Birth | | Position Held and
Length of Service | | Principal Occupations During Past Five Years | | |
Karla M. Rabusch
(Born 1959) | | President, since 2003 | | Executive Vice President of Wells Fargo Bank, N.A. and President of Wells Fargo Funds Management, LLC since 2003. Senior Vice President and Chief Administrative Officer of Wells Fargo Funds Management, LLC from 2001 to 2003. | | |
C. David Messman
(Born 1960) | | Secretary, since 2000; Chief Legal Counsel, since 2003 | | Senior Vice President and Secretary of Wells Fargo Funds Management, LLC since 2001. Vice President and Managing Senior Counsel of Wells Fargo Bank, N.A. since 1996. | | |
Kasey Phillips
(Born 1970) | | Treasurer, since 2009 | | Senior Vice President of Wells Fargo Funds Management, LLC since 2009. Senior Vice President of Evergreen Investment Management Company, LLC from 2006 to 2010. Treasurer of the Evergreen Funds from 2005 to 2010. | | |
David Berardi
(Born 1975) | | Assistant Treasurer, since 2009 | | Vice President of Wells Fargo Funds Management, LLC since 2009. Vice President of Evergreen Investment Management Company, LLC from 2008 to 2010. Assistant Vice President of Evergreen Investment Services, Inc. from 2004 to 2008. Manager of Fund Reporting and Control for Evergreen Investment Management Company, LLC from 2004 to 2010. | | |
Jeremy DePalma
(Born 1974) | | Assistant Treasurer, since 2009 | | Senior Vice President of Wells Fargo Funds Management, LLC since 2009. Senior Vice President of Evergreen Investment Management Company, LLC from 2008 to 2010. Vice President, Evergreen Investment Services, Inc. from 2004 to 2007. Head of the Fund Reporting and Control Team within Fund Administration from 2005 to 2010. | | |
Debra Ann Early
(Born 1964) | | Chief Compliance Officer, since 2007 | | Chief Compliance Officer of Wells Fargo Funds Management, LLC since 2007. Chief Compliance Officer of Parnassus Investments from 2005 to 2007. Chief Financial Officer of Parnassus Investments from 2004 to 2007 and Senior Audit Manager of PricewaterhouseCoopers LLP from 1998 to 2004. | | |
| 1. | The Statement of Additional Information includes additional information about the Trustees and is available, without charge, upon request, by calling 1-800-222-8222 or by visiting the Web site at www.wellsfargo.com/advantagefunds. |
| | | | |
| 30 | | Wells Fargo Advantage VT Small Cap Growth Fund | | List of Abbreviations |
The following is a list of common abbreviations for terms and entities which may have appeared in this report.
| ACB | — Agricultural Credit Bank |
| ADR | — American Depository Receipt |
| ADS | — American Depository Shares |
| AGC-ICC | — Assured Guaranty Corporation - Insured Custody Certificates |
| AGM | — Assured Guaranty Municipal |
| AMBAC | — American Municipal Bond Assurance Corporation |
| AMT | — Alternative Minimum Tax |
| BAN | — Bond Anticipation Notes |
| BHAC | — Berkshire Hathaway Assurance Corporation |
| CAB | — Capital Appreciation Bond |
| CCAB | — Convertible Capital Appreciation Bond |
| CDA | — Community Development Authority |
| CDO | — Collateralized Debt Obligation |
| COP | — Certificate of Participation |
| DRIVER | — Derivative Inverse Tax-Exempt Receipts |
| DW&P | — Department of Water & Power |
| DWR | — Department of Water Resources |
| ECFA | — Educational & Cultural Facilities Authority |
| EDA | — Economic Development Authority |
| EDFA | — Economic Development Finance Authority |
| ETF | — Exchange-Traded Fund |
| FFCB | — Federal Farm Credit Bank |
| FGIC | — Financial Guaranty Insurance Corporation |
| FHA | — Federal Housing Authority |
| FHLB | — Federal Home Loan Bank |
| FHLMC | — Federal Home Loan Mortgage Corporation |
| FNMA | — Federal National Mortgage Association |
| GDR | — Global Depository Receipt |
| GNMA | — Government National Mortgage Association |
| HCFR | — Healthcare Facilities Revenue |
| HEFA | — Health & Educational Facilities Authority |
| HEFAR | — Higher Education Facilities Authority Revenue |
| HFA | — Housing Finance Authority |
| HFFA | — Health Facilities Financing Authority |
| IBC | — Insured Bond Certificate |
| IDA | — Industrial Development Authority |
| IDAG | — Industrial Development Agency |
| IDR | — Industrial Development Revenue |
| KRW | — Republic of Korea Won |
| LIBOR | — London Interbank Offered Rate |
| LLC | — Limited Liability Company |
| LLP | — Limited Liability Partnership |
| MBIA | — Municipal Bond Insurance Association |
| MFHR | — Multi-Family Housing Revenue |
| MUD | — Municipal Utility District |
| NATL-RE | — National Public Finance Guarantee Corporation |
| PCFA | — Pollution Control Finance Authority |
| PCR | — Pollution Control Revenue |
| PFA | — Public Finance Authority |
| PFFA | — Public Facilities Financing Authority |
| PFOTER | — Puttable Floating Option Tax-Exempt Receipts |
| plc | — Public Limited Company |
| PUTTER | — Puttable Tax-Exempt Receipts |
| R&D | — Research & Development |
| RDA | — Redevelopment Authority |
| RDFA | — Redevelopment Finance Authority |
| REIT | — Real Estate Investment Trust |
| ROC | — Reset Option Certificates |
| SAVRS | — Select Auction Variable Rate Securities |
| SBA | — Small Business Authority |
| SFHR | — Single Family Housing Revenue |
| SFMR | — Single Family Mortgage Revenue |
| SPDR | — Standard & Poor’s Depositary Receipts |
| TAN | — Tax Anticipation Notes |
| TIPS | — Treasury Inflation-Protected Securities |
| TRAN | — Tax Revenue Anticipation Notes |
| TCR | — Transferable Custody Receipts |
| TTFA | — Transportation Trust Fund Authority |
| TVA | — Tennessee Valley Authority |
| XLCA | — XL Capital Assurance |


FOR MORE INFORMATION
More information about Wells Fargo Advantage Funds is available free upon request. To obtain literature, please write, e-mail, visit the Fund’s Web site, or call:
Wells Fargo Advantage Funds
P.O. Box 8266
Boston, MA 02266-8266
E-mail: wfaf@wellsfargo.com
Web site: www.wellsfargo.com/advantagefunds
Individual investors: 1-800-222-8222
Retail investment professionals: 1-888-877-9275
Institutional investment professionals: 1-866-765-0778
This report and the financial statements contained herein are submitted for the general information of the shareholders of Wells Fargo Advantage Funds. If this report is used for promotional purposes, distribution of the report must be accompanied or preceded by a current prospectus. For a prospectus containing more complete information, including charges and expenses, call 1-800-222-8222 or visit the Fund’s Web site at www.wellsfargo.com/advantagefunds. Please consider the investment objectives, risks, charges, and expenses of the investment carefully before investing. This and other information about Wells Fargo Advantage Funds can be found in the current prospectus. Read the prospectus carefully before you invest or send money.
Wells Fargo Funds Management, LLC, a wholly owned subsidiary of Wells Fargo & Company, provides investment advisory and administrative services for Wells Fargo Advantage Funds. Other affiliates of Wells Fargo & Company provide subadvisory and other services for the Funds. The Funds are distributed by Wells Fargo Funds Distributor, LLC, Member FINRA/SIPC, an affiliate of Wells Fargo & Company.
NOT FDIC INSURED ¡ NO BANK GUARANTEE ¡ MAY LOSE VALUE
© 2012 Wells Fargo Funds Management, LLC. All rights reserved.
| | |
| | 207577 02-12 AVT7/AR153 12-11 |

Wells Fargo Advantage
VT Small Cap Value Fund

Annual Report
December 31, 2011
Reduce clutter. Save trees.
Sign up for electronic delivery of prospectuses and shareholder reports at www.wellsfargo.com/advantagedelivery
Contents
The views expressed and any forward-looking statements are as of December 31, 2011, unless otherwise noted, and are those of the Fund managers and/or Wells Fargo Funds Management, LLC. Discussions of individual securities, or the markets generally, or any Wells Fargo Advantage Fund are not intended as individual recommendations. Future events or results may vary significantly from those expressed in any forward-looking statements; the views expressed are subject to change at any time in response to changing circumstances in the market. Wells Fargo Funds Management, LLC, disclaims any obligation to publicly update or revise any views expressed or forward-looking statements.
NOT FDIC INSURED ¡ NO BANK GUARANTEE ¡ MAY LOSE VALUE

WELLS FARGO INVESTMENT HISTORY
| | |
| |
| 1932 | | Keystone creates one of the first mutual fund families. |
| |
| 1971 | | Wells Fargo & Company introduces one of the first institutional index funds. |
| |
| 1978 | | Wells Fargo applies Markowitz and Sharpe’s research on Modern Portfolio Theory to introduce one of the industry’s first Tactical Asset Allocation (TAA) models in institutional separately managed accounts. |
| |
| 1984 | | Wells Fargo Stagecoach Funds launches its first asset allocation fund. |
| |
| 1989 | | The Tactical Asset Allocation (TAA) Model is first applied to Wells Fargo’s asset allocation mutual funds. |
| |
| 1994 | | Wells Fargo introduces the LifePath Funds, one of the first suites of target date funds (now the Wells Fargo Advantage Dow Jones Target Date FundsSM ). |
| |
| 1996 | | Evergreen Investments and Keystone Funds merge. |
| |
| 1997 | | Wells Fargo launches Wells Fargo Advantage WealthBuilder PortfoliosSM, a fund-of-funds suite of products that includes the use of quantitative models to shift assets among investment styles. |
| |
| 1999 | | Norwest Advantage Funds and Stagecoach Funds are reorganized into Wells Fargo Funds after the merger of Norwest and Wells Fargo. |
| |
| 2002 | | Evergreen Retail and Evergreen Institutional companies form the umbrella asset management company, Evergreen Investments. |
| |
| 2005 | | The integration of Strong Funds with Wells Fargo Funds creates Wells Fargo Advantage Funds, resulting in one of the top 20 mutual fund companies in the United States. |
| |
| 2006 | | Wells Fargo Advantage Funds relaunches the target date product line as Wells Fargo Advantage Dow Jones Target Date Funds. |
| |
| 2010 | | The mergers and reorganizations of Evergreen and Wells Fargo Advantage mutual funds are completed, unifying the families under the brand of Wells Fargo Advantage Funds. |
Wells Fargo Advantage Funds®
Wells Fargo Advantage Funds skillfully guides institutions, financial advisors, and individuals through the investment terrain to help them reach their financial objectives. Everything we do on behalf of investors is backed by our unique combination of qualifications.
Strength
Our organization is built on the standards of integrity and service established by our parent company—Wells Fargo & Company—more than 150 years ago. And, because we’re part of a highly diversified financial enterprise, we offer the depth of resources to help investors succeed.
Expertise
Our multi-boutique model offers investors access to the independent thinking of premier investment managers that have been chosen for their time-tested strategies. While each team specializes in a specific investment strategy, collectively they provide investors a wide choice of distinct investment styles. Our dedication to investment excellence doesn’t end with our expertise in manager selection—risk management, analysis, and rigorous ongoing review seek to ensure each manager’s investment process remains consistent.
Partnership
Our collaborative approach is built around understanding the needs and goals of our clients. By adhering to core principles of sound judgment and steady guidance, we support you through every stage of the investment decision process.
Carefully consider a fund’s investment objectives, risks, charges, and expenses before investing. For a current prospectus and, if available, a summary prospectus, containing this and other information, visit wellsfargo.com/advantagefunds. Read it carefully before investing.
Wells Fargo Funds Management, LLC, a wholly owned subsidiary of Wells Fargo & Company, provides investment advisory and administrative services for Wells Fargo Advantage Funds®. Other affiliates of Wells Fargo & Company provide subadvisory and other services for the Funds. The Funds are distributed by Wells Fargo Funds Distributor, LLC, Member FINRA/SIPC, an affiliate of Wells Fargo & Company.
“Dow Jones®” and “Dow Jones Target Date IndexesSM” are service marks of Dow Jones Trademark Holdings, LLC (“Dow Jones”), have been licensed to CME Group Index Services LLC (“CME Indexes”) and have been sublicensed for use for certain purposes by Global Index Advisors, Inc, and Wells Fargo Funds Management, LLC. The Wells Fargo Advantage Dow Jones Target Date FundsSM based on the Dow Jones Target Date IndexesSM, are not sponsored, endorsed, sold or promoted by Dow Jones, CME Indexes or their respective affiliates and none of them makes any representation regarding the advisability of investing in such product(s).
NOT FDIC INSURED ¡ NO BANK GUARANTEE ¡ MAY LOSE VALUE
Not part of the annual report.
Wells Fargo Advantage Funds offers more than 110 mutual funds across a wide range of asset classes, representing over $216 billion in assets under management, as of December 31, 2011.
| | | | |
| Equity Funds | | | | |
Asia Pacific Fund | | Global Opportunities Fund | | Premier Large Company Growth Fund |
C&B Large Cap Value Fund | | Growth Fund | | Small Cap Opportunities Fund |
C&B Mid Cap Value Fund | | Health Care Fund | | Small Cap Value Fund |
Capital Growth Fund | | Index Fund | | Small Company Growth Fund |
Common Stock Fund | | International Equity Fund | | Small Company Value Fund |
Disciplined U.S. Core Fund | | International Value Fund | | Small/Mid Cap Core Fund |
Discovery Fund† | | Intrinsic Small Cap Value Fund | | Small/Mid Cap Value Fund |
Diversified Equity Fund | | Intrinsic Value Fund | | Social Sustainability Fund† |
Diversified International Fund | | Intrinsic World Equity Fund | | Special Mid Cap Value Fund |
Diversified Small Cap Fund | | Large Cap Core Fund | | Special Small Cap Value Fund |
Emerging Growth Fund | | Large Cap Growth Fund | | Specialized Technology Fund |
Emerging Markets Equity Fund | | Large Company Value Fund | | Strategic Large Cap Growth Fund |
Endeavor Select Fund† | | Omega Growth Fund | | Traditional Small Cap Growth Fund |
Enterprise Fund† | | Opportunity Fund† | | Utility and Telecommunications Fund |
Equity Value Fund | | Precious Metals Fund | | |
| Bond Funds | | | | |
Adjustable Rate Government Fund | | Inflation-Protected Bond Fund | | Short-Term Bond Fund |
California Limited-Term Tax-Free Fund | | Intermediate Tax/AMT-Free Fund | | Short-Term High Yield Bond Fund |
California Tax-Free Fund | | International Bond Fund | | Short-Term Municipal Bond Fund |
Colorado Tax-Free Fund | | Minnesota Tax-Free Fund | | Strategic Municipal Bond Fund |
Government Securities Fund | | Municipal Bond Fund | | Total Return Bond Fund |
High Income Fund | | North Carolina Tax-Free Fund | | Ultra Short-Term Income Fund |
High Yield Bond Fund | | Pennsylvania Tax-Free Fund | | Ultra Short-Term Municipal Income Fund |
Income Plus Fund | | Short Duration Government Bond Fund | | Wisconsin Tax-Free Fund |
| Asset Allocation Funds | | | | |
Asset Allocation Fund | | WealthBuilder Equity Portfolio† | | Target 2020 Fund† |
Conservative Allocation Fund | | WealthBuilder Growth Allocation Portfolio† | | Target 2025 Fund† |
Diversified Capital Builder Fund | | WealthBuilder Growth Balanced Portfolio† | | Target 2030 Fund† |
Diversified Income Builder Fund | | WealthBuilder Moderate Balanced Portfolio† | | Target 2035 Fund† |
Growth Balanced Fund | | WealthBuilder Tactical Equity Portfolio† | | Target 2040 Fund† |
Index Asset Allocation Fund | | Target Today Fund† | | Target 2045 Fund† |
Moderate Balanced Fund | | Target 2010 Fund† | | Target 2050 Fund† |
WealthBuilder Conservative Allocation Portfolio† | | Target 2015 Fund† | | Target 2055 Fund† |
| Money Market Funds | | | | |
100% Treasury Money Market Fund | | Heritage Money Market Fund† | | National Tax-Free Money Market Fund |
California Municipal Money Market Fund | | Money Market Fund | | Prime Investment Money Market Fund |
Cash Investment Money Market Fund | | Municipal Cash Management Money Market Fund | | Treasury Plus Money Market Fund |
Government Money Market Fund | | Municipal Money Market Fund | | |
| Variable Trust Funds1 | | | | |
VT Discovery Fund† | | VT Intrinsic Value Fund | | VT Small Cap Growth Fund |
VT Index Asset Allocation Fund | | VT Omega Growth Fund | | VT Small Cap Value Fund |
VT International Equity Fund | | VT Opportunity Fund† | | VT Total Return Bond Fund |
An investment in a money market fund is not insured or guaranteed by the Federal Deposit Insurance Corporation or any other government agency. Although the Wells Fargo Advantage Money Market Funds seek to preserve the value of your investment at $1.00 per share, it is possible to lose money by investing in a money market fund.
| 1. | The Variable Trust Funds are generally available only through insurance company variable contracts. |
| † | In this report, the Wells Fargo Advantage Discovery FundSM, Wells Fargo Advantage Endeavor Select FundSM, Wells Fargo Advantage Enterprise FundSM, Wells Fargo Advantage Opportunity FundSM, Wells Fargo Advantage Social Sustainability FundSM, Wells Fargo Advantage WealthBuilder Conservative Allocation PortfolioSM, Wells Fargo Advantage WealthBuilder Equity PortfolioSM, Wells Fargo Advantage WealthBuilder Growth Allocation PortfolioSM, Wells Fargo Advantage WealthBuilder Growth Balanced PortfolioSM, Wells Fargo Advantage WealthBuilder Moderate Balanced PortfolioSM, Wells Fargo Advantage WealthBuilder Tactical Equity PortfolioSM, Wells Fargo Advantage Dow Jones Target Today FundSM, Wells Fargo Advantage Dow Jones Target 2010 FundSM, Wells Fargo Advantage Dow Jones Target 2015 FundSM, Wells Fargo Advantage Dow Jones Target 2020 FundSM, Wells Fargo Advantage Dow Jones Target 2025 FundSM, Wells Fargo Advantage Dow Jones Target 2030 FundSM, Wells Fargo Advantage Dow Jones Target 2035 FundSM, Wells Fargo Advantage Dow Jones Target 2040 FundSM, Wells Fargo Advantage Dow Jones Target 2045 FundSM, Wells Fargo Advantage Dow Jones Target 2050 FundSM, Wells Fargo Advantage Dow Jones Target 2055 FundSM, Wells Fargo Advantage Heritage Money Market FundSM, Wells Fargo Advantage VT Discovery FundSM, and Wells Fargo Advantage VT Opportunity FundSM are referred to as the Discovery Fund, Endeavor Select Fund, Enterprise Fund, Opportunity Fund, Social Sustainability Fund, WealthBuilder Conservative Allocation Portfolio, WealthBuilder Equity Portfolio, WealthBuilder Growth Allocation Portfolio, WealthBuilder Growth Balanced Portfolio, WealthBuilder Moderate Balanced Portfolio, WealthBuilder Tactical Equity Portfolio, Target Today Fund, Target 2010 Fund, Target 2015 Fund, Target 2020 Fund, Target 2025 Fund, Target 2030 Fund, Target 2035 Fund, Target 2040 Fund, Target 2045 Fund, Target 2050 Fund, Target 2055 Fund, Heritage Money Market Fund, VT Discovery Fund, and VT Opportunity Fund, respectively. |
Not part of the annual report.
| | | | |
| 2 | | Wells Fargo Advantage VT Small Cap Value Fund | | Letter to Shareholders |

Karla M. Rabusch,
President
Wells Fargo Advantage Funds
The U.S. economic recovery that began in mid-2009 progressed throughout the 12-month period, yet the rate of growth remained subpar compared with most previous recovery cycles.
Dear Valued Shareholder:
We’re pleased to offer you this annual report for the Wells Fargo Advantage VT Small Cap Value Fund for the 12-month period that ended December 31, 2011.
For the full 12-month period, most of the major domestic equity indexes posted either modest gains or relatively mild losses. However, the market’s 12-month return figures mask the uneven path that it traced throughout the year as investors had to contend with a variety of global and domestic headwinds. Whatever the future holds, we continue to believe that most investors can benefit from adhering to a well-diversified investment strategy. Over the long-term, such a strategy may allow you to balance risks and opportunities as you pursue your financial goals in a dynamic market landscape.
The economic recovery gained traction as the year progressed.
The U.S. economic recovery that began in mid-2009 progressed throughout the 12-month period, yet the rate of growth remained subpar compared with most previous recovery cycles.
2011 opened on a note of mounting optimism regarding the strength of the recovery, yet a batch of disappointing economic data in the spring and summer cast renewed doubts on the sustainability of the recovery. In September, it was reported that U.S. gross domestic product (GDP) grew at a mere 1.3% annual rate in the second quarter of 2011, following anemic growth at an annual rate of 0.4% in the first quarter. According to the December estimate, GDP growth accelerated to an annual rate of 1.8% in the third quarter, reigniting hopes for a sustainable recovery. Those hopes were buoyed by widespread anticipation of even stronger GDP growth in the fourth quarter. By the end of the 12-month period, few economists believed that the U.S. economy was in danger of sliding back into recession, although many expected a sluggish growth environment in 2012.
The struggling housing and labor markets slowed growth.
As has been the case throughout the recovery, the housing and labor markets continued to restrain economic momentum during 2011.
The beleaguered housing market has arguably exerted the biggest drag on growth. Despite intermittent signs of improvement, ongoing weakness in sales of both new and existing homes has put considerable downward pressure on prices. On the other hand, the labor market took a decided turn for the better in the latter half of the year: initial unemployment claims have eased in recent months, and the private sector has been steadily adding jobs. The pace of hiring, while not brisk, was sufficient to push the U.S. unemployment rate down to 8.5% as of December 2011—still well above its historical average, but at its lowest level since February 2009. Many observers expect the unemployment rate to decline further in 2012, which could act as a tailwind for consumer spending—widely viewed as one of the keys to long-term economic growth.
The Federal Reserve announced that it will keep rates low until 2013.
Consumers have already demonstrated some resilience in their spending—even in the face of higher energy costs. Oil prices skyrocketed in early 2011 before retreating later in the year, only to spike again during the fourth quarter. Yet “core” inflation, which excludes volatile energy and food prices, remained fairly benign throughout the year.
| | | | | | |
| Letter to Shareholders | | Wells Fargo Advantage VT Small Cap Value Fund | | | 3 | |
With inflation in check, the Federal Reserve (Fed) held its target range for the federal funds rate—a proxy for short-term interest rates—steady at 0% to 0.25%. Following its August 9 meeting, the Federal Open Market Committee (FOMC) issued a statement explaining that economic conditions were likely to warrant exceptionally low levels for the federal funds rate through at least mid-2013. In addition, the Fed carried out its second round of quantitative easing (QE2) in an effort to promote a more robust economic expansion. The stimulus program was completed as scheduled in June 2011. In September, the Fed launched yet another stimulus program—dubbed “Operation Twist”—that is designed to keep intermediate- and longer-term yields relatively low. The goal with keeping longer-term rates low is to encourage lending activity to spark business investments and home purchases, which, in turn, may provide support for a more sustainable economic recovery.
Market volatility was a dominant theme throughout most of 2011.
Despite pockets of turbulence sparked by the natural disasters in Japan and geopolitical turmoil in North Africa and the Middle East, the U.S. equity market performed very well from January through April of 2011. Some upbeat economic news, better-than-expected corporate profits, and investor enthusiasm about QE2 were among the catalysts for the market’s four-month advance.
In May and June, the market climate shifted to one of anxiety over the increasingly fragile state of the U.S. and global economies. As spring gave way to summer, investors not only worried that the U.S. might be on the brink of recession, they also feared that Europe’s sovereign debt problems could spiral out of control if a Greek default triggered financial contagion across the continent. In July and August, investor sentiment was further undermined by partisan wrangling over the federal debt ceiling and the Standard & Poor’s downgrade of the U.S. credit rating. The barrage of unsettling headlines led to heightened market volatility and sharply falling stock prices in the third quarter of 2011. Although volatility persisted into the fourth quarter, the market was able to rebound amid improved economic data and hopes for a resolution to the European crisis.
For the full 12-month period, the S&P 500 Index1 of large-cap stocks achieved a total return of 2.1%. The Russell Midcap® Index2 and the Russell 2000® Index3 of small-cap stocks lost 1.6% and 4.2%, respectively. International stocks fared worse than their U.S. counterparts, with the MSCI EAFE Index4 shedding 14.8%.
| 1. | The S&P 500 Index consists of 500 stocks chosen for market size, liquidity, and industry group representation. It is a market-value weighted index with each stock’s weight in the index proportionate to its market value. You cannot invest directly in an index. |
| 2. | The Russell Midcap® Index measures the performance of the 800 smallest companies in the Russell 1000 Index, which represent approximately 25% of the total market capitalization of the Russell 1000® Index. You cannot invest directly in an index. |
| 3. | The Russell 2000® Index measures the performance of the 2,000 smallest companies in the Russell 3000® Index, which represents approximately 8% of the total market capitalization of the Russell 3000 Index. You cannot invest directly in an index. |
| 4. | The Morgan Stanley Capital International Europe, Australasia, and Far East (“MSCI EAFE”) Index is an unmanaged group of securities widely regarded by investors to be representations of the stock markets of Europe, Australasia, and the Far East. You cannot invest directly in an index. Source: MSCI. MSCI makes no express or implied warranties or representations and shall have no liability whatsoever with respect to any MSCI data contained herein. The MSCI data may not be further redistributed or used as a basis for other indexes or any securities or financial products. This report is not approved, reviewed or produced by MSCI. |
| | | | |
| 4 | | Wells Fargo Advantage VT Small Cap Value Fund | | Letter to Shareholders |
The market turmoil of 2011 and an uncertain outlook going forward have left many investors questioning their resolve—and their investments. Yet, it is precisely at such times that the market may present opportunities—as well as challenges—for prudent investors.
Recent events have not altered our message to shareholders.
The market turmoil of 2011 and an uncertain outlook going forward have left many investors questioning their resolve—and their investments. Yet, it is precisely at such times that the market may present opportunities—as well as challenges—for prudent investors. Bear in mind that many investors who indiscriminately sold their equity investments during the severe market downturn of 2008 to 2009 missed out on the impressive two-year rally that followed. In our opinion, the lesson to be learned from these dramatic market events is that, for many investors, simply building and maintaining a well-diversified5 investment plan is the best long-term strategy.
To help you create a sound strategy based on your personal goals and risk tolerance, Wells Fargo Advantage Funds offers more than 110 mutual funds and other investments spanning a broad range of asset classes and investment styles. While diversification cannot guarantee an investment profit or prevent losses, we believe it can be an effective way to manage investment risk and potentially smooth out overall portfolio performance.
Thank you for choosing to invest with Wells Fargo Advantage Funds. We appreciate your confidence in us and remain committed to helping you meet your financial needs. For current information about your fund investments, contact your investment professional, visit our website at www.wellsfargo.com/advantagefunds, or call us directly at 1-800-222-8222. We are available 24 hours a day, 7 days a week.
Sincerely,

Karla M. Rabusch
President
Wells Fargo Advantage Funds
| 5. | Diversification does not assure or guarantee better performance and cannot eliminate the risk of investment losses. |
| | | | | | |
| Performance Highlights (Unaudited) | | Wells Fargo Advantage VT Small Cap Value Fund | | | 5 | |
INVESTMENT OBJECTIVE
The Fund seeks long-term capital appreciation.
ADVISER
Wells Fargo Funds Management, LLC
SUB-ADVISER
Wells Capital Management Incorporated
PORTFOLIO MANAGERS
Erik Astheimer
I. Charles Rinaldi
Michael Schneider, CFA
FUND INCEPTION
October 10, 1997
| | | | |
| 12 MONTH TOTAL RETURN AS OF DECEMBER 31, 2011 | |
Class 2 | | | (7.26)% | |
Russell 2000® Value Index1 | | | (5.50)% | |
Russell 2500™ Value Index2 | | | (3.36)% | |
Figures quoted represent past performance, which is no guarantee of future results and do not reflect the deduction of taxes that a shareholder may pay on fund distributions or the redemption of fund shares. Investment return and principal value of an investment will fluctuate so that an investor’s shares, when redeemed, may be worth more or less than their original cost. Current performance may be lower or higher than the performance data quoted and assumes the reinvestment of dividends and capital gains. Current month-end performance is available by calling 1-866-765-0778. Performance figures of the Fund do not reflect fees charged pursuant to the terms of variable life insurance policies and variable annuity contracts.
Index returns do not include transaction costs associated with buying and selling securities, any mutual fund fees or expenses or any taxes. It is not possible to invest directly in an index.
The Adviser has committed through July 18, 2013 to waive fees and/or reimburse expenses to the extent necessary to cap the Fund’s Total Annual Fund Operating Expenses After Fee Waiver, excluding certain other expenses at 1.14% for Class 2. The Fund’s gross and net expense ratios are 1.34% and 1.16%, respectively, for Class 2 shares. Without these reductions, the Fund’s returns would have been lower.
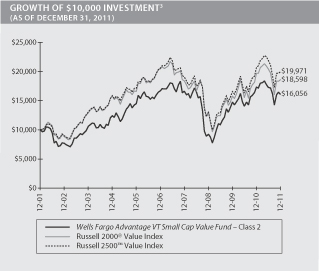
| 1. | The Russell 2000® Value Index measures the performance of those Russell 2000 companies with lower price-to-book ratios and lower forecasted growth values. You cannot invest directly in an index. |
| 2. | The Russell 2500™ Value Index measures the performance of those Russell 2500 companies with lower price-to-book ratios and lower forecasted growth values. You cannot invest directly in an index. |
| 3. | The chart compares the performance of the Wells Fargo Advantage VT Small Cap Value Fund Class 2 for the most recent ten years of the Fund with the Russell 2000 Value Index and the Russell 2500 Value Index. The chart assumes a hypothetical $10,000 investment and reflects all operating expenses of the Fund. Performance figures of the Fund do not reflect fees charged pursuant to the terms of variable life insurance policies and variable annuity contracts. |
| | | | |
| 6 | | Wells Fargo Advantage VT Small Cap Value Fund | | Performance Highlights (Unaudited) |
MANAGER’S DISCUSSION
Fund highlights
| n | | The Fund underperformed its benchmark, the Russell 2000® Value Index, for the 12-month period that ended December 31, 2011, due to weak stock selection in financials and health care. The Fund’s lack of exposure to utilities also contributed to relative underperformance. |
| n | | Energy stocks were the largest relative contributors in the Fund even though the sector was one of the weakest within the benchmark. The Fund’s overweight to precious metals companies contributed to performance, but the weak performance of gold-mining stocks relative to the price of physical gold negated some of the positive impact. |
| n | | The ongoing European sovereign debt crisis remains the largest near-term risk for a market already plagued with volatility. |
The 12-month period was once again characterized by high market volatility. Most domestic equity indexes finished the period flat to slightly down despite a strong rally in the fourth quarter of 2011. Volatility is likely to remain high given the market’s shifting focus from corporate earnings to sustainability of growth to concerns about European sovereign debt. These issues will take time to resolve, so the period ahead is likely to bring us more of the same.
| | | | |
TEN LARGEST EQUITY HOLDINGS4 (AS OF DECEMBER 31, 2011) | |
InterOil Corporation | | | 7.07% | |
Randgold Resources Limited ADR | | | 6.80% | |
Range Resources Corporation | | | 3.01% | |
McMoRan Exploration Company | | | 2.86% | |
Chimera Investment Corporation | | | 2.85% | |
Chicago Bridge & Iron Company NV | | | 2.67% | |
Trilogy Energy Corporation | | | 2.27% | |
United Continental Holdings Incorporated | | | 1.98% | |
Newpark Resources Incorporated | | | 1.94% | |
Argo Group International Holdings Limited | | | 1.58% | |
Weak stock selection in the financials and health care sectors resulted in the Fund’s underperformance for the period.
Financial stocks were the largest relative detractors for the period. The Fund largely invested in real estate investment trusts (REITs) that own mortgage-backed securities—known as mortgage REITs—as opposed to the regional banks and brick-and-mortar REITs that comprise the benchmark. Mortgage REITs make money by borrowing at a lower rate and investing in securities that yield a higher rate. In the current environment, in which interest rates are near record lows, mortgage REITs as a group provided dividends in the mid-teens that we deemed attractive. During the period, however, banks and brick-and-mortar REITs outperformed mortgage REITs, resulting in the Fund’s underperformance in the sector.
Health care stocks also detracted from relative performance. The home health services group was particularly hard hit by government intervention and regulation. Gentiva Health Services Incorporated, a leader in home nursing and hospice services, declined sharply on a higher-than-expected reimbursement rate cut proposed by the Centers for Medicare & Medicaid Services and subsequent concerns about the company’s ability to meet debt covenants. The considerable uncertainties with Gentiva’s business have pressured its stock price, but we see long-term value in the highly depressed stock. The home health industry is highly fragmented, and we believe that companies like Gentiva can grow and drive margin improvement through consolidation. The company should also continue to benefit from an aging population.
| 4. | The ten largest equity holdings are calculated based on the value of the securities divided by total net assets of the Fund. Holdings are subject to change and may have changed since the date specified. |
| | | | | | |
| Performance Highlights (Unaudited) | | Wells Fargo Advantage VT Small Cap Value Fund | | | 7 | |
|
SECTOR DISTRIBUTION5 (AS OF DECEMBER 31, 2011) |
|
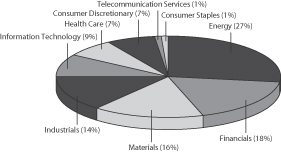 |
Despite general weakness among energy stocks, the Fund’s holdings in the sector were the largest relative contributors. Several of the Fund’s holdings were acquired during the reporting period, including Global Industries Limited, Petrohawk Energy Corporation, and Pride International Incorporated, which we no longer hold in the portfolio. Other long-time holdings like Trilogy Energy Corporation had triple-digit returns, helping mitigate negative returns from key holding InterOil Corporation. InterOil’s delay in reaching final investment decisions on announced projects led some investors to abandon the stock. We think the company is on track with its development plan, and we see significant upside as it moves closer to monetizing its resources.
Gold prices rose another 10% during the period. Top holding Randgold Resources Limited paced the Fund’s performance in the sector with a gain of 24%. However, Randgold’s positive return was the exception among mining stocks as most actually declined—some quite sharply—despite the rise in gold’s price. If the price of gold remains at current high levels or even continues to rise, we may see catch-up performance from gold-mining stocks, whose shares have languished over the past year.
Even though we see further uncertainty ahead, we remain focused on our investment process.
On the one hand, the market is facing significant headwinds that include high unemployment, the European sovereign debt crisis, and slowing economic growth. These issues are unlikely to be resolved anytime soon. On the other hand, we believe that stock valuations are quite attractive, particularly in light of near-record-low interest rates, high corporate profitability, and massive cash hoards on corporate balance sheets. Given the lack of a clear direction in the market or in the economy, macroeconomic events will likely dominate short-term market moves. In such an environment, it’s futile to attempt directional moves because the market shifts too quickly for anyone to be consistently right. Instead, we intend to stick with our time-tested investment process, which we believe should give us ample opportunity to buy high-quality businesses that we believe will thrive over the long-term.
| 5. | Sector distribution is subject to change and is calculated based on the total long-term investments of the Fund. |
| | | | |
| 8 | | Wells Fargo Advantage VT Small Cap Value Fund | | Performance Highlights (Unaudited) |
AVERAGE ANNUAL TOTAL RETURN6 (%) (AS OF DECEMBER 31, 2011)
| | | | | | | | | | | | | | | | | | | | | | | | | | | | |
| | | | | | | | | Expense Ratios7 | |
| | | Inception Date | | | 6 Months* | | | 1 Year | | | 5 Year | | | 10 Year | | | Gross | | | Net8 | |
Class 1 | | | 07/16/2010 | | | | (7.16 | ) | | | (7.06 | ) | | | (0.69 | ) | | | 4.88 | | | | 1.09% | | | | 0.91% | |
Class 2 | | | 10/10/1997 | | | | (7.16 | ) | | | (7.26 | ) | | | (0.76 | ) | | | 4.85 | | | | 1.34% | | | | 1.16% | |
Russell 2000 Value Index | | | | | | | (8.94 | ) | | | (5.50 | ) | | | (1.87 | ) | | | 6.40 | | | | | | | | | |
Russell 2500 Value Index | | | | | | | (8.91 | ) | | | (3.36 | ) | | | (0.58 | ) | | | 7.16 | | | | | | | | | |
| * | Returns for periods of less than one year are not annualized. |
Figures quoted represent past performance, which is no guarantee of future results and do not reflect the deduction of taxes that a shareholder may pay on fund distributions or the redemption of fund shares. Investment return and principal value of an investment will fluctuate so that an investor’s shares, when redeemed, may be worth more or less than their original cost. Current performance may be lower or higher than the performance data quoted and assumes the reinvestment of dividends and capital gains. Current month-end performance is available by calling 1-866-765-0778. Performance figures of the Fund do not reflect fees charged pursuant to the terms of variable life insurance policies and variable annuity contracts.
Index returns do not include transaction costs associated with buying and selling securities, any mutual fund fees or expenses or any taxes. It is not possible to invest directly in an index.
Stock fund values fluctuate in response to the activities of individual companies and general market and economic conditions. Smaller company stocks tend to be more volatile and less liquid than those of larger companies. The use of derivatives may reduce returns and/or increase volatility. Certain investment strategies tend to increase the total risk of an investment (relative to the broader market). This Fund is exposed to foreign investment risk. Consult the Fund’s prospectus for additional information on these and other risks.
Please refer to the prospectus provided by your participating insurance company for detailed information describing the separate accounts for information regarding surrender charges, mortality and expense risk fees and other charges that may be assessed by the participating insurance companies.
| 6. | Historical performance shown for Class 1 shares prior to their inception reflects the performance of Class 2 shares, and includes the higher expenses applicable to Class 2 shares. If these expenses had not been included, returns would be higher. |
| 7. | Reflects the expense ratios as stated in the most recent prospectuses. |
| 8. | The Adviser has committed through July 18, 2013 to waive fees and/or reimburse expenses to the extent necessary to cap the Fund’s Total Annual Fund Operating Expenses After Fee Waiver, excluding certain expenses, at 0.89% for Class 1 and 1.14% for Class 2 shares. Without this cap, the Fund’s returns would have been lower. |
| | | | | | |
| Fund Expenses (Unaudited) | | Wells Fargo Advantage VT Small Cap Value Fund | | | 9 | |
As a shareholder of the Fund, you incur ongoing costs, including management fees; distribution (12b-1) fees; and other Fund expenses. This example is intended to help you understand your ongoing costs (in dollars) of investing in the Fund and to compare these costs with the ongoing costs of investing in other mutual funds.
The example is based on an investment of $1,000 invested at the beginning of the six-month period and held for the entire period from July 1, 2011 to December 31, 2011.
Actual Expenses
The “Actual” line of the table below provides information about actual account values and actual expenses. You may use the information in this line, together with the amount you invested, to estimate the expenses that you paid over the period. Simply divide your account value by $1,000 (for example, an $8,600 account value divided by $1,000 = 8.6), then multiply the result by the number in the “Actual” line under the heading entitled “Expenses Paid During Period” for your applicable class of shares to estimate the expenses you paid on your account during this period.
Hypothetical Example for Comparison Purposes
The “Hypothetical” line of the table below provides information about hypothetical account values and hypothetical expenses based on the Fund’s actual expense ratio and an assumed rate of return of 5% per year before expenses, which is not the Fund’s actual return. The hypothetical account values and expenses may not be used to estimate the actual ending account balance or expenses you paid for the period. You may use this information to compare the ongoing costs of investing in the Fund and other funds. To do so, compare this 5% hypothetical example with the 5% hypothetical examples that appear in the shareholder reports of the other funds.
Please note that the expenses shown in the table are meant to highlight your ongoing costs only and do not reflect any separate account charges assessed by participating insurance companies. Therefore, the “Hypothetical” line of the table is useful in comparing ongoing costs only, and will not help you determine the relative total costs of owning different funds. In addition, if these separate account charges assessed by participating insurance companies were included, your costs would have been higher.
| | | | | | | | | | | | | | | | |
| | | Beginning
Account Value
07-01-2011 | | | Ending
Account Value
12-31-2011 | | | Expenses
Paid During
the Period1 | | | Net Annual
Expense Ratio | |
Class 1 | | | | | | | | | | | | | | | | |
Actual | | $ | 1,000.00 | | | $ | 928.41 | | | $ | 4.33 | | | | 0.89 | % |
Hypothetical (5% return before expenses) | | $ | 1,000.00 | | | $ | 1,020.72 | | | $ | 4.53 | | | | 0.89 | % |
Class 2 | | | | | | | | | | | | | | | | |
Actual | | $ | 1,000.00 | | | $ | 928.39 | | | $ | 5.54 | | | | 1.14 | % |
Hypothetical (5% return before expenses) | | $ | 1,000.00 | | | $ | 1,019.46 | | | $ | 5.80 | | | | 1.14 | % |
| 1. | Expenses paid is equal to the annualized expense ratio of each class multiplied by the average account value over the period, multiplied by the number of days in the most recent fiscal half-year divided by the number of days in the fiscal year (to reflect the one-half year period). |
| | | | |
| 10 | | Wells Fargo Advantage VT Small Cap Value Fund | | Portfolio of Investments—December 31, 2011 |
| | | | | | | | | | | | |
| Security Name | | | | | | Shares | | | Value | |
| | | | | | | | | | | | |
| | | | |
Common Stocks: 96.54% | | | | | | | | | | | | |
| | | | |
Consumer Discretionary: 6.26% | | | | | | | | | | | | |
| | | | |
| Automobiles: 0.07% | | | | | | | | | | | | |
Winnebago Industries Incorporated† | | | | | | | 5,200 | | | $ | 38,376 | |
| | | | | | | | | | | | |
| | | | |
| Diversified Consumer Services: 0.64% | | | | | | | | | | | | |
Cambium Learning Group Incorporated † | | | | | | | 22,100 | | | | 66,742 | |
Corinthian Colleges Incorporated † | | | | | | | 138,900 | | | | 301,413 | |
| | | | |
| | | | | | | | | | | 368,155 | |
| | | | | | | | | | | | |
| | | | |
| Hotels, Restaurants & Leisure: 1.87% | | | | | | | | | | | | |
Denny’s Corporation† | | | | | | | 52,100 | | | | 195,896 | |
Scientific Games Corporation Class A† | | | | | | | 37,600 | | | | 364,720 | |
The Wendy’s Company | | | | | | | 97,300 | | | | 521,528 | |
| | | | |
| | | | | | | | | | | 1,082,144 | |
| | | | | | | | | | | | |
| | | | |
| Household Durables: 0.72% | | | | | | | | | | | | |
Cavco Industries Incorporated† | | | | | | | 6,900 | | | | 276,414 | |
KB Home Incorporated | | | | | | | 13,000 | | | | 87,360 | |
Skyline Corporation | | | | | | | 12,700 | | | | 55,245 | |
| | | | |
| | | | | | | | | | | 419,019 | |
| | | | | | | | | | | | |
| | | | |
| Internet & Catalog Retail: 0.05% | | | | | | | | | | | | |
dELiA*s Incorporated† | | | | | | | 30,450 | | | | 31,059 | |
| | | | | | | | | | | | |
| | | | |
| Media: 0.54% | | | | | | | | | | | | |
Discovery Communications Incorporated† | | | | | | | 8,300 | | | | 312,910 | |
| | | | | | | | | | | | |
| | | | |
| Multiline Retail: 0.21% | | | | | | | | | | | | |
Saks Incorporated† | | | | | | | 12,500 | | | | 121,875 | |
| | | | | | | | | | | | |
| | | | |
| Specialty Retail: 2.16% | | | | | | | | | | | | |
Collective Brands Incorporated† | | | | | | | 37,400 | | | | 537,438 | |
Foot Locker Incorporated | | | | | | | 2,400 | | | | 57,216 | |
GameStop Corporation Class A† | | | | | | | 9,000 | | | | 217,170 | |
rue21 Incorporated† | | | | | | | 5,800 | | | | 125,280 | |
Talbots Incorporated† | | | | | | | 48,000 | | | | 127,680 | |
Vitamin Shoppe Incorporated† | | | | | | | 4,600 | | | | 183,448 | |
| | | | |
| | | | | | | | | | | 1,248,232 | |
| | | | | | | | | | | | |
| | | | |
Consumer Staples: 0.74% | | | | | | | | | | | | |
| | | | |
| Personal Products: 0.74% | | | | | | | | | | | | |
Prestige Brands Holdings Incorporated† | | | | | | | 37,900 | | | | 427,133 | |
| | | | | | | | | | | | |
| | | | |
Energy: 25.82% | | | | | | | | | | | | |
| | | | |
| Energy Equipment & Services: 8.96% | | | | | | | | | | | | |
Ensco International plc ADR | | | | | | | 2,800 | | | | 131,376 | |
Helix Energy Solutions Group Incorporated† | | | | | | | 18,600 | | | | 293,880 | |
Helmerich & Payne Incorporated | | | | | | | 13,400 | | | | 782,024 | |
ION Geophysical Corporation† | | | | | | | 108,700 | | | | 666,331 | |
| | | | | | |
| Portfolio of Investments—December 31, 2011 | | Wells Fargo Advantage VT Small Cap Value Fund | | | 11 | |
| | | | | | | | | | | | |
| Security Name | | | | | | Shares | | | Value | |
| | | | | | | | | | | | |
| | | | |
| Energy Equipment & Services (continued) | | | | | | | | | | | | |
Key Energy Services Incorporated† | | | | | | | 41,400 | | | $ | 640,458 | |
Newpark Resources Incorporated† | | | | | | | 117,900 | | | | 1,120,050 | |
Oceaneering International Incorporated | | | | | | | 15,500 | | | | 715,015 | |
Parker Drilling Company† | | | | | | | 34,300 | | | | 245,931 | |
PHI Incorporated (non-voting)† | | | | | | | 13,300 | | | | 330,505 | |
PHI Incorporated (voting)† | | | | | | | 2,200 | | | | 51,282 | |
Vantage Drilling Company† | | | | | | | 59,700 | | | | 69,252 | |
Willbros Group Incorporated† | | | | | | | 37,300 | | | | 136,891 | |
| | | | |
| | | | | | | | | | | 5,182,995 | |
| | | | | | | | | | | | |
| | | | |
| Oil, Gas & Consumable Fuels: 16.86% | | | | | | | | | | | | |
Forest Oil Corporation† | | | | | | | 15,400 | | | | 208,670 | |
InterOil Corporation† | | | | | | | 80,000 | | | | 4,090,400 | |
Lone Pine Resources Incorporated† | | | | | | | 10,000 | | | | 70,100 | |
McMoRan Exploration Company† | | | | | | | 113,700 | | | | 1,654,335 | |
Newfield Exploration Company† | | | | | | | 4,600 | | | | 173,558 | |
PetroQuest Energy Incorporated† | | | | | | | 12,700 | | | | 83,820 | |
Pioneer Natural Resources Company | | | | | | | 3,200 | | | | 286,336 | |
Plains Exploration & Product Company† | | | | | | | 3,600 | | | | 132,192 | |
Range Resources Corporation | | | | | | | 28,100 | | | | 1,740,514 | |
Trilogy Energy Corporation | | | | | | | 35,600 | | | | 1,312,876 | |
| | | | |
| | | | | | | | | | | 9,752,801 | |
| | | | | | | | | | | | |
| | | | |
Financials: 17.59% | | | | | | | | | | | | |
| | | | |
| Commercial Banks: 4.14% | | | | | | | | | | | | |
Ameris Bancorp† | | | | | | | 11,800 | | | | 121,304 | |
Associated Banc-Corporation | | | | | | | 10,100 | | | | 112,817 | |
Bancorp Incorporated† | | | | | | | 22,426 | | | | 162,140 | |
BBCN Bancorp Incorporated† | | | | | | | 18,888 | | | | 178,492 | |
CenterState Banks Incorporated | | | | | | | 19,500 | | | | 129,090 | |
City National Corporation | | | | | | | 7,000 | | | | 309,260 | |
First Horizon National Corporation | | | | | | | 19,700 | | | | 157,600 | |
Hancock Holding Company | | | | | | | 9,400 | | | | 300,518 | |
IBERIABANK Corporation | | | | | | | 6,800 | | | | 335,240 | |
NBH Holdings Corporation†144A(a) | | | | | | | 12,400 | | | | 198,400 | |
Park Sterling Corporation† | | | | | | | 16,500 | | | | 67,320 | |
Sandy Spring Bancorp Incorporated | | | | | | | 5,080 | | | | 89,154 | |
SVB Financial Group† | | | | | | | 4,200 | | | | 200,298 | |
Western Liberty Bancorp† | | | | | | | 13,700 | | | | 35,209 | |
| | | | |
| | | | | | | | | | | 2,396,842 | |
| | | | | | | | | | | | |
| | | | |
| Insurance: 2.91% | | | | | | | | | | | | |
Argo Group International Holdings Limited | | | | | | | 31,600 | | | | 915,136 | |
Hilltop Holdings Incorporated† | | | | | | | 30,600 | | | | 258,570 | |
Mercury General Corporation | | | | | | | 7,000 | | | | 319,340 | |
OneBeacon Insurance Group Limited | | | | | | | 12,400 | | | | 190,836 | |
| | | | |
| | | | | | | | | | | 1,683,882 | |
| | | | | | | | | | | | |
| | | | |
| REIT: 10.10% | | | | | | | | | | | | |
Anworth Mortgage Asset Corporation | | | | | | | 46,000 | | | | 288,880 | |
| | | | |
| 12 | | Wells Fargo Advantage VT Small Cap Value Fund | | Portfolio of Investments—December 31, 2011 |
| | | | | | | | | | | | |
| Security Name | | | | | | Shares | | | Value | |
| | | | | | | | | | | | |
| | | | |
| REIT (continued) | | | | | | | | | | | | |
Armour Residential Incorporated | | | | | | | 4,751 | | | $ | 33,494 | |
Capstead Mortgage Corporation | | | | | | | 61,400 | | | | 763,816 | |
Chimera Investment Corporation | | | | | | | 657,600 | | | | 1,650,576 | |
Crexus Investment Corporation | | | | | | | 69,300 | | | | 719,334 | |
Hatteras Financial Corporation | | | | | | | 16,600 | | | | 437,742 | |
Invesco Mortgage Capital Incorporated | | | | | | | 43,900 | | | | 616,795 | |
MFA Mortgage Investments Incorporated | | | | | | | 85,400 | | | | 573,888 | |
Redwood Trust Incorporated | | | | | | | 30,700 | | | | 312,526 | |
Sun Communities Incorporated | | | | | | | 12,100 | | | | 442,013 | |
| | | | |
| | | | | | | | | | | 5,839,064 | |
| | | | | | | | | | | | |
| | | | |
| Thrifts & Mortgage Finance: 0.44% | | | | | | | | | | | | |
First Niagara Financial Group Incorporated | | | | | | | 20,900 | | | | 180,367 | |
Northwest Bancshares Incorporated | | | | | | | 5,900 | | | | 73,396 | |
| | | | |
| | | | | | | | | | | 253,763 | |
| | | | | | | | | | | | |
| | | | |
Health Care: 7.21% | | | | | | | | | | | | |
| | | | |
| Health Care Equipment & Supplies: 3.96% | | | | | | | | | | | | |
Gen-Probe Incorporated† | | | | | | | 5,000 | | | | 295,600 | |
Hill-Rom Holdings Incorporated | | | | | | | 4,000 | | | | 134,760 | |
Hologic Incorporated† | | | | | | | 14,100 | | | | 246,891 | |
Invacare Corporation | | | | | | | 3,300 | | | | 50,457 | |
Orasure Technologies Incorporated† | | | | | | | 96,300 | | | | 877,293 | |
Symmetry Medical Incorporated† | | | | | | | 17,800 | | | | 142,222 | |
Thoratec Corporation† | | | | | | | 9,600 | | | | 322,176 | |
Varian Medical Systems Incorporated† | | | | | | | 3,300 | | | | 221,529 | |
| | | | |
| | | | | | | | | | | 2,290,928 | |
| | | | | | | | | | | | |
| | | | |
| Health Care Providers & Services: 1.60% | | | | | | | | | | | | |
Amedisys Incorporated† | | | | | | | 18,300 | | | | 199,653 | |
Community Health Systems Incorporated† | | | | | | | 7,400 | | | | 129,130 | |
Cross Country Healthcare Incorporated† | | | | | | | 44,300 | | | | 245,865 | |
Gentiva Health Services Incorporated† | | | | | | | 36,600 | | | | 247,050 | |
Healthways Incorporated† | | | | | | | 15,500 | | | | 106,330 | |
| | | | |
| | | | | | | | | | | 928,028 | |
| | | | | | | | | | | | |
| | | | |
| Health Care Technology: 0.35% | | | | | | | | | | | | |
Medidata Solutions Incorporated† | | | | | | | 9,300 | | | | 202,275 | |
| | | | | | | | | | | | |
| | | | |
| Life Sciences Tools & Services: 1.30% | | | | | | | | | | | | |
Accelrys Incorporated† | | | | | | | 38,600 | | | | 259,392 | |
Nordion Incorporated | | | | | | | 25,300 | | | | 211,508 | |
Parexel International Corporation† | | | | | | | 13,500 | | | | 279,990 | |
| | | | |
| | | | | | | | | | | 750,890 | |
| | | | | | | | | | | | |
| | | | |
Industrials: 13.69% | | | | | | | | | | | | |
| | | | |
| Airlines: 4.51% | | | | | | | | | | | | |
Alaska Air Group Incorporated† | | | | | | | 9,200 | | | | 690,828 | |
Delta Air Lines Incorporated† | | | | | | | 78,900 | | | | 638,301 | |
| | | | | | |
| Portfolio of Investments—December 31, 2011 | | Wells Fargo Advantage VT Small Cap Value Fund | | | 13 | |
| | | | | | | | | | | | |
| Security Name | | | | | | Shares | | | Value | |
| | | | | | | | | | | | |
| | | | |
| Airlines (continued) | | | | | | | | | | | | |
Lan Airlines SA ADR | | | | | | | 5,700 | | | $ | 132,468 | |
United Continental Holdings Incorporated† | | | | | | | 60,800 | | | | 1,147,296 | |
| | | | |
| | | | | | | | | | | 2,608,893 | |
| | | | | | | | | | | | |
| | | | |
| Building Products: 0.37% | | | | | | | | | | | | |
Webco Industries Incorporated†(a)(i) | | | | | | | 1,850 | | | | 212,750 | |
| | | | | | | | | | | | |
| | | | |
| Commercial Services & Supplies: 4.30% | | | | | | | | | | | | |
ABM Industries Incorporated | | | | | | | 31,900 | | | | 657,778 | |
ACCO Brands Corporation† | | | | | | | 46,800 | | | | 451,620 | |
GEO Group Incorporated† | | | | | | | 44,900 | | | | 752,075 | |
Healthcare Services Group | | | | | | | 18,300 | | | | 323,727 | |
Kforce Incorporated† | | | | | | | 8,600 | | | | 106,038 | |
Verisk Analytics Incorporated Class A† | | | | | | | 4,800 | | | | 192,624 | |
| | | | |
| | | | | | | | | | | 2,483,862 | |
| | | | | | | | | | | | |
| | | | |
| Construction & Engineering: 3.06% | | | | | | | | | | | | |
Chicago Bridge & Iron Company NV | | | | | | | 40,800 | | | | 1,542,240 | |
Primoris Services Corporation | | | | | | | 15,400 | | | | 229,922 | |
| | | | |
| | | | | | | | | | | 1,772,162 | |
| | | | | | | | | | | | |
| | | | |
| Electrical Equipment: 0.73% | | | | | | | | | | | | |
GrafTech International Limited† | | | | | | | 30,700 | | | | 419,055 | |
| | | | | | | | | | | | |
| | | | |
| Professional Services: 0.37% | | | | | | | | | | | | |
Hill International Incorporated† | | | | | | | 41,900 | | | | 215,366 | |
| | | | | | | | | | | | |
| | | | |
| Road & Rail: 0.12% | | | | | | | | | | | | |
Covenant Transport Incorporated Class A† | | | | | | | 23,700 | | | | 70,389 | |
| | | | | | | | | | | | |
| | | | |
| Trading Companies & Distributors: 0.23% | | | | | | | | | | | | |
Applied Industrial Technologies Incorporated | | | | | | | 3,800 | | | | 133,646 | |
| | | | | | | | | | | | |
| | | | |
Information Technology: 8.77% | | | | | | | | | | | | |
| | | | |
| Communications Equipment: 2.09% | | | | | | | | | | | | |
Brocade Communications Systems Incorporated† | | | | | | | 63,300 | | | | 328,527 | |
China GrenTech Corporation Limited ADR† | | | | | | | 35,600 | | | | 92,560 | |
Harmonic Incorporated† | | | | | | | 49,500 | | | | 249,480 | |
InterDigital Incorporated | | | | | | | 9,300 | | | | 405,201 | |
MRV Communications Incorporated | | | | | | | 153,400 | | | | 131,924 | |
| | | | |
| | | | | | | | | | | 1,207,692 | |
| | | | | | | | | | | | |
| | | | |
| Computers & Peripherals: 1.91% | | | | | | | | | | | | |
Cray Incorporated† | | | | | | | 68,000 | | | | 439,960 | |
Intermec Incorporated† | | | | | | | 55,900 | | | | 383,474 | |
Quantum Corporation† | | | | | | | 116,900 | | | | 280,560 | |
| | | | |
| | | | | | | | | | | 1,103,994 | |
| | | | | | | | | | | | |
| | | | |
| Electronic Equipment, Instruments & Components: 4.37% | | | | | | | | | | | | |
Checkpoint Systems Incorporated† | | | | | | | 13,600 | | | | 148,784 | |
Cognex Corporation | | | | | | | 13,200 | | | | 472,428 | |
| | | | |
| 14 | | Wells Fargo Advantage VT Small Cap Value Fund | | Portfolio of Investments—December 31, 2011 |
| | | | | | | | | | | | |
| Security Name | | | | | | Shares | | | Value | |
| | | | | | | | | | | | |
| | | | |
| Electronic Equipment, Instruments & Components (continued) | | | | | | | | | | | | |
Coherent Incorporated† | | | | | | | 15,300 | | | $ | 799,731 | |
Itron Incorporated† | | | | | | | 4,600 | | | | 164,542 | |
OSI Systems Incorporated† | | | | | | | 14,280 | | | | 696,578 | |
Power One Incorporated† | | | | | | | 62,400 | | | | 243,984 | |
| | | | |
| | | | | | | | | | | 2,526,047 | |
| | | | | | | | | | | | |
| | | | |
| Internet Software & Services: 0.22% | | | | | | | | | | | | |
Monster Worldwide Incorporated† | | | | | | | 16,400 | | | | 130,052 | |
| | | | | | | | | | | | |
| | | | |
| Office Electronics: 0.18% | | | | | | | | | | | | |
Zebra Technologies Corporation† | | | | | | | 2,900 | | | | 103,762 | |
| | | | | | | | | | | | |
| | | | |
Materials: 15.59% | | | | | | | | | | | | |
| | | | |
| Chemicals: 0.56% | | | | | | | | | | | | |
Calgon Carbon Corporation† | | | | | | | 20,700 | | | | 325,197 | |
| | | | | | | | | | | | |
| | | | |
| Containers & Packaging: 0.79% | | | | | | | | | | | | |
Intertape Polymer Group Incorporated† | | | | | | | 143,600 | | | | 455,212 | |
| | | | | | | | | | | | |
| | | | |
| Metals & Mining: 13.84% | | | | | | | | | | | | |
Agnico-Eagle Mines Limited | | | | | | | 21,700 | | | | 788,144 | |
Carpenter Technology Corporation | | | | | | | 15,300 | | | | 787,644 | |
Eldorado Gold Corporation | | | | | | | 22,300 | | | | 305,733 | |
Great Basin Gold Limited† | | | | | | | 109,100 | | | | 99,390 | |
Harry Winston Diamond Corporation† | | | | | | | 9,500 | | | | 101,175 | |
Petaquilla Minerals Limited† | | | | | | | 40,300 | | | | 23,374 | |
Randgold Resources Limited ADR | | | | | | | 38,500 | | | | 3,930,850 | |
Royal Gold Incorporated | | | | | | | 11,400 | | | | 768,702 | |
Sandstorm Gold Limited† | | | | | | | 210,240 | | | | 247,645 | |
Silver Standard Resources Incorporated† | | | | | | | 17,700 | | | | 244,614 | |
Steel Dynamics Incorporated | | | | | | | 38,300 | | | | 503,645 | |
United States Steel Corporation | | | | | | | 7,800 | | | | 206,388 | |
| | | | |
| | | | | | | | | | | 8,007,304 | |
| | | | | | | | | | | | |
| | | | |
| Paper & Forest Products: 0.40% | | | | | | | | | | | | |
Wausau Paper Corporation | | | | | | | 27,800 | | | | 229,628 | |
| | | | | | | | | | | | |
| | | | |
Telecommunication Services: 0.87% | | | | | | | | | | | | |
| | | | |
| Diversified Telecommunication Services: 0.87% | | | | | | | | | | | | |
Cincinnati Bell Incorporated† | | | | | | | 165,600 | | | | 501,768 | |
| | | | | | | | | | | | |
| | | | |
Total Common Stocks (Cost $53,110,363) | | | | | | | | | | | 55,837,150 | |
| | | | | | | | | | | | |
| | | | |
| Investment Companies: 1.33% | | | | | | | | | | | | |
Market Vectors Gold Miners ETF | | | | | | | 10,811 | | | | 556,010 | |
SPDR S&P Regional Banking ETF | | | | | | | 8,600 | | | | 209,926 | |
| | | | |
Total Investment Companies (Cost $740,446) | | | | | | | | | | | 765,936 | |
| | | | | | | | | | | | |
| | | | | | |
| Portfolio of Investments—December 31, 2011 | | Wells Fargo Advantage VT Small Cap Value Fund | | | 15 | |
| | | | | | | | | | | | | | | | |
| Security Name | | | | | Expiration Date | | | Shares | | | Value | |
| | | | | | | | | | | | | | | | |
| | | | |
Warrants: 0.00% | | | | | | | | | | | | | | | | |
| | | | |
Financials: 0.00% | | | | | | | | | | | | | | | | |
| | | | |
| REIT: 0.00% | | | | | | | | | | | | | | | | |
Armour Residential Incorporated† | | | | | | | 11/07/2013 | | | | 1,000 | | | $ | 14 | |
| | | | | | | | | | | | | | | | |
| | | | |
Total Warrants (Cost $160) | | | | | | | | | | | | | | | 14 | |
| | | | | | | | | | | | | | | | |
| | | | |
| | | Yield | | | | | | | | | | |
| Short-Term Investments: 1.43% | | | | | | | | | | | | | | | | |
| | | | |
| Investment Companies: 1.43% | | | | | | | | | | | | | | | | |
Wells Fargo Advantage Cash Investment Money Market Fund, Institutional Class(l)(u) | | | 0.04 | % | | | | | | | 826,768 | | | | 826,768 | |
| | | | | | | | | | | | | | | | |
| | | | |
Total Short-Term Investments (Cost $826,768) | | | | | | | | | | | | | | | 826,768 | |
| | | | | | | | | | | | | | | | |
| | | | | | | | |
| Total Investments in Securities | | | | | | | | |
| (Cost $54,677,737)* | | | 99.30 | % | | | 57,429,868 | |
Other Assets and Liabilities, Net | | | 0.70 | | | | 406,277 | |
| | | | | | | | |
| Total Net Assets | | | 100.00 | % | | $ | 57,836,145 | |
| | | | | | | | |
| † | Non-income earning security. |
| (a) | Security is fair valued by the Management Valuation Team, and in certain instances by the Board of Trustees, in accordance with procedures approved by the Board of Trustees. |
| (i) | Illiquid security for which the designation as illiquid is unaudited. |
| 144A | Security that may be resold to “qualified institutional buyers” under Rule 144A or security offered pursuant to Section 4(2) of the Securities Act of 1933, as amended. |
| (l) | Investment in an affiliate. |
| (u) | Rate shown is the 7-day annualized yield at period end. |
| * | Cost for federal income tax purposes is $55,098,753 and net unrealized appreciation (depreciation) consists of: |
| | | | |
Gross unrealized appreciation | | $ | 9,498,418 | |
Gross unrealized depreciation | | | (7,167,303 | ) |
| | | | |
Net unrealized appreciation | | $ | 2,331,115 | |
The accompanying notes are an integral part of these financial statements.
| | | | |
| 16 | | Wells Fargo Advantage VT Small Cap Value Fund | | Statement of Assets and Liabilities—December 31, 2011 |
| | | | |
| | | | |
| |
Assets | | | | |
Investments | | | | |
In unaffiliated securities, at value | | $ | 56,603,100 | |
In affiliated securities, at value | | | 826,768 | |
| | | | |
Total investments, at value (see cost below) | | | 57,429,868 | |
Receivable for investments sold | | | 277,177 | |
Receivable for Fund shares sold | | | 107,303 | |
Receivable for dividends | | | 217,976 | |
Prepaid expenses and other assets | | | 1,632 | |
| | | | |
Total assets | | | 58,033,956 | |
| | | | |
| |
Liabilities | | | | |
Payable for investments purchased | | | 50,390 | |
Payable for Fund shares redeemed | | | 80,349 | |
Advisory fee payable | | | 3,737 | |
Distribution fees payable | | | 3,599 | |
Due to other related parties | | | 6,930 | |
Professional fees payable | | | 33,592 | |
Accrued expenses and other liabilities | | | 19,214 | |
| | | | |
Total liabilities | | | 197,811 | |
| | | | |
Total net assets | | $ | 57,836,145 | |
| | | | |
| |
NET ASSETS CONSIST OF | | | | |
Paid-in capital | | $ | 72,308,107 | |
Undistributed net investment income | | | 548,784 | |
Accumulated net realized losses on investments | | | (17,772,877 | ) |
Net unrealized gains on investments | | | 2,752,131 | |
| | | | |
Total net assets | | $ | 57,836,145 | |
| | | | |
| |
COMPUTATION OF NET ASSET VALUE PER SHARE1 | | | | |
Net assets – Class 1 | | $ | 43,154,957 | |
Shares outstanding – Class 1 | | | 5,179,453 | |
Net asset value per share – Class 1 | | | $8.33 | |
Net assets – Class 2 | | $ | 14,681,188 | |
Shares outstanding – Class 2 | | | 1,764,701 | |
Net asset value per share – Class 2 | | | $8.32 | |
| |
Total investments, at cost | | $ | 54,677,737 | |
| | | | |
| 1. | The Fund has an unlimited number of authorized shares. |
The accompanying notes are an integral part of these financial statements.
| | | | | | |
| Statement of Operations—Year Ended December 31, 2011 | | Wells Fargo Advantage VT Small Cap Value Fund | | | 17 | |
| | | | |
| | | | |
| |
Investment income | | | | |
Dividends* | | $ | 1,310,848 | |
Income from affiliated securities | | | 3,514 | |
| | | | |
Total investment income | | | 1,314,362 | |
| | | | |
| |
Expenses | | | | |
Advisory fee | | | 503,335 | |
Administration fees | | | | |
Fund level | | | 33,556 | |
Class 1 | | | 40,081 | |
Class 2 | | | 13,608 | |
Distribution fees | | | | |
Class 2 | | | 42,526 | |
Custody and accounting fees | | | 31,942 | |
Professional fees | | | 51,956 | |
Shareholder report expenses | | | 75,530 | |
Trustees’ fees and expenses | | | 14,286 | |
Other fees and expenses | | | 1,394 | |
| | | | |
Total expenses | | | 808,214 | |
Less: Fee waivers and/or expense reimbursements | | | (168,397 | ) |
| | | | |
Net expenses | | | 639,817 | |
| | | | |
Net investment income | | | 674,545 | |
| | | | |
| |
REALIZED AND UNREALIZED GAINS (LOSSES) ON INVESTMENTS | | | | |
Net realized gains on investments | | | 4,495,887 | |
Net change in unrealized gains (losses) on investments | | | (10,006,816 | ) |
| | | | |
Net realized and unrealized gains (losses) on investments | | | (5,510,929 | ) |
| | | | |
Net decrease in net assets resulting from operations | | $ | (4,836,384 | ) |
| | | | |
| |
* Net of foreign dividend withholding taxes of | | | $8,839 | |
The accompanying notes are an integral part of these financial statements.
| | | | |
| 18 | | Wells Fargo Advantage VT Small Cap Value Fund | | Statements of Changes in Net Assets |
| | | | | | | | | | | | | | | | |
| | | Year Ended
December 31, 2011 | | | Year Ended
December 31, 2010 | |
| | | | |
Operations | | | | | | | | | | | | | | | | |
Net investment income | | | | | | $ | 674,545 | | | | | | | $ | 519,509 | |
Net realized gains on investments | | | | | | | 4,495,887 | | | | | | | | 1,492,997 | |
Net change in unrealized gains (losses) on investments | | | | | | | (10,006,816 | ) | | | | | | | 12,781,203 | |
| | | | | | | | | | | | | | | | |
Net increase (decrease) in net assets resulting from operations | | | | | | | (4,836,384 | ) | | | | | | | 14,793,709 | |
| | | | | | | | | | | | | | | | |
| | | | |
Distributions to shareholders from | | | | | | | | | | | | | | | | |
Net investment income | | | | | | | | | | | | | | | | |
Class 1 | | | | | | | (440,656 | ) | | | | | | | 0 | 1 |
Class 2 | | | | | | | (112,333 | ) | | | | | | | (154,516 | )2 |
| | | | | | | | | | | | | | | | |
Total distributions to shareholders | | | | | | | (552,989 | ) | | | | | | | (154,516 | ) |
| | | | | | | | | | | | | | | | |
| | | | |
Capital share transactions | | | Shares | | | | | | | | Shares | | | | | |
Proceeds from shares sold | | | | | | | | | | | | | | | | |
Class 1 | | | 177,977 | | | | 1,478,858 | | | | 219,798 | 1 | | | 1,707,233 | 1 |
Class 2 | | | 100,076 | | | | 880,176 | | | | 301,633 | 2 | | | 2,296,529 | 2 |
| | | | | | | | | | | | | | | | |
| | | | | | | 2,359,034 | | | | | | | | 4,003,762 | |
| | | | | | | | | | | | | | | | |
Reinvestment of distributions | | | | | | | | | | | | | | | | |
Class 1 | | | 49,071 | | | | 440,656 | | | | 0 | 1 | | | 0 | 1 |
Class 2 | | | 12,509 | | | | 112,333 | | | | 21,138 | 2 | | | 154,516 | 2 |
| | | | | | | | | | | | | | | | |
| | | | | | | 552,989 | | | | | | | | 154,516 | |
| | | | | | | | | | | | | | | | |
Payment for shares redeemed | | | | | | | | | | | | | | | | |
Class 1 | | | (1,488,987 | ) | | | (13,002,318 | ) | | | (811,923 | )1 | | | (6,559,421 | )1 |
Class 2 | | | (518,177 | ) | | | (4,544,639 | ) | | | (897,225 | )2 | | | (7,075,687 | )2 |
| | | | | | | | | | | | | | | | |
| | | | | | | (17,546,957 | ) | | | | | | | (13,635,108 | ) |
| | | | | | | | | | | | | | | | |
Net asset value of shares issued in acquisition | | | | | | | | | | | | | | | | |
Class 1 | | | 0 | | | | 0 | | | | 7,033,517 | | | | 51,770,209 | |
Class 2 | | | 0 | | | | 0 | | | | 1,210,549 | | | | 8,910,235 | |
| | | | | | | | | | | | | | | | |
| | | | | | | 0 | | | | | | | | 60,680,444 | |
| | | | | | | | | | | | | | | | |
Net increase (decrease) in net assets resulting
from capital share transactions | | | | | | | (14,634,934 | ) | | | | | | | 51,203,614 | |
| | | | | | | | | | | | | | | | |
Total increase (decrease) in net assets | | | | | | | (20,024,307 | ) | | | | | | | 65,842,807 | |
| | | | | | | | | | | | | | | | |
| | | | |
Net assets | | | | | | | | | | | | | | | | |
Beginning of period | | | | | | | 77,860,452 | | | | | | | | 12,017,645 | |
| | | | | | | | | | | | | | | | |
End of period | | | | | | $ | 57,836,145 | | | | | | | $ | 77,860,452 | |
| | | | | | | | | | | | | | | | |
Undistributed net investment income | | | | | | $ | 548,784 | | | | | | | $ | 499,936 | |
| | | | | | | | | | | | | | | | |
| 1. | Class commenced operations on July 16, 2010. |
| 2. | After the close of business on July 16, 2010, the existing shares of the Fund were renamed Class 2 shares. |
The accompanying notes are an integral part of these financial statements.
| | | | | | |
| Financial Highlights | | Wells Fargo Advantage VT Small Cap Value Fund | | | 19 | |
(For a share outstanding throughout each period)
| | | | | | | | |
| | | Year Ended December 31, | |
| Class 1 | | 2011 | | | 20101 | |
Net asset value, beginning of period | | $ | 9.04 | | | $ | 7.36 | |
Net investment income | | | 0.11 | | | | 0.05 | 2 |
Net realized and unrealized gains (losses) on investments | | | (0.74 | ) | | | 1.63 | |
| | | | | | | | |
Total from investment operations | | | (0.63 | ) | | | 1.68 | |
Distributions to shareholders from | | | | | | | | |
Net investment income | | | (0.08 | ) | | | 0.00 | |
Net asset value, end of period | | $ | 8.33 | | | $ | 9.04 | |
Total return3 | | | (7.06 | )% | | | 22.83 | % |
Ratios to average net assets (annualized) | | | | | | | | |
Gross expenses | | | 1.14 | % | | | 0.96 | % |
Net expenses | | | 0.89 | % | | | 0.89 | % |
Net investment income | | | 1.07 | % | | | 1.43 | % |
Supplemental data | | | | | | | | |
Portfolio turnover rate | | | 16 | % | | | 61 | % |
Net assets, end of period (000’s omitted) | | | $43,155 | | | | $58,255 | |
| 1. | For the period from July 16, 2010 (commencement of class operations) to December 31, 2010. |
| 2. | Calculated based upon average shares outstanding. |
| 3. | Returns for periods of less than one year are not annualized. |
The accompanying notes are an integral part of these financial statements.
| | | | |
| 20 | | Wells Fargo Advantage VT Small Cap Value Fund | | Financial Highlights |
(For a share outstanding throughout each period)
| | | | | | | | | | | | | | | | | | | | |
| | | Year Ended December 31, | |
| Class 21 | | 2011 | | | 2010 | | | 2009 | | | 2008 | | | 2007 | |
Net asset value, beginning of period | | $ | 9.03 | | | $ | 7.83 | | | $ | 4.95 | | | $ | 11.08 | | | $ | 13.22 | |
Net investment income (loss) | | | 0.09 | | | | 0.12 | | | | 0.08 | | | | 0.09 | 2 | | | (0.04 | ) |
Net realized and unrealized gains (losses) on investments | | | (0.74 | ) | | | 1.20 | | | | 2.87 | | | | (4.21 | ) | | | 0.21 | |
| | | | | | | | | | | | | | | | | | | | |
Total from investment operations | | | (0.65 | ) | | | 1.32 | | | | 2.95 | | | | (4.12 | ) | | | 0.17 | |
Distributions to shareholders from | | | | | | | | | | | | | | | | | | | | |
Net investment income | | | (0.06 | ) | | | (0.12 | ) | | | (0.07 | ) | | | 0.00 | | | | 0.00 | |
Net realized gains | | | 0.00 | | | | 0.00 | | | | 0.00 | | | | (2.01 | ) | | | (2.31 | ) |
| | | | | | | | | | | | | | | | | | | | |
Total distributions to shareholders | | | (0.06 | ) | | | (0.12 | ) | | | (0.07 | ) | | | (2.01 | ) | | | (2.31 | ) |
Net asset value, end of period | | $ | 8.32 | | | $ | 9.03 | | | $ | 7.83 | | | $ | 4.95 | | | $ | 11.08 | |
Total return | | | (7.26 | )% | | | 17.25 | % | | | 60.18 | % | | | (44.55 | )% | | | (0.32 | )% |
Ratios to average net assets (annualized) | | | | | | | | | | | | | | | | | | | | |
Gross expenses | | | 1.39 | % | | | 1.52 | % | | | 2.56 | % | | | 1.69 | % | | | 1.51 | % |
Net expenses | | | 1.14 | % | | | 1.14 | % | | | 1.14 | % | | | 1.14 | % | | | 1.14 | % |
Net investment income (loss) | | | 0.82 | % | | | 1.06 | % | | | 1.39 | % | | | 1.18 | % | | | (0.31 | )% |
Supplemental data | | | | | | | | | | | | | | | | | | | | |
Portfolio turnover rate | | | 16 | % | | | 61 | % | | | 45 | % | | | 39 | % | | | 60 | % |
Net assets, end of period (000’s omitted) | | | $14,681 | | | | $19,606 | | | | $12,018 | | | | $7,928 | | | | $17,527 | |
| 1. | After the close of business on July 16, 2010, existing shares of the Fund were renamed Class 2 shares. |
| 2. | Calculated based upon average shares outstanding. |
The accompanying notes are an integral part of these financial statements.
| | | | | | |
| Notes to Financial Statements | | Wells Fargo Advantage VT Small Cap Value Fund | | | 21 | |
1. ORGANIZATION
Wells Fargo Variable Trust (the “Trust”), a Delaware statutory trust organized on March 10, 1999, is an open-end management investment company registered under the Investment Company Act of 1940, as amended (the “1940 Act”). These financial statements report on Wells Fargo Advantage VT Small Cap Value Fund (the “Fund”) which is a diversified series of the Trust.
2. SIGNIFICANT ACCOUNTING POLICIES
The following significant accounting policies, which are consistently followed in the preparation of the financial statements of the Fund, are in conformity with U.S. generally accepted accounting principles which require management to make estimates and assumptions that affect the reported amounts of assets and liabilities, disclosure of contingent assets and liabilities at the date of the financial statements, and the reported amounts of revenues and expenses during the reporting period. Actual results could differ from those estimates.
Securities valuation
Investments in equity securities are valued each business day as of the close of regular trading on the New York Stock Exchange, which is usually 4:00 p.m. (Eastern Time). Securities which are traded on a national or foreign securities exchange are valued at the last reported sales price, except that securities listed on The Nasdaq Stock Market, Inc. (“Nasdaq”) are valued at the Nasdaq Official Closing Price (“NOCP”), and if no NOCP is available, then at the last reported sales price. If no sales price is shown on the Nasdaq, the bid price will be used. In the absence of any sale of securities listed on the Nasdaq, and in the case of other securities (including U.S. Government obligations, but excluding debt securities maturing in 60 days or less), the price will be deemed “stale” and the valuations will be determined in accordance with the Fund’s Fair Value Procedures.
Securities denominated in foreign currencies are translated into U.S. dollars using the closing rates of exchange in effect on the day of valuation.
Many securities markets and exchanges outside the U.S. close prior to the close of the New York Stock Exchange and therefore may not fully reflect trading or events that occur after the close of the principal exchange in which the foreign investments are traded, but before the close of the New York Stock Exchange. If such trading or events are expected to materially affect the value of the investments, then those investments are fair valued following procedures approved by the Board of Trustees. These procedures take into account multiple factors including movements in U.S. securities markets after foreign exchanges close. Depending on market activity, such fair valuations may be frequent. Such fair value pricing may result in NAVs that are higher or lower than NAVs based on the closing price or latest quoted bid price.
Debt securities of sufficient credit quality with original maturities of 60 days or less generally are valued at amortized cost which approximates fair value. The amortized cost method involves valuing a security at its cost, plus accretion of discount or minus amortization of premium over the period until maturity.
Investments in open-end mutual funds and non-registered investment companies are generally valued at net asset value.
Investments which are not valued using any of the methods discussed above, are valued at their fair value, as determined by procedures established in good faith and approved by the Board of Trustees.
Foreign currency translation
The accounting records of the Fund are maintained in U.S. dollars. Assets, including investment securities, and liabilities denominated in foreign currency are translated into U.S. dollars at the prevailing rates of exchange at the date of valuation. Purchases and sales of securities, and income and expenses are translated at the prevailing rate of exchange on the respective dates of such transactions. Reported net realized foreign exchange gains or losses arise from sales of foreign currencies, currency gains or losses realized between the trade and settlement dates on securities transactions, and the difference between the amounts of dividends, interest and foreign withholding taxes recorded and the U.S. dollar equivalent of the amounts actually paid or received. Net unrealized foreign exchange gains and losses arise from changes in the fair value of assets and liabilities other than investments in securities resulting in changes in exchange rates.
The changes in net assets arising from changes in exchange rates and the changes in net assets resulting from changes in market prices of securities are not separately presented. Such changes are recorded with net realized and unrealized gains or losses from investments. Gains and losses from certain foreign currency transactions are treated as ordinary income for U.S. federal income tax purposes.
| | | | |
| 22 | | Wells Fargo Advantage VT Small Cap Value Fund | | Notes to Financial Statements |
Security loans
The Fund may lend its securities from time to time in order to earn additional income in the form of fees or interest on securities received as collateral or the investment of any cash received as collateral. The Fund continues to receive interest or dividends on the securities loaned. The Fund receives collateral in the form of cash or securities with a value at least equal to the value of the securities on loan. The value of the loaned securities is determined at the close of each business day and any additional required collateral is delivered to the Fund on the next business day. In a securities lending transaction, the net asset value of the Fund will be affected by an increase or decrease in the value of the securities loaned and by an increase or decrease in the value of the instrument in which collateral is invested. The amount of securities lending activity undertaken by the Fund fluctuates from time to time. In the event of default or bankruptcy by the borrower, the Fund may be prevented from recovering the loaned securities or gaining access to the collateral or may experience delays or costs in doing so. In addition, the investment of any cash collateral received may lose all or part of its value. The Fund has the right under the lending agreement to recover the securities from the borrower on demand.
The Fund lends its securities through an unaffiliated securities lending agent. Cash collateral received in connection with its securities lending transactions is invested in Wells Fargo Securities Lending Cash Investments, LLC (the “Cash Collateral Fund”). The Cash Collateral Fund is exempt from registration under Section 3(c)(7) of the 1940 Act and is managed by Wells Fargo Funds Management LLC (“Funds Management”) and is sub-advised by Wells Capital Management Incorporated (“Wells Capital Management”). Funds Management receives an advisory fee starting at 0.05% and declining to 0.01% as the average daily net assets of the Cash Collateral Fund increase. All of the fees received by Funds Management are paid to Wells Capital Management for its services as sub-adviser. The Cash Collateral Fund seeks to provide a positive return compared to the daily Fed Funds Open rate by investing in high-quality, U.S. dollar-denominated short-term money market instruments. Cash Collateral Fund investments are fair valued based upon the amortized cost valuation technique. Income earned from investment in the Cash Collateral Fund is included in securities lending income on the Statement of Operations.
Security transactions and income recognition
Securities transactions are recorded on a trade date basis. Realized gains or losses are reported on the basis of identified cost of securities delivered.
Dividend income is recognized on the ex-dividend date, except for certain dividends from foreign securities, which are recorded as soon as the Fund is informed of the ex-dividend date. Income from foreign securities is recorded net of foreign taxes withheld where recovery of such taxes is not assured.
Distributions to shareholders
Distributions to shareholders from net investment income and net realized gains, if any, are recorded on the ex-dividend date. Such distributions are determined in conformity with income tax regulations, which may differ from generally accepted accounting principles.
The timing and character of distributions made during the period from net investment income or net realized gains may differ from their ultimate characterization for federal income tax purposes. To the extent that these differences are permanent in nature, such amounts are reclassified within the capital accounts based on their federal tax-basis treatment. Temporary differences do not require reclassifications. The primary permanent differences causing such reclassifications are due to dividends from certain securities. At December 31, 2011, as a result of permanent book-to-tax differences, the following reclassification adjustments were made on the Statement of Assets and Liabilities:
| | |
Undistributed Net Investment Income | | Accumulated
Net Realized
Losses on
Investments |
| $(72,708) | | $72,708 |
Federal and other taxes
The Fund intends to continue to qualify as a regulated investment company by distributing substantially all of its investment company taxable income and any net realized capital gains (after reduction for capital loss carryforwards) sufficient to relieve it from all, or substantially all, federal income taxes. Accordingly, no provision for federal income taxes was required.
| | | | | | |
| Notes to Financial Statements | | Wells Fargo Advantage VT Small Cap Value Fund | | | 23 | |
The Fund’s income and federal excise tax returns and all financial records supporting those returns for the prior three fiscal years are subject to examination by the federal and Delaware revenue authorities.
Under the recently enacted Regulated Investment Company Modernization Act of 2010, the Fund is permitted to carry forward capital losses incurred in taxable years which began after December 22, 2010 for an unlimited period. However, any losses incurred are required to be utilized prior to the losses incurred in pre-enactment taxable years. As a result of this ordering rule, pre-enactment capital loss carryforwards may be more likely to expire unused. Additionally, post-enactment capital losses that are carried forward will retain their character as either short-term or long-term capital losses rather than being considered all short-term as under previous law.
As of December 31, 2011, the Fund had net capital loss carryforwards, which are available to offset future net realized capital gains, in the amount of $17,402,202 with $4,116,200 expiring in 2016 and $13,286,002 expiring in 2017.
Class allocations
The separate classes of shares offered by the Fund differ principally in distribution fees. Shareholders of each class bear certain expenses that pertain to that particular class. All shareholders bear the common expenses of the Fund, earn income from the portfolio, and are allocated unrealized gains and losses pro rata based on the average daily net assets of each class, without distinction between share classes. Dividends are determined separately for each class based on income and expenses allocable to each class. Realized gains and losses are allocated to each class pro rata based upon the net assets of each class on the date realized. Differences in per share dividend rates generally result from the relative weightings of pro rata income and realized gain allocations and from differences in separate class expenses, including distribution fees.
3. FAIR VALUATION MEASUREMENTS
Fair value measurements of investments are determined within a framework that has established a fair value hierarchy based upon the various data inputs utilized in determining the value of the Fund’s investments. The three-level hierarchy gives the highest priority to unadjusted quoted prices in active markets for identical assets or liabilities (Level 1) and the lowest priority to significant unobservable inputs (Level 3). The Fund’s investments are classified within the fair value hierarchy based on the lowest level of input that is significant to the fair value measurement. The inputs are summarized into three broad levels as follows:
| n | | Level 1 – quoted prices in active markets for identical securities |
| n | | Level 2 – other significant observable inputs (including quoted prices for similar securities, interest rates, prepayment speeds, credit risk, etc.) |
| n | | Level 3 – significant unobservable inputs (including the Fund’s own assumptions in determining the fair value of investments) |
The inputs or methodologies used for valuing securities are not necessarily an indication of the risk associated with investing in those securities.
As of December 31, 2011, the inputs used in valuing the Fund’s assets, which are carried at fair value, were as follows:
| | | | | | | | | | | | | | | | |
| Investments in Securities | | Quoted Prices (Level 1) | | | Significant Other
Observable Inputs (Level 2) | | | Significant Unobservable Inputs (Level 3) | | | Total | |
Equity securities | | | | | | | | | | | | | | | | |
Common stocks | | $ | 55,426,000 | | | $ | 212,750 | | | $ | 198,400 | | | $ | 55,837,150 | |
Investment companies | | | 765,936 | | | | 0 | | | | 0 | | | | 765,936 | |
Warrants | | | 0 | | | | 14 | | | | 0 | | | | 14 | |
Short-term investments | | | | | | | | | | | | | | | | |
Investment companies | | | 826,768 | | | | 0 | | | | 0 | | | | 826,768 | |
| | | $ | 57,018,704 | | | $ | 212,764 | | | $ | 198,400 | | | $ | 57,429,868 | |
Further details on the major security types listed above can be found in the Portfolio of Investments.
| | | | |
| 24 | | Wells Fargo Advantage VT Small Cap Value Fund | | Notes to Financial Statements |
Transfers in and transfers out are recognized at the end of the reporting period. For the year ended December 31, 2011, the Fund did not have any significant transfers into/out of Level 1 and Level 2.
The following is a reconciliation of assets in which significant unobservable inputs (Level 3) were used in determining fair value:
| | | | |
| | | Common
stocks | |
Balance as of December 31, 2010 | | $ | 170,200 | |
Accrued discounts (premiums) | | | 0 | |
Realized gains (losses) | | | 0 | |
Change in unrealized gains (losses) | | | 31,979 | |
Purchases | | | 208,971 | |
Sales | | | 0 | |
Transfers into Level 3 | | | 0 | |
Transfers out of Level 3 | | | (212,750 | ) |
Balance as of December 31, 2011 | | $ | 198,400 | |
Change in unrealized gains (losses)
relating to securities still held at December 31, 2011 | | $ | (10,571 | ) |
4. TRANSACTIONS WITH AFFILIATES AND OTHER EXPENSES
Advisory fee
The Trust has entered into an advisory contract with Funds Management, an indirect wholly owned subsidiary of Wells Fargo & Company (“Wells Fargo”). The adviser is responsible for implementing investment policies and guidelines and for supervising the sub-adviser, who is responsible for day-to-day portfolio management of the Fund.
Pursuant to the contract, Funds Management is entitled to receive an annual advisory fee starting at 0.75% and declining to 0.60% as the average daily net assets of the Fund increase. For the year ended December 31, 2011, the advisory fee was equivalent to an annual rate of 0.75% of the Fund’s average daily net assets.
Funds Management may retain the services of certain sub-advisers to provide daily portfolio management to the Fund. The fees related to sub-advisory services are borne directly by Funds Management and do not increase the overall fees paid by the Fund. Wells Capital Management, an affiliate of Funds Management, is the sub-adviser to the Fund and is entitled to receive a fee from Funds Management at an annual rate starting at 0.55% and declining to 0.40% as the average daily net assets of the Fund increase.
Administration and transfer agent fees
The Trust has entered into an administration agreement with Funds Management. Under this agreement, for providing administrative services, which includes paying fees and expenses for services provided by the transfer agent, sub-transfer agents, omnibus account servicers and record-keepers, Funds Management is entitled to receive from the Fund an annual fund level administration fee starting at 0.05% and declining to 0.03% as the average daily net assets of the Fund increase and a class level administration fee of 0.08% of the average daily net assets of each class.
Funds Management has contractually waived and/or reimbursed advisory and administration fees to the extent necessary to maintain certain net operating expense ratios for the Fund. Waiver of fees and/or reimbursement of expenses by Funds Management were made first from fund level expenses on a proportionate basis and then from class specific expenses.
Distribution fees
The Trust has adopted a Distribution Plan for Class 2 shares of the Fund pursuant to Rule 12b-1 under the 1940 Act. Distribution fees are charged to Class 2 shares and paid to Wells Fargo Funds Distributor, LLC, the principal underwriter, at an annual rate of 0.25% of its average daily net assets.
| | | | | | |
| Notes to Financial Statements | | Wells Fargo Advantage VT Small Cap Value Fund | | | 25 | |
5. INVESTMENT PORTFOLIO TRANSACTIONS
Purchases and sales of investments, excluding U.S. Government obligations (if any) and short-term securities (securities with maturities of one year or less at purchase date), for the year ended December 31, 2011 were $10,446,447 and $19,390,696, respectively.
6. ACQUISITION
After the close of business on July 16, 2010, the Fund acquired the net assets of Evergreen VA Special Values Fund and renamed its existing shares as Class 2 shares. The purpose of the transaction was to combine two funds with similar investment objectives and strategies. Shareholders holding Class 1 and Class 2 shares of Evergreen VA Special Values Fund received Class 1 and Class 2 shares, respectively, of the Fund in the reorganization. The acquisition was accomplished by a tax-free exchange of all of the shares of Evergreen VA Special Values Fund for 8,244,066 shares the Fund valued at $60,680,444 at an exchange ratio of 1.56 and 1.55 for Class 1 and Class 2 shares, respectively. The investment portfolio of Evergreen VA Special Values Fund with a fair value of $60,693,159, identified cost of $60,659,673 and unrealized gains of $33,486 at July 16, 2010 were the principal assets acquired by the Fund. The aggregate net assets of Evergreen VA Special Values Fund and the Fund immediately prior to the acquisition were $60,680,444 and $9,494,728, respectively. The aggregate net assets of the Fund immediately after the acquisition were $70,175,172. For financial reporting purposes, assets received and shares issued by the Fund were recorded at fair value; however, the cost basis of the investments received from Evergreen VA Special Values Fund was carried forward to align ongoing reporting of the Fund’s realized and unrealized gains and losses with amounts distributable to shareholders for tax purposes.
Assuming the acquisition had been completed January 1, 2010, the beginning of the annual reporting period for the Fund, the pro forma results of operations for the year ended December 31, 2010 would have been:
| | | | |
Net investment income | | $ | 624,969 | |
Net realized and unrealized gains on investments | | $ | 13,030,505 | |
Net increase in net assets resulting from operations | | $ | 13,655,474 | |
7. BANK BORROWINGS
The Trust and Wells Fargo Funds Trust (excluding the money market funds) are parties to a $150,000,000 revolving credit agreement with State Street Bank and Trust Company, whereby the Fund is permitted to use bank borrowings for temporary or emergency purposes, such as to fund shareholder redemption requests. Interest under the credit agreement is charged to the Fund based on a borrowing rate equal to the higher of the Federal Funds rate in effect on that day plus 1.25% or the overnight LIBOR rate in effect on that day plus 1.25%. In addition, under the credit agreement, the Fund pays an annual commitment fee equal to 0.10% of the unused balance, which is allocated pro rata. Prior to September 6, 2011, the revolving credit agreement was for $125,000,000 and the annual commitment fee paid by the Fund was 0.125% of the unused balance. For the year ended December 31, 2011, the Fund paid $179 in commitment fees.
For the year ended December 31, 2011, there were no borrowings by the Fund under the agreement.
8. DISTRIBUTIONS TO SHAREHOLDERS
The tax character of distributions paid was $552,989 and $154,516 of ordinary income for the years ended December 31, 2011 and December 31, 2010, respectively.
As of December 31, 2011, the components of distributable earnings on a tax basis were as follows:
| | | | | | | | | | |
Undistributed
Ordinary
Income | | | Unrealized
Gains | | | Capital Loss
Carryforward | |
| $ | 601,260 | | | $ | 2,331,120 | | | $ | (17,402,202 | ) |
9. INDEMNIFICATION
Under the Trust’s organizational documents, the officers and directors are indemnified against certain liabilities that may arise out of performance of their duties to the Trust. Additionally, in the normal course of business, the Trust may enter into
| | | | |
| 26 | | Wells Fargo Advantage VT Small Cap Value Fund | | Notes to Financial Statements |
contracts with service providers that contain a variety of indemnification clauses. The Trust’s maximum exposure under these arrangements is dependent on future claims that may be made against the Fund and, therefore, cannot be estimated.
10. NEW ACCOUNTING PRONOUNCEMENTS
In May 2011, the Financial Accounting Standards Board (“FASB”) issued Accounting Standards Update (“ASU”) No. 2011-04 “Amendments to Achieve Common Fair Value Measurement and Disclosure Requirements in U.S. GAAP and IFRSs”. ASU No. 2011-04 amends FASB ASC Topic 820, Fair Value Measurements and Disclosures, to establish common requirements for measuring fair value and for disclosing information about fair value measurements in accordance with GAAP. The ASU is effective prospectively for interim and annual periods beginning after December 15, 2011. Management expects that adoption of the ASU will result in additional disclosures in the financial statements, as applicable.
In April 2011, FASB issued ASU No. 2011-03 “Reconsideration of Effective Control for Repurchase Agreements”. ASU No. 2011-03 amends FASB ASC Topic 860, Transfers and Servicing, specifically the criteria required to determine whether a repurchase agreement (repo) and similar agreements should be accounted for as sales of financial assets or secured borrowings with commitments. ASU No. 2011-03 changes the assessment of effective control by focusing on the transferor’s contractual rights and obligations and removing the criterion to assess its ability to exercise those rights or honor those obligations. This could result in changes to the way entities account for certain transactions including repurchase agreements, mortgage dollar rolls and reverse repurchase agreements. The ASU will become effective on a prospective basis for new transfers and modifications to existing transactions as of the beginning of the first interim or annual period beginning on or after December 15, 2011. Management has evaluated the impact of adopting the ASU and expects no significant changes.
| | | | | | |
| Report of Independent Registered Public Accounting Firm | | Wells Fargo Advantage VT Small Cap Value Fund | | | 27 | |
BOARD OF TRUSTEES AND SHAREHOLDERS OF WELLS FARGO VARIABLE TRUST:
We have audited the accompanying statement of assets and liabilities, including the portfolio of investments, of the Wells Fargo Advantage VT Small Cap Value Fund (the “Fund”), one of the funds constituting the Wells Fargo Variable Trust, as of December 31, 2011, and the related statement of operations for the year then ended, statements of changes in net assets for each of the years in the two-year period then ended, and the financial highlights for each of the years or periods in the five-year period then ended. These financial statements and financial highlights are the responsibility of the Fund’s management. Our responsibility is to express an opinion on these financial statements and financial highlights based on our audits.
We conducted our audits in accordance with the standards of the Public Company Accounting Oversight Board (United States). Those standards require that we plan and perform the audit to obtain reasonable assurance about whether the financial statements and financial highlights are free of material misstatement. An audit includes examining, on a test basis, evidence supporting the amounts and disclosures in the financial statements. Our procedures included confirmation of securities owned as of December 31, 2011, by correspondence with custodian and brokers, or by other appropriate auditing procedures. An audit also includes assessing the accounting principles used and significant estimates made by management, as well as evaluating the overall financial statement presentation. We believe that our audits provide a reasonable basis for our opinion.
In our opinion, the financial statements and financial highlights referred to above present fairly, in all material respects, the financial position of the Wells Fargo Advantage VT Small Cap Value Fund as of December 31, 2011, the results of its operations for the year then ended, changes in its net assets for each of the years in the two-year period then ended, and the financial highlights for each of the years or periods in the five-year period then ended, in conformity with U.S. generally accepted accounting principles.

Boston, Massachusetts
February 24, 2012
| | | | |
| 28 | | Wells Fargo Advantage VT Small Cap Value Fund | | Other Information (Unaudited) |
TAX INFORMATION
For corporate shareholders, pursuant to Section 854 of the Internal Revenue Code, 23.30% of ordinary income dividends qualify for the corporate dividends-received deduction for the fiscal year ended December 31, 2011.
PROXY VOTING INFORMATION
A description of the policies and procedures that the Fund uses to determine how to vote proxies relating to portfolio securities is available without charge, upon request, by calling 1-800-222-8222, visiting our Web site at www.wellsfargo.com/advantagefunds, or visiting the SEC Web site at www.sec.gov. Information regarding how the Fund voted proxies relating to portfolio securities during the most recent 12-month period ended June 30 is available without charge on the Fund’s Web site at www.wellsfargo.com/advantagefunds or by visiting the SEC Web site at www.sec.gov.
PORTFOLIO HOLDINGS INFORMATION
The complete portfolio holdings for the Fund are publicly available on the Fund’s Web site (www.wellsfargo.com/advantagefunds) on a monthly, 30-day or more delayed basis. In addition, top ten holdings information for the Fund is publicly available on the Fund’s Web site on a monthly, seven-day or more delayed basis. The Fund files its complete schedule of portfolio holdings with the SEC for the first and third quarters of each fiscal year on Form N-Q, which is available without charge by visiting the SEC Web site at www.sec.gov. In addition, the Fund’s Form N-Q may be reviewed and copied at the SEC’s Public Reference Room in Washington, DC, and at regional offices in New York City, at 233 Broadway, and in Chicago, at 175 West Jackson Boulevard, Suite 900. Information about the Public Reference Room may be obtained by calling 1-800-SEC-0330.
| | | | | | |
| Other Information (Unaudited) | | Wells Fargo Advantage VT Small Cap Value Fund | | | 29 | |
BOARD OF TRUSTEES
The following table provides basic information about the Board of Trustees (the “Trustees”) of the Trust and Officers of the Trust. This table should be read in conjunction with the Prospectus and the Statement of Additional Information1 of the Fund. Each of the Trustees and Officers listed below acts in identical capacities for the Wells Fargo Advantage family of funds, which consists of 138 funds comprising the Wells Fargo Funds Trust, Wells Fargo Variable Trust, Wells Fargo Master Trust and four closed-end funds (collectively the “Fund Complex”). All of the Trustees are also Members of the Audit and Governance Committees of each Trust in the Fund Complex. The mailing address of each Trustee and Officer is 525 Market Street, 12th Floor, San Francisco, CA 94105. Each Trustee and Officer serves an indefinite term, however, each Trustee serves such term until reaching the mandatory retirement age established by the Trustees.
Independent Trustees
| | | | | | |
Name and Year of Birth | | Position Held and Length of Service | | Principal Occupations During Past Five Years | | Other Directorships During
Past Five Years |
Peter G. Gordon
(Born 1942) | | Trustee, since 1998; Chairman, since 2005 (Lead Trustee since 2001) | | Co-Founder, Retired Chairman, President and CEO of Crystal Geyser Water Company. Trustee Emeritus, Colby College | | Asset Allocation Trust |
Isaiah Harris, Jr.
(Born 1952) | | Trustee, since 2009 | | Retired. Prior thereto, President and CEO of BellSouth Advertising and Publishing Corp. from 2005 to 2007, President and CEO of BellSouth Enterprises from 2004 to 2005 and President of BellSouth Consumer Services from 2000 to 2003. Emeritus member of the Iowa State University Foundation Board of Governors. Emeritus Member of the Advisory Board of Iowa State University School of Business. Mr. Harris is a certified public accountant. | | CIGNA Corporation; Deluxe Corporation; Asset Allocation Trust |
Judith M. Johnson
(Born 1949) | | Trustee, since 2008 | | Retired. Prior thereto, Chief Executive Officer and Chief Investment Officer of Minneapolis Employees Retirement Fund from 1996 to 2008. Ms. Johnson is an attorney, certified public accountant and a certified managerial accountant. | | Asset Allocation Trust |
Leroy Keith, Jr.
(Born 1939) | | Trustee, since 2010 | | Chairman, Bloc Global Services (development and construction). Trustee of the Evergreen Funds from 1983 to 2010. Former Managing Director, Almanac Capital Management (commodities firm), former Partner, Stonington Partners, Inc. (private equity fund), former Director, Obagi Medical Products Co. and former Director, Lincoln Educational Services. | | Trustee, Virtus Fund Complex (consisting of 40 portfolios as of 12/31/11); Asset Allocation Trust |
David F. Larcker
(Born 1950) | | Trustee, since 2009 | | James Irvin Miller Professor of Accounting at the Graduate School of Business, Stanford University, Director of Corporate Governance Research Program and Senior Faculty of The Rock Center for Corporate Governance since 2006. From 2005 to 2008, Professor of Accounting at the Graduate School of Business, Stanford University. Prior thereto, Ernst & Young Professor of Accounting at The Wharton School, University of Pennsylvania from 1985 to 2005. | | Asset Allocation Trust |
Olivia S. Mitchell
(Born 1953) | | Trustee, since 2006 | | International Foundation of Employee Benefit Plans Professor, Wharton School of the University of Pennsylvania since 1993. Director of Wharton’s Pension Research Council and Boettner Center on Pensions & Retirement Research, and Research Associate at the National Bureau of Economic Research. Previously, Cornell University Professor from 1978 to 1993. | | Asset Allocation Trust |
| | | | |
| 30 | | Wells Fargo Advantage VT Small Cap Value Fund | | Other Information (Unaudited) |
| | | | | | |
Name and Year of Birth | | Position Held and Length of Service | | Principal Occupations During Past Five Years | | Other Directorships During
Past Five Years |
Timothy J. Penny
(Born 1951) | | Trustee, since 1996 | | President and CEO of Southern Minnesota Initiative Foundation, a non-profit organization, since 2007 and Senior Fellow at the Humphrey Institute Policy Forum at the University of Minnesota since 1995. Member of the Board of Trustees of NorthStar Education Finance, Inc., a non-profit organization, since 2007. | | Asset Allocation Trust |
Michael S. Scofield
(Born 1943) | | Trustee, since 2010 | | Served on the Investment Company Institute’s Board of Governors and Executive Committee from 2008-2011 as well the Governing Council of the Independent Directors Council from 2006-2011 and the Independent Directors Council Executive Committee from 2008-2011. Chairman of the IDC from 2008-2010. Institutional Investor (Fund Directions) Trustee of Year in 2007. Trustee of the Evergreen Funds (and its predecessors) from 1984 to 2010. Chairman of the Evergreen Funds from 2000-2010. Former Trustee of the Mentor Funds. Retired Attorney, Law Offices of Michael S. Scofield and former Director and Chairman, Branded Media Corporation (multi-media branding company). | | Asset Allocation Trust |
Donald C. Willeke
(Born 1940) | | Trustee, since 1996 | | Principal of the law firm of Willeke & Daniels. General Counsel of the Minneapolis Employees Retirement Fund from 1984 until its consolidation into the Minnesota Public Employees Retirement Association on June 30, 2010. Director and Vice Chair of The Free Trust (non-profit corporation). Director of the American Chestnut Foundation (non-profit corporation). | | Asset Allocation Trust |
Officers
| | | | | | |
Name and Year of Birth | | Position Held and
Length of Service | | Principal Occupations During Past Five Years | | |
Karla M. Rabusch
(Born 1959) | | President, since 2003 | | Executive Vice President of Wells Fargo Bank, N.A. and President of Wells Fargo Funds Management, LLC since 2003. Senior Vice President and Chief Administrative Officer of Wells Fargo Funds Management, LLC from 2001 to 2003. | | |
C. David Messman
(Born 1960) | | Secretary, since 2000; Chief Legal Counsel, since 2003 | | Senior Vice President and Secretary of Wells Fargo Funds Management, LLC since 2001. Vice President and Managing Senior Counsel of Wells Fargo Bank, N.A. since 1996. | | |
Kasey Phillips
(Born 1970) | | Treasurer, since 2009 | | Senior Vice President of Wells Fargo Funds Management, LLC since 2009. Senior Vice President of Evergreen Investment Management Company, LLC from 2006 to 2010. Treasurer of the Evergreen Funds from 2005 to 2010. | | |
David Berardi
(Born 1975) | | Assistant Treasurer, since 2009 | | Vice President of Wells Fargo Funds Management, LLC since 2009. Vice President of Evergreen Investment Management Company, LLC from 2008 to 2010. Assistant Vice President of Evergreen Investment Services, Inc. from 2004 to 2008. Manager of Fund Reporting and Control for Evergreen Investment Management Company, LLC from 2004 to 2010. | | |
Jeremy DePalma
(Born 1974) | | Assistant Treasurer, since 2009 | | Senior Vice President of Wells Fargo Funds Management, LLC since 2009. Senior Vice President of Evergreen Investment Management Company, LLC from 2008 to 2010. Vice President, Evergreen Investment Services, Inc. from 2004 to 2007. Head of the Fund Reporting and Control Team within Fund Administration from 2005 to 2010. | | |
Debra Ann Early
(Born 1964) | | Chief Compliance Officer, since 2007 | | Chief Compliance Officer of Wells Fargo Funds Management, LLC since 2007. Chief Compliance Officer of Parnassus Investments from 2005 to 2007. Chief Financial Officer of Parnassus Investments from 2004 to 2007 and Senior Audit Manager of PricewaterhouseCoopers LLP from 1998 to 2004. | | |
| 1. | The Statement of Additional Information includes additional information about the Trustees and is available, without charge, upon request, by calling 1-800-222-8222 or by visiting the Web site at www.wellsfargo.com/advantagefunds. |
| | | | | | |
| List of Abbreviations | | Wells Fargo Advantage VT Small Cap Value Fund | | | 31 | |
The following is a list of common abbreviations for terms and entities which may have appeared in this report.
| ACB | — Agricultural Credit Bank |
| ADR | — American Depository Receipt |
| ADS | — American Depository Shares |
| AGC-ICC | — Assured Guaranty Corporation - Insured Custody Certificates |
| AGM | — Assured Guaranty Municipal |
| AMBAC | — American Municipal Bond Assurance Corporation |
| AMT | — Alternative Minimum Tax |
| BAN | — Bond Anticipation Notes |
| BHAC | — Berkshire Hathaway Assurance Corporation |
| CAB | — Capital Appreciation Bond |
| CCAB | — Convertible Capital Appreciation Bond |
| CDA | — Community Development Authority |
| CDO | — Collateralized Debt Obligation |
| COP | — Certificate of Participation |
| DRIVER | — Derivative Inverse Tax-Exempt Receipts |
| DW&P | — Department of Water & Power |
| DWR | — Department of Water Resources |
| ECFA | — Educational & Cultural Facilities Authority |
| EDA | — Economic Development Authority |
| EDFA | — Economic Development Finance Authority |
| ETF | — Exchange-Traded Fund |
| FFCB | — Federal Farm Credit Bank |
| FGIC | — Financial Guaranty Insurance Corporation |
| FHA | — Federal Housing Authority |
| FHLB | — Federal Home Loan Bank |
| FHLMC | — Federal Home Loan Mortgage Corporation |
| FNMA | — Federal National Mortgage Association |
| GDR | — Global Depository Receipt |
| GNMA | — Government National Mortgage Association |
| HCFR | — Healthcare Facilities Revenue |
| HEFA | — Health & Educational Facilities Authority |
| HEFAR | — Higher Education Facilities Authority Revenue |
| HFA | — Housing Finance Authority |
| HFFA | — Health Facilities Financing Authority |
| IBC | — Insured Bond Certificate |
| IDA | — Industrial Development Authority |
| IDAG | — Industrial Development Agency |
| IDR | — Industrial Development Revenue |
| KRW | — Republic of Korea Won |
| LIBOR | — London Interbank Offered Rate |
| LLC | — Limited Liability Company |
| LLP | — Limited Liability Partnership |
| MBIA | — Municipal Bond Insurance Association |
| MFHR | — Multi-Family Housing Revenue |
| MUD | — Municipal Utility District |
| NATL-RE | — National Public Finance Guarantee Corporation |
| PCFA | — Pollution Control Finance Authority |
| PCR | — Pollution Control Revenue |
| PFA | — Public Finance Authority |
| PFFA | — Public Facilities Financing Authority |
| PFOTER | — Puttable Floating Option Tax-Exempt Receipts |
| plc | — Public Limited Company |
| PUTTER | — Puttable Tax-Exempt Receipts |
| R&D | — Research & Development |
| RDA | — Redevelopment Authority |
| RDFA | — Redevelopment Finance Authority |
| REIT | — Real Estate Investment Trust |
| ROC | — Reset Option Certificates |
| SAVRS | — Select Auction Variable Rate Securities |
| SBA | — Small Business Authority |
| SFHR | — Single Family Housing Revenue |
| SFMR | — Single Family Mortgage Revenue |
| SPDR | — Standard & Poor’s Depositary Receipts |
| TAN | — Tax Anticipation Notes |
| TIPS | — Treasury Inflation-Protected Securities |
| TRAN | — Tax Revenue Anticipation Notes |
| TCR | — Transferable Custody Receipts |
| TTFA | — Transportation Trust Fund Authority |
| TVA | — Tennessee Valley Authority |
| XLCA | — XL Capital Assurance |
This page is intentionally left blank.
This page is intentionally left blank.
This page is intentionally left blank.


FOR MORE INFORMATION
More information about Wells Fargo Advantage Funds is available free upon request. To obtain literature, please write, e-mail, visit the Fund’s Web site, or call:
Wells Fargo Advantage Funds
P.O. Box 8266
Boston, MA 02266-8266
E-mail: wfaf@wellsfargo.com
Web site: www.wellsfargo.com/advantagefunds
Individual investors: 1-800-222-8222
Retail investment professionals: 1-888-877-9275
Institutional investment professionals: 1-866-765-0778
This report and the financial statements contained herein are submitted for the general information of the shareholders of Wells Fargo Advantage Funds. If this report is used for promotional purposes, distribution of the report must be accompanied or preceded by a current prospectus. For a prospectus containing more complete information, including charges and expenses, call 1-800-222-8222 or visit the Fund’s Web site at www.wellsfargo.com/advantagefunds. Please consider the investment objectives, risks, charges, and expenses of the investment carefully before investing. This and other information about Wells Fargo Advantage Funds can be found in the current prospectus. Read the prospectus carefully before you invest or send money.
Wells Fargo Funds Management, LLC, a wholly owned subsidiary of Wells Fargo & Company, provides investment advisory and administrative services for Wells Fargo Advantage Funds. Other affiliates of Wells Fargo & Company provide subadvisory and other services for the Funds. The Funds are distributed by Wells Fargo Funds Distributor, LLC Member FINRA/SIPC, an affiliate of Wells Fargo & Company.
NOT FDIC INSURED ¡ NO BANK GUARANTEE ¡ MAY LOSE VALUE
© 2012 Wells Fargo Funds Management, LLC. All rights reserved.
| | |
| | 207578 02-12 AVT8/AR154 12-11 |

Wells Fargo Advantage
VT Total Return Bond Fund

Annual Report
December 31, 2011
Reduce clutter. Save trees.
Sign up for electronic delivery of prospectuses and shareholder reports at www.wellsfargo.com/advantagedelivery
Contents
The views expressed and any forward-looking statements are as of December 31, 2011, unless otherwise noted, and are those of the Fund managers and/or Wells Fargo Funds Management, LLC. Discussions of individual securities, or the markets generally, or any Wells Fargo Advantage Fund are not intended as individual recommendations. Future events or results may vary significantly from those expressed in any forward-looking statements; the views expressed are subject to change at any time in response to changing circumstances in the market. Wells Fargo Funds Management, LLC, disclaims any obligation to publicly update or revise any views expressed or forward-looking statements.
NOT FDIC INSURED ¡ NO BANK GUARANTEE ¡ MAY LOSE VALUE

WELLS FARGO INVESTMENT HISTORY
| | |
| |
| 1932 | | Keystone creates one of the first mutual fund families. |
| |
| 1971 | | Wells Fargo & Company introduces one of the first institutional index funds. |
| |
| 1978 | | Wells Fargo applies Markowitz and Sharpe’s research on Modern Portfolio Theory to introduce one of the industry’s first Tactical Asset Allocation (TAA) models in institutional separately managed accounts. |
| |
| 1984 | | Wells Fargo Stagecoach Funds launches its first asset allocation fund. |
| |
| 1989 | | The Tactical Asset Allocation (TAA) Model is first applied to Wells Fargo’s asset allocation mutual funds. |
| |
| 1994 | | Wells Fargo introduces the LifePath Funds, one of the first suites of target date funds (now the Wells Fargo Advantage Dow Jones Target Date FundsSM ). |
| |
| 1996 | | Evergreen Investments and Keystone Funds merge. |
| |
| 1997 | | Wells Fargo launches Wells Fargo Advantage WealthBuilder PortfoliosSM, a fund-of-funds suite of products that includes the use of quantitative models to shift assets among investment styles. |
| |
| 1999 | | Norwest Advantage Funds and Stagecoach Funds are reorganized into Wells Fargo Funds after the merger of Norwest and Wells Fargo. |
| |
| 2002 | | Evergreen Retail and Evergreen Institutional companies form the umbrella asset management company, Evergreen Investments. |
| |
| 2005 | | The integration of Strong Funds with Wells Fargo Funds creates Wells Fargo Advantage Funds, resulting in one of the top 20 mutual fund companies in the United States. |
| |
| 2006 | | Wells Fargo Advantage Funds relaunches the target date product line as Wells Fargo Advantage Dow Jones Target Date Funds. |
| |
| 2010 | | The mergers and reorganizations of Evergreen and Wells Fargo Advantage mutual funds are completed, unifying the families under the brand of Wells Fargo Advantage Funds. |
Wells Fargo Advantage Funds®
Wells Fargo Advantage Funds skillfully guides institutions, financial advisors, and individuals through the investment terrain to help them reach their financial objectives. Everything we do on behalf of investors is backed by our unique combination of qualifications.
Strength
Our organization is built on the standards of integrity and service established by our parent company—Wells Fargo & Company—more than 150 years ago. And, because we’re part of a highly diversified financial enterprise, we offer the depth of resources to help investors succeed.
Expertise
Our multi-boutique model offers investors access to the independent thinking of premier investment managers that have been chosen for their time-tested strategies. While each team specializes in a specific investment strategy, collectively they provide investors a wide choice of distinct investment styles. Our dedication to investment excellence doesn’t end with our expertise in manager selection—risk management, analysis, and rigorous ongoing review seek to ensure each manager’s investment process remains consistent.
Partnership
Our collaborative approach is built around understanding the needs and goals of our clients. By adhering to core principles of sound judgment and steady guidance, we support you through every stage of the investment decision process.
Carefully consider a fund’s investment objectives, risks, charges, and expenses before investing. For a current prospectus and, if available, a summary prospectus, containing this and other information, visit wellsfargo.com/advantagefunds. Read it carefully before investing.
Wells Fargo Funds Management, LLC, a wholly owned subsidiary of Wells Fargo & Company, provides investment advisory and administrative services for Wells Fargo Advantage Funds®. Other affiliates of Wells Fargo & Company provide subadvisory and other services for the Funds. The Funds are distributed by Wells Fargo Funds Distributor, LLC, Member FINRA/SIPC, an affiliate of Wells Fargo & Company.
“Dow Jones®” and “Dow Jones Target Date IndexesSM” are service marks of Dow Jones Trademark Holdings, LLC (“Dow Jones”), have been licensed to CME Group Index Services LLC (“CME Indexes”) and have been sublicensed for use for certain purposes by Global Index Advisors, Inc, and Wells Fargo Funds Management, LLC. The Wells Fargo Advantage Dow Jones Target Date FundsSM based on the Dow Jones Target Date IndexesSM, are not sponsored, endorsed, sold or promoted by Dow Jones, CME Indexes or their respective affiliates and none of them makes any representation regarding the advisability of investing in such product(s).
NOT FDIC INSURED ¡ NO BANK GUARANTEE ¡ MAY LOSE VALUE
Not part of the annual report.
Wells Fargo Advantage Funds offers more than 110 mutual funds across a wide range of asset classes, representing over $216 billion in assets under management, as of December 31, 2011.
| | | | |
| Equity Funds | | | | |
Asia Pacific Fund | | Global Opportunities Fund | | Premier Large Company Growth Fund |
C&B Large Cap Value Fund | | Growth Fund | | Small Cap Opportunities Fund |
C&B Mid Cap Value Fund | | Health Care Fund | | Small Cap Value Fund |
Capital Growth Fund | | Index Fund | | Small Company Growth Fund |
Common Stock Fund | | International Equity Fund | | Small Company Value Fund |
Disciplined U.S. Core Fund | | International Value Fund | | Small/Mid Cap Core Fund |
Discovery Fund† | | Intrinsic Small Cap Value Fund | | Small/Mid Cap Value Fund |
Diversified Equity Fund | | Intrinsic Value Fund | | Social Sustainability Fund† |
Diversified International Fund | | Intrinsic World Equity Fund | | Special Mid Cap Value Fund |
Diversified Small Cap Fund | | Large Cap Core Fund | | Special Small Cap Value Fund |
Emerging Growth Fund | | Large Cap Growth Fund | | Specialized Technology Fund |
Emerging Markets Equity Fund | | Large Company Value Fund | | Strategic Large Cap Growth Fund |
Endeavor Select Fund† | | Omega Growth Fund | | Traditional Small Cap Growth Fund |
Enterprise Fund† | | Opportunity Fund† | | Utility and Telecommunications Fund |
Equity Value Fund | | Precious Metals Fund | | |
| Bond Funds | | | | |
Adjustable Rate Government Fund | | Inflation-Protected Bond Fund | | Short-Term Bond Fund |
California Limited-Term Tax-Free Fund | | Intermediate Tax/AMT-Free Fund | | Short-Term High Yield Bond Fund |
California Tax-Free Fund | | International Bond Fund | | Short-Term Municipal Bond Fund |
Colorado Tax-Free Fund | | Minnesota Tax-Free Fund | | Strategic Municipal Bond Fund |
Government Securities Fund | | Municipal Bond Fund | | Total Return Bond Fund |
High Income Fund | | North Carolina Tax-Free Fund | | Ultra Short-Term Income Fund |
High Yield Bond Fund | | Pennsylvania Tax-Free Fund | | Ultra Short-Term Municipal Income Fund |
Income Plus Fund | | Short Duration Government Bond Fund | | Wisconsin Tax-Free Fund |
| Asset Allocation Funds | | | | |
Asset Allocation Fund | | WealthBuilder Equity Portfolio† | | Target 2020 Fund† |
Conservative Allocation Fund | | WealthBuilder Growth Allocation Portfolio† | | Target 2025 Fund† |
Diversified Capital Builder Fund | | WealthBuilder Growth Balanced Portfolio† | | Target 2030 Fund† |
Diversified Income Builder Fund | | WealthBuilder Moderate Balanced Portfolio† | | Target 2035 Fund† |
Growth Balanced Fund | | WealthBuilder Tactical Equity Portfolio† | | Target 2040 Fund† |
Index Asset Allocation Fund | | Target Today Fund† | | Target 2045 Fund† |
Moderate Balanced Fund | | Target 2010 Fund† | | Target 2050 Fund† |
WealthBuilder Conservative Allocation Portfolio† | | Target 2015 Fund† | | Target 2055 Fund† |
| Money Market Funds | | | | |
100% Treasury Money Market Fund | | Heritage Money Market Fund† | | National Tax-Free Money Market Fund |
California Municipal Money Market Fund | | Money Market Fund | | Prime Investment Money Market Fund |
Cash Investment Money Market Fund | | Municipal Cash Management Money Market Fund | | Treasury Plus Money Market Fund |
Government Money Market Fund | | Municipal Money Market Fund | | |
| Variable Trust Funds1 | | | | |
VT Discovery Fund† | | VT Intrinsic Value Fund | | VT Small Cap Growth Fund |
VT Index Asset Allocation Fund | | VT Omega Growth Fund | | VT Small Cap Value Fund |
VT International Equity Fund | | VT Opportunity Fund† | | VT Total Return Bond Fund |
An investment in a money market fund is not insured or guaranteed by the Federal Deposit Insurance Corporation or any other government agency. Although the Wells Fargo Advantage Money Market Funds seek to preserve the value of your investment at $1.00 per share, it is possible to lose money by investing in a money market fund.
| 1. | The Variable Trust Funds are generally available only through insurance company variable contracts. |
| † | In this report, the Wells Fargo Advantage Discovery FundSM, Wells Fargo Advantage Endeavor Select FundSM, Wells Fargo Advantage Enterprise FundSM, Wells Fargo Advantage Opportunity FundSM, Wells Fargo Advantage Social Sustainability FundSM, Wells Fargo Advantage WealthBuilder Conservative Allocation PortfolioSM, Wells Fargo Advantage WealthBuilder Equity PortfolioSM, Wells Fargo Advantage WealthBuilder Growth Allocation PortfolioSM, Wells Fargo Advantage WealthBuilder Growth Balanced PortfolioSM, Wells Fargo Advantage WealthBuilder Moderate Balanced PortfolioSM, Wells Fargo Advantage WealthBuilder Tactical Equity PortfolioSM, Wells Fargo Advantage Dow Jones Target Today FundSM, Wells Fargo Advantage Dow Jones Target 2010 FundSM, Wells Fargo Advantage Dow Jones Target 2015 FundSM, Wells Fargo Advantage Dow Jones Target 2020 FundSM, Wells Fargo Advantage Dow Jones Target 2025 FundSM, Wells Fargo Advantage Dow Jones Target 2030 FundSM, Wells Fargo Advantage Dow Jones Target 2035 FundSM, Wells Fargo Advantage Dow Jones Target 2040 FundSM, Wells Fargo Advantage Dow Jones Target 2045 FundSM, Wells Fargo Advantage Dow Jones Target 2050 FundSM, Wells Fargo Advantage Dow Jones Target 2055 FundSM, Wells Fargo Advantage Heritage Money Market FundSM, Wells Fargo Advantage VT Discovery FundSM, and Wells Fargo Advantage VT Opportunity FundSM are referred to as the Discovery Fund, Endeavor Select Fund, Enterprise Fund, Opportunity Fund, Social Sustainability Fund, WealthBuilder Conservative Allocation Portfolio, WealthBuilder Equity Portfolio, WealthBuilder Growth Allocation Portfolio, WealthBuilder Growth Balanced Portfolio, WealthBuilder Moderate Balanced Portfolio, WealthBuilder Tactical Equity Portfolio, Target Today Fund, Target 2010 Fund, Target 2015 Fund, Target 2020 Fund, Target 2025 Fund, Target 2030 Fund, Target 2035 Fund, Target 2040 Fund, Target 2045 Fund, Target 2050 Fund, Target 2055 Fund, Heritage Money Market Fund, VT Discovery Fund, and VT Opportunity Fund, respectively. |
Not part of the annual report.
| | | | |
| 2 | | Wells Fargo Advantage VT Total Return Bond Fund | | Letter to Shareholders |

Karla M. Rabusch,
President
Wells Fargo Advantage Funds
During the period, fixed-income performance was best among the highest-quality securities and U.S. Treasuries
Dear Valued Shareholder:
We are pleased to offer you this annual report for the Wells Fargo Advantage VT Total Return Bond Fund, which covers the 12-month period that ended December 31, 2011. During the period, fixed-income performance was best among the highest-quality securities and U.S. Treasuries, as investors shifted allocations into the higher-quality safe havens when the Greek credit crisis escalated in August 2011 and amplified volatility through November 2011.
U.S. Treasuries and the highest-rated bonds performed best during the period.
Fixed-income performance oscillated during the 12-month period but culminated in strong annual returns in the core bond market. In the first quarter of 2011, U.S. Treasury yields climbed incrementally higher, but corporate bonds and structured product yields generally remained unchanged. High-yield securities performed better than investment-grade debt during these months. However, in the spring of 2011, those themes shifted as investment-grade bond prices once again strongly improved while high-yield securities underperformed but continued to generate positive returns. U.S. Treasury yields began to decline, with the most notable shifts lower occurring from April through mid-May 2011. Strategies that were broadly diversified across various sectors and credit-quality tiers generally outperformed strategies that were more heavily focused on U.S. Treasuries and the highest-quality fixed-income securities during this time, but most fixed-income sectors generated positive returns.
In June 2011, fixed-income securities were generally in a modest decline after having strong performance in the prior two months. Some risk aversion returned to the fixed-income markets at the start of the period, but those trends turned around in July 2011, resulting in positive performance across nearly all fixed-income markets, including high yield. During this period, once again strategies that were broadly diversified across various sectors and credit-quality tiers generally outperformed. During this turnaround, it appeared that economic optimism and investor confidence in the U.S. were on the upswing again.
However, those trends didn’t last for long—not due to the U.S. economy but instead from the lack of investor confidence overseas, as the Greek credit crisis once again rippled through the global credit markets. In August 2011, the crisis crescendoed, stirring up a wave of global risk aversion that led to a powerful rally in U.S. Treasuries and a sharp decline in high-yield bond prices, most notably in the lowest-quality credit tiers. During this time, most investment-grade fixed-income markets continued to generate positive returns—but specific areas of the riskiest segments of the market declined—and U.S. Treasury yields set multi-decade lows, surpassing the low yield levels that were set in the summer of 2010.
In October 2011, the high-yield market recovered significantly, benefiting from improving policy indications from Europe and the formal announcement of a European debt deal late in the month. Once again, investor confidence was bolstered, but the trend didn’t last because another round of policy uncertainty in Europe welled up, causing risk aversion and credit fears to return. November 2011 saw a modest decline in investment-grade corporate bond prices and a sharp correction in high-yield corporate bonds, before another strong recovery in
| | | | | | |
| Letter to Shareholders | | Wells Fargo Advantage VT Total Return Bond Fund | | | 3 | |
pricing in December finished the period on a positive trend. Thus, the theme for the period was an oscillation between risk aversion from global credit concerns and burgeoning trends of improving investor confidence. On the whole, most investment-grade fixed-income markets generated strong positive returns, with U.S. Treasuries providing the best performance for the period, while high-yield markets and the riskiest segments of structured products lagged.
The Federal Reserve launched Operation Twist in September.
While economic concerns and credit woes escalated in Europe, the growth outlook in the U.S. also continued to throttle back. This prompted the Federal Reserve (Fed) to intervene yet again with monetary accommodation—this time with “Operation Twist,” which was announced and launched in September 2011. Operation Twist was aimed at flattening the yield curve and driving long-term rates down by purchasing long-term Treasuries against selling short-term Treasuries off the Fed’s balance sheet. The Fed stated that it is unlikely to raise rates before mid-2013, thus keeping yields on Treasuries low. Treasury yields continued to rally from this policymaking, while credit spreads on corporate and securitized sectors widened with increasing risk aversion.
Economic conditions continued to face some headwinds in the form of languishing housing values and elevated levels of unemployment, which continued to create some volatility in the fixed-income markets during the period. While we cannot say definitively what near-term performance will look like, we continue to encourage investors to maintain fully diversified, actively managed portfolios, which may provide better protection from risk and added opportunities to capture relative value. While heightened volatility may be uncomfortable to experience in the short term, it often leads to unique opportunities to add relative value for investors with long-term investment horizons.
Don’t let short-term uncertainty derail long-term investment goals.
Periods of uncertainty can present challenges, but experience has taught us that maintaining a long-term investment strategy based on individual goals and risk tolerance can be an effective way to plan for the future. To help you create a sound strategy based on your personal goals and risk tolerance, Wells Fargo Advantage Funds offers more than 110 mutual funds and other investments spanning a wide range of asset classes and investment styles. Although diversification cannot guarantee an investment profit or prevent losses, we believe it can be an effective way to manage investment risk and potentially smooth out overall portfolio performance.
In our opinion, diligent and earnest assessment of the fundamental risks in individual fixed-income securities will be a key differentiating factor between which investment strategies perform well and which do not. At Wells Fargo Advantage Funds, we intend to continue measuring relative-value opportunities in the fixed-income markets and across our lineup of Wells Fargo Advantage Income Funds. We believe it is particularly important to have diligent investment analysts in charge of investor assets in changing markets. As evidenced by the performance of fixed-income assets during the recent 12-month period, heightened risks also often accompany such opportunities.
Thus, the theme for the period was an oscillation between risk aversion from global credit concerns and burgeoning trends of improving investor confidence.
| | | | |
| 4 | | Wells Fargo Advantage VT Total Return Bond Fund | | Letter to Shareholders |
Thank you for choosing to invest with Wells Fargo Advantage Funds. We appreciate your confidence in us and remain committed to helping you meet your financial needs. For current information about your fund investments, contact your investment professional, visit our website at www.wellsfargo.com/advantagefunds, or call us directly at 1-800-222-8222. We are available 24 hours a day, 7 days a week.
Sincerely,

Karla M. Rabusch
President
Wells Fargo Advantage Funds
| | | | | | |
| Performance Highlights (Unaudited) | | Wells Fargo Advantage VT Total Return Bond Fund | | | 5 | |
INVESTMENT OBJECTIVE
The Fund seeks total return, consisting of income and capital appreciation.
ADVISER
Wells Fargo Funds Management, LLC
SUB-ADVISER
Wells Capital Management Incorporated
PORTFOLIO MANAGERS
Troy Ludgood
Thomas O’Connor, CFA
FUND INCEPTION
September 20, 1999
| | | | |
| 12 MONTH TOTAL RETURN AS OF DECEMBER 31, 2011 | |
Class 2 | | | 8.31% | |
Barclays Capital U.S. Aggregate Bond Index1 | | | 7.84% | |
Figures quoted represent past performance, which is no guarantee of future results and do not reflect the deduction of taxes that a shareholder may pay on fund distributions or the redemption of fund shares. Investment return and principal value of an investment will fluctuate so that an investor’s shares, when redeemed, may be worth more or less than their original cost. Current performance may be lower or higher than the performance data quoted and assumes the reinvestment of dividends and capital gains. Current month-end performance is available by calling 1-866-765-0778. Performance figures of the Fund do not reflect fees charged pursuant to the terms of variable life insurance policies and variable annuity contracts.
Index returns do not include transaction costs associated with buying and selling securities, any mutual fund fees or expenses or any taxes. It is not possible to invest directly in an index.
The Adviser has committed through July 18, 2013 to waive fees and/or reimburse expenses to the extent necessary to cap the Fund’s Total Annual Fund Operating Expenses After Fee Waiver, excluding certain other expenses at 0.90% for Class 2. The Fund’s gross and net expense ratios are 0.90% and 0.90%, respectively, for Class 2 shares. Without these reductions, the Fund’s returns would have been lower.
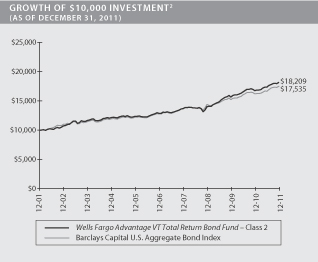
| 1. | The Barclays Capital U.S. Aggregate Bond Index is composed of the Barclays Capital Government/Credit Index and the Mortgage-Backed Securities Index and includes U.S. Treasury issues, agency issues, corporate bond issues, and mortgage-backed securities. You cannot invest directly in an index. |
| 2. | The chart compares the performance of the Wells Fargo Advantage VT Total Return Bond Fund Class 2 for the most recent ten years of the Fund with the Barclays Capital U.S. Aggregate Bond Index. The chart assumes a hypothetical $10,000 investment and reflects all operating expenses of the Fund. Performance figures of the Fund do not reflect fees charged pursuant to the terms of variable life insurance policies and variable annuity contracts. |
| | | | |
| 6 | | Wells Fargo Advantage VT Total Return Bond Fund | | Performance Highlights (Unaudited) |
MANAGER’S DISCUSSION
Fund highlights
| n | | The Fund outperformed its benchmark during the 12-month period that ended December 31, 2011, mainly due to specific security selections in agency mortgages, corporate bonds, commercial mortgage-backed securities (CMBS), and asset-backed securities (ABS). |
| n | | Our broad overweight in the ABS sector contributed to excess performance during the period. |
| n | | Our overweight in the corporate debt sector detracted from performance. |
European credit woes and several geopolitical events roiled the bond markets.
The past year held more than its fair share of challenges. A series of shocks tested the resiliency of the markets, including the earthquake, tsunami, and nuclear crisis in Japan; the geopolitical turmoil in North Africa and the Middle East; and the U.S. debt-ceiling debate and subsequent downgrade of the U.S. Treasury’s AAA3 credit rating by Standard & Poor’s. The eurozone debt crisis also dominated market sentiment.
Policymakers, both domestically and abroad, took a variety of steps to bolster investor confidence, improve liquidity, and reinvigorate the economy. European policymakers announced a series of measures aimed at addressing the challenges and helping European banks repair their balance sheets. The U.S. Federal Reserve (Fed) launched “Operation Twist” in an attempt to drive down long-term interest rates. As the year came to a close, fears of a potential double-dip recession in the U.S. and contagion risk from Europe began to subside, while recession remained a concern in Europe.
Given the strong performance of Treasuries, 2011 was a year of attractive total return for the Barclays Capital U.S. Aggregate Bond Index, albeit very low or negative excess return for most fixed-income asset classes. The ABS and CMBS sectors were the star performers, benefiting from light issuance and strong fundamentals, while credit was the greatest underperformer. Financial institutions were the biggest drag on the sector, as concerns about exposure to Europe weighed on investor sentiment.
| | | | |
TEN LARGEST LONG-TERM HOLDINGS4
(AS OF DECEMBER 31, 2011) | |
U.S. Treasury Note, 0.75%, 12/31/2016 | | | 5.19% | |
U.S. Treasury Note, 1.00%, 10/31/2016 | | | 3.35% | |
U.S. Treasury Note, 1.00%, 08/31/2016 | | | 3.29% | |
FNMA, 6.00%, 09/25/2035 | | | 2.77% | |
GNMA, 3.50%, 08/20/2041 | | | 2.74% | |
FNMA, 6.00%, 03/01/2034 | | | 1.96% | |
FNMA, 3.50%, 03/25/2041 | | | 1.89% | |
U.S. Treasury Note, 0.13%, 12/31/2031 | | | 1.89% | |
FNMA, 3.50%, 12/1/2013 | | | 1.77% | |
U.S. Treasury Note, 2.00%, 11/15/2021 | | | 1.59% | |
We maintained our consumer ABS overweight throughout 2011, ending the year with a 5.5% overweight. We reduced our overweight of top-tier credit card floater ABS, which outperformed, while adding exposure to retail credit cards. We were active in the Federal Family Education Loan Program sector, which provided many good relative-value trading opportunities during the year.
We maintained an agency mortgage risk-adjusted overweight throughout most of 2011, as the sector presented many compelling relative-value opportunities. We held a position in prepay protected premium coupons throughout the year that benefited from very good yield carry and price appreciation. In the first quarter, we started to build a large position in
| | 3. | The ratings indicated are from Standard & Poor’s. Credit-quality ratings apply to underlying holdings of the fund and not the fund itself. Standard and Poor’s rates the creditworthiness of bonds, ranging from AAA (highest) to D (lowest). Ratings from A to CCC may be modified by the addition of a plus (+) or minus (-) sign to show relative standing within the rating categories. |
| | 4. | The ten largest long-term holdings are calculated based on the value of the securities divided by total net assets of the Fund. Holdings are subject to change and may have changed since the date specified. |
| | | | | | |
| Performance Highlights (Unaudited) | | Wells Fargo Advantage VT Total Return Bond Fund | | | 7 | |
Government National Mortgage Association 15-year 4.0% pools; by the middle of the fourth quarter, we exited after significant price appreciation. Our risk-adjusted mortgage overweight at year-end was 5.5%.
We reduced exposure to credit during the course of the year, ending with an underweight of 0.5%, down from an overweight of 5.1% in early 2011. Our positioning during the year was dynamic, in response to varying market conditions. We increased exposure to credit in the first quarter as a result of an active new-issue calendar. We decreased several exposures during the second quarter as the credit sector started to look more richly valued. With risks in the market dramatically increasing over the course of the summer, we moved close to neutral by the end of the third quarter, in particular, reducing areas exposed to heightened risk, such as bank/finance and selected international assets.
|
PORTFOLIO ALLOCATION5 (AS OF DECEMBER 31, 2011) |
|
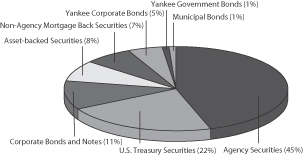 |
Our outlook is cautious on geopolitical risks but optimistic on relative trading opportunities.
We expect markets to remain prone to shocks during the first half of 2012 as participants assess the outlook for the global economy, policy execution risk, and market liquidity. With some ongoing uncertainty in the risk/reward profile, we are positioned with a somewhat conservative investment stance.
The U.S. economy outperformed initial expectations in the fourth quarter, setting up some momentum heading into 2012. Improvements in home and auto sales from low activity levels appear to be mitigating spillover effects from the financial markets.
In Europe, policymakers must navigate execution risk around implementation of fiscal control mechanisms, recessionary risk, and political willpower. In the near term, the European Central Bank’s long-term refinancing operation and the Fed’s dollar swap lines appear to be relieving systemic risk pressures. Completion of bank recapitalizations in Europe and the outcome of the Fed’s stress tests are the next milestones to watch.
Entering 2012, we maintain an overweight to agency mortgages and modest overweights to ABS and CMBS. With the Fed’s declaration that interest rates will be on hold through at least mid-2013, we think these asset classes will benefit from favorable breakevens versus Treasuries, limited net supply, and lower curve volatility. In mortgages, we are closely monitoring the risk of an increase in prepayment speeds. In credit, we expect new-issue supply to provide increased relative-value trading opportunities. We continue to be focused on security selection as the primary driver of performance.
| 5. | Portfolio allocation is subject to change and is calculated based on the total long-term investments of the Fund. |
| | | | |
| 8 | | Wells Fargo Advantage VT Total Return Bond Fund | | Performance Highlights (Unaudited) |
AVERAGE ANNUAL TOTAL RETURN (%) (AS OF DECEMBER 31, 2011)
| | | | | | | | | | | | | | | | | | | | | | | | | | | | |
| | | | | | | | | | | | | | | | | | Expense Ratios6 | |
| | | Inception Date | | | 6 Months* | | | 1 Year | | | 5 Year | | | 10 Year | | | Gross | | | Net7 | |
Class 2 | | | 09/20/1999 | | | | 4.89 | | | | 8.31 | | | | 7.14 | | | | 6.18 | | | | 0.90% | | | | 0.90% | |
Barclays Capital U.S. Aggregate Bond Index | | | | | | | 4.98 | | | | 7.84 | | | | 6.50 | | | | 5.78 | | | | | | | | | |
| * | Returns for periods of less than one year are not annualized. |
Figures quoted represent past performance, which is no guarantee of future results and do not reflect the deduction of taxes that a shareholder may pay on fund distributions or the redemption of fund shares. Investment return and principal value of an investment will fluctuate so that an investor’s shares, when redeemed, may be worth more or less than their original cost. Current performance may be lower or higher than the performance data quoted and assumes the reinvestment of dividends and capital gains. Current month-end performance is available by calling 1-866-765-0778. Performance figures of the Fund do not reflect fees charged pursuant to the terms of variable life insurance policies and variable annuity contracts.
Index returns do not include transaction costs associated with buying and selling securities, any mutual fund fees or expenses or any taxes. It is not possible to invest directly in an index.
Bond fund values fluctuate in response to the financial condition of individual issuers, general market and economic conditions, and changes in interest rates. In general, when interest rates rise, bond fund values fall and investors may lose principal value. The use of derivatives may reduce returns and/or increase volatility. Certain investment strategies tend to increase the total risk of an investment (relative to the broader market). This Fund is exposed to foreign investment risk and mortgage- and asset-backed securities risk. Consult the Fund’s prospectus for additional information on these and other risks.
Please refer to the prospectus provided by your participating insurance company for detailed information describing the separate accounts for information regarding surrender charges, mortality and expense risk fees and other charges that may be assessed by the participating insurance companies.
| 6. | Reflects the expense ratios as stated in the most recent prospectus. |
| 7. | The Adviser has committed through July 18, 2013 to waive fees and/or reimburse expenses to the extent necessary to cap the Fund’s Total Annual Fund Operating Expenses After Fee Waiver, excluding certain expenses, at 0.90% for Class 2. Without this cap, the Fund’s returns would have been lower. |
| | | | | | |
| Fund Expenses (Unaudited) | | Wells Fargo Advantage VT Total Return Bond Fund | | | 9 | |
As a shareholder of the Fund, you incur ongoing costs, including management fees; distribution (12b-1) fees; and other Fund expenses. This example is intended to help you understand your ongoing costs (in dollars) of investing in the Fund and to compare these costs with the ongoing costs of investing in other mutual funds.
The example is based on an investment of $1,000 invested at the beginning of the six-month period and held for the entire period from July 1, 2011 to December 31, 2011.
Actual Expenses
The “Actual” line of the table below provides information about actual account values and actual expenses. You may use the information in this line, together with the amount you invested, to estimate the expenses that you paid over the period. Simply divide your account value by $1,000 (for example, an $8,600 account value divided by $1,000 = 8.6), then multiply the result by the number in the “Actual” line under the heading entitled “Expenses Paid During Period” for your applicable class of shares to estimate the expenses you paid on your account during this period.
Hypothetical Example for Comparison Purposes
The “Hypothetical” line of the table below provides information about hypothetical account values and hypothetical expenses based on the Fund’s actual expense ratio and an assumed rate of return of 5% per year before expenses, which is not the Fund’s actual return. The hypothetical account values and expenses may not be used to estimate the actual ending account balance or expenses you paid for the period. You may use this information to compare the ongoing costs of investing in the Fund and other funds. To do so, compare this 5% hypothetical example with the 5% hypothetical examples that appear in the shareholder reports of the other funds.
Please note that the expenses shown in the table are meant to highlight your ongoing costs only and do not reflect any separate account charges assessed by participating insurance companies. Therefore, the “Hypothetical” line of the table is useful in comparing ongoing costs only, and will not help you determine the relative total costs of owning different funds. In addition, if these separate account charges assessed by participating insurance companies were included, your costs would have been higher.
| | | | | | | | | | | | | | | | |
| | | Beginning
Account Value
07-01-2011 | | | Ending
Account Value
12-31-2011 | | | Expenses
Paid During
the Period¹ | | | Net Annual
Expense Ratio | |
Class 2 | | | | | | | | | | | | | | | | |
Actual | | $ | 1,000.00 | | | $ | 1,048.92 | | | $ | 4.65 | | | | 0.90 | % |
Hypothetical (5% return before expenses) | | $ | 1,000.00 | | | $ | 1,020.67 | | | $ | 4.58 | | | | 0.90 | % |
| 1. | Expenses paid is equal to the annualized expense ratio multiplied by the average account value over the period, multiplied by the number of days in the most recent fiscal half-year divided by the number of days in the fiscal year (to reflect the one-half year period). |
| | | | |
| 10 | | Wells Fargo Advantage VT Total Return Bond Fund | | Portfolio of Investments—December 31, 2011 |
| | | | | | | | | | | | | | | | |
| Security Name | | Interest Rate | | | Maturity Date | | | Principal | | | Value | |
| | | | | | | | | | | | | | | | |
| | | | |
| Agency Securities: 49.37% | | | | | | | | | | | | | | | | |
FHLMC± | | | 2.40 | % | | | 12/01/2041 | | | $ | 202,000 | | | $ | 208,367 | |
FHLMC%% | | | 3.00 | | | | 12/15/2025 | | | | 700,000 | | | | 720,344 | |
FHLMC%% | | | 3.50 | | | | 06/15/2025 | | | | 1,200,000 | | | | 1,248,750 | |
FHLMC | | | 4.00 | | | | 12/01/2034 | | | | 94,416 | | | | 99,715 | |
FHLMC | | | 4.00 | | | | 12/01/2035 | | | | 110,210 | | | | 116,291 | |
FHLMC | | | 4.00 | | | | 02/15/2039 | | | | 45,844 | | | | 47,857 | |
FHLMC | | | 4.00 | | | | 02/15/2040 | | | | 246,638 | | | | 257,298 | |
FHLMC%% | | | 4.00 | | | | 02/15/2040 | | | | 900,000 | | | | 941,344 | |
FHLMC | | | 4.50 | | | | 11/15/2038 | | | | 111,405 | | | | 117,156 | |
FHLMC | | | 4.50 | | | | 08/01/2041 | | | | 118,076 | | | | 126,321 | |
FHLMC | | | 4.50 | | | | 08/01/2041 | | | | 124,261 | | | | 133,086 | |
FHLMC | | | 4.50 | | | | 08/01/2041 | | | | 190,985 | | | | 204,319 | |
FHLMC | | | 4.50 | | | | 08/01/2041 | | | | 170,395 | | | | 182,496 | |
FHLMC | | | 4.50 | | | | 09/01/2041 | | | | 153,560 | | | | 162,776 | |
FHLMC | | | 4.50 | | | | 10/01/2041 | | | | 255,015 | | | | 270,319 | |
FHLMC | | | 5.00 | | | | 03/01/2041 | | | | 44,487 | | | | 48,840 | |
FHLMC | | | 5.00 | | | | 03/01/2041 | | | | 28,638 | | | | 31,378 | |
FHLMC | | | 5.00 | | | | 03/01/2041 | | | | 24,672 | | | | 27,085 | |
FHLMC | | | 5.00 | | | | 03/01/2041 | | | | 25,894 | | | | 28,371 | |
FHLMC | | | 5.00 | | | | 04/01/2041 | | | | 164,991 | | | | 181,106 | |
FHLMC | | | 5.00 | | | | 04/01/2041 | | | | 90,093 | | | | 98,909 | |
FHLMC | | | 5.00 | | | | 04/01/2041 | | | | 53,461 | | | | 58,573 | |
FHLMC | | | 5.00 | | | | 04/01/2041 | | | | 24,758 | | | | 27,127 | |
FHLMC | | | 5.00 | | | | 05/01/2041 | | | | 141,618 | | | | 155,474 | |
FHLMC | | | 5.00 | | | | 05/01/2041 | | | | 31,707 | | | | 34,741 | |
FHLMC | | | 5.00 | | | | 05/01/2041 | | | | 83,636 | | | | 91,628 | |
FHLMC | | | 5.00 | | | | 06/01/2041 | | | | 97,416 | | | | 106,738 | |
FHLMC | | | 5.00 | | | | 06/01/2041 | | | | 104,487 | | | | 114,714 | |
FHLMC | | | 5.00 | | | | 07/01/2041 | | | | 67,604 | | | | 74,220 | |
FHLMC | | | 5.00 | | | | 07/01/2041 | | | | 44,568 | | | | 48,784 | |
FHLMC | | | 5.00 | | | | 07/01/2041 | | | | 44,704 | | | | 48,980 | |
FHLMC | | | 5.00 | | | | 07/01/2041 | | | | 215,608 | | | | 236,029 | |
FHLMC | | | 5.00 | | | | 08/01/2041 | | | | 87,880 | | | | 96,476 | |
FHLMC | | | 5.50 | | | | 10/01/2039 | | | | 38,959 | | | | 42,960 | |
FHLMC± | | | 5.59 | | | | 10/01/2038 | | | | 32,673 | | | | 35,368 | |
FHLMC± | | | 5.60 | | | | 08/01/2039 | | | | 128,850 | | | | 139,183 | |
FHLMC± | | | 5.68 | | | | 03/01/2036 | | | | 36,094 | | | | 39,074 | |
FHLMC± | | | 5.69 | | | | 03/01/2036 | | | | 22,849 | | | | 24,724 | |
FHLMC± | | | 5.81 | | | | 11/01/2036 | | | | 166,844 | | | | 180,471 | |
FHLMC± | | | 5.83 | | | | 11/01/2037 | | | | 1,467 | | | | 1,583 | |
FHLMC± | | | 5.92 | | | | 03/01/2037 | | | | 9,895 | | | | 10,698 | |
FHLMC± | | | 5.93 | | | | 06/01/2036 | | | | 60,715 | | | | 65,727 | |
FHLMC± | | | 5.97 | | | | 01/01/2037 | | | | 4,857 | | | | 5,243 | |
FHLMC± | | | 5.98 | | | | 06/01/2038 | | | | 105,979 | | | | 114,442 | |
FHLMC | | | 6.00 | | | | 03/01/2034 | | | | 40,279 | | | | 44,868 | |
FHLMC | | | 6.00 | | | | 02/01/2035 | | | | 36,465 | | | | 40,620 | |
FHLMC | | | 6.00 | | | | 12/01/2035 | | | | 577,908 | | | | 643,755 | |
FHLMC | | | 6.00 | | | | 08/01/2037 | | | | 57,641 | | | | 64,209 | |
FHLMC | | | 6.00 | | | | 08/01/2038 | | | | 52,137 | | | | 58,077 | |
FHLMC | | | 6.00 | | | | 10/01/2038 | | | | 79,848 | | | | 88,946 | |
FHLMC± | | | 6.15 | | | | 06/01/2037 | | | | 148,339 | | | | 161,240 | |
| | | | | | |
| Portfolio of Investments—December 31, 2011 | | Wells Fargo Advantage VT Total Return Bond Fund | | | 11 | |
| | | | | | | | | | | | | | | | |
| Security Name | | Interest Rate | | | Maturity Date | | | Principal | | | Value | |
| | | | | | | | | | | | | | | | |
| | | | |
| Agency Securities (continued) | | | | | | | | | | | | | | | | |
FHLMC Series 2980 Class QA | | | 6.00 | % | | | 05/15/2035 | | | $ | 610,469 | | | $ | 682,753 | |
FHLMC Series 3529 Class AG | | | 6.50 | | | | 04/15/2039 | | | | 388,265 | | | | 431,650 | |
FHLMC Series 3622 Class WA | | | 5.50 | | | | 09/15/2039 | | | | 214,460 | | | | 232,722 | |
FHLMC Series K003 Class AAVB | | | 4.77 | | | | 05/25/2018 | | | | 166,000 | | | | 186,371 | |
FHLMC Series K005 Class A2 | | | 4.32 | | | | 11/25/2019 | | | | 126,000 | | | | 139,892 | |
FHLMC Series T-48 Class 1A3 Preassign 00764± | | | 6.31 | | | | 07/25/2033 | | | | 3,048 | | | | 3,435 | |
FHLMC Series T-57 Class 1A3 Preassign 00073 | | | 7.50 | | | | 07/25/2043 | | | | 34,534 | | | | 39,713 | |
FHLMC Series T-59 Class 1A3 Preassign 00329 | | | 7.50 | | | | 10/25/2043 | | | | 46,251 | | | | 52,788 | |
FHLMC Series T-60 Class 1A3 Preassign 00462 | | | 7.50 | | | | 03/25/2044 | | | | 48,375 | | | | 54,345 | |
FNMA(z) | | | 3.39 | | | | 10/09/2019 | | | | 225,000 | | | | 172,928 | |
FNMA | | | 3.50 | | | | 12/01/2031 | | | | 1,479,331 | | | | 1,537,997 | |
FNMA | | | 3.50 | | | | 01/01/2032 | | | | 461,000 | | | | 479,282 | |
FNMA%% | | | 3.50 | | | | 02/25/2041 | | | | 200,000 | | | | 205,125 | |
FNMA%% | | | 3.50 | | | | 03/25/2041 | | | | 1,600,000 | | | | 1,645,500 | |
FNMA | | | 4.00 | | | | 10/01/2033 | | | | 27,425 | | | | 28,994 | |
FNMA | | | 4.00 | | | | 10/01/2033 | | | | 283,170 | | | | 299,371 | |
FNMA | | | 4.00 | | | | 01/01/2035 | | | | 49,605 | | | | 52,443 | |
FNMA | | | 4.00 | | | | 05/01/2037 | | | | 289,877 | | | | 306,190 | |
FNMA%% | | | 4.00 | | | | 03/25/2040 | | | | 400,000 | | | | 420,188 | |
FNMA | | | 4.50 | | | | 07/01/2041 | | | | 135,441 | | | | 144,242 | |
FNMA | | | 4.50 | | | | 08/01/2041 | | | | 217,785 | | | | 234,284 | |
FNMA | | | 4.50 | | | | 08/01/2041 | | | | 191,228 | | | | 205,715 | |
FNMA | | | 4.50 | | | | 08/01/2041 | | | | 41,118 | | | | 44,091 | |
FNMA | | | 4.50 | | | | 08/01/2041 | | | | 45,662 | | | | 48,891 | |
FNMA | | | 4.50 | | | | 08/01/2041 | | | | 30,796 | | | | 33,022 | |
FNMA | | | 4.50 | | | | 08/01/2041 | | | | 117,214 | | | | 124,830 | |
FNMA | | | 4.50 | | | | 10/01/2041 | | | | 48,864 | | | | 52,039 | |
FNMA%% | | | 5.00 | | | | 10/25/2036 | | | | 300,000 | | | | 323,437 | |
FNMA | | | 5.00 | | | | 03/01/2041 | | | | 24,737 | | | | 27,300 | |
FNMA | | | 5.00 | | | | 05/01/2041 | | | | 113,858 | | | | 125,299 | |
FNMA | | | 5.00 | | | | 05/01/2041 | | | | 110,008 | | | | 121,397 | |
FNMA | | | 5.00 | | | | 06/01/2041 | | | | 97,225 | | | | 107,300 | |
FNMA | | | 5.00 | | | | 06/01/2041 | | | | 129,381 | | | | 142,383 | |
FNMA | | | 5.00 | | | | 06/01/2041 | | | | 87,733 | | | | 96,633 | |
FNMA | | | 5.00 | | | | 06/01/2041 | | | | 66,470 | | | | 73,212 | |
FNMA | | | 5.00 | | | | 07/01/2041 | | | | 24,840 | | | | 27,359 | |
FNMA | | | 5.00 | | | | 07/01/2041 | | | | 1,141,469 | | | | 1,261,899 | |
FNMA | | | 5.00 | | | | 08/01/2041 | | | | 110,254 | | | | 121,679 | |
FNMA | | | 5.00 | | | | 08/01/2041 | | | | 66,512 | | | | 73,191 | |
FNMA | | | 5.00 | | | | 08/01/2041 | | | | 66,564 | | | | 73,317 | |
FNMA | | | 5.00 | | | | 08/01/2041 | | | | 236,754 | | | | 261,290 | |
FNMA | | | 5.00 | | | | 08/01/2041 | | | | 65,237 | | | | 72,120 | |
FNMA | | | 5.00 | | | | 09/01/2041 | | | | 176,823 | | | | 194,595 | |
FNMA | | | 5.00 | | | | 09/01/2041 | | | | 156,111 | | | | 171,949 | |
FNMA | | | 5.00 | | | | 09/01/2041 | | | | 77,661 | | | | 84,107 | |
FNMA± | | | 5.49 | | | | 01/01/2036 | | | | 128,858 | | | | 138,012 | |
FNMA | | | 5.50 | | | | 09/01/2034 | | | | 58,360 | | | | 63,643 | |
FNMA | | | 5.50 | | | | 12/01/2035 | | | | 123,385 | | | | 136,538 | |
FNMA | | | 5.50 | | | | 01/01/2038 | | | | 263,380 | | | | 291,456 | |
FNMA | | | 5.50 | | | | 07/01/2039 | | | | 53,005 | | | | 59,036 | |
FNMA | | | 5.50 | | | | 12/15/2039 | | | | 620,279 | | | | 672,036 | |
| | | | |
| 12 | | Wells Fargo Advantage VT Total Return Bond Fund | | Portfolio of Investments—December 31, 2011 |
| | | | | | | | | | | | | | | | |
| Security Name | | Interest Rate | | | Maturity Date | | | Principal | | | Value | |
| | | | | | | | | | | | | | | | |
| | | | |
| Agency Securities (continued) | | | | | | | | | | | | | | | | |
FNMA | | | 5.50 | % | | | 05/25/2040 | | | $ | 437,543 | | | $ | 479,064 | |
FNMA | | | 5.50 | | | | 08/01/2040 | | | | 128,858 | | | | 142,594 | |
FNMA± | | | 5.50 | | | | 02/01/2039 | | | | 61,909 | | | | 66,891 | |
FNMA± | | | 5.74 | | | | 10/01/2037 | | | | 21,632 | | | | 23,413 | |
FNMA± | | | 5.84 | | | | 09/01/2037 | | | | 64,034 | | | | 69,382 | |
FNMA± | | | 5.87 | | | | 02/01/2037 | | | | 36,628 | | | | 39,594 | |
FNMA± | | | 5.88 | | | | 01/01/2037 | | | | 36,073 | | | | 38,953 | |
FNMA± | | | 5.89 | | | | 07/01/2037 | | | | 44,456 | | | | 48,101 | |
FNMA± | | | 5.92 | | | | 04/01/2037 | | | | 50,215 | | | | 54,298 | |
FNMA± | | | 5.93 | | | | 01/01/2037 | | | | 66,585 | | | | 71,913 | |
FNMA± | | | 5.93 | | | | 03/01/2037 | | | | 39,394 | | | | 42,548 | |
FNMA± | | | 5.95 | | | | 09/01/2037 | | | | 22,069 | | | | 24,159 | |
FNMA | | | 6.00 | | | | 03/01/2034 | | | | 1,529,410 | | | | 1,705,443 | |
FNMA | | | 6.00 | | | | 03/01/2034 | | | | 1,138,586 | | | | 1,269,173 | |
FNMA | | | 6.00 | | | | 08/01/2034 | | | | 100,337 | | | | 111,503 | |
FNMA | | | 6.00 | | | | 08/01/2034 | | | | 48,167 | | | | 53,693 | |
FNMA | | | 6.00 | | | | 11/01/2034 | | | | 76,217 | | | | 84,698 | |
FNMA | | | 6.00 | | | | 12/01/2034 | | | | 307,942 | | | | 343,270 | |
FNMA | | | 6.00 | | | | 04/01/2035 | | | | 23,433 | | | | 26,121 | |
FNMA | | | 6.00 | | | | 04/01/2035 | | | | 478,888 | | | | 533,827 | |
FNMA | | | 6.00 | | | | 04/01/2035 | | | | 235,861 | | | | 262,109 | |
FNMA%% | | | 6.00 | | | | 07/25/2035 | | | | 100,000 | | | | 110,109 | |
FNMA%% | | | 6.00 | | | | 08/25/2035 | | | | 300,000 | | | | 329,625 | |
FNMA%% | | | 6.00 | | | | 09/25/2035 | | | | 2,200,000 | | | | 2,412,438 | |
FNMA | | | 6.00 | | | | 12/01/2035 | | | | 188,284 | | | | 209,884 | |
FNMA | | | 6.00 | | | | 08/01/2036 | | | | 474,619 | | | | 524,916 | |
FNMA | | | 6.00 | | | | 08/01/2036 | | | | 255,920 | | | | 284,401 | |
FNMA | | | 6.00 | | | | 10/01/2036 | | | | 238,739 | | | | 263,368 | |
FNMA | | | 6.00 | | | | 03/01/2037 | | | | 103,262 | | | | 114,223 | |
FNMA | | | 6.00 | | | | 07/01/2037 | | | | 471,594 | | | | 525,787 | |
FNMA | | | 6.00 | | | | 01/01/2038 | | | | 47,095 | | | | 51,894 | |
FNMA | | | 6.00 | | | | 10/01/2038 | | | | 241,973 | | | | 266,708 | |
FNMA | | | 6.00 | | | | 10/01/2039 | | | | 481,282 | | | | 534,416 | |
FNMA | | | 6.00 | | | | 12/01/2040 | | | | 73,657 | | | | 82,108 | |
FNMA± | | | 6.01 | | | | 12/01/2036 | | | | 31,602 | | | | 34,163 | |
FNMA± | | | 6.03 | | | | 09/01/2037 | | | | 12,198 | | | | 13,229 | |
FNMA± | | | 6.04 | | | | 03/01/2012 | | | | 168,769 | | | | 171,057 | |
FNMA± | | | 6.04 | | | | 07/01/2037 | | | | 23,831 | | | | 25,849 | |
FNMA± | | | 6.07 | | | | 10/01/2037 | | | | 75,942 | | | | 82,432 | |
FNMA± | | | 6.09 | | | | 11/01/2037 | | | | 27,331 | | | | 29,719 | |
FNMA± | | | 6.27 | | | | 09/01/2037 | | | | 206,571 | | | | 226,677 | |
FNMA± | | | 6.32 | | | | 10/01/2036 | | | | 19,675 | | | | 21,401 | |
FNMA(a) | | | 7.00 | | | | 02/25/2042 | | | | 240,000 | | | | 273,286 | |
FNMA Series 2002-33 Class A2 | | | 7.50 | | | | 06/25/2032 | | | | 35,190 | | | | 39,521 | |
FNMA Series 2003-W17 Class 1A7 | | | 5.75 | | | | 08/25/2033 | | | | 85,000 | | | | 97,422 | |
FNMA Series 2005-5 Class PA | | | 5.00 | | | | 01/25/2035 | | | | 66,179 | | | | 72,286 | |
FNMA Series 2006-56 Class CA | | | 6.00 | | | | 07/25/2036 | | | | 33,010 | | | | 37,750 | |
FNMA Series 2009-105 Class CB | | | 6.00 | | | | 12/25/2039 | | | | 275,502 | | | | 307,140 | |
FNMA Series 2009-11 Class LC | | | 4.50 | | | | 03/25/2049 | | | | 170,842 | | | | 180,699 | |
FNMA Series 2009-30 Class AD | | | 6.50 | | | | 04/25/2039 | | | | 252,179 | | | | 275,409 | |
FNMA Series 2009-30 Class AG | | | 6.50 | | | | 05/25/2039 | | | | 462,797 | | | | 515,957 | |
FNMA Series 2009-66 Class KE | | | 4.00 | | | | 09/25/2039 | | | | 222,295 | | | | 232,047 | |
| | | | | | |
| Portfolio of Investments—December 31, 2011 | | Wells Fargo Advantage VT Total Return Bond Fund | | | 13 | |
| | | | | | | | | | | | | | | | |
| Security Name | | Interest Rate | | | Maturity Date | | | Principal | | | Value | |
| | | | | | | | | | | | | | | | |
| | | | |
| Agency Securities (continued) | | | | | | | | | | | | | | | | |
FNMA Series 2009-78 Class J | | | 5.00 | % | | | 09/25/2019 | | | $ | 232,178 | | | $ | 251,985 | |
FNMA Series 2009-93 Class PD | | | 4.50 | | | | 09/25/2039 | | | | 94,677 | | | | 100,783 | |
FNMA Series 2009-M01 Class A2 | | | 4.29 | | | | 07/25/2019 | | | | 135,000 | | | | 151,674 | |
FNMA Series 2009-M02 Class A3 | | | 4.00 | | | | 01/25/2019 | | | | 244,000 | | | | 268,809 | |
FNMA Series 2010-054 Class EA | | | 4.50 | | | | 06/25/2040 | | | | 338,164 | | | | 360,343 | |
FNMA Series 2010-M01 Class A2 | | | 4.45 | | | | 09/25/2019 | | | | 100,000 | | | | 113,386 | |
FNMA Series 2010-M03 Class A3± | | | 4.33 | | | | 03/25/2020 | | | | 499,000 | | | | 562,133 | |
FNMA Series 2011 Class 53 | | | 4.50 | | | | 06/25/2041 | | | | 227,063 | | | | 239,334 | |
FNMA Series 2011-53 | | | 4.00 | | | | 06/25/2041 | | | | 580,328 | | | | 606,493 | |
FNMA Series 2011-78 Class D | | | 4.00 | | | | 08/25/2041 | | | | 54,798 | | | | 57,234 | |
GNMA | | | 3.50 | | | | 02/20/2041 | | | | 58,316 | | | | 59,929 | |
GNMA | | | 3.50 | | | | 02/20/2041 | | | | 26,855 | | | | 27,597 | |
GNMA | | | 3.50 | | | | 02/20/2041 | | | | 38,926 | | | | 40,003 | |
GNMA | | | 3.50 | | | | 03/20/2041 | | | | 75,687 | | | | 77,780 | |
GNMA± | | | 3.50 | | | | 05/20/2041 | | | | 156,113 | | | | 164,868 | |
GNMA± | | | 3.50 | | | | 05/20/2041 | | | | 69,211 | | | | 73,057 | |
GNMA± | | | 3.50 | | | | 06/20/2041 | | | | 222,929 | | | | 235,319 | |
GNMA%% | | | 3.50 | | | | 07/20/2041 | | | | 1,000,000 | | | | 1,040,781 | |
GNMA%% | | | 3.50 | | | | 08/20/2041 | | | | 2,300,000 | | | | 2,386,609 | |
GNMA± | | | 3.50 | | | | 10/20/2041 | | | | 63,777 | | | | 67,146 | |
GNMA | | | 6.00 | | | | 01/15/2040 | | | | 530,258 | | | | 601,133 | |
GNMA II± | | | 3.00 | | | | 07/20/2041 | | | | 118,313 | | | | 123,069 | |
GNMA II± | | | 3.00 | | | | 07/20/2041 | | | | 43,630 | | | | 45,406 | |
GNMA II± | | | 3.00 | | | | 08/20/2041 | | | | 67,552 | | | | 70,267 | |
GNMA II± | | | 3.00 | | | | 08/20/2041 | | | | 96,247 | | | | 100,165 | |
GNMA II± | | | 3.00 | | | | 10/20/2041 | | | | 74,761 | | | | 77,501 | |
GNMA II± | | | 3.00 | | | | 11/20/2041 | | | | 48,916 | | | | 50,685 | |
GNMA II± | | | 3.50 | | | | 07/20/2041 | | | | 200,696 | | | | 211,825 | |
GNMA II± | | | 3.50 | | | | 07/20/2041 | | | | 95,511 | | | | 100,784 | |
GNMA II± | | | 3.50 | | | | 08/20/2041 | | | | 65,108 | | | | 68,718 | |
GNMA Series 2002-95 Class DB | | | 6.00 | | | | 01/25/2033 | | | | 140,000 | | | | 159,821 | |
| | | | |
Total Agency Securities (Cost $42,259,089) | | | | | | | | | | | | | | | 43,016,094 | |
| | | | | | | | | | | | | | | | |
| | | | |
| Asset-Backed Securities: 8.25% | | | | | | | | | | | | | | | | |
Ally Auto Receivables Trust Series 2011-4 Class A4 | | | 1.14 | | | | 06/15/2016 | | | | 106,000 | | | | 105,662 | |
Ally Master Owner Trust Series 2011-4 Class A2 | | | 1.54 | | | | 09/15/2016 | | | | 117,000 | | | | 116,621 | |
Capital One Multi-Asset Execution Trust Series 2004-A4 Class A4± | | | 0.50 | | | | 03/15/2017 | | | | 50,000 | | | | 49,859 | |
Capital One Multi-Asset Execution Trust Series 2005-A10 Class A± | | | 0.36 | | | | 09/15/2015 | | | | 101,000 | | | | 100,858 | |
Chase Issuance Trust Series 2005-A11 Class A± | | | 0.35 | | | | 12/15/2014 | | | | 279,000 | | | | 278,930 | |
Chase Issuance Trust Series 2005-A6 Class A6± | | | 0.35 | | | | 07/15/2014 | | | | 71,000 | | | | 70,988 | |
Citibank Omni Master Trust Series 2009-A14 Class A14±144A | | | 3.03 | | | | 08/15/2018 | | | | 509,000 | | | | 533,944 | |
Citibank Omni Master Trust Series 2009-A8 Class A8±144A | | | 2.38 | | | | 05/16/2016 | | | | 332,000 | | | | 334,039 | |
Developers Diversified Realty Corporation Trust Series 2009-DDR1 Class A144A | | | 3.81 | | | | 10/14/2022 | | | | 261,769 | | | | 272,665 | |
Discover Card Master Trust Series 2009-A1 Class A1± | | | 1.58 | | | | 12/15/2014 | | | | 100,000 | | | | 100,591 | |
Ford Credit Auto Owner Trust Series 2009-D Class A3 | | | 2.17 | | | | 10/15/2013 | | | | 82,211 | | | | 82,631 | |
GE Capital Credit Card Master Note Trust Series 2009-2 Class A | | | 3.69 | | | | 07/15/2015 | | | | 349,000 | | | | 354,502 | |
Goal Capital Funding Trust Series 2006-1 Class A3± | | | 0.63 | | | | 11/25/2026 | | | | 334,000 | | | | 315,264 | |
Harley Davidson Motorcycle Trust Series 2011-2 Class A4 | | | 1.47 | | | | 08/15/2017 | | | | 131,000 | | | | 130,675 | |
Honda Auto Receivables Owner Trust Series 2010-3 Class A2 | | | 0.53 | | | | 01/21/2013 | | | | 146,041 | | | | 146,019 | |
Hyundai Auto Receivables Trust Series 2011-C Class A4 | | | 1.30 | | | | 02/15/2018 | | | | 93,000 | | | | 92,907 | |
MMCA Automobile Trust Series 2011-A Class A4144A | | | 2.02 | | | | 10/17/2016 | | | | 116,000 | | | | 117,479 | |
| | | | |
| 14 | | Wells Fargo Advantage VT Total Return Bond Fund | | Portfolio of Investments—December 31, 2011 |
| | | | | | | | | | | | | | | | |
| Security Name | | Interest Rate | | | Maturity Date | | | Principal | | | Value | |
| | | | | | | | | | | | | | | | |
| | | | |
| Asset-Backed Securities (continued) | | | | | | | | | | | | | | | | |
Nelnet Student Loan Trust Series 2005-2 Class A5± | | | 0.67 | % | | | 03/23/2037 | | | $ | 196,000 | | | $ | 176,007 | |
Nelnet Student Loan Trust Series 2006-1 Class A4± | | | 0.59 | | | | 11/23/2022 | | | | 142,000 | | | | 140,003 | |
Nelnet Student Loan Trust Series 2006-2 Class A4± | | | 0.50 | | | | 10/26/2026 | | | | 293,000 | | | | 286,639 | |
Nelnet Student Loan Trust Series 2007-1 Class A3± | | | 0.58 | | | | 05/27/2025 | | | | 253,000 | | | | 227,046 | |
Nelnet Student Loan Trust Series 2008-3 Class A4± | | | 2.16 | | | | 11/25/2024 | | | | 293,000 | | | | 299,736 | |
SLM Student Loan Trust Series 2000-A Class A2± | | | 0.61 | | | | 10/28/2028 | | | | 122,551 | | | | 122,138 | |
SLM Student Loan Trust Series 2003-14 Class A5± | | | 0.65 | | | | 01/25/2023 | | | | 340,000 | | | | 331,178 | |
SLM Student Loan Trust Series 2004-1 Class A3± | | | 0.63 | | | | 04/25/2023 | | | | 364,000 | | | | 351,986 | |
SLM Student Loan Trust Series 2004-3 Class A5± | | | 0.59 | | | | 07/25/2023 | | | | 93,000 | | | | 90,284 | |
SLM Student Loan Trust Series 2005-6 Class A± | | | 0.53 | | | | 07/27/2026 | | | | 421,000 | | | | 405,604 | |
SLM Student Loan Trust Series 2005-8 Class A3± | | | 0.53 | | | | 10/25/2024 | | | | 210,000 | | | | 203,331 | |
SLM Student Loan Trust Series 2006-10 Class A4± | | | 0.49 | | | | 07/25/2023 | | | | 173,000 | | | | 170,399 | |
SLM Student Loan Trust Series 2008-4 Class A2± | | | 1.47 | | | | 07/25/2016 | | | | 98,258 | | | | 99,170 | |
SLM Student Loan Trust Series 2008-9 Class A± | | | 1.92 | | | | 04/25/2023 | | | | 153,108 | | | | 156,633 | |
SLM Student Loan Trust Series 2011-C Class A1±144A | | | 1.66 | | | | 12/15/2023 | | | | 386,000 | | | | 386,064 | |
USAA Auto Owner Trust Series 2008-3 Class A4 | | | 4.71 | | | | 02/18/2014 | | | | 161,049 | | | | 162,085 | |
Volkswagen Auto Loan Enhanced Trust Series 2008-1 Class A4± | | | 1.98 | | | | 10/20/2014 | | | | 157,175 | | | | 157,511 | |
World Financial Network Credit Card Master Trust Series 2011-A Class A | | | 1.68 | | | | 08/15/2018 | | | | 122,000 | | | | 121,636 | |
World Omni Auto Receivables Trust Series 2008-A Class A4 | | | 4.74 | | | | 10/15/2013 | | | | 98,865 | | | | 100,130 | |
| | | | |
Total Asset-Backed Securities (Cost $7,198,882) | | | | | | | | | | | | | | | 7,191,214 | |
| | | | | | | | | | | | | | | | |
| | | | |
Corporate Bonds and Notes: 12.20% | | | | | | | | | | | | | | | | |
| | | | |
Consumer Discretionary: 1.15% | | | | | | | | | | | | | | | | |
| | | | |
| Automobiles: 0.28% | | | | | | | | | | | | | | | | |
Daimler Finance North America LLC144A | | | 1.88 | | | | 09/15/2014 | | | | 245,000 | | | | 243,705 | |
| | | | | | | | | | | | | | | | |
| | | | |
| Media: 0.69% | | | | | | | | | | | | | | | | |
Comcast Corporation | | | 8.38 | | | | 03/15/2013 | | | | 158,000 | | | | 171,843 | |
NBC Universal Incorporated | | | 2.88 | | | | 04/01/2016 | | | | 147,000 | | | | 149,898 | |
NBC Universal Incorporated | | | 4.38 | | | | 04/01/2021 | | | | 75,000 | | | | 79,121 | |
News America Incorporated | | | 6.15 | | | | 03/01/2037 | | | | 55,000 | | | | 60,018 | |
News America Incorporated | | | 6.15 | | | | 02/15/2041 | | | | 18,000 | | | | 20,708 | |
Time Warner Cable Incorporated | | | 5.50 | | | | 09/01/2041 | | | | 115,000 | | | | 120,952 | |
| | | | |
| | | | | | | | | | | | | | | 602,540 | |
| | | | | | | | | | | | | | | | |
| | | | |
| Specialty Retail: 0.18% | | | | | | | | | | | | | | | | |
Gap Incorporated | | | 5.95 | | | | 04/12/2021 | | | | 160,000 | | | | 152,555 | |
| | | | | | | | | | | | | | | | |
| | | | |
Consumer Staples : 0.65% | | | | | | | | | | | | | | | | |
| | | | |
| Beverages: 0.36% | | | | | | | | | | | | | | | | |
PepsiCo Incorporated | | | 2.50 | | | | 05/10/2016 | | | | 135,000 | | | | 140,472 | |
The Coca-Cola Company | | | 1.80 | | | | 09/01/2016 | | | | 170,000 | | | | 172,954 | |
| | | | |
| | | | | | | | | | | | | | | 313,426 | |
| | | | | | | | | | | | | | | | |
| | | | |
| Food & Staples Retailing: 0.10% | | | | | | | | | | | | | | | | |
Wal-Mart Stores Incorporated | | | 5.63 | | | | 04/15/2041 | | | | 70,000 | | | | 90,279 | |
| | | | | | | | | | | | | | | | |
| | | | |
| Food Products: 0.10% | | | | | | | | | | | | | | | | |
Kraft Foods Incorporated Class A | | | 6.50 | | | | 02/09/2040 | | | | 65,000 | | | | 84,400 | |
| | | | | | | | | | | | | | | | |
| | | | | | |
| Portfolio of Investments—December 31, 2011 | | Wells Fargo Advantage VT Total Return Bond Fund | | | 15 | |
| | | | | | | | | | | | | | | | |
| Security Name | | Interest Rate | | | Maturity Date | | | Principal | | | Value | |
| | | | | | | | | | | | | | | | |
| | | | |
| Tobacco: 0.09% | | | | | | | | | | | | | | | | |
Altria Group Incorporated | | | 10.20 | % | | | 02/06/2039 | | | $ | 50,000 | | | $ | 77,684 | |
| | | | | | | | | | | | | | | | |
| | | | |
Energy: 1.30% | | | | | | | | | | | | | | | | |
| | | | |
| Oil, Gas & Consumable Fuels: 1.30% | | | | | | | | | | | | | | | | |
El Paso Pipeline Partners Operating LLC | | | 5.00 | | | | 10/01/2021 | | | | 50,000 | | | | 51,441 | |
El Paso Pipeline Partners Operating LLC | | | 7.50 | | | | 11/15/2040 | | | | 55,000 | | | | 63,910 | |
Energen Corporation | | | 4.63 | | | | 09/01/2021 | | | | 160,000 | | | | 158,721 | |
Energy Transfer Partners LP | | | 9.00 | | | | 04/15/2019 | | | | 75,000 | | | | 89,186 | |
Kerr-McGee Corporation | | | 6.95 | | | | 07/01/2024 | | | | 190,000 | | | | 226,502 | |
Marathon Petroleum Corporation | | | 5.13 | | | | 03/01/2021 | | | | 23,000 | | | | 24,019 | |
Marathon Petroleum Corporation | | | 6.50 | | | | 03/01/2041 | | | | 23,000 | | | | 26,017 | |
MidAmerican Energy Holdings Company | | | 6.50 | | | | 09/15/2037 | | | | 65,000 | | | | 81,469 | |
Pride International Incorporated | | | 6.88 | | | | 08/15/2020 | | | | 95,000 | | | | 111,344 | |
The Williams Companies Incorporated | | | 7.88 | | | | 09/01/2021 | | | | 30,000 | | | | 36,909 | |
The Williams Companies Incorporated Series A | | | 7.50 | | | | 01/15/2031 | | | | 46,000 | | | | 55,984 | |
Western Gas Partners LP | | | 5.38 | | | | 06/01/2021 | | | | 195,000 | | | | 206,733 | |
| | | | |
| | | | | | | | | | | | | | | 1,132,235 | |
| | | | | | | | | | | | | | | | |
| | | | |
Financials: 5.23% | | | | | | | | | | | | | | | | |
| | | | |
| Capital Markets: 1.06% | | | | | | | | | | | | | | | | |
Goldman Sachs Group Incorporated | | | 3.63 | | | | 02/07/2016 | | | | 75,000 | | | | 72,480 | |
Goldman Sachs Group Incorporated | | | 5.25 | | | | 07/27/2021 | | | | 30,000 | | | | 29,255 | |
Goldman Sachs Group Incorporated | | | 6.00 | | | | 06/15/2020 | | | | 110,000 | | | | 112,643 | |
Goldman Sachs Group Incorporated | | | 6.25 | | | | 02/01/2041 | | | | 60,000 | | | | 58,761 | |
Lazard Group LLC | | | 6.85 | | | | 06/15/2017 | | | | 215,000 | | | | 225,580 | |
Lazard Group LLC | | | 7.13 | | | | 05/15/2015 | | | | 150,000 | | | | 161,092 | |
Morgan Stanley | | | 3.80 | | | | 04/29/2016 | | | | 200,000 | | | | 184,299 | |
Morgan Stanley | | | 5.50 | | | | 07/28/2021 | | | | 90,000 | | | | 83,187 | |
| | | | |
| | | | | | | | | | | | | | | 927,297 | |
| | | | | | | | | | | | | | | | |
| | | | |
| Commercial Banks: 0.17% | | | | | | | | | | | | | | | | |
Inter-American Development Bank Series EMTN | | | 3.88 | | | | 10/28/2041 | | | | 135,000 | | | | 143,327 | |
| | | | | | | | | | | | | | | | |
| | | | |
| Consumer Finance: 0.33% | | | | | | | | | | | | | | | | |
American Express Credit Corporation | | | 2.80 | | | | 09/19/2016 | | | | 230,000 | | | | 231,178 | |
Capital One Financial Corporation | | | 4.75 | | | | 07/15/2021 | | | | 55,000 | | | | 56,580 | |
| | | | |
| | | | | | | | | | | | | | | 287,758 | |
| | | | | | | | | | | | | | | | |
| | | | |
| Diversified Financial Services: 2.24% | | | | | | | | | | | | | | | | |
ABB Treasury Center USA Incorporated 144A | | | 2.50 | | | | 06/15/2016 | | | | 95,000 | | | | 95,545 | |
Bank of America Corporation | | | 3.75 | | | | 07/12/2016 | | | | 190,000 | | | | 175,960 | |
Bank of America Corporation | | | 5.00 | | | | 05/13/2021 | | | | 130,000 | | | | 118,366 | |
Bank of America Corporation | | | 6.00 | | | | 09/01/2017 | | | | 120,000 | | | | 117,223 | |
Citigroup Incorporated« | | | 1.88 | | | | 10/22/2012 | | | | 370,000 | | | | 375,103 | |
Citigroup Incorporated | | | 3.95 | | | | 06/15/2016 | | | | 163,000 | | | | 162,471 | |
Citigroup Incorporated | | | 4.50 | | | | 01/14/2022 | | | | 122,000 | | | | 117,320 | |
Citigroup Incorporated | | | 5.38 | | | | 08/09/2020 | | | | 45,000 | | | | 46,256 | |
General Electric Capital Corporation | | | 4.65 | | | | 10/17/2021 | | | | 185,000 | | | | 193,003 | |
General Electric Capital Corporation | | | 6.88 | | | | 01/10/2039 | | | | 145,000 | | | | 173,412 | |
JPMorgan Chase & Company | | | 4.35 | | | | 08/15/2021 | | | | 210,000 | | | | 211,998 | |
| | | | |
| 16 | | Wells Fargo Advantage VT Total Return Bond Fund | | Portfolio of Investments—December 31, 2011 |
| | | | | | | | | | | | | | | | |
| Security Name | | Interest Rate | | | Maturity Date | | | Principal | | | Value | |
| | | | | | | | | | | | | | | | |
| | | | |
| Diversified Financial Services (continued) | | | | | | | | | | | | | | | | |
JPMorgan Chase & Company | | | 5.40 | % | | | 01/06/2042 | | | $ | 95,000 | | | $ | 98,946 | |
JPMorgan Chase & Company | | | 5.60 | | | | 07/15/2041 | | | | 65,000 | | | | 67,923 | |
| | | | |
| | | | | | | | | | | | | | | 1,953,526 | |
| | | | | | | | | | | | | | | | |
| | | | |
| Insurance: 0.70% | | | | | | | | | | | | | | | | |
American International Group Incorporated | | | 4.88 | | | | 09/15/2016 | | | | 50,000 | | | | 47,325 | |
American International Group Incorporated Series MTN | | | 5.85 | | | | 01/16/2018 | | | | 65,000 | | | | 63,555 | |
Berkshire Hathaway Incorporated | | | 3.75 | | | | 08/15/2021 | | | | 164,000 | | | | 170,335 | |
CNA Financial Corporation | | | 5.75 | | | | 08/15/2021 | | | | 85,000 | | | | 86,704 | |
CNA Financial Corporation | | | 6.50 | | | | 08/15/2016 | | | | 50,000 | | | | 54,094 | |
MetLife Incorporated | | | 5.70 | | | | 06/15/2035 | | | | 45,000 | | | | 50,139 | |
Protective Life Corporation | | | 8.45 | | | | 10/15/2039 | | | | 43,000 | | | | 49,199 | |
Prudential Financial Incorporated | | | 5.63 | | | | 05/12/2041 | | | | 30,000 | | | | 29,440 | |
Prudential Financial Incorporated Series MTN | | | 4.50 | | | | 11/16/2021 | | | | 35,000 | | | | 35,338 | |
WR Berkley Corporation | | | 5.38 | | | | 09/15/2020 | | | | 25,000 | | | | 25,217 | |
| | | | |
| | | | | | | | | | | | | | | 611,346 | |
| | | | | | | | | | | | | | | | |
| | | | |
| REIT: 0.73% | | | | | | | | | | | | | | | | |
Boston Properties LP | | | 3.70 | | | | 11/15/2018 | | | | 80,000 | | | | 81,662 | |
ERP Operation Limited Partnership | | | 4.63 | | | | 12/15/2021 | | | | 70,000 | | | | 71,355 | |
HCP Incorporated | | | 6.75 | | | | 02/01/2041 | | | | 23,000 | | | | 25,956 | |
Health Care Property Investors Incorporated | | | 5.65 | | | | 12/15/2013 | | | | 150,000 | | | | 157,773 | |
Health Care REIT Incorporated | | | 6.50 | | | | 03/15/2041 | | | | 30,000 | | | | 30,008 | |
Kilroy Realty LP | | | 4.80 | | | | 07/15/2018 | | | | 110,000 | | | | 108,616 | |
Kilroy Realty LP | | | 5.00 | | | | 11/03/2015 | | | | 40,000 | | | | 41,143 | |
Kilroy Realty LP | | | 6.63 | | | | 06/01/2020 | | | | 30,000 | | | | 32,187 | |
SL Green Realty Corporation | | | 5.00 | | | | 08/15/2018 | | | | 30,000 | | | | 28,969 | |
WEA Finance LLC 144A | | | 4.63 | | | | 05/10/2021 | | | | 55,000 | | | | 53,962 | |
| | | | |
| | | | | | | | | | | | | | | 631,631 | |
| | | | | | | | | | | | | | | | |
| | | | |
Health Care: 0.97% | | | | | | | | | | | | | | | | |
| | | | |
| Biotechnology: 0.42% | | | | | | | | | | | | | | | | |
Amgen Incorporated | | | 3.88 | | | | 11/15/2021 | | | | 90,000 | | | | 90,783 | |
Amgen Incorporated | | | 5.15 | | | | 11/15/2041 | | | | 25,000 | | | | 25,865 | |
Gilead Sciences Incorporated | | | 4.50 | | | | 04/01/2021 | | | | 145,000 | | | | 153,676 | |
Gilead Sciences Incorporated | | | 5.65 | | | | 12/01/2041 | | | | 90,000 | | | | 99,451 | |
| | | | |
| | | | | | | | | | | | | | | 369,775 | |
| | | | | | | | | | | | | | | | |
| | | | |
| Health Care Equipment & Supplies: 0.15% | | | | | | | | | | | | | | | | |
Boston Scientific Corporation | | | 6.40 | | | | 06/15/2016 | | | | 115,000 | | | | 128,959 | |
| | | | | | | | | | | | | | | | |
| | | | |
| Health Care Providers & Services: 0.23% | | | | | | | | | | | | | | | | |
Coventry Health Care Incorporated | | | 5.95 | | | | 03/15/2017 | | | | 175,000 | | | | 196,502 | |
| | | | | | | | | | | | | | | | |
| | | | |
| Life Sciences Tools & Services: 0.17% | | | | | | | | | | | | | | | | |
Life Technologies Corporation | | | 5.00 | | | | 01/15/2021 | | | | 145,000 | | | | 151,666 | |
| | | | | | | | | | | | | | | | |
| | | | |
Industrials: 0.14% | | | | | | | | | | | | | | | | |
| | | | |
| Professional Services: 0.08% | | | | | | | | | | | | | | | | |
Verisk Analytics Incorporated | | | 5.80 | | | | 05/01/2021 | | | | 65,000 | | | | 69,947 | |
| | | | | | | | | | | | | | | | |
| | | | | | |
| Portfolio of Investments—December 31, 2011 | | Wells Fargo Advantage VT Total Return Bond Fund | | | 17 | |
| | | | | | | | | | | | | | | | |
| Security Name | | Interest Rate | | | Maturity Date | | | Principal | | | Value | |
| | | | | | | | | | | | | | | | |
| | | | |
| Road & Rail: 0.06% | | | | | | | | | | | | | | | | |
BSNF Railway Company | | | 5.75 | % | | | 05/01/2040 | | | $ | 46,000 | | | $ | 54,927 | |
| | | | | | | | | | | | | | | | |
| | | | |
Information Technology: 0.23% | | | | | | | | | | | | | | | | |
| | | | |
| Computers & Peripherals: 0.12% | | | | | | | | | | | | | | | | |
Hewlett Packard Company | | | 3.00 | | | | 09/15/2016 | | | | 58,000 | | | | 58,422 | |
Hewlett Packard Company | | | 4.38 | | | | 09/15/2021 | | | | 45,000 | | | | 46,424 | |
| | | | |
| | | | | | | | | | | | | | | 104,846 | |
| | | | | | | | | | | | | | | | |
| | | | |
| Software: 0.11% | | | | | | | | | | | | | | | | |
Adobe Systems Incorporated | | | 4.75 | | | | 02/01/2020 | | | | 91,000 | | | | 98,752 | |
| | | | | | | | | | | | | | | | |
| | | | |
Materials: 0.13% | | | | | | | | | | | | | | | | |
| | | | |
| Chemicals: 0.13% | | | | | | | | | | | | | | | | |
Dow Chemical Company | | | 5.25 | | | | 11/15/2041 | | | | 70,000 | | | | 73,485 | |
Dow Chemical Company | | | 8.55 | | | | 05/15/2019 | | | | 29,000 | | | | 37,931 | |
| | | | |
| | | | | | | | | | | | | | | 111,416 | |
| | | | | | | | | | | | | | | | |
| | | | |
Telecommunication Services: 0.92% | | | | | | | | | | | | | | | | |
| | | | |
| Diversified Telecommunication Services: 0.58% | | | | | | | | | | | | | | | | |
AT&T Incorporated | | | 5.55 | | | | 08/15/2041 | | | | 55,000 | | | | 64,626 | |
AT&T Incorporated | | | 6.40 | | | | 05/15/2038 | | | | 45,000 | | | | 55,491 | |
CenturyLink Incorporated | | | 6.45 | | | | 06/15/2021 | | | | 75,000 | | | | 75,112 | |
Citizens Communications Company | | | 9.00 | | | | 08/15/2031 | | | | 33,000 | | | | 30,113 | |
Frontier Communications Corporation | | | 8.25 | | | | 04/15/2017 | | | | 105,000 | | | | 107,363 | |
Verizon Communications Incorporated | | | 2.00 | | | | 11/01/2016 | | | | 90,000 | | | | 90,276 | |
Verizon Communications Incorporated | | | 3.50 | | | | 11/01/2021 | | | | 80,000 | | | | 83,255 | |
| | | | |
| | | | | | | | | | | | | | | 506,236 | |
| | | | | | | | | | | | | | | | |
| | | | |
| Wireless Telecommunication Services: 0.34% | | | | | | | | | | | | | | | | |
American Tower Corporation | | | 4.50 | | | | 01/15/2018 | | | | 145,000 | | | | 147,464 | |
American Tower Corporation | | | 5.05 | | | | 09/01/2020 | | | | 38,000 | | | | 38,056 | |
Verizon Wireless Capital LLC | | | 8.50 | | | | 11/15/2018 | | | | 80,000 | | | | 107,946 | |
| | | | |
| | | | | | | | | | | | | | | 293,466 | |
| | | | | | | | | | | | | | | | |
| | | | |
Utilities: 1.48% | | | | | | | | | | | | | | | | |
| | | | |
| Electric Utilities: 0.81% | | | | | | | | | | | | | | | | |
Ameren Corporation | | | 8.88 | | | | 05/15/2014 | | | | 105,000 | | | | 117,672 | |
Cleveland Electric Illuminating Company | | | 8.88 | | | | 11/15/2018 | | | | 110,000 | | | | 147,560 | |
Great Plains Energy Incorporated | | | 4.85 | | | | 06/01/2021 | | | | 20,000 | | | | 20,957 | |
LG&E & KU Energy LLC144A | | | 4.38 | | | | 10/01/2021 | | | | 80,000 | | | | 81,567 | |
Oncor Electric Delivery Company LLC 144A | | | 4.55 | | | | 12/01/2041 | | | | 70,000 | | | | 71,416 | |
PPL Electric Utilities | | | 3.00 | | | | 09/15/2021 | | | | 75,000 | | | | 75,767 | |
PPL Energy Supply LLC | | | 4.60 | | | | 12/15/2021 | | | | 80,000 | | | | 81,096 | |
Progress Energy Incorporated | | | 6.85 | | | | 04/15/2012 | | | | 85,000 | | | | 86,441 | |
Public Service Company of Colorado | | | 4.75 | | | | 08/15/2041 | | | | 18,000 | | | | 20,579 | |
| | | | |
| | | | | | | | | | | | | | | 703,055 | |
| | | | | | | | | | | | | | | | |
| | | | |
| 18 | | Wells Fargo Advantage VT Total Return Bond Fund | | Portfolio of Investments—December 31, 2011 |
| | | | | | | | | | | | | | | | |
| Security Name | | Interest Rate | | | Maturity Date | | | Principal | | | Value | |
| | | | | | | | | | | | | | | | |
| | | | |
| Multi-Utilities: 0.67% | | | | | | | | | | | | | | | | |
CMS Energy Corporation | | | 2.75 | % | | | 05/15/2014 | | | $ | 65,000 | | | $ | 64,201 | |
CMS Energy Corporation | | | 5.05 | | | | 02/15/2018 | | | | 105,000 | | | | 104,738 | |
Dominion Resources Incorporated | | | 4.90 | | | | 08/01/2041 | | | | 35,000 | | | | 37,714 | |
Dominion Resources Incorporated | | | 8.88 | | | | 01/15/2019 | | | | 210,000 | | | | 278,602 | |
MidAmerican Energy Holdings | | | 6.13 | | | | 04/01/2036 | | | | 30,000 | | | | 35,767 | |
Puget Sound Power & Light Company | | | 4.43 | | | | 11/15/2041 | | | | 65,000 | | | | 67,268 | |
| | | | |
| | | | | | | | | | | | | | | 588,290 | |
| | | | | | | | | | | | | | | | |
| | | | |
Total Corporate Bonds and Notes (Cost $10,321,457) | | | | | | | | | | | | | | | 10,629,546 | |
| | | | | | | | | | | | | | | | |
| | | | |
Municipal Bonds and Notes: 1.05% | | | | | | | | | | | | | | | | |
| | | | |
| California: 0.36% | | | | | | | | | | | | | | | | |
California Build America Bonds (Tax Revenue) | | | 7.60 | | | | 11/01/2040 | | | | 100,000 | | | | 123,576 | |
Los Angeles CA Community College District Build America Bonds (Tax Revenue) | | | 6.75 | | | | 08/01/2049 | | | | 90,000 | | | | 117,779 | |
Los Angeles CA DW&P Build America Bonds (Utilities Revenue) | | | 6.57 | | | | 07/01/2045 | | | | 55,000 | | | | 73,517 | |
| | | | |
| | | | | | | | | | | | | | | 314,872 | |
| | | | | | | | | | | | | | | | |
| | | | |
| Illinois: 0.19% | | | | | | | | | | | | | | | | |
Illinois (GO–State) | | | 5.37 | | | | 03/01/2017 | | | | 55,000 | | | | 59,002 | |
Illinois (GO–State) | | | 5.67 | | | | 03/01/2018 | | | | 50,000 | | | | 53,552 | |
Illinois (GO–State) | | | 5.88 | | | | 03/01/2019 | | | | 45,000 | | | | 48,416 | |
| | | | |
| | | | | | | | | | | | | | | 160,970 | |
| | | | | | | | | | | | | | | | |
| | | | |
| Nevada: 0.13% | | | | | | | | | | | | | | | | |
Clark County NV Airport Authority (Airport Revenue) | | | 6.82 | | | | 07/01/2045 | | | | 90,000 | | | | 114,389 | |
| | | | | | | | | | | | | | | | |
| | | | |
| New Jersey: 0.18% | | | | | | | | | | | | | | | | |
New Jersey State Turnpike Authority (Transportation Revenue) | | | 7.10 | | | | 01/01/2041 | | | | 115,000 | | | | 158,008 | |
| | | | | | | | | | | | | | | | |
| | | | |
| Ohio: 0.04% | | | | | | | | | | | | | | | | |
Ohio State University Series A (Education Revenue) | | | 4.80 | | | | 06/01/2111 | | | | 35,000 | | | | 36,504 | |
| | | | | | | | | | | | | | | | |
| | | | |
| Texas: 0.15% | | | | | | | | | | | | | | | | |
North Texas Tollway Authority (Transportation Revenue) | | | 6.72 | | | | 01/01/2049 | | | | 103,000 | | | | 127,767 | |
| | | | | | | | | | | | | | | | |
| | | | |
Total Municipal Bonds and Notes (Cost $760,620) | | | | | | | | | | | | | | | 912,510 | |
| | | | | | | | | | | | | | | | |
| | | | |
| Non-Agency Mortgage Backed Securities: 8.20% | | | | | | | | | | | | | | | | |
Americold LLC Trust Series 2010-ART Class A1 144A | | | 3.85 | | | | 01/14/2029 | | | | 179,939 | | | | 186,434 | |
Bank of America Commercial Mortgage Incorporated Series 2002-PB2 Class B | | | 6.31 | | | | 06/11/2035 | | | | 100,000 | | | | 100,358 | |
Bank of America Commercial Mortgage Incorporated Series 2004-6 Class A3 | | | 4.51 | | | | 12/10/2042 | | | | 23,706 | | | | 24,080 | |
Bank of America Commercial Mortgage Incorporated Series 2006-2 Class A4± | | | 5.73 | | | | 05/10/2045 | | | | 222,000 | | | | 248,553 | |
Bank of America Commercial Mortgage Incorporated Series 2006-5 Class A4 | | | 5.41 | | | | 09/10/2047 | | | | 89,000 | | | | 96,190 | |
Bank of America Commercial Mortgage Incorporated Series 2006-6 Class A4 | | | 5.36 | | | | 10/10/2045 | | | | 187,000 | | | | 201,110 | |
Bank of America Commercial Mortgage Incorporated Series 2007-1 Class A2 | | | 5.38 | | | | 01/15/2049 | | | | 35,886 | | | | 35,840 | |
Bear Stearns Commercial Mortgage Securities Incorporated Series 2003-T12 Class A3± | | | 4.24 | | | | 08/13/2039 | | | | 15,209 | | | | 15,310 | |
Bear Stearns Commercial Mortgage Securities Incorporated Series 2004-T14 Class A4± | | | 5.20 | | | | 01/12/2041 | | | | 213,000 | | | | 226,313 | |
Bear Stearns Commercial Mortgage Securities Incorporated Series 2005-PWR7 Class A | | | 4.95 | | | | 02/11/2041 | | | | 29,116 | | | | 29,113 | |
CFCRE Commercial Mortgage Trust Series 2011-C2 Class A2 | | | 3.06 | | | | 12/15/2047 | | | | 100,000 | | | | 102,114 | |
| | | | | | |
| Portfolio of Investments—December 31, 2011 | | Wells Fargo Advantage VT Total Return Bond Fund | | | 19 | |
| | | | | | | | | | | | | | | | |
| Security Name | | Interest Rate | | | Maturity Date | | | Principal | | | Value | |
| | | | | | | | | | | | | | | | |
| | | | |
| Non-Agency Mortgage Backed Securities (continued) | | | | | | | | | | | | | | | | |
CFCRE Commercial Mortgage Trust Series-2011 C2 Class A4 | | | 3.83 | % | | | 12/15/2047 | | | $ | 86,000 | | | $ | 89,177 | |
Citigroup Mortgage Loan Trust Incorporated Series 2007-AHL1 Class A2A± | | | 0.33 | | | | 12/25/2036 | | | | 10,948 | | | | 10,636 | |
Citigroup/Deutsche Bank Commercial Mortgage Series 2005-CD1 Class AM± | | | 5.23 | | | | 07/15/2044 | | | | 97,000 | | | | 101,744 | |
Commercial Mortgage Pass-Through Certificate Series 2001-J2 Class B 144A | | | 6.30 | | | | 07/16/2034 | | | | 151,000 | | | | 151,421 | |
Commercial Mortgage Pass-Through Certificate Series 2004-B4 Class A5 | | | 4.84 | | | | 10/15/2037 | | | | 160,000 | | | | 168,229 | |
Commercial Mortgage Pass-Through Certificate Series 2007-C9 Class A4± | | | 5.81 | | | | 12/10/2049 | | | | 141,000 | | | | 157,417 | |
Commercial Mortgage Pass-Through Certificates Series 2005-LP5 Class A4± | | | 4.98 | | | | 05/10/2043 | | | | 95,000 | | | | 103,606 | |
Credit Suisse First Boston Mortgage Securities Corporation Series 2002-CP3 Class A3 | | | 5.60 | | | | 07/15/2035 | | | | 24,443 | | | | 24,598 | |
Credit Suisse First Boston Mortgage Securities Corporation Series 2003-C4 Class B± | | | 5.25 | | | | 08/15/2036 | | | | 74,000 | | | | 76,704 | |
Credit Suisse First Boston Mortgage Securities Corporation Series 2005-C1 Class A3 | | | 4.81 | | | | 02/15/2038 | | | | 67,879 | | | | 69,987 | |
Credit Suisse First Boston Mortgage Securities Corporation Series 2005-C2 Class A4 | | | 4.83 | | | | 04/15/2037 | | | | 146,000 | | | | 153,721 | |
Credit Suisse First Boston Mortgage Securities Corporation Series 2005-C3 Class A | | | 4.73 | | | | 07/15/2037 | | | | 70,000 | | | | 72,349 | |
Credit Suisse First Boston Mortgage Securities Corporation Series 2006-C4 Class A3 | | | 5.47 | | | | 09/15/2039 | | | | 182,000 | | | | 193,597 | |
Extended Stay America Trust Series 2010-ESHA Class A 144A | | | 2.95 | | | | 11/05/2027 | | | | 376,310 | | | | 377,076 | |
GE Capital Commercial Mortgage Securities Incorporated Series 2004-C2 Class A4 | | | 4.89 | | | | 03/10/2040 | | | | 48,000 | | | | 50,680 | |
GMAC Commercial Mortgage Securities Incorporated Series 2001-C2 Class A2 | | | 6.70 | | | | 04/15/2034 | | | | 2,093 | | | | 2,093 | |
GMAC Commercial Mortgage Securities Incorporated Series 2003-C1 Class A2 | | | 4.08 | | | | 05/10/2036 | | | | 69,000 | | | | 70,494 | |
GMAC Commercial Mortgage Securities Incorporated Series 2006-C1 Class AM± | | | 5.29 | | | | 11/10/2045 | | | | 132,000 | | | | 131,624 | |
Greenwich Capital Commercial Funding Corporation Series 2005-GG5 Class A5± | | | 5.22 | | | | 04/10/2037 | | | | 249,000 | | | | 266,644 | |
Greenwich Capital Commercial Funding Corporation Series 2007-GG9 Class A4 | | | 5.44 | | | | 03/10/2039 | | | | 47,000 | | | | 50,883 | |
GS Mortgage Securities Corporation II Series 2005-GG4 Class A4 | | | 4.76 | | | | 07/10/2039 | | | | 45,000 | | | | 47,166 | |
Impact Funding LLC Series 2010-1 Class A1 144A | | | 5.31 | | | | 01/25/2051 | | | | 275,977 | | | | 293,541 | |
JPMorgan Chase Commercial Mortgage Securities Corporation Series 2001-CIBC2 Class D± | | | 6.85 | | | | 04/15/2035 | | | | 59,000 | | | | 58,863 | |
JPMorgan Chase Commercial Mortgage Securities Corporation Series 2002-C2 Class B± | | | 5.21 | | | | 12/12/2034 | | | | 30,000 | | | | 30,342 | |
JPMorgan Chase Commercial Mortgage Securities Corporation Series 2002-C2 Class A2 | | | 5.05 | | | | 12/12/2034 | | | | 60,793 | | | | 62,118 | |
JPMorgan Chase Commercial Mortgage Securities Corporation Series 2003-C1 Class A1 | | | 4.28 | | | | 01/12/2037 | | | | 28,899 | | | | 29,059 | |
JPMorgan Chase Commercial Mortgage Securities Corporation Series 2003-CB6 Class A1 | | | 4.39 | | | | 07/12/2037 | | | | 14,614 | | | | 14,777 | |
JPMorgan Chase Commercial Mortgage Securities Corporation Series 2003-PM1A Class A4± | | | 5.33 | | | | 08/12/2040 | | | | 159,000 | | | | 166,232 | |
JPMorgan Chase Commercial Mortgage Securities Corporation Series 2004-LN2 Class A2 | | | 5.12 | | | | 07/15/2041 | | | | 186,000 | | | | 196,672 | |
JPMorgan Chase Commercial Mortgage Securities Corporation Series 2006-LDP9 Class A2 | | | 5.13 | | | | 05/15/2047 | | | | 40,201 | | | | 41,471 | |
JPMorgan Chase Commercial Mortgage Securities Corporation Series 2006-LDP9 Class A3 | | | 5.34 | | | | 05/15/2047 | | | | 331,000 | | | | 351,101 | |
JPMorgan Chase Commercial Mortgage Securities Corporation Series 2007-LDPX Class A3 | | | 5.42 | | | | 01/15/2049 | | | | 74,000 | | | | 80,015 | |
JPMorgan Chase Commercial Mortgage Securities Corporation Series 2010-A2 Class A2 144A | | | 4.31 | | | | 08/05/2032 | | | | 189,000 | | | | 197,364 | |
JPMorgan Chase Commercial Mortgage Securities Corporation Series 2010-C1 Class A1 144A | | | 3.85 | | | | 06/15/2043 | | | | 331,323 | | | | 346,547 | |
JPMorgan Chase Commercial Mortgage Securities Corporation Series 2010-CNTR Class A1 144A | | | 3.30 | | | | 08/05/2032 | | | | 90,509 | | | | 91,744 | |
| | | | |
| 20 | | Wells Fargo Advantage VT Total Return Bond Fund | | Portfolio of Investments—December 31, 2011 |
| | | | | | | | | | | | | | | | |
| Security Name | | Interest Rate | | | Maturity Date | | | Principal | | | Value | |
| | | | | | | | | | | | | | | | |
| | | | |
| Non-Agency Mortgage Backed Securities (continued) | | | | | | | | | | | | | | | | |
JPMorgan Chase Commercial Mortgage Securities Corporation Series 2011-C5 Class A3 | | | 4.17 | % | | | 08/15/2046 | | | $ | 58,000 | | | $ | 62,086 | |
Lehman Brothers UBS Commercial Mortgage Trust Series 2002-C2 Class A4 | | | 5.59 | | | | 06/15/2031 | | | | 22,780 | | | | 22,971 | |
Lehman Brothers UBS Commercial Mortgage Trust Series 2002-C4 Class A4 | | | 4.56 | | | | 09/15/2026 | | | | 14,269 | | | | 14,357 | |
Lehman Brothers UBS Commercial Mortgage Trust Series 2004-C7 Class A5 | | | 4.63 | | | | 10/15/2029 | | | | 51,000 | | | | 52,554 | |
Lehman Brothers UBS Commercial Mortgage Trust Series 2005-C2 Class A4 | | | 5.00 | | | | 04/15/2030 | | | | 146,000 | | | | 153,616 | |
Lehman Brothers UBS Commercial Mortgage Trust Series 2007-C1 Class A4 | | | 5.42 | | | | 02/15/2040 | | | | 71,000 | | | | 77,379 | |
Lehman Brothers UBS Commercial Mortgage Trust Series 2007-C1 Class AAB | | | 5.40 | | | | 02/15/2040 | | | | 39,000 | | | | 41,110 | |
Lehman Brothers UBS Commercial Mortgage Trust Series 2007-C3 Class A3± | | | 5.93 | | | | 07/15/2044 | | | | 53,000 | | | | 56,572 | |
Lehman Brothers UBS Commercial Mortgage Trust Series 2007-C6 Class A3 | | | 5.93 | | | | 07/15/2040 | | | | 184,000 | | | | 194,787 | |
Merrill Lynch Mortgage Trust Series 2005-CIP1 Class A3A± | | | 4.95 | | | | 07/12/2038 | | | | 76,000 | | | | 79,345 | |
Morgan Stanley Capital I Series 2004-TP13 Class A3 | | | 4.39 | | | | 09/13/2045 | | | | 27,313 | | | | 27,825 | |
Morgan Stanley Capital I Series 2006-HQ8 Class AM± | | | 5.47 | | | | 03/12/2044 | | | | 49,000 | | | | 50,141 | |
Morgan Stanley Capital I Series 2007-HE2 Class A2A± | | | 0.33 | | | | 01/25/2037 | | | | 4,966 | | | | 4,874 | |
Morgan Stanley Capital I Series 2007-HQ13 Class A1 | | | 5.36 | | | | 12/15/2044 | | | | 43,921 | | | | 44,117 | |
Morgan Stanley Capital I Series 2011-C3 Class A2 | | | 3.22 | | | | 07/15/2049 | | | | 100,000 | | | | 103,552 | |
Morgan Stanley Dean Witter Capital I Series 2001-TOP3 Class A4 | | | 6.39 | | | | 07/15/2033 | | | | 6,881 | | | | 6,876 | |
Morgan Stanley Mortgage Loan Trust Series 2007-6XS Class 2A1S± | | | 0.40 | | | | 02/25/2047 | | | | 14,400 | | | | 11,493 | |
Nomura Asset Securities Corporation Series 1998-D6 Class A2± | | | 7.07 | | | | 03/15/2030 | | | | 128,000 | | | | 134,063 | |
Sequoia Mortgage Trust Series 2010-H1 Class A1± | | | 3.75 | | | | 02/25/2040 | | | | 28,345 | | | | 28,798 | |
Sequoia Mortgage Trust Series 2011-1 Class A1± | | | 4.13 | | | | 02/25/2041 | | | | 38,120 | | | | 37,917 | |
US Bank NA Series 2007-1 Class A | | | 5.92 | | | | 05/25/2012 | | | | 232,870 | | | | 237,775 | |
Wachovia Bank Commercial Mortgage Trust Series 2003-C7 Class A1 144A | | | 4.24 | | | | 10/15/2035 | | | | 13,990 | | | | 14,078 | |
Wachovia Bank Commercial Mortgage Trust Series 2003-C8 Class A3 | | | 4.45 | | | | 11/15/2035 | | | | 97,161 | | | | 97,493 | |
| | | | |
Total Non-Agency Mortgage Backed Securities (Cost $7,028,777) | | | | | | | | | | | | | | | 7,148,886 | |
| | | | | | | | | | | | | | | | |
| | | | |
| U.S. Treasury Securities: 24.04% | | | | | | | | | | | | | | | | |
U.S. Treasury Bond | | | 3.13 | | | | 11/15/2041 | | | | 845,000 | | | | 883,025 | |
U.S. Treasury Bond## | | | 3.75 | | | | 08/15/2041 | | | | 381,000 | | | | 447,020 | |
U.S. Treasury Bond## | | | 4.38 | | | | 05/15/2041 | | | | 601,000 | | | | 781,300 | |
U.S. Treasury Bond## | | | 4.50 | | | | 02/15/2036 | | | | 655,000 | | | | 856,413 | |
U.S. Treasury Bond## | | | 4.75 | | | | 02/15/2041 | | | | 499,000 | | | | 686,359 | |
U.S. Treasury Note | | | 0.88 | | | | 11/30/2016 | | | | 216,000 | | | | 216,692 | |
U.S. Treasury Note | | | 0.13 | | | | 12/31/2013 | | | | 1,647,000 | | | | 1,643,139 | |
U.S. Treasury Note | | | 0.25 | | | | 10/31/2013 | | | | 501,000 | | | | 501,137 | |
U.S. Treasury Note | | | 0.25 | | | | 11/30/2013 | | | | 219,000 | | | | 219,051 | |
U.S. Treasury Note | | | 0.25 | | | | 12/15/2014 | | | | 327,000 | | | | 325,978 | |
U.S. Treasury Note | | | 0.75 | | | | 12/31/2016 | | | | 4,515,000 | | | | 4,524,170 | |
U.S. Treasury Note## | | | 1.00 | | | | 08/31/2016 | | | | 2,838,000 | | | | 2,869,485 | |
U.S. Treasury Note | | | 1.00 | | | | 10/31/2016 | | | | 2,894,000 | | | | 2,922,940 | |
U.S. Treasury Note | | | 1.38 | | | | 11/30/2018 | | | | 83,000 | | | | 83,285 | |
U.S. Treasury Note | | | 1.50 | | | | 06/30/2016 | | | | 592,000 | | | | 612,350 | |
U.S. Treasury Note | | | 2.00 | | | | 11/15/2021 | | | | 1,374,000 | | | | 1,389,029 | |
U.S. Treasury Note | | | 2.13 | | | | 08/15/2021 | | | | 1,232,000 | | | | 1,262,992 | |
U.S. Treasury Note | | | 3.25 | | | | 03/31/2017 | | | | 400,000 | | | | 448,000 | |
U.S. Treasury Note | | | 3.50 | | | | 05/15/2020 | | | | 242,000 | | | | 278,300 | |
| | | | |
Total U.S. Treasury Securities (Cost $20,497,956) | | | | | | | | | | | | | | | 20,950,665 | |
| | | | | | | | | | | | | | | | |
| | | | |
Yankee Corporate Bonds and Notes: 5.49% | | | | | | | | | | | | | | | | |
| | | | |
Consumer Discretionary : 0.10% | | | | | | | | | | | | | | | | |
| | | | |
| Media: 0.10% | | | | | | | | | | | | | | | | |
Thomson Reuters Corporation | | | 5.95 | | | | 07/15/2013 | | | | 80,000 | | | | 85,249 | |
| | | | | | | | | | | | | | | | |
| | | | | | |
| Portfolio of Investments—December 31, 2011 | | Wells Fargo Advantage VT Total Return Bond Fund | | | 21 | |
| | | | | | | | | | | | | | | | |
| Security Name | | Interest Rate | | | Maturity Date | | | Principal | | | Value | |
| | | | | | | | | | | | | | | | |
| | | | |
Consumer Staples: 0.41% | | | | | | | | | | | | | | | | |
| | | | |
| Beverages: 0.41% | | | | | | | | | | | | | | | | |
Pernod-Ricard SA 144A | | | 4.45 | % | | | 01/15/2022 | | | $ | 170,000 | | | $ | 178,018 | |
Pernod-Ricard SA 144A | | | 5.75 | | | | 04/07/2021 | | | | 160,000 | | | | 180,446 | |
| | | | |
| | | | | | | | | | | | | | | 358,464 | |
| | | | | | | | | | | | | | | | |
| | | | |
Energy: 1.32% | | | | | | | | | | | | | | | | |
| | | | |
| Oil, Gas & Consumable Fuels: 1.32% | | | | | | | | | | | | | | | | |
BG Energy Capital plc 144A | | | 4.00 | | | | 10/15/2021 | | | | 220,000 | | | | 226,677 | |
BP Capital Markets plc | | | 2.25 | | | | 11/01/2016 | | | | 185,000 | | | | 186,222 | |
Husky Energy Incorporated | | | 7.25 | | | | 12/15/2019 | | | | 82,000 | | | | 100,313 | |
International Petroleum Investment Company GMTN Limited 144A | | | 5.50 | | | | 03/01/2022 | | | | 200,000 | | | | 200,000 | |
Petroleos Mexicanos 144A | | | 6.50 | | | | 06/02/2041 | | | | 20,000 | | | | 22,500 | |
Talisman Energy Incorporated | | | 7.75 | | | | 06/01/2019 | | | | 90,000 | | | | 110,943 | |
Transocean Incorporated | | | 5.05 | | | | 12/15/2016 | | | | 235,000 | | | | 240,005 | |
Transocean Incorporated | | | 6.38 | | | | 12/15/2021 | | | | 60,000 | | | | 63,749 | |
| | | | |
| | | | | | | | | | | | | | | 1,150,409 | |
| | | | | | | | | | | | | | | | |
| | | | |
Financials: 2.80% | | | | | | | | | | | | | | | | |
| | | | |
| Commercial Banks: 2.13% | | | | | | | | | | | | | | | | |
Bank of Montreal 144A | | | 1.30 | | | | 10/31/2014 | | | | 250,000 | | | | 249,606 | |
Bank of Nova Scotia 144A | | | 2.15 | | | | 08/03/2016 | | | | 200,000 | | | | 201,454 | |
Canadian Imperial Bank 144A | | | 1.50 | | | | 12/12/2014 | | | | 245,000 | | | | 245,372 | |
HSBC Holdings plc | | | 5.10 | | | | 04/05/2021 | | | | 75,000 | | | | 79,665 | |
HSBC Holdings plc | | | 6.80 | | | | 06/01/2038 | | | | 100,000 | | | | 103,407 | |
Korea Development Bank | | | 3.25 | | | | 03/09/2016 | | | | 199,000 | | | | 196,062 | |
Korea Development Bank | | | 3.88 | | | | 05/04/2017 | | | | 200,000 | | | | 197,544 | |
Lloyds TSB Bank plc | | | 4.88 | | | | 01/21/2016 | | | | 90,000 | | | | 87,728 | |
Rabobank Nederland NV | | | 5.25 | | | | 05/24/2041 | | | | 72,000 | | | | 70,445 | |
Standard Chartered plc 144A | | | 3.20 | | | | 05/12/2016 | | | | 190,000 | | | | 185,958 | |
Swedish Export Credit Corporation | | | 3.25 | | | | 09/16/2014 | | | | 233,000 | | | | 240,757 | |
| | | | |
| | | | | | | | | | | | | | | 1,857,998 | |
| | | | | | | | | | | | | | | | |
| | | | |
| Diversified Financial Services: 0.39% | | | | | | | | | | | | | | | | |
Caisse Centrale Desjardins du Quebec 144A | | | 2.55 | | | | 03/24/2016 | | | | 250,000 | | | | 256,771 | |
Credit Suisse New York | | | 6.00 | | | | 02/15/2018 | | | | 80,000 | | | | 78,879 | |
| | | | |
| | | | | | | | | | | | | | | 335,650 | |
| | | | | | | | | | | | | | | | |
| | | | |
| Thrifts & Mortgage Finance: 0.28% | | | | | | | | | | | | | | | | |
Achmea Hypotheekbank NV 144A | | | 3.20 | | | | 11/03/2014 | | | | 235,000 | | | | 246,653 | |
| | | | | | | | | | | | | | | | |
| | | | |
Materials: 0.24% | | | | | | | | | | | | | | | | |
| | | | |
| Metals & Mining: 0.24% | | | | | | | | | | | | | | | | |
Teck Resources Limited | | | 6.25 | | | | 07/15/2041 | | | | 52,000 | | | | 59,958 | |
Xstrata Canada Financial Corporation 144A | | | 4.95 | | | | 11/15/2021 | | | | 100,000 | | | | 102,123 | |
Xstrata Canada Financial Corporation 144A | | | 6.00 | | | | 11/15/2041 | | | | 50,000 | | | | 51,212 | |
| | | | |
| | | | | | | | | | | | | | | 213,293 | |
| | | | | | | | | | | | | | | | |
| | | | |
| 22 | | Wells Fargo Advantage VT Total Return Bond Fund | | Portfolio of Investments—December 31, 2011 |
| | | | | | | | | | | | | | | | |
| Security Name | | Interest Rate | | | Maturity Date | | | Principal | | | Value | |
| | | | | | | | | | | | | | | | |
| | | | |
Telecommunication Services: 0.46% | | | | | | | | | | | | | | | | |
| | | | |
| Diversified Telecommunication Services: 0.35% | | | | | | | | | | | | | | | | |
Hutchison Whampoa International Limited 144A | | | 5.75 | % | | | 09/11/2019 | | | $ | 100,000 | | | $ | 111,981 | |
Telemar Norte Leste SAU 144A | | | 5.50 | | | | 10/23/2020 | | | | 190,000 | | | | 187,150 | |
| | | | |
| | | | | | | | | | | | | | | 299,131 | |
| | | | | | | | | | | | | | | | |
| | | | |
| Wireless Telecommunication Services: 0.11% | | | | | | | | | | | | | | | | |
Telefonica Moviles Chile SA 144A | | | 2.88 | | | | 11/09/2015 | | | | 100,000 | | | | 98,712 | |
| | | | | | | | | | | | | | | | |
| | | | |
Utilities: 0.16% | | | | | | | | | | | | | | | | |
| | | | |
| Electric Utilities: 0.13% | | | | | | | | | | | | | | | | |
PPL WEM Holdings plc 144A | | | 3.90 | | | | 05/01/2016 | | | | 115,000 | | | | 115,300 | |
| | | | | | | | | | | | | | | | |
| | | | |
| Multi-Utilities: 0.03% | | | | | | | | | | | | | | | | |
National Grid plc | | | 6.30 | | | | 08/01/2016 | | | | 20,000 | | | | 22,955 | |
| | | | | | | | | | | | | | | | |
| | | | |
Total Yankee Corporate Bonds and Notes (Cost $4,712,877) | | | | | | | | | | | | | | | 4,783,814 | |
| | | | | | | | | | | | | | | | |
| | | | |
Yankee Government Bonds: 0.57% | | | | | | | | | | | | | | | | |
Province of Quebec | | | 2.75 | | | | 08/25/2021 | | | | 135,000 | | | | 134,793 | |
Republic of Chile | | | 3.25 | | | | 09/14/2021 | | | | 115,000 | | | | 118,163 | |
Republic of Poland | | | 5.00 | | | | 03/23/2022 | | | | 160,000 | | | | 160,800 | |
United Mexican States | | | 5.75 | | | | 10/12/2049 | | | | 80,000 | | | | 85,200 | |
| | | | |
Total Yankee Government Bonds (Cost $485,579) | | | | | | | | | | | | | | | 498,956 | |
| | | | | | | | | | | | | | | | |
| | | | |
Other: 0.38% | | | | | | | | | | | | | | | | |
Gryphon Funding Limited, Pass-Through Entity(a)(i)(v) | | | | | | | | | | | 232,466 | | | | 65,090 | |
VFNC Corporation, Pass-Through Entity, 0.30%±144A(a)(i)(v) | | | | | | | | | | | 624,536 | | | | 268,551 | |
| | | | |
Total Other (Cost $150,056) | | | | | | | | | | | | | | | 333,641 | |
| | | | | | | | | | | | | | | | |
| | | | |
| | | Yield | | | | | | Shares | | | | |
| | | | |
Short-Term Investments: 10.20% | | | | | | | | | | | | | | | | |
| | | | |
| Investment Companies: 10.20% | | | | | | | | | | | | | | | | |
Wells Fargo Advantage Cash Investment Money Market Fund, Institutional Class##(l)(u) | | | 0.04 | | | | | | | | 8,807,666 | | | | 8,807,666 | |
Wells Fargo Securities Lending Cash Investments, LLC(v)(l)(u)(r) | | | 0.12 | | | | | | | | 78,744 | | | | 78,744 | |
| | | | |
Total Short-Term Investments (Cost $8,886,410) | | | | | | | | | | | | | | | 8,886,410 | |
| | | | | | | | | | | | | | | | |
| | | | | | | | |
| Total Investments in Securities | | | | | | | | |
| (Cost $102,301,703)* | | | 119.75 | % | | | 104,351,736 | |
Other Assets and Liabilities, Net | | | (19.75 | ) | | | (17,213,958 | ) |
| | | | | | | | |
| Total Net Assets | | | 100.00 | % | | $ | 87,137,778 | |
| | | | | | | | |
| | | | | | | | | | | | | | | | |
| | | Interest Rate | | | | | | Principal | | | | |
| | | | | | | | | | | | | | | | |
| | | | |
TBA Sale Commitments: (2.80%) | | | | | | | | | | | | | | | | |
FNMA%% | | | 3.50 | | | | 03/25/2041 | | | $ | (400,000 | ) | | | (411,375 | ) |
FNMA%% | | | 4.00 | | | | 02/25/2040 | | | | (600,000 | ) | | | (630,282 | ) |
FNMA%% | | | 4.00 | | | | 03/25/2040 | | | | (100,000 | ) | | | (104,781 | ) |
FNMA%% | | | 5.00 | | | | 10/25/2036 | | | | (1,200,000 | ) | | | (1,293,750 | ) |
| | | | |
Total TBA Sale Commitments (Proceeds Received $(2,416,137)) | | | | | | | | | | | | | | | (2,440,188 | ) |
| | | | | | | | | | | | | | | | |
| | | | | | |
| Portfolio of Investments—December 31, 2011 | | Wells Fargo Advantage VT Total Return Bond Fund | | | 23 | |
| ± | Variable rate investment. |
| %% | Security issued on a when-issued (TBA) basis. |
| (z) | Zero coupon security. Rate represents yield to maturity. |
| 144A | Security that may be resold to “qualified institutional buyers” under Rule 144A or security offered pursuant to Section 4(2) of the Securities Act of 1933, as amended. |
| (a) | Security is fair valued by the Management Valuation Team, and in certain instances by the Board of Trustees, in accordance with procedures approved by the Board of Trustees. |
| « | All or a portion of this security is on loan. |
| ## | All or a portion of this security has been segregated for when-issued securities or unfunded loans. |
| (i) | Illiquid security for which the designation as illiquid is unaudited. |
| (v) | Security represents investment of cash collateral received from securities on loan. |
| (l) | Investment in an affiliate. |
| (u) | Rate shown is the 7-day annualized yield at period end. |
| (r) | The investment company is exempt from registration under Section 3(c)(7) of the 1940 Act. |
| * | Cost for federal income tax purposes is $102,584,674 and net unrealized appreciation (depreciation) consist of: |
| | | | |
Gross unrealized appreciation | | $ | 2,206,786 | |
Gross unrealized depreciation | | | (439,724 | ) |
| | | | |
Net unrealized appreciation | | $ | 1,767,062 | |
The accompanying notes are an integral part of these financial statements.
| | | | |
| 24 | | Wells Fargo Advantage VT Total Return Bond Fund | | Statement of Assets and Liabilities—December 31, 2011 |
| | | | |
| | | | |
| |
Assets | | | | |
Investments | | | | |
In unaffiliated securities (including securities on loan), at value | | $ | 95,465,326 | |
In affiliated securities, at value | | | 8,886,410 | |
| | | | |
Total investments, at value (see cost below) | | | 104,351,736 | |
Receivable for investments sold | | | 32,575,509 | |
Principal paydown receivable | | | 11,640 | |
Receivable for Fund shares sold | | | 80,276 | |
Receivable for interest | | | 460,214 | |
Receivable for securities lending income | | | 38 | |
| | | | |
Total assets | | | 137,479,413 | |
| | | | |
| |
Liabilities | | | | |
Dividends payable | | | 9,946 | |
Payable for investments purchased | | | 47,463,018 | |
Payable for Fund shares redeemed | | | 79,021 | |
Payable upon receipt of securities loaned | | | 228,800 | |
Payable for interest on TBA sale commitments | | | 3,294 | |
TBA sale commitments, at value (see proceeds received below) | | | 2,440,188 | |
Advisory fee payable | | | 10,988 | |
Distribution fees payable | | | 19,369 | |
Due to other related parties | | | 10,070 | |
Accrued expenses and other liabilities | | | 76,941 | |
| | | | |
Total liabilities | | | 50,341,635 | |
| | | | |
Total net assets | | $ | 87,137,778 | |
| | | | |
| |
NET ASSETS CONSIST OF | | | | |
Paid-in capital | | $ | 89,056,486 | |
Undistributed net investment income | | | 67,778 | |
Accumulated net realized losses on investments | | | (4,012,468 | ) |
Net unrealized gains on investments | | | 2,025,982 | |
| | | | |
Total net assets | | $ | 87,137,778 | |
| | | | |
| |
COMPUTATION OF NET ASSET VALUE PER SHARE1 | | | | |
Net assets – Class 2 | | $ | 87,137,778 | |
Shares outstanding – Class 2 | | | 8,270,617 | |
Net asset value per share – Class 2 | | | $10.54 | |
Total investments, at cost | | $ | 102,301,703 | |
| | | | |
Securities on loan, at value | | $ | 223,841 | |
| | | | |
Proceeds received from TBA sale commitments | | $ | 2,416,137 | |
| | | | |
| 1. | The Fund has an unlimited number of authorized shares. |
The accompanying notes are an integral part of these financial statements.
| | | | | | |
| Statement of Operations—Year Ended December 31, 2011 | | Wells Fargo Advantage VT Total Return Bond Fund | | | 25 | |
| | | | |
| | | | |
| |
Investment income | | | | |
Interest | | $ | 2,489,255 | |
Income from affiliated securities | | | 5,213 | |
| | | | |
Total investment income | | | 2,494,468 | |
| | | | |
| |
Expenses | | | | |
Advisory fee | | | 336,025 | |
Administration fees | | | | |
Fund level | | | 42,003 | |
Class 2 | | | 67,205 | |
Distribution fees | | | | |
Class 2 | | | 210,015 | |
Custody and accounting fees | | | 16,723 | |
Professional fees | | | 46,670 | |
Shareholder report expenses | | | 21,255 | |
Trustees’ fees and expenses | | | 15,389 | |
Other fees and expenses | | | 6,248 | |
| | | | |
Total expenses | | | 761,533 | |
Less: Fee waivers and/or expense reimbursements | | | (20,344 | ) |
| | | | |
Net expenses | | | 741,189 | |
| | | | |
Net investment income | | | 1,753,279 | |
| | | | |
| |
REALIZED AND UNREALIZED GAINS (LOSSES) ON INVESTMENTS | | | | |
| |
Net realized gains (losses) on: | | | | |
Unaffiliated securities | | | 4,069,906 | |
TBA sale commitments | | | (304,335 | ) |
| | | | |
Net realized gains on investments | | | 3,765,571 | |
| | | | |
| |
Net change in unrealized gains (losses) on: | | | | |
Unaffiliated securities | | | 1,122,564 | |
TBA sale commitments | | | (14,637 | ) |
| | | | |
Net change in unrealized gains (losses) on investments | | | 1,107,927 | |
| | | | |
Net realized and unrealized gains (losses) on investments | | | 4,873,498 | |
| | | | |
Net increase in net assets resulting from operations | | $ | 6,626,777 | |
| | | | |
The accompanying notes are an integral part of these financial statements.
| | | | |
| 26 | | Wells Fargo Advantage VT Total Return Bond Fund | | Statements of Changes in Net Assets |
| | | | | | | | | | | | | | | | |
| | | Year Ended
December 31, 2011 | | | Year Ended
December 31, 2010 | |
| | | | |
Operations | | | | | | | | | | | | | | | | |
Net investment income | | | | | | $ | 1,753,279 | | | | | | | $ | 2,351,700 | |
Net realized gains on investments | | | | | | | 3,765,571 | | | | | | | | 5,025,162 | |
Net change in unrealized gains (losses) on investments | | | | | | | 1,107,927 | | | | | | | | (1,720,127 | ) |
| | | | | | | | | | | | | | | | |
Net increase in net assets resulting from operations | | | | | | | 6,626,777 | | | | | | | | 5,656,735 | |
| | | | | | | | | | | | | | | | |
| | | | |
Distributions to shareholders from | | | | | | | | | | | | | | | | |
Net investment income – Class 2 | | | | | | | (2,244,747 | ) | | | | | | | (2,911,613 | )1 |
Net realized gains – Class 2 | | | | | | | (3,319,231 | ) | | | | | | | (1,599,718 | )1 |
| | | | | | | | | | | | | | | | |
Total distributions to shareholders | | | | | | | (5,563,978 | ) | | | | | | | (4,511,331 | ) |
| | | | | | | | | | | | | | | | |
| | | | |
| | | Shares | | | | | | | | Shares | | | | | |
| | | | |
Capital share transactions | | | | | | | | | | | | | | | | |
Proceeds from shares sold – Class 2 | | | 1,837,013 | | | | 19,239,066 | | | | 1,128,306 | 1 | | | 11,845,200 | 1 |
Reinvestment of distributions – Class 2 | | | 538,528 | | | | 5,563,978 | | | | 430,547 | 1 | | | 4,523,836 | 1 |
Payment for shares redeemed – Class 2 | | | (2,306,909 | ) | | | (24,143,648 | ) | | | (5,530,492 | )1 | | | (58,415,579 | )1 |
Net asset value of shares issued in acquisition – Class 2 | | | 0 | | | | 0 | | | | 2,976,311 | | | | 31,182,320 | |
| | | | | | | | | | | | | | | | |
Net increase (decrease) in net assets resulting
from capital share transactions | | | | | | | 659,396 | | | | | | | | (10,864,223 | ) |
| | | | | | | | | | | | | | | | |
Total increase (decrease) in net assets | | | | | | | 1,722,195 | | | | | | | | (9,718,819 | ) |
| | | | | | | | | | | | | | | | |
| | | | |
Net assets | | | | | | | | | | | | | | | | |
Beginning of period | | | | | | | 85,415,583 | | | | | | | | 95,134,402 | |
| | | | | | | | | | | | | | | | |
End of period | | | | | | $ | 87,137,778 | | | | | | | $ | 85,415,583 | |
| | | | | | | | | | | | | | | | |
Undistributed net investment income | | | | | | $ | 67,778 | | | | | | | $ | 41,738 | |
| | | | | | | | | | | | | | | | |
| 1. | After the close of business on July 16, 2010, existing shares of the Fund were renamed Class 2 shares. |
The accompanying notes are an integral part of these financial statements.
| | | | | | |
| Financial Highlights | | Wells Fargo Advantage VT Total Return Bond Fund | | | 27 | |
(For a share outstanding throughout each period)
| | | | | | | | | | | | | | | | | | | | |
| | | Year Ended December 31, | |
| Class 21 | | 2011 | | | 2010 | | | 2009 | | | 2008 | | | 2007 | |
Net asset value, beginning of period | | $ | 10.41 | | | $ | 10.34 | | | $ | 9.70 | | | $ | 9.94 | | | $ | 9.81 | |
Net investment income | | | 0.22 | | | | 0.29 | | | | 0.42 | | | | 0.44 | | | | 0.45 | |
Net realized and unrealized gains (losses) on investments | | | 0.62 | | | | 0.43 | | | | 0.72 | | | | (0.21 | ) | | | 0.13 | |
| | | | | | | | | | | | | | | | | | | | |
Total from investment operations | | | 0.84 | | | | 0.72 | | | | 1.14 | | | | 0.23 | | | | 0.58 | |
Distributions to shareholders from | | | | | | | | | | | | | | | | | | | | |
Net investment income | | | (0.28 | ) | | | (0.36 | ) | | | (0.46 | ) | | | (0.47 | ) | | | (0.45 | ) |
Net realized gains | | | (0.43 | ) | | | (0.29 | ) | | | (0.04 | ) | | | 0.00 | | | | 0.00 | |
| | | | | | | | | | | | | | | | | | | | |
Total distributions to shareholders | | | (0.71 | ) | | | (0.65 | ) | | | (0.50 | ) | | | (0.47 | ) | | | (0.45 | ) |
Net asset value, end of period | | | $10.54 | | | | $10.41 | | | | $10.34 | | | | $9.70 | | | | $9.94 | |
Total return | | | 8.31 | % | | | 7.04 | % | | | 11.99 | % | | | 2.39 | % | | | 6.08 | % |
Ratios to average net assets (annualized) | | | | | | | | | | | | | | | | | | | | |
Gross expenses | | | 0.91 | % | | | 0.91 | % | | | 1.20 | % | | | 1.19 | % | | | 0.94 | % |
Net expenses | | | 0.88 | % | | | 0.86 | % | | | 0.85 | % | | | 0.90 | % | | | 0.90 | % |
Net investment income | | | 2.09 | % | | | 2.76 | % | | | 4.07 | % | | | 4.55 | % | | | 4.58 | % |
Supplemental data | | | | | | | | | | | | | | | | | | | | |
Portfolio turnover rate | | | 843 | % | | | 838 | % | | | 580 | % | | | 692 | % | | | 580 | % |
Net assets, end of period (000’s omitted) | | | $87,138 | | | | $85,416 | | | | $95,134 | | | | $93,610 | | | | $129,098 | |
| 1. | After the close of business of July 16, 2010, existing shares of the Fund were renamed Class 2 shares. |
The accompanying notes are an integral part of these financial statements.
| | | | |
| 28 | | Wells Fargo Advantage VT Total Return Bond Fund | | Notes to Financial Statements |
1. ORGANIZATION
Wells Fargo Variable Trust (the “Trust”), a Delaware statutory trust organized on March 10, 1999, is an open-end management investment company registered under the Investment Company Act of 1940, as amended (the “1940 Act”). These financial statements report on Wells Fargo Advantage VT Total Return Bond Fund (the “Fund”) which is a diversified series of the Trust.
2. SIGNIFICANT ACCOUNTING POLICIES
The following significant accounting policies, which are consistently followed in the preparation of the financial statements of the Fund, are in conformity with U.S. generally accepted accounting principles which require management to make estimates and assumptions that affect the reported amounts of assets and liabilities, disclosure of contingent assets and liabilities at the date of the financial statements, and the reported amounts of revenues and expenses during the reporting period. Actual results could differ from those estimates.
Securities valuation
Fixed income securities with maturities exceeding 60 days are valued based on available evaluated prices received from an independent pricing service approved by the Board of Trustees which may utilize both transaction data and market information such as yield, prices of securities of comparable quality, coupon rate, maturity, type of issue, trading characteristics and other market data. If valuations are not available from the pricing service or values received are deemed not representative of market value, values will be obtained from a third party broker-dealer or determined based on the Fund’s Fair Value Procedures.
Debt securities of sufficient credit quality with original maturities of 60 days or less generally are valued at amortized cost which approximates fair value. The amortized cost method involves valuing a security at its cost, plus accretion of discount or minus amortization of premium over the period until maturity.
Investments in open-end mutual funds and non-registered investment companies are generally valued at net asset value.
Investments which are not valued using any of the methods discussed above, are valued at their fair value, as determined by procedures established in good faith and approved by the Board of Trustees.
Security loans
The Fund may lend its securities from time to time in order to earn additional income in the form of fees or interest on securities received as collateral or the investment of any cash received as collateral. The Fund continues to receive interest or dividends on the securities loaned. The Fund receives collateral in the form of cash or securities with a value at least equal to the value of the securities on loan. The value of the loaned securities is determined at the close of each business day and any additional required collateral is delivered to the Fund on the next business day. In a securities lending transaction, the net asset value of the Fund will be affected by an increase or decrease in the value of the securities loaned and by an increase or decrease in the value of the instrument in which collateral is invested. The amount of securities lending activity undertaken by the Fund fluctuates from time to time. In the event of default or bankruptcy by the borrower, the Fund may be prevented from recovering the loaned securities or gaining access to the collateral or may experience delays or costs in doing so. In addition, the investment of any cash collateral received may lose all or part of its value. The Fund has the right under the lending agreement to recover the securities from the borrower on demand.
The Fund lends its securities through an unaffiliated securities lending agent. Cash collateral received in connection with its securities lending transactions is invested in Wells Fargo Securities Lending Cash Investments, LLC (the “Cash Collateral Fund”). The Cash Collateral Fund is exempt from registration under Section 3(c)(7) of the 1940 Act and is managed by Wells Fargo Funds Management LLC (“Funds Management”) and is sub-advised by Wells Capital Management Incorporated (“Wells Capital Management”). Funds Management receives an advisory fee starting at 0.05% and declining to 0.01% as the average daily net assets of the Cash Collateral Fund increase. All of the fees received by Funds Management are paid to Wells Capital Management for its services as sub-adviser. The Cash Collateral Fund seeks to provide a positive return compared to the daily Fed Funds Open rate by investing in high-quality, U.S. dollar-denominated short-term money market instruments. Cash Collateral Fund investments are fair valued based upon the amortized cost valuation technique. Income earned from investment in the Cash Collateral Fund is included in securities lending income on the Statement of Operations.
| | | | | | |
| Notes to Financial Statements | | Wells Fargo Advantage VT Total Return Bond Fund | | | 29 | |
For Wells Fargo Advantage Funds that participated in securities lending activity prior to February 13, 2009, certain structured investment vehicles purchased in a joint account by the former securities lending agent defaulted or were impaired. Certain of the Wells Fargo Advantage Funds still hold ownership interest in these structured investment vehicles, which have since been restructured as pass-through securities. If the Fund holds an ownership interest in such pass-through securities, information regarding this ownership interest can be found in the Portfolio of Investments under the category “Other”.
When-issued transactions
The Fund may purchase securities on a forward commitment or ‘when-issued’ basis. The Fund records a when-issued transaction on the trade date and will segregate assets to cover its obligation by confirming the availability of qualifying assets having a value sufficient to make payment for the securities purchased. Securities purchased on a when-issued basis are marked-to-market daily and the Fund begins earning interest on the settlement date. Losses may arise due to changes in the market value of the underlying securities or if the counterparty does not perform under the contract.
TBA sale commitments
The Fund may enter into To Be Announced (“TBA”) sale commitments to hedge its portfolio positions or to sell mortgage-backed securities it owns under delayed delivery arrangements. Proceeds of TBA sale commitments are not received until the contractual settlement date. During the time a TBA sale commitment is outstanding, equivalent deliverable securities or an offsetting TBA purchase commitment deliverable on or before the sale commitment date, are held as “cover” for the transaction. Unsettled TBA sale commitments are valued at the current market value of the underlying securities, according to the procedures described under “Securities valuation”. The contract is marked-to-market daily and the change in market value is recorded by the Fund as an unrealized gain or loss. If the TBA sale commitment is closed through the acquisition of an offsetting purchase commitment, the Fund realizes a gain or loss. If the Fund delivers securities under the commitment, the Fund realizes a gain or a loss from the sale of the securities based upon the unit price established at the date the commitment was entered into.
Mortgage dollar roll transactions
The Fund may engage in mortgage dollar roll transactions with respect to mortgage-backed securities issued by Government National Mortgage Association (GNMA), Federal National Mortgage Association (FNMA) and Federal Home Loan Mortgage Corporation (FHLMC). In a mortgage dollar roll transaction, the Fund sells a mortgage-backed security to a financial institution, such as a bank or broker-dealer and simultaneously agrees to repurchase a substantially similar security from the institution at a later date at an agreed upon price. The mortgage-backed securities that are repurchased will bear the same interest rate as those sold, but generally will be collateralized by different pools of mortgages with different pre-payment histories. During the roll period, the Fund foregoes principal and interest paid on the securities. The Fund is compensated by the difference between the current sales price and the forward price for the future purchase as well as by the earnings on the cash proceeds of the initial sale. Mortgage dollar rolls may be renewed without physical delivery of the securities subject to the contract. The Fund accounts for the dollar roll transactions as purchases and sales.
Security transactions and income recognition
Securities transactions are recorded on a trade date basis. Realized gains or losses are reported on the basis of identified cost of securities delivered.
Interest income is accrued daily and bond discounts are accreted and premiums are amortized daily based on the effective interest method. To the extent debt obligations are placed on non-accrual status, any related interest income may be reduced by writing off interest receivables when the collection of all or a portion of interest has become doubtful based on consistently applied procedures. If the issuer subsequently resumes interest payments or when the collectability of interest is reasonably assured, the debt obligation is removed from non-accrual status.
Distributions to shareholders
Distributions to shareholders from net investment income and net realized gains, if any, are recorded on the ex-dividend date. Such distributions are determined in conformity with income tax regulations, which may differ from generally accepted accounting principles.
The timing and character of distributions made during the period from net investment income or net realized gains may differ from their ultimate characterization for federal income tax purposes. To the extent that these differences are
| | | | |
| 30 | | Wells Fargo Advantage VT Total Return Bond Fund | | Notes to Financial Statements |
permanent in nature, such amounts are reclassified within the capital accounts based on their federal tax-basis treatment. Temporary differences do not require reclassifications. The primary permanent differences causing such reclassifications are due to paydown losses and mortgage dollar roll transactions. At December 31, 2011, as a result of permanent book-to-tax differences, the following reclassification adjustments were made on the Statement of Assets and Liabilities:
| | | | | | |
Undistributed Net Investment Income | | | Accumulated Net Realized
Losses on
Investments | |
| $ | 517,508 | | | $ | (517,508 | ) |
Federal and other taxes
The Fund intends to continue to qualify as a regulated investment company by distributing substantially all of its investment company taxable income and any net realized capital gains (after reduction for capital loss carryforwards) sufficient to relieve it from all, or substantially all, federal income taxes. Accordingly, no provision for federal income taxes was required.
The Fund’s income and federal excise tax returns and all financial records supporting those returns for the prior three fiscal years are subject to examination by the federal and Delaware revenue authorities.
Under the recently enacted Regulated Investment Company Modernization Act of 2010, the Fund is permitted to carry forward capital losses incurred in taxable years which began after December 22, 2010 for an unlimited period. However, any losses incurred are required to be utilized prior to the losses incurred in pre-enactment taxable years. As a result of this ordering rule, pre-enactment capital loss carryforwards may be more likely to expire unused. Additionally, post-enactment capital losses that are carried forward will retain their character as either short-term or long-term capital losses rather than being considered all short-term as under previous law.
As of December 31, 2011, the Fund had net capital loss carryforwards, which are available to offset future net realized capital gains, in the amount of $5,408,193 with $713,327 expiring in 2015 and $4,694,866 expiring in 2016.
3. FAIR VALUATION MEASUREMENTS
Fair value measurements of investments are determined within a framework that has established a fair value hierarchy based upon the various data inputs utilized in determining the value of the Fund’s investments. The three-level hierarchy gives the highest priority to unadjusted quoted prices in active markets for identical assets or liabilities (Level 1) and the lowest priority to significant unobservable inputs (Level 3). The Fund’s investments are classified within the fair value hierarchy based on the lowest level of input that is significant to the fair value measurement. The inputs are summarized into three broad levels as follows:
| n | | Level 1 – quoted prices in active markets for identical securities |
| n | | Level 2 – other significant observable inputs (including quoted prices for similar securities, interest rates, prepayment speeds, credit risk, etc.) |
| n | | Level 3 – significant unobservable inputs (including the Fund’s own assumptions in determining the fair value of investments) |
The inputs or methodologies used for valuing securities are not necessarily an indication of the risk associated with investing in those securities.
| | | | | | |
| Notes to Financial Statements | | Wells Fargo Advantage VT Total Return Bond Fund | | | 31 | |
As of December 31, 2011, the inputs used in valuing the Fund’s assets, which are carried at fair value, were as follows:
| | | | | | | | | | | | | | | | |
| Investments in Securities | | Quoted Prices (Level 1) | | | Significant Other
Observable Inputs (Level 2) | | | Significant Unobservable Inputs (Level 3) | | | Total | |
Agency securities | | $ | 0 | | | $ | 43,016,094 | | | $ | 0 | | | $ | 43,016,094 | |
Asset-backed securities | | | 0 | | | | 7,191,214 | | | | 0 | | | | 7,191,214 | |
Corporate bonds and notes | | | 0 | | | | 10,629,546 | | | | 0 | | | | 10,629,546 | |
Municipal bonds and notes | | | 0 | | | | 912,510 | | | | 0 | | | | 912,510 | |
Non-agency mortgage-backed securities | | | 0 | | | | 7,148,886 | | | | 0 | | | | 7,148,886 | |
U.S. Treasury securities | | | 20,950,665 | | | | 0 | | | | 0 | | | | 20,950,665 | |
Yankee corporate bonds and notes | | | 0 | | | | 4,783,814 | | | | 0 | | | | 4,783,814 | |
Yankee government bonds | | | 0 | | | | 498,956 | | | | 0 | | | | 498,956 | |
Other | | | 0 | | | | 0 | | | | 333,641 | | | | 333,641 | |
Short-term investments | | | | | | | | | | | | | | | | |
Investment companies | | | 8,807,666 | | | | 78,744 | | | | 0 | | | | 8,886,410 | |
| | | $ | 29,758,331 | | | $ | 74,259,764 | | | $ | 333,641 | | | $ | 104,351,736 | |
Further details on the major security types listed above can be found in the Portfolio of Investments.
As of December 31, 2011, the inputs used in valuing TBA sales commitments, which are carried at their value, were as follows:
| | | | | | | | | | | | | | | | |
| | | Quoted Prices (Level 1) | | | Significant Other
Observable Inputs (Level 2) | | | Significant Unobservable Inputs (Level 3) | | | Total | |
TBA sale commitments | | $ | 0 | | | $ | (2,440,188 | ) | | $ | 0 | | | $ | (2,440,188 | ) |
Transfers in and transfers out are recognized at the end of the reporting period. For the year ended December 31, 2011, the Fund did not have any significant transfers into/out of Level 1 and Level 2.
The following is a reconciliation of assets in which significant unobservable inputs (Level 3) were used in determining fair value:
| | | | | | | | | | | | | | | | |
| | | Agency
securities | | | Asset-backed
securities | | | Other | | | Total | |
Balance as of December 31, 2010 | | $ | 603,883 | | | $ | 272,078 | | | $ | 553,059 | | | $ | 1,429,020 | |
Accrued discounts (premiums) | | | 0 | | | | (14 | ) | | | 0 | | | | (14 | ) |
Realized gains (losses) | | | 0 | | | | 8,156 | | | | 0 | | | | 8,156 | |
Change in unrealized gains (losses) | | | (189 | ) | | | (5,454 | ) | | | (17,992 | ) | | | (23,635 | ) |
Purchases | | | 0 | | | | 107,227 | | | | 0 | | | | 107,227 | |
Sales | | | (603,694 | ) | | | (381,993 | ) | | | (201,426 | ) | | | (1,187,113 | ) |
Transfers into Level 3 | | | 0 | | | | 0 | | | | 0 | | | | 0 | |
Transfers out of Level 3 | | | 0 | | | | 0 | | | | 0 | | | | 0 | |
Balance as of December 31, 2011 | | $ | 0 | | | $ | 0 | | | $ | 333,641 | | | $ | 333,641 | |
Change in unrealized gains (losses)
relating to securities still held at December 31, 2011 | | $ | 0 | | | $ | 0 | | | $ | (110,527 | ) | | $ | (110,527 | ) |
4. TRANSACTIONS WITH AFFILIATES AND OTHER EXPENSES
Advisory fee
The Trust has entered into an advisory contract with Funds Management, an indirect wholly owned subsidiary of Wells Fargo & Company (“Wells Fargo”). The adviser is responsible for implementing investment policies and guidelines and for supervising the sub-adviser, who is responsible for day-to-day portfolio management of the Fund.
| | | | |
| 32 | | Wells Fargo Advantage VT Total Return Bond Fund | | Notes to Financial Statements |
Pursuant to the contract, Funds Management is entitled to receive an annual advisory fee starting at 0.40% and declining to 0.30% as the average daily net assets of the Fund increase. For the year ended December 31, 2011, the advisory fee was equivalent to an annual rate of 0.40% of the Fund’s average daily net assets.
Funds Management may retain the services of certain sub-advisers to provide daily portfolio management to the Fund. The fees related to sub-advisory services are borne directly by Funds Management and do not increase the overall fees paid by the Fund. Wells Capital Management, an affiliate of Funds Management, is the sub-adviser to the Fund and is entitled to receive a fee from Funds Management at an annual rate starting at 0.20% and declining to 0.10% as the average daily net assets of the Fund increase.
Administration and transfer agent fees
The Trust has entered into an administration agreement with Funds Management. Under this agreement, for providing administrative services, which includes paying fees and expenses for services provided by the transfer agent, sub-transfer agents, omnibus account servicers and record-keepers, Funds Management is entitled to receive from the Fund an annual fund level administration fee starting at 0.05% and declining to 0.03% as the average daily net assets of the Fund increase and for Class 2 shares, a class level administration fee of 0.08% of its average daily net assets.
Funds Management has contractually waived and/or reimbursed advisory and administration fees to the extent necessary to maintain certain net operating expense ratios for the Fund. Waiver of fees and/or reimbursement of expenses by Funds Management were made first from fund level expenses on a proportionate basis and then from class specific expenses.
Distribution fees
The Trust has adopted a Distribution Plan for Class 2 shares of the Fund pursuant to Rule 12b-1 under the 1940 Act. Distribution fees are charged to Class 2 shares and paid to Wells Fargo Funds Distributor, LLC, the principal underwriter, at an annual rate of 0.25% of its average daily net assets.
5. INVESTMENT PORTFOLIO TRANSACTIONS
Purchases and sales of investments, excluding short-term securities (securities with maturities of one year or less at purchase date), for the year ended December 31, 2011 were as follows:
| | | | | | | | | | | | | | |
| Purchases at Cost | | | Sales Proceeds | |
| U.S. Government | | | Non-U.S. Government | | | U.S. Government | | | Non-U.S. Government | |
| $ | 697,337,848 | | | $ | 77,478,898 | | | $ | 681,761,372 | | | $ | 88,214,220 | |
6. ACQUISITION
After the close of business on July 16, 2010, the Fund acquired the net assets of Evergreen VA Core Bond Fund. The purpose of the transaction was to combine two funds with similar investment objectives and strategies. The Fund renamed its existing single class share as Class 2. The acquisition was accomplished by a tax-free exchange of all of the shares of Evergreen VA Core Bond Fund for 2,976,311 shares of the Fund valued at $31,182,320 at an exchange ratio of 0.83 for Class 2 shares. Shareholders holding Class 2 shares of Evergreen VA Core Bond Fund received Class 2 shares of the Fund in the reorganization. The investment portfolio of Evergreen VA Core Bond Fund with a fair value of $31,099,786, identified cost of $30,533,822 and unrealized gains of $565,964 at July 16, 2010 were the principal assets acquired by the Fund. The aggregate net assets of Evergreen VA Core Bond Fund and the Fund immediately prior to the acquisition were $31,182,320 and $58,161,686, respectively. The aggregate net assets of the Fund immediately after the acquisition were $89,344,006. For financial reporting purposes, assets received and shares issued by the Fund were recorded at fair value; however, the cost basis of the investments received from Evergreen VA Core Bond Fund was carried forward to align ongoing reporting of the Fund’s realized and unrealized gains and losses with amounts distributable to shareholders for tax purposes.
Assuming the acquisition had been completed January 1, 2010, the beginning of the annual reporting period for the Fund, the pro forma results of operations for the year ended December 31, 2010 would have been:
| | | | |
Net investment income | | $ | 2,883,307 | |
Net realized and unrealized gains on investments | | $ | 3,976,870 | |
Net increase in net assets resulting from operations | | $ | 6,860,177 | |
| | | | | | |
| Notes to Financial Statements | | Wells Fargo Advantage VT Total Return Bond Fund | | | 33 | |
7. BANK BORROWINGS
The Trust and Wells Fargo Funds Trust (excluding the money market funds) are parties to a $150,000,000 revolving credit agreement with State Street Bank and Trust Company, whereby the Fund is permitted to use bank borrowings for temporary or emergency purposes, such as to fund shareholder redemption requests. Interest under the credit agreement is charged to the Fund based on a borrowing rate equal to the higher of the Federal Funds rate in effect on that day plus 1.25% or the overnight LIBOR rate in effect on that day plus 1.25%. In addition, under the credit agreement, the Fund pays an annual commitment fee equal to 0.10% of the unused balance, which is allocated pro rata. Prior to September 6, 2011, the revolving credit agreement was for $125,000,000 and the annual commitment fee paid by the Fund was 0.125% of the unused balance. For the year ended December 31, 2011, the Fund paid $125 in commitment fees.
For the year ended December 31, 2011, there were no borrowings by the Fund under the agreement.
8. DISTRIBUTIONS TO SHAREHOLDERS
The tax character of distributions paid during the years ended December 31, 2011 and December 31, 2010 were as follows:
| | | | | | | | |
| | | Year ended December 31, | |
| | | 2011 | | | 2010 | |
Ordinary Income | | $ | 4,856,163 | | | $ | 4,511,331 | |
Long-term Capital Gain | | | 707,815 | | | | 0 | |
As of December 31, 2011, the components of distributable earnings on a tax basis were as follows:
| | | | | | | | | | | | | | |
Undistributed
Ordinary
Income | | | Undistributed
Long-Term
Gain | | | Unrealized
Gains (Losses) | | | Capital Loss
Carryforward | |
| $ | 775,817 | | | $ | 957,569 | | | $ | 1,767,062 | | | $ | (5,408,193 | ) |
9. INDEMNIFICATION
Under the Trust’s organizational documents, the officers and directors are indemnified against certain liabilities that may arise out of performance of their duties to the Trust. Additionally, in the normal course of business, the Trust may enter into contracts with service providers that contain a variety of indemnification clauses. The Trust’s maximum exposure under these arrangements is dependent on future claims that may be made against the Fund and, therefore, cannot be estimated.
10. NEW ACCOUNTING PRONOUNCEMENTS
In May 2011, the Financial Accounting Standards Board (“FASB”) issued Accounting Standards Update (“ASU”) No. 2011-04 “Amendments to Achieve Common Fair Value Measurement and Disclosure Requirements in U.S. GAAP and IFRSs”. ASU No. 2011-04 amends FASB ASC Topic 820, Fair Value Measurements and Disclosures, to establish common requirements for measuring fair value and for disclosing information about fair value measurements in accordance with GAAP. The ASU is effective prospectively for interim and annual periods beginning after December 15, 2011. Management expects that adoption of the ASU will result in additional disclosures in the financial statements, as applicable.
In April 2011, FASB issued ASU No. 2011-03 “Reconsideration of Effective Control for Repurchase Agreements”. ASU No. 2011-03 amends FASB ASC Topic 860, Transfers and Servicing, specifically the criteria required to determine whether a repurchase agreement (repo) and similar agreements should be accounted for as sales of financial assets or secured borrowings with commitments. ASU No. 2011-03 changes the assessment of effective control by focusing on the transferor’s contractual rights and obligations and removing the criterion to assess its ability to exercise those rights or honor those obligations. This could result in changes to the way entities account for certain transactions including repurchase agreements, mortgage dollar rolls and reverse repurchase agreements. The ASU will become effective on a prospective basis for new transfers and modifications to existing transactions as of the beginning of the first interim or annual period beginning on or after December 15, 2011. Management has evaluated the impact of adopting the ASU and expects no significant changes.
| | | | |
| 34 | | Wells Fargo Advantage VT Total Return Bond Fund | | Report of Independent Registered Public Accounting Firm |
BOARD OF TRUSTEES AND SHAREHOLDERS OF WELLS FARGO VARIABLE TRUST:
We have audited the accompanying statement of assets and liabilities, including the portfolio of investments, of the Wells Fargo Advantage VT Total Return Bond Fund (the “Fund”), one of the funds constituting the Wells Fargo Variable Trust, as of December 31, 2011, and the related statement of operations for the year then ended, statements of changes in net assets for each of the years in the two-year period then ended, and the financial highlights for each of the years in the five-year period then ended. These financial statements and financial highlights are the responsibility of the Fund’s management. Our responsibility is to express an opinion on these financial statements and financial highlights based on our audits.
We conducted our audits in accordance with the standards of the Public Company Accounting Oversight Board (United States). Those standards require that we plan and perform the audit to obtain reasonable assurance about whether the financial statements and financial highlights are free of material misstatement. An audit includes examining, on a test basis, evidence supporting the amounts and disclosures in the financial statements. Our procedures included confirmation of securities owned as of December 31, 2011, by correspondence with custodian and brokers, or by other appropriate auditing procedures. An audit also includes assessing the accounting principles used and significant estimates made by management, as well as evaluating the overall financial statement presentation. We believe that our audits provide a reasonable basis for our opinion.
In our opinion, the financial statements and financial highlights referred to above present fairly, in all material respects, the financial position of the Wells Fargo Advantage VT Total Return Bond Fund as of December 31, 2011, the results of its operations for the year then ended, changes in its net assets for each of the years in the two-year period then ended, and the financial highlights for each of the years in the five-year period then ended, in conformity with U.S. generally accepted accounting principles.

Boston, Massachusetts
February 24, 2012
| | | | | | |
| Other Information (Unaudited) | | Wells Fargo Advantage VT Total Return Bond Fund | | | 35 | |
TAX INFORMATION
Pursuant to Section 852 of the Internal Revenue Code, $707,815 was designated as long-term capital gain distributions for the fiscal year ended December 31, 2011.
PROXY VOTING INFORMATION
A description of the policies and procedures that the Fund uses to determine how to vote proxies relating to portfolio securities is available without charge, upon request, by calling 1-800-222-8222, visiting our Web site at www.wellsfargo.com/advantagefunds, or visiting the SEC Web site at www.sec.gov. Information regarding how the Fund voted proxies relating to portfolio securities during the most recent 12-month period ended June 30 is available without charge on the Fund’s Web site at www.wellsfargo.com/advantagefunds or by visiting the SEC Web site at www.sec.gov.
PORTFOLIO HOLDINGS INFORMATION
The complete portfolio holdings for the Fund are publicly available on the Fund’s Web site (www.wellsfargo.com/advantagefunds) on a monthly, 30-day or more delayed basis. In addition, top ten holdings information for the Fund is publicly available on the Fund’s Web site on a monthly, seven-day or more delayed basis. The Fund files its complete schedule of portfolio holdings with the SEC for the first and third quarters of each fiscal year on Form N-Q, which is available without charge by visiting the SEC Web site at www.sec.gov. In addition, the Fund’s Form N-Q may be reviewed and copied at the SEC’s Public Reference Room in Washington, DC, and at regional offices in New York City, at 233 Broadway, and in Chicago, at 175 West Jackson Boulevard, Suite 900. Information about the Public Reference Room may be obtained by calling 1-800-SEC-0330.
| | | | |
| 36 | | Wells Fargo Advantage VT Total Return Bond Fund | | Other Information (Unaudited) |
BOARD OF TRUSTEES
The following table provides basic information about the Board of Trustees (the “Trustees”) of the Trust and Officers of the Trust. This table should be read in conjunction with the Prospectus and the Statement of Additional Information1 of the Fund. Each of the Trustees and Officers listed below acts in identical capacities for the Wells Fargo Advantage family of funds, which consists of 138 funds comprising the Wells Fargo Funds Trust, Wells Fargo Variable Trust, Wells Fargo Master Trust and four closed-end funds (collectively the “Fund Complex”). All of the Trustees are also Members of the Audit and Governance Committees of each Trust in the Fund Complex. The mailing address of each Trustee and Officer is 525 Market Street, 12th Floor, San Francisco, CA 94105. Each Trustee and Officer serves an indefinite term, however, each Trustee serves such term until reaching the mandatory retirement age established by the Trustees.
Independent Trustees
| | | | | | |
Name and Year of Birth | | Position Held and Length of Service | | Principal Occupations During Past Five Years | | Other Directorships During
Past Five Years |
Peter G. Gordon
(Born 1942) | | Trustee, since 1998; Chairman, since 2005 (Lead Trustee since 2001) | | Co-Founder, Retired Chairman, President and CEO of Crystal Geyser Water Company. Trustee Emeritus, Colby College | | Asset Allocation Trust |
Isaiah Harris, Jr.
(Born 1952) | | Trustee, since 2009 | | Retired. Prior thereto, President and CEO of BellSouth Advertising and Publishing Corp. from 2005 to 2007, President and CEO of BellSouth Enterprises from 2004 to 2005 and President of BellSouth Consumer Services from 2000 to 2003. Emeritus member of the Iowa State University Foundation Board of Governors. Emeritus Member of the Advisory Board of Iowa State University School of Business. Mr. Harris is a certified public accountant. | | CIGNA Corporation; Deluxe Corporation; Asset Allocation Trust |
Judith M. Johnson
(Born 1949) | | Trustee, since 2008 | | Retired. Prior thereto, Chief Executive Officer and Chief Investment Officer of Minneapolis Employees Retirement Fund from 1996 to 2008. Ms. Johnson is an attorney, certified public accountant and a certified managerial accountant. | | Asset Allocation Trust |
Leroy Keith, Jr.
(Born 1939) | | Trustee, since 2010 | | Chairman, Bloc Global Services (development and construction). Trustee of the Evergreen Funds from 1983 to 2010. Former Managing Director, Almanac Capital Management (commodities firm), former Partner, Stonington Partners, Inc. (private equity fund), former Director, Obagi Medical Products Co. and former Director, Lincoln Educational Services. | | Trustee, Virtus Fund Complex (consisting of 40 portfolios as of 12/31/11); Asset Allocation Trust |
David F. Larcker
(Born 1950) | | Trustee, since 2009 | | James Irvin Miller Professor of Accounting at the Graduate School of Business, Stanford University, Director of Corporate Governance Research Program and Senior Faculty of The Rock Center for Corporate Governance since 2006. From 2005 to 2008, Professor of Accounting at the Graduate School of Business, Stanford University. Prior thereto, Ernst & Young Professor of Accounting at The Wharton School, University of Pennsylvania from 1985 to 2005. | | Asset Allocation Trust |
Olivia S. Mitchell
(Born 1953) | | Trustee, since 2006 | | International Foundation of Employee Benefit Plans Professor, Wharton School of the University of Pennsylvania since 1993. Director of Wharton’s Pension Research Council and Boettner Center on Pensions & Retirement Research, and Research Associate at the National Bureau of Economic Research. Previously, Cornell University Professor from 1978 to 1993. | | Asset Allocation Trust |
| | | | | | |
| Other Information (Unaudited) | | Wells Fargo Advantage VT Total Return Bond Fund | | | 37 | |
| | | | | | |
Name and Year of Birth | | Position Held and Length of Service | | Principal Occupations During Past Five Years | | Other Directorships During
Past Five Years |
Timothy J. Penny
(Born 1951) | | Trustee, since 1996 | | President and CEO of Southern Minnesota Initiative Foundation, a non-profit organization, since 2007 and Senior Fellow at the Humphrey Institute Policy Forum at the University of Minnesota since 1995. Member of the Board of Trustees of NorthStar Education Finance, Inc., a non-profit organization, since 2007. | | Asset Allocation Trust |
Michael S. Scofield
(Born 1943) | | Trustee, since 2010 | | Served on the Investment Company Institute’s Board of Governors and Executive Committee from 2008-2011 as well the Governing Council of the Independent Directors Council from 2006-2011 and the Independent Directors Council Executive Committee from 2008-2011. Chairman of the IDC from 2008-2010. Institutional Investor (Fund Directions) Trustee of Year in 2007. Trustee of the Evergreen Funds (and its predecessors) from 1984 to 2010. Chairman of the Evergreen Funds from 2000-2010. Former Trustee of the Mentor Funds. Retired Attorney, Law Offices of Michael S. Scofield and former Director and Chairman, Branded Media Corporation (multi-media branding company). | | Asset Allocation Trust |
Donald C. Willeke
(Born 1940) | | Trustee, since 1996 | | Principal of the law firm of Willeke & Daniels. General Counsel of the Minneapolis Employees Retirement Fund from 1984 until its consolidation into the Minnesota Public Employees Retirement Association on June 30, 2010. Director and Vice Chair of The Free Trust (non-profit corporation). Director of the American Chestnut Foundation (non-profit corporation). | | Asset Allocation Trust |
Officers
| | | | | | |
Name and Year of Birth | | Position Held and
Length of Service | | Principal Occupations During Past Five Years | | |
Karla M. Rabusch
(Born 1959) | | President, since 2003 | | Executive Vice President of Wells Fargo Bank, N.A. and President of Wells Fargo Funds Management, LLC since 2003. Senior Vice President and Chief Administrative Officer of Wells Fargo Funds Management, LLC from 2001 to 2003. | | |
C. David Messman
(Born 1960) | | Secretary, since 2000; Chief Legal Counsel, since 2003 | | Senior Vice President and Secretary of Wells Fargo Funds Management, LLC since 2001. Vice President and Managing Senior Counsel of Wells Fargo Bank, N.A. since 1996. | | |
Kasey Phillips
(Born 1970) | | Treasurer, since 2009 | | Senior Vice President of Wells Fargo Funds Management, LLC since 2009. Senior Vice President of Evergreen Investment Management Company, LLC from 2006 to 2010. Treasurer of the Evergreen Funds from 2005 to 2010. | | |
David Berardi
(Born 1975) | | Assistant Treasurer, since 2009 | | Vice President of Wells Fargo Funds Management, LLC since 2009. Vice President of Evergreen Investment Management Company, LLC from 2008 to 2010. Assistant Vice President of Evergreen Investment Services, Inc. from 2004 to 2008. Manager of Fund Reporting and Control for Evergreen Investment Management Company, LLC from 2004 to 2010. | | |
Jeremy DePalma
(Born 1974) | | Assistant Treasurer, since 2009 | | Senior Vice President of Wells Fargo Funds Management, LLC since 2009. Senior Vice President of Evergreen Investment Management Company, LLC from 2008 to 2010. Vice President, Evergreen Investment Services, Inc. from 2004 to 2007. Head of the Fund Reporting and Control Team within Fund Administration from 2005 to 2010. | | |
Debra Ann Early
(Born 1964) | | Chief Compliance Officer, since 2007 | | Chief Compliance Officer of Wells Fargo Funds Management, LLC since 2007. Chief Compliance Officer of Parnassus Investments from 2005 to 2007. Chief Financial Officer of Parnassus Investments from 2004 to 2007 and Senior Audit Manager of PricewaterhouseCoopers LLP from 1998 to 2004. | | |
| 1. | The Statement of Additional Information includes additional information about the Trustees and is available, without charge, upon request, by calling 1-800-222-8222 or by visiting the Web site at www.wellsfargo.com/advantagefunds. |
| | | | |
| 38 | | Wells Fargo Advantage VT Total Return Bond Fund | | List of Abbreviations |
The following is a list of common abbreviations for terms and entities which may have appeared in this report.
| ACB | — Agricultural Credit Bank |
| ADR | — American Depository Receipt |
| ADS | — American Depository Shares |
| AGC-ICC | — Assured Guaranty Corporation - Insured Custody Certificates |
| AGM | — Assured Guaranty Municipal |
| AMBAC | — American Municipal Bond Assurance Corporation |
| AMT | — Alternative Minimum Tax |
| BAN | — Bond Anticipation Notes |
| BHAC | — Berkshire Hathaway Assurance Corporation |
| CAB | — Capital Appreciation Bond |
| CCAB | — Convertible Capital Appreciation Bond |
| CDA | — Community Development Authority |
| CDO | — Collateralized Debt Obligation |
| COP | — Certificate of Participation |
| DRIVER | — Derivative Inverse Tax-Exempt Receipts |
| DW&P | — Department of Water & Power |
| DWR | — Department of Water Resources |
| ECFA | — Educational & Cultural Facilities Authority |
| EDA | — Economic Development Authority |
| EDFA | — Economic Development Finance Authority |
| ETF | — Exchange-Traded Fund |
| FFCB | — Federal Farm Credit Bank |
| FGIC | — Financial Guaranty Insurance Corporation |
| FHA | — Federal Housing Authority |
| FHLB | — Federal Home Loan Bank |
| FHLMC | — Federal Home Loan Mortgage Corporation |
| FNMA | — Federal National Mortgage Association |
| GDR | — Global Depository Receipt |
| GNMA | — Government National Mortgage Association |
| HCFR | — Healthcare Facilities Revenue |
| HEFA | — Health & Educational Facilities Authority |
| HEFAR | — Higher Education Facilities Authority Revenue |
| HFA | — Housing Finance Authority |
| HFFA | — Health Facilities Financing Authority |
| IBC | — Insured Bond Certificate |
| IDA | — Industrial Development Authority |
| IDAG | — Industrial Development Agency |
| IDR | — Industrial Development Revenue |
| KRW | — Republic of Korea Won |
| LIBOR | — London Interbank Offered Rate |
| LLC | — Limited Liability Company |
| LLP | — Limited Liability Partnership |
| MBIA | — Municipal Bond Insurance Association |
| MFHR | — Multi-Family Housing Revenue |
| MUD | — Municipal Utility District |
| NATL-RE | — National Public Finance Guarantee Corporation |
| PCFA | — Pollution Control Finance Authority |
| PCR | — Pollution Control Revenue |
| PFA | — Public Finance Authority |
| PFFA | — Public Facilities Financing Authority |
| PFOTER | — Puttable Floating Option Tax-Exempt Receipts |
| plc | — Public Limited Company |
| PUTTER | — Puttable Tax-Exempt Receipts |
| R&D | — Research & Development |
| RDA | — Redevelopment Authority |
| RDFA | — Redevelopment Finance Authority |
| REIT | — Real Estate Investment Trust |
| ROC | — Reset Option Certificates |
| SAVRS | — Select Auction Variable Rate Securities |
| SBA | — Small Business Authority |
| SFHR | — Single Family Housing Revenue |
| SFMR | — Single Family Mortgage Revenue |
| SPDR | — Standard & Poor’s Depositary Receipts |
| TAN | — Tax Anticipation Notes |
| TIPS | — Treasury Inflation-Protected Securities |
| TRAN | — Tax Revenue Anticipation Notes |
| TCR | — Transferable Custody Receipts |
| TTFA | — Transportation Trust Fund Authority |
| TVA | — Tennessee Valley Authority |
| XLCA | — XL Capital Assurance |


FOR MORE INFORMATION
More information about Wells Fargo Advantage Funds is available free upon request. To obtain literature, please write, e-mail, visit the Fund’s Web site, or call:
Wells Fargo Advantage Funds
P.O. Box 8266
Boston, MA 02266-8266
E-mail: wfaf@wellsfargo.com
Web site: www.wellsfargo.com/advantagefunds
Individual investors: 1-800-222-8222
Retail investment professionals: 1-888-877-9275
Institutional investment professionals: 1-866-765-0778
This report and the financial statements contained herein are submitted for the general information of the shareholders of Wells Fargo Advantage Funds. If this report is used for promotional purposes, distribution of the report must be accompanied or preceded by a current prospectus. For a prospectus containing more complete information, including charges and expenses, call 1-800-222-8222 or visit the Fund’s Web site at www.wellsfargo.com/advantagefunds. Please consider the investment objectives, risks, charges, and expenses of the investment carefully before investing. This and other information about Wells Fargo Advantage Funds can be found in the current prospectus. Read the prospectus carefully before you invest or send money.
Wells Fargo Funds Management, LLC, a wholly owned subsidiary of Wells Fargo & Company, provides investment advisory and administrative services for Wells Fargo Advantage Funds. Other affiliates of Wells Fargo & Company provide subadvisory and other services for the Funds. The Funds are distributed by Wells Fargo Funds Distributor, LLC, Member FINRA/SIPC, an affiliate of Wells Fargo & Company.
NOT FDIC INSURED ¡ NO BANK GUARANTEE ¡ MAY LOSE VALUE
© 2012 Wells Fargo Funds Management, LLC. All rights reserved.
| | |
| | 207579 02-12 AVT9/AR155 12-11 |
As of the end of the period, December 31, 2011, Wells Fargo Variable Trust has adopted a code of ethics, as defined in Item 2 of Form N-CSR, that applies to its President and Treasurer. A copy of the code of ethics is filed as an exhibit to this Form N-CSR.
| ITEM 3. | AUDIT COMMITTEE FINANCIAL EXPERT |
The Board of Trustees of Wells Fargo Variable Trust has determined that Judith Johnson is an audit committee financial expert, as defined in Item 3 of Form N-CSR. Mrs. Johnson is independent for purposes of Item 3 of Form N-CSR.
| ITEM 4. | PRINCIPAL ACCOUNTANT FEES AND SERVICES |
(a)
Audit Fees - Provided below are the aggregate fees billed for the fiscal years ended December 31, 2010 and December 31, 2011 for professional services rendered by the principal accountant for the audit of the Registrant’s annual financial statements or services that are normally provided by the accountant in connection with statutory and regulatory filings or engagements.
For the fiscal years ended December 31, 2010 and December 31, 2011, the Audit Fees were $284,730 and $553,779, respectively.
(b)
Audit-Related Fees – There were no audit-related fees incurred for the fiscal years ended December 31, 2010 and December 31, 2011 for assurance and related services by the principal accountant for the Registrant.
(c)
Tax Fees - Provided below are the aggregate fees billed for the fiscal years ended December 31, 2010 and December 31, 2011 for professional services rendered by the principal accountant for the Registrant for tax compliance, tax advice, and tax planning.
For the fiscal years ended December 31, 2010 and December 31, 2011, the Tax Fees were $21,020 and $21,560 respectively. The incurred Tax Fees are comprised of tax preparation and consulting services.
(d)
All Other Fees – There were no other fees incurred for the fiscal years ended December 31, 2010 and December 31, 2011.
(e)(1)
The Chairman of the Audit Committees is authorized to pre-approve: (1) audit services to the mutual funds of Wells Fargo Variable Trust; (2) non-audit tax or compliance consulting or training services provided to the Funds by the independent auditors (“Auditors”) if the fees for any particular engagement are not anticipated to exceed $50,000; and (3) non-audit tax or compliance consulting or training services provided by the Auditors to a Fund’s investment adviser and its controlling entities (where pre-approval is required because the engagement relates directly to the operations and financial reporting of the Fund) if the fee to the Auditors for any particular engagement is not anticipated to exceed $50,000. For any such pre-approval sought from the Chairman, Management shall prepare a brief description of the proposed services. If the Chairman approves of such service, he or she shall sign the statement prepared by Management. Such written statement shall be presented to the full Committees at their next regularly scheduled meetings.
(e)(2)
Not Applicable.
(f)
Not Applicable.
(g)
Non-Audit Fees – There were no non-audit fees billed for the fiscal years ended December 31, 2010 and December 31, 2011, by the principal accountant for services rendered to the Registrant, and rendered to the Registrant’s investment adviser, and any entity controlling, controlled by, or under common control with the adviser that provides ongoing services to the Registrant.
(h)
The Registrant’s audit committee of the board of directors has determined that non-audit services rendered to the registrant’s investment adviser, that were not pre-approved pursuant to paragraph (c)(7)(ii) of Rule 2-01 of the Regulation S-X, does not compromise the independence of the principal accountant.
| ITEM 5. | AUDIT COMMITTEE OF LISTED REGISTRANTS |
Not applicable.
| ITEMS 6. | SCHEDULE OF INVESTMENTS |
The Schedule of Investments is included as part of the report to shareholders filed under Item 1 of this Form.
| ITEM 7. | DISCLOSURE OF PROXY VOTING POLICIES AND PROCEDURES FOR CLOSED-END MANAGEMENT INVESTMENT COMPANIES |
Not applicable.
| ITEM 8. | PORTFOLIO MANAGERS OF CLOSED-END MANAGEMENT INVESTMENT COMPANIES |
Not applicable.
| ITEM 9. | PURCHASES OF EQUITY SECURITIES BY CLOSED-END MANAGEMENT INVESTMENT COMPANY AND AFFILIATED PURCHASES |
Not applicable.
| ITEM 10. | SUBMISSION OF MATTERS TO A VOTE OF SECURITY HOLDERS |
The Governance Committee (the “Committee”) of the Board of Trustees of the registrant (the “Trust”) has adopted procedures by which a shareholder of any series of the Trust may submit properly a nominee recommendation for the Committee’s consideration.
The shareholder must submit any such recommendation (a “Shareholder Recommendation”) in writing to the Trust, to the attention of the Trust’s Secretary, at the address of the principal executive offices of the Trust.
The Shareholder Recommendation must be delivered to, or mailed and received at, the principal executive offices of the Trust not less than forty-five (45) calendar days nor more than seventy-five (75) calendar days prior to the date of the Committee meeting at which the nominee would be considered.
The Shareholder Recommendation must include: (i) a statement in writing setting forth (A) the name, age, date of birth, business address, residence address and nationality of the person recommended by the shareholder (the “candidate”); (B) the series (and, if applicable, class) and number of all shares of the Trust owned of record or beneficially by the candidate, as reported to such shareholder by the candidate; (C) any other information regarding the candidate called for with respect to director nominees by paragraphs (a), (d), (e) and (f) of Item 401 of Regulation S-K or paragraph (b) of Item 22 of Rule 14a-101 (Schedule 14A) under the Securities Exchange Act of 1934, as amended (the “Exchange Act”), adopted by the Securities and Exchange Commission (or the corresponding provisions of any regulation or rule subsequently adopted by the Securities and Exchange Commission or any successor agency applicable to the Trust); (D) any other information regarding the candidate that would be required to be disclosed if the candidate were a nominee in a proxy statement or other filing required to be made in connection with solicitation of proxies for election of directors pursuant to Section 14 of the Exchange Act and the rules and regulations promulgated thereunder; and (E) whether the recommending shareholder believes that the candidate is or will be an “interested person” of the Trust (as defined in the Investment Company Act of 1940, as amended) and, if not an “interested person,” information regarding the candidate that will be sufficient for the Trust to make such determination; (ii) the written and signed consent of the candidate to be named as a nominee and to serve as a Trustee if elected; (iii) the recommending shareholder’s name as it appears on the Trust’s books; (iv) the series (and, if applicable, class) and number of all shares of the Trust owned beneficially and of record by the recommending shareholder; and (v) a description of all arrangements or understandings between the recommending shareholder and the candidate and any other person or persons (including their names) pursuant to which the recommendation is being made by the recommending shareholder. In addition, the Committee may require the candidate to interview in person and furnish such other information as it may reasonably require or deem necessary to determine the eligibility of such candidate to serve as a Trustee of the Trust.
| ITEM 11. | CONTROLS AND PROCEDURES |
(a) The President and Treasurer have concluded that the Wells Fargo Variable Trust (the “Trust”) disclosure controls and procedures (as defined in Rule 30a-3(c) under the Investment Company Act of 1940) provide reasonable assurances that material information relating to the Trust is made known to them by the appropriate persons based on their evaluation of these controls and procedures as of a date within 90 days of the filing of this report.
(b) There were no significant changes in the Trust’s internal controls over financial reporting (as defined in Rule 30a-3(d) under the Investment Company Act of 1940) that occurred during the second quarter of the period covered by this report that materially affected, or is reasonably likely to materially affect, the registrant’s internal control over financial reporting.
(a)(1) Code of Ethics pursuant to Item 2 of Form N-CSR is filed and attached hereto as Exhibit 10a.
(a)(2) Certification pursuant to Rule 30a-2(a) under the Investment Company Act of 1940 (17 CFR 270.30a-2(a)) is filed and attached hereto as Exhibit 99.CERT.
(a)(3) Not applicable.
(b) Certification pursuant to Rule 30a-2(b) under the Investment Company Act of 1940 (17 CFR 270.30a-2(b)) is filed and attached hereto as Exhibit 99.906CERT.
SIGNATURES
Pursuant to the requirements of the Securities Exchange Act of 1934 and the Investment Company Act of 1940, the registrant has duly caused this report to be signed on its behalf by the undersigned, thereunto duly authorized.
| | |
| Wells Fargo Variable Trust |
| |
| By: | | |
| |
| | /s/ Karla M. Rabusch |
| |
| | Karla M. Rabusch |
| | President |
|
| Date: February 24, 2011 |
Pursuant to the requirements of the Securities Exchange Act of 1934 and the Investment Company Act of 1940, this report has been signed below by the following persons on behalf of the registrant and in the capacities and on the date indicated.
| | |
| By: | | |
| |
| | /s/ Karla M. Rabusch |
| |
| | Karla M. Rabusch |
| | President |
|
| Date: February 24, 2011 |
| |
| By: | | |
| |
| | /s/ Kasey L. Phillips |
| |
| | Kasey L. Phillips |
| | Treasurer |
|
| Date: February 24, 2011 |