Washington, D.C. 20549
Kinetics Mutual Funds, Inc. & Kinetics Portfolios Trust
U.S. Bancorp Fund Services, LLC
615 E. Michigan Street
Item 1. Report to Stockholders.
| KINETICS MUTUAL FUNDS, INC. |
| Table of Contents |
| June 30, 2014 |
| | Page |
| Shareholders’ Letter | 2 |
| Year 2014 Semi-Annual Investment Commentary | 5 |
| KINETICS MUTUAL FUNDS, INC. — FEEDER FUNDS | |
| Expense Example | 9 |
| Statements of Assets & Liabilities | 16 |
| Statements of Operations | 20 |
| Statements of Changes in Net Assets | 24 |
| Notes to Financial Statements | 35 |
| Financial Highlights | 50 |
| KINETICS PORTFOLIOS TRUST — MASTER INVESTMENT PORTFOLIOS | |
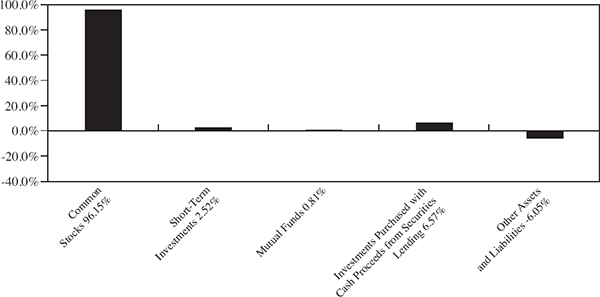
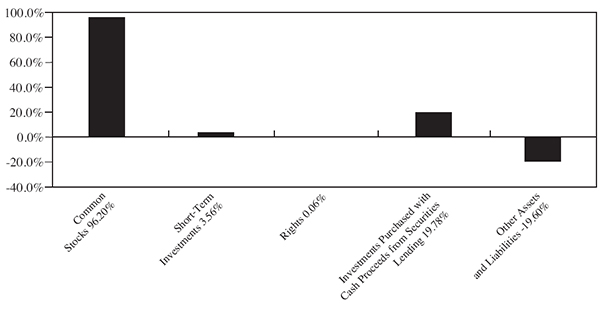
| Allocation of Portfolio Assets | 79 |
| Portfolio of Investments — The Internet Portfolio | 87 |
| Portfolio of Investments — The Global Portfolio | 92 |
| Portfolio of Investments — The Paradigm Portfolio | 97 |
| Portfolio of Investments — The Medical Portfolio | 103 |
| Portfolio of Investments — The Small Cap Opportunities Portfolio | 106 |
| Portfolio of Investments — The Market Opportunities Portfolio | 111 |
| Portfolio of Investments — The Alternative Income Portfolio | 115 |
| Portfolio of Investments — The Multi-Disciplinary Portfolio | 125 |
| Portfolio of Options Written — The Alternative Income Portfolio | 134 |
| Portfolio of Options Written — The Multi-Disciplinary Portfolio | 167 |
| Statements of Assets & Liabilities | 178 |
| Statements of Operations | 182 |
| Statements of Changes in Net Assets | 186 |
| Notes to Financial Statements | 190 |
| KINETICS MUTUAL FUNDS, INC. |
| Shareholders’ Letter |
Dear Fellow Shareholders:
We are pleased to present the Kinetics Mutual Funds (“Funds”) Semi-Annual Report for the six-month period ended June 30, 2014. Equity markets have continued to advance during the first half of the year, albeit at a slower pace than in 2013. We believe that this advance is rooted in fundamentals for most companies; however, there are pockets of speculative excesses that have been enabled and encouraged by sustained low borrowing costs. Tempting as they may be, we strongly believe that stocks with speculative valuations should be avoided, as a small change in sentiment and/or earnings momentum can result in large, possibly permanent, losses. This strategy has resulted in modest underperformance for most of the Funds on a year-to-date basis, although we are confident that this is a temporary phenomenon. The Funds (No-Load Class) appreciated as follows during the first half of the year: The Paradigm Fund +4.66%, The Multi-Disciplinary Income Fund +4.90%, The Small Cap Opportunities Fund +3.81%, The Market Opportunities Fund +0.51%, The Internet Fund -2.38%, The Medical Fund +9.67%, The Alternative Income Fund +2.67%, and The Global Fund +2.81%. This compares to returns of +7.14% for the S&P 500 Index and +6.18% for the MSCI All Country World Index.
As a security’s valuation increases, so too does the risk of owning the security, because there is inherently a lower potential for upside, and additional future growth and profitability has already been reflected in the price. U.S. equity markets have risen considerably for over 5 years, resulting in increased risk for investors, but we believe that most equities still evidence significant, potential long-term upside, thereby justifying the investment risk. It is of the utmost importance for us to remain disciplined in assessing potential upside, compared to relative risk, as market prices now reflect varying degrees of positive developments for individual companies and economies alike. Our investment approach is based on our extended investment time horizon; thus, we are not overly concerned with short-term results, instead emphasizing potential cash flows and asset values over the next three to five years. This approach doesn’t fit precisely within either classic value or growth investing strategies, as we attempt to avoid making such classifications. Ideally, we are currently buying companies that are fairly valued based upon current asset values and cash flows, yet have “free” exposure to future growth potential. Frequently, such companies do not yet have visible drivers for revenue or earnings expansion, and thus are not closely followed by growth investors, and therefore have not been driven up in price. In short, we believe many of the “obvious” bargains in
the equity markets are no longer available at attractive prices. However, fortunes have been made buying excellent companies at fair prices—this is the current emphasis of our investment strategy.
Our equity investment process aims to identify underpriced securities primarily by extending our time horizon and identifying securities that are prone to mispricing using prevailing investment approaches. Similarly, we believe that we can exploit this strategy in certain Funds through the options market, which is also prone to mispricing. Options are primarily priced based upon implied volatility, which in turn is based on the standard deviation of the returns of the underlying equity. Note that we wrote “based on” the experienced volatility of the underlying equity, not “directly driven by”, as options are based upon implied volatility. Implied volatility tends to be higher than experienced volatility, which is directly attributable to the fact that investors are willing to pay a premium for protection from experienced volatility. This dynamic enables us to utilize a put-writing strategy in two of the Funds1 that effectively earns the aforementioned premiums in exchange for assuming the price volatility of the equity. We are able to do so with confidence because we have done extensive valuation work on most of the companies’ underlying the put options, and believe them to be attractively priced. The strategy, which can be made more conservative by writing out-of-the-money puts, or more aggressive by writing at-the-money puts, generally results in an attractive cash flow stream. The strategy has historically outperformed equity indexes in down markets, while trailing in sharply rising markets, and has the potential to significantly outperform in range bound markets. These strategies offer a compelling complement to an investor’s equity allocation, due to the varying performance drivers.
Shareholders can continue to access additional information from our website, www.kineticsfunds.com. This website provides a broad array of information, including recent portfolio holdings, quarterly investment commentaries, conference call transcripts, newsflashes, recent performance data, and online access to account information.
Kinetics offers the following funds to investors:
The Paradigm Fund focuses on companies that are valued attractively and currently have, or are expected to soon have, sustainable high business returns. The Fund has produced attractive returns since its inception in an environment that should be described as difficult for equity investors. The Paradigm Fund is Kinetics’ flagship fund.
| | | |
| 1 | This options strategy is used in The Multi-Disciplinary Income Fund and The Alternative Income Fund. |
The Multi-Disciplinary Income Fund seeks to utilize stock options and fixed-income investments in order to provide investors with equity-like returns, but with more muted volatility. At times, the options strategies of the Fund may cause the manager to purchase equity securities.
The Small Cap Opportunities Fund focuses on undervalued and special situation small capitalization equities that have the potential for rewarding long-term investment results. The same investment fundamentals employed by The Paradigm Fund are used to identify such opportunities.
The Medical Fund is a sector fund, offering an investment in scientific discovery within the promising field of medical research, particularly in the development of cancer treatments and therapies. As a sector fund, The Medical Fund is likely to have heightened volatility.
The Internet Fund is a sector fund that focuses on companies engaged in the evolution of Internet-related developments. As such, this Fund has been, and is likely to continue to be, quite volatile. More recently, this Fund has been focusing on content companies, which we believe will be the winners in the next generation of Internet development.
The Global Fund focuses on selecting long life cycle international companies that can generate long-term wealth through their business operations. This Fund is presently finding exciting opportunities in the more developed markets.
The Market Opportunities Fund focuses on those companies that benefit from increasing transactional volume or throughput, such as publicly-traded exchanges and credit card processors, or companies that act as facilitators, such as gaming companies, airports and publicly-traded toll roads.
The Alternative Income Fund seeks to provide current income and gains, with a secondary objective of obtaining long-term growth of capital. The Fund utilizes stock options and fixed income investments in order to generate a total return with limited market value variability.
The Kinetics Investment Team
| KINETICS MUTUAL FUNDS, INC. |
| Investment Commentary |
Dear Fellow Shareholders,
One of the most difficult evaluations for professional investors, and ultimately their clients, is the notion of risk and reward. Academic attempts to quantify these figures are well-intentioned, yet noticeably lacking in results. The truth is that there is no valid quantifiable method to gauge risk and reward, because prices are set by human beings, and hence are subject to human behavior, which is hardly quantifiable. All that we can do is make an educated assessment of asset values and cash flows under varying scenarios, and then assess the likelihood of each scenario. Even if we are able to precisely predict these values, we must then subject them to critical discount rate and growth assumptions. It is prudent to use very conservative assumptions for both, which we do, and if the company still appears to offer value, we consider making an investment. The good news is that we are still able to identify many such companies, while the less-good news is that the overall market is approaching valuation levels that cannot be justified using our high discount rate/low growth rate assumptions. As markets trend higher yet, to almost fix the levels seen during the 2009 nadir1, we are continuously calculating which future variables are discounted in current prices. Again, assuming a high discount rate (which is consistent with our high hurdle rate of return), we believe there is a good likelihood for many companies to achieve these rates. However, for many other companies, their current valuations can only be justified when very ambitious assumptions are made in terms of discount rates, growth, and profitability. This reminds us of the infamous 2007 quote of former Citigroup CEO Chuck Prince: “But as long as the music is playing, you’ve got to get up and dance. We’re still dancing.” Investors in such companies continue to dance, seemingly ignoring what happens when the music stops and the valuations are ultimately reconciled with fundamentals.
Many people might believe that investors in the aforementioned companies that are trading at aggressive valuations are driven simply by greed. True, these companies may offer very large gains in a short period of time, yet this is frequently paired with the potential for rapid losses. Rather than disparage such investors for imprudence, one must consider the “institutional imperative” to continue dancing. This is the imperative to keep pace with your benchmark index every week, month, quarter, and year, as clients are not likely to tolerate
underperformance for very long. Few investment managers enjoy the long-term investment horizon that permits them to truly reduce risk in a meaningful manner during increasingly speculative markets. Of course we, too, are subject to this imperative to a certain degree, but we attempt to alleviate this perpetual pressure by communicating our long-term outlook to investors and remaining benchmark agnostic. The first factor sometimes seems futile, and of course we understand when our investors become impatient, but the latter factor truly allows us to avoid areas that we believe are excessively valued. For example, we have always maintained a very low exposure to pure technology companies for the simple reason that we have minimal visibility into the prospects for these companies beyond the current product cycle. Just consider the variety of once-mighty technology firms that are now facing obsolescence. An index-conscious investor may also appreciate this dynamic, but is still compelled to own these companies due to his or her desire to minimize index tracking error. It doesn’t make logical sense to do so, but these are the established parameters in mainstream investment management.
We do not mean to raise alarm with our shareholders, but to inform them that there are pockets of risky companies in the marketplace, and we expect to forego owning such companies. This may be a trying experience, as low rates and easy access to capital have the potential to drive these companies higher yet. In contrast, we continue to hold many of the companies that have led to our strong post-crisis performance, which we are still able to discount at appropriately high rates, and still justify the values. So long as we are able to do this, we expect to hold course in the Funds and maintain a very low turnover. For investors that may be even more risk averse (compared to our high hurdle discount rates), we urge these individuals to consider our option income strategies that can potentially achieve equity-like returns with lower realized volatility and greater downside protection. In our opinion, these strategies offer benefits when compared to conventional yield-oriented strategies such as traditional bonds, leveraged loans, real estate investment trusts, or master limited partnerships.
Disclosure
This material is intended to be reviewed in conjunction with a current prospectus, which includes all fees and expenses that apply to a continued investment, as well as information regarding the risk factors, policies and objectives of the Funds. Read it carefully before investing.
Mutual Fund investing involves risk. Principal loss is possible. Because The Internet Fund, The Medical Fund and The Market Opportunities Fund invest in a single industry or geographic region, their shares are subject to a higher degree of risk than funds with a higher level of diversification. Internet, biotechnology and certain capital markets or gaming stocks are subject to a rate of change in technology, obsolescence and competition that is generally higher than that of other industries, hence they may experience extreme price and volume fluctuations.
International investing [for all Funds] presents special risks including currency exchange fluctuation, government regulations, and the potential for political and economic instability. Accordingly, the share prices for these Funds are expected to be more volatile than that of U.S.-only funds. Past performance is no guarantee of future performance.
Because smaller companies [for The Small Cap Opportunities Fund] often have narrower markets and limited financial resources, they present more risk than larger, more well established, companies.
Non-investment grade debt securities [for all Funds], i.e., junk bonds, are subject to greater credit risk, price volatility and risk of loss than investment grade securities.
Further, options contain special risks including the imperfect correlation between the value of the option and the value of the underlying asset. Investments [for The Multi- Disciplinary Fund and The Alternative Income Fund] in futures, swaps and other derivative instruments may result in loss as derivative instruments may be illiquid, difficult to price and leveraged so that small changes may produce disproportionate losses to the Funds. To the extent the Funds segregate assets to cover derivative positions, they may impair their ability to meet current obligations, to honor requests for redemption and to manage the investments in a manner consistent with their
respective investment objectives. Purchasing and writing put and call options and, in particular, writing “uncovered” options are highly specialized activities that entail greater than ordinary investment risk.
As non-diversified Funds [except The Global Fund and The Multi-Disciplinary Fund] the value of Fund shares may fluctuate more than shares invested in a broader range of industries and companies. Unlike other investment companies that directly acquire and manage their own portfolios of securities, The Kinetics Mutual Funds pursue their investment objectives by investing all of their investable assets in a corresponding portfolio series of the Kinetics Portfolios Trust.
The information concerning the Funds included in the shareholder report contains certain forward-looking statements about the factors that may affect the performance of the Funds in the future. These statements are based on Fund management’s predictions and expectations concerning certain future events and their expected impact on the Funds, such as performance of the economy as a whole and of specific industry sectors, changes in the levels of interest rates, the impact of developing world events, and other factors that may influence the future performance of the Funds. Management believes these forward-looking statements to be reasonable, although they are inherently uncertain and difficult to predict. Actual events may cause adjustments in portfolio management strategies from those currently expected to be employed.
The Nasdaq Composite (NASDAQ) and the Standard & Poor’s 500 Index (S&P 500) each represent an unmanaged, broad-basket of stocks. They are typically used as a proxy for overall market performance.
Distributor: Kinetics Funds Distributor LLC is not an affiliate of Kinetics Mutual Funds, Inc. Kinetics Funds Distributor LLC is an affiliate of Kinetics Asset Management LLC, Investment Adviser to Kinetics Mutual Funds, Inc.
For more information, log onto www.kineticsfunds.com. July 1, 2014 — Kinetics Asset Management LLC®
| KINETICS MUTUAL FUNDS, INC. — THE FEEDER FUNDS |
| Expense Example |
| June 30, 2014 (Unaudited) |
Shareholders incur two types of costs: (1) transaction costs, including sales charges (loads) on purchase payments, reinvestments of dividends or other distributions made by a Fund, redemption fees, and exchange fees, and (2), ongoing costs, including management fees, distribution and/or service (12b-1) fees, and other Fund expenses. This example is intended to help investors understand the ongoing costs (in dollars) of investing in a series of Kinetics Mutual Funds, Inc. (each a “Feeder Fund” and collectively the “Feeder Funds”), and to compare these costs with the ongoing costs of investing in other mutual funds. The example is based on an investment of $1,000 invested on January 1, 2014 and held for the entire period from January 1, 2014 to June 30, 2014.
Actual Expenses
The first line and second line items of the table below provide information about actual account values and actual expenses before and after expense reimbursement. Unlike other mutual funds that directly acquire and manage their own portfolio securities, each Feeder Fund invests all or generally all of its investable assets in a corresponding series of The Kinetics Portfolios Trust (each, a “Master Portfolio”, and together the “Master Portfolios”), a separately registered investment company. The Master Portfolio, in turn, invests in securities. With this type of organization, expenses can accrue specifically to the Master Portfolio or the Feeder Fund or both. Each Feeder Fund records its proportionate share of the Master Portfolio’s expenses, including directed brokerage credits, on a daily basis. Any expense reductions include Fund-specific expenses as well as the expenses allocated from the Master Portfolio.
The Feeder Funds will charge shareholder fees for outgoing wire transfers, returned checks, and exchanges executed by telephone between a Feeder Fund and any other Feeder Fund. The Feeder Funds’ transfer agent charges a $5.00 transaction fee to shareholder accounts for telephone exchanges between any two Feeder Funds. The Feeder Funds’ transfer agent does not charge a transaction fee for written exchange requests. IRA accounts are assessed a $15.00 annual fee. Finally, as a disincentive to market-timing transactions, the Feeder Funds will assess a 2.00% fee on the redemption or exchange of Fund shares held for less than 30 days. These fees will be paid to the Feeder Funds to help offset transaction costs. The Feeder Funds reserve the right to waive the redemption fee, subject to their sole discretion, in instances deemed not to be disadvantageous to the Feeder Funds or shareholders as described in the Feeder Funds’ prospectus.
| KINETICS MUTUAL FUNDS, INC. — THE FEEDER FUNDS |
Expense Example — (Continued) |
| June 30, 2014 (Unaudited) |
You may use the information provided in the first line, together with the amounts you invested, to estimate the expenses that you paid over the period. Simply divide your account value by $1,000 (for example, an $8,600 account value divided by $1,000 = 8.6), then multiply the result by the number in the first line under the heading entitled “Expenses Paid During Period” to estimate the expenses you paid on your account during this period.
Hypothetical Example for Comparison Purposes
The third and fourth line items of the table below provide information about hypothetical account values and hypothetical expenses before and after expense reimbursements based on the Feeder Funds’ actual expense ratios and an assumed rate of return of 5% per year before expenses, which are not the Feeder Funds’ actual returns. The hypothetical account values and expenses may not be used to estimate the actual ending account balance or expenses one paid for the period. You may use this information to compare the ongoing costs of investing in the Feeder Funds and other funds. To do so, compare this 5% hypothetical example with the 5% hypothetical examples that appear in the shareholder reports of the other funds. Please note that the expenses shown in the table are meant to highlight one’s ongoing costs only and do not reflect any transactional costs, such as sales charges (loads), redemption fees, or exchange fees. Therefore, the second line of the table is useful in comparing ongoing costs only, and will not help one determine the relative total costs of owning different funds. If these transactional costs had been included, one’s costs would have been higher.
| KINETICS MUTUAL FUNDS, INC. — THE FEEDER FUNDS |
Expense Example — (Continued) |
| June 30, 2014 (Unaudited) |
| | | | | | | | | | | | | |
| | | | | | | | | | | | Expenses Paid | |
| | | Beginning | | | Ending | | | | | | During | |
| | | Account | | | Account | | | Annualized | | | Period* | |
| | | Value | | | Value | | | Expense | | | (1/1/14 to | |
| | | ( 1/1/14) | | | ( 6/30/14) | | | Ratio | | | 6/30/14) | |
| The Internet Fund | | | | | | | | | | | | |
| No Load Class Actual | | $ | 1,000.00 | | | $ | 976.20 | | | | 1.78 | % | | $ | 8.72 | |
| No Load Class Hypothetical (5% return | | | | | | | | | | | | | | | | |
| before expenses) | | $ | 1,000.00 | | | $ | 1,015.97 | | | | 1.78 | % | | $ | 8.90 | |
| Advisor Class A Actual | | $ | 1,000.00 | | | $ | 975.10 | | | | 2.03 | % | | $ | 9.94 | |
| Advisor Class A Hypothetical (5% return | | | | | | | | | | | | | | | | |
| before expenses) | | $ | 1,000.00 | | | $ | 1,014.73 | | | | 2.03 | % | | $ | 10.14 | |
| Advisor Class C Actual | | $ | 1,000.00 | | | $ | 972.60 | | | | 2.53 | % | | $ | 12.37 | |
| Advisor Class C Hypothetical (5% return | | | | | | | | | | | | | | | | |
| before expenses) | | $ | 1,000.00 | | | $ | 1,012.25 | | | | 2.53 | % | | $ | 12.62 | |
| | | | | | | | | | | | | | | | | |
| The Global Fund | | | | | | | | | | | | | | | | |
| No Load Class Actual — after | | | | | | | | | | | | | | | | |
| expense reimbursement | | $ | 1,000.00 | | | $ | 1,028.10 | | | | 1.39 | % | | $ | 6.99 | |
| No Load Class Hypothetical (5% return | | | | | | | | | | | | | | | | |
| before expenses) — after | | | | | | | | | | | | | | | | |
| expense reimbursement | | $ | 1,000.00 | | | $ | 1,017.91 | | | | 1.39 | % | | $ | 6.95 | |
| Advisor Class A Actual — after | | | | | | | | | | | | | | | | |
| expense reimbursement | | $ | 1,000.00 | | | $ | 1,028.20 | | | | 1.64 | % | | $ | 8.25 | |
| Advisor Class A Hypothetical (5% return | | | | | | | | | | | | | | | | |
| before expenses) — after | | | | | | | | | | | | | | | | |
| expense reimbursement | | $ | 1,000.00 | | | $ | 1,016.67 | | | | 1.64 | % | | $ | 8.20 | |
| Advisor Class C Actual — after | | | | | | | | | | | | | | | | |
| expense reimbursement | | $ | 1,000.00 | | | $ | 1,023.70 | | | | 2.14 | % | | $ | 10.74 | |
| Advisor Class C Hypothetical (5% return | | | | | | | | | | | | | | | | |
| before expenses) — after | | | | | | | | | | | | | | | | |
| expense reimbursement | | $ | 1,000.00 | | | $ | 1,014.19 | | | | 2.14 | % | | $ | 10.69 | |
| KINETICS MUTUAL FUNDS, INC. — THE FEEDER FUNDS |
Expense Example — (Continued) |
| June 30, 2014 (Unaudited) |
| | | | | | | | | | | | Expenses Paid | |
| | | Beginning | | | Ending | | | | | | During | |
| | | Account | | | Account | | | Annualized | | | Period* | |
| | | Value | | | Value | | | Expense | | | (1/1/14 to | |
| | | ( 1/1/14) | | | ( 6/30/14) | | | Ratio | | | 6/30/14) | |
| The Paradigm Fund | | | | | | | | | | | | |
| No Load Class Actual — after | | | | | | | | | | | | |
| expense reimbursement | | $ | 1,000.00 | | | $ | 1,046.60 | | | | 1.64 | % | | $ | 8.32 | |
| No Load Class Hypothetical (5% return | | | | | | | | | | | | | | | | |
| before expenses) — after | | | | | | | | | | | | | | | | |
| expense reimbursement | | $ | 1,000.00 | | | $ | 1,016.67 | | | | 1.64 | % | | $ | 8.20 | |
| Advisor Class A Actual — after | | | | | | | | | | | | | | | | |
| expense reimbursement | | $ | 1,000.00 | | | $ | 1,045.30 | | | | 1.89 | % | | $ | 9.58 | |
| Advisor Class A Hypothetical (5% return | | | | | | | | | | | | | | | | |
| before expenses) — after | | | | | | | | | | | | | | | | |
| expense reimbursement | | $ | 1,000.00 | | | $ | 1,015.43 | | | | 1.89 | % | | $ | 9.44 | |
| Advisor Class C Actual — after | | | | | | | | | | | | | | | | |
| expense reimbursement | | $ | 1,000.00 | | | $ | 1,042.90 | | | | 2.39 | % | | $ | 12.11 | |
| Advisor Class C Hypothetical (5% return | | | | | | | | | | | | | | | | |
| before expenses) — after | | | | | | | | | | | | | | | | |
| expense reimbursement | | $ | 1,000.00 | | | $ | 1,012.95 | | | | 2.39 | % | | $ | 11.93 | |
| Institutional Class Actual — after | | | | | | | | | | | | | | | | |
| expense reimbursement | | $ | 1,000.00 | | | $ | 1,047.50 | | | | 1.44 | % | | $ | 7.31 | |
| Institutional Class Hypothetical (5% return | | | | | | | | | | | | | | | | |
| before expenses) — after | | | | | | | | | | | | | | | | |
| expense reimbursement | | $ | 1,000.00 | | | $ | 1,017.66 | | | | 1.44 | % | | $ | 7.20 | |
| | | | | | | | | | | | | | | | | |
| The Medical Fund | | | | | | | | | | | | | | | | |
| No Load Class Actual — after | | | | | | | | | | | | | | | | |
| expense reimbursement | | $ | 1,000.00 | | | $ | 1,096.70 | | | | 1.39 | % | | $ | 7.23 | |
| No Load Class Hypothetical (5% return | | | | | | | | | | | | | | | | |
| before expenses) — after | | | | | | | | | | | | | | | | |
| expense reimbursement | | $ | 1,000.00 | | | $ | 1,017.91 | | | | 1.39 | % | | $ | 6.95 | |
| Advisor Class A Actual — after | | | | | | | | | | | | | | | | |
| expense reimbursement | | $ | 1,000.00 | | | $ | 1,095.20 | | | | 1.64 | % | | $ | 8.52 | |
| Advisor Class A Hypothetical (5% return | | | | | | | | | | | | | | | | |
| before expenses) — after | | | | | | | | | | | | | | | | |
| expense reimbursement | | $ | 1,000.00 | | | $ | 1,016.67 | | | | 1.64 | % | | $ | 8.20 | |
| Advisor Class C Actual — after | | | | | | | | | | | | | | | | |
| expense reimbursement | | $ | 1,000.00 | | | $ | 1,092.20 | | | | 2.14 | % | | $ | 11.10 | |
| Advisor Class C Hypothetical (5% return | | | | | | | | | | | | | | | | |
| before expenses) — after | | | | | | | | | | | | | | | | |
| expense reimbursement | | $ | 1,000.00 | | | $ | 1,014.19 | | | | 2.14 | % | | $ | 10.69 | |
| KINETICS MUTUAL FUNDS, INC. — THE FEEDER FUNDS |
Expense Example — (Continued) |
| June 30, 2014 (Unaudited) |
| | | | | | | | | | | | Expenses Paid | |
| | | Beginning | | | Ending | | | | | | During | |
| | | Account | | | Account | | | Annualized | | | Period* | |
| | | Value | | | Value | | | Expense | | | (1/1/14 to | |
| | | ( 1/1/14) | | | ( 6/30/14) | | | Ratio | | | 6/30/14) | |
| The Small Cap Opportunities Fund | | | | | | | | | | | | |
| No Load Class Actual — after | | | | | | | | | | | | |
| expense reimbursement | | $ | 1,000.00 | | | $ | 1,038.10 | | | | 1.64 | % | | $ | 8.29 | |
| No Load Class Hypothetical (5% return | | | | | | | | | | | | | | | | |
| before expenses) — after | | | | | | | | | | | | | | | | |
| expense reimbursement | | $ | 1,000.00 | | | $ | 1,016.67 | | | | 1.64 | % | | $ | 8.20 | |
| Advisor Class A Actual — after | | | | | | | | | | | | | | | | |
| expense reimbursement | | $ | 1,000.00 | | | $ | 1,036.60 | | | | 1.89 | % | | $ | 9.54 | |
| Advisor Class A Hypothetical (5% return | | | | | | | | | | | | | | | | |
| before expenses) — after | | | | | | | | | | | | | | | | |
| expense reimbursement | | $ | 1,000.00 | | | $ | 1,015.43 | | | | 1.89 | % | | $ | 9.44 | |
| Advisor Class C Actual — after | | | | | | | | | | | | | | | | |
| expense reimbursement | | $ | 1,000.00 | | | $ | 1,034.50 | | | | 2.39 | % | | $ | 12.06 | |
| Advisor Class C Hypothetical (5% return | | | | | | | | | | | | | | | | |
| before expenses) — after | | | | | | | | | | | | | | | | |
| expense reimbursement | | $ | 1,000.00 | | | $ | 1,012.95 | | | | 2.39 | % | | $ | 11.93 | |
| Institutional Class Actual — after | | | | | | | | | | | | | | | | |
| expense reimbursement | | $ | 1,000.00 | | | $ | 1,038.80 | | | | 1.44 | % | | $ | 7.28 | |
| Institutional Class Hypothetical (5% return | | | | | | | | | | | | | | | | |
| before expenses) — after | | | | | | | | | | | | | | | | |
| expense reimbursement | | $ | 1,000.00 | | | $ | 1,017.66 | | | | 1.44 | % | | $ | 7.20 | |
| | | | | | | | | | | | | | | | | |
| The Market Opportunities Fund | | | | | | | | | | | | | | | | |
| No Load Class Actual — after | | | | | | | | | | | | | | | | |
| expense reimbursement | | $ | 1,000.00 | | | $ | 1,005.10 | | | | 1.64 | % | | $ | 8.15 | |
| No Load Class Hypothetical (5% return | | | | | | | | | | | | | | | | |
| before expenses) — after | | | | | | | | | | | | | | | | |
| expense reimbursement | | $ | 1,000.00 | | | $ | 1,016.67 | | | | 1.64 | % | | $ | 8.20 | |
| Advisor Class A Actual — after | | | | | | | | | | | | | | | | |
| expense reimbursement | | $ | 1,000.00 | | | $ | 1,004.00 | | | | 1.89 | % | | $ | 9.39 | |
| Advisor Class A Hypothetical (5% return | | | | | | | | | | | | | | | | |
| before expenses) — after | | | | | | | | | | | | | | | | |
| expense reimbursement | | $ | 1,000.00 | | | $ | 1,015.43 | | | | 1.89 | % | | $ | 9.44 | |
| Advisor Class C Actual — after | | | | | | | | | | | | | | | | |
| expense reimbursement | | $ | 1,000.00 | | | $ | 1,001.20 | | | | 2.39 | % | | $ | 11.86 | |
| Advisor Class C Hypothetical (5% return | | | | | | | | | | | | | | | | |
| before expenses) — after | | | | | | | | | | | | | | | | |
| expense reimbursement | | $ | 1,000.00 | | | $ | 1,012.95 | | | | 2.39 | % | | $ | 11.93 | |
| Institutional Class Actual — after | | | | | | | | | | | | | | | | |
| expense reimbursement | | $ | 1,000.00 | | | $ | 1,006.20 | | | | 1.44 | % | | $ | 7.16 | |
| Institutional Class Hypothetical (5% return | | | | | | | | | | | | | | | | |
| before expenses) — after | | | | | | | | | | | | | | | | |
| expense reimbursement | | $ | 1,000.00 | | | $ | 1,017.66 | | | | 1.44 | % | | $ | 7.20 | |
| KINETICS MUTUAL FUNDS, INC. — THE FEEDER FUNDS |
Expense Example — (Continued) |
| June 30, 2014 (Unaudited) |
| | | | | | | | | | | | Expenses Paid | |
| | | Beginning | | | Ending | | | | | | During | |
| | | Account | | | Account | | | Annualized | | | Period* | |
| | | Value | | | Value | | | Expense | | | (1/1/14 to | |
| | | ( 1/1/14) | | | ( 6/30/14) | | | Ratio | | | 6/30/14) | |
| The Alternative Income Fund | | | | | | | | | | | | |
| No Load Class Actual — after | | | | | | | | | | | | |
| expense reimbursement | | $ | 1,000.00 | | | $ | 1,026.70 | | | | 0.95 | % | | $ | 4.77 | |
| No Load Class Hypothetical (5% return | | | | | | | | | | | | | | | | |
| before expenses) — after | | | | | | | | | | | | | | | | |
| expense reimbursement | | $ | 1,000.00 | | | $ | 1,020.09 | | | | 0.95 | % | | $ | 4.76 | |
| Advisor Class A Actual — after | | | | | | | | | | | | | | | | |
| expense reimbursement | | $ | 1,000.00 | | | $ | 1,025.50 | | | | 1.20 | % | | $ | 6.03 | |
| Advisor Class A Hypothetical (5% return | | | | | | | | | | | | | | | | |
| before expenses) — after | | | | | | | | | | | | | | | | |
| expense reimbursement | | $ | 1,000.00 | | | $ | 1,018.85 | | | | 1.20 | % | | $ | 6.01 | |
| Advisor Class C Actual — after | | | | | | | | | | | | | | | | |
| expense reimbursement | | $ | 1,000.00 | | | $ | 1,022.80 | | | | 1.70 | % | | $ | 8.53 | |
| Advisor Class C Hypothetical (5% return | | | | | | | | | | | | | | | | |
| before expenses) — after | | | | | | | | | | | | | | | | |
| expense reimbursement | | $ | 1,000.00 | | | $ | 1,016.37 | | | | 1.70 | % | | $ | 8.50 | |
| Institutional Class Actual — after | | | | | | | | | | | | | | | | |
| expense reimbursement | | $ | 1,000.00 | | | $ | 1,027.60 | | | | 0.75 | % | | $ | 3.77 | |
| Institutional Class Hypothetical (5% return | | | | | | | | | | | | | | | | |
| before expenses) — after | | | | | | | | | | | | | | | | |
| expense reimbursement | | $ | 1,000.00 | | | $ | 1,021.08 | | | | 0.75 | % | | $ | 3.76 | |
| KINETICS MUTUAL FUNDS, INC. — THE FEEDER FUNDS |
Expense Example — (Continued) |
| June 30, 2014 (Unaudited) |
| | | | | | | | | | | | Expenses Paid | |
| | | Beginning | | | Ending | | | | | | During | |
| | | Account | | | Account | | | Annualized | | | Period* | |
| | | Value | | | Value | | | Expense | | | (1/1/14 to | |
| | | ( 1/1/14) | | | ( 6/30/14) | | | Ratio | | | 6/30/14) | |
| The Multi-Disciplinary Fund | | | | | | | | | | | | |
| No Load Class Actual — after | | | | | | | | | | | | |
| expense reimbursement | | $ | 1,000.00 | | | $ | 1,049.00 | | | | 1.49 | % | | $ | 7.57 | |
| No Load Class Hypothetical (5% return | | | | | | | | | | | | | | | | |
| before expenses) — after | | | | | | | | | | | | | | | | |
| expense reimbursement | | $ | 1,000.00 | | | $ | 1,017.41 | | | | 1.49 | % | | $ | 7.45 | |
| Advisor Class A Actual — after | | | | | | | | | | | | | | | | |
| expense reimbursement | | $ | 1,000.00 | | | $ | 1,047.60 | | | | 1.74 | % | | $ | 8.83 | |
| Advisor Class A Hypothetical (5% return | | | | | | | | | | | | | | | | |
| before expenses) — after | | | | | | | | | | | | | | | | |
| expense reimbursement | | $ | 1,000.00 | | | $ | 1,016.17 | | | | 1.74 | % | | $ | 8.70 | |
| Advisor Class C Actual — after | | | | | | | | | | | | | | | | |
| expense reimbursement | | $ | 1,000.00 | | | $ | 1,044.40 | | | | 2.24 | % | | $ | 11.35 | |
| Advisor Class C Hypothetical (5% return | | | | | | | | | | | | | | | | |
| before expenses) — after | | | | | | | | | | | | | | | | |
| expense reimbursement | | $ | 1,000.00 | | | $ | 1,013.69 | | | | 2.24 | % | | $ | 11.18 | |
| Institutional Class Actual — after | | | | | | | | | | | | | | | | |
| expense reimbursement | | $ | 1,000.00 | | | $ | 1,049.80 | | | | 1.29 | % | | $ | 6.56 | |
| Institutional Class Hypothetical (5% return | | | | | | | | | | | | | | | | |
| before expenses) — after | | | | | | | | | | | | | | | | |
| expense reimbursement | | $ | 1,000.00 | | | $ | 1,018.40 | | | | 1.29 | % | | $ | 6.46 | |
| | |
| Note: | Each Feeder Fund records its proportionate share of the respective Master Portfolio’s expenses on a daily basis. Any expense reductions include Feeder Fund-specific expenses as well as the expenses allocated for the Master Portfolio. |
| * | Expenses are equal to the Feeder Fund’s annualized expense ratio before expense reimbursement and after expense reimbursement multiplied by the average account value over the period, multiplied by 181/365. |
| KINETICS MUTUAL FUNDS, INC. — THE FEEDER FUNDS |
| Statements of Assets & Liabilities |
| June 30, 2014 (Unaudited) |
| | | The Internet | | | The Global | |
| | | Fund | | | Fund | |
| ASSETS: | | | | | | |
| Investments in the Master Portfolio, at value* | | $ | 168,029,880 | | | $ | 10,866,875 | |
| Receivable from Adviser | | | – | | | | 8,855 | |
| Receivable for Master Portfolio interest sold | | | 98,704 | | | | – | |
| Receivable for Fund shares sold | | | 32,052 | | | | 25,392 | |
| Prepaid expenses and other assets | | | 30,604 | | | | 26,222 | |
| Total Assets | | | 168,191,240 | | | | 10,927,344 | |
| LIABILITIES: | | | | | | | | |
| Payable for Master Portfolio interest purchased | | | – | | | | 25,392 | |
| Payable to Directors and Officers | | | 3,255 | | | | 223 | |
| Payable for Fund shares repurchased | | | 130,756 | | | | – | |
| Payable for shareholder servicing fees | | | 34,175 | | | | 2,305 | |
| Payable for distribution fees | | | 2,951 | | | | 1,473 | |
| Accrued expenses and other liabilities | | | 60,315 | | | | 12,386 | |
| Total Liabilities | | | 231,452 | | | | 41,779 | |
| Net Assets | | $ | 167,959,788 | | | $ | 10,885,565 | |
| NET ASSETS CONSIST OF: | | | | | | | | |
| Paid in capital | | $ | 76,539,620 | | | $ | 8,201,936 | |
| Accumulated net investment loss | | | (1,010,754 | ) | | | (56,355 | ) |
| Accumulated net realized gain (loss) on investments and | | | | | | | | |
| foreign currency | | | 7,595,083 | | | | (139,820 | ) |
| Net unrealized appreciation on: | | | | | | | | |
| Investments and foreign currency | | | 84,835,839 | | | | 2,879,804 | |
| Net Assets | | $ | 167,959,788 | | | $ | 10,885,565 | |
| CALCULATION OF NET ASSET VALUE PER SHARE — NO LOAD CLASS: | | | | | | | | |
| Net Assets | | $ | 161,688,339 | | | $ | 8,129,887 | |
| Shares outstanding | | | 2,794,367 | | | | 1,306,983 | |
| Net asset value per share (offering price and redemption price) | | $ | 57.86 | | | $ | 6.22 | |
| CALCULATION OF NET ASSET VALUE PER SHARE — ADVISOR CLASS A: | | | | | | | | |
| Net Assets | | $ | 5,117,155 | | | $ | 1,033,626 | |
| Shares outstanding | | | 90,728 | | | | 166,712 | |
| Net asset value per share (redemption price) | | $ | 56.40 | | | $ | 6.20 | |
| Offering price per share ($56.40 divided by .9425 and $6.20 | | | | | | | | |
| divided by .9425) | | $ | 59.84 | | | $ | 6.58 | |
| CALCULATION OF NET ASSET VALUE PER SHARE — ADVISOR CLASS C: | | | | | | | | |
| Net Assets | | $ | 1,154,294 | | | $ | 1,722,052 | |
| Shares outstanding | | | 21,430 | | | | 285,276 | |
| Net asset value per share (offering price and redemption price) | | $ | 53.86 | | | $ | 6.04 | |
| | |
| * | Each Feeder Fund invests all or generally all its assets directly in the corresponding Master Portfolio. The financial statements for the Master Portfolios, along with the portfolio of investments in securities, are contained elsewhere in this report and should be read in conjunction with the Feeder Funds’ financial statements. |
The accompanying notes are an integral part of these financial statements.
| KINETICS MUTUAL FUNDS, INC. — THE FEEDER FUNDS |
Statements of Assets & Liabilities — (Continued) |
| June 30, 2014 (Unaudited) |
| | | The Paradigm | | | The Medical | |
| | | Fund | | | Fund | |
| ASSETS: | | | | | | |
| Investments in the Master Portfolio, at value* | | $ | 1,306,563,813 | | | $ | 26,837,141 | |
| Receivable from Adviser | | | 75,744 | | | | 14,610 | |
| Receivable for Fund shares sold | | | 1,295,433 | | | | 69,419 | |
| Prepaid expenses and other assets | | | 83,978 | | | | 21,832 | |
| Total Assets | | | 1,308,018,968 | | | | 26,943,002 | |
| LIABILITIES: | | | | | | | | |
| Payable for Master Portfolio interest purchased | | | 236,819 | | | | 48,581 | |
| Payable to Directors and Officers | | | 23,536 | | | | 504 | |
| Payable for Fund shares repurchased | | | 1,058,614 | | | | 20,838 | |
| Payable for shareholder servicing fees | | | 211,062 | | | | 5,426 | |
| Payable for distribution fees | | | 319,393 | | | | 3,405 | |
| Accrued expenses and other liabilities | | | 233,580 | | | | 15,217 | |
| Total Liabilities | | | 2,083,004 | | | | 93,971 | |
| Net Assets | | $ | 1,305,935,964 | | | $ | 26,849,031 | |
| NET ASSETS CONSIST OF: | | | | | | | | |
| Paid in capital | | $ | 1,612,768,928 | | | $ | 17,466,430 | |
| Accumulated net investment loss | | | (16,285,540 | ) | | | 80,924 | |
| Accumulated net realized loss on investments and foreign currency | | | (775,545,217 | ) | | | (284,557 | ) |
| Net unrealized appreciation on: | | | | | | | | |
| Investments and foreign currency | | | 484,997,793 | | | | 9,586,234 | |
| Net Assets | | $ | 1,305,935,964 | | | $ | 26,849,031 | |
| CALCULATION OF NET ASSET VALUE PER SHARE — NO LOAD CLASS: | | | | | | | | |
| Net Assets | | $ | 604,911,792 | | | $ | 21,637,389 | |
| Shares outstanding | | | 16,825,180 | | | | 747,947 | |
| Net asset value per share (offering price and redemption price) | | $ | 35.95 | | | $ | 28.93 | |
| CALCULATION OF NET ASSET VALUE PER SHARE — ADVISOR CLASS A: | | | | | | | | |
| Net Assets | | $ | 224,422,943 | | | $ | 4,608,688 | |
| Shares outstanding | | | 6,362,867 | | | | 164,251 | |
| Net asset value per share (redemption price) | | $ | 35.27 | | | $ | 28.06 | |
| Offering price per share ($35.27 divided by .9425 and $28.06 | | | | | | | | |
| divided by .9425) | | $ | 37.42 | | | $ | 29.77 | |
| CALCULATION OF NET ASSET VALUE PER SHARE — ADVISOR CLASS C: | | | | | | | | |
| Net Assets | | $ | 145,389,323 | | | $ | 602,954 | |
| Shares outstanding | | | 4,305,709 | | | | 21,844 | |
| Net asset value per share (offering price and redemption price) | | $ | 33.77 | | | $ | 27.60 | |
| CALCULATION OF NET ASSET VALUE PER SHARE — INSTITUTIONAL CLASS: | | | | | | | | |
| Net Assets | | $ | 331,211,906 | | | | N/A | |
| Shares outstanding | | | 9,219,825 | | | | N/A | |
| Net asset value per share (offering price and redemption price) | | $ | 35.92 | | | | N/A | |
| | |
| * | Each Feeder Fund invests all or generally all its assets directly in the corresponding Master Portfolio. The financial statements for the Master Portfolios, along with the portfolio of investments in securities, are contained elsewhere in this report and should be read in conjunction with the Feeder Funds’ financial statements. |
The accompanying notes are an integral part of these financial statements.
| KINETICS MUTUAL FUNDS, INC. — THE FEEDER FUNDS |
Statements of Assets & Liabilities — (Continued) |
| June 30, 2014 (Unaudited) |
| | | The Small Cap | | | The Market | |
| | | Opportunities | | | Opportunities | |
| | | Fund | | | Fund | |
| ASSETS: | | | | | | |
| Investments in the Master Portfolio, at value* | | $ | 425,887,728 | | | $ | 63,526,697 | |
| Receivable from Adviser | | | 65,112 | | | | 9,870 | |
| Receivable for Master Portfolio interest sold | | | – | | | | 107,247 | |
| Receivable for Fund shares sold | | | 2,930,127 | | | | 791 | |
| Prepaid expenses and other assets | | | 76,969 | | | | 38,403 | |
| Total Assets | | | 428,959,936 | | | | 63,683,008 | |
| LIABILITIES: | | | | | | | | |
| Payable for Master Portfolio interest purchased | | | 1,958,839 | | | | — | |
| Payable to Directors and Officers | | | 7,134 | | | | 1,243 | |
| Payable for Fund shares repurchased | | | 971,288 | | | | 108,037 | |
| Payable for shareholder servicing fees | | | 80,029 | | | | 12,683 | |
| Payable for distribution fees | | | 29,470 | | | | 12,862 | |
| Accrued expenses and other liabilities | | | 69,210 | | | | 19,505 | |
| Total Liabilities | | | 3,115,970 | | | | 154,330 | |
| Net Assets | | $ | 425,843,966 | | | $ | 63,528,678 | |
| NET ASSETS CONSIST OF: | | | | | | | | |
| Paid in capital | | $ | 487,393,366 | | | $ | 69,889,208 | |
| Accumulated net investment loss | | | (3,500,730 | ) | | | (770,405 | ) |
| Accumulated net realized loss on investments and foreign currency | | | (149,796,891 | ) | | | (22,508,804 | ) |
| Net unrealized appreciation on: | | | | | | | | |
| Investments and foreign currency | | | 91,748,221 | | | | 16,918,679 | |
| Net Assets | | $ | 425,843,966 | | | $ | 63,528,678 | |
| CALCULATION OF NET ASSET VALUE PER SHARE — NO LOAD CLASS: | | | | | | | | |
| Net Assets | | $ | 334,650,873 | | | $ | 44,956,755 | |
| Shares outstanding | | | 8,035,288 | | | | 2,532,891 | |
| Net asset value per share (offering price and redemption price) | | $ | 41.65 | | | $ | 17.75 | |
| CALCULATION OF NET ASSET VALUE PER SHARE — ADVISOR CLASS A: | | | | | | | | |
| Net Assets | | $ | 37,474,682 | | | $ | 10,744,376 | |
| Shares outstanding | | | 917,721 | | | | 607,909 | |
| Net asset value per share (redemption price) | | $ | 40.83 | | | $ | 17.67 | |
| Offering price per share ($40.83 divided by .9425 and $17.67 | | | | | | | | |
| divided by .9425) | | $ | 43.32 | | | $ | 18.75 | |
| CALCULATION OF NET ASSET VALUE PER SHARE — ADVISOR CLASS C: | | | | | | | | |
| Net Assets | | $ | 13,531,363 | | | $ | 5,817,504 | |
| Shares outstanding | | | 339,514 | | | | 335,482 | |
| Net asset value per share (offering price and redemption price) | | $ | 39.86 | | | $ | 17.34 | |
| CALCULATION OF NET ASSET VALUE PER SHARE — INSTITUTIONAL CLASS: | | | | | | | | |
| Net Assets | | $ | 40,187,048 | | | $ | 2,010,043 | |
| Shares outstanding | | | 956,509 | | | | 112,596 | |
| Net asset value per share (offering price and redemption price) | | $ | 42.01 | | | $ | 17.85 | |
| | |
| * | Each Feeder Fund invests all or generally all its assets directly in the corresponding Master Portfolio. The financial statements for the Master Portfolios, along with the portfolio of investments in securities, are contained elsewhere in this report and should be read in conjunction with the Feeder Funds’ financial statements. |
The accompanying notes are an integral part of these financial statements.
| KINETICS MUTUAL FUNDS, INC. — THE FEEDER FUNDS |
Statements of Assets & Liabilities — (Continued) |
| June 30, 2014 (Unaudited) |
| | | The Alternative | | | The Multi- | |
| | | Income | | | Disciplinary | |
| | | Fund | | | Fund | |
| ASSETS: | | | | | | |
| Investments in the Master Portfolio, at value* | | $ | 29,828,062 | | | $ | 112,736,399 | |
| Receivable from Adviser | | | 23,773 | | | | 35,347 | |
| Receivable for Master Portfolio interest sold | | | 105,861 | | | | – | |
| Receivable for Fund shares sold | | | 757 | | | | 615,183 | |
| Prepaid expenses and other assets | | | 37,718 | | | | 39,544 | |
| Total Assets | | | 29,996,171 | | | | 113,426,473 | |
| LIABILITIES: | | | | | | | | |
| Payable for Master Portfolio interest purchased | | | – | | | | 549,771 | |
| Payable to Directors and Officers | | | 481 | | | | 1,900 | |
| Payable for Fund shares repurchased | | | 106,618 | | | | 65,412 | |
| Payable for shareholder servicing fees | | | 4,331 | | | | 14,115 | |
| Payable for distribution fees | | | 5,671 | | | | 20,819 | |
| Accrued expenses and other liabilities | | | 13,491 | | | | 26,511 | |
| Total Liabilities | | | 130,592 | | | | 678,528 | |
| Net Assets | | $ | 29,865,579 | | | $ | 112,747,945 | |
| NET ASSETS CONSIST OF: | | | | | | | | |
| Paid in capital | | $ | 36,678,013 | | | $ | 108,439,565 | |
| Accumulated net investment loss | | | (27,646 | ) | | | (870,062 | ) |
| Accumulated net realized gain (loss) on investments, | | | | | | | | |
| foreign currency and written options contracts | | | (7,713,317 | ) | | | 1,277,116 | |
| Net unrealized appreciation on: | | | | | | | | |
| Investments and foreign currency | | | 50,458 | | | | 2,260,402 | |
| Written option contracts | | | 878,071 | | | | 1,640,924 | |
| Net Assets | | $ | 29,865,579 | | | $ | 112,747,945 | |
| CALCULATION OF NET ASSET VALUE PER SHARE — NO LOAD CLASS: | | | | | | | | |
| Net Assets | | $ | 13,655,334 | | | $ | 20,359,537 | |
| Shares outstanding | | | 151,581 | | | | 1,783,752 | |
| Net asset value per share (offering price and redemption price) | | $ | 90.09 | | | $ | 11.41 | |
| CALCULATION OF NET ASSET VALUE PER SHARE — ADVISOR CLASS A: | | | | | | | | |
| Net Assets | | $ | 4,680,922 | | | $ | 25,442,309 | |
| Shares outstanding | | | 52,111 | | | | 2,238,185 | |
| Net asset value per share (redemption price) | | $ | 89.83 | | | $ | 11.37 | |
| Offering price per share ($89.83 divided by .9425 and $11.37 | | | | | | | | |
| divided by .9425) | | $ | 95.31 | | | $ | 12.06 | |
| CALCULATION OF NET ASSET VALUE PER SHARE — ADVISOR CLASS C: | | | | | | | | |
| Net Assets | | $ | 1,329,968 | | | $ | 11,867,509 | |
| Shares outstanding | | | 15,126 | | | | 1,052,656 | |
| Net asset value per share (offering price and redemption price) | | $ | 87.93 | | | $ | 11.27 | |
| CALCULATION OF NET ASSET VALUE PER SHARE — INSTITUTIONAL CLASS: | | | | | | | | |
| Net Assets | | $ | 10,199,355 | | | $ | 55,078,590 | |
| Shares outstanding | | | 111,979 | | | | 4,810,559 | |
| Net asset value per share (offering price and redemption price) | | $ | 91.08 | | | $ | 11.45 | |
| | |
| * | Each Feeder Fund invests all or generally all its assets directly in the corresponding Master Portfolio. The financial statements for the Master Portfolios, along with the portfolio of investments in securities, are contained elsewhere in this report and should be read in conjunction with the Feeder Funds’ financial statements. |
The accompanying notes are an integral part of these financial statements.
| KINETICS MUTUAL FUNDS, INC. — THE FEEDER FUNDS |
| Statements of Operations |
| For the Six Months Ended June 30, 2014 (Unaudited) |
| | | The Internet | | | The Global | |
| | | Fund | | | Fund | |
| INVESTMENT LOSS ALLOCATED FROM MASTER PORTFOLIOS: | | | | | | |
| Dividends† | | $ | 379,706 | | | $ | 37,505 | |
| Interest | | | 571 | | | | 58 | |
| Income from securities lending | | | 15,099 | | | | 22,967 | |
| Expenses allocated from Master Portfolio | | | (1,125,816 | ) | | | (89,184 | ) |
| Net investment loss from Master Portfolio | | | (730,440 | ) | | | (28,654 | ) |
| EXPENSES: | | | | | | | | |
| Distribution fees — Advisor Class A | | | 6,650 | | | | 2,291 | |
| Distribution fees — Advisor Class C | | | 4,078 | | | | 5,822 | |
| Shareholder servicing fees — Advisor Class A | | | 6,650 | | | | 2,291 | |
| Shareholder servicing fees — Advisor Class C | | | 1,360 | | | | 1,941 | |
| Shareholder servicing fees — No Load Class | | | 203,718 | | | | 10,182 | |
| Transfer agent fees and expenses | | | 74,276 | | | | 10,286 | |
| Reports to shareholders | | | 19,544 | | | | 1,810 | |
| Administration fees | | | 28,426 | | | | 2,750 | |
| Professional fees | | | 8,285 | | | | 4,223 | |
| Directors’ and Officers’ fees and expenses | | | 3,331 | | | | 323 | |
| Registration fees | | | 23,277 | | | | 21,442 | |
| Fund accounting fees | | | 4,278 | | | | 332 | |
| Other expenses | | | 4,538 | | | | 228 | |
| Total expenses | | | 388,411 | | | | 63,921 | |
| Less, expense reimbursement | | | — | | | | (64,866 | ) |
| Net expenses | | | 388,411 | | | | (945 | ) |
| Net investment loss | | | (1,118,851 | ) | | | (27,709 | ) |
| REALIZED AND UNREALIZED GAIN (LOSS) ON INVESTMENTS | | | | | | | | |
| ALLOCATED FROM MASTER PORTFOLIOS: | | | | | | | | |
| Net realized gain on: | | | | | | | | |
| Investments and foreign currency | | | 2,584,251 | | | | 256,805 | |
| Net change in unrealized appreciation (depreciation) of: | | | | | | | | |
| Investments and foreign currency | | | (6,031,508 | ) | | | 71,658 | |
| Net gain (loss) on investments | | | (3,447,257 | ) | | | 328,463 | |
| Net increase (decrease) in net assets resulting from operations | | $ | (4,566,108 | ) | | $ | 300,754 | |
| † Net of foreign taxes withheld of: | | $ | 1,409 | | | $ | 2,125 | |
The accompanying notes are an integral part of these financial statements.
| KINETICS MUTUAL FUNDS, INC. — THE FEEDER FUNDS |
Statements of Operations — (Continued) |
| For the Six Months Ended June 30, 2014 (Unaudited) |
| | | The Paradigm | | | The Medical | |
| | | Fund | | | Fund | |
| INVESTMENT LOSS ALLOCATED FROM MASTER PORTFOLIOS: | | | | | | |
| Dividends† | | $ | 3,108,566 | | | $ | 279,223 | |
| Interest | | | 7,164 | | | | 148 | |
| Income from securities lending | | | 766,214 | | | | 31,693 | |
| Expenses allocated from Master Portfolio | | | (8,408,041 | ) | | | (185,990 | ) |
| Net investment income (loss) from Master Portfolio | | | (4,526,097 | ) | | | 125,074 | |
| EXPENSES: | | | | | | | | |
| Distribution fees — Advisor Class A | | | 260,880 | | | | 5,840 | |
| Distribution fees — Advisor Class C | | | 520,198 | | | | 2,126 | |
| Shareholder servicing fees — Advisor Class A | | | 260,880 | | | | 5,840 | |
| Shareholder servicing fees — Advisor Class C | | | 173,399 | | | | 709 | |
| Shareholder servicing fees — No Load Class | | | 730,508 | | | | 26,384 | |
| Shareholder servicing fees — Institutional Class | | | 329,346 | | | | – | |
| Transfer agent fees and expenses | | | 155,276 | | | | 13,309 | |
| Reports to shareholders | | | 101,298 | | | | 2,893 | |
| Administration fees | | | 212,903 | | | | 4,315 | |
| Professional fees | | | 39,590 | | | | 4,636 | |
| Directors’ and Officers’ fees and expenses | | | 30,533 | | | | 614 | |
| Registration fees | | | 42,263 | | | | 22,557 | |
| Fund accounting fees | | | 32,764 | | | | 663 | |
| Other expenses | | | 27,436 | | | | 543 | |
| Total expenses | | | 2,917,274 | | | | 90,429 | |
| Less, expense waiver for Institutional Class shareholder | | | | | | | | |
| servicing fees | | | (247,010 | ) | | | — | |
| Less, expense reimbursement | | | (284,895 | ) | | | (85,351 | ) |
| Net expenses | | | 2,385,369 | | | | 5,078 | |
| Net investment loss | | | (6,911,466 | ) | | | 119,996 | |
| REALIZED AND UNREALIZED GAIN ON INVESTMENTS | | | | | | | | |
| ALLOCATED FROM MASTER PORTFOLIOS: | | | | | | | | |
| Net realized gain on: | | | | | | | | |
| Investments and foreign currency | | | 8,519,792 | | | | 124,755 | |
| Net change in unrealized appreciation of: | | | | | | | | |
| Investments and foreign currency | | | 56,445,954 | | | | 2,079,076 | |
| Net gain on investments | | | 64,965,746 | | | | 2,203,831 | |
| Net increase in net assets resulting from operations | | $ | 58,054,280 | | | $ | 2,323,827 | |
| † Net of foreign taxes withheld of: | | $ | 120,715 | | | $ | 24,583 | |
The accompanying notes are an integral part of these financial statements.
| KINETICS MUTUAL FUNDS, INC. — THE FEEDER FUNDS |
Statements of Operations — (Continued) |
| For the Six Months Ended June 30, 2014 (Unaudited) |
| | | The Small Cap | | | The Market | |
| | | Opportunities | | | Opportunities | |
| | | Fund | | | Fund | |
| INVESTMENT LOSS ALLOCATED FROM MASTER PORTFOLIOS: | | | | | | |
| Dividends† | | $ | 1,146,004 | | | $ | 399,647 | |
| Interest | | | 1,926 | | | | 459 | |
| Income from securities lending | | | 242,390 | | | | 34,131 | |
| Expenses allocated from Master Portfolio | | | (2,678,867 | ) | | | (451,978 | ) |
| Net investment loss from Master Portfolio | | | (1,288,547 | ) | | | (17,741 | ) |
| EXPENSES: | | | | | | | | |
| Distribution fees — Advisor Class A | | | 37,670 | | | | 13,530 | |
| Distribution fees — Advisor Class C | | | 40,561 | | | | 21,081 | |
| Shareholder servicing fees — Advisor Class A | | | 37,670 | | | | 13,530 | |
| Shareholder servicing fees — Advisor Class C | | | 13,520 | | | | 7,027 | |
| Shareholder servicing fees — No Load Class | | | 411,135 | | | | 59,011 | |
| Shareholder servicing fees — Institutional Class | | | 32,543 | | | | 1,885 | |
| Transfer agent fees and expenses | | | 48,420 | | | | 14,026 | |
| Reports to shareholders | | | 35,677 | | | | 4,763 | |
| Administration fees | | | 66,124 | | | | 11,592 | |
| Professional fees | | | 16,457 | | | | 5,722 | |
| Directors’ and Officers’ fees and expenses | | | 13,108 | | | | 1,518 | |
| Registration fees | | | 50,072 | | | | 30,042 | |
| Fund accounting fees | | | 10,493 | | | | 1,651 | |
| Other expenses | | | 4,415 | | | | 1,428 | |
| Total expenses | | | 817,865 | | | | 186,806 | |
| Less, expense waiver for Institutional Class shareholder | | | | | | | | |
| servicing fees | | | (24,407 | ) | | | (1,413 | ) |
| Less, expense reimbursement | | | (126,933 | ) | | | (67,217 | ) |
| Net expenses | | | 666,525 | | | | 118,176 | |
| Net investment loss | | | (1,955,072 | ) | | | (135,917 | ) |
| REALIZED AND UNREALIZED GAIN (LOSS) ON INVESTMENTS | | | | | | | | |
| ALLOCATED FROM MASTER PORTFOLIOS: | | | | | | | | |
| Net realized gain on: | | | | | | | | |
| Investments and foreign currency | | | 10,607,039 | | | | 3,363,810 | |
| Net change in unrealized appreciation (depreciation) of: | | | | | | | | |
| Investments and foreign currency | | | 7,797,824 | | | | (3,036,607 | ) |
| Net gain on investments | | | 18,404,863 | | | | 327,203 | |
| Net increase in net assets resulting from operations | | $ | 16,449,791 | | | $ | 191,286 | |
| † Net of foreign taxes withheld of: | | $ | 13,166 | | | $ | 14,446 | |
The accompanying notes are an integral part of these financial statements.
| KINETICS MUTUAL FUNDS, INC. — THE FEEDER FUNDS |
Statements of Operations — (Continued) |
| For the Six Months Ended June 30, 2014 (Unaudited) |
| | | The Alternative | | | The Multi- | |
| | | Income | | | Disciplinary | |
| | | Fund | | | Fund | |
| INVESTMENT INCOME (LOSS) ALLOCATED FROM MASTER PORTFOLIOS: | | | | | | |
| Dividends | | $ | 21,136 | | | $ | 243,960 | |
| Interest | | | 77,674 | | | | 1,577,786 | |
| Income from securities lending | | | 4,035 | | | | 13,269 | |
| Expenses allocated from Master Portfolio | | | (165,392 | ) | | | (702,487 | ) |
| Net investment income (loss) from Master Portfolio | | | (62,547 | ) | | | 1,132,528 | |
| EXPENSES: | | | | | | | | |
| Distribution fees — Advisor Class A | | | 4,094 | | | | 37,906 | |
| Distribution fees — Advisor Class C | | | 6,089 | | | | 41,958 | |
| Shareholder servicing fees — Advisor Class A | | | 4,094 | | | | 37,906 | |
| Shareholder servicing fees — Advisor Class C | | | 2,030 | | | | 13,986 | |
| Shareholder servicing fees — No Load Class | | | 16,230 | | | | 24,786 | |
| Shareholder servicing fees — Institutional Class | | | 9,430 | | | | 41,310 | |
| Transfer agent fees and expenses | | | 11,624 | | | | 15,746 | |
| Reports to shareholders | | | 1,393 | | | | 11,453 | |
| Administration fees | | | 4,434 | | | | 18,877 | |
| Professional fees | | | 4,696 | | | | 6,677 | |
| Directors’ and Officers’ fees and expenses | | | 711 | | | | 2,199 | |
| Registration fees | | | 26,323 | | | | 33,860 | |
| Fund accounting fees | | | 674 | | | | 2,412 | |
| Other expenses | | | 422 | | | | 2,115 | |
| Total expenses | | | 92,244 | | | | 291,191 | |
| Less, expense waiver for Institutional Class shareholder | | | | | | | | |
| servicing fees | | | (7,072 | ) | | | (30,982 | ) |
| Less, expense reimbursement | | | (120,073 | ) | | | (159,381 | ) |
| Net expenses | | | (34,901 | ) | | | 100,828 | |
| Net investment income (loss) | | | (27,646 | ) | | | 1,031,700 | |
| REALIZED AND UNREALIZED GAIN (LOSS) ON INVESTMENTS | | | | | | | | |
| ALLOCATED FROM MASTER PORTFOLIOS: | | | | | | | | |
| Net realized gain (loss) on: | | | | | | | | |
| Investments and foreign currency | | | (46,153 | ) | | | (2,102,757 | ) |
| Written option contracts expired or closed | | | 392,201 | | | | 2,679,330 | |
| Net change in unrealized appreciation (depreciation) of: | | | | | | | | |
| Investments and foreign currency | | | 108,712 | | | | 4,980,924 | |
| Written option contracts | | | 274,450 | | | | (1,685,001 | ) |
| Net gain on investments | | | 729,210 | | | | 3,872,496 | |
| Net increase in net assets resulting from operations | | $ | 701,564 | | | $ | 4,904,196 | |
The accompanying notes are an integral part of these financial statements.
| KINETICS MUTUAL FUNDS, INC. — THE FEEDER FUNDS |
| Statements of Changes in Net Assets |
| | | The Internet Fund | | | The Global Fund | |
| | | For the | | | | | | For the | | | | |
| | | Six Months | | | For the | | | Six Months | | | For the | |
| | | Ended | | | Year Ended | | | Ended | | | Year Ended | |
| | | June 30, 2014 | | | December 31, | | | June 30, 2014 | | | December 31, | |
| | | (Unaudited) | | | 2013 | | | (Unaudited) | | | 2013 | |
| OPERATIONS: | | | | | | | | | | | | |
| Net investment income (loss) | | $ | (1,118,851 | ) | | $ | (2,263,838 | ) | | $ | (27,709 | ) | | $ | 8,809 | |
| Net realized gain on sale of investments | | | | | | | | | | | | | | | | |
| and foreign currency | | | 2,584,251 | | | | 11,540,964 | | | | 256,805 | | | | 66,904 | |
| Net change in unrealized appreciation | | | | | | | | | | | | | | | | |
| (depreciation) of investments and | | | | | | | | | | | | | | | | |
| foreign currency | | | (6,031,508 | ) | | | 52,880,805 | | | | 71,658 | | | | 2,169,965 | |
| Net increase (decrease) in net assets | | | | | | | | | | | | | | | | |
| resulting from operations | | | (4,566,108 | ) | | | 62,157,931 | | | | 300,754 | | | | 2,245,678 | |
| DISTRIBUTIONS TO SHAREHOLDERS — | | | | | | | | | | | | | | | | |
| NO LOAD CLASS: | | | | | | | | | | | | | | | | |
| Net investment income | | | — | | | | — | | | | — | | | | (9,185 | ) |
| Net realized gains | | | — | | | | (8,399,207 | ) | | | — | | | | — | |
| Total distributions | | | — | | | | (8,399,207 | ) | | | — | | | | (9,185 | ) |
| DISTRIBUTIONS TO SHAREHOLDERS — | | | | | | | | | | | | | | | | |
| ADVISOR CLASS A: | | | | | | | | | | | | | | | | |
| Net investment income | | | — | | | | — | | | | — | | | | (2,107 | ) |
| Net realized gains | | | — | | | | (264,840 | ) | | | — | | | | — | |
| Total distributions | | | — | | | | (264,840 | ) | | | — | | | | (2,107 | ) |
| DISTRIBUTIONS TO SHAREHOLDERS — | | | | | | | | | | | | | | | | |
| ADVISOR CLASS C: | | | | | | | | | | | | | | | | |
| Net investment income | | | — | | | | — | | | | — | | | | (1,648 | ) |
| Net realized gains | | | — | | | | (47,335 | ) | | | — | | | | — | |
| Total distributions | | | — | | | | (47,335 | ) | | | — | | | | (1,648 | ) |
| CAPITAL SHARE TRANSACTIONS — | | | | | | | | | | | | | | | | |
| NO LOAD CLASS: | | | | | | | | | | | | | | | | |
| Proceeds from shares sold | | | 11,554,092 | | | | 26,409,652 | | | | 686,008 | | | | 3,089,656 | |
| Redemption fees | | | 13,534 | | | | 4,961 | | | | 53 | | | | 68 | |
| Proceeds from shares issued to holders | | | | | | | | | | | | | | | | |
| in reinvestment of dividends | | | — | | | | 8,096,254 | | | | — | | | | 8,850 | |
| Cost of shares redeemed | | | (17,833,989 | ) | | | (69,661,189 | ) | | | (1,474,229 | ) | | | (1,183,302 | ) |
| Net increase (decrease) in net assets | | | | | | | | | | | | | | | | |
| resulting from capital share | | | | | | | | | | | | | | | | |
| transactions | | | (6,266,363 | ) | | | (35,150,322 | ) | | | (788,168 | ) | | | 1,915,272 | |
| CAPITAL SHARE TRANSACTIONS — | | | | | | | | | | | | | | | | |
| ADVISOR CLASS A: | | | | | | | | | | | | | | | | |
| Proceeds from shares sold | | | 1,820,845 | | | | 4,387,670 | | | | 711,334 | | | | 1,186,661 | |
| Redemption fees | | | 234 | | | | 550 | | | | 1,415 | | | | 40 | |
| Proceeds from shares issued to holders | | | | | | | | | | | | | | | | |
| in reinvestment of dividends | | | — | | | | 221,753 | | | | — | | | | 1,866 | |
| Cost of shares redeemed | | | (2,057,732 | ) | | | (1,362,298 | ) | | | (1,717,697 | ) | | | (576,135 | ) |
| Net increase (decrease) in net assets | | | | | | | | | | | | | | | | |
| resulting from capital share | | | | | | | | | | | | | | | | |
| transactions | | | (236,653 | ) | | | 3,247,675 | | | | (1,004,948 | ) | | | 612,432 | |
The accompanying notes are an integral part of these financial statements.
| KINETICS MUTUAL FUNDS, INC. — THE FEEDER FUNDS |
Statements of Changes in Net Assets — (Continued) |
| | | The Internet Fund | | | The Global Fund | |
| | | For the | | | | | | For the | | | | |
| | | Six Months | | | For the | | | Six Months | | | For the | |
| | | Ended | | | Year Ended | | | Ended | | | Year Ended | |
| | | June 30, 2014 | | | December 31, | | | June 30, 2014 | | | December 31, | |
| | | (Unaudited) | | | 2013 | | | (Unaudited) | | | 2013 | |
| CAPITAL SHARE TRANSACTIONS — | | | | | | | | | | | | |
| ADVISOR CLASS C: | | | | | | | | | | | | |
| Proceeds from shares sold | | $ | 523,123 | | | $ | 604,756 | | | $ | 180,066 | | | $ | 914,460 | |
| Redemption fees | | | — | | | | — | | | | — | | | | — | |
| Proceeds from shares issued to holders | | | | | | | | | | | | | | | | |
| in reinvestment of dividends | | | — | | | | 35,987 | | | | — | | | | 1,580 | |
| Cost of shares redeemed | | | (244,681 | ) | | | (34,603 | ) | | | (22,083 | ) | | | (2,000 | ) |
| Net increase in net assets resulting | | | | | | | | | | | | | | | | |
| from capital share transactions | | | 278,442 | | | | 606,140 | | | | 157,983 | | | | 914,040 | |
| TOTAL INCREASE (DECREASE) IN | | | | | | | | | | | | | | | | |
| NET ASSETS: | | | (10,790,682 | ) | | | 22,150,042 | | | | (1,334,379 | ) | | | 5,674,482 | |
| NET ASSETS: | | | | | | | | | | | | | | | | |
| Beginning of period | | | 178,750,470 | | | | 156,600,428 | | | | 12,219,944 | | | | 6,545,462 | |
| End of period* | | $ | 167,959,788 | | | $ | 178,750,470 | | | $ | 10,885,565 | | | $ | 12,219,944 | |
| * Including undistributed net investment | | | | | | | | | | | | | | | | |
| income (loss) of: | | $ | (1,010,754 | ) | | $ | 108,097 | | | $ | (56,355 | ) | | $ | (28,646 | ) |
| CHANGES IN SHARES OUTSTANDING — | | | | | | | | | | | | | | | | |
| NO LOAD CLASS: | | | | | | | | | | | | | | | | |
| Shares sold | | | 201,464 | | | | 525,397 | | | | 115,889 | | | | 584,835 | |
| Shares issued in reinvestments of | | | | | | | | | | | | | | | | |
| dividends and distributions | | | — | | | | 137,016 | | | | — | | | | 1,468 | |
| Shares redeemed | | | (314,821 | ) | | | (1,345,154 | ) | | | (247,261 | ) | | | (224,143 | ) |
| Net increase (decrease) in shares | | | | | | | | | | | | | | | | |
| outstanding | | | (113,357 | ) | | | (682,741 | ) | | | (131,372 | ) | | | 362,160 | |
| CHANGES IN SHARES OUTSTANDING — | | | | | | | | | | | | | | | | |
| ADVISOR CLASS A: | | | | | | | | | | | | | | | | |
| Shares sold | | | 32,737 | | | | 83,265 | | | | 121,017 | | | | 208,374 | |
| Shares issued in reinvestments of | | | | | | | | | | | | | | | | |
| dividends and distributions | | | — | | | | 3,845 | | | | — | | | | 310 | |
| Shares redeemed | | | (37,190 | ) | | | (24,534 | ) | | | (284,361 | ) | | | (110,866 | ) |
| Net increase (decrease) in shares | | | | | | | | | | | | | | | | |
| outstanding | | | (4,453 | ) | | | 62,576 | | | | (163,344 | ) | | | 97,818 | |
| CHANGES IN SHARES OUTSTANDING — | | | | | | | | | | | | | | | | |
| ADVISOR CLASS C: | | | | | | | | | | | | | | | | |
| Shares sold | | | 9,575 | | | | 12,031 | | | | 30,732 | | | | 175,531 | |
| Shares issued in reinvestments of | | | | | | | | | | | | | | | | |
| dividends and distributions | | | — | | | | 652 | | | | — | | | | 269 | |
| Shares redeemed | | | (4,633 | ) | | | (731 | ) | | | (3,856 | ) | | | (347 | ) |
| Net increase in shares | | | | | | | | | | | | | | | | |
| outstanding | | | 4,942 | | | | 11,952 | | | | 26,876 | | | | 175,453 | |
The accompanying notes are an integral part of these financial statements.
| KINETICS MUTUAL FUNDS, INC. — THE FEEDER FUNDS |
Statements of Changes in Net Assets — (Continued) |
| | | The Paradigm Fund | | | The Medical Fund | |
| | | For the | | | | | | For the | | | | |
| | | Six Months | | | For the | | | Six Months | | | For the | |
| | | Ended | | | Year Ended | | | Ended | | | Year Ended | |
| | | June 30, 2014 | | | December 31, | | | June 30, 2014 | | | December 31, | |
| | | (Unaudited) | | | 2013 | | | (Unaudited) | | | 2013 | |
| OPERATIONS: | | | | | | | | | | | | |
| Net investment income (loss) | | $ | (6,911,466 | ) | | $ | (6,330,819 | ) | | $ | 119,996 | | | $ | (13,040 | ) |
| Net realized gain (loss) on sale of | | | | | | | | | | | | | | | | |
| investments and foreign currency | | | 8,519,792 | | | | 950,246 | | | | 124,755 | | | | (340,728 | ) |
| Net change in unrealized appreciation | | | | | | | | | | | | | | | | |
| of investments and foreign | | | | | | | | | | | | | | | | |
| currency | | | 56,445,954 | | | | 384,565,800 | | | | 2,079,076 | | | | 8,683,292 | |
| Net increase in net assets resulting | | | | | | | | | | | | | | | | |
| from operations | | | 58,054,280 | | | | 379,185,227 | | | | 2,323,827 | | | | 8,329,524 | |
| DISTRIBUTIONS TO SHAREHOLDERS — | | | | | | | | | | | | | | | | |
| NO LOAD CLASS: | | | | | | | | | | | | | | | | |
| Net investment income | | | — | | | | (3,649,194 | ) | | | — | | | | (47,302 | ) |
| Net realized gains | | | — | | | | — | | | | — | | | | (118,630 | ) |
| Total distributions | | | — | | | | (3,649,194 | ) | | | — | | | | (165,932 | ) |
| DISTRIBUTIONS TO SHAREHOLDERS — | | | | | | | | | | | | | | | | |
| ADVISOR CLASS A: | | | | | | | | | | | | | | | | |
| Net investment income | | | — | | | | (958,523 | ) | | | — | | | | (4,406 | ) |
| Net realized gains | | | — | | | | — | | | | — | | | | (22,398 | ) |
| Total distributions | | | — | | | | (958,523 | ) | | | — | | | | (26,804 | ) |
| DISTRIBUTIONS TO SHAREHOLDERS — | | | | | | | | | | | | | | | | |
| ADVISOR CLASS C: | | | | | | | | | | | | | | | | |
| Net investment income | | | — | | | | (111,115 | ) | | | — | | | | (632 | ) |
| Net realized gains | | | — | | | | — | | | | — | | | | (3,216 | ) |
| Total distributions | | | — | | | | (111,115 | ) | | | — | | | | (3,848 | ) |
| DISTRIBUTIONS TO SHAREHOLDERS — | | | | | | | | | | | | | | | | |
| INSTITUTIONAL CLASS: | | | | | | | | | | | | | | | | |
| Net investment income | | | — | | | | (2,547,950 | ) | | | N/A | | | | N/A | |
| Net realized gains | | | — | | | | — | | | | N/A | | | | N/A | |
| Total distributions | | | — | | | | (2,547,950 | ) | | | N/A | | | | N/A | |
| CAPITAL SHARE TRANSACTIONS — | | | | | | | | | | | | | | | | |
| NO LOAD CLASS: | | | | | | | | | | | | | | | | |
| Proceeds from shares sold | | | 53,069,221 | | | | 128,552,091 | | | | 1,309,932 | | | | 5,499,559 | |
| Redemption fees | | | 6,452 | | | | 28,908 | | | | 1,594 | | | | 2,309 | |
| Proceeds from shares issued to holders | | | | | | | | | | | | | | | | |
| in reinvestment of dividends | | | — | | | | 3,421,586 | | | | — | | | | 163,327 | |
| Cost of shares redeemed | | | (73,024,458 | ) | | | (129,139,004 | ) | | | (2,074,936 | ) | | | (6,191,262 | ) |
| Net increase (decrease) in net assets | | | | | | | | | | | | | | | | |
| resulting from capital share | | | | | | | | | | | | | | | | |
| transactions | | | (19,948,785 | ) | | | 2,863,581 | | | | (763,410 | ) | | | (526,067 | ) |
The accompanying notes are an integral part of these financial statements.
| KINETICS MUTUAL FUNDS, INC. — THE FEEDER FUNDS |
Statements of Changes in Net Assets — (Continued) |
| | | The Paradigm Fund | | | The Medical Fund | |
| | | For the | | | | | | For the | | | | |
| | | Six Months | | | For the | | | Six Months | | | For the | |
| | | Ended | | | Year Ended | | | Ended | | | Year Ended | |
| | | June 30, 2014 | | | December 31, | | | June 30, 2014 | | | December 31, | |
| | | (Unaudited) | | | 2013 | | | (Unaudited) | | | 2013 | |
| CAPITAL SHARE TRANSACTIONS — | | | | | | | | | | | | |
| ADVISOR CLASS A: | | | | | | | | | | | | |
| Proceeds from shares sold | | $ | 29,916,413 | | | $ | 41,783,343 | | | $ | 1,347,488 | | | $ | 2,015,743 | |
| Redemption fees | | | 2,259 | | | | 4,446 | | | | 200 | | | | 962 | |
| Proceeds from shares issued to holders | | | | | | | | | | | | | | | | |
| in reinvestment of dividends | | | — | | | | 869,957 | | | | — | | | | 16,802 | |
| Cost of shares redeemed | | | (19,771,917 | ) | | | (32,587,410 | ) | | | (850,533 | ) | | | (2,055,321 | ) |
| Net increase (decrease) in net assets | | | | | | | | | | | | | | | | |
| resulting from capital share | | | | | | | | | | | | | | | | |
| transactions | | | 10,146,755 | | | | 10,070,336 | | | | 497,155 | | | | (21,814 | ) |
| CAPITAL SHARE TRANSACTIONS — | | | | | | | | | | | | | | | | |
| ADVISOR CLASS C: | | | | | | | | | | | | | | | | |
| Proceeds from shares sold | | | 7,869,901 | | | | 10,763,761 | | | | 71,750 | | | | 110,624 | |
| Redemption fees | | | 331 | | | | 4 | | | | — | | | | — | |
| Proceeds from shares issued to holders | | | | | | | | | | | | | | | | |
| in reinvestment of dividends | | | — | | | | 100,621 | | | | — | | | | 1,975 | |
| Cost of shares redeemed | | | (6,828,834 | ) | | | (15,948,545 | ) | | | (45,690 | ) | | | (219,103 | ) |
| Net increase (decrease) in net assets | | | | | | | | | | | | | | | | |
| resulting from capital share | | | | | | | | | | | | | | | | |
| transactions | | | 1,041,398 | | | | (5,084,159 | ) | | | 26,060 | | | | (106,504 | ) |
| CAPITAL SHARE TRANSACTIONS — | | | | | | | | | | | | | | | | |
| INSTITUTIONAL CLASS: | | | | | | | | | | | | | | | | |
| Proceeds from shares sold | | | 41,512,569 | | | | 110,215,275 | | | | N/A | | | | N/A | |
| Redemption fees | | | 5,016 | | | | 5,525 | | | | N/A | | | | N/A | |
| Proceeds from shares issued to holders | | | | | | | | | | | | | | | | |
| in reinvestment of dividends | | | — | | | | 1,781,955 | | | | N/A | | | | N/A | |
| Cost of shares redeemed | | | (59,206,495 | ) | | | (63,765,372 | ) | | | N/A | | | | N/A | |
| Net increase (decrease) in net assets | | | | | | | | | | | | | | | | |
| resulting from capital share | | | | | | | | | | | | | | | | |
| transactions | | | (17,688,910 | ) | | | 48,237,383 | | | | N/A | | | | N/A | |
| TOTAL INCREASE IN NET ASSETS: | | | 31,604,738 | | | | 428,005,586 | | | | 2,083,632 | | | | 7,478,555 | |
| NET ASSETS: | | | | | | | | | | | | | | | | |
| Beginning of period | | | 1,274,331,226 | | | | 846,325,640 | | | | 24,765,399 | | | | 17,286,844 | |
| End of period* | | $ | 1,305,935,964 | | | $ | 1,274,331,226 | | | $ | 26,849,031 | | | $ | 24,765,399 | |
| * Including undistributed net investment | | | | | | | | | | | | | | | | |
| income (loss) of: | | $ | (16,285,540 | ) | | $ | (9,374,074 | ) | | $ | 80,924 | | | $ | (39,072 | ) |
The accompanying notes are an integral part of these financial statements.
| KINETICS MUTUAL FUNDS, INC. — THE FEEDER FUNDS |
Statements of Changes in Net Assets — (Continued) |
| | | The Paradigm Fund | | | The Medical Fund | |
| | | For the | | | | | | For the | | | | |
| | | Six Months | | | For the | | | Six Months | | | For the | |
| | | Ended | | | Year Ended | | | Ended | | | Year Ended | |
| | | June 30, 2014 | | | December 31, | | | June 30, 2014 | | | December 31, | |
| | | (Unaudited) | | | 2013 | | | (Unaudited) | | | 2013 | |
| CHANGES IN SHARES OUTSTANDING — | | | | | | | | | | | | |
| NO LOAD CLASS: | | | | | | | | | | | | |
| Shares sold | | | 1,545,972 | | | | 4,367,391 | | | | 46,732 | | | | 245,850 | |
| Shares issued in reinvestments of | | | | | | | | | | | | | | | | |
| dividends and distributions | | | — | | | | 100,105 | | | | — | | | | 6,196 | |
| Shares redeemed | | | (2,124,234 | ) | | | (4,435,343 | ) | | | (75,485 | ) | | | (275,053 | ) |
| Net increase (decrease) in | | | | | | | | | | | | | | | | |
| shares outstanding | | | (578,262 | ) | | | 32,153 | | | | (28,753 | ) | | | (23,007 | ) |
| CHANGES IN SHARES OUTSTANDING — | | | | | | | | | | | | | | | | |
| ADVISOR CLASS A: | | | | | | | | | | | | | | | | |
| Shares sold | | | 882,433 | | | | 1,418,522 | | | | 49,882 | | | | 90,529 | |
| Shares issued in reinvestments of | | | | | | | | | | | | | | | | |
| dividends and distributions | | | — | | | | 25,915 | | | | — | | | | 656 | |
| Shares redeemed | | | (582,711 | ) | | | (1,136,718 | ) | | | (31,839 | ) | | | (94,006 | ) |
| Net increase (decrease) in | | | | | | | | | | | | | | | | |
| shares outstanding | | | 299,722 | | | | 307,719 | | | | 18,043 | | | | (2,821 | ) |
| CHANGES IN SHARES OUTSTANDING — | | | | | | | | | | | | | | | | |
| ADVISOR CLASS C: | | | | | | | | | | | | | | | | |
| Shares sold | | | 242,459 | | | | 385,726 | | | | 2,603 | | | | 4,926 | |
| Shares issued in reinvestments of | | | | | | | | | | | | | | | | |
| dividends and distributions | | | — | | | | 3,123 | | | | — | | | | 78 | |
| Shares redeemed | | | (209,812 | ) | | | (590,232 | ) | | | (1,761 | ) | | | (10,184 | ) |
| Net increase (decrease) in | | | | | | | | | | | | | | | | |
| shares outstanding | | | 32,647 | | | | (201,383 | ) | | | 842 | | | | (5,180 | ) |
| CHANGES IN SHARES OUTSTANDING — | | | | | | | | | | | | | | | | |
| INSTITUTIONAL CLASS: | | | | | | | | | | | | | | | | |
| Shares sold | | | 1,206,189 | | | | 3,816,087 | | | | N/A | | | | N/A | |
| Shares issued in reinvestments of | | | | | | | | | | | | | | | | |
| dividends and distributions | | | — | | | | 52,226 | | | | N/A | | | | N/A | |
| Shares redeemed | | | (1,718,968 | ) | | | (2,177,559 | ) | | | N/A | | | | N/A | |
| Net increase (decrease) in | | | | | | | | | | | | | | | | |
| shares outstanding | | | (512,779 | ) | | | 1,690,754 | | | | N/A | | | | N/A | |
The accompanying notes are an integral part of these financial statements.
| KINETICS MUTUAL FUNDS, INC. — THE FEEDER FUNDS |
Statements of Changes in Net Assets — (Continued) |
| | | The Small Cap | | | The Market | |
| | | Opportunities Fund | | | Opportunities Fund | |
| | | For the | | | | | | For the | | | | |
| | | Six Months | | | For the | | | Six Months | | | For the | |
| | | Ended | | | Year Ended | | | Ended | | | Year Ended | |
| | | June 30, 2014 | | | December 31, | | | June 30, 2014 | | | December 31, | |
| | | (Unaudited) | | | 2013 | | | (Unaudited) | | | 2013 | |
| OPERATIONS: | | | | | | | | | | | | |
| Net investment loss | | $ | (1,955,072 | ) | | $ | (535,751 | ) | | $ | (135,917 | ) | | $ | (33,421 | ) |
| Net realized gain on sale of investments | | | | | | | | | | | | | | | | |
| and foreign currency | | | 10,607,039 | | | | 912,039 | | | | 3,363,810 | | | | 4,586,000 | |
| Net change in unrealized appreciation | | | | | | | | | | | | | | | | |
| (depreciation) of investments and | | | | | | | | | | | | | | | | |
| foreign currency | | | 7,797,824 | | | | 74,228,630 | | | | (3,036,607 | ) | | | 16,099,778 | |
| Net increase in net assets resulting | | | | | | | | | | | | | | | | |
| from operations | | | 16,449,791 | | | | 74,604,918 | | | | 191,286 | | | | 20,652,357 | |
| DISTRIBUTIONS TO SHAREHOLDERS — | | | | | | | | | | | | | | | | |
| NO LOAD CLASS: | | | | | | | | | | | | | | | | |
| Net investment income | | | — | | | | — | | | | — | | | | (173,362 | ) |
| Total distributions | | | — | | | | — | | | | — | | | | (173,362 | ) |
| DISTRIBUTIONS TO SHAREHOLDERS — | | | | | | | | | | | | | | | | |
| ADVISOR CLASS A: | | | | | | | | | | | | | | | | |
| Net investment income | | | — | | | | — | | | | — | | | | (43,317 | ) |
| Total distributions | | | — | | | | — | | | | — | | | | (43,317 | ) |
| DISTRIBUTIONS TO SHAREHOLDERS — | | | | | | | | | | | | | | | | |
| ADVISOR CLASS C: | | | | | | | | | | | | | | | | |
| Net investment income | | | — | | | | — | | | | — | | | | (20,715 | ) |
| Total distributions | | | — | | | | — | | | | — | | | | (20,715 | ) |
| DISTRIBUTIONS TO SHAREHOLDERS — | | | | | | | | | | | | | | | | |
| INSTITUTIONAL CLASS: | | | | | | | | | | | | | | | | |
| Net investment income | | | — | | | | — | | | | — | | | | (6,619 | ) |
| Total distributions | | | — | | | | — | | | | — | | | | (6,619 | ) |
| CAPITAL SHARE TRANSACTIONS — | | | | | | | | | | | | | | | | |
| NO LOAD CLASS: | | | | | | | | | | | | | | | | |
| Proceeds from shares sold | | | 157,263,992 | | | | 191,484,979 | | | | 7,225,489 | | | | 12,840,687 | |
| Redemption fees | | | 33,208 | | | | 16,105 | | | | 2,124 | | | | 2,752 | |
| Proceeds from shares issued to holders | | | | | | | | | | | | | | | | |
| in reinvestment of dividends | | | — | | | | — | | | | — | | | | 172,044 | |
| Cost of shares redeemed | | | (113,713,554 | ) | | | (37,876,316 | ) | | | (9,882,623 | ) | | | (13,323,220 | ) |
| Net increase (decrease) in net assets | | | | | | | | | | | | | | | | |
| resulting from capital share | | | | | | | | | | | | | | | | |
| transactions | | | 43,583,646 | | | | 153,624,768 | | | | (2,655,010 | ) | | | (307,737 | ) |
The accompanying notes are an integral part of these financial statements.
KINETICS MUTUAL FUNDS, INC. — THE FEEDER FUNDS
| Statements of Changes in Net Assets — (Continued) |
| | | The Small Cap | | | The Market | |
| | | Opportunities Fund | | | Opportunities Fund | |
| | | For the | | | | | | For the | | | | |
| | | Six Months | | | For the | | | Six Months | | | For the | |
| | | Ended | | | Year Ended | | | Ended | | | Year Ended | |
| | | June 30, 2014 | | | December 31, | | | June 30, 2014 | | | December 31, | |
| | | (Unaudited) | | | 2013 | | | (Unaudited) | | | 2013 | |
| CAPITAL SHARE TRANSACTIONS — | | | | | | | | | | | | |
| ADVISOR CLASS A: | | | | | | | | | | | | |
| Proceeds from shares sold | | $ | 17,903,630 | | | $ | 11,072,084 | | | $ | 2,291,068 | | | $ | 5,568,364 | |
| Redemption fees | | | 691 | | | | 2,704 | | | | — | | | | 1,711 | |
| Proceeds from shares issued to holders | | | | | | | | | | | | | | | | |
| in reinvestment of dividends | | | — | | | | — | | | | — | | | | 34,665 | |
| Cost of shares redeemed | | | (3,612,419 | ) | | | (2,330,561 | ) | | | (3,303,812 | ) | | | (3,495,307 | ) |
| Net increase (decrease) in net assets | | | | | | | | | | | | | | | | |
| resulting from capital share | | | | | | | | | | | | | | | | |
| transactions | | | 14,291,902 | | | | 8,744,227 | | | | (1,012,744 | ) | | | 2,109,433 | |
| CAPITAL SHARE TRANSACTIONS — | | | | | | | | | | | | | | | | |
| ADVISOR CLASS C: | | | | | | | | | | | | | | | | |
| Proceeds from shares sold | | | 6,834,211 | | | | 3,682,497 | | | | 554,299 | | | | 378,584 | |
| Redemption fees | | | 1,917 | | | | 716 | | | | — | | | | 199 | |
| Proceeds from shares issued to holders | | | | | | | | | | | | | | | | |
| in reinvestment of dividends | | | — | | | | — | | | | — | | | | 18,554 | |
| Cost of shares redeemed | | | (952,850 | ) | | | (937,616 | ) | | | (275,538 | ) | | | (546,143 | ) |
| Net increase (decrease) in net assets | | | | | | | | | | | | | | | | |
| resulting from capital share | | | | | | | | | | | | | | | | |
| transactions | | | 5,883,278 | | | | 2,745,597 | | | | 278,761 | | | | (148,806 | ) |
| CAPITAL SHARE TRANSACTIONS — | | | | | | | | | | | | | | | | |
| INSTITUTIONAL CLASS: | | | | | | | | | | | | | | | | |
| Proceeds from shares sold | | | 25,011,205 | | | | 36,054,133 | | | | 325,178 | | | | 13,645,790 | |
| Redemption fees | | | 255 | | | | — | | | | — | | | | 1,462 | |
| Proceeds from shares issued to holders | | | | | | | | | | | | | | | | |
| in reinvestment of dividends | | | — | | | | — | | | | — | | | | 6,468 | |
| Cost of shares redeemed | | | (27,273,289 | ) | | | (9,399,860 | ) | | | (139,853 | ) | | | (12,782,149 | ) |
| Net increase (decrease) in net assets | | | | | | | | | | | | | | | | |
| resulting from capital share | | | | | | | | | | | | | | | | |
| transactions | | | (2,261,829 | ) | | | 26,654,273 | | | | 185,325 | | | | 871,571 | |
| TOTAL INCREASE (DECREASE) IN | | | | | | | | | | | | | | | | |
| NET ASSETS: | | | 77,946,788 | | | | 266,373,783 | | | | (3,012,382 | ) | | | 22,932,805 | |
| NET ASSETS: | | | | | | | | | | | | | | | | |
| Beginning of period | | | 347,897,178 | | | | 81,523,395 | | | | 66,541,060 | | | | 43,608,255 | |
| End of period* | | $ | 425,843,966 | | | $ | 347,897,178 | | | $ | 63,528,678 | | | $ | 66,541,060 | |
| * Including undistributed net investment | | | | | | | | | | | | | | | | |
| loss of: | | $ | (3,500,730 | ) | | $ | (1,545,658 | ) | | $ | (770,405 | ) | | $ | (634,488 | ) |
The accompanying notes are an integral part of these financial statements.
KINETICS MUTUAL FUNDS, INC. — THE FEEDER FUNDS
| Statements of Changes in Net Assets — (Continued) |
| | | The Small Cap | | | The Market | |
| | | Opportunities Fund | | | Opportunities Fund | |
| | | For the | | | | | | For the | | | | |
| | | Six Months | | | For the | | | Six Months | | | For the | |
| | | Ended | | | Year Ended | | | Ended | | | Year Ended | |
| | | June 30, 2014 | | | December 31, | | | June 30, 2014 | | | December 31, | |
| | | (Unaudited) | | | 2013 | | | (Unaudited) | | | 2013 | |
| CHANGES IN SHARES OUTSTANDING — | | | | | | | | | | | | |
| NO LOAD CLASS: | | | | | | | | | | | | |
| Shares sold | | | 3,925,189 | | | | 5,488,513 | | | | 415,376 | | | | 787,628 | |
| Shares issued in reinvestments of | | | | | | | | | | | | | | | | |
| dividends and distributions | | | — | | | | — | | | | — | | | | 9,814 | |
| Shares redeemed | | | (2,814,736 | ) | | | (1,104,650 | ) | | | (570,750 | ) | | | (835,192 | ) |
| Net increase (decrease) in | | | | | | | | | | | | | | | | |
| shares outstanding | | | 1,110,453 | | | | 4,383,863 | | | | (155,374 | ) | | | (37,750 | ) |
| CHANGES IN SHARES OUTSTANDING — | | | | | | | | | | | | | | | | |
| ADVISOR CLASS A: | | | | | | | | | | | | | | | | |
| Shares sold | | | 454,500 | | | | 321,977 | | | | 131,489 | | | | 358,219 | |
| Shares issued in reinvestments of | | | | | | | | | | | | | | | | |
| dividends and distributions | | | — | | | | — | | | | — | | | | 1,983 | |
| Shares redeemed | | | (92,076 | ) | | | (71,873 | ) | | | (190,547 | ) | | | (233,140 | ) |
| Net increase (decrease) in | | | | | | | | | | | | | | | | |
| shares outstanding | | | 362,424 | | | | 250,104 | | | | (59,058 | ) | | | 127,062 | |
| CHANGES IN SHARES OUTSTANDING — | | | | | | | | | | | | | | | | |
| ADVISOR CLASS C: | | | | | | | | | | | | | | | | |
| Shares sold | | | 177,637 | | | | 110,477 | | | | 32,513 | | | | 25,837 | |
| Shares issued in reinvestments of | | | | | | | | | | | | | | | | |
| dividends and distributions | | | — | | | | — | | | | — | | | | 1,080 | |
| Shares redeemed | | | (24,420 | ) | | | (28,337 | ) | | | (16,113 | ) | | | (37,227 | ) |
| Net increase (decrease) in | | | | | | | | | | | | | | | | |
| shares outstanding | | | 153,217 | | | | 82,140 | | | | 16,400 | | | | (10,310 | ) |
| CHANGES IN SHARES OUTSTANDING — | | | | | | | | | | | | | | | | |
| INSTITUTIONAL CLASS: | | | | | | | | | | | | | | | | |
| Shares sold | | | 615,893 | | | | 990,478 | | | | 18,639 | | | | 937,141 | |
| Shares issued in reinvestments of | | | | | | | | | | | | | | | | |
| dividends and distributions | | | — | | | | — | | | | — | | | | 367 | |
| Shares redeemed | | | (674,105 | ) | | | (271,270 | ) | | | (7,994 | ) | | | (854,503 | ) |
| Net increase (decrease) in | | | | | | | | | | | | | | | | |
| shares outstanding | | | (58,212 | ) | | | 719,208 | | | | 10,645 | | | | 83,005 | |
The accompanying notes are an integral part of these financial statements.
| KINETICS MUTUAL FUNDS, INC. — THE FEEDER FUNDS |
Statements of Changes in Net Assets — (Continued) |
| | | The Alternative | | | The Multi- | |
| | | Income Fund | | | Disciplinary Fund | |
| | | For the | | | | | | For the | | | | |
| | | Six Months | | | For the | | | Six Months | | | For the | |
| | | Ended | | | Year Ended | | | Ended | | | Year Ended | |
| | | June 30, 2014 | | | December 31, | | | June 30, 2014 | | | December 31, | |
| | | (Unaudited) | | | 2013 | | | (Unaudited) | | | 2013 | |
| OPERATIONS: | | | | | | | | | | | | |
| Net investment income (loss) | | $ | (27,646 | ) | | $ | (54,057 | ) | | $ | 1,031,700 | | | $ | 1,363,638 | |
| Net realized gain on sale of | | | | | | | | | | | | | | | | |
| investments, foreign currency | | | | | | | | | | | | | | | | |
| and written option contracts | | | | | | | | | | | | | | | | |
| expired or closed | | | 346,048 | | | | 331,354 | | | | 576,573 | | | | 2,371,485 | |
| Net change in unrealized appreciation | | | | | | | | | | | | | | | | |
| (depreciation) of investments, | | | | | | | | | | | | | | | | |
| foreign currency and written | | | | | | | | | | | | | | | | |
| options | | | 383,162 | | | | 594,800 | | | | 3,295,923 | | | | (739,904 | ) |
| Net increase in net assets resulting | | | | | | | | | | | | | | | | |
| from operations | | | 701,564 | | | | 872,097 | | | | 4,904,196 | | | | 2,995,219 | |
| DISTRIBUTIONS TO SHAREHOLDERS — | | | | | | | | | | | | | | | | |
| NO LOAD CLASS: | | | | | | | | | | | | | | | | |
| Net investment income | | | — | | | | — | | | | (180,784 | ) | | | (487,296 | ) |
| Net realized gains | | | — | | | | — | | | | (82,316 | ) | | | (441,978 | ) |
| Total distributions | | | — | | | | — | | | | (263,100 | ) | | | (929,274 | ) |
| DISTRIBUTIONS TO SHAREHOLDERS — | | | | | | | | | | | | | | | | |
| ADVISOR CLASS A: | | | | | | | | | | | | | | | | |
| Net investment income | | | — | | | | — | | | | (194,271 | ) | | | (924,799 | ) |
| Net realized gains | | | — | | | | — | | | | (103,459 | ) | | | (819,239 | ) |
| Total distributions | | | — | | | | — | | | | (297,730 | ) | | | (1,744,038 | ) |
| DISTRIBUTIONS TO SHAREHOLDERS — | | | | | | | | | | | | | | | | |
| ADVISOR CLASS C: | | | | | | | | | | | | | | | | |
| Net investment income | | | — | | | | — | | | | (70,069 | ) | | | (183,756 | ) |
| Net realized gains | | | — | | | | — | | | | (48,618 | ) | | | (258,354 | ) |
| Total distributions | | | — | | | | — | | | | (118,687 | ) | | | (442,110 | ) |
| DISTRIBUTIONS TO SHAREHOLDERS — | | | | | | | | | | | | | | | | |
| INSTITUTIONAL CLASS: | | | | | | | | | | | | | | | | |
| Net investment income | | | — | | | | — | | | | (521,477 | ) | | | (457,067 | ) |
| Net realized gains | | | — | | | | — | | | | (219,359 | ) | | | (509,401 | ) |
| Total distributions | | | — | | | | — | | | | (740,836 | ) | | | (966,468 | ) |
| CAPITAL SHARE TRANSACTIONS — | | | | | | | | | | | | | | | | |
| NO LOAD CLASS: | | | | | | | | | | | | | | | | |
| Proceeds from shares sold | | | 2,367,382 | | | | 9,908,542 | | | | 2,848,127 | | | | 8,952,699 | |
| Redemption fees | | | 397 | | | | 9 | | | | 1 | | | | 334 | |
| Proceeds from shares issued to holders | | | | | | | | | | | | | | | | |
| in reinvestment of dividends | | | — | | | | — | | | | 212,289 | | | | 736,771 | |
| Cost of shares redeemed | | | (892,430 | ) | | | (3,240,996 | ) | | | (2,953,900 | ) | | | (9,582,407 | ) |
| Net increase in net assets resulting | | | | | | | | | | | | | | | | |
| from capital share transactions | | | 1,475,349 | | | | 6,667,555 | | | | 106,517 | | | | 107,397 | |
The accompanying notes are an integral part of these financial statements.
| KINETICS MUTUAL FUNDS, INC. — THE FEEDER FUNDS |
Statements of Changes in Net Assets — (Continued) |
| | | The Alternative | | | The Multi- | |
| | | Income Fund | | | Disciplinary Fund | |
| | | For the | | | | | | For the | | | | |
| | | Six Months | | | For the | | | Six Months | | | For the | |
| | | Ended | | | Year Ended | | | Ended | | | Year Ended | |
| | | June 30, 2014 | | | December 31, | | | June 30, 2014 | | | December 31, | |
| | | (Unaudited) | | | 2013 | | | (Unaudited) | | | 2013 | |
| CAPITAL SHARE TRANSACTIONS — | | | | | | | | | | | | |
| ADVISOR CLASS A: | | | | | | | | | | | | |
| Proceeds from shares sold | | $ | 2,119,693 | | | $ | 1,848,803 | | | $ | 2,564,640 | | | $ | 33,189,160 | |
| Redemption fees | | | 102 | | | | 313 | | | | 5 | | | | 4,331 | |
| Proceeds from shares issued to holders | | | | | | | | | | | | | | | | |
| in reinvestment of dividends | | | — | | | | — | | | | 270,743 | | | | 1,696,922 | |
| Cost of shares redeemed | | | (417,638 | ) | | | (1,667,426 | ) | | | (14,647,398 | ) | | | (24,094,744 | ) |
| Net increase (decrease) in net assets | | | | | | | | | | | | | | | | |
| resulting from capital | | | | | | | | | | | | | | | | |
| share transactions | | | 1,702,157 | | | | 181,690 | | | | (11,812,010 | ) | | | 10,795,669 | |
| CAPITAL SHARE TRANSACTIONS — | | | | | | | | | | | | | | | | |
| ADVISOR CLASS C: | | | | | | | | | | | | | | | | |
| Proceeds from shares sold | | | 140,668 | | | | 1,152,698 | | | | 1,066,327 | | | | 4,855,689 | |
| Redemption fees | | | — | | | | — | | | | 33 | | | | — | |
| Proceeds from shares issued to holders | | | | | | | | | | | | | | | | |
| in reinvestment of dividends | | | — | | | | — | | | | 113,401 | | | | 423,776 | |
| Cost of shares redeemed | | | (704,873 | ) | | | (1,134,524 | ) | | | (905,930 | ) | | | (1,435,484 | ) |
| Net increase (decrease) in net assets | | | | | | | | | | | | | | | | |
| resulting from capital | | | | | | | | | | | | | | | | |
| share transactions | | | (564,205 | ) | | | 18,174 | | | | 273,831 | | | | 3,843,981 | |
| CAPITAL SHARE TRANSACTIONS — | | | | | | | | | | | | | | | | |
| INSTITUTIONAL CLASS: | | | | | | | | | | | | | | | | |
| Proceeds from shares sold | | | 4,598,650 | | | | 5,417,780 | | | | 48,737,567 | | | | 17,790,455 | |
| Redemption fees | | | — | | | | — | | | | — | | | | — | |
| Proceeds from shares issued to holders | | | | | | | | | | | | | | | | |
| in reinvestment of dividends | | | — | | | | — | | | | 738,321 | | | | 955,985 | |
| Cost of shares redeemed | | | (1,510,152 | ) | | | (384,298 | ) | | | (18,939,640 | ) | | | (1,638,909 | ) |
| Net increase in net assets resulting | | | | | | | | | | | | | | | | |
| from capital share transactions | | | 3,088,498 | | | | 5,033,482 | | | | 30,536,248 | | | | 17,107,531 | |
| TOTAL INCREASE IN NET ASSETS: | | | 6,403,363 | | | | 12,772,998 | | | | 22,588,429 | | | | 30,767,907 | |
| NET ASSETS: | | | | | | | | | | | | | | | | |
| Beginning of period | | | 23,462,216 | | | | 10,689,218 | | | | 90,159,516 | | | | 59,391,609 | |
| End of period* | | $ | 29,865,579 | | | $ | 23,462,216 | | | $ | 112,747,945 | | | $ | 90,159,516 | |
| * Including undistributed net investment | | | | | | | | | | | | | | | | |
| loss of: | | $ | (27,646 | ) | | $ | — | | | $ | (870,062 | ) | | $ | (935,161 | ) |
| CHANGES IN SHARES OUTSTANDING — | | | | | | | | | | | | | | | | |
| NO LOAD CLASS: | | | | | | | | | | | | | | | | |
| Shares sold | | | 26,810 | | | | 939,415 | | | | 255,431 | | | | 790,030 | |
| Shares issued in reinvestments of | | | | | | | | | | | | | | | | |
| dividends and distributions | | | — | | | | — | | | | 18,665 | | | | 66,399 | |
| Shares redeemed | | | (10,049 | ) | | | (1,368,656 | )(1) | | | (264,104 | ) | | | (849,113 | ) |
| Net increase (decrease) in | | | | | | | | | | | | | | | | |
| shares outstanding | | | 16,761 | | | | (429,241 | ) | | | 9,992 | | | | 7,316 | |
The accompanying notes are an integral part of these financial statements.
| KINETICS MUTUAL FUNDS, INC. — THE FEEDER FUNDS |
Statements of Changes in Net Assets — (Continued) |
| | | The Alternative | | | The Multi- | |
| | | Income Fund | | | Disciplinary Fund | |
| | | For the | | | | | | For the | | | | |
| | | Six Months | | | For the | | | Six Months | | | For the | |
| | | Ended | | | Year Ended | | | Ended | | | Year Ended | |
| | | June 30, 2014 | | | December 31, | | | June 30, 2014 | | | December 31, | |
| | | (Unaudited) | | | 2013 | | | (Unaudited) | | | 2013 | |
| CHANGES IN SHARES OUTSTANDING — | | | | | | | | | | | | |
| ADVISOR CLASS A: | | | | | | | | | | | | |
| Shares sold | | | 23,790 | | | | 43,207 | | | | 229,967 | | | | 2,944,381 | |
| Shares issued in reinvestments of | | | | | | | | | | | | | | | | |
| dividends and distributions | | | — | | | | — | | | | 23,874 | | | | 153,652 | |
| Shares redeemed | | | (4,714 | ) | | | (321,663 | )(1) | | | (1,310,784 | ) | | | (2,138,431 | ) |
| Net increase (decrease) in | | | | | | | | | | | | | | | | |
| shares outstanding | | | 19,076 | | | | (278,456 | ) | | | (1,056,943 | ) | | | 959,602 | |
| CHANGES IN SHARES OUTSTANDING — | | | | | | | | | | | | | | | | |
| ADVISOR CLASS C: | | | | | | | | | | | | | | | | |
| Shares sold | | | 1,622 | | | | 33,993 | | | | 95,754 | | | | 435,881 | |
| Shares issued in reinvestments of | | | | | | | | | | | | | | | | |
| dividends and distributions | | | — | | | | — | | | | 10,071 | | | | 38,723 | |
| Shares redeemed | | | (8,122 | ) | | | (226,741 | )(1) | | | (81,880 | ) | | | (128,853 | ) |
| Net increase (decrease) in | | | | | | | | | | | | | | | | |
| shares outstanding | | | (6,500 | ) | | | (192,748 | ) | | | 23,945 | | | | 345,751 | |
| CHANGES IN SHARES OUTSTANDING — | | | | | | | | | | | | | | | | |
| INSTITUTIONAL CLASS: | | | | | | | | | | | | | | | | |
| Shares sold | | | 51,441 | | | | 246,519 | | | | 4,328,981 | | | | 1,566,653 | |
| Shares issued in reinvestments of | | | | | | | | | | | | | | | | |
| dividends and distributions | | | — | | | | — | | | | 64,709 | | | | 86,068 | |
| Shares redeemed | | | (16,673 | ) | | | (363,249 | )(1) | | | (1,683,363 | ) | | | (144,343 | ) |
| Net increase (decrease) in | | | | | | | | | | | | | | | | |
| shares outstanding | | | 34,768 | | | | (116,730 | ) | | | 2,710,327 | | | | 1,508,378 | |
| | |
| (1) | Shares redeemed include: 1,198,771 No Load Class shares, 210,478 Class A shares, 159,007 Class C shares and 332,551 Institutional Class shares respectively due to the reverse split. During the year ended December 31, 2013, shares of the Alternative Income Fund were adjusted to reflect a 10:1 reverse stock split. |
The accompanying notes are an integral part of these financial statements.
| KINETICS MUTUAL FUNDS, INC. — THE FEEDER FUNDS |
| Notes to Financial Statements |
| June 30, 2014 (Unaudited) |
1. Organization
Kinetics Mutual Funds, Inc. (the “Company”) is registered under the Investment Company Act of 1940, as amended (the “1940 Act”), and is incorporated in the State of Maryland. The Company is an open-end management investment company issuing its shares in series. One billion shares are authorized for the Company with a par value of $0.001 per share. The series of the Company presently authorized are The Internet Fund (“Internet”), The Global Fund (“Global”), The Paradigm Fund (“Paradigm”), The Medical Fund (“Medical”), The Small Cap Opportunities Fund (“Small Cap”), The Market Opportunities Fund (“Market Opportunities”), The Alternative Income Fund (“Alternative Income”), and The Multi-Disciplinary Fund (“Multi-Disciplinary”). Investment operations of the Company began on October 21, 1996 (Internet), September 30, 1999 (Medical), December 31, 1999 (Global and Paradigm), March 20, 2000 (Small Cap), January 31, 2006 (Market Opportunities), June 29, 2007 (Alternative Income), and February 11, 2008 (Multi-Disciplinary). Each series, unlike many other investment companies which directly acquire and manage their own portfolios of securities, seeks to achieve its investment objective by investing all of its investable assets in a corresponding portfolio series (each a “Master Portfolio” and collectively the “Master Portfolios”) of Kinetics Portfolios Trust (the “Trust”).
On April 28, 2000 (January 31, 2006 with respect to Market Opportunities, June 29, 2007 with respect to Alternative Income, and February 11, 2008 with respect to Multi-Disciplinary), each series in the Company entered into a master-feeder fund structure. By entering into this structure, each series (each a “Feeder Fund” and collectively, the “Feeder Funds”) invested all of its assets in a corresponding Master Portfolio which had the same investment objective as the Feeder Fund. Each Master Portfolio has multiple feeder funds. Each Feeder Fund receives a proportionate amount of interest in the Master Portfolio equal to its relative contribution of capital. Thus, each Feeder Fund is allocated its portion of income, gains (losses) and expenses from the Master Portfolio.
| KINETICS MUTUAL FUNDS, INC. — THE FEEDER FUNDS |
Notes to Financial Statements — (Continued) |
| June 30, 2014 (Unaudited) |
Each Feeder Fund’s respective interest in the corresponding Master Portfolio as of June 30, 2014 is as follows:
| | | Interest in | |
| | | Master Portfolio | |
| Internet Fund | | | 99.989 | % |
| Global Fund | | | 99.924 | % |
| Paradigm Fund | | | 96.476 | % |
| Medical Fund | | | 99.886 | % |
| Small Cap Fund | | | 99.990 | % |
| Market Opportunities Fund | | | 99.973 | % |
| Alternative Income Fund | | | 99.613 | % |
| Multi-Disciplinary Fund | | | 99.859 | % |
Prior to the conversion to a master-feeder fund structure on April 28, 2000, each then existing series conducted its own investment operations.
As of June 30, 2014 each of the Feeder Funds offers Advisor Class A shares. Advisor Class A shares are subject to an annual Rule 12b-1 fee of 0.25% of average daily net assets and a shareholder servicing fee of 0.25% of average daily net assets. The Advisor Class A shares are also subject to a front-end sales charge of 5.75%.
As of June 30, 2014, each of the Feeder Funds offers Advisor Class C shares. Advisor Class C shares are subject to an annual Rule 12b-1 fee of 0.75% of average daily net assets and a shareholder servicing fee of 0.25% of average daily net assets. If you sell your Advisor Class C shares within 12 months of purchase, you will have to pay a contingent deferred sales charge of 1.00%, which is applied to the NAV of the shares on the date of original purchase or on the date of redemption, whichever is less.
As of June 30, 2014, each of the Feeder Funds offers No Load Class shares. No Load Class shares are subject to a shareholder servicing fee of 0.25% of average daily net assets but do not have 12b-1 fees or a sales charge.
As of June 30, 2014 the Paradigm, Small Cap, Market Opportunities, Alternative Income, and Multi-Disciplinary Funds offer Institutional Class shares. Institutional Class shares are subject to a shareholder servicing fee of 0.20% of average daily net assets but do not have 12b-1 fees or a sales charge. The Adviser has voluntarily agreed to waive a portion of the Institutional Class shareholder servicing fee in excess of 0.05%.
| KINETICS MUTUAL FUNDS, INC. — THE FEEDER FUNDS |
Notes to Financial Statements — (Continued) |
| June 30, 2014 (Unaudited) |
Each class of shares for each Fund has identical rights and privileges except with respect to the Rule 12b-1 fees paid by the Advisor Class A and Advisor Class C shares, the sales charge on the Advisor Class A shares, the shareholder servicing fees paid by the Advisor Class A, Advisor Class C, No Load Class and Institutional Class shares, voting rights on matters pertaining to a single class of shares and the exchange privileges of each class of shares. Shares of each Feeder Fund will assess a 2.00% redemption fee (with exceptions) on shares redeemed or exchanged within 30 days of purchase. Income, expenses (other than expenses attributable to a specific class), and realized and unrealized gains or losses on investments are allocated to each class based on its relative net assets.
Refer to the Master Portfolio’s financial statements to obtain information about the investment objective of the corresponding Feeder Fund. The financial statements of the Master Portfolios, including the portfolios of investments, are contained elsewhere in this report and should be read in conjunction with the Feeder Funds’ financial statements.
2. Significant Accounting Policies
Security Valuation
Master Portfolio securities that are listed on a U.S. securities exchange for which market quotations are readily available are valued at the last quoted sale price on the day the valuation is made. Price information on listed securities is taken from the exchange where the security is primarily traded. All equity securities that are traded using the National Association of Securities Dealers’ Automated Quotation System (“NASDAQ”) are valued using the NASDAQ Official Closing Price (“NOCP”). Foreign securities are valued by an independent pricing service. In the event market quotations are not readily available or if events occur that may materially affect the value of a particular security between the time trading ends on a particular security and the close of regular trading on the New York Stock Exchange (“NYSE”), “fair value” will be determined. Unlisted U.S. securities and listed U.S. securities not traded on the valuation date for which market quotations are readily available are valued at the last bid price. Exchange traded options are valued at the composite price, using the National Best Bid and Offer quotes (“NBBO”). NBBO consists of the highest bid price and lowest ask price across any of the exchanges on which an option is quoted, thus providing a view across the entire U.S. options marketplace. Composite option pricing calculates the mean of the highest bid price and lowest ask price across the exchanges where the option is traded. If
| KINETICS MUTUAL FUNDS, INC. — THE FEEDER FUNDS |
Notes to Financial Statements — (Continued) |
| June 30, 2014 (Unaudited) |
the composite option price is not available, the mean between the highest bid and the lowest asked quotations at the close of the exchanges will be used. If none of the above are available, exchange traded options are valued at the last quoted sales price. Non-exchange traded options for which over-the-counter quotations are not readily available are valued at the mean of the current bid and asked prices. Fixed-income securities (other than obligations having a maturity of 60 days or less) are normally valued on the basis of quotes obtained from pricing services, which take into account appropriate factors such as institutional-sized trading in similar groups of securities, yield, quality, coupon rate, maturity, type of issue, trading characteristics and other market data.
Investment grade fixed-income securities with remaining maturities of 60 days or less are valued at amortized cost, which approximates fair value. Other assets and securities for which no quotations are readily available (including restricted securities) will be valued in good faith at fair value using methods determined by the Board of Trustees of the Master Portfolios. In determining the fair value of a security, the Board of Trustees shall take into account the relevant factors and surrounding circumstances, which may include: (i) the nature and pricing history (if any) of the security; (ii) whether any dealer quotations for the security are available; (iii) possible valuation methodologies that could be used to determine the fair value of the security; (iv) the recommendation of the portfolio manager of the Portfolios with respect to the valuation of the security; (v) whether the same or similar securities are held by other funds managed by the Advisor or other funds and the method used to price the security in those funds; (vi) the extent to which the fair value to be determined for the security will result from the use of data or formula produced by third parties independent of the Advisor; and (vii) the liquidity or illiquidity of the market for the security; and (viii) the value of a foreign security traded on other foreign markets. At June 30, 2014, 0.00%, 0.00%, and 0.00% of the net assets of The Internet Portfolio, The Paradigm Portfolio and The Market Opportunities Portfolio, respectively, were fair valued securities. The other Master Portfolios did not hold any fair valued securities at June 30, 2014.
Repurchase Agreements
Each Master Portfolio may enter into repurchase agreements with banks that are members of the Federal Reserve System or securities dealers who are members of a national securities exchange or are primary dealers in U.S. Government Securities. In connection with transactions in repurchase agreements, it is the Trust’s policy that the Master Portfolio receive, as collateral, securities whose market value, including accrued interest, at all times will be at least equal to
| KINETICS MUTUAL FUNDS, INC. — THE FEEDER FUNDS |
Notes to Financial Statements — (Continued) |
| June 30, 2014 (Unaudited) |
102% of the amount invested by the Master Portfolio in each repurchase agreement. If the seller defaults and the value of the collateral declines, realization of the collateral by the Master Portfolio may be delayed or limited.
Written Option Accounting
The Master Portfolios may write (sell) call or put options for trading or hedging purposes. When the Master Portfolio writes an option, an amount equal to the premium received by the Master Portfolio is included in the Statement of Assets and Liabilities as an asset and an equivalent liability. The amount of the liability is subsequently marked-to-market to reflect the current value of the option written. By writing the option, the Master Portfolio may become obligated during the term of the option to deliver or purchase the securities underlying the option at the exercise price if the option is exercised. When an option expires on its stipulated expiration date or the Master Portfolio enters into a closing purchase transaction, the Master Portfolio realizes a gain or loss if the cost of the closing transaction differs from the premium received when the option was sold, without regard to any unrealized gain or loss on the underlying security, and the liability related to such option is eliminated. When an option is exercised, the premium originally received decreases the cost basis of the underlying security (or increases the proceeds on the security sold short) and the Master Portfolio realizes a gain or loss from the sale of the security (or closing of the short sale). As collateral for uncovered written options, the Master Portfolio is required under the 1940 Act to maintain assets consisting of cash, cash equivalents or liquid securities. This collateral is required to be adjusted daily to reflect the exercise price of the purchase obligation for put options or the market value of the instrument underlying the contract for call options.
Foreign Currency Translations
The books and records of the Master Portfolios are maintained in U.S. dollars. For the Master Portfolios, foreign currency transactions are translated into U.S. dollars on the following basis: (i) market values of investment securities and other assets and liabilities are translated at the exchange rate of such currencies against the U.S. dollar, as provided by an approved pricing service, and (ii) purchases and sales of investment securities, dividend and interest income and certain expenses at the rates of exchange prevailing on the respective dates of such transactions. The Master Portfolios do not isolate and treat as ordinary income that portion of the results of operations arising as a result of changes in the exchange rate from the fluctuations arising from changes in the market prices of securities held
| KINETICS MUTUAL FUNDS, INC. — THE FEEDER FUNDS |
Notes to Financial Statements — (Continued) |
| June 30, 2014 (Unaudited) |
during the period. Such fluctuations are included with the net realized and unrealized gain or loss from investments. However, for federal income tax purposes, the Master Portfolios do isolate and treat as ordinary income the effect of changes in foreign exchange rates arising from actual foreign currency transactions and the effect of changes in foreign exchange rates arising between trade date and settlement date.
Restricted and Illiquid Securities
The Master Portfolios may invest in restricted securities. These securities are valued by the Master Portfolios after giving due consideration to pertinent factors including recent private sales, market conditions and the issuer’s financial performance. The Master Portfolios have no right to require registration of unregistered securities. At June 30, 2014 the following Master Portfolio held securities restricted to institutional investors (144A securities):
| | | | | | Percentage of | |
| | | Market Value | | | Net Assets | |
| The Alternative Income Portfolio | | $ | 658,595 | | | | 2.20 | % |
| The Multi-Disciplinary Portfolio | | | 17,578,917 | | | | 15.57 | % |
An illiquid asset is any asset which may not be sold or disposed of in the ordinary course of business within seven days at approximately the value at which the Master Portfolio has valued the investment. At June 30, 2014, the following Master Portfolios held illiquid securities:
| | | | | | Percentage of | |
| | | Market Value | | | Net Assets | |
| The Internet Portfolio | | $ | — | * | | | 0.00 | % |
| The Paradigm Portfolio | | | — | * | | | 0.00 | % |
| The Market Opportunities Portfolio | | | — | * | | | 0.00 | % |
| The Multi-Disciplinary Portfolio | | | 525,000 | | | | 0.47 | % |
| | |
| * | Amount is less than $0.50. |
When-Issued Securities
The Master Portfolios may purchase securities on a when-issued or delayed delivery basis. Although the purchase amounts of these securities are established at the time the purchaser enters into the agreement, these securities may be delivered and paid for at a future date. The Master Portfolios record purchases of when-issued securities and reflect the values of such securities in determining net asset value in the same manner as other portfolio
| KINETICS MUTUAL FUNDS, INC. — THE FEEDER FUNDS |
Notes to Financial Statements — (Continued) |
| June 30, 2014 (Unaudited) |
securities. The Master Portfolios maintain at all times cash or other liquid assets in an amount at least equal to the amount of outstanding commitments for when-issued securities.
Securities Lending
Each Master Portfolio may lend its portfolio securities to broker-dealers by entering directly into lending arrangements with such broker-dealers or indirectly through repurchase agreements with respect to no more than 331/3% of the total assets of each Master Portfolio (including any collateral posted) or 50% of the total assets of each Master Portfolio (excluding any collateral posted). Securities lending and repurchase transactions will be fully collateralized at all times with cash and/or short-term debt obligations. The Master Portfolios receive interest on the collateral received as well as a fee for the securities loaned.
Expense Allocation
Common expenses incurred by Feeder Funds are allocated among the Feeder Funds (i) based upon relative average net assets, (ii) as incurred on a specific identification basis, or (iii) equally among the Feeder Funds, depending on the nature of the expenditure.
Each Feeder Fund records its proportionate share of the corresponding Master Portfolio’s expenses on a daily basis. In addition, each Feeder Fund accrues its own separate expenses. Any cap on expenses includes Feeder Fund-specific expenses as well as the expenses allocated from the Master Portfolio.
Federal Income Taxes
Each Master Portfolio will be treated as a partnership for federal income tax purposes. As such, each investor in the Master Portfolio via its investment in a Feeder Fund will be subject to taxation on its share of the Master Portfolio’s ordinary income and capital gains. It is intended that the Master Portfolio’s assets will be managed so an investor in the Master Portfolio via its investment in a Feeder Fund can satisfy the requirements of subchapter M of the Internal Revenue Code.
It is the Feeder Funds’ policy to meet the requirements of the Internal Revenue Code applicable to regulated investment companies and the Feeder Funds
| KINETICS MUTUAL FUNDS, INC. — THE FEEDER FUNDS |
Notes to Financial Statements — (Continued) |
| June 30, 2014 (Unaudited) |
intend to distribute investment company net taxable income and net capital gains to shareholders. Therefore, no federal income tax provision is recorded.
Dividends from net investment income and distributions of net realized capital gains, if any, will be declared and paid at least annually. The character of distributions made during the year from net investment income or net realized gains may differ from the characterization for federal income tax purposes due to differences in the recognition of income, expenses and gain items for financial statement and tax purposes. Additionally, the Feeder Funds may utilize earnings and profits distributed to shareholders on redemption of shares as part of the dividends paid deduction for income tax purposes. Where appropriate, reclassifications between capital accounts are made for such differences that are permanent in nature
There is no tax liability resulting from unrecognized tax benefits relating to uncertain income tax positions taken or expected to be taken in future tax returns. As of June 30, 2014, open tax years include the tax years ended December 31, 2010 through 2013. The Funds are also not aware of any tax positions for which it is reasonably possible that the total amounts of unrecognized tax benefits will significantly change in the next six months.
Use of Estimates
The preparation of financial statements in conformity with U.S. generally accepted accounting principles (“GAAP”) requires management to make estimates and assumptions that affect the reported amounts in the financial statements. Actual results could differ from those estimates.
Other
Realized gains and losses on the sale of investments are calculated on the identified cost basis. Dividend income is recorded on the ex-dividend date. Interest income is accounted for on the accrual basis and includes amortization of premiums and discounts on the interest method. Other noncash dividends are recognized as investment income at the fair value of the property received. Withholding taxes on foreign dividends have been provided for in accordance with the Company’s understanding of the applicable country’s tax rules and rates.
| KINETICS MUTUAL FUNDS, INC. — THE FEEDER FUNDS |
Notes to Financial Statements — (Continued) |
| June 30, 2014 (Unaudited) |
3. Investment Adviser
The Trust has entered into Investment Advisory Agreements (the “Agreements”) with Kinetics Asset Management LLC (the “Adviser”), with whom certain officers and trustees of the Trust are affiliated, to furnish investment advisory services to the Master Portfolios. The Adviser is a wholly-owned subsidiary of Horizon Kinetics LLC. Under the terms of the Agreements, the Master Portfolios, except the Alternative Income Portfolio, compensate the Adviser for its management services at the annual rate of 1.25% of each Master Portfolio’s average daily net assets. The Alternative Income Portfolio compensates the Adviser for its management services at the annual rate of 0.90% of the Master Portfolio’s average daily net assets.
The Adviser has voluntarily agreed to waive a portion of its advisory fee and/or reimburse certain operating expenses as deemed appropriate through at least May 1, 2015. The Adviser may discontinue the voluntary waiver/reimbursement at any time after May 1, 2015; these waivers/reimbursements are not subject to recapture.
For the period ended June 30, 2014, the rate earned by the Adviser from the Master Portfolios and the waived fees/reimbursed expenses for the Feeder Funds are as follows:
| | | The Internet | | | The Global | |
| | | Fund | | | Fund | |
| Annual Advisory Rate | | | 1.25 | % | | | 1.25 | % |
| Expenses Reimbursed by Adviser through | | | | | | | | |
| voluntary waiver | | $ | — | | | $ | 64,866 | |
| Expenses Reimbursed by Adviser through | | | | | | | | |
| institutional class shareholder | | | | | | | | |
| servicing fee waiver | | $ | — | | | $ | — | |
| | | | | | | | | |
| | | The Paradigm | | | The Medical | |
| | | Fund | | | Fund | |
| Annual Advisory Rate | | | 1.25 | % | | | 1.25 | % |
| Expenses Reimbursed by Adviser through | | | | | | | | |
| voluntary waiver | | $ | 284,895 | | | $ | 85,351 | |
| Expenses Reimbursed by Adviser through | | | | | | | | |
| institutional class shareholder servicing | | | | | | | | |
| fee waiver | | $ | 247,010 | | | $ | — | |
| KINETICS MUTUAL FUNDS, INC. — THE FEEDER FUNDS |
Notes to Financial Statements — (Continued) |
| June 30, 2014 (Unaudited) |
| | | The Small Cap | | | The Market | |
| | | Opportunities | | | Opportunities | |
| | | Fund | | | Fund | |
| Annual Advisory Rate | | | 1.25 | % | | | 1.25 | % |
| Expenses Reimbursed by Adviser through | | | | | | | | |
| voluntary waiver | | $ | 126,933 | | | $ | 67,217 | |
| Expenses Reimbursed by Adviser through | | | | | | | | |
| institutional class shareholder servicing | | | | | | | | |
| fee waiver | | $ | 24,407 | | | $ | 1,413 | |
| | | | | | | | | |
| | | The Alternative | | | The Multi- | |
| | | Income | | | Disciplinary | |
| | | Fund | | | Fund | |
| Annual Advisory Rate | | | 0.90 | % | | | 1.25 | % |
| Expenses Reimbursed by Adviser through | | | | | | | | |
| voluntary waiver | | $ | 120,073 | | | $ | 159,381 | |
| Expenses Reimbursed by Adviser through | | | | | | | | |
| institutional class shareholder servicing | | | | | | | | |
| fee waiver | | $ | 7,072 | | | $ | 30,982 | |
The Adviser receives a shareholder servicing fee from the No Load Class, Advisor Class A and Advisor Class C shares of a Feeder Fund pursuant to a Shareholder Servicing Agreement in the amount equal to 0.25% of the Feeder Fund’s average daily net assets attributable to No Load Class, Advisor Class A and Advisor Class C shares, respectively. For the Institutional Class, the Adviser receives a shareholder servicing fee pursuant to a shareholder servicing agreement in the amount equal to 0.20% of a Feeder Fund’s average daily net assets attributable to Institutional Class shares. At this time, the Adviser has contractually agreed to waive and/or reimburse the portion of the Institutional Class shareholder servicing fee in excess of 0.05% of a Feeder Fund’s average daily net assets attributable to Institutional Class shares until at least May 1, 2015. For the six months ended June 30, 2014, the Adviser waived amounts depicted in the above table in shareholder servicing fees for the Institutional Class of the Paradigm, Small Cap, Market Opportunities, Alternative Income, and Multi-Disciplinary Funds. During the six months ended June 30, 2014, Internet, Global, Paradigm, Medical, Small Cap, Market Opportunities, Alternative Income and Multi-Disciplinary Funds incurred shareholder servicing expenses of $211,728, $14,414, $1,494,133, $32,933, $494,868, $81,453, $31,784, and $117,988 respectively, pursuant to the Shareholder Servicing Plan. The Adviser is responsible for paying a portion of these shareholder servicing fees to various agents that have a written shareholder servicing agreement with the Adviser and that perform shareholder servicing functions and maintenance of shareholder accounts on behalf of their clients who own shares of the Feeder Funds.
| KINETICS MUTUAL FUNDS, INC. — THE FEEDER FUNDS |
Notes to Financial Statements — (Continued) |
| June 30, 2014 (Unaudited) |
For the six months ended June 30, 2014, the Feeder Funds were allocated $13,000 for the services of the Chief Compliance Officer employed by the Adviser.
The Company, on behalf of the Feeder Funds, has adopted two Retail Distribution Plans pursuant to Rule 12b-1 under the 1940 Act (the “12b-1Plans”). One Plan is for Advisor Class A shares, while the other Plan is for Advisor Class C shares. Under the first Plan, Advisor Class A shares may pay up to an annual rate of 0.50% of the average daily net asset value of Advisor Class A shares to the Distributor or other qualified recipients under the Plan. During the six months ended June 30, 2014, payments under the 12b-1 Plan for the Advisor Class A shares of the Internet, Global, Paradigm, Medical, Small Cap, Market Opportunities, Alternative Income, and Multi-Disciplinary Funds were limited to 0.25% of the average daily net asset value of such shares of such Funds. During the six months ended June 30, 2014, the Advisor Class A shares of the Internet, Global, Paradigm, Medical, Small Cap, Market Opportunities, Alternative Income, and Multi-Disciplinary Funds incurred expenses of $6,650, $2,291, $260,880, $5,840, $37,670, $13,530, $4,094 and $37,906 respectively, pursuant to the 12b-1 Plan. Under the second Plan, Advisor Class C shares pay an annual rate of 0.75% of the average daily net asset value of such shares. During the six months ended June 30, 2014, Internet, Global, Paradigm, Medical, Small Cap, Market Opportunities, Alternative Income, and Multi-Disciplinary Funds Advisor Class C Shares incurred expenses of $4,078, $5,822, $520,198, $2,126, $40,561, $21,081, $6,089 and $41,958, respectively, pursuant to the 12b-1 Plan.
Kinetics Funds Distributor, LLC (the “Distributor”) acts as the Funds’ principal underwriter in a continuous public offering of the Feeder Funds’ shares. The Distributor is an affiliate of the Adviser. For the six months ended June 30, 2014, the Distributor received $4,804, $687, $51,881, $624, $12,063, $1,794, $305, and $161 from sales loads from the Internet, Global, Paradigm, Medical, Small Cap, Market Opportunities, Alternative Income, and Multi-Disciplinary Funds.
4. Reclassification of Capital Accounts
GAAP requires that certain components of net assets relating to permanent differences be reclassified between financial and tax reporting. These reclassifications have no effect on net assets or net asset value per share. For the year ended December 31, 2013, each Fund recorded the following reclassifications to the accounts listed below:
| KINETICS MUTUAL FUNDS, INC. — THE FEEDER FUNDS |
Notes to Financial Statements — (Continued) |
| June 30, 2014 (Unaudited) |
| | | INCREASE/(DECREASE) | |
| | | | | | Accumulated | | | | |
| | | | | | Net | | | Accumulated | |
| | | | | | Investment | | | Net Realized | |
| | | | | | Income | | | Gain | |
| | | Paid In Capital | | | (Loss) | | | (Loss) | |
| Internet | | $ | (2,073,487 | ) | | $ | 2,328,094 | | | $ | (254,607 | ) |
| Global | | | – | | | | 53,671 | | | | (53,671 | ) |
| Paradigm | | | (11,104,043 | ) | | | 13,673,332 | | | | (2,569,289 | ) |
| Medical | | | – | | | | (2,064 | ) | | | 2,064 | |
| Small Cap | | | 948,572 | | | | (262,869 | ) | | | (685,703 | ) |
| Market Opportunities | | | (91,727 | ) | | | 799,552 | | | | (707,825 | ) |
| Alternative Income | | | (145,322 | ) | | | 126,512 | | | | 18,810 | |
| Multi-Disciplinary | | | – | | | | 187,120 | | | | (187,120 | ) |
5. Income Taxes
At December 31, 2013 the Internet, Global, Paradigm, Medical, Small Cap, Market Opportunities, Alternative Income, and Multi-Disciplinary Funds had $0, $966, $0, $0, $260,462, $0, $0, and $453,666, respectively, of undistributed net investment income on a tax basis.
At December 31, 2013, the Internet and Multi-Disciplinary Funds had $5,361,037 and $17,495, respectively, of accumulated net realized gains on a tax basis.
At December 31, 2013, the Feeder Funds had accumulated net realized capital loss carryforwards expiring in the following years:
| | | | | | | | | | | | No | | | No | |
| | | | | | | | | | | | Expiration | | | Expiration | |
| Feeder Fund | | 2016 | | | 2017 | | | 2018 | | | Short-term | | | Long-term | |
| Internet | | $ | — | | | $ | — | | | $ | — | | | $ | — | | | $ | — | |
| Global | | | — | | | | (367,030 | ) | | | — | | | | — | | | | — | |
| Paradigm | | | (205,745,172 | ) | | | (445,505,345 | ) | | | (115,786,082 | ) | | | (1,814,849 | ) | | | — | |
| Medical | | | — | | | | — | | | | — | | | | — | | | | (342,501 | ) |
| Small Cap | | | (53,244,496 | ) | | | (96,486,615 | ) | | | (8,224,702 | ) | | | — | | | | — | |
| Market Opportunities | | | (16,707,598 | ) | | | (6,623,055 | ) | | | (2,108,533 | ) | | | — | | | | — | |
| Alternative Income | | | (987,119 | ) | | | (4,868,599 | ) | | | (2,203,647 | ) | | | — | | | | — | |
| Multi-Disciplinary | | | — | | | | — | | | | — | | | | — | | | | — | |
As a result of the Regulated Investment Company Modernization Act of 2010 (the “Modernization Act”), losses incurred in this fiscal year and beyond retain their character, short-term or long-term, have no expiration date and are utilized prior to capital loss carryforwards accumulated before the enactment of the Modernization Act.
| KINETICS MUTUAL FUNDS, INC. — THE FEEDER FUNDS |
Notes to Financial Statements — (Continued) |
| June 30, 2014 (Unaudited) |
For the year ended December 31, 2013, the following Feeder Funds utilized capital loss carryforwards:
| | | Capital Loss | |
| Fund | | Carryforward | |
| Global | | $ | 36,284 | |
| Small Cap | | | 1,332,607 | |
| Market Opportunities | | | 3,947,393 | |
| Alternative | | | 1,652 | |
At December 31, 2013, the following Feeder Funds deferred, on a tax basis, post-October losses:
| | | Post-October | | | Post-October | |
| Feeder Fund | | Losses | | | Currency Losses | |
| Internet | | $ | (36,653 | ) | | | — | |
| Paradigm | | | — | | | $ | (825,325 | ) |
| Medical | | | — | | | | (39,071 | ) |
| Market Opportunities | | | — | | | | (107,573 | ) |
The tax components of dividends paid during the years ended December 31, 2013 and December 31, 2012, are:
| | | Internet | | Global | |
| | | Ordinary | | Long-Term | | Ordinary | | Long-Term | |
| | | Income | | Capital Gains | | Income | | Capital Gains | |
| | | Distribution | | Distribution | | Distribution | | Distribution | |
| 2013 | | $ | — | | | $ | 8,711,382 | | | $ | 12,940 | | | $ | — | |
| 2012 | | $ | — | | | $ | 5,260,270 | | | $ | 156,516 | | | $ | — | |
| | | | | | | | | | | | | | | | | |
| | | Paradigm | | Medical | |
| | | Ordinary | | Long-Term | | Ordinary | | | Long-Term | |
| | | Income | | Capital Gains | | Income | | | Capital Gains | |
| | | Distribution | | Distribution | | Distribution | | | Distribution | |
| 2013 | | $ | 7,266,782 | | | $ | — | | | $ | 52,349 | | | $ | 144,235 | |
| 2012 | | $ | 3,816,172 | | | $ | — | | | $ | 301,886 | | | $ | 1,910,710 | |
| | | | | | | | | | | | | | | | | |
| | | Small Cap | | Market Opportunities | |
| | | Ordinary | | Long-Term | | Ordinary | | | Long-Term | |
| | | Income | | Capital Gains | | Income | | | Capital Gains | |
| | | Distribution | | Distribution | | Distribution | | | Distribution | |
| 2013 | | $ | — | | | $ | — | | | $ | 244,013 | | | $ | — | |
| 2012 | | $ | — | | | $ | — | | | $ | 654,956 | | | $ | — | |
| KINETICS MUTUAL FUNDS, INC. — THE FEEDER FUNDS |
Notes to Financial Statements — (Continued) |
| June 30, 2014 (Unaudited) |
| | | Alternative Income | | | Multi-Disciplinary | |
| | | Ordinary | | | Long-Term | | | Ordinary | | | Long-Term | |
| | | Income | | | Capital Gains | | | Income | | | Capital Gains | |
| | | Distribution | | | Distribution | | | Distribution | | | Distribution | |
| 2013 | | $ | — | | | $ | — | | | $ | 3,590,035 | | | $ | 491,855 | |
| 2012 | | $ | 251,325 | | | $ | — | | | $ | 2,322,725 | | | $ | — | |
6. Tax Information
The Global, Paradigm, Medical, and Market Opportunities Funds designate 49%, 100%, 100% and 84%, respectively, of dividends declared after December 31, 2013 from net investment income as qualified dividend income under the Jobs and Growth Tax Relief Reconciliation Act of 2003.
The Internet, Global, Paradigm, Medical, Small Cap, Market Opportunities, Alternative Income, and Multi-Disciplinary Funds hereby designate 0%, 100%, 100%, 27%, 0%, 100%, 0% and 88%, respectively, as ordinary income distributions and 100%, 73% and 12% for the Internet, Medical and Multi-Disciplinary Funds as long-term capital gain distributions for the purposes of the dividends paid deduction, which include earnings and profits distributed to shareholders on redemptions of Fund shares.
For corporate shareholders in the Feeder Funds, the percentage of ordinary dividend income distributed for the year ended December 31, 2013, which is designated as qualifying for the dividends-received deduction, is as follows: Global 22%, Paradigm 100%, Medical 100%, and Market Opportunities 63%. The Multi-Disciplinary Fund designates 100% of its ordinary income distributions for the fiscal year ended December 31, 2013 as interest-related dividends under Internal Revenue Code Section 871(k)(l)(C).
The Multi-Disciplinary Fund designates 38% of its ordinary income distribution as a short-term capital gain distribution under Internal Revenue Code Section 871(k)(2)(C).
7. Information about Proxy Voting
Information regarding how the Company and the Master Portfolios vote proxies relating to portfolio securities is available without charge, upon request by calling toll-free at 1-800-930-3828 or by accessing the Company’s website at www.kineticsfunds.com and by accessing the SEC’s website at www.sec.gov. Information regarding how the Feeder Funds and the Master Portfolios voted
| KINETICS MUTUAL FUNDS, INC. — THE FEEDER FUNDS |
Notes to Financial Statements — (Continued) |
| June 30, 2014 (Unaudited) |
proxies relating to portfolio securities during the most recent twelve month period ended June 30, is available without charge, upon request, by calling toll-free at 1-800-930-3828 or by accessing the SEC’s website at www.sec.gov.
8. Information about the Portfolio Holdings
The Feeder Funds file their complete schedule of portfolio holdings for their first and third fiscal quarters with the SEC on Form N-Q. The Feeder Funds’ Form N-Q is available without charge, upon request, by calling toll-free at 1-800-930-3828. Furthermore, you can obtain the Form N-Q on the SEC’s website at www.sec.gov. Finally, the Form N-Q may be reviewed and copied at the SEC’s Public Reference Room in Washington, D.C. Information on the operation of the Public Reference Room may be obtained by calling 1-800-SEC-0330.
9. Subsequent Events
Effective July 7, 2014, The Multi-Disciplinary Fund changed its name to The Multi-Disciplinary Income Fund. The Multi-Disciplinary Portfolio made corresponding changes to its name on July 7, 2014.
KINETICS MUTUAL FUNDS, INC. — THE FEEDER FUNDS
| | | The Internet Fund | |
| | | No Load Class | |
| | | For the | | | | | | | | | | | | | | | | |
| | | Six Months | | | For the | | | For the | | | For the | | | For the | | | For the | |
| | | Ended | | | Year Ended | | | Year Ended | | | Year Ended | | | Year Ended | | | Year Ended | |
| | | June 30, 2014 | | | December 31, | | | December 31, | | | December 31, | | | December 31, | | | December 31, | |
| | | (Unaudited) | | | 2013 | | | 2012 | | | 2011 | | | 2010 | | | 2009 | |
PER SHARE DATA:(1) | | | | | | | | | | | | | | | | | | |
| Net Asset Value, | | | | | | | | | | | | | | | | | | |
| Beginning of Period | | $ | 59.27 | | | $ | 43.18 | | | $ | 36.26 | | | $ | 37.25 | | | $ | 30.74 | | | $ | 20.71 | |
| Income from Investment Operations: | | | | | | | | | | | | | | | | | | | | | | | | |
Net investment loss(2) | | | (0.37 | ) | | | (0.67 | ) | | | (0.15 | ) | | | (0.37 | ) | | | (0.28 | ) | | | (0.14 | ) |
| Net realized and unrealized gain | | | | | | | | | | | | | | | | | | | | | | | | |
| (loss) on investments | | | (1.04 | ) | | | 19.78 | | | | 8.56 | | | | (0.37 | ) | | | 6.79 | | | | 10.21 | |
| Total from investment | | | | | | | | | | | | | | | | | | | | | | | | |
| operations | | | (1.41 | ) | | | 19.11 | | | | 8.41 | | | | (0.74 | ) | | | 6.51 | | | | 10.07 | |
Redemption Fees(3) | | | 0.00 | | | | 0.00 | | | | 0.00 | | | | 0.00 | | | | 0.00 | | | | 0.00 | |
| Less Distributions: | | | | | | | | | | | | | | | | | | | | | | | | |
| From net investment income | | | — | | | | — | | | | — | | | | — | | | | — | | | | (0.04 | ) |
| From net realized gains | | | — | | | | (3.02 | ) | | | (1.49 | ) | | | (0.25 | ) | | | — | | | | — | |
| Total distributions | | | — | | | | (3.02 | ) | | | (1.49 | ) | | | (0.25 | ) | | | — | | | | (0.04 | ) |
| Net Asset Value, End of Period | | $ | 57.86 | | | $ | 59.27 | | | $ | 43.18 | | | $ | 36.26 | | | $ | 37.25 | | | $ | 30.74 | |
| Total return | | | (2.38 | )%(4) | | | 44.28 | % | | | 23.24 | % | | | (1.98 | )% | | | 21.18 | % | | | 48.61 | % |
| | | | | | | | | | | | | | | | | | | | | | | | | |
| SUPPLEMENTAL DATA AND RATIOS | | | | | | | | | | | | | | | | | | | | | | | | |
| Net assets, end of period (000’s) | | $ | 161,688 | | | $ | 172,332 | | | $ | 155,036 | | | $ | 103,828 | | | $ | 113,085 | | | $ | 104,666 | |
| Ratio of operating expenses to | | | | | | | | | | | | | | | | | | | | | | | | |
| average net assets: | | | | | | | | | | | | | | | | | | | | | | | | |
| Before expense reimbursement | | | 1.78 | %(5) | | | 1.84 | % | | | 1.94 | % | | | 1.94 | % | | | 1.95 | % | | | 1.98 | % |
After expense reimbursement(6) | | | 1.78 | %(5) | | | 1.84 | % | | | 1.89 | % | | | 1.89 | % | | | 1.89 | % | | | 1.89 | % |
| Ratio of net investment income | | | | | | | | | | | | | | | | | | | | | | | | |
| (loss) to average net assets: | | | | | | | | | | | | | | | | | | | | | | | | |
| Before expense reimbursement | | | (1.31 | )%(5) | | | (1.30 | )% | | | (0.41 | )% | | | (0.99 | )% | | | (0.91 | )% | | | (0.64 | )% |
After expense reimbursement(6) | | | (1.31 | )%(5) | | | (1.30 | )% | | | (0.36 | )% | | | (0.94 | )% | | | (0.85 | )% | | | (0.55 | )% |
Portfolio turnover rate(7) | | | 0 | % | | | 8 | % | | | 9 | % | | | 32 | % | | | 12 | % | | | 14 | % |
| | |
| (1) | Information presented relates to a share of capital stock outstanding for each period. |
| (2) | Net investment income per share represents net investment income divided by the average shares outstanding throughout the period. |
| (3) | Amount calculated is less than $0.005. |
| (4) | Not annualized. |
| (5) | Annualized. |
| (6) | See Note #3, Investment Adviser, for the waiver and expense reimbursement discussion. |
| (7) | Portfolio turnover of The Internet Portfolio. |
The accompanying notes are an integral part of these financial statements.
| KINETICS MUTUAL FUNDS, INC. — THE FEEDER FUNDS |
Financial Highlights — (Continued) |
| | | The Internet Fund | |
| | | Advisor Class A | |
| | | For the Six Months Ended June 30, 2014 (Unaudited) | | | For the Year Ended December 31, 2013 | | | For the Year Ended December 31, 2012 | | | For the Year Ended December 31, 2011 | | | For the Year Ended December 31, 2010 | | | For the Year Ended December 31, 2009 | |
PER SHARE DATA:(1) | | | | | | | | | | | | | | | | | | |
| Net Asset Value, Beginning | | | | | | | | | | | | | | | | | | |
| of Period | | $ | 57.84 | | | $ | 42.30 | | | $ | 35.63 | | | $ | 36.69 | | | $ | 30.35 | | | $ | 20.50 | |
| Income from Investment | | | | | | | | | | | | | | | | | | | | | | | | |
| Operations: | | | | | | | | | | | | | | | | | | | | | | | | |
Net investment loss(2) | | | (0.43 | ) | | | (0.81 | ) | | | (0.24 | ) | | | (0.46 | ) | | | (0.36 | ) | | | (0.21 | ) |
| Net realized and unrealized | | | | | | | | | | | | | | | | | | | | | | | | |
| gain (loss) on investments | | | (1.01 | ) | | | 19.36 | | | | 8.40 | | | | (0.36 | ) | | | 6.70 | | | | 10.09 | |
| Total from investment | | | | | | | | | | | | | | | | | | | | | | | | |
| operations | | | (1.44 | ) | | | 18.55 | | | | 8.16 | | | | (0.82 | ) | | | 6.34 | | | | 9.88 | |
| Redemption Fees | | | 0.00 | (3) | | | 0.01 | | | | — | | | | 0.01 | | | | 0.00 | (3) | | | 0.01 | |
| Less Distributions: | | | | | | | | | | | | | | | | | | | | | | | | |
| From net investment income | | | — | | | | — | | | | — | | | | — | | | | — | | | | (0.04 | ) |
| From net realized gains | | | — | | | | (3.02 | ) | | | (1.49 | ) | | | (0.25 | ) | | | — | | | | — | |
| Total distributions | | | — | | | | (3.02 | ) | | | (1.49 | ) | | | (0.25 | ) | | | — | | | | (0.04 | ) |
| Net Asset Value, End of Period | | $ | 56.40 | | | $ | 57.84 | | | $ | 42.30 | | | $ | 35.63 | | | $ | 36.69 | | | $ | 30.35 | |
Total return(4) | | | (2.49 | )%(5) | | | 43.94 | % | | | 22.92 | % | | | (2.20 | )% | | | 20.89 | % | | | 48.23 | % |
| | | | | | | | | | | | | | | | | | | | | | | | | |
| SUPPLEMENTAL DATA AND RATIOS | | | | | | | | | | | | | | | | | | | | | | | | |
| Net assets, end of period (000’s) | | $ | 5,117 | | | $ | 5,506 | | | $ | 1,379 | | | $ | 1,050 | | | $ | 1,892 | | | $ | 738 | |
| Ratio of operating expenses to | | | | | | | | | | | | | | | | | | | | | | | | |
| average net assets: | | | | | | | | | | | | | | | | | | | | | | | | |
| Before expense | | | | | | | | | | | | | | | | | | | | | | | | |
| reimbursement | | | 2.03 | %(6) | | | 2.09 | % | | | 2.19 | % | | | 2.19 | % | | | 2.20 | % | | | 2.23 | % |
| After expense | | | | | | | | | | | | | | | | | | | | | | | | |
reimbursement(7) | | | 2.03 | %(6) | | | 2.09 | % | | | 2.14 | % | | | 2.14 | % | | | 2.14 | % | | | 2.14 | % |
| Ratio of net investment loss to | | | | | | | | | | | | | | | | | | | | | | | | |
| average net assets: | | | | | | | | | | | | | | | | | | | | | | | | |
| Before expense reimbursement | | | (1.56 | )%(6) | | | (1.55 | )% | | | (0.66 | )% | | | (1.24 | )% | | | (1.16 | )% | | | (0.89 | )% |
After expense reimbursement(7) | | | (1.56 | )%(6) | | | (1.55 | )% | | | (0.61 | )% | | | (1.19 | )% | | | (1.10 | )% | | | (0.80 | )% |
Portfolio turnover rate(8) | | | 0 | % | | | 8 | % | | | 9 | % | | | 32 | % | | | 12 | % | | | 14 | % |
| (1) | Information presented relates to a share of capital stock outstanding for each period. |
| (2) | Net investment income per share represents net investment income divided by the average shares outstanding throughout the period. |
| (3) | Amount calculated is less than $0.005. |
| (4) | The total return calculation does not reflect the 5.75% front end sales charge on Advisor Class A shares. |
| (5) | Not annualized. |
| (6) | Annualized. |
| (7) | See Note #3, Investment Adviser, for the waiver and expense reimbursement discussion. |
| (8) | Portfolio turnover of The Internet Portfolio. |
The accompanying notes are an integral part of these financial statements.
| KINETICS MUTUAL FUNDS, INC. — THE FEEDER FUNDS |
Financial Highlights — (Continued) |
| | | The Internet Fund | |
| | | Advisor Class C | |
| | | For the Six Months Ended June 30, 2014 (Unaudited) | | | For the Year Ended December 31, 2013 | | | For the Year Ended December 31, 2012 | | | For the Year Ended December 31, 2011 | | | For the Year Ended December 31, 2010 | | | For the Year Ended December 31, 2009 | |
PER SHARE DATA:(1) | | | | | | | | | | | | | | | | | | |
| Net Asset Value, Beginning | | | | | | | | | | | | | | | | | | |
| of Period | | $ | 55.38 | | | $ | 40.79 | | | $ | 34.58 | | | $ | 35.79 | | | $ | 29.76 | | | $ | 20.20 | |
| Income from Investment | | | | | | | | | | | | | | | | | | | | | | | | |
| Operations: | | | | | | | | | | | | | | | | | | | | | | | | |
Net investment loss(2) | | | (0.54 | ) | | | (1.03 | ) | | | (0.43 | ) | | | (0.63 | ) | | | (0.51 | ) | | | (0.31 | ) |
| Net realized and unrealized gain | | | | | | | | | | | | | | | | | | | | | | | | |
| (loss) on investments | | | (0.98 | ) | | | 18.64 | | | | 8.13 | | | | (0.34 | ) | | | 6.54 | | | | 9.91 | |
| Total from investment | | | | | | | | | | | | | | | | | | | | | | | | |
| operations | | | (1.52 | ) | | | 17.61 | | | | 7.70 | | | | (0.97 | ) | | | 6.03 | | | | 9.60 | |
| Redemption Fees | | | — | | | | — | | | | — | | | | 0.01 | | | | — | | | | — | |
| Less Distributions: | | | | | | | | | | | | | | | | | | | | | | | | |
| From net investment income | | | — | | | | — | | | | — | | | | — | | | | — | | | | (0.04 | ) |
| From net realized gains | | | — | | | | (3.02 | ) | | | (1.49 | ) | | | (0.25 | ) | | | — | | | | — | |
| Total distributions | | | — | | | | (3.02 | ) | | | (1.49 | ) | | | (0.25 | ) | | | — | | | | (0.04 | ) |
| Net Asset Value, End of Period | | $ | 53.86 | | | $ | 55.38 | | | $ | 40.79 | | | $ | 34.58 | | | $ | 35.79 | | | $ | 29.76 | |
| Total return | | | (2.74 | )%(3) | | | 43.20 | % | | | 22.32 | % | | | (2.67 | )% | | | 20.26 | % | | | 47.51 | % |
| | | | | | | | | | | | | | | | | | | | | | | | | |
| SUPPLEMENTAL DATA AND RATIOS | | | | | | | | | | | | | | | | | | | | | | | | |
| Net assets, end of period (000’s) | | $ | 1,154 | | | $ | 913 | | | $ | 185 | | | $ | 103 | | | $ | 196 | | | $ | 120 | |
| Ratio of operating expenses to | | | | | | | | | | | | | | | | | | | | | | | | |
| average net assets: | | | | | | | | | | | | | | | | | | | | | | | | |
| Before expense | | | | | | | | | | | | | | | | | | | | | | | | |
| reimbursement | | | 2.53 | %(4) | | | 2.59 | % | | | 2.69 | % | | | 2.69 | % | | | 2.70 | % | | | 2.73 | % |
| After expense | | | | | | | | | | | | | | | | | | | | | | | | |
reimbursement(5) | | | 2.53 | %(4) | | | 2.59 | % | | | 2.64 | % | | | 2.64 | % | | | 2.64 | % | | | 2.64 | % |
| Ratio of net investment loss to | | | | | | | | | | | | | | | | | | | | | | | | |
| average net assets: | | | | | | | | | | | | | | | | | | | | | | | | |
| Before expense reimbursement | | | (2.06 | )%(4) | | | (2.05 | )% | | | (1.16 | )% | | | (1.74 | )% | | | (1.66 | )% | | | (1.39 | )% |
After expense reimbursement(5) | | | (2.06 | )%(4) | | | (2.05 | )% | | | (1.11 | )% | | | (1.69 | )% | | | (1.60 | )% | | | (1.30 | )% |
Portfolio turnover rate(6) | | | 0 | % | | | 8 | % | | | 9 | % | | | 32 | % | | | 12 | % | | | 14 | % |
| (1) | Information presented relates to a share of capital stock outstanding for each period. |
| (2) | Net investment income per share represents net investment income divided by the average shares outstanding throughout the period. |
| (3) | Not annualized. |
| (4) | Annualized. |
| (5) | See Note #3, Investment Adviser, for the waiver and expense reimbursement discussion. |
| (6) | Portfolio turnover of The Internet Portfolio. |
The accompanying notes are an integral part of these financial statements.
| KINETICS MUTUAL FUNDS, INC. — THE FEEDER FUNDS |
Financial Highlights — (Continued) |
| | | The Global Fund | |
| | | No Load Class | |
| | | For the Six Months Ended June 30, 2014 (Unaudited) | | | For the Year Ended December 31, 2013 | | | For the Year Ended December 31, 2012 | | | For the Year Ended December 31, 2011 | | | For the Year Ended December 31, 2010 | | | For the Year Ended December 31, 2009 | |
PER SHARE DATA:(1) | | | | | | | | | | | | | | | | | | |
| Net Asset Value, Beginning | | | | | | | | | | | | | | | | | | |
| of Period | | $ | 6.05 | | | $ | 4.71 | | | $ | 3.92 | | | $ | 4.67 | | | $ | 3.92 | | | $ | 2.36 | |
| Income from Investment Operations: | | | | | | | | | | | | | | | | | | | | | | | | |
Net investment income (loss)(2) | | | (0.01 | ) | | | 0.01 | | | | 0.03 | | | | 0.06 | | | | 0.02 | | | | 0.02 | |
| Net realized and unrealized gain | | | | | | | | | | | | | | | | | | | | | | | | |
| (loss) on investments | | | 0.18 | | | | 1.34 | | | | 0.88 | | | | (0.78 | ) | | | 0.78 | | | | 1.55 | |
| Total from investment | | | | | | | | | | | | | | | | | | | | | | | | |
| operations | | | 0.17 | | | | 1.35 | | | | 0.91 | | | | (0.72 | ) | | | 0.80 | | | | 1.57 | |
| Redemption Fees | | | 0.00 | (3) | | | 0.00 | (3) | | | 0.00 | (3) | | | 0.00 | (3) | | | 0.00 | (3) | | | 0.01 | |
| Less Distributions: | | | | | | | | | | | | | | | | | | | | | | | | |
| From net investment income | | | — | | | | (0.01 | ) | | | (0.12 | ) | | | (0.03 | ) | | | (0.05 | ) | | | (0.02 | ) |
| Total distributions | | | — | | | | (0.01 | ) | | | (0.12 | ) | | | (0.03 | ) | | | (0.05 | ) | | | (0.02 | ) |
Net Asset Value, End of Period | | $ | 6.22 | | | $ | 6.05 | | | $ | 4.71 | | | $ | 3.92 | | | $ | 4.67 | | | $ | 3.92 | |
| Total return | | | 2.81 | %(4) | | | 28.59 | % | | | 23.16 | % | | | (15.41 | )% | | | 20.30 | % | | | 66.86 | % |
| | | | | | | | | | | | | | | | | | | | | | | | | |
| SUPPLEMENTAL DATA AND RATIOS | | | | | | | | | | | | | | | | | | | | | | | | |
| Net assets, end of period (000’s) | | $ | 8,130 | | | $ | 8,705 | | | $ | 5,069 | | | $ | 3,631 | | | $ | 4,541 | | | $ | 4,370 | |
| Ratio of operating expenses to | | | | | | | | | | | | | | | | | | | | | | | | |
| average net assets: | | | | | | | | | | | | | | | | | | | | | | | | |
| Before expense reimbursement | | | 2.51 | %(5) | | | 2.83 | % | | | 3.38 | % | | | 3.94 | % | | | 4.17 | % | | | 5.32 | % |
After expense reimbursement(6) | | | 1.39 | %(5) | | | 1.39 | % | | | 1.39 | % | | | 1.39 | % | | | 1.39 | % | | | 1.39 | % |
| Ratio of net investment income (loss) | | | | | | | | | | | | | | | | | | | | | | | | |
| to average net assets: | | | | | | | | | | | | | | | | | | | | | | | | |
| Before expense reimbursement | | | (1.46 | )%(5) | | | (1.22 | )% | | | (1.22 | )% | | | (1.11 | )% | | | (2.26 | )% | | | (3.27 | )% |
After expense reimbursement(6) | | | (0.34 | )%(5) | | | 0.22 | % | | | 0.77 | % | | | 1.44 | % | | | 0.52 | % | | | 0.66 | % |
Portfolio turnover rate(7) | | | 12 | % | | | 15 | % | | | 23 | % | | | 135 | % | | | 122 | % | | | 53 | % |
| (1) | Information presented relates to a share of capital stock outstanding for each period. |
| (2) | Net investment income per share represents net investment income divided by the average shares outstanding throughout the period. |
| (3) | Amount calculated is less than $0.005. |
| (4) | Not annualized. |
| (5) | Annualized. |
| (6) | See Note #3, Investment Adviser, for the waiver and expense reimbursement discussion. |
| (7) | Portfolio turnover of The Global Portfolio. |
The accompanying notes are an integral part of these financial statements.
| KINETICS MUTUAL FUNDS, INC. — THE FEEDER FUNDS |
Financial Highlights — (Continued) |
| | | The Global Fund | |
| | | Advisor Class A | |
| | | For the Six Months Ended June 30, 2014 (Unaudited) | | | For the Year Ended December 31, 2013 | | | For the Year Ended December 31, 2012 | | | For the Year Ended December 31, 2011 | | | For the Year Ended December 31, 2010 | | | For the Year Ended December 31, 2009 | |
PER SHARE DATA:(1) | | | | | | | | | | | | | | | | | | |
| Net Asset Value, Beginning | | | | | | | | | | | | | | | | | | |
| of Period | | $ | 6.03 | | | $ | 4.71 | | | $ | 3.92 | | | $ | 4.68 | | | $ | 3.93 | | | $ | 2.36 | |
| Income from Investment Operations: | | | | | | | | | | | | | | | | | | | | | | | | |
Net investment income (loss)(2) | | | (0.02 | ) | | | (0.00 | )(3) | | | 0.02 | | | | 0.05 | | | | 0.01 | | | | 0.01 | |
| Net realized and unrealized gain | | | | | | | | | | | | | | | | | | | | | | | | |
| (loss) on investments | | | 0.19 | | | | 1.33 | | | | 0.88 | | | | (0.78 | ) | | | 0.78 | | | | 1.57 | |
| Total from investment | | | | | | | | | | | | | | | | | | | | | | | | |
| operations | | | 0.17 | | | | 1.33 | | | | 0.90 | | | | (0.73 | ) | | | 0.79 | | | | 1.58 | |
| Redemption Fees | | | 0.00 | (3) | | | 0.00 | (3) | | | 0.00 | (3) | | | 0.00 | (3) | | | 0.00 | (3) | | | — | |
| Less Distributions: | | | | | | | | | | | | | | | | | | | | | | | | |
| From net investment income | | | — | | | | (0.01 | ) | | | (0.11 | ) | | | (0.03 | ) | | | (0.04 | ) | | | (0.01 | ) |
| Total distributions | | | — | | | | (0.01 | ) | | | (0.11 | ) | | | (0.03 | ) | | | (0.04 | ) | | | (0.01 | ) |
Net Asset Value, End of Period | | $ | 6.20 | | | $ | 6.03 | | | $ | 4.71 | | | $ | 3.92 | | | $ | 4.68 | | | $ | 3.93 | |
Total return(4) | | | 2.82 | %(5) | | | 28.16 | % | | | 22.94 | % | | | (15.59 | )% | | | 20.04 | % | | | 67.11 | % |
| | | | | | | | | | | | | | | | | | | | | | | | | |
| SUPPLEMENTAL DATA AND RATIOS | | | | | | | | | | | | | | | | | | | | | | | | |
| Net assets, end of period (000’s) | | $ | 1,034 | | | $ | 1,992 | | | $ | 1,093 | | | $ | 392 | | | $ | 707 | | | $ | 368 | |
| Ratio of operating expenses to | | | | | | | | | | | | | | | | | | | | | | | | |
| average net assets: | | | | | | | | | | | | | | | | | | | | | | | | |
| Before expense reimbursement | | | 2.76 | %(6) | | | 3.08 | % | | | 3.63 | % | | | 4.19 | % | | | 4.42 | % | | | 5.57 | % |
After expense reimbursement(7) | | | 1.64 | %(6) | | | 1.64 | % | | | 1.64 | % | | | 1.64 | % | | | 1.64 | % | | | 1.64 | % |
| Ratio of net investment income (loss) | | | | | | | | | | | | | | | | | | | | | | | | |
| to average net assets: | | | | | | | | | | | | | | | | | | | | | | | | |
| Before expense reimbursement | | | (1.71 | )%(6) | | | (1.47 | )% | | | (1.47 | )% | | | (1.36 | )% | | | (2.51 | )% | | | (3.52 | )% |
After expense reimbursement(7) | | | (0.59 | )%(6) | | | (0.03 | )% | | | 0.52 | % | | | 1.19 | % | | | 0.27 | % | | | 0.41 | % |
Portfolio turnover rate(8) | | | 12 | % | | | 15 | % | | | 23 | % | | | 135 | % | | | 122 | % | | | 53 | % |
| (1) | Information presented relates to a share of capital stock outstanding for each period. |
| (2) | Net investment income per share represents net investment income divided by the average shares outstanding throughout the period. |
| (3) | Amount calculated is less than $0.005. |
| (4) | The total return calculation does not reflect the 5.75% front end sales charge on Advisor Class A shares. |
| (5) | Not annualized. |
| (6) | Annualized. |
| (7) | See Note #3, Investment Adviser, for the waiver and expense reimbursement discussion. |
| (8) | Portfolio turnover of The Global Portfolio. |
The accompanying notes are an integral part of these financial statements.
| KINETICS MUTUAL FUNDS, INC. — THE FEEDER FUNDS |
Financial Highlights — (Continued) |
| | | The Global Fund | |
| | | Advisor Class C | |
| | | For the Six Months Ended June 30, 2014 (Unaudited) | | | For the Year Ended December 31, 2013 | | | For the Year Ended December 31, 2012 | | | For the Year Ended December 31, 2011 | | | For the Year Ended December 31, 2010 | | | For the Year Ended December 31, 2009 | |
PER SHARE DATA:(1) | | | | | | | | | | | | | | | | | | |
| Net Asset Value, Beginning | | | | | | | | | | | | | | | | | | |
| of Period | | $ | 5.90 | | | $ | 4.62 | | | $ | 3.87 | | | $ | 4.64 | | | $ | 3.90 | | | $ | 2.37 | |
| Income from Investment Operations: | | | | | | | | | | | | | | | | | | | | | | | | |
Net investment income (loss)(2) | | | (0.03 | ) | | | (0.03 | ) | | | 0.00 | (3) | | | 0.03 | | | | (0.01 | ) | | | 0.00 | (3) |
| Net realized and unrealized gain | | | | | | | | | | | | | | | | | | | | | | | | |
| (loss) on investments | | | 0.17 | | | | 1.32 | | | | 0.85 | | | | (0.77 | ) | | | 0.77 | | | | 1.53 | |
| Total from investment | | | | | | | | | | | | | | | | | | | | | | | | |
| operations | | | 0.14 | | | | 1.29 | | | | 0.85 | | | | (0.74 | ) | | | 0.76 | | | | 1.53 | |
| Redemption Fees | | | — | | | | — | | | | — | | | | — | | | | — | | | | — | |
| Less Distributions: | | | | | | | | | | | | | | | | | | | | | | | | |
| From net investment income | | | — | | | | (0.01 | ) | | | (0.10 | ) | | | (0.03 | ) | | | (0.02 | ) | | | (0.00 | )(3) |
| Total distributions | | | — | | | | (0.01 | ) | | | (0.10 | ) | | | (0.03 | ) | | | (0.02 | ) | | | (0.00 | )(3) |
Net Asset Value, End of Period | | $ | 6.04 | | | $ | 5.90 | | | $ | 4.62 | | | $ | 3.87 | | | $ | 4.64 | | | $ | 3.90 | |
| Total return | | | 2.37 | %(4) | | | 27.84 | % | | | 22.04 | % | | | (15.94 | )% | | | 19.24 | % | | | 65.08 | % |
| | | | | | | | | | | | | | | | | | | | | | | | | |
| SUPPLEMENTAL DATA AND RATIOS | | | | | | | | | | | | | | | | | | | | | | | | |
| Net assets, end of period (000’s) | | $ | 1,722 | | | $ | 1,523 | | | $ | 383 | | | $ | 111 | | | $ | 64 | | | $ | 36 | |
| Ratio of operating expenses to | | | | | | | | | | | | | | | | | | | | | | | | |
| average net assets: | | | | | | | | | | | | | | | | | | | | | | | | |
| Before expense reimbursement | | | 3.26 | %(5) | | | 3.58 | % | | | 4.13 | % | | | 4.69 | % | | | 4.92 | % | | | 6.07 | % |
After expense reimbursement(6) | | | 2.14 | %(5) | | | 2.14 | % | | | 2.14 | % | | | 2.14 | % | | | 2.14 | % | | | 2.14 | % |
| Ratio of net investment income (loss) | | | | | | | | | | | | | | | | | | | | | | | | |
| to average net assets: | | | | | | | | | | | | | | | | | | | | | | | | |
| Before expense reimbursement | | | (2.21 | )%(5) | | | (1.97 | )% | | | (1.97 | )% | | | (1.86 | )% | | | (3.01 | )% | | | (4.02 | )% |
After expense reimbursement(6) | | | (1.09 | )%(5) | | | (0.53 | )% | | | 0.02 | % | | | 0.69 | % | | | (0.23 | )% | | | (0.09 | )% |
Portfolio turnover rate(7) | | | 12 | % | | | 15 | % | | | 23 | % | | | 135 | % | | | 122 | % | | | 53 | % |
| (1) | Information presented relates to a share of capital stock outstanding for each period. |
| (2) | Net investment income per share represents net investment income divided by the average shares outstanding throughout the period. |
| (3) | Amount calculated is less than $0.005. |
| (4) | Not annualized. |
| (5) | Annualized. |
| (6) | See Note #3, Investment Adviser, for the waiver and expense reimbursement discussion. |
| (7) | Portfolio turnover of The Global Portfolio. |
The accompanying notes are an integral part of these financial statements.
| KINETICS MUTUAL FUNDS, INC. — THE FEEDER FUNDS |
Financial Highlights — (Continued) |
| | | The Paradigm Fund | |
| | | No Load Class | |
| | | For the Six Months Ended June 30, 2014 (Unaudited) | | | For the Year Ended December 31, 2013 | | | For the Year Ended December 31, 2012 | | | For the Year Ended December 31, 2011 | | | For the Year Ended December 31, 2010 | | | For the Year Ended December 31, 2009 | |
PER SHARE DATA:(1) | | | | | | | | | | | | | | | | | | |
| Net Asset Value, Beginning | | | | | | | | | | | | | | | | | | |
| of Period | | $ | 34.35 | | | $ | 23.99 | | | $ | 19.81 | | | $ | 23.31 | | | $ | 20.18 | | | $ | 14.42 | |
| Income from Investment Operations: | | | | | | | | | | | | | | | | | | | | | | | | |
Net investment income (loss)(2) | | | (0.18 | ) | | | (0.15 | ) | | | 0.05 | | | | 0.02 | | | | 0.11 | | | | 0.15 | |
| Net realized and unrealized gain | | | | | | | | | | | | | | | | | | | | | | | | |
| (loss) on investments | | | 1.78 | | | | 10.72 | | | | 4.25 | | | | (3.34 | ) | | | 3.39 | | | | 5.78 | |
| Total from investment | | | | | | | | | | | | | | | | | | | | | | | | |
| operations | | | 1.60 | | | | 10.57 | | | | 4.30 | | | | (3.32 | ) | | | 3.50 | | | | 5.93 | |
Redemption Fees(3) | | | 0.00 | | | | 0.00 | | | | 0.00 | | | | 0.00 | | | | 0.00 | | | | 0.00 | |
| Less Distributions: | | | | | | | | | | | | | | | | | | | | | | | | |
| From net investment income | | | — | | | | (0.21 | ) | | | (0.12 | ) | | | (0.18 | ) | | | (0.37 | ) | | | (0.17 | ) |
| Total distributions | | | — | | | | (0.21 | ) | | | (0.12 | ) | | | (0.18 | ) | | | (0.37 | ) | | | (0.17 | ) |
Net Asset Value, End of Period | | $ | 35.95 | | | $ | 34.35 | | | $ | 23.99 | | | $ | 19.81 | | | $ | 23.31 | | | $ | 20.18 | |
| Total return | | | 4.66 | %(4) | | | 44.07 | % | | | 21.78 | % | | | (14.27 | )% | | | 17.37 | % | | | 41.02 | % |
| | | | | | | | | | | | | | | | | | | | | | | | | |
| SUPPLEMENTAL DATA AND RATIOS | | | | | | | | | | | | | | | | | | | | | | | | |
| Net assets, end of period (000’s) | | $ | 604,912 | | | $ | 597,746 | | | $ | 416,696 | | | $ | 430,528 | | | $ | 687,056 | | | $ | 825,278 | |
| Ratio of operating expenses to | | | | | | | | | | | | | | | | | | | | | | | | |
| average net assets: | | | | | | | | | | | | | | | | | | | | | | | | |
| Before expense reimbursement | | | 1.69 | %(5) | | | 1.72 | % | | | 1.78 | % | | | 1.78 | % | | | 1.76 | % | | | 1.73 | % |
After expense reimbursement(6) | | | 1.64 | %(5) | | | 1.64 | % | | | 1.64 | % | | | 1.64 | % | | | 1.64 | % | | | 1.64 | % |
| Ratio of net investment income (loss) | | | | | | | | | | | | | | | | | | | | | | | | |
| to average net assets: | | | | | | | | | | | | | | | | | | | | | | | | |
| Before expense reimbursement | | | (1.07 | )%(5) | | | (0.60 | )% | | | 0.08 | % | | | (0.03 | )% | | | 0.43 | % | | | 0.78 | % |
After expense reimbursement(6) | | | (1.02 | )%(5) | | | (0.52 | )% | | | 0.22 | % | | | 0.11 | % | | | 0.55 | % | | | 0.87 | % |
Portfolio turnover rate(7) | | | 5 | % | | | 4 | % | | | 6 | % | | | 58 | % | | | 7 | % | | | 15 | % |
| (1) | Information presented relates to a share of capital stock outstanding for each period. |
| (2) | Net investment income per share represents net investment income divided by the average shares outstanding throughout the period. |
| (3) | Amount calculated is less than $0.005. |
| (4) | Not annualized. |
| (5) | Annualized. |
| (6) | See Note #3, Investment Adviser, for the waiver and expense reimbursement discussion. |
| (7) | Portfolio turnover of The Paradigm Portfolio. |
The accompanying notes are an integral part of these financial statements.
| KINETICS MUTUAL FUNDS, INC. — THE FEEDER FUNDS |
Financial Highlights — (Continued) |
| | | The Paradigm Fund | |
| | | Advisor Class A | |
| | | For the Six Months Ended June 30, 2014 (Unaudited) | | | For the Year Ended December 31, 2013 | | | For the Year Ended December 31, 2012 | | | For the Year Ended December 31, 2011 | | | For the Year Ended December 31, 2010 | | | For the Year Ended December 31, 2009 | |
PER SHARE DATA:(1) | | | | | | | | | | | | | | | | | | |
| Net Asset Value, Beginning | | | | | | | | | | | | | | | | | | |
| of Period | | $ | 33.74 | | | $ | 23.59 | | | $ | 19.45 | | | $ | 22.95 | | | $ | 19.88 | | | $ | 14.16 | |
| Income from Investment Operations: | | | | | | | | | | | | | | | | | | | | | | | | |
Net investment income (loss)(2) | | | (0.21 | ) | | | (0.22 | ) | | | (0.01 | ) | | | (0.03 | ) | | | 0.06 | | | | 0.10 | |
| Net realized and unrealized gain | | | | | | | | | | | | | | | | | | | | | | | | |
| (loss) on investments | | | 1.74 | | | | 10.53 | | | | 4.18 | | | | (3.29 | ) | | | 3.33 | | | | 5.68 | |
| Total from investment | | | | | | | | | | | | | | | | | | | | | | | | |
| operations | | | 1.53 | | | | 10.31 | | | | 4.17 | | | | (3.32 | ) | | | 3.39 | | | | 5.78 | |
| Redemption Fees | | | 0.00 | (3) | | | 0.00 | (3) | | | 0.00 | (3) | | | 0.00 | (3) | | | 0.00 | (3) | | | — | |
| Less Distributions: | | | | | | | | | | | | | | | | | | | | | | | | |
| From net investment income | | | — | | | | (0.16 | ) | | | (0.03 | ) | | | (0.18 | ) | | | (0.32 | ) | | | (0.06 | ) |
| Total distributions | | | — | | | | (0.16 | ) | | | (0.03 | ) | | | (0.18 | ) | | | (0.32 | ) | | | (0.06 | ) |
Net Asset Value, End of Period | | $ | 35.27 | | | $ | 33.74 | | | $ | 23.59 | | | $ | 19.45 | | | $ | 22.95 | | | $ | 19.88 | |
Total return(4) | | | 4.53 | %(5) | | | 43.70 | % | | | 21.49 | % | | | (14.49 | )% | | | 17.11 | % | | | 40.64 | % |
| | | | | | | | | | | | | | | | | | | | | | | | | |
| SUPPLEMENTAL DATA AND RATIOS | | | | | | | | | | | | | | | | | | | | | | | | |
| Net assets, end of period (000’s) | | $ | 224,423 | | | $ | 204,548 | | | $ | 135,747 | | | $ | 146,939 | | | $ | 226,264 | | | $ | 252,106 | |
| Ratio of operating expenses to | | | | | | | | | | | | | | | | | | | | | | | | |
| average net assets: | | | | | | | | | | | | | | | | | | | | | | | | |
| Before expense reimbursement | | | 1.94 | %(6) | | | 1.97 | % | | | 2.03 | % | | | 2.03 | % | | | 2.01 | % | | | 1.98 | % |
After expense reimbursement(7) | | | 1.89 | %(6) | | | 1.89 | % | | | 1.89 | % | | | 1.89 | % | | | 1.89 | % | | | 1.89 | % |
| Ratio of net investment income (loss) | | | | | | | | | | | | | | | | | | | | | | | | |
| to average net assets: | | | | | | | | | | | | | | | | | | | | | | | | |
| Before expense reimbursement | | | (1.32 | )%(6) | | | (0.85 | )% | | | (0.17 | )% | | | (0.28 | )% | | | 0.18 | % | | | 0.53 | % |
After expense reimbursement(7) | | | (1.27 | )%(6) | | | (0.77 | )% | | | (0.03 | )% | | | (0.14 | )% | | | 0.30 | % | | | 0.62 | % |
Portfolio turnover rate(8) | | | 5 | % | | | 4 | % | | | 6 | % | | | 58 | % | | | 7 | % | | | 15 | % |
| (1) | Information presented relates to a share of capital stock outstanding for each period. |
| (2) | Net investment income per share represents net investment income divided by the average shares outstanding throughout the period. |
| (3) | Amount calculated is less than $0.005. |
| (4) | The total return calculation does not reflect the 5.75% front end sales charge on Advisor Class A shares. |
| (5) | Not annualized. |
| (6) | Annualized. |
| (7) | See Note #3, Investment Adviser, for the waiver and expense reimbursement discussion. |
| (8) | Portfolio turnover of The Paradigm Portfolio. |
The accompanying notes are an integral part of these financial statements.
| KINETICS MUTUAL FUNDS, INC. — THE FEEDER FUNDS |
Financial Highlights — (Continued) |
| | | The Paradigm Fund | |
| | | Advisor Class C | |
| | | For the Six Months Ended June 30, 2014 (Unaudited) | | | For the Year Ended December 31, 2013 | | | For the Year Ended December 31, 2012 | | | For the Year Ended December 31, 2011 | | | For the Year Ended December 31, 2010 | | | For the Year Ended December 31, 2009 | |
PER SHARE DATA:(1) | | | | | | | | | | | | | | | | | | |
| Net Asset Value, Beginning | | | | | | | | | | | | | | | | | | |
| of Period | | $ | 32.38 | | | $ | 22.66 | | | $ | 18.76 | | | $ | 22.25 | | | $ | 19.33 | | | $ | 13.80 | |
| Income from Investment Operations: | | | | | | | | | | | | | | | | | | | | | | | | |
Net investment income (loss)(2) | | | (0.29 | ) | | | (0.35 | ) | | | (0.11 | ) | | | (0.14 | ) | | | (0.04 | ) | | | 0.02 | |
| Net realized and unrealized gain | | | | | | | | | | | | | | | | | | | | | | | | |
| (loss) on investments | | | 1.68 | | | | 10.10 | | | | 4.01 | | | | (3.17 | ) | | | 3.22 | | | | 5.51 | |
| Total from investment | | | | | | | | | | | | | | | | | | | | | | | | |
| operations | | | 1.39 | | | | 9.75 | | | | 3.90 | | | | (3.31 | ) | | | 3.18 | | | | 5.53 | |
Redemption Fees(3) | | | 0.00 | | | | 0.00 | | | | 0.00 | | | | 0.00 | | | | 0.00 | | | | 0.00 | |
| Less Distributions: | | | | | | | | | | | | | | | | | | | | | | | | |
| From net investment income | | | — | | | | (0.03 | ) | | | — | | | | (0.18 | ) | | | (0.26 | ) | | | — | |
| Total distributions | | | — | | | | (0.03 | ) | | | — | | | | (0.18 | ) | | | (0.26 | ) | | | — | |
Net Asset Value, End of Period | | $ | 33.77 | | | $ | 32.38 | | | $ | 22.66 | | | $ | 18.76 | | | $ | 22.25 | | | $ | 19.33 | |
| Total return | | | 4.29 | %(4) | | | 43.01 | % | | | 20.85 | % | | | (14.90 | )% | | | 16.45 | % | | | 39.97 | % |
| | | | | | | | | | | | | | | | | | | | | | | | | |
| SUPPLEMENTAL DATA AND RATIOS | | | | | | | | | | | | | | | | | | | | | | | | |
| Net assets, end of period (000’s) | | $ | 145,389 | | | $ | 138,355 | | | $ | 101,405 | | | $ | 102,534 | | | $ | 152,571 | | | $ | 169,578 | |
| Ratio of operating expenses to | | | | | | | | | | | | | | | | | | | | | | | | |
| average net assets: | | | | | | | | | | | | | | | | | | | | | | | | |
| Before expense reimbursement | | | 2.44 | %(5) | | | 2.47 | % | | | 2.53 | % | | | 2.53 | % | | | 2.51 | % | | | 2.48 | % |
After expense reimbursement(6) | | | 2.39 | %(5) | | | 2.39 | % | | | 2.39 | % | | | 2.39 | % | | | 2.39 | % | | | 2.39 | % |
| Ratio of net investment income (loss) | | | | | | | | | | | | | | | | | | | | | | | | |
| to average net assets: | | | | | | | | | | | | | | | | | | | | | | | | |
| Before expense reimbursement | | | (1.82 | )%(5) | | | (1.35 | )% | | | (0.67 | )% | | | (0.78 | )% | | | (0.32 | )% | | | 0.03 | % |
After expense reimbursement(6) | | | (1.77 | )%(5) | | | (1.27 | )% | | | (0.53 | )% | | | (0.64 | )% | | | (0.20 | )% | | | 0.12 | % |
Portfolio turnover rate(7) | | | 5 | % | | | 4 | % | | | 6 | % | | | 58 | % | | | 7 | % | | | 15 | % |
| (1) | Information presented relates to a share of capital stock outstanding for each period. |
| (2) | Net investment income per share represents net investment income divided by the average shares outstanding throughout the period. |
| (3) | Amount calculated is less than $0.005. |
| (4) | Not annualized. |
| (5) | Annualized. |
| (6) | See Note #3, Investment Adviser, for the waiver and expense reimbursement discussion. |
| (7) | Portfolio turnover of The Paradigm Portfolio. |
The accompanying notes are an integral part of these financial statements.
| KINETICS MUTUAL FUNDS, INC. — THE FEEDER FUNDS |
Financial Highlights — (Continued) |
| | | The Paradigm Fund | |
| | | Institutional Class | |
| | | For the Six Months Ended June 30, 2014 (Unaudited) | | | For the Year Ended December 31, 2013 | | | For the Year Ended December 31, 2012 | | | For the Year Ended December 31, 2011 | | | For the Year Ended December 31, 2010 | | | For the Year Ended December 31, 2009 | |
PER SHARE DATA:(1) | | | | | | | | | | | | | | | | | | |
| Net Asset Value, Beginning | | | | | | | | | | | | | | | | | | |
| of Period | | $ | 34.28 | | | $ | 23.93 | | | $ | 19.79 | | | $ | 23.25 | | | $ | 20.13 | | | $ | 14.44 | |
| Income from Investment Operations: | | | | | | | | | | | | | | | | | | | | | | | | |
Net investment income (loss)(2) | | | (0.14 | ) | | | (0.09 | ) | | | 0.10 | | | | 0.07 | | | | 0.16 | | | | 0.18 | |
| Net realized and unrealized gain | | | | | | | | | | | | | | | | | | | | | | | | |
| (loss) on investments | | | 1.78 | | | | 10.70 | | | | 4.24 | | | | (3.35 | ) | | | 3.38 | | | | 5.78 | |
| Total from investment | | | | | | | | | | | | | | | | | | | | | | | | |
| operations | | | 1.64 | | | | 10.61 | | | | 4.34 | | | | (3.28 | ) | | | 3.54 | | | | 5.96 | |
Redemption Fees(3) | | | 0.00 | | | | 0.00 | | | | 0.00 | | | | 0.00 | | | | 0.00 | | | | 0.00 | |
| Less Distributions: | | | | | | | | | | | | | | | | | | | | | | | | |
| From net investment income | | | — | | | | (0.26 | ) | | | (0.20 | ) | | | (0.18 | ) | | | (0.42 | ) | | | (0.27 | ) |
| Total distributions | | | — | | | | (0.26 | ) | | | (0.20 | ) | | | (0.18 | ) | | | (0.42 | ) | | | (0.27 | ) |
Net Asset Value, End of Period | | $ | 35.92 | | | $ | 34.28 | | | $ | 23.93 | | | $ | 19.79 | | | $ | 23.25 | | | $ | 20.13 | |
| Total return | | | 4.75 | %(4) | | | 44.40 | % | | | 21.99 | % | | | (14.13 | )% | | | 17.62 | % | | | 41.31 | % |
| | | | | | | | | | | | | | | | | | | | | | | | | |
| SUPPLEMENTAL DATA AND RATIOS | | | | | | | | | | | | | | | | | | | | | | | | |
| Net assets, end of period (000’s) | | $ | 331,212 | | | $ | 333,682 | | | $ | 192,478 | | | $ | 134,309 | | | $ | 142,261 | | | $ | 125,372 | |
| Ratio of operating expenses to | | | | | | | | | | | | | | | | | | | | | | | | |
| average net assets: | | | | | | | | | | | | | | | | | | | | | | | | |
| Before expense reimbursement | | | 1.64 | %(5) | | | 1.67 | % | | | 1.73 | % | | | 1.73 | % | | | 1.71 | % | | | 1.68 | % |
After expense reimbursement(6) | | | 1.44 | %(5) | | | 1.44 | % | | | 1.44 | % | | | 1.44 | % | | | 1.44 | % | | | 1.44 | % |
| Ratio of net investment income (loss) | | | | | | | | | | | | | | | | | | | | | | | | |
| to average net assets: | | | | | | | | | | | | | | | | | | | | | | | | |
| Before expense reimbursement | | | (1.02 | )%(5) | | | (0.55 | )% | | | 0.13 | % | | | 0.02 | % | | | 0.48 | % | | | 0.83 | % |
After expense reimbursement(6) | | | (0.82 | )%(5) | | | (0.32 | )% | | | 0.42 | % | | | 0.31 | % | | | 0.75 | % | | | 1.07 | % |
Portfolio turnover rate(7) | | | 5 | % | | | 4 | % | | | 6 | % | | | 58 | % | | | 7 | % | | | 15 | % |
| (1) | Information presented relates to a share of capital stock outstanding for each period. |
| (2) | Net investment income per share represents net investment income divided by the average shares outstanding throughout the period. |
| (3) | Amount calculated is less than $0.005. |
| (4) | Not annualized. |
| (5) | Annualized. |
| (6) | See Note #3, Investment Adviser, for the waiver and expense reimbursement discussion. |
| (7) | Portfolio turnover of The Paradigm Portfolio. |
The accompanying notes are an integral part of these financial statements.
| KINETICS MUTUAL FUNDS, INC. — THE FEEDER FUNDS |
Financial Highlights — (Continued) |
| | | The Medical Fund | |
| | | No Load Class | |
| | | For the Six Months Ended June 30, 2014 (Unaudited) | | | For the Year Ended December 31, 2013 | | | For the Year Ended December 31, 2012 | | | For the Year Ended December 31, 2011 | | | For the Year Ended December 31, 2010 | | | For the Year Ended December 31, 2009 | |
PER SHARE DATA:(1) | | | | | | | | | | | | | | | | | | |
| Net Asset Value, Beginning | | | | | | | | | | | | | | | | | | |
| of Period | | $ | 26.38 | | | $ | 17.82 | | | $ | 18.75 | | | $ | 19.48 | | | $ | 18.77 | | | $ | 15.23 | |
| Income from Investment Operations: | | | | | | | | | | | | | | | | | | | | | | | | |
Net investment income (loss)(2) | | | 0.13 | | | | (0.00 | )(3) | | | 0.33 | | | | 0.18 | | | | 0.10 | | | | 0.20 | |
| Net realized and unrealized gain | | | | | | | | | | | | | | | | | | | | | | | | |
| on investments | | | 2.42 | | | | 8.77 | | | | 1.32 | | | | 0.82 | | | | 0.72 | | | | 3.51 | |
| Total from investment | | | | | | | | | | | | | | | | | | | | | | | | |
| operations | | | 2.55 | | | | 8.77 | | | | 1.65 | | | | 1.00 | | | | 0.82 | | | | 3.71 | |
| Redemption Fees | | | 0.00 | (3) | | | 0.00 | (3) | | | 0.00 | (3) | | | 0.00 | (3) | | | 0.00 | (3) | | | 0.01 | |
| Less Distributions: | | | | | | | | | | | | | | | | | | | | | | | | |
| From net investment income | | | — | | | | (0.06 | ) | | | (0.36 | ) | | | (0.25 | ) | | | (0.11 | ) | | | (0.16 | ) |
| From net realized gains | | | — | | | | (0.15 | ) | | | (2.22 | ) | | | (1.48 | ) | | | — | | | | (0.02 | ) |
| Total distributions | | | — | | | | (0.21 | ) | | | (2.58 | ) | | | (1.73 | ) | | | (0.11 | ) | | | (0.18 | ) |
Net Asset Value, End of Period | | $ | 28.93 | | | $ | 26.38 | | | $ | 17.82 | | | $ | 18.75 | | | $ | 19.48 | | | $ | 18.77 | |
| Total return | | | 9.67 | %(4) | | | 49.25 | % | | | 8.86 | % | | | 5.11 | % | | | 4.30 | % | | | 24.47 | % |
| | | | | | | | | | | | | | | | | | | | | | | | | |
| SUPPLEMENTAL DATA AND RATIOS | | | | | | | | | | | | | | | | | | | | | | | | |
| Net assets, end of period (000’s) | | $ | 21,637 | | | $ | 20,489 | | | $ | 14,254 | | | $ | 16,376 | | | $ | 25,777 | | | $ | 21,126 | |
| Ratio of operating expenses to | | | | | | | | | | | | | | | | | | | | | | | | |
| average net assets: | | | | | | | | | | | | | | | | | | | | | | | | |
| Before expense reimbursement | | | 2.04 | %(5) | | | 2.09 | % | | | 2.22 | % | | | 2.02 | % | | | 2.00 | % | | | 2.15 | % |
After expense reimbursement(6) | | | 1.39 | %(5) | | | 1.39 | % | | | 1.39 | % | | | 1.39 | % | | | 1.39 | % | | | 1.39 | % |
| Ratio of net investment income (loss) | | | | | | | | | | | | | | | | | | | | | | | | |
| to average net assets: | | | | | | | | | | | | | | | | | | | | | | | | |
| Before expense reimbursement | | | 0.32 | %(5) | | | (0.70 | )% | | | 0.83 | % | | | 0.24 | % | | | (0.06 | )% | | | 0.42 | % |
After expense reimbursement(6) | | | 0.97 | %(5) | | | 0.00 | % | | | 1.66 | % | | | 0.87 | % | | | 0.55 | % | | | 1.17 | % |
Portfolio turnover rate(7) | | | 3 | % | | | 12 | % | | | 0 | % | | | 5 | % | | | 3 | % | | | 13 | % |
| (1) | Information presented relates to a share of capital stock outstanding for each period. |
| (2) | Net investment income per share represents net investment income divided by the average shares outstanding throughout the period. |
| (3) | Amount calculated is less than $0.005. |
| (4) | Not annualized. |
| (5) | Annualized. |
| (6) | See Note #3, Investment Adviser, for the waiver and expense reimbursement discussion. |
| (7) | Portfolio turnover of The Medical Portfolio. |
The accompanying notes are an integral part of these financial statements.
| KINETICS MUTUAL FUNDS, INC. — THE FEEDER FUNDS |
Financial Highlights — (Continued) |
| | | The Medical Fund | |
| | | Advisor Class A | |
| | | For the Six Months Ended June 30, 2014 (Unaudited) | | | For the Year Ended December 31, 2013 | | | For the Year Ended December 31, 2012 | | | For the Year Ended December 31, 2011 | | | For the Year Ended December 31, 2010 | | | For the Year Ended December 31, 2009 | |
PER SHARE DATA:(1) | | | | | | | | | | | | | | | | | | |
| Net Asset Value, Beginning | | | | | | | | | | | | | | | | | | |
| of Period | | $ | 25.62 | | | $ | 17.33 | | | $ | 18.29 | | | $ | 19.06 | | | $ | 18.36 | | | $ | 14.90 | |
| Income from Investment Operations: | | | | | | | | | | | | | | | | | | | | | | | | |
Net investment income (loss)(2) | | | 0.10 | | | | (0.06 | ) | | | 0.27 | | | | 0.12 | | | | 0.05 | | | | 0.15 | |
| Net realized and unrealized gain | | | | | | | | | | | | | | | | | | | | | | | | |
| on investments | | | 2.34 | | | | 8.52 | | | | 1.29 | | | | 0.80 | | | | 0.71 | | | | 3.44 | |
| Total from investment | | | | | | | | | | | | | | | | | | | | | | | | |
| operations | | | 2.44 | | | | 8.46 | | | | 1.56 | | | | 0.92 | | | | 0.76 | | | | 3.59 | |
| Redemption Fees | | | 0.00 | (3) | | | 0.01 | | | | 0.00 | (3) | | | 0.00 | (3) | | | 0.00 | (3) | | | 0.01 | |
| Less Distributions: | | | | | | | | | | | | | | | | | | | | | | | | |
| From net investment income | | | — | | | | (0.03 | ) | | | (0.30 | ) | | | (0.21 | ) | | | (0.06 | ) | | | (0.12 | ) |
| From net realized gains | | | — | | | | (0.15 | ) | | | (2.22 | ) | | | (1.48 | ) | | | — | | | | (0.02 | ) |
| Total distributions | | | — | | | | (0.18 | ) | | | (2.52 | ) | | | (1.69 | ) | | | (0.06 | ) | | | (0.14 | ) |
Net Asset Value, End of Period | | $ | 28.06 | | | $ | 25.62 | | | $ | 17.33 | | | $ | 18.29 | | | $ | 19.06 | | | $ | 18.36 | |
Total return(4) | | | 9.52 | %(5) | | | 48.90 | % | | | 8.60 | % | | | 4.79 | % | | | 4.13 | % | | | 24.17 | % |
| | | | | | | | | | | | | | | | | | | | | | | | | |
| SUPPLEMENTAL DATA AND RATIOS | | | | | | | | | | | | | | | | | | | | | | | | |
| Net assets, end of period (000’s) | | $ | 4,609 | | | $ | 3,746 | | | $ | 2,583 | | | $ | 3,240 | | | $ | 4,207 | | | $ | 4,347 | |
| Ratio of operating expenses to | | | | | | | | | | | | | | | | | | | | | | | | |
| average net assets: | | | | | | | | | | | | | | | | | | | | | | | | |
| Before expense reimbursement | | | 2.29 | %(6) | | | 2.34 | % | | | 2.47 | % | | | 2.27 | % | | | 2.25 | % | | | 2.40 | % |
After expense reimbursement(7) | | | 1.64 | %(6) | | | 1.64 | % | | | 1.64 | % | | | 1.64 | % | | | 1.64 | % | | | 1.64 | % |
| Ratio of net investment income (loss) | | | | | | | | | | | | | | | | | | | | | | | | |
| to average net assets: | | | | | | | | | | | | | | | | | | | | | | | | |
| Before expense reimbursement | | | 0.07 | %(6) | | | (0.95 | )% | | | 0.58 | % | | | (0.01 | )% | | | (0.31 | )% | | | 0.17 | % |
After expense reimbursement(7) | | | 0.72 | %(6) | | | (0.25 | )% | | | 1.41 | % | | | 0.62 | % | | | 0.30 | % | | | 0.92 | % |
Portfolio turnover rate(8) | | | 3 | % | | | 12 | % | | | 0 | % | | | 5 | % | | | 3 | % | | | 13 | % |
| (1) | Information presented relates to a share of capital stock outstanding for each period. |
| (2) | Net investment income per share represents net investment income divided by the average shares outstanding throughout the period. |
| (3) | Amount calculated is less than $0.005. |
| (4) | The total return calculation does not reflect the 5.75% front end sales charge on Advisor Class A shares. |
| (5) | Not annualized. |
| (6) | Annualized. |
| (7) | See Note #3, Investment Adviser, for the waiver and expense reimbursement discussion. |
| (8) | Portfolio turnover of The Medical Portfolio. |
The accompanying notes are an integral part of these financial statements.
| KINETICS MUTUAL FUNDS, INC. — THE FEEDER FUNDS |
Financial Highlights — (Continued) |
| | | The Medical Fund | |
| | | Advisor Class C | |
| | | For the Six Months Ended June 30, 2014 (Unaudited) | | | For the Year Ended December 31, 2013 | | | For the Year Ended December 31, 2012 | | | For the Year Ended December 31, 2011 | | | For the Year Ended December 31, 2010 | | | For the Year Ended December 31, 2009 | |
PER SHARE DATA:(1) | | | | | | | | | | | | | | | | | | |
| Net Asset Value, Beginning | | | | | | | | | | | | | | | | | | |
| of Period | | $ | 25.27 | | | $ | 17.19 | | | $ | 18.15 | | | $ | 18.90 | | | $ | 18.27 | | | $ | 14.83 | |
| Income from Investment Operations: | | | | | | | | | | | | | | | | | | | | | | | | |
Net investment income (loss)(2) | | | 0.03 | | | | (0.16 | ) | | | 0.17 | | | | 0.02 | | | | (0.04 | ) | | | 0.07 | |
| Net realized and unrealized gain | | | | | | | | | | | | | | | | | | | | | | | | |
| on investments | | | 2.30 | | | | 8.42 | | | | 1.29 | | | | 0.80 | | | | 0.69 | | | | 3.41 | |
| Total from investment | | | | | | | | | | | | | | | | | | | | | | | | |
| operations | | | 2.33 | | | | 8.26 | | | | 1.46 | | | | 0.82 | | | | 0.65 | | | | 3.48 | |
| Redemption Fees | | | — | | | | — | | | | — | | | | 0.00 | (3) | | | — | | | | 0.00 | (3) |
| Less Distributions: | | | | | | | | | | | | | | | | | | | | | | | | |
| From net investment income | | | — | | | | (0.03 | ) | | | (0.20 | ) | | | (0.09 | ) | | | (0.02 | ) | | | (0.02 | ) |
| From net realized gains | | | — | | | | (0.15 | ) | | | (2.22 | ) | | | (1.48 | ) | | | — | | | | (0.02 | ) |
| Total distributions | | | — | | | | (0.18 | ) | | | (2.42 | ) | | | (1.57 | ) | | | (0.02 | ) | | | (0.04 | ) |
Net Asset Value, End of Period | | $ | 27.60 | | | $ | 25.27 | | | $ | 17.19 | | | $ | 18.15 | | | $ | 18.90 | | | $ | 18.27 | |
| Total return | | | 9.22 | %(4) | | | 48.08 | % | | | 8.08 | % | | | 4.32 | % | | | 3.55 | % | | | 23.50 | % |
| | | | | | | | | | | | | | | | | | | | | | | | | |
| SUPPLEMENTAL DATA AND RATIOS | | | | | | | | | | | | | | | | | | | | | | | | |
| Net assets, end of period (000’s) | | $ | 603 | | | $ | 531 | | | $ | 450 | | | $ | 580 | | | $ | 692 | | | $ | 454 | |
| Ratio of operating expenses to | | | | | | | | | | | | | | | | | | | | | | | | |
| average net assets: | | | | | | | | | | | | | | | | | | | | | | | | |
| Before expense reimbursement | | | 2.79 | %(5) | | | 2.84 | % | | | 2.97 | % | | | 2.77 | % | | | 2.75 | % | | | 2.90 | % |
After expense reimbursement(6) | | | 2.14 | %(5) | | | 2.14 | % | | | 2.14 | % | | | 2.14 | % | | | 2.14 | % | | | 2.14 | % |
| Ratio of net investment income (loss) | | | | | | | | | | | | | | | | | | | | | | | | |
| to average net assets: | | | | | | | | | | | | | | | | | | | | | | | | |
| Before expense reimbursement | | | (0.43 | )%(5) | | | (1.45 | )% | | | 0.08 | % | | | (0.51 | )% | | | (0.81 | )% | | | (0.33 | )% |
After expense reimbursement(6) | | | 0.22 | %(5) | | | (0.75 | )% | | | 0.91 | % | | | 0.12 | % | | | (0.20 | )% | | | 0.42 | % |
Portfolio turnover rate(7) | | | 3 | % | | | 12 | % | | | 0 | % | | | 5 | % | | | 3 | % | | | 13 | % |
| (1) | Information presented relates to a share of capital stock outstanding for each period. |
| (2) | Net investment income per share represents net investment income divided by the average shares outstanding throughout the period. |
| (3) | Amount calculated is less than $0.005. |
| (4) | Not annualized. |
| (5) | Annualized. |
| (6) | See Note #3, Investment Adviser, for the waiver and expense reimbursement discussion. |
| (7) | Portfolio turnover of The Medical Portfolio. |
The accompanying notes are an integral part of these financial statements.
| KINETICS MUTUAL FUNDS, INC. — THE FEEDER FUNDS |
Financial Highlights — (Continued) |
| | | The Small Cap Opportunities Fund | |
| | | No Load Class | |
| | | For the Six Months Ended June 30, 2014 (Unaudited) | | | For the Year Ended December 31, 2013 | | | For the Year Ended December 31, 2012 | | | For the Year Ended December 31, 2011 | | | For the Year Ended December 31, 2010 | | | For the Year Ended December 31, 2009 | |
PER SHARE DATA:(1) | | | | | | | | | | | | | | | | | | |
| Net Asset Value, Beginning | | | | | | | | | | | | | | | | | | |
| of Period | | $ | 40.12 | | | $ | 25.17 | | | $ | 19.85 | | | $ | 23.32 | | | $ | 20.83 | | | $ | 13.17 | |
| Income from Investment Operations: | | | | | | | | | | | | | | | | | | | | | | | | |
Net investment income (loss)(2) | | | (0.19 | ) | | | (0.10 | ) | | | 0.01 | | | | (0.04 | ) | | | (0.04 | ) | | | (0.04 | ) |
| Net realized and unrealized gain | | | | | | | | | | | | | | | | | | | | | | | | |
| (loss) on investments | | | 1.72 | | | | 15.05 | | | | 5.31 | | | | (3.15 | ) | | | 2.93 | | | | 7.70 | |
| Total from investment | | | | | | | | | | | | | | | | | | | | | | | | |
| operations | | | 1.53 | | | | 14.95 | | | | 5.32 | | | | (3.19 | ) | | | 2.89 | | | | 7.66 | |
Redemption Fees(3) | | | 0.00 | | | | 0.00 | | | | 0.00 | | | | 0.00 | | | | 0.00 | | | | 0.00 | |
| Less Distributions: | | | | | | | | | | | | | | | | | | | | | | | | |
| From net investment income | | | — | | | | — | | | | — | | | | (0.28 | ) | | | (0.40 | ) | | | — | |
| Total distributions | | | — | | | | — | | | | — | | | | (0.28 | ) | | | (0.40 | ) | | | — | |
Net Asset Value, End of Period | | $ | 41.65 | | | $ | 40.12 | | | $ | 25.17 | | | $ | 19.85 | | | $ | 23.32 | | | $ | 20.83 | |
| Total return | | | 3.81 | %(4) | | | 59.40 | % | | | 26.74 | % | | | (13.65 | )% | | | 13.86 | % | | | 58.16 | % |
| | | | | | | | | | | | | | | | | | | | | | | | | |
| SUPPLEMENTAL DATA AND RATIOS | | | | | | | | | | | | | | | | | | | | | | | | |
| Net assets, end of period (000’s) | | $ | 334,651 | | | $ | 277,816 | | | $ | 63,947 | | | $ | 67,798 | | | $ | 130,279 | | | $ | 161,205 | |
| Ratio of operating expenses to | | | | | | | | | | | | | | | | | | | | | | | | |
| average net assets: | | | | | | | | | | | | | | | | | | | | | | | | |
| Before expense reimbursement | | | 1.70 | %(5) | | | 1.73 | % | | | 1.96 | % | | | 1.90 | % | | | 1.86 | % | | | 1.86 | % |
After expense reimbursement(6) | | | 1.64 | %(5) | | | 1.64 | % | | | 1.64 | % | | | 1.64 | % | | | 1.64 | % | | | 1.64 | % |
| Ratio of net investment income (loss) | | | | | | | | | | | | | | | | | | | | | | | | |
| to average net assets: | | | | | | | | | | | | | | | | | | | | | | | | |
| Before expense reimbursement | | | (1.01 | )%(5) | | | (0.38 | )% | | | (0.25 | )% | | | (0.44 | )% | | | (0.42 | )% | | | (0.48 | )% |
After expense reimbursement(6) | | | (0.95 | )%(5) | | | (0.29 | )% | | | 0.07 | % | | | (0.18 | )% | | | (0.20 | )% | | | (0.26 | )% |
Portfolio turnover rate(7) | | | 9 | % | | | 6 | % | | | 22 | % | | | 47 | % | | | 4 | % | | | 4 | % |
| (1) | Information presented relates to a share of capital stock outstanding for each period. |
| (2) | Net investment income per share represents net investment income divided by the average shares outstanding throughout the period. |
| (3) | Amount calculated is less than $0.005. |
| (4) | Not annualized. |
| (5) | Annualized. |
| (6) | See Note #3, Investment Adviser, for the waiver and expense reimbursement discussion. |
| (7) | Portfolio turnover of The Small Cap Opportunities Portfolio. |
The accompanying notes are an integral part of these financial statements.
| KINETICS MUTUAL FUNDS, INC. — THE FEEDER FUNDS |
Financial Highlights — (Continued) |
| | | The Small Cap Opportunities Fund | |
| | | Advisor Class A | |
| | | For the Six Months Ended June 30, 2014 (Unaudited) | | | For the Year Ended December 31, 2013 | | | For the Year Ended December 31, 2012 | | | For the Year Ended December 31, 2011 | | | For the Year Ended December 31, 2010 | | | For the Year Ended December 31, 2009 | |
PER SHARE DATA:(1) | | | | | | | | | | | | | | | | | | |
| Net Asset Value, Beginning | | | | | | | | | | | | | | | | | | |
| of Period | | $ | 39.39 | | | $ | 24.77 | | | $ | 19.59 | | | $ | 22.98 | | | $ | 20.53 | | | $ | 13.01 | |
| Income from Investment Operations: | | | | | | | | | | | | | | | | | | | | | | | | |
Net investment loss(2) | | | (0.23 | ) | | | (0.18 | ) | | | (0.04 | ) | | | (0.10 | ) | | | (0.09 | ) | | | (0.08 | ) |
| Net realized and unrealized gain | | | | | | | | | | | | | | | | | | | | | | | | |
| (loss) on investments | | | 1.67 | | | | 14.79 | | | | 5.22 | | | | (3.08 | ) | | | 2.87 | | | | 7.60 | |
| Total from investment | | | | | | | | | | | | | | | | | | | | | | | | |
| operations | | | 1.44 | | | | 14.61 | | | | 5.18 | | | | (3.18 | ) | | | 2.78 | | | | 7.52 | |
| Redemption Fees | | | 0.00 | (3) | | | 0.01 | | | | 0.00 | (3) | | | 0.00 | (3) | | | 0.00 | (3) | | | 0.00 | (3) |
| Less Distributions: | | | | | | | | | | | | | | | | | | | | | | | | |
| From net investment income | | | — | | | | — | | | | — | | | | (0.21 | ) | | | (0.33 | ) | | | — | |
| Total distributions | | | — | | | | — | | | | — | | | | (0.21 | ) | | | (0.33 | ) | | | — | |
Net Asset Value, End of Period | | $ | 40.83 | | | $ | 39.39 | | | $ | 24.77 | | | $ | 19.59 | | | $ | 22.98 | | | $ | 20.53 | |
Total return(4) | | | 3.66 | %(5) | | | 59.02 | % | | | 26.44 | % | | | (13.85 | )% | | | 13.56 | % | | | 57.80 | % |
| | | | | | | | | | | | | | | | | | | | | | | | | |
| SUPPLEMENTAL DATA AND RATIOS | | | | | | | | | | | | | | | | | | | | | | | | |
| Net assets, end of period (000’s) | | $ | 37,475 | | | $ | 21,871 | | | $ | 7,558 | | | $ | 7,250 | | | $ | 11,509 | | | $ | 14,244 | |
| Ratio of operating expenses to | | | | | | | | | | | | | | | | | | | | | | | | |
| average net assets: | | | | | | | | | | | | | | | | | | | | | | | | |
| Before expense reimbursement | | | 1.95 | %(6) | | | 1.98 | % | | | 2.21 | % | | | 2.15 | % | | | 2.11 | % | | | 2.11 | % |
After expense reimbursement(7) | | | 1.89 | %(6) | | | 1.89 | % | | | 1.89 | % | | | 1.89 | % | | | 1.89 | % | | | 1.89 | % |
| Ratio of net investment loss | | | | | | | | | | | | | | | | | | | | | | | | |
| to average net assets: | | | | | | | | | | | | | | | | | | | | | | | | |
| Before expense reimbursement | | | (1.26 | )%(6) | | | (0.63 | )% | | | (0.50 | )% | | | (0.69 | )% | | | (0.67 | )% | | | (0.73 | )% |
After expense reimbursement(7) | | | (1.20 | )%(6) | | | (0.54 | )% | | | (0.18 | )% | | | (0.43 | )% | | | (0.45 | )% | | | (0.51 | )% |
Portfolio turnover rate(8) | | | 9 | % | | | 6 | % | | | 22 | % | | | 47 | % | | | 4 | % | | | 4 | % |
| (1) | Information presented relates to a share of capital stock outstanding for each period. |
| (2) | Net investment income per share represents net investment income divided by the average shares outstanding throughout the period. |
| (3) | Amount calculated is less than $0.005. |
| (4) | The total return calculation does not reflect the 5.75% front end sales charge on Advisor Class A shares. |
| (5) | Not annualized. |
| (6) | Annualized. |
| (7) | See Note #3, Investment Adviser, for the waiver and expense reimbursement discussion. |
| (8) | Portfolio turnover of The Small Cap Opportunities Portfolio. |
The accompanying notes are an integral part of these financial statements.
| KINETICS MUTUAL FUNDS, INC. — THE FEEDER FUNDS |
Financial Highlights — (Continued) |
| | | The Small Cap Opportunities Fund | |
| | | Advisor Class C | |
| | | For the Six Months Ended June 30, 2014 (Unaudited) | | | For the Year Ended December 31, 2013 | | | For the Year Ended December 31, 2012 | | | For the Year Ended December 31, 2011 | | | For the Year Ended December 31, 2010 | | | For the Year Ended December 31, 2009 | |
PER SHARE DATA:(1) | | | | | | | | | | | | | | | | | | |
| Net Asset Value, Beginning | | | | | | | | | | | | | | | | | | |
| of Period | | $ | 38.53 | | | $ | 24.35 | | | $ | 19.36 | | | $ | 22.68 | | | $ | 20.28 | | | $ | 12.92 | |
| Income from Investment Operations: | | | | | | | | | | | | | | | | | | | | | | | | |
Net investment loss(2) | | | (0.32 | ) | | | (0.34 | ) | | | (0.15 | ) | | | (0.20 | ) | | | (0.20 | ) | | | (0.16 | ) |
| Net realized and unrealized gain | | | | | | | | | | | | | | | | | | | | | | | | |
| (loss) on investments | | | 1.64 | | | | 14.51 | | | | 5.14 | | | | (3.04 | ) | | | 2.84 | | | | 7.52 | |
| Total from investment | | | | | | | | | | | | | | | | | | | | | | | | |
| operations | | | 1.32 | | | | 14.17 | | | | 4.99 | | | | (3.24 | ) | | | 2.64 | | | | 7.36 | |
| Redemption Fees | | | 0.01 | | | | 0.01 | | | | — | | | | — | | | | — | | | | 0.00 | (3) |
| Less Distributions: | | | | | | | | | | | | | | | | | | | | | | | | |
| From net investment income | | | — | | | | — | | | | — | | | | (0.08 | ) | | | (0.24 | ) | | | — | |
| Total distributions | | | — | | | | — | | | | — | | | | (0.08 | ) | | | (0.24 | ) | | | — | |
Net Asset Value, End of Period | | $ | 39.86 | | | $ | 38.53 | | | $ | 24.35 | | | $ | 19.36 | | | $ | 22.68 | | | $ | 20.28 | |
| Total return | | | 3.45 | %(4) | | | 58.23 | % | | | 25.77 | % | | | (14.29 | )% | | | 13.00 | % | | | 56.97 | % |
| | | | | | | | | | | | | | | | | | | | | | | | | |
| SUPPLEMENTAL DATA AND RATIOS | | | | | | | | | | | | | | | | | | | | | | | | |
| Net assets, end of period (000’s) | | $ | 13,531 | | | $ | 7,178 | | | $ | 2,536 | | | $ | 2,440 | | | $ | 3,450 | | | $ | 4,445 | |
| Ratio of operating expenses to | | | | | | | | | | | | | | | | | | | | | | | | |
| average net assets: | | | | | | | | | | | | | | | | | | | | | | | | |
| Before expense reimbursement | | | 2.45 | %(5) | | | 2.48 | % | | | 2.71 | % | | | 2.65 | % | | | 2.61 | % | | | 2.61 | % |
After expense reimbursement(6) | | | 2.39 | %(5) | | | 2.39 | % | | | 2.39 | % | | | 2.39 | % | | | 2.39 | % | | | 2.39 | % |
| Ratio of net investment loss to | | | | | | | | | | | | | | | | | | | | | | | | |
| average net assets: | | | | | | | | | | | | | | | | | | | | | | | | |
| Before expense reimbursement | | | (1.76 | )%(5) | | | (1.13 | )% | | | (1.00 | )% | | | (1.19 | )% | | | (1.17 | )% | | | (1.23 | )% |
After expense reimbursement(6) | | | (1.70 | )%(5) | | | (1.04 | )% | | | (0.68 | )% | | | (0.93 | )% | | | (0.95 | )% | | | (1.01 | )% |
Portfolio turnover rate(7) | | | 9 | % | | | 6 | % | | | 22 | % | | | 47 | % | | | 4 | % | | | 4 | % |
| (1) | Information presented relates to a share of capital stock outstanding for each period. |
| (2) | Net investment income per share represents net investment income divided by the average shares outstanding throughout the period. |
| (3) | Amount calculated is less than $0.005. |
| (4) | Not annualized. |
| (5) | Annualized. |
| (6) | See Note #3, Investment Adviser, for the waiver and expense reimbursement discussion. |
| (7) | Portfolio turnover of The Small Cap Opportunities Portfolio. |
The accompanying notes are an integral part of these financial statements.
| KINETICS MUTUAL FUNDS, INC. — THE FEEDER FUNDS |
Financial Highlights — (Continued) |
| | | The Small Cap Opportunities Fund | |
| | | Institutional Class | |
| | | For the Six Months Ended June 30, 2014 (Unaudited) | | | For the Year Ended December 31, 2013 | | | For the Year Ended December 31, 2012 | | | For the Year Ended December 31, 2011 | | | For the Year Ended December 31, 2010 | | | For the Year Ended December 31, 2009 | |
PER SHARE DATA:(1) | | | | | | | | | | | | | | | | | | |
| Net Asset Value, Beginning | | | | | | | | | | | | | | | | | | |
| of Period | | $ | 40.44 | | | $ | 25.32 | | | $ | 19.93 | | | $ | 23.45 | | | $ | 20.90 | | | $ | 13.19 | |
| Income from Investment Operations: | | | | | | | | | | | | | | | | | | | | | | | | |
Net investment income (loss)(2) | | | (0.15 | ) | | | (0.03 | ) | | | 0.06 | | | | 0.00 | (3) | | | 0.00 | (3) | | | (0.01 | ) |
| Net realized and unrealized gain | | | | | | | | | | | | | | | | | | | | | | | | |
| (loss) on investments | | | 1.72 | | | | 15.15 | | | | 5.33 | | | | (3.17 | ) | | | 2.95 | | | | 7.72 | |
| Total from investment | | | | | | | | | | | | | | | | | | | | | | | | |
| operations | | | 1.57 | | | | 15.12 | | | | 5.39 | | | | (3.17 | ) | | | 2.95 | | | | 7.71 | |
| Redemption Fees | | | 0.00 | (3) | | | — | | | | 0.00 | (3) | | | 0.00 | (3) | | | 0.00 | (3) | | | 0.00 | (3) |
| Less Distributions: | | | | | | | | | | | | | | | | | | | | | | | | |
| From net investment income | | | — | | | | — | | | | — | | | | (0.35 | ) | | | (0.40 | ) | | | — | |
| Total distributions | | | — | | | | — | | | | — | | | | (0.35 | ) | | | (0.40 | ) | | | — | |
Net Asset Value, End of Period | | $ | 42.01 | | | $ | 40.44 | | | $ | 25.32 | | | $ | 19.93 | | | $ | 23.45 | | | $ | 20.90 | |
| Total return | | | 3.88 | %(4) | | | 59.72 | % | | | 27.04 | % | | | (13.51 | )% | | | 14.10 | % | | | 58.45 | % |
| | | | | | | | | | | | | | | | | | | | | | | | | |
| SUPPLEMENTAL DATA AND RATIOS | | | | | | | | | | | | | | | | | | | | | | | | |
| Net assets, end of period (000’s) | | $ | 40,187 | | | $ | 41,032 | | | $ | 7,482 | | | $ | 5,498 | | | $ | 9,808 | | | $ | 19,749 | |
| Ratio of operating expenses to | | | | | | | | | | | | | | | | | | | | | | | | |
| average net assets: | | | | | | | | | | | | | | | | | | | | | | | | |
| Before expense reimbursement | | | 1.65 | %(5) | | | 1.68 | % | | | 1.91 | % | | | 1.85 | % | | | 1.81 | % | | | 1.81 | % |
After expense reimbursement(6) | | | 1.44 | %(5) | | | 1.44 | % | | | 1.44 | % | | | 1.44 | % | | | 1.44 | % | | | 1.44 | % |
| Ratio of net investment income (loss) | | | | | | | | | | | | | | | | | | | | | | | | |
| to average net assets: | | | | | | | | | | | | | | | | | | | | | | | | |
| Before expense reimbursement | | | (0.96 | )%(5) | | | (0.33 | )% | | | (0.20 | )% | | | (0.39 | )% | | | (0.37 | )% | | | (0.43 | )% |
After expense reimbursement(6) | | | (0.75 | )%(5) | | | (0.09 | )% | | | 0.27 | % | | | 0.02 | % | | | 0.00 | % | | | (0.06 | )% |
Portfolio turnover rate(7) | | | 9 | % | | | 6 | % | | | 22 | % | | | 47 | % | | | 4 | % | | | 4 | % |
| (1) | Information presented relates to a share of capital stock outstanding for each period. |
| (2) | Net investment income per share represents net investment income divided by the average shares outstanding throughout the period. |
| (3) | Amount calculated is less than $0.005. |
| (4) | Not annualized. |
| (5) | Annualized. |
| (6) | See Note #3, Investment Adviser, for the waiver and expense reimbursement discussion. |
| (7) | Portfolio turnover of The Small Cap Opportunities Portfolio. |
The accompanying notes are an integral part of these financial statements.
| KINETICS MUTUAL FUNDS, INC. — THE FEEDER FUNDS |
Financial Highlights — (Continued) |
| | | The Market Opportunities Fund | |
| | | No Load Class | |
| | | For the Six Months Ended June 30, 2014 (Unaudited) | | | For the Year Ended December 31, 2013 | | | For the Year Ended December 31, 2012 | | | For the Year Ended December 31, 2011 | | | For the Year Ended December 31, 2010 | | | For the Year Ended December 31, 2009 | |
PER SHARE DATA:(1) | | | | | | | | | | | | | | | | | | |
| Net Asset Value, Beginning | | | | | | | | | | | | | | | | | | |
| of Period | | $ | 17.66 | | | $ | 12.08 | | | $ | 10.45 | | �� | $ | 11.46 | | | $ | 10.84 | | | $ | 7.22 | |
| Income from Investment Operations: | | | | | | | | | | | | | | | | | | | | | | | | |
Net investment income (loss)(2) | | | (0.03 | ) | | | 0.00 | (3) | | | 0.03 | | | | 0.01 | | | | 0.04 | | | | 0.00 | (3) |
| Net realized and unrealized gain | | | | | | | | | | | | | | | | | | | | | | | | |
| (loss) on investments | | | 0.12 | | | | 5.65 | | | | 1.80 | | | | (0.91 | ) | | | 1.18 | | | | 3.62 | |
| Total from investment | | | | | | | | | | | | | | | | | | | | | | | | |
| operations | | | 0.09 | | | | 5.65 | | | | 1.83 | | | | (0.90 | ) | | | 1.22 | | | | 3.62 | |
| Redemption Fees | | | 0.00 | (3) | | | 0.00 | (3) | | | 0.00 | (3) | | | 0.00 | (3) | | | 0.00 | (3) | | | 0.01 | |
| Less Distributions: | | | | | | | | | | | | | | | | | | | | | | | | |
| From net investment income | | | — | | | | (0.07 | ) | | | (0.20 | ) | | | (0.11 | ) | | | (0.60 | ) | | | (0.01 | ) |
| Total distributions | | | — | | | | (0.07 | ) | | | (0.20 | ) | | | (0.11 | ) | | | (0.60 | ) | | | (0.01 | ) |
Net Asset Value, End of Period | | $ | 17.75 | | | $ | 17.66 | | | $ | 12.08 | | | $ | 10.45 | | | $ | 11.46 | | | $ | 10.84 | |
| Total return | | | 0.51 | %(4) | | | 46.74 | % | | | 17.52 | % | | | (7.85 | )% | | | 11.31 | % | | | 50.21 | % |
| | | | | | | | | | | | | | | | | | | | | | | | | |
| SUPPLEMENTAL DATA AND RATIOS | | | | | | | | | | | | | | | | | | | | | | | | |
| Net assets, end of period (000’s) | | $ | 44,957 | | | $ | 47,466 | | | $ | 32,929 | | | $ | 30,191 | | | $ | 38,562 | | | $ | 41,254 | |
| Ratio of operating expenses to | | | | | | | | | | | | | | | | | | | | | | | | |
| average net assets: | | | | | | | | | | | | | | | | | | | | | | | | |
| Before expense reimbursement | | | 1.85 | %(5) | | | 1.88 | % | | | 1.97 | % | | | 1.93 | % | | | 1.92 | % | | | 1.93 | % |
After expense reimbursement(6) | | | 1.64 | %(5) | | | 1.64 | % | | | 1.64 | % | | | 1.64 | % | | | 1.64 | % | | | 1.64 | % |
| Ratio of net investment income (loss) | | | | | | | | | | | | | | | | | | | | | | | | |
| to average net assets: | | | | | | | | | | | | | | | | | | | | | | | | |
| Before expense reimbursement | | | (0.52 | )%(5) | | | (0.21 | )% | | | (0.10 | )% | | | (0.20 | )% | | | 0.06 | % | | | (0.25 | )% |
After expense reimbursement(6) | | | (0.31 | )%(5) | | | 0.03 | % | | | 0.23 | % | | | 0.09 | % | | | 0.34 | % | | | 0.04 | % |
Portfolio turnover rate(7) | | | 14 | % | | | 21 | % | | | 26 | % | | | 14 | % | | | 12 | % | | | 14 | % |
| (1) | Information presented relates to a share of capital stock outstanding for each period. |
| (2) | Net investment income per share represents net investment income divided by the average shares outstanding throughout the period. |
| (3) | Amount calculated is less than $0.005. |
| (4) | Not annualized. |
| (5) | Annualized. |
| (6) | See Note #3, Investment Adviser, for the waiver and expense reimbursement discussion. |
| (7) | Portfolio turnover of The Market Opportunities Portfolio. |
The accompanying notes are an integral part of these financial statements.
| KINETICS MUTUAL FUNDS, INC. — THE FEEDER FUNDS |
Financial Highlights — (Continued) |
| | | The Market Opportunities Fund | |
| | | Advisor Class A | |
| | | For the Six Months Ended June 30, 2014 (Unaudited) | | | For the Year Ended December 31, 2013 | | | For the Year Ended December 31, 2012 | | | For the Year Ended December 31, 2011 | | | For the Year Ended December 31, 2010 | | | For the Year Ended December 31, 2009 | |
PER SHARE DATA:(1) | | | | | | | | | | | | | | | | | | |
| Net Asset Value, Beginning | | | | | | | | | | | | | | | | | | |
| of Period | | $ | 17.60 | | | $ | 12.07 | | | $ | 10.43 | | | $ | 11.43 | | | $ | 10.80 | | | $ | 7.22 | |
| Income from Investment Operations: | | | | | | | | | | | | | | | | | | | | | | | | |
Net investment income (loss)(2) | | | (0.05 | ) | | | (0.03 | ) | | | 0.00 | (3) | | | (0.02 | ) | | | 0.01 | | | | (0.02 | ) |
| Net realized and unrealized gain | | | | | | | | | | | | | | | | | | | | | | | | |
| (loss) on investments | | | 0.12 | | | | 5.63 | | | | 1.80 | | | | (0.90 | ) | | | 1.19 | | | | 3.61 | |
| Total from investment | | | | | | | | | | | | | | | | | | | | | | | | |
| operations | | | 0.07 | | | | 5.60 | | | | 1.80 | | | | (0.92 | ) | | | 1.20 | | | | 3.59 | |
| Redemption Fees | | | — | | | | 0.00 | (3) | | | 0.00 | (3) | | | 0.00 | (3) | | | 0.00 | (3) | | | 0.00 | (3) |
| Less Distributions: | | | | | | | | | | | | | | | | | | | | | | | | |
| From net investment income | | | — | | | | (0.07 | ) | | | (0.16 | ) | | | (0.08 | ) | | | (0.57 | ) | | | (0.01 | ) |
| Total distributions | | | — | | | | (0.07 | ) | | | (0.16 | ) | | | (0.08 | ) | | | (0.57 | ) | | | (0.01 | ) |
Net Asset Value, End of Period | | $ | 17.67 | | | $ | 17.60 | | | $ | 12.07 | | | $ | 10.43 | | | $ | 11.43 | | | $ | 10.80 | |
Total return(4) | | | 0.40 | %(5) | | | 46.36 | % | | | 17.26 | % | | | (8.08 | )% | | | 11.11 | % | | | 49.66 | % |
| | | | | | | | | | | | | | | | | | | | | | | | | |
| SUPPLEMENTAL DATA AND RATIOS | | | | | | | | | | | | | | | | | | | | | | | | |
| Net assets, end of period (000’s) | | $ | 10,744 | | | $ | 11,742 | | | $ | 6,518 | | | $ | 8,600 | | | $ | 14,167 | | | $ | 18,770 | |
| Ratio of operating expenses to | | | | | | | | | | | | | | | | | | | | | | | | |
| average net assets: | | | | | | | | | | | | | | | | | | | | | | | | |
| Before expense reimbursement | | | 2.10 | %(6) | | | 2.13 | % | | | 2.22 | % | | | 2.18 | % | | | 2.17 | % | | | 2.18 | % |
After expense reimbursement(7) | | | 1.89 | %(6) | | | 1.89 | % | | | 1.89 | % | | | 1.89 | % | | | 1.89 | % | | | 1.89 | % |
| Ratio of net investment income (loss) | | | | | | | | | | | | | | | | | | | | | | | | |
| to average net assets: | | | | | | | | | | | | | | | | | | | | | | | | |
| Before expense reimbursement | | | (0.77 | )%(6) | | | (0.46 | )% | | | (0.35 | )% | | | (0.45 | )% | | | (0.19 | )% | | | (0.50 | )% |
After expense reimbursement(7) | | | (0.56 | )%(6) | | | (0.22 | )% | | | (0.02 | )% | | | (0.16 | )% | | | 0.09 | % | | | (0.21 | )% |
Portfolio turnover rate(8) | | | 14 | % | | | 21 | % | | | 26 | % | | | 14 | % | | | 12 | % | | | 14 | % |
| (1) | Information presented relates to a share of capital stock outstanding for each period. |
| (2) | Net investment income per share represents net investment income divided by the average shares outstanding throughout the period. |
| (3) | Amount calculated is less than $0.005. |
| (4) | The total return calculation does not reflect the 5.75% front end sales charge on Advisor Class A shares. |
| (5) | Not annualized. |
| (6) | Annualized. |
| (7) | See Note #3, Investment Adviser, for the waiver and expense reimbursement discussion. |
| (8) | Portfolio turnover of The Market Opportunities Portfolio. |
The accompanying notes are an integral part of these financial statements.
| KINETICS MUTUAL FUNDS, INC. — THE FEEDER FUNDS |
Financial Highlights — (Continued) |
| | | The Market Opportunities Fund | |
| | | Advisor Class C | |
| | | For the Six Months Ended June 30, 2014 (Unaudited) | | | For the Year Ended December 31, 2013 | | | For the Year Ended December 31, 2012 | | | For the Year Ended December 31, 2011 | | | For the Year Ended December 31, 2010 | | | For the Year Ended December 31, 2009 | |
PER SHARE DATA:(1) | | | | | | | | | | | | | | | | | | |
| Net Asset Value, Beginning | | | | | | | | | | | | | | | | | | |
| of Period | | $ | 17.32 | | | $ | 11.94 | | | $ | 10.32 | | | $ | 11.30 | | | $ | 10.69 | | | $ | 7.17 | |
| Income from Investment Operations: | | | | | | | | | | | | | | | | | | | | | | | | |
Net investment loss(2) | | | (0.09 | ) | | | (0.11 | ) | | | (0.06 | ) | | | (0.08 | ) | | | (0.04 | ) | | | (0.06 | ) |
| Net realized and unrealized gain | | | | | | | | | | | | | | | | | | | | | | | | |
| (loss) on investments | | | 0.11 | | | | 5.56 | | | | 1.78 | | | | (0.88 | ) | | | 1.17 | | | | 3.59 | |
| Total from investment | | | | | | | | | | | | | | | | | | | | | | | | |
| operations | | | 0.02 | | | | 5.45 | | | | 1.72 | | | | (0.96 | ) | | | 1.13 | | | | 3.53 | |
| Redemption Fees | | | — | | | | 0.00 | (3) | | | 0.00 | (3) | | | — | | | | 0.00 | (3) | | | 0.00 | (3) |
| Less Distributions: | | | | | | | | | | | | | | | | | | | | | | | | |
| From net investment income | | | — | | | | (0.07 | ) | | | (0.10 | ) | | | (0.02 | ) | | | (0.52 | ) | | | (0.01 | ) |
| Total distributions | | | — | | | | (0.07 | ) | | | (0.10 | ) | | | (0.02 | ) | | | (0.52 | ) | | | (0.01 | ) |
Net Asset Value, End of Period | | $ | 17.34 | | | $ | 17.32 | | | $ | 11.94 | | | $ | 10.32 | | | $ | 11.30 | | | $ | 10.69 | |
| Total return | | | 0.12 | %(4) | | | 45.61 | % | | | 16.70 | % | | | (8.51 | )% | | | 10.54 | % | | | 49.17 | % |
| | | | | | | | | | | | | | | | | | | | | | | | | |
| SUPPLEMENTAL DATA AND RATIOS | | | | | | | | | | | | | | | | | | | | | | | | |
| Net assets, end of period (000’s) | | $ | 5,818 | | | $ | 5,525 | | | $ | 3,932 | | | $ | 4,233 | | | $ | 5,569 | | | $ | 6,055 | |
| Ratio of operating expenses to | | | | | | | | | | | | | | | | | | | | | | | | |
| average net assets: | | | | | | | | | | | | | | | | | | | | | | | | |
| Before expense reimbursement | | | 2.60 | %(5) | | | 2.63 | % | | | 2.72 | % | | | 2.68 | % | | | 2.67 | % | | | 2.68 | % |
After expense reimbursement(6) | | | 2.39 | %(5) | | | 2.39 | % | | | 2.39 | % | | | 2.39 | % | | | 2.39 | % | | | 2.39 | % |
| Ratio of net investment loss | | | | | | | | | | | | | | | | | | | | | | | | |
| to average net assets: | | | | | | | | | | | | | | | | | | | | | | | | |
| Before expense reimbursement | | | (1.27 | )%(5) | | | (0.96 | )% | | | (0.85 | )% | | | (0.95 | )% | | | (0.69 | )% | | | (1.00 | )% |
After expense reimbursement(6) | | | (1.06 | )%(5) | | | (0.72 | )% | | | (0.52 | )% | | | (0.66 | )% | | | (0.41 | )% | | | (0.71 | )% |
Portfolio turnover rate(7) | | | 14 | % | | | 21 | % | | | 26 | % | | | 14 | % | | | 12 | % | | | 14 | % |
| (1) | Information presented relates to a share of capital stock outstanding for each period. |
| (2) | Net investment income per share represents net investment income divided by the average shares outstanding throughout the period. |
| (3) | Amount calculated is less than $0.005. |
| (4) | Not annualized. |
| (5) | Annualized. |
| (6) | See Note #3, Investment Adviser, for the waiver and expense reimbursement discussion. |
| (7) | Portfolio turnover of The Market Opportunities Portfolio. |
The accompanying notes are an integral part of these financial statements.
| KINETICS MUTUAL FUNDS, INC. — THE FEEDER FUNDS |
Financial Highlights — (Continued) |
| | | The Market Opportunities Fund | |
| | | Institutional Class | |
| | | For the Six Months Ended June 30, 2014 (Unaudited) | | | For the Year Ended December 31, 2013 | | | For the Year Ended December 31, 2012 | | | For the Year Ended December 31, 2011 | | | For the Year Ended December 31, 2010 | | | For the Year Ended December 31, 2009 | |
PER SHARE DATA:(1) | | | | | | | | | | | | | | | | | | |
| Net Asset Value, Beginning | | | | | | | | | | | | | | | | | | |
| of Period | | $ | 17.74 | | | $ | 12.10 | | | $ | 10.46 | | | $ | 11.48 | | | $ | 10.86 | | | $ | 7.21 | |
| Income from Investment Operations: | | | | | | | | | | | | | | | | | | | | | | | | |
Net investment income (loss)(2) | | | (0.01 | ) | | | 0.03 | | | | 0.05 | | | | 0.03 | | | | 0.06 | | | | 0.02 | |
| Net realized and unrealized gain | | | | | | | | | | | | | | | | | | | | | | | | |
| (loss) on investments | | | 0.12 | | | | 5.67 | | | | 1.81 | | | | (0.92 | ) | | | 1.19 | | | | 3.64 | |
| Total from investment | | | | | | | | | | | | | | | | | | | | | | | | |
| operations | | | 0.11 | | | | 5.70 | | | | 1.86 | | | | (0.89 | ) | | | 1.25 | | | | 3.66 | |
| Redemption Fees | | | — | | | | 0.01 | | | | — | | | | — | | | | — | | | | — | |
| Less Distributions: | | | | | | | | | | | | | | | | | | | | | | | | |
| From net investment income | | | — | | | | (0.07 | ) | | | (0.22 | ) | | | (0.13 | ) | | | (0.63 | ) | | | (0.01 | ) |
| Total distributions | | | — | | | | (0.07 | ) | | | (0.22 | ) | | | (0.13 | ) | | | (0.63 | ) | | | (0.01 | ) |
Net Asset Value, End of Period | | $ | 17.85 | | | $ | 17.74 | | | $ | 12.10 | | | $ | 10.46 | | | $ | 11.48 | | | $ | 10.86 | |
| Total return | | | 0.62 | %(3) | | | 47.15 | % | | | 17.83 | % | | | (7.71 | )% | | | 11.54 | % | | | 50.70 | % |
| | | | | | | | | | | | | | | | | | | | | | | | | |
| SUPPLEMENTAL DATA AND RATIOS | | | | | | | | | | | | | | | | | | | | | | | | |
| Net assets, end of period (000’s) | | $ | 2,010 | | | $ | 1,809 | | | $ | 229 | | | $ | 186 | | | $ | 212 | | | $ | 19 | |
| Ratio of operating expenses to | | | | | | | | | | | | | | | | | | | | | | | | |
| average net assets: | | | | | | | | | | | | | | | | | | | | | | | | |
| Before expense reimbursement | | | 1.80 | %(4) | | | 1.83 | % | | | 1.92 | % | | | 1.88 | % | | | 1.87 | % | | | 1.88 | % |
After expense reimbursement(5) | | | 1.44 | %(4) | | | 1.44 | % | | | 1.44 | % | | | 1.44 | % | | | 1.44 | % | | | 1.44 | % |
| Ratio of net investment income (loss) | | | | | | | | | | | | | | | | | | | | | | | | |
| to average net assets: | | | | | | | | | | | | | | | | | | | | | | | | |
| Before expense reimbursement | | | (0.47 | )%(4) | | | (0.16 | )% | | | (0.05 | )% | | | (0.15 | )% | | | 0.11 | % | | | (0.20 | )% |
After expense reimbursement(5) | | | (0.11 | )%(4) | | | 0.23 | % | | | 0.43 | % | | | 0.29 | % | | | 0.54 | % | | | 0.24 | % |
Portfolio turnover rate(6) | | | 14 | % | | | 21 | % | | | 26 | % | | | 14 | % | | | 12 | % | | | 14 | % |
| (1) | Information presented relates to a share of capital stock outstanding for each period. |
| (2) | Net investment income per share represents net investment income divided by the average shares outstanding throughout the period. |
| (3) | Not annualized. |
| (4) | Annualized. |
| (5) | See Note #3, Investment Adviser, for the waiver and expense reimbursement discussion. |
| (6) | Portfolio turnover of The Market Opportunities Portfolio. |
The accompanying notes are an integral part of these financial statements.
| KINETICS MUTUAL FUNDS, INC. — THE FEEDER FUNDS |
Financial Highlights — (Continued) |
| | | The Alternative Income Fund | |
| | | No Load Class | |
| | | For the Six Months Ended June 30, 2014 (Unaudited) | | | For the Year Ended December 31, 2013 | | | For the Year Ended December 31, 2012(1) | | | For the Year Ended December 31, 2011(1) | | | For the Year Ended December 31, 2010(1) | | | For the Year Ended December 31, 2009(1) | |
PER SHARE DATA:(2) | | | | | | | | | | | | | | | | | | |
| Net Asset Value, Beginning | | | | | | | | | | | | | | | | | | |
| of Period | | $ | 87.88 | | | $ | 83.31 | | | $ | 77.90 | | | $ | 83.82 | | | $ | 88.57 | | | $ | 76.13 | |
| Income from Investment Operations: | | | | | | | | | | | | | | | | | | | | | | | | |
Net investment income (loss)(3) | | | (0.09 | ) | | | (0.21 | ) | | | 1.53 | | | | 1.03 | | | | 0.72 | | | | 0.37 | |
| Net realized and unrealized gain | | | | | | | | | | | | | | | | | | | | | | | | |
| (loss) on investments | | | 2.30 | | | | 4.78 | | | | 6.09 | | | | (5.13 | ) | | | (4.75 | ) | | | 12.08 | |
| Total from investment | | | | | | | | | | | | | | | | | | | | | | | | |
| operations | | | 2.21 | | | | 4.57 | | | | 7.62 | | | | (4.10 | ) | | | (4.03 | ) | | | 12.45 | |
| Redemption Fees | | | 0.00 | (4) | | | 0.00 | (4) | | | 0.00 | (4) | | | 0.00 | (4) | | | 0.00 | (4) | | | 0.01 | |
| Less Distributions: | | | | | | | | | | | | | | | | | | | | | | | | |
| From net investment income | | | — | | | | — | | | | (2.21 | ) | | | (1.82 | ) | | | (0.72 | ) | | | (0.02 | ) |
| Total distributions | | | — | | | | — | | | | (2.21 | ) | | | (1.82 | ) | | | (0.72 | ) | | | (0.02 | ) |
Net Asset Value, End of Period | | $ | 90.09 | | | $ | 87.88 | | | $ | 83.31 | | | $ | 77.90 | | | $ | 83.82 | | | $ | 88.57 | |
| Total return | | | 2.67 | %(5) | | | 5.22 | % | | | 9.90 | % | | | (4.88 | )% | | | (4.60 | )% | | | 16.46 | % |
| | | | | | | | | | | | | | | | | | | | | | | | | |
| SUPPLEMENTAL DATA AND RATIOS | | | | | | | | | | | | | | | | | | | | | | | | |
| Net assets, end of period (000’s) | | $ | 13,655 | | | $ | 11,848 | | | $ | 4,699 | | | $ | 5,613 | | | $ | 7,001 | | | $ | 7,176 | |
| Ratio of operating expenses to | | | | | | | | | | | | | | | | | | | | | | | | |
| average net assets: | | | | | | | | | | | | | | | | | | | | | | | | |
| Before expense reimbursement | | | 1.83 | %(6) | | | 2.23 | % | | | 2.55 | % | | | 2.29 | % | | | 2.17 | % | | | 2.36 | % |
After expense reimbursement(7) | | | 0.95 | %(6) | | | 0.95 | % | | | 1.64 | % | | | 1.64 | % | | | 1.64 | % | | | 1.64 | % |
| Ratio of net investment income (loss) | | | | | | | | | | | | | | | | | | | | | | | | |
| to average net assets: | | | | | | | | | | | | | | | | | | | | | | | | |
| Before expense reimbursement | | | (1.08 | )%(6) | | | (1.52 | )% | | | 0.93 | % | | | 0.59 | % | | | 0.33 | % | | | (0.26 | )% |
After expense reimbursement(7) | | | (0.20 | )%(6) | | | (0.24 | )% | | | 1.84 | % | | | 1.24 | % | | | 0.86 | % | | | 0.46 | % |
Portfolio turnover rate(8) | | | 8 | % | | | 19 | % | | | 56 | % | | | 69 | % | | | 111 | % | | | 45 | % |
| (1) | Per share data adjusted for 1:10 reverse stock split completed as of May 31, 2013. |
| (2) | Information presented relates to a share of capital stock outstanding for each period. |
| (3) | Net investment income per share represents net investment income divided by the average shares outstanding throughout the period. |
| (4) | Amount calculated is less than $0.005. |
| (5) | Not annualized. |
| (6) | Annualized. |
| (7) | See Note #3, Investment Adviser, for the waiver and expense reimbursement discussion. |
| (8) | Portfolio turnover of The Alternative Income Portfolio. |
The accompanying notes are an integral part of these financial statements.
| KINETICS MUTUAL FUNDS, INC. — THE FEEDER FUNDS |
Financial Highlights — (Continued) |
| | | The Alternative Income Fund | |
| | | Advisor Class A | |
| | | For the Six Months Ended June 30, 2014 (Unaudited) | | | For the Year Ended December 31, 2013 | | | For the Year Ended December 31, 2012(1) | | | For the Year Ended December 31, 2011(1) | | | For the Year Ended December 31, 2010(1) | | | For the Year Ended December 31, 2009(1) | |
PER SHARE DATA:(2) | | | | | | | | | | | | | | | | | | |
| Net Asset Value, Beginning | | | | | | | | | | | | | | | | | | |
| of Period | | $ | 87.73 | | | $ | 83.38 | | | $ | 77.76 | | | $ | 83.52 | | | $ | 88.18 | | | $ | 75.94 | |
| Income from Investment Operations: | | | | | | | | | | | | | | | | | | | | | | | | |
Net investment income (loss)(3) | | | (0.20 | ) | | | (0.43 | ) | | | 1.31 | | | | 0.82 | | | | 0.50 | | | | 0.17 | |
| Net realized and unrealized gain | | | | | | | | | | | | | | | | | | | | | | | | |
| (loss) on investments | | | 2.30 | | | | 4.77 | | | | 6.09 | | | | (5.13 | ) | | | (4.70 | ) | | | 12.06 | |
| Total from investment | | | | | | | | | | | | | | | | | | | | | | | | |
| operations | | | 2.10 | | | | 4.34 | | | | 7.40 | | | | (4.31 | ) | | | (4.20 | ) | | | 12.23 | |
| Redemption Fees | | | 0.00 | (4) | | | 0.01 | | | | 0.00 | (4) | | | 0.01 | | | | 0.01 | | | | 0.01 | |
| Less Distributions: | | | | | | | | | | | | | | | | | | | | | | | | |
| From net investment income | | | — | | | | — | | | | (1.78 | ) | | | (1.46 | ) | | | (0.47 | ) | | | — | |
| Total distributions | | | — | | | | — | | | | (1.78 | ) | | | (1.46 | ) | | | (0.47 | ) | | | — | |
Net Asset Value, End of Period | | $ | 89.83 | | | $ | 87.73 | | | $ | 83.38 | | | $ | 77.76 | | | $ | 83.52 | | | $ | 88.18 | |
Total return(5) | | | 2.55 | %(6) | | | 4.91 | % | | | 9.61 | % | | | (5.08 | )% | | | (4.80 | )% | | | 16.21 | % |
| | | | | | | | | | | | | | | | | | | | | | | | | |
| SUPPLEMENTAL DATA AND RATIOS | | | | | | | | | | | | | | | | | | | | | | | | |
| Net assets, end of period (000’s) | | $ | 4,681 | | | $ | 2,898 | | | $ | 2,597 | | | $ | 4,559 | | | $ | 10,100 | | | $ | 10,339 | |
| Ratio of operating expenses to | | | | | | | | | | | | | | | | | | | | | | | | |
| average net assets: | | | | | | | | | | | | | | | | | | | | | | | | |
| Before expense reimbursement | | | 2.08 | %(7) | | | 2.48 | % | | | 2.80 | % | | | 2.54 | % | | | 2.42 | % | | | 2.61 | % |
After expense reimbursement(8) | | | 1.20 | %(7) | | | 1.20 | % | | | 1.89 | % | | | 1.89 | % | | | 1.89 | % | | | 1.89 | % |
| Ratio of net investment income (loss) | | | | | | | | | | | | | | | | | | | | | | | | |
| to average net assets: | | | | | | | | | | | | | | | | | | | | | | | | |
| Before expense reimbursement | | | (1.33 | )%(7) | | | (1.77 | )% | | | 0.68 | % | | | 0.34 | % | | | 0.08 | % | | | (0.51 | )% |
After expense reimbursement(8) | | | (0.45 | )%(7) | | | (0.49 | )% | | | 1.59 | % | | | 0.99 | % | | | 0.61 | % | | | 0.21 | % |
Portfolio turnover rate(9) | | | 8 | % | | | 19 | % | | | 56 | % | | | 69 | % | | | 111 | % | | | 45 | % |
| (1) | Per share data adjusted for 1:10 reverse stock split completed as of May 31, 2013. |
| (2) | Information presented relates to a share of capital stock outstanding for each period. |
| (3) | Net investment income per share represents net investment income divided by the average shares outstanding throughout the period. |
| (4) | Amount calculated is less than $0.005. |
| (5) | The total return calculation does not reflect the 5.75% front end sales charge on Advisor Class A shares. |
| (6) | Not annualized. |
| (7) | Annualized. |
| (8) | See Note #3, Investment Adviser, for the waiver and expense reimbursement discussion. |
| (9) | Portfolio turnover of The Alternative Income Portfolio. |
The accompanying notes are an integral part of these financial statements.
| KINETICS MUTUAL FUNDS, INC. — THE FEEDER FUNDS |
Financial Highlights — (Continued) |
| | | The Alternative Income Fund | |
| | | Advisor Class C | |
| | | For the Six Months Ended June 30, 2014 (Unaudited) | | | For the Year Ended December 31, 2013 | | | For the Year Ended December 31, 2012(1) | | | For the Year Ended December 31, 2011(1) | | | For the Year Ended December 31, 2010(1) | | | For the Year Ended December 31, 2009(1) | |
PER SHARE DATA:(2) | | | | | | | | | | | | | | | | | | |
| Net Asset Value, Beginning | | | | | | | | | | | | | | | | | | |
| of Period | | $ | 86.10 | | | $ | 82.26 | | | $ | 76.75 | | | $ | 82.53 | | | $ | 87.12 | | | $ | 75.42 | |
| Income from Investment Operations: | | | | | | | | | | | | | | | | | | | | | | | | |
Net investment income (loss)(3) | | | (0.41 | ) | | | (0.84 | ) | | | 0.89 | | | | 0.40 | | | | 0.09 | | | | (0.23 | ) |
| Net realized and unrealized gain | | | | | | | | | | | | | | | | | | | | | | | | |
| (loss) on investments | | | 2.24 | | | | 4.68 | | | | 6.00 | | | | (5.03 | ) | | | (4.57 | ) | | | 11.93 | |
| Total from investment | | | | | | | | | | | | | | | | | | | | | | | | |
| operations | | | 1.83 | | | | 3.84 | | | | 6.89 | | | | (4.63 | ) | | | (4.48 | ) | | | 11.70 | |
| Redemption Fees | | | — | | | | — | | | | 0.00 | (4) | | | 0.01 | | | | 0.00 | (4) | | | 0.00 | (4) |
| Less Distributions: | | | | | | | | | | | | | | | | | | | | | | | | |
| From net investment income | | | — | | | | — | | | | (1.38 | ) | | | (1.16 | ) | | | (0.11 | ) | | | — | |
| Total distributions | | | — | | | | — | | | | (1.38 | ) | | | (1.16 | ) | | | (0.11 | ) | | | — | |
Net Asset Value, End of Period | | $ | 87.93 | | | $ | 86.10 | | | $ | 82.26 | | | $ | 76.75 | | | $ | 82.53 | | | $ | 87.12 | |
| Total return | | | 2.28 | %(5) | | | 4.46 | % | | | 8.96 | % | | | (5.51 | )% | | | (5.15 | )% | | | 15.52 | % |
| | | | | | | | | | | | | | | | | | | | | | | | | |
| SUPPLEMENTAL DATA AND RATIOS | | | | | | | | | | | | | | | | | | | | | | | | |
| Net assets, end of period (000’s) | | $ | 1,330 | | | $ | 1,862 | | | $ | 1,763 | | | $ | 2,316 | | | $ | 2,840 | | | $ | 2,700 | |
| Ratio of operating expenses to | | | | | | | | | | | | | | | | | | | | | | | | |
| average net assets: | | | | | | | | | | | | | | | | | | | | | | | | |
| Before expense reimbursement | | | 2.58 | %(6) | | | 2.98 | % | | | 3.30 | % | | | 3.04 | % | | | 2.92 | % | | | 3.11 | % |
After expense reimbursement(7) | | | 1.70 | %(6) | | | 1.70 | % | | | 2.39 | % | | | 2.39 | % | | | 2.39 | % | | | 2.39 | % |
| Ratio of net investment income (loss) | | | | | | | | | | | | | | | | | | | | | | | | |
| to average net assets: | | | | | | | | | | | | | | | | | | | | | | | | |
| Before expense reimbursement | | | (1.83 | )%(6) | | | (2.27 | )% | | | 0.18 | % | | | (0.16 | )% | | | (0.42 | )% | | | (1.01 | )% |
After expense reimbursement(7) | | | (0.95 | )%(6) | | | (0.99 | )% | | | 1.09 | % | | | 0.49 | % | | | 0.11 | % | | | (0.29 | )% |
Portfolio turnover rate(8) | | | 8 | % | | | 19 | % | | | 56 | % | | | 69 | % | | | 111 | % | | | 45 | % |
| (1) | Per share data adjusted for 1:10 reverse stock split completed as of May 31, 2013. |
| (2) | Information presented relates to a share of capital stock outstanding for each period. |
| (3) | Net investment income per share represents net investment income divided by the average shares outstanding throughout the period. |
| (4) | Amount calculated is less than $0.005. (5) Not annualized. |
| (6) | Annualized. |
| (7) | See Note #3, Investment Adviser, for the waiver and expense reimbursement discussion. |
| (8) | Portfolio turnover of The Alternative Income Portfolio. |
The accompanying notes are an integral part of these financial statements.
| KINETICS MUTUAL FUNDS, INC. — THE FEEDER FUNDS |
Financial Highlights — (Continued) |
| | | The Alternative Income Fund | |
| | | Institutional Class | |
| | | For the Six Months Ended June 30, 2014 (Unaudited) | | | For the Year Ended December 31, 2013 | | | For the Year Ended December 31, 2012(1) | | | For the Year Ended December 31, 2011(1) | | | For the Year Ended December 31, 2010(1) | | | For the Year Ended December 31, 2009(1) | |
PER SHARE DATA:(2) | | | | | | | | | | | | | | | | | | |
| Net Asset Value, Beginning | | | | | | | | | | | | | | | | | | |
| of Period | | $ | 88.76 | | | $ | 84.00 | | | $ | 78.49 | | | $ | 84.22 | | | $ | 88.97 | | | $ | 76.32 | |
| Income from Investment Operations: | | | | | | | | | | | | | | | | | | | | | | | | |
Net investment income (loss)(3) | | | 0.00 | (4) | | | (0.04 | ) | | | 1.72 | | | | 1.21 | | | | 0.88 | | | | 0.55 | |
| Net realized and unrealized gain | | | | | | | | | | | | | | | | | | | | | | | | |
| (loss) on investments | | | 2.32 | | | | 4.80 | | | | 6.16 | | | | (5.13 | ) | | | (4.74 | ) | | | 12.26 | |
| Total from investment | | | | | | | | | | | | | | | | | | | | | | | | |
| operations | | | 2.32 | | | | 4.76 | | | | 7.88 | | | | (3.92 | ) | | | (3.86 | ) | | | 12.81 | |
| Redemption Fees | | | — | | | | — | | | | 0.01 | | | | 0.17 | | | | 0.01 | | | | 0.06 | |
| Less Distributions: | | | | | | | | | | | | | | | | | | | | | | | | |
| From net investment income | | | — | | | | — | | | | (2.38 | ) | | | (1.98 | ) | | | (0.90 | ) | | | (0.22 | ) |
| Total distributions | | | — | | | | — | | | | (2.38 | ) | | | (1.98 | ) | | | (0.90 | ) | | | (0.22 | ) |
Net Asset Value, End of Period | | $ | 91.08 | | | $ | 88.76 | | | $ | 84.00 | | | $ | 78.49 | | | $ | 84.22 | | | $ | 88.97 | |
| Total return | | | 2.76 | %(5) | | | 5.39 | % | | | 10.17 | % | | | (4.43 | )% | | | (4.38 | )% | | | 16.94 | % |
| | | | | | | | | | | | | | | | | | | | | | | | | |
| SUPPLEMENTAL DATA AND RATIOS | | | | | | | | | | | | | | | | | | | | | | | | |
| Net assets, end of period (000’s) | | $ | 10,199 | | | $ | 6,854 | | | $ | 1,629 | | | $ | 798 | | | $ | 4,182 | | | $ | 2,905 | |
| Ratio of operating expenses to | | | | | | | | | | | | | | | | | | | | | | | | |
| average net assets: | | | | | | | | | | | | | | | | | | | | | | | | |
| Before expense reimbursement | | | 1.78 | %(6) | | | 2.18 | % | | | 2.50 | % | | | 2.24 | % | | | 2.12 | % | | | 2.31 | % |
After expense reimbursement(7) | | | 0.75 | %(6) | | | 0.75 | % | | | 1.44 | % | | | 1.44 | % | | | 1.44 | % | | | 1.44 | % |
| Ratio of net investment income (loss) to | | | | | | | | | | | | | | | | | | | | | | | | |
| average net assets: | | | | | | | | | | | | | | | | | | | | | | | | |
| Before expense reimbursement | | | (1.03 | )%(6) | | | (1.47 | )% | | | 0.98 | % | | | 0.64 | % | | | 0.38 | % | | | (0.21 | )% |
After expense reimbursement(7) | | | 0.00 | %(6) | | | (0.04 | )% | | | 2.04 | % | | | 1.44 | % | | | 1.06 | % | | | 0.66 | % |
Portfolio turnover rate(8) | | | 8 | % | | | 19 | % | | | 56 | % | | | 69 | % | | | 111 | % | | | 45 | % |
| (1) | Per share data adjusted for 1:10 reverse stock split completed as of May 31, 2013. |
| (2) | Information presented relates to a share of capital stock outstanding for each period. |
| (3) | Net investment income per share represents net investment income divided by the average shares outstanding throughout the period. |
| (4) | Amount calculated is less than $0.005. |
| (5) | Not annualized. |
| (6) | Annualized. |
| (7) | See Note #3, Investment Adviser, for the waiver and expense reimbursement discussion. |
| (8) | Portfolio turnover of The Alternative Income Portfolio. |
The accompanying notes are an integral part of these financial statements.
| KINETICS MUTUAL FUNDS, INC. — THE FEEDER FUNDS |
Financial Highlights — (Continued) |
| | | The Multi-Disciplinary Fund | |
| | | No Load Class | |
| | | For the Six Months Ended June 30, 2014 (Unaudited) | | | For the Year Ended December 31, 2013 | | | For the Year Ended December 31, 2012 | | | For the Year Ended December 31, 2011 | | | For the Year Ended December 31, 2010 | | | For the Year Ended December 31, 2009 | |
PER SHARE DATA:(1) | | | | | | | | | | | | | | | | | | |
| Net Asset Value, | | | | | | | | | | | | | | | | | | |
| Beginning of Period | | $ | 11.02 | | | $ | 11.08 | | | $ | 10.09 | | | $ | 10.47 | | | $ | 9.86 | | | $ | 8.22 | |
| Income from Investment Operations: | | | | | | | | | | | | | | | | | | | | | | | | |
Net investment income(2) | | | 0.12 | | | | 0.20 | | | | 0.34 | | | | 0.83 | | | | 0.35 | | | | 0.09 | |
| Net realized and unrealized gain | | | | | | | | | | | | | | | | | | | | | | | | |
| (loss) on investments | | | 0.42 | | | | 0.28 | | | | 1.20 | | | | (0.80 | ) | | | 0.91 | | | | 1.79 | |
| Total from investment | | | | | | | | | | | | | | | | | | | | | | | | |
| operations | | | 0.54 | | | | 0.48 | | | | 1.54 | | | | 0.03 | | | | 1.26 | | | | 1.88 | |
| Redemption Fees | | | 0.00 | (3) | | | 0.00 | (3) | | | 0.00 | (3) | | | 0.00 | (3) | | | 0.00 | (3) | | | — | |
| Less Distributions: | | | | | | | | | | | | | | | | | | | | | | | | |
| From net investment income | | | (0.10 | ) | | | (0.28 | ) | | | (0.43 | ) | | | (0.36 | ) | | | (0.35 | ) | | | (0.08 | ) |
| From net realized gains | | | (0.05 | ) | | | (0.26 | ) | | | (0.12 | ) | | | (0.05 | ) | | | (0.30 | ) | | | (0.16 | ) |
| Total distributions | | | (0.15 | ) | | | (0.54 | ) | | | (0.55 | ) | | | (0.41 | ) | | | (0.65 | ) | | | (0.24 | ) |
| Net Asset Value, End of Period | | $ | 11.41 | | | $ | 11.02 | | | $ | 11.08 | | | $ | 10.09 | | | $ | 10.47 | | | $ | 9.86 | |
| Total return | | | 4.90 | %(4) | | | 4.28 | % | | | 15.38 | % | | | 0.24 | % | | | 13.04 | % | | | 22.90 | % |
| | | | | | | | | | | | | | | | | | | | | | | | | |
| SUPPLEMENTAL DATA AND RATIOS | | | | | | | | | | | | | | | | | | | | | | | | |
| Net assets, end of period (000’s) | | $ | 20,360 | | | $ | 19,553 | | | $ | 19,566 | | | $ | 13,389 | | | $ | 3,489 | | | $ | 938 | |
| Ratio of operating expenses to | | | | | | | | | | | | | | | | | | | | | | | | |
| average net assets: | | | | | | | | | | | | | | | | | | | | | | | | |
| Before expense reimbursement | | | 1.80 | %(5) | | | 1.83 | %(8) | | | 2.00 | % | | | 2.38 | % | | | 6.11 | % | | | 13.11 | % |
After expense reimbursement(6) | | | 1.49 | %(5) | | | 1.50 | %(8) | | | 1.49 | % | | | 1.49 | % | | | 1.49 | % | | | 1.49 | % |
| Ratio of net investment income (loss) | | | | | | | | | | | | | | | | | | | | | | | | |
| to average net assets: | | | | | | | | | | | | | | | | | | | | | | | | |
| Before expense reimbursement | | | 1.78 | %(5) | | | 1.41 | %(9) | | | 2.65 | % | | | 7.09 | % | | | (1.19 | )% | | | (10.69 | )% |
After expense reimbursement(6) | | | 2.09 | %(5) | | | 1.74 | %(9) | | | 3.16 | % | | | 7.98 | % | | | 3.43 | % | | | 0.93 | % |
Portfolio turnover rate(7) | | | 20 | % | | | 54 | % | | | 41 | % | | | 74 | % | | | 38 | % | | | 77 | % |
| (1) | Information presented relates to a share of capital stock outstanding for each period. |
| (2) | Net investment income per share represents net investment income divided by the average shares outstanding throughout the period. |
| (3) | Amount calculated is less than $0.005. |
| (4) | Not annualized. |
| (5) | Annualized. |
| (6) | See Note #3, Investment Adviser, for the waiver and expense reimbursement discussion. |
| (7) | Portfolio turnover of The Multi-Disciplinary Portfolio. |
| (8) | The ratio of expenses includes borrowing expense on securities sold short. The expense ratio excluding borrowing expenses on securities sold short was 1.82% before expense reimbursement and 1.49% after expense reimbursement. |
| (9) | The ratio of net investment income includes borrowing expense on securities sold short. |
The accompanying notes are an integral part of these financial statements.
| KINETICS MUTUAL FUNDS, INC. — THE FEEDER FUNDS |
Financial Highlights — (Continued) |
| | | The Multi-Disciplinary Fund | |
| | | Advisor Class A | |
| | | For the Six Months Ended June 30, 2014 (Unaudited) | | | For the Year Ended December 31, 2013 | | | For the Year Ended December 31, 2012 | | | For the Year Ended December 31, 2011 | | | For the Year Ended December 31, 2010 | | | For the Year Ended December 31, 2009 | |
PER SHARE DATA:(1) | | | | | | | | | | | | | | | | | | |
| Net Asset Value, | | | | | | | | | | | | | | | | | | |
| Beginning of Period | | $ | 10.98 | | | $ | 11.03 | | | $ | 10.05 | | | $ | 10.44 | | | $ | 9.85 | | | $ | 8.20 | |
| Income from Investment Operations: | | | | | | | | | | | | | | | | | | | | | | | | |
Net investment income(2) | | | 0.10 | | | | 0.17 | | | | 0.31 | | | | 0.78 | | | | 0.33 | | | | 0.06 | |
| Net realized and unrealized gain | | | | | | | | | | | | | | | | | | | | | | | | |
| (loss) on investments | | | 0.43 | | | | 0.29 | | | | 1.20 | | | | (0.78 | ) | | | 0.89 | | | | 1.80 | |
| Total from investment | | | | | | | | | | | | | | | | | | | | | | | | |
| operations | | | 0.53 | | | | 0.46 | | | | 1.51 | | | | — | | | | 1.22 | | | | 1.86 | |
| Redemption Fees | | | 0.00 | (3) | | | 0.00 | (3) | | | 0.00 | (3) | | | — | | | | — | | | | — | |
| Less Distributions: | | | | | | | | | | | | | | | | | | | | | | | | |
| From net investment income | | | (0.09 | ) | | | (0.25 | ) | | | (0.41 | ) | | | (0.34 | ) | | | (0.33 | ) | | | (0.05 | ) |
| From net realized gains | | | (0.05 | ) | | | (0.26 | ) | | | (0.12 | ) | | | (0.05 | ) | | | (0.30 | ) | | | (0.16 | ) |
| Total distributions | | | (0.14 | ) | | | (0.51 | ) | | | (0.53 | ) | | | (0.39 | ) | | | (0.63 | ) | | | (0.21 | ) |
| Net Asset Value, End of Period | | $ | 11.37 | | | $ | 10.98 | | | $ | 11.03 | | | $ | 10.05 | | | $ | 10.44 | | | $ | 9.85 | |
Total return(4) | | | 4.76 | %(5) | | | 4.15 | % | | | 15.12 | % | | | (0.01 | )% | | | 12.64 | % | | | 22.73 | % |
| | | | | | | | | | | | | | | | | | | | | | | | | |
| SUPPLEMENTAL DATA AND RATIOS | | | | | | | | | | | | | | | | | | | | | | | | |
| Net assets, end of period (000’s) | | $ | 25,442 | | | $ | 36,170 | | | $ | 25,764 | | | $ | 4,726 | | | $ | 356 | | | $ | 103 | |
| Ratio of operating expenses to | | | | | | | | | | | | | | | | | | | | | | | | |
| average net assets: | | | | | | | | | | | | | | | | | | | | | | | | |
| Before expense reimbursement | | | 2.05 | %(6) | | | 2.08 | %(9) | | | 2.25 | % | | | 2.63 | % | | | 6.36 | % | | | 13.36 | % |
After expense reimbursement(7) | | | 1.74 | %(6) | | | 1.75 | %(9) | | | 1.74 | % | | | 1.74 | % | | | 1.74 | % | | | 1.74 | % |
| Ratio of net investment income (loss) | | | | | | | | | | | | | | | | | | | | | | | | |
| to average net assets: | | | | | | | | | | | | | | | | | | | | | | | | |
| Before expense reimbursement | | | 1.53 | %(6) | | | 1.16 | %(10) | | | 2.40 | % | | | 6.84 | % | | | (1.44 | )% | | | (10.94 | )% |
After expense reimbursement(7) | | | 1.84 | %(6) | | | 1.49 | %(10) | | | 2.91 | % | | | 7.73 | % | | | 3.18 | % | | | 0.68 | % |
Portfolio turnover rate(8) | | | 20 | % | | | 54 | % | | | 41 | % | | | 74 | % | | | 38 | % | | | 77 | % |
| (1) | Information presented relates to a share of capital stock outstanding for each period. |
| (2) | Net investment income per share represents net investment income divided by the average shares outstanding throughout the period. |
| (3) | Amount calculated is less than $0.005. |
| (4) | The total return calculation does not reflect the 5.75% front end sales charge on Advisor Class A shares. |
| (5) | Not annualized. |
| (6) | Annualized. |
| (7) | See Note #3, Investment Adviser, for the waiver and expense reimbursement discussion. |
| (8) | Portfolio turnover of The Multi-Disciplinary Portfolio. |
| (9) | The ratio of expenses includes borrowing expense on securities sold short. The expense ratio excluding borrowing expenses on securities sold short was 2.07% before expense reimbursement and 1.74% after expense reimbursement. |
| (10) | The ratio of net investment income includes borrowing expense on securities sold short. |
| | |
The accompanying notes are an integral part of these financial statements.
| KINETICS MUTUAL FUNDS, INC. — THE FEEDER FUNDS |
Financial Highlights — (Continued) |
| | | The Multi-Disciplinary Fund | |
| | | Advisor Class C | |
| | | For the Six Months Ended June 30, 2014 (Unaudited) | | | For the Year Ended December 31, 2013 | | | For the Year Ended December 31, 2012 | | | For the Year Ended December 31, 2011 | | | For the Year Ended December 31, 2010 | | | For the Year Ended December 31, 2009 | |
PER SHARE DATA:(1) | | | | | | | | | | | | | | | | | | |
| Net Asset Value, | | | | | | | | | | | | | | | | | | |
| Beginning of Period | | $ | 10.90 | | | $ | 10.96 | | | $ | 10.00 | | | $ | 10.40 | | | $ | 9.80 | | | $ | 8.17 | |
| Income from Investment Operations: | | | | | | | | | | | | | | | | | | | | | | | | |
Net investment income(2) | | | 0.07 | | | | 0.11 | | | | 0.26 | | | | 0.74 | | | | 0.27 | | | | 0.02 | |
| Net realized and unrealized gain | | | | | | | | | | | | | | | | | | | | | | | | |
| (loss) on investments | | | 0.42 | | | | 0.29 | | | | 1.18 | | | | (0.78 | ) | | | 0.90 | | | | 1.78 | |
| Total from investment | | | | | | | | | | | | | | | | | | | | | | | | |
| operations | | | 0.49 | | | | 0.40 | | | | 1.44 | | | | (0.04 | ) | | | 1.17 | | | | 1.80 | |
| Redemption Fees | | | 0.00 | (3) | | | — | | | | — | | | | — | | | | — | | | | — | |
| Less Distributions: | | | | | | | | | | | | | | | | | | | | | | | | |
| From net investment income | | | (0.07 | ) | | | (0.20 | ) | | | (0.36 | ) | | | (0.31 | ) | | | (0.27 | ) | | | (0.01 | ) |
| From net realized gains | | | (0.05 | ) | | | (0.26 | ) | | | (0.12 | ) | | | (0.05 | ) | | | (0.30 | ) | | | (0.16 | ) |
| Total distributions | | | (0.12 | ) | | | (0.46 | ) | | | (0.48 | ) | | | (0.36 | ) | | | (0.57 | ) | | | (0.17 | ) |
| Net Asset Value, End of Period | | $ | 11.27 | | | $ | 10.90 | | | $ | 10.96 | | | $ | 10.00 | | | $ | 10.40 | | | $ | 9.80 | |
| Total return | | | 4.44 | %(4) | | | 3.59 | % | | | 14.48 | % | | | (0.49 | )% | | | 12.13 | % | | | 22.03 | % |
| | | | | | | | | | | | | | | | | | | | | | | | | |
| SUPPLEMENTAL DATA AND RATIOS | | | | | | | | | | | | | | | | | | | | | | | | |
| Net assets, end of period (000’s) | | $ | 11,868 | | | $ | 11,209 | | | $ | 7,485 | | | $ | 1,645 | | | $ | 128 | | | $ | 105 | |
| Ratio of operating expenses to | | | | | | | | | | | | | | | | | | | | | | | | |
| average net assets: | | | | | | | | | | | | | | | | | | | | | | | | |
| Before expense reimbursement | | | 2.55 | %(5) | | | 2.58 | %(8) | | | 2.75 | % | | | 3.13 | % | | | 6.86 | % | | | 13.86 | % |
After expense reimbursement(6) | | | 2.24 | %(5) | | | 2.25 | %(8) | | | 2.24 | % | | | 2.24 | % | | | 2.24 | % | | | 2.24 | % |
| Ratio of net investment income | | | | | | | | | | | | | | | | | | | | | | | | |
| (loss) to average net assets: | | | | | | | | | | | | | | | | | | | | | | | | |
| Before expense reimbursement | | | 1.03 | %(5) | | | 0.66 | %(9) | | | 1.90 | % | | | 6.34 | % | | | (1.94 | )% | | | (11.44 | )% |
After expense reimbursement(6) | | | 1.34 | %(5) | | | 0.99 | %(9) | | | 2.41 | % | | | 7.23 | % | | | 2.68 | % | | | 0.18 | % |
Portfolio turnover rate(7) | | | 20 | % | | | 54 | % | | | 41 | % | | | 74 | % | | | 38 | % | | | 77 | % |
| (1) | Information presented relates to a share of capital stock outstanding for each period. |
| (2) | Net investment income per share represents net investment income divided by the average shares outstanding throughout the period. |
| (3) | Amount calculated is less than $0.005. |
| (4) | Not annualized. |
| (5) | Annualized. |
| (6) | See Note #3, Investment Adviser, for the waiver and expense reimbursement discussion. |
| (7) | Portfolio turnover of The Multi-Disciplinary Portfolio. |
| (8) | The ratio of expenses includes borrowing expense on securities sold short. The expense ratio excluding borrowing expenses on securities sold short was 2.57% before expense reimbursement and 2.24% after expense reimbursement. |
| (9) | The ratio of net investment income includes borrowing expense on securities sold short. |
| | |
The accompanying notes are an integral part of these financial statements.
| KINETICS MUTUAL FUNDS, INC. — THE FEEDER FUNDS |
Financial Highlights — (Continued) |
| | | The Multi-Disciplinary Fund | |
| | | Institutional Class | |
| | | For the Six Months Ended June 30, 2014 (Unaudited) | | | For the Year Ended December 31, 2013 | | | For the Year Ended December 31, 2012 | | | For the Year Ended December 31, 2011 | | | For the Year Ended December 31, 2010 | | | For the Year Ended December 31, 2009 | |
PER SHARE DATA:(1) | | | | | | | | | | | | | | | | | | |
| Net Asset Value, | | | | | | | | | | | | | | | | | | |
| Beginning of Period | | $ | 11.06 | | | $ | 11.11 | | | $ | 10.12 | | | $ | 10.50 | | | $ | 9.89 | | | $ | 8.23 | |
| Income from Investment Operations: | | | | | | | | | | | | | | | | | | | | | | | | |
Net investment income(2) | | | 0.13 | | | | 0.22 | | | | 0.36 | | | | 0.85 | | | | 0.37 | | | | 0.10 | |
| Net realized and unrealized gain | | | | | | | | | | | | | | | | | | | | | | | | |
| (loss) on investments | | | 0.42 | | | | 0.29 | | | | 1.20 | | | | (0.80 | ) | | | 0.91 | | | | 1.81 | |
| Total from investment | | | | | | | | | | | | | | | | | | | | | | | | |
| operations | | | 0.55 | | | | 0.51 | | | | 1.56 | | | | 0.05 | | | | 1.28 | | | | 1.91 | |
| Redemption Fees | | | — | | | | — | | | | — | | | | — | | | | — | | | | — | |
| Less Distributions: | | | | | | | | | | | | | | | | | | | | | | | | |
| From net investment income | | | (0.11 | ) | | | (0.30 | ) | | | (0.45 | ) | | | (0.38 | ) | | | (0.37 | ) | | | (0.09 | ) |
| From net realized gains | | | (0.05 | ) | | | (0.26 | ) | | | (0.12 | ) | | | (0.05 | ) | | | (0.30 | ) | | | (0.16 | ) |
| Total distributions | | | (0.16 | ) | | | (0.56 | ) | | | (0.57 | ) | | | (0.43 | ) | | | (0.67 | ) | | | (0.25 | ) |
| Net Asset Value, End of Period | | $ | 11.45 | | | $ | 11.06 | | | $ | 11.11 | | | $ | 10.12 | | | $ | 10.50 | | | $ | 9.89 | |
| Total return | | | 4.98 | %(3) | | | 4.58 | % | | | 15.55 | % | | | 0.42 | % | | | 13.19 | % | | | 23.25 | % |
| | | | | | | | | | | | | | | | | | | | | | | | | |
| SUPPLEMENTAL DATA AND RATIOS | | | | | | | | | | | | | | | | | | | | | | | | |
| Net assets, end of period (000’s) | | $ | 55,079 | | | $ | 23,227 | | | $ | 6,576 | | | $ | 3,878 | | | $ | 142 | | | $ | 101 | |
| Ratio of operating expenses to | | | | | | | | | | | | | | | | | | | | | | | | |
| average net assets: | | | | | | | | | | | | | | | | | | | | | | | | |
| Before expense reimbursement | | | 1.75 | %(4) | | | 1.78 | %(7) | | | 1.95 | % | | | 2.33 | % | | | 6.06 | % | | | 13.06 | % |
After expense reimbursement(5) | | | 1.29 | %(4) | | | 1.30 | %(7) | | | 1.29 | % | | | 1.29 | % | | | 1.29 | % | | | 1.29 | % |
| Ratio of net investment income | | | | | | | | | | | | | | | | | | | | | | | | |
| (loss) to average net assets: | | | | | | | | | | | | | | | | | | | | | | | | |
| Before expense reimbursement | | | 1.83 | %(4) | | | 1.46 | %(8) | | | 2.70 | % | | | 7.14 | % | | | (1.14 | )% | | | (10.64 | )% |
After expense reimbursement(5) | | | 2.29 | %(4) | | | 1.94 | %(8) | | | 3.36 | % | | | 8.18 | % | | | 3.63 | % | | | 1.13 | % |
Portfolio turnover rate(6) | | | 20 | % | | | 54 | % | | | 41 | % | | | 74 | % | | | 38 | % | | | 77 | % |
| (1) | Information presented relates to a share of capital stock outstanding for each period. |
| (2) | Net investment income per share represents net investment income divided by the average shares outstanding throughout the period. |
| (3) | Not annualized. |
| (4) | Annualized. |
| (5) | See Note #3, Investment Adviser, for the waiver and expense reimbursement discussion. |
| (6) | Portfolio turnover of The Multi-Disciplinary Portfolio. |
| (7) | The ratio of expenses includes borrowing expense on securities sold short. The expense ratio excluding borrowing expenses on securities sold short was 1.77% before expense reimbursement and 1.29% after expense reimbursement. |
| (8) | The ratio of net investment income includes borrowing expense on securities sold short. |
The accompanying notes are an integral part of these financial statements.
| KINETICS PORTFOLIOS TRUST — MASTER INVESTMENT PORTFOLIOS |
| Allocation of Portfolio Assets |
| June 30, 2014 (Unaudited) |
The Internet Portfolio
| | | | | | Percentage | |
| | | Market | | | of Total | |
| Sector Allocation* | | Value | | | Net Assets | |
| Information | | $ | 97,537,633 | | | | 58.0 | % |
| Retail Trade | | | 22,239,149 | | | | 13.2 | % |
| Management of Companies and Enterprises | | | 15,872,573 | | | | 9.5 | % |
| Arts, Entertainment, and Recreation | | | 14,200,290 | | | | 8.5 | % |
| Finance and Insurance | | | 8,911,763 | | | | 5.3 | % |
| Manufacturing | | | 5,027,224 | | | | 3.0 | % |
| Real Estate and Rental and Leasing | | | 409,400 | | | | 0.2 | % |
| Administrative and Support and Waste Management and | | | | | | | | |
| Remediation Services | | | 377,560 | | | | 0.2 | % |
| Professional, Scientific, and Technical Services | | | 13,080 | | | | 0.0 | % |
* Excludes Short-Term Investments
| KINETICS PORTFOLIOS TRUST — MASTER INVESTMENT PORTFOLIOS |
| Allocation of Portfolio Assets |
June 30, 2014 (Unaudited) — (Continued) |
The Global Portfolio
| | | | | | Percentage | |
| | | Market | | | of Total | |
| Country Allocation* | | Value | | | Net Assets | |
| United States | | $ | 5,560,024 | | | | 50.9 | % |
| Canada | | | 2,663,288 | | | | 24.5 | % |
| France | | | 876,243 | | | | 8.1 | % |
| Cayman Islands | | | 679,692 | | | | 6.3 | % |
| Switzerland | | | 293,798 | | | | 2.7 | % |
| Spain | | | 161,798 | | | | 1.5 | % |
| Singapore | | | 70,495 | | | | 0.7 | % |
| Guernsey | | | 75,558 | | | | 0.7 | % |
| Brazil | | | 49,847 | | | | 0.5 | % |
| Greece | | | 45,461 | | | | 0.4 | % |
| Japan | | | 38,450 | | | | 0.4 | % |
| Argentina | | | 23,033 | | | | 0.2 | % |
| Germany | | | 6,967 | | | | 0.1 | % |
* Excludes Short-Term Investments
| KINETICS PORTFOLIOS TRUST — MASTER INVESTMENT PORTFOLIOS |
| Allocation of Portfolio Assets |
June 30, 2014 (Unaudited) — (Continued) |
The Paradigm Portfolio
| | | | | | Percentage | |
| | | Market | | | of Total | |
| Sector Allocation* | | Value | | | Net Assets | |
| Information | | $ | 317,065,034 | | | | 23.3 | % |
| Real Estate and Rental and Leasing | | | 212,172,199 | | | | 15.7 | % |
| Management of Companies and Enterprises | | | 160,853,060 | | | | 11.9 | % |
| Finance and Insurance | | | 136,964,780 | | | | 10.1 | % |
| Arts, Entertainment, and Recreation | | | 115,341,900 | | | | 8.5 | % |
| Retail Trade | | | 109,852,273 | | | | 8.1 | % |
| Manufacturing | | | 82,400,955 | | | | 6.1 | % |
| Mining, Quarrying, and Oil and Gas Extraction | | | 73,823,393 | | | | 5.5 | % |
| Petroleum and Gas | | | 65,962,118 | | | | 4.9 | % |
| Utilities | | | 2,750,600 | | | | 0.2 | % |
| Construction | | | 1,104,074 | | | | 0.1 | % |
| Transportation and Warehousing | | | 953,641 | | | | 0.1 | % |
| Accommodation and Food Services | | | 337,528 | | | | 0.0 | % |
| Wholesale Trade | | | 66,857 | | | | 0.0 | % |
* Excludes Short-Term Investments
| KINETICS PORTFOLIOS TRUST — MASTER INVESTMENT PORTFOLIOS |
| Allocation of Portfolio Assets |
June 30, 2014 (Unaudited) — (Continued) |
The Medical Portfolio
| | | | | | Percentage | |
| | | Market | | | of Total | |
| Sector Allocation* | | Value | | | Net Assets | |
| Manufacturing | | $ | 23,622,502 | | | | 88.0 | % |
| Professional, Scientific, and Technical Services | | | 2,233,452 | | | | 8.3 | % |
| Finance and Insurance | | | 9,240 | | | | 0.0 | % |
* Excludes Short-Term Investments
| KINETICS PORTFOLIOS TRUST — MASTER INVESTMENT PORTFOLIOS |
| Allocation of Portfolio Assets |
June 30, 2014 (Unaudited) — (Continued) |
The Small Cap Opportunities Portfolio
| | | | | | Percentage | |
| | | Market | | | of Total | |
| Sector Allocation* | | Value | | | Net Assets | |
| Real Estate and Rental and Leasing | | $ | 101,327,144 | | | | 23.9 | % |
| Manufacturing | | | 101,313,979 | | | | 23.8 | % |
| Finance and Insurance | | | 66,548,699 | | | | 15.6 | % |
| Petroleum and Gas | | | 35,944,695 | | | | 8.4 | % |
| Management of Companies and Enterprises | | | 34,546,235 | | | | 8.1 | % |
| Information | | | 23,592,080 | | | | 5.5 | % |
| Retail Trade | | | 23,030,370 | | | | 5.4 | % |
| Arts, Entertainment, and Recreation | | | 15,974,430 | | | | 3.8 | % |
| Mining, Quarrying, and Oil and Gas Extraction | | | 6,970,065 | | | | 1.6 | % |
| Accommodation and Food Services | | | 4,528,990 | | | | 1.1 | % |
| Wholesale Trade | | | 946,944 | | | | 0.2 | % |
| Transportation Equipment | | | 880,190 | | | | 0.2 | % |
* Excludes Short-Term Investments
| KINETICS PORTFOLIOS TRUST — MASTER INVESTMENT PORTFOLIOS |
| Allocation of Portfolio Assets |
June 30, 2014 (Unaudited) — (Continued) |
The Market Opportunities Portfolio
| | | | | | Percentage | |
| | | Market | | | of Total | |
| Sector Allocation* | | Value | | | Net Assets | |
| Finance and Insurance | | $ | 29,943,886 | | | | 47.0 | % |
| Real Estate and Rental and Leasing | | | 8,371,901 | | | | 13.2 | % |
| Management of Companies and Enterprises | | | 8,251,689 | | | | 13.0 | % |
| Petroleum and Gas | | | 4,867,344 | | | | 7.7 | % |
| Retail Trade | | | 2,643,630 | | | | 4.2 | % |
| Accommodation and Food Services | | | 1,419,060 | | | | 2.2 | % |
| Arts, Entertainment, and Recreation | | | 884,152 | | | | 1.4 | % |
| Information | | | 672,344 | | | | 1.1 | % |
| Mining, Quarrying, and Oil and Gas Extraction | | | 229,360 | | | | 0.4 | % |
| Manufacturing | | | 75,911 | | | | 0.1 | % |
| Wholesale Trade | | | 17,856 | | | | 0.0 | % |
| Support Activities for Water Transportation | | | 10,037 | | | | 0.0 | % |
* Excludes Short-Term Investments
| KINETICS PORTFOLIOS TRUST — MASTER INVESTMENT PORTFOLIOS |
| Allocation of Portfolio Assets |
June 30, 2014 (Unaudited) — (Continued) |
The Alternative Income Portfolio
| | | | | | Percentage | |
| | | Market | | | of Total | |
| Sector Allocation* | | Value | | | Net Assets | |
| Finance and Insurance | | $ | 11,942,241 | | | | 40.0 | % |
| Manufacturing | | | 8,773,564 | | | | 29.3 | % |
| Information | | | 1,800,048 | | | | 6.0 | % |
| Retail Trade | | | 1,780,075 | | | | 5.9 | % |
| Public Administration | | | 1,599,897 | | | | 5.3 | % |
| Mining, Quarrying, and Oil and Gas Extraction | | | 936,882 | | | | 3.1 | % |
| Utilities | | | 357,474 | | | | 1.2 | % |
| Professional, Scientific, and Technical Services | | | 242,834 | | | | 0.8 | % |
| Wholesale Trade | | | 200,878 | | | | 0.7 | % |
| Accommodations and Food Services | | | 200,314 | | | | 0.7 | % |
| Administrative and Support and Waste Management and | | | | | | | | |
| Remediation Services | | | 104,028 | | | | 0.3 | % |
| Transportation and Warehousing | | | 101,939 | | | | 0.3 | % |
* Excludes Short-Term Investments & Written Options
| KINETICS PORTFOLIOS TRUST — MASTER INVESTMENT PORTFOLIOS |
| Allocation of Portfolio Assets |
June 30, 2014 (Unaudited) — (Continued) |
The Multi-Disciplinary Portfolio
| | | | | | Percentage | |
| | | Market | | | of Total | |
| Sector Allocation* | | Value | | | Net Assets | |
| Information | | $ | 24,993,207 | | | | 22.3 | % |
| Manufacturing | | | 18,306,390 | | | | 16.2 | % |
| Finance and Insurance | | | 17,080,676 | | | | 15.1 | % |
| Mining, Quarrying, and Oil and Gas Extraction | | | 14,528,224 | | | | 12.8 | % |
| Administrative and Support and Waste Management and | | | | | | | | |
| Remediation Services | | | 8,911,384 | | | | 7.9 | % |
| Real Estate and Rental and Leasing | | | 6,557,528 | | | | 5.8 | % |
| Accommodation and Food Services | | | 3,731,063 | | | | 3.3 | % |
| Construction | | | 3,660,000 | | | | 3.2 | % |
| Retail Trade | | | 3,620,625 | | | | 3.2 | % |
| Arts, Entertainment, and Recreation | | | 2,761,273 | | | | 2.4 | % |
| Wholesale Trade | | | 1,901,688 | | | | 1.7 | % |
| Other Services (except Public Administration) | | | 1,305,443 | | | | 1.2 | % |
| Transportation and Warehousing | | | 525,000 | | | | 0.5 | % |
| Health Care and Social Assistance | | | 326,625 | | | | 0.3 | % |
| Professional, Scientific, and Technical Services | | | 253,125 | | | | 0.2 | % |
| Utilities | | | 115,250 | | | | 0.1 | % |
* Excludes Short-Term Investments & Written Options
| KINETICS PORTFOLIOS TRUST — MASTER INVESTMENT PORTFOLIOS |
| The Internet Portfolio |
| Portfolio of Investments — June 30, 2014 (Unaudited) |
| Identifier | | COMMON STOCKS — 97.86% | Shares | | | Value | |
| | | Administrative and Support Services — 0.23% | | | | | |
| CRMZ | | CreditRiskMonitor.com, Inc. | 600 | | $ | 1,740 | |
| CTRP | | Ctrip.com International Ltd. — ADR* | 5,800 | | | 371,432 | |
| IILG | | Interval Leisure Group, Inc.^ | 200 | | | 4,388 | |
| | | | | | | 377,560 | |
| | | Broadcasting (except Internet) — 3.67% | | | | | |
| CBS | | CBS Corporation — Class B | 53,300 | | | 3,312,062 | |
| DIS | | The Walt Disney Company^ | 33,300 | | | 2,855,142 | |
| | | | | | | 6,167,204 | |
| | | Computer and Electronic Product Manufacturing — 0.33% | | | | | |
| QCOM | | QUALCOMM Inc. | 7,000 | | | 554,400 | |
| | | Credit Intermediation and Related Activities — 0.17% | | | | | |
| TREE | | Tree.com, Inc.*^ | 9,833 | | | 286,534 | |
| | | Data Processing, Hosting and Related Services — 0.19% | | | | | |
| CSGP | | CoStar Group, Inc.* | 2,000 | | | 316,340 | |
| | | Data Processor — 3.60% | | | | | |
| MA | | MasterCard, Inc. — Class A | 36,000 | | | 2,644,920 | |
| VRSK | | Verisk Analytics, Inc. — Class A* | 7,700 | | | 462,154 | |
| V | | Visa, Inc. — Class A^ | 14,000 | | | 2,949,940 | |
| | | | | | | 6,057,014 | |
| | | Defense — 2.27% | | | | | |
| CACI | | CACI International, Inc. — Class A*^ | 40,000 | | | 2,808,400 | |
| MANT | | ManTech International Corporation — Class A | 34,000 | | | 1,003,680 | |
| | | | | | | 3,812,080 | |
| | | E-Commerce — 12.68% | | | | | |
| EBAY | | eBay, Inc.*^ | 72,000 | | | 3,604,320 | |
| IACI | | IAC/InterActiveCorp | 100,000 | | | 6,923,000 | |
| LINTA | | Liberty Interactive Corporation — Class A* | 367,400 | | | 10,786,864 | |
| | | | | | | 21,314,184 | |
| | | Gaming — 1.66% | | | | | |
| 200 HK | | Melco International Development Limited | 920,000 | | | 2,783,598 | |
| | | General Merchandise Stores — 0.01% | | | | | |
| SHLD | | Sears Holdings Corporation*^ | 400 | | | 15,984 | |
The accompanying notes are an integral part of these financial statements.
| KINETICS PORTFOLIOS TRUST — MASTER INVESTMENT PORTFOLIOS |
| The Internet Portfolio |
Portfolio of Investments — June 30, 2014 (Unaudited) — (Continued) |
| Identifier | | | Shares | | | Value | |
| | | Global Exchanges — 0.20% | | | | | |
| EXAE GA | | Hellenic Exchanges S.A. Holding Clearing Settlement | | | | | |
| | | and Registry* | 11,000 | | $ | 125,017 | |
| JSE SJ | | JSE Limited | 24,000 | | | 216,417 | |
| | | | | | | 341,434 | |
| | | Holding Company — 16.87% | | | | | |
| GBLS BB | | Groupe Bruxelles Lambert S.A. Strip VVPR*+ | 2,000 | | | — | |
| IEP | | Icahn Enterprises LP | 37,177 | | | 3,706,519 | |
| LMCA | | Liberty Media Corporation — Class A* | 118,800 | | | 16,237,584 | |
| LVNTA | | Liberty Ventures — Series A* | 114,000 | | | 8,413,200 | |
| | | | | | | 28,357,303 | |
| | | Media — 19.34% | | | | | |
| DISCA | | Discovery Communications, Inc. — Class A* | 101,700 | | | 7,554,276 | |
| SNI | | Scripps Networks Interactive — Class A^ | 77,000 | | | 6,247,780 | |
| STRZA | | Starz — Class A* | 129,200 | | | 3,848,868 | |
| TWX | | Time Warner, Inc. | 77,000 | | | 5,409,250 | |
| VIAB | | Viacom Inc. — Class B | 108,800 | | | 9,436,224 | |
| | | | | | | 32,496,398 | |
| | | Motion Picture and Sound Recording Industries — 2.21% | | | | | |
| DWA | | DreamWorks Animation SKG, Inc. — Class A* | 160,000 | | | 3,721,600 | |
| | | Motor Vehicle and Parts Dealers — 0.71% | | | | | |
| AN | | AutoNation, Inc.* | 20,000 | | | 1,193,600 | |
| | | Non-Store Retailers — 1.24% | | | | | |
| CPRT | | Copart, Inc.* | 38,860 | | | 1,397,405 | |
| LE | | Lands’ End, Inc.* | 120 | | | 4,030 | |
| OSTK | | Overstock.com, Inc.* | 1,000 | | | 15,770 | |
| BID | | Sotheby’s^ | 16,000 | | | 671,840 | |
| | | | | | | 2,089,045 | |
| | | Other Exchanges — 0.04% | | | | | |
| CBOE | | CBOE Holdings Inc. | 1,200 | | | 59,052 | |
| | | Other Information Services — 7.07% | | | | | |
| GOOGL | | Google Inc. — Class A* | 8,600 | | | 5,028,162 | |
| GOOG | | Google Inc. — Class C* | 8,600 | | | 4,947,408 | |
| YHOO | | Yahoo! Inc.*^ | 54,000 | | | 1,897,020 | |
| | | | | | | 11,872,590 | |
The accompanying notes are an integral part of these financial statements.
| KINETICS PORTFOLIOS TRUST — MASTER INVESTMENT PORTFOLIOS |
| The Internet Portfolio |
Portfolio of Investments — June 30, 2014 (Unaudited) — (Continued) |
| Identifier | | | Shares | | | Value | |
| | | Performing Arts, Spectator Sports, and Related Industries — 5.10% | | | | | |
| LYV | | Live Nation Entertainment, Inc.* | 195,000 | | $ | 4,814,550 | |
| MSG | | The Madison Square Garden Company — Class A* | 60,000 | | | 3,747,000 | |
| | | | | | | 8,561,550 | |
| | | Professional, Scientific, and Technical Services — 0.01% | | | | | |
| MWW | | Monster Worldwide, Inc.* | 2,000 | | | 13,080 | |
| | | Publishing Industries (except Internet) — 1.11% | | | | | |
| SSP | | The E.W. Scripps Company — Class A* | 77,500 | | | 1,639,900 | |
| TIME | | Time Inc.* | 9,625 | | | 233,118 | |
| | | | | | | 1,873,018 | |
| | | Rental and Leasing Services — 0.16% | | | | | |
| CDCO | | Comdisco Holding Company, Inc.* | 56,000 | | | 274,400 | |
| | | Satellite Telecommunications — 16.91% | | | | | |
| DISH | | DISH Network Corp. — Class A* | 146,000 | | | 9,501,680 | |
| SATS | | EchoStar Corporation — Class A* | 218,000 | | | 11,540,920 | |
| LBTYK | | Liberty Global plc — Series C*^ | 144,000 | | | 6,092,640 | |
| LORL | | Loral Space & Communications Inc.* | 8,600 | | | 625,134 | |
| VSAT | | ViaSat, Inc.*^ | 11,400 | | | 660,744 | |
| | | | | | | 28,421,118 | |
| | | Securities, Commodity Contracts, and Other Financial Investments | | | | | |
| | | and Related Activities — 1.29% | | | | | |
| ICE | | IntercontinentalExchange Group, Inc. | 8,030 | | | 1,516,867 | |
| MKTX | | MarketAxess Holdings, Inc. | 5,700 | | | 308,142 | |
| OTCM | | OTC Markets Group Inc. — Class A | 30,600 | | | 342,720 | |
| | | | | | | 2,167,729 | |
| | | Security System Services — 0.77% | | | | | |
| ASCMA | | Ascent Capital Group LLC — Class A*^ | 19,600 | | | 1,293,796 | |
| | | Telecommunications — 0.02% | | | | | |
| ICTG | | ICTC Group Inc.* | 149 | | | 3,278 | |
| 9984 JP | | SoftBank Corp. | 400 | | | 29,783 | |
| | | | | | | 33,061 | |
| | | TOTAL COMMON STOCKS | | | | | |
| | | (cost $79,658,372) | | | | 164,453,672 | |
The accompanying notes are an integral part of these financial statements.
| KINETICS PORTFOLIOS TRUST — MASTER INVESTMENT PORTFOLIOS |
| The Internet Portfolio |
Portfolio of Investments — June 30, 2014 (Unaudited) — (Continued) |
| | | | | Principal | | | | |
| Identifier | | ESCROW NOTES — 0.00% | | Amount | | | Value | |
| | | Special Purpose Entity — 0.00% | | | | | | |
| 006ESC958 | | Adelphia Communications Corp. Preferred*+ | $ | 190,000 | | $ | — | |
| | | TOTAL ESCROW NOTES | | | | | | |
| | | (cost $0) | | | | | — | |
| | | | | | | | | |
| | | RIGHTS — 0.08% | | Shares | | | | |
| | | Rental and Leasing Services — 0.08% | | | | | | |
| CDCOR | | Comdisco Holding Company, Inc.*# | | 1,800,000 | | | 135,000 | |
| | | TOTAL RIGHTS | | | | | | |
| | | (cost $89,222) | | | | | 135,000 | |
| | | | | | | | | |
| | | | �� | Principal | | | | |
| | | SHORT-TERM INVESTMENTS — 2.13% | | Amount | | | | |
| | | Commercial Paper — 2.13% | | | | | | |
| 039715141 | | U.S. Bank N.A., 0.02%, 07/01/2014 | $ | 3,578,000 | | | 3,578,000 | |
| | | | | | | | | |
| | | | | Shares | | | | |
| | | Money Market Funds — 0.00% | | | | | | |
| FIGXX | | Fidelity Institutional Government Portfolio — Class I, 0.01%b | | 7,876 | | | 7,876 | |
| | | TOTAL SHORT-TERM INVESTMENTS | | | | | | |
| | | (cost $3,585,876) | | | | | 3,585,876 | |
| | | | | | | | | |
| | | INVESTMENTS PURCHASED WITH | | | | | | |
| | | THE CASH PROCEEDS FROM | | | | | | |
| | | SECURITIES LENDING — 12.58% | | | | | | |
| | | Money Market Funds — 12.58% | | | | | | |
| | | Mount Vernon Securities Lending Trust — | | | | | | |
| | | Prime Portfolio, 0.18%b | | 21,133,565 | | | 21,133,565 | |
| | | TOTAL INVESTMENTS PURCHASED WITH THE | | | | | | |
| | | CASH PROCEEDS FROM SECURITIES LENDING | | | | | | |
| | | (cost $21,133,565) | | | | | 21,133,565 | |
| | | TOTAL INVESTMENTS — 112.65% | | | | | | |
| | | (cost $104,467,035) | | | | $ | 189,308,113 | |
The accompanying notes are an integral part of these financial statements.
| KINETICS PORTFOLIOS TRUST — MASTER INVESTMENT PORTFOLIOS |
| The Internet Portfolio |
Portfolio of Investments — June 30, 2014 (Unaudited) — (Continued) |
| Percentages are stated as a percent of net assets. |
| * — | Non-income producing security. |
| ^ — | This security or a portion of this security was out on loan at June 30, 2014. Total loaned securities had a market value of $20,765,137 at June 30, 2014. |
| + — | Security is considered illiquid and was fair valued. The aggregate value of such securities is $0 or 0.00% of net assets. |
| # — | Contingent value right (contingent upon profitability of company). |
| b — | The rate quoted is the annualized seven-day yield as of June 30, 2014. |
| ADR — American Depository Receipt. |
The accompanying notes are an integral part of these financial statements.
| KINETICS PORTFOLIOS TRUST — MASTER INVESTMENT PORTFOLIOS |
| The Global Portfolio |
Portfolio of Investments — June 30, 2014 (Unaudited) — (Continued) |
| Identifier | | COMMON STOCKS — 96.15% | | Shares | | | Value | |
| | | Apparel Manufacturing — 2.48% | | | | | | |
| MC FP | | LVMH Moet Hennessy Louis Vuitton SA | | 1,400 | | $ | 269,916 | |
| | | Asset Management — 12.29% | | | | | | |
| APO | | Apollo Global Management LLC — Class A | | 300 | | | 8,316 | |
| BAM | | Brookfield Asset Management Inc. — Class A | | 4,000 | | | 176,080 | |
| DDEJF | | Dundee Corporation — Class A* | | 36,000 | | | 581,040 | |
| JZCP LN | | JZ Capital Partners Ltd. | | 10,000 | | | 75,558 | |
| ONEXF | | Onex Corporation | | 8,000 | | | 496,000 | |
| | | | | | | | 1,336,994 | |
| | | Beverage and Tobacco Product Manufacturing — 0.16% | | | | | | |
| CWGL | | Crimson Wine Group Ltd.*^ | | 1,350 | | | 12,218 | |
| FNEVY | | Fraser and Neave Limited — ADR | | 400 | | | 4,860 | |
| | | | | | | | 17,078 | |
| | | Chemical Manufacturing — 1.34% | | | | | | |
| PAH | | Platform Specialty Products Corporation* | | 5,200 | | | 145,756 | |
| | | Construction of Buildings — 2.00% | | | | | | |
| BRP | | Brookfield Residential Properties Inc.* | | 10,100 | | | 209,575 | |
| LEN | | Lennar Corporation — Class A^ | | 200 | | | 8,396 | |
| | | | | | | | 217,971 | |
| | | Credit Intermediation and Related Activities — 0.03% | | | | | | |
| IFT | | Imperial Holdings, Inc.* | | 400 | | | 2,728 | |
| | | Crop Production — 0.21% | | | | | | |
| CRESY | | Cresud S.A.C.I.F.y A. — ADR | | 1,765 | | | 23,033 | |
| | | E-Commerce — 4.05% | | | | | | |
| LINTA | | Liberty Interactive Corporation — Class A* | | 15,000 | | | 440,400 | |
| | | Electronics and Appliance Stores — 0.47% | | | | | | |
| SHOS | | Sears Hometown and Outlet Stores Inc.* | | 2,400 | | | 51,528 | |
| | | European Exchanges — 1.37% | | | | | | |
| BME SM | | Bolsas y Mercados Espanoles | | 3,130 | | | 149,471 | |
| | | Gaming — 2.29% | | | | | | |
| WYNN | | Wynn Resorts Limited | | 1,200 | | | 249,072 | |
| | | General Merchandise Stores — 4.13% | | | | | | |
| SEARF | | Sears Canada Inc.^ | | 6,600 | | | 89,826 | |
| SHLD | | Sears Holdings Corporation*^ | | 9,000 | | | 359,640 | |
| | | | | | | | 449,466 | |
The accompanying notes are an integral part of these financial statements.
| KINETICS PORTFOLIOS TRUST — MASTER INVESTMENT PORTFOLIOS |
| The Global Portfolio |
Portfolio of Investments — June 30, 2014 (Unaudited) — (Continued) |
| Identifier | | | | Shares | | | Value | |
| | | Global Exchanges — 0.88% | | | | | | |
| BVMF3 BZ | | BM&FBOVESPA SA | | 9,470 | | $ | 49,846 | |
| EXAE GA | | Hellenic Exchanges S.A. Holding Clearing Settlement | | | | | | |
| | | and Registry* | | 4,000 | | | 45,461 | |
| | | | | | | | 95,307 | |
| | | Holding Company — 20.17% | | | | | | |
| BOL FP | | Bollore SA | | 925 | | | 600,370 | |
| CKI CN | | Clarke Inc. | | 2,000 | | | 20,074 | |
| IEP | | Icahn Enterprises LP | | 6,094 | | | 607,596 | |
| LUK | | Leucadia National Corporation | | 2,200 | | | 57,684 | |
| LMCA | | Liberty Media Corporation — Class A* | | 3,600 | | | 492,048 | |
| LVNTA | | Liberty Ventures — Series A* | | 5,200 | | | 383,760 | |
| PVF CN | | Partners Value Fund Inc.* | | 1,200 | | | 32,056 | |
| | | | | | | | 2,193,588 | |
| | | Insurance Carriers and Related Activities — 0.74% | | | | | | |
| AFSI | | AmTrust Financial Services, Inc.^ | | 500 | | | 20,905 | |
| GLRE | | Greenlight Capital Re, Ltd. — Class A* | | 1,800 | | | 59,292 | |
| | | | | | | | 80,197 | |
| | | Jewelry, Watch, Precious Stone, and Precious Metal Merchant | | | | | | |
| | | Wholesalers — 2.70% | | | | | | |
| CFR VX | | Compagnie Financiere Richemont SA | | 2,800 | | | 293,798 | |
| | | Lessors of Nonresidential Buildings (except Miniwarehouses) — 5.81% | | | | | | |
| HHC | | The Howard Hughes Corporation* | | 4,000 | | | 631,320 | |
| | | Media — 2.01% | | | | | | |
| ATC NA | | Altice S.A.* | | 100 | | | 6,967 | |
| DISCA | | Discovery Communications, Inc. — Class A* | | 1,200 | | | 89,136 | |
| STRZA | | Starz — Class A* | | 4,094 | | | 121,960 | |
| | | | | | | | 218,063 | |
| | | Mining (except Oil and Gas) — 0.69% | | | | | | |
| FNV | | Franco-Nevada Corporation | | 1,000 | | | 57,340 | |
| NCQ | | NovaCopper Inc.* | | 666 | | | 726 | |
| NG | | NovaGold Resources Inc.* | | 4,000 | | | 16,840 | |
| | | | | | | | 74,906 | |
| | | Motion Picture and Sound Recording Industries — 1.84% | | | | | | |
| DWA | | DreamWorks Animation SKG, Inc. — Class A* | | 8,600 | | | 200,036 | |
The accompanying notes are an integral part of these financial statements.
| KINETICS PORTFOLIOS TRUST — MASTER INVESTMENT PORTFOLIOS |
| The Global Portfolio |
Portfolio of Investments — June 30, 2014 (Unaudited) — (Continued) |
| Identifier | | | | Shares | | | Value | |
| | | Oil and Gas — 3.98% | | | | | | |
| TPL | | Texas Pacific Land Trust | | 2,700 | | $ | 432,297 | |
| | | Oil and Gas Extraction — 9.76% | | | | | | |
| CLR | | Continental Resources, Inc.* | | 1,050 | | | 165,942 | |
| PARR | | Par Petroleum Corporation* | | 3,400 | | | 68,850 | |
| POU CN | | Paramount Resources Ltd. — Class A* | | 1,410 | | | 78,689 | |
| SEMUF | | Siem Industries Inc.* | | 6,600 | | | 620,400 | |
| TOU CN | | Tourmaline Oil Corp.* | | 2,415 | | | 127,331 | |
| | | | | | | | 1,061,212 | |
| | | Other Information Services — 0.01% | | | | | | |
| IIJI | | Internet Initiative Japan Inc. — ADR | | 100 | | | 1,221 | |
| | | Publishing Industries (except Internet) — 0.11% | | | | | | |
| PRIS | | Promotora de Informaciones S.A. — ADR*^ | | 873 | | | 1,641 | |
| PRS SM | | Promotora de Informaciones S.A. — Class A* | | 18,310 | | | 8,901 | |
| PRIS/B US | | Promotora de Informaciones S.A. — Class B — ADR* | | 700 | | | 1,785 | |
| | | | | | | | 12,327 | |
| | | Real Estate — 8.07% | | | | | | |
| BPY | | Brookfield Property Partners LP | | 281 | | | 5,865 | |
| BRE CN | | Brookfield Real Estate Services, Inc. | | 5,050 | | | 66,257 | |
| CIT SP | | City Developments Limited | | 8,000 | | | 65,635 | |
| DRM CN | | Dream Unlimited Corp. — Class A* | | 49,200 | | | 711,453 | |
| TPH | | TRI Pointe Homes, Inc.*^ | | 1,800 | | | 28,296 | |
| | | | | | | | 877,506 | |
| | | Restaurants — 5.16% | | | | | | |
| BKW | | Burger King Worldwide Inc. | | 1,800 | | | 48,996 | |
| WEN | | The Wendy’s Company^ | | 60,000 | | | 511,800 | |
| | | | | | | | 560,796 | |
| | | Satellite Telecommunications — 2.75% | | | | | | |
| DISH | | DISH Network Corp. — Class A* | | 2,000 | | | 130,160 | |
| SATS | | EchoStar Corporation — Class A* | | 3,200 | | | 169,408 | |
| | | | | | | | 299,568 | |
| | | Telecommunications — 0.40% | | | | | | |
| NUM FP | | Numericable Group SA* | | 100 | | | 5,957 | |
| 9984 JP | | SoftBank Corp. | | 500 | | | 37,229 | |
| | | | | | | | 43,186 | |
The accompanying notes are an integral part of these financial statements.
| KINETICS PORTFOLIOS TRUST — MASTER INVESTMENT PORTFOLIOS |
| The Global Portfolio |
Portfolio of Investments — June 30, 2014 (Unaudited) — (Continued) |
| Identifier | | | | Shares | | | Value | |
| | | Transportation Equipment Manufacturing — 0.25% | | | | | | |
| HEI/A | | HEICO Corporation — Class A | | 675 | | $ | 27,405 | |
| | | TOTAL COMMON STOCKS | | | | | | |
| | | (cost $7,584,738) | | | | | 10,456,146 | |
| | | | | | | | | |
| | | MUTUAL FUNDS — 0.81% | | | | | | |
| | | Funds, Trusts, and Other Financial Vehicles — 0.81% | | | | | | |
| TRF | | Templeton Russia and East European Fund, Inc. | | 5,800 | | | 88,508 | |
| | | TOTAL MUTUAL FUNDS | | | | | | |
| | | (cost $77,855) | | | | | 88,508 | |
| | | | | | | | | |
| | | | | Principal | | | | |
| | | SHORT-TERM INVESTMENTS — 2.52% | | Amount | | | | |
| | | Commercial Paper — 2.45% | | | | | | |
| 039715141 | | U.S. Bank N.A., 0.02%, 07/01/2014 | $ | 267,000 | | | 267,000 | |
| | | | | | | | | |
| | | | | Shares | | | | |
| | | Money Market Funds — 0.07% | | | | | | |
| FIGXX | | Fidelity Institutional Government Portfolio — Class I, 0.01%b | | 7,449 | | | 7,449 | |
| | | TOTAL SHORT-TERM INVESTMENTS | | | | | | |
| | | (cost $274,449) | | | | | 274,449 | |
| | | | | | | | | |
| | | INVESTMENTS PURCHASED WITH | | | | | | |
| | | THE CASH PROCEEDS FROM | | | | | | |
| | | SECURITIES LENDING — 6.57% | | | | | | |
| | | Money Market Funds — 6.57% | | | | | | |
| | | Mount Vernon Securities Lending Trust — | | | | | | |
| | | Prime Portfolio, 0.18%b | | 714,121 | | | 714,121 | |
| | | TOTAL INVESTMENTS PURCHASED WITH | | | | | | |
| | | THE CASH PROCEEDS FROM SECURITIES LENDING | | | | | | |
| | | (cost $714,121) | | | | | 714,121 | |
| | | TOTAL INVESTMENTS — 106.05% | | | | | | |
| | | (cost $8,651,163) | | | | $ | 11,533,224 | |
The accompanying notes are an integral part of these financial statements.
| KINETICS PORTFOLIOS TRUST — MASTER INVESTMENT PORTFOLIOS |
| The Global Portfolio |
Portfolio of Investments — June 30, 2014 (Unaudited) — (Continued) |
| | Percentages are stated as a percent of net assets. |
| * — | Non-income producing security. |
| ^ — | This security or a portion of this security was out on loan at June 30, 2014. Total loaned securities had a market value of $699,502 at June 30, 2014. |
| b — | The rate quoted is the annualized seven-day yield as of June 30, 2014. |
| ADR — American Depository Receipt. |
The accompanying notes are an integral part of these financial statements.
| KINETICS PORTFOLIOS TRUST — MASTER INVESTMENT PORTFOLIOS |
| The Paradigm Portfolio |
Portfolio of Investments — June 30, 2014 (Unaudited) — (Continued) |
| Identifier | | COMMON STOCKS — 94.49% | | Shares | | | Value | |
| | | Apparel Manufacturing — 0.13% | | | | | | |
| LB | | L Brands, Inc. | | 25,600 | | $ | 1,501,696 | |
| LVMUY | | LVMH Moet Hennessy Louis Vuitton SA — ADR | | 5,200 | | | 200,616 | |
| | | | | | | | 1,702,312 | |
| | | Asset Management — 5.86% | | | | | | |
| APO | | Apollo Global Management LLC — Class A | | 1,000 | | | 27,720 | |
| BAM | | Brookfield Asset Management Inc. — Class A | | 1,085,600 | | | 47,788,112 | |
| DDEJF | | Dundee Corporation — Class A* | | 158,100 | | | 2,551,734 | |
| JZCP LN | | JZ Capital Partners Ltd. | | 15,200 | | | 114,848 | |
| OAK | | Oaktree Capital Group LLC | | 14,400 | | | 719,856 | |
| ONEXF | | Onex Corporation | | 411,800 | | | 25,531,600 | |
| RCP LN | | RIT Capital Partners plc | | 22,400 | | | 504,491 | |
| 806 HK | | Value Partners Group Limited | | 2,747,000 | | | 1,839,509 | |
| WETF | | WisdomTree Investments, Inc.*^ | | 24,700 | | | 305,292 | |
| | | | | | | | 79,383,162 | |
| | | Beverage and Tobacco Product Manufacturing — 0.12% | | | | | | |
| BF/A | | Brown-Forman Corporation — Class A | | 450 | | | 41,553 | |
| ROX | | Castle Brands, Inc.*^ | | 72,000 | | | 64,080 | |
| CWGL | | Crimson Wine Group Ltd.*^ | | 171,860 | | | 1,555,333 | |
| | | | | | | | 1,660,966 | |
| | | Broadcasting (except Internet) — 2.57% | | | | | | |
| CBS | | CBS Corporation — Class B | | 561,020 | | | 34,861,783 | |
| | | Chemical Manufacturing — 1.41% | | | | | | |
| OPK | | OPKO Health, Inc.*^ | | 4,000 | | | 35,360 | |
| PAH | | Platform Specialty Products Corporation* | | 148,900 | | | 4,173,667 | |
| SIAL | | Sigma-Aldrich Corporation | | 145,815 | | | 14,797,306 | |
| VHI | | Valhi, Inc.^ | | 4,600 | | | 29,532 | |
| | | | | | | | 19,035,865 | |
| | | Construction of Buildings — 0.13% | | | | | | |
| BRP | | Brookfield Residential Properties Inc.* | | 28,600 | | | 593,450 | |
| LEN | | Lennar Corporation — Class A | | 26,300 | | | 1,104,074 | |
| | | | | | | | 1,697,524 | |
| | | Credit Intermediation and Related Activities — 0.00% | | | | | | |
| IFT | | Imperial Holdings, Inc.* | | 7,200 | | | 49,104 | |
| OCN | | Ocwen Financial Corporation*^ | | 200 | | | 7,420 | |
| | | | | | | | 56,524 | |
The accompanying notes are an integral part of these financial statements.
| KINETICS PORTFOLIOS TRUST — MASTER INVESTMENT PORTFOLIOS |
| The Paradigm Portfolio |
Portfolio of Investments — June 30, 2014 (Unaudited) — (Continued) |
| Identifier | | | | Shares | | | Value | |
| | | E-Commerce — 2.94% | | | | | | |
| IACI | | IAC/InterActiveCorp | | 44,700 | | $ | 3,094,581 | |
| LINTA | | Liberty Interactive Corporation — Class A* | | 1,248,400 | | | 36,653,024 | |
| | | | | | | | 39,747,605 | |
| | | Electronics and Appliance Stores — 0.19% | | | | | | |
| SHOS | | Sears Hometown and Outlet Stores Inc.* | | 117,500 | | | 2,522,725 | |
| | | Gaming — 4.93% | | | | | | |
| LVS | | Las Vegas Sands Corp. | | 358,200 | | | 27,302,004 | |
| MGM | | MGM Resorts International*^ | | 481,600 | | | 12,714,240 | |
| WYNN | | Wynn Resorts Limited | | 129,000 | | | 26,775,240 | |
| | | | | | | | 66,791,484 | |
| | | Gasoline Stations — 0.03% | | | | | | |
| SUSS | | Susser Holdings Corporation*^ | | 5,200 | | | 419,744 | |
| | | General Merchandise Stores — 2.04% | | | | | | |
| SEARF | | Sears Canada Inc.^ | | 493,400 | | | 6,715,174 | |
| SHLD | | Sears Holdings Corporation*^ | | 521,780 | | | 20,850,329 | |
| | | | | | | | 27,565,503 | |
| | | Global Exchanges — 0.25% | | | | | | |
| EXAE GA | | Hellenic Exchanges S.A. Holding Clearing Settlement | | | | | | |
| | | and Registry* | | 33,600 | | | 381,870 | |
| JSE SJ | | JSE Limited | | 330,000 | | | 2,975,741 | |
| | | | | | | | 3,357,611 | |
| | | Holding Company — 17.16% | | | | | | |
| BOL FP | | Bollore SA | | 5,200 | | | 3,375,051 | |
| GBLS BB | | Groupe Bruxelles Lambert S.A. Strip VVPR*+ | | 23,520 | | | — | |
| IEP | | Icahn Enterprises LP^ | | 945,845 | | | 94,300,794 | |
| LUK | | Leucadia National Corporation | | 1,373,900 | | | 36,023,658 | |
| LMCA | | Liberty Media Corporation — Class A* | | 624,400 | | | 85,342,992 | |
| LVNTA | | Liberty Ventures — Series A* | | 180,800 | | | 13,343,040 | |
| PVF CN | | Partners Value Fund Inc.* | | 800 | | | 21,371 | |
| | | | | | | | 232,406,906 | |
| | | Insurance Carriers and Related Activities — 1.11% | | | | | | |
| AFSI | | AmTrust Financial Services, Inc.^ | | 4,600 | | | 192,326 | |
| MKL | | Markel Corporation* | | 22,732 | | | 14,904,008 | |
| | | | | | | | 15,096,334 | |
The accompanying notes are an integral part of these financial statements.
| KINETICS PORTFOLIOS TRUST — MASTER INVESTMENT PORTFOLIOS |
| The Paradigm Portfolio |
Portfolio of Investments — June 30, 2014 (Unaudited) — (Continued) |
| Identifier | | | | Shares | | | Value | |
| | | Lessors of Nonresidential Buildings | | | | | | |
| | | (except Miniwarehouses) — 11.56% | | | | | | |
| HHC | | The Howard Hughes Corporation* | | 959,300 | | $ | 151,406,319 | |
| RSE | | Rouse Properties, Inc.^ | | 298,400 | | | 5,105,624 | |
| | | | | | | | 156,511,943 | |
| | | Lessors of Residential Buildings and Dwellings — 1.06% | | | | | | |
| ELS | | Equity Lifestyle Properties, Inc. — REIT | | 325,200 | | | 14,360,832 | |
| | | Machinery Manufacturing — 0.10% | | | | | | |
| CFX | | Colfax Corporation*^ | | 17,300 | | | 1,289,542 | |
| | | Manufactured Brands — 2.35% | | | | | | |
| JAH | | Jarden Corporation*^ | | 536,000 | | | 31,811,600 | |
| | | Media — 5.19% | | | | | | |
| DISCA | | Discovery Communications, Inc. — Class A* | | 389,923 | | | 28,963,481 | |
| SNI | | Scripps Networks Interactive — Class A^ | | 69,973 | | | 5,677,609 | |
| STRZA | | Starz — Class A* | | 619,000 | | | 18,440,010 | |
| VIAB | | Viacom Inc. — Class B | | 197,700 | | | 17,146,521 | |
| | | | | | | | 70,227,621 | |
| | | Merchant Wholesalers, Nondurable Goods — 0.01% | | | | | | |
| GLEN LN | | Glencore Xstrata plc* | | 12,000 | | | 66,857 | |
| | | Mining (except Oil and Gas) — 1.21% | | | | | | |
| FNV | | Franco-Nevada Corporation^ | | 286,800 | | | 16,445,112 | |
| | | Motion Picture and Sound Recording Industries — 3.18% | | | | | | |
| DWA | | DreamWorks Animation SKG, Inc. — Class A*^ | | 1,853,400 | | | 43,110,084 | |
| | | Motor Vehicle and Parts Dealers — 4.19% | | | | | | |
| AN | | AutoNation, Inc.* | | 950,800 | | | 56,743,744 | |
| | | Non-Store Retailers — 0.34% | | | | | | |
| LE | | Lands’ End, Inc.*^ | | 138,810 | | | 4,661,240 | |
| | | Oil and Gas — 4.87% | | | | | | |
| TPL | | Texas Pacific Land Trust | | 411,980 | | | 65,962,118 | |
| | | Oil and Gas Extraction — 4.24% | | | | | | |
| CNQ | | Canadian Natural Resources Ltd. | | 194,400 | | | 8,924,904 | |
| CLR | | Continental Resources, Inc.*^ | | 112,990 | | | 17,856,939 | |
| PARR | | Par Petroleum Corporation* | | 23,600 | | | 477,900 | |
| SEMUF | | Siem Industries Inc.* | | 29,700 | | | 2,791,800 | |
| TOU CN | | Tourmaline Oil Corp.* | | 518,290 | | | 27,326,738 | |
| | | | | | | | 57,378,281 | |
The accompanying notes are an integral part of these financial statements.
| KINETICS PORTFOLIOS TRUST — MASTER INVESTMENT PORTFOLIOS |
| The Paradigm Portfolio |
Portfolio of Investments — June 30, 2014 (Unaudited) — (Continued) |
| Identifier | | | | Shares | | | Value | |
| | | Other Exchanges — 2.88% | | | | | | |
| CBOE | | CBOE Holdings Inc.^ | | 779,126 | | $ | 38,340,790 | |
| URB/A CN | | Urbana Corporation — Class A | | 398,178 | | | 675,416 | |
| | | | | | | | 39,016,206 | |
| | | Other Information Services — 0.00% | | | | | | |
| GOOGL | | Google Inc. — Class A* | | 30 | | | 17,540 | |
| GOOG | | Google Inc. — Class C* | | 30 | | | 17,258 | |
| | | | | | | | 34,798 | |
| | | Performing Arts, Spectator Sports, and Related Industries — 3.58% | | | | | | |
| LYV | | Live Nation Entertainment, Inc.* | | 1,966,400 | | | 48,550,416 | |
| | | Real Estate — 3.01% | | | | | | |
| BPY | | Brookfield Property Partners LP | | 73,064 | | | 1,524,846 | |
| DRM CN | | Dream Unlimited Corp. — Class A* | | 258,100 | | | 3,732,236 | |
| FCE/A | | Forest City Enterprises, Inc. — Class A*^ | | 1,258,200 | | | 25,000,434 | |
| TPH | | TRI Pointe Homes, Inc.*^ | | 60,400 | | | 949,488 | |
| VNO | | Vornado Realty Trust — REIT | | 89,000 | | | 9,498,970 | |
| | | | | | | | 40,705,974 | |
| | | Restaurants — 2.05% | | | | | | |
| BKW | | Burger King Worldwide Inc.^ | | 12,400 | | | 337,528 | |
| WEN | | The Wendy’s Company^ | | 3,209,600 | | | 27,377,888 | |
| | | | | | | | 27,715,416 | |
| | | Satellite Telecommunications — 5.48% | | | | | | |
| DISH | | DISH Network Corp. — Class A* | | 709,100 | | | 46,148,228 | |
| SATS | | EchoStar Corporation — Class A* | | 512,500 | | | 27,131,750 | |
| LORL | | Loral Space & Communications Inc.* | | 300 | | | 21,807 | |
| VSAT | | ViaSat, Inc.* | | 16,800 | | | 973,728 | |
| | | | | | | | 74,275,513 | |
| | | Security System Services — 0.05% | | | | | | |
| ASCMA | | Ascent Capital Group LLC — Class A*^ | | 10,400 | | | 686,504 | |
| | | Support Activities for Transportation — 0.07% | | | | | | |
| 357 HK | | Hainan Meilan International Airport Company Limited — | | | | | | |
| | | Class H | | 1,041,000 | | | 953,641 | |
| | | Transportation Equipment Manufacturing — 0.00% | | | | | | |
| HEI/A | | HEICO Corporation — Class A | | 1,250 | | | 50,750 | |
The accompanying notes are an integral part of these financial statements.
KINETICS PORTFOLIOS TRUST — MASTER INVESTMENT PORTFOLIOS The Paradigm Portfolio |
Portfolio of Investments — June 30, 2014 (Unaudited) — (Continued) |
| Identifier | | | | Shares | | | Value | |
| | | Utilities — 0.20% | | | | | | |
| BIP | | Brookfield Infrastructure Partners LP^ | | 65,930 | | $ | 2,750,600 | |
| | | TOTAL COMMON STOCKS | | | | | | |
| | | (cost $774,218,091) | | | | | 1,279,614,840 | |
| | | | | Principal | | | | |
| | | ESCROW NOTES — 0.00% | | Amount | | | | |
| | | Special Purpose Entity — 0.00% | | | | | | |
| 006ESCBG1 | | Adelphia Communications Corp.*+ | $ | 200,000 | | | — | |
| | | TOTAL ESCROW NOTES | | | | | | |
| | | (cost $0) | | | | | — | |
| | | | | | | | | |
| | | MUTUAL FUNDS — 0.00% | | Shares | | | | |
| | | Funds, Trusts, and Other Financial Vehicles — 0.00% | | | | | | |
| TRF | | Templeton Russia and East European Fund, Inc. | | 2,200 | | | 33,572 | |
| | | TOTAL MUTUAL FUNDS | | | | | | |
| | | (cost $32,396) | | | | | 33,572 | |
| | | | | | | | | |
| | | | | Principal | | | | |
| | | SHORT-TERM INVESTMENTS — 5.57% | | Amount | | | | |
| | | Commercial Paper — 4.61% | | | | | | |
| 039715141 | | U.S. Bank N.A., 0.02%, 07/01/2014 | | $62,480,000 | | | 62,480,000 | |
| | | | | | | | | |
| | | | | Shares | | | | |
| | | Money Market Funds — 0.96% | | | | | | |
| FIGXX | | Fidelity Institutional Government Portfolio — Class I, 0.01%b | | 12,966,640 | | | 12,966,640 | |
| | | TOTAL SHORT-TERM INVESTMENTS | | | | | | |
| | | (cost $75,446,640) | | | | | 75,446,640 | |
The accompanying notes are an integral part of these financial statements.
| KINETICS PORTFOLIOS TRUST — MASTER INVESTMENT PORTFOLIOS |
| The Paradigm Portfolio |
Portfolio of Investments — June 30, 2014 (Unaudited) — (Continued) |
| | | INVESTMENTS PURCHASED WITH | | | | | | |
| | | THE CASH PROCEEDS FROM | | | | | | |
| Identifier | | SECURITIES LENDING — 5.50% | | Shares | | | Value | |
| | | Money Market Funds — 5.50% | | | | | | |
| | | Mount Vernon Securities Lending Trust — | | | | | | |
| | | Prime Portfolio, 0.18%b | | 74,540,645 | | $ | 74,540,645 | |
| | | TOTAL INVESTMENTS PURCHASED WITH | | | | | | |
| | | THE CASH PROCEEDS FROM SECURITIES LENDING | | | | | | |
| | | (cost $74,540,645) | | | | | 74,540,645 | |
| | | TOTAL INVESTMENTS — 105.56% | | | | | | |
| | | (cost $ 924,237,772) | | | | $ | 1,429,635,697 | |
| Percentages are stated as a percent of net assets. |
| * — | Non-income producing security. |
| ^ — | This security or a portion of this security was out on loan at June 30, 2014. Total loaned securities had a market value of $73,703,910 at June 30, 2014. |
| + — | Security is considered illiquid and was fair valued. The aggregate value of such securities is $0 or 0.00% of net assets. |
| b — | The rate quoted is the annualized seven-day yield as of June 30, 2014. |
ADR — American Depository Receipt. REIT — Real Estate Investment Trust. |
The accompanying notes are an integral part of these financial statements.
| KINETICS PORTFOLIOS TRUST — MASTER INVESTMENT PORTFOLIOS |
| The Medical Portfolio |
Portfolio of Investments — June 30, 2014 (Unaudited) — (Continued) |
| Identifier | | COMMON STOCKS — 96.20% | | Shares | | | Value | |
| | | Chemical Manufacturing — 8.25% | | | | | | |
| AGEN | | Agenus, Inc.* | | 148 | | $ | 477 | |
| ALKS | | Alkermes plc*^ | | 25,000 | | | 1,258,250 | |
| APHB | | Ampliphi Biosciences Corp.* | | 1,000 | | | 438 | |
| IMNP | | Immune Pharmaceuticals Inc.* | | 17 | | | 43 | |
| LONN VX | | Lonza Group AG* | | 5,000 | | | 544,091 | |
| MACK | | Merrimack Pharmaceuticals, Inc.*^ | | 12,000 | | | 87,480 | |
| MMRF | | MMRGlobal Inc.* | | 43,000 | | | 1,225 | |
| OSIR | | Osiris Therapeutics, Inc.*^ | | 18,000 | | | 281,160 | |
| SNTA | | Synta Pharmaceuticals Corp.*^ | | 11,000 | | | 44,990 | |
| | | | | | | | 2,218,154 | |
| | | Pharmaceutical and Biotechnology — 79.64% | | | | | | |
| ABT | | Abbott Laboratories | | 13,000 | | | 531,700 | |
| ABBV | | AbbVie Inc. | | 14,000 | | | 790,160 | |
| ARNA | | Arena Pharmaceuticals, Inc.*^ | | 45,000 | | | 263,700 | |
| AZN | | AstraZeneca plc — ADR | | 13,000 | | | 966,030 | |
| BIIB | | Biogen Idec, Inc.* | | 7,250 | | | 2,285,998 | |
| BMY | | Bristol-Myers Squibb Company | | 34,000 | | | 1,649,340 | |
| CLDX | | Celldex Therapeutics Inc.*^ | | 26,294 | | | 429,118 | |
| CBST | | Cubist Pharmaceuticals, Inc.* | | 24,000 | | | 1,675,680 | |
| DNDN | | Dendreon Corporation*^ | | 34,000 | | | 78,200 | |
| LLY | | Eli Lilly & Company | | 23,000 | | | 1,429,910 | |
| GSK | | GlaxoSmithKline plc — ADR^ | | 22,673 | | | 1,212,552 | |
| ISIS | | Isis Pharmaceuticals, Inc.*^ | | 17,000 | | | 585,650 | |
| JNJ | | Johnson & Johnson | | 14,000 | | | 1,464,680 | |
| MRK | | Merck & Co., Inc. | | 16,000 | | | 925,600 | |
| NVS | | Novartis AG — ADR^ | | 18,000 | | | 1,629,540 | |
| ONTY | | Oncothyreon, Inc.* | | 32,333 | | | 104,759 | |
| PFE | | Pfizer, Inc. | | 46,000 | | | 1,365,280 | |
| PGNX | | Progenics Pharmaceuticals, Inc.* | | 67,200 | | | 289,632 | |
| RHHBY | | Roche Holding AG Ltd. — ADR | | 22,000 | | | 820,600 | |
| SNY | | Sanofi — ADR | | 26,000 | | | 1,382,420 | |
| SHPG | | Shire plc — ADR | | 6,000 | | | 1,412,940 | |
| VICL | | Vical Inc.*^ | | 84,500 | | | 103,090 | |
| | | | | | | | 21,396,579 | |
The accompanying notes are an integral part of these financial statements.
| KINETICS PORTFOLIOS TRUST — MASTER INVESTMENT PORTFOLIOS |
| The Medical Portfolio |
Portfolio of Investments — June 30, 2014 (Unaudited) — (Continued) |
| Identifier | | | | Shares | | | Value | |
| | | Professional, Scientific, and Technical Services — 8.31% | | | | | | |
| AFFX | | Affymetrix, Inc.*^ | | 104,000 | | $ | 926,640 | |
| AMRI | | Albany Molecular Research, Inc.*^ | | 56,000 | | | 1,126,720 | |
| CDXS | | Codexis, Inc.*^ | | 5,611 | | | 8,192 | |
| ONTX | | Onconova Therapeutics, Inc.*^ | | 18,000 | | | 97,740 | |
| PACB | | Pacific Biosciences of California Inc.* | | 12,000 | | | 74,160 | |
| | | | | | | | 2,233,452 | |
| | | TOTAL COMMON STOCKS | | | | | | |
| | | (cost $16,267,866) | | | | | 25,848,185 | |
| | | | | | | | | |
| | | RIGHTS — 0.06% | | | | | | |
| | | Funds, Trusts, and Other Financial Vehicles — 0.03% | | | | | | |
| LGNDZ | | Ligand Pharmaceuticals Inc.* | | 44,000 | | | 660 | |
| LGNXZ | | Ligand Pharmaceuticals Inc.* | | 44,000 | | | 4,840 | |
| LGNYZ | | Ligand Pharmaceuticals Inc.* | | 44,000 | | | 3,300 | |
| LGNZZ | | Ligand Pharmaceuticals Inc.* | | 44,000 | | | 440 | |
| | | | | | | | 9,240 | |
| | | Pharmaceutical and Biotechnology — 0.03% | | | | | | |
| GCVRZ | | Sanofi*^ | | 15,538 | | | 7,769 | |
| | | TOTAL RIGHTS | | | | | | |
| | | (cost $0) | | | | | 17,009 | |
| | | | | | | | | |
| | | | | Principal | | | | |
| | | SHORT-TERM INVESTMENTS — 3.56% | | Amount | | | | |
| | | Commercial Paper — 3.52% | | | | | | |
| 039715141 | | U.S. Bank N.A., 0.02%, 07/01/2014 | $ | 946,000 | | | 946,000 | |
| | | | | | | | | |
| | | | | Shares | | | | |
| | | Money Market Funds — 0.04% | | | | | | |
| FIGXX | | Fidelity Institutional Government Portfolio — Class I, 0.01%b | | 9,884 | | | 9,884 | |
| | | TOTAL SHORT-TERM INVESTMENTS | | | | | | |
| | | (cost $955,884) | | | | | 955,884 | |
The accompanying notes are an integral part of these financial statements.
| KINETICS PORTFOLIOS TRUST — MASTER INVESTMENT PORTFOLIOS |
| The Medical Portfolio |
Portfolio of Investments — June 30, 2014 (Unaudited) — (Continued) |
| | | INVESTMENTS PURCHASED WITH | | | | | | |
| | | THE CASH PROCEEDS FROM | | | | | | |
| Identifier | | SECURITIES LENDING — 19.78% | | Shares | | | Value | |
| | | Money Market Funds — 19.78% | | | | | | |
| | | Mount Vernon Securities Lending Trust — | | | | | | |
| | | Prime Portfolio, 0.18%b | | 5,313,927 | | $ | 5,313,927 | |
| | | TOTAL INVESTMENTS PURCHASED WITH | | | | | | |
| | | THE CASH PROCEEDS FROM SECURITIES LENDING | | | | | | |
| | | (cost $5,313,927) | | | | | 5,313,927 | |
| | | TOTAL INVESTMENTS — 119.60% | | | | | | |
| | | (cost $22,537,677) | | | | $ | 32,135,005 | |
| Percentages are stated as a percent of net assets. |
| * — | Non-income producing security. |
| ^ — | This security or a portion of this security was out on loan at June 30, 2014. Total loaned securities had a market value of $5,028,621 at June 30, 2014. |
| b — | The rate quoted is the annualized seven-day yield as of June 30, 2014. |
| ADR — American Depository Receipt. |
The accompanying notes are an integral part of these financial statements.
| KINETICS PORTFOLIOS TRUST — MASTER INVESTMENT PORTFOLIOS |
| The Small Cap Opportunities Portfolio |
Portfolio of Investments — June 30, 2014 (Unaudited) — (Continued) |
| Identifier | | COMMON STOCKS — 97.48% | | Shares | | | Value | |
| | | Asset Management — 9.92% | | | | | | |
| DDEJF | | Dundee Corporation — Class A* | | 884,900 | | $ | 14,282,286 | |
| JZCP LN | | JZ Capital Partners Ltd. | | 196,400 | | | 1,483,957 | |
| OCX CN | | Onex Corporation | | 378,700 | | | 23,430,743 | |
| RCP LN | | RIT Capital Partners plc | | 135,200 | | | 3,044,962 | |
| SII CN | | Sprott, Inc. | | 1,680 | | | 4,770 | |
| | | | | | | | 42,246,718 | |
| | | Automobile and Other Motor Vehicle Merchant Wholesalers — 0.21% | | | | | | |
| VTU LN | | Vertu Motors plc | | 975,000 | | | 880,190 | |
| | | Chemical Manufacturing — 3.83% | | | | | | |
| IPAR | | Inter Parfums, Inc. | | 155,100 | | | 4,583,205 | |
| PAH | | Platform Specialty Products Corporation* | | 418,300 | | | 11,724,949 | |
| | | | | | | | 16,308,154 | |
| | | Construction of Buildings — 3.05% | | | | | | |
| BRP | | Brookfield Residential Properties Inc.* | | 625,100 | | | 12,970,825 | |
| | | Credit Intermediation and Related Activities — 0.23% | | | | | | |
| BOKF | | BOK Financial Corporation | | 11,400 | | | 759,240 | |
| IFT | | Imperial Holdings, Inc.* | | 35,000 | | | 238,700 | |
| | | | | | | | 997,940 | |
| | | Electronics and Appliance Stores — 1.89% | | | | | | |
| SHOS | | Sears Hometown and Outlet Stores Inc.* | | 375,700 | | | 8,066,279 | |
| | | Forestry and Logging — 0.01% | | | | | | |
| KEWL | | Keweenaw Land Association Ltd.* | | 380 | | | 33,440 | |
| | | Gaming — 1.06% | | | | | | |
| TPCA | | Tropicana Entertainment Inc.* | | 256,600 | | | 4,528,990 | |
| | | General Merchandise Stores — 2.40% | | | | | | |
| SEARF | | Sears Canada Inc. | | 613,100 | | | 8,344,291 | |
| SHLD | | Sears Holdings Corporation* | | 46,500 | | | 1,858,140 | |
| | | | | | | | 10,202,431 | |
| | | Global Exchanges — 0.51% | | | | | | |
| EXAE GA | | Hellenic Exchanges S.A. Holding Clearing Settlement | | | | | | |
| | | and Registry | | 190,000 | | | 2,159,387 | |
The accompanying notes are an integral part of these financial statements.
| KINETICS PORTFOLIOS TRUST — MASTER INVESTMENT PORTFOLIOS |
| The Small Cap Opportunities Portfolio |
Portfolio of Investments — June 30, 2014 (Unaudited) — (Continued) |
| Identifier | | | | Shares | | | Value | |
| | | Holding Company — 9.46% | | | | | | |
| IEP | | Icahn Enterprises LP | | 336,295 | | $ | 33,528,575 | |
| LVNTA | | Liberty Ventures — Series A* | | 32,200 | | | 2,376,360 | |
| PVF CN | | Partners Value Fund Inc.* | | 164,500 | | | 4,394,426 | |
| | | | | | | | 40,299,361 | |
| | | Insurance Carriers and Related Activities — 3.46% | | | | | | |
| AFSI | | AmTrust Financial Services, Inc. | | 217,300 | | | 9,085,313 | |
| GLRE | | Greenlight Capital Re, Ltd. — Class A* | | 171,400 | | | 5,645,916 | |
| | | | | | | | 14,731,229 | |
| | | Lessors of Nonresidential Buildings (except Miniwarehouses) — 10.62% | | | | | | |
| HHC | | The Howard Hughes Corporation* | | 276,400 | | | 43,624,212 | |
| RSE | | Rouse Properties, Inc. | | 92,800 | | | 1,587,808 | |
| | | | | | | | 45,212,020 | |
| | | Lessors of Residential Buildings and Dwellings — 1.45% | | | | | | |
| ELS | | Equity Lifestyle Properties, Inc. — REIT | | 139,800 | | | 6,173,568 | |
| | | Machinery Manufacturing — 0.60% | | | | | | |
| CFX | | Colfax Corporation* | | 34,500 | | | 2,571,630 | |
| | | Manufactured Brands — 7.14% | | | | | | |
| JAH | | Jarden Corporation* | | 472,150 | | | 28,022,102 | |
| MOV | | Movado Group, Inc. | | 57,200 | | | 2,383,524 | |
| | | | | | | | 30,405,626 | |
| | | Media — 1.22% | | | | | | |
| STRZA | | Starz — Class A* | | 173,800 | | | 5,177,502 | |
| | | Merchant Wholesalers, Durable Goods — 0.22% | | | | | | |
| DORM | | Dorman Products, Inc.* | | 19,200 | | | 946,944 | |
| | | Mining (except Oil and Gas) — 0.31% | | | | | | |
| FM CN | | First Quantum Minerals Ltd. | | 39,366 | | | 841,884 | |
| MUX | | McEwen Mining Inc.* | | 160,600 | | | 462,528 | |
| | | | | | | | 1,304,412 | |
| | | Motion Picture and Sound Recording Industries — 4.05% | | | | | | |
| DWA | | DreamWorks Animation SKG, Inc. — Class A* | | 742,300 | | | 17,265,898 | |
| | | Motor Vehicle and Parts Dealers — 0.45% | | | | | | |
| PAG | | Penske Automotive Group, Inc. | | 38,700 | | | 1,915,650 | |
| | | Non-Store Retailers — 0.11% | | | | | | |
| LE | | Lands’ End, Inc.* | | 13,986 | | | 469,650 | |
The accompanying notes are an integral part of these financial statements.
| KINETICS PORTFOLIOS TRUST — MASTER INVESTMENT PORTFOLIOS |
| The Small Cap Opportunities Portfolio |
Portfolio of Investments — June 30, 2014 (Unaudited) — (Continued) |
| Identifier | | | | Shares | | | Value | |
| | | Oil and Gas — 8.44% | | | | | | |
| TPL | | Texas Pacific Land Trust | | 224,500 | | $ | 35,944,695 | |
| | | Oil and Gas Extraction — 1.33% | | | | | | |
| BLMC | | Biloxi Marsh Lands Corporation | | 100 | | | 3,345 | |
| PARR | | Par Petroleum Corporation* | | 213,900 | | | 4,331,475 | |
| WPX | | WPX Energy Inc.* | | 55,800 | | | 1,334,178 | |
| | | | | | | | 5,668,998 | |
| | | Other Exchanges — 0.47% | | | | | | |
| CBOE | | CBOE Holdings Inc. | | 16,990 | | | 836,078 | |
| URB/A CN | | Urbana Corporation — Class A | | 695,071 | | | 1,179,025 | |
| | | | | | | | 2,015,103 | |
| | | Performing Arts, Spectator Sports, and Related Industries — 3.75% | | | | | | |
| LYV | | Live Nation Entertainment, Inc.* | | 647,000 | | | 15,974,430 | |
| | | Petroleum and Coal Products Manufacturing — 1.23% | | | | | | |
| CVI | | CVR Energy, Inc. | | 108,600 | | | 5,233,434 | |
| | | Publishing Industries (except Internet) — 0.25% | | | | | | |
| PRIS | | Promotora de Informaciones S.A. — ADR*^ | | 150,205 | | | 282,386 | |
| PRIS/B US | | Promotora de Informaciones S.A. — Class B — ADR* | | 251,600 | | | 641,580 | |
| VALU | | Value Line, Inc. | | 7,615 | | | 128,008 | |
| | | | | | | | 1,051,974 | |
| | | Real Estate — 8.56% | | | | | | |
| DRM CN | | Dream Unlimited Corp. — Class A* | | 2,235,900 | | | 32,332,072 | |
| TPH | | TRI Pointe Homes, Inc.* | | 263,500 | | | 4,142,220 | |
| | | | | | | | 36,474,292 | |
| | | Rental and Leasing Services — 0.01% | | | | | | |
| CDCO | | Comdisco Holding Company, Inc.* | | 7,560 | | | 37,044 | |
| | | Restaurants — 5.92% | | | | | | |
| WEN | | The Wendy’s Company | | 2,958,400 | | | 25,235,152 | |
| | | Satellite Telecommunications — 0.46% | | | | | | |
| LORL | | Loral Space & Communications Inc.* | | 14,000 | | | 1,017,660 | |
| VSAT | | ViaSat, Inc.* | | 16,400 | | | 950,544 | |
| | | | | | | | 1,968,204 | |
| | | Securities, Commodity Contracts, and Other Financial Investments | | | | | | |
| | | and Related Activities — 0.00% | | | | | | |
| RHJI BB | | RHJ International* | | 800 | | | 3,896 | |
The accompanying notes are an integral part of these financial statements.
| KINETICS PORTFOLIOS TRUST — MASTER INVESTMENT PORTFOLIOS |
| The Small Cap Opportunities Portfolio |
Portfolio of Investments — June 30, 2014 (Unaudited) — (Continued) |
| Identifier | | | | Shares | | | Value | |
| | | Telecommunications — 0.02% | | | | | | |
| CIBY | | CIBL, Inc.* | | 18 | | $ | 24,930 | |
| ICTG | | ICTC Group Inc.* | | 208 | | | 4,576 | |
| LICT | | Lynch Interactive Corporation* | | 16 | | | 67,200 | |
| | | | | | | | 96,706 | |
| | | Transportation Equipment Manufacturing — 4.84% | | | | | | |
| ARII | | American Railcar Industries, Inc. | | 153,600 | | | 10,409,472 | |
| FDML | | Federal-Mogul Corporation* | | 504,200 | | | 10,199,966 | |
| | | | | | | | 20,609,438 | |
| | | TOTAL COMMON STOCKS | | | | | | |
| | | (cost $322,540,999) | | | | | 415,181,210 | |
| | | | | | | | | |
| | | RIGHTS — 0.10% | | | | | | |
| | | Rental and Leasing Services — 0.10% | | | | | | |
| CDCOR | | Comdisco Holding Company, Inc. | | 5,634,807 | | | 422,611 | |
| | | TOTAL RIGHTS | | | | | | |
| | | (cost $1,296,169) | | | | | 422,611 | |
| | | | | | | | | |
| | | | | Principal | | | | |
| | | SHORT-TERM INVESTMENTS — 2.02% | | Amount | | | | |
| | | Commercial Paper — 2.02% | | | | | | |
| 039715141 | | U.S. Bank N.A., 0.02%, 07/01/2014 | $ | 8,610,000 | | | 8,610,000 | |
| | | | | | | | | |
| | | | | Shares | | | | |
| | | Money Market Funds — 0.00% | | | | | | |
| FIGXX | | Fidelity Institutional Government Portfolio — Class I, 0.01%b | | 8,021 | | | 8,021 | |
| | | TOTAL SHORT-TERM INVESTMENTS | | | | | | |
| | | (cost $8,618,021) | | | | | 8,618,021 | |
The accompanying notes are an integral part of these financial statements.
| KINETICS PORTFOLIOS TRUST — MASTER INVESTMENT PORTFOLIOS |
| The Small Cap Opportunities Portfolio |
Portfolio of Investments — June 30, 2014 (Unaudited) — (Continued) |
| | | INVESTMENTS PURCHASED WITH | | | | | | |
| | | THE CASH PROCEEDS FROM | | | | | | |
| Identifier | | SECURITIES LENDING — 11.43% | | Shares | | | Value | |
| | | Money Market Funds — 11.43% | | | | | | |
| | | Mount Vernon Securities Lending Trust — | | | | | | |
| | | Prime Portfolio, 0.18%b | | 48,702,392 | | $ | 48,702,392 | |
| | | TOTAL INVESTMENTS PURCHASED WITH | | | | | | |
| | | THE CASH PROCEEDS FROM SECURITIES LENDING | | | | | | |
| | | (cost $48,702,392) | | | | | 48,702,392 | |
| | | TOTAL INVESTMENTS — 111.03% | | | | | | |
| | | (cost $381,157,581) | | | | | $472,924,234 | |
| Percentages are stated as a percent of net assets. |
| * — | Non-income producing security. |
| ^ — | This security or a portion of this security was out on loan at June 30, 2014. Total loaned securities had a market value of $47,293,574 at June 30, 2014. |
| # — | Contingent value right (contingent upon profitability of company). |
| b — | The rate quoted is the annualized seven-day yield as of June 30, 2014. |
| ADR — American Depository Receipt. |
| REIT — Real Estate Investment Trust. |
The accompanying notes are an integral part of these financial statements.
| KINETICS PORTFOLIOS TRUST — MASTER INVESTMENT PORTFOLIOS |
| The Market Opportunities Portfolio |
Portfolio of Investments — June 30, 2014 (Unaudited) — (Continued) |
| Identifier | | COMMON STOCKS — 90.24% | | Shares | | | Value | |
| | | Asset Management — 24.52% | | | | | | |
| APO | | Apollo Global Management LLC — Class A | | 19,500 | | $ | 540,540 | |
| BX | | The Blackstone Group LP | | 60,000 | | | 2,006,400 | |
| BAM | | Brookfield Asset Management Inc. — Class A | | 54,000 | | | 2,377,080 | |
| DDEJF | | Dundee Corporation — Class A* | | 194,600 | | | 3,140,844 | |
| FII | | Federated Investors, Inc. — Class B^ | | 3,600 | | | 111,312 | |
| JZCP LN | | JZ Capital Partners Ltd. | | 60,600 | | | 457,881 | |
| OAK | | Oaktree Capital Group LLC | | 44,800 | | | 2,239,552 | |
| OZM | | Och-Ziff Capital Management Group — Class A | | 2,400 | | | 33,192 | |
| ONEXF | | Onex Corporation | | 60,000 | | | 3,720,000 | |
| SII CN | | Sprott, Inc. | | 41,155 | | | 116,864 | |
| 806 HK | | Value Partners Group Limited | | 306,000 | | | 204,911 | |
| WETF | | WisdomTree Investments, Inc.*^ | | 51,200 | | | 632,832 | |
| | | | | | | | 15,581,408 | |
| | | Beverage and Tobacco Product Manufacturing — 0.07% | | | | | | |
| CWGL | | Crimson Wine Group Ltd.*^ | | 5,080 | | | 45,974 | |
| | | Chemical Manufacturing — 0.04% | | | | | | |
| BIOF | | BioFuel Energy Corporation* | | 1,600 | | | 10,992 | |
| KDUS | | Cadus Corporation* | | 7,200 | | | 12,168 | |
| | | | | | | | 23,160 | |
| | | Construction of Buildings — 0.54% | | | | | | |
| BRP | | Brookfield Residential Properties Inc.* | | 16,400 | | | 340,300 | |
| | | Credit Intermediation and Related Activities — 2.29% | | | | | | |
| BBCN | | BBCN Bancorp, Inc. | | 10 | | | 159 | |
| EWBC | | East West Bancorp, Inc. | | 3,204 | | | 112,108 | |
| IFT | | Imperial Holdings, Inc.*^ | | 197,200 | | | 1,344,904 | |
| | | | | | | | 1,457,171 | |
| | | Data Processor — 4.17% | | | | | | |
| MA | | MasterCard, Inc. — Class A | | 16,000 | | | 1,175,520 | |
| V | | Visa, Inc. — Class A^ | | 7,000 | | | 1,474,970 | |
| | | | | | | | 2,650,490 | |
| | | E-Commerce — 1.06% | | | | | | |
| LINTA | | Liberty Interactive Corporation — Class A* | | 22,900 | | | 672,344 | |
| | | Electronics and Appliance Stores — 0.02% | | | | | | |
| SHOS | | Sears Hometown and Outlet Stores Inc.* | | 610 | | | 13,097 | |
| | | European Exchanges — 0.69% | | | | | | |
| DB1 GR | | Deutsche Boerse AG | | 5,650 | | | 438,507 | |
The accompanying notes are an integral part of these financial statements.
| KINETICS PORTFOLIOS TRUST — MASTER INVESTMENT PORTFOLIOS |
| The Market Opportunities Portfolio |
Portfolio of Investments — June 30, 2014 (Unaudited) — (Continued) |
| Identifier | | | | Shares | | | Value | |
| | | Gaming — 3.62% | | | | | | |
| LVS | | Las Vegas Sands Corp. | | 11,600 | | $ | 884,152 | |
| TPCA | | Tropicana Entertainment Inc.* | | 80,400 | | | 1,419,060 | |
| | | | | | | | 2,303,212 | |
| | | General Merchandise Stores — 0.43% | | | | | | |
| SEARF | | Sears Canada Inc.^ | | 300 | | | 4,083 | |
| SHLD | | Sears Holdings Corporation*^ | | 6,800 | | | 271,728 | |
| | | | | | | | 275,811 | |
| | | Global Exchanges — 2.62% | | | | | | |
| EXAE GA | | Hellenic Exchanges S.A. Holding Clearing Settlement and Registry* | | 21,600 | | | 245,488 | |
| JSE SJ | | JSE Limited | | 83,600 | | | 753,854 | |
| LSE LN | | London Stock Exchange Group plc | | 12,800 | | | 439,650 | |
| SGX SP | | Singapore Exchange Limited | | 40,000 | | | 222,953 | |
| | | | | | | | 1,661,945 | |
| | | Holding Company — 15.87% | | | | | | |
| CKI CN | | Clarke Inc. | | 1,000 | | | 10,037 | |
| IEP | | Icahn Enterprises LP^ | | 61,726 | | | 6,154,088 | |
| LUK | | Leucadia National Corporation | | 80,000 | | | 2,097,600 | |
| LVNTA | | Liberty Ventures — Series A* | | 9,148 | | | 675,122 | |
| PVF CN | | Partners Value Fund Inc.* | | 42,900 | | | 1,146,024 | |
| | | | | | | | 10,082,871 | |
| | | Insurance Carriers and Related Activities — 2.10% | | | | | | |
| AFSI | | AmTrust Financial Services, Inc.^ | | 19,600 | | | 819,476 | |
| GLRE | | Greenlight Capital Re, Ltd. — Class A* | | 1,200 | | | 39,528 | |
| MKL | | Markel Corporation* | | 725 | | | 475,339 | |
| | | | | | | | 1,334,343 | |
| | | Lessors of Nonresidential Buildings | | | | | | |
| | | (except Miniwarehouses) — 7.45% | | | | | | |
| HHC | | The Howard Hughes Corporation* | | 27,700 | | | 4,371,891 | |
| RSE | | Rouse Properties, Inc. | | 21,200 | | | 362,732 | |
| | | | | | | | 4,734,623 | |
| | | Merchant Wholesalers, Durable Goods — 0.03% | | | | | | |
| AMRK | | A-Mark Precious Metals, Inc.* | | 1,600 | | | 17,856 | |
| | | Mining (except Oil and Gas) — 0.36% | | | | | | |
| FNV | | Franco-Nevada Corporation | | 4,000 | | | 229,360 | |
The accompanying notes are an integral part of these financial statements.
| KINETICS PORTFOLIOS TRUST — MASTER INVESTMENT PORTFOLIOS |
| The Market Opportunities Portfolio |
Portfolio of Investments — June 30, 2014 (Unaudited) — (Continued) |
| Identifier | | | | Shares | | | Value | |
| | | Non-Store Retailers — 2.64% | | | | | | |
| BID | | Sotheby’s^ | | 40,000 | | $ | 1,679,600 | |
| | | Oil and Gas — 7.66% | | | | | | |
| TPL | | Texas Pacific Land Trust | | 30,400 | | | 4,867,344 | |
| | | Other Exchanges — 5.21% | | | | | | |
| CBOE | | CBOE Holdings Inc. | | 45,400 | | | 2,234,134 | |
| FTIS LI | | Financial Technologies (India) Ltd. — GDR | | 96,180 | | | 57,814 | |
| NZX NZ | | NZX Ltd. | | 359,002 | | | 411,764 | |
| URB/A CN | | Urbana Corporation — Class A | | 356,004 | | | 603,877 | |
| | | | | | | | 3,307,589 | |
| | | Real Estate — 5.19% | | | | | | |
| DRM CN | | Dream Unlimited Corp. — Class A* | | 228,000 | | | 3,296,978 | |
| | | Securities, Commodity Contracts, and Other Financial Investments and Related Activities — 3.26% | | | | | | |
| CME | | CME Group, Inc. | | 6,400 | | | 454,080 | |
| ICE | | IntercontinentalExchange Group, Inc. | | 5,600 | | | 1,057,840 | |
| OTCM | | OTC Markets Group Inc. — Class A^ | | 50,220 | | | 562,464 | |
| | | | | | | | 2,074,384 | |
| | | Transportation Equipment Manufacturing — 0.01% | | | | | | |
| ARII | | American Railcar Industries, Inc. | | 100 | | | 6,777 | |
| | | U.S. Equity Exchanges — 0.39% | | | | | | |
| NDAQ | | The NASDAQ OMX Group, Inc. | | 6,400 | | | 247,168 | |
| | | TOTAL COMMON STOCKS | | | | | | |
| | | (cost $40,423,256) | | | | | 57,342,312 | |
| | | | | | | | | |
| | | RIGHTS — 0.00% | | | | | | |
| | | Asset Management — 0.00% | | | | | | |
| WPSL | | W.P. Stewart & Co., Ltd.*+ | | 205 | | | — | |
| | | TOTAL RIGHTS | | | | | | |
| | | (cost $0) | | | | | — | |
The accompanying notes are an integral part of these financial statements.
| KINETICS PORTFOLIOS TRUST — MASTER INVESTMENT PORTFOLIOS |
| The Market Opportunities Portfolio |
Portfolio of Investments — June 30, 2014 (Unaudited) — (Continued) |
| Identifier | | MUTUAL FUNDS — 0.07% | | Shares | | | Value | |
| | | Funds, Trusts, and Other Financial Vehicles — 0.07% | | | | | | |
| PFN | | PIMCO Income Strategy Fund II | | 760 | | $ | 8,406 | |
| SPE | | Special Opportunities Fund Inc. | | 2,000 | | | 33,400 | |
| TRF | | Templeton Russia and East European Fund, Inc. | | 200 | | | 3,052 | |
| | | TOTAL MUTUAL FUNDS | | | | | | |
| | | (cost $41,435) | | | | | 44,858 | |
| | | | | | | | | |
| | | | | Principal | | | | |
| | | SHORT-TERM INVESTMENTS — 9.98% | | Amount | | | | |
| | | Commercial Paper — 4.99% | | | | | | |
| 039715141 | | U.S. Bank N.A., 0.02%, 07/01/2014 | $ | 3,170,000 | | | 3,170,000 | |
| | | | | | | | | |
| | | | | Shares | | | | |
| | | Money Market Funds — 4.99% | | | | | | |
| FIGXX | | Fidelity Institutional Government Portfolio — | | | | | | |
| | | Class I, 0.01%b | | 3,170,000 | | | 3,170,000 | |
| | | TOTAL SHORT-TERM INVESTMENTS | | | | | | |
| | | (cost $6,340,000) | | | | | 6,340,000 | |
| | | | | | | | | |
| | | INVESTMENTS PURCHASED WITH | | | | | | |
| | | THE CASH PROCEEDS FROM | | | | | | |
| | | SECURITIES LENDING — 8.76% | | | | | | |
| | | Money Market Funds — 8.76% | | | | | | |
| | | Mount Vernon Securities Lending Trust — | | | | | | |
| | | Prime Portfolio, 0.18%b | | 5,564,976 | | | 5,564,976 | |
| | | TOTAL INVESTMENTS PURCHASED WITH | | | | | | |
| | | THE CASH PROCEEDS FROM SECURITIES LENDING | | | | | | |
| | | (cost $5,564,976) | | | | | 5,564,976 | |
| | | TOTAL INVESTMENTS — 109.05% | | | | | | |
| | | (cost $52,369,667) | | | | $ | 69,292,146 | |
| Percentages are stated as a percent of net assets. |
| * — | Non-income producing security. |
| ^ — | This security or a portion of this security was out on loan at June 30, 2014. Total loaned securities had a market value of $5,474,060 at June 30, 2014. |
| + — | Security is considered illiquid and was fair valued. The aggregate value of such securities is $0 or 0.00% of net assets. |
| b — | The rate quoted is the annualized seven-day yield as of June 30, 2014. |
| GDR — | Global Depository Receipt. |
The accompanying notes are an integral part of these financial statements.
| KINETICS PORTFOLIOS TRUST — MASTER INVESTMENT PORTFOLIOS |
| The Alternative Income Portfolio |
Portfolio of Investments — June 30, 2014 (Unaudited) — (Continued) |
| | | | | Principal | | | | |
| Identifier | | CORPORATE BONDS — 65.18% | | Amount | | | Value | |
| | | Beverage and Tobacco Product Manufacturing — 3.05% | | | | | | |
| 02209SAK9 | | Altria Group, Inc. | | | | | | |
| | | 4.125%, 09/11/2015 | $ | 100,000 | | $ | 104,081 | |
| 03523TBL1 | | Anheuser-Busch InBev Worldwide Inc. | | | | | | |
| | | 1.500%, 07/14/2014+ | | 126,000 | | | 126,048 | |
| 191216AP5 | | The Coca-Cola Company | | | | | | |
| | | 1.500%, 11/15/2015 | | 100,000 | | | 101,529 | |
| 26138EAM1 | | Dr. Pepper Snapple Group, Inc. | | | | | | |
| | | 2.900%, 01/15/2016 | | 200,000 | | | 206,915 | |
| 713448CL0 | | PepsiCo, Inc. | | | | | | |
| | | 0.950%, 02/22/2017 | | 200,000 | | | 199,862 | |
| 761713AV8 | | Reynolds American, Inc. | | | | | | |
| | | 1.050%, 10/30/2015 | | 175,000 | | | 175,024 | |
| | | | | | | | 913,459 | |
| | | Broadcasting (except Internet) — 0.68% | | | | | | |
| 63946BAB6 | | NBCUniversal Media, LLC | | | | | | |
| | | 3.650%, 04/30/2015 | | 100,000 | | | 102,735 | |
| 25468PCU8 | | The Walt Disney Company | | | | | | |
| | | 0.450%, 12/01/2015 | | 100,000 | | | 100,135 | |
| | | | | | | | 202,870 | |
| | | Chemical Manufacturing — 3.33% | | | | | | |
| | | Colgate-Palmolive Company | | | | | | |
| 19416QDQ0 | | 1.375%, 11/01/2015 | | 150,000 | | | 152,000 | |
| 19416QDX5 | | 1.300%, 01/15/2017 | | 200,000 | | | 202,253 | |
| 260543CD3 | | The Dow Chemical Company | | | | | | |
| | | 2.500%, 02/15/2016 | | 250,000 | | | 257,051 | |
| | | Ecolab Inc. | | | | | | |
| 278865AJ9 | | 2.375%, 12/08/2014 | | 125,000 | | | 126,094 | |
| 278865AN0 | | 1.000%, 08/09/2015 | | 55,000 | | | 55,284 | |
| 628530AW7 | | Mylan Inc. | | | | | | |
| | | 1.800%, 06/24/2016 | | 200,000 | | | 202,930 | |
| | | | | | | | 995,612 | |
| | | Computer and Electronic Product | | | | | | |
| | | Manufacturing — 6.24% | | | | | | |
| 037833AM2 | | Apple, Inc. | | | | | | |
| | | 1.050%, 05/05/2017 | | 250,000 | | | 250,512 | |
| 111320AD9 | | Broadcom Corporation | | | | | | |
| | | 2.375%, 11/01/2015 | | 200,000 | | | 204,752 | |
The accompanying notes are an integral part of these financial statements.
| KINETICS PORTFOLIOS TRUST — MASTER INVESTMENT PORTFOLIOS |
| The Alternative Income Portfolio |
Portfolio of Investments — June 30, 2014 (Unaudited) — (Continued) |
| | | | | Principal | | | | |
| Identifier | | | | Amount | | | Value | |
| | | Computer and Electronic Product | | | | | | |
| | | Manufacturing — 6.24% (Continued) | | | | | | |
| 22303QAK6 | | Covidien International Finance SA | | | | | | |
| | | 2.800%, 06/15/2015 | $ | 100,000 | | $ | 102,392 | |
| 428236BC6 | | Hewlett-Packard Co. | | | | | | |
| | | 2.125%, 09/13/2015 | | 100,000 | | | 101,793 | |
| 459200HD6 | | IBM Corp. | | | | | | |
| | | 0.750%, 05/11/2015 | | 100,000 | | | 100,446 | |
| 458140AH3 | | Intel Corp. | | | | | | |
| | | 1.950%, 10/01/2016 | | 200,000 | | | 205,340 | |
| | | Medtronic, Inc. | | | | | | |
| 585055AR7 | | 3.000%, 03/15/2015 | | 100,000 | | | 101,923 | |
| 585055BB1 | | 0.875%, 02/27/2017 | | 250,000 | | | 249,248 | |
| 882508AR5 | | Texas Instruments Inc. | | | | | | |
| | | 2.375%, 05/16/2016 | | 200,000 | | | 206,829 | |
| 883556AS1 | | Thermo Fisher Scientific, Inc. | | | | | | |
| | | 3.200%, 05/01/2015 | | 140,000 | | | 143,138 | |
| 902133AL1 | | Tyco Electronics Group SA | | | | | | |
| | | 1.600%, 02/03/2015 | | 200,000 | | | 201,372 | |
| | | | | | | | 1,867,745 | |
| | | Consumer Staples — 0.67% | | | | | | |
| 742718ED7 | | The Procter & Gamble Company | | | | | | |
| | | 0.750%, 11/04/2016 | | 200,000 | | | 199,933 | |
| | | Credit Intermediation and Related Activities — 12.04% | | | | | | |
| 025815AA9 | | American Express Centurion | | | | | | |
| | | 0.875%, 11/13/2015 | | 250,000 | | | 251,325 | |
| 0258M0CZ0 | | American Express Credit Corporation | | | | | | |
| | | 5.125%, 08/25/2014+ | | 100,000 | | | 100,689 | |
| 06051GES4 | | Bank of America Corporation | | | | | | |
| | | 1.250%, 01/11/2016 | | 250,000 | | | 251,970 | |
| 06406HCD9 | | The Bank of New York Mellon Corporation | | | | | | |
| | | 0.700%, 10/23/2015 | | 200,000 | | | 200,697 | |
| 064159BV7 | | Bank of Nova Scotia | | | | | | |
| | | 0.950%, 03/15/2016 | | 200,000 | | | 201,288 | |
| 07330NAC9 | | Branch Banking & Trust Company Global Bank | | | | | | |
| | | 1.450%, 10/03/2016 | | 180,000 | | | 182,050 | |
| 140420NG1 | | Capital One Bank (USA), NA | | | | | | |
| | | 1.200%, 02/13/2017 | | 250,000 | | | 250,150 | |
The accompanying notes are an integral part of these financial statements.
| KINETICS PORTFOLIOS TRUST — MASTER INVESTMENT PORTFOLIOS |
| The Alternative Income Portfolio |
Portfolio of Investments — June 30, 2014 (Unaudited) — (Continued) |
| | | | | Principal | | | | |
| Identifier | | | | Amount | | | Value | |
| | | Credit Intermediation and Related | | | | | | |
| | | Activities — 12.04% (Continued) | | | | | | |
| | | Caterpillar Financial Services Corporation | | | | | | |
| 14912L5B3 | | 1.050%, 03/26/2015 | $ | 100,000 | | $ | 100,596 | |
| 14912L4S7 | | 2.650%, 04/01/2016 | | 200,000 | | | 207,188 | |
| 31677QAX7 | | Fifth Third Bank | | | | | | |
| | | 0.900%, 02/26/2016 | | 150,000 | | | 150,444 | |
| 36962G6M1 | | General Electric Capital Corp. | | | | | | |
| | | 1.000%, 12/11/2015 | | 200,000 | | | 201,609 | |
| 41283LAC9 | | Harley-Davidson Financial Services Inc. | | | | | | |
| | | 1.150%, 09/15/2015, Acquired 01/08/2014 | | | | | | |
| | | at $200,694■ | | 200,000 | | | 201,113 | |
| | | John Deere Capital Corporation | | | | | | |
| 24422ERQ4 | | 0.875%, 04/17/2015 | | 100,000 | | | 100,498 | |
| 24422ESH3 | | 1.050%, 12/15/2016 | | 200,000 | | | 200,850 | |
| 49327M2J2 | | Key Bank NA | | | | | | |
| | | 1.100%, 11/25/2016 | | 250,000 | | | 251,088 | |
| 69371RK62 | | PACCAR Financial Corporation | | | | | | |
| | | 1.050%, 06/05/2015 | | 100,000 | | | 100,726 | |
| 69349LAN8 | | PNC Bank NA | | | | | | |
| | | 1.300%, 10/03/2016 | | 250,000 | | | 252,508 | |
| 88166CAA6 | | Teva Pharmaceuticals Finance | | | | | | |
| | | 3.000%, 06/15/2015 | | 100,000 | | | 102,463 | |
| 92976GAB7 | | Wells Fargo Bank NA | | | | | | |
| | | 4.800%, 11/01/2014 | | 96,000 | | | 97,480 | |
| 94974BFL9 | | Wells Fargo & Company | | | | | | |
| | | 1.250%, 07/20/2016 | | 200,000 | | | 201,828 | |
| | | | | | | | 3,606,560 | |
| | | Digital Security — 0.51% | | | | | | |
| 871503AG3 | | Symantec Corp. | | | | | | |
| | | 2.750%, 09/15/2015 | | 150,000 | | | 153,449 | |
| | | Diversified Financial Services — 0.67% | | | | | | |
| 46623EJR1 | | JPMorgan Chase & Co. | | | | | | |
| | | 1.100%, 10/15/2015 | | 200,000 | | | 200,895 | |
| | | E-Commerce — 1.14% | | | | | | |
| 023135AK2 | | Amazon.com, Inc. | | | | | | |
| | | 0.650%, 11/27/2015 | | 200,000 | | | 200,392 | |
The accompanying notes are an integral part of these financial statements.
| KINETICS PORTFOLIOS TRUST — MASTER INVESTMENT PORTFOLIOS |
| The Alternative Income Portfolio |
Portfolio of Investments — June 30, 2014 (Unaudited) — (Continued) |
| | | | | Principal | | | | |
| Identifier | | | | Amount | | | Value | |
| | | E-Commerce — 1.14% (Continued) | | | | | | |
| 278642AD5 | | eBay, Inc. | | | | | | |
| | | 0.700%, 07/15/2015 | $ | 140,000 | | $ | 140,589 | |
| | | | | | | | 340,981 | |
| | | Electrical Equipment, Appliance, and Component | | | | | | |
| | | Manufacturing — 0.33% | | | | | | |
| 963320AP1 | | Whirlpool Corporation | | | | | | |
| | | 1.350%, 03/01/2017 | | 100,000 | | | 100,130 | |
| | | Fabricated Metal Product Manufacturing — 0.69% | | | | | | |
| 235851AL6 | | Danaher Corporation | | | | | | |
| | | 2.300%, 06/23/2016 | | 200,000 | | | 206,587 | |
| | | Food Manufacturing — 3.88% | | | | | | |
| 205887BH4 | | ConAgra Foods, Inc. | | | | | | |
| | | 1.350%, 09/10/2015 | | 100,000 | | | 100,768 | |
| 370334BN3 | | General Mills, Inc. | | | | | | |
| | | 0.875%, 01/29/2016 | | 200,000 | | | 200,957 | |
| 423074AL7 | | HJ Heinz Co. | | | | | | |
| | | 2.000%, 09/12/2016 | | 150,000 | | | 151,633 | |
| | | Kellogg Company | | | | | | |
| 487836BG2 | | 1.125%, 05/15/2015 | | 200,000 | | | 201,436 | |
| 487836BF4 | | 1.875%, 11/17/2016 | | 100,000 | | | 102,026 | |
| 50076QAK2 | | Kraft Foods Group Inc. | | | | | | |
| | | 1.625%, 06/04/2015 | | 200,000 | | | 202,105 | |
| 982526AR6 | | William Wrigley Jr. Company | | | | | | |
| | | 1.400%, 10/21/2016, Acquired 10/28/2013 | | | | | | |
| | | at $201,122■ | | 200,000 | | | 201,499 | |
| | | | | | | | 1,160,424 | |
| | | Food Services and Drinking Places — 0.67% | | | | | | |
| 855244AE9 | | Starbucks Corporation | | | | | | |
| | | 0.875%, 12/05/2016 | | 200,000 | | | 200,314 | |
| | | General Merchandise Stores — 1.42% | | | | | | |
| 22160KAD7 | | Costco Wholesale Corporation | | | | | | |
| | | 0.650%, 12/07/2015 | | 150,000 | | | 150,600 | |
| | | Wal-Mart Stores, Inc. | | | | | | |
| 931142CX9 | | 1.500%, 10/25/2015 | | 74,000 | | | 75,169 | |
| 931142DE0 | | 0.600%, 04/11/2016 | | 200,000 | | | 200,478 | |
| | | | | | | | 426,247 | |
The accompanying notes are an integral part of these financial statements.
| KINETICS PORTFOLIOS TRUST — MASTER INVESTMENT PORTFOLIOS |
| The Alternative Income Portfolio |
Portfolio of Investments — June 30, 2014 (Unaudited) — (Continued) |
| | | | | Principal | | | | |
| Identifier | | | | Amount | | | Value | |
| | | Health and Personal Care Stores — 1.69% | | | | | | |
| | | CVS Caremark Corporation | | | | | | |
| 126650BT6 | | 3.250%, 05/18/2015 | $ | 100,000 | | $ | 102,571 | |
| 126650CA6 | | 1.200%, 12/05/2016 | | 200,000 | | | 201,342 | |
| 931422AG4 | | Walgreen Company | | | | | | |
| | | 1.000%, 03/13/2015 | | 200,000 | | | 200,798 | |
| | | | | | | | 504,711 | |
| | | Holding Company — 0.84% | | | | | | |
| 084664BX8 | | Berkshire Hathaway Finance Corp. | | | | | | |
| | | 0.950%, 08/15/2016# | | 250,000 | | | 251,473 | |
| | | Insurance Carriers and Related Activities — 1.68% | | | | | | |
| 74432QAE5 | | Prudential Financial, Inc. | | | | | | |
| | | 5.100%, 09/20/2014 | | 100,000 | | | 101,026 | |
| 91324PBX9 | | UnitedHealth Group Inc. | | | | | | |
| | | 0.850%, 10/15/2015 | | 100,000 | | | 100,475 | |
| 94973VAZ0 | | WellPoint, Inc. | | | | | | |
| | | 1.250%, 09/10/2015 | | 300,000 | | | 302,379 | |
| | | | | | | | 503,880 | |
| | | Machinery Manufacturing — 1.00% | | | | | | |
| 452308AS8 | | Illinois Tool Works, Inc. | | | | | | |
| | | 0.900%, 02/25/2017# | | 300,000 | | | 299,909 | |
| | | Media — 0.85% | | | | | | |
| 25470DAB5 | | Discovery Communications | | | | | | |
| | | 3.700%, 06/01/2015 | | 100,000 | | | 102,977 | |
| 92553PAK8 | | Viacom Inc. | | | | | | |
| | | 1.250%, 02/27/2015 | | 150,000 | | | 150,863 | |
| | | | | | | | 253,840 | |
| | | Merchant Wholesalers, Nondurable Goods — 1.53% | | | | | | |
| | | Express Scripts Holding Company | | | | | | |
| 30219GAB4 | | 2.100%, 02/12/2015 | | 100,000 | | | 101,024 | |
| 302182AF7 | | 3.125%, 05/15/2016 | | 150,000 | | | 156,345 | |
| 581557AY1 | | McKesson Corp. | | | | | | |
| | | 0.950%, 12/04/2015 | | 200,000 | | | 200,878 | |
| | | | | | | | 458,247 | |
| | | Mining (except Oil and Gas) — 1.34% | | | | | | |
| 35671DAV7 | | Freeport-McMoRan Copper & Gold Inc. | | | | | | |
| | | 1.400%, 02/13/2015 | | 300,000 | | | 301,233 | |
The accompanying notes are an integral part of these financial statements.
| KINETICS PORTFOLIOS TRUST — MASTER INVESTMENT PORTFOLIOS |
| The Alternative Income Portfolio |
Portfolio of Investments — June 30, 2014 (Unaudited) — (Continued) |
| | | | | | | | | |
| | | | | Principal | | | | |
| Identifier | | | | Amount | | | Value | |
| | | Mining (except Oil and Gas) — 1.34% (Continued) | | | | | | |
| 76720AAA4 | | Rio Tinto Financial USA plc | | | | | | |
| | | 1.125%, 03/20/2015 | $ | 100,000 | | $ | 100,539 | |
| | | | | | | | 401,772 | |
| | | Miscellaneous Manufacturing — 3.73% | | | | | | |
| 88579YAD3 | | 3M Co. | | | | | | |
| | | 1.375%, 09/29/2016 | | 250,000 | | | 254,535 | |
| 071813BH1 | | Baxter International Inc. | | | | | | |
| | | 0.950%, 06/01/2016 | | 200,000 | | | 200,950 | |
| 14170TAL5 | | CareFusion Corp. | | | | | | |
| | | 1.450%, 05/15/2017 | | 300,000 | | | 299,986 | |
| 067383AB5 | | CR Bard, Inc. | | | | | | |
| | | 2.875%, 01/15/2016 | | 150,000 | | | 155,211 | |
| 863667AC5 | | Stryker Corporation | | | | | | |
| | | 2.000%, 09/30/2016 | | 200,000 | | | 205,262 | |
| | | | | | | | 1,115,944 | |
| | | Motor Vehicle and Parts Dealers — 0.84% | | | | | | |
| 053332AQ5 | | AutoZone, Inc. | | | | | | |
| | | 1.300%, 01/13/2017 | | 250,000 | | | 250,766 | |
| | | Oil and Gas Extraction — 2.12% | | | | | | |
| 136385AQ4 | | Canadian Natural Resources Ltd. | | | | | | |
| | | 1.450%, 11/14/2014 | | 130,000 | | | 130,554 | |
| 25179MAS2 | | Devon Energy Corporation | | | | | | |
| | | 1.200%, 12/15/2016 | | 200,000 | | | 200,727 | |
| 565849AJ5 | | Marathon Oil Corporation | | | | | | |
| | | 0.900%, 11/01/2015 | | 100,000 | | | 100,384 | |
| 674599CB9 | | Occidental Petroleum Corporation | | | | | | |
| | | 1.750%, 02/15/2017 | | 200,000 | | | 203,830 | |
| | | | | | | | 635,495 | |
| | | Other Information Services — 0.76% | | | | | | |
| 38259PAC6 | | Google Inc. | | | | | | |
| | | 2.125%, 05/19/2016 | | 222,000 | | | 228,811 | |
| | | Petroleum and Coal Products Manufacturing — 1.34% | | | | | | |
| 166764AC4 | | Chevron Corporation | | | | | | |
| | | 0.889%, 06/24/2016 | | 200,000 | | | 201,373 | |
The accompanying notes are an integral part of these financial statements.
| KINETICS PORTFOLIOS TRUST — MASTER INVESTMENT PORTFOLIOS |
| The Alternative Income Portfolio |
Portfolio of Investments — June 30, 2014 (Unaudited) — (Continued) |
| | | | | Principal | | | | |
| Identifier | | | | Amount | | | Value | |
| | | Petroleum and Coal Products | | | | | | |
| | | Manufacturing — 1.34% (Continued) | | | | | | |
| 30231GAA0 | | Exxon Mobil Corp. | | | | | | |
| | | 0.921%, 03/15/2017# | $ | 200,000 | | $ | 200,343 | |
| | | | | | | | 401,716 | |
| | | Pharmaceutical and Biotechnology — 3.68% | | | | | | |
| 031162AJ9 | | Amgen Inc. | | | | | | |
| | | 4.850%, 11/18/2014 | | 140,000 | | | 142,388 | |
| 377372AG2 | | GlaxoSmithKline Capital Inc. | | | | | | |
| | | 0.700%, 03/18/2016 | | 200,000 | | | 200,580 | |
| 478160BF0 | | Johnson & Johnson | | | | | | |
| | | 0.700%, 11/28/2016# | | 300,000 | | | 300,774 | |
| 53217VAD1 | | Life Technologies Corporation | | | | | | |
| | | 3.500%, 01/15/2016 | | 150,000 | | | 155,878 | |
| 717081DJ9 | | Pfizer, Inc. | | | | | | |
| | | 1.100%, 05/15/2017 | | 300,000 | | | 301,383 | |
| | | | | | | | 1,101,003 | |
| | | Pipeline Transportation — 0.34% | | | | | | |
| 96950FAB0 | | Williams Partners LP | | | | | | |
| | | 3.800%, 02/15/2015 | | 100,000 | | | 101,939 | |
| | | Publishing Industries (except Internet) — 0.33% | | | | | | |
| 884903BL8 | | Thomson Reuters Corporation | | | | | | |
| | | 0.875%, 05/23/2016 | | 100,000 | | | 100,006 | |
| | | Satellite Telecommunications — 0.52% | | | | | | |
| 25459HAY1 | | DIRECTV Holdings, LLC | | | | | | |
| | | 3.500%, 03/01/2016 | | 150,000 | | | 156,588 | |
| | | Software — 0.34% | | | | | | |
| 00724FAA9 | | Adobe Systems, Inc. | | | | | | |
| | | 3.250%, 02/01/2015 | | 100,000 | | | 101,563 | |
| | | Support Activities for Mining — 0.86% | | | | | | |
| 806854AA3 | | Schlumberger Investment SA | | | | | | |
| | | 1.950%, 09/14/2016, Acquired 01/10/2014 | | | | | | |
| | | at $255,555 ■ | | 250,000 | | | 255,983 | |
| | | Telecommunications — 2.01% | | | | | | |
| 00206RBL5 | | AT&T, Inc. | | | | | | |
| | | 0.800%, 12/01/2015 | | 200,000 | | | 200,592 | |
The accompanying notes are an integral part of these financial statements.
| KINETICS PORTFOLIOS TRUST — MASTER INVESTMENT PORTFOLIOS |
| The Alternative Income Portfolio |
Portfolio of Investments — June 30, 2014 (Unaudited) — (Continued) |
| | | | | Principal | | | | |
| Identifier | | | | Amount | | | Value | |
| | | Telecommunications — 2.01% (Continued) | | | | | | |
| 92343VBH6 | | Verizon Communications Inc. | | | | | | |
| | | 0.700%, 11/02/2015 | $ | 200,000 | | $ | 200,585 | |
| 92857WAX8 | | Vodafone Group plc | | | | | | |
| | | 1.625%, 03/20/2017 | | 200,000 | | | 201,745 | |
| | | | | | | | 602,922 | |
| | | Transportation Equipment Manufacturing — 2.52% | | | | | | |
| 539830AX7 | | Lockheed Martin Corp. | | | | | | |
| | | 2.125%, 09/15/2016 | | 250,000 | | | 257,498 | |
| 89233P6J0 | | Toyota Motor Credit Corp. | | | | | | |
| | | 0.875%, 07/17/2015 | | 200,000 | | | 201,231 | |
| B84TD43 | | VW Credit, Inc. | | | | | | |
| | | 1.875%, 10/13/2016 | | 290,000 | | | 296,054 | |
| | | | | | | | 754,783 | |
| | | Utilities — 1.19% | | | | | | |
| 693304AN7 | | PECO Energy Company | | | | | | |
| | | 5.000%, 10/01/2014 | | 52,000 | | | 52,590 | |
| 843646AF7 | | Southern Power Company | | | | | | |
| | | 4.875%, 07/15/2015 | | 100,000 | | | 104,588 | |
| 98389BAP5 | | Xcel Energy, Inc. | | | | | | |
| | | 0.750%, 05/09/2016 | | 200,000 | | | 200,296 | |
| | | | | | | | 357,474 | |
| | | Waste Management and Remediation Services — 0.35% | | | | | | |
| 94106LAT6 | | Waste Management, Inc. | | | | | | |
| | | 6.375%, 03/11/2015 | | 100,000 | | | 104,027 | |
| | | TOTAL CORPORATE BONDS | | | | | | |
| | | (cost $19,484,992) | | | | | 19,518,058 | |
| | | | | | | | | |
| | | U.S. GOVERNMENT AGENCY | | | | | | |
| | | ISSUES — 4.13%1 | | | | | | |
| | | U.S. Government Agency Issues — 4.13% | | | | | | |
| 3133ED4A7 | | Federal Farm Credit Bank | | | | | | |
| | | 0.375%, 10/07/2015# | | 300,000 | | | 300,599 | |
| | | Federal Home Loan Banks | | | | | | |
| 313371ZY5 | | 1.875%, 12/11/2015# | | 175,000 | | | 178,941 | |
| 313375RN9 | | 1.000%, 03/11/2016# | | 200,000 | | | 201,822 | |
The accompanying notes are an integral part of these financial statements.
| KINETICS PORTFOLIOS TRUST — MASTER INVESTMENT PORTFOLIOS |
| The Alternative Income Portfolio |
Portfolio of Investments — June 30, 2014 (Unaudited) — (Continued) |
| | | | | Principal | | | | |
| Identifier | | | | Amount | | | Value | |
| | | U.S. Government Agency Issues — 4.13% (Continued) | | | | | | |
| 3137EADQ9 | | Federal Home Loan Mortgage Corporation | | | | | | |
| | | 0.500%, 05/13/2016# | $ | 300,000 | | $ | 300,185 | |
| 31398A4K5 | | Federal National Mortgage Association | | | | | | |
| | | 1.875%, 10/15/2015# | | 250,000 | | | 254,924 | |
| | | TOTAL U.S. GOVERNMENT AGENCY ISSUES | | | | | | |
| | | (cost $1,235,502) | | | | | 1,236,471 | |
| | | | | | | | | |
| | | U.S. TREASURY OBLIGATIONS — 5.34% | | | | | | |
| | | U.S. Treasury Notes — 5.34% | | | | | | |
| 912828TK6 | | 0.250%, 08/15/2015# | | 350,000 | | | 350,356 | |
| 912828UW8 | | 0.250%, 04/15/2016# | | 500,000 | | | 498,897 | |
| 912828VL1 | | 0.625%, 07/15/2016# | | 250,000 | | | 250,781 | |
| 912828WA4 | | 0.625%, 10/15/2016# | | 300,000 | | | 300,340 | |
| 912828B74 | | 0.625%, 02/15/2017# | | 200,000 | | | 199,523 | |
| | | TOTAL U.S. TREASURY OBLIGATIONS | | | | | | |
| | | (cost $1,596,744) | | | | | 1,599,897 | |
| | | | | | | | | |
| | | EXCHANGE TRADED FUNDS — 18.78% | | Shares | | | | |
| | | Funds, Trusts, and Other Financial Vehicles — 18.78% | | | | | | |
| CSJ | | iShares 1-3 Year Credit Bond ETF | | 34,100 | | | 3,603,688 | |
| MINT | | PIMCO Enhanced Short Maturity ETF | | 4,700 | | | 476,580 | |
| SCPB | | SPDR Barclays Short Term Corporate Bond ETF# | | 24,000 | | | 739,440 | |
| VCSH | | Vanguard Short-Term Corporate Bond ETF | | 10,000 | | | 803,700 | |
| | | TOTAL EXCHANGE TRADED FUNDS | | | | | | |
| | | (cost $5,614,159) | | | | | 5,623,408 | |
| | | | | | | | | |
| | | PURCHASED PUT OPTIONS — 0.21% | | Contractsd | | | | |
| | | Credit Intermediation and Related Activities — 0.16% | | | | | | |
| | | iPath S&P 500 VIX Short-Term Futures ETN* | | | | | | |
| VXX 150117P00025000 | | Expiration Date: January 2015, Exercise Price: $25.00 | | 20 | | | 5,770 | |
| VXX 160115P00020000 | | Expiration Date: January 2016, Exercise Price: $20.00 | | 55 | | | 21,313 | |
| VXX 160115P00025000 | | Expiration Date: January 2016, Exercise Price: $25.00 | | 30 | | | 20,400 | |
| | | | | | | | 47,483 | |
The accompanying notes are an integral part of these financial statements.
| KINETICS PORTFOLIOS TRUST — MASTER INVESTMENT PORTFOLIOS |
| The Alternative Income Portfolio |
Portfolio of Investments — June 30, 2014 (Unaudited) — (Continued) |
| Identifier | | | | Contractsd | | | Value | |
| | | Funds, Trusts, and Other Financial Vehicles — 0.05% | | | | | | |
| | | ProShares Ultra VIX Short-Term Futures ETF* | | | | | | |
| UVXY 160115P00015000 | | Expiration Date: January 2016, Exercise Price: $15.00 | | 21 | | $ | 14,857 | |
| | | TOTAL PURCHASED PUT OPTIONS | | | | | | |
| | | (cost $56,248) | | | | | 62,340 | |
| | | | | | | | | |
| | | | | Principal | | | | |
| | | SHORT-TERM INVESTMENTS — 8.64% | | Amount | | | | |
| | | Commercial Paper — 4.32% | | | | | | |
| 039715141 | | U.S. Bank N.A., 0.02%, 07/01/2014 | $ | 1,293,000 | | | 1,293,000 | |
| | | | | | | | | |
| | | | | Shares | | | | |
| | | Money Market Funds — 4.32% | | | | | | |
| FIGXX | | Fidelity Institutional Government Portfolio — | | | | | | |
| | | Class I, 0.01%b | | 1,293,000 | | | 1,293,000 | |
| | | TOTAL SHORT-TERM INVESTMENTS | | | | | | |
| | | (cost $2,586,000) | | | | | 2,586,000 | |
| | | TOTAL INVESTMENTS — 102.28% | | | | | | |
| | | (cost $30,573,645) | | | | $ | 30,626,174 | |
| Percentages are stated as a percent of net assets. |
| * — | Non-income producing security. |
| # — | All or a portion of the securities have been committed as collateral for written option contracts. |
| ■ — | Restricted security restricted to institutional investors (144a securities); the percentage of net assets comprised of 144a securities was 2.20%. |
| 1 — | The obligations of certain U.S. Government-Sponsored entities are neither issued nor guaranteed by the United States Treasury. |
| b — | The rate quoted is the annualized seven-day yield as of June 30, 2014. |
| d — | 100 shares per contract. |
| + — | Priced at amortized cost. |
| ETF — Exchange Traded Fund. |
| ETN — Exchange Traded Note. |
The accompanying notes are an integral part of these financial statements.
| KINETICS PORTFOLIOS TRUST — MASTER INVESTMENT PORTFOLIOS |
| The Multi-Disciplinary Portfolio |
Portfolio of Investments — June 30, 2014 (Unaudited) — (Continued) |
| | | | | Principal | | | | |
| Identifier | | CONVERTIBLE BONDS — 29.13% | | Amount | | | Value | |
| | | Administrative and Support Services — 4.93% | | | | | | |
| | | WebMD Health Corporation | | | | | | |
| 94770VAH5 | | 2.250%, 03/31/2016 | $ | 400,000 | | $ | 413,250 | |
| 94770VAF9 | | 2.500%, 01/31/2018# | | 4,875,000 | | | 5,149,219 | |
| | | | | | | | 5,562,469 | |
| | | Computer and Electronic Product Manufacturing — 0.44% | | | | | | |
| 747906AJ4 | | Quantum Corp. | | | | | | |
| | | 4.500%, 11/15/2017 | | 500,000 | | | 495,938 | |
| | | Mining (except Oil and Gas) — 5.13% | | | | | | |
| 250669AA6 | | Detour Gold Corporation | | | | | | |
| | | 5.500%, 11/30/2017 | | 1,000,000 | | | 962,500 | |
| B7W1RP3 | | Kirkland Lake Gold Inc. | | | | | | |
| | | 6.000%, 06/30/2017 | | CAD 350,000 | | | 242,725 | |
| 780287AA6 | | Royal Gold, Inc. | | | | | | |
| | | 2.875%, 06/15/2019 | | 4,264,000 | | | 4,591,795 | |
| | | | | | | | 5,797,020 | |
| | | Nonmetallic Mineral Product Manufacturing — 4.70% | | | | | | |
| 69073TAQ6 | | Owens-Brockway Glass Container | | | | | | |
| | | 3.000%, 06/01/2015, Acquired | | | | | | |
| | | 07/06/2011-03/15/2013 at $5,160,863^■ | . | 5,170,000 | | | 5,312,175 | |
| | | Oil and Gas Extraction — 4.76% | | | | | | |
| | | Chesapeake Energy Corporation | | | | | | |
| 165167BW6 | | 2.750%, 11/15/2035# | | 650,000 | | | 692,250 | |
| 165167CB1 | | 2.250%, 12/15/2038 | | 4,830,000 | | | 4,679,062 | |
| | | | | | | | 5,371,312 | |
| | | Performing Arts, Spectator Sports, and | | | | | | |
| | | Related Industries — 2.44% | | | | | | |
| 538034AB5 | | Live Nation Entertainment, Inc. | | | | | | |
| | | 2.875%, 07/15/2027# | | 2,763,000 | | | 2,761,273 | |
| | | Personal and Laundry Services — 1.16% | | | | | | |
| 758932AA5 | | Regis Corporation | | | | | | |
| | | 5.000%, 07/15/2014 | | 1,303,000 | | | 1,305,443 | |
| | | Real Estate — 0.45% | | | | | | |
| 345550AP2 | | Forest City Enterprises, Inc. | | | | | | |
| | | 4.250%, 08/15/2018 | | 446,000 | | | 505,653 | |
The accompanying notes are an integral part of these financial statements.
KINETICS PORTFOLIOS TRUST — MASTER INVESTMENT PORTFOLIOS The Multi-Disciplinary Portfolio Portfolio of Investments — June 30, 2014 (Unaudited) — (Continued) |
| | | | | Principal | | | | |
| Identifier | | | | Amount | | | Value | |
| | | Software Publishers — 4.22% | | | | | | |
| 285512AA7 | | Electronic Arts, Inc. | | | | | | |
| | | 0.750%, 07/15/2016 | $ | 3,750,000 | | $ | 4,760,156 | |
| | | Transportation Equipment Manufacturing — 0.90% | | | | | | |
| 63934EAL2 | | Navistar International Corp. | | | | | | |
| | | 3.000%, 10/15/2014^ | | 1,000,000 | | | 1,012,500 | |
| | | TOTAL CONVERTIBLE BONDS | | | | | | |
| | | (cost $30,386,137) | | | | | 32,883,939 | |
| | | | | | | | | |
| | | CORPORATE BONDS — 56.62% | | | | | | |
| | | Apparel Manufacturing — 2.51% | | | | | | |
| 532716AU1 | | L Brands, Inc. | | | | | | |
| | | 5.625%, 02/15/2022 | | 2,600,000 | | | 2,827,500 | |
| | | Beverage and Tobacco Product | | | | | | |
| | | Manufacturing — 0.09% | | | | | | |
| 21036PAL2 | | Constellation Brands, Inc. | | | | | | |
| | | 4.250%, 05/01/2023^ | | 100,000 | | | 100,625 | |
| | | Broadcasting (except Internet) — 2.85% | | | | | | |
| 1248EPAY9 | | CCO Holdings LLC/Capital Corporation | | | | | | |
| | | 5.250%, 09/30/2022 | | 2,150,000 | | | 2,190,312 | |
| | | Sirius XM Radio, Inc. | | | | | | |
| 82967NAN8 | | 5.750%, 08/01/2021, Acquired | | | | | | |
| | | 02/28/2014-03/20/2014 at $785,136^■ | | 750,000 | | | 791,250 | |
| 82967NAL2 | | 4.625%, 05/15/2023, Acquired 04/11/2014 | | | | | | |
| | | at $233,438^■ | | 250,000 | | | 240,000 | |
| | | | | | | | 3,221,562 | |
| | | Chemical Manufacturing — 3.42% | | | | | | |
| 044209AF1 | | Ashland Inc. | | | | | | |
| | | 4.750%, 08/15/2022^ | | 3,550,000 | | | 3,585,500 | |
| 345838AA4 | | Forest Laboratories, Inc. | | | | | | |
| | | 5.000%, 12/15/2021, Acquired 04/01/2014 | | | | | | |
| | | at $265,828■ | | 250,000 | | | 274,590 | |
| | | | | | | | 3,860,090 | |
| | | Computer and Electronic Product | | | | | | |
| | | Manufacturing — 0.66% | | | | | | |
| 436440AF8 | | Hologic, Inc. | | | | | | |
| | | 6.250%, 08/01/2020 | | 700,000 | | | 742,000 | |
The accompanying notes are an integral part of these financial statements.
KINETICS PORTFOLIOS TRUST — MASTER INVESTMENT PORTFOLIOS The Multi-Disciplinary Portfolio Portfolio of Investments — June 30, 2014 (Unaudited) — (Continued) |
| | | | | Principal | | | | |
| Identifier | | | | Amount | | | Value | |
| | | Construction of Buildings — 3.24% | | | | | | |
| 526057BN3 | | Lennar Corporation | | | | | | |
| | | 4.750%, 11/15/2022 | $ | 3,660,000 | | $ | 3,660,000 | |
| | | Credit Intermediation and Related Activities — 1.20% | | | | | | |
| 02005NAE0 | | Ally Financial, Inc. | | | | | | |
| | | 8.000%, 03/15/2020 | | 200,000 | | | 243,500 | |
| 852060AG7 | | Sprint Capital Corp. | | | | | | |
| | | 6.900%, 05/01/2019^ | | 1,000,000 | | | 1,107,500 | |
| | | | | | | | 1,351,000 | |
| | | Data Processing, Hosting and Related Services — 3.59% | | | | | | |
| | | Sungard Data Systems, Inc. | | | | | | |
| 867363AR4 | | 7.375%, 11/15/2018 | | 200,000 | | | 211,500 | |
| 867363AX1 | | 6.625%, 11/01/2019^ | | 3,637,000 | | | 3,846,128 | |
| | | | | | | | 4,057,628 | |
| | | E-Commerce — 3.28% | | | | | | |
| 44919PAC6 | | IAC/InterActiveCorp | | | | | | |
| | | 4.750%, 12/15/2022 | | 3,750,000 | | | 3,707,813 | |
| | | Electrical Equipment, Appliance, and Component | | | | | | |
| | | Manufacturing — 0.92% | | | | | | |
| 384313AD4 | | GrafTech International Ltd. | | | | | | |
| | | 6.375%, 11/15/2020 | | 1,000,000 | | | 1,035,000 | |
| | | Food Manufacturing — 3.93% | | | | | | |
| | | Post Holdings, Inc. | | | | | | |
| 737446AE4 | | 6.750%, 12/01/2021, Acquired 04/17/2014 | | | | | | |
| | | at $262,332■ | | 250,000 | | | 266,250 | |
| 737446AB0 | | 7.375%, 02/15/2022^ | | 3,850,000 | | | 4,172,438 | |
| | | | | | | | 4,438,688 | |
| | | Gaming — 3.31% | | | | | | |
| 552953CA7 | | MGM Resorts International | | | | | | |
| | | 6.625%, 12/15/2021 | | 250,000 | | | 278,438 | |
| 983130AT2 | | Wynn Las Vegas LLC | | | | | | |
| | | 5.375%, 03/15/2022^ | | 3,300,000 | | | 3,452,625 | |
| | | | | | | | 3,731,063 | |
The accompanying notes are an integral part of these financial statements.
KINETICS PORTFOLIOS TRUST — MASTER INVESTMENT PORTFOLIOS The Multi-Disciplinary Portfolio Portfolio of Investments — June 30, 2014 (Unaudited) — (Continued) |
| | | | | Principal | | | | |
| Identifier | | | | Amount | | | Value | |
| | | Holding Company — 1.87% | | | | | | |
| | | Icahn Enterprises | | | | | | |
| 451102AX5 | | 6.000%, 08/01/2020 | $ | 250,000 | | $ | 269,062 | |
| 451102BF3 | | 5.875%, 02/01/2022^ | | 1,750,000 | | | 1,841,875 | |
| | | | | | | | 2,110,937 | |
| | | Hospitals — 0.29% | | | | | | |
| 12543DAQ3 | | Community Health Systems, Inc. | | | | | | |
| | | 7.125%, 07/15/2020 | | 200,000 | | | 216,750 | |
| 40412CAB7 | | HCA Holdings, Inc. | | | | | | |
| | | 7.750%, 05/15/2021 | | 100,000 | | | 109,875 | |
| | | | | | | | 326,625 | |
| | | Lessors of Nonresidential Buildings | | | | | | |
| | | (except Miniwarehouses) — 3.33% | | | | | | |
| 44267DAA5 | | The Howard Hughes Corporation | | | | | | |
| | | 6.875%, 10/01/2021, Acquired | | | | | | |
| | | 03/05/2014-04/17/2014 at $3,787,064■ | | 3,500,000 | | | 3,762,500 | |
| | | Merchant Wholesalers, Durable Goods — 1.69% | | | | | | |
| | | HD Supply, Inc. | | | | | | |
| 40415RAF2 | | 8.125%, 04/15/2019^ | | 1,450,000 | | | 1,600,437 | |
| 40415RAK1 | | 11.500%, 07/15/2020 | | 250,000 | | | 301,250 | |
| | | | | | | | 1,901,687 | |
| | | Mining (except Oil and Gas) — 2.07% | | | | | | |
| 35671DAU9 | | Freeport-McMoRan Copper & Gold Inc. | | | | | | |
| | | 3.550%, 03/01/2022^ | | 1,100,000 | | | 1,091,142 | |
| | | Peabody Energy Corporation | | | | | | |
| 704549AK0 | | 6.000%, 11/15/2018^ | | 950,000 | | | 995,125 | |
| 704549AH7 | | 6.500%, 09/15/2020 | | 250,000 | | | 253,125 | |
| | | | | | | | 2,339,392 | |
| | | Motion Picture and Sound Recording | | | | | | |
| | | Industries — 1.19% | | | | | | |
| 26153CAA1 | | DreamWorks Animation SKG, Inc. | | | | | | |
| | | 6.875%, 08/15/2020, Acquired | | | | | | |
| | | 03/03/2014-03/25/2014 at $1,348,562■ | | 1,240,000 | | | 1,342,300 | |
| | | Motor Vehicle and Parts Dealers — 0.70% | | | | | | |
| 70959WAE3 | | Penske Automotive Group, Inc. | | | | | | |
| | | 5.750%, 10/01/2022 | | 750,000 | | | 793,125 | |
The accompanying notes are an integral part of these financial statements.
KINETICS PORTFOLIOS TRUST — MASTER INVESTMENT PORTFOLIOS The Multi-Disciplinary Portfolio Portfolio of Investments — June 30, 2014 (Unaudited) — (Continued) |
| | | | | Principal | | | | |
| Identifier | | | | Amount | | | Value | |
| | | Non-Store Retailers — 2.97% | | | | | | |
| 835898AF4 | | Sotheby’s | | | | | | |
| | | 5.250%, 10/01/2022, Acquired | | | | | | |
| | | 03/03/2014-04/03/2014 at $3,357,946#■ | $ | 3,426,000 | | $ | 3,348,915 | |
| | | Oil and Gas Extraction — 0.90% | | | | | | |
| 212015AH4 | | Continental Resources, Inc. | | | | | | |
| | | 5.000%, 09/15/2022 | | 100,000 | | | 108,875 | |
| 98212BAD5 | | WPX Energy Inc. | | | | | | |
| | | 6.000%, 01/15/2022 | | 850,000 | | | 911,625 | |
| | | | | | | | 1,020,500 | |
| | | Professional, Scientific, and Technical | | | | | | |
| | | Services — 0.22% | | | | | | |
| 65409QBA9 | | Nielsen Finance LLC | | | | | | |
| | | 4.500%, 10/01/2020 | | 250,000 | | | 253,125 | |
| | | Publishing Industries (except Internet) — 0.42% | | | | | | |
| 67020YAD2 | | Nuance Communications, Inc. | | | | | | |
| | | 5.375%, 08/15/2020, Acquired | | | | | | |
| | | 02/14/2014-03/27/2014 at $449,375■ | | 450,000 | | | 468,000 | |
| | | Rental and Leasing Services — 2.03% | | | | | | |
| 459745GF6 | | International Lease Finance Corp. | | | | | | |
| | | 8.250%, 12/15/2020 | | 1,850,000 | | | 2,289,375 | |
| | | Satellite Telecommunications — 3.62% | | | | | | |
| | | Dish DBS Corp. | | | | | | |
| 25470XAH8 | | 4.625%, 07/15/2017 | | 3,000,000 | | | 3,191,250 | |
| 25470XAB1 | | 7.875%, 09/01/2019 | | 100,000 | | | 119,000 | |
| 67054LAB3 | | Numericable Group SA | | | | | | |
| | | 6.000%, 05/15/2022, Acquired | | | | | | |
| | | 06/11/2014 at $263,099■ | | 750,000 | | | 780,937 | |
| | | | | | | | 4,091,187 | |
| | | Securities, Commodity Contracts, and Other Financial | | | | | | |
| | | Investments and Related Activities — 2.10% | | | | | | |
| 683797AB0 | | Oppenheimer Holdings, Inc. | | | | | | |
| | | 8.750%, 04/15/2018 | | 2,210,000 | | | 2,370,225 | |
| | | Telecommunications — 2.96% | | | | | | |
| 156700AS5 | | Centurylink, Inc. | | | | | | |
| | | 5.800%, 03/15/2022 | | 500,000 | | | 523,125 | |
The accompanying notes are an integral part of these financial statements.
KINETICS PORTFOLIOS TRUST — MASTER INVESTMENT PORTFOLIOS The Multi-Disciplinary Portfolio Portfolio of Investments — June 30, 2014 (Unaudited) — (Continued) |
| | | | | Principal | | | | |
| Identifier | | | | Amount | | | Value | |
| | | Telecommunications — 2.96% (Continued) | | | | | | |
| 228227BD5 | | Crown Castle International Corp. | | | | | | |
| | | 5.250%, 01/15/2023 | $ | 300,000 | | $ | 314,250 | |
| | | Hughes Satellite Systems Corp. | | | | | | |
| 444454AB8 | | 6.500%, 06/15/2019 | | 500,000 | | | 560,000 | |
| 444454AA0 | | 7.625%, 06/15/2021 | | 500,000 | | | 575,000 | |
| 83404DAA7 | | SoftBank Corp. | | | | | | |
| | | 4.500%, 04/15/2020, Acquired | | | | | | |
| | | 04/24/2014-04/28/2014 at $757,316■ | | 750,000 | | | 765,000 | |
| 852061AK6 | | Sprint Communications Inc. | | | | | | |
| | | 9.000%, 11/15/2018, Acquired 12/30/2013 | | | | | | |
| | | at $119,059^■ | | 100,000 | | | 121,500 | |
| 87264AAD7 | | T-Mobile USA, Inc. | | | | | | |
| | | 6.633%, 04/28/2021 | | 350,000 | | | 380,187 | |
| 55181WAA2 | | Virgin Media Secured Finance plc | | | | | | |
| | | 5.375%, 04/15/2021, Acquired 02/11/2014 | | | | | | |
| | | at $101,625^■ | | 100,000 | | | 105,500 | |
| | | | | | | | 3,344,562 | |
| | | Transportation Equipment Manufacturing — 1.16% | | | | | | |
| 63934EAM0 | | Navistar International Corp. | | | | | | |
| | | 8.250%, 11/01/2021^ | | 1,250,000 | | | 1,309,375 | |
| | | Utilities — 0.10% | | | | | | |
| 629377BN1 | | NRG Energy, Inc. | | | | | | |
| | | 7.625%, 01/15/2018 | | 100,000 | | | 115,250 | |
| | | TOTAL CORPORATE BONDS | | | | | | |
| | | (cost $63,087,801) | | | | | 63,920,049 | |
| | | | | | | | | |
| | | MUNICIPAL BONDS — 0.47% | | | | | | |
| | | Air Transportation — 0.47% | | | | | | |
| | | Branson Missouri Regional Airport Transportation | | | | | | |
| | | Development District | | | | | | |
| 105459AB7 | | 6.000%, 07/01/2025c+ | | 2,000,000 | | | 300,000 | |
| 105459AC5 | | 6.000%, 07/01/2037c+ | | 1,500,000 | | | 225,000 | |
| | | | | | | | 525,000 | |
| | | TOTAL MUNICIPAL BONDS | | | | | | |
| | | (cost $2,245,112) | | | | | 525,000 | |
The accompanying notes are an integral part of these financial statements.
KINETICS PORTFOLIOS TRUST — MASTER INVESTMENT PORTFOLIOS The Multi-Disciplinary Portfolio Portfolio of Investments — June 30, 2014 (Unaudited) — (Continued) |
| | | | | Principal | | | | |
| Identifier | | ESCROW NOTES — 0.09% | | Amount | | | Value | |
| | | Holding Company — 0.09% | | | | | | |
| 29ESCQ8A3 | | Energy Future Intermediate Holdings Co. LLC | $ | 1,000,000 | | $ | 97,500 | |
| | | TOTAL ESCROW NOTES | | | | | | |
| | | (Cost $38,520) | | | | | 97,500 | |
| | | EXCHANGE TRADED FUNDS — 1.20% | | Shares | | | | |
| | | Funds, Trusts, and Other Financial Vehicles — 1.20% | | | | | | |
| BOND | | PIMCO Total Return ETF^ | | 12,400 | | | 1,351,600 | |
| | | TOTAL EXCHANGE TRADED FUNDS | | | | | | |
| | | (cost $1,319,040) | | | | | 1,351,600 | |
| | | | | | | | | |
| | | EXCHANGE TRADED NOTES — 0.00% | | | | | | |
| | | Credit Intermediation and Related Activities — 0.00% | | | | | | |
| ZIV | | VelocityShares Daily Inverse VIX Medium | | | | | | |
| | | Term ETN* | | 100 | | | 4,651 | |
| | | TOTAL EXCHANGE TRADED NOTES | | | | | | |
| | | (cost $3,791) | | | | | 4,651 | |
| | | | | | | | | |
| | | MUTUAL FUNDS — 7.25% | | | | | | |
| | | Funds, Trusts, and Other Financial | | | | | | |
| | | Vehicles — 7.25% | | | | | | |
| ACG | | ACM Income Fund, Inc. | | 131,200 | | | 986,624 | |
| ACP | | Avenue Income Credit Strategies Fund | | 16,600 | | | 298,468 | |
| DSL | | DoubleLine Income Solutions Fund | | 27,400 | | | 615,404 | |
| DBL | | DoubleLine Opportunistic Credit Fund | | 18,900 | | | 446,985 | |
| TLI | | LMP Corporate Loan Fund Inc. | | 12,000 | | | 144,240 | |
| PCM | | PCM Fund Inc. | | 2,900 | | | 35,525 | |
| PCN | | PIMCO Corporate Income Fund | | 1,700 | | | 28,849 | |
| PCI | | PIMCO Dynamic Credit Income Fund | | 55,600 | | | 1,324,392 | |
| PDI | | PIMCO Dynamic Income Fund | | 70,500 | | | 2,403,345 | |
| PKO | | PIMCO Income Opportunity Fund | | 16,050 | | | 469,623 | |
| PFL | | PIMCO Income Strategy Fund | | 20,600 | | | 254,204 | |
| PFN | | PIMCO Income Strategy Fund II | | 20,100 | | | 222,306 | |
| SPE | | Special Opportunities Fund Inc. | | 28,200 | | | 470,940 | |
| DMO | | Western Asset Mortgage Defined | | | | | | |
| | | Opportunity Fund Inc. | | 19,500 | | | 479,700 | |
| WIW | | Western Asset/Claymore Inflation-Linked | | | | | | |
| | | Opportunities & Income Fund | | 200 | | | 2,462 | |
The accompanying notes are an integral part of these financial statements.
KINETICS PORTFOLIOS TRUST — MASTER INVESTMENT PORTFOLIOS The Multi-Disciplinary Portfolio Portfolio of Investments — June 30, 2014 (Unaudited) — (Continued) |
| Identifier | | | | Shares | | | Value | |
| | | Funds, Trusts, and Other Financial | | | | | | |
| | | Vehicles — 7.25% (Continued) | | | | | | |
| WIA | | Western Asset/Claymore Inflation-Linked | | | | | | |
| | | Securities & Income Fund | | 200 | | $ | 2,446 | |
| | | TOTAL MUTUAL FUNDS | | | | | | |
| | | (cost $7,838,008) | | | | | 8,185,513 | |
| | | | | | | | | |
| | | PURCHASED PUT OPTIONS — 1.42% | | Contractsd | | | | |
| | | Credit Intermediation and Related Activities — 0.25% | | | | | | |
| | | iPath S&P 500 VIX Short-Term Futures ETN* | | | | | | |
| VXX 150117P00025000 | | Expiration Date: January 2015, Exercise Price: $25.00 | | 2 | | | 577 | |
| VXX 160115P00015000 | | Expiration Date: January 2016, Exercise Price: $15.00 | | 4 | | | 660 | |
| VXX 160115P00020000 | | Expiration Date: January 2016, Exercise Price: $20.00 | | 536 | | | 207,700 | |
| VXX 160115P00025000 | | Expiration Date: January 2016, Exercise Price: $25.00 | | 114 | | | 77,520 | |
| | | | | | | | 286,457 | |
| | | Funds, Trusts, and Other Financial | | | | | | |
| | | Vehicles — 1.17% | | | | | | |
| | | ProShares Ultra VIX Short-Term Futures ETF* | | | | | | |
| UVXY2 150117P00010000 | | Expiration Date: January 2015, Exercise Price: $10.00 | | 18 | | | 9,045 | |
| UVXY2 150117P00011000 | | Expiration Date: January 2015, Exercise Price: $11.00 | | 12 | | | 7,080 | |
| UVXY1 150117P00012000 | | Expiration Date: January 2015, Exercise Price: $12.00 | | 6 | | | 6,570 | |
| UVXY2 150117P00012000 | | Expiration Date: January 2015, Exercise Price: $12.00 | | 78 | | | 52,650 | |
| UVXY2 150117P00014000 | | Expiration Date: January 2015, Exercise Price: $14.00 | | 4 | | | 3,410 | |
| UVXY2 150117P00015000 | | Expiration Date: January 2015, Exercise Price: $15.00 | | 4 | | | 3,770 | |
| UVXY2 150117P00016000 | | Expiration Date: January 2015, Exercise Price: $16.00 | | 18 | | | 18,585 | |
| UVXY2 160115P00008000 | | Expiration Date: January 2016, Exercise Price: $8.00 | | 60 | | | 30,300 | |
| UVXY2 160115P00009000 | | Expiration Date: January 2016, Exercise Price: $9.00 | | 214 | | | 126,795 | |
| UVXY2 160115P00010000 | | Expiration Date: January 2016, Exercise Price: $10.00 | | 26 | | | 17,550 | |
| UVXY 160115P00015000 | | Expiration Date: January 2016, Exercise Price: $15.00 | | 705 | | | 498,787 | |
| UVXY 160115P00020000 | | Expiration Date: January 2016, Exercise Price: $20.00 | | 510 | | | 548,250 | |
| | | | | | | | 1,322,792 | |
| | | TOTAL PURCHASED PUT OPTIONS | | | | | | |
| | | (cost $1,395,269) | | | | | 1,609,249 | |
The accompanying notes are an integral part of these financial statements.
KINETICS PORTFOLIOS TRUST — MASTER INVESTMENT PORTFOLIOS The Multi-Disciplinary Portfolio Portfolio of Investments — June 30, 2014 (Unaudited) — (Continued) |
| | | | | Principal | | | | |
| Identifier | | SHORT-TERM INVESTMENTS — 5.36% | | Amount | | | Value | |
| | | Commercial Paper — 3.91% | | | | | | |
| 039715141 | | U.S. Bank N.A., 0.02%, 07/01/2014 | $ | 4,414,000 | | | 4,414,000 | |
| | | | | Shares | | | | |
| | | Money Market Funds — 1.45% | | | | | | |
| FIGXX | | Fidelity Institutional Government | | | | | | |
| | | Portfolio — Class I, 0.01%b | | 1,642,442 | | | 1,642,442 | |
| | | TOTAL SHORT-TERM INVESTMENTS | | | | | | |
| | | (cost $6,056,442) | | | | | 6,056,442 | |
| | | INVESTMENTS PURCHASED WITH | | | | | | |
| | | THE CASH PROCEEDS FROM | | | | | | |
| | | SECURITIES LENDING — 22.21% | | | | | | |
| | | Money Market Funds — 22.21% | | | | | | |
| | | Mount Vernon Securities Lending Trust — | | | | | | |
| | | Prime Portfolio, 0.18%b | | 25,078,937 | | | 25,078,937 | |
| | | TOTAL INVESTMENTS PURCHASED WITH THE | | | | | | |
| | | CASH PROCEEDS FROM SECURITIES LENDING | | | | | | |
| | | (cost $25,078,937) | | | | | 25,078,937 | |
| | | TOTAL INVESTMENTS — 123.75% | | | | | | |
| | | (cost $137,449,056) | | | | $ | 139,712,880 | |
| Percentages are stated as a percent of net assets. |
| * — | Non-income producing security. |
| ^ — | This security or a portion of this security was out on loan at June 30, 2014. Total loaned securities had a market value of $24,410,710 at June 30, 2014. |
| # — | All or a portion of the shares have been committed as collateral for written option contracts. |
■ — | Restricted security restricted to institutional investors (144a securities); the percentage of net assets comprised of 144a securities was 15.57%. |
c — | The security missed January 1, 2012 interest payment and has ceased to accrue income. A forbearance agreement is currently in place. |
| + — | Security is considered illiquid. The aggregate value of such securities is $525,000 or 0.47% of net assets. |
b — | The rate quoted is the annualized seven-day yield as of June 30, 2014. |
d — | 100 shares per contract. |
| CAD — Canadian Dollars. |
| ETF — Exchange Traded Fund. |
| ETN — Exchange Traded Note. |
The accompanying notes are an integral part of these financial statements.
KINETICS PORTFOLIOS TRUST — MASTER INVESTMENT PORTFOLIOS The Alternative Income Portfolio Portfolio of Options Written — June 30, 2014 (Unaudited) |
| Identifier | | PUT OPTIONS WRITTEN | | Contractsd | | | Value | |
| | | Accommodation | | | | | | |
| | | Carnival Corporation | | | | | | |
| CCL 150117P00024500 | | Expiration: January 2015, Exercise Price: $24.50 | | 33 | | $ | 412 | |
| CCL 150117P00029500 | | Expiration: January 2015, Exercise Price: $29.50 | | 9 | | | 360 | |
| CCL 160115P00028000 | | Expiration: January 2016, Exercise Price: $28.00 | | 29 | | | 3,625 | |
| CCL 160115P00030000 | | Expiration: January 2016, Exercise Price: $30.00 | | 3 | | | 518 | |
| | | Marriott International Inc. — Class A | | | | | | |
| MAR 160115P00033000 | | Expiration: January 2016, Exercise Price: $33.00 | | 35 | | | 1,138 | |
| MAR 160115P00035000 | | Expiration: January 2016, Exercise Price: $35.00 | | 8 | | | 320 | |
| MAR 160115P00045000 | | Expiration: January 2016, Exercise Price: $45.00 | | 2 | | | 250 | |
| | | Starwood Hotels & Resorts Worldwide, Inc. | | | | | | |
| HOT 150117P00053700 | | Expiration: January 2015, Exercise Price: $53.70 | | 1 | | | 27 | |
| HOT 160115P00053700 | | Expiration: January 2016, Exercise Price: $53.70 | | 4 | | | 684 | |
| HOT 160115P00056200 | | Expiration: January 2016, Exercise Price: $56.20 | | 10 | | | 2,080 | |
| HOT 160115P00058700 | | Expiration: January 2016, Exercise Price: $58.70 | | 1 | | | 255 | |
| | | | | | | | 9,669 | |
| | | Administrative and Support Services | | | | | | |
| | | Accenture plc — Class A | | | | | | |
| ACN 150117P00065000 | | Expiration: January 2015, Exercise Price: $65.00 | | 5 | | | 412 | |
| ACN 160115P00060000 | | Expiration: January 2016, Exercise Price: $60.00 | | 7 | | | 1,575 | |
| | | Expedia, Inc. | | | | | | |
| EXPE 141018P00050000 | | Expiration: October 2014, Exercise Price: $50.00 | | 3 | | | 53 | |
| EXPE 141018P00055000 | | Expiration: October 2014, Exercise Price: $55.00 | | 2 | | | 70 | |
| EXPE 150117P00044480 | | Expiration: January 2015, Exercise Price: $44.48 | | 4 | | | 120 | |
| EXPE 150117P00049480 | | Expiration: January 2015, Exercise Price: $49.48 | | 6 | | | 330 | |
| EXPE 150117P00054480 | | Expiration: January 2015, Exercise Price: $54.48 | | 4 | | | 390 | |
| EXPE 150117P00059480 | | Expiration: January 2015, Exercise Price: $59.48 | | 12 | | | 1,980 | |
| EXPE 160115P00040000 | | Expiration: January 2016, Exercise Price: $40.00 | | 3 | | | 435 | |
| EXPE 160115P00050000 | | Expiration: January 2016, Exercise Price: $50.00 | | 10 | | | 3,075 | |
| EXPE 160115P00055000 | | Expiration: January 2016, Exercise Price: $55.00 | | 1 | | | 435 | |
| | | | | | | | 8,875 | |
| | | Ambulatory Health Care Services | | | | | | |
| | | DaVita HealthCare Partners Inc. | | | | | | |
| DVA 160115P00050000 | | Expiration: January 2016, Exercise Price: $50.00 | | 11 | | | 990 | |
| DVA 160115P00055000 | | Expiration: January 2016, Exercise Price: $55.00 | | 1 | | | 148 | |
| | | | | | | | 1,138 | |
The accompanying notes are an integral part of these financial statements.
KINETICS PORTFOLIOS TRUST — MASTER INVESTMENT PORTFOLIOS The Alternative Income Portfolio Portfolio of Options Written — June 30, 2014 (Unaudited) — (Continued) |
| Identifier | | | | Contractsd | | | Value | |
| | | Apparel Manufacturing | | | | | | |
| | | L Brands, Inc. | | | | | | |
| LB 141122P00045000 | | Expiration: November 2014, Exercise Price: $45.00 | | 3 | | | $ 97 | |
| LB 150117P00039000 | | Expiration: January 2015, Exercise Price: $39.00 | | 11 | | | 247 | |
| LB 150117P00043000 | | Expiration: January 2015, Exercise Price: $43.00 | | 9 | | | 383 | |
| LB 150117P00046000 | | Expiration: January 2015, Exercise Price: $46.00 | | 5 | | | 338 | |
| LB 160115P00039000 | | Expiration: January 2016, Exercise Price: $39.00 | | 10 | | | 1,250 | |
| LB 160115P00040000 | | Expiration: January 2016, Exercise Price: $40.00 | | 3 | | | 420 | |
| LB 160115P00041500 | | Expiration: January 2016, Exercise Price: $41.50 | | 2 | | | 320 | |
| | | | | | | | 3,055 | |
| | | Asset Management | | | | | | |
| | | Affiliated Managers Group, Inc. | | | | | | |
| AMG 141220P00140000 | | Expiration: December 2014, Exercise Price: $140.00 | | 1 | | | 135 | |
| AMG 141220P00145000 | | Expiration: December 2014, Exercise Price: $145.00 | | 1 | | | 162 | |
| | | BlackRock, Inc. | | | | | | |
| BLK 160115P00210000 | | Expiration: January 2016, Exercise Price: $210.00 | | 8 | | | 4,840 | |
| BLK 160115P00220000 | | Expiration: January 2016, Exercise Price: $220.00 | | 1 | | | 710 | |
| BLK 160115P00230000 | | Expiration: January 2016, Exercise Price: $230.00 | | 4 | | | 3,520 | |
| | | The Blackstone Group LP | | | | | | |
| BX 141220P00024000 | | Expiration: December 2014, Exercise Price: $24.00 | | 6 | | | 150 | |
| BX 150117P00017000 | | Expiration: January 2015, Exercise Price: $17.00 | | 40 | | | 300 | |
| BX 150117P00022000 | | Expiration: January 2015, Exercise Price: $22.00 | | 16 | | | 312 | |
| BX 160115P00020000 | | Expiration: January 2016, Exercise Price: $20.00 | | 5 | | | 420 | |
| BX 160115P00023000 | | Expiration: January 2016, Exercise Price: $23.00 | | 39 | | | 5,265 | |
| | | Franklin Resources, Inc. | | | | | | |
| BEN 150117P00040000 | | Expiration: January 2015, Exercise Price: $40.00 | | 1 | | | 30 | |
| BEN 160115P00040000 | | Expiration: January 2016, Exercise Price: $40.00 | | 42 | | | 5,460 | |
| | | KKR & Co. LP | | | | | | |
| KKR 150117P00013000 | | Expiration: January 2015, Exercise Price: $13.00 | | 50 | | | 500 | |
| KKR 160115P00015000 | | Expiration: January 2016, Exercise Price: $15.00 | | 22 | | | 1,375 | |
| | | Legg Mason, Inc. | | | | | | |
| LM 141122P00034000 | | Expiration: November 2014, Exercise Price: $34.00 | | 10 | | | 175 | |
| | | | | | | | 23,354 | |
The accompanying notes are an integral part of these financial statements.
KINETICS PORTFOLIOS TRUST — MASTER INVESTMENT PORTFOLIOS The Alternative Income Portfolio Portfolio of Options Written — June 30, 2014 (Unaudited) — (Continued)] |
| Identifier | | | | Contractsd | | | Value | |
| | | Beverage and Tobacco Product Manufacturing | | | | | | |
| | | Anheuser-Busch InBev NV — ADR | | | | | | |
| BUD 160115P00090000 | | Expiration: January 2016, Exercise Price: $90.00 | | 2 | | $ | 595 | |
| | | Constellation Brands, Inc. — Class A | | | | | | |
| STZ 150117P00042500 | | Expiration: January 2015, Exercise Price: $42.50 | | 8 | | | 100 | |
| STZ 150117P00055000 | | Expiration: January 2015, Exercise Price: $55.00 | | 2 | | | 40 | |
| STZ 160115P00045000 | | Expiration: January 2016, Exercise Price: $45.00 | | 9 | | | 405 | |
| STZ 160115P00052500 | | Expiration: January 2016, Exercise Price: $52.50 | | 3 | | | 270 | |
| STZ 160115P00057500 | | Expiration: January 2016, Exercise Price: $57.50 | | 3 | | | 405 | |
| STZ 160115P00060000 | | Expiration: January 2016, Exercise Price: $60.00 | | 7 | | | 1,137 | |
| STZ 160115P00062500 | | Expiration: January 2016, Exercise Price: $62.50 | | 2 | | | 400 | |
| | | The Coca-Cola Company | | | | | | |
| KO 150117P00030000 | | Expiration: January 2015, Exercise Price: $30.00 | | 18 | | | 153 | |
| KO 150117P00032500 | | Expiration: January 2015, Exercise Price: $32.50 | | 5 | | | 57 | |
| KO 150117P00035000 | | Expiration: January 2015, Exercise Price: $35.00 | | 8 | | | 184 | |
| KO 160115P00033000 | | Expiration: January 2016, Exercise Price: $33.00 | | 7 | | | 567 | |
| | | Lorillard, Inc. | | | | | | |
| LO 150117P00036670 | | Expiration: January 2015, Exercise Price: $36.67 | | 28 | | | 420 | |
| LO 150117P00045000 | | Expiration: January 2015, Exercise Price: $45.00 | | 2 | | | 129 | |
| LO 160115P00037500 | | Expiration: January 2016, Exercise Price: $37.50 | | 11 | | | 1,243 | |
| | | Molson Coors Brewing Company — Class B | | | | | | |
| TAP 150117P00045000 | | Expiration: January 2015, Exercise Price: $45.00 | | 22 | | | 385 | |
| TAP 160115P00037500 | | Expiration: January 2016, Exercise Price: $37.50 | | 2 | | | 70 | |
| TAP 160115P00040000 | | Expiration: January 2016, Exercise Price: $40.00 | | 14 | | | 665 | |
| TAP 160115P00042500 | | Expiration: January 2016, Exercise Price: $42.50 | | 6 | | | 360 | |
| TAP 160115P00045000 | | Expiration: January 2016, Exercise Price: $45.00 | | 5 | | | 425 | |
| TAP 160115P00047500 | | Expiration: January 2016, Exercise Price: $47.50 | | 3 | | | 308 | |
| | | Philip Morris International, Inc. | | | | | | |
| PM 150117P00075000 | | Expiration: January 2015, Exercise Price: $75.00 | | 5 | | | 700 | |
| | | | | | | | 9,018 | |
| | | Broadcasting (except Internet) | | | | | | |
| | | CBS Corporation — Class B | | | | | | |
| CBS 141220P00040000 | | Expiration: December 2014, Exercise Price: $40.00 | | 2 | | | 25 | |
| CBS 141220P00042500 | | Expiration: December 2014, Exercise Price: $42.50 | | 3 | | | 67 | |
| CBS 150117P00037000 | | Expiration: January 2015, Exercise Price: $37.00 | | 12 | | | 120 | |
| CBS 150117P00040000 | | Expiration: January 2015, Exercise Price: $40.00 | | 4 | | | 70 | |
| CBS 150117P00042000 | | Expiration: January 2015, Exercise Price: $42.00 | | 2 | | | 70 | |
| CBS 150117P00045000 | | Expiration: January 2015, Exercise Price: $45.00 | | 8 | | | 400 | |
| CBS 150117P00047000 | | Expiration: January 2015, Exercise Price: $47.00 | | 2 | | | 140 | |
The accompanying notes are an integral part of these financial statements.
KINETICS PORTFOLIOS TRUST — MASTER INVESTMENT PORTFOLIOS The Alternative Income Portfolio Portfolio of Options Written — June 30, 2014 (Unaudited) — (Continued) |
| Identifier | | | | Contractsd | | | Value | |
| | | Broadcasting (except Internet) — (Continued) | | | | | | |
| | | Comcast Corporation — Class A | | | | | | |
| CMCSA 150117P00037000 | | Expiration: January 2015, Exercise Price: $37.00 | | 15 | | $ | 262 | |
| CMCSA 150117P00040000 | | Expiration: January 2015, Exercise Price: $40.00 | | 6 | | | 165 | |
| CMCSA 160115P00035000 | | Expiration: January 2016, Exercise Price: $35.00 | | 6 | | | 399 | |
| CMCSA 160115P00038000 | | Expiration: January 2016, Exercise Price: $38.00 | | 10 | | | 975 | |
| CMCSA 160115P00040000 | | Expiration: January 2016, Exercise Price: $40.00 | | 8 | | | 1,004 | |
| | | Sirius XM Holdings Inc. | | | | | | |
| SIRI 160115P00002500 | | Expiration: January 2016, Exercise Price: $2.50 | | 160 | | | 2,080 | |
| | | Time Warner Inc. | | | | | | |
| TWX1 160115P00045000 | | Expiration: January 2016, Exercise Price: $45.00 | | 4 | | | 384 | |
| TWX1 160115P00050000 | | Expiration: January 2016, Exercise Price: $50.00 | | 5 | | | 740 | |
| | | Twenty-First Century Fox, Inc. — Class A | | | | | | |
| FOXA 150117P00025000 | | Expiration: January 2015, Exercise Price: $25.00 | | 28 | | | 560 | |
| FOXA 150117P00027000 | | Expiration: January 2015, Exercise Price: $27.00 | | 15 | | | 525 | |
| FOXA 160115P00023000 | | Expiration: January 2016, Exercise Price: $23.00 | | 14 | | | 910 | |
| FOXA 160115P00025000 | | Expiration: January 2016, Exercise Price: $25.00 | | 25 | | | 2,375 | |
| | | The Walt Disney Company | | | | | | |
| DIS 160115P00050000 | | Expiration: January 2016, Exercise Price: $50.00 | | 8 | | | 676 | |
| DIS 160115P00055000 | | Expiration: January 2016, Exercise Price: $55.00 | | 16 | | | 1,952 | |
| DIS 160115P00060000 | | Expiration: January 2016, Exercise Price: $60.00 | | 4 | | | 740 | |
| DIS 160115P00062500 | | Expiration: January 2016, Exercise Price: $62.50 | | 1 | | | 219 | |
| | | | | | | | 14,858 | |
| | | Building Equipment Contractors | | | | | | |
| | | Honeywell International Inc. | | | | | | |
| HON 150117P00065000 | | Expiration: January 2015, Exercise Price: $65.00 | | 1 | | | 31 | |
| HON 160115P00065000 | | Expiration: January 2016, Exercise Price: $65.00 | | 7 | | | 1,155 | |
| HON 160115P00070000 | | Expiration: January 2016, Exercise Price: $70.00 | | 1 | | | 236 | |
| | | | | | | | 1,422 | |
| | | Building Material and Garden Equipment and Supplies Dealers | | | | | | |
| | | Fastenal Company | | | | | | |
| FAST 150117P00032500 | | Expiration: January 2015, Exercise Price: $32.50 | | 31 | | | 542 | |
| FAST 150117P00034500 | | Expiration: January 2015, Exercise Price: $34.50 | | 13 | | | 325 | |
| FAST 150117P00037500 | | Expiration: January 2015, Exercise Price: $37.50 | | 7 | | | 332 | |
| FAST 160115P00033000 | | Expiration: January 2016, Exercise Price: $33.00 | | 15 | | | 1,800 | |
| FAST 160115P00035000 | | Expiration: January 2016, Exercise Price: $35.00 | | 3 | | | 458 | |
| FAST 160115P00038000 | | Expiration: January 2016, Exercise Price: $38.00 | | 2 | | | 440 | |
The accompanying notes are an integral part of these financial statements.
KINETICS PORTFOLIOS TRUST — MASTER INVESTMENT PORTFOLIOS The Alternative Income Portfolio Portfolio of Options Written — June 30, 2014 (Unaudited) — (Continued) |
| Identifier | | | | Contractsd | | | Value | |
| | | Building Material and Garden Equipment and | | | | | | |
| | | Supplies Dealers — (Continued) | | | | | | |
| | | The Home Depot, Inc. | | | | | | |
| HD 150117P00060000 | | Expiration: January 2015, Exercise Price: $60.00 | | 1 | | | $ 37 | |
| HD 150117P00065000 | | Expiration: January 2015, Exercise Price: $65.00 | | 10 | | | 625 | |
| | | Lowe’s Companies, Inc. | | | | | | |
| LOW 150117P00035000 | | Expiration: January 2015, Exercise Price: $35.00 | | 10 | | | 300 | |
| LOW 150117P00037000 | | Expiration: January 2015, Exercise Price: $37.00 | | 9 | | | 378 | |
| LOW 150117P00040000 | | Expiration: January 2015, Exercise Price: $40.00 | | 5 | | | 373 | |
| LOW 160115P00035000 | | Expiration: January 2016, Exercise Price: $35.00 | | 31 | | | 4,371 | |
| | | The Sherwin-Williams Company | | | | | | |
| SHW 150117P00130000 | | Expiration: January 2015, Exercise Price: $130.00 | | 4 | | | 140 | |
| SHW 150117P00135000 | | Expiration: January 2015, Exercise Price: $135.00 | | 4 | | | 180 | |
| SHW 150117P00150000 | | Expiration: January 2015, Exercise Price: $150.00 | | 2 | | | 170 | |
| SHW 160115P00140000 | | Expiration: January 2016, Exercise Price: $140.00 | | 2 | | | 800 | |
| SHW 160115P00150000 | | Expiration: January 2016, Exercise Price: $150.00 | | 2 | | | 1,100 | |
| | | | | | | | 12,371 | |
| | | Chemical Manufacturing | | | | | | |
| | | Celgene Corporation | | | | | | |
| CELG 141018P00052500 | | Expiration: October 2014, Exercise Price: $52.50 | | 2 | | | 27 | |
| CELG 150117P00050000 | | Expiration: January 2015, Exercise Price: $50.00 | | 12 | | | 300 | |
| CELG 150117P00055000 | | Expiration: January 2015, Exercise Price: $55.00 | | 6 | | | 204 | |
| CELG 150117P00057500 | | Expiration: January 2015, Exercise Price: $57.50 | | 10 | | | 420 | |
| CELG 150117P00060000 | | Expiration: January 2015, Exercise Price: $60.00 | | 2 | | | 110 | |
| CELG 160115P00050000 | | Expiration: January 2016, Exercise Price: $50.00 | | 4 | | | 460 | |
| CELG 160115P00055000 | | Expiration: January 2016, Exercise Price: $55.00 | | 12 | | | 2,148 | |
| CELG 160115P00060000 | | Expiration: January 2016, Exercise Price: $60.00 | | 4 | | | 1,042 | |
| | | CF Industries Holdings, Inc. | | | | | | |
| CF 150117P00170000 | | Expiration: January 2015, Exercise Price: $170.00 | | 1 | | | 150 | |
| CF 160115P00175000 | | Expiration: January 2016, Exercise Price: $175.00 | | 1 | | | 960 | |
| CF 160115P00180000 | | Expiration: January 2016, Exercise Price: $180.00 | | 3 | | | 3,255 | |
| CF 160115P00185000 | | Expiration: January 2016, Exercise Price: $185.00 | | 1 | | | 1,225 | |
The accompanying notes are an integral part of these financial statements.
KINETICS PORTFOLIOS TRUST — MASTER INVESTMENT PORTFOLIOS The Alternative Income Portfolio Portfolio of Options Written — June 30, 2014 (Unaudited) — (Continued) |
| Identifier | | | | Contractsd | | | Value | |
| | | Chemical Manufacturing — (Continued) | | | | | | |
| | | The Dow Chemical Company | | | | | | |
| DOW 141220P00037000 | | Expiration: December 2014, Exercise Price: $37.00 | | 4 | | $ | 108 | |
| DOW 150117P00027000 | | Expiration: January 2015, Exercise Price: $27.00 | | 12 | | | 96 | |
| DOW 150117P00030000 | | Expiration: January 2015, Exercise Price: $30.00 | | 1 | | | 13 | |
| DOW 150117P00032000 | | Expiration: January 2015, Exercise Price: $32.00 | | 12 | | | 216 | |
| DOW 160115P00028000 | | Expiration: January 2016, Exercise Price: $28.00 | | 8 | | | 420 | |
| DOW 160115P00030000 | | Expiration: January 2016, Exercise Price: $30.00 | | 20 | | | 1,340 | |
| DOW 160115P00033000 | | Expiration: January 2016, Exercise Price: $33.00 | | 6 | | | 588 | |
| DOW 160115P00035000 | | Expiration: January 2016, Exercise Price: $35.00 | | 2 | | | 248 | |
| DOW 160115P00037000 | | Expiration: January 2016, Exercise Price: $37.00 | | 19 | | | 2,993 | |
| | | E.I. du Pont de Nemours and Company | | | | | | |
| DD 150117P00045000 | | Expiration: January 2015, Exercise Price: $45.00 | | 10 | | | 175 | |
| DD 160115P00045000 | | Expiration: January 2016, Exercise Price: $45.00 | | 18 | | | 1,710 | |
| | | Eastman Chemical Company | | | | | | |
| EMN 150117P00055000 | | Expiration: January 2015, Exercise Price: $55.00 | | 3 | | | 60 | |
| EMN 150117P00057500 | | Expiration: January 2015, Exercise Price: $57.50 | | 10 | | | 300 | |
| EMN 160115P00055000 | | Expiration: January 2016, Exercise Price: $55.00 | | 1 | | | 142 | |
| EMN 160115P00060000 | | Expiration: January 2016, Exercise Price: $60.00 | | 12 | | | 2,430 | |
| EMN 160115P00065000 | | Expiration: January 2016, Exercise Price: $65.00 | | 3 | | | 855 | |
| | | LyondellBasell Industries NV — Class A | | | | | | |
| LYB 150117P00057250 | | Expiration: January 2015, Exercise Price: $57.25 | | 3 | | | 45 | |
| LYB 160115P00060000 | | Expiration: January 2016, Exercise Price: $60.00 | | 2 | | | 240 | |
| LYB 160115P00067500 | | Expiration: January 2016, Exercise Price: $67.50 | | 2 | | | 365 | |
| | | Monsanto Company | | | | | | |
| MON 150117P00075000 | | Expiration: January 2015, Exercise Price: $75.00 | | 10 | | | 175 | |
| MON 150117P00082500 | | Expiration: January 2015, Exercise Price: $82.50 | | 5 | | | 132 | |
| MON 160115P00075000 | | Expiration: January 2016, Exercise Price: $75.00 | | 2 | | | 220 | |
| MON 160115P00080000 | | Expiration: January 2016, Exercise Price: $80.00 | | 4 | | | 578 | |
| MON 160115P00085000 | | Expiration: January 2016, Exercise Price: $85.00 | | 5 | | | 950 | |
| MON 160115P00090000 | | Expiration: January 2016, Exercise Price: $90.00 | | 1 | | | 246 | |
| | | The Mosaic Company | | | | | | |
| MOS 150117P00032500 | | Expiration: January 2015, Exercise Price: $32.50 | | 3 | | | 30 | |
| MOS 150117P00035000 | | Expiration: January 2015, Exercise Price: $35.00 | | 34 | | | 510 | |
| MOS 160115P00035000 | | Expiration: January 2016, Exercise Price: $35.00 | | 15 | | | 1,455 | |
The accompanying notes are an integral part of these financial statements.
KINETICS PORTFOLIOS TRUST — MASTER INVESTMENT PORTFOLIOS The Alternative Income Portfolio Portfolio of Options Written — June 30, 2014 (Unaudited) — (Continued) |
| Identifier | | | | Contractsd | | | Value | |
| | | Chemical Manufacturing — (Continued) | | | | | | |
| | | Mylan Inc. | | | | | | |
| MYL 141018P00037000 | | Expiration: October 2014, Exercise Price: $37.00 | | 4 | | $ | 102 | |
| MYL 150117P00032000 | | Expiration: January 2015, Exercise Price: $32.00 | | 3 | | | 74 | |
| MYL 150117P00035000 | | Expiration: January 2015, Exercise Price: $35.00 | | 28 | | | 1,120 | |
| MYL 150117P00036000 | | Expiration: January 2015, Exercise Price: $36.00 | | 2 | | | 92 | |
| MYL 150117P00037000 | | Expiration: January 2015, Exercise Price: $37.00 | | 4 | | | 218 | |
| MYL 160115P00035000 | | Expiration: January 2016, Exercise Price: $35.00 | | 2 | | | 304 | |
| MYL 160115P00037000 | | Expiration: January 2016, Exercise Price: $37.00 | | 2 | | | 384 | |
| | | OPKO Health, Inc. | | | | | | |
| OPK 150117P00003000 | | Expiration: January 2015, Exercise Price: $3.00 | | 66 | | | 330 | |
| OPK 160115P00003000 | | Expiration: January 2016, Exercise Price: $3.00 | | 66 | | | 1,980 | |
| | | Teva Pharmaceutical Industries Ltd. — ADR | | | | | | |
| TEVA 150117P00032500 | | Expiration: January 2015, Exercise Price: $32.50 | | 21 | | | 199 | |
| TEVA 150117P00037500 | | Expiration: January 2015, Exercise Price: $37.50 | | 4 | | | 108 | |
| TEVA 160115P00030000 | | Expiration: January 2016, Exercise Price: $30.00 | | 35 | | | 1,418 | |
| TEVA 160115P00032500 | | Expiration: January 2016, Exercise Price: $32.50 | | 6 | | | 366 | |
| TEVA 160115P00037500 | | Expiration: January 2016, Exercise Price: $37.50 | | 6 | | | 783 | |
| | | | | | | | 34,419 | |
| | | Clothing and Clothing Accessories Stores | | | | | | |
| | | The Estee Lauder Companies Inc. — Class A | | | | | | |
| EL 160115P00050000 | | Expiration: January 2016, Exercise Price: $50.00 | | 2 | | | 230 | |
| | | The Gap, Inc. | | | | | | |
| GPS 150117P00028000 | | Expiration: January 2015, Exercise Price: $28.00 | | 9 | | | 121 | |
| GPS 150117P00030000 | | Expiration: January 2015, Exercise Price: $30.00 | | 5 | | | 115 | |
| GPS 160115P00028000 | | Expiration: January 2016, Exercise Price: $28.00 | | 17 | | | 1,573 | |
| GPS 160115P00030000 | | Expiration: January 2016, Exercise Price: $30.00 | | 20 | | | 2,420 | |
| | | Nordstrom, Inc. | | | | | | |
| JWN 150117P00045000 | | Expiration: January 2015, Exercise Price: $45.00 | | 16 | | | 264 | |
| JWN 160115P00045000 | | Expiration: January 2016, Exercise Price: $45.00 | | 4 | | | 456 | |
| | | Tiffany & Co. | | | | | | |
| TIF 150117P00060000 | | Expiration: January 2015, Exercise Price: $60.00 | | 4 | | | 82 | |
| TIF 160115P00055000 | | Expiration: January 2016, Exercise Price: $55.00 | | 11 | | | 1,028 | |
| TIF 160115P00060000 | | Expiration: January 2016, Exercise Price: $60.00 | | 1 | | | 135 | |
| TIF 160115P00065000 | | Expiration: January 2016, Exercise Price: $65.00 | | 1 | | | 191 | |
| TIF 160115P00067500 | | Expiration: January 2016, Exercise Price: $67.50 | | 7 | | | 1,593 | |
| TIF 160115P00072500 | | Expiration: January 2016, Exercise Price: $72.50 | | 1 | | | 313 | |
| | | | | | | | 8,521 | |
The accompanying notes are an integral part of these financial statements.
KINETICS PORTFOLIOS TRUST — MASTER INVESTMENT PORTFOLIOS The Alternative Income Portfolio Portfolio of Options Written — June 30, 2014 (Unaudited) — (Continued) |
| Identifier | | | | Contractsd | | | Value | |
| | | Computer and Electronic Product Manufacturing | | | | | | |
| | | Agilent Technologies, Inc. | | | | | | |
| A 150117P00035000 | | Expiration: January 2015, Exercise Price: $35.00 | | 19 | | $ | 342 | |
| A 150117P00040000 | | Expiration: January 2015, Exercise Price: $40.00 | | 5 | | | 165 | |
| A 150117P00042000 | | Expiration: January 2015, Exercise Price: $42.00 | | 18 | | | 801 | |
| A 160115P00035000 | | Expiration: January 2016, Exercise Price: $35.00 | | 1 | | | 104 | |
| A 160115P00040000 | | Expiration: January 2016, Exercise Price: $40.00 | | 17 | | | 3,026 | |
| A 160115P00045000 | | Expiration: January 2016, Exercise Price: $45.00 | | 2 | | | 560 | |
| | | Altera Corporation | | | | | | |
| ALTR 150117P00023000 | | Expiration: January 2015, Exercise Price: $23.00 | | 20 | | | 250 | |
| | | Apple, Inc. | | | | | | |
| AAPL 160115P00057140 | | Expiration: January 2016, Exercise Price: $57.14 | | 7 | | | 696 | |
| AAPL7 160115P00057140 | | Expiration: January 2016, Exercise Price: $57.14 | | 28 | e | | 286 | |
| AAPL 160115P00058570 | | Expiration: January 2016, Exercise Price: $58.57 | | 21 | | | 2,468 | |
| AAPL 160115P00068570 | | Expiration: January 2016, Exercise Price: $68.57 | | 1 | | | 288 | |
| AAPL 160115P00070000 | | Expiration: January 2016, Exercise Price: $70.00 | | 2 | | | 655 | |
| | | Broadcom Corporation — Class A | | | | | | |
| BRCM 150117P00023000 | | Expiration: January 2015, Exercise Price: $23.00 | | 20 | | | 230 | |
| BRCM 160115P00023000 | | Expiration: January 2016, Exercise Price: $23.00 | | 8 | | | 488 | |
| BRCM 160115P00027000 | | Expiration: January 2016, Exercise Price: $27.00 | | 3 | | | 376 | |
| | | Cisco Systems, Inc. | | | | | | |
| CSCO 140719P00018000 | | Expiration: July 2014, Exercise Price: $18.00 | | 29 | | | 29 | |
| CSCO 150117P00015000 | | Expiration: January 2015, Exercise Price: $15.00 | | 20 | | | 110 | |
| CSCO 150117P00017000 | | Expiration: January 2015, Exercise Price: $17.00 | | 4 | | | 42 | |
| CSCO 160115P00015000 | | Expiration: January 2016, Exercise Price: $15.00 | | 10 | | | 265 | |
| CSCO 160115P00018000 | | Expiration: January 2016, Exercise Price: $18.00 | | 18 | | | 1,152 | |
| | | EMC Corporation | | | | | | |
| EMC 160115P00020000 | | Expiration: January 2016, Exercise Price: $20.00 | | 7 | | | 553 | |
| | | Hologic, Inc. | | | | | | |
| HOLX 160115P00015000 | | Expiration: January 2016, Exercise Price: $15.00 | | 61 | | | 2,897 | |
| | | International Business Machines Corporation | | | | | | |
| IBM 150117P00160000 | | Expiration: January 2015, Exercise Price: $160.00 | | 5 | | | 1,562 | |
| IBM 160115P00130000 | | Expiration: January 2016, Exercise Price: $130.00 | | 1 | | | 301 | |
| IBM 160115P00140000 | | Expiration: January 2016, Exercise Price: $140.00 | | 2 | | | 900 | |
| IBM 160115P00160000 | | Expiration: January 2016, Exercise Price: $160.00 | | 2 | | | 1,835 | |
The accompanying notes are an integral part of these financial statements.
KINETICS PORTFOLIOS TRUST — MASTER INVESTMENT PORTFOLIOS The Alternative Income Portfolio Portfolio of Options Written — June 30, 2014 (Unaudited) — (Continued) |
| Identifier | | | | Contractsd | | | Value | |
| | | Computer and Electronic Product Manufacturing — (Continued) | | | | | | |
| | | QUALCOMM Inc. | | | | | | |
| QCOM 150117P00055000 | | Expiration: January 2015, Exercise Price: $55.00 | | 1 | | $ | 21 | |
| QCOM 160115P00050000 | | Expiration: January 2016, Exercise Price: $50.00 | | 15 | | | 1,342 | |
| QCOM 160115P00055000 | | Expiration: January 2016, Exercise Price: $55.00 | | 6 | | | 864 | |
| QCOM 160115P00057500 | | Expiration: January 2016, Exercise Price: $57.50 | | 1 | | | 180 | |
| QCOM 160115P00060000 | | Expiration: January 2016, Exercise Price: $60.00 | | 3 | | | 668 | |
| | | Sony Corporation | | | | | | |
| SNE 150117P00012000 | | Expiration: January 2015, Exercise Price: $12.00 | | 14 | | | 210 | |
| SNE 150117P00015000 | | Expiration: January 2015, Exercise Price: $15.00 | | 26 | | | 1,755 | |
| SNE 160115P00013000 | | Expiration: January 2016, Exercise Price: $13.00 | | 25 | | | 2,375 | |
| | | St. Jude Medical, Inc. | | | | | | |
| STJ 150117P00040000 | | Expiration: January 2015, Exercise Price: $40.00 | | 2 | | | 30 | |
| STJ 160115P00040000 | | Expiration: January 2016, Exercise Price: $40.00 | | 20 | | | 1,700 | |
| STJ 160115P00045000 | | Expiration: January 2016, Exercise Price: $45.00 | | 8 | | | 1,060 | |
| STJ 160115P00050000 | | Expiration: January 2016, Exercise Price: $50.00 | | 14 | | | 3,150 | |
| | | Texas Instruments Inc. | | | | | | |
| TXN 150117P00030000 | | Expiration: January 2015, Exercise Price: $30.00 | | 9 | | | 113 | |
| TXN 160115P00030000 | | Expiration: January 2016, Exercise Price: $30.00 | | 2 | | | 123 | |
| | | Thermo Fisher Scientific, Inc. | | | | | | |
| TMO 150117P00075000 | | Expiration: January 2015, Exercise Price: $75.00 | | 1 | | | 33 | |
| TMO 160115P00080000 | | Expiration: January 2016, Exercise Price: $80.00 | | 10 | | | 2,575 | |
| TMO 160115P00085000 | | Expiration: January 2016, Exercise Price: $85.00 | | 4 | | | 1,340 | |
| | | | | | | | 37,920 | |
| | | Construction of Buildings | | | | | | |
| | | Lennar Corporation — Class A | | | | | | |
| LEN 141122P00028000 | | Expiration: November 2014, Exercise Price: $28.00 | | 5 | | | 55 | |
| LEN 141122P00030000 | | Expiration: November 2014, Exercise Price: $30.00 | | 5 | | | 95 | |
| LEN 150117P00023000 | | Expiration: January 2015, Exercise Price: $23.00 | | 8 | | | 84 | |
| LEN 150117P00028000 | | Expiration: January 2015, Exercise Price: $28.00 | | 20 | | | 490 | |
| LEN 150117P00030000 | | Expiration: January 2015, Exercise Price: $30.00 | | 12 | | | 432 | |
| LEN 160115P00025000 | | Expiration: January 2016, Exercise Price: $25.00 | | 15 | | | 1,065 | |
| LEN 160115P00028000 | | Expiration: January 2016, Exercise Price: $28.00 | | 14 | | | 1,680 | |
| LEN 160115P00030000 | | Expiration: January 2016, Exercise Price: $30.00 | | 9 | | | 1,391 | |
| | | | | | | | 5,292 | |
The accompanying notes are an integral part of these financial statements.
KINETICS PORTFOLIOS TRUST — MASTER INVESTMENT PORTFOLIOS The Alternative Income Portfolio Portfolio of Options Written — June 30, 2014 (Unaudited) — (Continued) |
| Identifier | | | | Contractsd | | | Value | |
| | | Consumer Staples | | | | | | |
| | | The Procter & Gamble Company | | | | | | |
| PG 150117P00065000 | | Expiration: January 2015, Exercise Price: $65.00 | | 8 | | $ | 312 | |
| PG 160115P00060000 | | Expiration: January 2016, Exercise Price: $60.00 | | 7 | | | 851 | |
| | | | | | | | 1,163 | |
| | | Couriers and Messengers | | | | | | |
| | | FedEx Corp. | | | | | | |
| FDX 150117P00097500 | | Expiration: January 2015, Exercise Price: $97.50 | | 3 | | | 82 | |
| FDX 150117P00100000 | | Expiration: January 2015, Exercise Price: $100.00 | | 2 | | | 67 | |
| FDX 150117P00105000 | | Expiration: January 2015, Exercise Price: $105.00 | | 3 | | | 134 | |
| FDX 160115P00090000 | | Expiration: January 2016, Exercise Price: $90.00 | | 5 | | | 633 | |
| FDX 160115P00095000 | | Expiration: January 2016, Exercise Price: $95.00 | | 4 | | | 642 | |
| FDX 160115P00097500 | | Expiration: January 2016, Exercise Price: $97.50 | | 1 | | | 181 | |
| FDX 160115P00100000 | | Expiration: January 2016, Exercise Price: $100.00 | | 7 | | | 1,407 | |
| | | | | | | | 3,146 | |
| | | Credit Intermediation and Related Activities | | | | | | |
| | | American Express Company | | | | | | |
| AXP 150117P00055000 | | Expiration: January 2015, Exercise Price: $55.00 | | 17 | | | 255 | |
| AXP 150117P00065000 | | Expiration: January 2015, Exercise Price: $65.00 | | 1 | | | 26 | |
| AXP 160115P00060000 | | Expiration: January 2016, Exercise Price: $60.00 | | 1 | | | 99 | |
| AXP 160115P00065000 | | Expiration: January 2016, Exercise Price: $65.00 | | 7 | | | 1,005 | |
| AXP 160115P00067500 | | Expiration: January 2016, Exercise Price: $67.50 | | 6 | | | 1,035 | |
| | | Bank of America Corporation | | | | | | |
| BAC 150117P00010000 | | Expiration: January 2015, Exercise Price: $10.00 | | 30 | | | 135 | |
| BAC 150117P00012000 | | Expiration: January 2015, Exercise Price: $12.00 | | 32 | | | 496 | |
| BAC 160115P00010000 | | Expiration: January 2016, Exercise Price: $10.00 | | 42 | | | 1,533 | |
| BAC 160115P00012000 | | Expiration: January 2016, Exercise Price: $12.00 | | 118 | | | 8,555 | |
| | | The Bank of New York Mellon Corporation | | | | | | |
| BK 160115P00023000 | | Expiration: January 2016, Exercise Price: $23.00 | | 28 | | | 1,316 | |
| BK 160115P00025000 | | Expiration: January 2016, Exercise Price: $25.00 | | 20 | | | 1,250 | |
| | | Capital One Financial Corporation | | | | | | |
| COF 160115P00055000 | | Expiration: January 2016, Exercise Price: $55.00 | | 8 | | | 1,056 | |
| | | Citigroup Inc. | | | | | | |
| C 150117P00037000 | | Expiration: January 2015, Exercise Price: $37.00 | | 6 | | | 219 | |
| C 160115P00033000 | | Expiration: January 2016, Exercise Price: $33.00 | | 3 | | | 289 | |
| C 160115P00035000 | | Expiration: January 2016, Exercise Price: $35.00 | | 17 | | | 2,091 | |
| | | Ocwen Financial Corporation | | | | | | |
| OCN 150117P00025000 | | Expiration: January 2015, Exercise Price: $25.00 | | 8 | | | 580 | |
| OCN 160115P00027500 | | Expiration: January 2016, Exercise Price: $27.50 | | 20 | | | 6,600 | |
The accompanying notes are an integral part of these financial statements.
KINETICS PORTFOLIOS TRUST — MASTER INVESTMENT PORTFOLIOS The Alternative Income Portfolio Portfolio of Options Written — June 30, 2014 (Unaudited) — (Continued) |
| Identifier | | | | Contractsd | | | Value | |
| | | Credit Intermediation and Related Activities — (Continued) | | | | | | |
| | | State Street Corporation | | | | | | |
| STT 160115P00050000 | | Expiration: January 2016, Exercise Price: $50.00 | | 2 | | $ | 381 | |
| | | U.S. Bancorp | | | | | | |
| USB 160115P00030000 | | Expiration: January 2016, Exercise Price: $30.00 | | 4 | | | 270 | |
| USB 160115P00033000 | | Expiration: January 2016, Exercise Price: $33.00 | | 3 | | | 300 | |
| USB 160115P00035000 | | Expiration: January 2016, Exercise Price: $35.00 | | 2 | | | 270 | |
| | | Wells Fargo & Company | | | | | | |
| WFC 150117P00035000 | | Expiration: January 2015, Exercise Price: $35.00 | | 19 | | | 266 | |
| WFC 160115P00035000 | | Expiration: January 2016, Exercise Price: $35.00 | | 6 | | | 405 | |
| | | | | | | | 28,432 | |
| | | Data Processor | | | | | | |
| | | MasterCard, Inc. — Class A | | | | | | |
| MA 150117P00055000 | | Expiration: January 2015, Exercise Price: $55.00 | | 6 | | | 255 | |
| MA 150117P00055500 | | Expiration: January 2015, Exercise Price: $55.50 | | 2 | | | 91 | |
| MA 150117P00058000 | | Expiration: January 2015, Exercise Price: $58.00 | | 10 | | | 635 | |
| MA 160115P00055000 | | Expiration: January 2016, Exercise Price: $55.00 | | 10 | | | 2,245 | |
| MA 160115P00057000 | | Expiration: January 2016, Exercise Price: $57.00 | | 2 | | | 534 | |
| MA 160115P00058000 | | Expiration: January 2016, Exercise Price: $58.00 | | 3 | | | 865 | |
| MA 160115P00062000 | | Expiration: January 2016, Exercise Price: $62.00 | | 10 | | | 4,025 | |
| | | Visa, Inc. — Class A | | | | | | |
| V 150117P00140000 | | Expiration: January 2015, Exercise Price: $140.00 | | 2 | | | 71 | |
| V 150117P00145000 | | Expiration: January 2015, Exercise Price: $145.00 | | 4 | | | 172 | |
| V 150117P00180000 | | Expiration: January 2015, Exercise Price: $180.00 | | 3 | | | 774 | |
| V 160115P00150000 | | Expiration: January 2016, Exercise Price: $150.00 | | 1 | | | 383 | |
| V 160115P00165000 | | Expiration: January 2016, Exercise Price: $165.00 | | 2 | | | 1,225 | |
| | | | | | | | 11,275 | |
| | | Diversi_ed Financial Services | | | | | | |
| | | JPMorgan Chase & Co. | | | | | | |
| JPM 150117P00040000 | | Expiration: January 2015, Exercise Price: $40.00 | | 8 | | | 168 | |
| JPM 160115P00040000 | | Expiration: January 2016, Exercise Price: $40.00 | | 21 | | | 2,205 | |
| JPM 160115P00045000 | | Expiration: January 2016, Exercise Price: $45.00 | | 9 | | | 1,733 | |
| | | | | | | | 4,106 | |
The accompanying notes are an integral part of these financial statements.
KINETICS PORTFOLIOS TRUST — MASTER INVESTMENT PORTFOLIOS The Alternative Income Portfolio Portfolio of Options Written — June 30, 2014 (Unaudited) — (Continued) |
| Identifier | | | | Contractsd | | | Value | |
| | | E-Commerce | | | | | | |
| | | Amazon.com, Inc. | | | | | | |
| AMZN 150117P00255000 | | Expiration: January 2015, Exercise Price: $255.00 | | 1 | | $ | 562 | |
| AMZN 150117P00260000 | | Expiration: January 2015, Exercise Price: $260.00 | | 1 | | | 642 | |
| AMZN 150117P00270000 | | Expiration: January 2015, Exercise Price: $270.00 | | 5 | | | 4,162 | |
| AMZN 160115P00230000 | | Expiration: January 2016, Exercise Price: $230.00 | | 1 | | | 1,198 | |
| AMZN 160115P00260000 | | Expiration: January 2016, Exercise Price: $260.00 | | 1 | | | 1,975 | |
| AMZN 160115P00290000 | | Expiration: January 2016, Exercise Price: $290.00 | | 1 | | | 3,058 | |
| | | eBay, Inc. | | | | | | |
| EBAY 150117P00038000 | | Expiration: January 2015, Exercise Price: $38.00 | | 6 | | | 234 | |
| EBAY 150117P00040000 | | Expiration: January 2015, Exercise Price: $40.00 | | 7 | | | 413 | |
| EBAY 160115P00035000 | | Expiration: January 2016, Exercise Price: $35.00 | | 3 | | | 368 | |
| EBAY 160115P00040000 | | Expiration: January 2016, Exercise Price: $40.00 | | 34 | | | 7,480 | |
| EBAY 160115P00045000 | | Expiration: January 2016, Exercise Price: $45.00 | | 9 | | | 3,465 | |
| | | IAC/InterActiveCorp | | | | | | |
| IACI 140719P00050000 | | Expiration: July 2014, Exercise Price: $50.00 | | 9 | | | 22 | |
| IACI 141018P00050000 | | Expiration: October 2014, Exercise Price: $50.00 | | 3 | | | 105 | |
| IACI 150117P00040000 | | Expiration: January 2015, Exercise Price: $40.00 | | 11 | | | 303 | |
| IACI 150117P00045000 | | Expiration: January 2015, Exercise Price: $45.00 | | 11 | | | 550 | |
| IACI 150117P00050000 | | Expiration: January 2015, Exercise Price: $50.00 | | 14 | | | 1,260 | |
| IACI 150117P00055000 | | Expiration: January 2015, Exercise Price: $55.00 | | 2 | | | 330 | |
| | | Liberty Interactive Corporation — Class A | | | | | | |
| LINTA 150117P00017000 | | Expiration: January 2015, Exercise Price: $17.00 | | 5 | | | 75 | |
| LINTA 150117P00020000 | | Expiration: January 2015, Exercise Price: $20.00 | | 30 | | | 450 | |
| | | | | | | | 26,652 | |
| | | Electrical Equipment, Appliance, and Component Manufacturing | | | | | | |
| | | Corning Inc. | | | | | | |
| GLW 150117P00012000 | | Expiration: January 2015, Exercise Price: $12.00 | | 38 | | | 209 | |
| | | Emerson Electric Co. | | | | | | |
| EMR 160115P00050000 | | Expiration: January 2016, Exercise Price: $50.00 | | 2 | | | 365 | |
| EMR 160115P00055000 | | Expiration: January 2016, Exercise Price: $55.00 | | 5 | | | 1,450 | |
| | | Whirlpool Corporation | | | | | | |
| WHR 141220P00110000 | | Expiration: December 2014, Exercise Price: $110.00 | | 2 | | | 336 | |
| WHR 150117P00100000 | | Expiration: January 2015, Exercise Price: $100.00 | | 5 | | | 532 | |
| WHR 150117P00105000 | | Expiration: January 2015, Exercise Price: $105.00 | | 1 | | | 149 | |
| WHR 160115P00090000 | | Expiration: January 2016, Exercise Price: $90.00 | | 2 | | | 730 | |
| WHR 160115P00105000 | | Expiration: January 2016, Exercise Price: $105.00 | | 1 | | | 693 | |
| WHR 160115P00110000 | | Expiration: January 2016, Exercise Price: $110.00 | | 1 | | | 840 | |
| WHR 160115P00115000 | | Expiration: January 2016, Exercise Price: $115.00 | | 2 | | | 2,010 | |
| | | | | | | | 7,314 | |
The accompanying notes are an integral part of these financial statements.
KINETICS PORTFOLIOS TRUST — MASTER INVESTMENT PORTFOLIOS The Alternative Income Portfolio Portfolio of Options Written — June 30, 2014 (Unaudited) — (Continued) |
| Identifier | | | | Contractsd | | | Value | |
| | | Fabricated Metal Product Manufacturing | | | | | | |
| | | Danaher Corporation | | | | | | |
| DHR 150117P00050000 | | Expiration: January 2015, Exercise Price: $50.00 | | 12 | | $ | 180 | |
| DHR 150117P00052500 | | Expiration: January 2015, Exercise Price: $52.50 | | 8 | | | 140 | |
| DHR 160115P00055000 | | Expiration: January 2016, Exercise Price: $55.00 | | 3 | | | 360 | |
| | | | | | | | 680 | |
| | | Food and Beverage Stores | | | | | | |
| | | The Kroger Co. | | | | | | |
| KR 150117P00030000 | | Expiration: January 2015, Exercise Price: $30.00 | | 12 | | | 90 | |
| KR 160115P00025000 | | Expiration: January 2016, Exercise Price: $25.00 | | 12 | | | 210 | |
| KR 160115P00028000 | | Expiration: January 2016, Exercise Price: $28.00 | | 12 | | | 390 | |
| KR 160115P00030000 | | Expiration: January 2016, Exercise Price: $30.00 | | 9 | | | 383 | |
| | | Whole Foods Market, Inc. | | | | | | |
| WFM 150117P00030000 | | Expiration: January 2015, Exercise Price: $30.00 | | 3 | | | 187 | |
| WFM 150117P00037500 | | Expiration: January 2015, Exercise Price: $37.50 | | 12 | | | 3,510 | |
| WFM 160115P00028000 | | Expiration: January 2016, Exercise Price: $28.00 | | 14 | | | 2,149 | |
| WFM 160115P00030000 | | Expiration: January 2016, Exercise Price: $30.00 | | 9 | | | 1,832 | |
| WFM 160115P00035000 | | Expiration: January 2016, Exercise Price: $35.00 | | 8 | | | 3,100 | |
| | | | | | | | 11,851 | |
| | | Food Manufacturing | | | | | | |
| | | Archer-Daniels-Midland Company | | | | | | |
| ADM 141220P00035000 | | Expiration: December 2014, Exercise Price: $35.00 | | 4 | | | 108 | |
| ADM 150117P00030000 | | Expiration: January 2015, Exercise Price: $30.00 | | 28 | | | 350 | |
| ADM 150117P00032000 | | Expiration: January 2015, Exercise Price: $32.00 | | 1 | | | 18 | |
| ADM 160115P00028000 | | Expiration: January 2016, Exercise Price: $28.00 | | 3 | | | 157 | |
| ADM 160115P00030000 | | Expiration: January 2016, Exercise Price: $30.00 | | 39 | | | 2,847 | |
| ADM 160115P00033000 | | Expiration: January 2016, Exercise Price: $33.00 | | 7 | | | 844 | |
| | | Bunge Limited | | | | | | |
| BG 150117P00060000 | | Expiration: January 2015, Exercise Price: $60.00 | | 2 | | | 125 | |
| BG 150117P00065000 | | Expiration: January 2015, Exercise Price: $65.00 | | 2 | | | 240 | |
| BG 160115P00055000 | | Expiration: January 2016, Exercise Price: $55.00 | | 1 | | | 182 | |
| BG 160115P00065000 | | Expiration: January 2016, Exercise Price: $65.00 | | 10 | | | 4,150 | |
| | | Mead Johnson Nutrition Company | | | | | | |
| MJN 150117P00055000 | | Expiration: January 2015, Exercise Price: $55.00 | | 4 | | | 190 | |
| MJN 150117P00060000 | | Expiration: January 2015, Exercise Price: $60.00 | | 10 | | | 535 | |
| MJN 150117P00065000 | | Expiration: January 2015, Exercise Price: $65.00 | | 1 | | | 55 | |
| MJN 160115P00055000 | | Expiration: January 2016, Exercise Price: $55.00 | | 1 | | | 118 | |
The accompanying notes are an integral part of these financial statements.
KINETICS PORTFOLIOS TRUST — MASTER INVESTMENT PORTFOLIOS The Alternative Income Portfolio Portfolio of Options Written — June 30, 2014 (Unaudited) — (Continued) |
| Identifier | | | | Contractsd | | | Value | |
| | | Food Manufacturing — (Continued) | | | | | | |
| | | Mondelez International Inc. — Class A | | | | | | |
| MDLZ 160115P00030000 | | Expiration: January 2016, Exercise Price: $30.00 | | 3 | | $ | 280 | |
| | | Tyson Foods, Inc. — Class A | | | | | | |
| TSN 160115P00025000 | | Expiration: January 2016, Exercise Price: $25.00 | | 8 | | | 760 | |
| TSN 160115P00030000 | | Expiration: January 2016, Exercise Price: $30.00 | | 3 | | | 638 | |
| | | | | | | | 11,597 | |
| | | Food Services and Drinking Places | | | | | | |
| | | Starbucks Corporation | | | | | | |
| SBUX 150117P00050000 | | Expiration: January 2015, Exercise Price: $50.00 | | 5 | | | 77 | |
| SBUX 150117P00055000 | | Expiration: January 2015, Exercise Price: $55.00 | | 12 | | | 318 | |
| SBUX 150117P00060000 | | Expiration: January 2015, Exercise Price: $60.00 | | 2 | | | 100 | |
| SBUX 160115P00050000 | | Expiration: January 2016, Exercise Price: $50.00 | | 5 | | | 518 | |
| SBUX 160115P00055000 | | Expiration: January 2016, Exercise Price: $55.00 | | 19 | | | 3,183 | |
| SBUX 160115P00060000 | | Expiration: January 2016, Exercise Price: $60.00 | | 1 | | | 253 | |
| | | Yum! Brands, Inc. | | | | | | |
| YUM 150117P00055000 | | Expiration: January 2015, Exercise Price: $55.00 | | 1 | | | 14 | |
| YUM 150117P00060000 | | Expiration: January 2015, Exercise Price: $60.00 | | 13 | | | 429 | |
| YUM 160115P00050000 | | Expiration: January 2016, Exercise Price: $50.00 | | 4 | | | 328 | |
| YUM 160115P00055000 | | Expiration: January 2016, Exercise Price: $55.00 | | 8 | | | 1,020 | |
| | | | | | | | 6,240 | |
| | | Funds, Trusts, and Other Financial Vehicles | | | | | | |
| | | CBRE Group, Inc. — Class A | | | | | | |
| CBG 140920P00020000 | | Expiration: September 2014, Exercise Price: $20.00 | | 5 | | | 12 | |
| CBG 150117P00020000 | | Expiration: January 2015, Exercise Price: $20.00 | | 41 | | | 308 | |
| | | iShares MSCI Emerging Markets ETF | | | | | | |
| EEM 150117P00030000 | | Expiration: January 2015, Exercise Price: $30.00 | | 2 | | | 30 | |
| EEM 160115P00028000 | | Expiration: January 2016, Exercise Price: $28.00 | | 6 | | | 360 | |
| EEM 160115P00030000 | | Expiration: January 2016, Exercise Price: $30.00 | | 4 | | | 320 | |
| | | Market Vectors Gold Miners ETF | | | | | | |
| GDX 150117P00015000 | | Expiration: January 2015, Exercise Price: $15.00 | | 8 | | | 32 | |
| GDX 150117P00016000 | | Expiration: January 2015, Exercise Price: $16.00 | | 3 | | | 15 | |
| GDX 150117P00017000 | | Expiration: January 2015, Exercise Price: $17.00 | | 8 | | | 60 | |
| GDX 150117P00020000 | | Expiration: January 2015, Exercise Price: $20.00 | | 30 | | | 795 | |
| GDX 160115P00015000 | | Expiration: January 2016, Exercise Price: $15.00 | | 21 | | | 609 | |
| GDX 160115P00016000 | | Expiration: January 2016, Exercise Price: $16.00 | | 3 | | | 118 | |
| | | | | | | | 2,659 | |
The accompanying notes are an integral part of these financial statements.
KINETICS PORTFOLIOS TRUST — MASTER INVESTMENT PORTFOLIOS The Alternative Income Portfolio Portfolio of Options Written — June 30, 2014 (Unaudited) — (Continued) |
| Identifier | | | | Contractsd | | | Value | |
| | | Furniture and Home Furnishings Stores | | | | | | |
| | | Bed Bath & Beyond Inc. | | | | | | |
| BBBY 160115P00050000 | | Expiration: January 2016, Exercise Price: $50.00 | | 10 | | $ | 3,300 | |
| | | Gaming | | | | | | |
| | | Las Vegas Sands Corp. | | | | | | |
| LVS 141220P00055000 | | Expiration: December 2014, Exercise Price: $55.00 | | 1 | | | 74 | |
| LVS 150117P00047250 | | Expiration: January 2015, Exercise Price: $47.25 | | 1 | | | 42 | |
| LVS 150117P00050000 | | Expiration: January 2015, Exercise Price: $50.00 | | 4 | | | 232 | |
| LVS 150117P00052250 | | Expiration: January 2015, Exercise Price: $52.25 | | 9 | | | 635 | |
| LVS 150117P00055000 | | Expiration: January 2015, Exercise Price: $55.00 | | 2 | | | 180 | |
| LVS 150117P00057250 | | Expiration: January 2015, Exercise Price: $57.25 | | 2 | | | 215 | |
| LVS 160115P00050000 | | Expiration: January 2016, Exercise Price: $50.00 | | 2 | | | 468 | |
| LVS 160115P00055000 | | Expiration: January 2016, Exercise Price: $55.00 | | 18 | | | 6,075 | |
| LVS 160115P00060000 | | Expiration: January 2016, Exercise Price: $60.00 | | 2 | | | 955 | |
| | | Wynn Resorts Limited | | | | | | |
| WYNN 141220P00150000 | | Expiration: December 2014, Exercise Price: $150.00 | | 2 | | | 369 | |
| WYNN 141220P00155000 | | Expiration: December 2014, Exercise Price: $155.00 | | 1 | | | 237 | |
| WYNN 150117P00167000 | | Expiration: January 2015, Exercise Price: $167.00 | | 3 | | | 1,387 | |
| WYNN 150117P00175000 | | Expiration: January 2015, Exercise Price: $175.00 | | 1 | | | 627 | |
| WYNN 160115P00120000 | | Expiration: January 2016, Exercise Price: $120.00 | | 1 | | | 365 | |
| WYNN 160115P00140000 | | Expiration: January 2016, Exercise Price: $140.00 | | 3 | | | 2,093 | |
| WYNN 160115P00147000 | | Expiration: January 2016, Exercise Price: $147.00 | | 1 | | | 865 | |
| WYNN 160115P00167000 | | Expiration: January 2016, Exercise Price: $167.00 | | 3 | | | 4,448 | |
| | | | | | | | 19,267 | |
| | | General Merchandise Stores | | | | | | |
| | | Costco Wholesale Corporation | | | | | | |
| COST 150117P00083000 | | Expiration: January 2015, Exercise Price: $83.00 | | 1 | | | 31 | |
| COST 150117P00088000 | | Expiration: January 2015, Exercise Price: $88.00 | | 6 | | | 255 | |
| COST 160115P00085000 | | Expiration: January 2016, Exercise Price: $85.00 | | 3 | | | 540 | |
| COST 160115P00090000 | | Expiration: January 2016, Exercise Price: $90.00 | | 8 | | | 1,916 | |
| COST 160115P00095000 | | Expiration: January 2016, Exercise Price: $95.00 | | 1 | | | 325 | |
| | | Family Dollar Stores, Inc. | | | | | | |
| FDO 150117P00042500 | | Expiration: January 2015, Exercise Price: $42.50 | | 11 | | | 275 | |
The accompanying notes are an integral part of these financial statements.
KINETICS PORTFOLIOS TRUST — MASTER INVESTMENT PORTFOLIOS The Alternative Income Portfolio Portfolio of Options Written — June 30, 2014 (Unaudited) — (Continued) |
| Identifier | | | | Contractsd | | | Value | |
| | | General Merchandise Stores — (Continued) | | | | | | |
| | | Macy’s, Inc. | | | | | | |
| M 141122P00045000 | | Expiration: November 2014, Exercise Price: $45.00 | | 3 | | | $ 97 | |
| M 150117P00037000 | | Expiration: January 2015, Exercise Price: $37.00 | | 4 | | | 70 | |
| M 150117P00040000 | | Expiration: January 2015, Exercise Price: $40.00 | | 2 | | | 55 | |
| M 150117P00042000 | | Expiration: January 2015, Exercise Price: $42.00 | | 2 | | | 72 | |
| M 160115P00030000 | | Expiration: January 2016, Exercise Price: $30.00 | | 30 | | | 1,260 | |
| M 160115P00038000 | | Expiration: January 2016, Exercise Price: $38.00 | | 2 | | | 230 | |
| M 160115P00040000 | | Expiration: January 2016, Exercise Price: $40.00 | | 19 | | | 2,736 | |
| | | Sears Holdings Corporation | | | | | | |
| SHLD1 150117P00020000 | | Expiration: January 2015, Exercise Price: $20.00 | | 5 | | | 93 | |
| SHLD1 150117P00030000 | | Expiration: January 2015, Exercise Price: $30.00 | | 8 | | | 824 | |
| | | Wal-Mart Stores, Inc. | | | | | | |
| WMT 150117P00062500 | | Expiration: January 2015, Exercise Price: $62.50 | | 5 | | | 178 | |
| WMT 150117P00065000 | | Expiration: January 2015, Exercise Price: $65.00 | | 4 | | | 214 | |
| WMT 160115P00055000 | | Expiration: January 2016, Exercise Price: $55.00 | | 1 | | | 83 | |
| | | | | | | | 9,254 | |
| | | Health and Personal Care Stores | | | | | | |
| | | CVS Caremark Corporation | | | | | | |
| CVS 160115P00052500 | | Expiration: January 2016, Exercise Price: $52.50 | | 3 | | | 297 | |
| CVS 160115P00055000 | | Expiration: January 2016, Exercise Price: $55.00 | | 1 | | | 128 | |
| CVS 160115P00060000 | | Expiration: January 2016, Exercise Price: $60.00 | | 17 | | | 3,536 | |
| | | Walgreen Company | | | | | | |
| WAG 141018P00055000 | | Expiration: October 2014, Exercise Price: $55.00 | | 2 | | | 35 | |
| WAG 150117P00055000 | | Expiration: January 2015, Exercise Price: $55.00 | | 10 | | | 555 | |
| WAG 160115P00040000 | | Expiration: January 2016, Exercise Price: $40.00 | | 8 | | | 316 | |
| WAG 160115P00045000 | | Expiration: January 2016, Exercise Price: $45.00 | | 22 | | | 1,738 | |
| WAG 160115P00050000 | | Expiration: January 2016, Exercise Price: $50.00 | | 7 | | | 1,001 | |
| WAG 160115P00052500 | | Expiration: January 2016, Exercise Price: $52.50 | | 1 | | | 186 | |
| WAG 160115P00055000 | | Expiration: January 2016, Exercise Price: $55.00 | | 5 | | | 1,228 | |
| | | | | | | | 9,020 | |
The accompanying notes are an integral part of these financial statements.
KINETICS PORTFOLIOS TRUST — MASTER INVESTMENT PORTFOLIOS The Alternative Income Portfolio Portfolio of Options Written — June 30, 2014 (Unaudited) — (Continued) |
| Identifier | | | | Contractsd | | | Value | |
| | | Heavy and Civil Engineering Construction | | | | | | |
| | | Chicago Bridge & Iron Company N.V. | | | | | | |
| CBI 150117P00055000 | | Expiration: January 2015, Exercise Price: $55.00 | | 3 | | $ | 510 | |
| CBI 150117P00057500 | | Expiration: January 2015, Exercise Price: $57.50 | | 1 | | | 222 | |
| CBI 150117P00060000 | | Expiration: January 2015, Exercise Price: $60.00 | | 4 | | | 1,160 | |
| CBI 160115P00055000 | | Expiration: January 2016, Exercise Price: $55.00 | | 3 | | | 1,410 | |
| CBI 160115P00060000 | | Expiration: January 2016, Exercise Price: $60.00 | | 14 | | | 9,240 | |
| CBI 160115P00062500 | | Expiration: January 2016, Exercise Price: $62.50 | | 3 | | | 2,280 | |
| | | | | | | | 14,822 | |
| | | Holding Company | | | | | | |
| | | Icahn Enterprises LP | | | | | | |
| IEP 140920P00075000 | | Expiration: September 2014, Exercise Price: $75.00 | | 14 | | | 315 | |
| IEP 140920P00080000 | | Expiration: September 2014, Exercise Price: $80.00 | | 8 | | | 420 | |
| IEP 140920P00085000 | | Expiration: September 2014, Exercise Price: $85.00 | | 2 | | | 220 | |
| IEP 141220P00075000 | | Expiration: December 2014, Exercise Price: $75.00 | | 3 | | | 330 | |
| | | Leucadia National Corporation | | | | | | |
| LUK2 150117P00015000 | | Expiration: January 2015, Exercise Price: $15.00 | | 33 | | | 248 | |
| LUK2 150117P00020000 | | Expiration: January 2015, Exercise Price: $20.00 | | 42 | | | 3,465 | |
| | | | | | | | 4,998 | |
| | | Insurance Carriers and Related Activities | | | | | | |
| | | Aetna Inc. | | | | | | |
| AET 150117P00050000 | | Expiration: January 2015, Exercise Price: $50.00 | | 8 | | | 152 | |
| AET 160115P00050000 | | Expiration: January 2016, Exercise Price: $50.00 | | 12 | | | 1,290 | |
| AET 160115P00055000 | | Expiration: January 2016, Exercise Price: $55.00 | | 1 | | | 165 | |
| AET 160115P00060000 | | Expiration: January 2016, Exercise Price: $60.00 | | 2 | | | 495 | |
| | | Aflac, Inc. | | | | | | |
| AFL 150117P00047000 | | Expiration: January 2015, Exercise Price: $47.00 | | 8 | | | 200 | |
| AFL 150117P00050000 | | Expiration: January 2015, Exercise Price: $50.00 | | 10 | | | 410 | |
| AFL 160115P00050000 | | Expiration: January 2016, Exercise Price: $50.00 | | 2 | | | 393 | |
| | | American International Group, Inc. | | | | | | |
| AIG 150117P00035000 | | Expiration: January 2015, Exercise Price: $35.00 | | 38 | | | 437 | |
| AIG 160115P00035000 | | Expiration: January 2016, Exercise Price: $35.00 | | 14 | | | 1,071 | |
| AIG 160115P00038000 | | Expiration: January 2016, Exercise Price: $38.00 | | 15 | | | 1,710 | |
| | | Lincoln National Corporation | | | | | | |
| LNC 160115P00038000 | | Expiration: January 2016, Exercise Price: $38.00 | | 6 | | | 1,392 | |
The accompanying notes are an integral part of these financial statements.
| KINETICS PORTFOLIOS TRUST — MASTER INVESTMENT PORTFOLIOS |
| The Alternative Income Portfolio |
Portfolio of Options Written — June 30, 2014 (Unaudited) — (Continued) |
| Identifier | | | Contractsd | | | Value | |
| | | Insurance Carriers and Related Activities — (Continued) | | | | | |
| | | MetLife, Inc. | | | | | |
| MET 150117P00035000 | | Expiration: January 2015, Exercise Price: $35.00 | 18 | | $ | 297 | |
| MET 150117P00037000 | | Expiration: January 2015, Exercise Price: $37.00 | 2 | | | 42 | |
| MET 160115P00035000 | | Expiration: January 2016, Exercise Price: $35.00 | 8 | | | 692 | |
| MET 160115P00038000 | | Expiration: January 2016, Exercise Price: $38.00 | 25 | | | 3,212 | |
| MET 160115P00040000 | | Expiration: January 2016, Exercise Price: $40.00 | 14 | | | 2,310 | |
| | | Prudential Financial, Inc. | | | | | |
| PRU 160115P00060000 | | Expiration: January 2016, Exercise Price: $60.00 | 1 | | | 209 | |
| PRU 160115P00065000 | | Expiration: January 2016, Exercise Price: $65.00 | 8 | | | 2,520 | |
| | | UnitedHealth Group Inc. | | | | | |
| UNH 150117P00052500 | | Expiration: January 2015, Exercise Price: $52.50 | 7 | | | 161 | |
| UNH 160115P00055000 | | Expiration: January 2016, Exercise Price: $55.00 | 12 | | | 1,704 | |
| UNH 160115P00060000 | | Expiration: January 2016, Exercise Price: $60.00 | 9 | | | 1,886 | |
| | | WellPoint, Inc. | | | | | |
| WLP 150117P00062500 | | Expiration: January 2015, Exercise Price: $62.50 | 7 | | | 147 | |
| WLP 150117P00065000 | | Expiration: January 2015, Exercise Price: $65.00 | 1 | | | 26 | |
| WLP 160115P00060000 | | Expiration: January 2016, Exercise Price: $60.00 | 1 | | | 102 | |
| WLP 160115P00065000 | | Expiration: January 2016, Exercise Price: $65.00 | 5 | | | 673 | |
| WLP 160115P00070000 | | Expiration: January 2016, Exercise Price: $70.00 | 2 | | | 387 | |
| WLP 160115P00075000 | | Expiration: January 2016, Exercise Price: $75.00 | 15 | | | 3,983 | |
| | | | | | | 26,066 | |
| | | Leather and Allied Product Manufacturing | | | | | |
| | | Coach, Inc. | | | | | |
| COH 150117P00030000 | | Expiration: January 2015, Exercise Price: $30.00 | 5 | | | 687 | |
| COH 160115P00025000 | | Expiration: January 2016, Exercise Price: $25.00 | 60 | | | 9,150 | |
| | | NIKE, Inc. — Class B | | | | | |
| NKE 150117P00050000 | | Expiration: January 2015, Exercise Price: $50.00 | 2 | | | 24 | |
| NKE 150117P00052500 | | Expiration: January 2015, Exercise Price: $52.50 | 4 | | | 66 | |
| NKE 160115P00050000 | | Expiration: January 2016, Exercise Price: $50.00 | 12 | | | 1,074 | |
| NKE 160115P00055000 | | Expiration: January 2016, Exercise Price: $55.00 | 20 | | | 2,900 | |
| NKE 160115P00060000 | | Expiration: January 2016, Exercise Price: $60.00 | 1 | | | 229 | |
| | | | | | | 14,130 | |
| | | Machinery Manufacturing | | | | | |
| | | Baker Hughes Inc. | | | | | |
| BHI 160115P00050000 | | Expiration: January 2016, Exercise Price: $50.00 | 2 | | | 328 | |
| BHI 160115P00052500 | | Expiration: January 2016, Exercise Price: $52.50 | 4 | | | 812 | |
The accompanying notes are an integral part of these financial statements.
| KINETICS PORTFOLIOS TRUST — MASTER INVESTMENT PORTFOLIOS |
| The Alternative Income Portfolio |
Portfolio of Options Written — June 30, 2014 (Unaudited) — (Continued) |
| Identifier | | | Contractsd | | | Value | |
| | | Machinery Manufacturing — (Continued) | | | | | |
| | | Cameron International Corporation | | | | | |
| CAM 141122P00047500 | | Expiration: November 2014, Exercise Price: $47.50 | 3 | | $ | 60 | |
| CAM 160115P00040000 | | Expiration: January 2016, Exercise Price: $40.00 | 8 | | | 660 | |
| | | Caterpillar Inc. | | | | | |
| CAT 160115P00060000 | | Expiration: January 2016, Exercise Price: $60.00 | 1 | | | 82 | |
| CAT 160115P00065000 | | Expiration: January 2016, Exercise Price: $65.00 | 8 | | | 920 | |
| CAT 160115P00070000 | | Expiration: January 2016, Exercise Price: $70.00 | 5 | | | 797 | |
| CAT 160115P00080000 | | Expiration: January 2016, Exercise Price: $80.00 | 1 | | | 315 | |
| | | Cummins Inc. | | | | | |
| CMI 141220P00110000 | | Expiration: December 2014, Exercise Price: $110.00 | 1 | | | 62 | |
| CMI 150117P00095000 | | Expiration: January 2015, Exercise Price: $95.00 | 1 | | | 32 | |
| CMI 150117P00097500 | | Expiration: January 2015, Exercise Price: $97.50 | 2 | | | 85 | |
| CMI 150117P00115000 | | Expiration: January 2015, Exercise Price: $115.00 | 1 | | | 110 | |
| CMI 160115P00090000 | | Expiration: January 2016, Exercise Price: $90.00 | 1 | | | 200 | |
| CMI 160115P00095000 | | Expiration: January 2016, Exercise Price: $95.00 | 1 | | | 248 | |
| CMI 160115P00100000 | | Expiration: January 2016, Exercise Price: $100.00 | 3 | | | 938 | |
| CMI 160115P00105000 | | Expiration: January 2016, Exercise Price: $105.00 | 9 | | | 3,465 | |
| CMI 160115P00110000 | | Expiration: January 2016, Exercise Price: $110.00 | 2 | | | 940 | |
| CMI 160115P00115000 | | Expiration: January 2016, Exercise Price: $115.00 | 1 | | | 575 | |
| | | Deere & Company | | | | | |
| DE 150117P00065000 | | Expiration: January 2015, Exercise Price: $65.00 | 1 | | | 23 | |
| DE 160115P00060000 | | Expiration: January 2016, Exercise Price: $60.00 | 4 | | | 400 | |
| | | Eaton Corporation plc | | | | | |
| ETN 150117P00050000 | | Expiration: January 2015, Exercise Price: $50.00 | 4 | | | 100 | |
| ETN 150117P00055000 | | Expiration: January 2015, Exercise Price: $55.00 | 11 | | | 467 | |
| ETN 160115P00050000 | | Expiration: January 2016, Exercise Price: $50.00 | 12 | | | 1,680 | |
| ETN 160115P00055000 | | Expiration: January 2016, Exercise Price: $55.00 | 10 | | | 2,100 | |
| | | General Electric Company | | | | | |
| GE 150117P00022000 | | Expiration: January 2015, Exercise Price: $22.00 | 25 | | | 687 | |
| GE 160115P00018000 | | Expiration: January 2016, Exercise Price: $18.00 | 15 | | | 600 | |
| GE 160115P00020000 | | Expiration: January 2016, Exercise Price: $20.00 | 34 | | | 2,244 | |
| | | Ingersoll-Rand plc | | | | | |
| IR1 150117P00045000 | | Expiration: January 2015, Exercise Price: $45.00 | 4 | | | 40 | |
| IR 160115P00040000 | | Expiration: January 2016, Exercise Price: $40.00 | 3 | | | 420 | |
| IR 160115P00045000 | | Expiration: January 2016, Exercise Price: $45.00 | 11 | | | 2,613 | |
The accompanying notes are an integral part of these financial statements.
| KINETICS PORTFOLIOS TRUST — MASTER INVESTMENT PORTFOLIOS |
| The Alternative Income Portfolio |
Portfolio of Options Written — June 30, 2014 (Unaudited) — (Continued) |
| Identifier | | | Contractsd | | | Value | |
| | | Machinery Manufacturing — (Continued) | | | | | |
| | | National Oilwell Varco, Inc. | | | | | |
| NOV1 150117P00057500 | | Expiration: January 2015, Exercise Price: $57.50 | 4 | | $ | 110 | |
| NOV1 160115P00055000 | | Expiration: January 2016, Exercise Price: $55.00 | 10 | | | 1,120 | |
| NOV 160115P00060000 | | Expiration: January 2016, Exercise Price: $60.00 | 1 | | | 216 | |
| NOV1 160115P00060000 | | Expiration: January 2016, Exercise Price: $60.00 | 8 | | | 1,216 | |
| | | | | | | 24,665 | |
| | | Management of Companies and Enterprises | | | | | |
| | | The Goldman Sachs Group, Inc. | | | | | |
| GS 150117P00115000 | | Expiration: January 2015, Exercise Price: $115.00 | 2 | | | 85 | |
| GS 150117P00120000 | | Expiration: January 2015, Exercise Price: $120.00 | 2 | | | 104 | |
| GS 150117P00125000 | | Expiration: January 2015, Exercise Price: $125.00 | 1 | | | 69 | |
| GS 160115P00115000 | | Expiration: January 2016, Exercise Price: $115.00 | 3 | | | 698 | |
| GS 160115P00120000 | | Expiration: January 2016, Exercise Price: $120.00 | 1 | | | 286 | |
| | | | | | | 1,242 | |
| | | Media | | | | | |
| | | Viacom Inc. — Class B | | | | | |
| VIAB 150117P00060000 | | Expiration: January 2015, Exercise Price: $60.00 | 8 | | | 280 | |
| VIAB 150117P00062500 | | Expiration: January 2015, Exercise Price: $62.50 | 1 | | | 42 | |
| VIAB 160115P00060000 | | Expiration: January 2016, Exercise Price: $60.00 | 13 | | | 2,698 | |
| VIAB 160115P00065000 | | Expiration: January 2016, Exercise Price: $65.00 | 2 | | | 590 | |
| | | | | | | 3,610 | |
| | | Merchant Wholesalers, Nondurable Goods | | | | | |
| | | Cardinal Health, Inc. | | | | | |
| CAH 150117P00040000 | | Expiration: January 2015, Exercise Price: $40.00 | 18 | | | 180 | |
| CAH 150117P00045000 | | Expiration: January 2015, Exercise Price: $45.00 | 5 | | | 87 | |
| CAH 150117P00050000 | | Expiration: January 2015, Exercise Price: $50.00 | 2 | | | 65 | |
| CAH 160115P00045000 | | Expiration: January 2016, Exercise Price: $45.00 | 6 | | | 855 | |
| CAH 160115P00050000 | | Expiration: January 2016, Exercise Price: $50.00 | 12 | | | 2,490 | |
| CAH 160115P00052500 | | Expiration: January 2016, Exercise Price: $52.50 | 2 | | | 525 | |
| | | Express Scripts Holding Company | | | | | |
| ESRX 150117P00047500 | | Expiration: January 2015, Exercise Price: $47.50 | 10 | | | 235 | |
| ESRX 150117P00055000 | | Expiration: January 2015, Exercise Price: $55.00 | 2 | | | 119 | |
| ESRX 160115P00047500 | | Expiration: January 2016, Exercise Price: $47.50 | 2 | | | 236 | |
| ESRX 160115P00050000 | | Expiration: January 2016, Exercise Price: $50.00 | 11 | | | 1,667 | |
| ESRX 160115P00055000 | | Expiration: January 2016, Exercise Price: $55.00 | 6 | | | 1,449 | |
| ESRX 160115P00057500 | | Expiration: January 2016, Exercise Price: $57.50 | 4 | | | 1,192 | |
The accompanying notes are an integral part of these financial statements.
| KINETICS PORTFOLIOS TRUST — MASTER INVESTMENT PORTFOLIOS |
| The Alternative Income Portfolio |
Portfolio of Options Written — June 30, 2014 (Unaudited) — (Continued) |
| Identifier | | | Contractsd | | | Value | |
| | | Merchant Wholesalers, Nondurable Goods — (Continued) | | | | | |
| | | McKesson Corp. | | | | | |
| MCK 150117P00125000 | | Expiration: January 2015, Exercise Price: $125.00 | 8 | | $ | 440 | |
| MCK 160115P00120000 | | Expiration: January 2016, Exercise Price: $120.00 | 6 | | | 1,830 | |
| MCK 160115P00125000 | | Expiration: January 2016, Exercise Price: $125.00 | 1 | | | 320 | |
| MCK 160115P00130000 | | Expiration: January 2016, Exercise Price: $130.00 | 4 | | | 1,520 | |
| | | Ralph Lauren Corporation | | | | | |
| RL 150117P00115000 | | Expiration: January 2015, Exercise Price: $115.00 | 5 | | | 312 | |
| RL 150117P00120000 | | Expiration: January 2015, Exercise Price: $120.00 | 1 | | | 88 | |
| RL 160115P00110000 | | Expiration: January 2016, Exercise Price: $110.00 | 1 | | | 310 | |
| RL 160115P00115000 | | Expiration: January 2016, Exercise Price: $115.00 | 5 | | | 1,900 | |
| RL 160115P00125000 | | Expiration: January 2016, Exercise Price: $125.00 | 1 | | | 580 | |
| RL 160115P00130000 | | Expiration: January 2016, Exercise Price: $130.00 | 1 | | | 700 | |
| | | | | | | 17,100 | |
| | | Mining (except Oil and Gas) | | | | | |
| | | BHP Billiton Limited — ADR | | | | | |
| BHP 150117P00047500 | | Expiration: January 2015, Exercise Price: $47.50 | 10 | | | 375 | |
| BHP 150117P00055000 | | Expiration: January 2015, Exercise Price: $55.00 | 1 | | | 90 | |
| BHP 160115P00045000 | | Expiration: January 2016, Exercise Price: $45.00 | 4 | | | 584 | |
| BHP 160115P00050000 | | Expiration: January 2016, Exercise Price: $50.00 | 10 | | | 2,315 | |
| | | Freeport-McMoRan Copper & Gold Inc. | | | | | |
| FCX 150117P00022000 | | Expiration: January 2015, Exercise Price: $22.00 | 23 | | | 207 | |
| FCX 150117P00024000 | | Expiration: January 2015, Exercise Price: $24.00 | 24 | | | 348 | |
| FCX 150117P00025000 | | Expiration: January 2015, Exercise Price: $25.00 | 4 | | | 70 | |
| FCX 150117P00027000 | | Expiration: January 2015, Exercise Price: $27.00 | 2 | | | 56 | |
| FCX 160115P00023000 | | Expiration: January 2016, Exercise Price: $23.00 | 21 | | | 1,533 | |
| FCX 160115P00025000 | | Expiration: January 2016, Exercise Price: $25.00 | 27 | | | 2,848 | |
| | | Newmont Mining Corporation | | | | | |
| NEM 160115P00015000 | | Expiration: January 2016, Exercise Price: $15.00 | 6 | | | 240 | |
| NEM 160115P00018000 | | Expiration: January 2016, Exercise Price: $18.00 | 8 | | | 712 | |
| | | Rio Tinto plc — ADR | | | | | |
| RIO 150117P00037500 | | Expiration: January 2015, Exercise Price: $37.50 | 15 | | | 637 | |
| RIO 150117P00040000 | | Expiration: January 2015, Exercise Price: $40.00 | 3 | | | 173 | |
| RIO 160115P00037500 | | Expiration: January 2016, Exercise Price: $37.50 | 6 | | | 1,320 | |
| RIO 160115P00040000 | | Expiration: January 2016, Exercise Price: $40.00 | 2 | | | 570 | |
| | | | | | | 12,078 | |
The accompanying notes are an integral part of these financial statements.
| KINETICS PORTFOLIOS TRUST — MASTER INVESTMENT PORTFOLIOS |
| The Alternative Income Portfolio |
Portfolio of Options Written — June 30, 2014 (Unaudited) — (Continued) |
| Identifier | | | Contractsd | | | Value | |
| | | Miscellaneous Manufacturing | | | | | |
| | | 3M Co. | | | | | |
| MMM 150117P00105000 | | Expiration: January 2015, Exercise Price: $105.00 | 1 | | $ | 56 | |
| MMM 160115P00095000 | | Expiration: January 2016, Exercise Price: $95.00 | 7 | | | 1,176 | |
| MMM 160115P00110000 | | Expiration: January 2016, Exercise Price: $110.00 | 1 | | | 338 | |
| | | Baxter International Inc. | | | | | |
| BAX 150117P00052500 | | Expiration: January 2015, Exercise Price: $52.50 | 5 | | | 102 | |
| | | Hasbro, Inc. | | | | | |
| HAS 160115P00037500 | | Expiration: January 2016, Exercise Price: $37.50 | 2 | | | 305 | |
| HAS 160115P00040000 | | Expiration: January 2016, Exercise Price: $40.00 | 12 | | | 2,640 | |
| HAS 160115P00045000 | | Expiration: January 2016, Exercise Price: $45.00 | 7 | | | 2,100 | |
| | | International Game Technology | | | | | |
| IGT 150117P00010000 | | Expiration: January 2015, Exercise Price: $10.00 | 65 | | | 975 | |
| IGT 150117P00012000 | | Expiration: January 2015, Exercise Price: $12.00 | 57 | | | 2,423 | |
| | | Intuitive Surgical, Inc. | | | | | |
| ISRG 150117P00300000 | | Expiration: January 2015, Exercise Price: $300.00 | 1 | | | 560 | |
| ISRG 150117P00320000 | | Expiration: January 2015, Exercise Price: $320.00 | 1 | | | 875 | |
| | | Stryker Corporation | | | | | |
| SYK 150117P00055000 | | Expiration: January 2015, Exercise Price: $55.00 | 12 | | | 270 | |
| SYK 160115P00055000 | | Expiration: January 2016, Exercise Price: $55.00 | 1 | | | 115 | |
| SYK 160115P00060000 | | Expiration: January 2016, Exercise Price: $60.00 | 2 | | | 325 | |
| | | | | | | 12,260 | |
| | | Motion Picture and Sound Recording Industries | | | | | |
| | | DreamWorks Animation SKG, Inc. — Class A | | | | | |
| DWA 140920P00019000 | | Expiration: September 2014, Exercise Price: $19.00 | 26 | | | 845 | |
| DWA 140920P00020000 | | Expiration: September 2014, Exercise Price: $20.00 | 23 | | | 1,092 | |
| DWA 140920P00023000 | | Expiration: September 2014, Exercise Price: $23.00 | 16 | | | 2,560 | |
| DWA 141220P00018000 | | Expiration: December 2014, Exercise Price: $18.00 | 55 | | | 2,888 | |
| DWA 141220P00020000 | | Expiration: December 2014, Exercise Price: $20.00 | 17 | | | 1,700 | |
| | | | | | | 9,085 | |
| | | Motor Vehicle and Parts Dealers | | | | | |
| | | AutoNation, Inc. | | | | | |
| AN 141018P00045000 | | Expiration: October 2014, Exercise Price: $45.00 | 7 | | | 140 | |
| | | CarMax, Inc. | | | | | |
| KMX 150117P00035000 | | Expiration: January 2015, Exercise Price: $35.00 | 14 | | | 350 | |
| KMX 160115P00030000 | | Expiration: January 2016, Exercise Price: $30.00 | 3 | | | 202 | |
| KMX 160115P00035000 | | Expiration: January 2016, Exercise Price: $35.00 | 38 | | | 4,750 | |
| | | | | | | 5,442 | |
The accompanying notes are an integral part of these financial statements.
| KINETICS PORTFOLIOS TRUST — MASTER INVESTMENT PORTFOLIOS |
| The Alternative Income Portfolio |
Portfolio of Options Written — June 30, 2014 (Unaudited) — (Continued) |
| Identifier | | | Contractsd | | | Value | |
| | | Nonmetallic Mineral Product Manufacturing | | | | | |
| | | USG Corporation | | | | | |
| USG 141122P00020000 | | Expiration: November 2014, Exercise Price: $20.00 | 5 | | $ | 88 | |
| USG 150117P00020000 | | Expiration: January 2015, Exercise Price: $20.00 | 20 | | | 600 | |
| USG 160115P00020000 | | Expiration: January 2016, Exercise Price: $20.00 | 50 | | | 7,000 | |
| | | | | | | 7,688 | |
| | | Non-Store Retailers | | | | | |
| | | Sotheby’s | | | | | |
| BID 141018P00030000 | | Expiration: October 2014, Exercise Price: $30.00 | 5 | | | 137 | |
| BID 141018P00032000 | | Expiration: October 2014, Exercise Price: $32.00 | 4 | | | 160 | |
| BID 150117P00025000 | | Expiration: January 2015, Exercise Price: $25.00 | 4 | | | 140 | |
| BID 150117P00029000 | | Expiration: January 2015, Exercise Price: $29.00 | 12 | | | 690 | |
| BID 150117P00030000 | | Expiration: January 2015, Exercise Price: $30.00 | 10 | | | 700 | |
| BID 150117P00035000 | | Expiration: January 2015, Exercise Price: $35.00 | 6 | | | 825 | |
| BID1 150117P00037000 | | Expiration: January 2015, Exercise Price: $37.00 | 10 | | | 975 | |
| BID 160115P00030000 | | Expiration: January 2016, Exercise Price: $30.00 | 16 | | | 3,400 | |
| BID1 160115P00035000 | | Expiration: January 2016, Exercise Price: $35.00 | 2 | | | 330 | |
| | | | | | | 7,357 | |
| | | Oil and Gas Extraction | | | | | |
| | | Anadarko Petroleum Corporation | | | | | |
| APC 150117P00067500 | | Expiration: January 2015, Exercise Price: $67.50 | 9 | | | 193 | |
| APC 160115P00055000 | | Expiration: January 2016, Exercise Price: $55.00 | 5 | | | 205 | |
| APC 160115P00060000 | | Expiration: January 2016, Exercise Price: $60.00 | 3 | | | 210 | |
| APC 160115P00072500 | | Expiration: January 2016, Exercise Price: $72.50 | 1 | | | 170 | |
| APC 160115P00075000 | | Expiration: January 2016, Exercise Price: $75.00 | 1 | | | 229 | |
| | | Apache Corporation | | | | | |
| APA 160115P00060000 | | Expiration: January 2016, Exercise Price: $60.00 | 7 | | | 679 | |
| APA 160115P00065000 | | Expiration: January 2016, Exercise Price: $65.00 | 3 | | | 415 | |
| | | Canadian Natural Resources Ltd. | | | | | |
| CNQ 160115P00030000 | | Expiration: January 2016, Exercise Price: $30.00 | 4 | | | 290 | |
| | | Chesapeake Energy Corporation | | | | | |
| CHK 150117P00018000 | | Expiration: January 2015, Exercise Price: $18.00 | 63 | | | 441 | |
| CHK 150117P00020000 | | Expiration: January 2015, Exercise Price: $20.00 | 10 | | | 120 | |
| CHK 160115P00018000 | | Expiration: January 2016, Exercise Price: $18.00 | 5 | | | 247 | |
| CHK 160115P00020000 | | Expiration: January 2016, Exercise Price: $20.00 | 57 | | | 4,360 | |
The accompanying notes are an integral part of these financial statements.
| KINETICS PORTFOLIOS TRUST — MASTER INVESTMENT PORTFOLIOS |
| The Alternative Income Portfolio |
Portfolio of Options Written — June 30, 2014 (Unaudited) — (Continued) |
| Identifier | | | Contractsd | | | Value | |
| | | Oil and Gas Extraction — (Continued) | | | | | |
| | | Continental Resources, Inc. | | | | | |
| CLR 141220P00100000 | | Expiration: December 2014, Exercise Price: $100.00 | 1 | | $ | 52 | |
| CLR 150117P00075000 | | Expiration: January 2015, Exercise Price: $75.00 | 13 | | | 162 | |
| CLR 150117P00080000 | | Expiration: January 2015, Exercise Price: $80.00 | 13 | | | 195 | |
| CLR 150117P00090000 | | Expiration: January 2015, Exercise Price: $90.00 | 1 | | | 35 | |
| CLR 150117P00100000 | | Expiration: January 2015, Exercise Price: $100.00 | 1 | | | 68 | |
| CLR 160115P00075000 | | Expiration: January 2016, Exercise Price: $75.00 | 1 | | | 153 | |
| CLR 160115P00080000 | | Expiration: January 2016, Exercise Price: $80.00 | 3 | | | 540 | |
| CLR 160115P00110000 | | Expiration: January 2016, Exercise Price: $110.00 | 1 | | | 600 | |
| | | Encana Corporation | | | | | |
| ECA 150117P00013000 | | Expiration: January 2015, Exercise Price: $13.00 | 25 | | | 187 | |
| ECA 150117P00015000 | | Expiration: January 2015, Exercise Price: $15.00 | 15 | | | 188 | |
| ECA 160115P00013000 | | Expiration: January 2016, Exercise Price: $13.00 | 14 | | | 350 | |
| | | EOG Resources, Inc. | | | | | |
| EOG 150117P00062500 | | Expiration: January 2015, Exercise Price: $62.50 | 6 | | | 156 | |
| EOG 150117P00075000 | | Expiration: January 2015, Exercise Price: $75.00 | 2 | | | 114 | |
| EOG 160115P00060000 | | Expiration: January 2016, Exercise Price: $60.00 | 2 | | | 205 | |
| EOG 160115P00065000 | | Expiration: January 2016, Exercise Price: $65.00 | 2 | | | 275 | |
| EOG 160115P00067500 | | Expiration: January 2016, Exercise Price: $67.50 | 14 | | | 2,247 | |
| EOG 160115P00070000 | | Expiration: January 2016, Exercise Price: $70.00 | 2 | | | 372 | |
| EOG 160115P00075000 | | Expiration: January 2016, Exercise Price: $75.00 | 4 | | | 986 | |
| | | Marathon Oil Corporation | | | | | |
| MRO 160115P00025000 | | Expiration: January 2016, Exercise Price: $25.00 | 19 | | | 1,036 | |
| | | Occidental Petroleum Corporation | | | | | |
| OXY 160115P00065000 | | Expiration: January 2016, Exercise Price: $65.00 | 2 | | | 239 | |
| OXY 160115P00070000 | | Expiration: January 2016, Exercise Price: $70.00 | 11 | | | 1,876 | |
| | | Pioneer Natural Resources Company | | | | | |
| PXD 141220P00150000 | | Expiration: December 2014, Exercise Price: $150.00 | 1 | | | 120 | |
| PXD 160115P00150000 | | Expiration: January 2016, Exercise Price: $150.00 | 1 | | | 750 | |
| PXD 160115P00160000 | | Expiration: January 2016, Exercise Price: $160.00 | 1 | | | 955 | |
| | | Talisman Energy Inc. | | | | | |
| TLM 150117P00008000 | | Expiration: January 2015, Exercise Price: $8.00 | 12 | | | 300 | |
| TLM 160115P00008000 | | Expiration: January 2016, Exercise Price: $8.00 | 132 | | | 9,570 | |
| | | | | | | 29,290 | |
| | | Other Exchanges | | | | | |
| | | CBOE Holdings Inc. | | | | | |
| CBOE 150117P00038750 | | Expiration: January 2015, Exercise Price: $38.75 | 30 | | | 2,475 | |
| CBOE 160115P00034500 | | Expiration: January 2016, Exercise Price: $34.50 | 10 | | | 1,350 | |
| CBOE 160115P00039500 | | Expiration: January 2016, Exercise Price: $39.50 | 2 | | | 525 | |
| | | | | | | 4,350 | |
The accompanying notes are an integral part of these financial statements.
| KINETICS PORTFOLIOS TRUST — MASTER INVESTMENT PORTFOLIOS |
| The Alternative Income Portfolio |
Portfolio of Options Written — June 30, 2014 (Unaudited) — (Continued) |
| Identifier | | | Contractsd | | | Value | |
| | | Other Information Services | | | | | |
| | | Google Inc. — Class A/C | | | | | |
| GOLG8 150117P00850000 | | Expiration: January 2015, Exercise Price: $850.00 | 1e | | $ | 48 | |
| GOLG1 150117P00950000 | | Expiration: January 2015, Exercise Price: $950.00 | 1 | | | 1,200 | |
| GOLG1 160115P00830000 | | Expiration: January 2016, Exercise Price: $830.00 | 1 | | | 2,160 | |
| GOLG8 160115P00900000 | | Expiration: January 2016, Exercise Price: $900.00 | 1e | | | 337 | |
| | | | | | | 3,745 | |
| | | Paper Manufacturing | | | | | |
| | | Kimberly-Clark Corporation | | | | | |
| KMB 150117P00082500 | | Expiration: January 2015, Exercise Price: $82.50 | 8 | | | 280 | |
| | | Performing Arts, Spectator Sports, and Related Industries | | | | | |
| | | Live Nation Entertainment, Inc. | | | | | |
| LYV 141018P00016000 | | Expiration: October 2014, Exercise Price: $16.00 | 9 | | | 112 | |
| LYV 150117P00012000 | | Expiration: January 2015, Exercise Price: $12.00 | 79 | | | 988 | |
| LYV 150117P00016000 | | Expiration: January 2015, Exercise Price: $16.00 | 9 | | | 158 | |
| LYV 150117P00017000 | | Expiration: January 2015, Exercise Price: $17.00 | 10 | | | 250 | |
| LYV 160115P00013000 | | Expiration: January 2016, Exercise Price: $13.00 | 48 | | | 2,640 | |
| LYV 160115P00015000 | | Expiration: January 2016, Exercise Price: $15.00 | 8 | | | 540 | |
| LYV 160115P00017000 | | Expiration: January 2016, Exercise Price: $17.00 | 10 | | | 1,075 | |
| | | | | | | 5,763 | |
| | | Petroleum and Coal Products Manufacturing | | | | | |
| | | ConocoPhillips | | | | | |
| COP 160115P00050000 | | Expiration: January 2016, Exercise Price: $50.00 | 10 | | | 560 | |
| | | Hess Corporation | | | | | |
| HES 150117P00055000 | | Expiration: January 2015, Exercise Price: $55.00 | 4 | | | 42 | |
| HES 150117P00057500 | | Expiration: January 2015, Exercise Price: $57.50 | 2 | | | 24 | |
| HES 150117P00060000 | | Expiration: January 2015, Exercise Price: $60.00 | 2 | | | 29 | |
| HES 160115P00055000 | | Expiration: January 2016, Exercise Price: $55.00 | 4 | | | 258 | |
| HES 160115P00060000 | | Expiration: January 2016, Exercise Price: $60.00 | 26 | | | 2,886 | |
| | | Marathon Petroleum Corporation | | | | | |
| MPC 150117P00065000 | | Expiration: January 2015, Exercise Price: $65.00 | 1 | | | 185 | |
| MPC 150117P00067500 | | Expiration: January 2015, Exercise Price: $67.50 | 2 | | | 490 | |
| MPC 160115P00062500 | | Expiration: January 2016, Exercise Price: $62.50 | 2 | | | 960 | |
| MPC 160115P00065000 | | Expiration: January 2016, Exercise Price: $65.00 | 2 | | | 1,140 | |
| MPC 160115P00067500 | | Expiration: January 2016, Exercise Price: $67.50 | 1 | | | 660 | |
| MPC 160115P00070000 | | Expiration: January 2016, Exercise Price: $70.00 | 1 | | | 780 | |
The accompanying notes are an integral part of these financial statements.
| KINETICS PORTFOLIOS TRUST — MASTER INVESTMENT PORTFOLIOS |
| The Alternative Income Portfolio |
Portfolio of Options Written — June 30, 2014 (Unaudited) — (Continued) |
| Identifier | | | Contractsd | | | Value | |
| | | Petroleum and Coal Products Manufacturing — (Continued) | | | | | |
| | | Phillips 66 | | | | | |
| PSX 150117P00050000 | | Expiration: January 2015, Exercise Price: $50.00 | 4 | | $ | 80 | |
| PSX 150117P00055000 | | Expiration: January 2015, Exercise Price: $55.00 | 1 | | | 35 | |
| PSX 160115P00045000 | | Expiration: January 2016, Exercise Price: $45.00 | 6 | | | 465 | |
| PSX 160115P00055000 | | Expiration: January 2016, Exercise Price: $55.00 | 15 | | | 3,037 | |
| PSX 160115P00057500 | | Expiration: January 2016, Exercise Price: $57.50 | 4 | | | 970 | |
| PSX 160115P00060000 | | Expiration: January 2016, Exercise Price: $60.00 | 2 | | | 625 | |
| PSX 160115P00062500 | | Expiration: January 2016, Exercise Price: $62.50 | 3 | | | 1,095 | |
| | | Valero Energy Corporation | | | | | |
| VLO 141220P00040000 | | Expiration: December 2014, Exercise Price: $40.00 | 6 | | | 558 | |
| VLO 150117P00035000 | | Expiration: January 2015, Exercise Price: $35.00 | 8 | | | 352 | |
| VLO 150117P00040000 | | Expiration: January 2015, Exercise Price: $40.00 | 8 | | | 904 | |
| VLO 150117P00042000 | | Expiration: January 2015, Exercise Price: $42.00 | 4 | | | 642 | |
| VLO 160115P00035000 | | Expiration: January 2016, Exercise Price: $35.00 | 32 | | | 6,320 | |
| VLO 160115P00038000 | | Expiration: January 2016, Exercise Price: $38.00 | 6 | | | 1,689 | |
| VLO 160115P00040000 | | Expiration: January 2016, Exercise Price: $40.00 | 3 | | | 1,028 | |
| | | | | | | 25,814 | |
| | | Pharmaceutical and Biotechnology | | | | | |
| | | AbbVie Inc. | | | | | |
| ABBV 150117P00035000 | | Expiration: January 2015, Exercise Price: $35.00 | 12 | | | 210 | |
| ABBV 160115P00035000 | | Expiration: January 2016, Exercise Price: $35.00 | 26 | | | 2,795 | |
| ABBV 160115P00037500 | | Expiration: January 2016, Exercise Price: $37.50 | 21 | | | 3,150 | |
| ABBV 160115P00040000 | | Expiration: January 2016, Exercise Price: $40.00 | 5 | | | 925 | |
| | | Allergan, Inc. | | | | | |
| AGN 150117P00085000 | | Expiration: January 2015, Exercise Price: $85.00 | 1 | | | 67 | |
| AGN 150117P00092500 | | Expiration: January 2015, Exercise Price: $92.50 | 1 | | | 80 | |
| AGN 160115P00092500 | | Expiration: January 2016, Exercise Price: $92.50 | 1 | | | 150 | |
| | | Amgen Inc. | | | | | |
| AMGN 150117P00080000 | | Expiration: January 2015, Exercise Price: $80.00 | 1 | | | 46 | |
| AMGN 150117P00082500 | | Expiration: January 2015, Exercise Price: $82.50 | 3 | | | 166 | |
| AMGN 150117P00087500 | | Expiration: January 2015, Exercise Price: $87.50 | 4 | | | 318 | |
| AMGN 150117P00090000 | | Expiration: January 2015, Exercise Price: $90.00 | 2 | | | 194 | |
| AMGN 150117P00100000 | | Expiration: January 2015, Exercise Price: $100.00 | 5 | | | 1,030 | |
| AMGN 160115P00080000 | | Expiration: January 2016, Exercise Price: $80.00 | 2 | | | 502 | |
| AMGN 160115P00085000 | | Expiration: January 2016, Exercise Price: $85.00 | 9 | | | 2,993 | |
| AMGN 160115P00090000 | | Expiration: January 2016, Exercise Price: $90.00 | 2 | | | 865 | |
The accompanying notes are an integral part of these financial statements.
| KINETICS PORTFOLIOS TRUST — MASTER INVESTMENT PORTFOLIOS |
| The Alternative Income Portfolio |
Portfolio of Options Written — June 30, 2014 (Unaudited) — (Continued) |
| Identifier | | | Contractsd | | | Value | |
| | | Pharmaceutical and Biotechnology — (Continued) | | | | | |
| | | Biogen Idec, Inc. | | | | | |
| BIIB 150117P00200000 | | Expiration: January 2015, Exercise Price: $200.00 | 1 | | $ | 225 | |
| BIIB 150117P00210000 | | Expiration: January 2015, Exercise Price: $210.00 | 1 | | | 287 | |
| BIIB 150117P00220000 | | Expiration: January 2015, Exercise Price: $220.00 | 1 | | | 375 | |
| BIIB 150117P00225000 | | Expiration: January 2015, Exercise Price: $225.00 | 1 | | | 425 | |
| BIIB 160115P00210000 | | Expiration: January 2016, Exercise Price: $210.00 | 1 | | | 1,220 | |
| | | Bristol-Myers Squibb Company | | | | | |
| BMY 150117P00035000 | | Expiration: January 2015, Exercise Price: $35.00 | 4 | | | 72 | |
| BMY 150117P00037000 | | Expiration: January 2015, Exercise Price: $37.00 | 12 | | | 354 | |
| BMY 150117P00040000 | | Expiration: January 2015, Exercise Price: $40.00 | 10 | | | 610 | |
| BMY 150117P00042000 | | Expiration: January 2015, Exercise Price: $42.00 | 3 | | | 300 | |
| BMY 160115P00035000 | | Expiration: January 2016, Exercise Price: $35.00 | 18 | | | 2,304 | |
| BMY 160115P00040000 | | Expiration: January 2016, Exercise Price: $40.00 | 10 | | | 2,470 | |
| | | Eli Lilly & Company | | | | | |
| LLY 150117P00043000 | | Expiration: January 2015, Exercise Price: $43.00 | 10 | | | 245 | |
| LLY 160115P00045000 | | Expiration: January 2016, Exercise Price: $45.00 | 5 | | | 605 | |
| | | Gilead Sciences, Inc. | | | | | |
| GILD 141122P00055000 | | Expiration: November 2014, Exercise Price: $55.00 | 6 | | | 108 | |
| GILD 150117P00047500 | | Expiration: January 2015, Exercise Price: $47.50 | 2 | | | 45 | |
| GILD 150117P00050000 | | Expiration: January 2015, Exercise Price: $50.00 | 4 | | | 102 | |
| GILD 150117P00057500 | | Expiration: January 2015, Exercise Price: $57.50 | 14 | | | 735 | |
| GILD 150117P00060000 | | Expiration: January 2015, Exercise Price: $60.00 | 1 | | | 72 | |
| GILD 150117P00062500 | | Expiration: January 2015, Exercise Price: $62.50 | 2 | | | 190 | |
| GILD 160115P00050000 | | Expiration: January 2016, Exercise Price: $50.00 | 4 | | | 510 | |
| GILD 160115P00057500 | | Expiration: January 2016, Exercise Price: $57.50 | 2 | | | 506 | |
| GILD 160115P00060000 | | Expiration: January 2016, Exercise Price: $60.00 | 2 | | | 605 | |
| | | Merck & Co., Inc. | | | | | |
| MRK 150117P00038000 | | Expiration: January 2015, Exercise Price: $38.00 | 6 | | | 102 | |
| MRK 160115P00035000 | | Expiration: January 2016, Exercise Price: $35.00 | 7 | | | 374 | |
| MRK 160115P00038000 | | Expiration: January 2016, Exercise Price: $38.00 | 8 | | | 612 | |
| MRK 160115P00045000 | | Expiration: January 2016, Exercise Price: $45.00 | 5 | | | 883 | |
| | | Pfizer, Inc. | | | | | |
| PFE 150117P00022000 | | Expiration: January 2015, Exercise Price: $22.00 | 50 | | | 525 | |
| PFE 160115P00023000 | | Expiration: January 2016, Exercise Price: $23.00 | 23 | | | 1,691 | |
| | | | | | | 30,043 | |
The accompanying notes are an integral part of these financial statements.
| KINETICS PORTFOLIOS TRUST — MASTER INVESTMENT PORTFOLIOS |
| The Alternative Income Portfolio |
Portfolio of Options Written — June 30, 2014 (Unaudited) — (Continued) |
| Identifier | | | Contractsd | | | Value | |
| | | Pipeline Transportation | | | | | |
| | | The Williams Companies, Inc. | | | | | |
| WMB 150117P00030000 | | Expiration: January 2015, Exercise Price: $30.00 | 5 | | $ | 22 | |
| WMB 160115P00025000 | | Expiration: January 2016, Exercise Price: $25.00 | 21 | | | 368 | |
| WMB 160115P00028000 | | Expiration: January 2016, Exercise Price: $28.00 | 8 | | | 256 | |
| WMB 160115P00030000 | | Expiration: January 2016, Exercise Price: $30.00 | 52 | | | 1,872 | |
| | | | | | | 2,518 | |
| | | Primary Metal Manufacturing | | | | | |
| | | Nucor Corporation | | | | | |
| NUE 150117P00038000 | | Expiration: January 2015, Exercise Price: $38.00 | 20 | | | 830 | |
| | | Professional, Scientific, and Technical Services | | | | | |
| | | Cerner Corporation | | | | | |
| CERN 150117P00035000 | | Expiration: January 2015, Exercise Price: $35.00 | 20 | | | 500 | |
| CERN 150117P00037500 | | Expiration: January 2015, Exercise Price: $37.50 | 18 | | | 765 | |
| CERN 150117P00040000 | | Expiration: January 2015, Exercise Price: $40.00 | 8 | | | 500 | |
| CERN 150117P00042500 | | Expiration: January 2015, Exercise Price: $42.50 | 3 | | | 300 | |
| CERN 160115P00040000 | | Expiration: January 2016, Exercise Price: $40.00 | 10 | | | 2,475 | |
| | | Fluor Corporation | | | | | |
| FLR 150117P00052500 | | Expiration: January 2015, Exercise Price: $52.50 | 4 | | | 130 | |
| FLR 150117P00060000 | | Expiration: January 2015, Exercise Price: $60.00 | 8 | | | 620 | |
| FLR 160115P00050000 | | Expiration: January 2016, Exercise Price: $50.00 | 9 | | | 1,260 | |
| FLR 160115P00055000 | | Expiration: January 2016, Exercise Price: $55.00 | 3 | | | 645 | |
| FLR 160115P00057500 | | Expiration: January 2016, Exercise Price: $57.50 | 2 | | | 540 | |
| FLR 160115P00060000 | | Expiration: January 2016, Exercise Price: $60.00 | 9 | | | 2,925 | |
| | | The Interpublic Group of Companies, Inc. | | | | | |
| IPG 150117P00008000 | | Expiration: January 2015, Exercise Price: $8.00 | 50 | | | 625 | |
| | | Leidos Holdings Inc. | | | | | |
| LDOS1 150117P00007000 | | Expiration: January 2015, Exercise Price: $7.00 | 50 | | | 500 | |
| LDOS 150117P00035000 | | Expiration: January 2015, Exercise Price: $35.00 | 6 | | | 1,080 | |
| LDOS 160115P00035000 | | Expiration: January 2016, Exercise Price: $35.00 | 8 | | | 3,360 | |
| | | | | | | 16,225 | |
| | | Publishing Industries (except Internet) | | | | | |
| | | Autodesk, Inc. | | | | | |
| ADSK 141018P00036000 | | Expiration: October 2014, Exercise Price: $36.00 | 4 | | | 48 | |
| ADSK 150117P00035000 | | Expiration: January 2015, Exercise Price: $35.00 | 8 | | | 288 | |
| ADSK 150117P00037000 | | Expiration: January 2015, Exercise Price: $37.00 | 6 | | | 288 | |
| ADSK 150117P00039000 | | Expiration: January 2015, Exercise Price: $39.00 | 2 | | | 127 | |
| ADSK 150117P00040000 | | Expiration: January 2015, Exercise Price: $40.00 | 4 | | | 296 | |
| ADSK 160115P00037000 | | Expiration: January 2016, Exercise Price: $37.00 | 4 | | | 766 | |
| ADSK 160115P00040000 | | Expiration: January 2016, Exercise Price: $40.00 | 2 | | | 514 | |
The accompanying notes are an integral part of these financial statements.
| KINETICS PORTFOLIOS TRUST — MASTER INVESTMENT PORTFOLIOS |
| The Alternative Income Portfolio |
Portfolio of Options Written — June 30, 2014 (Unaudited) — (Continued) |
| Identifier | | | Contractsd | | | Value | |
| | | Publishing Industries (except Internet) — (Continued) | | | | | |
| | | Electronic Arts Inc. | | | | | |
| EA 141220P00021000 | | Expiration: December 2014, Exercise Price: $21.00 | 7 | | $ | 70 | |
| EA 141220P00026000 | | Expiration: December 2014, Exercise Price: $26.00 | 3 | | | 105 | |
| EA 150117P00017000 | | Expiration: January 2015, Exercise Price: $17.00 | 5 | | | 27 | |
| EA 150117P00020000 | | Expiration: January 2015, Exercise Price: $20.00 | 21 | | | 210 | |
| EA 150117P00026000 | | Expiration: January 2015, Exercise Price: $26.00 | 3 | | | 129 | |
| EA 160115P00015000 | | Expiration: January 2016, Exercise Price: $15.00 | 12 | | | 294 | |
| EA 160115P00018000 | | Expiration: January 2016, Exercise Price: $18.00 | 5 | | | 225 | |
| | | Nuance Communications, Inc. | | | | | |
| NUAN 150117P00010000 | | Expiration: January 2015, Exercise Price: $10.00 | 84 | | | 420 | |
| NUAN 160115P00010000 | | Expiration: January 2016, Exercise Price: $10.00 | 8 | | | 160 | |
| | | | | | | 3,967 | |
| | | Rail Transportation | | | | | |
| | | CSX Corporation | | | | | |
| CSX 150117P00020000 | | Expiration: January 2015, Exercise Price: $20.00 | 10 | | | 125 | |
| CSX 160115P00020000 | | Expiration: January 2016, Exercise Price: $20.00 | 15 | | | 750 | |
| | | Norfolk Southern Corporation | | | | | |
| NSC 150117P00067500 | | Expiration: January 2015, Exercise Price: $67.50 | 1 | | | 25 | |
| NSC 160115P00060000 | | Expiration: January 2016, Exercise Price: $60.00 | 1 | | | 90 | |
| NSC 160115P00075000 | | Expiration: January 2016, Exercise Price: $75.00 | 1 | | | 252 | |
| | | | | | | 1,242 | |
| | | Real Estate | | | | | |
| | | General Growth Properties, Inc. | | | | | |
| GGP 150117P00015000 | | Expiration: January 2015, Exercise Price: $15.00 | 60 | | | 300 | |
| | | Satellite Telecommunications | | | | | |
| | | DIRECTV | | | | | |
| DTV 160115P00050000 | | Expiration: January 2016, Exercise Price: $50.00 | 1 | | | 37 | |
| DTV 160115P00055000 | | Expiration: January 2016, Exercise Price: $55.00 | 1 | | | 84 | |
| | | DISH Network Corp. — Class A | | | | | |
| DISH 141220P00045000 | | Expiration: December 2014, Exercise Price: $45.00 | 3 | | | 225 | |
| DISH 150117P00035000 | | Expiration: January 2015, Exercise Price: $35.00 | 17 | | | 552 | |
| DISH 150117P00040000 | | Expiration: January 2015, Exercise Price: $40.00 | 11 | | | 605 | |
| DISH 150117P00041000 | | Expiration: January 2015, Exercise Price: $41.00 | 20 | | | 1,100 | |
| DISH 150117P00045000 | | Expiration: January 2015, Exercise Price: $45.00 | 2 | | | 185 | |
| DISH 150117P00046000 | | Expiration: January 2015, Exercise Price: $46.00 | 2 | | | 200 | |
| DISH 160115P00043000 | | Expiration: January 2016, Exercise Price: $43.00 | 3 | | | 705 | |
| DISH 160115P00045000 | | Expiration: January 2016, Exercise Price: $45.00 | 5 | | | 1,363 | |
The accompanying notes are an integral part of these financial statements.
| KINETICS PORTFOLIOS TRUST — MASTER INVESTMENT PORTFOLIOS |
| The Alternative Income Portfolio |
Portfolio of Options Written — June 30, 2014 (Unaudited) — (Continued) |
| Identifier | | | Contractsd | | | Value | |
| | | Satellite Telecommunications — (Continued) | | | | | |
| | | Liberty Global plc — Class A | | | | | |
| LBTYA 160115P00035000 | | Expiration: January 2016, Exercise Price: $35.00 | 2 | | $ | 390 | |
| LBTY2 160115P00060000 | | Expiration: January 2016, Exercise Price: $60.00 | 3 | | | 893 | |
| | | | | | | 6,339 | |
| | | Securities, Commodity Contracts, and Other Financial | | | | | |
| | | Investments and Related Activities | | | | | |
| | | The Charles Schwab Corporation | | | | | |
| SCHW 150117P00015000 | | Expiration: January 2015, Exercise Price: $15.00 | 63 | | | 630 | |
| SCHW 150117P00017000 | | Expiration: January 2015, Exercise Price: $17.00 | 4 | | | 50 | |
| SCHW 150117P00020000 | | Expiration: January 2015, Exercise Price: $20.00 | 20 | | | 500 | |
| SCHW 160115P00018000 | | Expiration: January 2016, Exercise Price: $18.00 | 20 | | | 1,350 | |
| SCHW 160115P00020000 | | Expiration: January 2016, Exercise Price: $20.00 | 15 | | | 1,538 | |
| | | CME Group Inc. | | | | | |
| CME 150117P00042500 | | Expiration: January 2015, Exercise Price: $42.50 | 11 | | | 192 | |
| CME 150117P00045000 | | Expiration: January 2015, Exercise Price: $45.00 | 7 | | | 157 | |
| CME 150117P00052500 | | Expiration: January 2015, Exercise Price: $52.50 | 1 | | | 58 | |
| CME 150117P00055000 | | Expiration: January 2015, Exercise Price: $55.00 | 2 | | | 150 | |
| CME 150117P00060000 | | Expiration: January 2015, Exercise Price: $60.00 | 6 | | | 840 | |
| CME 160115P00050000 | | Expiration: January 2016, Exercise Price: $50.00 | 4 | | | 930 | |
| CME 160115P00055000 | | Expiration: January 2016, Exercise Price: $55.00 | 10 | | | 3,400 | |
| | | Morgan Stanley | | | | | |
| MS 160115P00020000 | | Expiration: January 2016, Exercise Price: $20.00 | 9 | | | 468 | |
| MS 160115P00023000 | | Expiration: January 2016, Exercise Price: $23.00 | 39 | | | 3,568 | |
| | | | | | | 13,831 | |
| | | Software | | | | | |
| | | Adobe Systems, Inc. | | | | | |
| ADBE 150117P00042000 | | Expiration: January 2015, Exercise Price: $42.00 | 8 | | | 164 | |
| ADBE 160115P00045000 | | Expiration: January 2016, Exercise Price: $45.00 | 12 | | | 1,524 | |
| ADBE 160115P00047000 | | Expiration: January 2016, Exercise Price: $47.00 | 9 | | | 1,359 | |
| ADBE 160115P00050000 | | Expiration: January 2016, Exercise Price: $50.00 | 6 | | | 1,167 | |
| | | | | | | 4,214 | |
| | | Software Publishers | | | | | |
| | | Citrix Systems, Inc. | | | | | |
| CTXS 150117P00045000 | | Expiration: January 2015, Exercise Price: $45.00 | 10 | | | 450 | |
| CTXS 150117P00050000 | | Expiration: January 2015, Exercise Price: $50.00 | 6 | | | 600 | |
| CTXS 160115P00035000 | | Expiration: January 2016, Exercise Price: $35.00 | 2 | | | 165 | |
The accompanying notes are an integral part of these financial statements.
| KINETICS PORTFOLIOS TRUST — MASTER INVESTMENT PORTFOLIOS |
| The Alternative Income Portfolio |
Portfolio of Options Written — June 30, 2014 (Unaudited) — (Continued) |
| Identifier | | | Contractsd | | | Value | |
| | | Software Publishers — (Continued) | | | | | |
| | | Microsoft Corporation | | | | | |
| MSFT 150117P00025000 | | Expiration: January 2015, Exercise Price: $25.00 | 25 | | $ | 162 | |
| MSFT 150117P00028000 | | Expiration: January 2015, Exercise Price: $28.00 | 9 | | | 108 | |
| MSFT 160115P00025000 | | Expiration: January 2016, Exercise Price: $25.00 | 39 | | | 1,618 | |
| MSFT 160115P00028000 | | Expiration: January 2016, Exercise Price: $28.00 | 13 | | | 891 | |
| MSFT 160115P00030000 | | Expiration: January 2016, Exercise Price: $30.00 | 10 | | | 965 | |
| | | Oracle Corporation | | | | | |
| ORCL 150117P00025000 | | Expiration: January 2015, Exercise Price: $25.00 | 13 | | | 150 | |
| ORCL 150117P00028000 | | Expiration: January 2015, Exercise Price: $28.00 | 27 | | | 486 | |
| ORCL 160115P00028000 | | Expiration: January 2016, Exercise Price: $28.00 | 8 | | | 692 | |
| ORCL 160115P00030000 | | Expiration: January 2016, Exercise Price: $30.00 | 3 | | | 354 | |
| | | | | | | 6,641 | |
| | | Support Activities for Mining | | | | | |
| | | Halliburton Company | | | | | |
| HAL 150117P00035000 | | Expiration: January 2015, Exercise Price: $35.00 | 8 | | | 36 | |
| HAL 160115P00035000 | | Expiration: January 2016, Exercise Price: $35.00 | 10 | | | 425 | |
| HAL 160115P00038000 | | Expiration: January 2016, Exercise Price: $38.00 | 22 | | | 1,287 | |
| HAL 160115P00040000 | | Expiration: January 2016, Exercise Price: $40.00 | 6 | | | 462 | |
| HAL 160115P00043000 | | Expiration: January 2016, Exercise Price: $43.00 | 7 | | | 707 | |
| HAL 160115P00045000 | | Expiration: January 2016, Exercise Price: $45.00 | 5 | | | 613 | |
| HAL 160115P00047000 | | Expiration: January 2016, Exercise Price: $47.00 | 2 | | | 298 | |
| HAL 160115P00050000 | | Expiration: January 2016, Exercise Price: $50.00 | 5 | | | 975 | |
| | | Helmerich & Payne, Inc. | | | | | |
| HP 141220P00080000 | | Expiration: December 2014, Exercise Price: $80.00 | 1 | | | 55 | |
| HP 150117P00077500 | | Expiration: January 2015, Exercise Price: $77.50 | 2 | | | 115 | |
| HP 160115P00080000 | | Expiration: January 2016, Exercise Price: $80.00 | 1 | | | 420 | |
| HP 160115P00082500 | | Expiration: January 2016, Exercise Price: $82.50 | 1 | | | 440 | |
| HP 160115P00085000 | | Expiration: January 2016, Exercise Price: $85.00 | 1 | | | 475 | |
| | | Schlumberger Limited | | | | | |
| SLB 150117P00067500 | | Expiration: January 2015, Exercise Price: $67.50 | 1 | | | 15 | |
| SLB 160115P00065000 | | Expiration: January 2016, Exercise Price: $65.00 | 9 | | | 707 | |
| SLB 160115P00070000 | | Expiration: January 2016, Exercise Price: $70.00 | 12 | | | 1,260 | |
| SLB 160115P00085000 | | Expiration: January 2016, Exercise Price: $85.00 | 1 | | | 249 | |
The accompanying notes are an integral part of these financial statements.
| KINETICS PORTFOLIOS TRUST — MASTER INVESTMENT PORTFOLIOS |
| The Alternative Income Portfolio |
Portfolio of Options Written — June 30, 2014 (Unaudited) — (Continued) |
| Identifier | | | Contractsd | | | Value | |
| | | Support Activities for Mining — (Continued) | | | | | |
| | | Transocean Ltd. | | | | | |
| RIG 141122P00031000 | | Expiration: November 2014, Exercise Price: $31.00 | 4 | | $ | 110 | |
| RIG 150117P00033000 | | Expiration: January 2015, Exercise Price: $33.00 | 33 | | | 1,402 | |
| RIG 150117P00038000 | | Expiration: January 2015, Exercise Price: $38.00 | 1 | | | 108 | |
| RIG 160115P00030000 | | Expiration: January 2016, Exercise Price: $30.00 | 13 | | | 1,580 | |
| RIG 160115P00035000 | | Expiration: January 2016, Exercise Price: $35.00 | 16 | | | 3,880 | |
| RIG 160115P00038000 | | Expiration: January 2016, Exercise Price: $38.00 | 1 | | | 363 | |
| | | | | | | 15,982 | |
| | | Support Activities for Transportation | | | | | |
| | | Expeditors International of Washington, Inc. | | | | | |
| EXPD 150117P00032500 | | Expiration: January 2015, Exercise Price: $32.50 | 26 | | | 650 | |
| EXPD 160115P00030000 | | Expiration: January 2016, Exercise Price: $30.00 | 30 | | | 2,325 | |
| EXPD 160115P00035000 | | Expiration: January 2016, Exercise Price: $35.00 | 1 | | | 168 | |
| | | | | | | 3,143 | |
| | | Telecommunications | | | | | |
| | | Verizon Communications Inc. | | | | | |
| VZ 150117P00035000 | | Expiration: January 2015, Exercise Price: $35.00 | 8 | | | 100 | |
| VZ 160115P00035000 | | Expiration: January 2016, Exercise Price: $35.00 | 16 | | | 1,304 | |
| | | | | | | 1,404 | |
| | | Transportation Equipment Manufacturing | | | | | |
| | | American Railcar Industries, Inc. | | | | | |
| ARII 141220P00045000 | | Expiration: December 2014, Exercise Price: $45.00 | 4 | | | 310 | |
| ARII 141220P00050000 | | Expiration: December 2014, Exercise Price: $50.00 | 4 | | | 560 | |
| | | The Boeing Company | | | | | |
| BA 150117P00085000 | | Expiration: January 2015, Exercise Price: $85.00 | 4 | | | 148 | |
| BA 150117P00087500 | | Expiration: January 2015, Exercise Price: $87.50 | 1 | | | 41 | |
| BA 150117P00092500 | | Expiration: January 2015, Exercise Price: $92.50 | 2 | | | 123 | |
| BA 150117P00100000 | | Expiration: January 2015, Exercise Price: $100.00 | 3 | | | 310 | |
| BA 160115P00095000 | | Expiration: January 2016, Exercise Price: $95.00 | 1 | | | 370 | |
| BA 160115P00100000 | | Expiration: January 2016, Exercise Price: $100.00 | 13 | | | 6,078 | |
| BA 160115P00105000 | | Expiration: January 2016, Exercise Price: $105.00 | 2 | | | 1,200 | |
| | | General Dynamics Corporation | | | | | |
| GD 160115P00070000 | | Expiration: January 2016, Exercise Price: $70.00 | 1 | | | 122 | |
| | | Johnson Controls, Inc. | | | | | |
| JCI 150117P00032000 | | Expiration: January 2015, Exercise Price: $32.00 | 2 | | | 35 | |
| JCI 150117P00037000 | | Expiration: January 2015, Exercise Price: $37.00 | 2 | | | 65 | |
| JCI 160115P00033000 | | Expiration: January 2016, Exercise Price: $33.00 | 4 | | | 430 | |
| JCI 160115P00035000 | | Expiration: January 2016, Exercise Price: $35.00 | 28 | | | 3,850 | |
| JCI 160115P00038000 | | Expiration: January 2016, Exercise Price: $38.00 | 2 | | | 395 | |
The accompanying notes are an integral part of these financial statements.
| KINETICS PORTFOLIOS TRUST — MASTER INVESTMENT PORTFOLIOS |
| The Alternative Income Portfolio |
Portfolio of Options Written — June 30, 2014 (Unaudited) — (Continued) |
| Identifier | | | Contractsd | | | Value | |
| | | Transportation Equipment Manufacturing — (Continued) | | | | | |
| | | PACCAR Inc. | | | | | |
| PCAR 150117P00040300 | | Expiration: January 2015, Exercise Price: $40.30 | 18 | | $ | 405 | |
| PCAR 150117P00043300 | | Expiration: January 2015, Exercise Price: $43.30 | 3 | | | 98 | |
| | | Textron Inc. | | | | | |
| TXT 141220P00030000 | | Expiration: December 2014, Exercise Price: $30.00 | 5 | | | 227 | |
| TXT 150117P00027000 | | Expiration: January 2015, Exercise Price: $27.00 | 5 | | | 138 | |
| TXT 150117P00030000 | | Expiration: January 2015, Exercise Price: $30.00 | 5 | | | 270 | |
| TXT 160115P00027000 | | Expiration: January 2016, Exercise Price: $27.00 | 12 | | | 1,578 | |
| | | Toyota Motor Corporation — ADR | | | | | |
| TM 150117P00085000 | | Expiration: January 2015, Exercise Price: $85.00 | 1 | | | 25 | |
| TM 160115P00085000 | | Expiration: January 2016, Exercise Price: $85.00 | 6 | | | 1,335 | |
| TM 160115P00090000 | | Expiration: January 2016, Exercise Price: $90.00 | 2 | | | 537 | |
| | | Toyota Motor Credit Corp. | | | | | |
| TM 160115P00080000 | | Expiration: January 2016, Exercise Price: $80.00 | 1 | | | 157 | |
| | | United Technologies Corporation | | | | | |
| UTX 160115P00080000 | | Expiration: January 2016, Exercise Price: $80.00 | 2 | | | 404 | |
| UTX 160115P00085000 | | Expiration: January 2016, Exercise Price: $85.00 | 3 | | | 789 | |
| | | | | | | 20,000 | |
| | | U.S. Equity Exchanges | | | | | |
| | | The NASDAQ OMX Group, Inc. | | | | | |
| NDAQ 141220P00027000 | | Expiration: December 2014, Exercise Price: $27.00 | 5 | | $ | 75 | |
| NDAQ 160115P00030000 | | Expiration: January 2016, Exercise Price: $30.00 | 9 | | | 1,508 | |
| | | | | | | 1,583 | |
| | | Waste Management and Remediation Services | | | | | |
| | | Waste Management, Inc. | | | | | |
| WM 160115P00035000 | | Expiration: January 2016, Exercise Price: $35.00 | 2 | | | 200 | |
| | | TOTAL PUT OPTIONS WRITTEN | | | | | |
| | | (premiums received $1,565,600) | | | $ | 684,115 | |
| d — | 100 Shares Per Contract Unless Otherwise Noted. |
| e — | 10 Shares Per Contract |
| ADR — American Depository Receipt. |
| ETF — Exchange Traded Fund |
The accompanying notes are an integral part of these financial statements.
| KINETICS PORTFOLIOS TRUST — MASTER INVESTMENT PORTFOLIOS |
| The Multi-Disciplinary Portfolio |
Portfolio of Options Written — June 30, 2014 (Unaudited) — (Continued) |
| Identifier | | PUT OPTIONS WRITTEN | Contractsd | | | Value | |
| | | Accommodation | | | | | |
| | | Carnival Corporation | | | | | |
| CCL 150117P00032500 | | Expiration: January 2015, Exercise Price: $32.50 | 16 | | $ | 1,280 | |
| | | Marriott International Inc. — Class A | | | | | |
| MAR 150117P00035000 | | Expiration: January 2015, Exercise Price: $35.00 | 16 | | | 120 | |
| MAR 160115P00040000 | | Expiration: January 2016, Exercise Price: $40.00 | 76 | | | 5,320 | |
| MAR 160115P00042000 | | Expiration: January 2016, Exercise Price: $42.00 | 32 | | | 2,880 | |
| | | Royal Caribbean Cruises Ltd. | | | | | |
| RCL 150117P00028000 | | Expiration: January 2015, Exercise Price: $28.00 | 52 | | | 676 | |
| | | | | | | 10,276 | |
| | | Administrative and Support Services | | | | | |
| | | Expedia, Inc. | | | | | |
| EXPE 150117P00039480 | | Expiration: January 2015, Exercise Price: $39.48 | 9 | | | 90 | |
| EXPE 160115P00050000 | | Expiration: January 2016, Exercise Price: $50.00 | 102 | | | 31,365 | |
| EXPE 160115P00055000 | | Expiration: January 2016, Exercise Price: $55.00 | 12 | | | 5,220 | |
| | | | | | | 36,675 | |
| | | Ambulatory Health Care Services | | | | | |
| | | DaVita HealthCare Partners Inc. | | | | | |
| DVA 160115P00050000 | | Expiration: January 2016, Exercise Price: $50.00 | 50 | | | 4,500 | |
| | | | | | | | |
| | | Apparel Manufacturing | | | | | |
| | | L Brands, Inc. | | | | | |
| LB 150117P00041000 | | Expiration: January 2015, Exercise Price: $41.00 | 41 | | | 1,333 | |
| | | Asset Management | | | | | |
| | | Apollo Global Management LLC — Class A | | | | | |
| APO 160115P00025000 | | Expiration: January 2016, Exercise Price: $25.00 | 28 | | | 11,340 | |
| | | BlackRock, Inc. | | | | | |
| BLK 160115P00250000 | | Expiration: January 2016, Exercise Price: $250.00 | 25 | | | 33,625 | |
| | | The Blackstone Group LP | | | | | |
| BX 160115P00025000 | | Expiration: January 2016, Exercise Price: $25.00 | 21 | | | 3,969 | |
| | | Franklin Resources, Inc. | | | | | |
| BEN 160115P00050000 | | Expiration: January 2016, Exercise Price: $50.00 | 56 | | | 20,720 | |
| | | KKR & Co. LP | | | | | |
| KKR 150117P00017000 | | Expiration: January 2015, Exercise Price: $17.00 | 68 | | | 1,020 | |
| | | Oaktree Capital Group LLC | | | | | |
| OAK 140719P00050000 | | Expiration: July 2014, Exercise Price: $50.00 | 8 | | | 700 | |
| OAK 140719P00055000 | | Expiration: July 2014, Exercise Price: $55.00 | 32 | | | 16,160 | |
| | | | | | | 87,534 | |
The accompanying notes are an integral part of these financial statements.
| KINETICS PORTFOLIOS TRUST — MASTER INVESTMENT PORTFOLIOS |
| The Multi-Disciplinary Portfolio |
Portfolio of Options Written — June 30, 2014 (Unaudited) — (Continued) |
| Identifier | | | Contractsd | | | Value | |
| | | Beverage and Tobacco Product Manufacturing | | | | | |
| | | Molson Coors Brewing Company — Class B | | | | | |
| TAP 150117P00040000 | | Expiration: January 2015, Exercise Price: $40.00 | 50 | | $ | 375 | |
| | | Broadcasting (except Internet) | | | | | |
| | | CBS Corporation — Class B | | | | | |
| CBS 150117P00037000 | | Expiration: January 2015, Exercise Price: $37.00 | 3 | | | 30 | |
| CBS 150117P00040000 | | Expiration: January 2015, Exercise Price: $40.00 | 39 | | | 682 | |
| CBS 150117P00042000 | | Expiration: January 2015, Exercise Price: $42.00 | 10 | | | 350 | |
| CBS 150117P00045000 | | Expiration: January 2015, Exercise Price: $45.00 | 8 | | | 400 | |
| CBS 160115P00050000 | | Expiration: January 2016, Exercise Price: $50.00 | 167 | | | 55,945 | |
| | | Comcast Corporation — Class A | | | | | |
| CMCSA 150117P00037000 | | Expiration: January 2015, Exercise Price: $37.00 | 16 | | | 280 | |
| | | Sirius XM Holdings Inc. | | | | | |
| SIRI 160115P00003000 | | Expiration: January 2016, Exercise Price: $3.00 | 336 | | | 9,408 | |
| SIRI 160115P00003500 | | Expiration: January 2016, Exercise Price: $3.50 | 192 | | | 10,080 | |
| | | Twenty-First Century Fox, Inc. — Class A | | | | | |
| FOXA 150117P00027000 | | Expiration: January 2015, Exercise Price: $27.00 | 14 | | | 490 | |
| FOXA1 150117P00027000 | | Expiration: January 2015, Exercise Price: $27.00 | 37 | | | 555 | |
| FOXA 160115P00030000 | | Expiration: January 2016, Exercise Price: $30.00 | 14 | | | 3,115 | |
| | | | | | | 81,335 | |
| | | Building Material and Garden Equipment and Supplies Dealers | | | | | |
| | | Fastenal Company | | | | | |
| FAST 150117P00037500 | | Expiration: January 2015, Exercise Price: $37.50 | 6 | | | 285 | |
| FAST 150117P00042500 | | Expiration: January 2015, Exercise Price: $42.50 | 7 | | | 822 | |
| | | The Sherwin-Williams Company | | | | | |
| SHW 150117P00160000 | | Expiration: January 2015, Exercise Price: $160.00 | 5 | | | 713 | |
| | | | | | | 1,820 | |
| | | Chemical Manufacturing | | | | | |
| | | Celgene Corporation | | | | | |
| CELG 160115P00070000 | | Expiration: January 2016, Exercise Price: $70.00 | 84 | | | 42,210 | |
| | | Monsanto Company | | | | | |
| MON 150117P00090000 | | Expiration: January 2015, Exercise Price: $90.00 | 6 | | | 264 | |
| | | OPKO Health, Inc. | | | | | |
| OPK 160115P00005000 | | Expiration: January 2016, Exercise Price: $5.00 | 168 | | | 12,180 | |
| | | | | | | 54,654 | |
The accompanying notes are an integral part of these financial statements.
| KINETICS PORTFOLIOS TRUST — MASTER INVESTMENT PORTFOLIOS |
| The Multi-Disciplinary Portfolio |
Portfolio of Options Written — June 30, 2014 (Unaudited) — (Continued) |
| Identifier | | | Contractsd | | | Value | |
| | | Clothing and Clothing Accessories Stores | | | | | |
| | | Tiffany & Co. | | | | | |
| TIF 150117P00060000 | | Expiration: January 2015, Exercise Price: $60.00 | 4 | | $ | 82 | |
| TIF 150117P00062500 | | Expiration: January 2015, Exercise Price: $62.50 | 40 | | | 960 | |
| TIF 150117P00065000 | | Expiration: January 2015, Exercise Price: $65.00 | 9 | | | 257 | |
| TIF 160115P00067500 | | Expiration: January 2016, Exercise Price: $67.50 | 14 | | | 3,185 | |
| TIF 160115P00070000 | | Expiration: January 2016, Exercise Price: $70.00 | 34 | | | 9,112 | |
| TIF 160115P00075000 | | Expiration: January 2016, Exercise Price: $75.00 | 14 | | | 5,110 | |
| | | | | | | 18,706 | |
| | | Computer and Electronic Product Manufacturing | | | | | |
| | | Apple, Inc. | | | | | |
| AAPL 160115P00064290 | | Expiration: January 2016, Exercise Price: $64.29 | 77 | | | 15,207 | |
| AAPL 160115P00068570 | | Expiration: January 2016, Exercise Price: $68.57 | 84 | | | 24,192 | |
| AAPL 160115P00071430 | | Expiration: January 2016, Exercise Price: $71.43 | 14 | | | 5,005 | |
| | | Hologic, Inc. | | | | | |
| HOLX 160115P00018000 | | Expiration: January 2016, Exercise Price: $18.00 | 45 | | | 4,275 | |
| | | Sony Corporation | | | | | |
| SNE 150117P00015000 | | Expiration: January 2015, Exercise Price: $15.00 | 24 | | | 1,620 | |
| SNE 150117P00017000 | | Expiration: January 2015, Exercise Price: $17.00 | 180 | | | 27,450 | |
| SNE 160115P00015000 | | Expiration: January 2016, Exercise Price: $15.00 | 240 | | | 37,200 | |
| | | | | | | 114,949 | |
| | | Construction of Buildings | | | | | |
| | | Lennar Corporation — Class A | | | | | |
| LEN 150117P00025000 | | Expiration: January 2015, Exercise Price: $25.00 | 132 | | | 1,650 | |
| LEN 150117P00033000 | | Expiration: January 2015, Exercise Price: $33.00 | 16 | | | 1,056 | |
| LEN 160115P00025000 | | Expiration: January 2016, Exercise Price: $25.00 | 56 | | | 3,976 | |
| LEN 160115P00030000 | | Expiration: January 2016, Exercise Price: $30.00 | 73 | | | 11,279 | |
| | | | | | | 17,961 | |
| | | Credit Intermediation and Related Activities | | | | | |
| | | Altisource Portfolio Solutions SA | | | | | |
| ASPS 140719P00105000 | | Expiration: July 2014, Exercise Price: $105.00 | 36 | | | 7,560 | |
| | | Bank of America Corporation | | | | | |
| BAC 160115P00015000 | | Expiration: January 2016, Exercise Price: $15.00 | 128 | | | 23,232 | |
| | | The Bank Of New York Mellon Corporation | | | | | |
| BK 150117P00025000 | | Expiration: January 2015, Exercise Price: $25.00 | 6 | | | 117 | |
The accompanying notes are an integral part of these financial statements.
| KINETICS PORTFOLIOS TRUST — MASTER INVESTMENT PORTFOLIOS |
| The Multi-Disciplinary Portfolio |
Portfolio of Options Written — June 30, 2014 (Unaudited) — (Continued) |
| Identifier | | | Contractsd | | | Value | |
| | | Credit Intermediation and Related Activities — (Continued) | | | | | |
| | | Ocwen Financial Corporation | | | | | |
| OCN 150117P00045000 | | Expiration: January 2015, Exercise Price: $45.00 | 16 | | $ | 15,520 | |
| OCN 160115P00045000 | | Expiration: January 2016, Exercise Price: $45.00 | 14 | | | 17,780 | |
| OCN 160115P00050000 | | Expiration: January 2016, Exercise Price: $50.00 | 36 | | | 58,860 | |
| | | Wells Fargo & Company | | | | | |
| WFC 160115P00040000 | | Expiration: January 2016, Exercise Price: $40.00 | 16 | | | 2,000 | |
| | | | | | | 125,069 | |
| | | E-Commerce | | | | | |
| | | IAC/InterActiveCorp | | | | | |
| IACI 150117P00040000 | | Expiration: January 2015, Exercise Price: $40.00 | 20 | | | 550 | |
| IACI 150117P00050000 | | Expiration: January 2015, Exercise Price: $50.00 | 56 | | | 5,040 | |
| IACI 150117P00055000 | | Expiration: January 2015, Exercise Price: $55.00 | 10 | | | 1,650 | |
| IACI 150117P00060000 | | Expiration: January 2015, Exercise Price: $60.00 | 18 | | | 5,040 | |
| | | Liberty Interactive Corporation — Class A | | | | | |
| LINTA 150117P00022000 | | Expiration: January 2015, Exercise Price: $22.00 | 136 | | | 3,740 | |
| LINTA 150117P00025000 | | Expiration: January 2015, Exercise Price: $25.00 | 122 | | | 7,930 | |
| | | | | | | 23,950 | |
| | | Fabricated Metal Product Manufacturing | | | | | |
| | | McDermott International, Inc. | | | | | |
| MDR 150117P00008000 | | Expiration: January 2015, Exercise Price: $8.00 | 600 | | | 52,500 | |
| MDR 150117P00010000 | | Expiration: January 2015, Exercise Price: $10.00 | 46 | | | 10,235 | |
| | | | | | | 62,735 | |
| | | Food Services and Drinking Places | | | | | |
| | | Starbucks Corporation | | | | | |
| SBUX 150117P00030000 | | Expiration: January 2015, Exercise Price: $30.00 | 30 | | | 45 | |
| SBUX 150117P00045000 | | Expiration: January 2015, Exercise Price: $45.00 | 2 | | | 14 | |
| SBUX 150117P00052500 | | Expiration: January 2015, Exercise Price: $52.50 | 5 | | | 95 | |
| SBUX 150117P00055000 | | Expiration: January 2015, Exercise Price: $55.00 | 9 | | | 239 | |
| SBUX 150117P00057500 | | Expiration: January 2015, Exercise Price: $57.50 | 24 | | | 900 | |
| SBUX 160115P00067500 | | Expiration: January 2016, Exercise Price: $67.50 | 24 | | | 11,040 | |
| SBUX 160115P00070000 | | Expiration: January 2016, Exercise Price: $70.00 | 28 | | | 15,400 | |
| | | | | | | 27,733 | |
| | | Funds, Trusts, and Other Financial Vehicles | | | | | |
| | | iShares iBoxx $ High Yield Corporate Bond ETF | | | | | |
| HYG 150117P00091000 | | Expiration: January 2015, Exercise Price: $91.00 | 57 | | | 10,972 | |
The accompanying notes are an integral part of these financial statements.
| KINETICS PORTFOLIOS TRUST — MASTER INVESTMENT PORTFOLIOS |
| The Multi-Disciplinary Portfolio |
Portfolio of Options Written — June 30, 2014 (Unaudited) — (Continued) |
| Identifier | | | Contractsd | | | Value | |
| | | Funds, Trusts, and Other Financial Vehicles — (Continued) | | | | | |
| | | Market Vectors Gold Miners ETF | | | | | |
| GDX 150117P00020000 | | Expiration: January 2015, Exercise Price: $20.00 | 50 | | | $ 1,325 | |
| | | Market Vectors Junior Gold Miners ETF | | | | | |
| GDXJ1 150117P00007000 | | Expiration: January 2015, Exercise Price: $7.00 | 50 | | | 875 | |
| | | ProShares Short VIX Short-Term Futures ETF | | | | | |
| SVXY 150117P00020000 | | Expiration: January 2015, Exercise Price: $20.00 | 8 | | | 180 | |
| SVXY 150117P00035000 | | Expiration: January 2015, Exercise Price: $35.00 | 4 | | | 260 | |
| | | SPDR S&P 500 ETF Trust | | | | | |
| SPY 141220P00140000 | | Expiration: December 2014, Exercise Price: $140.00 | 1 | | | 28 | |
| | | | | | | 13,640 | |
| | | Gaming | | | | | |
| | | Las Vegas Sands Corp. | | | | | |
| LVS 150117P00044250 | | Expiration: January 2015, Exercise Price: $44.25. | 9 | | | 329 | |
| LVS 160115P00055000 | | Expiration: January 2016, Exercise Price: $55.00 | 62 | | | 20,925 | |
| LVS 160115P00060000 | | Expiration: January 2016, Exercise Price: $60.00 | 26 | | | 12,415 | |
| | | Wynn Resorts Limited | | | | | |
| WYNN 150117P00117000 | | Expiration: January 2015, Exercise Price: $117.00 | 5 | | | 237 | |
| WYNN 160115P00135000 | | Expiration: January 2016, Exercise Price: $135.00 | 31 | | | 18,523 | |
| WYNN 160115P00140000 | | Expiration: January 2016, Exercise Price: $140.00 | 18 | | | 12,555 | |
| | | | | | | 64,984 | |
| | | General Merchandise Stores | | | | | |
| | | Family Dollar Stores, Inc. | | | | | |
| FDO 150117P00050000 | | Expiration: January 2015, Exercise Price: $50.00 | 25 | | | 1,937 | |
| FDO 150117P00052500 | | Expiration: January 2015, Exercise Price: $52.50 | 9 | | | 1,013 | |
| | | Sears Holdings Corporation | | | | | |
| SHLD1 150117P00035000 | | Expiration: January 2015, Exercise Price: $35.00 | 6 | | | 1,260 | |
| SHLD1 150117P00045000 | | Expiration: January 2015, Exercise Price: $45.00 | 65 | | | 36,725 | |
| SHLD1 150117P00050000 | | Expiration: January 2015, Exercise Price: $50.00 | 92 | | | 77,050 | |
| SHLD 160115P00025000 | | Expiration: January 2016, Exercise Price: $25.00 | 2 | | | 1,005 | |
| SHLD1 160115P00035000 | | Expiration: January 2016, Exercise Price: $35.00 | 13 | | | 7,117 | |
| SHLD1 160115P00060000 | | Expiration: January 2016, Exercise Price: $60.00 | 6 | | | 12,180 | |
| | | | | | | 138,287 | |
The accompanying notes are an integral part of these financial statements.
| KINETICS PORTFOLIOS TRUST — MASTER INVESTMENT PORTFOLIOS |
| The Multi-Disciplinary Portfolio |
Portfolio of Options Written — June 30, 2014 (Unaudited) — (Continued) |
| Identifier | | | Contractsd | | | Value | |
| | | Holding Company | | | | | |
| | | Icahn Enterprises LP | | | | | |
| IEP 140920P00090000 | | Expiration: September 2014, Exercise Price: $90.00 | 26 | | $ | 5,655 | |
| IEP 140920P00100000 | | Expiration: September 2014, Exercise Price: $100.00 | 35 | | | 21,700 | |
| IEP 141220P00090000 | | Expiration: December 2014, Exercise Price: $90.00 | 5 | | | 2,425 | |
| | | Leucadia National Corporation | | | | | |
| LUK2 150117P00022000 | | Expiration: January 2015, Exercise Price: $22.00 | 286 | | | 50,765 | |
| LUK2 150117P00025000 | | Expiration: January 2015, Exercise Price: $25.00 | 19 | | | 7,885 | |
| | | Liberty Media Corporation — Class A | | | | | |
| LMCA 140719P00135000 | | Expiration: July 2014, Exercise Price: $135.00 | 12 | | | 1,920 | |
| LMCA1 141018P00120000 | | Expiration: October 2014, Exercise Price: $120.00 | 38 | | | 6,270 | |
| | | | | | | 96,620 | |
| | | Insurance Carriers and Related Activities | | | | | |
| | | American International Group, Inc. | | | | | |
| AIG 160115P00045000 | | Expiration: January 2016, Exercise Price: $45.00 | 102 | | | 26,673 | |
| | | AmTrust Financial Services, Inc. | | | | | |
| AFSI 160115P00030000 | | Expiration: January 2016, Exercise Price: $30.00 | 76 | | | 23,180 | |
| AFSI 160115P00040000 | | Expiration: January 2016, Exercise Price: $40.00 | 38 | | | 26,410 | |
| | | | | | | 76,263 | |
| | | Leather and Allied Product Manufacturing | | | | | |
| | | Coach, Inc. | | | | | |
| COH 160115P00040000 | | Expiration: January 2016, Exercise Price: $40.00 | 124 | | | 117,180 | |
| | | Lessors of Nonresidential Buildings | | | | | |
| | | (except Miniwarehouses) | | | | | |
| | | The Howard Hughes Corporation | | | | | |
| HHC 140719P00100000 | | Expiration: July 2014, Exercise Price: $100.00 | 32 | | | 1,360 | |
| HHC 140719P00105000 | | Expiration: July 2014, Exercise Price: $105.00 | 9 | | | 405 | |
| HHC 140719P00110000 | | Expiration: July 2014, Exercise Price: $110.00 | 10 | | | 425 | |
| HHC 140719P00115000 | | Expiration: July 2014, Exercise Price: $115.00 | 1 | | | 42 | |
| | | | | | | 2,232 | |
| | | Machinery Manufacturing | | | | | |
| | | National Oilwell Varco, Inc. | | | | | |
| NOV1 150117P00057500 | | Expiration: January 2015, Exercise Price: $57.50 | 45 | | | 1,238 | |
The accompanying notes are an integral part of these financial statements.
| KINETICS PORTFOLIOS TRUST — MASTER INVESTMENT PORTFOLIOS |
| The Multi-Disciplinary Portfolio |
Portfolio of Options Written — June 30, 2014 (Unaudited) — (Continued) |
| Identifier | | | Contractsd | | | Value | |
| | | Media | | | | | |
| | | Starz — Class A | | | | | |
| STRZA 140719P00025000 | | Expiration: July 2014, Exercise Price: $25.00 | 28 | | $ | 210 | |
| | | Viacom Inc. — Class B | | | | | |
| VIAB 150117P00055000 | | Expiration: January 2015, Exercise Price: $55.00 | 32 | | | 640 | |
| VIAB 150117P00057500 | | Expiration: January 2015, Exercise Price: $57.50 | 10 | | | 250 | |
| | | | | | | 1,100 | |
| | | Merchant Wholesalers, Nondurable Goods | | | | | |
| | | Cardinal Health, Inc. | | | | | |
| CAH 150117P00042000 | | Expiration: January 2015, Exercise Price: $42.00 | 7 | | | 105 | |
| | | Mining (except Oil and Gas) | | | | | |
| | | Barrick Gold Corporation | | | | | |
| ABX 150117P00015000 | | Expiration: January 2015, Exercise Price: $15.00 | 124 | | | 5,394 | |
| ABX 160115P00013000 | | Expiration: January 2016, Exercise Price: $13.00 | 134 | | | 9,246 | |
| ABX 160115P00015000 | | Expiration: January 2016, Exercise Price: $15.00 | 76 | | | 9,842 | |
| | | Freeport-McMoRan Copper & Gold Inc. | | | | | |
| FCX 150117P00022000 | | Expiration: January 2015, Exercise Price: $22.00 | 2 | | | 18 | |
| FCX 150117P00024000 | | Expiration: January 2015, Exercise Price: $24.00 | 116 | | | 1,682 | |
| FCX 150117P00027000 | | Expiration: January 2015, Exercise Price: $27.00 | 52 | | | 1,456 | |
| FCX 160115P00030000 | | Expiration: January 2016, Exercise Price: $30.00 | 4 | | | 938 | |
| FCX 160115P00032000 | | Expiration: January 2016, Exercise Price: $32.00 | 20 | | | 6,200 | |
| | | Newmont Mining Corporation | | | | | |
| NEM 150117P00025000 | | Expiration: January 2015, Exercise Price: $25.00 | 60 | | | 10,890 | |
| | | Rio Tinto plc — ADR | | | | | |
| RIO 150117P00040000 | | Expiration: January 2015, Exercise Price: $40.00 | 5 | | | 287 | |
| | | Silver Wheaton Corporation | | | | | |
| SLW 150117P00018000 | | Expiration: January 2015, Exercise Price: $18.00 | 16 | | | 312 | |
| SLW 150117P00020000 | | Expiration: January 2015, Exercise Price: $20.00 | 106 | | | 4,346 | |
| SLW 160115P00018000 | | Expiration: January 2016, Exercise Price: $18.00 | 52 | | | 5,460 | |
| | | | | | | 56,071 | |
| | | Miscellaneous Manufacturing | | | | | |
| | | Hasbro, Inc. | | | | | |
| HAS 150117P00040000 | | Expiration: January 2015, Exercise Price: $40.00 | 17 | | | 637 | |
| | | International Game Technology | | | | | |
| IGT 150117P00010000 | | Expiration: January 2015, Exercise Price: $10.00 | 20 | | | 300 | |
| | | | | | | 937 | |
The accompanying notes are an integral part of these financial statements.
| KINETICS PORTFOLIOS TRUST — MASTER INVESTMENT PORTFOLIOS |
| The Multi-Disciplinary Portfolio |
Portfolio of Options Written — June 30, 2014 (Unaudited) — (Continued) |
| Identifier | | | Contractsd | | | Value | |
| | | Nonmetallic Mineral Product Manufacturing | | | | | |
| | | USG Corporation | | | | | |
| USG 150117P00020000 | | Expiration: January 2015, Exercise Price: $20.00 | 16 | | $ | 480 | |
| | | Non-Store Retailers | | | | | |
| | | Sotheby’s | | | | | |
| BID1 150117P00028000 | | Expiration: January 2015, Exercise Price: $28.00 | 17 | | | 510 | |
| | | Oil and Gas Extraction | | | | | |
| | | Canadian Natural Resources Ltd. | | | | | |
| CNQ 160115P00030000 | | Expiration: January 2016, Exercise Price: $30.00 | 4 | | | 290 | |
| | | Chesapeake Energy Corporation | | | | | |
| CHK1 150117P00022000 | | Expiration: January 2015, Exercise Price: $22.00 | 16 | | | 384 | |
| CHK 150117P00025000 | | Expiration: January 2015, Exercise Price: $25.00 | 4 | | | 256 | |
| CHK1 160115P00020000 | | Expiration: January 2016, Exercise Price: $20.00 | 128 | | | 9,792 | |
| CHK1 160115P00023000 | | Expiration: January 2016, Exercise Price: $23.00 | 46 | | | 6,348 | |
| CHK1 160115P00025000 | | Expiration: January 2016, Exercise Price: $25.00 | 14 | | | 2,723 | |
| | | Continental Resources, Inc. | | | | | |
| CLR 150117P00055000 | | Expiration: January 2015, Exercise Price: $55.00 | 1 | | | 7 | |
| CLR 150117P00070000 | | Expiration: January 2015, Exercise Price: $70.00 | 23 | | | 230 | |
| CLR 150117P00085000 | | Expiration: January 2015, Exercise Price: $85.00 | 19 | | | 428 | |
| CLR 150117P00090000 | | Expiration: January 2015, Exercise Price: $90.00 | 10 | | | 350 | |
| CLR 150117P00095000 | | Expiration: January 2015, Exercise Price: $95.00 | 12 | | | 600 | |
| CLR 160115P00080000 | | Expiration: January 2016, Exercise Price: $80.00 | 14 | | | 2,520 | |
| CLR 160115P00090000 | | Expiration: January 2016, Exercise Price: $90.00 | 7 | | | 2,030 | |
| CLR 160115P00100000 | | Expiration: January 2016, Exercise Price: $100.00 | 36 | | | 14,040 | |
| | | Talisman Energy Inc. | | | | | |
| TLM 150117P00010000 | | Expiration: January 2015, Exercise Price: $10.00 | 8 | | | 680 | |
| TLM 160115P00010000 | | Expiration: January 2016, Exercise Price: $10.00 | 116 | | | 18,270 | |
| | | | | | | 58,948 | |
| | | Other Exchanges | | | | | |
| | | CBOE Holdings Inc. | | | | | |
| CBOE 150117P00043750 | | Expiration: January 2015, Exercise Price: $43.75 | 34 | | | 5,695 | |
| CBOE 160115P00044500 | | Expiration: January 2016, Exercise Price: $44.50 | 50 | | | 22,000 | |
| | | | | | | 27,695 | |
The accompanying notes are an integral part of these financial statements.
| KINETICS PORTFOLIOS TRUST — MASTER INVESTMENT PORTFOLIOS |
| The Multi-Disciplinary Portfolio |
Portfolio of Options Written — June 30, 2014 (Unaudited) — (Continued) |
| Identifier | | | Contractsd | | | Value | |
| | | Other Information Services | | | | | |
| | | Google Inc. — Class A/C | | | | | |
| GOLG1 150117P00800000 | | Expiration: January 2015, Exercise Price: $800.00 | 1 | | $ | 350 | |
| GOLG1 160115P00950000 | | Expiration: January 2016, Exercise Price: $950.00 | 7 | | | 31,640 | |
| | | | | | | 31,990 | |
| | | Performing Arts, Spectator Sports, and | | | | | |
| | | Related Industries | | | | | |
| | | Live Nation Entertainment, Inc. | | | | | |
| LYV 150117P00012000 | | Expiration: January 2015, Exercise Price: $12.00 | 102 | | | 1,275 | |
| LYV 150117P00015000 | | Expiration: January 2015, Exercise Price: $15.00 | 242 | | | 3,630 | |
| LYV 160115P00015000 | | Expiration: January 2016, Exercise Price: $15.00 | 180 | | | 12,150 | |
| LYV 160115P00017000 | | Expiration: January 2016, Exercise Price: $17.00 | 112 | | | 12,040 | |
| | | | | | | 29,095 | |
| | | Pharmaceutical and Biotechnology | | | | | |
| | | AbbVie Inc. | | | | | |
| ABBV 160115P00040000 | | Expiration: January 2016, Exercise Price: $40.00 | 76 | | | 14,060 | |
| | | Amgen Inc. | | | | | |
| AMGN 160115P00085000 | | Expiration: January 2016, Exercise Price: $85.00 | 76 | | | 25,270 | |
| | | Gilead Sciences, Inc. | | | | | |
| GILD 160115P00050000 | | Expiration: January 2016, Exercise Price: $50.00 | 76 | | | 9,690 | |
| | | | | | | 49,020 | |
| | | Pipeline Transportation | | | | | |
| | | The Williams Companies, Inc. | | | | | |
| WMB 150117P00030000 | | Expiration: January 2015, Exercise Price: $30.00 | 7 | | | 32 | |
| WMB 160115P00030000 | | Expiration: January 2016, Exercise Price: $30.00 | 144 | | | 5,184 | |
| | | | | | | 5,216 | |
| | | Professional, Scientific, and Technical Services | | | | | |
| | | Iron Mountain Inc. | | | | | |
| IRM 150117P00030000 | | Expiration: January 2015, Exercise Price: $30.00 | 13 | | | 943 | |
| | | Verisign Inc. | | | | | |
| VRSN 150117P00050000 | | Expiration: January 2015, Exercise Price: $50.00 | 62 | | | 24,335 | |
| | | | | | | 25,278 | |
The accompanying notes are an integral part of these financial statements.
| KINETICS PORTFOLIOS TRUST — MASTER INVESTMENT PORTFOLIOS |
| The Multi-Disciplinary Portfolio |
Portfolio of Options Written — June 30, 2014 (Unaudited) — (Continued) |
| Identifier | | | Contractsd | | | Value | |
| | | Publishing Industries (except Internet) | | | | | |
| | | Nuance Communications, Inc. | | | | | |
| NUAN 160115P00013000 | | Expiration: January 2016, Exercise Price: $13.00 | 210 | | $ | 13,650 | |
| NUAN 160115P00015000 | | Expiration: January 2016, Exercise Price: $15.00 | 8 | | | 940 | |
| | | | | | | 14,590 | |
| | | Rail Transportation | | | | | |
| | | Norfolk Southern Corporation | | | | | |
| NSC 150117P00065000 | | Expiration: January 2015, Exercise Price: $65.00 | 7 | | | 140 | |
| | | Real Estate | | | | | |
| | | General Growth Properties, Inc. | | | | | |
| GGP 150117P00020000 | | Expiration: January 2015, Exercise Price: $20.00 | 18 | | | 585 | |
| | | TRI Pointe Homes, Inc. | | | | | |
| TPH 140719P00015000 | | Expiration: July 2014, Exercise Price: $15.00 | 1 | | | 37 | |
| TPH 150117P00014000 | | Expiration: January 2015, Exercise Price: $14.00 | 54 | | | 5,805 | |
| TPH 150117P00015000 | | Expiration: January 2015, Exercise Price: $15.00 | 36 | | | 5,580 | |
| | | | | | | 12,007 | |
| | | Restaurants | | | | | |
| | | The Wendy’s Company | | | | | |
| WEN 150117P00007000 | | Expiration: January 2015, Exercise Price: $7.00 | 232 | | | 5,800 | |
| WEN 160115P00007000 | | Expiration: January 2016, Exercise Price: $7.00 | 1,080 | | | 72,900 | |
| | | | | | | 78,700 | |
| | | Satellite Telecommunications | | | | | |
| | | DISH Network Corp. — Class A | | | | | |
| DISH 150117P00030000 | | Expiration: January 2015, Exercise Price: $30.00 | 26 | | | 455 | |
| DISH 150117P00032000 | | Expiration: January 2015, Exercise Price: $32.00 | 4 | | | 100 | |
| DISH 150117P00036000 | | Expiration: January 2015, Exercise Price: $36.00 | 12 | | | 330 | |
| DISH 150117P00040000 | | Expiration: January 2015, Exercise Price: $40.00 | 78 | | | 4,290 | |
| DISH 160115P00045000 | | Expiration: January 2016, Exercise Price: $45.00 | 2 | | | 545 | |
| DISH 160115P00047000 | | Expiration: January 2016, Exercise Price: $47.00 | 48 | | | 15,360 | |
| | | Liberty Global plc — Class A | | | | | |
| LBTY2 160115P00075000 | | Expiration: January 2016, Exercise Price: $75.00 | 6 | | | 3,990 | |
| | | | | | | 25,070 | |
The accompanying notes are an integral part of these financial statements.
| KINETICS PORTFOLIOS TRUST — MASTER INVESTMENT PORTFOLIOS |
| The Multi-Disciplinary Portfolio |
Portfolio of Options Written — June 30, 2014 (Unaudited) — (Continued) |
| Identifier | | | Contractsd | | | Value | |
| | | Securities, Commodity Contracts, and Other | | | | | |
| | | Financial Investments and Related Activities | | | | | |
| | | CME Group Inc. | | | | | |
| CME 150117P00047500 | | Expiration: January 2015, Exercise Price: $47.50 | 25 | | $ | 750 | |
| CME 150117P00057500 | | Expiration: January 2015, Exercise Price: $57.50 | 2 | | | 200 | |
| CME 160115P00065000 | | Expiration: January 2016, Exercise Price: $65.00 | 10 | | | 7,200 | |
| CME 160115P00070000 | | Expiration: January 2016, Exercise Price: $70.00 | 32 | | | 31,680 | |
| | | | | | | 39,830 | |
| | | Support Activities for Mining | | | | | |
| | | Transocean Ltd. | | | | | |
| RIG 160115P00040000 | | Expiration: January 2016, Exercise Price: $40.00 | 120 | | | 53,700 | |
| | | Support Activities for Transportation | | | | | |
| | | Expeditors International of Washington, Inc. | | | | | |
| EXPD 150117P00035000 | | Expiration: January 2015, Exercise Price: $35.00 | 30 | | | 1,200 | |
| | | Transportation Equipment Manufacturing | | | | | |
| | | American Railcar Industries, Inc. | | | | | |
| ARII 140920P00040000 | | Expiration: September 2014, Exercise Price: $40.00 | 4 | | | 40 | |
| ARII 141220P00050000 | | Expiration: December 2014, Exercise Price: $50.00 | 42 | | | 5,880 | |
| | | | | | | 5,920 | |
| | | TOTAL PUT OPTIONS WRITTEN | | | | | |
| | | (premiums received $3,340,899) | | | $ | 1,697,651 | |
| | | |
| d — | 100 Shares Per Contract unless otherwise noted. |
ADR — American Depository Receipt.
ETF — Exchange Traded Fund.
The accompanying notes are an integral part of these financial statements.
| KINETICS PORTFOLIOS TRUST — MASTER INVESTMENT PORTFOLIOS |
| Statements of Assets & Liabilities |
| June 30, 2014 (Unaudited) |
| | | The Internet Portfolio | | | The Global Portfolio | |
| ASSETS: | | | | | | |
Investments, at value (1)(2) | | $ | 189,308,113 | | | $ | 11,533,224 | |
Foreign currencies, at value (3) | | | — | | | | 1,891 | |
| Cash | | | — | | | | 614 | |
| Receivable for contributed capital | | | 32,052 | | | | 25,392 | |
| Receivable for investments sold | | | — | | | | 42,390 | |
| Dividends and interest receivable | | | 66,993 | | | | 5,559 | |
| Other accounts receivable | | | 99,877 | | | | — | |
| Prepaid expenses and other assets | | | 7,232 | | | | 3,336 | |
| Total Assets | | | 189,514,267 | | | | 11,612,406 | |
| LIABILITIES: | | | | | | | | |
| Payable to Adviser | | | 170,992 | | | | 11,589 | |
| Payable to Trustees and Officers | | | 3,161 | | | | 207 | |
| Payable for collateral received for securities loaned | | | 21,133,565 | | | | 714,121 | |
| Payable for withdrawn capital | | | 130,756 | | | | — | |
| Accrued expenses and other liabilities | | | 26,766 | | | | 11,346 | |
| Total Liabilities | | | 21,465,240 | | | | 737,263 | |
| Net Assets | | $ | 168,049,027 | | | $ | 10,875,143 | |
(1) Cost of investments | | $ | 104,467,035 | | | $ | 8,651,163 | |
(2) Includes loaned securities with a market value of | | $ | 20,765,137 | | | $ | 699,502 | |
(3) Cost of foreign currencies | | $ | — | | | $ | 1,891 | |
The accompanying notes are an integral part of these financial statements.
| KINETICS PORTFOLIOS TRUST — MASTER INVESTMENT PORTFOLIOS |
Statements of Assets & Liabilities — (Continued) |
| June 30, 2014 (Unaudited) |
| | | The Paradigm Portfolio | | | The Medical Portfolio | |
| ASSETS: | | | | | | |
Investments, at value (1)(2) | | $ | 1,429,635,697 | | | $ | 32,135,005 | |
Foreign currencies, at value (3) | | | 5,483 | | | | — | |
| Cash | | | 214,005 | | | | 3,813 | |
| Receivable for contributed capital | | | 1,295,433 | | | | 69,419 | |
| Receivable for investments sold | | | 257,541 | | | | — | |
| Dividends and interest receivable | | | 292,995 | | | | 28,543 | |
| Prepaid expenses and other assets | | | 171,708 | | | | 4,046 | |
| Total Assets | | | 1,431,872,862 | | | | 32,240,826 | |
| LIABILITIES: | | | | | | | | |
| Payable to Adviser | | | 1,370,867 | | | | 27,149 | |
| Payable to Trustees and Officers | | | 23,805 | | | | 471 | |
| Payable for securities purchased | | | 422,220 | | | | — | |
| Payable for collateral received for securities loaned | | | 74,540,645 | | | | 5,313,927 | |
| Payable for withdrawn capital | | | 1,058,614 | | | | 20,838 | |
| Accrued expenses and other liabilities | | | 163,691 | | | | 10,605 | |
| Total Liabilities | | | 77,579,842 | | | | 5,372,990 | |
| Net Assets | | $ | 1,354,293,020 | | | $ | 26,867,836 | |
(1) Cost of investments | | $ | 924,237,772 | | | $ | 22,537,677 | |
(2) Includes loaned securities with a market value of | | $ | 73,703,910 | | | $ | 5,028,621 | |
(3) Cost of foreign currencies | | $ | 5,483 | | | $ | — | |
The accompanying notes are an integral part of these financial statements.
KINETICS PORTFOLIOS TRUST — MASTER INVESTMENT PORTFOLIOS Statements of Assets & Liabilities — (Continued) June 30, 2014 (Unaudited) |
| | | The Small Cap Opportunities Portfolio | | | The Market Opportunities Portfolio | |
| ASSETS: | | | | | | |
Investments, at value (1)(2) | | $ | 472,924,234 | | | $ | 69,292,146 | |
| Cash | | | — | | | | 75,586 | |
| Receivable for contributed capital | | | 2,930,127 | | | | 791 | |
| Receivable for investments sold | | | — | | | | 143,253 | |
| Dividends and interest receivable | | | 180,809 | | | | 16,735 | |
| Other accounts receivable | | | 20,977 | | | | — | |
| Prepaid expenses and other assets | | | 51,196 | | | | 5,610 | |
| Total Assets | | | 476,107,343 | | | | 69,534,121 | |
| LIABILITIES: | | | | | | | | |
| Payable to Adviser | | | 430,149 | | | | 65,351 | |
| Payable to Trustees and Officers | | | 7,032 | | | | 1,199 | |
| Payable for securities purchased | | | 10,493 | | | | 232,339 | |
| Payable for collateral received for securities loaned | | | 48,702,392 | | | | 5,564,976 | |
| Payable for withdrawn capital | | | 971,288 | | | | 108,037 | |
| Accrued expenses and other liabilities | | | 53,992 | | | | 18,591 | |
| Total Liabilities | | | 50,175,346 | | | | 5,990,493 | |
| Net Assets | | $ | 425,931,997 | | | $ | 63,543,628 | |
(1) Cost of investments | | $ | 381,157,581 | | | $ | 52,369,667 | |
(2) Includes loaned securities with a market value of | | $ | 47,293,574 | | | $ | 5,474,060 | |
The accompanying notes are an integral part of these financial statements.
| KINETICS PORTFOLIOS TRUST — MASTER INVESTMENT PORTFOLIOS |
Statements of Assets & Liabilities — (Continued) |
| June 30, 2014 (Unaudited) |
| | | The Alternative Income Portfolio | | | The Multi- Disciplinary Portfolio | |
| ASSETS: | | | | | | |
Investments, at value (1)(2) | | $ | 30,626,174 | | | $ | 139,712,880 | |
| Cash | | | 118,886 | | | | 441,093 | |
| Receivable for contributed capital | | | 757 | | | | 615,183 | |
| Receivable for investments sold | | | — | | | | 5,008 | |
| Dividends and interest receivable | | | 84,684 | | | | 1,128,451 | |
| Prepaid expenses and other assets | | | 1,167 | | | | 5,654 | |
| Total Assets | | | 30,831,668 | | | | 141,908,269 | |
| LIABILITIES: | | | | | | | | |
Written options, at value (3) | | | 684,115 | | | | 1,697,651 | |
| Payable to Adviser | | | 21,823 | | | | 112,404 | |
| Payable to Trustees and Officers | | | 489 | | | | 1,880 | |
| Payable for securities purchased | | | 56,237 | | | | 2,030,955 | |
| Payable for collateral received for securities loaned | | | — | | | | 25,078,937 | |
| Payable for withdrawn capital | | | 106,618 | | | | 65,412 | |
| Accrued expenses and other liabilities | | | 18,362 | | | | 24,942 | |
| Total Liabilities | | | 887,644 | | | | 29,012,181 | |
| Net Assets | | $ | 29,944,024 | | | $ | 112,896,088 | |
(1) Cost of investments | | $ | 30,573,645 | | | $ | 137,449,056 | |
(2) Includes loaned securities with a market value of | | $ | — | | | $ | 24,410,710 | |
(3) Premiums received | | $ | 1,565,600 | | | $ | 3,340,899 | |
The accompanying notes are an integral part of these financial statements.
| KINETICS PORTFOLIOS TRUST — MASTER INVESTMENT PORTFOLIOS |
| Statements of Operations |
| For the Six Months Ended June 30, 2014 (Unaudited) |
| | | The Internet Portfolio | | | The Global Portfolio | |
| INVESTMENT INCOME: | | | | | | |
| Dividends† | | $ | 379,750 | | | $ | 37,532 | |
| Interest | | | 576 | | | | 58 | |
| Income from securities lending | | | 15,170 | | | | 22,983 | |
| Total investment income | | | 395,496 | | | | 60,573 | |
| EXPENSES: | | | | | | | | |
| Investment advisory fees | | | 1,058,487 | | | | 71,967 | |
| Administration fees | | | 36,819 | | | | 2,933 | |
| Professional fees | | | 8,613 | | | | 4,243 | |
| Fund accounting fees | | | 13,483 | | | | 3,182 | |
| Trustees’ and Officers’ fees and expenses | | | 3,832 | | | | 314 | |
| Custodian fees and expenses | | | 277 | | | | 6,377 | |
| Other expenses | | | 4,427 | | | | 231 | |
| Total expenses | | | 1,125,938 | | | | 89,247 | |
| Net investment loss | | | (730,442 | ) | | | (28,674 | ) |
| REALIZED AND UNREALIZED GAIN (LOSS) ON INVESTMENTS: | | | | | | | | |
| Net realized gain on: | | | | | | | | |
| Investments and foreign currency | | | 2,584,505 | | | | 257,030 | |
| Net change in unrealized appreciation (depreciation) of: | | | | | | | | |
| Investments and foreign currency | | | (6,032,141 | ) | | | 71,420 | |
| Net realized and unrealized gain (loss) on investments | | | (3,447,636 | ) | | | 328,450 | |
| Net increase (decrease) in net assets resulting from operations | | $ | (4,178,078 | ) | | $ | 299,776 | |
| † Net of foreign taxes withheld of: | | $ | 1,409 | | | $ | 2,126 | |
The accompanying notes are an integral part of these financial statements.
| KINETICS PORTFOLIOS TRUST — MASTER INVESTMENT PORTFOLIOS |
Statements of Operations — (Continued) |
| For the Six Months Ended June 30, 2014 (Unaudited) |
| | | The Paradigm Portfolio | | | The Medical Portfolio | |
| INVESTMENT INCOME: | | | | | | |
| Dividends† | | $ | 3,222,334 | | | $ | 279,538 | |
| Interest | | | 7,466 | | | | 148 | |
| Income from securities lending | | | 794,463 | | | | 31,728 | |
| Total investment income | | | 4,024,263 | | | | 311,414 | |
| EXPENSES: | | | | | | | | |
| Investment advisory fees | | | 8,173,674 | | | | 164,582 | |
| Administration fees | | | 281,329 | | | | 5,687 | |
| Professional fees | | | 42,615 | | | | 4,658 | |
| Fund accounting fees | | | 98,830 | | | | 2,871 | |
| Trustees’ and Officers’ fees and expenses | | | 34,952 | | | | 692 | |
| Custodian fees and expenses | | | 62,698 | | | | 7,172 | |
| Other expenses | | | 27,818 | | | | 533 | |
| Total expenses | | | 8,721,916 | | | | 186,195 | |
| Net investment income (loss) | | | (4,697,653 | ) | | | 125,219 | |
| REALIZED AND UNREALIZED GAIN ON INVESTMENTS: | | | | | | | | |
| Net realized gain on: | | | | | | | | |
| Investments and foreign currency | | | 8,885,297 | | | | 124,901 | |
| Net change in unrealized appreciation of: | | | | | | | | |
| Investments and foreign currency | | | 58,393,408 | | | | 2,081,524 | |
| Net realized and unrealized gain on investments | | | 67,278,705 | | | | 2,206,425 | |
| Net increase in net assets resulting from operations | | $ | 62,581,052 | | | $ | 2,331,644 | |
| † Net of foreign taxes withheld of: | | $ | 125,257 | | | $ | 24,610 | |
The accompanying notes are an integral part of these financial statements.
| KINETICS PORTFOLIOS TRUST — MASTER INVESTMENT PORTFOLIOS |
Statements of Operations — (Continued) |
| For the Six Months Ended June 30, 2014 (Unaudited) |
| | | The Small Cap Opportunities Portfolio | | | The Market Opportunities Portfolio | |
| INVESTMENT INCOME: | | | | | | |
| Dividends† | | $ | 1,146,097 | | | $ | 399,746 | |
| Interest | | | 1,931 | | | | 461 | |
| Income from securities lending | | | 242,415 | | | | 34,234 | |
| Total investment income | | | 1,390,443 | | | | 434,441 | |
| EXPENSES: | | | | | | | | |
| Investment advisory fees | | | 2,506,653 | | | | 409,237 | |
| Administration fees | | | 85,439 | | | | 14,166 | |
| Professional fees | | | 16,516 | | | | 5,804 | |
| Fund accounting fees | | | 31,709 | | | | 6,636 | |
| Trustees’ and Officers’ fees and expenses | | | 14,204 | | | | 1,691 | |
| Custodian fees and expenses | | | 20,329 | | | | 13,159 | |
| Other expenses | | | 4,295 | | | | 1,398 | |
| Total expenses | | | 2,679,145 | | | | 452,091 | |
| Net investment loss | | | (1,288,702 | ) | | | (17,650 | ) |
| REALIZED AND UNREALIZED GAIN (LOSS) ON INVESTMENTS: | | | | | | | | |
| Net realized gain on: | | | | | | | | |
| Investments and foreign currency | | | 10,608,921 | | | | 3,364,667 | |
| Net change in unrealized appreciation (depreciation) of: | | | | | | | | |
| Investments and foreign currency | | | 7,798,558 | | | | (3,037,348 | ) |
| Net realized and unrealized gain on investments | | | 18,407,479 | | | | 327,319 | |
| Net increase in net assets resulting from operations | | $ | 17,118,777 | | | $ | 309,669 | |
| † Net of foreign taxes withheld of: | | $ | 13,168 | | | $ | 14,449 | |
The accompanying notes are an integral part of these financial statements.
| KINETICS PORTFOLIOS TRUST — MASTER INVESTMENT PORTFOLIOS |
Statements of Operations — (Continued) |
| For the Six Months Ended June 30, 2014 (Unaudited) |
| | | The Alternative Income Portfolio | | | The Multi- Disciplinary Portfolio | |
| INVESTMENT INCOME: | | | | | | |
| Dividends | | $ | 21,223 | | | $ | 244,111 | |
| Interest | | | 78,001 | | | | 1,580,137 | |
| Income from securities lending | | | 4,052 | | | | 13,289 | |
| Total investment income | | | 103,276 | | | | 1,837,537 | |
| EXPENSES: | | | | | | | | |
| Investment advisory fees | | | 122,810 | | | | 640,659 | |
| Administration fees | | | 5,775 | | | | 23,967 | |
| Professional fees | | | 4,726 | | | | 6,824 | |
| Fund accounting fees. | | | 27,967 | | | | 17,748 | |
| Trustees’ and Officers’ fees and expenses | | | 794 | | | | 2,422 | |
| Custodian fees and expenses | | | 3,594 | | | | 9,960 | |
| Other expenses | | | 412 | | | | 2,036 | |
| Total expenses | | | 166,078 | | | | 703,616 | |
| Net investment income (loss) | | | (62,802 | ) | | | 1,133,921 | |
| REALIZED AND UNREALIZED GAIN (LOSS) ON INVESTMENTS: | | | | | | | | |
| Net realized gain (loss) on: | | | | | | | | |
| Investments and foreign currency | | | (45,843 | ) | | | (2,104,887 | ) |
| Written option contracts expired or closed | | | 393,726 | | | | 2,683,126 | |
| Net change in unrealized appreciation (depreciation) of: | | | | | | | | |
| Investments and foreign currency | | | 109,699 | | | | 4,988,596 | |
| Written option contracts | | | 274,957 | | | | (1,688,291 | ) |
| Net realized and unrealized gain on investments | | | 732,539 | | | | 3,878,544 | |
| Net increase in net assets resulting from operations | | $ | 669,737 | | | $ | 5,012,465 | |
The accompanying notes are an integral part of these financial statements.
| KINETICS PORTFOLIOS TRUST — MASTER INVESTMENT PORTFOLIOS |
| Statements of Changes in Net Assets |
| | | The Internet Portfolio | | | The Global Portfolio | |
| | | For the | | | For the | | | For the | | | For the | |
| | | Six Months Ended | | | Year Ended | | | Six Months Ended | | | Year Ended | |
| | | June 30, 2014 | | | December 31, | | | June 30, 2014 | | | December 31, | |
| | | (Unaudited) | | | 2013 | | | (Unaudited) | | | 2013 | |
| OPERATIONS: | | | | | | | | | | | | |
| Net investment loss | | $ | (730,442 | ) | | $ | (1,454,560 | ) | | $ | (28,674 | ) | | $ | (11,316 | ) |
| Net realized gain on sale of | | | | | | | | | | | | | | | | |
| investments, foreign | | | | | | | | | | | | | | | | |
| currency and distributions | | | | | | | | | | | | | | | | |
| received from other investment | | | | | | | | | | | | | | | | |
| companies | | | 2,584,505 | | | | 11,541,829 | | | | 257,030 | | | | 66,987 | |
| Net change in unrealized | | | | | | | | | | | | | | | | |
| appreciation (depreciation) | | | | | | | | | | | | | | | | |
| of investments and foreign | | | | | | | | | | | | | | | | |
| currency | | | (6,032,141 | ) | | | 52,885,945 | | | | 71,420 | | | | 2,171,749 | |
| Net increase (decrease) in net | | | | | | | | | | | | | | | | |
| assets resulting from | | | | | | | | | | | | | | | | |
| operations | | | (4,178,078 | ) | | | 62,973,214 | | | | 299,776 | | | | 2,227,420 | |
| NET INCREASE (DECREASE) IN NET | | | | | | | | | | | | | | | | |
| ASSETS RESULTING FROM | | | | | | | | | | | | | | | | |
| BENEFICIAL INTEREST | | | | | | | | | | | | | | | | |
| TRANSACTIONS: | | | | | | | | | | | | | | | | |
| Contributions | | | 4,027,962 | | | | 12,808,479 | | | | 983,354 | | | | 4,489,494 | |
| Withdrawals | | | (10,659,901 | ) | | | (53,634,097 | ) | | | (2,625,102 | ) | | | (1,037,208 | ) |
| Net increase (decrease) in net assets | | | | | | | | | | | | | | | | |
| resulting from beneficial | | | | | | | | | | | | | | | | |
| interest transactions | | | (6,631,939 | ) | | | (40,825,618 | ) | | | (1,641,748 | ) | | | 3,452,286 | |
| Total increase (decrease) in | | | | | | | | | | | | | | | | |
| net assets | | | (10,810,017 | ) | | | 22,147,596 | | | | (1,341,972 | ) | | | 5,679,706 | |
| NET ASSETS: | | | | | | | | | | | | | | | | |
| Beginning of period | | | 178,859,044 | | | | 156,711,448 | | | | 12,217,115 | | | | 6,537,409 | |
| End of period | | $ | 168,049,027 | | | $ | 178,859,044 | | | $ | 10,875,143 | | | $ | 12,217,115 | |
The accompanying notes are an integral part of these financial statements.
| KINETICS PORTFOLIOS TRUST — MASTER INVESTMENT PORTFOLIOS |
Statements of Changes in Net Assets — (Continued) |
| | | The Paradigm Portfolio | | | The Medical Portfolio | |
| | | For the | | | For the | | | For the | | | For the | |
| | | Six Months Ended | | | Year Ended | | | Six Months Ended | | | Year Ended | |
| | | June 30, 2014 | | | December 31, | | | June 30, 2014 | | | December 31, | |
| | | (Unaudited) | | | 2013 | | | (Unaudited) | | | 2013 | |
| OPERATIONS: | | | | | | | | | | | | |
| Net investment income (loss) | | $ | (4,697,653 | ) | | $ | (2,519,178 | ) | | $ | 125,219 | | | $ | (4,268 | ) |
| Net realized gain (loss) on sale of | | | | | | | | | | | | | | | | |
| investments and foreign | | | | | | | | | | | | | | | | |
| currency | | | 8,885,297 | | | | 992,713 | | | | 124,901 | | | | (341,050 | ) |
| Net change in unrealized | | | | | | | | | | | | | | | | |
| appreciation of investments and | | | | | | | | | | | | | | | | |
| foreign currency | | | 58,393,408 | | | | 400,868,795 | | | | 2,081,524 | | | | 8,692,907 | |
| Net increase in net assets resulting | | | | | | | | | | | | | | | | |
| from operations | | | 62,581,052 | | | | 399,342,330 | | | | 2,331,644 | | | | 8,347,589 | |
| NET INCREASE (DECREASE) IN NET | | | | | | | | | | | | | | | | |
| ASSETS RESULTING FROM | | | | | | | | | | | | | | | | |
| BENEFICIAL INTEREST | | | | | | | | | | | | | | | | |
| TRANSACTIONS: | | | | | | | | | | | | | | | | |
| Contributions | | | 36,448,798 | | | | 130,575,410 | | | | 1,923,992 | | | | 5,013,915 | |
| Withdrawals | | | (72,480,427 | ) | | | (85,425,092 | ) | | | (2,177,138 | ) | | | (5,881,082 | ) |
| Net increase (decrease) in net | | | | | | | | | | | | | | | | |
| assets resulting from beneficial | | | | | | | | | | | | | | | | |
| interest transactions | | | (36,031,629 | ) | | | 45,150,318 | | | | (253,146 | ) | | | (867,167 | ) |
| Total increase in net assets | | | 26,549,423 | | | | 444,492,648 | | | | 2,078,498 | | | | 7,480,422 | |
| NET ASSETS: | | | | | | | | | | | | | | | | |
| Beginning of period | | | 1,327,743,597 | | | | 883,250,949 | | | | 24,789,338 | | | | 17,308,916 | |
| End of period | | $ | 1,354,293,020 | | | $ | 1,327,743,597 | | | $ | 26,867,836 | | | $ | 24,789,338 | |
The accompanying notes are an integral part of these financial statements.
| KINETICS PORTFOLIOS TRUST — MASTER INVESTMENT PORTFOLIOS |
Statements of Changes in Net Assets — (Continued) |
| | | The Small Cap | | | The Market | |
| | | Opportunities Portfolio | | | Opportunities Portfolio | |
| | | For the | | | For the | | | For the | | | For the | |
| | | Six Months Ended | | | Year Ended | | | Six Months Ended | | | Year Ended | |
| | | June 30, 2014 | | | December 31, | | | June 30, 2014 | | | December 31, | |
| | | (Unaudited) | | | 2013 | | | (Unaudited) | | | 2013 | |
| OPERATIONS: | | | | | | | | | | | | |
| Net investment income (loss) | | $ | (1,288,702 | ) | | $ | 23,416 | | | $ | (17,650 | ) | | $ | 156,009 | |
| Net realized gain on sale of | | | | | | | | | | | | | | | | |
| investments, foreign currency and | | | | | | | | | | | | | | | | |
| distributions received from other | | | | | | | | | | | | | | | | |
| investment companies | | | 10,608,921 | | | | 912,482 | | | | 3,364,667 | | | | 4,587,167 | |
| Net change in unrealized appreciation | | | | | | | | | | | | | | | | |
| (depreciation) of investments and | | | | | | | | | | | | | | | | |
| foreign currency | | | 7,798,558 | | | | 74,243,893 | | | | (3,037,348 | ) | | | 16,103,917 | |
| Net increase in net assets | | | | | | | | | | | | | | | | |
| resulting from operations | | | 17,118,777 | | | | 75,179,791 | | | | 309,669 | | | | 20,847,093 | |
| NET INCREASE (DECREASE) IN NET | | | | | | | | | | | | | | | | |
| ASSETS RESULTING FROM | | | | | | | | | | | | | | | | |
| BENEFICIAL INTEREST | | | | | | | | | | | | | | | | |
| TRANSACTIONS: | | | | | | | | | | | | | | | | |
| Contributions | | | 113,727,092 | | | | 200,357,556 | | | | 6,839,345 | | | | 28,774,153 | |
| Withdrawals | | | (52,912,107 | ) | | | (9,127,095 | ) | | | (10,166,699 | ) | | | (26,698,470 | ) |
| Net increase (decrease) in net assets | | | | | | | | | | | | | | | | |
| resulting from beneficial | | | | | | | | | | | | | | | | |
| interest transactions | | | 60,814,985 | | | | 191,230,461 | | | | (3,327,354 | ) | | | 2,075,683 | |
| Total increase (decrease) in net assets | | | 77,933,762 | | | | 266,410,252 | | | | (3,017,685 | ) | | | 22,922,776 | |
| NET ASSETS: | | | | | | | | | | | | | | | | |
| Beginning of period | | | 347,998,235 | | | | 81,587,983 | | | | 66,561,313 | | | | 43,638,537 | |
| End of period | | $ | 425,931,997 | | | $ | 347,998,235 | | | $ | 63,543,628 | | | $ | 66,561,313 | |
The accompanying notes are an integral part of these financial statements.
| KINETICS PORTFOLIOS TRUST — MASTER INVESTMENT PORTFOLIOS |
Statements of Changes in Net Assets — (Continued) |
| | | The Alternative | | | The Multi- Disciplinary Portfolio | |
| | | For the | | | For the | | | For the | | | For the |
| | | Six Months Ended | | | Year Ended | | | Six Months Ended | | | Year Ended |
| | | June 30, 2014 | | | December 31, | | | June 30, 2014 | | | December 31, |
| | | (Unaudited) | | | 2013 | | | (Unaudited) | | | 2013 |
| OPERATIONS: | | | | | | | | | | | | |
| Net investment income (loss) | | $ | (62,802 | ) | | $ | (93,420 | ) | | $ | 1,133,921 | | | $ | 1,621,053 | |
| Net realized gain on sale of | | | | | | | | | | | | | | | | |
| investments, foreign currency, | | | | | | | | | | | | | | | | |
| written options, securities sold | | | | | | | | | | | | | | | | |
| short and distributions received | | | | | | | | | | | | | | | | |
| from other investment companies | | | 347,883 | | | | 332,007 | | | | 578,239 | | | | 2,381,562 | |
| Net change in unrealized appreciation | | | | | | | | | | | | | | | | |
| (depreciation) of investments, | | | | | | | | | | | | | | | | |
| foreign currency, written | | | | | | | | | | | | | | | | |
| options and securities sold short | | | 384,656 | | | | 599,148 | | | | 3,300,305 | | | | (743,581 | ) |
| Net increase in net assets | | | | | | | | | | | | | | | | |
| resulting from operations | | | 669,737 | | | | 837,735 | | | | 5,012,465 | | | | 3,259,034 | |
| NET INCREASE IN NET ASSETS | | | | | | | | | | | | | | | | |
| RESULTING FROM BENEFICIAL | | | | | | | | | | | | | | | | |
| INTEREST TRANSACTIONS: | | | | | | | | | | | | | | | | |
| Contributions | | | 8,147,887 | | | | 15,277,302 | | | | 37,870,944 | | | | 49,389,741 | |
| Withdrawals | | | (2,426,631 | ) | | | (3,357,344 | ) | | | (20,298,829 | ) | | | (21,888,150 | ) |
| Net increase in net assets | | | | | | | | | | | | | | | | |
| resulting from beneficial | | | | | | | | | | | | | | | | |
| interest transactions | | | 5,721,256 | | | | 11,919,958 | | | | 17,572,115 | | | | 27,501,591 | |
| Total increase in net assets | | | 6,390,993 | | | | 12,757,693 | | | | 22,584,580 | | | | 30,760,625 | |
| NET ASSETS: | | | | | | | | | | | | | | | | |
| Beginning of period | | | 23,553,031 | | | | 10,795,338 | | | | 90,311,508 | | | | 59,550,883 | |
| End of period | | $ | 29,944,024 | | | $ | 23,553,031 | | | $ | 112,896,088 | | | $ | 90,311,508 | |
The accompanying notes are an integral part of these financial statements.
| KINETICS PORTFOLIOS TRUST — MASTER INVESTMENT PORTFOLIOS |
| Notes to Financial Statements |
| June 30, 2014 (Unaudited) |
1. Organization
The Kinetics Portfolios Trust (the “Trust”) was organized as a Delaware Statutory Trust on March 14, 2000 and is registered under the Investment Company Act of 1940, as amended (the “1940 Act”), as an open-end management investment company issuing its beneficial interests in series, each series representing a distinct portfolio with its own investment objective and policies. The series currently authorized are: The Internet Portfolio, The Global Portfolio, The Paradigm Portfolio, The Medical Portfolio, The Small Cap Opportunities Portfolio, The Market Opportunities Portfolio, The Alternative Income Portfolio and The Multi-Disciplinary Portfolio (collectively, the “Master Portfolios”). Pursuant to the 1940 Act, the Master Portfolios, are “non-diversified” series of the Trust, except The Global Portfolio and The Multi-Disciplinary Portfolio. The Market Opportunities Portfolio commenced operations on January 31, 2006, The Alternative Income Portfolio commenced operations on June 29, 2007 and The Multi-Disciplinary Portfolio commenced operations on February 11, 2008. Each of the remaining Master Portfolios commenced operations on April 28, 2000.
Each Master Portfolio is a Master Investment Portfolio in a master-feeder fund structure. Each Master Portfolio has multiple feeder funds invested in the Master Portfolio. By contributing assets to the Master Portfolio, the feeder funds receive a beneficial interest in the Master Portfolio. The Master Portfolio then invests the contributed assets in portfolio securities and allocates income, gains (losses) and expenses to the feeder funds based on the feeder funds’ proportionate interests in the Master Portfolio.
Each of the Master Portfolios, except for The Alternative Income Portfolio and The Multi-Disciplinary Portfolio, seeks to provide investors with long-term capital growth. The Alternative Income Portfolio seeks to provide current income and gains. The Multi-Disciplinary Portfolio seeks to provide investors with total return. The Internet Portfolio invests primarily in the equity securities of U.S. and foreign companies engaged in the Internet and Internet-related activities. The Global Portfolio generally invests in the equity securities of foreign companies that have the ability to facilitate an increase in the growth of their traditional business lines and in U.S. companies benefiting from international economic growth. The Paradigm Portfolio invests primarily in the equity securities of U.S. and foreign companies that the investment adviser believes are undervalued and that have high returns on equity and are well positioned to reduce their costs, extend the reach of their distribution channels and experience significant growth in their assets or revenues. The Medical
| KINETICS PORTFOLIOS TRUST — MASTER INVESTMENT PORTFOLIOS |
Notes to Financial Statements — (Continued) |
| June 30, 2014 (Unaudited) |
Portfolio invests primarily in the equity securities of U.S. and foreign companies engaged in medical research, pharmaceutical treatments and related medical technology industries and related technology industries, generally, with a focus on companies engaged in cancer research and drug development. The Small Cap Opportunities Portfolio invests primarily in the equity securities of U.S. and foreign small capitalized companies that provide attractive valuation opportunities due to special situations such as lack of institutional ownership, lack of significant analyst coverage or companies with sound fundamentals that have experienced a short-term earnings shortfall. The Market Opportunities Portfolio invests primarily in the equity securities of U.S. and foreign companies engaged in capital markets or related to capital markets, as well as companies involved in the gaming industry. The Alternative Income and Multi-Disciplinary Portfolios utilizes a two-part investment strategy, which includes fixed income and derivatives components.
2. Significant Accounting Policies
Security Valuation
Master Portfolio securities that are listed on a U.S. securities exchange for which market quotations are readily available are valued at the last quoted sale price on the day the valuation is made. Price information on listed securities is taken from the exchange where the security is primarily traded. All equity securities that are traded using the National Association of Securities Dealers’ Automated Quotation System (“NASDAQ”) are valued using the NASDAQ Official Closing Price (“NOCP”). Foreign securities are valued by an independent pricing service. In the event market quotations are not readily available or if events occur that may materially affect the value of a particular security between the time trading ends on a particular security and the close of regular trading on the New York Stock Exchange (“NYSE”), “fair value” will be determined. Unlisted U.S. securities and listed U.S. securities not traded on the valuation date for which market quotations are readily available are valued at the last bid price. Exchange traded options are valued at the composite price, using the National Best Bid and Offer quotes (“NBBO”). NBBO consists of the highest bid price and lowest ask price across any of the exchanges on which an option is quoted thus providing a view across the entire U.S. options marketplace. Composite option pricing calculates the mean of the highest bid price and lowest ask price across the exchanges where the option is traded. If the composite option price is not available, the mean between the highest bid and the lowest asked quotations at the close of the exchanges will be used. If none of the above are available, exchange traded options are valued at the last
| KINETICS PORTFOLIOS TRUST — MASTER INVESTMENT PORTFOLIOS |
Notes to Financial Statements — (Continued) |
| June 30, 2014 (Unaudited) |
quoted sales price. Non-exchange traded options for which over-the-counter quotations are not readily available are valued at the mean of the current bid and asked prices. Fixed-income securities (other than obligations having a maturity of 60 days or less) are normally valued on the basis of quotes obtained from pricing services, which take into account appropriate factors such as institutional-sized trading in similar groups of securities, yield, quality, coupon rate, maturity, type of issue, trading characteristics and other market data.
Investment grade fixed-income securities with remaining maturities of 60 days or less are valued at amortized cost, which approximates fair value. Other assets and securities for which no quotations are readily available (including restricted securities) will be valued in good faith at fair value using methods determined by the Board of Trustees of the Master Portfolios. In determining the fair value of a security, the Board of Trustees shall take into account the relevant factors and surrounding circumstances, which may include: (i) the nature and pricing history (if any) of the security; (ii) whether any dealer quotations for the security are available; (iii) possible valuation methodologies that could be used to determine the fair value of the security; (iv) the recommendation of the portfolio manager of the Portfolios with respect to the valuation of the security; (v) whether the same or similar securities are held by other funds managed by the Advisor or other funds and the method used to price the security in those funds; (vi) the extent to which the fair value to be determined for the security will result from the use of data or formula produced by third parties independent of the Advisor; (vii) the liquidity or illiquidity of the market for the security; and (viii) the value of a foreign security traded on other foreign markets. At June 30, 2014, 0.00%, 0.00% and 0.00% of the net assets of The Internet Portfolio, The Paradigm Portfolio and The Market Opportunities Portfolio, respectively, were fair valued securities. The other Master Portfolios did not hold any fair valued securities at June 30, 2014.
Repurchase Agreements
Each Master Portfolio may enter into repurchase agreements with banks that are members of the Federal Reserve System or securities dealers who are members of a national securities exchange or are primary dealers in U.S. Government Securities. In connection with transactions in repurchase agreements, it is the Trust’s policy that the Master Portfolio receive, as collateral, securities whose market value, including accrued interest, at all times will be at least equal to 102% of the amount invested by the Master Portfolio in each repurchase agreement. If the seller defaults, and the value of the collateral declines, realization of the collateral by the Master Portfolio may be delayed or limited.
| KINETICS PORTFOLIOS TRUST — MASTER INVESTMENT PORTFOLIOS |
Notes to Financial Statements — (Continued) |
| June 30, 2014 (Unaudited) |
Written Options
The Master Portfolios may write (sell) call or put options for trading or hedging purposes. When a Master Portfolio writes an option, an amount equal to the premium received by the Master Portfolio is included in the Statement of Assets and Liabilities as an asset and an equivalent liability. The amount of the liability is subsequently marked-to-market to reflect the current value of the option written. By writing the option, the Master Portfolio may become obligated during the term of the option to deliver or purchase the securities underlying the option at the exercise price if the option is exercised. When an option expires on its stipulated expiration date or the Master Portfolio enters into a closing purchase transaction, the Master Portfolio realizes a gain or loss if the cost of the closing transaction differs from the premium received when the option was sold, without regard to any unrealized gain or loss on the underlying security, and the liability related to such option is eliminated. When an option is exercised, the premium originally received decreases the cost basis of the underlying security (or increases the proceeds on the security sold short) and the Master Portfolio realizes a gain or loss from the sale of the security (or closing of the short sale). As collateral for uncovered written options, the Master Portfolio is required under the 1940 Act to maintain assets consisting of cash, cash equivalents or liquid securities. This collateral is required to be adjusted daily to reflect the exercise price of the purchase obligation for put options or the market value of the instrument underlying the contract for call options.
Foreign Currency Translations
The books and records of the Master Portfolios are maintained in U.S. dollars. For the Master Portfolios, foreign currency transactions are translated into U.S. dollars on the following basis: (i) market values of investment securities and other assets and liabilities are translated at the exchange rate of such currencies against the U.S. dollar, as provided by an approved pricing service, and (ii) purchases and sales of investment securities, dividend and interest income and certain expenses at the rates of exchange prevailing on the respective dates of such transactions. The Master Portfolios do not isolate and treat as ordinary income that portion of the results of operations arising as a result of changes in the exchange rate from the fluctuations arising from changes in the market prices of securities held during the period. Such fluctuations are included with the net realized and unrealized gain or loss from investments. However, for federal income tax purposes, the Master Portfolios do isolate and treat as ordinary income the effect of changes in foreign exchange rates arising from actual foreign currency transactions and
| KINETICS PORTFOLIOS TRUST — MASTER INVESTMENT PORTFOLIOS |
Notes to Financial Statements — (Continued) |
| June 30, 2014 (Unaudited) |
the effect of changes in foreign exchange rates arising between trade date and settlement date.
Restricted and Illiquid Securities
The Master Portfolios may invest in restricted securities. These securities are valued by the Master Portfolios after giving due consideration to pertinent factors including recent private sales, market conditions and the issuer’s financial performance. The Master Portfolios have no right to require registration of unregistered securities. At June 30, 2014 the following Master Portfolios held securities restricted to institutional investors (144A Securities):
| | | | | | Percentage of | |
| | | Market Value | | | Net Assets | |
| The Alternative Income Portfolio | | $ | 658,595 | | | | 2.20 | % |
| The Multi-Disciplinary Portfolio | | | 17,578,917 | | | | 15.57 | % |
An illiquid asset is any asset which may not be sold or disposed of in the ordinary course of business within seven days at approximately the value at which the Master Portfolio has valued the investment. At June 30, 2014, the following Master Portfolios held illiquid securities:
| | | | | | Percentage of | |
| | | Market Value | | | Net Assets | |
| The Internet Portfolio | | $ | — | * | | | 0.00 | % |
| The Paradigm Portfolio | | | — | * | | | 0.00 | % |
| The Market Opportunities Portfolio | | | — | * | | | 0.00 | % |
| The Multi-Disciplinary Portfolio | | | 525,000 | | | | 0.47 | % |
* Amount is less than $0.50.
When-Issued Securities
The Master Portfolios may purchase securities on a when-issued or delayed delivery basis. Although the purchase amounts of these securities are established at the time the purchaser enters into the agreement, these securities may be delivered and paid for at a future date. The Master Portfolios record purchases of when-issued securities and reflect the values of such securities in determining net asset value in the same manner as other portfolio securities. The Master Portfolios maintain at all times cash or other liquid assets in an amount at least equal to the amount of outstanding commitments for when-issued securities.
| KINETICS PORTFOLIOS TRUST — MASTER INVESTMENT PORTFOLIOS |
Notes to Financial Statements — (Continued) |
| June 30, 2014 (Unaudited) |
Securities Lending
Each Master Portfolio may lend its portfolio securities to broker-dealers by entering directly into lending arrangements with such broker dealers or indirectly through repurchase agreements with respect to no more than 331/3% of the total assets of each Master Portfolio (including any collateral posted) or 50% of the total assets of each Master Portfolio (excluding any collateral posted). Securities lending and repurchase transactions will be fully collateralized at all times with cash and/or short-term debt obligations. The Master Portfolios receive interest on the collateral received as well as a fee for the securities loaned.
Short-Term Investments
The Portfolios may invest in money market funds and short-term high quality debt securities such as commercial paper, repurchase agreements and certificates of deposit. Money market funds typically invest in short-term instruments and attempt to maintain a stable net asset value. While the risk is low, these funds may lose value. At June 30, 2014, The Internet Portfolio, The Global Portfolio, The Paradigm Portfolio, The Medical Portfolio, The Small Cap Opportunities Portfolio, The Market Opportunities Portfolio and The Multi-Disciplinary Portfolio invested approximately 13%, 7%, 6%, 20%, 11%, 9% and 22%, respectively, of net assets in the Mount Vernon Securities Lending Trust-Prime Portfolio which normally invests in short-term instruments with an objective of maximizing current income to the extent consistent with the preservation of capital and liquidity. Mount Vernon Securities Lending Trust-Prime Portfolio’s financial statements are available on the SEC website www.sec.gov.
Expense Allocation
Common expenses incurred by the Master Portfolios are allocated among the Master Portfolios (i) based upon relative average net assets, (ii) as incurred on a specific identification basis, or (iii) equally among the Master Portfolios, depending on the nature of the expenditure. All expenses incurred by the Master Portfolios are allocated to the feeder funds daily based on their proportionate interests in the respective Master Portfolios.
Federal Income Taxes
Each Master Portfolio will be treated as a partnership for federal income tax purposes. As such, each investor in a Master Portfolio will be subject to taxation on its share of the Master Portfolio’s ordinary income and capital gains. It is intended that each Master Portfolio’s assets will be managed so an investor in
| KINETICS PORTFOLIOS TRUST — MASTER INVESTMENT PORTFOLIOS |
Notes to Financial Statements — (Continued) |
| June 30, 2014 (Unaudited) |
the Master Portfolio can satisfy the requirements of subchapter M of the Internal Revenue Code.
There is no tax liability resulting from unrecognized tax benefits relating to uncertain income tax positions taken or expected to be taken in future tax returns. As of June 30, 2014, open tax years include the tax years ended December 31, 2010 through 2013. The Master Portfolios are also not aware of any tax positions for which it is reasonably possible that the total amounts of unrecognized tax benefits will significantly change in the next six months.
Use of Estimates
The preparation of financial statements in conformity with U.S. generally accepted accounting principles (“GAAP”) requires management to make estimates and assumptions that affect the reported amounts in the financial statements. Actual results could differ from those estimates.
Other
Realized gains and losses on the sale of investments are calculated on the identified cost basis. Dividend income is recorded on the ex-dividend date. Interest income is accounted for on the accrual basis and includes amortization of premiums and discounts on the interest method. Other noncash dividends are recognized as investment income at the fair value of the property received. Withholding taxes on foreign dividends have been provided for in accordance with the Trust’s understanding of the applicable country’s tax rules and rates.
3. Investment Adviser
The Trust has entered into Investment Advisory Agreements (the “Agreements”) with Kinetics Asset Management LLC (the “Adviser”), with whom certain officers and trustees of the Trust are affiliated, to furnish investment advisory services to the Master Portfolios. The Adviser is a wholly-owned subsidiary of Horizon Kinetics LLC. Under the terms of the Agreements, the Master Portfolios, except the Alternative Income Portfolio, compensate the Adviser for its management services at the annual rate of 1.25% of each Master Portfolio’s average daily net assets. The Alternative Income Portfolio compensates the Adviser for its management services at the annual rate of 0.90% of the Master Portfolio’s average daily net assets.
| KINETICS PORTFOLIOS TRUST — MASTER INVESTMENT PORTFOLIOS |
Notes to Financial Statements — (Continued) |
| June 30, 2014 (Unaudited) |
For the six months ended June 30, 2014, The Internet Portfolio, The Global Portfolio, The Paradigm Portfolio, The Medical Portfolio, The Small Cap Opportunities Portfolio, The Market Opportunities Portfolio, The Alternative Income Portfolio and The Multi-Disciplinary Portfolio incurred expenses of $1,058,487, $71,967, $8,173,674, $164,582, $2,506,653, $409,237, $122,810 and $640,659, respectively, pursuant to the Agreements.
For the six months ended June 30, 2014, the Trust was allocated $13,000 for the services of the Chief Compliance Officer employed by the Adviser.
4. Approval of Investment Advisory Contracts by Trustees of Kinetics Portfolios Trust
At a meeting of the Board of Trustees of the Trust held on March 14, 2014, the Board, including all of the Trustees who are not interested persons under the 1940 Act (the “Independent Trustees”), approved the Advisory Agreements with respect to each Master Portfolio. In reaching a decision to renew the Advisory Agreements, the Board of Trustees, including all of the Independent Trustees, considered, among others (1) the nature, extent, and quality of the services to be provided by the Adviser, including, but not limited to, a review of the complexity of the services provided, whether the services are provided in a satisfactory and efficient manner; (2) the experience and qualifications of the personnel providing such services; (3) the investment performance of the Trust and the Adviser as compared with industry competitors; (4) an evaluation of the fee structure, any fee waivers, and the Trust’s expense ratios, and a comparison of them in relation to those of other investment companies having comparable investment policies and limitations; (5) possible alternative fee structures or bases for determining fees; (6) the extent to which economies of scale would be realized as the Trust grows and whether fee levels reflect these economies of scale for the benefit of the Trust’s investors; (7) the direct and indirect costs of the services to be provided (and the basis of determining and allocating these costs) and profits to be realized by the Adviser and its affiliates from their relationship with the Trust; (8) other compensation or possible benefits to the Adviser and its affiliates arising from their advisory and other relationships with the Trust, including, if applicable, any benefits derived or to be derived by the Adviser from its relationship with the Trust such as soft dollar arrangements by which brokers provide research to the Trust or the Adviser in return for allocating the Trust’s brokerage; (9) the entrepreneurial risks borne by the Adviser, if any (e.g., because a fund is in a start-up mode or for other reasons, its revenues may be less or its expenses greater than anticipated); and (10) a
| KINETICS PORTFOLIOS TRUST — MASTER INVESTMENT PORTFOLIOS |
Notes to Financial Statements — (Continued) |
| June 30, 2014 (Unaudited) |
comparison of the fees charged by the Adviser with fees charged by the Adviser to similar clients;
The Board of Trustees, including a majority of the Independent Trustees, concluded that: they were satisfied with the quality of services provided by the Adviser in advising the Master Portfolios, the profits earned by the Adviser were reasonable in light of the nature, extent and quality of the services provided to each Master Portfolio; and that each Master Portfolio was not large enough to attain significant economies of scale. Based on the factors considered, the Board of Trustees, including a majority of the Independent Trustees, concluded that it was appropriate to renew the Agreements.
5. Securities Transactions
Purchases and sales of investment securities, other than short-term investments, for the six months ended June 30, 2014 were as follows:
| | | Purchases | | | Sales | |
| | | U.S. | | | | | | U.S. | | | | |
| | | Government | | | Other | | | Government | | | Other | |
| The Internet Portfolio | | $ | — | | | $ | 446,581 | | | $ | — | | | $ | 4,794,301 | |
| The Global Portfolio | | | — | | | | 1,343,524 | | | | — | | | | 2,252,732 | |
| The Paradigm Portfolio | | | — | | | | 66,810,193 | | | | — | | | | 81,032,730 | |
| The Medical Portfolio | | | — | | | | 710,421 | | | | — | | | | 1,056,720 | |
| The Small Cap Opportunities Portfolio | | | — | | | | 107,432,449 | | | | — | | | | 35,834,749 | |
| The Market Opportunities Portfolio | | | — | | | | 8,566,319 | | | | — | | | | 7,920,783 | |
| The Alternative Income Portfolio | | | 698,313 | | | | 9,792,552 | | | | — | | | | 2,041,024 | |
| The Multi-Disciplinary Portfolio | | | — | | | | 63,853,176 | | | | — | | | | 17,546,348 | |
As of December 31, 2013, the cost of investments and unrealized appreciation (depreciation) on investment securities for federal income tax purposes was as follows:
| | | Internet | | | Global | | | Paradigm | | | Medical | |
| Tax cost of Investments | | | 117,409,807 | | | | 13,048,074 | | | | 1,104,043,145 | | | | 19,467,492 | |
| Unrealized Appreciation | | | 91,055,545 | | | | 3,054,298 | | | | 484,181,004 | | | | 9,603,989 | |
| Unrealized Depreciation | | | (219,383 | ) | | | (302,799 | ) | | | (60,535,275 | ) | | | (2,154,995 | ) |
| Net unrealized appreciation (depreciation) | | | 90,836,162 | | | | 2,751,499 | | | | 423,645,729 | | | | 7,448,994 | |
| | | | | | Market | | | Alternative | | | Multi- | |
| | | Small Cap | | | Opportunities | | | Income | | | Disciplinary | |
| Tax cost of Investments | | | 339,982,206 | | | | 52,397,674 | | | | 21,276,045 | | | | 75,897,875 | |
| Unrealized Appreciation | | | 89,576,151 | | | | 21,523,028 | | | | 35,933 | | | | 683,134 | |
| Unrealized Depreciation | | | (9,665,716 | ) | | | (2,407,862 | ) | | | (93,103 | ) | | | (3,659,168 | ) |
| Net unrealized appreciation (depreciation) | | | 79,910,435 | | | | 19,115,166 | | | | (57,170 | ) | | | (2,976,034 | ) |
| KINETICS PORTFOLIOS TRUST — MASTER INVESTMENT PORTFOLIOS |
Notes to Financial Statements — (Continued) |
| June 30, 2014 (Unaudited) |
For the six months ended June 30, 2014, the Master Portfolios wrote the following options:
| | | Number | | | Premium | |
| | | of Contracts | | | Amount | |
| The Alternative Income Portfolio | | | | | | |
| Outstanding at the Beginning of the Year | | | 6,199 | | | $ | 1,141,683 | |
| Options Written | | | 4,903 | | | | 934,631 | |
| Options Expired | | | (1,364 | ) | | | (115,643 | ) |
| Options Closed | | | (1,756 | ) | | | (395,071 | ) |
| Outstanding at June 30, 2014 | | | 7,982 | | | $ | 1,565,600 | |
| | | | | | | | | |
| The Multi-Disciplinary Portfolio | | | | | | | | |
| Outstanding at the Beginning of the Year | | | 20,763 | | | $ | 5,343,721 | |
| Options Written | | | 4,142 | | | | 1,155,122 | |
| Options Exercised | | | (665 | ) | | | (126,080 | ) |
| Options Expired | | | (13,571 | ) | | | (2,812,847 | ) |
| Options Closed | | | (387 | ) | | | (219,017 | ) |
| Outstanding at June 30, 2014 | | | 10,282 | | | $ | 3,340,899 | |
6. Portfolio Securities Loaned
As of June 30, 2014, the Master Portfolios had loaned securities that were collateralized by cash. The cash collateral is invested by the custodian in a money market pooled account approved by the Adviser. Although risk is mitigated by the collateral, a Master Portfolio could experience a delay in recovering its securities and possible loss of income or value if the borrower fails to return them. The Master Portfolio receives interest on the collateral received as well as a fee for the securities loaned. The Master Portfolios will continue to receive dividends and interest on all securities loaned. Gain or loss in the fair value of the securities loaned that may occur during the term of the loan will be accounted for by the Master Portfolios. The value of the securities on loan and the value of the related collateral at June 30, 2014, were as follows:
| | | Securities | | | Collateral | |
| The Internet Portfolio | | $ | 20,765,137 | | | $ | 21,133,565 | |
| The Global Portfolio | | | 699,502 | | | | 714,121 | |
| The Paradigm Portfolio | | | 73,703,910 | | | | 74,540,645 | |
| The Medical Portfolio | | | 5,028,621 | | | | 5,313,927 | |
| The Small Cap Opportunities Portfolio | | | 47,293,574 | | | | 48,702,392 | |
| The Market Opportunities Portfolio | | | 5,474,060 | | | | 5,564,976 | |
| The Alternative Income Portfolio | | | — | | | | — | |
| The Multi-Disciplinary Portfolio | | | 24,410,710 | | | | 25,078,937 | |
| KINETICS PORTFOLIOS TRUST — MASTER INVESTMENT PORTFOLIOS |
Notes to Financial Statements — (Continued) |
| June 30, 2014 (Unaudited) |
7. Selected Financial Highlights
Financial highlights for the Master Portfolios were as follows:
| | | The Internet Portfolio | |
| | | For the Six | | | For the Year | | | For the Year | | | For the Year | | | For the Year | | | For the Year | |
| | | Months Ended | | | Ended | | | Ended | | | Ended | | | Ended | | | Ended | |
| | | June 30, 2014 | | | December 31, | | | December 31, | | | December 31, | | | December 31, | | | December 31, | |
| | | (Unaudited) | | | 2013 | | | 2012 | | | 2011 | | | 2010 | | | 2009 | |
| Total return* | | | (1.93 | )%(2) | | | 44.75 | % | | | 23.76 | % | | | (1.47 | )% | | | 21.70 | % | | | 49.13 | % |
| Ratio of expenses to average net assets: | | | 1.33 | %(1) | | | 1.37 | % | | | 1.37 | % | | | 1.38 | % | | | 1.37 | % | | | 1.37 | % |
| Ratio of net investment income (loss) to average net assets: | | | (0.86 | )%(1) | | | (0.84 | )% | | | 0.16 | % | | | (0.43 | )% | | | (0.33 | )% | | | (0.04 | )% |
| Portfolio turnover rate | | | 0 | % | | | 8 | % | | | 9 | % | | | 32 | % | | | 12 | % | | | 14 | % |
| | | The Global Portfolio | |
| | | For the Six | | | For the Year | | | For the Year | | | For the Year | | | For the Year | | | For the Year | |
| | | Months Ended | | | Ended | | | Ended | | | Ended | | | Ended | | | Ended | |
| | | June 30, 2014 | | | December 31, | | | December 31, | | | December 31, | | | December 31, | | | December 31, | |
| | | (Unaudited) | | | 2013 | | | 2012 | | | 2011 | | | 2010 | | | 2009 | |
| Total return* | | | 2.65 | %(2) | | | 28.25 | % | | | 22.78 | % | | | (16.25 | )% | | | 19.26 | % | | | 65.44 | % |
| Ratio of expenses to average net assets: | | | 1.55 | %(1) | | | 1.73 | % | | | 1.77 | % | | | 2.23 | % | | | 2.43 | % | | | 2.81 | % |
| Ratio of net investment income (loss) to average net assets: | | | (0.50 | )%(1) | | | (0.12 | )% | | | 0.40 | % | | | 0.61 | % | | | (0.51 | )% | | | (0.74 | )% |
| Portfolio turnover rate | | | 12 | % | | | 15 | % | | | 23 | % | | | 135 | % | | | 122 | % | | | 53 | % |
| * | The returns are calculated by adjusting the corresponding No-Load Feeder returns by Feeder expenses and reimbursements. |
| (1) | Annualized. |
| (2) | Not annualized. |
| KINETICS PORTFOLIOS TRUST — MASTER INVESTMENT PORTFOLIOS |
Notes to Financial Statements — (Continued) |
| June 30, 2014 (Unaudited) |
| | | The Paradigm Portfolio | |
| | | For the Six | | | For the Year | | | For the Year | | | For the Year | | | For the Year | | | For the Year | |
| | | Months Ended | | | Ended | | | Ended | | | Ended | | | Ended | | | Ended | |
| | | June 30, 2014 | | | December 31, | | | December 31, | | | December 31, | | | December 31, | | | December 31, | |
| | | (Unaudited) | | | 2013 | | | 2012 | | | 2011 | | | 2010 | | | 2009 | |
| Total return* | | | 4.97 | %(2) | | | 44.36 | % | | | 22.06 | % | | | (14.00 | )% | | | 17.65 | % | | | 41.30 | % |
| Ratio of expenses to average net assets: | | | 1.33 | %(1) | | | 1.35 | % | | | 1.36 | % | | | 1.37 | % | | | 1.36 | % | | | 1.36 | % |
| Ratio of net investment income (loss) to average net assets: | | | (0.72 | )%(1) | | | (0.23 | )% | | | 0.50 | % | | | 0.37 | % | | | 0.83 | % | | | 1.15 | % |
| Portfolio turnover rate | | | 5 | % | | | 4 | % | | | 6 | % | | | 58 | % | | | 7 | % | | | 15 | % |
| | | The Medical Portfolio | |
| | | For the Six | | | For the Year | | | For the Year | | | For the Year | | | For the Year | | | For the Year | |
| | | Months Ended | | | Ended | | | Ended | | | Ended | | | Ended | | | Ended | |
| | | June 30, 2014 | | | December 31, | | | December 31, | | | December 31, | | | December 31, | | | December 31, | |
| | | (Unaudited) | | | 2013 | | | 2012 | | | 2011 | | | 2010 | | | 2009 | |
| Total return* | | | 9.65 | %(2) | | | 49.23 | % | | | 8.81 | % | | | 5.10 | % | | | 4.30 | % | | | 24.43 | % |
| Ratio of expenses to average net assets: | | | 1.41 | %(1) | | | 1.41 | % | | | 1.44 | % | | | 1.40 | % | | | 1.39 | % | | | 1.43 | % |
| Ratio of net investment income (loss) to average net assets: | | | 0.95 | %(1) | | | (0.02 | )% | | | 1.62 | % | | | 0.86 | % | | | 0.55 | % | | | 1.14 | % |
| Portfolio turnover rate | | | 3 | % | | | 12 | % | | | 0 | % | | | 5 | % | | | 3 | % | | | 13 | % |
| | | The Small Cap Opportunities Portfolio | |
| | | For the Six | | | For the Year | | | For the Year | | | For the Year | | | For the Year | | | For the Year | |
| | | Months Ended | | | Ended | | | Ended | | | Ended | | | Ended | | | Ended | |
| | | June 30, 2014 | | | December 31, | | | December 31, | | | December 31, | | | December 31, | | | December 31, | |
| | | (Unaudited) | | | 2013 | | | 2012 | | | 2011 | | | 2010 | | | 2009 | |
| Total return* | | | 4.11 | %(2) | | | 59.69 | % | | | 26.94 | % | | | (13.44 | )% | | | 14.08 | % | | | 58.38 | % |
| Ratio of expenses to average net assets: | | | 1.34 | %(1) | | | 1.35 | % | | | 1.44 | % | | | 1.43 | % | | | 1.42 | % | | | 1.42 | % |
| Ratio of net investment income (loss) to average net assets: | | | (0.64 | )%(1) | | | 0.01 | % | | | 0.27 | % | | | 0.03 | % | | | 0.02 | % | | | (0.05 | )% |
| Portfolio turnover rate | | | 9 | % | | | 6 | % | | | 22 | % | | | 47 | % | | | 4 | % | | | 4 | % |
| * | The returns are calculated by adjusting the corresponding No-Load Feeder returns by Feeder expenses and reimbursements. |
| (1) | Annualized. |
| (2) | Not annualized. |
| KINETICS PORTFOLIOS TRUST — MASTER INVESTMENT PORTFOLIOS |
Notes to Financial Statements — (Continued) |
| June 30, 2014 (Unaudited) |
| | | The Market Opportunities Portfolio | |
| | | For the Six | | | For the Year | | | For the Year | | | For the Year | | | For the Year | | | For the Year | |
| | | Months Ended | | | Ended | | | Ended | | | Ended | | | Ended | | | Ended | |
| | | June 30, 2014 | | | December 31, | | | December 31, | | | December 31, | | | December 31, | | | December 31, | |
| | | (Unaudited) | | | 2013 | | | 2012 | | | 2011 | | | 2010 | | | 2009 | |
| Total return* | | | 0.77 | %(2) | | | 46.98 | % | | | 17.73 | % | | | (7.63 | )% | | | 11.53 | % | | | 50.43 | % |
| Ratio of expenses to average net assets: | | | 1.38 | %(1) | | | 1.40 | % | | | 1.43 | % | | | 1.42 | % | | | 1.42 | % | | | 1.42 | % |
| Ratio of net investment income (loss) to average net assets: | | | (0.05 | )%(1) | | | 0.27 | % | | | 0.44 | % | | | 0.30 | % | | | 0.56 | % | | | 0.26 | % |
| Portfolio turnover rate | | | 14 | % | | | 21 | % | | | 26 | % | | | 14 | % | | | 12 | % | | | 14 | % |
| | | The Alternative Income Portfolio | |
| | | For the Six | | | For the Year | | | For the Year | | | For the Year | | | For the Year | | | For the Year | |
| | | Months Ended | | | Ended | | | Ended | | | Ended | | | Ended | | | Ended | |
| | | June 30, 2014 | | | December 31, | | | December 31, | | | December 31, | | | December 31, | | | December 31, | |
| | | (Unaudited) | | | 2013 | | | 2012 | | | 2011 | | | 2010 | | | 2009 | |
| Total return* | | | 2.40 | %(2) | | | 4.92 | % | | | 10.05 | % | | | (4.66 | )% | | | (4.43 | )% | | | 16.61 | % |
| Ratio of expenses to average net assets: | | | 1.22 | %(1) | | | 1.25 | % | | | 1.49 | % | | | 1.42 | % | | | 1.47 | % | | | 1.49 | % |
| Ratio of net investment income (loss) to average net assets: | | | (0.46 | )%(1) | | | (0.54 | )% | | | 1.99 | % | | | 1.47 | % | | | 1.04 | % | | | 0.63 | % |
| Portfolio turnover rate | | | 8 | % | | | 19 | % | | | 56 | % | | | 69 | % | | | 111 | % | | | 45 | % |
| | | The Multi-Disciplinary Portfolio | |
| | | For the Six | | | For the Year | | | For the Year | | | For the Year | | | For the Year | | | For the Year | |
| | | Months Ended | | | Ended | | | Ended | | | Ended | | | Ended | | | Ended | |
| | | June 30, 2014 | | | December 31, | | | December 31, | | | December 31, | | | December 31, | | | December 31, | |
| | | (Unaudited) | | | 2013 | | | 2012 | | | 2011 | | | 2010 | | | 2009 | |
| Total return* | | | 5.02 | %(2) | | | 4.39 | % | | | 15.42 | % | | | 0.19 | % | | | 12.12 | % | | | 20.73 | % |
| Ratio of expenses to average net assets: | | | 1.37 | %(1) | | | 1.39 | % | | | 1.45 | % | | | 1.54 | % | | | 2.41 | % | | | 3.66 | % |
| Ratio of net investment income (loss) to average net assets: | | | 2.21 | %(1) | | | 1.87 | % | | | 3.23 | % | | | 8.00 | % | | | 2.58 | % | | | (1.20 | )% |
| Portfolio turnover rate | | | 20 | % | | | 54 | % | | | 41 | % | | | 74 | % | | | 38 | % | | | 77 | % |
| * | The returns are calculated by adjusting the corresponding No-Load Feeder returns by Feeder expenses and reimbursements. |
| (1) | Annualized. |
| (2) | Not annualized. |
| KINETICS PORTFOLIOS TRUST — MASTER INVESTMENT PORTFOLIOS |
Notes to Financial Statements — (Continued) |
| June 30, 2014 (Unaudited) |
8. Summary of Fair Value Exposure
Various inputs are used in determining the value of a Master Portfolio’s investments. These inputs are summarized in the three broad levels listed below:
| | Level 1 - Unadjusted quoted prices in active markets for identical assets or liabilities that a Master Portfolio has the ability to access. |
| | |
| | Level 2 - Observable inputs other than quoted prices included in Level 1 that are observable for the asset or liability, either directly or indirectly. These inputs may include quoted prices for the identical instrument on an inactive market, prices for similar instruments, interest rates, prepayment speeds, credit risk, yield curves, default rates and similar data. |
| | |
| | Level 3 - Unobservable inputs for the asset or liability, to the extent relevant observable inputs are not available, representing a Master Portfolio’s own assumptions about the assumptions a market participant would use in valuing the asset or liability, and would be based on the best information available. |
The availability of observable inputs can vary from security to security and is affected by a wide variety of factors, including, for example, the type of security, whether the security is new and not yet established in the marketplace, the liquidity of markets, and other characteristics particular to the security. To the extent that valuation is based on models or inputs that are less observable or unobservable in the market, the determination of fair value requires more judgment. Accordingly, the degree of judgment exercised in determining fair value is greatest for instruments categorized in Level 3.
The inputs used to measure fair value may fall into different levels of the fair value hierarchy. In such cases, for disclosure purposes, the level in the fair value hierarchy within which the fair value measurement falls in its entirety, is determined based on the lowest level input that is significant to the fair value measurement in its entirety.
| KINETICS PORTFOLIOS TRUST — MASTER INVESTMENT PORTFOLIOS |
Notes to Financial Statements — (Continued) |
| June 30, 2014 (Unaudited) |
The Internet Portfolio
The following is a summary of the inputs used to value the The Internet Portfolio’s net assets as of June 30, 2014:
| Assets^ | | Level 1 | | | Level 2 | | | Level 3 | | | Total | |
| Common Stocks | | $ | 164,174,254 | | | $ | 279,418 | (1) | | $ | — | (2)* | | $ | 164,453,672 | |
| Escrow Notes | | | — | | | | — | | | | — | * | | | — | * |
| Rights | | | 135,000 | | | | — | | | | — | | | | 135,000 | |
| Short-Term Investments | | | 7,876 | | | | 3,578,000 | † | | | — | | | | 3,585,876 | |
| Investments Purchased with the Cash Proceeds from Securities Lending | | | 21,133,565 | | | | — | | | | — | | | | 21,133,565 | |
| Total Investments in Securities | | $ | 185,450,695 | | | $ | 3,857,418 | | | $ | — | | | $ | 189,308,113 | |
| (1) | The Common Stocks Level 2 balance consists of the market value of the associated Level 2 investments in the following industries: |
| Administrative and Support Services | | $ | 1,740 | |
| Rental and Leasing Services | | | 274,400 | |
| Telecommunications | | | 3,278 | |
| | | $ | 279,418 | |
| (2) | The Common Stocks Level 3 balance consists of the market value of the associated Level 3 investments in the following industry: |
| Holding Company | | $ | — | * |
| Transfers out of Level 1 into Level 2 | | $ | 274,400 | |
Transfers were made out of Level 1 into Level 2 due to a decrease in market activity.
Transfers between levels are recognized at the end of the reporting period.
Following is a reconciliation of Level 3 assets for which significant unobservable inputs were used to determine fair value:
| Description | Investments in Securities | |
| Balance as of December 31, 2013 | | $ | — | * |
| Accrued discounts/premiums | | | — | |
| Realized gain (loss) | | | — | |
| Change in unrealized appreciation (depreciation) | | | — | |
| Net purchases | | | — | |
| Net sales | | | — | |
| Transfer in and/or out of Level 3 | | | — | |
| Balance as of June 30, 2014 | | $ | — | * |
| KINETICS PORTFOLIOS TRUST — MASTER INVESTMENT PORTFOLIOS |
Notes to Financial Statements — (Continued) |
| June 30, 2014 (Unaudited) |
| | | Fair Value at | | Valuation | | Unobservable | | |
| Description | | 6/30/2014 | | Techniques | | Input | | Range |
| Common Stocks | | $—* | | Delisted-Acquired by the U.S. Government/ Market Comparables | | No active market | | $0.00-$0.00 |
| Escrow Notes | | —* | | Conservative Value Assigned Pending Bankruptcy Litigation Proceedings/Market Comparables | | No active market | | $0.00-$0.00 |
There is no active market for the Level 3 securities, so a conservative value is being assigned until such time as a market exists.
| ^ | See Portfolio of Investments for breakout of investments by industry classification. |
| * | Amount is less than $0.50. |
| † | Priced at amortized cost. |
The Global Portfolio
The following is a summary of the inputs used to value the The Global Portfolio’s net assets as of June 30, 2014:
| Assets^ | | Level 1 | | | Level 2 | | | Level 3 | | | Total | |
| Common Stocks | | $ | 9,629,088 | | | $ | 827,058 | (1) | | $ | — | | | $ | 10,456,146 | |
| Mutual Funds | | | 88,508 | | | | — | | | | — | | | | 88,508 | |
| Short-Term Investments | | | 7,449 | | | | 267,000 | † | | | — | | | | 274,449 | |
| Investments Purchased with the Cash Proceeds from Securities Lending | | | 714,121 | | | | — | | | | — | | | | 714,121 | |
| Total Investments in Securities | | $ | 10,439,166 | | | $ | 1,094,058 | | | $ | — | | | $ | 11,533,224 | |
| (1) | The Common Stocks Level 2 balance consists of the market value of the associated Level 2 investments in the following industries: |
| Beverage and Tobacco Product Manufacturing | | $ | 4,860 | |
| Holding Company | | | 32,056 | |
| Oil and Gas Extraction | | | 78,689 | |
| Real Estate | | | 711,453 | |
| | | $ | 827,058 | |
| Transfers out of Level 2 into Level 1 | | $ | 620,400 | |
Transfers were made out of Level 2 into Level 1 due to a increase in market activity.
Transfers between levels are recognized at the end of the reporting period.
| ^ | See Portfolio of Investments for breakout of investments by industry classification. |
| † | Priced at amortized cost. |
| KINETICS PORTFOLIOS TRUST — MASTER INVESTMENT PORTFOLIOS |
Notes to Financial Statements — (Continued) |
| June 30, 2014 (Unaudited) |
The Paradigm Portfolio
The following is a summary of the inputs used to value The Paradigm Portfolio’s net assets as of June 30, 2014:
| Assets^ | | Level 1 | | | Level 2 | | | Level 3 | | | Total | |
| Common Stocks | | $ | 1,275,861,233 | | | $ | 3,753,607 | (1) | | $ | — | (2)* | | $ | 1,279,614,840 | |
| Escrow Notes | | | — | | | | — | | | | — | * | | | — | * |
| Mutual Funds | | | 33,572 | | | | — | | | | — | | | | 33,572 | |
| Short-Term Investments | | | 12,966,640 | | | | 62,480,000 | † | | | — | | | | 75,446,640 | |
| Investments Purchased with the Cash Proceeds from Securities Lending | | | 74,540,645 | | | | — | | | | — | | | | 74,540,645 | |
| Total Investments in Securities | | $ | 1,363,402,090 | | | $ | 66,233,607 | | | $ | — | * | | $ | 1,429,635,697 | |
| (1) | The Common Stocks Level 2 balance consists of the market value of the associated Level 2 investments in the following industries: |
| Holding Company | | $ | 21,371 | |
| Real Estate | | | 3,732,236 | |
| | | $ | 3,753,607 | |
| (2) | The Common Stocks Level 3 balance consists of the market value of the associated Level 3 investments in the following industry: |
| Holding Company | | $ | — | * |
| | | $ | — | * |
| Transfers out of Level 2 into Level 1 | | $ | 2,791,800 | |
Transfers were made out of Level 2 into Level 1 due to a increase in market activity.
Transfers between levels are recognized at the end of the reporting period.
Following is a reconciliation of Level 3 assets for which significant unobservable inputs were used to determine fair value:
| Description | Investments in Securities | |
| Balance as of December 31, 2013 | | $ | — | * |
| Accrued discounts/premiums | | | — | |
| Realized gain (loss) | | | — | |
| Change in unrealized appreciation (depreciation) | | | — | |
| Net purchases | | | — | |
| Net sales | | | — | |
| Transfer in and/or out of Level 3 | | | — | |
| Balance as of June 30, 2014 | | $ | — | * |
| KINETICS PORTFOLIOS TRUST — MASTER INVESTMENT PORTFOLIOS |
Notes to Financial Statements — (Continued) |
| June 30, 2014 (Unaudited) |
| | | Fair Value at | | Valuation | | Unobservable | | |
| Description | | 6/30/2014 | | Techniques | | Input | | Range |
| Escrow Notes | | —* | | Conservative Value Assigned Pending Bankruptcy Litigation Proceedings/Market Comparables | | No active market | | $0.00-$0.00 |
There is no active market for the Level 3 securities, so a conservative value is being assigned until such time as a market exists.
| ^ | See Portfolio of Investments for breakout of investments by industry classification. |
| * | Amount is less than $0.50. |
| † | Priced at amortized cost. |
The Medical Portfolio
The following is a summary of the inputs used to value the The Medical Portfolio’s net assets as of June 30, 2014:
| Assets^ | | Level 1 | | | Level 2 | | | Level 3 | | | Total | |
| Common Stocks | | $ | 25,848,185 | | | $ | — | | | $ | — | | | $ | 25,848,185 | |
| Rights | | | 7,769 | | | | 9,240 | | | | — | | | | 17,009 | |
| Short-Term Investments | | | 9,884 | | | | 946,000 | † | | | — | | | | 955,884 | |
| Investments Purchased with the Cash Proceeds from Securities Lending | | | 5,313,927 | | | | — | | | | — | | | | 5,313,927 | |
| Total Investments in Securities | | $ | 31,179,765 | | | $ | 955,240 | | | $ | — | | | $ | 32,135,005 | |
For the period ended June 30, 2014, there were no transfers into or out of Level 1 or Level 2.
Following is a reconciliation of Level 3 assets for which significant unobservable inputs were used to determine fair value:
| Description | Investments in Securities | |
| Balance as of December 31, 2013 | | $ | — | * |
| Accrued discounts/premiums | | | — | |
| Realized gain (loss) | | | 3,813 | |
| Change in unrealized appreciation (depreciation) | | | — | |
| Net purchases | | | — | |
| Net sales | | | (3,813 | ) |
| Transfer in and/or out of Level 3 | | | — | |
| Balance as of June 30, 2014 | | $ | — | |
| ^ | See Portfolio of Investments for breakout of investments by industry classification. |
| * | Amount is less than $0.50. |
| † | Priced at amortized cost. |
| KINETICS PORTFOLIOS TRUST — MASTER INVESTMENT PORTFOLIOS |
Notes to Financial Statements — (Continued) |
| June 30, 2014 (Unaudited) |
The Small Cap Opportunities Portfolio
The following is a summary of the inputs used to value the The Small Cap Opportunities Portfolio’s net assets as of June 30, 2014:
| Assets^ | | Level 1 | | | Level 2 | | | Level 3 | | | Total | |
| Common Stocks | | $ | 354,107,025 | | | $ | 61,074,185 | (1) | | $ | — | | | $ | 415,181,210 | |
| Rights | | | 422,611 | | | | — | | | | — | | | | 422,611 | |
| Short-Term Investments | | | 8,021 | | | | 8,610,000 | † | | | — | | | | 8,618,021 | |
| Investments Purchased with the Cash Proceeds from Securities Lending | | | 48,702,392 | | | | — | | | | — | | | | 48,702,392 | |
| Total Investments in Securities | | $ | 403,240,049 | | | $ | 69,684,185 | | | $ | — | | | $ | 472,924,234 | |
| (1) | The Common Stocks Level 2 balance consists of the market value of the associated Level 2 investments in the following industries: |
| Asset Management | | $ | 23,430,743 | |
| Forestry and Logging | | | 33,440 | |
| Holding Company | | | 4,394,426 | |
| Mining (except Oil and Gas) | | | 841,884 | |
| Real Estate | | | 32,332,072 | |
| Rental and Leasing Services | | | 37,044 | |
| Telecommunications | | | 4,576 | |
| | | $ | 61,074,185 | |
| Transfers out of Level 1 into Level 2 | | $ | 70,484 | |
| Transfers out of Level 2 into Level 1 | | | 70,545 | |
Transfers were made out of Level 1 into Level 2 due to a decrease in market activity.
Transfers were made out of Level 2 into Level 1 due to an increase in market activity.
Transfers between levels are recognized at the end of the reporting period.
| ^ | See Portfolio of Investments for breakout of investments by industry classification. |
| † | Priced at amortized cost. |
| KINETICS PORTFOLIOS TRUST — MASTER INVESTMENT PORTFOLIOS |
Notes to Financial Statements — (Continued) |
| June 30, 2014 (Unaudited) |
The Market Opportunities Portfolio
The following is a summary of the inputs used to value the The Market Opportunities Portfolio’s net assets as of June 30, 2014:
| Assets^ | | Level 1 | | | Level 2 | | | Level 3 | | | Total | |
| Common Stocks | | $ | 52,841,496 | | | $ | 4,500,816 | (1) | | $ | — | | | $ | 57,342,312 | |
| Rights | | | — | | | | — | | | | — | * | | | — | * |
| Mutual Funds | | | 44,858 | | | | — | | | | — | | | | 44,858 | |
| Short-Term Investments | | | 3,170,000 | | | | 3,170,000 | † | | | — | | | | 6,340,000 | |
| Investments Purchased with the Cash Proceeds from Securities Lending | | | 5,564,976 | | | | — | | | | — | | | | 5,564,976 | |
| Total Investments in Securities | | $ | 61,621,330 | | | $ | 7,670,816 | | | $ | — | * | | $ | 69,292,146 | |
| (1) | The Common Stocks Level 2 balance consists of the market value of the associated Level 2 investments in the following industries: |
| Holding Company | | $ | 1,146,024 | |
| Other Exchanges | | | 57,814 | |
| Real Estate | | | 3,296,978 | |
| | | $ | 4,500,816 | |
| Transfers out of Level 3 into Level 2 | | $ | 57,814 | |
Transfers were made out of Level 3 into Level 2 due to an increase in market activity.
Transfers between levels are recognized at the end of the reporting period.
Following is a reconciliation of Level 3 assets for which significant unobservable inputs were used to determine fair value:
| Description | Investments in Securities | |
| Balance as of December 31, 2013 | | $ | 41,105 | |
| Accrued discounts/premiums | | | — | |
| Realized gain (loss) | | | — | |
| Change in unrealized appreciation (depreciation) | | | 16,709 | |
| Net purchases | | | — | |
| Net sales | | | — | |
| Transfer in and/or out of Level 3 | | | (57,814 | ) |
| Balance as of June 30, 2014 | | $ | — | * |
| | | Fair Value at | | Valuation | | Unobservable | | |
| Description | | 6/30/2014 | | Techniques | | Input | | Range |
| Rights | | — | | Market Comparables | | No active market | | $0.00-$0.00 |
There is no active market for the Level 3 securities, so a conservative value is being assigned until such time as a market exists.
| ^ | See Portfolio of Investments for breakout of investments by industry classification. |
| * | Amount is less than $0.50. |
| † | Priced at amortized cost. |
| KINETICS PORTFOLIOS TRUST — MASTER INVESTMENT PORTFOLIOS |
Notes to Financial Statements — (Continued) |
| June 30, 2014 (Unaudited) |
The Alternative Income Portfolio
The following is a summary of the inputs used to value the The Alternative Income Portfolio’s net assets as of June 30, 2014:
| Assets^ | | Level 1 | | | Level 2 | | | Level 3 | | | Total | |
| Corporate Bonds | | $ | — | | | $ | 19,518,058 | | | $ | — | | | $ | 19,518,058 | |
| U.S. Government Agency Issues | | | — | | | | 1,236,471 | | | | — | | | | 1,236,471 | |
| U.S. Treasury Obligations | | | — | | | | 1,599,897 | | | | — | | | | 1,599,897 | |
| Exchange Traded Funds | | | 5,623,408 | | | | — | | | | — | | | | 5,623,408 | |
| Purchased Put Options | | | — | | | | 62,340 | | | | — | | | | 62,340 | |
| Short-Term Investments | | | 1,293,000 | | | | 1,293,000 | † | | | — | | | | 2,586,000 | |
| Total Investments in Securities | | $ | 6,916,408 | | | $ | 23,709,766 | | | $ | — | | | $ | 30,626,174 | |
| Liabilities | | | | | | | | | | | | | | | | |
| Written Options | | $ | — | | | $ | 684,115 | | | $ | — | | | $ | 684,115 | |
For the period ended June 30, 2014, there were no transfers into or out of Level 1 or Level 2, or investments in Level 3 securities.
| ^ | See Portfolio of Investments for breakout of investments by industry classification. |
| † | Priced at amortized cost. |
The Multi-Disciplinary Portfolio
The following is a summary of the inputs used to value the The Multi-Disciplinary Portfolio’s net assets as of June 30, 2014:
| Assets^ | | Level 1 | | | Level 2 | | | Level 3 | | | Total | |
| Convertible Bonds | | $ | — | | | $ | 32,883,939 | | | $ | — | | | $ | 32,883,939 | |
| Corporate Bonds | | | — | | | | 63,920,049 | | | | — | | | | 63,920,049 | |
| Municipal Bonds | | | — | | | | 525,000 | | | | — | | | | 525,000 | |
| Escrow Notes | | | — | | | | 97,500 | | | | — | | | | 97,500 | |
| Exchange Traded Funds | | | 1,351,600 | | | | — | | | | — | | | | 1,351,600 | |
| Exchange Traded Notes | | | 4,651 | | | | — | | | | — | | | | 4,651 | |
| Mutual Funds | | | 8,185,513 | | | | — | | | | — | | | | 8,185,513 | |
| Purchased Put Options | | | — | | | | 1,609,249 | | | | — | | | | 1,609,249 | |
| Short-Term Investments | | | 1,642,442 | | | | 4,414,000 | † | | | — | | | | 6,056,442 | |
| Investments Purchased with the Cash | | | | | | | | | | | | | | | | |
| Proceeds from Securities Lending | | | 25,078,937 | | | | — | | | | — | | | | 25,078,937 | |
| Total Investments in Securities | | $ | 36,263,143 | | | $ | 103,449,737 | | | $ | — | | | $ | 139,712,880 | |
| Liabilities | | | | | | | | | | | | | | | | |
| Written Options | | $ | — | | | $ | 1,697,651 | | | $ | — | | | $ | 1,697,651 | |
For the period ended June 30, 2014, there were no transfers into or out of Level 1 or Level 2, or investments in Level 3 securities.
| ^ | See Portfolio of Investments for breakout of investments by industry classification. |
| † | Priced at amortized cost. |
| KINETICS PORTFOLIOS TRUST — MASTER INVESTMENT PORTFOLIOS |
Notes to Financial Statements — (Continued) |
| June 30, 2014 (Unaudited) |
9. Disclosures about Derivative Instruments and Hedging Activities
The Master Portfolios have adopted enhanced disclosure regarding derivatives and hedging activity intended to improve financial reporting of derivative instruments by enabling investors to understand how and why a Master Portfolio uses derivatives, how derivatives are accounted for by the Master Portfolios, and how derivative instruments affect a Master Portfolio’s results of operations and financial position. The Master Portfolios utilized options to implement or to gain further exposure to their respective investment strategies.
The Alternative Income Portfolio
Statement of Assets and Liabilities
Fair Values of derivative instruments as of June 30, 2014:
| | | Assets | | Liabilities | |
| Equity Contracts | | Description | | Fair Value | | Description | | Fair Value | |
| Purchased Put Options | | Investments, at value | | $ | 62,340 | | | | $ | — | |
| Total | | | | $ | 62,340 | | | | $ | — | |
| Written Options | | | | $ | — | | Written option contracts, at value | | $ | 684,115 | |
| Total | | | | $ | — | | | | $ | 684,115 | |
Statement of Operations
The effect of derivative instruments on the Statement of Operations for the six months ended June 30, 2014:
Amount of Realized Gain (Loss) on Equity Contracts
| Equity Contracts | | | |
| Purchased Put Options | | $ | — | |
| Written Put Options | | | 393,726 | |
| Total | | $ | 393,726 | |
Change in Unrealized Appreciation (Depreciation) on Equity Contracts
| | | | |
| Equity Contracts | | | |
| Purchased Put Options | | $ | 6,092 | |
| Written Put Options | | | 274,957 | |
| Total | | $ | 281,049 | |
The Alternative Income Portfolio has adopted authoritative standards regarding disclosure about derivatives and hedging activities and how they affect the Portfolio’s Statement of Assets and Liabilities and Statement of Operations. For
| KINETICS PORTFOLIOS TRUST — MASTER INVESTMENT PORTFOLIOS |
Notes to Financial Statements — (Continued) |
| June 30, 2014 (Unaudited) |
the six months ended June 30, 2014: written option contracts (4,903 contracts) were opened and $934,631 premiums were received during the period, purchased option contracts (126 contracts) were opened and $56,248 premiums were paid during the period.
The Multi-Disciplinary Portfolio
Statement of Assets and Liabilities
Fair Values of derivative instruments as of June 30, 2014:
| | | Assets | | Liabilities | |
| Equity Contracts | | Description | | Fair Value | | Description | | Fair Value | |
| Purchased Put Options | | Investments, at value | | $ | 1,609,249 | | Written option contracts, at value | | $ | — | |
| Total | | | | $ | 1,609,249 | | | | $ | — | |
| Written Put Options | | | | $ | — | | | | $ | 1,697,651 | |
| Total | | | | $ | — | | | | $ | 1,697,651 | |
Statement of Operations
The effect of derivative instruments on the Statement of Operations for the six months ended June 30, 2014:
Amount of Realized Gain (Loss) on Equity Contracts
| Equity Contracts | | | |
| Purchased Put Options | | $ | — | |
| Written Put Options | | | 2,683,126 | |
| Total | | $ | 2,683,126 | |
Change in Unrealized Appreciation (Depreciation) on Equity Contracts
| Equity Contracts | | | |
| Purchased Put Options | | $ | 206,099 | |
| Written Put Options | | | (1,688,291 | ) |
| Total | | $ | (1,482,192 | ) |
The Multi-Disciplinary Portfolio has adopted authoritative standards regarding disclosure about derivatives and hedging activities and how they affect the Portfolio’s Statement of Assets and Liabilities and Statement of Operations. For the six months ended June 30, 2014: written option contracts (4,142 contracts) were opened and $1,155,122 premiums were received during the period, purchased option contracts (1,497 contracts) were opened and $1,024,882 premiums were paid during the period.
| KINETICS PORTFOLIOS TRUST — MASTER INVESTMENT PORTFOLIOS |
Notes to Financial Statements — (Continued) |
| June 30, 2014 (Unaudited) |
10. Offsetting Assets and Liabilities
The Portfolios are subject to various Master Netting Arrangements, which govern the terms of certain transactions with select counterparties. The Master Netting Arrangements allow the Portfolio to close out and net its total exposure to a counterparty in the event of a default with respect to all the transactions governed under a single agreement with a counterparty. The Master Netting Arrangements also specify collateral posting arrangements at pre-arranged exposure levels. Under the Master Netting Arrangements, collateral is routinely transferred if the total net exposure to certain transactions (net of existing collateral already in place) governed under the relevant Master Netting Arrangement with a counterparty in a given account exceeds a specified threshold depending on the counterparty and the type of Master Netting Arrangement.
The Internet Portfolio
The following is a summary of the Assets and Liabilities subject to offsetting in The Internet Portfolio as of June 30, 2014:
| Liabilities: | | | | | | Gross Amounts Offset in the | | | Net Amounts Presented in the | | | Gross Amounts not offset in the statement of financial position | | | | |
| | | | Gross Amounts of Recognized Liabilities | | | Statement of Financial Position | | | Statement of Financial Position | | | Financial Instruments | | | Collateral Pledged (Received) | | | Net Amount | |
| Description | | | | | | | | | | | | | | | | | | | |
| Securities | | | | | | | | | | | | | | | | | | | |
| Lending | | $ | 21,133,565 | | $ | — | | $ | 21,133,565 | | $ | 21,133,565 | | $ | — | | $ | — | |
The Global Portfolio
The following is a summary of the Assets and Liabilities subject to offsetting in The Global Portfolio as of June 30, 2014:
| Liabilities: | | | | | | Gross Amounts Offset in the | | | Net Amounts Presented in the | | | Gross Amounts not offset in the statement of financial position | | | | |
| | | | Gross Amounts of Recognized Liabilities | | | Statement of Financial Position | | | Statement of Financial Position | | | Financial Instruments | | | Collateral Pledged (Received) | | | Net Amount | |
| Description | | | | | | | | | | | | | | | | | | | |
| Securities | | | | | | | | | | | | | | | | | | | |
| Lending | | $ | 714,121 | | $ | — | | $ | 714,121 | | $ | 714,121 | | $ | — | | $ | — | |
| KINETICS PORTFOLIOS TRUST — MASTER INVESTMENT PORTFOLIOS |
Notes to Financial Statements — (Continued) |
| June 30, 2014 (Unaudited) |
The Paradigm Portfolio
The following is a summary of the Assets and Liabilities subject to offsetting in The Internet Portfolio as of June 30, 2014:
| Liabilities: | | | | | | Gross Amounts Offset in the | | | Net Amounts Presented in the | | | Gross Amounts not offset in the statement of financial position | | | | |
| | | | Gross Amounts of Recognized Liabilities | | | Statement of Financial Position | | | Statement of Financial Position | | | Financial Instruments | | | Collateral Pledged (Received) | | | Net Amount | |
| Description | | | | | | | | | | | | | | | | | | | |
| Securities | | | | | | | | | | | | | | | | | | | |
| Lending | | $ | 74,540,645 | | $ | — | | $ | 74,540,645 | | $ | 74,540,645 | | $ | — | | $ | — | |
The Medical Portfolio
The following is a summary of the Assets and Liabilities subject to offsetting in The Medical Portfolio as of June 30, 2014:
| Liabilities: | | | | | | Gross Amounts Offset in the | | | Net Amounts Presented in the | | | Gross Amounts not offset in the statement of financial position | | | | |
| | | | Gross Amounts of Recognized Liabilities | | | Statement of Financial Position | | | Statement of Financial Position | | | Financial Instruments | | | Collateral Pledged (Received) | | | Net Amount | |
| Description | | | | | | | | | | | | | | | | | | | |
| Securities | | | | | | | | | | | | | | | | | | | |
| Lending | | $ | 5,313,927 | | $ | — | | $ | 5,313,927 | | $ | 5,313,927 | | $ | — | | $ | — | |
The Small Cap Opportunities Portfolio
The following is a summary of the Assets and Liabilities subject to offsetting in The Small Cap Opportunities Portfolio as of June 30, 2014:
| Liabilities: | | | | | | Gross Amounts Offset in the | | | Net Amounts Presented in the | | | Gross Amounts not offset in the statement of financial position | | | | |
| | | | Gross Amounts of Recognized Liabilities | | | Statement of Financial Position | | | Statement of Financial Position | | | Financial Instruments | | | Collateral Pledged (Received) | | | Net Amount | |
| Description | | | | | | | | | | | | | | | | | | | |
| Securities | | | | | | | | | | | | | | | | | | | |
| Lending | | $ | 48,702,392 | | $ | — | | $ | 48,702,392 | | $ | 48,702,392 | | $ | — | | $ | — | |
| KINETICS PORTFOLIOS TRUST — MASTER INVESTMENT PORTFOLIOS |
Notes to Financial Statements — (Continued) |
| June 30, 2014 (Unaudited) |
The Market Opportunities Portfolio
The following is a summary of the Assets and Liabilities subject to offsetting in The Market Opportunities Portfolio as of June 30, 2014:
| Liabilities: | | | | | | Gross Amounts Offset in the | | | Net Amounts Presented in the | | | Gross Amounts not offset in the statement of financial position | | | | |
| | | | Gross Amounts of Recognized Liabilities | | | Statement of Financial Position | | | Statement of Financial Position | | | Financial Instruments | | | Collateral Pledged (Received) | | | Net Amount | |
| Description | | | | | | | | | | | | | | | | | | | |
| Securities | | | | | | | | | | | | | | | | | | | |
| Lending | | $ | 5,564,976 | | $ | — | | $ | 5,564,976 | | $ | 5,564,976 | | $ | — | | $ | — | |
The Alternative Income Portfolio
The following is a summary of the Assets and Liabilities subject to offsetting in The Alternative Income Portfolio as of June 30, 2014:
| Liabilities: | | | | | | Gross Amounts Offset in the | | | Net Amounts Presented in the | | | Gross Amounts not offset in the statement of financial position | | | | |
| | | | Gross Amounts of Recognized Liabilities | | | Statement of Financial Position | | | Statement of Financial Position | | | Financial Instruments | | | Collateral Pledged (Received) | | | Net Amount | |
| Description | | | | | | | | | | | | | | | | | | | |
| Written | | | | | | | | | | | | | | | | | | | |
| Options | | $ | 684,115 | | $ | — | | $ | 684,115 | | $ | — | | $ | 684,115 | | $ | — | |
The Multi-Disciplinary Portfolio
The following is a summary of the Assets and Liabilities subject to offsetting in The Multi-Disciplinary Portfolio as of June 30, 2014:
| Liabilities: | | | | | Gross Amounts Offset in the | | | Net Amounts Presented in the | | | Gross Amounts not offset in the statement of financial position | | | | |
| | | Gross Amounts of Recognized Liabilities | | | Statement of Financial Position | | | Statement of Financial Position | | | Financial Instruments | | | Collateral Pledged (Received) | | | Net Amount | |
| Description | | | | | | | | | | | | | | | | | | |
| Written | | | | | | | | | | | | | | | | | | |
| Options | | $ | 1,697,651 | | | $ | — | | | $ | 1,697,651 | | | $ | — | | | $ | 1,697,651 | | | $ | — | |
| Securities | | | | | | | | | | | | | | | | | | | | | | | | |
| Lending | | | 25,078,937 | | | | — | | | | 25,078,937 | | | | 25,078,937 | | | | — | | | | — | |
| | | $ | 26,776,588 | | | $ | — | | | $ | 26,776,588 | | | $ | 25,078,937 | | | $ | 1,697,651 | | | $ | — | |
| KINETICS PORTFOLIOS TRUST — MASTER INVESTMENT PORTFOLIOS |
Notes to Financial Statements — (Continued) |
| June 30, 2014 (Unaudited) |
11. Information about Proxy Voting
Information regarding how the Master Portfolios votes proxies relating to portfolio securities is available without charge upon request by calling toll-free at 1-800-930-3828 or by accessing the Funds’ website at www.kineticsfunds.com and by accessing the SEC’s website at www.sec.gov. Information regarding how the Master Portfolios voted proxies relating to portfolio securities during the most recent twelve month period ended June 30, is available without charge, upon request, by calling toll-free at 1-800-930-3828 or by accessing the SEC’s website at www.sec.gov.
12. Information about the Portfolio Holdings
The Kinetics Portfolios Trust files its complete schedules of portfolio holdings for its first and third fiscal quarters with the SEC on Form N-Q. The Master Portfolios’ Form N-Q is available without charge, upon request, by calling toll-free at 1-800-930-3828. Furthermore, you can obtain the Form N-Q on the SEC’s website at www.sec.gov. Finally, the Form N-Q may be reviewed and copied at the SEC’s Public Reference Room in Washington, D.C. Information on the operation of the Public Reference Room may be obtained by calling 1-800-SEC-0330.
13. Subsequent Events
Effective July 7, 2014, The Multi-Disciplinary Portfolio changed its name to The Multi-Disciplinary Income Portfolio. The Multi-Disciplinary Fund made corresponding changes to its name on July 7, 2014.
14. Recent Accounting Pronouncements
In June 2014, the Financial Accounting Standard Board issued ASU No. 2014-11 “Repurchase-to-Maturity Transactions, Repurchase Financings, and Disclosures.” ASU No. 2014-11 makes limited changes to the accounting for repurchase agreements, clarifies when repurchase agreements and securities lending transactions should be accounted for as secured borrowings, and requires additional disclosures regarding these types of transactions. The guidance is effective for fiscal years beginning after December 15, 2014, and for interim periods within those fiscal years. Management is currently evaluating the impact these disclosures will have on the Fund’s financial statement disclosures.
[THIS PAGE INTENTIONALLY LEFT BLANK]
[THIS PAGE INTENTIONALLY LEFT BLANK]
[THIS PAGE INTENTIONALLY LEFT BLANK]
[THIS PAGE INTENTIONALLY LEFT BLANK]
[THIS PAGE INTENTIONALLY LEFT BLANK]
Item 2. Code of Ethics.
Item 3. Audit Committee Financial Expert.
Item 4. Principal Accountant Fees and Services.
Item 5. Audit Committee of Listed Registrants.
Not applicable to registrants who are not listed issuers (as defined in Rule 10A-3 under the Securities Exchange Act of 1934).
Item 6. Schedule of Investments.
The Schedule of Investments is included as part of the report to shareholders filed under Item 1 of this Form.
Item 7. Disclosure of Proxy Voting Policies and Procedures for Closed-End Management Investment Companies.
Not applicable to open-end investment companies.
Item 8. Portfolio Managers of Closed-End Management Investment Companies.
Not applicable to open-end investment companies.
Item 9. Purchases of Equity Securities by Closed-End Management Investment Company and Affiliated Purchasers.
Not applicable to open-end investment companies.
Item 10. Submission of Matters to a Vote of Security Holders.
There have been no material changes to the procedures by which shareholders may recommend nominees to the registrant’s board of trustees.
Item 11. Controls and Procedures.
Item 12. Exhibits.
(3) Not applicable to open-end investment companies.
Pursuant to the requirements of the Securities Exchange Act of 1934 and the Investment Company Act of 1940, the registrant has duly caused this report to be signed on its behalf by the undersigned, thereunto duly authorized.
Peter B. Doyle, President
Pursuant to the requirements of the Securities Exchange Act of 1934 and the Investment Company Act of 1940, this report has been signed below by the following persons on behalf of the registrant and in the capacities and on the dates indicated.
Leonid Polyakov, Treasurer
* Print the name and title of each signing officer under his or her signature.