As filed with the Securities and Exchange Commission on September 4, 2015
UNITED STATES
SECURITIES AND EXCHANGE COMMISSION
Washington, D.C. 20549
FORM N-CSR
CERTIFIED SHAREHOLDER REPORT OF REGISTERED
MANAGEMENT INVESTMENT COMPANIES
Investment Company Act file number 811-09303 & 811-09923
Kinetics Mutual Funds, Inc. & Kinetics Portfolios Trust
(Exact name of registrant as specified in charter)
470 Park Avenue South
New York, NY 10016
(Address of principal executive offices) (Zip code)
U.S. Bancorp Fund Services, LLC
615 E. Michigan Street
Milwaukee, WI 53202
(Name and address of agent for service)
(800) 930-3828
Registrant's telephone number, including area code
Date of fiscal year end: December 31, 2015
Date of reporting period: June 30, 2015
Item 1. Report to Stockholders.
| KINETICS MUTUAL FUNDS, INC. |
| Table of Contents |
| June 30, 2015 |
| | Page |
| Shareholders’ Letter | 2 |
| Year 2015 Semi-Annual Investment Commentary | 5 |
| KINETICS MUTUAL FUNDS, INC. — FEEDER FUNDS | |
| Expense Example | 11 |
| Statements of Assets & Liabilities | 17 |
| Statements of Operations | 21 |
| Statements of Changes in Net Assets | 25 |
| Notes to Financial Statements | 36 |
| Financial Highlights | 52 |
| KINETICS PORTFOLIOS TRUST — MASTER INVESTMENT PORTFOLIOS | |
| Allocation of Portfolio Assets | 81 |
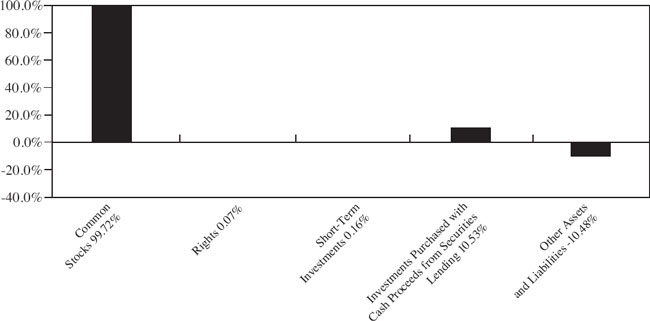
| Portfolio of Investments — The Internet Portfolio | 89 |
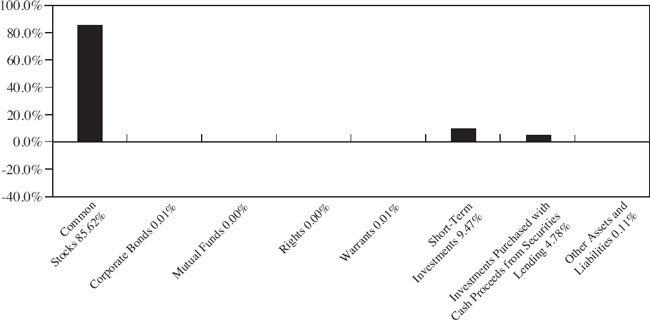
| Portfolio of Investments — The Global Portfolio | 94 |
| Portfolio of Investments — The Paradigm Portfolio | 99 |
| Portfolio of Investments — The Medical Portfolio | 104 |
| Portfolio of Investments — The Small Cap Opportunities Portfolio | 107 |
| Portfolio of Investments — The Market Opportunities Portfolio | 112 |
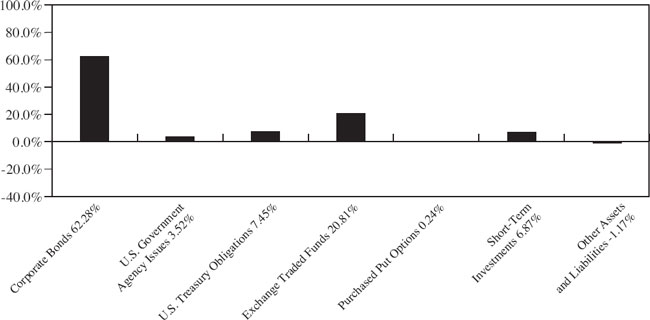
| Portfolio of Investments — The Alternative Income Portfolio | 117 |
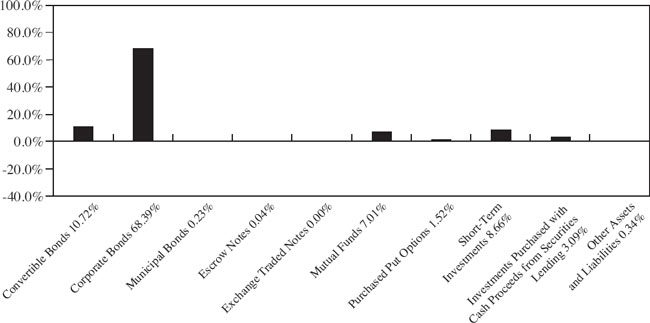
| Portfolio of Investments — The Multi-Disciplinary Income Portfolio | 124 |
| Portfolio of Options Written — The Alternative Income Portfolio | 133 |
| Portfolio of Options Written — The Multi-Disciplinary Income Portfolio | 153 |
| Statements of Assets & Liabilities | 160 |
| Statements of Operations | 164 |
| Statements of Changes in Net Assets | 168 |
| Notes to Financial Statements | 172 |
| KINETICS MUTUAL FUNDS, INC. |
| Shareholders’ Letter |
Dear Fellow Shareholders,
We are pleased to present the Kinetics Mutual Funds (“Funds”) Report for the six-month period ended June 30, 2015. The S&P 500 Index edged nominally higher during the first half of the year, generating a total return of 1.23%. The performance was not evenly split across sectors, as niche companies in technology and healthcare contributed the most to performance, while energy and utilities detracted the most from returns. Our broad market funds had limited exposure to these sectors, while our Medical and Internet Funds benefitted from the respective sectoral advances. In aggregate, however, the Funds largely did not participate in the strong performance of “growth” stocks, as evidenced by the 4.33% first half return of the Russell 3000 Growth Index (an all capitalization index). It does not come as a surprise to us that companies with the ability to grow revenues in a weak global economy have been rewarded with enviable valuations. However, we are concerned that such companies are being rewarded for revenue growth without concern for cash flow growth. This represents the difference in methodology between value and growth investors, with the former (Kinetics included) requiring physical cash generation for investment, and the latter seemingly willing to use a variety of growth metrics for valuation, many of which are not financial in nature (i.e., “subscriber growth” or “total addressable market”).
We are confident that value investing is a prudent long-term strategy, but panics and manias will inevitably distort returns episodically. For example, our long-term returns (10-year) are currently influenced by the global financial crisis (2008-2009) and the present exuberance for growth stocks. Accordingly, the Russell 3000 Growth Index has outperformed the Russell 3000 Value Index by 2.14% annually over the past 10 years. This may not appear to be a profound difference, but over 10 years this discrepancy has resulted in a 140% total return for growth stocks compared to a 97% total return for value stocks. There were similar long-term returns favoring growth stocks in late 1999, influenced by both the savings and loan crisis in the early 1990’s and what was later recognized as a technology bubble later in the decade. We never change our investment process or philosophy due to market preference, and note that since the inceptions of the Funds, our value strategies have proven superior to growth strategies and the broad market.
Despite the outperformance of “growth” companies during the first half of 2015, we are generally satisfied with the year-to-date returns of the Funds, and
believe that our relative performance will improve. The Funds generated returns as follows during the year (No-Load Class): The Paradigm Fund +3.23%, The Multi-Disciplinary Income Fund +1.64%, The Small Cap Opportunities Fund +4.89%, The Market Opportunities Fund +2.34%, The Internet Fund +0.62%, The Medical Fund +11.54%, The Alternative Income Fund +2.58% and The Global Fund +2.81%. This compares to returns of +1.23% for the S&P 500 Index and +2.66% for the MSCI All Country World Index.
Shareholders can continue to access additional information from our website, www.kineticsfunds.com. This website provides a broad array of information, including recent portfolio holdings, quarterly investment commentaries, conference call transcripts, newsflashes, recent performance data, and online access to account information.
Kinetics offers the following funds to investors:
The Paradigm Fund focuses on companies that we believe are valued attractively and currently have, or are expected to soon have, sustainable high business returns. The Fund has produced attractive risk adjusted returns since its inception, while maintaining amongst the lowest turnover rates in the industry. The Paradigm Fund is Kinetics’ flagship fund.
The Multi-Disciplinary Income Fund seeks to utilize stock options and fixed-income investments in order to provide investors with equity-like returns, but with more muted volatility. At times, the options strategies of the Fund may cause the manager to purchase equity securities.
The Small Cap Opportunities Fund focuses on undervalued and special situation small capitalization equities that we believe have the potential for rewarding long-term investment results. The same investment fundamentals employed by The Paradigm Fund are used to identify such opportunities.
The Medical Fund is a sector fund, offering an investment in scientific discovery within the promising field of medical research, particularly in the development of cancer treatments and therapies. As a sector fund, The Medical Fund is likely to have heightened volatility.
The Internet Fund is a sector fund that focuses on companies engaged in the evolution of Internet-related developments. As such, this Fund has been, and is likely to continue to be, quite volatile. The Internet Fund is not designed to be a
major component of one’s equity exposure. More recently, this Fund has been focusing on content companies, which we believe will be the winners in the next generation of Internet development.
The Global Fund’s mandate is focused on selecting long life cycle international companies that we believe can generate long-term wealth through their business operations. This Fund is presently identifying exciting opportunities in the more developed markets.
The Market Opportunities Fund focuses on those companies that benefit from increasing transactional volume or throughput, such as publicly-traded exchanges and credit card processors, or companies that act as facilitators, such as gaming companies, airports and publicly-traded toll roads.
The Alternative Income Fund seeks to provide current income and gains, with a secondary objective of obtaining long-term growth of capital. The Fund utilizes stock options and fixed-income investments and seeks to generate a total return that exceeds most short-term U.S. fixed income indexes, with limited market value variability.
| | The Kinetics Investment Team |
| KINETICS MUTUAL FUNDS, INC. |
| Investment Commentary |
Dear Fellow Shareholders,
A not insignificant portion of equity investors are influenced by historical events in making investment decisions. At the extreme, technical analysts attempt to identify patterns in stock price movements that portend future movements. Perhaps a more balanced use of historical information is that of pension managers basing expected future returns on historical performance. Reasonable as this may seem, one must be acutely aware of the factors that influenced historical returns and how these factors may have changed over time.
Let’s begin by simply analyzing historical equity market returns – depending on which U.S. equity index one happens to use, long-term average equity market returns average out to approximately 10%, including dividends. In the interest of consistency, we will examine the S&P 500, which has been in existence in its current form since 19571. During this period, the average federal funds rate has been 5.17%, average real annual GDP growth has averaged 3.10% and government expenditures have grown at an average rate of 2.01%. Compare this to the current 0.13% federal funds rate, (0.04%) real GDP contraction and (0.17%) contraction in government expenditures. It should be noted that during the market gains over the past 15 years, dating back to June of 2000, the federal funds rate has declined by 640 basis points (from 6.53%), and government expenditures have grown by 15.67%. The point of this analysis is not only that current and recent conditions have been extremely supportive of equity valuations, but also that these variables are all but certain to change going forward.
Equity market returns have been exceptional over the past 5½ years, dating back to 2009, which marked the beginning of the market recovery from the global financial crisis. During this period, the NASDAQ Composite has annualized at 16.8%, the Russell 2000 at 14.2% and the S&P 500 at 15%. Even if we ignore the unprecedented economic stimulus efforts enacted by the U.S. government (and later, various foreign governments), these returns must be taken within the context of average federal funds rates of 0.13%. Not only are rates near the zero lower bound, but Janet Yellen, Chair of the Federal Reserve, appears committed to raising rates within the next 12 months. By definition, this will decrease the present value of the cash flows that companies generate; hence, these cash flows must increase in order to merely maintain current valuations, let alone expand valuations.
The stated objective of the low interest rate environment has been to stimulate economic growth, and facilitate “full employment,” but the resultant reaction of
| | |
| 1 Not including float adjustment in 2004-2005 |
investors has caused perhaps unintended consequences. The dearth of yield in conventional, investment grade fixed income securities has led investors to seek out yield in equities. The first manifestation of this was evident in utilities, real estate investment trusts (REITs) and master limited partnerships (MLPs), all of which pay out significant portions of free cash flow. However, the danger of valuing equity securities solely based upon dividend yield has already been exposed, as the S&P 500 GICS Level 1 Utilities have declined 10.67% this year, the MSCI U.S. REIT Index has declined 6.16% and the Alerian MLP Index has declined 10.99%. Investors seeking income in these securities were likely unprepared for such capital depreciation.
The most recent manifestation of low rates appears to be present in less conspicuous yield oriented securities: the “blue chips” of the S&P 500. Consider Philip Morris International, the non-U.S. tobacco and cigarette company. Despite the stigma of investing in tobacco, the company commands a 17.8x price-to-earnings multiple based on expected 2015 earnings and has an estimated long-term growth rate of 5%. Compare this to Apple Inc., which trades at 13.3x expected 2015 earnings and which has an estimated long-term growth rate of 15%. Apple is expected to grow approximately 3x greater than Philip Morris, yet trades at a discount of over 5x expected earnings. Both of these companies are large constituents of various popular indexes; in fact, Apple is a far larger weighting in the S&P 500 than Philip Morris. Thus, there must be more at play than simply an indexation/ETF flow driven valuation disconnect. Apple currently has a dividend yield of approximately 1.7%, while Philip Morris boasts a yield of approximately 4.9%. We contend that Philip Morris has attracted a shareholder base that uses it as a “bond substitute,” as its yield appears to be sustainable and growing, and the current yield is over double the current yield of a 10-year U.S. Treasury. If and when interest rates increase, these shares may experience the same fate as the aforementioned utilities, REITs and MLPs. Furthermore, despite the stability of Philip Morris’s products, the company is only reinvesting approximately 12.8% of funds from operations and pays out over 70% of funds from operations.
We have focused this letter primarily on large capitalization index constituents that we expect will have unenviable long-term rates of return from this point in time. The returns are likely to be unsatisfactory relative to the equity risk investors must accept, but still positive on an absolute basis, given the strong balance sheets and durable cash flows of most large U.S. companies. In other words, we do not envision a crisis or price collapse, but a much less inauspicious prolonged period of single digit returns. Given this outlook and our target rate of return, we must look elsewhere for our investments. We are hesitant to invest in various classic “value” investments that trade at statistically low values relative to cash flow and book value, but that are losing
competitiveness and don’t have our required long product lifecycle. While we add new positions as we uncover them, for the most part, the Funds have comprised many of the same investments for many years now, and for good reason: we believe that they remain attractive investment opportunities.
The Funds are generally dominated by owner-operated companies that suffer from a valuation discount that we believe is related to most investors’ short-term investment horizon. Historically, we have earned a higher annualized rate of return than most investors and the markets due to our willingness to wait for returns with an indefinite period for realization, a “time arbitrage,” as we call it. This can be a humbling and frustrating strategy as it is all but certain to experience periods of underperformance relative to the market and peers. We are loathe to forecast short-term performance or to strive to identify similarly short-term catalysts, but we will examine some short and intermediate term events that may drive returns.
DISH Network Corporation (“DISH”) is widely recognized as one of two prominent satellite television providers in the United States. The company is run by owner-operator and founder Charles Ergen, who owns nearly $17 billion of the company. The core business of DISH is mature at best, and likely in decline, as linear television viewing has shifted to streaming and On Demand offerings. Despite this, DISH has not wavered in its annual price increase for its core subscription service. This business will likely stabilize in time and continues to generate copious free cash flow. If we apply a modest multiple to this cash flow, we arrive at a market capitalization that is well below the current market-assigned equity value of the company. As a side note, it’s worth mentioning that this dynamic precludes DISH from being analyzed by investors using investment screens, as it appears to be statically “expensive.” It turns out that DISH trades at a premium for very good reasons. The more immediate opportunity that is now apparent in the company’s financial statements relates to the company’s 2007 acquisition of Sling Media. Sling, which has yet to generate meaningful cash flow, is an “over the top” (i.e., no cable subscription) internet protocol television (“IPTV”) service. This service allows subscribers to access a limited, but highly valuable roster of televised content for $20 per month on TV, tablet, phone or computer. IPTV is in its infancy, as content partners are fighting to maintain their valuable “bundles” of channels, which are only distributed together through cable companies. However, streaming appears to be the direction that television viewership is headed, particularly for millennials and future generations. Sling Media would certainly fetch a gaudy valuation multiple were it traded separately, but we are happy to have exposure through DISH.
Sling Media has great potential, but its ultimate value is far from certain, and likely rather small related to the total asset value of DISH. The far more uncertain and significant “hidden” value is related to DISH’s 2012 acquisition of wireless spectrum rights from bankrupt DBSD North America and TerreStar Networks. DISH has invested over $5.0 billion in wireless spectrum licenses and related assets dating back to 2008, including certain 700 MHz licenses acquired at the height of the financial crisis. More importantly, the 2012 acquisitions include 40 MHz of licenses under AWS-4 authority. This spectrum is in the ultra-high frequency (“UHF”) band and of particular interest due to the rapidly accelerating wireless data demand related to smart phone and tablets. It is thought that DISH will partner, sell or sublease these licenses with/to a wireless operator that is in need of additional capacity. While it was speculated that the licenses were worth a considerable amount more than cost, the picture became clearer in January of this year with the conclusion of the FCC AWS-3 auction, which provided indicative pricing for DISH’s AWS-4 licenses. The auction suggests that DISH spectrum may be worth as much as the entire company is currently being traded for; yet, the stock is down over 7% through the first 2 quarters of this year.
The value of Sling Media and the wireless spectrum is ignored by most of the investment community simply due to the uncertainty regarding the timing and method of ultimate value realization. Charles Ergen has nearly $17 billion of his personal capital at stake and is methodical in his exploration of monetization efforts, and thus far his patience has resulted in only increasing indicative value for the assets. This is exactly the type of opportunity that we embrace, recognizing that our conservative estimated rate of return will be well into the double digits, even if 3-5 years are required to realize the asset values.
Many of the top positions in the Funds exhibit similar characteristics to DISH: dormant assets, owner operator, spin-off history, terms of trades, scalability, and time arbitrage. The catalyst may not be as obvious with most holdings as it is with DISH, but with every day that passes, the realization of these returns is nearer. Patience has long been our strong suit, and it is particularly difficult with low rate-driven broad market rallies. We have been through periods such as this before and have been rewarded at the end. We believe that this experience will not be different.
Disclaimer:
There is no assurance that specific securities discussed herein are, or will remain, holdings in the Funds. Opinions expressed are Kinetics Asset Management’s present opinions only, and are subject to change.
Disclosure
This material is intended to be reviewed in conjunction with a current prospectus, which includes all fees and expenses that apply to a continued investment, as well as information regarding the risk factors, policies and objectives of the Funds. Read it carefully before investing.
Mutual Fund investing involves risk. Principal loss is possible. Because The Internet Fund, The Medical Fund and The Market Opportunities Fund invest in a single industry or geographic region, their shares are subject to a higher degree of risk than funds with a higher level of diversification. Internet, biotechnology and certain capital markets or gaming stocks are subject to a rate of change in technology, obsolescence and competition that is generally higher than that of other industries, hence they may experience extreme price and volume fluctuations.
International investing [for all Funds] presents special risks including currency exchange fluctuation, government regulations, and the potential for political and economic instability. Accordingly, the share prices for these Funds are expected to be more volatile than that of U.S.-only funds. Past performance is no guarantee of future performance.
Because smaller companies [for The Small Cap Opportunities Fund] often have narrower markets and limited financial resources, they present more risk than larger, more well established, companies.
Non-investment grade debt securities [for all Funds], i.e., junk bonds, are subject to greater credit risk, price volatility and risk of loss than investment grade securities.
Further, options contain special risks including the imperfect correlation between the value of the option and the value of the underlying asset. Investments [for The Multi-Disciplinary Income Fund and The Alternative Income Fund] in futures, swaps and other derivative instruments may result in loss as derivative instruments may be illiquid, difficult to price and leveraged so that small changes may produce disproportionate losses to the Funds. To the extent the Funds segregate assets to cover derivative positions, they may impair their ability to meet current obligations, to honor requests for redemption and to manage the investments in a manner consistent with their respective investment objectives. Purchasing and writing put and call
options and, in particular, writing “uncovered” options are highly specialized activities that entail greater than ordinary investment risk.
As non-diversified Funds [except The Global Fund and The Multi-Disciplinary Income Fund] the value of Fund shares may fluctuate more than shares invested in a broader range of industries and companies. Unlike other investment companies that directly acquire and manage their own portfolios of securities, The Kinetics Mutual Funds pursue their investment objectives by investing all of their investable assets in a corresponding portfolio series of the Kinetics Portfolios Trust.
The information concerning the Funds included in the shareholder report contains certain forward-looking statements about the factors that may affect the performance of the Funds in the future. These statements are based on Fund management’s predictions and expectations concerning certain future events and their expected impact on the Funds, such as performance of the economy as a whole and of specific industry sectors, changes in the levels of interest rates, the impact of developing world events, and other factors that may influence the future performance of the Funds. Management believes these forward-looking statements to be reasonable, although they are inherently uncertain and difficult to predict. Actual events may cause adjustments in portfolio management strategies from those currently expected to be employed.
The Nasdaq Composite (NASDAQ) and the Standard & Poor’s 500 Index (S&P 500) each represent an unmanaged, broad-basket of stocks. They are typically used as a proxy for overall market performance.
Distributor: Kinetics Funds Distributor LLC is not an affiliate of Kinetics Mutual Funds, Inc. Kinetics Funds Distributor LLC is an affiliate of Kinetics Asset Management LLC, Investment Adviser to Kinetics Mutual Funds, Inc.
For more information, log onto www.kineticsfunds.com. July 1, 2015 — Kinetics Asset Management LLC®
| KINETICS MUTUAL FUNDS, INC. — THE FEEDER FUNDS |
| Expense Example |
| June 30, 2015 (Unaudited) |
Shareholders incur two types of costs: (1) transaction costs, including sales charges (loads) on purchase payments, reinvestments of dividends or other distributions made by a Fund, redemption fees, and exchange fees, and (2), ongoing costs, including management fees, distribution and/or service (12b-1) fees, and other Fund expenses. This example is intended to help investors understand the ongoing costs (in dollars) of investing in a series of Kinetics Mutual Funds, Inc. (each a “Feeder Fund” and collectively the “Feeder Funds”), and to compare these costs with the ongoing costs of investing in other mutual funds. The example is based on an investment of $1,000 invested on January 1, 2015 and held for the entire period from January 1, 2015 to June 30, 2015.
Actual Expenses
The first line item of the table below provides information about actual account values and actual expenses before and after expense reimbursement. Unlike other mutual funds that directly acquire and manage their own portfolio securities, each Feeder Fund invests all or generally all of its investable assets in a corresponding series of The Kinetics Portfolios Trust (each, a “Master Portfolio”, and together the “Master Portfolios”), a separately registered investment company. The Master Portfolio, in turn, invests in securities. With this type of organization, expenses can accrue specifically to the Master Portfolio or the Feeder Fund or both. Each Feeder Fund records its proportionate share of the Master Portfolio’s expenses, including directed brokerage credits, on a daily basis. Any expense reductions include Fund-specific expenses as well as the expenses allocated from the Master Portfolio.
The Feeder Funds will charge shareholder fees for outgoing wire transfers, returned checks, and exchanges executed by telephone between a Feeder Fund and any other Feeder Fund. The Feeder Funds’ transfer agent charges a $5.00 transaction fee to shareholder accounts for telephone exchanges between any two Feeder Funds. The Feeder Funds’ transfer agent does not charge a transaction fee for written exchange requests. IRA accounts are assessed a $15.00 annual fee. Finally, as a disincentive to market-timing transactions, the Feeder Funds will assess a 2.00% fee on the redemption or exchange of Fund shares held for less than 30 days. These fees will be paid to the Feeder Funds to help offset transaction costs. The Feeder Funds reserve the right to waive the redemption fee, subject to their sole discretion, in instances deemed not to be disadvantageous to the Feeder Funds or shareholders as described in the Feeder Funds’ prospectus.
| KINETICS MUTUAL FUNDS, INC. — THE FEEDER FUNDS |
Expense Example — (Continued) |
| June 30, 2015 (Unaudited) |
You may use the information provided in the first line, together with the amounts you invested, to estimate the expenses that you paid over the period. Simply divide your account value by $1,000 (for example, an $8,600 account value divided by $1,000 = 8.6), then multiply the result by the number in the first line under the heading entitled “Expenses Paid During Period” to estimate the expenses you paid on your account during this period.
Hypothetical Example for Comparison Purposes
The second line item of the tables below provide information about hypothetical account values and hypothetical expenses based on the Feeder Funds’ actual expense ratios and an assumed rate of return of 5% per year before expenses, which are not the Feeder Funds’ actual returns. The hypothetical account values and expenses may not be used to estimate the actual ending account balance or expenses one paid for the period. You may use this information to compare the ongoing costs of investing in the Feeder Funds and other funds. To do so, compare this 5% hypothetical example with the 5% hypothetical examples that appear in the shareholder reports of other funds. Please note that the expenses shown in the table are meant to highlight one’s ongoing costs only and do not reflect any transactional costs, such as sales charges (loads), redemption fees, or exchange fees. Therefore, the second line of the tables are useful in comparing ongoing costs only, and will not help one determine the relative total costs of owning different funds. If these transactional costs had been included, one’s costs would have been higher.
| KINETICS MUTUAL FUNDS, INC. — THE FEEDER FUNDS |
Expense Example — (Continued) |
| June 30, 2015 (Unaudited) |
| | | | | | | | | | | | | Expenses Paid | |
| | | | Beginning | | | Ending | | | | | | During | |
| | | | Account | | | Account | | | Annualized | | Period* | |
| | | | Value | | | Value | | | Expense | | (1/1/15 to | |
| | | | (1/1/15) | | | (6/30/15) | | | Ratio | | 6/30/15) | |
| | | | | | | | | | | | | | |
| The Internet Fund | | | | | | | | | | | | | |
| No Load Class Actual | | $ | 1,000.00 | | $ | 1,006.20 | | | 1.81 | % | $ | 9.00 | |
| No Load Class Hypothetical (5% return | | | | | | | | | | | | | |
| before expenses) | | $ | 1,000.00 | | $ | 1,015.82 | | | 1.81 | % | $ | 9.05 | |
| Advisor Class A Actual | | $ | 1,000.00 | | $ | 1,005.10 | | | 2.06 | % | $ | 10.24 | |
| Advisor Class A Hypothetical (5% return | | | | | | | | | | | | | |
| before expenses) | | $ | 1,000.00 | | $ | 1,014.58 | | | 2.06 | % | $ | 10.29 | |
| Advisor Class C Actual | | $ | 1,000.00 | | $ | 1,002.50 | | | 2.56 | % | $ | 12.71 | |
| Advisor Class C Hypothetical (5% return | | | | | | | | | | | | | |
| before expenses) | | $ | 1,000.00 | | $ | 1,012.11 | | | 2.56 | % | $ | 12.77 | |
| | | | | | | | | | | | | | |
| The Global Fund | | | | | | | | | | | | | |
| No Load Class Actual — after expense | | | | | | | | | | | | | |
| reimbursement | | $ | 1,000.00 | | $ | 1,028.10 | | | 1.39 | % | $ | 6.99 | |
| No Load Class Hypothetical (5% return | | | | | | | | | | | | | |
| before expenses) — after | | | | | | | | | | | | | |
| expense reimbursement | | $ | 1,000.00 | | $ | 1,017.91 | | | 1.39 | % | $ | 6.95 | |
| Advisor Class A Actual — after expense | | | | | | | | | | | | | |
| reimbursement | | $ | 1,000.00 | | $ | 1,028.20 | | | 1.64 | % | $ | 8.25 | |
| Advisor Class A Hypothetical (5% return | | | | | | | | | | | | | |
| before expenses) — after | | | | | | | | | | | | | |
| expense reimbursement | | $ | 1,000.00 | | $ | 1,016.67 | | | 1.64 | % | $ | 8.20 | |
| Advisor Class C Actual — after | | | | | | | | | | | | | |
| expense reimbursement | | $ | 1,000.00 | | $ | 1,023.30 | | | 2.14 | % | $ | 10.74 | |
| Advisor Class C Hypothetical (5% return | | | | | | | | | | | | | |
| before expenses) — after | | | | | | | | | | | | | |
| expense reimbursement | | $ | 1,000.00 | | $ | 1,014.19 | | | 2.14 | % | $ | 10.69 | |
| KINETICS MUTUAL FUNDS, INC. — THE FEEDER FUNDS |
Expense Example — (Continued) |
| June 30, 2015 (Unaudited) |
| | | | | | | | | | | | | | |
| | | | | | | | | | | | | Expenses Paid | |
| | | | Beginning | | | Ending | | | | | | During | |
| | | | Account | | | Account | | | Annualized | | Period* | |
| | | | Value | | | Value | | | Expense | | (1/1/15 to | |
| | | | (1/1/15) | | | (6/30/15) | | | Ratio | | 6/30/15) | |
| | | | | | | | | | | | | | |
| The Paradigm Fund | | | | | | | | | | | | | |
| No Load Class Actual — after expense | | | | | | | | | | | | | |
| reimbursement | | $ | 1,000.00 | | $ | 1,032.30 | | | 1.64 | % | $ | 8.26 | |
| No Load Class Hypothetical (5% return | | | | | | | | | | | | | |
| before expenses) — after | | | | | | | | | | | | | |
| expense reimbursement | | $ | 1,000.00 | | $ | 1,016.67 | | | 1.64 | % | $ | 8.20 | |
| Advisor Class A Actual — after | | | | | | | | | | | | | |
| expense reimbursement | | $ | 1,000.00 | | $ | 1,031.10 | | | 1.89 | % | $ | 9.52 | |
| Advisor Class A Hypothetical (5% return | | | | | | | | | | | | | |
| before expenses) — after | | | | | | | | | | | | | |
| expense reimbursement | | $ | 1,000.00 | | $ | 1,015.43 | | | 1.89 | % | $ | 9.44 | |
| Advisor Class C Actual — after | | | | | | | | | | | | | |
| expense reimbursement | | $ | 1,000.00 | | $ | 1,028.90 | | | 2.39 | % | $ | 12.02 | |
| Advisor Class C Hypothetical (5% return | | | | | | | | | | | | | |
| before expenses) — after | | | | | | | | | | | | | |
| expense reimbursement | | $ | 1,000.00 | | $ | 1,012.95 | | | 2.39 | % | $ | 11.93 | |
| Institutional Class Actual — after | | | | | | | | | | | | | |
| expense reimbursement | | $ | 1,000.00 | | $ | 1,033.70 | | | 1.44 | % | $ | 7.26 | |
| Institutional Class Hypothetical (5% return | | | | | | | | | | | | | |
| before expenses) — after | | | | | | | | | | | | | |
| expense reimbursement | | $ | 1,000.00 | | $ | 1,017.66 | | | 1.44 | % | $ | 7.20 | |
| | | | | | | | | | | | | | |
| The Medical Fund | | | | | | | | | | | | | |
| No Load Class Actual — after | | | | | | | | | | | | | |
| expense reimbursement | | $ | 1,000.00 | | $ | 1,115.40 | | | 1.39 | % | $ | 7.29 | |
| No Load Class Hypothetical (5% return | | | | | | | | | | | | | |
| before expenses) — after | | | | | | | | | | | | | |
| expense reimbursement | | $ | 1,000.00 | | $ | 1,017.91 | | | 1.39 | % | $ | 6.95 | |
| Advisor Class A Actual — after | | | | | | | | | | | | | |
| expense reimbursement | | $ | 1,000.00 | | $ | 1,114.10 | | | 1.64 | % | $ | 8.60 | |
| Advisor Class A Hypothetical (5% return | | | | | | | | | | | | | |
| before expenses) — after | | | | | | | | | | | | | |
| expense reimbursement | | $ | 1,000.00 | | $ | 1,016.67 | | | 1.64 | % | $ | 8.20 | |
| Advisor Class C Actual — after | | | | | | | | | | | | | |
| expense reimbursement | | $ | 1,000.00 | | $ | 1,111.50 | | | 2.14 | % | $ | 11.20 | |
| Advisor Class C Hypothetical (5% return | | | | | | | | | | | | | |
| before expenses) — after | | | | | | | | | | | | | |
| expense reimbursement | | $ | 1,000.00 | | $ | 1,014.19 | | | 2.14 | % | $ | 10.69 | |
| KINETICS MUTUAL FUNDS, INC. — THE FEEDER FUNDS |
Expense Example — (Continued) |
| June 30, 2015 (Unaudited) |
| | | | | | | | | | | | | Expenses Paid | |
| | | | Beginning | | | Ending | | | | | | During | |
| | | | Account | | | Account | | | Annualized | | Period* | |
| | | | Value | | | Value | | | Expense | | (1/1/15 to | |
| | | | (1/1/15) | | | (6/30/15) | | | Ratio | | 6/30/15) | |
| | | | | | | | | | | | | | |
| The Small Cap Opportunities Fund | | | | | | | | | | | | | |
| No Load Class Actual — after | | | | | | | | | | | | | |
| expense reimbursement | | $ | 1,000.00 | | $ | 1,048.90 | | | 1.64 | % | $ | 8.33 | |
| No Load Class Hypothetical (5% return | | | | | | | | | | | | | |
| before expenses) — after | | | | | | | | | | | | | |
| expense reimbursement | | $ | 1,000.00 | | $ | 1,016.67 | | | 1.64 | % | $ | 8.20 | |
| Advisor Class A Actual — after | | | | | | | | | | | | | |
| expense reimbursement | | $ | 1,000.00 | | $ | 1,047.80 | | | 1.89 | % | $ | 9.60 | |
| Advisor Class A Hypothetical (5% return | | | | | | | | | | | | | |
| before expenses) — after | | | | | | | | | | | | | |
| expense reimbursement | | $ | 1,000.00 | | $ | 1,015.43 | | | 1.89 | % | $ | 9.44 | |
| Advisor Class C Actual — after | | | | | | | | | | | | | |
| expense reimbursement | | $ | 1,000.00 | | $ | 1,045.10 | | | 2.39 | % | $ | 12.12 | |
| Advisor Class C Hypothetical (5% return | | | | | | | | | | | | | |
| before expenses) — after | | | | | | | | | | | | | |
| expense reimbursement | | $ | 1,000.00 | | $ | 1,012.95 | | | 2.39 | % | $ | 11.93 | |
| Institutional Class Actual — after | | | | | | | | | | | | | |
| expense reimbursement | | $ | 1,000.00 | | $ | 1,050.10 | | | 1.44 | % | $ | 7.32 | |
| Institutional Class Hypothetical (5% return | | | | | | | | | | | | | |
| before expenses) — after | | | | | | | | | | | | | |
| expense reimbursement | | $ | 1,000.00 | | $ | 1,017.66 | | | 1.44 | % | $ | 7.20 | |
| | | | | | | | | | | | | | |
| The Market Opportunities Fund | | | | | | | | | | | | | |
| No Load Class Actual — after expense | | | | | | | | | | | | | |
| reimbursement | | $ | 1,000.00 | | $ | 1,023.40 | | | 1.64 | % | $ | 8.23 | |
| No Load Class Hypothetical (5% return | | | | | | | | | | | | | |
| before expenses) — after | | | | | | | | | | | | | |
| expense reimbursement | | $ | 1,000.00 | | $ | 1,016.67 | | | 1.64 | % | $ | 8.20 | |
| Advisor Class A Actual — after | | | | | | | | | | | | | |
| expense reimbursement | | $ | 1,000.00 | | $ | 1,022.30 | | | 1.89 | % | $ | 9.48 | |
| Advisor Class A Hypothetical (5% return | | | | | | | | | | | | | |
| before expenses) — after | | | | | | | | | | | | | |
| expense reimbursement | | $ | 1,000.00 | | $ | 1,015.43 | | | 1.89 | % | $ | 9.44 | |
| Advisor Class C Actual — after | | | | | | | | | | | | | |
| expense reimbursement | | $ | 1,000.00 | | $ | 1,019.70 | | | 2.39 | % | $ | 11.97 | |
| Advisor Class C Hypothetical (5% return | | | | | | | | | | | | | |
| before expenses) — after | | | | | | | | | | | | | |
| expense reimbursement | | $ | 1,000.00 | | $ | 1,012.95 | | | 2.39 | % | $ | 11.93 | |
| Institutional Class Actual — after | | | | | | | | | | | | | |
| expense reimbursement | | $ | 1,000.00 | | $ | 1,025.00 | | | 1.44 | % | $ | 7.23 | |
| Institutional Class Hypothetical (5% return | | | | | | | | | | | | | |
| before expenses) — after | | | | | | | | | | | | | |
| expense reimbursement | | $ | 1,000.00 | | $ | 1,017.66 | | | 1.44 | % | $ | 7.20 | |
| KINETICS MUTUAL FUNDS, INC. — THE FEEDER FUNDS |
Expense Example — (Continued) |
| June 30, 2015 (Unaudited) |
| | | | | | | | | | | | | Expenses Paid | |
| | | | Beginning | | | Ending | | | | | | During | |
| | | | Account | | | Account | | | Annualized | | Period* | |
| | | | Value | | | Value | | | Expense | | (1/1/15 to | |
| | | | (1/1/15) | | | (6/30/15) | | | Ratio | | 6/30/15) | |
| | | | | | | | | | | | | | |
| The Alternative Income Fund | | | | | | | | | | | | | |
| No Load Class Actual — after | | | | | | | | | | | | | |
| expense reimbursement | | $ | 1,000.00 | | $ | 1,025.80 | | | 0.95 | % | $ | 4.77 | |
| No Load Class Hypothetical (5% return | | | | | | | | | | | | | |
| before expenses) — after | | | | | | | | | | | | | |
| expense reimbursement | | $ | 1,000.00 | | $ | 1,020.09 | | | 0.95 | % | $ | 4.76 | |
| Advisor Class A Actual — after | | | | | | | | | | | | | |
| expense reimbursement | | $ | 1,000.00 | | $ | 1,024.40 | | | 1.20 | % | $ | 6.02 | |
| Advisor Class A Hypothetical (5% return | | | | | | | | | | | | | |
| before expenses) — after | | | | | | | | | | | | | |
| expense reimbursement | | $ | 1,000.00 | | $ | 1,018.85 | | | 1.20 | % | $ | 6.01 | |
| Advisor Class C Actual — after | | | | | | | | | | | | | |
| expense reimbursement | | $ | 1,000.00 | | $ | 1,022.10 | | | 1.70 | % | $ | 8.52 | |
| Advisor Class C Hypothetical (5% return | | | | | | | | | | | | | |
| before expenses) — after | | | | | | | | | | | | | |
| expense reimbursement | | $ | 1,000.00 | | $ | 1,016.37 | | | 1.70 | % | $ | 8.50 | |
| Institutional Class Actual — after | | | | | | | | | | | | | |
| expense reimbursement | | $ | 1,000.00 | | $ | 1,026.50 | | | 0.75 | % | $ | 3.77 | |
| Institutional Class Hypothetical (5% return | | | | | | | | | | | | | |
| before expenses) — after | | | | | | | | | | | | | |
| expense reimbursement | | $ | 1,000.00 | | $ | 1,021.08 | | | 0.75 | % | $ | 3.76 | |
| | | | | | | | | | | | | | |
| The Multi-Disciplinary Income Fund | | | | | | | | | | | | | |
| No Load Class Actual — after | | | | | | | | | | | | | |
| expense reimbursement | | $ | 1,000.00 | | $ | 1,016.40 | | | 1.49 | % | $ | 7.45 | |
| No Load Class Hypothetical (5% return | | | | | | | | | | | | | |
| before expenses) — after | | | | | | | | | | | | | |
| expense reimbursement | | $ | 1,000.00 | | $ | 1,017.41 | | | 1.49 | % | $ | 7.45 | |
| Advisor Class A Actual — after | | | | | | | | | | | | | |
| expense reimbursement | | $ | 1,000.00 | | $ | 1,015.20 | | | 1.74 | % | $ | 8.69 | |
| Advisor Class A Hypothetical (5% return | | | | | | | | | | | | | |
| before expenses) — after | | | | | | | | | | | | | |
| expense reimbursement | | $ | 1,000.00 | | $ | 1,016.17 | | | 1.74 | % | $ | 8.70 | |
| Advisor Class C Actual — after | | | | | | | | | | | | | |
| expense reimbursement | | $ | 1,000.00 | | $ | 1,012.90 | | | 2.24 | % | $ | 11.18 | |
| Advisor Class C Hypothetical (5% return | | | | | | | | | | | | | |
| before expenses) — after | | | | | | | | | | | | | |
| expense reimbursement | | $ | 1,000.00 | | $ | 1,013.69 | | | 2.24 | % | $ | 11.18 | |
| Institutional Class Actual — after | | | | | | | | | | | | | |
| expense reimbursement | | $ | 1,000.00 | | $ | 1,017.40 | | | 1.29 | % | $ | 6.45 | |
| Institutional Class Hypothetical (5% return | | | | | | | | | | | | | |
| before expenses) — after | | | | | | | | | | | | | |
| expense reimbursement | | $ | 1,000.00 | | $ | 1,018.40 | | | 1.29 | % | $ | 6.46 | |
| Note: | Each Feeder Fund records its proportionate share of the respective Master Portfolio’s expenses on a daily basis. Any expense reductions include Feeder Fund-specific expenses as well as the expenses allocated for the Master Portfolio. |
| * | Expenses are equal to the Feeder Fund’s annualized expense ratio before expense reimbursement and after expense reimbursement multiplied by the average account value over the period, multiplied by 181/365. |
| KINETICS MUTUAL FUNDS, INC. — THE FEEDER FUNDS |
| Statements of Assets & Liabilities |
| June 30, 2015 (Unaudited) |
| | | The Internet | | | The Global | |
| | | Fund | | | Fund | |
| ASSETS: | | | | | | |
| Investments in the Master Portfolio, at value* | | $ | 145,287,660 | | | $ | 8,741,186 | |
| Receivable from Adviser | | | — | | | | 9,909 | |
| Receivable for Master Portfolio interest sold | | | 25,540 | | | | — | |
| Receivable for Fund shares sold | | | 28,513 | | | | 14,215 | |
| Prepaid expenses and other assets | | | 27,361 | | | | 23,985 | |
| Total Assets | | | 145,369,074 | | | | 8,789,295 | |
| LIABILITIES: | | | | | | | | |
| Payable for Master Portfolio interest purchased | | | — | | | | 14,215 | |
| Payable to Directors | | | 2,342 | | | | 139 | |
| Payable to Chief Compliance Officer | | | 169 | | | | 8 | |
| Payable for Fund shares repurchased | | | 54,053 | | | | — | |
| Payable for shareholder servicing fees | | | 30,788 | | | | 1,852 | |
| Payable for distribution fees | | | 3,981 | | | | 4,089 | |
| Accrued expenses and other liabilities | | | 58,985 | | | | 12,372 | |
| Total Liabilities | | | 150,318 | | | | 32,675 | |
| Net Assets | | $ | 145,218,756 | | | $ | 8,756,620 | |
| NET ASSETS CONSIST OF: | | | | | | | | |
| Paid in capital | | $ | 59,105,725 | | | $ | 7,259,862 | |
| Accumulated net investment loss | | | (907,076 | ) | | | (12,797 | ) |
Accumulated net realized gain on investments and foreign currency | | | 12,131,577 | | | | 171,817 | |
| Net unrealized appreciation on: | | | | | | | | |
| Investments and foreign currency | | | 74,888,530 | | | | 1,337,738 | |
| Net Assets | | $ | 145,218,756 | | | $ | 8,756,620 | |
| CALCULATION OF NET ASSET VALUE PER SHARE — NO LOAD CLASS: | | | | | | | | |
| Net Assets | | $ | 140,218,313 | | | $ | 6,396,510 | |
| Shares outstanding | | | 2,484,735 | | | | 1,167,549 | |
| Net asset value per share (offering price and redemption price) | | $ | 56.43 | | | $ | 5.48 | |
| CALCULATION OF NET ASSET VALUE PER SHARE — ADVISOR CLASS A: | | | | | | | | |
| Net Assets | | $ | 3,991,010 | | | $ | 501,613 | |
| Shares outstanding | | | 72,848 | | | | 91,942 | |
| Net asset value per share (redemption price) | | $ | 54.79 | | | $ | 5.46 | |
Offering price per share ($54.79 divided by .9425 and $5.46 divided by .9425) | | $ | 58.13 | | | $ | 5.79 | |
| CALCULATION OF NET ASSET VALUE PER SHARE — ADVISOR CLASS C: | | | | | | | | |
| Net Assets | | $ | 1,009,433 | | | $ | 1,858,497 | |
| Shares outstanding | | | 19,436 | | | | 351,631 | |
| Net asset value per share (offering price and redemption price) | | $ | 51.94 | | | $ | 5.29 | |
| * | Each Feeder Fund invests all or generally all its assets directly in the corresponding Master Portfolio. The financial statements for the Master Portfolios, along with the portfolio of investments in securities, are contained elsewhere in this report and should be read in conjunction with the Feeder Funds’ financial statements. |
The accompanying notes are an integral part of these financial statements.
| KINETICS MUTUAL FUNDS, INC. — THE FEEDER FUNDS |
Statements of Assets & Liabilities — (Continued) |
| June 30, 2015 (Unaudited) |
| | | The Paradigm | | | The Medical | |
| | | Fund | | | Fund | |
| ASSETS: | | | | | | |
| Investments in the Master Portfolio, at value* | | $ | 1,075,783,157 | | | $ | 29,867,473 | |
| Receivable from Adviser | | | 106,768 | | | | 15,737 | |
| Receivable for Master Portfolio interest sold | | | 399,248 | | | | — | |
| Receivable for Fund shares sold | | | 769,413 | | | | 31,371 | |
| Prepaid expenses and other assets | | | 66,142 | | | | 21,153 | |
| Total Assets | | | 1,077,124,728 | | | | 29,935,734 | |
| LIABILITIES: | | | | | | | | |
| Payable for Master Portfolio interest purchased | | | — | | | | 28,902 | |
| Payable to Directors | | | 17,534 | | | | 449 | |
| Payable to Chief Compliance Officer | | | 1,287 | | | | 32 | |
| Payable for Fund shares repurchased | | | 1,168,660 | | | | 2,469 | |
| Payable for shareholder servicing fees | | | 168,677 | | | | 6,192 | |
| Payable for distribution fees | | | 436,932 | | | | 4,374 | |
| Accrued expenses and other liabilities | | | 237,635 | | | | 15,822 | |
| Total Liabilities | | | 2,030,725 | | | | 58,240 | |
| Net Assets | | $ | 1,075,094,003 | | | $ | 29,877,494 | |
| NET ASSETS CONSIST OF: | | | | | | | | |
| Paid in capital | | $ | 1,395,681,914 | | | $ | 15,877,258 | |
| Accumulated net investment income (loss) | | | (13,457,785 | ) | | | 142,398 | |
Accumulated net realized gain (loss) on investments and foreign currency | | | (687,102,309 | ) | | | 1,599,729 | |
| Net unrealized appreciation on: | | | | | | | | |
| Investments and foreign currency | | | 379,972,183 | | | | 12,258,109 | |
| Net Assets | | $ | 1,075,094,003 | | | $ | 29,877,494 | |
| CALCULATION OF NET ASSET VALUE PER SHARE — NO LOAD CLASS: | | | | | | | | |
| Net Assets | | $ | 425,265,297 | | | $ | 24,168,110 | |
| Shares outstanding | | | 12,087,155 | | | | 706,396 | |
| Net asset value per share (offering price and redemption price) | | $ | 35.18 | | | $ | 34.21 | |
| CALCULATION OF NET ASSET VALUE PER SHARE — ADVISOR CLASS A: | | | | | | | | |
| Net Assets | | $ | 165,327,841 | | | $ | 5,034,015 | |
| Shares outstanding | | | 4,801,781 | | | | 152,081 | |
| Net asset value per share (redemption price) | | $ | 34.43 | | | $ | 33.10 | |
Offering price per share ($34.43 divided by .9425 and $33.10 divided by .9425) | | $ | 36.53 | | | $ | 35.12 | |
| CALCULATION OF NET ASSET VALUE PER SHARE — ADVISOR CLASS C: | | | | | | | | |
| Net Assets | | $ | 136,877,059 | | | $ | 675,369 | |
| Shares outstanding | | | 4,173,484 | | | | 20,846 | |
| Net asset value per share (offering price and redemption price) | | $ | 32.80 | | | $ | 32.40 | |
| CALCULATION OF NET ASSET VALUE PER SHARE — INSTITUTIONAL CLASS: | | | | | | | | |
| Net Assets | | $ | 347,623,806 | | | | N/A | |
| Shares outstanding | | | 9,868,717 | | | | N/A | |
| Net asset value per share (offering price and redemption price) | | $ | 35.22 | | | | N/A | |
| * | Each Feeder Fund invests all or generally all its assets directly in the corresponding Master Portfolio. The financial statements for the Master Portfolios, along with the portfolio of investments in securities, are contained elsewhere in this report and should be read in conjunction with the Feeder Funds’ financial statements. |
The accompanying notes are an integral part of these financial statements.
| KINETICS MUTUAL FUNDS, INC. — THE FEEDER FUNDS |
Statements of Assets & Liabilities — (Continued) |
| June 30, 2015 (Unaudited) |
| |
| | | The Small Cap | | | The Market | |
| | | Opportunities | | | Opportunities | |
| | | Fund | | | Fund | |
| ASSETS: | | | | | | |
| Investments in the Master Portfolio, at value* | | $ | 326,109,866 | | | $ | 51,230,166 | |
| Receivable from Adviser | | | 25,577 | | | | 8,624 | |
| Receivable for Master Portfolio interest sold | | | 30,484 | | | | — | |
| Receivable for Fund shares sold | | | 411,045 | | | | 50,556 | |
| Prepaid expenses and other assets | | | 48,177 | | | | 29,537 | |
| Total Assets | | | 326,625,149 | | | | 51,318,883 | |
| LIABILITIES: | | | | | | | | |
| Payable for Master Portfolio interest purchased | | | — | | | | 46,887 | |
| Payable to Directors | | | 5,246 | | | | 822 | |
| Payable to Chief Compliance Officer | | | 379 | | | | 64 | |
| Payable for Fund shares repurchased | | | 441,528 | | | | 3,669 | |
| Payable for shareholder servicing fees | | | 55,815 | | | | 10,233 | |
| Payable for distribution fees | | | 22,836 | | | | 17,114 | |
| Accrued expenses and other liabilities | | | 77,828 | | | | 19,330 | |
| Total Liabilities | | | 603,632 | | | | 98,119 | |
| Net Assets | | $ | 326,021,517 | | | $ | 51,220,764 | |
| NET ASSETS CONSIST OF: | | | | | | | | |
| Paid in capital | | $ | 412,699,107 | | | $ | 59,447,005 | |
| Accumulated net investment loss | | | (3,112,169 | ) | | | (877,038 | ) |
| Accumulated net realized loss on investments and foreign currency | | | (121,208,256 | ) | | | (19,012,861 | ) |
| Net unrealized appreciation on: | | | | | | | | |
| Investments and foreign currency | | | 37,642,835 | | | | 11,663,658 | |
| Net Assets | | $ | 326,021,517 | | | $ | 51,220,764 | |
| CALCULATION OF NET ASSET VALUE PER SHARE — NO LOAD CLASS: | | | | | | | | |
| Net Assets | | $ | 213,261,546 | | | $ | 36,507,725 | |
| Shares outstanding | | | 5,465,206 | | | | 2,138,330 | |
| Net asset value per share (offering price and redemption price) | | $ | 39.02 | | | $ | 17.07 | |
| CALCULATION OF NET ASSET VALUE PER SHARE — ADVISOR CLASS A: | | | | | | | | |
| Net Assets | | $ | 21,349,011 | | | $ | 6,878,941 | |
| Shares outstanding | | | 559,415 | | | | 405,580 | |
| Net asset value per share (redemption price) | | $ | 38.16 | | | $ | 16.96 | |
Offering price per share ($38.16 divided by .9425 and $16.96 divided by .9425) | | $ | 40.49 | | | $ | 17.99 | |
| CALCULATION OF NET ASSET VALUE PER SHARE — ADVISOR CLASS C: | | | | | | | | |
| Net Assets | | $ | 12,872,052 | | | $ | 4,980,886 | |
| Shares outstanding | | | 347,313 | | | | 300,857 | |
| Net asset value per share (offering price and redemption price) | | $ | 37.06 | | | $ | 16.56 | |
| CALCULATION OF NET ASSET VALUE PER SHARE — INSTITUTIONAL CLASS: | | | | | | | | |
| Net Assets | | $ | 78,538,908 | | | $ | 2,853,212 | |
| Shares outstanding | | | 1,991,186 | | | | 165,819 | |
| Net asset value per share (offering price and redemption price) | | $ | 39.44 | | | $ | 17.21 | |
| * | Each Feeder Fund invests all or generally all its assets directly in the corresponding Master Portfolio. The financial statements for the Master Portfolios, along with the portfolio of investments in securities, are contained elsewhere in this report and should be read in conjunction with the Feeder Funds’ financial statements. |
The accompanying notes are an integral part of these financial statements.
| KINETICS MUTUAL FUNDS, INC. — THE FEEDER FUNDS |
Statements of Assets & Liabilities — (Continued) |
| June 30, 2015 (Unaudited) |
| | | The | | | The Multi- | |
| | | Alternative | | | Disciplinary | |
| | | Income | | | Income | |
| | | Fund | | | Fund | |
| ASSETS: | | | | | | |
| Investments in the Master Portfolio, at value* | | $ | 34,847,356 | | | $ | 142,414,200 | |
| Receivable from Adviser | | | 21,849 | | | | 39,613 | |
| Receivable for Fund shares sold | | | 85,385 | | | | 280,940 | |
| Prepaid expenses and other assets | | | 39,509 | | | | 36,983 | |
| Total Assets | | | 34,994,099 | | | | 142,771,736 | |
| LIABILITIES: | | | | | | | | |
| Payable for Master Portfolio interest purchased | | | 84,348 | | | | 764,543 | |
| Payable to Directors | | | 567 | | | | 2,168 | |
| Payable to Chief Compliance Officer | | | 38 | | | | 148 | |
| Payable for Fund shares repurchased | | | 1,037 | | | | 396,262 | |
| Payable for shareholder servicing fees | | | 2,852 | | | | 11,138 | |
| Payable for distribution fees | | | 4,502 | | | | 24,309 | |
| Fund Distribution Payable | | | — | | | | 11,764 | |
| Accrued expenses and other liabilities | | | 15,564 | | | | 34,308 | |
| Total Liabilities | | | 108,908 | | | | 1,244,640 | |
| Net Assets | | $ | 34,885,191 | | | $ | 141,527,096 | |
| NET ASSETS CONSIST OF: | | | | | | | | |
| Paid in capital | | $ | 41,090,732 | | | $ | 144,240,113 | |
| Accumulated net investment income (loss) | | | 10,806 | | | | (760,571 | ) |
Accumulated net realized gain (loss) on investments and foreign currency | | | (6,670,155 | ) | | | 332,217 | |
| Net unrealized appreciation (depreciation) on: | | | | | | | | |
| Investments and foreign currency | | | (15,899 | ) | | | (3,159,320 | ) |
| Written option contracts | | | 469,707 | | | | 874,657 | |
| Net Assets | | $ | 34,885,191 | | | $ | 141,527,096 | |
| CALCULATION OF NET ASSET VALUE PER SHARE — NO LOAD CLASS: | | | | | | | | |
| Net Assets | | $ | 5,554,231 | | | $ | 9,594,224 | |
| Shares outstanding | | | 60,788 | | | | 887,950 | |
| Net asset value per share (offering price and redemption price) | | $ | 91.37 | | | $ | 10.80 | |
| CALCULATION OF NET ASSET VALUE PER SHARE — ADVISOR CLASS A: | | | | | | | | |
| Net Assets | | $ | 1,882,170 | | | $ | 11,595,228 | |
| Shares outstanding | | | 20,718 | | | | 1,077,701 | |
| Net asset value per share (redemption price) | | $ | 90.85 | | | $ | 10.76 | |
Offering price per share ($90.85 divided by .9425 and $10.76 divided by .9425) | | $ | 96.39 | | | $ | 11.42 | |
| CALCULATION OF NET ASSET VALUE PER SHARE — ADVISOR CLASS C: | | | | | | | | |
| Net Assets | | $ | 1,432,814 | | | $ | 10,307,421 | |
| Shares outstanding | | | 16,187 | | | | 966,709 | |
| Net asset value per share (offering price and redemption price) | | $ | 88.52 | | | $ | 10.66 | |
| CALCULATION OF NET ASSET VALUE PER SHARE — INSTITUTIONAL CLASS: | | | | | | | | |
| Net Assets | | $ | 26,015,976 | | | $ | 110,030,223 | |
| Shares outstanding | | | 281,117 | | | | 10,157,617 | |
| Net asset value per share (offering price and redemption price) | | $ | 92.55 | | | $ | 10.83 | |
| * | Each Feeder Fund invests all or generally all its assets directly in the corresponding Master Portfolio. The financial statements for the Master Portfolios, along with the portfolio of investments in securities, are contained elsewhere in this report and should be read in conjunction with the Feeder Funds’ financial statements. |
The accompanying notes are an integral part of these financial statements.
| KINETICS MUTUAL FUNDS, INC. — THE FEEDER FUNDS |
| Statements of Operations |
| For the Six Months Ended June 30, 2015 (Unaudited) |
| | | The Internet | | | The Global | |
| | | Fund | | | Fund | |
| INVESTMENT INCOME (LOSS) ALLOCATED FROM MASTER PORTFOLIOS: | | | | | | |
| Dividends† | | $ | 283,672 | | | $ | 27,074 | |
| Interest | | | 196 | | | | 1,596 | |
| Income from securities lending | | | 26,819 | | | | 12,186 | |
| Expenses allocated from Master Portfolio | | | (1,016,612 | ) | | | (72,827 | ) |
| Net investment loss from Master Portfolio | | | (705,925 | ) | | | (31,971 | ) |
| EXPENSES: | | | | | | | | |
| Distribution fees — Advisor Class A | | | 5,851 | | | | 619 | |
| Distribution fees — Advisor Class C | | | 4,031 | | | | 6,613 | |
| Shareholder servicing fees — Advisor Class A | | | 5,851 | | | | 619 | |
| Shareholder servicing fees — Advisor Class C | | | 1,344 | | | | 2,204 | |
| Shareholder servicing fees — No Load Class | | | 181,305 | | | | 8,296 | |
| Transfer agent fees and expenses | | | 69,360 | | | | 9,989 | |
| Reports to shareholders | | | 16,813 | | | | 1,250 | |
| Administration fees | | | 26,180 | | | | 2,426 | |
| Professional fees | | | 8,451 | | | | 4,204 | |
| Directors’ fees | | | 5,111 | | | | 288 | |
| Chief Compliance Officer fees | | | 1,019 | | | | 54 | |
| Registration fees | | | 22,642 | | | | 20,633 | |
| Fund accounting fees | | | 3,774 | | | | 206 | |
| Other expenses | | | 3,245 | | | | 208 | |
| Total expenses | | | 354,977 | | | | 57,609 | |
| Less, expense reimbursement | | | — | | | | (61,380 | ) |
| Net expenses | | | 354,977 | | | | (3,771 | ) |
| Net investment loss | | | (1,060,902 | ) | | | (28,200 | ) |
REALIZED AND UNREALIZED GAIN (LOSS) ON INVESTMENTS ALLOCATED FROM MASTER PORTFOLIOS: | | | | | | | | |
| Net realized gain on: | | | | | | | | |
| Investments and foreign currency | | | 8,568,342 | | | | 247,639 | |
| Net change in unrealized appreciation (depreciation) of: | | | | | | | | |
| Investments and foreign currency | | | (6,493,865 | ) | | | 17,877 | |
| Net gain on investments | | | 2,074,477 | | | | 265,516 | |
| Net increase in net assets resulting from operations | | $ | 1,013,575 | | | $ | 237,316 | |
| † Net of foreign taxes withheld of: | | $ | 979 | | | $ | 2,867 | |
The accompanying notes are an integral part of these financial statements.
| KINETICS MUTUAL FUNDS, INC. — THE FEEDER FUNDS |
Statements of Operations — (Continued) |
| For the Six Months Ended June 30, 2015 (Unaudited) |
| | | The Paradigm | | | The Medical | |
| | | Fund | | | Fund | |
| INVESTMENT INCOME (LOSS) ALLOCATED FROM MASTER PORTFOLIOS: | | | | | | |
| Dividends† | | $ | 2,349,706 | | | $ | 277,796 | |
| Interest | | | 50,599 | | | | 40 | |
| Income from securities lending | | | 990,314 | | | | 8,261 | |
| Expenses allocated from Master Portfolio | | | (7,589,547 | ) | | | (203,575 | ) |
| Net investment income (loss) from Master Portfolio | | | (4,198,928 | ) | | | 82,522 | |
| EXPENSES: | | | | | | | | |
| Distribution fees — Advisor Class A | | | 213,917 | | | | 6,068 | |
| Distribution fees — Advisor Class C | | | 515,287 | | | | 2,509 | |
| Shareholder servicing fees — Advisor Class A | | | 213,917 | | | | 6,068 | |
| Shareholder servicing fees — Advisor Class C | | | 171,762 | | | | 836 | |
| Shareholder servicing fees — No Load Class | | | 584,209 | | | | 29,497 | |
| Shareholder servicing fees — Institutional Class | | | 349,908 | | | | — | |
| Transfer agent fees and expenses | | | 153,007 | | | | 13,451 | |
| Reports to shareholders | | | 93,113 | | | | 2,459 | |
| Administration fees | | | 197,386 | | | | 4,989 | |
| Professional fees | | | 37,737 | | | | 4,803 | |
| Directors’ fees | | | 38,449 | | | | 996 | |
| Chief Compliance Officer fees | | | 7,757 | | | | 196 | |
| Registration fees | | | 36,962 | | | | 20,566 | |
| Fund accounting fees | | | 28,300 | | | | 716 | |
| Other expenses | | | 23,867 | | | | 536 | |
| Total expenses | | | 2,665,578 | | | | 93,690 | |
Less, expense waiver for Institutional Class shareholder servicing fees | | | (262,431 | ) | | | — | |
| Less, expense reimbursement | | | (381,683 | ) | | | (86,294 | ) |
| Net expenses | | | 2,021,464 | | | | 7,396 | |
| Net investment income (loss) | | | (6,220,392 | ) | | | 75,126 | |
REALIZED AND UNREALIZED GAIN (LOSS) ON INVESTMENTS ALLOCATED FROM MASTER PORTFOLIOS: | | | | | | | | |
| Net realized gain on: | | | | | | | | |
| Investments and foreign currency | | | 60,679,419 | | | | 1,327,539 | |
| Net change in unrealized appreciation (depreciation) of: | | | | | | | | |
| Investments and foreign currency | | | (17,021,096 | ) | | | 1,702,446 | |
| Net gain on investments | | | 43,658,323 | | | | 3,029,985 | |
| Net increase in net assets resulting from operations | | $ | 37,437,931 | | | $ | 3,105,111 | |
| † Net of foreign taxes withheld of: | | $ | 97,451 | | | $ | 15,355 | |
The accompanying notes are an integral part of these financial statements.
| KINETICS MUTUAL FUNDS, INC. — THE FEEDER FUNDS |
Statements of Operations — (Continued) |
| For the Six Months Ended June 30, 2015 (Unaudited) |
| | | The Small Cap | | | The Market | |
| | | Opportunities | | | Opportunities | |
| | | Fund | | | Fund | |
| INVESTMENT INCOME (LOSS) ALLOCATED FROM MASTER PORTFOLIOS: | | | | | | |
| Dividends† | | $ | 794,500 | | | $ | 178,917 | |
| Interest | | | 6,061 | | | | 610 | |
| Income from securities lending | | | 413,241 | | | | 14,169 | |
| Expenses allocated from Master Portfolio | | | (2,256,482 | ) | | | (363,518 | ) |
| Net investment loss from Master Portfolio | | | (1,042,680 | ) | | | (169,822 | ) |
| EXPENSES: | | | | | | | | |
| Distribution fees — Advisor Class A | | | 28,894 | | | | 9,204 | |
| Distribution fees — Advisor Class C | | | 48,613 | | | | 19,230 | |
| Shareholder servicing fees — Advisor Class A | | | 28,894 | | | | 9,204 | |
| Shareholder servicing fees — Advisor Class C | | | 16,204 | | | | 6,410 | |
| Shareholder servicing fees — No Load Class | | | 286,254 | | | | 46,157 | |
| Shareholder servicing fees — Institutional Class | | | 70,900 | | | | 2,896 | |
| Transfer agent fees and expenses | | | 42,205 | | | | 13,641 | |
| Reports to shareholders | | | 31,878 | | | | 3,749 | |
| Administration fees | | | 58,921 | | | | 9,988 | |
| Professional fees | | | 13,809 | | | | 5,439 | |
| Directors’ fees | | | 11,334 | | | | 1,742 | |
| Chief Compliance Officer fees | | | 2,263 | | | | 364 | |
| Registration fees | | | 50,675 | | | | 26,576 | |
| Fund accounting fees | | | 8,194 | | | | 1,265 | |
| Other expenses | | | 7,086 | | | | 1,215 | |
| Total expenses | | | 706,124 | | | | 157,080 | |
Less, expense waiver for Institutional Class shareholder servicing fees | | | (53,175 | ) | | | (2,172 | ) |
| Less, expense reimbursement | | | (147,770 | ) | | | (63,925 | ) |
| Net expenses | | | 505,179 | | | | 90,983 | |
| Net investment loss | | | (1,547,859 | ) | | | (260,805 | ) |
REALIZED AND UNREALIZED GAIN (LOSS) ON INVESTMENTS ALLOCATED FROM MASTER PORTFOLIOS: | | | | | | | | |
| Net realized gain on: | | | | | | | | |
| Investments and foreign currency | | | 16,643,551 | | | | 2,539,801 | |
| Net change in unrealized appreciation (depreciation) of: | | | | | | | | |
| Investments and foreign currency | | | 993,234 | | | | (1,105,977 | ) |
| Net gain on investments | | | 17,636,785 | | | | 1,433,824 | |
| Net increase in net assets resulting from operations | | $ | 16,088,926 | | | $ | 1,173,019 | |
| † Net of foreign taxes withheld of: | | $ | 18,725 | | | $ | 11,655 | |
The accompanying notes are an integral part of these financial statements.
| KINETICS MUTUAL FUNDS, INC. — THE FEEDER FUNDS |
Statements of Operations — (Continued) |
| For the Six Months Ended June 30, 2015 (Unaudited) |
| | | The | | | The Multi- | |
| | | Alternative | | | Disciplinary | |
| | | Income | | | Income | |
| | | Fund | | | Fund | |
| INVESTMENT INCOME (LOSS) ALLOCATED FROM MASTER PORTFOLIOS: | | | | | | |
| Dividends | | $ | 41,705 | | | $ | 410,245 | |
| Interest | | | 122,063 | | | | 2,770,055 | |
| Income from securities lending | | | — | | | | 12,029 | |
| Expenses allocated from Master Portfolio | | | (215,121 | ) | | | (948,206 | ) |
| Net investment income (loss) from Master Portfolio | | | (51,353 | ) | | | 2,244,123 | |
| EXPENSES: | | | | | | | | |
| Distribution fees — Advisor Class A | | | 1,877 | | | | 15,085 | |
| Distribution fees — Advisor Class C | | | 5,362 | | | | 39,006 | |
| Shareholder servicing fees — Advisor Class A | | | 1,877 | | | | 15,085 | |
| Shareholder servicing fees — Advisor Class C | | | 1,787 | | | | 13,002 | |
| Shareholder servicing fees — No Load Class | | | 8,833 | | | | 12,197 | |
| Shareholder servicing fees — Institutional Class | | | 26,196 | | | | 107,591 | |
| Transfer agent fees and expenses | | | 12,706 | | | | 19,922 | |
| Reports to shareholders | | | 2,166 | | | | 12,022 | |
| Administration fees | | | 6,853 | | | | 25,832 | |
| Professional fees | | | 5,118 | | | | 8,386 | |
| Directors’ fees | | | 1,324 | | | | 4,940 | |
| Chief Compliance Officer fees | | | 269 | | | | 997 | |
| Registration fees | | | 27,425 | | | | 32,864 | |
| Fund accounting fees | | | 1,000 | | | | 3,627 | |
| Other expenses | | | 791 | | | | 7,441 | |
| Total expenses | | | 103,584 | | | | 317,997 | |
Less, expense waiver for Institutional Class shareholder servicing fees | | | (19,647 | ) | | | (80,693 | ) |
| Less, expense reimbursement | | | (146,096 | ) | | | (197,371 | ) |
| Net expenses | | | (62,159 | ) | | | 39,933 | |
| Net investment income | | | 10,806 | | | | 2,204,190 | |
REALIZED AND UNREALIZED GAIN (LOSS) ON INVESTMENTS ALLOCATED FROM MASTER PORTFOLIOS: | | | | | | | | |
| Net realized gain (loss) on: | | | | | | | | |
| Investments and foreign currency | | | (3,899 | ) | | | (671,502 | ) |
| Written option contracts expired or closed | | | 922,273 | | | | 491,575 | |
| Net change in unrealized appreciation (depreciation) of: | | | | | | | | |
| Investments and foreign currency | | | 79,543 | | | | 466,326 | |
| Written option contracts | | | (62,175 | ) | | | (128,869 | ) |
| Net gain on investments | | | 935,742 | | | | 157,530 | |
| Net increase in net assets resulting from operations | | $ | 946,548 | | | $ | 2,361,720 | |
The accompanying notes are an integral part of these financial statements.
| KINETICS MUTUAL FUNDS, INC. — THE FEEDER FUNDS |
| Statements of Changes in Net Assets |
| | | The Internet Fund | | | The Global Fund | |
| | | For the | | | | | | For the | | | | |
| | | Six Months | | | For the | | | Six Months | | | For the | |
| | | Ended | | | Year Ended | | | Ended | | | Year Ended | |
| | | June 30, 2015 | | | December 31, | | | June 30, 2015 | | | December 31, | |
| | | (Unaudited) | | | 2014 | | | (Unaudited) | | | 2014 | |
| OPERATIONS: | | | | | | | | | | | | |
| Net investment loss | | $ | (1,060,902 | ) | | $ | (2,237,746 | ) | | $ | (28,200 | ) | | $ | (48,980 | ) |
Net realized gain on sale of investments and foreign currency | | | 8,568,342 | | | | 10,595,537 | | | | 247,639 | | | | 318,071 | |
Net change in unrealized appreciation (depreciation) of investments and foreign currency | | | (6,493,865 | ) | | | (9,484,952 | ) | | | 17,877 | | | | (1,488,285 | ) |
Net increase (decrease) in net assets resulting from operations | | | 1,013,575 | | | | (1,127,161 | ) | | | 237,316 | | | | (1,219,194 | ) |
| DISTRIBUTIONS TO SHAREHOLDERS — | | | | | | | | | | | | | | | | |
| NO LOAD CLASS: | | | | | | | | | | | | | | | | |
| Net realized gains | | | — | | | | (8,004,471 | ) | | | — | | | | (712 | ) |
| Total distributions | | | — | | | | (8,004,471 | ) | | | — | | | | (712 | ) |
| DISTRIBUTIONS TO SHAREHOLDERS — | | | | | | | | | | | | | | | | |
| ADVISOR CLASS A: | | | | | | | | | | | | | | | | |
| Net realized gains | | | — | | | | (281,407 | ) | | | — | | | | (52 | ) |
| Total distributions | | | — | | | | (281,407 | ) | | | — | | | | (52 | ) |
| DISTRIBUTIONS TO SHAREHOLDERS — | | | | | | | | | | | | | | | | |
| ADVISOR CLASS C: | | | | | | | | | | | | | | | | |
| Net realized gains | | | — | | | | (63,160 | ) | | | — | | | | (175 | ) |
| Total distributions | | | — | | | | (63,160 | ) | | | — | | | | (175 | ) |
| CAPITAL SHARE TRANSACTIONS — | | | | | | | | | | | | | | | | |
| NO LOAD CLASS: | | | | | | | | | | | | | | | | |
| Proceeds from shares sold | | | 1,073,749 | | | | 13,300,316 | | | | 339,275 | | | | 1,083,377 | |
| Redemption fees | | | 158 | | | | 14,113 | | | | 15 | | | | 77 | |
Proceeds from shares issued to holders in reinvestment of dividends | | | — | | | | 7,733,943 | | | | — | | | | 679 | |
| Cost of shares redeemed | | | (13,020,967 | ) | | | (33,117,579 | ) | | | (902,029 | ) | | | (2,073,922 | ) |
Net decrease in net assets resulting from capital share transactions | | | (11,947,060 | ) | | | (12,069,207 | ) | | | (562,739 | ) | | | (989,789 | ) |
| CAPITAL SHARE TRANSACTIONS — | | | | | | | | | | | | | | | | |
| ADVISOR CLASS A: | | | | | | | | | | | | | | | | |
| Proceeds from shares sold | | | 216,486 | | | | 2,906,101 | | | | 27,700 | | | | 726,190 | |
| Redemption fees | | | — | | | | 277 | | | | — | | | | 1,415 | |
Proceeds from shares issued to holders in reinvestment of dividends | | | — | | | | 149,179 | | | | — | | | | 30 | |
| Cost of shares redeemed | | | (1,409,775 | ) | | | (3,086,613 | ) | | | (35,781 | ) | | | (2,164,173 | ) |
Net decrease in net assets resulting from capital share transactions | | | (1,193,289 | ) | | | (31,056 | ) | | | (8,081 | ) | | | (1,436,538 | ) |
The accompanying notes are an integral part of these financial statements.
| KINETICS MUTUAL FUNDS, INC. — THE FEEDER FUNDS |
Statements of Changes in Net Assets — (Continued) |
| | | The Internet Fund | | | The Global Fund | |
| | | For the | | | | | | For the | | | | |
| | | Six Months | | | For the | | | Six Months | | | For the | |
| | | Ended | | | Year Ended | | | Ended | | | Year Ended | |
| | | June 30, 2015 | | | December 31, | | | June 30, 2015 | | | December 31, | |
| | | (Unaudited) | | | 2014 | | | (Unaudited) | | | 2014 | |
| CAPITAL SHARE TRANSACTIONS — | | | | | | | | | | | | |
| ADVISOR CLASS C: | | | | | | | | | | | | |
| Proceeds from shares sold | | $ | 42,840 | | | $ | 588,707 | | | $ | 275,656 | | | $ | 384,348 | |
| Redemption fees | | | — | | | | 487 | | | | — | | | | 40 | |
Proceeds from shares issued to holders in reinvestment of dividends | | | — | | | | 54,872 | | | | — | | | | 168 | |
| Cost of shares redeemed | | | (145,419 | ) | | | (369,965 | ) | | | (62,196 | ) | | | (81,376 | ) |
Net increase (decrease) in net assets resulting from capital share transactions | | | (102,579 | ) | | | 274,101 | | | | 213,460 | | | | 303,180 | |
| TOTAL DECREASE IN NET ASSETS: | | | (12,229,353 | ) | | | (21,302,361 | ) | | | (120,044 | ) | | | (3,343,280 | ) |
| NET ASSETS: | | | | | | | | | | | | | | | | |
| Beginning of period | | | 157,448,109 | | | | 178,750,470 | | | | 8,876,664 | | | | 12,219,944 | |
| End of period* | | $ | 145,218,756 | | | $ | 157,448,109 | | | $ | 8,756,620 | | | $ | 8,876,664 | |
* Including undistributed net investment income (loss) of: | | $ | (907,076 | ) | | $ | 153,826 | | | $ | (12,797 | ) | | $ | 15,403 | |
| CHANGES IN SHARES OUTSTANDING — | | | | | | | | | | | | | | | | |
| NO LOAD CLASS: | | | | | | | | | | | | | | | | |
| Shares sold | | | 19,007 | | | | 231,907 | | | | 61,595 | | | | 185,397 | |
Shares issued in reinvestments of dividends and distributions | | | — | | | | 136,932 | | | | — | | | | 128 | |
| Shares redeemed | | | (230,302 | ) | | | (580,533 | ) | | | (165,181 | ) | | | (352,745 | ) |
| Net decrease in shares outstanding | | | (211,295 | ) | | | (211,694 | ) | | | (103,586 | ) | | | (167,220 | ) |
| CHANGES IN SHARES OUTSTANDING — | | | | | | | | | | | | | | | | |
| ADVISOR CLASS A: | | | | | | | | | | | | | | | | |
| Shares sold | | | 3,983 | | | | 51,935 | | | | 4,947 | | | | 123,524 | |
Shares issued in reinvestments of dividends and distributions | | | — | | | | 2,719 | | | | — | | | | 5 | |
| Shares redeemed | | | (25,475 | ) | | | (55,495 | ) | | | (6,655 | ) | | | (359,935 | ) |
| Net decrease in shares outstanding | | | (21,492 | ) | | | (841 | ) | | | (1,708 | ) | | | (236,406 | ) |
| CHANGES IN SHARES OUTSTANDING — | | | | | | | | | | | | | | | | |
| ADVISOR CLASS C: | | | | | | | | | | | | | | | | |
| Shares sold | | | 849 | | | | 10,790 | | | | 51,398 | | | | 67,992 | |
Shares issued in reinvestments of dividends and distributions | | | — | | | | 1,052 | | | | — | | | | 32 | |
| Shares redeemed | | | (2,751 | ) | | | (6,992 | ) | | | (11,580 | ) | | | (14,611 | ) |
Net increase (decrease) in shares outstanding | | | (1,902 | ) | | | 4,850 | | | | 39,818 | | | | 53,413 | |
The accompanying notes are an integral part of these financial statements.
| KINETICS MUTUAL FUNDS, INC. — THE FEEDER FUNDS |
Statements of Changes in Net Assets — (Continued) |
| | | The Paradigm Fund | | | The Medical Fund | |
| | | For the | | | | | | For the | | | | |
| | | Six Months | | | For the | | | Six Months | | | For the | |
| | | Ended | | | Year Ended | | | Ended | | | Year Ended | |
| | | June 30, 2015 | | | December 31, | | | June 30, 2015 | | | December 31, | |
| | | (Unaudited) | | | 2014 | | | (Unaudited) | | | 2014 | |
| OPERATIONS: | | | | | | | | | | | | |
| Net investment income (loss) | | $ | (6,220,392 | ) | | $ | (13,751,919 | ) | | $ | 75,126 | | | $ | 106,318 | |
Net realized gain on sale of investments and foreign currency | | | 60,679,419 | | | | 36,331,414 | | | | 1,327,539 | | | | 723,512 | |
Net change in unrealized appreciation (depreciation) of investments and foreign currency | | | (17,021,096 | ) | | | (31,558,560 | ) | | | 1,702,446 | | | | 3,048,505 | |
Net increase (decrease) in net assets resulting from operations | | | 37,437,931 | | | | (8,979,065 | ) | | | 3,105,111 | | | | 3,878,335 | |
| DISTRIBUTIONS TO SHAREHOLDERS — | | | | | | | | | | | | | | | | |
| NO LOAD CLASS: | | | | | | | | | | | | | | | | |
| Net realized gains | | | — | | | | — | | | | — | | | | (33,693 | ) |
| Total distributions | | | — | | | | — | | | | — | | | | (33,693 | ) |
| DISTRIBUTIONS TO SHAREHOLDERS — | | | | | | | | | | | | | | | | |
| ADVISOR CLASS A: | | | | | | | | | | | | | | | | |
| Net realized gains | | | — | | | | — | | | | — | | | | (7,270 | ) |
| Total distributions | | | — | | | | — | | | | — | | | | (7,270 | ) |
| DISTRIBUTIONS TO SHAREHOLDERS — | | | | | | | | | | | | | | | | |
| ADVISOR CLASS C: | | | | | | | | | | | | | | | | |
| Net realized gains | | | — | | | | — | | | | — | | | | (1,021 | ) |
| Total distributions | | | — | | | | — | | | | — | | | | (1,021 | ) |
| DISTRIBUTIONS TO SHAREHOLDERS — | | | | | | | | | | | | | | | | |
| INSTITUTIONAL CLASS: | | | | | | | | | | | | | | | | |
| Net investment income | | | — | | | | — | | | | N/A | | | | N/A | |
| Total distributions | | | — | | | | — | | | | N/A | | | | N/A | |
| CAPITAL SHARE TRANSACTIONS — | | | | | | | | | | | | | | | | |
| NO LOAD CLASS: | | | | | | | | | | | | | | | | |
| Proceeds from shares sold | | | 12,670,136 | | | | 79,013,052 | | | | 1,020,981 | | | | 2,139,812 | |
| Redemption fees | | | 1,190 | | | | 10,973 | | | | 164 | | | | 1,600 | |
Proceeds from shares issued to holders in reinvestment of dividends | | | — | | | | — | | | | — | | | | 33,284 | |
| Cost of shares redeemed | | | (126,087,974 | ) | | | (151,816,953 | ) | | | (1,246,294 | ) | | | (3,940,694 | ) |
Net decrease in net assets resulting from capital share transactions | | | (113,416,648 | ) | | | (72,792,928 | ) | | | (225,149 | ) | | | (1,765,998 | ) |
The accompanying notes are an integral part of these financial statements.
| KINETICS MUTUAL FUNDS, INC. — THE FEEDER FUNDS |
Statements of Changes in Net Assets — (Continued) |
| | | The Paradigm Fund | | | The Medical Fund | |
| | | For the | | | | | | For the | | | | |
| | | Six Months | | | For the | | | Six Months | | | For the | |
| | | Ended | | | Year Ended | | | Ended | | | Year Ended | |
| | | June 30, 2015 | | | December 31, | | | June 30, 2015 | | | December 31, | |
| | | (Unaudited) | | | 2014 | | | (Unaudited) | | | 2014 | |
| CAPITAL SHARE TRANSACTIONS — | | | | | | | | | | | | |
| ADVISOR CLASS A: | | | | | | | | | | | | |
| Proceeds from shares sold | | $ | 7,338,782 | | | $ | 42,819,434 | | | $ | 393,966 | | | $ | 2,048,708 | |
| Redemption fees | | | 279 | | | | 2,758 | | | | 36 | | | | 374 | |
Proceeds from shares issued to holders in reinvestment of dividends | | | — | | | | — | | | | — | | | | 5,220 | |
| Cost of shares redeemed | | | (19,288,635 | ) | | | (75,223,571 | ) | | | (453,925 | ) | | | (1,826,869 | ) |
Net increase (decrease) in net assets resulting from capital share transactions | | | (11,949,574 | ) | | | (32,401,379 | ) | | | (59,923 | ) | | | 227,433 | |
| CAPITAL SHARE TRANSACTIONS — | | | | | | | | | | | | | | | | |
| ADVISOR CLASS C: | | | | | | | | | | | | | | | | |
| Proceeds from shares sold | | | 6,975,317 | | | | 13,393,108 | | | | 79,240 | | | | 141,764 | |
| Redemption fees | | | — | | | | 603 | | | | — | | | | — | |
Proceeds from shares issued to holders in reinvestment of dividends | | | — | | | | — | | | | — | | | | 647 | |
| Cost of shares redeemed | | | (9,205,051 | ) | | | (14,361,754 | ) | | | (106,902 | ) | | | (120,479 | ) |
Net increase (decrease) in net assets resulting from capital share transactions | | | (2,229,734 | ) | | | (968,043 | ) | | | (27,662 | ) | | | 21,932 | |
| CAPITAL SHARE TRANSACTIONS — | | | | | | | | | | | | | | | | |
| INSTITUTIONAL CLASS: | | | | | | | | | | | | | | | | |
| Proceeds from shares sold | | | 35,491,119 | | | | 106,804,359 | | | | N/A | | | | N/A | |
| Redemption fees | | | 2,168 | | | | 4,182 | | | | N/A | | | | N/A | |
Proceeds from shares issued to holders in reinvestment of dividends | | | — | | | | — | | | | N/A | | | | N/A | |
| Cost of shares redeemed | | | (45,543,729 | ) | | | (90,695,882 | ) | | | N/A | | | | N/A | |
Net increase (decrease) in net assets resulting from capital share transactions | | | (10,050,442 | ) | | | 16,112,659 | | | | N/A | | | | N/A | |
| TOTAL INCREASE (DECREASE) IN | | | | | | | | | | | | | | | | |
| NET ASSETS: | | | (100,208,467 | ) | | | (99,028,756 | ) | | | 2,792,377 | | | | 2,319,718 | |
| NET ASSETS: | | | | | | | | | | | | | | | | |
| Beginning of period | | | 1,175,302,470 | | | | 1,274,331,226 | | | | 27,085,117 | | | | 24,765,399 | |
| End of period* | | $ | 1,075,094,003 | | | $ | 1,175,302,470 | | | $ | 29,877,494 | | | $ | 27,085,117 | |
* Including undistributed net investment income (loss) of: | | $ | (13,457,785 | ) | | $ | (7,237,393 | ) | | $ | 142,398 | | | $ | 67,272 | |
The accompanying notes are an integral part of these financial statements.
| KINETICS MUTUAL FUNDS, INC. — THE FEEDER FUNDS |
Statements of Changes in Net Assets — (Continued) |
| | | The Paradigm Fund | | | The Medical Fund | |
| | | For the | | | | | | For the | | | | |
| | | Six Months | | | For the | | | Six Months | | | For the | |
| | | Ended | | | Year Ended | | | Ended | | | Year Ended | |
| | | June 30, 2015 | | | December 31, | | | June 30, 2015 | | | December 31, | |
| | | (Unaudited) | | | 2014 | | | (Unaudited) | | | 2014 | |
| CHANGES IN SHARES OUTSTANDING — | | | | | | | | | | | | |
| NO LOAD CLASS: | | | | | | | | | | | | |
| Shares sold | | | 357,248 | | | | 2,290,400 | | | | 30,556 | | | | 74,948 | |
Shares issued in reinvestments of dividends and distributions | | | — | | | | — | | | | — | | | | 1,084 | |
| Shares redeemed | | | (3,580,905 | ) | | | (4,383,030 | ) | | | (37,425 | ) | | | (139,467 | ) |
Net decrease in shares outstanding | | | (3,223,657 | ) | | | (2,092,630 | ) | | | (6,869 | ) | | | (63,435 | ) |
| CHANGES IN SHARES OUTSTANDING — | | | | | | | | | | | | | | | | |
| ADVISOR CLASS A: | | | | | | | | | | | | | | | | |
| Shares sold | | | 210,839 | | | | 1,259,055 | | | | 12,177 | | | | 74,488 | |
Shares issued in reinvestments of dividends and distributions | | | — | | | | — | | | | — | | | | 176 | |
| Shares redeemed | | | (559,483 | ) | | | (2,171,775 | ) | | | (14,195 | ) | | | (66,773 | ) |
Net increase (decrease) in shares outstanding | | | (348,644 | ) | | | (912,720 | ) | | | (2,018 | ) | | | 7,891 | |
| CHANGES IN SHARES OUTSTANDING — | | | | | | | | | | | | | | | | |
| ADVISOR CLASS C: | | | | | | | | | | | | | | | | |
| Shares sold | | | 209,507 | | | | 412,314 | | | | 2,527 | | | | 5,106 | |
Shares issued in reinvestments of dividends and distributions | | | — | | | | — | | | | — | | | | 22 | |
| Shares redeemed | | | (280,645 | ) | | | (440,754 | ) | | | (3,318 | ) | | | (4,493 | ) |
Net increase (decrease) in shares outstanding | | | (71,138 | ) | | | (28,440 | ) | | | (791 | ) | | | 635 | |
| CHANGES IN SHARES OUTSTANDING — | | | | | | | | | | | | | | | | |
| INSTITUTIONAL CLASS: | | | | | | | | | | | | | | | | |
| Shares sold | | | 999,443 | | | | 3,053,557 | | | | N/A | | | | N/A | |
Shares issued in reinvestments of dividends and distributions | | | — | | | | — | | | | N/A | | | | N/A | |
| Shares redeemed | | | (1,290,389 | ) | | | (2,626,498 | ) | | | N/A | | | | N/A | |
Net increase (decrease) in shares outstanding | | | (290,946 | ) | | | 427,059 | | | | N/A | | | | N/A | |
The accompanying notes are an integral part of these financial statements.
| KINETICS MUTUAL FUNDS, INC. — THE FEEDER FUNDS |
Statements of Changes in Net Assets — (Continued) |
| | | The Small Cap Opportunities Fund | | | The Market Opportunities Fund | |
| | | For the | | | | | | For the | | | | |
| | | Six Months | | | For the | | | Six Months | | | For the | |
| | | Ended | | | Year Ended | | | Ended | | | Year Ended | |
| | | June 30, 2015 | | | December 31, | | | June 30, 2015 | | | December 31, | |
| | | (Unaudited) | | | 2014 | | | (Unaudited) | | | 2014 | |
| OPERATIONS: | | | | | | | | | | | | |
| Net investment loss | | $ | (1,547,859 | ) | | $ | (3,680,400 | ) | | $ | (260,805 | ) | | $ | (411,679 | ) |
Net realized gain on sale of investments and foreign currency | | | 16,643,551 | | | | 22,542,735 | | | | 2,539,801 | | | | 4,069,744 | |
Net change in unrealized appreciation (depreciation) of investments and foreign currency | | | 993,234 | | | | (47,300,796 | ) | | | (1,105,977 | ) | | | (7,185,651 | ) |
Net increase (decrease) in net assets resulting from operations | | | 16,088,926 | | | | (28,438,461 | ) | | | 1,173,019 | | | | (3,527,586 | ) |
| CAPITAL SHARE TRANSACTIONS — | | | | | | | | | | | | | | | | |
| NO LOAD CLASS: | | | | | | | | | | | | | | | | |
| Proceeds from shares sold | | | 3,768,921 | | | | 194,445,896 | | | | 367,193 | | | | 8,010,235 | |
| Redemption fees | | | 4,799 | | | | 41,304 | | | | — | | | | 2,251 | |
Proceeds from shares issued to holders in reinvestment of dividends | | | — | | | | — | | | | — | | | | — | |
| Cost of shares redeemed | | | (52,841,315 | ) | | | (200,815,126 | ) | | | (2,044,925 | ) | | | (15,752,146 | ) |
Net decrease in net assets resulting from capital share transactions | | | (49,067,595 | ) | | | (6,327,926 | ) | | | (1,677,732 | ) | | | (7,739,660 | ) |
| CAPITAL SHARE TRANSACTIONS — | | | | | | | | | | | | | | | | |
| ADVISOR CLASS A: | | | | | | | | | | | | | | | | |
| Proceeds from shares sold | | | 1,806,012 | | | | 23,756,168 | | | | 258,746 | | | | 2,637,530 | |
| Redemption fees | | | 138 | | | | 1,454 | | | | 4 | | | | — | |
Proceeds from shares issued to holders in reinvestment of dividends | | | — | | | | — | | | | — | | | | — | |
| Cost of shares redeemed | | | (7,196,499 | ) | | | (18,170,301 | ) | | | (2,335,595 | ) | | | (4,968,036 | ) |
Net increase (decrease) in net assets resulting from capital share transactions | | | (5,390,349 | ) | | | 5,587,321 | | | | (2,076,845 | ) | | | (2,330,506 | ) |
| CAPITAL SHARE TRANSACTIONS — | | | | | | | | | | | | | | | | |
| ADVISOR CLASS C: | | | | | | | | | | | | | | | | |
| Proceeds from shares sold | | | 917,192 | | | | 9,629,115 | | | | 74,265 | | | | 697,027 | |
| Redemption fees | | | — | | | | 2,106 | | | | — | | | | 61 | |
Proceeds from shares issued to holders in reinvestment of dividends | | | — | | | | — | | | | — | | | | — | |
| Cost of shares redeemed | | | (1,541,686 | ) | | | (2,801,727 | ) | | | (305,254 | ) | | | (774,680 | ) |
Net increase (decrease) in net assets resulting from capital share transactions | | | (624,494 | ) | | | 6,829,494 | | | | (230,989 | ) | | | (77,592 | ) |
The accompanying notes are an integral part of these financial statements.
| KINETICS MUTUAL FUNDS, INC. — THE FEEDER FUNDS |
Statements of Changes in Net Assets — (Continued) |
| | | The Small Cap Opportunities Fund | | | The Market Opportunities Fund | |
| | | For the | | | | | | For the | | | | |
| | | Six Months | | | For the | | | Six Months | | | For the | |
| | | Ended | | | Year Ended | | | Ended | | | Year Ended | |
| | | June 30, 2015 | | | December 31, | | | June 30, 2015 | | | December 31, | |
| | | (Unaudited) | | | 2014 | | | (Unaudited) | | | 2014 | |
| CAPITAL SHARE TRANSACTIONS — | | | | | | | | | | | | |
| INSTITUTIONAL CLASS: | | | | | | | | | | | | |
| Proceeds from shares sold | | $ | 24,219,446 | | | $ | 69,362,018 | | | $ | 78,431 | | | $ | 2,345,012 | |
| Redemption fees | | | 257 | | | | 1,007 | | | | — | | | | — | |
Proceeds from shares issued to holders in reinvestment of dividends | | | — | | | | — | | | | — | | | | — | |
| Cost of shares redeemed | | | (12,225,161 | ) | | | (41,890,144 | ) | | | (396,730 | ) | | | (859,118 | ) |
Net increase (decrease) in net assets resulting from capital share transactions | | | 11,994,542 | | | | 27,472,881 | | | | (318,299 | ) | | | 1,485,894 | |
TOTAL INCREASE (DECREASE) IN NET ASSETS: | | | (26,998,970 | ) | | | 5,123,309 | | | | (3,130,846 | ) | | | (12,189,450 | ) |
| NET ASSETS: | | | | | | | | | | | | | | | | |
| Beginning of period | | | 353,020,487 | | | | 347,897,178 | | | | 54,351,610 | | | | 66,541,060 | |
| End of period* | | $ | 326,021,517 | | | $ | 353,020,487 | | | $ | 51,220,764 | | | $ | 54,351,610 | |
* Including undistributed net investment loss of: | | $ | (3,112,169 | ) | | $ | (1,564,310 | ) | | $ | (877,038 | ) | | $ | (616,233 | ) |
The accompanying notes are an integral part of these financial statements.
| KINETICS MUTUAL FUNDS, INC. — THE FEEDER FUNDS |
Statements of Changes in Net Assets — (Continued) |
| | | The Small Cap Opportunities Fund | | | The Market Opportunities Fund | |
| | | For the | | | | | | For the | | | | |
| | | Six Months | | | For the | | | Six Months | | | For the | |
| | | Ended | | | Year Ended | | | Ended | | | Year Ended | |
| | | June 30, 2015 | | | December 31, | | | June 30, 2015 | | | December 31, | |
| | | (Unaudited) | | | 2014 | | | (Unaudited) | | | 2014 | |
| CHANGES IN SHARES OUTSTANDING — | | | | | | | | | | | | |
| NO LOAD CLASS: | | | | | | | | | | | | |
| Shares sold | | | 97,532 | | | | 4,843,634 | | | | 21,602 | | | | 459,541 | |
Shares issued in reinvestments of dividends and distributions | | | — | | | | — | | | | — | | | | — | |
| Shares redeemed | | | (1,381,631 | ) | | | (5,019,164 | ) | | | (120,387 | ) | | | (910,691 | ) |
| Net decrease in shares outstanding | | | (1,284,099 | ) | | | (175,530 | ) | | | (98,785 | ) | | | (451,150 | ) |
| CHANGES IN SHARES OUTSTANDING — | | | | | | | | | | | | | | | | |
| ADVISOR CLASS A: | | | | | | | | | | | | | | | | |
| Shares sold | | | 47,690 | | | | 605,187 | | | | 15,235 | | | | 151,222 | |
Shares issued in reinvestments of dividends and distributions | | | — | | | | — | | | | — | | | | — | |
| Shares redeemed | | | (190,706 | ) | | | (458,053 | ) | | | (141,041 | ) | | | (286,803 | ) |
Net increase (decrease) in shares outstanding | | | (143,016 | ) | | | 147,134 | | | | (125,806 | ) | | | (135,581 | ) |
| CHANGES IN SHARES OUTSTANDING — | | | | | | | | | | | | | | | | |
| ADVISOR CLASS C: | | | | | | | | | | | | | | | | |
| Shares sold | | | 25,052 | | | | 251,012 | | | | 4,471 | | | | 40,997 | |
Shares issued in reinvestments of dividends and distributions | | | — | | | | — | | | | — | | | | — | |
| Shares redeemed | | | (42,232 | ) | | | (72,816 | ) | | | (18,260 | ) | | | (45,433 | ) |
Net increase (decrease) in shares outstanding | | | (17,180 | ) | | | 178,196 | | | | (13,789 | ) | | | (4,436 | ) |
| CHANGES IN SHARES OUTSTANDING — | | | | | | | | | | | | | | | | |
| INSTITUTIONAL CLASS: | | | | | | | | | | | | | | | | |
| Shares sold | | | 618,723 | | | | 1,719,477 | | | | 4,675 | | | | 133,749 | |
Shares issued in reinvestments of dividends and distributions | | | — | | | | — | | | | — | | | | — | |
| Shares redeemed | | | (314,816 | ) | | | (1,046,919 | ) | | | (23,935 | ) | | | (50,621 | ) |
Net increase (decrease) in shares outstanding | | | 303,907 | | | | 672,558 | | | | (19,260 | ) | | | 83,128 | |
The accompanying notes are an integral part of these financial statements.
| KINETICS MUTUAL FUNDS, INC. — THE FEEDER FUNDS |
Statements of Changes in Net Assets — (Continued) |
| | | The Alternative Income Fund | | | The Multi- Disciplinary Income Fund | |
| | | For the | | | | | | For the | | | | |
| | | Six Months | | | For the | | | Six Months | | | For the | |
| | | Ended | | | Year Ended | | | Ended | | | Year Ended | |
| | | June 30, 2015 | | | December 31, | | | June 30, 2015 | | | December 31, | |
| | | (Unaudited) | | | 2014 | | | (Unaudited) | | | 2014 | |
| OPERATIONS: | | | | | | | | | | | | |
| Net investment income (loss) | | $ | 10,806 | | | $ | (33,516 | ) | | $ | 2,204,190 | | | $ | 3,337,411 | |
Net realized gain (loss) on sale of investments, foreign currency and written option contracts expired or closed | | | 918,374 | | | | 470,836 | | | | (179,927 | ) | | | 1,920,531 | |
Net change in unrealized appreciation (depreciation) of investments, foreign currency and written options | | | 17,368 | | | | (108,927 | ) | | | 337,457 | | | | (3,227,523 | ) |
Net increase in net assets resulting from operations | | | 946,548 | | | | 328,393 | | | | 2,361,720 | | | | 2,030,419 | |
| DISTRIBUTIONS TO SHAREHOLDERS — | | | | | | | | | | | | | | | | |
| NO LOAD CLASS: | | | | | | | | | | | | | | | | |
| Net investment income | | | — | | | | — | | | | (140,748 | ) | | | (455,480 | ) |
| Net realized gains | | | — | | | | — | | | | (7,624 | ) | | | (248,972 | ) |
| Total distributions | | | — | | | | — | | | | (148,372 | ) | | | (704,452 | ) |
| DISTRIBUTIONS TO SHAREHOLDERS — | | | | | | | | | | | | | | | | |
| ADVISOR CLASS A: | | | | | | | | | | | | | | | | |
| Net investment income | | | — | | | | — | | | | (159,092 | ) | | | (395,670 | ) |
| Net realized gains | | | — | | | | — | | | | (9,565 | ) | | | (290,649 | ) |
| Total distributions | | | — | | | | — | | | | (168,657 | ) | | | (686,319 | ) |
| DISTRIBUTIONS TO SHAREHOLDERS — | | | | | | | | | | | | | | | | |
| ADVISOR CLASS C: | | | | | | | | | | | | | | | | |
| Net investment income | | | — | | | | — | | | | (115,556 | ) | | | (218,512 | ) |
| Net realized gains | | | — | | | | — | | | | (8,371 | ) | | | (209,535 | ) |
| Total distributions | | | — | | | | — | | | | (123,927 | ) | | | (428,047 | ) |
| DISTRIBUTIONS TO SHAREHOLDERS — | | | | | | | | | | | | | | | | |
| INSTITUTIONAL CLASS: | | | | | | | | | | | | | | | | |
| Net investment income | | | — | | | | — | | | | (1,704,079 | ) | | | (2,149,325 | ) |
| Net realized gains | | | — | | | | — | | | | (85,793 | ) | | | (1,730,722 | ) |
| Total distributions | | | — | | | | — | | | | (1,789,872 | ) | | | (3,880,047 | ) |
| CAPITAL SHARE TRANSACTIONS — | | | | | | | | | | | | | | | | |
| NO LOAD CLASS: | | | | | | | | | | | | | | | | |
| Proceeds from shares sold | | | 853,418 | | | | 3,393,314 | | | | 429,273 | | | | 3,708,727 | |
| Redemption fees | | | 2,004 | | | | 446 | | | | — | | | | 37 | |
Proceeds from shares issued to holders in reinvestment of dividends | | | — | | | | — | | | | 139,741 | | | | 592,803 | |
| Cost of shares redeemed | | | (3,702,360 | ) | | | (7,189,252 | ) | | | (1,100,326 | ) | | | (13,631,910 | ) |
Net decrease in net assets resulting from capital share transactions | | | (2,846,938 | ) | | | (3,795,492 | ) | | | (531,312 | ) | | | (9,330,343 | ) |
The accompanying notes are an integral part of these financial statements.
| KINETICS MUTUAL FUNDS, INC. — THE FEEDER FUNDS |
Statements of Changes in Net Assets — (Continued) |
| | | The Alternative Income Fund | | | The Multi- Disciplinary Income Fund | |
| | | For the | | | | | | For the | | | | |
| | | Six Months | | | For the | | | Six Months | | | For the | |
| | | Ended | | | Year Ended | | | Ended | | | Year Ended | |
| | | June 30, 2015 | | | December 31, | | | June 30, 2015 | | | December 31, | |
| | | (Unaudited) | | | 2014 | | | (Unaudited) | | | 2014 | |
| CAPITAL SHARE TRANSACTIONS — | | | | | | | | | | | | |
| ADVISOR CLASS A: | | | | | | | | | | | | |
| Proceeds from shares sold | | $ | 562,428 | | | $ | 2,345,454 | | | $ | 525,167 | | | $ | 3,461,056 | |
| Redemption fees | | | — | | | | 102 | | | | 367 | | | | 1,186 | |
Proceeds from shares issued to holders in reinvestment of dividends | | | — | | | | — | | | | 153,809 | | | | 630,746 | |
| Cost of shares redeemed | | | (266,711 | ) | | | (3,730,023 | ) | | | (1,387,861 | ) | | | (28,268,189 | ) |
Net increase (decrease) in net assets resulting from capital share transactions | | | 295,717 | | | | (1,384,467 | ) | | | (708,518 | ) | | | (24,175,201 | ) |
| CAPITAL SHARE TRANSACTIONS — | | | | | | | | | | | | | | | | |
| ADVISOR CLASS C: | | | | | | | | | | | | | | | | |
| Proceeds from shares sold | | | 62,154 | | | | 461,527 | | | | 338,726 | | | | 1,455,079 | |
| Redemption fees | | | 488 | | | | — | | | | — | | | | 33 | |
Proceeds from shares issued to holders in reinvestment of dividends | | | — | | | | — | | | | 115,996 | | | | 409,715 | |
| Cost of shares redeemed | | | (165,662 | ) | | | (827,335 | ) | | | (562,326 | ) | | | (2,414,816 | ) |
Net decrease in net assets resulting from capital share transactions | | | (103,020 | ) | | | (365,808 | ) | | | (107,604 | ) | | | (549,989 | ) |
| CAPITAL SHARE TRANSACTIONS — | | | | | | | | | | | | | | | | |
| INSTITUTIONAL CLASS: | | | | | | | | | | | | | | | | |
| Proceeds from shares sold | | | 2,383,807 | | | | 23,588,431 | | | | 20,738,590 | | | | 107,173,887 | |
| Redemption fees | | | 1,283 | | | | 80 | | | | — | | | | — | |
Proceeds from shares issued to holders in reinvestment of dividends | | | — | | | | — | | | | 1,788,741 | | | | 3,872,607 | |
| Cost of shares redeemed | | | (3,928,011 | ) | | | (3,697,548 | ) | | | (15,163,287 | ) | | | (28,102,437 | ) |
Net increase (decrease) in net assets resulting from capital share transactions | | | (1,542,921 | ) | | | 19,890,963 | | | | 7,364,044 | | | | 82,944,057 | |
TOTAL INCREASE (DECREASE) IN NET ASSETS: | | | (3,250,614 | ) | | | 14,673,589 | | | | 6,147,502 | | | | 45,220,078 | |
| NET ASSETS: | | | | | | | | | | | | | | | | |
| Beginning of period | | | 38,135,805 | | | | 23,462,216 | | | | 135,379,594 | | | | 90,159,516 | |
| End of period* | | $ | 34,885,191 | | | $ | 38,135,805 | | | $ | 141,527,096 | | | $ | 135,379,594 | |
* Including undistributed net investment income (loss) of: | | $ | 10,806 | | | $ | — | | | $ | (760,571 | ) | | $ | (845,286 | ) |
The accompanying notes are an integral part of these financial statements.
| KINETICS MUTUAL FUNDS, INC. — THE FEEDER FUNDS |
Statements of Changes in Net Assets — (Continued) |
| | | The Alternative Income Fund | | | The Multi- Disciplinary Income Fund | |
| | | For the | | | | | | For the | | | | |
| | | Six Months | | | For the | | | Six Months | | | For the | |
| | | Ended | | | Year Ended | | | Ended | | | Year Ended | |
| | | June 30, 2015 | | | December 31, | | | June 30, 2015 | | | December 31, | |
| | | (Unaudited) | | | 2014 | | | (Unaudited) | | | 2014 | |
| CHANGES IN SHARES OUTSTANDING — | | | | | | | | | | | | |
| NO LOAD CLASS: | | | | | | | | | | | | |
| Shares sold | | | 9,422 | | | | 38,237 | | | | 39,355 | | | | 331,467 | |
Shares issued in reinvestments of dividends and distributions | | | — | | | | — | | | | 12,889 | | | | 53,691 | |
| Shares redeemed | | | (40,725 | ) | | | (80,966 | ) | | | (100,700 | ) | | | (1,222,512 | ) |
Net decrease in shares outstanding | | | (31,303 | ) | | | (42,729 | ) | | | (48,456 | ) | | | (837,354 | ) |
| CHANGES IN SHARES OUTSTANDING — | | | | | | | | | | | | | | | | |
| ADVISOR CLASS A: | | | | | | | | | | | | | | | | |
| Shares sold | | | 6,176 | | | | 26,310 | | | | 48,215 | | | | 310,268 | |
Shares issued in reinvestments of dividends and distributions | | | — | | | | — | | | | 14,237 | | | | 57,214 | |
| Shares redeemed | | | (2,981 | ) | | | (41,822 | ) | | | (127,603 | ) | | | (2,519,758 | ) |
Net increase (decrease) in shares outstanding | | | 3,195 | | | | (15,512 | ) | | | (65,151 | ) | | | (2,152,276 | ) |
| CHANGES IN SHARES OUTSTANDING — | | | | | | | | | | | | | | | | |
| ADVISOR CLASS C: | | | | | | | | | | | | | | | | |
| Shares sold | | | 711 | | | | 5,282 | | | | 31,322 | | | | 130,823 | |
Shares issued in reinvestments of dividends and distributions | | | — | | | | — | | | | 10,836 | | | | 37,746 | |
| Shares redeemed | | | (1,910 | ) | | | (9,522 | ) | | | (52,067 | ) | | | (220,662 | ) |
| Net decrease in shares outstanding | | | (1,199 | ) | | | (4,240 | ) | | | (9,909 | ) | | | (52,093 | ) |
| CHANGES IN SHARES OUTSTANDING — | | | | | | | | | | | | | | | | |
| INSTITUTIONAL CLASS: | | | | | | | | | | | | | | | | |
| Shares sold | | | 25,841 | | | | 261,887 | | | | 1,891,659 | | | | 9,538,510 | |
Shares issued in reinvestments of dividends and distributions | | | — | | | | — | | | | 164,534 | | | | 353,169 | |
| Shares redeemed | | | (42,857 | ) | | | (40,965 | ) | | | (1,381,169 | ) | | | (2,509,318 | ) |
Net increase (decrease) in shares outstanding | | | (17,016 | ) | | | 220,922 | | | | 675,024 | | | | 7,382,361 | |
The accompanying notes are an integral part of these financial statements.
| KINETICS MUTUAL FUNDS, INC. — THE FEEDER FUNDS |
| Notes to Financial Statements |
| June 30, 2015 (Unaudited) |
1. Organization
Kinetics Mutual Funds, Inc. (the “Company”) is registered under the Investment Company Act of 1940, as amended (the “1940 Act”), and is incorporated in the State of Maryland. The Company is an open-end management investment company issuing its shares in series. One billion shares are authorized for the Company with a par value of $0.001 per share. The series of the Company presently authorized are The Internet Fund (“Internet”), The Global Fund (“Global”), The Paradigm Fund (“Paradigm”), The Medical Fund (“Medical”), The Small Cap Opportunities Fund (“Small Cap”), The Market Opportunities Fund (“Market Opportunities”), The Alternative Income Fund (“Alternative Income”), and The Multi-Disciplinary Income Fund (“Multi-Disciplinary Income”). Investment operations of the Company began on October 21, 1996 (Internet), September 30, 1999 (Medical), December 31, 1999 (Global and Paradigm), March 20, 2000 (Small Cap), January 31, 2006 (Market Opportunities), June 29, 2007 (Alternative Income), and February 11, 2008 (Multi-Disciplinary Income). Each series, unlike many other investment companies which directly acquire and manage their own portfolios of securities, seeks to achieve its investment objective by investing all of its investable assets in a corresponding portfolio series (each a “Master Portfolio” and collectively the “Master Portfolios”) of Kinetics Portfolios Trust (the “Trust”).
On April 28, 2000 (January 31, 2006 with respect to Market Opportunities, June 29, 2007 with respect to Alternative Income, and February 11, 2008 with respect to Multi-Disciplinary Income), each series in the Company entered into a master-feeder fund structure. By entering into this structure, each series (each a “Feeder Fund” and collectively, the “Feeder Funds”) invested all of its assets in a corresponding Master Portfolio which had the same investment objective as the Feeder Fund. Each Master Portfolio has multiple feeder funds. Each Feeder Fund receives a proportionate amount of interest in the Master Portfolio equal to its relative contribution of capital. Thus, each Feeder Fund is allocated its portion of income, gains (losses) and expenses from the Master Portfolio.
| KINETICS MUTUAL FUNDS, INC. — THE FEEDER FUNDS |
Notes to Financial Statements — (Continued) |
| June 30, 2015 (Unaudited) |
Each Feeder Fund’s respective interest in the corresponding Master Portfolio as of June 30, 2015 is as follows:
| | Interest in Master Portfolio |
| Internet Fund | 99.987% |
| Global Fund | 99.916% |
| Paradigm Fund | 98.960% |
| Medical Fund | 99.879% |
| Small Cap Fund | 99.987% |
| Market Opportunities Fund | 99.968% |
| Alternative Income Fund | 99.663% |
| Multi-Disciplinary Income Fund | 99.888% |
Prior to the conversion to a master-feeder fund structure on April 28, 2000, each then existing series conducted its own investment operations.
As of June 30, 2015 each of the Feeder Funds offers Advisor Class A shares. Advisor Class A shares are subject to an annual Rule 12b-1 fee of 0.25% of average daily net assets and a shareholder servicing fee of 0.25% of average daily net assets. The Advisor Class A shares are also subject to a front-end sales charge of 5.75%.
As of June 30, 2015, each of the Feeder Funds offers Advisor Class C shares. Advisor Class C shares are subject to an annual Rule 12b-1 fee of 0.75% of average daily net assets and a shareholder servicing fee of 0.25% of average daily net assets. If you sell your Advisor Class C shares within 12 months of purchase, you will have to pay a contingent deferred sales charge of 1.00%, which is applied to the NAV of the shares on the date of original purchase or on the date of redemption, whichever is less.
As of June 30, 2015, each of the Feeder Funds offers No Load Class shares. No Load Class shares are subject to a shareholder servicing fee of 0.25% of average daily net assets but do not have 12b-1 fees or a sales charge.
As of June 30, 2015 the Paradigm, Small Cap, Market Opportunities, Alternative Income, and Multi-Disciplinary Income Funds offer Institutional Class shares. Institutional Class shares are subject to a shareholder servicing fee of 0.20% of average daily net assets but do not have 12b-1 fees or a sales charge. The Adviser has voluntarily agreed to waive a portion of the Institutional Class shareholder servicing fee in excess of 0.05%.
| KINETICS MUTUAL FUNDS, INC. — THE FEEDER FUNDS |
Notes to Financial Statements — (Continued) |
| June 30, 2015 (Unaudited) |
Each class of shares for each Fund has identical rights and privileges except with respect to the Rule 12b-1 fees paid by the Advisor Class A and Advisor Class C shares, the front-end sales charge on the Advisor Class A shares, the contingent deferred sales charge on Class C, the shareholder servicing fees paid by the Advisor Class A, Advisor Class C, No Load Class and Institutional Class shares, voting rights on matters pertaining to a single class of shares and the exchange privileges of each class of shares. Shares of each Feeder Fund will assess a 2.00% redemption fee (with exceptions) on shares redeemed or exchanged within 30 days of purchase. Income, expenses (other than expenses attributable to a specific class), and realized and unrealized gains or losses on investments are allocated to each class based on its relative net assets.
Refer to the Master Portfolios’ financial statements to obtain information about the investment objective of the corresponding Feeder Fund. The financial statements of the Master Portfolios, including the portfolios of investments, are contained elsewhere in this report and should be read in conjunction with the Feeder Funds’ financial statements.
2. Significant Accounting Policies
Security Valuation
Master Portfolio securities that are listed on a U.S. securities exchange for which market quotations are readily available are valued at the last quoted sale price on the day the valuation is made. Price information on listed securities is taken from the exchange where the security is primarily traded. All equity securities that are traded using the National Association of Securities Dealers’ Automated Quotation System (“NASDAQ”) are valued using the NASDAQ Official Closing Price (“NOCP”). Foreign securities are valued by an independent pricing service. In the event market quotations are not readily available or if events occur that may materially affect the value of a particular security between the time trading ends on a particular security and the close of regular trading on the New York Stock Exchange (“NYSE”), “fair value” will be determined. Unlisted U.S. securities and listed U.S. securities not traded on the valuation date for which market quotations are readily available are valued at the last bid price. Exchange traded options are valued at the composite price, using the National Best Bid and Offer quotes (“NBBO”). NBBO consists of the highest bid price and lowest ask price across any of the exchanges on which an option is quoted, thus providing a view across the entire U.S. options marketplace. Composite option pricing calculates the mean of the highest bid price and lowest ask price across the exchanges where the option is traded. If
| KINETICS MUTUAL FUNDS, INC. — THE FEEDER FUNDS |
Notes to Financial Statements — (Continued) |
| June 30, 2015 (Unaudited) |
the composite option price is not available, the mean between the highest bid and the lowest asked quotations at the close of the exchanges will be used. If none of the above are available, exchange traded options are valued at the last quoted sales price. Non-exchange traded options for which over-the-counter quotations are not readily available are valued at the mean of the current bid and asked prices. Debt obligations (including convertible securities) that are either investment grade or non-investment grade and irrespective of days to maturity will be valued as follows: Debt securities are valued at evaluated mean by one of the authorized third party pricing agents which rely on various valuation methodologies such as matrix pricing and other analytical pricing models as well as market transactions and dealer quotations. Investments in registered open-end investment companies other than exchange-traded funds are valued at their reported net asset value (“NAV”). Certain instruments such as repurchase agreements and demand notes, are traded at cost and there are no market values available for those instruments from third parties. Those instruments are priced at cost.
Other assets and securities for which no quotations are readily available (including restricted securities) will be valued in good faith at fair value using methods determined by the Board of Trustees of the Master Portfolios. In determining the fair value of a security, the Board of Trustees shall take into account the relevant factors and surrounding circumstances, which may include: (i) the nature and pricing history (if any) of the security; (ii) whether any dealer quotations for the security are available; (iii) possible valuation methodologies that could be used to determine the fair value of the security; (iv) the recommendation of the portfolio manager of the Portfolios with respect to the valuation of the security; (v) whether the same or similar securities are held by other funds managed by the Advisor or other funds and the method used to price the security in those funds; (vi) the extent to which the fair value to be determined for the security will result from the use of data or formula produced by third parties independent of the Advisor; and (vii) the liquidity or illiquidity of the market for the security; and (viii) the value of a foreign security traded on other foreign markets. At June 30, 2015, 0.00%, 0.00%, and 0.00% of the net assets of The Internet Portfolio, The Paradigm Portfolio and The Market Opportunities Portfolio, respectively, were fair valued securities. The other Master Portfolios did not hold any fair valued securities at June 30, 2015.
| KINETICS MUTUAL FUNDS, INC. — THE FEEDER FUNDS |
Notes to Financial Statements — (Continued) |
| June 30, 2015 (Unaudited) |
Repurchase Agreements
Each Master Portfolio may enter into repurchase agreements with banks that are members of the Federal Reserve System or securities dealers who are members of a national securities exchange or are primary dealers in U.S. Government Securities. In connection with transactions in repurchase agreements, it is the Trust’s policy that the Master Portfolio receive, as collateral, securities whose market value, including accrued interest, at all times will be at least equal to 102% of the amount invested by the Master Portfolio in each repurchase agreement. If the seller defaults and the value of the collateral declines, realization of the collateral by the Master Portfolio may be delayed or limited.
Written Option Accounting
The Master Portfolios may write (sell) call or put options for trading or hedging purposes. When a Master Portfolio writes an option, an amount equal to the premium received by the Master Portfolio is included in the Statement of Assets and Liabilities as an asset and an equivalent liability. The amount of the liability is subsequently marked-to-market to reflect the current value of the option written. By writing the option, the Master Portfolio may become obligated during the term of the option to deliver or purchase the securities underlying the option at the exercise price if the option is exercised. When an option expires on its stipulated expiration date or the Master Portfolio enters into a closing purchase transaction, the Master Portfolio realizes a gain or loss if the cost of the closing transaction differs from the premium received when the option was sold, without regard to any unrealized gain or loss on the underlying security, and the liability related to such option is eliminated. When an option is exercised, the premium originally received decreases the cost basis of the underlying security (or increases the proceeds on the security sold short) and the Master Portfolio realizes a gain or loss from the sale of the security (or closing of the short sale). As collateral for uncovered written options, the Master Portfolio is required under the 1940 Act to maintain assets consisting of cash, cash equivalents or liquid securities. This collateral is required to be adjusted daily to reflect the exercise price of the purchase obligation for put options or the market value of the instrument underlying the contract for call options.
Foreign Currency Translations
The books and records of the Master Portfolios are maintained in U.S. dollars. For the Master Portfolios, foreign currency transactions are translated into U.S. dollars on the following basis: (i) market values of investment securities and
| KINETICS MUTUAL FUNDS, INC. — THE FEEDER FUNDS |
Notes to Financial Statements — (Continued) |
| June 30, 2015 (Unaudited) |
other assets and liabilities are translated at the exchange rate of such currencies against the U.S. dollar, as provided by an approved pricing service, and (ii) purchases and sales of investment securities, dividend and interest income and certain expenses at the rates of exchange prevailing on the respective dates of such transactions. The Master Portfolios do not isolate and treat as ordinary income that portion of the results of operations arising as a result of changes in the exchange rate from the fluctuations arising from changes in the market prices of securities held during the period. Such fluctuations are included with the net realized and unrealized gain or loss from investments. However, for federal income tax purposes, the Master Portfolios do isolate and treat as ordinary income the effect of changes in foreign exchange rates arising from actual foreign currency transactions and the effect of changes in foreign exchange rates arising between trade date and settlement date.
Restricted and Illiquid Securities
The Master Portfolios may invest in restricted securities. These securities are valued by the Master Portfolios after giving due consideration to pertinent factors including recent private sales, market conditions and the issuer’s financial performance. The Master Portfolios have no right to require registration of unregistered securities. At June 30, 2015, the following Master Portfolios held securities restricted to institutional investors (144A securities):
| | | Market Value | | Percentage of Net Assets |
| The Alternative Income Portfolio | | $ | 653,891 | | | | 1.87 | % |
| The Multi-Disciplinary Income Portfolio | | | 28,025,286 | | | | 19.66 | % |
An illiquid asset is any asset which may not be sold or disposed of in the ordinary course of business within seven days at approximately the value at which a Master Portfolio has valued the investment. At June 30, 2015, the following Master Portfolios held illiquid securities:
| | | Market Value | | Percentage of Net Assets |
| The Internet Portfolio | | $ | — | * | | | 0.00 | % |
| The Paradigm Portfolio | | | — | * | | | 0.00 | % |
| The Market Opportunities Portfolio | | | — | * | | | 0.00 | % |
| The Multi-Disciplinary Income Portfolio | | | 332,500 | | | | 0.23 | % |
| * Amount is less than $0.50. |
| KINETICS MUTUAL FUNDS, INC. — THE FEEDER FUNDS |
Notes to Financial Statements — (Continued) |
| June 30, 2015 (Unaudited) |
When-Issued Securities
The Master Portfolios may purchase securities on a when-issued or delayed delivery basis. Although the purchase amounts of these securities are established at the time the purchaser enters into the agreement, these securities may be delivered and paid for at a future date. The Master Portfolios record purchases of when-issued securities and reflect the values of such securities in determining net asset value in the same manner as other portfolio securities. The Master Portfolios maintain at all times cash or other liquid assets in an amount at least equal to the amount of outstanding commitments for when-issued securities.
Securities Lending
Each Master Portfolio may lend its portfolio securities to broker-dealers by entering directly into lending arrangements with such broker-dealers or indirectly through repurchase agreements with respect to no more than 331/3% of the total assets of each Master Portfolio (including any collateral posted) or 50% of the total assets of each Master Portfolio (excluding any collateral posted). Securities lending and repurchase transactions will be fully collateralized at all times with cash and/or short-term debt obligations. The Master Portfolios receive interest on the collateral received as well as a fee for the securities loaned.
Expense Allocation
Common expenses incurred by Feeder Funds are allocated among the Feeder Funds (i) based upon relative average net assets, (ii) as incurred on a specific identification basis, or (iii) equally among the Feeder Funds, depending on the nature of the expenditure.
Each Feeder Fund records its proportionate share of the corresponding Master Portfolio’s expenses on a daily basis. In addition, each Feeder Fund accrues its own separate expenses. Any cap on expenses includes Feeder Fund-specific expenses as well as the expenses allocated from the Master Portfolio.
Federal Income Taxes
Each Master Portfolio will be treated as a partnership for federal income tax purposes. As such, each investor in the Master Portfolio via its investment in a Feeder Fund will be subject to taxation on its share of the Master Portfolio’s ordinary income and capital gains. It is intended that the Master Portfolio’s
| KINETICS MUTUAL FUNDS, INC. — THE FEEDER FUNDS |
Notes to Financial Statements — (Continued) |
| June 30, 2015 (Unaudited) |
assets will be managed so an investor in the Master Portfolio via its investment in a Feeder Fund can satisfy the requirements of subchapter M of the Internal Revenue Code.
It is the Feeder Funds’ policy to meet the requirements of the Internal Revenue Code applicable to regulated investment companies and the Feeder Funds intend to distribute investment company net taxable income and net capital gains to shareholders. Therefore, no federal income tax provision is recorded.
Dividends from net investment income and distributions of net realized capital gains, if any, will be declared and paid at least annually. The character of distributions made during the year from net investment income or net realized gains may differ from the characterization for federal income tax purposes due to differences in the recognition of income, expenses and gain items for financial statement and tax purposes. Additionally, the Feeder Funds may utilize earnings and profits distributed to shareholders on redemption of shares as part of the dividends paid deduction for income tax purposes. Where appropriate, reclassifications between capital accounts are made for such differences that are permanent in nature.
There is no tax liability resulting from unrecognized tax benefits relating to uncertain income tax positions taken or expected to be taken in future tax returns. As of June 30, 2015, open tax years include the tax years ended December 31, 2011 through 2014. The Funds are also not aware of any tax positions for which it is reasonably possible that the total amounts of unrecognized tax benefits will significantly change in the next six months.
Use of Estimates
The preparation of financial statements in conformity with U.S. generally accepted accounting principles (“GAAP”) requires management to make estimates and assumptions that affect the reported amounts in the financial statements. Actual results could differ from those estimates.
Other
Realized gains and losses on the sale of investments are calculated on the identified cost basis. Dividend income is recorded on the ex-dividend date. Interest income is accounted for on the accrual basis and includes amortization of premiums and discounts on the interest method. Other noncash dividends are recognized as investment income at the fair value of the property received.
| KINETICS MUTUAL FUNDS, INC. — THE FEEDER FUNDS |
Notes to Financial Statements — (Continued) |
| June 30, 2015 (Unaudited) |
Withholding taxes on foreign dividends have been provided for in accordance with the Company’s understanding of the applicable country’s tax rules and rates.
3. Investment Adviser
The Trust has entered into Investment Advisory Agreements (the “Agreements”) with Kinetics Asset Management LLC (the “Adviser”), with whom certain Officers and trustees of the Trust are affiliated, to furnish investment advisory services to the Master Portfolios. The Adviser is a wholly-owned subsidiary of Horizon Kinetics LLC. Under the terms of the Agreements, the Master Portfolios, except the Alternative Income Portfolio, compensate the Adviser for its management services at the annual rate of 1.25% of each Master Portfolio’s average daily net assets. The Alternative Income Portfolio compensates the Adviser for its management services at the annual rate of 0.90% of the Master Portfolio’s average daily net assets.
The Adviser has voluntarily agreed to waive a portion of its advisory fee and/or reimburse certain operating expenses as deemed appropriate through at least May 1, 2016. The Adviser may discontinue the voluntary waiver/reimbursement at any time after May 1, 2016; these waivers/reimbursements are not subject to recapture.
For the period ended June 30, 2015, the rate earned by the Adviser from the Master Portfolios and the waived fees/reimbursed expenses for the Feeder Funds are as follows:
| | | The Internet Fund | | | The Global Fund | |
| Annual Advisory Rate | | | 1.25% | | | | 1.25% | |
Expenses Reimbursed by Adviser through voluntary waiver | | $ | — | | | $ | 61,380 | |
Expenses Reimbursed by Adviser through institutional class shareholder servicing fee waiver | | $ | — | | | $ | — | |
| | | The Paradigm Fund | | | The Medical Fund | |
| Annual Advisory Rate | | | 1.25% | | | | 1.25% | |
Expenses Reimbursed by Adviser through voluntary waiver | | $ | 381,683 | | | $ | 86,294 | |
Expenses Reimbursed by Adviser through institutional class shareholder servicing fee waiver | | $ | 262,431 | | | $ | — | |
| KINETICS MUTUAL FUNDS, INC. — THE FEEDER FUNDS |
Notes to Financial Statements — (Continued) |
| June 30, 2015 (Unaudited) |
| | | The Small Cap Opportunities Fund | | | The Market Opportunities Fund | |
| Annual Advisory Rate | | | 1.25% | | | | 1.25% | |
Expenses Reimbursed by Adviser through voluntary waiver | | $ | 147,770 | | | $ | 63,925 | |
Expenses Reimbursed by Adviser through institutional class shareholder servicing fee waiver | | $ | 53,175 | | | $ | 2,172 | |
| | | The Alternative Income Fund | | | The Multi- Disciplinary Income Fund | |
| Annual Advisory Rate | | | 0.90% | | | | 1.25% | |
Expenses Reimbursed by Adviser through voluntary waiver | | $ | 146,096 | | | $ | 197,371 | |
Expenses Reimbursed by Adviser through institutional class shareholder servicing fee waiver | | $ | 19,647 | | | $ | 80,693 | |
The Adviser receives a shareholder servicing fee from the No Load Class, Advisor Class A and Advisor Class C shares of a Feeder Fund pursuant to a Shareholder Servicing Agreement in the amount equal to 0.25% of the Feeder Fund’s average daily net assets attributable to No Load Class, Advisor Class A and Advisor Class C shares, respectively. For the Institutional Class, the Adviser receives a shareholder servicing fee pursuant to a shareholder servicing agreement in the amount equal to 0.20% of a Feeder Fund’s average daily net assets attributable to Institutional Class shares. At this time, the Adviser has contractually agreed to waive and/or reimburse the portion of the Institutional Class shareholder servicing fee in excess of 0.05% of a Feeder Fund’s average daily net assets attributable to Institutional Class shares until at least May 1, 2016. For the six months ended June 30, 2015, the Adviser waived amounts depicted in the above table in shareholder servicing fees for the Institutional Class of the Paradigm, Small Cap, Market Opportunities, Alternative Income, and Multi-Disciplinary Income Funds.
| | | Shareholder Servicing Expenses for six months ended June 30, 2015 |
| | |
| | |
| The Internet Fund | | $ | 188,500 | |
| The Global Fund | | | 11,119 | |
| The Paradigm Fund | | | 1,319,796 | |
| The Medical Fund | | | 36,401 | |
| The Small Cap Opportunities Fund | | | 402,252 | |
| The Market Opportunities Fund | | | 64,667 | |
| The Alternative Income Fund | | | 38,693 | |
| The Multi-Disciplinary Income Fund | | | 147,875 | |
| KINETICS MUTUAL FUNDS, INC. — THE FEEDER FUNDS |
Notes to Financial Statements — (Continued) |
| June 30, 2015 (Unaudited) |
The Adviser is responsible for paying a portion of these shareholder servicing fees to various agents that have a written shareholder servicing agreement with the Adviser and that perform shareholder servicing functions and maintenance of shareholder accounts on behalf of their clients who own shares of the Feeder Funds.
For the six months ended June 30, 2015, the Feeder Funds were allocated $13,000 for the services of the Chief Compliance Officer employed by the Adviser.
The Company, on behalf of the Feeder Funds, has adopted two Retail Distribution Plans pursuant to Rule 12b-1 under the 1940 Act (the “12b-1 Plans”). One Plan is for Advisor Class A shares, while the other Plan is for Advisor Class C shares. Under the 12b-1 Plan for Advisor Class A shares, Advisor Class A shares may pay up to an annual rate of 0.50% of the average daily net asset value of Advisor Class A shares to the Distributor or other qualified recipients under the 12b-1 Plan. During the six months ended June 30, 2015, payments under the 12b-1 Plan for the Advisor Class A shares of the Internet, Global, Paradigm, Medical, Small Cap, Market Opportunities, Alternative Income, and Multi-Disciplinary Income Funds were limited to 0.25% of the average daily net asset value of such shares of such Funds. Under the second Plan, Advisor Class C shares pay an annual rate of 0.75% of the average daily net asset value of such shares.
| | | 12b-1 Expenses for six months ended June 30, 2015 | |
| | | Advisor Class A | | | Advisor Class C | |
| The Internet Fund | | $ | 5,851 | | | $ | 4,031 | |
| The Global Fund | | | 619 | | | | 6,613 | |
| The Paradigm Fund | | | 213,917 | | | | 515,287 | |
| The Medical Fund | | | 6,068 | | | | 2,509 | |
| The Small Cap Opportunities Fund | | | 28,894 | | | | 48,613 | |
| The Market Opportunities Fund | | | 9,204 | | | | 19,230 | |
| The Alternative Income Fund | | | 1,877 | | | | 5,362 | |
| The Multi-Disciplinary Income Fund | | | 15,085 | | | | 39,006 | |
| KINETICS MUTUAL FUNDS, INC. — THE FEEDER FUNDS |
Notes to Financial Statements — (Continued) |
| June 30, 2015 (Unaudited) |
Kinetics Funds Distributor, LLC (the “Distributor”) acts as the Funds’ principal underwriter in a continuous public offering of the Funds’ shares. The Distributor is an affiliate of the Adviser.
| | | | Distributor Sales Load Fees for six months ended June 30, 2015 |
| | | |
| | | |
| | | |
| | | |
| The Internet Fund | | $ | 49 | |
| The Global Fund | | | — | |
| The Paradigm Fund | | | 14,844 | |
| The Medical Fund | | | 1,488 | |
| The Small Cap Opportunities Fund | | | 2,761 | |
| The Market Opportunities Fund | | | 312 | |
| The Alternative Income Fund | | | 1,569 | |
| The Multi-Disciplinary Income Fund | | | 419 | |
4. Reclassification of Capital Accounts
GAAP requires that certain components of net assets relating to permanent differences be reclassified between financial and tax reporting. These reclassifications have no effect on net assets or net asset value per share. For the year ended December 31, 2014, each Feeder Fund recorded the following reclassifications to the accounts listed below:
| | | INCREASE/(DECREASE) | |
| | | Accumulated | | | | | | | |
| | | Net | | | Accumulated | | | | |
| | | Investment | | | Net Realized | | | | |
| | | Income | | | Gain | | | | |
| | | (Loss) | | | (Loss) | | | Paid In Capital | |
| The Internet Fund | | $ | 2,283,475 | | | $ | (3,694,096 | ) | | $ | 1,410,621 | |
| The Global Fund | | | 93,029 | | | | 3,671 | | | | (96,700 | ) |
| The Paradigm Fund | | | 15,888,600 | | | | (48,133 | ) | | | (15,840,467 | ) |
| The Medical Fund | | | 26 | | | | (26 | ) | | | — | |
| The Small Cap Opportunities Fund | | | 3,661,748 | | | | 9,388 | | | | (3,671,136 | ) |
| The Market Opportunities Fund | | | 429,934 | | | | 250,208 | | | | (680,142 | ) |
| The Alternative Income Fund | | | 33,516 | | | | — | | | | (33,516 | ) |
| The Multi-Disciplinary Income Fund | | | (28,549 | ) | | | 28,549 | | | | — | |
5. Income Taxes
At December 31, 2014, the Internet, Global, Paradigm, Medical, Small Cap, Market Opportunities, Alternative Income, and Multi-Disciplinary Income Funds had $0, $0, $0, $163,939, $0, $0, $0, and $113,181, respectively, of undistributed net investment income on a tax basis.
| KINETICS MUTUAL FUNDS, INC. — THE FEEDER FUNDS |
Notes to Financial Statements — (Continued) |
| June 30, 2015 (Unaudited) |
At December 31, 2014, the Internet and Medical Funds had $3,886,897 and $242,334, respectively, of accumulated net realized gains on a tax basis.
At December 31, 2014, the Feeder Funds had accumulated net realized capital loss carryforwards expiring in the following years:
| | | 2018 | | | 2017 | | | 2016 | |
| Internet | | $ | — | | | $ | — | | | $ | — | |
| Global | | | — | | | | (42,250 | ) | | | — | |
| Paradigm | | | (115,786,082 | ) | | | (445,505,345 | ) | | | (171,733,296 | ) |
| Medical | | | — | | | | — | | | | — | |
| Small Cap | | | (8,224,702 | ) | | | (96,486,615 | ) | | | (31,007,116 | ) |
| Market Opportunities | | | (2,108,533 | ) | | | (6,623,055 | ) | | | (12,715,065 | ) |
| Alternative Income | | | (2,203,647 | ) | | | (4,868,599 | ) | | | (483,616 | ) |
| Multi-Disciplinary Income | | | — | | | | — | | | | — | |
As a result of the Regulated Investment Company Modernization Act of 2010 (the “Modernization Act”), losses incurred in this fiscal year and beyond retain their character, short-term or long-term, have no expiration date and are utilized prior to capital loss carryforwards accumulated before the enactment of the Modernization Act.
For the year ended December 31, 2014, the following Feeder Funds utilized capital loss carryforwards:
| | | Capital Loss Carryforward |
| | |
| Global | | $ | 319,581 | |
| Paradigm | | | 35,792,871 | |
| Medical | | | 342,501 | |
| Small Cap | | | 22,539,948 | |
| Market Opportunities | | | 3,893,801 | |
| Alternative Income | | | 503,501 | |
| KINETICS MUTUAL FUNDS, INC. — THE FEEDER FUNDS |
Notes to Financial Statements — (Continued) |
| June 30, 2015 (Unaudited) |
At December 31, 2014, the following Feeder Funds deferred, on a tax basis, post-October losses:
| | | Late Year | | | Post-October | |
| | | Ordinary | | | Capital Loss | |
| | | Loss Deferral | | | Deferral | |
| Internet | | $ | — | | | $ | — | |
| Global | | | (498 | ) | | | — | |
| Paradigm | | | (358,026 | ) | | | — | |
| Medical | | | — | | | | — | |
| Small Cap | | | (211,011 | ) | | | — | |
| Market Opportunities | | | (82,218 | ) | | | — | |
| Alternative Income | | | — | | | | — | |
| Multi-Disciplinary Income | | | — | | | | (172,818 | ) |
The tax components of dividends paid during the six months ended June 30, 2015 and the year ended December 31, 2014 are:
| | | Internet | | | Global | |
| | | Ordinary | | | Long-Term | | | Ordinary | | | Long-Term | |
| | | Income | | | Capital Gains | | | Income | | | Capital Gains | |
| | | Distribution | | | Distribution | | | Distribution | | | Distribution | |
| 2015 | | $ | — | | | $ | — | | | $ | — | | | $ | — | |
| 2014 | | $ | — | | | $ | 8,349,038 | | | $ | — | | | $ | 939 | |
| | | Paradigm | | | Medical | |
| | | Ordinary | | | Long-Term | | | Ordinary | | | Long-Term | |
| | | Income | | | Capital Gains | | | Income | | | Capital Gains | |
| | | Distribution | | | Distribution | | | Distribution | | | Distribution | |
| 2015 | | $ | — | | | $ | — | | | $ | — | | | $ | — | |
| 2014 | | $ | — | | | $ | — | | | $ | — | | | $ | 41,984 | |
| | | Small Cap | | | Market Opportunities | |
| | | Ordinary | | | Long-Term | | | Ordinary | | | Long-Term | |
| | | Income | | | Capital Gains | | | Income | | | Capital Gains | |
| | | Distribution | | | Distribution | | | Distribution | | | Distribution | |
| 2015 | | $ | — | | | $ | — | | | $ | — | | | $ | — | |
| 2014 | | $ | — | | | $ | — | | | $ | — | | | $ | — | |
| | | Alternative Income | | | Multi-Disciplinary Income | |
| | | Ordinary | | | Long-Term | | | Ordinary | | | Long-Term | |
| | | Income | | | Capital Gains | | | Income | | | Capital Gains | |
| | | Distribution | | | Distribution | | | Distribution | | | Distribution | |
| 2015 | | $ | — | | | $ | — | | | $ | 2,230,828 | | | $ | — | |
| 2014 | | $ | — | | | $ | — | | | $ | 5,680,986 | | | $ | 17,879 | |
| KINETICS MUTUAL FUNDS, INC. — THE FEEDER FUNDS |
Notes to Financial Statements — (Continued) |
| June 30, 2015 (Unaudited) |
6. Tax Information
The Funds did not designate any net investment income as qualified dividend income under the Jobs and Growth Tax Relief Reconciliation Act of 2003.
The Internet, Global, Paradigm, Medical, Small Cap, Market Opportunities, Alternative Income, and Multi-Disciplinary Income Funds hereby designate 0%, 0%, 0%, 0%, 0%, 0%, 0% and 99.69%, respectively, as ordinary income distributions and 100%, 100%, 100% and 0.3%, respectively, for the Internet, Global, Medical and Multi-Disciplinary Income Funds as long-term capital gain distributions for the purposes of the dividends paid deduction, which include earnings and profits distributed to shareholders on redemptions of Fund shares.
For corporate shareholders in the Feeder Funds, there was no ordinary dividend income distributed for the year ended December 31, 2014 which was designated as qualifying for the dividends-received deduction. The Multi-Disciplinary Income Fund designates 94% of its ordinary income distributions for the fiscal year ended December 31, 2014 as interest-related dividends under Internal Revenue Code Section 871(k)(l)(C).
The Multi-Disciplinary Income Fund designates 43% of its ordinary income distribution as a short-term capital gain distribution under Internal Revenue Code Section 871(k)(2)(C).
7. Information about Proxy Voting
Information regarding how the Company and the Master Portfolios vote proxies relating to portfolio securities is available without charge, upon request by calling toll-free at 1-800-930-3828 or by accessing the Company’s website at www.kineticsfunds.com and by accessing the SEC’s website at www.sec.gov. Information regarding how the Feeder Funds and the Master Portfolios voted proxies relating to portfolio securities during the most recent twelve month period ended June 30, is available without charge, upon request, by calling toll-free at 1-800-930-3828 or by accessing the SEC’s website at www.sec.gov.
| KINETICS MUTUAL FUNDS, INC. — THE FEEDER FUNDS |
Notes to Financial Statements — (Continued) |
| June 30, 2015 (Unaudited) |
8. Information about the Portfolio Holdings
The Feeder Funds file their complete schedule of portfolio holdings for their first and third fiscal quarters with the SEC on Form N-Q. The Feeder Funds’ Form N-Q is available without charge, upon request, by calling toll-free at 1-800-930-3828. Furthermore, you can obtain the Form N-Q on the SEC’s website at www.sec.gov. Finally, the Form N-Q may be reviewed and copied at the SEC’s Public Reference Room in Washington, D.C. Information on the operation of the Public Reference Room may be obtained by calling 1-800-SEC-0330.
9. Subsequent Events
In preparing these financial statements, management has evaluated Fund related events and transactions for potential recognition or disclosure through the date the financial statements were issued. There were no events or translations that occurred during the period that materially impacted the amounts or disclosures in the Funds’ financial statements.
10. Recent Accounting Pronouncements
In June 2014, the Financial Accounting Standard Board issued ASU No. 2014-11 “Repurchase-to-Maturity Transactions, Repurchase Financings, and Disclosures.” ASU No. 2014-11 makes limited changes to the accounting for repurchase agreements, clarifies when repurchase agreements and securities lending transactions should be accounted for as secured borrowings, and requires additional disclosures regarding these types of transactions. The guidance is effective for fiscal years beginning after December 15, 2014, and for interim periods within those fiscal years. Management is currently evaluating the impact these disclosures will have on the Funds’ financial statement disclosures.
| KINETICS MUTUAL FUNDS, INC. — THE FEEDER FUNDS |
| Financial Highlights |
| | | The Internet Fund | |
| | | No Load Class | |
| | | For the Six Months Ended June 30, 2015 (Unaudited) | | | For the Year Ended December 31, 2014 | | | For the Year Ended December 31, 2013 | | | For the Year Ended December 31, 2012 | | | For the Year Ended December 31, 2011 | | | For the Year Ended December 31, 2010 | |
PER SHARE DATA:(1) | | | | | | | | | | | | | | | | | | |
| Net Asset Value, Beginning of Period | | $ | 56.08 | | | $ | 59.27 | | | $ | 43.18 | | | $ | 36.26 | | | $ | 37.25 | | | $ | 30.74 | |
| Income from Investment Operations: | | | | | | | | | | | | | | | | | | | | | | | | |
Net investment loss(2) | | | (0.39 | ) | | | (0.77 | ) | | | (0.67 | ) | | | (0.15 | ) | | | (0.37 | ) | | | (0.28 | ) |
| Net realized and unrealized gain (loss) on investments | | | 0.74 | | | | 0.69 | | | | 19.78 | | | | 8.56 | | | | (0.37 | ) | | | 6.79 | |
| Total from investment operations | | | 0.35 | | | | (0.08 | ) | | | 19.11 | | | | 8.41 | | | | (0.74 | ) | | | 6.51 | |
| Redemption Fees | | | 0.00 | (3) | | | 0.01 | | | | 0.00 | (3) | | | 0.00 | (3) | | | 0.00 | (3) | | | 0.00 | (3) |
| Less Distributions: | | | | | | | | | | | | | | | | | | | | | | | | |
| From net realized gains | | | — | | | | (3.12 | ) | | | (3.02 | ) | | | (1.49 | ) | | | (0.25 | ) | | | — | |
| Total distributions | | | — | | | | (3.12 | ) | | | (3.02 | ) | | | (1.49 | ) | | | (0.25 | ) | | | — | |
| Net Asset Value, End of Period | | $ | 56.43 | | | $ | 56.08 | | | $ | 59.27 | | | $ | 43.18 | | | $ | 36.26 | | | $ | 37.25 | |
| Total return | | | 0.62 | %(4) | | | (0.16 | )% | | | 44.28 | % | | | 23.24 | % | | | (1.98 | )% | | | 21.18 | % |
| | | | | | | | | | | | | | | | | | | | | | | | | |
| SUPPLEMENTAL DATA AND RATIOS | | | | | | | | | | | | | | | | | | | | | | | | |
| Net assets, end of period (000’s) | | $ | 140,218 | | | $ | 151,200 | | | $ | 172,332 | | | $ | 155,036 | | | $ | 103,828 | | | $ | 113,085 | |
| Ratio of operating expenses to average net assets: | | | | | | | | | | | | | | | | | | | | | | | | |
| Before expense reimbursement | | | 1.81 | %(5) | | | 1.78 | % | | | 1.84 | % | | | 1.94 | % | | | 1.94 | % | | | 1.95 | % |
After expense reimbursement(6) | | | 1.81 | %(5) | | | 1.78 | % | | | 1.84 | % | | | 1.89 | % | | | 1.89 | % | | | 1.89 | % |
| Ratio of net investment loss to average net assets: | | | | | | | | | | | | | | | | | | | | | | | | |
| Before expense reimbursement | | | (1.39 | )%(5) | | | (1.34 | )% | | | (1.30 | )% | | | (0.41 | )% | | | (0.99 | )% | | | (0.91 | )% |
After expense reimbursement(6) | | | (1.39 | )%(5) | | | (1.34 | )% | | | (1.30 | )% | | | (0.36 | )% | | | (0.94 | )% | | | (0.85 | )% |
Portfolio turnover rate(7) | | | 0 | % | | | 1 | % | | | 8 | % | | | 9 | % | | | 32 | % | | | 12 | % |
| (1) | Information presented relates to a share of capital stock outstanding for each period. |
| (2) | Net investment income per share represents net investment income divided by the average shares outstanding throughout the period. |
| (3) | Amount calculated is less than $0.005. |
| (4) | Not annualized. |
| (5) | Annualized. |
| (6) | See Note #3, Investment Adviser, for the waiver and expense reimbursement discussion. |
| (7) | Portfolio turnover of The Internet Portfolio. |
The accompanying notes are an integral part of these financial statements.
| KINETICS MUTUAL FUNDS, INC. — THE FEEDER FUNDS |
Financial Highlights — (Continued) |
| | | The Internet Fund | |
| | | Advisor Class A | |
| | | For the Six Months Ended June 30, 2015 (Unaudited) | | | For the Year Ended December 31, 2014 | | | For the Year Ended December 31, 2013 | | | For the Year Ended December 31, 2012 | | | For the Year Ended December 31, 2011 | | | For the Year Ended December 31, 2010 | |
PER SHARE DATA:(1) | | | | | | | | | | | | | | | | | | |
| Net Asset Value, Beginning of Period | | $ | 54.51 | | | $ | 57.84 | | | $ | 42.30 | | | $ | 35.63 | | | $ | 36.69 | | | $ | 30.35 | |
| Income from Investment Operations: | | | | | | | | | | | | | | | | | | | | | | | | |
Net investment loss(2) | | | (0.45 | ) | | | (0.89 | ) | | | (0.81 | ) | | | (0.24 | ) | | | (0.46 | ) | | | (0.36 | ) |
| Net realized and unrealized gain (loss) on investments | | | 0.73 | | | | 0.68 | | | | 19.36 | | | | 8.40 | | | | (0.36 | ) | | | 6.70 | |
| Total from investment operations | | | 0.28 | | | | (0.21 | ) | | | 18.55 | | | | 8.16 | | | | (0.82 | ) | | | 6.34 | |
| Redemption Fees | | | — | | | | 0.00 | (3) | | | 0.01 | | | | — | | | | 0.01 | | | | 0.00 | (3) |
| Less Distributions: | | | | | | | | | | | | | | | | | | | | | | | | |
| From net realized gains | | | — | | | | (3.12 | ) | | | (3.02 | ) | | | (1.49 | ) | | | (0.25 | ) | | | — | |
| Total distributions | | | — | | | | (3.12 | ) | | | (3.02 | ) | | | (1.49 | ) | | | (0.25 | ) | | | — | |
| Net Asset Value, End of Period | | $ | 54.79 | | | $ | 54.51 | | | $ | 57.84 | | | $ | 42.30 | | | $ | 35.63 | | | $ | 36.69 | |
Total return(4) | | | 0.51 | %(5) | | | (0.41 | )% | | | 43.94 | % | | | 22.92 | % | | | (2.20 | )% | | | 20.89 | % |
| | | | | | | | | | | | | | | | | | | | | | | | | |
| SUPPLEMENTAL DATA AND RATIOS | | | | | | | | | | | | | | | | | | | | | | | | |
| Net assets, end of period (000’s) | | $ | 3,991 | | | $ | 5,143 | | | $ | 5,506 | | | $ | 1,379 | | | $ | 1,050 | | | $ | 1,892 | |
| Ratio of operating expenses to average net assets: | | | | | | | | | | | | | | | | | | | | | | | | |
| Before expense reimbursement | | | 2.06 | %(6) | | | 2.03 | % | | | 2.09 | % | | | 2.19 | % | | | 2.19 | % | | | 2.20 | % |
After expense reimbursement(7) | | | 2.06 | %(6) | | | 2.03 | % | | | 2.09 | % | | | 2.14 | % | | | 2.14 | % | | | 2.14 | % |
| Ratio of net investment loss to average net assets: | | | | | | | | | | | | | | | | | | | | | | | | |
| Before expense reimbursement | | | (1.64 | )%(6) | | | (1.59 | )% | | | (1.55 | )% | | | (0.66 | )% | | | (1.24 | )% | | | (1.16 | )% |
After expense reimbursement(7) | | | (1.64 | )%(6) | | | (1.59 | )% | | | (1.55 | )% | | | (0.61 | )% | | | (1.19 | )% | | | (1.10 | )% |
Portfolio turnover rate(8) | | | 0 | % | | | 1 | % | | | 8 | % | | | 9 | % | | | 32 | % | | | 12 | % |
| (1) | Information presented relates to a share of capital stock outstanding for each period. |
| (2) | Net investment income per share represents net investment income divided by the average shares outstanding throughout the period. |
| (3) | Amount calculated is less than $0.005. |
| (4) | The total return calculation does not reflect the 5.75% front end sales charge on Advisor Class A shares. |
| (5) | Not annualized. |
| (6) | Annualized. |
| (7) | See Note #3, Investment Adviser, for the waiver and expense reimbursement discussion. |
| (8) | Portfolio turnover of The Internet Portfolio. |
The accompanying notes are an integral part of these financial statements.
| KINETICS MUTUAL FUNDS, INC. — THE FEEDER FUNDS |
Financial Highlights — (Continued) |
| | | The Internet Fund | |
| | | Advisor Class C | |
| | | For the Six Months Ended June 30, 2015 (Unaudited) | | | For the Year Ended December 31, 2014 | | | For the Year Ended December 31, 2013 | | | For the Year Ended December 31, 2012 | | | For the Year Ended December 31, 2011 | | | For the Year Ended December 31, 2010 | |
PER SHARE DATA:(1) | | | | | | | | | | | | | | | | | | |
| Net Asset Value, Beginning of Period | | $ | 51.81 | | | $ | 55.38 | | | $ | 40.79 | | | $ | 34.58 | | | $ | 35.79 | | | $ | 29.76 | |
| Income from Investment | | | | | | | | | | | | | | | | | | | | | | | | |
| Operations: | | | | | | | | | | | | | | | | | | | | | | | | |
Net investment loss(2) | | | (0.56 | ) | | | (1.11 | ) | | | (1.03 | ) | | | (0.43 | ) | | | (0.63 | ) | | | (0.51 | ) |
| Net realized and unrealized gain (loss) on investments | | | 0.69 | | | | 0.64 | | | | 18.64 | | | | 8.13 | | | | (0.34 | ) | | | 6.54 | |
| Total from investment operations | | | 0.13 | | | | (0.47 | ) | | | 17.61 | | | | 7.70 | | | | (0.97 | ) | | | 6.03 | |
| Redemption Fees | | | — | | | | 0.02 | | | | — | | | | — | | | | 0.01 | | | | — | |
| Less Distributions: | | | | | | | | | | | | | | | | | | | | | | | | |
| From net realized gains | | | — | | | | (3.12 | ) | | | (3.02 | ) | | | (1.49 | ) | | | (0.25 | ) | | | — | |
| Total distributions | | | — | | | | (3.12 | ) | | | (3.02 | ) | | | (1.49 | ) | | | (0.25 | ) | | | — | |
| Net Asset Value, End of Period | | $ | 51.94 | | | $ | 51.81 | | | $ | 55.38 | | | $ | 40.79 | | | $ | 34.58 | | | $ | 35.79 | |
| Total return | | | 0.25 | %(3) | | | (0.86 | )% | | | 43.20 | % | | | 22.32 | % | | | (2.67 | )% | | | 20.26 | % |
| | | | | | | | | | | | | | | | | | | | | | | | | |
| SUPPLEMENTAL DATA AND RATIOS | | | | | | | | | | | | | | | | | | | | | | | | |
| Net assets, end of period (000’s) | | $ | 1,009 | | | $ | 1,105 | | | $ | 913 | | | $ | 185 | | | $ | 103 | | | $ | 196 | |
| Ratio of operating expenses to average net assets: | | | | | | | | | | | | | | | | | | | | | | | | |
| Before expense reimbursement | | | 2.56 | %(4) | | | 2.53 | % | | | 2.59 | % | | | 2.69 | % | | | 2.69 | % | | | 2.70 | % |
After expense reimbursement(5). | | | 2.56 | %(4) | | | 2.53 | % | | | 2.59 | % | | | 2.64 | % | | | 2.64 | % | | | 2.64 | % |
| Ratio of net investment loss to average net assets: | | | | | | | | | | | | | | | | | | | | | | | | |
| Before expense reimbursement | | | (2.14 | )%(4) | | | (2.09 | )% | | | (2.05 | )% | | | (1.16 | )% | | | (1.74 | )% | | | (1.66 | )% |
After expense reimbursement(5) | | | (2.14 | )%(4) | | | (2.09 | )% | | | (2.05 | )% | | | (1.11 | )% | | | (1.69 | )% | | | (1.60 | )% |
Portfolio turnover rate(6) | | | 0 | % | | | 1 | % | | | 8 | % | | | 9 | % | | | 32 | % | | | 12 | % |
| (1) | Information presented relates to a share of capital stock outstanding for each period. |
| (2) | Net investment income per share represents net investment income divided by the average shares outstanding throughout the period. |
| (3) | Not annualized. |
| (4) | Annualized. |
| (5) | See Note #3, Investment Adviser, for the waiver and expense reimbursement discussion. |
| (6) | Portfolio turnover of The Internet Portfolio. |
The accompanying notes are an integral part of these financial statements.
| KINETICS MUTUAL FUNDS, INC. — THE FEEDER FUNDS |
Financial Highlights — (Continued) |
| | | The Global Fund | |
| | | No Load Class | |
| | | For the Six Months Ended June 30, 2015 (Unaudited) | | | For the Year Ended December 31, 2014 | | | For the Year Ended December 31, 2013 | | | For the Year Ended December 31, 2012 | | | For the Year Ended December 31, 2011 | | | For the Year Ended December 31, 2010 | |
PER SHARE DATA:(1) | | | | | | | | | | | | | | | | | | |
| Net Asset Value, Beginning of Period | | $ | 5.33 | | | $ | 6.05 | | | $ | 4.71 | | | $ | 3.92 | | | $ | 4.67 | | | $ | 3.92 | |
| Income from Investment Operations: | | | | | | | | | | | | | | | | | | | | | | | | |
Net investment income (loss)(2) | | | (0.01 | ) | | | (0.02 | ) | | | 0.01 | | | | 0.03 | | | | 0.06 | | | | 0.02 | |
| Net realized and unrealized gain (loss) on investments | | | 0.16 | | | | (0.70 | ) | | | 1.34 | | | | 0.88 | | | | (0.78 | ) | | | 0.78 | |
| Total from investment operations | | | 0.15 | | | | (0.72 | ) | | | 1.35 | | | | 0.91 | | | | (0.72 | ) | | | 0.80 | |
Redemption Fees(3) | | | 0.00 | | | | 0.00 | | | | 0.00 | | | | 0.00 | | | | 0.00 | | | | 0.00 | |
| Less Distributions: | | | | | | | | | | | | | | | | | | | | | | | | |
| From net investment income | | | — | | | | — | | | | (0.01 | ) | | | (0.12 | ) | | | (0.03 | ) | | | (0.05 | ) |
| From net realized gains | | | — | | | | (0.00 | )(3) | | | — | | | | — | | | | — | | | | — | |
| Total distributions | | | — | | | | (0.00 | )(3) | | | (0.01 | ) | | | (0.12 | ) | | | (0.03 | ) | | | (0.05 | ) |
Net Asset Value, End of Period | | $ | 5.48 | | | $ | 5.33 | | | $ | 6.05 | | | $ | 4.71 | | | $ | 3.92 | | | $ | 4.67 | |
| Total return | | | 2.81 | %(4) | | | (11.89 | )% | | | 28.59 | % | | | 23.16 | % | | | (15.41 | )% | | | 20.30 | % |
| | | | | | | | | | | | | | | | | | | | | | | | | |
| SUPPLEMENTAL DATA AND RATIOS | | | | | | | | | | | | | | | | | | | | | | | | |
| Net assets, end of period (000’s) | | $ | 6,397 | | | $ | 6,771 | | | $ | 8,705 | | | $ | 5,069 | | | $ | 3,631 | | | $ | 4,541 | |
| Ratio of operating expenses to average net assets: | | | | | | | | | | | | | | | | | | | | | | | | |
| Before expense reimbursement | | | 2.77 | %(5) | | | 2.61 | % | | | 2.83 | % | | | 3.38 | % | | | 3.94 | % | | | 4.17 | % |
After expense reimbursement(6) | | | 1.39 | %(5) | | | 1.39 | % | | | 1.39 | % | | | 1.39 | % | | | 1.39 | % | | | 1.39 | % |
| Ratio of net investment income (loss) to average net assets: | | | | | | | | | | | | | | | | | | | | | | | | |
| Before expense reimbursement | | | (1.85 | )%(5) | | | (1.54 | )% | | | (1.22 | )% | | | (1.22 | )% | | | (1.11 | )% | | | (2.26 | )% |
After expense reimbursement(6) | | | (0.47 | )%(5) | | | (0.32 | )% | | | 0.22 | % | | | 0.77 | % | | | 1.44 | % | | | 0.52 | % |
Portfolio turnover rate(7) | | | 4 | % | | | 14 | % | | | 15 | % | | | 23 | % | | | 135 | % | | | 122 | % |
| (1) | Information presented relates to a share of capital stock outstanding for each period. |
| (2) | Net investment income per share represents net investment income divided by the average shares outstanding throughout the period. |
| (3) | Amount calculated is less than $0.005. |
| (4) | Not annualized. |
| (5) | Annualized. |
| (6) | See Note #3, Investment Adviser, for the waiver and expense reimbursement discussion. |
| (7) | Portfolio turnover of The Global Portfolio. |
The accompanying notes are an integral part of these financial statements.
| KINETICS MUTUAL FUNDS, INC. — THE FEEDER FUNDS |
Financial Highlights — (Continued) |
| | | The Global Fund | |
| | | Advisor Class A | |
| | | For the Six Months Ended June 30, 2015 (Unaudited) | | | For the Year Ended December 31, 2014 | | | For the Year Ended December 31, 2013 | | | For the Year Ended December 31, 2012 | | | For the Year Ended December 31, 2011 | | | For the Year Ended December 31, 2010 | |
PER SHARE DATA:(1) | | | | | | | | | | | | | | | | | | |
| Net Asset Value, Beginning of Period | | $ | 5.31 | | | $ | 6.03 | | | $ | 4.71 | | | $ | 3.92 | | | $ | 4.68 | | | $ | 3.93 | |
| Income from Investment Operations: | | | | | | | | | | | | | | | | | | | | | | | | |
Net investment income (loss)(2) | | | (0.02 | ) | | | (0.03 | ) | | | (0.00 | )(3) | | | 0.02 | | | | 0.05 | | | | 0.01 | |
| Net realized and unrealized gain (loss) on investments | | | 0.17 | | | | (0.70 | ) | | | 1.33 | | | | 0.88 | | | | (0.78 | ) | | | 0.78 | |
| Total from investment operations | | | 0.15 | | | | (0.73 | ) | | | 1.33 | | | | 0.90 | | | | (0.73 | ) | | | 0.79 | |
| Redemption Fees | | | — | | | | 0.01 | | | | 0.00 | (3) | | | 0.00 | (3) | | | 0.00 | (3) | | | 0.00 | (3) |
| Less Distributions: | | | | | | | | | | | | | | | | | | | | | | | | |
| From net investment income | | | — | | | | — | | | | (0.01 | ) | | | (0.11 | ) | | | (0.03 | ) | | | (0.04 | ) |
| From net realized gains | | | — | | | | (0.00 | )(3) | | | — | | | | — | | | | — | | | | — | |
| Total distributions | | | — | | | | (0.00 | )(3) | | | (0.01 | ) | | | (0.11 | ) | | | (0.03 | ) | | | (0.04 | ) |
Net Asset Value, End of Period | | $ | 5.46 | | | $ | 5.31 | | | $ | 6.03 | | | $ | 4.71 | | | $ | 3.92 | | | $ | 4.68 | |
Total return(4) | | | 2.82 | %(5) | | | (11.93 | )% | | | 28.16 | % | | | 22.94 | % | | | (15.59 | )% | | | 20.04 | % |
| | | | | | | | | | | | | | | | | | | | | | | | | |
| SUPPLEMENTAL DATA AND RATIOS | | | | | | | | | | | | | | | | | | | | | | | | |
| Net assets, end of period (000’s) | | $ | 502 | | | $ | 497 | | | $ | 1,992 | | | $ | 1,093 | | | $ | 392 | | | $ | 707 | |
| Ratio of operating expenses to average net assets: | | | | | | | | | | | | | | | | | | | | | | | | |
| Before expense reimbursement | | | 3.02 | %(6) | | | 2.86 | % | | | 3.08 | % | | | 3.63 | % | | | 4.19 | % | | | 4.42 | % |
After expense reimbursement(7) | | | 1.64 | %(6) | | | 1.64 | % | | | 1.64 | % | | | 1.64 | % | | | 1.64 | % | | | 1.64 | % |
| Ratio of net investment income (loss) to average net assets: | | | | | | | | | | | | | | | | | | | | | | | | |
| Before expense reimbursement | | | (2.10 | )%(6) | | | (1.79 | )% | | | (1.47 | )% | | | (1.47 | )% | | | (1.36 | )% | | | (2.51 | )% |
After expense reimbursement(7) | | | (0.72 | )%(6) | | | (0.57 | )% | | | (0.03 | )% | | | 0.52 | % | | | 1.19 | % | | | 0.27 | % |
Portfolio turnover rate(8) | | | 4 | % | | | 14 | % | | | 15 | % | | | 23 | % | | | 135 | % | | | 122 | % |
| (1) | Information presented relates to a share of capital stock outstanding for each period. |
| (2) | Net investment income per share represents net investment income divided by the average shares outstanding throughout the period. |
| (3) | Amount calculated is less than $0.005. |
| (4) | The total return calculation does not reflect the 5.75% front end sales charge on Advisor Class A shares. |
| (5) | Not annualized. |
| (6) | Annualized. |
| (7) | See Note #3, Investment Adviser, for the waiver and expense reimbursement discussion. |
| (8) | Portfolio turnover of The Global Portfolio. |
The accompanying notes are an integral part of these financial statements.
| KINETICS MUTUAL FUNDS, INC. — THE FEEDER FUNDS |
Financial Highlights — (Continued) |
| | | The Global Fund | |
| | | Advisor Class C | |
| | | For the Six Months Ended June 30, 2015 (Unaudited) | | | For the Year Ended December 31, 2014 | | | For the Year Ended December 31, 2013 | | | For the Year Ended December 31, 2012 | | | For the Year Ended December 31, 2011 | | | For the Year Ended December 31, 2010 | |
PER SHARE DATA:(1) | | | | | | | | | | | | | | | | | | |
| Net Asset Value, Beginning of Period | | $ | 5.16 | | | $ | 5.90 | | | $ | 4.62 | | | $ | 3.87 | | | $ | 4.64 | | | $ | 3.90 | |
| Income from Investment Operations: | | | | | | | | | | | | | | | | | | | | | | | | |
Net investment income (loss)(2) | | | (0.03 | ) | | | (0.06 | ) | | | (0.03 | ) | | | 0.00 | (3) | | | 0.03 | | | | (0.01 | ) |
| Net realized and unrealized gain (loss) on investments | | | 0.16 | | | | (0.68 | ) | | | 1.32 | | | | 0.85 | | | | (0.77 | ) | | | 0.77 | |
| Total from investment operations | | | 0.13 | | | | (0.74 | ) | | | 1.29 | | | | 0.85 | | | | (0.74 | ) | | | 0.76 | |
| Redemption Fees | | | — | | | | 0.00 | (3) | | | — | | | | — | | | | — | | | | — | |
| Less Distributions: | | | | | | | | | | | | | | | | | | | | | | | | |
| From net investment income | | | — | | | | — | | | | (0.01 | ) | | | (0.10 | ) | | | (0.03 | ) | | | (0.02 | ) |
| From net realized gains | | | — | | | | (0.00 | )(3) | | | — | | | | — | | | | — | | | | — | |
| Total distributions | | | — | | | | (0.00 | )(3) | | | (0.01 | ) | | | (0.10 | ) | | | (0.03 | ) | | | (0.02 | ) |
Net Asset Value, End of Period | | $ | 5.29 | | | $ | 5.16 | | | $ | 5.90 | | | $ | 4.62 | | | $ | 3.87 | | | $ | 4.64 | |
| Total return | | | 2.33 | %(4) | | | (12.53 | )% | | | 27.84 | % | | | 22.04 | % | | | (15.94 | )% | | | 19.24 | % |
| | | | | | | | | | | | | | | | | | | | | | | | | |
| SUPPLEMENTAL DATA AND RATIOS | | | | | | | | | | | | | | | | | | | | | | | | |
| Net assets, end of period (000’s) | | $ | 1,858 | | | $ | 1,608 | | | $ | 1,523 | | | $ | 383 | | | $ | 111 | | | $ | 64 | |
| Ratio of operating expenses to average net assets: | | | | | | | | | | | | | | | | | | | | | | | | |
| Before expense reimbursement | | | 3.52 | %(5) | | | 3.36 | % | | | 3.58 | % | | | 4.13 | % | | | 4.69 | % | | | 4.92 | % |
After expense reimbursement(6) | | | 2.14 | %(5) | | | 2.14 | % | | | 2.14 | % | | | 2.14 | % | | | 2.14 | % | | | 2.14 | % |
| Ratio of net investment income (loss) to average net assets: | | | | | | | | | | | | | | | | | | | | | | | | |
| Before expense reimbursement | | | (2.60 | )%(5) | | | (2.29 | )% | | | (1.97 | )% | | | (1.97 | )% | | | (1.86 | )% | | | (3.01 | )% |
After expense reimbursement(6) | | | (1.22 | )%(5) | | | (1.07 | )% | | | (0.53 | )% | | | 0.02 | % | | | 0.69 | % | | | (0.23 | )% |
Portfolio turnover rate(7) | | | 4 | % | | | 14 | % | | | 15 | % | | | 23 | % | | | 135 | % | | | 122 | % |
| (1) | Information presented relates to a share of capital stock outstanding for each period. |
| (2) | Net investment income per share represents net investment income divided by the average shares outstanding throughout the period. |
| (3) | Amount calculated is less than $0.005. |
| (4) | Not annualized. |
| (5) | Annualized. |
| (6) | See Note #3, Investment Adviser, for the waiver and expense reimbursement discussion. |
| (7) | Portfolio turnover of The Global Portfolio. |
The accompanying notes are an integral part of these financial statements.
| KINETICS MUTUAL FUNDS, INC. — THE FEEDER FUNDS |
Financial Highlights — (Continued) |
| | | The Paradigm Fund | |
| | | No Load Class | |
| | | For the Six Months Ended June 30, 2015 (Unaudited) | | | For the Year Ended December 31, 2014 | | | For the Year Ended December 31, 2013 | | | For the Year Ended December 31, 2012 | | | For the Year Ended December 31, 2011 | | | For the Year Ended December 31, 2010 | |
PER SHARE DATA:(1) | | | | | | | | | | | | | | | | | | |
| Net Asset Value, Beginning of Period | | $ | 34.08 | | | $ | 34.35 | | | $ | 23.99 | | | $ | 19.81 | | | $ | 23.31 | | | $ | 20.18 | |
| Income from Investment Operations: | | | | | | | | | | | | | | | | | | | | | | | | |
Net investment income (loss)(2) | | | (0.18 | ) | | | (0.36 | ) | | | (0.15 | ) | | | 0.05 | | | | 0.02 | | | | 0.11 | |
| Net realized and unrealized gain (loss) on investments | | | 1.28 | | | | 0.09 | | | | 10.72 | | | | 4.25 | | | | (3.34 | ) | | | 3.39 | |
| Total from investment operations | | | 1.10 | | | | (0.27 | ) | | | 10.57 | | | | 4.30 | | | | (3.32 | ) | | | 3.50 | |
Redemption Fees(3) | | | 0.00 | | | | 0.00 | | | | 0.00 | | | | 0.00 | | | | 0.00 | | | | 0.00 | |
| Less Distributions: | | | | | | | | | | | | | | | | | | | | | | | | |
| From net investment income | | | — | | | | — | | | | (0.21 | ) | | | (0.12 | ) | | | (0.18 | ) | | | (0.37 | ) |
| Total distributions | | | — | | | | — | | | | (0.21 | ) | | | (0.12 | ) | | | (0.18 | ) | | | (0.37 | ) |
Net Asset Value, End of Period | | $ | 35.18 | | | $ | 34.08 | | | $ | 34.35 | | | $ | 23.99 | | | $ | 19.81 | | | $ | 23.31 | |
| Total return | | | 3.23 | %(4) | | | (0.79 | )% | | | 44.07 | % | | | 21.78 | % | | | (14.27 | )% | | | 17.37 | % |
| | | | | | | | | | | | | | | | | | | | | | | | | |
| SUPPLEMENTAL DATA AND RATIOS | | | | | | | | | | | | | | | | | | | | | | | | |
| Net assets, end of period (000’s) | | $ | 425,265 | | | $ | 521,738 | | | $ | 597,746 | | | $ | 416,696 | | | $ | 430,528 | | | $ | 687,056 | |
| Ratio of operating expenses to average net assets: | | | | | | | | | | | | | | | | | | | | | | | | |
| Before expense reimbursement | | | 1.71 | %(5) | | | 1.68 | % | | | 1.72 | % | | | 1.78 | % | | | 1.78 | % | | | 1.76 | % |
After expense reimbursement(6) | | | 1.64 | %(5) | | | 1.64 | % | | | 1.64 | % | | | 1.64 | % | | | 1.64 | % | | | 1.64 | % |
| Ratio of net investment income (loss) to average net assets: | | | | | | | | | | | | | | | | | | | | | | | | |
| Before expense reimbursement | | | (1.11 | )%(5) | | | (1.06 | )% | | | (0.60 | )% | | | 0.08 | % | | | (0.03 | )% | | | 0.43 | % |
After expense reimbursement(6) | | | (1.04 | )%(5) | | | (1.02 | )% | | | (0.52 | )% | | | 0.22 | % | | | 0.11 | % | | | 0.55 | % |
Portfolio turnover rate(7) | | | 1 | % | | | 7 | % | | | 4 | % | | | 6 | % | | | 58 | % | | | 7 | % |
| (1) | Information presented relates to a share of capital stock outstanding for each period. |
| (2) | Net investment income per share represents net investment income divided by the average shares outstanding throughout the period. |
| (3) | Amount calculated is less than $0.005. |
| (4) | Not annualized. |
| (5) | Annualized. |
| (6) | See Note #3, Investment Adviser, for the waiver and expense reimbursement discussion. |
| (7) | Portfolio turnover of The Paradigm Portfolio. |
The accompanying notes are an integral part of these financial statements.
| KINETICS MUTUAL FUNDS, INC. — THE FEEDER FUNDS |
Financial Highlights — (Continued) |
| | | The Paradigm Fund | |
| | | Advisor Class A | |
| | | For the Six Months Ended June 30, 2015 (Unaudited) | | | For the Year Ended December 31, 2014 | | | For the Year Ended December 31, 2013 | | | For the Year Ended December 31, 2012 | | | For the Year Ended December 31, 2011 | | | For the Year Ended December 31, 2010 | |
PER SHARE DATA:(1) | | | | | | | | | | | | | | | | | | |
| Net Asset Value, Beginning of Period | | $ | 33.39 | | | $ | 33.74 | | | $ | 23.59 | | | $ | 19.45 | | | $ | 22.95 | | | $ | 19.88 | |
| Income from Investment Operations: | | | | | | | | | | | | | | | | | | | | | | | | |
Net investment income (loss)(2) | | | (0.22 | ) | | | (0.43 | ) | | | (0.22 | ) | | | (0.01 | ) | | | (0.03 | ) | | | 0.06 | |
| Net realized and unrealized gain (loss) on investments | | | 1.26 | | | | 0.08 | | | | 10.53 | | | | 4.18 | | | | (3.29 | ) | | | 3.33 | |
| Total from investment operations | | | 1.04 | | | | (0.35 | ) | | | 10.31 | | | | 4.17 | | | | (3.32 | ) | | | 3.39 | |
Redemption Fees(3) | | | 0.00 | | | | 0.00 | | | | 0.00 | | | | 0.00 | | | | 0.00 | | | | 0.00 | |
| Less Distributions: | | | | | | | | | | | | | | | | | | | | | | | | |
| From net investment income | | | — | | | | — | | | | (0.16 | ) | | | (0.03 | ) | | | (0.18 | ) | | | (0.32 | ) |
| Total distributions | | | — | | | | — | | | | (0.16 | ) | | | (0.03 | ) | | | (0.18 | ) | | | (0.32 | ) |
Net Asset Value, End of Period | | $ | 34.43 | | | $ | 33.39 | | | $ | 33.74 | | | $ | 23.59 | | | $ | 19.45 | | | $ | 22.95 | |
Total return(4) | | | 3.11 | %(5) | | | (1.04 | )% | | | 43.70 | % | | | 21.49 | % | | | (14.49 | )% | | | 17.11 | % |
| | | | | | | | | | | | | | | | | | | | | | | | | |
| SUPPLEMENTAL DATA AND RATIOS | | | | | | | | | | | | | | | | | | | | | | | | |
| Net assets, end of period (000’s) | | $ | 165,328 | | | $ | 171,958 | | | $ | 204,548 | | | $ | 135,747 | | | $ | 146,939 | | | $ | 226,264 | |
| Ratio of operating expenses to average net assets: | | | | | | | | | | | | | | | | | | | | | | | | |
| Before expense reimbursement | | | 1.96 | %(6) | | | 1.93 | % | | | 1.97 | % | | | 2.03 | % | | | 2.03 | % | | | 2.01 | % |
After expense reimbursement(7) | | | 1.89 | %(6) | | | 1.89 | % | | | 1.89 | % | | | 1.89 | % | | | 1.89 | % | | | 1.89 | % |
| Ratio of net investment income (loss) to average net assets: | | | | | | | | | | | | | | | | | | | | | | | | |
| Before expense reimbursement | | | (1.36 | )%(6) | | | (1.31 | )% | | | (0.85 | )% | | | (0.17 | )% | | | (0.28 | )% | | | 0.18 | % |
After expense reimbursement(7) | | | (1.29 | )%(6) | | | (1.27 | )% | | | (0.77 | )% | | | (0.03 | )% | | | (0.14 | )% | | | 0.30 | % |
Portfolio turnover rate(8) | | | 1 | % | | | 7 | % | | | 4 | % | | | 6 | % | | | 58 | % | | | 7 | % |
| (1) | Information presented relates to a share of capital stock outstanding for each period. |
| (2) | Net investment income per share represents net investment income divided by the average shares outstanding throughout the period. |
| (3) | Amount calculated is less than $0.005. |
| (4) | The total return calculation does not reflect the 5.75% front end sales charge on Advisor Class A shares. |
| (5) | Not annualized. |
| (6) | Annualized. |
| (7) | See Note #3, Investment Adviser, for the waiver and expense reimbursement discussion. |
| (8) | Portfolio turnover of The Paradigm Portfolio. |
The accompanying notes are an integral part of these financial statements.
| KINETICS MUTUAL FUNDS, INC. — THE FEEDER FUNDS |
Financial Highlights — (Continued) |
| | | The Paradigm Fund | |
| | | Advisor Class C | |
| | | For the Six Months Ended June 30, 2015 (Unaudited) | | | For the Year Ended December 31, 2014 | | | For the Year Ended December 31, 2013 | | | For the Year Ended December 31, 2012 | | | For the Year Ended December 31, 2011 | | | For the Year Ended December 31, 2010 | |
PER SHARE DATA:(1) | | | | | | | | | | | | | | | | | | |
| Net Asset Value, Beginning of Period | | $ | 31.88 | | | $ | 32.38 | | | $ | 22.66 | | | $ | 18.76 | | | $ | 22.25 | | | $ | 19.33 | |
| Income from Investment Operations: | | | | | | | | | | | | | | | | | | | | | | | | |
Net investment loss(2) | | | (0.29 | ) | | | (0.58 | ) | | | (0.35 | ) | | | (0.11 | ) | | | (0.14 | ) | | | (0.04 | ) |
| Net realized and unrealized gain (loss) on investments | | | 1.21 | | | | 0.08 | | | | 10.10 | | | | 4.01 | | | | (3.17 | ) | | | 3.22 | |
| Total from investment operations | | | 0.92 | | | | (0.50 | ) | | | 9.75 | | | | 3.90 | | | | (3.31 | ) | | | 3.18 | |
| Redemption Fees | | | — | | | | 0.00 | (3) | | | 0.00 | (3) | | | 0.00 | (3) | | | 0.00 | (3) | | | 0.00 | (3) |
| Less Distributions: | | | | | | | | | | | | | | | | | | | | | | | | |
| From net investment income | | | — | | | | — | | | | (0.03 | ) | | | — | | | | (0.18 | ) | | | (0.26 | ) |
| Total distributions | | | — | | | | — | | | | (0.03 | ) | | | — | | | | (0.18 | ) | | | (0.26 | ) |
Net Asset Value, End of Period | | $ | 32.80 | | | $ | 31.88 | | | $ | 32.38 | | | $ | 22.66 | | | $ | 18.76 | | | $ | 22.25 | |
| Total return | | | 2.89 | %(4) | | | (1.54 | )% | | | 43.01 | % | | | 20.85 | % | | | (14.90 | )% | | | 16.45 | % |
| | | | | | | | | | | | | | | | | | | | | | | | | |
| SUPPLEMENTAL DATA AND RATIOS | | | | | | | | | | | | | | | | | | | | | | | | |
| Net assets, end of period (000’s) | | $ | 136,877 | | | $ | 135,333 | | | $ | 138,355 | | | $ | 101,405 | | | $ | 102,534 | | | $ | 152,571 | |
| Ratio of operating expenses to average net assets: | | | | | | | | | | | | | | | | | | | | | | | | |
| Before expense reimbursement | | | 2.46 | %(5) | | | 2.43 | % | | | 2.47 | % | | | 2.53 | % | | | 2.53 | % | | | 2.51 | % |
After expense reimbursement(6) | | | 2.39 | %(5) | | | 2.39 | % | | | 2.39 | % | | | 2.39 | % | | | 2.39 | % | | | 2.39 | % |
| Ratio of net investment income (loss) to average net assets: | | | | | | | | | | | | | | | | | | | | | | | | |
| Before expense reimbursement | | | (1.86 | )%(5) | | | (1.81 | )% | | | (1.35 | )% | | | (0.67 | )% | | | (0.78 | )% | | | (0.32 | )% |
After expense reimbursement(6) | | | (1.79 | )%(5) | | | (1.77 | )% | | | (1.27 | )% | | | (0.53 | )% | | | (0.64 | )% | | | (0.20 | )% |
Portfolio turnover rate(7) | | | 1 | % | | | 7 | % | | | 4 | % | | | 6 | % | | | 58 | % | | | 7 | % |
| (1) | Information presented relates to a share of capital stock outstanding for each period. |
| (2) | Net investment income per share represents net investment income divided by the average shares outstanding throughout the period. |
| (3) | Amount calculated is less than $0.005. |
| (4) | Not annualized. |
| (5) | Annualized. |
| (6) | See Note #3, Investment Adviser, for the waiver and expense reimbursement discussion. |
| (7) | Portfolio turnover of The Paradigm Portfolio. |
The accompanying notes are an integral part of these financial statements.
| KINETICS MUTUAL FUNDS, INC. — THE FEEDER FUNDS |
Financial Highlights — (Continued) |
| | | The Paradigm Fund | |
| | | Institutional Class | |
| | | For the Six Months Ended June 30, 2015 (Unaudited) | | | For the Year Ended December 31, 2014 | | | For the Year Ended December 31, 2013 | | | For the Year Ended December 31, 2012 | | | For the Year Ended December 31, 2011 | | | For the Year Ended December 31, 2010 | |
PER SHARE DATA:(1) | | | | | | | | | | | | | | | | | | |
| Net Asset Value, Beginning of Period | | $ | 34.08 | | | $ | 34.28 | | | $ | 23.93 | | | $ | 19.79 | | | $ | 23.25 | | | $ | 20.13 | |
| Income from Investment Operations: | | | | | | | | | | | | | | | | | | | | | | | | |
Net investment income (loss)(2) | | | (0.15 | ) | | | (0.29 | ) | | | (0.09 | ) | | | 0.10 | | | | 0.07 | | | | 0.16 | |
| Net realized and unrealized gain (loss) on investments | | | 1.29 | | | | 0.09 | | | | 10.70 | | | | 4.24 | | | | (3.35 | ) | | | 3.38 | |
| Total from investment operations | | | 1.14 | | | | (0.20 | ) | | | 10.61 | | | | 4.34 | | | | (3.28 | ) | | | 3.54 | |
Redemption Fees(3) | | | 0.00 | | | | 0.00 | | | | 0.00 | | | | 0.00 | | | | 0.00 | | | | 0.00 | |
| Less Distributions: | | | | | | | | | | | | | | | | | | | | | | | | |
| From net investment income | | | — | | | | — | | | | (0.26 | ) | | | (0.20 | ) | | | (0.18 | ) | | | (0.42 | ) |
| Total distributions | | | — | | | | — | | | | (0.26 | ) | | | (0.20 | ) | | | (0.18 | ) | | | (0.42 | ) |
Net Asset Value, End of Period | | $ | 35.22 | | | $ | 34.08 | | | $ | 34.28 | | | $ | 23.93 | | | $ | 19.79 | | | $ | 23.25 | |
| Total return | | | 3.37 | %(4) | | | (0.61 | )% | | | 44.40 | % | | | 21.99 | % | | | (14.13 | )% | | | 17.62 | % |
| | | | | | | | | | | | | | | | | | | | | | | | | |
| SUPPLEMENTAL DATA AND RATIOS | | | | | | | | | | | | | | | | | | | | | | | | |
| Net assets, end of period (000’s) | | $ | 347,624 | | | $ | 346,273 | | | $ | 333,682 | | | $ | 192,478 | | | $ | 134,309 | | | $ | 142,261 | |
| Ratio of operating expenses to average net assets: | | | | | | | | | | | | | | | | | | | | | | | | |
| Before expense reimbursement | | | 1.66 | %(5) | | | 1.63 | % | | | 1.67 | % | | | 1.73 | % | | | 1.73 | % | | | 1.71 | % |
After expense reimbursement(6) | | | 1.44 | %(5) | | | 1.44 | % | | | 1.44 | % | | | 1.44 | % | | | 1.44 | % | | | 1.44 | % |
| Ratio of net investment income (loss) to average net assets: | | | | | | | | | | | | | | | | | | | | | | | | |
| Before expense reimbursement | | | (1.06 | )%(5) | | | (1.01 | )% | | | (0.55 | )% | | | 0.13 | % | | | 0.02 | % | | | 0.48 | % |
After expense reimbursement(6) | | | (0.84 | )%(5) | | | (0.82 | )% | | | (0.32 | )% | | | 0.42 | % | | | 0.31 | % | | | 0.75 | % |
Portfolio turnover rate(7) | | | 1 | % | | | 7 | % | | | 4 | % | | | 6 | % | | | 58 | % | | | 7 | % |
| (1) | Information presented relates to a share of capital stock outstanding for each period. |
| (2) | Net investment income per share represents net investment income divided by the average shares outstanding throughout the period. |
| (3) | Amount calculated is less than $0.005. |
| (4) | Not annualized. |
| (5) | Annualized. |
| (6) | See Note #3, Investment Adviser, for the waiver and expense reimbursement discussion. |
| (7) | Portfolio turnover of The Paradigm Portfolio. |
The accompanying notes are an integral part of these financial statements.
| KINETICS MUTUAL FUNDS, INC. — THE FEEDER FUNDS |
Financial Highlights — (Continued) |
| | | The Medical Fund | |
| | | No Load Class | |
| | | For the Six Months Ended June 30, 2015 (Unaudited) | | | For the Year Ended December 31, 2014 | | | For the Year Ended December 31, 2013 | | | For the Year Ended December 31, 2012 | | | For the Year Ended December 31, 2011 | | | For the Year Ended December 31, 2010 | |
PER SHARE DATA:(1) | | | | | | | | | | | | | | | | | | |
| Net Asset Value, Beginning of Period | | $ | 30.67 | | | $ | 26.38 | | | $ | 17.82 | | | $ | 18.75 | | | $ | 19.48 | | | $ | 18.77 | |
| Income from Investment Operations: | | | | | | | | | | | | | | | | | | | | | | | | |
Net investment income (loss)(2) | | | 0.10 | | | | 0.13 | | | | (0.00 | )(3) | | | 0.33 | | | | 0.18 | | | | 0.10 | |
| Net realized and unrealized gain on investments | | | 3.44 | | | | 4.21 | | | | 8.77 | | | | 1.32 | | | | 0.82 | | | | 0.72 | |
| Total from investment operations | | | 3.54 | | | | 4.34 | | | | 8.77 | | | | 1.65 | | | | 1.00 | | | | 0.82 | |
Redemption Fees(3) | | | 0.00 | | | | 0.00 | | | | 0.00 | | | | 0.00 | | | | 0.00 | | | | 0.00 | |
| Less Distributions: | | | | | | | | | | | | | | | | | | | | | | | | |
| From net investment income | | | — | | | | — | | | | (0.06 | ) | | | (0.36 | ) | | | (0.25 | ) | | | (0.11 | ) |
| From net realized gains | | | — | | | | (0.05 | ) | | | (0.15 | ) | | | (2.22 | ) | | | (1.48 | ) | | | — | |
| Total distributions | | | — | | | | (0.05 | ) | | | (0.21 | ) | | | (2.58 | ) | | | (1.73 | ) | | | (0.11 | ) |
Net Asset Value, End of Period | | $ | 34.21 | | | $ | 30.67 | | | $ | 26.38 | | | $ | 17.82 | | | $ | 18.75 | | | $ | 19.48 | |
| Total return | | | 11.54 | %(4) | | | 16.44 | % | | | 49.25 | % | | | 8.86 | % | | | 5.11 | % | | | 4.30 | % |
| | | | | | | | | | | | | | | | | | | | | | | | | |
| SUPPLEMENTAL DATA AND RATIOS | | | | | | | | | | | | | | | | | | | | | | | | |
| Net assets, end of period (000’s) | | $ | 24,168 | | | $ | 21,876 | | | $ | 20,489 | | | $ | 14,254 | | | $ | 16,376 | | | $ | 25,777 | |
| Ratio of operating expenses to average net assets: | | | | | | | | | | | | | | | | | | | | | | | | |
| Before expense reimbursement | | | 1.98 | %(5) | | | 2.02 | % | | | 2.09 | % | | | 2.22 | % | | | 2.02 | % | | | 2.00 | % |
After expense reimbursement(6) | | | 1.39 | %(5) | | | 1.39 | % | | | 1.39 | % | | | 1.39 | % | | | 1.39 | % | | | 1.39 | % |
| Ratio of net investment income (loss) to average net assets: | | | | | | | | | | | | | | | | | | | | | | | | |
| Before expense reimbursement | | | (0.02 | )%(5) | | | (0.17 | )% | | | (0.70 | )% | | | 0.83 | % | | | 0.24 | % | | | (0.06 | )% |
After expense reimbursement(6) | | | 0.57 | %(5) | | | 0.46 | % | | | 0.00 | % | | | 1.66 | % | | | 0.87 | % | | | 0.55 | % |
Portfolio turnover rate(7) | | | 7 | % | | | 3 | % | | | 12 | % | | | 0 | % | | | 5 | % | | | 3 | % |
| (1) | Information presented relates to a share of capital stock outstanding for each period. |
| (2) | Net investment income per share represents net investment income divided by the average shares outstanding throughout the period. |
| (3) | Amount calculated is less than $0.005. |
| (4) | Not annualized. |
| (5) | Annualized. |
| (6) | See Note #3, Investment Adviser, for the waiver and expense reimbursement discussion. |
| (7) | Portfolio turnover of The Medical Portfolio. |
The accompanying notes are an integral part of these financial statements.
| KINETICS MUTUAL FUNDS, INC. — THE FEEDER FUNDS |
Financial Highlights — (Continued) |
| | | The Medical Fund | |
| | | Advisor Class A | |
| | | For the Six Months Ended June 30, 2015 (Unaudited) | | | For the Year Ended December 31, 2014 | | | For the Year Ended December 31, 2013 | | | For the Year Ended December 31, 2012 | | | For the Year Ended December 31, 2011 | | | For the Year Ended December 31, 2010 | |
PER SHARE DATA:(1) | | | | | | | | | | | | | | | | | | |
| Net Asset Value, Beginning of Period | | $ | 29.71 | | | $ | 25.62 | | | $ | 17.33 | | | $ | 18.29 | | | $ | 19.06 | | | $ | 18.36 | |
| Income from Investment Operations: | | | | | | | | | | | | | | | | | | �� | | | | | | |
Net investment income (loss)(2) | | | 0.05 | | | | 0.06 | | | | (0.06 | ) | | | 0.27 | | | | 0.12 | | | | 0.05 | |
| Net realized and unrealized gain on investments | | | 3.34 | | | | 4.08 | | | | 8.52 | | | | 1.29 | | | | 0.80 | | | | 0.71 | |
| Total from investment operations | | | 3.39 | | | | 4.14 | | | | 8.46 | | | | 1.56 | | | | 0.92 | | | | 0.76 | |
| Redemption Fees | | | 0.00 | (3) | | | 0.00 | (3) | | | 0.01 | | | | 0.00 | (3) | | | 0.00 | (3) | | | 0.00 | (3) |
| Less Distributions: | | | | | | | | | | | | | | | | | | | | | | | | |
| From net investment income | | | — | | | | — | | | | (0.03 | ) | | | (0.30 | ) | | | (0.21 | ) | | | (0.06 | ) |
| From net realized gains | | | — | | | | (0.05 | ) | | | (0.15 | ) | | | (2.22 | ) | | | (1.48 | ) | | | — | |
| Total distributions | | | — | | | | (0.05 | ) | | | (0.18 | ) | | | (2.52 | ) | | | (1.69 | ) | | | (0.06 | ) |
Net Asset Value, End of Period | | $ | 33.10 | | | $ | 29.71 | | | $ | 25.62 | | | $ | 17.33 | | | $ | 18.29 | | | $ | 19.06 | |
Total return(4) | | | 11.41 | %(5) | | | 16.15 | % | | | 48.90 | % | | | 8.60 | % | | | 4.79 | % | | | 4.13 | % |
| | | | | | | | | | | | | | | | | | | | | | | | | |
| SUPPLEMENTAL DATA AND RATIOS | | | | | | | | | | | | | | | | | | | | | | | | |
| Net assets, end of period (000’s) | | $ | 5,034 | | | $ | 4,578 | | | $ | 3,746 | | | $ | 2,583 | | | $ | 3,240 | | | $ | 4,207 | |
| Ratio of operating expenses to average net assets: | | | | | | | | | | | | | | | | | | | | | | | | |
| Before expense reimbursement | | | 2.23 | %(6) | | | 2.27 | % | | | 2.34 | % | | | 2.47 | % | | | 2.27 | % | | | 2.25 | % |
After expense reimbursement(7) | | | 1.64 | %(6) | | | 1.64 | % | | | 1.64 | % | | | 1.64 | % | | | 1.64 | % | | | 1.64 | % |
| Ratio of net investment income (loss) to average net assets: | | | | | | | | | | | | | | | | | | | | | | | | |
| Before expense reimbursement | | | (0.27 | )%(6) | | | (0.42 | )% | | | (0.95 | )% | | | 0.58 | % | | | (0.01 | )% | | | (0.31 | )% |
After expense reimbursement(7) | | | 0.32 | %(6) | | | 0.21 | % | | | (0.25 | )% | | | 1.41 | % | | | 0.62 | % | | | 0.30 | % |
Portfolio turnover rate(8) | | | 7 | % | | | 3 | % | | | 12 | % | | | 0 | % | | | 5 | % | | | 3 | % |
| (1) | Information presented relates to a share of capital stock outstanding for each period. |
| (2) | Net investment income per share represents net investment income divided by the average shares outstanding throughout the period. |
| (3) | Amount calculated is less than $0.005. |
| (4) | The total return calculation does not reflect the 5.75% front end sales charge on Advisor Class A shares. |
| (5) | Not annualized. |
| (6) | Annualized. |
| (7) | See Note #3, Investment Adviser, for the waiver and expense reimbursement discussion. |
| (8) | Portfolio turnover of The Medical Portfolio. |
The accompanying notes are an integral part of these financial statements.
| KINETICS MUTUAL FUNDS, INC. — THE FEEDER FUNDS |
Financial Highlights — (Continued) |
| | | The Medical Fund | |
| | | Advisor Class C | |
| | | For the Six Months Ended June 30, 2015 (Unaudited) | | | For the Year Ended December 31, 2014 | | | For the Year Ended December 31, 2013 | | | For the Year Ended December 31, 2012 | | | For the Year Ended December 31, 2011 | | | For the Year Ended December 31, 2010 | |
PER SHARE DATA:(1) | | | | | | | | | | | | | | | | | | |
| Net Asset Value, Beginning of Period | | $ | 29.15 | | | $ | 25.27 | | | $ | 17.19 | | | $ | 18.15 | | | $ | 18.90 | | | $ | 18.27 | |
| Income from Investment Operations: | | | | | | | | | | | | | | | | | | | | | | | | |
Net investment income (loss)(2) | | | (0.03 | ) | | | (0.08 | ) | | | (0.16 | ) | | | 0.17 | | | | 0.02 | | | | (0.04 | ) |
| Net realized and unrealized gain on investments | | | 3.28 | | | | 4.01 | | | | 8.42 | | | | 1.29 | | | | 0.80 | | | | 0.69 | |
| Total from investment operations | | | 3.25 | | | | 3.93 | | | | 8.26 | | | | 1.46 | | | | 0.82 | | | | 0.65 | |
| Redemption Fees | | | — | | | | — | | | | — | | | | — | | | | 0.00 | (3) | | | — | |
| Less Distributions: | | | | | | | | | | | | | | | | | | | | | | | | |
| From net investment income | | | — | | | | — | | | | (0.03 | ) | | | (0.20 | ) | | | (0.09 | ) | | | (0.02 | ) |
| From net realized gains | | | — | | | | (0.05 | ) | | | (0.15 | ) | | | (2.22 | ) | | | (1.48 | ) | | | — | |
| Total distributions | | | — | | | | (0.05 | ) | | | (0.18 | ) | | | (2.42 | ) | | | (1.57 | ) | | | (0.02 | ) |
Net Asset Value, End of Period | | $ | 32.40 | | | $ | 29.15 | | | $ | 25.27 | | | $ | 17.19 | | | $ | 18.15 | | | $ | 18.90 | |
| Total return | | | 11.15 | %(4) | | | 15.54 | % | | | 48.08 | % | | | 8.08 | % | | | 4.32 | % | | | 3.55 | % |
| | | | | | | | | | | | | | | | | | | | | | | | | |
| SUPPLEMENTAL DATA AND RATIOS | | | | | | | | | | | | | | | | | | | | | | | | |
| Net assets, end of period (000’s) | | $ | 675 | | | $ | 631 | | | $ | 531 | | | $ | 450 | | | $ | 580 | | | $ | 692 | |
| Ratio of operating expenses to average net assets: | | | | | | | | | | | | | | | | | | | | | | | | |
| Before expense reimbursement | | | 2.73 | %(5) | | | 2.77 | % | | | 2.84 | % | | | 2.97 | % | | | 2.77 | % | | | 2.75 | % |
After expense reimbursement(6) | | | 2.14 | %(5) | | | 2.14 | % | | | 2.14 | % | | | 2.14 | % | | | 2.14 | % | | | 2.14 | % |
| Ratio of net investment income (loss) to average net assets: | | | | | | | | | | | | | | | | | | | | | | | | |
| Before expense reimbursement | | | (0.77 | )%(5) | | | (0.92 | )% | | | (1.45 | )% | | | 0.08 | % | | | (0.51 | )% | | | (0.81 | )% |
After expense reimbursement(6) | | | (0.18 | )%(5) | | | (0.29 | )% | | | (0.75 | )% | | | 0.91 | % | | | 0.12 | % | | | (0.20 | )% |
Portfolio turnover rate(7) | | | 7 | % | | | 3 | % | | | 12 | % | | | 0 | % | | | 5 | % | | | 3 | % |
| (1) | Information presented relates to a share of capital stock outstanding for each period. |
| (2) | Net investment income per share represents net investment income divided by the average shares outstanding throughout the period. |
| (3) | Amount calculated is less than $0.005. |
| (4) | Not annualized. |
| (5) | Annualized. |
| (6) | See Note #3, Investment Adviser, for the waiver and expense reimbursement discussion. |
| (7) | Portfolio turnover of The Medical Portfolio. |
The accompanying notes are an integral part of these financial statements.
| KINETICS MUTUAL FUNDS, INC. — THE FEEDER FUNDS |
Financial Highlights — (Continued) |
| | | The Small Cap Opportunities Fund | |
| | | No Load Class | |
| | | For the Six Months Ended June 30, 2015 (Unaudited) | | | For the Year Ended December 31, 2014 | | | For the Year Ended December 31, 2013 | | | For the Year Ended December 31, 2012 | | | For the Year Ended December 31, 2011 | | | For the Year Ended December 31, 2010 | |
PER SHARE DATA:(1) | | | | | | | | | | | | | | | | | | |
| Net Asset Value, Beginning of Period | | $ | 37.21 | | | $ | 40.12 | | | $ | 25.17 | | | $ | 19.85 | | | $ | 23.32 | | | $ | 20.83 | |
| Income from Investment Operations: | | | | | | | | | | | | | | | | | | | | | | | | |
Net investment income (loss)(2) | | | (0.18 | ) | | | (0.36 | ) | | | (0.10 | ) | | | 0.01 | | | | (0.04 | ) | | | (0.04 | ) |
| Net realized and unrealized gain (loss) on investments | | | 1.99 | | | | (2.56 | ) | | | 15.05 | | | | 5.31 | | | | (3.15 | ) | | | 2.93 | |
| Total from investment operations | | | 1.81 | | | | (2.92 | ) | | | 14.95 | | | | 5.32 | | | | (3.19 | ) | | | 2.89 | |
| Redemption Fees | | | 0.00 | (3) | | | 0.01 | | | | 0.00 | (3) | | | 0.00 | (3) | | | 0.00 | (3) | | | 0.00 | (3) |
| Less Distributions: | | | | | | | | | | | | | | | | | | | | | | | | |
| From net investment income | | | — | | | | — | | | | — | | | | — | | | | (0.28 | ) | | | (0.40 | ) |
| Total distributions | | | — | | | | — | | | | — | | | | — | | | | (0.28 | ) | | | (0.40 | ) |
Net Asset Value, End of Period | | $ | 39.02 | | | $ | 37.21 | | | $ | 40.12 | | | $ | 25.17 | | | $ | 19.85 | | | $ | 23.32 | |
| Total return | | | 4.89 | %(4) | | | (7.28 | )% | | | 59.40 | % | | | 26.74 | % | | | (13.65 | )% | | | 13.86 | % |
| | | | | | | | | | | | | | | | | | | | | | | | | |
| SUPPLEMENTAL DATA AND RATIOS | | | | | | | | | | | | | | | | | | | | | | | | |
| Net assets, end of period (000’s) | | $ | 213,262 | | | $ | 251,110 | | | $ | 277,816 | | | $ | 63,947 | | | $ | 67,798 | | | $ | 130,279 | |
| Ratio of operating expenses to average net assets: | | | | | | | | | | | | | | | | | | | | | | | | |
| Before expense reimbursement | | | 1.73 | %(5) | | | 1.71 | % | | | 1.73 | % | | | 1.96 | % | | | 1.90 | % | | | 1.86 | % |
After expense reimbursement(6) | | | 1.64 | %(5) | | | 1.64 | % | | | 1.64 | % | | | 1.64 | % | | | 1.64 | % | | | 1.64 | % |
Ratio of net investment income (loss) to average net assets: | | | | | | | | | | | | | | | | | | | | | | | | |
| Before expense reimbursement | | | (1.01 | )%(5) | | | (0.96 | )% | | | (0.38 | )% | | | (0.25 | )% | | | (0.44 | )% | | | (0.42 | )% |
After expense reimbursement(6) | | | (0.92 | )%(5) | | | (0.89 | )% | | | (0.29 | )% | | | 0.07 | % | | | (0.18 | )% | | | (0.20 | )% |
Portfolio turnover rate(7) | | | 1 | % | | | 19 | % | | | 6 | % | | | 22 | % | | | 47 | % | | | 4 | % |
| (1) | Information presented relates to a share of capital stock outstanding for each period. |
| (2) | Net investment income per share represents net investment income divided by the average shares outstanding throughout the period. |
| (3) | Amount calculated is less than $0.005. |
| (4) | Not annualized. |
| (5) | Annualized. |
| (6) | See Note #3, Investment Adviser, for the waiver and expense reimbursement discussion. |
| (7) | Portfolio turnover of The Small Cap Opportunities Portfolio. |
The accompanying notes are an integral part of these financial statements.
| KINETICS MUTUAL FUNDS, INC. — THE FEEDER FUNDS |
Financial Highlights — (Continued) |
| | | The Small Cap Opportunities Fund | |
| | | Advisor Class A | |
| | | For the Six Months Ended June 30, 2015(Unaudited) | | | For the Year Ended December 31, 2014 | | | For the Year Ended December 31, 2013 | | | For the Year Ended December 31, 2012 | | | For the Year Ended December 31, 2011 | | | For the Year Ended December 31, 2010 | |
PER SHARE DATA:(1) | | | | | | | | | | | | | | | | | | |
| Net Asset Value, Beginning of Period | | $ | 36.43 | | | $ | 39.39 | | | $ | 24.77 | | | $ | 19.59 | | | $ | 22.98 | | | $ | 20.53 | |
| Income from Investment Operations: | | | | | | | | | | | | | | | | | | | | | | | | |
Net investment loss(2) | | | (0.22 | ) | | | (0.45 | ) | | | (0.18 | ) | | | (0.04 | ) | | | (0.10 | ) | | | (0.09 | ) |
| Net realized and unrealized gain (loss) on investments | | | 1.95 | | | | (2.51 | ) | | | 14.79 | | | | 5.22 | | | | (3.08 | ) | | | 2.87 | |
| Total from investment operations | | | 1.73 | | | | (2.96 | ) | | | 14.61 | | | | 5.18 | | | | (3.18 | ) | | | 2.78 | |
| Redemption Fees | | | 0.00 | (3) | | | 0.00 | (3) | | | 0.01 | | | | 0.00 | (3) | | | 0.00 | (3) | | | 0.00 | (3) |
| Less Distributions: | | | | | | | | | | | | | | | | | | | | | | | | |
| From net investment income | | | — | | | | — | | | | — | | | | — | | | | (0.21 | ) | | | (0.33 | ) |
| Total distributions | | | — | | | | — | | | | — | | | | — | | | | (0.21 | ) | | | (0.33 | ) |
Net Asset Value, End of Period | | $ | 38.16 | | | $ | 36.43 | | | $ | 39.39 | | | $ | 24.77 | | | $ | 19.59 | | | $ | 22.98 | |
Total return(4) | | | 4.78 | %(5) | | | (7.54 | )% | | | 59.02 | % | | | 26.44 | % | | | (13.85 | )% | | | 13.56 | % |
| | | | | | | | | | | | | | | | | | | | | | | | | |
| SUPPLEMENTAL DATA AND RATIOS | | | | | | | | | | | | | | | | | | | | | | | | |
| Net assets, end of period (000’s) | | $ | 21,349 | | | $ | 25,591 | | | $ | 21,871 | | | $ | 7,558 | | | $ | 7,250 | | | $ | 11,509 | |
| Ratio of operating expenses to average net assets: | | | | | | | | | | | | | | | | | | | | | | | | |
| Before expense reimbursement | | | 1.98 | %(6) | | | 1.96 | % | | | 1.98 | % | | | 2.21 | % | | | 2.15 | % | | | 2.11 | % |
After expense reimbursement(7) | | | 1.89 | %(6) | | | 1.89 | % | | | 1.89 | % | | | 1.89 | % | | | 1.89 | % | | | 1.89 | % |
| Ratio of net investment loss to average net assets: | | | | | | | | | | | | | | | | | | | | | | | | |
| Before expense reimbursement | | | (1.26 | )%(6) | | | (1.21 | )% | | | (0.63 | )% | | | (0.50 | )% | | | (0.69 | )% | | | (0.67 | )% |
After expense reimbursement(7) | | | (1.17 | )%(6) | | | (1.14 | )% | | | (0.54 | )% | | | (0.18 | )% | | | (0.43 | )% | | | (0.45 | )% |
Portfolio turnover rate(8) | | | 1 | % | | | 19 | % | | | 6 | % | | | 22 | % | | | 47 | % | | | 4 | % |
| (1) | Information presented relates to a share of capital stock outstanding for each period. |
| (2) | Net investment income per share represents net investment income divided by the average shares outstanding throughout the period. |
| (3) | Amount calculated is less than $0.005. |
| (4) | The total return calculation does not reflect the 5.75% front end sales charge on Advisor Class A shares. |
| (5) | Not annualized. |
| (6) | Annualized. |
| (7) | See Note #3, Investment Adviser, for the waiver and expense reimbursement discussion. |
| (8) | Portfolio turnover of The Small Cap Opportunities Portfolio. |
The accompanying notes are an integral part of these financial statements.
| KINETICS MUTUAL FUNDS, INC. — THE FEEDER FUNDS |
Financial Highlights — (Continued) |
| | | The Small Cap Opportunities Fund | |
| | | Advisor Class C | |
| | | For the Six Months Ended June 30, 2015 (Unaudited) | | | For the Year Ended December 31, 2014 | | | For the Year Ended December 31, 2013 | | | For the Year Ended December 31, 2012 | | | For the Year Ended December 31, 2011 | | | For the Year Ended December 31, 2010 | |
PER SHARE DATA:(1) | | | | | | | | | | | | | | | | | | |
| Net Asset Value, Beginning of Period | | $ | 35.47 | | | $ | 38.53 | | | $ | 24.35 | | | $ | 19.36 | | | $ | 22.68 | | | $ | 20.28 | |
| Income from Investment Operations: | | | | | | | | | | | | | | | | | | | | | | | | |
Net investment loss(2) | | | (0.30 | ) | | | (0.63 | ) | | | (0.34 | ) | | | (0.15 | ) | | | (0.20 | ) | | | (0.20 | ) |
| Net realized and unrealized gain (loss) on investments | | | 1.89 | | | | (2.44 | ) | | | 14.51 | | | | 5.14 | | | | (3.04 | ) | | | 2.84 | |
| Total from investment operations | | | 1.59 | | | | (3.07 | ) | | | 14.17 | | | | 4.99 | | | | (3.24 | ) | | | 2.64 | |
| Redemption Fees | | | — | | | | 0.01 | | | | 0.01 | | | | — | | | | — | | | | — | |
| Less Distributions: | | | | | | | | | | | | | | | | | | | | | | | | |
| From net investment income | | | — | | | | — | | | | — | | | | — | | | | (0.08 | ) | | | (0.24 | ) |
| Total distributions | | | — | | | | — | | | | — | | | | — | | | | (0.08 | ) | | | (0.24 | ) |
Net Asset Value, End of Period | | $ | 37.06 | | | $ | 35.47 | | | $ | 38.53 | | | $ | 24.35 | | | $ | 19.36 | | | $ | 22.68 | |
| Total return | | | 4.51 | %(3) | | | (7.97 | )% | | | 58.23 | % | | | 25.77 | % | | | (14.29 | )% | | | 13.00 | % |
| | | | | | | | | | | | | | | | | | | | | | | | | |
| SUPPLEMENTAL DATA AND RATIOS | | | | | | | | | | | | | | | | | | | | | | | | |
| Net assets, end of period (000’s) | | $ | 12,872 | | | $ | 12,928 | | | $ | 7,178 | | | $ | 2,536 | | | $ | 2,440 | | | $ | 3,450 | |
| Ratio of operating expenses to average net assets: | | | | | | | | | | | | | | | | | | | | | | | | |
| Before expense reimbursement | | | 2.48 | %(4) | | | 2.46 | % | | | 2.48 | % | | | 2.71 | % | | | 2.65 | % | | | 2.61 | % |
After expense reimbursement(5) | | | 2.39 | %(4) | | | 2.39 | % | | | 2.39 | % | | | 2.39 | % | | | 2.39 | % | | | 2.39 | % |
| Ratio of net investment loss to average net assets: | | | | | | | | | | | | | | | | | | | | | | | | |
| Before expense reimbursement | | | (1.76 | )%(4) | | | (1.71 | )% | | | (1.13 | )% | | | (1.00 | )% | | | (1.19 | )% | | | (1.17 | )% |
After expense reimbursement(5) | | | (1.67 | )%(4) | | | (1.64 | )% | | | (1.04 | )% | | | (0.68 | )% | | | (0.93 | )% | | | (0.95 | )% |
Portfolio turnover rate(6) | | | 1 | % | | | 19 | % | | | 6 | % | | | 22 | % | | | 47 | % | | | 4 | % |
| (1) | Information presented relates to a share of capital stock outstanding for each period. |
| (2) | Net investment income per share represents net investment income divided by the average shares outstanding throughout the period. |
| (3) | Not annualized. |
| (4) | Annualized. |
| (5) | See Note #3, Investment Adviser, for the waiver and expense reimbursement discussion. |
| (6) | Portfolio turnover of The Small Cap Opportunities Portfolio. |
The accompanying notes are an integral part of these financial statements.
| KINETICS MUTUAL FUNDS, INC. — THE FEEDER FUNDS |
Financial Highlights — (Continued) |
| | | The Small Cap Opportunities Fund | |
| | | Institutional Class | |
| | | For the Six Months Ended June 30, 2015 (Unaudited) | | | For the Year Ended December 31, 2014 | | | For the Year Ended December 31, 2013 | | | For the Year Ended December 31, 2012 | | | For the Year Ended December 31, 2011 | | | For the Year Ended December 31, 2010 | |
PER SHARE DATA:(1) | | | | | | | | | | | | | | | | | | |
| Net Asset Value, Beginning of Period | | $ | 37.57 | | | $ | 40.44 | | | $ | 25.32 | | | $ | 19.93 | | | $ | 23.45 | | | $ | 20.90 | |
| Income from Investment Operations: | | | | | | | | | | | | | | | | | | | | | | | | |
Net investment income (loss)(2) | | | (0.14 | ) | | | (0.28 | ) | | | (0.03 | ) | | | 0.06 | | | | 0.00 | (3) | | | 0.00 | (3) |
| Net realized and unrealized gain (loss) on investments | | | 2.01 | | | | (2.59 | ) | | | 15.15 | | | | 5.33 | | | | (3.17 | ) | | | 2.95 | |
| Total from investment operations | | | 1.87 | | | | (2.87 | ) | | | 15.12 | | | | 5.39 | | | | (3.17 | ) | | | 2.95 | |
| Redemption Fees | | | 0.00 | (3) | | | 0.00 | (3) | | | — | | | | 0.00 | (3) | | | 0.00 | (3) | | | 0.00 | (3) |
| Less Distributions: | | | | | | | | | | | | | | | | | | | | | | | | |
| From net investment income | | | — | | | | — | | | | — | | | | — | | | | (0.35 | ) | | | (0.40 | ) |
| Total distributions | | | — | | | | — | | | | — | | | | — | | | | (0.35 | ) | | | (0.40 | ) |
Net Asset Value, End of Period | | $ | 39.44 | | | $ | 37.57 | | | $ | 40.44 | | | $ | 25.32 | | | $ | 19.93 | | | $ | 23.45 | |
| Total return | | | 5.01 | %(4) | | | (7.12 | )% | | | 59.72 | % | | | 27.04 | % | | | (13.51 | )% | | | 14.10 | % |
| | | | | | | | | | | | | | | | | | | | | | | | | |
| SUPPLEMENTAL DATA AND RATIOS | | | | | | | | | | | | | | | | | | | | | | | | |
| Net assets, end of period (000’s) | | $ | 78,539 | | | $ | 63,392 | | | $ | 41,032 | | | $ | 7,482 | | | $ | 5,498 | | | $ | 9,808 | |
| Ratio of operating expenses to average net assets: | | | | | | | | | | | | | | | | | | | | | | | | |
| Before expense reimbursement | | | 1.68 | %(5) | | | 1.66 | % | | | 1.68 | % | | | 1.91 | % | | | 1.85 | % | | | 1.81 | % |
After expense reimbursement(6) | | | 1.44 | %(5) | | | 1.44 | % | | | 1.44 | % | | | 1.44 | % | | | 1.44 | % | | | 1.44 | % |
| Ratio of net investment income (loss) to average net assets: | | | | | | | | | | | | | | | | | | | | | | | | |
| Before expense reimbursement | | | (0.96 | )%(5) | | | (0.91 | )% | | | (0.33 | )% | | | (0.20 | )% | | | (0.39 | )% | | | (0.37 | )% |
After expense reimbursement(6) | | | (0.72 | )%(5) | | | (0.69 | )% | | | (0.09 | )% | | | 0.27 | % | | | 0.02 | % | | | 0.00 | % |
Portfolio turnover rate(7) | | | 1 | % | | | 19 | % | | | 6 | % | | | 22 | % | | | 47 | % | | | 4 | % |
| (1) | Information presented relates to a share of capital stock outstanding for each period. |
| (2) | Net investment income per share represents net investment income divided by the average shares outstanding throughout the period. |
| (3) | Amount calculated is less than $0.005. |
| (4) | Not annualized. |
| (5) | Annualized. |
| (6) | See Note #3, Investment Adviser, for the waiver and expense reimbursement discussion. |
| (7) | Portfolio turnover of The Small Cap Opportunities Portfolio. |
The accompanying notes are an integral part of these financial statements.
| KINETICS MUTUAL FUNDS, INC. — THE FEEDER FUNDS |
Financial Highlights — (Continued) |
| | | The Market Opportunities Fund | |
| | | No Load Class | |
| | | For the Six Months Ended June 30, 2015 (Unaudited) | | | For the Year Ended December 31, 2014 | | | For the Year Ended December 31, 2013 | | | For the Year Ended December 31, 2012 | | | For the Year Ended December 31, 2011 | | | For the Year Ended December 31, 2010 | |
PER SHARE DATA:(1) | | | | | | | | | | | | | | | | | | |
| Net Asset Value, Beginning of Period | | $ | 16.68 | | | $ | 17.66 | | | $ | 12.08 | | | $ | 10.45 | | | $ | 11.46 | | | $ | 10.84 | |
| Income from Investment Operations: | | | | | | | | | | | | | | | | | | | | | | | | |
Net investment income (loss)(2) | | | (0.08 | ) | | | (0.10 | ) | | | 0.00 | (3) | | | 0.03 | | | | 0.01 | | | | 0.04 | |
| Net realized and unrealized gain (loss) on investments | | | 0.47 | | | | (0.88 | ) | | | 5.65 | | | | 1.80 | | | | (0.91 | ) | | | 1.18 | |
| Total from investment operations | | | 0.39 | | | | (0.98 | ) | | | 5.65 | | | | 1.83 | | | | (0.90 | ) | | | 1.22 | |
| Redemption Fees | | | — | | | | 0.00 | (3) | | | 0.00 | (3) | | | 0.00 | (3) | | | 0.00 | (3) | | | 0.00 | (3) |
| Less Distributions: | | | | | | | | | | | | | | | | | | | | | | | | |
| From net investment income | | | — | | | | — | | | | (0.07 | ) | | | (0.20 | ) | | | (0.11 | ) | | | (0.60 | ) |
| Total distributions | | | — | | | | — | | | | (0.07 | ) | | | (0.20 | ) | | | (0.11 | ) | | | (0.60 | ) |
Net Asset Value, End of Period | | $ | 17.07 | | | $ | 16.68 | | | $ | 17.66 | | | $ | 12.08 | | | $ | 10.45 | | | $ | 11.46 | |
| Total return | | | 2.34 | %(4) | | | (5.55 | )% | | | 46.74 | % | | | 17.52 | % | | | (7.85 | )% | | | 11.31 | % |
| | | | | | | | | | | | | | | | | | | | | | | | | |
| SUPPLEMENTAL DATA AND RATIOS | | | | | | | | | | | | | | | | | | | | | | | | |
| Net assets, end of period (000’s) | | $ | 36,508 | | | $ | 37,318 | | | $ | 47,466 | | | $ | 32,929 | | | $ | 30,191 | | | $ | 38,562 | |
Ratio of operating expenses to average net assets: | | | | | | | | | | | | | | | | | | | | | | | | |
| Before expense reimbursement | | | 1.88 | %(5) | | | 1.86 | % | | | 1.88 | % | | | 1.97 | % | | | 1.93 | % | | | 1.92 | % |
After expense reimbursement(6) | | | 1.64 | %(5) | | | 1.64 | % | | | 1.64 | % | | | 1.64 | % | | | 1.64 | % | | | 1.64 | % |
Ratio of net investment income (loss) to average net assets: | | | | | | | | | | | | | | | | | | | | | | | | |
| Before expense reimbursement | | | (1.14 | )%(5) | | | (0.77 | )% | | | (0.21 | )% | | | (0.10 | )% | | | (0.20 | )% | | | 0.06 | % |
After expense reimbursement(6) | | | (0.90 | )%(5) | | | (0.55 | )% | | | 0.03 | % | | | 0.23 | % | | | 0.09 | % | | | 0.34 | % |
Portfolio turnover rate(7) | | | 1 | % | | | 18 | % | | | 21 | % | | | 26 | % | | | 14 | % | | | 12 | % |
| (1) | Information presented relates to a share of capital stock outstanding for each period. |
| (2) | Net investment income per share represents net investment income divided by the average shares outstanding throughout the period. |
| (3) | Amount calculated is less than $0.005. |
| (4) | Not annualized. |
| (5) | Annualized. |
| (6) | See Note #3, Investment Adviser, for the waiver and expense reimbursement discussion. |
| (7) | Portfolio turnover of The Market Opportunities Portfolio. |
The accompanying notes are an integral part of these financial statements.
| KINETICS MUTUAL FUNDS, INC. — THE FEEDER FUNDS |
Financial Highlights — (Continued) |
| | | The Market Opportunities Fund | |
| | | Advisor Class A | |
| | | For the Six Months Ended June 30, 2015 (Unaudited) | | | For the Year Ended December 31, 2014 | | | For the Year Ended December 31, 2013 | | | For the Year Ended December 31, 2012 | | | For the Year Ended December 31, 2011 | | | For the Year Ended December 31, 2010 | |
PER SHARE DATA:(1) | | | | | | | | | | | | | | | | | | |
| Net Asset Value, Beginning of Period | | $ | 16.59 | | | $ | 17.60 | | | $ | 12.07 | | | $ | 10.43 | | | $ | 11.43 | | | $ | 10.80 | |
| Income from Investment Operations: | | | | | | | | | | | | | | | | | | | | | | | | |
Net investment income (loss)(2) | | | (0.10 | ) | | | (0.14 | ) | | | (0.03 | ) | | | 0.00 | (3) | | | (0.02 | ) | | | 0.01 | |
| Net realized and unrealized gain (loss) on investments | | | 0.47 | | | | (0.87 | ) | | | 5.63 | | | | 1.80 | | | | (0.90 | ) | | | 1.19 | |
| Total from investment operations | | | 0.37 | | | | (1.01 | ) | | | 5.60 | | | | 1.80 | | | | (0.92 | ) | | | 1.20 | |
| Redemption Fees | | | 0.00 | (3) | | | — | | | | 0.00 | (3) | | | 0.00 | (3) | | | 0.00 | (3) | | | 0.00 | (3) |
| Less Distributions: | | | | | | | | | | | | | | | | | | | | | | | | |
| From net investment income | | | — | | | | — | | | | (0.07 | ) | | | (0.16 | ) | | | (0.08 | ) | | | (0.57 | ) |
| Total distributions | | | — | | | | — | | | | (0.07 | ) | | | (0.16 | ) | | | (0.08 | ) | | | (0.57 | ) |
Net Asset Value, End of Period | | $ | 16.96 | | | $ | 16.59 | | | $ | 17.60 | | | $ | 12.07 | | | $ | 10.43 | | | $ | 11.43 | |
Total return(4) | | | 2.23 | %(5) | | | (5.74 | )% | | | 46.36 | % | | | 17.26 | % | | | (8.08 | )% | | | 11.11 | % |
| | | | | | | | | | | | | | | | | | | | | | | | | |
| SUPPLEMENTAL DATA AND RATIOS | | | | | | | | | | | | | | | | | | | | | | | | |
| Net assets, end of period (000’s) | | $ | 6,879 | | | $ | 8,817 | | | $ | 11,742 | | | $ | 6,518 | | | $ | 8,600 | | | $ | 14,167 | |
| Ratio of operating expenses to average net assets: | | | | | | | | | | | | | | | | | | | | | | | | |
| Before expense reimbursement | | | 2.13 | %(6) | | | 2.11 | % | | | 2.13 | % | | | 2.22 | % | | | 2.18 | % | | | 2.17 | % |
After expense reimbursement(7) | | | 1.89 | %(6) | | | 1.89 | % | | | 1.89 | % | | | 1.89 | % | | | 1.89 | % | | | 1.89 | % |
| Ratio of net investment income (loss) to average net assets: | | | | | | | | | | | | | | | | | | | | | | | | |
| Before expense reimbursement | | | (1.39 | )%(6) | | | (1.02 | )% | | | (0.46 | )% | | | (0.35 | )% | | | (0.45 | )% | | | (0.19 | )% |
After expense reimbursement(7) | | | (1.15 | )%(6) | | | (0.80 | )% | | | (0.22 | )% | | | (0.02 | )% | | | (0.16 | )% | | | 0.09 | % |
Portfolio turnover rate(8) | | | 1 | % | | | 18 | % | | | 21 | % | | | 26 | % | | | 14 | % | | | 12 | % |
| (1) | Information presented relates to a share of capital stock outstanding for each period. |
| (2) | Net investment income per share represents net investment income divided by the average shares outstanding throughout the period. |
| (3) | Amount calculated is less than $0.005. |
| (4) | The total return calculation does not reflect the 5.75% front end sales charge on Advisor Class A shares. |
| (5) | Not annualized. |
| (6) | Annualized. |
| (7) | See Note #3, Investment Adviser, for the waiver and expense reimbursement discussion. |
| (8) | Portfolio turnover of The Market Opportunities Portfolio. |
The accompanying notes are an integral part of these financial statements.
| KINETICS MUTUAL FUNDS, INC. — THE FEEDER FUNDS |
Financial Highlights — (Continued) |
| | | The Market Opportunities Fund | |
| | | Advisor Class C | |
| | | For the Six Months Ended June 30, 2015 (Unaudited) | | | For the Year Ended December 31, 2014 | | | For the Year Ended December 31, 2013 | | | For the Year Ended December 31, 2012 | | | For the Year Ended December 31, 2011 | | | For the Year Ended December 31, 2010 | |
PER SHARE DATA:(1) | | | | | | | | | | | | | | | | | | |
| Net Asset Value, Beginning of Period | | $ | 16.24 | | | $ | 17.32 | | | $ | 11.94 | | | $ | 10.32 | | | $ | 11.30 | | | $ | 10.69 | |
| Income from Investment Operations: | | | | | | | | | | | | | | | | | | | | | | | | |
Net investment loss(2) | | | (0.14 | ) | | | (0.22 | ) | | | (0.11 | ) | | | (0.06 | ) | | | (0.08 | ) | | | (0.04 | ) |
| Net realized and unrealized gain (loss) on investments | | | 0.46 | | | | (0.86 | ) | | | 5.56 | | | | 1.78 | | | | (0.88 | ) | | | 1.17 | |
| Total from investment operations | | | 0.32 | | | | (1.08 | ) | | | 5.45 | | | | 1.72 | | | | (0.96 | ) | | | 1.13 | |
| Redemption Fees | | | — | | | | 0.00 | (3) | | | 0.00 | (3) | | | 0.00 | (3) | | | — | | | | 0.00 | (3) |
| Less Distributions: | | | | | | | | | | | | | | | | | | | | | | | | |
| From net investment income | | | — | | | | — | | | | (0.07 | ) | | | (0.10 | ) | | | (0.02 | ) | | | (0.52 | ) |
| Total distributions | | | — | | | | — | | | | (0.07 | ) | | | (0.10 | ) | | | (0.02 | ) | | | (0.52 | ) |
Net Asset Value, End of Period | | $ | 16.56 | | | $ | 16.24 | | | $ | 17.32 | | | $ | 11.94 | | | $ | 10.32 | | | $ | 11.30 | |
| Total return | | | 1.97 | %(4) | | | (6.24 | )% | | | 45.61 | % | | | 16.70 | % | | | (8.51 | )% | | | 10.54 | % |
| | | | | | | | | | | | | | | | | | | | | | | | | |
| SUPPLEMENTAL DATA AND RATIOS | | | | | | | | | | | | | | | | | | | | | | | | |
| Net assets, end of period (000’s) | | $ | 4,981 | | | $ | 5,109 | | | $ | 5,525 | | | $ | 3,932 | | | $ | 4,233 | | | $ | 5,569 | |
| Ratio of operating expenses to average net assets: | | | | | | | | | | | | | | | | | | | | | | | | |
| Before expense reimbursement | | | 2.63 | %(5) | | | 2.61 | % | | | 2.63 | % | | | 2.72 | % | | | 2.68 | % | | | 2.67 | % |
After expense reimbursement(6) | | | 2.39 | %(5) | | | 2.39 | % | | | 2.39 | % | | | 2.39 | % | | | 2.39 | % | | | 2.39 | % |
| Ratio of net investment loss to average net assets: | | | | | | | | | | | | | | | | | | | | | | | | |
| Before expense reimbursement | | | (1.89 | )%(5) | | | (1.52 | )% | | | (0.96 | )% | | | (0.85 | )% | | | (0.95 | )% | | | (0.69 | )% |
After expense reimbursement(6) | | | (1.65 | )%(5) | | | (1.30 | )% | | | (0.72 | )% | | | (0.52 | )% | | | (0.66 | )% | | | (0.41 | )% |
Portfolio turnover rate(7) | | | 1 | % | | | 18 | % | | | 21 | % | | | 26 | % | | | 14 | % | | | 12 | % |
| (1) | Information presented relates to a share of capital stock outstanding for each period. |
| (2) | Net investment income per share represents net investment income divided by the average shares outstanding throughout the period. |
| (3) | Amount calculated is less than $0.005. |
| (4) | Not annualized. |
| (5) | Annualized. |
| (6) | See Note #3, Investment Adviser, for the waiver and expense reimbursement discussion. |
| (7) | Portfolio turnover of The Market Opportunities Portfolio. |
The accompanying notes are an integral part of these financial statements.
| KINETICS MUTUAL FUNDS, INC. — THE FEEDER FUNDS |
Financial Highlights — (Continued) |
| | | The Market Opportunities Fund | |
| | | Institutional Class | |
| | | For the Six Months Ended June 30, 2015 (Unaudited) | | | For the Year Ended December 31, 2014 | | | For the Year Ended December 31, 2013 | | | For the Year Ended December 31, 2012 | | | For the Year Ended December 31, 2011 | | | For the Year Ended December 31, 2010 | |
PER SHARE DATA:(1) | | | | | | | | | | | | | | | | | | |
| Net Asset Value, Beginning of Period | | $ | 16.80 | | | $ | 17.74 | | | $ | 12.10 | | | $ | 10.46 | | | $ | 11.48 | | | $ | 10.86 | |
| Income from Investment Operations: | | | | | | | | | | | | | | | | | | | | | | | | |
Net investment income (loss)(2) | | | (0.06 | ) | | | (0.06 | ) | | | 0.03 | | | | 0.05 | | | | 0.03 | | | | 0.06 | |
| Net realized and unrealized gain (loss) on investments | | | 0.47 | | | | (0.88 | ) | | | 5.67 | | | | 1.81 | | | | (0.92 | ) | | | 1.19 | |
| Total from investment operations | | | 0.41 | | | | (0.94 | ) | | | 5.70 | | | | 1.86 | | | | (0.89 | ) | | | 1.25 | |
| Redemption Fees | | | — | | | | — | | | | 0.01 | | | | — | | | | — | | | | — | |
| Less Distributions: | | | | | | | | | | | | | | | | | | | | | | | | |
| From net investment income | | | — | | | | — | | | | (0.07 | ) | | | (0.22 | ) | | | (0.13 | ) | | | (0.63 | ) |
| Total distributions | | | — | | | | — | | | | (0.07 | ) | | | (0.22 | ) | | | (0.13 | ) | | | (0.63 | ) |
Net Asset Value, End of Period | | $ | 17.21 | | | $ | 16.80 | | | $ | 17.74 | | | $ | 12.10 | | | $ | 10.46 | | | $ | 11.48 | |
| Total return | | | 2.50 | %(3) | | | (5.36 | )% | | | 47.15 | % | | | 17.83 | % | | | (7.71 | )% | | | 11.54 | % |
| | | | | | | | | | | | | | | | | | | | | | | | | |
| SUPPLEMENTAL DATA AND RATIOS | | | | | | | | | | | | | | | | | | | | | | | | |
| Net assets, end of period (000’s) | | $ | 2,853 | | | $ | 3,108 | | | $ | 1,809 | | | $ | 229 | | | $ | 186 | | | $ | 212 | |
| Ratio of operating expenses to average net assets: | | | | | | | | | | | | | | | | | | | | | | | | |
| Before expense reimbursement | | | 1.83 | %(4) | | | 1.81 | % | | | 1.83 | % | | | 1.92 | % | | | 1.88 | % | | | 1.87 | % |
After expense reimbursement(5) | | | 1.44 | %(4) | | | 1.44 | % | | | 1.44 | % | | | 1.44 | % | | | 1.44 | % | | | 1.44 | % |
| Ratio of net investment income (loss) to average net assets: | | | | | | | | | | | | | | | | | | | | | | | | |
| Before expense reimbursement | | | (1.09 | )%(4) | | | (0.72 | )% | | | (0.16 | )% | | | (0.05 | )% | | | (0.15 | )% | | | 0.11 | % |
After expense reimbursement(5) | | | (0.70 | )%(4) | | | (0.35 | )% | | | 0.23 | % | | | 0.43 | % | | | 0.29 | % | | | 0.54 | % |
Portfolio turnover rate(6) | | | 1 | % | | | 18 | % | | | 21 | % | | | 26 | % | | | 14 | % | | | 12 | % |
| (1) | Information presented relates to a share of capital stock outstanding for each period. |
| (2) | Net investment income per share represents net investment income divided by the average shares outstanding throughout the period. |
| (3) | Not annualized. |
| (4) | Annualized. |
| (5) | See Note #3, Investment Adviser, for the waiver and expense reimbursement discussion. |
| (6) | Portfolio turnover of The Market Opportunities Portfolio. |
The accompanying notes are an integral part of these financial statements.
| KINETICS MUTUAL FUNDS, INC. — THE FEEDER FUNDS |
Financial Highlights — (Continued) |
| | | The Alternative Income Fund | |
| | | No Load Class | |
| | | For the Six Months Ended June 30, 2015 (Unaudited) | | | For the Year Ended December 31, 2014 | | | For the Year Ended December 31, 2013 | | | For the Year Ended December 31, 2012(1) | | | For the Year Ended December 31, 2011(1) | | | For the Year Ended December 31, 2010(1) | |
PER SHARE DATA:(2) | | | | | | | | | | | | | | | | | | |
| Net Asset Value, Beginning of Period | | $ | 89.06 | | | $ | 87.88 | | | $ | 83.31 | | | $ | 77.90 | | | $ | 83.82 | | | $ | 88.57 | |
| Income from Investment Operations: | | | | | | | | | | | | | | | | | | | | | | | | |
Net investment income (loss)(3) | | | (0.02 | ) | | | (0.12 | ) | | | (0.21 | ) | | | 1.53 | | | | 1.03 | | | | 0.72 | |
| Net realized and unrealized gain (loss) on investments | | | 2.30 | | | | 1.30 | | | | 4.78 | | | | 6.09 | | | | (5.13 | ) | | | (4.75 | ) |
| Total from investment operations | | | 2.28 | | | | 1.18 | | | | 4.57 | | | | 7.62 | | | | (4.10 | ) | | | (4.03 | ) |
| Redemption Fees | | | 0.03 | | | | 0.00 | (4) | | | 0.00 | (4) | | | 0.00 | (4) | | | 0.00 | (4) | | | 0.00 | (4) |
| Less Distributions: | | | | | | | | | | | | | | | | | | | | | | | | |
| From net investment income | | | — | | | | — | | | | — | | | | (2.21 | ) | | | (1.82 | ) | | | (0.72 | ) |
| Total distributions | | | — | | | | — | | | | — | | | | (2.21 | ) | | | (1.82 | ) | | | (0.72 | ) |
Net Asset Value, End of Period | | $ | 91.37 | | | $ | 89.06 | | | $ | 87.88 | | | $ | 83.31 | | | $ | 77.90 | | | $ | 83.82 | |
| Total return | | | 2.58 | %(5) | | | 1.50 | % | | | 5.22 | % | | | 9.90 | % | | | (4.88 | )% | | | (4.60 | )% |
| | | | | | | | | | | | | | | | | | | | | | | | | |
| SUPPLEMENTAL DATA AND RATIOS | | | | | | | | | | | | | | | | | | | | | | | | |
| Net assets, end of period (000’s) | | $ | 5,554 | | | $ | 8,202 | | | $ | 11,848 | | | $ | 4,699 | | | $ | 5,613 | | | $ | 7,001 | |
| Ratio of operating expenses to average net assets: | | | | | | | | | | | | | | | | | | | | | | | | |
| Before expense reimbursement | | | 1.76 | %(6) | | | 1.80 | % | | | 2.23 | % | | | 2.55 | % | | | 2.29 | % | | | 2.17 | % |
After expense reimbursement(7) | | | 0.95 | %(6) | | | 0.95 | % | | | 0.95 | % | | | 1.64 | % | | | 1.64 | % | | | 1.64 | % |
| Ratio of net investment income (loss) to average net assets: | | | | | | | | | | | | | | | | | | | | | | | | |
| Before expense reimbursement | | | (0.85 | )%(6) | | | (0.99 | )% | | | (1.52 | )% | | | 0.93 | % | | | 0.59 | % | | | 0.33 | % |
After expense reimbursement(7) | | | (0.04 | )%(6) | | | (0.14 | )% | | | (0.24 | )% | | | 1.84 | % | | | 1.24 | % | | | 0.86 | % |
Portfolio turnover rate(8) | | | 3 | % | | | 17 | % | | | 19 | % | | | 56 | % | | | 69 | % | | | 111 | % |
| (1) | Per share data adjusted for 1:10 reverse stock split completed as of May 31, 2013. |
| (2) | Information presented relates to a share of capital stock outstanding for each period. |
| (3) | Net investment income per share represents net investment income divided by the average shares outstanding throughout the period. |
| (4) | Amount calculated is less than $0.005. |
| (5) | Not annualized. |
| (6) | Annualized. |
| (7) | See Note #3, Investment Adviser, for the waiver and expense reimbursement discussion. |
| (8) | Portfolio turnover of The Alternative Income Portfolio. |
The accompanying notes are an integral part of these financial statements.
| KINETICS MUTUAL FUNDS, INC. — THE FEEDER FUNDS |
Financial Highlights — (Continued) |
| | | The Alternative Income Fund | |
| | | Advisor Class A | |
| | | For the Six Months Ended June 30, 2015 (Unaudited) | | | For the Year Ended December 31, 2014 | | | For the Year Ended December 31, 2013 | | | For the Year Ended December 31, 2012(1) | | | For the Year Ended December 31, 2011(1) | | | For the Year Ended December 31, 2010(1) | |
PER SHARE DATA:(2) | | | | | | | | | | | | | | | | | | |
| Net Asset Value, Beginning of Period | | $ | 88.69 | | | $ | 87.73 | | | $ | 83.38 | | | $ | 77.76 | | | $ | 83.52 | | | $ | 88.18 | |
| Income from Investment Operations: | | | | | | | | | | | | | | | | | | | | | | | | |
Net investment income (loss)(3) | | | (0.13 | ) | | | (0.34 | ) | | | (0.43 | ) | | | 1.31 | | | | 0.82 | | | | 0.50 | |
| Net realized and unrealized gain (loss) on investments | | | 2.29 | | | | 1.30 | | | | 4.77 | | | | 6.09 | | | | (5.13 | ) | | | (4.70 | ) |
| Total from investment operations | | | 2.16 | | | | 0.96 | | | | 4.34 | | | | 7.40 | | | | (4.31 | ) | | | (4.20 | ) |
| Redemption Fees | | | — | | | | 0.00 | (4) | | | 0.01 | | | | 0.00 | (4) | | | 0.01 | | | | 0.01 | |
| Less Distributions: | | | | | | | | | | | | | | | | | | | | | | | | |
| From net investment income | | | — | | | | — | | | | — | | | | (1.78 | ) | | | (1.46 | ) | | | (0.47 | ) |
| Total distributions | | | — | | | | — | | | | — | | | | (1.78 | ) | | | (1.46 | ) | | | (0.47 | ) |
Net Asset Value, End of Period | | $ | 90.85 | | | $ | 88.69 | | | $ | 87.73 | | | $ | 83.38 | | | $ | 77.76 | | | $ | 83.52 | |
Total return(5) | | | 2.44 | %(6) | | | 1.24 | % | | | 4.91 | % | | | 9.61 | % | | | (5.08 | )% | | | (4.80 | )% |
| | | | | | | | | | | | | | | | | | | | | | | | | |
| SUPPLEMENTAL DATA AND RATIOS | | | | | | | | | | | | | | | | | | | | | | | | |
| Net assets, end of period (000’s) | | $ | 1,882 | | | $ | 1,554 | | | $ | 2,898 | | | $ | 2,597 | | | $ | 4,559 | | | $ | 10,100 | |
| Ratio of operating expenses to average net assets: | | | | | | | | | | | | | | | | | | | | | | | | |
| Before expense reimbursement | | | 2.01 | %(7) | | | 2.05 | % | | | 2.48 | % | | | 2.80 | % | | | 2.54 | % | | | 2.42 | % |
After expense reimbursement(8) | | | 1.20 | %(7) | | | 1.20 | % | | | 1.20 | % | | | 1.89 | % | | | 1.89 | % | | | 1.89 | % |
| Ratio of net investment income (loss) to average net assets: | | | | | | | | | | | | | | | | | | | | | | | | |
| Before expense reimbursement | | | (1.10 | )%(7) | | | (1.24 | )% | | | (1.77 | )% | | | 0.68 | % | | | 0.34 | % | | | 0.08 | % |
After expense reimbursement(8) | | | (0.29 | )%(7) | | | (0.39 | )% | | | (0.49 | )% | | | 1.59 | % | | | 0.99 | % | | | 0.61 | % |
Portfolio turnover rate(9) | | | 3 | % | | | 17 | % | | | 19 | % | | | 56 | % | | | 69 | % | | | 111 | % |
| (1) | Per share data adjusted for 1:10 reverse stock split completed as of May 31, 2013. |
| (2) | Information presented relates to a share of capital stock outstanding for each period. |
| (3) | Net investment income per share represents net investment income divided by the average shares outstanding throughout the period. |
| (4) | Amount calculated is less than $0.005. |
| (5) | The total return calculation does not reflect the 5.75% front end sales charge on Advisor Class A shares. |
| (6) | Not annualized. |
| (7) | Annualized. |
| (8) | See Note #3, Investment Adviser, for the waiver and expense reimbursement discussion. |
| (9) | Portfolio turnover of The Alternative Income Portfolio. |
The accompanying notes are an integral part of these financial statements.
| KINETICS MUTUAL FUNDS, INC. — THE FEEDER FUNDS |
Financial Highlights — (Continued) |
| | | The Alternative Income Fund | |
| | | Advisor Class C | |
| | | For the Six Months Ended June 30, 2015 (Unaudited) | | | For the Year Ended December 31, 2014 | | | For the Year Ended December 31, 2013 | | | For the Year Ended December 31, 2012(1) | | | For the Year Ended December 31, 2011(1) | | | For the Year Ended December 31, 2010(1) | |
PER SHARE DATA:(2) | | | | | | | | | | | | | | | | | | |
| Net Asset Value, Beginning of Period | | $ | 86.60 | | | $ | 86.10 | | | $ | 82.26 | | | $ | 76.75 | | | $ | 82.53 | | | $ | 87.12 | |
| Income from Investment Operations: | | | | | | | | | | | | | | | | | | | | | | | | |
Net investment income (loss)(3) | | | (0.35 | ) | | | (0.77 | ) | | | (0.84 | ) | | | 0.89 | | | | 0.40 | | | | 0.09 | |
| Net realized and unrealized gain (loss) on investments | | | 2.24 | | | | 1.27 | | | | 4.68 | | | | 6.00 | | | | (5.03 | ) | | | (4.57 | ) |
| Total from investment operations | | | 1.89 | | | | 0.50 | | | | 3.84 | | | | 6.89 | | | | (4.63 | ) | | | (4.48 | ) |
| Redemption Fees | | | 0.03 | | | | — | | | | — | | | | 0.00 | (4) | | | 0.01 | | | | 0.00 | (4) |
| Less Distributions: | | | | | | | | | | | | | | | | | | | | | | | | |
| From net investment income | | | — | | | | — | | | | — | | | | (1.38 | ) | | | (1.16 | ) | | | (0.11 | ) |
| Total distributions | | | — | | | | — | | | | — | | | | (1.38 | ) | | | (1.16 | ) | | | (0.11 | ) |
Net Asset Value, End of Period | | $ | 88.52 | | | $ | 86.60 | | | $ | 86.10 | | | $ | 82.26 | | | $ | 76.75 | | | $ | 82.53 | |
| Total return | | | 2.21 | %(5) | | | 0.74 | % | | | 4.46 | % | | | 8.96 | % | | | (5.51 | )% | | | (5.15 | )% |
| | | | | | | | | | | | | | | | | | | | | | | | | |
| SUPPLEMENTAL DATA AND RATIOS | | | | | | | | | | | | | | | | | | | | | | | | |
| Net assets, end of period (000’s) | | $ | 1,433 | | | $ | 1,506 | | | $ | 1,862 | | | $ | 1,763 | | | $ | 2,316 | | | $ | 2,840 | |
| Ratio of operating expenses to average net assets: | | | | | | | | | | | | | | | | | | | | | | | | |
| Before expense reimbursement | | | 2.51 | %(6) | | | 2.55 | % | | | 2.98 | % | | | 3.30 | % | | | 3.04 | % | | | 2.92 | % |
After expense reimbursement (7) | | | 1.70 | %(6) | | | 1.70 | % | | | 1.70 | % | | | 2.39 | % | | | 2.39 | % | | | 2.39 | % |
| Ratio of net investment income (loss) to average net assets: | | | | | | | | | | | | | | | | | | | | | | | | |
| Before expense reimbursement | | | (1.60 | )%(6) | | | (1.74 | )% | | | (2.27 | )% | | | 0.18 | % | | | (0.16 | )% | | | (0.42 | )% |
After expense reimbursement(7) | | | (0.79 | )%(6) | | | (0.89 | )% | | | (0.99 | )% | | | 1.09 | % | | | 0.49 | % | | | 0.11 | % |
Portfolio turnover rate(8) | | | 3 | % | | | 17 | % | | | 19 | % | | | 56 | % | | | 69 | % | | | 111 | % |
| (1) | Per share data adjusted for 1:10 reverse stock split completed as of May 31, 2013. |
| (2) | Information presented relates to a share of capital stock outstanding for each period. |
| (3) | Net investment income per share represents net investment income divided by the average shares outstanding throughout the period. |
| (4) | Amount calculated is less than $0.005. |
| (5) | Not annualized. |
| (6) | Annualized. |
| (7) | See Note #3, Investment Adviser, for the waiver and expense reimbursement discussion. |
| (8) | Portfolio turnover of The Alternative Income Portfolio. |
The accompanying notes are an integral part of these financial statements.
| KINETICS MUTUAL FUNDS, INC. — THE FEEDER FUNDS |
Financial Highlights — (Continued) |
| | | The Alternative Income Fund | |
| | | Institutional Class | |
| | | For the Six Months Ended June 30, 2015 (Unaudited) | | | For the Year Ended December 31, 2014 | | | For the Year Ended December 31, 2013 | | | For the Year Ended December 31, 2012(1) | | | For the Year Ended December 31, 2011(1) | | | For the Year Ended December 31, 2010(1) | |
PER SHARE DATA:(2) | | | | | | | | | | | | | | | | | | |
| Net Asset Value, Beginning of Period | | $ | 90.14 | | | $ | 88.76 | | | $ | 84.00 | | | $ | 78.49 | | | $ | 84.22 | | | $ | 88.97 | |
| Income from Investment Operations: | | | | | | | | | | | | | | | | | | | | | | | | |
Net investment income (loss)(3) | | | 0.07 | | | | 0.06 | | | | (0.04 | ) | | | 1.72 | | | | 1.21 | | | | 0.88 | |
| Net realized and unrealized gain (loss) on investments | | | 2.34 | | | | 1.32 | | | | 4.80 | | | | 6.16 | | | | (5.13 | ) | | | (4.74 | ) |
| Total from investment operations | | | 2.41 | | | | 1.38 | | | | 4.76 | | | | 7.88 | | | | (3.92 | ) | | | (3.86 | ) |
| Redemption Fees | | | 0.00 | (4) | | | 0.00 | (4) | | | — | | | | 0.01 | | | | 0.17 | | | | 0.01 | |
| Less Distributions: | | | | | | | | | | | | | | | | | | | | | | | | |
| From net investment income | | | — | | | | — | | | | — | | | | (2.38 | ) | | | (1.98 | ) | | | (0.90 | ) |
| Total distributions | | | — | | | | — | | | | — | | | | (2.38 | ) | | | (1.98 | ) | | | (0.90 | ) |
Net Asset Value, End of Period | | $ | 92.55 | | | $ | 90.14 | | | $ | 88.76 | | | $ | 84.00 | | | $ | 78.49 | | | $ | 84.22 | |
| Total return | | | 2.65 | %(5) | | | 1.72 | % | | | 5.39 | % | | | 10.17 | % | | | (4.43 | )% | | | (4.38 | )% |
| | | | | | | | | | | | | | | | | | | | | | | | | |
| SUPPLEMENTAL DATA AND RATIOS | | | | | | | | | | | | | | | | | | | | | | | | |
| Net assets, end of period (000’s) | | $ | 26,016 | | | $ | 26,874 | | | $ | 6,854 | | | $ | 1,629 | | | $ | 798 | | | $ | 4,182 | |
| Ratio of operating expenses to average net assets: | | | | | | | | | | | | | | | | | | | | | | | | |
| Before expense reimbursement | | | 1.71 | %(6) | | | 1.75 | % | | | 2.18 | % | | | 2.50 | % | | | 2.24 | % | | | 2.12 | % |
After expense reimbursement(7) | | | 0.75 | %(6) | | | 0.75 | % | | | 0.75 | % | | | 1.44 | % | | | 1.44 | % | | | 1.44 | % |
| Ratio of net investment income (loss) to average net assets: | | | | | | | | | | | | | | | | | | | | | | | | |
| Before expense reimbursement | | | (0.80 | )%(6) | | | (0.94 | )% | | | (1.47 | )% | | | 0.98 | % | | | 0.64 | % | | | 0.38 | % |
After expense reimbursement(7) | | | 0.16 | %(6) | | | 0.06 | % | | | (0.04 | )% | | | 2.04 | % | | | 1.44 | % | | | 1.06 | % |
Portfolio turnover rate(8) | | | 3 | % | | | 17 | % | | | 19 | % | | | 56 | % | | | 69 | % | | | 111 | % |
| (1) | Per share data adjusted for 1:10 reverse stock split completed as of May 31, 2013. |
| (2) | Information presented relates to a share of capital stock outstanding for each period. |
| (3) | Net investment income per share represents net investment income divided by the average shares outstanding throughout the period. |
| (4) | Amount calculated is less than $0.005. |
| (5) | Not annualized. |
| (6) | Annualized. |
| (7) | See Note #3, Investment Adviser, for the waiver and expense reimbursement discussion. |
| (8) | Portfolio turnover of The Alternative Income Portfolio. |
The accompanying notes are an integral part of these financial statements.
| KINETICS MUTUAL FUNDS, INC. — THE FEEDER FUNDS |
Financial Highlights — (Continued) |
| | | The Multi-Disciplinary Income Fund | |
| | | No Load Class | |
| | | For the Six Months Ended June 30, 2015 (Unaudited) | | | For the Year Ended December 31, 2014 | | | For the Year Ended December 31, 2013 | | | For the Year Ended December 31, 2012 | | | For the Year Ended December 31, 2011 | | | For the Year Ended December 31, 2010 | |
PER SHARE DATA:(1) | | | | | | | | | | | | | | | | | | |
| Net Asset Value, Beginning of Period | | $ | 10.79 | | | $ | 11.02 | | | $ | 11.08 | | | $ | 10.09 | | | $ | 10.47 | | | $ | 9.86 | |
| Income from Investment Operations: | | | | | | | | | | | | | | | | | | | | | | | | |
Net investment income(2) | | | 0.17 | | | | 0.33 | | | | 0.20 | | | | 0.34 | | | | 0.83 | | | | 0.35 | |
| Net realized and unrealized gain (loss) on investments | | | 0.01 | | | | (0.06 | ) | | | 0.28 | | | | 1.20 | | | | (0.80 | ) | | | 0.91 | |
| Total from investment operations | | | 0.18 | | | | 0.27 | | | | 0.48 | | | | 1.54 | | | | 0.03 | | | | 1.26 | |
| Redemption Fees | | | — | | | | 0.00 | (3) | | | 0.00 | (3) | | | 0.00 | (3) | | | 0.00 | (3) | | | 0.00 | (3) |
| Less Distributions: | | | | | | | | | | | | | | | | | | | | | | | | |
| From net investment income | | | (0.16 | ) | | | (0.29 | ) | | | (0.28 | ) | | | (0.43 | ) | | | (0.36 | ) | | | (0.35 | ) |
| From net realized gains | | | (0.01 | ) | | | (0.21 | ) | | | (0.26 | ) | | | (0.12 | ) | | | (0.05 | ) | | | (0.30 | ) |
| Total distributions | | | (0.17 | ) | | | (0.50 | ) | | | (0.54 | ) | | | (0.55 | ) | | | (0.41 | ) | | | (0.65 | ) |
Net Asset Value, End of Period | | $ | 10.80 | | | $ | 10.79 | | | $ | 11.02 | | | $ | 11.08 | | | $ | 10.09 | | | $ | 10.47 | |
| Total return | | | 1.64 | %(4) | | | 2.46 | % | | | 4.28 | % | | | 15.38 | % | | | 0.24 | % | | | 13.04 | % |
| | | | | | | | | | | | | | | | | | | | | | | | | |
| SUPPLEMENTAL DATA AND RATIOS | | | | | | | | | | | | | | | | | | | | | | | | |
| Net assets, end of period (000’s) | | $ | 9,594 | | | $ | 10,105 | | | $ | 19,553 | | | $ | 19,566 | | | $ | 13,389 | | | $ | 3,489 | |
| Ratio of operating expenses to average net assets: | | | | | | | | | | | | | | | | | | | | | | | | |
| Before expense reimbursement | | | 1.77 | %(5) | | | 1.79 | % | | | 1.83 | %(6) | | | 2.00 | % | | | 2.38 | % | | | 6.11 | % |
After expense reimbursement(7) | | | 1.49 | %(5) | | | 1.49 | % | | | 1.50 | %(6) | | | 1.49 | % | | | 1.49 | % | | | 1.49 | % |
| Ratio of net investment income (loss) to average net assets: | | | | | | | | | | | | | | | | | | | | | | | | |
| Before expense reimbursement | | | 2.79 | %(5) | | | 2.63 | % | | | 1.41 | %(8) | | | 2.65 | % | | | 7.09 | % | | | (1.19 | )% |
After expense reimbursement(7) | | | 3.07 | %(5) | | | 2.93 | % | | | 1.74 | %(8) | | | 3.16 | % | | | 7.98 | % | | | 3.43 | % |
Portfolio turnover rate(9) | | | 2 | % | | | 35 | % | | | 54 | % | | | 41 | % | | | 74 | % | | | 38 | % |
| (1) | Information presented relates to a share of capital stock outstanding for each period. |
| (2) | Net investment income per share represents net investment income divided by the average shares outstanding throughout the period. |
| (3) | Amount calculated is less than $0.005. |
| (4) | Not annualized. |
| (5) | Annualized. |
| (6) | The ratio of expenses includes borrowing expense on securities sold short. The expense ratio excluding borrowing expenses on securities sold short was 1.82% before expense reimbursement and 1.49% after expense reimbursement. |
| (7) | See Note #3, Investment Adviser, for the waiver and expense reimbursement discussion. |
| (8) | The ratio of net investment income includes borrowing expense on securities sold short. |
| (9) | Portfolio turnover of The Multi-Disciplinary Income Portfolio. |
The accompanying notes are an integral part of these financial statements.
| KINETICS MUTUAL FUNDS, INC. — THE FEEDER FUNDS |
Financial Highlights — (Continued) |
| | | The Multi-Disciplinary Income Fund | |
| | | Advisor Class A | |
| | | For the Six Months Ended June 30, 2015 (Unaudited) | | | For the Year Ended December 31, 2014 | | | For the Year Ended December 31, 2013 | | | For the Year Ended December 31, 2012 | | | For the Year Ended December 31, 2011 | | | For the Year Ended December 31, 2010 | |
PER SHARE DATA:(1) | | | | | | | | | | | | | | | | | | |
| Net Asset Value, Beginning of Period | | $ | 10.75 | | | $ | 10.98 | | | $ | 11.03 | | | $ | 10.05 | | | $ | 10.44 | | | $ | 9.85 | |
| Income from Investment Operations: | | | | | | | | | | | | | | | | | | | | | | | | |
Net investment income(2) | | | 0.15 | | | | 0.30 | | | | 0.17 | | | | 0.31 | | | | 0.78 | | | | 0.33 | |
| Net realized and unrealized gain (loss) on investments | | | 0.02 | | | | (0.06 | ) | | | 0.29 | | | | 1.20 | | | | (0.78 | ) | | | 0.89 | |
| Total from investment operations | | | 0.17 | | | | 0.24 | | | | 0.46 | | | | 1.51 | | | | — | | | | 1.22 | |
| Redemption Fees | | | 0.00 | (3) | | | 0.00 | (3) | | | 0.00 | (3) | | | 0.00 | (3) | | | — | | | | — | |
| Less Distributions: | | | | | | | | | | | | | | | | | | | | | | | | |
| From net investment income | | | (0.15 | ) | | | (0.26 | ) | | | (0.25 | ) | | | (0.41 | ) | | | (0.34 | ) | | | (0.33 | ) |
| From net realized gains | | | (0.01 | ) | | | (0.21 | ) | | | (0.26 | ) | | | (0.12 | ) | | | (0.05 | ) | | | (0.30 | ) |
| Total distributions | | | (0.16 | ) | | | (0.47 | ) | | | (0.51 | ) | | | (0.53 | ) | | | (0.39 | ) | | | (0.63 | ) |
Net Asset Value, End of Period | | $ | 10.76 | | | $ | 10.75 | | | $ | 10.98 | | | $ | 11.03 | | | $ | 10.05 | | | $ | 10.44 | |
Total return(4) | | | 1.52 | %(5) | | | 2.17 | % | | | 4.15 | % | | | 15.12 | % | | | (0.01 | )% | | | 12.64 | % |
| | | | | | | | | | | | | | | | | | | | | | | | | |
| SUPPLEMENTAL DATA AND RATIOS | | | | | | | | | | | | | | | | | | | | | | | | |
| Net assets, end of period (000’s) | | $ | 11,595 | | | $ | 12,281 | | | $ | 36,170 | | | $ | 25,764 | | | $ | 4,726 | | | $ | 356 | |
| Ratio of operating expenses to average net assets: | | | | | | | | | | | | | | | | | | | | | | | | |
| Before expense reimbursement | | | 2.02 | %(6) | | | 2.04 | % | | | 2.08 | %(7) | | | 2.25 | % | | | 2.63 | % | | | 6.36 | % |
After expense reimbursement(8) | | | 1.74 | %(6) | | | 1.74 | % | | | 1.75 | %(7) | | | 1.74 | % | | | 1.74 | % | | | 1.74 | % |
| Ratio of net investment income (loss) to average net assets: | | | | | | | | | | | | | | | | | | | | | | | | |
| Before expense reimbursement | | | 2.54 | %(6) | | | 2.38 | % | | | 1.16 | %(9) | | | 2.40 | % | | | 6.84 | % | | | (1.44 | )% |
After expense reimbursement(8) | | | 2.82 | %(6) | | | 2.68 | % | | | 1.49 | %(9) | | | 2.91 | % | | | 7.73 | % | | | 3.18 | % |
Portfolio turnover rate(10) | | | 2 | % | | | 35 | % | | | 54 | % | | | 41 | % | | | 74 | % | | | 38 | % |
| (1) | Information presented relates to a share of capital stock outstanding for each period. |
| (2) | Net investment income per share represents net investment income divided by the average shares outstanding throughout the period. |
| (3) | Amount calculated is less than $0.005. |
| (4) | The total return calculation does not reflect the 5.75% front end sales charge on Advisor Class A shares. |
| (5) | Not annualized. |
| (6) | Annualized. |
| (7) | The ratio of expenses includes borrowing expense on securities sold short. The expense ratio excluding borrowing expenses on securities sold short was 2.07% before expense reimbursement and 1.74% after expense reimbursement. |
| (8) | See Note #3, Investment Adviser, for the waiver and expense reimbursement discussion. |
| (9) | The ratio of net investment income includes borrowing expense on securities sold short. |
| (10) | Portfolio turnover of The Multi-Disciplinary Income Portfolio. |
The accompanying notes are an integral part of these financial statements.
| KINETICS MUTUAL FUNDS, INC. — THE FEEDER FUNDS |
Financial Highlights — (Continued) |
| | | The Multi-Disciplinary Income Fund | |
| | | Advisor Class C | |
| | | For the Six Months Ended June 30, 2015 (Unaudited) | | | For the Year Ended December 31, 2014 | | | For the Year Ended December 31, 2013 | | | For the Year Ended December 31, 2012 | | | For the Year Ended December 31, 2011 | | | For the Year Ended December 31, 2010 | |
PER SHARE DATA:(1) | | | | | | | | | | | | | | | | | | |
| Net Asset Value, Beginning of Period | | $ | 10.65 | | | $ | 10.90 | | | $ | 10.96 | | | $ | 10.00 | | | $ | 10.40 | | | $ | 9.80 | |
| Income from Investment Operations: | | | | | | | | | | | | | | | | | | | | | | | | |
Net investment income(2) | | | 0.12 | | | | 0.24 | | | | 0.11 | | | | 0.26 | | | | 0.74 | | | | 0.27 | |
| Net realized and unrealized gain (loss) on investments | | | 0.02 | | | | (0.06 | ) | | | 0.29 | | | | 1.18 | | | | (0.78 | ) | | | 0.90 | |
| Total from investment operations | | | 0.14 | | | | 0.18 | | | | 0.40 | | | | 1.44 | | | | (0.04 | ) | | | 1.17 | |
| Redemption Fees | | | — | | | | 0.00 | (3) | | | — | | | | — | | | | — | | | | — | |
| Less Distributions: | | | | | | | | | | | | | | | | | | | | | | | | |
| From net investment income | | | (0.12 | ) | | | (0.22 | ) | | | (0.20 | ) | | | (0.36 | ) | | | (0.31 | ) | | | (0.27 | ) |
| From net realized gains | | | (0.01 | ) | | | (0.21 | ) | | | (0.26 | ) | | | (0.12 | ) | | | (0.05 | ) | | | (0.30 | ) |
| Total distributions | | | (0.13 | ) | | | (0.43 | ) | | | (0.46 | ) | | | (0.48 | ) | | | (0.36 | ) | | | (0.57 | ) |
Net Asset Value, End of Period | | $ | 10.66 | | | $ | 10.65 | | | $ | 10.90 | | | $ | 10.96 | | | $ | 10.00 | | | $ | 10.40 | |
| Total return | | | 1.29 | %(4) | | | 1.61 | % | | | 3.59 | % | | | 14.48 | % | | | (0.49 | )% | | | 12.13 | % |
| | | | | | | | | | | | | | | | | | | | | | | | | |
| SUPPLEMENTAL DATA AND RATIOS | | | | | | | | | | | | | | | | | | | | | | | | |
| Net assets, end of period (000’s) | | $ | 10,307 | | | $ | 10,403 | | | $ | 11,209 | | | $ | 7,485 | | | $ | 1,645 | | | $ | 128 | |
| Ratio of operating expenses to average net assets: | | | | | | | | | | | | | | | | | | | | | | | | |
| Before expense reimbursement | | | 2.52 | %(5) | | | 2.54 | % | | | 2.58 | %(6) | | | 2.75 | % | | | 3.13 | % | | | 6.86 | % |
After expense reimbursement(7) | | | 2.24 | %(5) | | | 2.24 | % | | | 2.25 | %(6) | | | 2.24 | % | | | 2.24 | % | | | 2.24 | % |
| Ratio of net investment income (loss) to average net assets: | | | | | | | | | | | | | | | | | | | | | | | | |
| Before expense reimbursement | | | 2.04 | %(5) | | | 1.88 | % | | | 0.66 | %(8) | | | 1.90 | % | | | 6.34 | % | | | (1.94 | )% |
After expense reimbursement(7) | | | 2.32 | %(5) | | | 2.18 | % | | | 0.99 | %(8) | | | 2.41 | % | | | 7.23 | % | | | 2.68 | % |
Portfolio turnover rate(9) | | | 2 | % | | | 35 | % | | | 54 | % | | | 41 | % | | | 74 | % | | | 38 | % |
| (1) | Information presented relates to a share of capital stock outstanding for each period. |
| (2) | Net investment income per share represents net investment income divided by the average shares outstanding throughout the period. |
| (3) | Amount calculated is less than $0.005. |
| (4) | Not annualized. |
| (5) | Annualized. |
| (6) | The ratio of expenses includes borrowing expense on securities sold short. The expense ratio excluding borrowing expenses on securities sold short was 2.57% before expense reimbursement and 2.24% after expense reimbursement. |
| (7) | See Note #3, Investment Adviser, for the waiver and expense reimbursement discussion. |
| (8) | The ratio of net investment income includes borrowing expense on securities sold short. |
| (9) | Portfolio turnover of The Multi-Disciplinary Income Portfolio. |
The accompanying notes are an integral part of these financial statements.
| KINETICS MUTUAL FUNDS, INC. — THE FEEDER FUNDS |
Financial Highlights — (Continued) |
| | | The Multi-Disciplinary Income Fund | |
| | | Institutional Class | |
| | | For the Six Months Ended June 30, 2015 (Unaudited) | | | For the Year Ended December 31, 2014 | | | For the Year Ended December 31, 2013 | | | For the Year Ended December 31, 2012 | | | For the Year Ended December 31, 2011 | | | For the Year Ended December 31, 2010 | |
PER SHARE DATA:(1) | | | | | | | | | | | | | | | | | | |
| Net Asset Value, Beginning of Period | | $ | 10.82 | | | $ | 11.06 | | | $ | 11.11 | | | $ | 10.12 | | | $ | 10.50 | | | $ | 9.89 | |
| Income from Investment Operations: | | | | | | | | | | | | | | | | | | | | | | | | |
Net investment income(2) | | | 0.18 | | | | 0.35 | | | | 0.22 | | | | 0.36 | | | | 0.85 | | | | 0.37 | |
| Net realized and unrealized gain (loss) on investments | | | 0.01 | | | | (0.06 | ) | | | 0.29 | | | | 1.20 | | | | (0.80 | ) | | | 0.91 | |
| Total from investment operations | | | 0.19 | | | | 0.29 | | | | 0.51 | | | | 1.56 | | | | 0.05 | | | | 1.28 | |
| Redemption Fees | | | — | | | | — | | | | — | | | | — | | | | — | | | | — | |
| Less Distributions: | | | | | | | | | | | | | | | | | | | | | | | | |
| From net investment income | | | (0.17 | ) | | | (0.32 | ) | | | (0.30 | ) | | | (0.45 | ) | | | (0.38 | ) | | | (0.37 | ) |
| From net realized gains | | | (0.01 | ) | | | (0.21 | ) | | | (0.26 | ) | | | (0.12 | ) | | | (0.05 | ) | | | (0.30 | ) |
| Total distributions | | | (0.18 | ) | | | (0.53 | ) | | | (0.56 | ) | | | (0.57 | ) | | | (0.43 | ) | | | (0.67 | ) |
Net Asset Value, End of Period | | $ | 10.83 | | | $ | 10.82 | | | $ | 11.06 | | | $ | 11.11 | | | $ | 10.12 | | | $ | 10.50 | |
| Total return | | | 1.74 | %(3) | | | 2.61 | % | | | 4.58 | % | | | 15.55 | % | | | 0.42 | % | | | 13.19 | % |
| | | | | | | | | | | | | | | | | | | | | | | | | |
| SUPPLEMENTAL DATA AND RATIOS | | | | | | | | | | | | | | | | | | | | | | | | |
| Net assets, end of period (000’s) | | $ | 110,030 | | | $ | 102,590 | | | $ | 23,227 | | | $ | 6,576 | | | $ | 3,878 | | | $ | 142 | |
| Ratio of operating expenses to average net assets: | | | | | | | | | | | | | | | | | | | | | | | | |
| Before expense reimbursement | | | 1.72 | %(4) | | | 1.74 | % | | | 1.78 | %(5) | | | 1.95 | % | | | 2.33 | % | | | 6.06 | % |
After expense reimbursement(6) | | | 1.29 | %(4) | | | 1.29 | % | | | 1.30 | %(5) | | | 1.29 | % | | | 1.29 | % | | | 1.29 | % |
| Ratio of net investment income (loss) to average net assets: | | | | | | | | | | | | | | | | | | | | | | | | |
| Before expense reimbursement | | | 2.84 | %(4) | | | 2.68 | % | | | 1.46 | %(7) | | | 2.70 | % | | | 7.14 | % | | | (1.14 | )% |
After expense reimbursement(6) | | | 3.27 | %(4) | | | 3.13 | % | | | 1.94 | %(7) | | | 3.36 | % | | | 8.18 | % | | | 3.63 | % |
Portfolio turnover rate(8) | | | 2 | % | | | 35 | % | | | 54 | % | | | 41 | % | | | 74 | % | | | 38 | % |
| (1) | Information presented relates to a share of capital stock outstanding for each period. |
| (2) | Net investment income per share represents net investment income divided by the average shares outstanding throughout the period. |
| (3) | Not annualized. |
| (4) | Annualized. |
| (5) | The ratio of expenses includes borrowing expense on securities sold short. The expense ratio excluding borrowing expenses on securities sold short was 1.77% before expense reimbursement and 1.29% after expense reimbursement. |
| (6) | See Note #3, Investment Adviser, for the waiver and expense reimbursement discussion. |
| (7) | The ratio of net investment income includes borrowing expense on securities sold short. |
| (8) | Portfolio turnover of The Multi-Disciplinary Income Portfolio. |
The accompanying notes are an integral part of these financial statements.
| KINETICS PORTFOLIOS TRUST — MASTER INVESTMENT PORTFOLIOS |
| Allocation of Portfolio Assets |
| June 30, 2015 (Unaudited) |
The Internet Portfolio
| Sector Allocation* | | | Market Value | | | Percentage of Total Net Assets | |
| Information | | $ | 85,001,727 | | | 58.5 | % |
| Retail Trade | | | 17,563,781 | | | 12.1 | % |
| Management of Companies and Enterprises | | | 14,014,550 | | | 9.6 | % |
| Arts, Entertainment, and Recreation | | | 13,149,470 | | | 9.0 | % |
| Finance and Insurance | | | 7,900,902 | | | 5.5 | % |
| Manufacturing | | | 4,463,476 | | | 3.1 | % |
| Administrative and Support and Waste Management and Remediation Services | | | 427,836 | | | 0.3 | % |
| Real Estate and Rental and Leasing | | | 358,800 | | | 0.2 | % |
| Professional, Scientific,and Technical Services | | | 13,080 | | | 0.0 | % |
* Excludes Short-Term Investments
| KINETICS PORTFOLIOS TRUST — MASTER INVESTMENT PORTFOLIOS |
| Allocation of Portfolio Assets |
June 30, 2015 (Unaudited) — (Continued) |
The Global Portfolio
| | | | | | | Percentage | |
| | | | Market | | | of Total | |
| Country Allocation* | | | Value | | | Net Assets | |
| United States | | $ | 4,836,476 | | | 55.3 | % |
| Canada | | | 2,016,645 | | | 23.0 | % |
| France | | | 679,768 | | | 7.8 | % |
| Cayman Islands | | | 442,200 | | | 5.1 | % |
| Switzerland | | | 227,756 | | | 2.6 | % |
| Spain | | | 134,062 | | | 1.5 | % |
| Guernsey | | | 70,470 | | | 0.8 | % |
| Brazil | | | 35,728 | | | 0.4 | % |
| Japan | | | 30,324 | | | 0.3 | % |
| Argentina | | | 23,241 | | | 0.3 | % |
| Germany | | | 13,774 | | | 0.2 | % |
| United Kingdom | | | 13,718 | | | 0.2 | % |
| Sweden | | | 3,726 | | | 0.0 | % |
* Excludes Short-Term Investments
| KINETICS PORTFOLIOS TRUST — MASTER INVESTMENT PORTFOLIOS |
| Allocation of Portfolio Assets |
June 30, 2015 (Unaudited) — (Continued) |
The Paradigm Portfolio
| | | | | | | Percentage | |
| | | | Market | | | of Total | |
| Sector Allocation* | | | Value | | | Net Assets | |
| Information | | $ | 262,472,278 | | | 24.2 | % |
| Real Estate and Rental and Leasing | | | 166,561,714 | | | 15.3 | % |
| Finance and Insurance | | | 135,087,566 | | | 12.4 | % |
| Management of Companies and Enterprises | | | 121,280,028 | | | 11.2 | % |
| Petroleum and Gas | | | 89,365,176 | | | 8.2 | % |
| Retail Trade | | | 88,334,458 | | | 8.1 | % |
| Manufacturing | | | 76,553,352 | | | 7.1 | % |
| Arts, Entertainment, and Recreation | | | 63,027,897 | | | 5.8 | % |
| Mining, Quarrying, and Oil and Gas Extraction | | | 36,972,205 | | | 3.4 | % |
| Utilities | | | 2,615,318 | | | 0.2 | % |
| Construction | | | 1,296,416 | | | 0.1 | % |
| Transportation and Warehousing | | | 68,038 | | | 0.0 | % |
* Excludes Short-Term Investments
| KINETICS PORTFOLIOS TRUST — MASTER INVESTMENT PORTFOLIOS |
| Allocation of Portfolio Assets |
June 30, 2015 (Unaudited) — (Continued) |
The Medical Portfolio
| | | | | | | Percentage | |
| | | | Market | | | of Total | |
| Sector Allocation* | | | Value | | | Net Assets | |
| Manufacturing | | $ | 27,421,081 | | | 91.7 | % |
| Professional, Scientific, and Technical Services | | | 2,408,717 | | | 8.1 | % |
| Finance and Insurance | | | 10,032 | | | 0.0 | % |
* Excludes Short-Term Investments
| KINETICS PORTFOLIOS TRUST — MASTER INVESTMENT PORTFOLIOS |
| Allocation of Portfolio Assets |
June 30, 2015 (Unaudited) — (Continued) |
The Small Cap Opportunities Portfolio
| | | | | | | Percentage | |
| | | | Market | | | of Total | |
| Sector Allocation* | | | Value | | | Net Assets | |
| Manufacturing | | $ | 90,442,367 | | | 27.7 | % |
| Real Estate and Rental and Leasing | | | 62,516,268 | | | 19.2 | % |
| Finance and Insurance | | | 48,470,675 | | | 14.9 | % |
| Management of Companies and Enterprises | | | 30,047,096 | | | 9.2 | % |
| Petroleum and Gas | | | 29,387,687 | | | 9.0 | % |
| Information | | | 22,300,053 | | | 6.8 | % |
| Arts, Entertainment, and Recreation | | | 14,789,620 | | | 4.5 | % |
| Retail Trade | | | 12,316,863 | | | 3.8 | % |
| Mining, Quarrying, and Oil and Gas Extraction | | | 7,610,603 | | | 2.3 | % |
| Accommodation and Food Services | | | 4,118,430 | | | 1.3 | % |
| Utilities | | | 1,695,841 | | | 0.5 | % |
| Wholesale Trade | | | 915,072 | | | 0.3 | % |
* Excludes Short-Term Investments
| KINETICS PORTFOLIOS TRUST — MASTER INVESTMENT PORTFOLIOS |
| Allocation of Portfolio Assets |
June 30, 2015 (Unaudited) — (Continued) |
The Market Opportunities Portfolio
| | | | | | | Percentage | |
| | | | Market | | | of Total | |
| Sector Allocation* | | | Value | | | Net Assets | |
| Finance and Insurance | | $ | 23,123,893 | | | 45.1 | % |
| Management of Companies and Enterprises | | | 6,239,854 | | | 12.2 | % |
| Real Estate and Rental and Leasing | | | 5,941,002 | | | 11.6 | % |
| Petroleum and Gas | | | 4,529,749 | | | 8.8 | % |
| Retail Trade | | | 2,023,526 | | | 4.0 | % |
| Accommodation and Food Services | | | 1,258,320 | | | 2.5 | % |
| Mining, Quarrying, and Oil and Gas Extraction | | | 257,310 | | | 0.5 | % |
| Information | | | 247,144 | | | 0.5 | % |
| Arts, Entertainment, and Recreation | | | 157,710 | | | 0.3 | % |
| Manufacturing | | | 66,726 | | | 0.1 | % |
| Wholesale Trade | | | 16,752 | | | 0.0 | % |
| Support Activities for Water Transportation | | | 9,488 | | | 0.0 | % |
| Industrials | | | 8,601 | | | 0.0 | % |
| Administrative and Support and Waste Management and Remediation Services | | | 5,114 | | | 0.0 | % |
* Excludes Short-Term Investments
| KINETICS PORTFOLIOS TRUST — MASTER INVESTMENT PORTFOLIOS |
| Allocation of Portfolio Assets |
June 30, 2015 (Unaudited) — (Continued) |
The Alternative Income Portfolio
| | | | | | | Percentage | |
| | | | Market | | | of Total | |
| Sector Allocation* | | | Value | | | Net Assets | |
| Finance and Insurance | | $ | 14,857,624 | | | 42.5 | % |
| Manufacturing | | | 7,843,795 | | | 22.4 | % |
| Public Administration | | | 2,604,607 | | | 7.5 | % |
| Retail Trade | | | 1,869,375 | | | 5.3 | % |
| Information | | | 1,580,455 | | | 4.5 | % |
| Mining, Quarrying, and Oil and Gas Extraction | | | 1,281,497 | | | 3.7 | % |
| Utilities | | | 705,849 | | | 2.0 | % |
| Wholesale Trade | | | 700,098 | | | 2.0 | % |
| Professional, Scientific, and Technical Services | | | 431,832 | | | 1.2 | % |
| Accommodations and Food Services | | | 400,422 | | | 1.2 | % |
| Administrative and Support and Waste Management and Remediation Services | | | 389,827 | | | 1.1 | % |
| Transportation and Warehousing | | | 306,367 | | | 0.9 | % |
* Excludes Short-Term Investments & Written Options
| KINETICS PORTFOLIOS TRUST — MASTER INVESTMENT PORTFOLIOS |
| Allocation of Portfolio Assets |
June 30, 2015 (Unaudited) — (Continued) |
The Multi-Disciplinary Income Portfolio
| | | | | | | Percentage | |
| | | | Market | | | of Total | |
| Sector Allocation* | | | Value | | | Net Assets | |
| Information | | $ | 28,241,664 | | | 19.8 | % |
| Finance and Insurance | | | 21,354,892 | | | 15.0 | % |
| Real Estate and Rental and Leasing | | | 19,278,472 | | | 13.5 | % |
| Manufacturing | | | 16,151,195 | | | 11.3 | % |
| Mining, Quarrying, and Oil and Gas Extraction | | | 11,716,208 | | | 8.2 | % |
| Administrative and Support and Waste Management and Remediation Services | | | 9,750,594 | | | 6.8 | % |
| Retail Trade | | | 6,680,126 | | | 4.7 | % |
| Construction | | | 5,243,875 | | | 3.7 | % |
| Accommodation and Food Services | | | 4,622,300 | | | 3.2 | % |
| Transportation and Warehousing | | | 583,750 | | | 0.4 | % |
| Health Care and Social Assistance | | | 531,525 | | | 0.4 | % |
| Professional, Scientific, and Technical Services | | | 497,812 | | | 0.4 | % |
| Utilities | | | 389,747 | | | 0.3 | % |
| Wholesale Trade | | | 290,000 | | | 0.2 | % |
* Excludes Short-Term Investments & Written Options
| KINETICS PORTFOLIOS TRUST — MASTER INVESTMENT PORTFOLIOS |
| The Internet Portfolio |
| Portfolio of Investments — June 30, 2015 (Unaudited) |
| COMMON STOCKS — 98.26% | | Shares | | Value | |
| Administrative and Support Services — 0.29% | | | | | | | |
| CreditRiskMonitor.com, Inc. | | | 600 | | $ | 2,070 | |
| Ctrip.com International Limited — ADR* | | | 5,800 | | | 421,196 | |
| Interval Leisure Group, Inc. | | | 200 | | | 4,570 | |
| | | | | | | 427,836 | |
| Broadcasting (except Internet) — 4.32% | | | | | | | |
| CBS Corporation — Class B | | | 14,000 | | | 777,000 | |
| The E.W. Scripps Company — Class A | | | 76,000 | | | 1,736,600 | |
| The Walt Disney Company | | | 33,000 | | | 3,766,620 | |
| | | | | | | 6,280,220 | |
| Cable Distributor — 8.21% | | | | | | | |
| Liberty Broadband Corporation — Series A* | | | 28,200 | | | 1,437,354 | |
| Liberty Broadband Corporation — Series C* | | | 71,600 | | | 3,663,056 | |
| Liberty Global plc — Series C* | | | 134,800 | | | 6,824,924 | |
| | | | | | | 11,925,334 | |
| Computer and Electronic Product Manufacturing — 0.25% | | | | | | | |
| QUALCOMM Inc. | | | 5,800 | | | 363,254 | |
| Credit Intermediation and Related Activities — 0.49% | | | | | | | |
| LendingTree, Inc.* | | | 9,033 | | | 710,084 | |
| Data Processing, Hosting and Related Services — 0.28% | | | | | | | |
| CoStar Group, Inc.*^ | | | 2,000 | | | 402,520 | |
| Data Processor — 3.94% | | | | | | | |
| MasterCard, Inc. — Class A | | | 28,000 | | | 2,617,440 | |
| Verisk Analytics, Inc. — Class A* | | | 7,600 | | | 552,976 | |
| Visa, Inc. — Class A | | | 38,000 | | | 2,551,700 | |
| | | | | | | 5,722,116 | |
| Defense — 2.52% | | | | | | | |
| CACI International, Inc. — Class A* | | | 35,000 | | | 2,831,150 | |
| ManTech International Corporation — Class A^ | | | 28,800 | | | 835,200 | |
| | | | | | | 3,666,350 | |
The accompanying notes are an integral part of these financial statements.
| KINETICS PORTFOLIOS TRUST — MASTER INVESTMENT PORTFOLIOS |
| The Internet Portfolio |
Portfolio of Investments — June 30, 2015 (Unaudited) — (Continued) |
| | | Shares | | Value | |
| E-Commerce — 14.37% | | | | | | | |
| eBay, Inc.* | | | 72,000 | | $ | 4,337,280 | |
| IAC/InterActiveCorp | | | 47,000 | | | 3,744,020 | |
| Liberty Interactive Corporation — Class A* | | | 338,200 | | | 9,385,050 | |
| Liberty TripAdvisor Holdings Inc. — Series A* | | | 106,000 | | | 3,415,320 | |
| | | | | | | 20,881,670 | |
| Gaming — 0.68% | | | | | | | |
| Melco International Development Limited | | | 700,000 | | | 989,737 | |
| Global Exchanges — 0.11% | | | | | | | |
| JSE Limited | | | 15,000 | | | 158,421 | |
| Holding Company — 2.25% | | | | | | | |
| Icahn Enterprises LP | | | 37,689 | | | 3,268,390 | |
| Media — 27.84% | | | | | | | |
| Discovery Communications, Inc. — Class A*^ | | | 100,000 | | | 3,326,000 | |
| Discovery Communications, Inc. — Class C* | | | 96,000 | | | 2,983,680 | |
| Liberty Media Corporation — Class A* | | | 115,600 | | | 4,166,224 | |
| Liberty Media Corporation — Class C* | | | 186,000 | | | 6,677,400 | |
| Liberty Ventures — Series A* | | | 162,700 | | | 6,389,229 | |
| Scripps Networks Interactive — Class A | | | 72,000 | | | 4,706,640 | |
| Starz — Class A* | | | 127,000 | | | 5,679,440 | |
| Time Warner, Inc.^ | | | 48,000 | | | 4,195,680 | |
| Viacom Inc. — Class B | | | 36,000 | | | 2,327,040 | |
| | | | | | | 40,451,333 | |
| Motion Picture and Sound Recording Industries — 2.49% | | | | | | | |
| DreamWorks Animation SKG, Inc. — Class A*^ | | | 137,200 | | | 3,619,336 | |
| Motor Vehicle and Parts Dealers — 0.73% | | | | | | | |
| AutoNation, Inc.* | | | 16,800 | | | 1,058,064 | |
| Non-Store Retailers — 1.40% | | | | | | | |
| Copart, Inc.* | | | 37,600 | | | 1,334,048 | |
| Overstock.com, Inc.*^ | | | 1,000 | | | 22,540 | |
| Sotheby’s^ | | | 15,000 | | | 678,600 | |
| | | | | | | 2,035,188 | |
| Other Exchanges — 0.04% | | | | | | | |
| CBOE Holdings Inc. | | | 1,000 | | | 57,220 | |
The accompanying notes are an integral part of these financial statements.
| KINETICS PORTFOLIOS TRUST — MASTER INVESTMENT PORTFOLIOS |
| The Internet Portfolio |
Portfolio of Investments — June 30, 2015 (Unaudited) — (Continued) |
| | | Shares | | Value | |
| Other Information Services — 6.99% | | | | | | | |
| Google Inc. — Class A* | | | 7,200 | | $ | 3,888,288 | |
| Google Inc. — Class C* | | | 8,020 | | | 4,174,490 | |
| Yahoo! Inc.* | | | 53,400 | | | 2,098,086 | |
| | | | | | | 10,160,864 | |
| Performing Arts, Spectator Sports, and Related Industries — 5.78% | | | | | | | |
| Live Nation Entertainment, Inc.* | | | 124,000 | | | 3,408,760 | |
| The Madison Square Garden Company — Class A* | | | 59,700 | | | 4,984,353 | |
| | | | | | | 8,393,113 | |
| Professional, Scientific, and Technical Services — 0.01% | | | | | | | |
| Monster Worldwide, Inc.* | | | 2,000 | | | 13,080 | |
| Publishing Industries (except Internet) — 0.11% | | | | | | | |
| Journal Media Group Inc. | | | 19,375 | | | 160,619 | |
| Rental and Leasing Services — 0.17% | | | | | | | |
| Comdisco Holding Company, Inc.* | | | 56,000 | | | 243,600 | |
| Satellite Telecommunications — 14.11% | | | | | | | |
| DISH Network Corp. — Class A* | | | 137,800 | | | 9,330,438 | |
| EchoStar Corporation — Class A* | | | 209,600 | | | 10,203,328 | |
| Loral Space & Communications Inc.* | | | 8,600 | | | 542,832 | |
| ViaSat, Inc.* | | | 7,200 | | | 433,872 | |
| | | | | | | 20,510,470 | |
| Securities, Commodity Contracts, and Other Financial Investments and | | | | | | | |
| Related Activities — 0.86% | | | | | | | |
| IntercontinentalExchange Group, Inc. | | | 1,200 | | | 268,332 | |
| MarketAxess Holdings, Inc. | | | 5,700 | | | 528,789 | |
| OTC Markets Group Inc. — Class A | | | 30,600 | | | 455,940 | |
| | | | | | | 1,253,061 | |
| Telecommunications — 0.02% | | | | | | | |
| ICTC Group Inc.* | | | 149 | | | 2,980 | |
| SoftBank Corp. | | | 400 | | | 23,562 | |
| | | | | | | 26,542 | |
| TOTAL COMMON STOCKS | | | | | | | |
| (cost $67,979,077) | | | | | | 142,778,422 | |
The accompanying notes are an integral part of these financial statements.
| KINETICS PORTFOLIOS TRUST — MASTER INVESTMENT PORTFOLIOS |
| The Internet Portfolio |
Portfolio of Investments — June 30, 2015 (Unaudited) — (Continued) |
| | | Principal | | | |
| ESCROW NOTES — 0.00% | | Amount | | Value | |
| Special Purpose Entity — 0.00% | | | | | | | |
| Adelphia Communications Corp. Preferred*+ | | $ | 190,000 | | $ | — | |
| TOTAL ESCROW NOTES | | | | | | | |
| (cost $0) | | | | | | — | |
| | | | | | | | |
| RIGHTS — 0.08% | | Shares | | | | |
| Rental and Leasing Services — 0.08% | | | | | | | |
| Comdisco Holding Company, Inc.*^# | | | 1,800,000 | | | 115,200 | |
| TOTAL RIGHTS | | | | | | | |
| (cost $21,920) | | | | | | 115,200 | |
| | | | | | | | |
| INVESTMENTS PURCHASED WITH THE CASH | | | | | | | |
| PROCEEDS FROM SECURITIES LENDING — 3.62% | | | | | | | |
| Money Market Funds — 3.62% | | | | | | | |
Mount Vernon Securities Lending Trust — Prime Portfolio, 0.23%b | | | 5,262,475 | | | 5,262,475 | |
| TOTAL INVESTMENTS PURCHASED WITH THE | | | | | | | |
| CASH PROCEEDS FROM SECURITIES LENDING | | | | | | | |
| (cost $5,262,475) | | | | | | 5,262,475 | |
| TOTAL INVESTMENTS — 101.96% | | | | | | | |
| (cost $73,263,472) | | | | | $ | 148,156,097 | |
The accompanying notes are an integral part of these financial statements.
| KINETICS PORTFOLIOS TRUST — MASTER INVESTMENT PORTFOLIOS |
| The Internet Portfolio |
Portfolio of Investments — June 30, 2015 (Unaudited) — (Continued) |
Percentages are stated as a percent of net assets.
| *— | Non-income producing security. |
| ^ — | This security or a portion of this security was out on loan at June 30, 2015. Total loaned securities had a market value of $5,086,658 at June 30, 2015. |
| — | Security is considered illiquid and was fair valued. The aggregate value of such securities is $0 or 0.00% of net assets. |
| — | Contingent value right (contingent upon profitability of company). |
| b — | The rate quoted is the annualized seven-day yield as of June 30, 2015. |
ADR — American Depository Receipt.
The accompanying notes are an integral part of these financial statements.
| KINETICS PORTFOLIOS TRUST — MASTER INVESTMENT PORTFOLIOS |
| The Global Portfolio |
Portfolio of Investments — June 30, 2015 (Unaudited) — (Continued) |
| COMMON STOCKS — 96.15% | | Shares | | Value | |
| Apparel Manufacturing — 2.00% | | | | | | | |
| LVMH Moet Hennessy Louis Vuitton SA | | | 1,000 | | $ | 175,199 | |
| Asset Management — 8.10% | | | | | | | |
| Apollo Global Management LLC — Class A | | | 300 | | | 6,645 | |
| Brookfield Asset Management Inc. — Class A | | | 6,000 | | | 209,580 | |
| JZ Capital Partners Limited | | | 10,000 | | | 70,470 | |
| Onex Corporation | | | 7,000 | | | 387,100 | |
| Partners Value Investments Inc.* | | | 1,200 | | | 35,068 | |
| | | | | | | 708,863 | |
| Cable Distributor — 2.11% | | | | | | | |
| Altice SA* | | | 100 | | | 13,774 | |
| Liberty Broadband Corporation — Series A* | | | 900 | | | 45,873 | |
| Liberty Broadband Corporation — Series C* | | | 2,340 | | | 119,714 | |
| Numericable Group SA* | | | 100 | | | 5,301 | |
| | | | | | | 184,662 | |
| Chemical Manufacturing — 1.46% | | | | | | | |
| Platform Specialty Products Corporation* | | | 5,000 | | | 127,900 | |
| Construction of Buildings — 0.43% | | | | | | | |
| Lennar Corporation — Class A | | | 200 | | | 10,208 | |
| TRI Pointe Homes, Inc.* | | | 1,800 | | | 27,540 | |
| | | | | | | 37,748 | |
| Crop Production — 0.27% | | | | | | | |
| Cresud S.A.C.I.F.y A. — ADR*^ | | | 1,785 | | | 23,241 | |
| E-Commerce — 5.09% | | | | | | | |
| Liberty Interactive Corporation — Class A* | | | 10,000 | | | 277,500 | |
| Liberty TripAdvisor Holdings Inc. — Series A* | | | 5,200 | | | 167,544 | |
| | | | | | | 445,044 | |
| Electronics and Appliance Stores — 0.20% | | | | | | | |
| Sears Hometown and Outlet Stores Inc.* | | | 1,800 | | | 17,100 | |
| European Exchanges — 1.45% | | | | | | | |
| Bolsas y Mercados Espanoles | | | 3,130 | | | 126,599 | |
| Gaming — 1.13% | | | | | | | |
| Wynn Resorts Limited | | | 1,000 | | | 98,670 | |
The accompanying notes are an integral part of these financial statements.
| KINETICS PORTFOLIOS TRUST — MASTER INVESTMENT PORTFOLIOS |
| The Global Portfolio |
Portfolio of Investments — June 30, 2015 (Unaudited) — (Continued) |
| | | Shares | | Value | |
| General Merchandise Stores — 2.41% | | | | | | | |
| Sears Canada Inc.*^ | | | 6,600 | | $ | 40,194 | |
| Sears Holdings Corporation*^ | | | 6,400 | | | 170,880 | |
| | | | | | | 211,074 | |
| Global Exchanges — 0.41% | | | | | | | |
| BM&FBOVESPA SA | | | 9,470 | | | 35,728 | |
| Holding Company — 19.33% | | | | | | | |
| Bollore SA | | | 92,500 | | | 492,416 | |
| Clarke Inc. | | | 33,000 | | | 313,091 | |
| Dundee Corporation — Class A* | | | 35,800 | | | 359,790 | |
| HRG Group, Inc.* | | | 200 | | | 2,600 | |
| Icahn Enterprises LP | | | 5,994 | | | 519,800 | |
| Investor AB — B Shares | | | 100 | | | 3,726 | |
| | | | | | | 1,691,423 | |
| Insurance Carriers and Related Activities — 0.11% | | | | | | | |
| Fairfax Financial Holdings Limited | | | 20 | | | 9,880 | |
| Jewelry, Watch, Precious Stone, and Precious Metal | | | | | | | |
| Merchant Wholesalers — 2.60% | | | | | | | |
| Compagnie Financiere Richemont SA | | | 2,800 | | | 227,756 | |
| Lessors of Nonresidential Buildings (except Miniwarehouses) — 6.56% | | | | | | | |
| The Howard Hughes Corporation* | | | 4,000 | | | 574,160 | |
| Media — 10.40% | | | | | | | |
| Discovery Communications, Inc. — Class A* | | | 1,200 | | | 39,912 | |
| Discovery Communications, Inc. — Class C* | | | 1,200 | | | 37,296 | |
| Liberty Media Corporation — Class A* | | | 3,600 | | | 129,744 | |
| Liberty Media Corporation — Class C* | | | 7,200 | | | 258,480 | |
| Liberty Ventures — Series A* | | | 7,332 | | | 287,927 | |
| Starz — Class A* | | | 3,494 | | | 156,252 | |
| | | | | | | 909,611 | |
| Mining (except Oil and Gas) — 0.94% | | | | | | | |
| Franco-Nevada Corporation | | | 1,200 | | | 57,180 | |
| NovaCopper Inc.*^ | | | 666 | | | 333 | |
| NovaGold Resources Inc.* | | | 4,000 | | | 13,680 | |
| Sandstorm Gold Limited* | | | 3,600 | | | 10,584 | |
| | | | | | | 81,777 | |
| Motion Picture and Sound Recording Industries — 2.17% | | | | | | | |
| DreamWorks Animation SKG, Inc. — Class A*^ | | | 7,200 | | | 189,936 | |
The accompanying notes are an integral part of these financial statements.
| KINETICS PORTFOLIOS TRUST — MASTER INVESTMENT PORTFOLIOS |
| The Global Portfolio |
Portfolio of Investments — June 30, 2015 (Unaudited) — (Continued) |
| | | Shares | | Value | |
| Oil and Gas — 4.65% | | | | | | | |
| Texas Pacific Land Trust | | | 2,700 | | $ | 406,323 | |
| Oil and Gas Extraction — 7.13% | | | | | | | |
| Continental Resources, Inc.* | | | 2,100 | | | 89,019 | |
| Paramount Resources Limited — Class A* | | | 1,410 | | | 32,400 | |
| Siem Industries Inc. | | | 6,600 | | | 442,200 | |
| Tourmaline Oil Corp.* | | | 2,000 | | | 60,080 | |
| | | | | | | 623,699 | |
| Oil Refining — 0.88% | | | | | | | |
| Par Petroleum Corporation* | | | 4,114 | | | 77,014 | |
| Other Information Services — 0.01% | | | | | | | |
| Internet Initiative Japan Inc. — ADR | | | 100 | | | 872 | |
| Pipeline Transportation — 0.08% | | | | | | | |
| Rubis SCA | | | 100 | | | 6,852 | |
| Publishing Industries (except Internet) — 0.09% | | | | | | | |
| Promotora de Informaciones S.A. — ADR* | | | 240 | | | 2,057 | |
| Promotora de Informaciones S.A. — Class A* | | | 610 | | | 5,406 | |
| | | | | | | 7,463 | |
| Real Estate — 4.86% | | | | | | | |
| Brookfield Property Partners LP | | | 281 | | | 6,196 | |
| Dream Unlimited Corp. — Class A* | | | 54,000 | | | 418,943 | |
| | | | | | | 425,139 | |
| Restaurants — 7.23% | | | | | | | |
| Restaurant Brands International LP | | | 18 | | | 652 | |
| Restaurant Brands International, Inc. | | | 1,782 | | | 68,090 | |
| The Wendy’s Company | | | 50,000 | | | 564,000 | |
| | | | | | | 632,742 | |
| Satellite Telecommunications — 3.17% | | | | | | | |
| DISH Network Corp. — Class A* | | | 1,800 | | | 121,878 | |
| EchoStar Corporation — Class A* | | | 3,200 | | | 155,776 | |
| | | | | | | 277,654 | |
| Telecommunications — 0.44% | | | | | | | |
| Cable & Wireless Communications plc | | | 9,000 | | | 9,418 | |
| SoftBank Corp. | | | 500 | | | 29,452 | |
| | | | | | | 38,870 | |
The accompanying notes are an integral part of these financial statements.
| KINETICS PORTFOLIOS TRUST — MASTER INVESTMENT PORTFOLIOS |
| The Global Portfolio |
Portfolio of Investments — June 30, 2015 (Unaudited) — (Continued) |
| | | Shares | | Value | |
| Transportation — 0.05% | | | | | | | |
| Clarkson plc | | | 100 | | $ | 4,300 | |
| Transportation Equipment Manufacturing — 0.39% | | | | | | | |
| HEICO Corporation — Class A | | | 675 | | | 34,270 | |
| TOTAL COMMON STOCKS | | | | | | | |
| (cost $7,049,551) | | | | | | 8,411,569 | |
| | | | | | | | |
| | | Principal | | | | |
| CORPORATE BONDS — 0.40% | | Amount | | | | |
| General Merchandise Stores — 0.40% | | | | | | | |
| Sears Holdings Corporation, 8.000%, 12/15/2019 | | $ | 39,500 | | | 35,155 | |
| TOTAL CORPORATE BONDS | | | | | | | |
| (cost $39,500) | | | | | | 35,155 | |
| | | | | | | | |
| MUTUAL FUNDS — 0.69% | | Shares | | | | |
| Funds, Trusts, and Other Financial Vehicles — 0.69% | | | | | | | |
| Templeton Russia and East European Fund, Inc. | | | 6,000 | | | 60,300 | |
| TOTAL MUTUAL FUNDS | | | | | | | |
| (cost $79,646) | | | | | | 60,300 | |
| | | | | | | | |
| WARRANTS — 0.24% | | | | | | | |
| General Merchandise Stores — 0.24% | | | | | | | |
| Sears Holdings Corporation*^ | | | 1,390 | | | 20,864 | |
| TOTAL WARRANTS | | | | | | | |
| (cost $19,439) | | | | | | 20,864 | |
| | | | | | | | |
| | | Principal | | | | |
| SHORT-TERM INVESTMENTS — 2.35% | | Amount | | | | |
| Commercial Paper — 2.34% | | | | | | | |
| U.S. Bank N.A., 0.02%, 07/01/2015 | | $ | 205,000 | | | 205,000 | |
| | | | | | | | |
| | | Shares | | | | |
| Money Market Funds — 0.01% | | | | | | | |
Fidelity Institutional Government Portfolio — Class I, 0.01%b | | | 635 | | | 635 | |
| TOTAL SHORT-TERM INVESTMENTS | | | | | | | |
| (cost $205,635) | | | | | | 205,635 | |
The accompanying notes are an integral part of these financial statements.
| KINETICS PORTFOLIOS TRUST — MASTER INVESTMENT PORTFOLIOS |
| The Global Portfolio |
Portfolio of Investments — June 30, 2015 (Unaudited) — (Continued) |
| INVESTMENTS PURCHASED WITH THE CASH | | | | | |
| PROCEEDS FROM SECURITIES LENDING — 5.29% | | Shares | | Value | |
| Money Market Funds — 5.29% | | | | | | | |
Mount Vernon Securities Lending Trust — Prime Portfolio, 0.23%b | | | 463,370 | | $ | 463,370 | |
| TOTAL INVESTMENTS PURCHASED WITH THE CASH PROCEEDS FROM SECURITIES LENDING | | | | | | | |
| (cost $463,370) | | | | | | 463,370 | |
| TOTAL INVESTMENTS — 105.12% | | | | | | | |
| (cost $7,857,141) | | | | | $ | 9,196,893 | |
Percentages are stated as a percent of net assets.
* — Non-income producing security.
^ — This security or a portion of this security was out on loan at June 30, 2015. Total loaned securities had a market value of $436,732 at June 30, 2015.
b — The rate quoted is the annualized seven-day yield as of June 30, 2015.
ADR — American Depository Receipt.
The accompanying notes are an integral part of these financial statements.
| KINETICS PORTFOLIOS TRUST — MASTER INVESTMENT PORTFOLIOS |
| The Paradigm Portfolio |
Portfolio of Investments — June 30, 2015 (Unaudited) — (Continued) |
| COMMON STOCKS — 95.87% | | Shares | | Value | |
| Apparel Manufacturing — 0.17% | | | | | | | |
| L Brands, Inc. | | | 21,900 | | $ | 1,877,487 | |
| Asset Management — 6.88% | | | | | | | |
| Apollo Global Management LLC — Class A | | | 1,000 | | | 22,150 | |
| Brookfield Asset Management Inc. — Class A | | | 1,476,100 | | | 51,560,173 | |
| GAMCO Investors, Inc. — Class A | | | 500 | | | 34,355 | |
| Onex Corporation | | | 373,200 | | | 20,637,960 | |
| Partners Value Investments Inc.* | | | 800 | | | 23,379 | |
| RIT Capital Partners plc | | | 20,600 | | | 500,726 | |
| Value Partners Group Limited | | | 1,128,000 | | | 1,781,156 | |
| WisdomTree Investments, Inc. | | | 11,000 | | | 241,615 | |
| | | | | | | 74,801,514 | |
| Beverage and Tobacco Product Manufacturing — 0.15% | | | | | | | |
| Brown-Forman Corporation — Class A^ | | | 450 | | | 50,139 | |
| Castle Brands, Inc.* | | | 72,000 | | | 100,080 | |
| Crimson Wine Group Limited* | | | 154,000 | | | 1,439,900 | |
| | | | | | | 1,590,119 | |
| Broadcasting (except Internet) — 1.14% | | | | | | | |
| CBS Corporation — Class B | | | 223,800 | | | 12,420,900 | |
| Cable Distributor — 2.40% | | | | | | | |
| Liberty Broadband Corporation — Series A* | | | 137,600 | | | 7,013,472 | |
| Liberty Broadband Corporation — Series C* | | | 373,600 | | | 19,113,376 | |
| | | | | | | 26,126,848 | |
| Chemical Manufacturing — 0.32% | | | | | | | |
| Platform Specialty Products Corporation* | | | 136,800 | | | 3,499,344 | |
| Construction of Buildings — 0.22% | | | | | | | |
| Green Brick Partners, Inc.*^ | | | 3,600 | | | 39,420 | |
| Lennar Corporation — Class A^ | | | 25,400 | | | 1,296,416 | |
| TRI Pointe Homes, Inc.* | | | 66,800 | | | 1,022,040 | |
| | | | | | | 2,357,876 | |
| Credit Intermediation and Related Activities — 0.00% | | | | | | | |
| Imperial Holdings, Inc.*^ | | | 7,500 | | | 43,425 | |
| E-Commerce — 3.19% | | | | | | | |
| IAC/InterActiveCorp | | | 12,400 | | | 987,784 | |
| Liberty Interactive Corporation — Class A* | | | 1,039,600 | | | 28,848,900 | |
| Liberty TripAdvisor Holdings Inc. — Series A* | | | 150,200 | | | 4,839,444 | |
| | | | | | | 34,676,128 | |
The accompanying notes are an integral part of these financial statements.
| KINETICS PORTFOLIOS TRUST — MASTER INVESTMENT PORTFOLIOS |
| The Paradigm Portfolio |
Portfolio of Investments — June 30, 2015 (Unaudited) — (Continued) |
| | | Shares | | Value | |
| Electrical Equipment, Appliance, and Component Manufacturing — 0.00% | | | | | | | |
| Danaher Corporation | | | 100 | | $ | 8,559 | |
| Electronics and Appliance Stores — 0.09% | | | | | | | |
| Sears Hometown and Outlet Stores Inc.*^ | | | 97,400 | | | 925,300 | |
| Gaming — 1.69% | | | | | | | |
| Las Vegas Sands Corp. | | | 172,600 | | | 9,073,582 | |
| MGM Resorts International* | | | 168,800 | | | 3,080,600 | |
| Wynn Resorts Limited | | | 63,000 | | | 6,216,210 | |
| | | | | | | 18,370,392 | |
| General Merchandise Stores — 1.26% | | | | | | | |
| Sears Canada Inc.*^ | | | 447,200 | | | 2,723,448 | |
| Sears Holdings Corporation*^ | | | 410,000 | | | 10,947,000 | |
| | | | | | | 13,670,448 | |
| Global Exchanges — 0.18% | | | | | | | |
| JSE Limited | | | 184,900 | | | 1,952,803 | |
| Holding Company — 9.17% | | | | | | | |
| Bollore SA | | | 608,200 | | | 3,237,703 | |
| Dundee Corporation — Class A*^ | | | 167,000 | | | 1,678,350 | |
| Icahn Enterprises LP | | | 913,818 | | | 79,246,297 | |
| Leucadia National Corporation | | | 640,700 | | | 15,556,196 | |
| | | | | | | 99,718,546 | |
| Insurance Carriers and Related Activities — 1.67% | | | | | | | |
| Markel Corporation* | | | 22,732 | | | 18,201,058 | |
| Lessors of Nonresidential Buildings (except Miniwarehouses) — 12.21% | | | | | | | |
| The Howard Hughes Corporation* | | | 897,200 | | | 128,784,088 | |
| Rouse Properties, Inc.^ | | | 244,000 | | | 3,989,400 | |
| | | | | | | 132,773,488 | |
| Lessors of Residential Buildings and Dwellings — 0.68% | | | | | | | |
| Equity Lifestyle Properties, Inc. — REIT | | | 140,400 | | | 7,382,232 | |
| Machinery Manufacturing — 0.07% | | | | | | | |
| Colfax Corporation*^ | | | 17,000 | | | 784,550 | |
| Manufactured Brands — 3.55% | | | | | | | |
| Jarden Corporation* | | | 745,000 | | | 38,553,750 | |
| Movado Group, Inc. | | | 800 | | | 21,728 | |
| | | | | | | 38,575,478 | |
The accompanying notes are an integral part of these financial statements.
| KINETICS PORTFOLIOS TRUST — MASTER INVESTMENT PORTFOLIOS |
| The Paradigm Portfolio |
Portfolio of Investments — June 30, 2015 (Unaudited) — (Continued) |
| | | Shares | | | Value | |
| Media — 11.31% | | | | | | |
| Discovery Communications, Inc. — Class A*^ | | | 345,300 | | | $ | 11,484,678 | |
| Discovery Communications, Inc. — Class C* | | | 268,500 | | | | 8,344,980 | |
| Liberty Media Corporation — Class A* | | | 580,800 | | | | 20,932,032 | |
| Liberty Media Corporation — Class C* | | | 1,013,300 | | | | 36,377,470 | |
| Liberty Ventures — Series A* | | | 332,200 | | | | 13,045,494 | |
| Scripps Networks Interactive — Class A | | | 60,000 | | | | 3,922,200 | |
| Starz — Class A* | | | 558,900 | | | | 24,994,008 | |
| Viacom Inc. — Class B | | | 60,000 | | | | 3,878,400 | |
| | | | | | | | 122,979,262 | |
| Mining (except Oil and Gas) — 1.26% | | | | | | | | |
| Franco-Nevada Corporation | | | 286,200 | | | | 13,637,430 | |
| Motion Picture and Sound Recording Industries — 3.56% | | | | | | | | |
| DreamWorks Animation SKG, Inc. — Class A*^ | | | 1,468,100 | | | | 38,728,478 | |
| Motor Vehicle and Parts Dealers — 5.02% | | | | | | | | |
| AutoNation, Inc.* | | | 865,600 | | | | 54,515,488 | |
| Non-Store Retailers — 0.17% | | | | | | | | |
| Lands’ End, Inc.*^ | | | 76,200 | | | | 1,892,046 | |
| Oil and Gas — 8.22% | | | | | | | | |
Texas Pacific Land Trust^c | | | 593,828 | | | | 89,365,176 | |
| Oil and Gas Extraction — 2.10% | | | | | | | | |
| Canadian Natural Resources Limited | | | 61,300 | | | | 1,664,908 | |
| Continental Resources, Inc.*^ | | | 178,400 | | | | 7,562,376 | |
| Siem Industries Inc. | | | 29,700 | | | | 1,989,900 | |
| Tourmaline Oil Corp.* | | | 386,000 | | | | 11,595,452 | |
| | | | | | | | 22,812,636 | |
| Oil Refining — 0.05% | | | | | | | | |
| Par Petroleum Corporation* | | | 27,892 | | | | 522,138 | |
| Other Exchanges — 3.53% | | | | | | | | |
| CBOE Holdings Inc. | | | 660,200 | | | | 37,776,644 | |
| Urbana Corporation — Class A | | | 368,178 | | | | 633,773 | |
| | | | | | | | 38,410,417 | |
| Performing Arts, Spectator Sports, and Related Industries — 4.11% | | | | | | | | |
| Live Nation Entertainment, Inc.* | | | 1,624,500 | | | | 44,657,505 | |
| Pharmaceuticals — 0.01% | | | | | | | | |
| OPKO Health, Inc.*^ | | | 4,000 | | | | 64,320 | |
The accompanying notes are an integral part of these financial statements.
| KINETICS PORTFOLIOS TRUST — MASTER INVESTMENT PORTFOLIOS |
| The Paradigm Portfolio |
Portfolio of Investments — June 30, 2015 (Unaudited) — (Continued) |
| | | Shares | | | Value | |
| Real Estate — 2.33% | | | | | | |
| Brookfield Property Partners LP | | | 71,064 | | | $ | 1,566,961 | |
| Dream Unlimited Corp. — Class A* | | | 304,200 | | | | 2,360,047 | |
| Forest City Enterprises, Inc. — Class A* | | | 818,600 | | | | 18,091,060 | |
| Urban Edge Properties — REIT | | | 14,800 | | | | 307,692 | |
| Vornado Realty Trust — REIT | | | 31,800 | | | | 3,018,774 | |
| | | | | | | | 25,344,534 | |
| Restaurants — 2.94% | | | | | | | | |
| The Wendy’s Company | | | 2,834,000 | | | | 31,967,520 | |
| Satellite Telecommunications — 5.96% | | | | | | | | |
| DISH Network Corp. — Class A* | | | 614,000 | | | | 41,573,940 | |
| EchoStar Corporation — Class A* | | | 477,400 | | | | 23,239,832 | |
| | | | | | | | 64,813,772 | |
| Support Activities for Transportation — 0.01% | | | | | | | | |
| HNA Infrastructure Company Limited | | | 60,000 | | | | 68,038 | |
| Transportation Equipment Manufacturing — 0.01% | | | | | | | | |
| HEICO Corporation — Class A | | | 1,250 | | | | 63,462 | |
| Utilities — 0.24% | | | | | | | | |
| Brookfield Infrastructure Partners LP^ | | | 58,600 | | | | 2,615,318 | |
| TOTAL COMMON STOCKS | | | | | | | | |
| (cost $645,656,787) | | | | | | | 1,042,214,035 | |
| | | | | | | | | |
| | | Principal | | | | | |
| ESCROW NOTES — 0.00% | | Amount | | | | | |
| Special Purpose Entity — 0.00% | | | | | | | | |
| Adelphia Communications Corp.*+ | | $ | 200,000 | | | | — | |
| TOTAL ESCROW NOTES | | | | | | | | |
| (cost $0) | | | | | | | — | |
| | | | | | | | | |
| WARRANTS — 0.13% | | Shares | | | | | |
| General Merchandise Stores — 0.13% | | | | | | | | |
| Sears Holdings Corporation*^ | | | 94,631 | | | | 1,420,411 | |
| TOTAL WARRANTS | | | | | | | | |
| (cost $1,567,656) | | | | | | | 1,420,411 | |
The accompanying notes are an integral part of these financial statements.
| KINETICS PORTFOLIOS TRUST — MASTER INVESTMENT PORTFOLIOS |
| The Paradigm Portfolio |
Portfolio of Investments — June 30, 2015 (Unaudited) — (Continued) |
| | | Principal | | | | |
| SHORT-TERM INVESTMENTS — 3.73% | | Amount | | | Value | |
| Commercial Paper — 3.73% | | | | | | |
| U.S. Bank N.A., 0.02%, 07/01/2015 | | $ | 40,549,000 | | | $ | 40,549,000 | |
| | | | | | | | | |
| | | Shares | | | | | |
| Money Market Funds — 0.00% | | | | | | | | |
Fidelity Institutional Government Portfolio — Class I, 0.01%b | | | 370 | | | | 370 | |
| TOTAL SHORT-TERM INVESTMENTS | | | | | | | | |
| (cost $40,549,370) | | | | | | | 40,549,370 | |
| | | | | | | | | |
| INVESTMENTS PURCHASED WITH THE CASH PROCEEDS | | | | | | | | |
| FROM SECURITIES LENDING — 7.38% | | | | | | | | |
| Money Market Funds — 7.38% | | | | | | | | |
Mount Vernon Securities Lending Trust — Prime Portfolio, 0.23%b | | | 80,187,483 | | | | 80,187,483 | |
| TOTAL INVESTMENTS PURCHASED WITH THE CASH | | | | | | | | |
| PROCEEDS FROM SECURITIES LENDING | | | | | | | | |
| (cost $80,187,483) | | | | | | | 80,187,483 | |
| TOTAL INVESTMENTS — 107.11% | | | | | | | | |
| (cost $767,961,296) | | | | | | $ | 1,164,371,299 | |
Percentages are stated as a percent of net assets.
* — Non-income producing security.
^ — This security or a portion of this security was out on loan at June 30, 2015. Total loaned securities had a market value of $76,631,535 at June 30, 2015.
+ — Security is considered illiquid and was fair valued. The aggregate value of such securities is $0 or 0.00% of net assets.
b — The rate quoted is the annualized seven-day yield as of June 30, 2015.
c — Affiliated issuer. See Note 11.
REIT — Real Estate Investment Trust.
The accompanying notes are an integral part of these financial statements.
| KINETICS PORTFOLIOS TRUST — MASTER INVESTMENT PORTFOLIOS |
| The Medical Portfolio |
Portfolio of Investments — June 30, 2015 (Unaudited) — (Continued) |
| COMMON STOCKS — 99.72% | | Shares | | | Value | |
| Chemical Manufacturing — 7.31% | | | | | | |
| Agenus, Inc.* | | | 148 | | | $ | 1,277 | |
| AmpliPhi Biosciences Corp.* | | | 1,000 | | | | 187 | |
| Celgene Corporation* | | | 5,000 | | | | 578,675 | |
| Gilead Sciences, Inc. | | | 8,000 | | | | 936,640 | |
| Immune Pharmaceuticals Inc.* | | | 17 | | | | 33 | |
| Lonza Group AG* | | | 5,000 | | | | 667,950 | |
| MMRGlobal Inc.* | | | 43,000 | | | | 280 | |
| | | | | | | | 2,185,042 | |
| Pharmaceutical and Biotechnology — 84.35% | | | | | | | | |
| AbbVie Inc. | | | 14,000 | | | | 940,660 | |
| Alkermes plc* | | | 25,000 | | | | 1,608,500 | |
| Arena Pharmaceuticals, Inc.*^ | | | 45,000 | | | | 208,800 | |
| AstraZeneca plc — ADR | | | 13,000 | | | | 828,230 | |
| Biogen Inc.* | | | 7,250 | | | | 2,928,565 | |
| Bristol-Myers Squibb Company | | | 34,000 | | | | 2,262,360 | |
| Celldex Therapeutics Inc.*^ | | | 26,294 | | | | 663,135 | |
| Eli Lilly & Company | | | 23,000 | | | | 1,920,270 | |
| GlaxoSmithKline plc — ADR | | | 22,673 | | | | 944,330 | |
| Isis Pharmaceuticals, Inc.*^ | | | 17,000 | | | | 978,350 | |
| Johnson & Johnson | | | 14,000 | | | | 1,364,440 | |
| Merck & Co., Inc. | | | 16,000 | | | | 910,880 | |
| Merrimack Pharmaceuticals, Inc.*^ | | | 19,000 | | | | 234,935 | |
| Novartis AG — ADR | | | 18,000 | | | | 1,770,120 | |
| Oncothyreon, Inc.* | | | 33,333 | | | | 124,665 | |
| Osiris Therapeutics, Inc.*^ | | | 19,000 | | | | 369,740 | |
| Pfizer, Inc. | | | 46,000 | | | | 1,542,380 | |
| Progenics Pharmaceuticals, Inc.*^ | | | 67,200 | | | | 501,312 | |
| Receptos, Inc.* | | | 8,000 | | | | 1,520,400 | |
| Roche Holding AG Limited — ADR | | | 22,000 | | | | 771,540 | |
| Sanofi — ADR | | | 26,000 | | | | 1,287,780 | |
| Shire plc — ADR | | | 6,000 | | | | 1,448,940 | |
| Synta Pharmaceuticals Corp.* | | | 16,000 | | | | 35,680 | |
| Vical Inc.* | | | 84,500 | | | | 59,150 | |
| | | | | | | | 25,225,162 | |
The accompanying notes are an integral part of these financial statements.
| KINETICS PORTFOLIOS TRUST — MASTER INVESTMENT PORTFOLIOS |
| The Medical Portfolio |
Portfolio of Investments — June 30, 2015 (Unaudited) — (Continued) |
| | | Shares | | | Value | |
| Professional, Scientific, and Technical Services — 8.06% | | | | | | |
| Affymetrix, Inc.*^ | | | 104,000 | | | $ | 1,135,680 | |
| Albany Molecular Research, Inc.*^ | | | 56,000 | | | | 1,132,320 | |
| Codexis, Inc.* | | | 5,611 | | | | 21,827 | |
| Onconova Therapeutics, Inc.*^ | | | 21,000 | | | | 49,770 | |
| Pacific Biosciences of California Inc.*^ | | | 12,000 | | | | 69,120 | |
| | | | | | | | 2,408,717 | |
| TOTAL COMMON STOCKS | | | | | | | | |
| (cost $17,567,372) | | | | | | | 29,818,921 | |
| | | | | | | | | |
| RIGHTS — 0.07% | | | | | | | | |
| Funds, Trusts, and Other Financial Vehicles — 0.03% | | | | | | | | |
| Ligand Pharmaceuticals Inc.* | | | 44,000 | | | | 1,804 | |
| Ligand Pharmaceuticals Inc.* | | | 44,000 | | | | 4,840 | |
| Ligand Pharmaceuticals Inc. | | | 44,000 | | | | 3,080 | |
| Ligand Pharmaceuticals Inc.* | | | 44,000 | | | | 308 | |
| | | | | | | | 10,032 | |
| Pharmaceutical and Biotechnology — 0.04% | | | | | | | | |
| Sanofi* | | | 15,538 | | | | 10,877 | |
| TOTAL RIGHTS | | | | | | | | |
| (cost $0) | | | | | | | 20,909 | |
| | | | | | | | | |
| | | Principal | | | | | |
| SHORT-TERM INVESTMENTS — 0.16% | | Amount | | | | | |
| Commercial Paper — 0.16% | | | | | | | | |
| U.S. Bank N.A., 0.02%, 07/01/2015 | | $ | 49,000 | | | | 49,000 | |
| | | | | | | | | |
| | | Shares | | | | | |
| Money Market Funds — 0.00% | | | | | | | | |
Fidelity Institutional Government Portfolio — Class I, 0.01%b | | | 610 | | | | 610 | |
| TOTAL SHORT-TERM INVESTMENTS | | | | | | | | |
| (cost $49,610) | | | | | | | 49,610 | |
The accompanying notes are an integral part of these financial statements.
| KINETICS PORTFOLIOS TRUST — MASTER INVESTMENT PORTFOLIOS |
| The Medical Portfolio |
Portfolio of Investments — June 30, 2015 (Unaudited) — (Continued) |
| INVESTMENTS PURCHASED WITH THE CASH | | | | | | |
| PROCEEDS FROM SECURITIES LENDING — 10.53% | | Shares | | | Value | |
| Money Market Funds — 10.53% | | | | | | |
Mount Vernon Securities Lending Trust — Prime Portfolio, 0.23%b | | | 3,148,825 | | | $ | 3,148,825 | |
| TOTAL INVESTMENTS PURCHASED WITH THE CASH PROCEEDS | | | | | | | | |
| FROM SECURITIES LENDING | | | | | | | | |
| (cost $3,148,825) | | | | | | | 3,148,825 | |
| TOTAL INVESTMENTS — 110.48% | | | | | | | | |
| (cost $20,765,807) | | | | | | $ | 33,038,265 | |
Percentages are stated as a percent of net assets.
* — Non-income producing security.
^ — This security or a portion of this security was out on loan at June 30, 2015. Total loaned securities had a market value of $3,077,519 at June 30, 2015.
b — The rate quoted is the annualized seven-day yield as of June 30, 2015.
ADR — American Depository Receipt.
The accompanying notes are an integral part of these financial statements.
| KINETICS PORTFOLIOS TRUST — MASTER INVESTMENT PORTFOLIOS |
| The Small Cap Opportunities Portfolio |
Portfolio of Investments — June 30, 2015 (Unaudited) — (Continued) |
| COMMON STOCKS — 99.37% | | Shares | | | Value | |
| Asset Management — 6.78% | | | | | | |
| GAMCO Investors, Inc. — Class A | | | 23,400 | | | $ | 1,607,814 | |
| JZ Capital Partners Limited | | | 196,400 | | | | 1,384,033 | |
| Onex Corporation | | | 185,300 | | | | 10,253,069 | |
| Partners Value Investments Inc.* | | | 191,000 | | | | 5,581,665 | |
| RIT Capital Partners plc | | | 135,200 | | | | 3,286,318 | |
| Sprott, Inc. | | | 1,680 | | | | 3,322 | |
| | | | | | | | 22,116,221 | |
| Chemical Manufacturing — 4.89% | | | | | | | | |
| Inter Parfums, Inc. | | | 155,100 | | | | 5,262,543 | |
| Platform Specialty Products Corporation* | | | 418,300 | | | | 10,700,114 | |
| | | | | | | | 15,962,657 | |
| Construction of Buildings — 4.49% | | | | | | | | |
| Green Brick Partners, Inc.* | | | 398,700 | | | | 4,365,765 | |
| TRI Pointe Homes, Inc.* | | | 672,700 | | | | 10,292,310 | |
| | | | | | | | 14,658,075 | |
| Credit Intermediation and Related Activities — 1.55% | | | | | | | | |
| BOK Financial Corporation | | | 11,400 | | | | 793,212 | |
| Imperial Holdings, Inc.*^ | | | 735,250 | | | | 4,257,098 | |
| | | | | | | | 5,050,310 | |
| E-Commerce — 0.32% | | | | | | | | |
| Liberty TripAdvisor Holdings Inc. — Series A* | | | 32,200 | | | | 1,037,484 | |
| Electronics and Appliance Stores — 1.09% | | | | | | | | |
| Sears Hometown and Outlet Stores Inc.*^ | | | 375,700 | | | | 3,569,150 | |
| Forestry and Logging — 0.01% | | | | | | | | |
| Keweenaw Land Association Limited* | | | 380 | | | | 36,480 | |
| Gaming — 1.26% | | | | | | | | |
| Tropicana Entertainment Inc.* | | | 256,600 | | | | 4,118,430 | |
| General Merchandise Stores — 1.53% | | | | | | | | |
| Sears Canada Inc.*^ | | | 613,100 | | | | 3,733,779 | |
| Sears Holdings Corporation*^ | | | 46,500 | | | | 1,241,550 | |
| | | | | | | | 4,975,329 | |
| Holding Company — 11.58% | | | | | | | | |
| Dundee Corporation — Class A* | | | 856,700 | | | | 8,609,835 | |
| Icahn Enterprises LP | | | 336,294 | | | | 29,163,416 | |
| | | | | | | | 37,773,251 | |
The accompanying notes are an integral part of these financial statements.
| KINETICS PORTFOLIOS TRUST — MASTER INVESTMENT PORTFOLIOS |
| The Small Cap Opportunities Portfolio |
Portfolio of Investments — June 30, 2015 (Unaudited) — (Continued) |
| | | Shares | | | Value | |
| Insurance Carriers and Related Activities — 3.52% | | | | | | |
| AmTrust Financial Services, Inc.^ | | | 153,100 | | | $ | 10,029,581 | |
| Greenlight Capital Re, Limited — Class A* | | | 50,200 | | | | 1,464,334 | |
| | | | | | | | 11,493,915 | |
| Lessors of Nonresidential Buildings (except Miniwarehouses) — 9.22% | | | | | | | | |
| The Howard Hughes Corporation* | | | 209,600 | | | | 30,085,984 | |
| Machinery Manufacturing — 0.49% | | | | | | | | |
| Colfax Corporation*^ | | | 34,500 | | | | 1,592,175 | |
| Manufactured Brands — 11.04% | | | | | | | | |
| Jarden Corporation* | | | 665,825 | | | | 34,456,444 | |
| Movado Group, Inc. | | | 57,200 | | | | 1,553,552 | |
| | | | | | | | 36,009,996 | |
| Media — 2.11% | | | | | | | | |
| Liberty Ventures — Series A* | | | 32,200 | | | | 1,264,494 | |
| Starz — Class A* | | | 125,800 | | | | 5,625,776 | |
| | | | | | | | 6,890,270 | |
| Merchant Wholesalers, Durable Goods — 0.28% | | | | | | | | |
| Dorman Products, Inc.*^ | | | 19,200 | | | | 915,072 | |
| Mining (except Oil and Gas) — 0.05% | | | | | | | | |
| McEwen Mining Inc.*^ | | | 160,600 | | | | 153,999 | |
| Motion Picture and Sound Recording Industries — 4.57% | | | | | | | | |
| DreamWorks Animation SKG, Inc. — Class A*^ | | | 564,400 | | | | 14,888,872 | |
| Motor Vehicle and Parts Dealers — 0.62% | | | | | | | | |
| Penske Automotive Group, Inc. | | | 38,700 | | | | 2,016,657 | |
| Non-Store Retailers — 0.11% | | | | | | | | |
| Lands’ End, Inc.*^ | | | 13,986 | | | | 347,272 | |
| Oil and Gas — 9.01% | | | | | | | | |
| Texas Pacific Land Trust | | | 195,280 | | | | 29,387,687 | |
| Oil and Gas Extraction — 0.21% | | | | | | | | |
| Biloxi Marsh Lands Corporation | | | 100 | | | | 2,624 | |
| WPX Energy Inc.* | | | 55,800 | | | | 685,224 | |
| | | | | | | | 687,848 | |
The accompanying notes are an integral part of these financial statements.
| KINETICS PORTFOLIOS TRUST — MASTER INVESTMENT PORTFOLIOS |
| The Small Cap Opportunities Portfolio |
Portfolio of Investments — June 30, 2015 (Unaudited) — (Continued) |
| | | Shares | | | Value | |
| Oil Refining — 2.08% | | | | | | |
| Par Petroleum Corporation* | | | 361,719 | | | $ | 6,771,380 | |
| Other Exchanges — 0.37% | | | | | | | | |
| Urbana Corporation — Class A | | | 695,071 | | | | 1,196,479 | |
| Performing Arts, Spectator Sports, and Related Industries — 4.54% | | | | | | | | |
| Live Nation Entertainment, Inc.* | | | 538,000 | | | | 14,789,620 | |
| Petroleum and Coal Products Manufacturing — 1.02% | | | | | | | | |
| CVR Energy, Inc.^ | | | 88,300 | | | | 3,323,612 | |
| Pipeline Transportation — 0.52% | | | | | | | | |
| Rubis SCA | | | 24,750 | | | | 1,695,840 | |
| Publishing Industries (except Internet) — 0.19% | | | | | | | | |
| Promotora de Informaciones S.A. — ADR* | | | 64,644 | | | | 553,999 | |
| Value Line, Inc. | | | 7,615 | | | | 79,044 | |
| | | | | | | | 633,043 | |
| Real Estate — 5.32% | | | | | | | | |
| Dream Unlimited Corp. — Class A* | | | 2,235,000 | | | | 17,339,592 | |
| Rental and Leasing Services — 0.01% | | | | | | | | |
| Comdisco Holding Company, Inc. | | | 7,560 | | | | 32,886 | |
| Restaurants — 7.69% | | | | | | | | |
| The Wendy’s Company | | | 2,224,400 | | | | 25,091,232 | |
| Satellite Telecommunications — 0.57% | | | | | | | | |
| Loral Space & Communications Inc.* | | | 14,000 | | | | 883,680 | |
| ViaSat, Inc.* | | | 16,400 | | | | 988,264 | |
| | | | | | | | 1,871,944 | |
| Securities, Commodity Contracts, and Other Financial Investments | | | | | | | | |
| and Related Activities — 0.00% | | | | | | | | |
| BHF Kleinwort Benson Group SA* | | | 800 | | | | 3,915 | |
| Telecommunications — 0.04% | | | | | | | | |
| CIBL, Inc.* | | | 18 | | | | 24,318 | |
| ICTC Group Inc.* | | | 208 | | | | 4,160 | |
| LICT Corporation* | | | 16 | | | | 86,400 | |
| | | | | | | | 114,878 | |
The accompanying notes are an integral part of these financial statements.
| KINETICS PORTFOLIOS TRUST — MASTER INVESTMENT PORTFOLIOS |
| The Small Cap Opportunities Portfolio |
Portfolio of Investments — June 30, 2015 (Unaudited) — (Continued) |
| | | Shares | | | Value | |
| Transportation Equipment Manufacturing — 2.29% | | �� | | | | |
| American Railcar Industries, Inc.^ | | | 67,400 | | | $ | 3,278,336 | |
| Federal-Mogul Holdings Corporation* | | | 369,700 | | | | 4,196,095 | |
| | | | | | | | 7,474,431 | |
| TOTAL COMMON STOCKS | | | | | | | | |
| (cost $285,768,906) | | | | | | | 324,105,986 | |
| | | | | | | | | |
| RIGHTS — 0.11% | | | | | | | | |
| Rental and Leasing Services — 0.11% | | | | | | | | |
| Comdisco Holding Company, Inc.*# | | | 5,634,807 | | | | 360,628 | |
| TOTAL RIGHTS | | | | | | | | |
| (cost $1,088,543) | | | | | | | 360,628 | |
| | | | | | | | | |
| WARRANTS — 0.05% | | | | | | | | |
| General Merchandise Stores — 0.05% | | | | | | | | |
| Sears Holdings Corporation*^ | | | 9,591 | | | | 143,961 | |
| TOTAL WARRANTS | | | | | | | | |
| (cost $97,552) | | | | | | | 143,961 | |
| | | | | | | | | |
| | | Principal | | | | | |
| SHORT-TERM INVESTMENTS — 0.04% | | Amount | | | | | |
| Commercial Paper — 0.04% | | | | | | | | |
| U.S. Bank N.A., 0.02%, 07/01/2015 | | $ | 130,000 | | | | 130,000 | |
| | | | | | | | | |
| | | Shares | | | | | |
| Money Market Funds — 0.00% | | | | | | | | |
Fidelity Institutional Government Portfolio — Class I, 0.01%b | | | 696 | | | | 696 | |
| TOTAL SHORT-TERM INVESTMENTS | | | | | | | | |
| (cost $130,696) | | | | | | | 130,696 | |
The accompanying notes are an integral part of these financial statements.
| KINETICS PORTFOLIOS TRUST — MASTER INVESTMENT PORTFOLIOS |
| The Small Cap Opportunities Portfolio |
Portfolio of Investments — June 30, 2015 (Unaudited) — (Continued) |
| INVESTMENTS PURCHASED WITH THE CASH | | | | | | |
| PROCEEDS FROM SECURITIES LENDING — 13.59% | | Shares | | | Value | |
| Money Market Funds — 13.59% | | | | | | |
Mount Vernon Securities Lending Trust — Prime Portfolio, 0.23%b | | | 44,329,175 | | | $ | 44,329,175 | |
| TOTAL INVESTMENTS PURCHASED WITH THE CASH PROCEEDS | | | | | | | | |
| FROM SECURITIES LENDING | | | | | | | | |
| (cost $44,329,175) | | | | | | | 44,329,175 | |
| TOTAL INVESTMENTS — 113.16% | | | | | | | | |
| (cost $331,414,872) | | | | | | $ | 369,070,446 | |
Percentages are stated as a percent of net assets.
* — Non-income producing security.
^ — This security or a portion of this security was out on loan at June 30, 2015. Total loaned securities had a market value of $42,780,293 at June 30, 2015.
# — Contingent value right (contingent upon profitability of company).
b — The rate quoted is the annualized seven-day yield as of June 30, 2015.
ADR — American Depository Receipt.
The accompanying notes are an integral part of these financial statements.
| KINETICS PORTFOLIOS TRUST — MASTER INVESTMENT PORTFOLIOS |
| The Market Opportunities Portfolio |
Portfolio of Investments — June 30, 2015 (Unaudited) — (Continued) |
| COMMON STOCKS — 85.62% | | Shares | | | Value | |
| Administrative and Support Services — 0.01% | | | | | | |
| Markit Limited* | | | 200 | | | $ | 5,114 | |
| Asset Management — 16.72% | | | | | | | | |
| Apollo Global Management LLC — Class A | | | 18,900 | | | | 418,635 | |
| The Blackstone Group LP | | | 9,000 | | | | 367,830 | |
| Brookfield Asset Management Inc. — Class A | | | 73,000 | | | | 2,549,890 | |
| Federated Investors, Inc. — Class B^ | | | 3,600 | | | | 120,564 | |
| GAMCO Investors, Inc. — Class A | | | 300 | | | | 20,613 | |
| JZ Capital Partners Limited | | | 55,200 | | | | 388,995 | |
| Oaktree Capital Group LLC^ | | | 18,000 | | | | 957,240 | |
| Onex Corporation | | | 43,000 | | | | 2,377,900 | |
| Partners Value Investments Inc.* | | | 43,216 | | | | 1,262,918 | |
| Pershing Square Holdings Limited* | | | 100 | | | | 3,050 | |
| Senvest Capital Inc.* | | | 120 | | | | 18,735 | |
| Sprott, Inc. | | | 41,155 | | | | 81,387 | |
| | | | | | | | 8,567,757 | |
| Beverage and Tobacco Product Manufacturing — 0.09% | | | | | | | | |
| Crimson Wine Group Limited* | | | 5,080 | | | | 47,498 | |
| Chemical Manufacturing — 0.03% | | | | | | | | |
| Cadus Corporation* | | | 10,800 | | | | 14,364 | |
| Construction of Buildings — 0.11% | | | | | | | | |
| Green Brick Partners, Inc.* | | | 5,190 | | | | 56,830 | |
| Credit Intermediation and Related Activities — 3.04% | | | | | | | | |
| BBCN Bancorp, Inc. | | | 10 | | | | 148 | |
| Imperial Holdings, Inc.* | | | 269,000 | | | | 1,557,510 | |
| | | | | | | | 1,557,658 | |
| Data Processor — 6.16% | | | | | | | | |
| MasterCard, Inc. — Class A | | | 14,800 | | | | 1,383,504 | |
| Visa, Inc. — Class A | | | 26,400 | | | | 1,772,760 | |
| | | | | | | | 3,156,264 | |
| E-Commerce — 0.48% | | | | | | | | |
| Liberty Interactive Corporation — Class A* | | | 2,000 | | | | 55,500 | |
| Liberty TripAdvisor Holdings Inc. — Series A* | | | 5,948 | | | | 191,644 | |
| | | | | | | | 247,144 | |
The accompanying notes are an integral part of these financial statements.
| KINETICS PORTFOLIOS TRUST — MASTER INVESTMENT PORTFOLIOS |
| The Market Opportunities Portfolio |
Portfolio of Investments — June 30, 2015 (Unaudited) — (Continued) |
| | | Shares | | | Value | |
| Gaming — 2.76% | | | | | | |
| Las Vegas Sands Corp. | | | 3,000 | | | $ | 157,710 | |
| Tropicana Entertainment Inc.* | | | 78,400 | | | | 1,258,320 | |
| | | | | | | | 1,416,030 | |
| General Merchandise Stores — 0.05% | | | | | | | | |
| Sears Holdings Corporation*^ | | | 1,000 | | | | 26,700 | |
| Global Exchanges — 2.62% | | | | | | | | |
| JSE Limited | | | 62,000 | | | | 654,807 | |
| London Stock Exchange Group plc | | | 12,800 | | | | 476,652 | |
| Singapore Exchange Limited | | | 36,000 | | | | 209,288 | |
| | | | | | | | 1,340,747 | |
| Holding Company — 15.52% | | | | | | | | |
| Bollore SA | | | 10,000 | | | | 53,234 | |
| Clarke Inc. | | | 1,000 | | | | 9,488 | |
| Dundee Corporation — Class A* | | | 169,900 | | | | 1,707,495 | |
| Icahn Enterprises LP | | | 58,400 | | | | 5,064,448 | |
| Leucadia National Corporation | | | 46,000 | | | | 1,116,880 | |
| | | | | | | | 7,951,545 | |
| Insurance Carriers and Related Activities — 1.17% | | | | | | | | |
| Fairfax Financial Holdings Limited | | | 40 | | | | 19,760 | |
| Markel Corporation* | | | 725 | | | | 580,493 | |
| | | | | | | | 600,253 | |
| Lessors of Nonresidential Buildings (except Miniwarehouses) — 7.39% | | | | | | | | |
| The Howard Hughes Corporation* | | | 26,400 | | | | 3,789,456 | |
| Media — 0.95% | | | | | | | | |
| Liberty Ventures — Series A* | | | 12,403 | | | | 487,066 | |
| Merchant Wholesalers, Durable Goods — 0.03% | | | | | | | | |
| A-Mark Precious Metals, Inc. | | | 1,600 | | | | 16,752 | |
| Mining (except Oil and Gas) — 0.51% | | | | | | | | |
| Franco-Nevada Corporation | | | 5,400 | | | | 257,310 | |
| Sandstorm Gold Limited* | | | 1,800 | | | | 5,292 | |
| | | | | | | | 262,602 | |
| Non-Store Retailers — 2.93% | | | | | | | | |
| Sotheby’s^ | | | 33,200 | | | | 1,501,968 | |
The accompanying notes are an integral part of these financial statements.
| KINETICS PORTFOLIOS TRUST — MASTER INVESTMENT PORTFOLIOS |
| The Market Opportunities Portfolio |
Portfolio of Investments — June 30, 2015 (Unaudited) — (Continued) |
| | | Shares | | | Value | |
| Oil and Gas — 8.84% | | | | | | |
| Texas Pacific Land Trust | | | 30,100 | | | $ | 4,529,749 | |
| Other Exchanges — 6.18% | | | | | | | | |
| CBOE Holdings Inc. | | | 40,000 | | | | 2,288,800 | |
| NZX Limited | | | 359,002 | | | | 262,740 | |
| Urbana Corporation — Class A | | | 356,004 | | | | 612,817 | |
| | | | | | | | 3,164,357 | |
| Real Estate — 4.09% | | | | | | | | |
| Dream Unlimited Corp. — Class A* | | | 270,000 | | | | 2,094,716 | |
| Securities, Commodity Contracts, and Other Financial Investments | | | | | | | | |
| and Related Activities — 5.34% | | | | | | | | |
| CME Group, Inc. | | | 6,000 | | | | 558,360 | |
| IntercontinentalExchange Group, Inc. | | | 3,600 | | | | 804,996 | |
| Ladenburg Thalmann Financial Services Inc.*^ | | | 24,000 | | | | 84,000 | |
| OTC Markets Group Inc. — Class A | | | 86,385 | | | | 1,287,136 | |
| | | | | | | | 2,734,492 | |
| Transportation — 0.02% | | | | | | | | |
| Clarkson plc | | | 200 | | | | 8,601 | |
| Transportation Equipment Manufacturing — 0.01% | | | | | | | | |
| American Railcar Industries, Inc.^ | | | 100 | | | | 4,864 | |
| U.S. Equity Exchanges — 0.57% | | | | | | | | |
| The NASDAQ OMX Group, Inc. | | | 6,000 | | | | 292,860 | |
| TOTAL COMMON STOCKS | | | | | | | | |
| (cost $32,205,041) | | | | | | | 43,875,387 | |
| | | | | | | | | |
| | | Principal | | | | | |
| CORPORATE BONDS — 0.01% | | Amount | | | | | |
| General Merchandise Stores — 0.01% | | | | | | | | |
| Sears Holdings Corporation, 8.000%, 12/15/2019 | | $ | 5,500 | | | | 4,895 | |
| TOTAL CORPORATE BONDS | | | | | | | | |
| (cost $5,500) | | | | | | | 4,895 | |
The accompanying notes are an integral part of these financial statements.
| KINETICS PORTFOLIOS TRUST — MASTER INVESTMENT PORTFOLIOS |
| The Market Opportunities Portfolio |
Portfolio of Investments — June 30, 2015 (Unaudited) — (Continued) |
| MUTUAL FUNDS — 0.00% | | Shares | | | Value | |
| Funds, Trusts, and Other Financial Vehicles — 0.00% | | | | | | |
| Templeton Russia and East European Fund, Inc. | | | 200 | | | $ | 2,010 | |
| TOTAL MUTUAL FUNDS | | | | | | | | |
| (cost $2,544) | | | | | | | 2,010 | |
| | | | | | | | | |
| RIGHTS — 0.00% | | | | | | | | |
| Asset Management — 0.00% | | | | | | | | |
| W.P. Stewart & Co., Limited*+ | | | 205 | | | | — | |
| TOTAL RIGHTS | | | | | | | | |
| (cost $0) | | | | | | | — | |
| | | | | | | | | |
| WARRANTS — 0.01% | | | | | | | | |
| General Merchandise Stores — 0.01% | | | | | | | | |
| Sears Holdings Corporation*^ | | | 193 | | | | 2,897 | |
| TOTAL WARRANTS | | | | | | | | |
| (cost $3,070) | | | | | | | 2,897 | |
| | | | | | | | | |
| | | Principal | | | | | |
| SHORT-TERM INVESTMENTS — 9.47% | | Amount | | | | | |
| Commercial Paper — 4.74% | | | | | | | | |
| U.S. Bank N.A., 0.02%, 07/01/2015 | | $ | 2,430,000 | | | | 2,430,000 | |
| | | | | | | | | |
| | | Shares | | | | | |
| Money Market Funds — 4.73% | | | | | | | | |
Fidelity Institutional Government Portfolio — Class I, 0.01%b | | | 2,426,000 | | | | 2,426,000 | |
| TOTAL SHORT-TERM INVESTMENTS | | | | | | | | |
| (cost $4,856,000) | | | | | | | 4,856,000 | |
The accompanying notes are an integral part of these financial statements.
| KINETICS PORTFOLIOS TRUST — MASTER INVESTMENT PORTFOLIOS |
| The Market Opportunities Portfolio |
Portfolio of Investments — June 30, 2015 (Unaudited) — (Continued) |
| INVESTMENTS PURCHASED WITH THE CASH | | | | | | |
| PROCEEDS FROM SECURITIES LENDING — 4.78% | | Shares | | | Value | |
| Money Market Funds — 4.78% | | | | | | |
Mount Vernon Securities Lending Trust — Prime Portfolio, 0.23%b | | | 2,451,116 | | | $ | 2,451,116 | |
| TOTAL INVESTMENTS PURCHASED WITH THE CASH PROCEEDS | | | | | | | | |
| FROM SECURITIES LENDING | | | | | | | | |
| (cost $2,451,116) | | | | | | | 2,451,116 | |
| TOTAL INVESTMENTS — 99.89% | | | | | | | | |
| (cost $39,523,271) | | | | | | $ | 51,192,305 | |
Percentages are stated as a percent of net assets.
* — Non-income producing security.
^ — This security or a portion of this security was out on loan at June 30, 2015. Total loaned securities had a market value of $2,360,131 at June 30, 2015.
+ — Security is considered illiquid and was fair valued. The aggregate value of such securities is $0 or 0.00% of net assets.
b — The rate quoted is the annualized seven-day yield as of June 30, 2015.
The accompanying notes are an integral part of these financial statements.
| KINETICS PORTFOLIOS TRUST — MASTER INVESTMENT PORTFOLIOS |
| The Alternative Income Portfolio |
Portfolio of Investments — June 30, 2015 (Unaudited) — (Continued) |
| | | Principal | | | | |
| CORPORATE BONDS — 62.28% | | Amount | | | Value | |
| Beverage and Tobacco Product Manufacturing — 2.22% | | | | | | |
| Altria Group, Inc., 4.125%, 09/11/2015 | | $ | 100,000 | | | $ | 100,568 | |
| The Coca-Cola Company, 1.500%, 11/15/2015 | | | 100,000 | | | | 100,306 | |
| Dr. Pepper Snapple Group, Inc., 2.900%, 01/15/2016 | | | 200,000 | | | | 202,248 | |
| PepsiCo, Inc., 0.950%, 02/22/2017# | | | 200,000 | | | | 200,033 | |
| Reynolds American, Inc., 1.050%, 10/30/2015 | | | 175,000 | | | | 174,413 | |
| | | | | | | | 777,568 | |
| Broadcasting (except Internet) — 0.29% | | | | | | | | |
| The Walt Disney Company, 0.450%, 12/01/2015 | | | 100,000 | | | | 99,969 | |
| Chemical Manufacturing — 0.88% | | | | | | | | |
| The Dow Chemical Company, 2.500%, 02/15/2016 | | | 250,000 | | | | 252,449 | |
| Ecolab Inc., 1.000%, 08/09/2015 | | | 55,000 | | | | 55,011 | |
| | | | | | | | 307,460 | |
| Computer and Electronic Product Manufacturing — 2.16% | | | | | | | | |
| Apple, Inc., 1.050%, 05/05/2017# | | | 250,000 | | | | 250,816 | |
| Hewlett-Packard Co., 2.125%, 09/13/2015 | | | 100,000 | | | | 100,336 | |
| Intel Corp., 1.950%, 10/01/2016 | | | 200,000 | | | | 202,155 | |
| Texas Instruments Inc., 2.375%, 05/16/2016 | | | 200,000 | | | | 203,281 | |
| | | | | | | | 756,588 | |
| Consumer Staples — 0.57% | | | | | | | | |
| The Procter & Gamble Company, 0.750%, 11/04/2016 | | | 200,000 | | | | 200,172 | |
| Credit Intermediation and Related Activities — 10.40% | | | | | | | | |
| American Express Centurion, 0.875%, 11/13/2015 | | | 250,000 | | | | 250,184 | |
| Bank of America Corporation, 1.250%, 01/11/2016 | | | 250,000 | | | | 250,644 | |
| The Bank of New York Mellon Corporation, 0.700%, 10/23/2015 | | | 200,000 | | | | 200,099 | |
| Bank of Nova Scotia, 0.950%, 03/15/2016 | | | 200,000 | | | | 200,572 | |
| Branch Banking & Trust Company, 1.450%, 10/03/2016 | | | 180,000 | | | | 181,294 | |
| Capital One Bank (USA), NA, 1.200%, 02/13/2017 | | | 250,000 | | | | 248,834 | |
| Caterpillar Financial Services Corporation, 2.650%, 04/01/2016 | | | 200,000 | | | | 203,299 | |
| Citigroup Inc., 1.300%, 11/15/2016 | | | 350,000 | | | | 349,928 | |
| Fifth Third Bank, 0.900%, 02/26/2016 | | | 150,000 | | | | 150,157 | |
| General Electric Capital Corp., 1.000%, 12/11/2015 | | | 200,000 | | | | 200,583 | |
| Harley-Davidson Financial Services Inc., 1.150%, 09/15/2015, | | | | | | | | |
Acquired 01/08/2014 at $200,119■ | | | 200,000 | | | | 200,092 | |
| John Deere Capital Corporation, 1.050%, 12/15/2016 | | | 200,000 | | | | 200,229 | |
The accompanying notes are an integral part of these financial statements.
| KINETICS PORTFOLIOS TRUST — MASTER INVESTMENT PORTFOLIOS |
| The Alternative Income Portfolio |
Portfolio of Investments — June 30, 2015 (Unaudited) — (Continued) |
| | | Principal | | | | |
| | | Amount | | | Value | |
| Credit Intermediation and Related Activities — 10.40% (Continued) | | | | | | |
| Key Bank NA, 1.100%, 11/25/2016 | | $ | 250,000 | | | $ | 250,421 | |
| Manufacturers and Traders Trust Company, 1.400%, 07/25/2017# | | | 300,000 | | | | 299,668 | |
| PNC Bank NA, 1.300%, 10/03/2016 | | | 250,000 | | | | 251,095 | |
| Wells Fargo & Company, 1.250%, 07/20/2016 | | | 200,000 | | | | 200,879 | |
| | | | | | | | 3,637,978 | |
| Digital Security — 0.43% | | | | | | | | |
| Symantec Corp., 2.750%, 09/15/2015 | | | 150,000 | | | | 150,525 | |
| Diversified Financial Services — 1.44% | | | | | | | | |
| The Goldman Sachs Group, Inc., 3.625%, 02/07/2016 | | | 300,000 | | | | 304,887 | |
| JPMorgan Chase & Co., 1.100%, 10/15/2015 | | | 200,000 | | | | 200,189 | |
| | | | | | | | 505,076 | |
| E-Commerce — 0.97% | | | | | | | | |
| Amazon.com, Inc., 0.650%, 11/27/2015 | | | 200,000 | | | | 200,026 | |
| eBay, Inc., 0.700%, 07/15/2015 | | | 140,000 | | | | 140,005 | |
| | | | | | | | 340,031 | |
| Electrical Equipment, Appliance, and Component Manufacturing — 0.29% | | | | | | | | |
| Whirlpool Corporation, 1.350%, 03/01/2017 | | | 100,000 | | | | 100,335 | |
| Fabricated Metal Product Manufacturing — 0.58% | | | | | | | | |
| Danaher Corporation, 2.300%, 06/23/2016 | | | 200,000 | | | | 202,683 | |
| Food and Beverage Stores — 0.86% | | | | | | | | |
| The Kroger Co., 1.200%, 10/17/2016 | | | 300,000 | | | | 300,667 | |
| Food Manufacturing — 2.71% | | | | | | | | |
| ConAgra Foods, Inc. | | | | | | | | |
| 1.350%, 09/10/2015 | | | 100,000 | | | | 100,051 | |
| 1.300%, 01/25/2016 | | | 200,000 | | | | 200,055 | |
| General Mills, Inc., 0.875%, 01/29/2016 | | | 200,000 | | | | 200,194 | |
| HJ Heinz Co., 2.000%, 09/12/2016 | | | 150,000 | | | | 147,198 | |
| Kellogg Company, 1.875%, 11/17/2016 | | | 100,000 | | | | 100,978 | |
| William Wrigley Jr. Company, 1.400%, 10/21/2016, | | | | | | | | |
Acquired 10/28/2013 at $200,639■ | | | 200,000 | | | | 200,576 | |
| | | | | | | | 949,052 | |
| Food Services and Drinking Places — 1.14% | | | | | | | | |
| Starbucks Corporation, 0.875%, 12/05/2016 | | | 400,000 | | | | 400,422 | |
The accompanying notes are an integral part of these financial statements.
| KINETICS PORTFOLIOS TRUST — MASTER INVESTMENT PORTFOLIOS |
| The Alternative Income Portfolio |
Portfolio of Investments — June 30, 2015 (Unaudited) — (Continued) |
| | | Principal | | | | |
| | | Amount | | | Value | |
| General Merchandise Stores — 1.21% | | | | | | |
| Costco Wholesale Corporation, 0.650%, 12/07/2015 | | $ | 150,000 | | | $ | 150,086 | |
| Wal-Mart Stores, Inc. | | | | | | | | |
| 1.500%, 10/25/2015 | | | 74,000 | | | | 74,238 | |
| 0.600%, 04/11/2016 | | | 200,000 | | | | 200,097 | |
| | | | | | | | 424,421 | |
| Health and Personal Care Stores — 1.15% | | | | | | | | |
| CVS Caremark Corporation, 1.200%, 12/05/2016 | | | 200,000 | | | | 200,350 | |
| Walgreen Company, 1.800%, 09/15/2017 | | | 200,000 | | | | 200,901 | |
| | | | | | | | 401,251 | |
| Holding Company — 0.72% | | | | | | | | |
| Berkshire Hathaway Finance Corp., 0.950%, 08/15/2016# | | | 250,000 | | | | 250,566 | |
| Household and Personal Products — 1.01% | | | | | | | | |
| Colgate-Palmolive Company | | | | | | | | |
| 1.375%, 11/01/2015 | | | 150,000 | | | | 150,462 | |
| 1.300%, 01/15/2017# | | | 200,000 | | | | 201,574 | |
| | | | | | | | 352,036 | |
| Insurance Carriers and Related Activities — 4.07% | | | | | | | | |
| Aetna Inc., 1.750%, 05/15/2017# | | | 300,000 | | | | 302,656 | |
| American International Group, Inc., 5.450%, 05/18/2017# | | | 400,000 | | | | 430,150 | |
| UnitedHealth Group Inc. | | | | | | | | |
| 0.850%, 10/15/2015 | | | 100,000 | | | | 100,082 | |
| 1.875%, 11/15/2016 | | | 285,000 | | | | 288,627 | |
| WellPoint, Inc., 1.250%, 09/10/2015 | | | 300,000 | | | | 300,179 | |
| | | | | | | | 1,421,694 | |
| Machinery Manufacturing — 1.55% | | | | | | | | |
| Cameron International Corporation, 1.400%, 06/15/2017 | | | 242,000 | | | | 240,533 | |
| Illinois Tool Works, Inc., 0.900%, 02/25/2017# | | | 300,000 | | | | 300,268 | |
| | | | | | | | 540,801 | |
| Merchant Wholesalers, Nondurable Goods — 1.87% | | | | | | | | |
| AmerisourceBergen Corporation, 1.150%, 05/15/2017 | | | 300,000 | | | | 299,625 | |
| Express Scripts Holding Company, 3.125%, 05/15/2016 | | | 150,000 | | | | 152,497 | |
| McKesson Corp., 0.950%, 12/04/2015 | | | 200,000 | | | | 200,301 | |
| | | | | | | | 652,423 | |
The accompanying notes are an integral part of these financial statements.
| KINETICS PORTFOLIOS TRUST — MASTER INVESTMENT PORTFOLIOS |
| The Alternative Income Portfolio |
Portfolio of Investments — June 30, 2015 (Unaudited) — (Continued) |
| | | Principal | | | | |
| | | Amount | | | Value | |
| Miscellaneous Manufacturing — 4.02% | | | | | | |
| 3M Co., 1.375%, 09/29/2016 | | $ | 250,000 | | | $ | 252,095 | |
| Baxter International Inc., 0.950%, 06/01/2016 | | | 200,000 | | | | 199,674 | |
| Becton Dickinson & Co. | | | | | | | | |
| 1.450%, 05/15/2017 | | | 300,000 | | | | 299,917 | |
| 1.800%, 12/15/2017 | | | 300,000 | | | | 300,215 | |
| CR Bard, Inc., 2.875%, 01/15/2016 | | | 150,000 | | | | 151,679 | |
| Stryker Corporation, 2.000%, 09/30/2016 | | | 200,000 | | | | 202,199 | |
| | | | | | | | 1,405,779 | |
| Motor Vehicle and Parts Dealers — 0.72% | | | | | | | | |
| AutoZone, Inc., 1.300%, 01/13/2017 | | | 250,000 | | | | 250,508 | |
| Oil and Gas Extraction — 1.93% | | | | | | | | |
| Apache Corporation, 5.625%, 01/15/2017 | | | 350,000 | | | | 371,358 | |
| Marathon Oil Corporation, 0.900%, 11/01/2015 | | | 100,000 | | | | 99,983 | |
| Occidental Petroleum Corporation, 1.750%, 02/15/2017# | | | 200,000 | | | | 201,859 | |
| | | | | | | | 673,200 | |
| Other Information Services — 0.64% | | | | | | | | |
| Google Inc., 2.125%, 05/19/2016 | | | 222,000 | | | | 225,342 | |
| Petroleum and Coal Products Manufacturing — 3.17% | | | | | | | | |
| Chevron Corporation, 0.889%, 06/24/2016 | | | 200,000 | | | | 200,597 | |
| Exxon Mobil Corporation, 0.921%, 03/15/2017# | | | 200,000 | | | | 200,138 | |
| Hess Corporation, 1.300%, 06/15/2017 | | | 350,000 | | | | 348,364 | |
| Phillips 66, 2.950%, 05/01/2017 | | | 350,000 | | | | 359,916 | |
| | | | | | | | 1,109,015 | |
| Pharmaceutical and Biotechnology — 4.68% | | | | | | | | |
| Amgen Inc., 2.300%, 06/15/2016 | | | 427,000 | | | | 431,832 | |
| GlaxoSmithKline Capital Inc., 0.700%, 03/18/2016 | | | 200,000 | | | | 200,331 | |
| Johnson & Johnson, 0.700%, 11/28/2016# | | | 300,000 | | | | 300,729 | |
| Life Technologies Corporation, 3.500%, 01/15/2016 | | | 150,000 | | | | 151,888 | |
| Medtronic, Inc., 0.875%, 02/27/2017# | | | 250,000 | | | | 249,716 | |
| Pfizer, Inc., 1.100%, 05/15/2017# | | | 300,000 | | | | 300,967 | |
| | | | | | | | 1,635,463 | |
| Pharmaceuticals — 0.57% | | | | | | | | |
| Mylan Inc., 1.800%, 06/24/2016 | | | 200,000 | | | | 200,148 | |
| Publishing Industries (except Internet) — 0.29% | | | | | | | | |
| Thomson Reuters Corporation, 0.875%, 05/23/2016 | | | 100,000 | | | | 99,819 | |
The accompanying notes are an integral part of these financial statements.
| KINETICS PORTFOLIOS TRUST — MASTER INVESTMENT PORTFOLIOS |
| The Alternative Income Portfolio |
Portfolio of Investments — June 30, 2015 (Unaudited) — (Continued) |
| | | Principal | | | | |
| | | Amount | | | Value | |
| Satellite Telecommunications — 1.16% | | | | | | |
| DIRECTV Holdings, LLC | | | | | | |
| 3.500%, 03/01/2016 | | $ | 150,000 | | | $ | 152,361 | |
| 2.400%, 03/15/2017 | | | 250,000 | | | | 253,407 | |
| | | | | | | | 405,768 | |
| Support Activities for Mining — 0.72% | | | | | | | | |
| Schlumberger Investment SA, 1.950%, 09/14/2016, | | | | | | | | |
Acquired 01/10/2014 at $253,048■ | | | 250,000 | | | | 253,223 | |
| Support Activities for Transportation — 0.88% | | | | | | | | |
| GATX Corporation, 3.500%, 07/15/2016 | | | 300,000 | | | | 306,367 | |
| Telecommunications — 1.71% | | | | | | | | |
| AT&T, Inc., 0.800%, 12/01/2015 | | | 200,000 | | | | 200,014 | |
| Verizon Communications Inc., 0.700%, 11/02/2015 | | | 200,000 | | | | 199,736 | |
| Vodafone Group plc, 1.625%, 03/20/2017 | | | 200,000 | | | | 199,281 | |
| | | | | | | | 599,031 | |
| Transportation Equipment Manufacturing — 2.14% | | | | | | | | |
| Lockheed Martin Corp., 2.125%, 09/15/2016 | | | 250,000 | | | | 253,734 | |
| Toyota Motor Credit Corp., 0.875%, 07/17/2015 | | | 200,000 | | | | 200,039 | |
| VW Credit, Inc., 1.875%, 10/13/2016 | | | 290,000 | | | | 293,263 | |
| | | | | | | | 747,036 | |
| Utilities — 2.02% | | | | | | | | |
| Duke Energy Corporation, 2.150%, 11/15/2016 | | | 400,000 | | | | 406,284 | |
| Southern Power Company, 4.875%, 07/15/2015 | | | 100,000 | | | | 100,107 | |
| Xcel Energy, Inc., 0.750%, 05/09/2016 | | | 200,000 | | | | 199,458 | |
| | | | | | | | 705,849 | |
| Waste Management and Remediation Services — 1.11% | | | | | | | | |
| Waste Management, Inc., 2.600%, 09/01/2016 | | | 383,000 | | | | 389,827 | |
| TOTAL CORPORATE BONDS | | | | | | | | |
| (cost $21,791,780) | | | | | | | 21,778,093 | |
| | | | | | | | | |
U.S. GOVERNMENT AGENCY ISSUES — 3.52%1 | | | | | | | | |
| U.S. Government Agency Issues — 3.52% | | | | | | | | |
| Federal Farm Credit Bank, 0.375%, 10/07/2015# | | | 300,000 | | | | 300,198 | |
The accompanying notes are an integral part of these financial statements.
| KINETICS PORTFOLIOS TRUST — MASTER INVESTMENT PORTFOLIOS |
| The Alternative Income Portfolio |
Portfolio of Investments — June 30, 2015 (Unaudited) — (Continued) |
| | | Principal | | | | |
| | | Amount | | | Value | |
| U.S. Government Agency Issues — 3.52% (Continued) | | | | | | |
| Federal Home Loan Banks | | | | | | |
| 1.875%, 12/11/2015# | | $ | 175,000 | | | $ | 176,343 | |
| 1.000%, 03/11/2016# | | | 200,000 | | | | 200,884 | |
| Federal Home Loan Mortgage Corporation, 0.500%, 05/13/2016# | | | 300,000 | | | | 300,434 | |
| Federal National Mortgage Association, 1.875%, 10/15/2015# | | | 250,000 | | | | 251,271 | |
| TOTAL U.S. GOVERNMENT AGENCY ISSUES | | | | | | | | |
| (cost $1,227,954) | | | | | | | 1,229,130 | |
| | | | | | | | | |
| U.S. TREASURY OBLIGATIONS — 7.45% | | | | | | | | |
| U.S. Treasury Notes — 7.45% | | | | | | | | |
| 0.250%, 08/15/2015# | | | 350,000 | | | | 350,069 | |
| 0.250%, 04/15/2016# | | | 500,000 | | | | 499,883 | |
| 0.625%, 07/15/2016# | | | 250,000 | | | | 250,703 | |
| 0.625%, 10/15/2016# | | | 300,000 | | | | 300,820 | |
| 0.625%, 02/15/2017# | | | 200,000 | | | | 200,281 | |
| 0.750%, 06/30/2017 | | | 500,000 | | | | 501,015 | |
| 0.875%, 08/15/2017# | | | 500,000 | | | | 501,836 | |
| TOTAL U.S. TREASURY OBLIGATIONS | | | | | | | | |
| (cost $2,595,585) | | | | | | | 2,604,607 | |
| | | | | | | | | |
| EXCHANGE TRADED FUNDS — 20.81% | | Shares | | | | | |
| Funds, Trusts, and Other Financial Vehicles — 20.81% | | | | | | | | |
| iShares 1-3 Year Credit Bond ETF | | | 34,100 | | | | 3,591,753 | |
| PIMCO Enhanced Short Maturity ETF | | | 4,700 | | | | 475,405 | |
| SPDR Barclays Short Term Corporate Bond ETF# | | | 24,000 | | | | 734,400 | |
| Vanguard Short-Term Corporate Bond ETF | | | 31,100 | | | | 2,474,938 | |
| TOTAL EXCHANGE TRADED FUNDS | | | | | | | | |
| (cost $7,303,061) | | | | | | | 7,276,496 | |
| | | | | | | | | |
| PURCHASED PUT OPTIONS — 0.24% | | Contractsd | | | | | |
| Credit Intermediation and Related Activities — 0.16% | | | | | | | | |
| iPath S&P 500 VIX Short-Term Futures ETN* | | | | | | | | |
| Expiration Date: January 2016, Exercise Price: $15.00 | | | 12 | | | | 1,590 | |
| Expiration Date: January 2016, Exercise Price: $20.00 | | | 71 | | | | 29,287 | |
The accompanying notes are an integral part of these financial statements.
| KINETICS PORTFOLIOS TRUST — MASTER INVESTMENT PORTFOLIOS |
| The Alternative Income Portfolio |
Portfolio of Investments — June 30, 2015 (Unaudited) — (Continued) |
| | | Contractsd | | | Value | |
| Credit Intermediation and Related Activities — 0.16% (Continued) | | | | | | |
| Expiration Date: January 2016, Exercise Price: $25.00 | | | 30 | | | $ | 23,700 | |
| | | | | | | | 54,577 | |
| Funds, Trusts, and Other Financial Vehicles — 0.08% | | | | | | | | |
| ProShares Ultra VIX Short-Term Futures ETF* | | | | | | | | |
| Expiration Date: January 2016, Exercise Price: $10.00 | | | 6 | | | | 2,745 | |
| Expiration Date: January 2016, Exercise Price: $15.00 | | | 29 | | | | 26,100 | |
| | | | | | | | 28,845 | |
| TOTAL PURCHASED PUT OPTIONS | | | | | | | | |
| (cost $67,981) | | | | | | | 83,422 | |
| | | | | | | | | |
| | | Principal | | | | | |
| SHORT-TERM INVESTMENTS — 6.87% | | Amount | | | | | |
| Commercial Paper — 3.95% | | | | | | | | |
| U.S. Bank N.A., 0.02%, 07/01/2015 | | $ | 1,382,000 | | | | 1,382,000 | |
| | | | | | | | | |
| | | Shares | | | | | |
| Money Market Funds — 2.92% | | | | | | | | |
Fidelity Institutional Government Portfolio — Class I, 0.01%#b | | | 1,019,387 | | | | 1,019,387 | |
| TOTAL SHORT-TERM INVESTMENTS | | | | | | | | |
| (cost $2,401,387) | | | | | | | 2,401,387 | |
| TOTAL INVESTMENTS — 101.17% | | | | | | | | |
| (cost $35,387,748) | | | | | | $ | 35,373,135 | |
____________________
Percentages are stated as a percent of net assets.
* — Non-income producing security.
# — All or a portion of the securities have been committed as collateral for written option contracts.
■ — Restricted security restricted to institutional investors (144a securities); the percentage of net assets comprised of 144a securities was 1.87%.
1 — The obligations of certain U.S. Government-sponsored entities are neither issued nor guaranteed by the United States Treasury.
b — The rate quoted is the annualized seven-day yield as of June 30, 2015.
d — 100 shares per contract.
ETF — Exchange Traded Fund.
ETN — Exchange Traded Note.
The accompanying notes are an integral part of these financial statements.
| KINETICS PORTFOLIOS TRUST — MASTER INVESTMENT PORTFOLIOS |
| The Multi-Disciplinary Income Portfolio |
Portfolio of Investments — June 30, 2015 (Unaudited) — (Continued) |
| | | Principal | | | | |
| CONVERTIBLE BONDS — 10.72% | | Amount | | | Value | |
| Administrative and Support Services — 3.78% | | | | | | |
| WebMD Health Corporation | | | | | | |
| 2.250%, 03/31/2016 | | $ | 400,000 | | | $ | 403,250 | |
| 2.500%, 01/31/2018# | | | 4,875,000 | | | | 4,987,734 | |
| | | | | | | | 5,390,984 | |
| Computer and Electronic Product Manufacturing — 0.42% | | | | | | | | |
| Quantum Corp., 4.500%, 11/15/2017 | | | 500,000 | | | | 597,500 | |
| Mining (except Oil and Gas) — 3.96% | | | | | | | | |
| Detour Gold Corporation, 5.500%, 11/30/2017 | | | 1,000,000 | | | | 990,625 | |
| Kirkland Lake Gold Inc., 6.000%, 06/30/2017 | | CAD | 350,000 | | | | 273,709 | |
| Royal Gold, Inc., 2.875%, 06/15/2019 | | | 4,264,000 | | | | 4,386,590 | |
| | | | | | | | 5,650,924 | |
| Oil and Gas Extraction — 2.19% | | | | | | | | |
| Chesapeake Energy Corporation | | | | | | | | |
| 2.750%, 11/15/2035^# | | | 650,000 | | | | 646,750 | |
| 2.250%, 12/15/2038 | | | 2,830,000 | | | | 2,469,175 | |
| | | | | | | | 3,115,925 | |
| Real Estate — 0.37% | | | | | | | | |
| Forest City Enterprises, Inc., 4.250%, 08/15/2018 | | | 446,000 | | | | 524,886 | |
| TOTAL CONVERTIBLE BONDS | | | | | | | | |
| (cost $14,964,017) | | | | | | | 15,280,219 | |
| | | | | | | | | |
| CORPORATE BONDS — 68.39% | | | | | | | | |
| Ambulatory Health Care Services — 0.23% | | | | | | | | |
| DaVita HealthCare Partners Inc., 5.750%, 08/15/2022 | | | 300,000 | | | | 319,125 | |
| Apparel Manufacturing — 2.08% | | | | | | | | |
| L Brands, Inc. | | | | | | | | |
| 6.625%, 04/01/2021 | | | 200,000 | | | | 220,876 | |
| 5.625%, 02/15/2022 | | | 2,600,000 | | | | 2,749,500 | |
| | | | | | | | 2,970,376 | |
| Beverage and Tobacco Product Manufacturing — 0.07% | | | | | | | | |
| Constellation Brands, Inc., 4.250%, 05/01/2023 | | | 100,000 | | | | 98,750 | |
The accompanying notes are an integral part of these financial statements.
| KINETICS PORTFOLIOS TRUST — MASTER INVESTMENT PORTFOLIOS |
| The Multi-Disciplinary Income Portfolio |
Portfolio of Investments — June 30, 2015 (Unaudited) — (Continued) |
| | | Principal | | | | |
| | | Amount | | | Value | |
| Broadcasting (except Internet) — 3.55% | | | | | | |
| AMC Networks, Inc., 7.750%, 07/15/2021 | | $ | 700,000 | | | $ | 759,500 | |
| Cablevision Systems Corporation, 5.875%, 09/15/2022 | | | 200,000 | | | | 194,500 | |
| CCO Holdings LLC/Capital Corporation, 5.250%, 09/30/2022 | | | 2,150,000 | | | | 2,123,125 | |
| Sinclair Television Group, 5.375%, 04/01/2021 | | | 250,000 | | | | 252,812 | |
| Sirius XM Radio, Inc. | | | | | | | | |
5.750%, 08/01/2021, Acquired 02/28/2014-03/20/2014 at $783,473■ | | | 750,000 | | | | 773,438 | |
4.625%, 05/15/2023, Acquired 04/11/2014-07/23/2014 at $713,240■ | | | 750,000 | | | | 706,875 | |
6.000%, 07/15/2024, Acquired 07/02/2014 at $261,881■ | | | 250,000 | | | | 253,125 | |
| | | | | | | | 5,063,375 | |
| Cable Distributor — 0.86% | | | | | | | | |
Altice SA, 7.750%, 05/15/2022, Acquired 07/02/2014 at $267,189■ | | | 250,000 | | | | 242,500 | |
| Numericable Group SA, 6.000%, 05/15/2022, | | | | | | | | |
Acquired 06/11/2014-11/04/2014 at $1,041,867■ | | | 1,000,000 | | | | 988,125 | |
| | | | | | | | 1,230,625 | |
| Chemical Manufacturing — 4.01% | | | | | | | | |
| Ashland Inc., 4.750%, 08/15/2022# | | | 3,800,000 | | | | 3,743,000 | |
| LSB Industries, Inc., 7.750%, 08/01/2019 | | | 1,850,000 | | | | 1,970,250 | |
| | | | | | | | 5,713,250 | |
| Construction of Buildings — 5.61% | | | | | | | | |
| Lennar Corporation, 4.750%, 11/15/2022 | | | 5,210,000 | | | | 5,144,875 | |
| TRI Pointe Holdings, Inc., 4.375%, 06/15/2019 | | | 2,895,000 | | | | 2,851,575 | |
| | | | | | | | 7,996,450 | |
| Credit Intermediation and Related Activities — 0.85% | | | | | | | | |
| Ally Financial, Inc., 8.000%, 03/15/2020 | | | 161,000 | | | | 189,980 | |
| Sprint Capital Corp., 6.900%, 05/01/2019 | | | 1,000,000 | | | | 1,022,500 | |
| | | | | | | | 1,212,480 | |
| Data Processing, Hosting and Related Services — 3.09% | | | | | | | | |
| SunGard Data Systems, Inc. | | | | | | | | |
| 7.375%, 11/15/2018 | | | 200,000 | | | | 207,350 | |
| 6.625%, 11/01/2019 | | | 4,051,000 | | | | 4,197,849 | |
| | | | | | | | 4,405,199 | |
| E-Commerce — 2.93% | | | | | | | | |
| IAC/InterActiveCorp, 4.750%, 12/15/2022 | | | 4,250,000 | | | | 4,180,938 | |
The accompanying notes are an integral part of these financial statements.
| KINETICS PORTFOLIOS TRUST — MASTER INVESTMENT PORTFOLIOS |
| The Multi-Disciplinary Income Portfolio |
Portfolio of Investments — June 30, 2015 (Unaudited) — (Continued) |
| | | Principal | | | | |
| | | Amount | | | Value | |
| Electrical Equipment, Appliance, and Component Manufacturing — 0.64% | | | | | | |
| GrafTech International Limited, 6.375%, 11/15/2020 | | $ | 1,000,000 | | | $ | 915,000 | |
| Fabricated Metal Product Manufacturing — 0.16% | | | | | | | | |
| Ball Corp., 4.000%, 11/15/2023 | | | 250,000 | | | | 233,125 | |
| Food Manufacturing — 3.60% | | | | | | | | |
| Post Holdings, Inc. | | | | | | | | |
6.750%, 12/01/2021, Acquired 04/17/2014 at $261,273■ | | | 250,000 | | | | 250,625 | |
| 7.375%, 02/15/2022 | | | 4,775,000 | | | | 4,876,469 | |
| | | | | | | | 5,127,094 | |
| Gaming — 3.24% | | | | | | | | |
| MGM Resorts International, 6.625%, 12/15/2021 | | | 756,000 | | | | 793,800 | |
| Wynn Las Vegas LLC | | | | | | | | |
| 5.375%, 03/15/2022^ | | | 3,300,000 | | | | 3,366,000 | |
4.250%, 05/30/2023, Acquired 07/02/2014-07/29/2014 at $486,962■ | | | 500,000 | | | | 462,500 | |
| | | | | | | | 4,622,300 | |
| Health Care Equipment and Services — 0.51% | | | | | | | | |
| Hologic, Inc., 6.250%, 08/01/2020 | | | 700,000 | | | | 724,517 | |
| Holding Company — 3.98% | | | | | | | | |
| Icahn Enterprises | | | | | | | | |
| 6.000%, 08/01/2020 | | | 3,750,000 | | | | 3,885,938 | |
| 5.875%, 02/01/2022 | | | 1,750,000 | | | | 1,789,375 | |
| | | | | | | | 5,675,313 | |
| Hospitals — 0.15% | | | | | | | | |
| Community Health System, Inc., 7.125%, 07/15/2020 | | | 200,000 | | | | 212,400 | |
| Lessors of Nonresidential Buildings (except Miniwarehouses) — 4.60% | | | | | | | | |
| The Howard Hughes Corporation, 6.875%, 10/01/2021, | | | | | | | | |
Acquired 03/05/2014-06/19/2015 at $6,528,281■ | | | 6,150,000 | | | | 6,549,750 | |
| Merchant Wholesalers, Durable Goods — 0.20% | | | | | | | | |
| HD Supply, Inc., 11.500%, 07/15/2020 | | | 250,000 | | | | 290,000 | |
| Mining (except Oil and Gas) — 0.88% | | | | | | | | |
| Freeport-McMoRan Copper & Gold Inc., 3.550%, 03/01/2022 | | | 1,100,000 | | | | 1,019,671 | |
| Vulcan Materials Co., 7.500%, 06/15/2021 | | | 200,000 | | | | 231,000 | |
| | | | | | | | 1,250,671 | |
The accompanying notes are an integral part of these financial statements.
| KINETICS PORTFOLIOS TRUST — MASTER INVESTMENT PORTFOLIOS |
| The Multi-Disciplinary Income Portfolio |
Portfolio of Investments — June 30, 2015 (Unaudited) — (Continued) |
| | | Principal | | | | |
| | | Amount | | | Value | |
| Motion Picture and Sound Recording Industries — 2.23% | | | | | | |
| DreamWorks Animation SKG, Inc., 6.875%, 08/15/2020, | | | | | | |
Acquired 03/03/2014-01/16/2015 at $3,371,830■ | | $ | 3,190,000 | | | $ | 3,174,050 | |
| Motor Vehicle and Parts Dealers — 2.60% | | | | | | | | |
| Penske Automotive Group, Inc., 5.750%, 10/01/2022 | | | 3,550,000 | | | | 3,709,750 | |
| Nonmetallic Mineral Product Manufacturing — 0.20% | | | | | | | | |
| USG Corporation, 9.750%, 01/15/2018 | | | 250,000 | | | | 285,625 | |
| Non-Store Retailers — 3.06% | | | | | | | | |
| Sotheby’s, 5.250%, 10/01/2022, | | | | | | | | |
Acquired 03/03/2014-10/03/2014 at $4,334,104#■ | | | 4,426,000 | | | | 4,359,610 | |
| Oil and Gas Extraction — 1.19% | | | | | | | | |
| Continental Resources, Inc., 5.000%, 09/15/2022 | | | 100,000 | | | | 98,188 | |
| QEP Resources, Inc., 6.875%, 03/01/2021 | | | 250,000 | | | | 260,625 | |
| WPX Energy Inc., 6.000%, 01/15/2022 | | | 1,350,000 | | | | 1,339,875 | |
| | | | | | | | 1,698,688 | |
| Pharmaceuticals — 0.19% | | | | | | | | |
| Forest Laboratories, Inc., 5.000%, 12/15/2021, | | | | | | | | |
Acquired 04/01/2014 at $263,924■ | | | 250,000 | | | | 271,646 | |
| Professional, Scientific, and Technical Services — 0.35% | | | | | | | | |
| Lamar Media Corp., 5.000%, 05/01/2023 | | | 250,000 | | | | 248,125 | |
| Nielsen Finance LLC, 4.500%, 10/01/2020 | | | 250,000 | | | | 249,688 | |
| | | | | | | | 497,813 | |
| Publishing Industries (except Internet) — 0.80% | | | | | | | | |
| TEGNA, Inc. | | | | | | | | |
| 5.125%, 10/15/2019 | | | 250,000 | | | | 258,125 | |
| 5.125%, 07/15/2020 | | | 250,000 | | | | 257,187 | |
| 6.375%, 10/15/2023 | | | 600,000 | | | | 627,000 | |
| | | | | | | | 1,142,312 | |
| Rail Transportation — 0.18% | | | | | | | | |
| Florida East Coast Holdings Corporation, 6.750%, 05/01/2019, | | | | | | | | |
Acquired 07/09/2014 at $263,790■ | | | 250,000 | | | | 251,250 | |
The accompanying notes are an integral part of these financial statements.
| KINETICS PORTFOLIOS TRUST — MASTER INVESTMENT PORTFOLIOS |
| The Multi-Disciplinary Income Portfolio |
Portfolio of Investments — June 30, 2015 (Unaudited) — (Continued) |
| | | Principal | | | | |
| | | Amount | | | Value | |
| Real Estate — 4.94% | | | | | | |
| Brookfield Residential Properties | | | | | | |
6.500%, 12/15/2020, Acquired 07/14/2014-06/19/2015 at $6,579,952■ | | $ | 6,300,000 | | | $ | 6,302,646 | |
6.125%, 07/01/2022, Acquired 04/09/2015 at $103,750■ | | | 100,000 | | | | 99,000 | |
6.375%, 05/15/2025, Acquired 06/19/2015 at $641,235■ | | | 651,000 | | | | 641,235 | |
| | | | | | | | 7,042,881 | |
| Rental and Leasing Services — 1.69% | | | | | | | | |
| Hertz Corp., 6.750%, 04/15/2019 | | | 200,000 | | | | 206,880 | |
| International Lease Finance Corp., 8.250%, 12/15/2020 | | | 1,850,000 | | | | 2,201,500 | |
| | | | | | | | 2,408,380 | |
| Satellite Telecommunications — 2.25% | | | | | | | | |
| Dish DBS Corp. | | | | | | | | |
| 4.625%, 07/15/2017 | | | 3,000,000 | | | | 3,097,500 | |
| 7.875%, 09/01/2019 | | | 100,000 | | | | 111,150 | |
| | | | | | | | 3,208,650 | |
| Securities, Commodity Contracts, and Other Financial Investments | | | | | | | | |
| and Related Activities — 1.62% | | | | | | | | |
| Oppenheimer Holdings, Inc., 8.750%, 04/15/2018 | | | 2,210,000 | | | | 2,309,450 | |
| Software and Services — 1.22% | | | | | | | | |
| Crown Castle International Corp. | | | | | | | | |
| 4.875%, 04/15/2022 | | | 723,000 | | | | 732,037 | |
| 5.250%, 01/15/2023 | | | 300,000 | | | | 303,300 | |
| Nuance Communications, Inc., 5.375%, 08/15/2020, | | | | | | | | |
Acquired 02/14/2014-07/29/2014 at $706,184■ | | | 700,000 | | | | 707,000 | |
| | | | | | | | 1,742,337 | |
| Telecommunications — 2.87% | | | | | | | | |
| CenturyLink, Inc., 5.800%, 03/15/2022 | | | 500,000 | | | | 479,375 | |
| Hughes Satellite Systems Corp. | | | | | | | | |
| 6.500%, 06/15/2019 | | | 450,000 | | | | 489,937 | |
| 7.625%, 06/15/2021 | | | 500,000 | | | | 551,975 | |
| Level 3 Financing, Inc., 7.000%, 06/01/2020 | | | 200,000 | | | | 212,750 | |
| Millicom International Cellular SA, 4.750%, 05/22/2020, | | | | | | | | |
Acquired 08/28/2014 at $390,975■ | | | 390,000 | | | | 376,947 | |
The accompanying notes are an integral part of these financial statements.
| KINETICS PORTFOLIOS TRUST — MASTER INVESTMENT PORTFOLIOS |
| The Multi-Disciplinary Income Portfolio |
Portfolio of Investments — June 30, 2015 (Unaudited) — (Continued) |
| | | Principal | | | | |
| | | Amount | | | Value | |
| Telecommunications — 2.87% (Continued) | | | | | | |
| SoftBank Corp., 4.500%, 04/15/2020, | | | | | | |
Acquired 04/24/2014-06/19/2015 at $1,415,924■ | | $ | 1,400,000 | | | $ | 1,408,750 | |
| Sprint Communications Inc., 9.000%, 11/15/2018, | | | | | | | | |
Acquired 12/30/2013 at $114,998■ | | | 100,000 | | | | 113,176 | |
| T-Mobile USA, Inc., 6.633%, 04/28/2021 | | | 350,000 | | | | 364,000 | |
| Virgin Media Secured Finance plc, 5.375%, 04/15/2021, | | | | | | | | |
Acquired 02/11/2014 at $91,463■ | | | 90,000 | | | | 93,038 | |
| | | | | | | | 4,089,948 | |
| Transportation Equipment Manufacturing — 1.53% | | | | | | | | |
| Dana Holding Corp., 5.375%, 09/15/2021 | | | 250,000 | | | | 257,187 | |
| Lear Corp., 4.750%, 01/15/2023 | | | 500,000 | | | | 495,000 | |
| Navistar International Corp., 8.250%, 11/01/2021^ | | | 1,500,000 | | | | 1,432,500 | |
| | | | | | | | 2,184,687 | |
| Utilities — 0.23% | | | | | | | | |
| NRG Energy, Inc., 7.625%, 01/15/2018 | | | 100,000 | | | | 109,875 | |
| ONEOK Inc., 4.250%, 02/01/2022 | | | 230,000 | | | | 222,372 | |
| | | | | | | | 332,247 | |
| TOTAL CORPORATE BONDS | | | | | | | | |
| (cost $98,797,790) | | | | | | | 97,500,062 | |
| | | | | | | | | |
| MUNICIPAL BONDS — 0.23% | | | | | | | | |
| Air Transportation — 0.23% | | | | | | | | |
| Branson Missouri Regional Airport Transportation Development District | | | | | | | | |
6.000%, 07/01/2025c+ | | | 2,000,000 | | | | 190,000 | |
6.000%, 07/01/2037c+ | | | 1,500,000 | | | | 142,500 | |
| | | | | | | | 332,500 | |
| TOTAL MUNICIPAL BONDS | | | | | | | | |
| (cost $2,245,112) | | | | | | | 332,500 | |
| | | | | | | | | |
| ESCROW NOTES — 0.04% | | | | | | | | |
| Holding Company — 0.04% | | | | | | | | |
Energy Future Intermediate Holdings Co. LLCc | | | 1,000,000 | | | | 57,500 | |
| TOTAL ESCROW NOTES | | | | | | | | |
| (cost $38,521) | | | | | | | 57,500 | |
The accompanying notes are an integral part of these financial statements.
| KINETICS PORTFOLIOS TRUST — MASTER INVESTMENT PORTFOLIOS |
| The Multi-Disciplinary Income Portfolio |
Portfolio of Investments — June 30, 2015 (Unaudited) — (Continued) |
| EXCHANGE TRADED NOTES — 0.00% | | Shares | | | Value | |
| Credit Intermediation and Related Activities — 0.00% | | | | | | |
| VelocityShares Daily Inverse VIX Medium Term ETN* | | | 100 | | | $ | 4,647 | |
| TOTAL EXCHANGE TRADED NOTES | | | | | | | | |
| (cost $3,971) | | | | | | | 4,647 | |
| | | | | | | | | |
| MUTUAL FUNDS — 7.01% | | | | | | | | |
| Funds, Trusts, and Other Financial Vehicles — 7.01% | | | | | | | | |
| ACM Income Fund, Inc. | | | 131,200 | | | | 976,128 | |
| Avenue Income Credit Strategies Fund | | | 16,600 | | | | 235,886 | |
| DoubleLine Income Solutions Fund | | | 37,000 | | | | 731,490 | |
| DoubleLine Opportunistic Credit Fund | | | 51,800 | | | | 1,200,206 | |
| LMP Corporate Loan Fund Inc. | | | 12,000 | | | | 132,480 | |
| PCM Fund Inc. | | | 2,900 | | | | 29,145 | |
| PIMCO Corporate Income Fund | | | 1,700 | | | | 24,140 | |
| PIMCO Dynamic Credit Income Fund | | | 64,200 | | | | 1,295,556 | |
| PIMCO Dynamic Income Fund | | | 123,800 | | | | 3,616,198 | |
| PIMCO Income Opportunity Fund | | | 16,050 | | | | 388,410 | |
| PIMCO Income Strategy Fund | | | 20,600 | | | | 223,716 | |
| PIMCO Income Strategy Fund II^ | | | 20,100 | | | | 197,583 | |
| Special Opportunities Fund Inc. | | | 28,000 | | | | 428,120 | |
| Western Asset Mortgage Defined Opportunity Fund Inc.^ | | | 19,500 | | | | 467,220 | |
| Western Asset/Claymore Inflation-Linked Opportunities & Income Fund | | | 2,200 | | | | 24,618 | |
| Western Asset/Claymore Inflation-Linked Securities & Income Fund | | | 1,600 | | | | 18,032 | |
| TOTAL MUTUAL FUNDS | | | | | | | | |
| (cost $10,819,819) | | | | | | | 9,988,928 | |
| | | | | | | | | |
| PURCHASED PUT OPTIONS — 1.52% | | Contractsd | | | | | |
| Credit Intermediation and Related Activities — 0.22% | | | | | | | | |
| iPath S&P 500 VIX Short-Term Futures ETN* | | | | | | | | |
| Expiration Date: January 2016, Exercise Price: $15.00 | | | 4 | | | | 530 | |
| Expiration Date: January 2016, Exercise Price: $20.00 | | | 536 | | | | 221,100 | |
| Expiration Date: January 2016, Exercise Price: $25.00 | | | 114 | | | | 90,060 | |
| | | | | | | | 311,690 | |
The accompanying notes are an integral part of these financial statements.
| KINETICS PORTFOLIOS TRUST — MASTER INVESTMENT PORTFOLIOS |
| The Multi-Disciplinary Income Portfolio |
Portfolio of Investments — June 30, 2015 (Unaudited) — (Continued) |
| | | Contractsd | | | Value | |
| Funds, Trusts, and Other Financial Vehicles — 1.30% | | | | | | |
| ProShares Ultra VIX Short-Term Futures ETF* | | | | | | |
| Expiration Date: January 2016, Exercise Price: $8.00 | | | 60 | | | $ | 37,050 | |
| Expiration Date: January 2016, Exercise Price: $9.00 | | | 214 | | | | 152,475 | |
| Expiration Date: January 2016, Exercise Price: $10.00 | | | 80 | | | | 45,830 | |
| Expiration Date: January 2016, Exercise Price: $15.00 | | | 850 | | | | 765,000 | |
| Expiration Date: January 2016, Exercise Price: $20.00 | | | 510 | | | | 683,400 | |
| Expiration Date: January 2017, Exercise Price: $3.00 | | | 306 | | | | 37,638 | |
| Expiration Date: January 2017, Exercise Price: $5.00 | | | 108 | | | | 12,906 | |
| Expiration Date: January 2017, Exercise Price: $10.00 | | | 58 | | | | 22,040 | |
| Expiration Date: January 2017, Exercise Price: $15.00 | | | 18 | | | | 12,195 | |
| Expiration Date: January 2017, Exercise Price: $25.00 | | | 34 | | | | 45,900 | |
| Expiration Date: January 2017, Exercise Price: $30.00 | | | 22 | | | | 37,950 | |
| | | | | | | | 1,852,384 | |
| Motion Picture and Sound Recording Industries — 0.00% | | | | | | | | |
| DreamWorks Animation SKG, Inc. — Class A* | | | | | | | | |
| Expiration Date: January 2016, Exercise Price: $10.00 | | | 108 | | | | 2,430 | |
| Expiration Date: January 2017, Exercise Price: $8.00 | | | 144 | | | | 1,800 | |
| | | | | | | | 4,230 | |
| TOTAL PURCHASED PUT OPTIONS | | | | | | | | |
| (cost $1,625,535) | | | | | | | 2,168,304 | |
| | | | | | | | | |
| | | Principal | | | | | |
| SHORT-TERM INVESTMENTS — 8.66% | | Amount | | | | | |
| Commercial Paper — 4.34% | | | | | | | | |
| U.S. Bank N.A., 0.02%, 07/01/2015 | | $ | 6,193,000 | | | | 6,193,000 | |
| | | | | | | | | |
| | | Shares | | | | | |
| Money Market Funds — 4.32% | | | | | | | | |
Fidelity Institutional Government Portfolio — Class I, 0.01%b | | | 6,162,000 | | | | 6,162,000 | |
| TOTAL SHORT-TERM INVESTMENTS | | | | | | | | |
| (cost $12,355,000) | | | | | | | 12,355,000 | |
The accompanying notes are an integral part of these financial statements.
| KINETICS PORTFOLIOS TRUST — MASTER INVESTMENT PORTFOLIOS |
| The Multi-Disciplinary Income Portfolio |
Portfolio of Investments — June 30, 2015 (Unaudited) — (Continued) |
| INVESTMENTS PURCHASED WITH THE CASH | | | | | | |
| PROCEEDS FROM SECURITIES LENDING — 3.09% | | Shares | | | Value | |
| Money Market Funds — 3.09% | | | | | | |
Mount Vernon Securities Lending Trust — Prime Portfolio, 0.23%b | | | 4,404,520 | | | $ | 4,404,520 | |
| TOTAL INVESTMENTS PURCHASED WITH THE CASH PROCEEDS | | | | | | | | |
| FROM SECURITIES LENDING | | | | | | | | |
| (cost $4,404,520) | | | | | | | 4,404,520 | |
| TOTAL INVESTMENTS — 99.66% | | | | | | | | |
| (cost $145,254,285) | | | | | | $ | 142,091,680 | |
Percentages are stated as a percent of net assets.
* — Non-income producing security.
^ — This security or a portion of this security was out on loan at June 30, 2015. Total loaned securities had a market value of $4,285,844 at June 30, 2015.
# — All or a portion of the shares have been committed as collateral for written option contracts.
■— Restricted security restricted to institutional investors (144a securities); the percentage of net assets comprised of 144a securities was 19.66%.
c — Default or other conditions exist and the security is not presently accruing income.
+ — Security is considered illiquid. The aggregate value of such securities is $332,500 or 0.23% of net assets.
b — The rate quoted is the annualized seven-day yield as of June 30, 2015.
d — 100 shares per contract.
CAD — Canadian Dollars.
ETF — Exchange Traded Fund.
ETN — Exchange Traded Note.
The accompanying notes are an integral part of these financial statements.
| KINETICS PORTFOLIOS TRUST — MASTER INVESTMENT PORTFOLIOS |
| The Alternative Income Portfolio |
| Portfolio of Options Written — June 30, 2015 (Unaudited) |
| PUT OPTIONS WRITTEN | | Contractsd | | | Value | |
| Accommodation | | | | | | |
| Carnival Corporation | | | | | | |
| Expiration: January 2017, Exercise Price: $28.00 | | | 14 | | | $ | 735 | |
| Expiration: January 2017, Exercise Price: $30.00 | | | 32 | | | | 2,160 | |
| Marriott International Inc. — Class A | | | | | | | | |
| Expiration: January 2016, Exercise Price: $55.00 | | | 4 | | | | 280 | |
| Expiration: January 2017, Exercise Price: $50.00 | | | 4 | | | | 710 | |
| Expiration: January 2017, Exercise Price: $55.00 | | | 9 | | | | 2,363 | |
| Starwood Hotels & Resorts Worldwide, Inc. | | | | | | | | |
| Expiration: January 2016, Exercise Price: $52.40 | | | 4 | | | | 182 | |
| Expiration: January 2016, Exercise Price: $54.90 | | | 10 | | | | 565 | |
| Expiration: January 2016, Exercise Price: $57.40 | | | 1 | | | | 71 | |
| Expiration: January 2016, Exercise Price: $59.90 | | | 5 | | | | 452 | |
| Expiration: January 2017, Exercise Price: $54.35 | | | 12 | | | | 2,484 | |
| | | | | | | | 10,002 | |
| Administrative and Support Services | | | | | | | | |
| Accenture plc — Class A | | | | | | | | |
| Expiration: January 2017, Exercise Price: $60.00 | | | 2 | | | | 325 | |
| Expiration: January 2017, Exercise Price: $65.00 | | | 4 | | | | 850 | |
| Expedia, Inc. | | | | | | | | |
| Expiration: January 2016, Exercise Price: $62.50 | | | 2 | | | | 85 | |
| Expiration: January 2017, Exercise Price: $55.00 | | | 2 | | | | 295 | |
| Expiration: January 2017, Exercise Price: $60.00 | | | 20 | | | | 4,050 | |
| The Priceline Group Inc. | | | | | | | | |
| Expiration: January 2017, Exercise Price: $860.00 | | | 1 | | | | 4,425 | |
| | | | | | | | 10,030 | |
| Apparel Manufacturing | | | | | | | | |
| L Brands, Inc. | | | | | | | | |
| Expiration: January 2017, Exercise Price: $48.00 | | | 27 | | | | 3,443 | |
| Expiration: January 2017, Exercise Price: $53.00 | | | 8 | | | | 1,440 | |
| | | | | | | | 4,883 | |
| Asset Management | | | | | | | | |
| Franklin Resources, Inc. | | | | | | | | |
| Expiration: January 2016, Exercise Price: $39.50 | | | 42 | | | | 2,730 | |
| KKR & Co. LP | | | | | | | | |
| Expiration: January 2016, Exercise Price: $13.00 | | | 9 | | | | 90 | |
| Expiration: January 2016, Exercise Price: $15.00 | | | 22 | | | | 275 | |
| | | | | | | | 3,095 | |
The accompanying notes are an integral part of these financial statements.
| KINETICS PORTFOLIOS TRUST — MASTER INVESTMENT PORTFOLIOS |
| The Alternative Income Portfolio |
Portfolio of Options Written — June 30, 2015 (Unaudited) — (Continued) |
| | | Contractsd | | | Value | |
| Beverage and Tobacco Product Manufacturing | | | | | | |
| The Coca-Cola Company | | | | | | |
| Expiration: January 2016, Exercise Price: $35.00 | | | 4 | | | $ | 256 | |
| Expiration: January 2017, Exercise Price: $35.00 | | | 17 | | | | 3,417 | |
| Molson Coors Brewing Company — Class B | | | | | | | | |
| Expiration: January 2016, Exercise Price: $50.00 | | | 2 | | | | 80 | |
| Expiration: January 2016, Exercise Price: $52.50 | | | 2 | | | | 115 | |
| Expiration: January 2016, Exercise Price: $55.00 | | | 9 | | | | 787 | |
| Expiration: January 2017, Exercise Price: $55.00 | | | 7 | | | | 2,013 | |
| Expiration: January 2017, Exercise Price: $60.00 | | | 2 | | | | 910 | |
| PepsiCo, Inc. | | | | | | | | |
| Expiration: January 2017, Exercise Price: $80.00 | | | 3 | | | | 1,125 | |
| Philip Morris International, Inc. | | | | | | | | |
| Expiration: January 2016, Exercise Price: $60.00 | | | 1 | | | | 65 | |
| | | | | | | | 8,768 | |
| Broadcasting (except Internet) | | | | | | | | |
| CBS Corporation — Class B | | | | | | | | |
| Expiration: January 2016, Exercise Price: $40.00 | | | 36 | | | | 1,764 | |
| Expiration: January 2016, Exercise Price: $42.50 | | | 8 | | | | 564 | |
| Expiration: January 2016, Exercise Price: $45.00 | | | 15 | | | | 1,470 | |
| Comcast Corporation — Class A | | | | | | | | |
| Expiration: January 2017, Exercise Price: $38.00 | | | 5 | | | | 480 | |
| Expiration: January 2017, Exercise Price: $40.00 | | | 11 | | | | 1,276 | |
| Sirius XM Holdings Inc. | | | | | | | | |
| Expiration: January 2016, Exercise Price: $2.50 | | | 160 | | | | 480 | |
| Twenty-First Century Fox, Inc. — Class A | | | | | | | | |
| Expiration: January 2016, Exercise Price: $23.00 | | | 14 | | | | 280 | |
| Expiration: January 2016, Exercise Price: $25.00 | | | 25 | | | | 812 | |
| Expiration: January 2017, Exercise Price: $23.00 | | | 5 | | | | 400 | |
| Expiration: January 2017, Exercise Price: $25.00 | | | 16 | | | | 1,840 | |
| | | | | | | | 9,366 | |
| Building Material and Garden Equipment and Supplies Dealers | | | | | | | | |
| Fastenal Company | | | | | | | | |
| Expiration: January 2016, Exercise Price: $33.00 | | | 20 | | | | 850 | |
| Expiration: January 2016, Exercise Price: $35.00 | | | 3 | | | | 218 | |
| Expiration: January 2016, Exercise Price: $38.00 | | | 2 | | | | 260 | |
| Expiration: January 2017, Exercise Price: $30.00 | | | 4 | | | | 410 | |
| Expiration: January 2017, Exercise Price: $33.00 | | | 16 | | | | 2,600 | |
The accompanying notes are an integral part of these financial statements.
| KINETICS PORTFOLIOS TRUST — MASTER INVESTMENT PORTFOLIOS |
| The Alternative Income Portfolio |
Portfolio of Options Written — June 30, 2015 (Unaudited) — (Continued) |
| | | Contractsd | | | Value | |
| Building Material and Garden Equipment and Supplies Dealers (Continued) | | | | | | |
| The Home Depot, Inc. | | | | | | |
| Expiration: January 2017, Exercise Price: $70.00 | | | 10 | | | $ | 1,775 | |
| Expiration: January 2017, Exercise Price: $75.00 | | | 8 | | | | 1,812 | |
| Lowe’s Companies, Inc. | | | | | | | | |
| Expiration: January 2017, Exercise Price: $40.00 | | | 15 | | | | 1,515 | |
| Expiration: January 2017, Exercise Price: $45.00 | | | 4 | | | | 614 | |
| | | | | | | | 10,054 | |
| Cable Distributor | | | | | | | | |
| Liberty Global plc — Class A | | | | | | | | |
| Expiration: January 2016, Exercise Price: $35.00 | | | 2 | | | | 80 | |
| Expiration: January 2016, Exercise Price: $60.00 | | | 3 | | | | 360 | |
| | | | | | | | 440 | |
| Chemical Manufacturing | | | | | | | | |
| Celgene Corporation | | | | | | | | |
| Expiration: January 2017, Exercise Price: $65.00 | | | 2 | | | | 478 | |
| Expiration: January 2017, Exercise Price: $70.00 | | | 3 | | | | 918 | |
| Expiration: January 2017, Exercise Price: $75.00 | | | 12 | | | | 4,650 | |
| CF Industries Holdings, Inc. | | | | | | | | |
| Expiration: January 2017, Exercise Price: $39.00 | | | 10 | | | | 1,085 | |
| Expiration: January 2017, Exercise Price: $40.00 | | | 5 | | | | 602 | |
| The Dow Chemical Company | | | | | | | | |
| Expiration: January 2016, Exercise Price: $33.00 | | | 6 | | | | 144 | |
| Expiration: January 2016, Exercise Price: $35.00 | | | 8 | | | | 268 | |
| Expiration: January 2016, Exercise Price: $37.00 | | | 35 | | | | 1,610 | |
| Expiration: January 2016, Exercise Price: $40.00 | | | 13 | | | | 910 | |
| E.I. du Pont de Nemours and Company | | | | | | | | |
| Expiration: January 2017, Exercise Price: $55.00 | | | 4 | | | | 1,600 | |
| Eastman Chemical Company | | | | | | | | |
| Expiration: January 2016, Exercise Price: $55.00 | | | 6 | | | | 255 | |
| Expiration: January 2016, Exercise Price: $60.00 | | | 18 | | | | 1,215 | |
| Expiration: January 2016, Exercise Price: $65.00 | | | 6 | | | | 675 | |
| LyondellBasell Industries NV — Class A | | | | | | | | |
| Expiration: January 2016, Exercise Price: $60.00 | | | 11 | | | | 385 | |
| Expiration: January 2016, Exercise Price: $65.00 | | | 7 | | | | 298 | |
| Expiration: January 2016, Exercise Price: $67.50 | | | 12 | | | | 630 | |
The accompanying notes are an integral part of these financial statements.
��
| KINETICS PORTFOLIOS TRUST — MASTER INVESTMENT PORTFOLIOS |
| The Alternative Income Portfolio |
Portfolio of Options Written — June 30, 2015 (Unaudited) — (Continued) |
| | | Contractsd | | | Value | |
| Chemical Manufacturing (Continued) | | | | | | |
| Monsanto Company | | | | | | |
| Expiration: January 2016, Exercise Price: $85.00 | | | 7 | | | $ | 1,190 | |
| Expiration: January 2016, Exercise Price: $90.00 | | | 1 | | | | 221 | |
| Expiration: January 2016, Exercise Price: $95.00 | | | 5 | | | | 1,688 | |
| Expiration: January 2017, Exercise Price: $90.00 | | | 4 | | | | 2,480 | |
| The Mosaic Company | | | | | | | | |
| Expiration: January 2016, Exercise Price: $35.00 | | | 19 | | | | 627 | |
| Expiration: January 2016, Exercise Price: $37.50 | | | 9 | | | | 477 | |
| | | | | | | | 22,406 | |
| Clothing and Clothing Accessories Stores | | | | | | | | |
| DSW Inc. — Class A | | | | | | | | |
| Expiration: January 2017, Exercise Price: $20.00 | | | 35 | | | | 7,437 | |
| Expiration: January 2017, Exercise Price: $22.50 | | | 46 | | | | 4,945 | |
| The Gap, Inc. | | | | | | | | |
| Expiration: January 2016, Exercise Price: $28.00 | | | 51 | | | | 1,505 | |
| Expiration: January 2016, Exercise Price: $30.00 | | | 36 | | | | 1,746 | |
| Nordstrom, Inc. | | | | | | | | |
| Expiration: January 2016, Exercise Price: $55.00 | | | 5 | | | | 220 | |
| Expiration: January 2017, Exercise Price: $55.00 | | | 8 | | | | 1,772 | |
| Tiffany & Co. | | | | | | | | |
| Expiration: January 2016, Exercise Price: $65.00 | | | 1 | | | | 64 | |
| Expiration: January 2016, Exercise Price: $67.50 | | | 7 | | | | 556 | |
| Expiration: January 2016, Exercise Price: $70.00 | | | 2 | | | | 200 | |
| Expiration: January 2016, Exercise Price: $72.50 | | | 7 | | | | 886 | |
| Expiration: January 2016, Exercise Price: $75.00 | | | 8 | | | | 1,288 | |
| Expiration: January 2017, Exercise Price: $65.00 | | | 2 | | | | 568 | |
| Expiration: January 2017, Exercise Price: $70.00 | | | 4 | | | | 1,550 | |
| Expiration: January 2017, Exercise Price: $75.00 | | | 3 | | | | 1,620 | |
| | | | | | | | 24,357 | |
| Computer and Electronic Product Manufacturing | | | | | | | | |
| Agilent Technologies, Inc. | | | | | | | | |
| Expiration: January 2016, Exercise Price: $40.00 | | | 25 | | | | 837 | |
| Expiration: January 2016, Exercise Price: $42.50 | | | 3 | | | | 159 | |
| Expiration: January 2016, Exercise Price: $45.00 | | | 2 | | | | 167 | |
| Expiration: January 2017, Exercise Price: $30.00 | | | 6 | | | | 1,032 | |
| Expiration: January 2017, Exercise Price: $40.00 | | | 23 | | | | 4,243 | |
| Expiration: January 2017, Exercise Price: $42.50 | | | 5 | | | | 1,208 | |
The accompanying notes are an integral part of these financial statements.
| KINETICS PORTFOLIOS TRUST — MASTER INVESTMENT PORTFOLIOS |
| The Alternative Income Portfolio |
Portfolio of Options Written — June 30, 2015 (Unaudited) — (Continued) |
| | | Contractsd | | | Value | |
| Computer and Electronic Product Manufacturing (Continued) | | | | | | |
| Apple, Inc. | | | | | | |
| Expiration: January 2017, Exercise Price: $80.00 | | | 6 | | | $ | 1,398 | |
| Cisco Systems, Inc. | | | | | | | | |
| Expiration: January 2017, Exercise Price: $18.00 | | | 24 | | | | 1,404 | |
| Expiration: January 2017, Exercise Price: $20.00 | | | 12 | | | | 1,080 | |
| EMC Corporation | | | | | | | | |
| Expiration: January 2016, Exercise Price: $20.00 | | | 7 | | | | 175 | |
| Expiration: January 2017, Exercise Price: $23.00 | | | 11 | | | | 1,886 | |
| International Business Machines Corporation | | | | | | | | |
| Expiration: January 2016, Exercise Price: $130.00 | | | 1 | | | | 152 | |
| Expiration: January 2016, Exercise Price: $140.00 | | | 2 | | | | 546 | |
| Expiration: January 2016, Exercise Price: $160.00 | | | 2 | | | | 1,755 | |
| Expiration: January 2017, Exercise Price: $125.00 | | | 1 | | | | 543 | |
| Expiration: January 2017, Exercise Price: $130.00 | | | 4 | | | | 2,610 | |
| QUALCOMM Inc. | | | | | | | | |
| Expiration: January 2016, Exercise Price: $50.00 | | | 15 | | | | 1,207 | |
| Expiration: January 2016, Exercise Price: $55.00 | | | 6 | | | | 993 | |
| Expiration: January 2016, Exercise Price: $57.50 | | | 7 | | | | 1,613 | |
| Expiration: January 2016, Exercise Price: $60.00 | | | 3 | | | | 953 | |
| Expiration: January 2017, Exercise Price: $55.00 | | | 9 | | | | 4,208 | |
| St. Jude Medical, Inc. | | | | | | | | |
| Expiration: January 2016, Exercise Price: $50.00 | | | 19 | | | | 713 | |
| Texas Instruments Inc. | | | | | | | | |
| Expiration: January 2016, Exercise Price: $38.00 | | | 6 | | | | 273 | |
| Expiration: January 2017, Exercise Price: $30.00 | | | 4 | | | | 458 | |
| Expiration: January 2017, Exercise Price: $33.00 | | | 8 | | | | 904 | |
| Expiration: January 2017, Exercise Price: $38.00 | | | 7 | | | | 1,365 | |
| | | | | | | | 31,882 | |
| Construction of Buildings | | | | | | | | |
| Lennar Corporation — Class A | | | | | | | | |
| Expiration: January 2016, Exercise Price: $28.00 | | | 24 | | | | 264 | |
| Expiration: January 2016, Exercise Price: $30.00 | | | 9 | | | | 139 | |
| Expiration: January 2017, Exercise Price: $30.00 | | | 21 | | | | 1,775 | |
| Expiration: January 2017, Exercise Price: $33.00 | | | 6 | | | | 723 | |
| TRI Pointe Homes, Inc. | | | | | | | | |
| Expiration: January 2017, Exercise Price: $10.00 | | | 75 | | | | 3,563 | |
| | | | | | | | 6,464 | |
The accompanying notes are an integral part of these financial statements.
| KINETICS PORTFOLIOS TRUST — MASTER INVESTMENT PORTFOLIOS |
| The Alternative Income Portfolio |
Portfolio of Options Written — June 30, 2015 (Unaudited) — (Continued) |
| | | Contractsd | | | Value | |
| Consumer Staples | | | | | | |
| The Procter & Gamble Company | | | | | | |
| Expiration: January 2016, Exercise Price: $70.00 | | | 8 | | | $ | 956 | |
| Expiration: January 2017, Exercise Price: $70.00 | | | 2 | | | | 800 | |
| Expiration: January 2017, Exercise Price: $75.00 | | | 4 | | | | 2,410 | |
| | | | | | | | 4,166 | |
| Couriers and Messengers | | | | | | | | |
| FedEx Corp. | | | | | | | | |
| Expiration: January 2017, Exercise Price: $125.00 | | | 6 | | | | 2,385 | |
| Expiration: January 2017, Exercise Price: $130.00 | | | 4 | | | | 1,930 | |
| | | | | | | | 4,315 | |
| Credit Intermediation and Related Activities | | | | | | | | |
| American Express Company | | | | | | | | |
| Expiration: January 2016, Exercise Price: $60.00 | | | 1 | | | | 62 | |
| Expiration: January 2016, Exercise Price: $65.00 | | | 12 | | | | 1,284 | |
| Expiration: January 2016, Exercise Price: $67.50 | | | 6 | | | | 867 | |
| Expiration: January 2016, Exercise Price: $70.00 | | | 9 | | | | 1,742 | |
| Expiration: January 2016, Exercise Price: $75.00 | | | 2 | | | | 695 | |
| Expiration: January 2017, Exercise Price: $65.00 | | | 5 | | | | 1,825 | |
| Expiration: January 2017, Exercise Price: $70.00 | | | 4 | | | | 2,100 | |
| Bank of America Corporation | | | | | | | | |
| Expiration: January 2017, Exercise Price: $13.00 | | | 15 | | | | 1,110 | |
| The Bank of New York Mellon Corporation | | | | | | | | |
| Expiration: January 2016, Exercise Price: $30.00 | | | 5 | | | | 115 | |
| Citigroup Inc. | | | | | | | | |
| Expiration: January 2016, Exercise Price: $40.00 | | | 17 | | | | 765 | |
| Expiration: January 2016, Exercise Price: $43.00 | | | 8 | | | | 524 | |
| State Street Corporation | | | | | | | | |
| Expiration: January 2016, Exercise Price: $50.00 | | | 2 | | | | 64 | |
| U.S. Bancorp | | | | | | | | |
| Expiration: January 2016, Exercise Price: $33.00 | | | 3 | | | | 97 | |
| Expiration: January 2016, Exercise Price: $35.00 | | | 2 | | | | 97 | |
| Wells Fargo & Company | | | | | | | | |
| Expiration: January 2016, Exercise Price: $40.00 | | | 4 | | | | 144 | |
| Expiration: January 2017, Exercise Price: $40.00 | | | 15 | | | | 2,288 | |
| Expiration: January 2017, Exercise Price: $45.00 | | | 3 | | | | 720 | |
| | | | | | | | 14,499 | |
The accompanying notes are an integral part of these financial statements.
| KINETICS PORTFOLIOS TRUST — MASTER INVESTMENT PORTFOLIOS |
| The Alternative Income Portfolio |
Portfolio of Options Written — June 30, 2015 (Unaudited) — (Continued) |
| | | Contractsd | | | Value | |
| Diversified Financial Services | | | | | | |
| The Goldman Sachs Group, Inc. | | | | | | |
| Expiration: January 2017, Exercise Price: $150.00 | | | 2 | | | $ | 1,230 | |
| E-Commerce | | | | | | | | |
| Amazon.com, Inc. | | | | | | | | |
| Expiration: January 2016, Exercise Price: $290.00 | | | 1 | | | | 243 | |
| Expiration: January 2017, Exercise Price: $240.00 | | | 1 | | | | 655 | |
| Expiration: January 2017, Exercise Price: $250.00 | | | 1 | | | | 762 | |
| eBay, Inc. | | | | | | | | |
| Expiration: January 2016, Exercise Price: $45.00 | | | 9 | | | | 405 | |
| Expiration: January 2017, Exercise Price: $40.00 | | | 18 | | | | 1,845 | |
| | | | | | | | 3,910 | |
| Electrical Equipment, Appliance, and Component Manufacturing | | | | | | | | |
| Corning Inc. | | | | | | | | |
| Expiration: January 2016, Exercise Price: $15.00 | | | 13 | | | | 312 | |
| Expiration: January 2017, Exercise Price: $15.00 | | | 23 | | | | 2,105 | |
| Emerson Electric Co. | | | | | | | | |
| Expiration: January 2016, Exercise Price: $45.00 | | | 2 | | | | 140 | |
| Expiration: January 2016, Exercise Price: $50.00 | | | 11 | | | | 1,705 | |
| Expiration: January 2016, Exercise Price: $55.00 | | | 5 | | | | 1,675 | |
| Whirlpool Corporation | | | | | | | | |
| Expiration: January 2016, Exercise Price: $130.00 | | | 2 | | | | 398 | |
| | | | | | | | 6,335 | |
| Electronics and Appliance Stores | | | | | | | | |
| Best Buy Co., Inc. | | | | | | | | |
| Expiration: January 2016, Exercise Price: $22.49 | | | 16 | | | | 504 | |
| Expiration: January 2016, Exercise Price: $24.49 | | | 6 | | | | 318 | |
| | | | | | | | 822 | |
The accompanying notes are an integral part of these financial statements.
| KINETICS PORTFOLIOS TRUST — MASTER INVESTMENT PORTFOLIOS |
| The Alternative Income Portfolio |
Portfolio of Options Written — June 30, 2015 (Unaudited) — (Continued) |
| | | Contractsd | | | Value | |
| Equity Index | | | | | | |
| S&P 500 Index | | | | | | |
| Expiration: July 2015, Exercise Price: $2,020.00 | | | 1 | | | $ | 1,290 | |
| Expiration: July 2015, Exercise Price: $2,030.00 | | | 6 | | | | 1,680 | |
| Expiration: July 2015, Exercise Price: $2,030.00 | | | 7 | | | | 10,675 | |
| Expiration: July 2015, Exercise Price: $2,035.00 | | | 1 | | | | 2,090 | |
| Expiration: July 2015, Exercise Price: $2,040.00 | | | 1 | | | | 2,240 | |
| Expiration: July 2015, Exercise Price: $2,040.00 | | | 3 | | | | 7,920 | |
| Expiration: July 2015, Exercise Price: $2,045.00 | | | 17 | | | | 33,065 | |
| Expiration: July 2015, Exercise Price: $2,045.00 | | | 4 | | | | 11,180 | |
| Expiration: July 2015, Exercise Price: $2,050.00 | | | 11 | | | | 7,755 | |
| Expiration: July 2015, Exercise Price: $2,055.00 | | | 1 | | | | 870 | |
| Expiration: July 2015, Exercise Price: $2,055.00 | | | 23 | | | | 62,675 | |
| Expiration: July 2015, Exercise Price: $2,055.00 | | | 4 | | | | 12,560 | |
| Expiration: July 2015, Exercise Price: $2,060.00 | | | 4 | | | | 13,280 | |
| Expiration: July 2015, Exercise Price: $2,065.00 | | | 1 | | | | 3,490 | |
| | | | | | | | 170,770 | |
| Fabricated Metal Product Manufacturing | | | | | | | | |
| Danaher Corporation | | | | | | | | |
| Expiration: January 2016, Exercise Price: $60.00 | | | 28 | | | | 1,680 | |
| Expiration: January 2016, Exercise Price: $65.00 | | | 5 | | | | 463 | |
| | | | | | | | 2,143 | |
| Food and Beverage Stores | | | | | | | | |
| Whole Foods Market, Inc. | | | | | | | | |
| Expiration: January 2016, Exercise Price: $35.00 | | | 8 | | | | 1,068 | |
| Expiration: January 2017, Exercise Price: $28.00 | | | 25 | | | | 3,338 | |
| Expiration: January 2017, Exercise Price: $30.00 | | | 6 | | | | 1,074 | |
| | | | | | | | 5,480 | |
| Food Manufacturing | | | | | | | | |
| Archer-Daniels-Midland Company | | | | | | | | |
| Expiration: January 2016, Exercise Price: $38.00 | | | 3 | | | | 165 | |
| Expiration: January 2016, Exercise Price: $40.00 | | | 17 | | | | 1,300 | |
| Bunge Limited | | | | | | | | |
| Expiration: January 2016, Exercise Price: $65.00 | | | 10 | | | | 550 | |
| ConAgra Foods, Inc. | | | | | | | | |
| Expiration: January 2016, Exercise Price: $28.00 | | | 8 | | | | 140 | |
The accompanying notes are an integral part of these financial statements.
| KINETICS PORTFOLIOS TRUST — MASTER INVESTMENT PORTFOLIOS |
| The Alternative Income Portfolio |
Portfolio of Options Written — June 30, 2015 (Unaudited) — (Continued) |
| | | Contractsd | | | Value | |
| Food Manufacturing (Continued) | | | | | | |
| Mondelez International Inc. — Class A | | | | | | |
| Expiration: January 2016, Exercise Price: $32.00 | | | 8 | | | $ | 232 | |
| Tyson Foods, Inc. — Class A | | | | | | | | |
| Expiration: January 2016, Exercise Price: $28.00 | | | 5 | | | | 75 | |
| Expiration: January 2016, Exercise Price: $30.00 | | | 14 | | | | 350 | |
| Expiration: January 2017, Exercise Price: $28.00 | | | 55 | | | | 5,363 | |
| Expiration: January 2017, Exercise Price: $30.00 | | | 34 | | | | 4,590 | |
| | | | | | | | 12,765 | |
| Funds, Trusts, and Other Financial Vehicles | | | | | | | | |
| iShares MSCI Emerging Markets ETF | | | | | | | | |
| Expiration: January 2016, Exercise Price: $28.00 | | | 6 | | | | 129 | |
| Expiration: January 2016, Exercise Price: $30.00 | | | 10 | | | | 340 | |
| Expiration: January 2016, Exercise Price: $33.00 | | | 10 | | | | 645 | |
| Market Vectors Gold Miners ETF | | | | | | | | |
| Expiration: January 2016, Exercise Price: $15.00 | | | 21 | | | | 1,271 | |
| Expiration: January 2016, Exercise Price: $16.00 | | | 15 | | | | 1,395 | |
| | | | | | | | 3,780 | |
| Furniture and Home Furnishings Stores | | | | | | | | |
| Bed Bath & Beyond Inc. | | | | | | | | |
| Expiration: January 2016, Exercise Price: $50.00 | | | 10 | | | | 440 | |
| Gaming | | | | | | | | |
| Las Vegas Sands Corp. | | | | | | | | |
| Expiration: January 2016, Exercise Price: $45.00 | | | 20 | | | | 3,930 | |
| Expiration: January 2016, Exercise Price: $50.00 | | | 8 | | | | 3,000 | |
| Wynn Resorts Limited | | | | | | | | |
| Expiration: January 2016, Exercise Price: $110.00 | | | 7 | | | | 12,285 | |
| | | | | | | | 19,215 | |
| General Merchandise Stores | | | | | | | | |
| Macy’s, Inc. | | | | | | | | |
| Expiration: January 2016, Exercise Price: $45.00 | | | 5 | | | | 167 | |
| Expiration: January 2017, Exercise Price: $40.00 | | | 3 | | | | 335 | |
| Expiration: January 2017, Exercise Price: $42.50 | | | 23 | | | | 3,243 | |
| Expiration: January 2017, Exercise Price: $45.00 | | | 4 | | | | 702 | |
The accompanying notes are an integral part of these financial statements.
| KINETICS PORTFOLIOS TRUST — MASTER INVESTMENT PORTFOLIOS |
| The Alternative Income Portfolio |
Portfolio of Options Written — June 30, 2015 (Unaudited) — (Continued) |
| | | Contractsd | | | Value | |
| General Merchandise Stores (Continued) | | | | | | |
| Sears Holdings Corporation | | | | | | |
| Expiration: January 2016, Exercise Price: $18.00 | | | 8 | | | $ | 600 | |
| Wal-Mart Stores, Inc. | | | | | | | | |
| Expiration: January 2016, Exercise Price: $67.50 | | | 4 | | | | 926 | |
| | | | | | | | 5,973 | |
| Heavy and Civil Engineering Construction | | | | | | | | |
| Chicago Bridge & Iron Company N.V. | | | | | | | | |
| Expiration: January 2016, Exercise Price: $32.50 | | | 7 | | | | 927 | |
| Expiration: January 2016, Exercise Price: $35.00 | | | 3 | | | | 548 | |
| Expiration: January 2017, Exercise Price: $35.00 | | | 8 | | | | 2,840 | |
| Expiration: January 2017, Exercise Price: $37.50 | | | 19 | | | | 8,455 | |
| | | | | | | | 12,770 | |
| Insurance Carriers and Related Activities | | | | | | | | |
| Aflac, Inc. | | | | | | | | |
| Expiration: January 2016, Exercise Price: $50.00 | | | 2 | | | | 124 | |
| Expiration: January 2017, Exercise Price: $45.00 | | | 7 | | | | 857 | |
| Expiration: January 2017, Exercise Price: $47.50 | | | 4 | | | | 602 | |
| American International Group, Inc. | | | | | | | | |
| Expiration: January 2017, Exercise Price: $38.00 | | | 5 | | | | 512 | |
| Expiration: January 2017, Exercise Price: $40.00 | | | 16 | | | | 1,968 | |
| Lincoln National Corporation | | | | | | | | |
| Expiration: January 2016, Exercise Price: $38.00 | | | 31 | | | | 930 | |
| Expiration: January 2016, Exercise Price: $40.00 | | | 5 | | | | 195 | |
| MetLife, Inc. | | | | | | | | |
| Expiration: January 2016, Exercise Price: $35.00 | | | 8 | | | | 252 | |
| Expiration: January 2016, Exercise Price: $38.00 | | | 27 | | | | 1,040 | |
| Expiration: January 2016, Exercise Price: $40.00 | | | 19 | | | | 874 | |
| Prudential Financial, Inc. | | | | | | | | |
| Expiration: January 2016, Exercise Price: $60.00 | | | 1 | | | | 60 | |
| Expiration: January 2016, Exercise Price: $65.00 | | | 30 | | | | 2,595 | |
| | | | | | | | 10,009 | |
The accompanying notes are an integral part of these financial statements.
| KINETICS PORTFOLIOS TRUST — MASTER INVESTMENT PORTFOLIOS |
| The Alternative Income Portfolio |
Portfolio of Options Written — June 30, 2015 (Unaudited) — (Continued) |
| | | Contractsd | | | Value | |
| Leather and Allied Product Manufacturing | | | | | | |
| Coach, Inc. | | | | | | |
| Expiration: January 2016, Exercise Price: $28.00 | | | 5 | | | $ | 400 | |
| Expiration: January 2017, Exercise Price: $25.00 | | | 46 | | | | 7,130 | |
| Expiration: January 2017, Exercise Price: $28.00 | | | 6 | | | | 1,485 | |
| NIKE, Inc. — Class B | | | | | | | | |
| Expiration: January 2017, Exercise Price: $70.00 | | | 5 | | | | 780 | |
| | | | | | | | 9,795 | |
| Machinery Manufacturing | | | | | | | | |
| Baker Hughes Inc. | | | | | | | | |
| Expiration: January 2016, Exercise Price: $50.00 | | | 8 | | | | 1,372 | |
| Expiration: January 2016, Exercise Price: $52.50 | | | 4 | | | | 938 | |
| Expiration: January 2017, Exercise Price: $40.00 | | | 8 | | | | 1,900 | |
| Cameron International Corporation | | | | | | | | |
| Expiration: January 2016, Exercise Price: $40.00 | | | 8 | | | | 860 | |
| Expiration: January 2017, Exercise Price: $45.00 | | | 4 | | | | 1,780 | |
| Caterpillar Inc. | | | | | | | | |
| Expiration: January 2016, Exercise Price: $65.00 | | | 8 | | | | 596 | |
| Expiration: January 2016, Exercise Price: $70.00 | | | 5 | | | | 657 | |
| Expiration: January 2016, Exercise Price: $75.00 | | | 2 | | | | 463 | |
| Expiration: January 2016, Exercise Price: $77.50 | | | 3 | | | | 909 | |
| Expiration: January 2016, Exercise Price: $80.00 | | | 2 | | | | 785 | |
| Expiration: January 2016, Exercise Price: $82.50 | | | 1 | | | | 498 | |
| Expiration: January 2017, Exercise Price: $70.00 | | | 12 | | | | 5,760 | |
| Expiration: January 2017, Exercise Price: $75.00 | | | 18 | | | | 11,835 | |
| Cummins Inc. | | | | | | | | |
| Expiration: January 2016, Exercise Price: $95.00 | | | 4 | | | | 370 | |
| Expiration: January 2016, Exercise Price: $100.00 | | | 3 | | | | 375 | |
| Expiration: January 2016, Exercise Price: $105.00 | | | 12 | | | | 2,010 | |
| Expiration: January 2016, Exercise Price: $110.00 | | | 6 | | | | 1,410 | |
| Expiration: January 2016, Exercise Price: $115.00 | | | 1 | | | | 330 | |
| Eaton Corporation plc | | | | | | | | |
| Expiration: January 2016, Exercise Price: $50.00 | | | 17 | | | | 1,147 | |
| Expiration: January 2016, Exercise Price: $55.00 | | | 12 | | | | 1,380 | |
| Expiration: January 2016, Exercise Price: $57.50 | | | 8 | | | | 1,240 | |
| Expiration: January 2017, Exercise Price: $45.00 | | | 10 | | | | 1,850 | |
The accompanying notes are an integral part of these financial statements.
| KINETICS PORTFOLIOS TRUST — MASTER INVESTMENT PORTFOLIOS |
| The Alternative Income Portfolio |
Portfolio of Options Written — June 30, 2015 (Unaudited) — (Continued) |
| | | Contractsd | | | Value | |
| Machinery Manufacturing (Continued) | | | | | | |
| General Electric Company | | | | | | |
| Expiration: January 2016, Exercise Price: $20.00 | | | 34 | | | $ | 612 | |
| Ingersoll-Rand plc | | | | | | | | |
| Expiration: January 2016, Exercise Price: $47.50 | | | 2 | | | | 85 | |
| | | | | | | | 39,162 | |
| Media | | | | | | | | |
| Time Warner, Inc. | | | | | | | | |
| Expiration: January 2016, Exercise Price: $60.00 | | | 2 | | | | 85 | |
| Viacom Inc. — Class B | | | | | | | | |
| Expiration: January 2016, Exercise Price: $60.00 | | | 25 | | | | 6,938 | |
| Expiration: January 2016, Exercise Price: $65.00 | | | 2 | | | | 970 | |
| | | | | | | | 7,993 | |
| Merchant Wholesalers, Nondurable Goods | | | | | | | | |
| Express Scripts Holding Company | | | | | | | | |
| Expiration: January 2016, Exercise Price: $57.50 | | | 4 | | | | 158 | |
| Expiration: January 2017, Exercise Price: $60.00 | | | 4 | | | | 726 | |
| Ralph Lauren Corporation | | | | | | | | |
| Expiration: January 2016, Exercise Price: $110.00 | | | 1 | | | | 228 | |
| Expiration: January 2016, Exercise Price: $115.00 | | | 5 | | | | 1,625 | |
| Expiration: January 2016, Exercise Price: $120.00 | | | 1 | | | | 455 | |
| Expiration: January 2016, Exercise Price: $125.00 | | | 1 | | | | 615 | |
| Expiration: January 2016, Exercise Price: $130.00 | | | 1 | | | | 830 | |
| | | | | | | | 4,637 | |
| Mining (except Oil and Gas) | | | | | | | | |
| BHP Billiton Limited — ADR | | | | | | | | |
| Expiration: January 2016, Exercise Price: $45.00 | | | 4 | | | | 2,390 | |
| Expiration: January 2017, Exercise Price: $42.50 | | | 21 | | | | 14,542 | |
| Expiration: January 2017, Exercise Price: $45.00 | | | 4 | | | | 3,280 | |
| Newmont Mining Corporation | | | | | | | | |
| Expiration: January 2016, Exercise Price: $18.00 | | | 18 | | | | 774 | |
| Rio Tinto plc — ADR | | | | | | | | |
| Expiration: January 2016, Exercise Price: $37.50 | | | 9 | | | | 1,845 | |
| Expiration: January 2016, Exercise Price: $40.00 | | | 41 | | | | 12,915 | |
| Expiration: January 2016, Exercise Price: $42.50 | | | 2 | | | | 910 | |
| Expiration: January 2017, Exercise Price: $35.00 | | | 19 | | | | 7,030 | |
| Expiration: January 2017, Exercise Price: $37.50 | | | 11 | | | | 5,335 | |
| | | | | | | | 49,021 | |
The accompanying notes are an integral part of these financial statements.
| KINETICS PORTFOLIOS TRUST — MASTER INVESTMENT PORTFOLIOS |
| The Alternative Income Portfolio |
Portfolio of Options Written — June 30, 2015 (Unaudited) — (Continued) |
| | | Contractsd | | | Value | |
| Miscellaneous Manufacturing | | | | | | |
| 3M Co. | | | | | | |
| Expiration: January 2017, Exercise Price: $110.00 | | | 1 | | | $ | 365 | |
| Expiration: January 2017, Exercise Price: $115.00 | | | 1 | | | | 438 | |
| Expiration: January 2017, Exercise Price: $125.00 | | | 2 | | | | 1,260 | |
| Hasbro, Inc. | | | | | | | | |
| Expiration: January 2016, Exercise Price: $37.50 | | | 2 | | | | 50 | |
| Expiration: January 2016, Exercise Price: $45.00 | | | 7 | | | | 175 | |
| Expiration: January 2017, Exercise Price: $40.00 | | | 3 | | | | 277 | |
| Intuitive Surgical, Inc. | | | | | | | | |
| Expiration: January 2016, Exercise Price: $350.00 | | | 2 | | | | 605 | |
| Expiration: January 2017, Exercise Price: $340.00 | | | 1 | | | | 1,185 | |
| Expiration: January 2017, Exercise Price: $370.00 | | | 2 | | | | 3,610 | |
| Expiration: January 2017, Exercise Price: $390.00 | | | 1 | | | | 2,360 | |
| Mattel, Inc. | | | | | | | | |
| Expiration: January 2017, Exercise Price: $23.00 | | | 51 | | | | 14,025 | |
| Stryker Corporation | | | | | | | | |
| Expiration: January 2016, Exercise Price: $75.00 | | | 3 | | | | 210 | |
| | | | | | | | 24,560 | |
| Motor Vehicle and Parts Dealers | | | | | | | | |
| CarMax, Inc. | | | | | | | | |
| Expiration: January 2017, Exercise Price: $33.00 | | | 3 | | | | 203 | |
| Expiration: January 2017, Exercise Price: $35.00 | | | 6 | | | | 510 | |
| Expiration: January 2017, Exercise Price: $40.00 | | | 10 | | | | 1,350 | |
| | | | | | | | 2,063 | |
| Nonmetallic Mineral Product Manufacturing | | | | | | | | |
| USG Corporation | | | | | | | | |
| Expiration: January 2016, Exercise Price: $20.00 | | | 62 | | | | 2,015 | |
| Expiration: January 2017, Exercise Price: $18.00 | | | 13 | | | | 1,170 | |
| Expiration: January 2017, Exercise Price: $20.00 | | | 9 | | | | 1,013 | |
| | | | | | | | 4,198 | |
| Non-Store Retailers | | | | | | | | |
| Sotheby’s | | | | | | | | |
| Expiration: January 2016, Exercise Price: $35.00 | | | 2 | | | | 60 | |
| Expiration: January 2017, Exercise Price: $25.00 | | | 8 | | | | 420 | |
| Expiration: January 2017, Exercise Price: $28.00 | | | 12 | | | | 960 | |
| Expiration: January 2017, Exercise Price: $30.00 | | | 6 | | | | 630 | |
| | | | | | | | 2,070 | |
The accompanying notes are an integral part of these financial statements.
| KINETICS PORTFOLIOS TRUST — MASTER INVESTMENT PORTFOLIOS |
| The Alternative Income Portfolio |
Portfolio of Options Written — June 30, 2015 (Unaudited) — (Continued) |
| | | Contractsd | | | Value | |
| Oil and Gas Extraction | | | | | | |
| Anadarko Petroleum Corporation | | | | | | |
| Expiration: January 2016, Exercise Price: $60.00 | | | 3 | | | $ | 318 | |
| Expiration: January 2016, Exercise Price: $72.50 | | | 1 | | | | 392 | |
| Expiration: January 2016, Exercise Price: $75.00 | | | 1 | | | | 490 | |
| Expiration: January 2017, Exercise Price: $60.00 | | | 2 | | | | 775 | |
| Expiration: January 2017, Exercise Price: $65.00 | | | 6 | | | | 3,090 | |
| Expiration: January 2017, Exercise Price: $70.00 | | | 3 | | | | 2,115 | |
| Apache Corporation | | | | | | | | |
| Expiration: January 2017, Exercise Price: $50.00 | | | 1 | | | | 495 | |
| Expiration: January 2017, Exercise Price: $55.00 | | | 5 | | | | 3,587 | |
| Canadian Natural Resources Limited | | | | | | | | |
| Expiration: January 2016, Exercise Price: $25.00 | | | 16 | | | | 2,640 | |
| Continental Resources, Inc. | | | | | | | | |
| Expiration: January 2016, Exercise Price: $32.50 | | | 32 | | | | 5,120 | |
| Devon Energy Corporation | | | | | | | | |
| Expiration: January 2017, Exercise Price: $45.00 | | | 6 | | | | 1,662 | |
| EOG Resources, Inc. | | | | | | | | |
| Expiration: January 2016, Exercise Price: $60.00 | | | 2 | | | | 112 | |
| Expiration: January 2016, Exercise Price: $65.00 | | | 2 | | | | 195 | |
| Expiration: January 2016, Exercise Price: $67.50 | | | 14 | | | | 1,792 | |
| Expiration: January 2016, Exercise Price: $70.00 | | | 2 | | | | 323 | |
| Expiration: January 2016, Exercise Price: $75.00 | | | 4 | | | | 1,052 | |
| Expiration: January 2016, Exercise Price: $80.00 | | | 3 | | | | 1,207 | |
| Expiration: January 2016, Exercise Price: $82.50 | | | 1 | | | | 488 | |
| Expiration: January 2016, Exercise Price: $85.00 | | | 4 | | | | 2,360 | |
| Expiration: January 2017, Exercise Price: $65.00 | | | 5 | | | | 1,875 | |
| Expiration: January 2017, Exercise Price: $70.00 | | | 7 | | | | 3,570 | |
| Marathon Oil Corporation | | | | | | | | |
| Expiration: January 2016, Exercise Price: $25.00 | | | 19 | | | | 3,126 | |
| Expiration: January 2017, Exercise Price: $25.00 | | | 18 | | | | 5,904 | |
| Occidental Petroleum Corporation | | | | | | | | |
| Expiration: January 2016, Exercise Price: $65.00 | | | 2 | | | | 225 | |
| Expiration: January 2016, Exercise Price: $70.00 | | | 11 | | | | 2,338 | |
| Expiration: January 2017, Exercise Price: $65.00 | | | 2 | | | | 810 | |
The accompanying notes are an integral part of these financial statements.
| KINETICS PORTFOLIOS TRUST — MASTER INVESTMENT PORTFOLIOS |
| The Alternative Income Portfolio |
Portfolio of Options Written — June 30, 2015 (Unaudited) — (Continued) |
| | | Contractsd | | | Value | |
| Oil and Gas Extraction (Continued) | | | | | | |
| Pioneer Natural Resources Company | | | | | | |
| Expiration: January 2016, Exercise Price: $115.00 | | | 8 | | | $ | 3,360 | |
| Expiration: January 2016, Exercise Price: $135.00 | | | 1 | | | | 1,030 | |
| | | | | | | | 50,451 | |
| Other Exchanges | | | | | | | | |
| CBOE Holdings Inc. | | | | | | | | |
| Expiration: January 2016, Exercise Price: $39.50 | | | 2 | | | | 60 | |
| Expiration: January 2016, Exercise Price: $49.50 | | | 5 | | | | 487 | |
| | | | | | | | 547 | |
| Other Information Services | | | | | | | | |
| Google Inc. — Class A | | | | | | | | |
| Expiration: January 2016, Exercise Price: $830.00 | | | 1 | | | | 755 | |
Expiration: January 2016, Exercise Price: $900.00e | | | 1 | | | | 148 | |
| Expiration: June 2016, Exercise Price: $405.00 | | | 1 | | | | 715 | |
| Expiration: June 2016, Exercise Price: $410.00 | | | 1 | | | | 765 | |
| Expiration: June 2016, Exercise Price: $420.00 | | | 2 | | | | 1,800 | |
| Expiration: June 2016, Exercise Price: $450.00 | | | 1 | | | | 1,390 | |
| | | | | | | | 5,573 | |
| Performing Arts, Spectator Sports, and Related Industries | | | | | | | | |
| Live Nation Entertainment, Inc. | | | | | | | | |
| Expiration: January 2016, Exercise Price: $13.00 | | | 48 | | | | 1,080 | |
| Expiration: January 2016, Exercise Price: $15.00 | | | 8 | | | | 120 | |
| Expiration: January 2016, Exercise Price: $17.00 | | | 32 | | | | 560 | |
| | | | | | | | 1,760 | |
| Petroleum and Coal Products Manufacturing | | | | | | | | |
| Chevron Corporation | | | | | | | | |
| Expiration: January 2016, Exercise Price: $85.00 | | | 2 | | | | 420 | |
| Expiration: January 2016, Exercise Price: $90.00 | | | 2 | | | | 685 | |
| ConocoPhillips | | | | | | | | |
| Expiration: January 2016, Exercise Price: $50.00 | | | 10 | | | | 840 | |
| Expiration: January 2017, Exercise Price: $50.00 | | | 12 | | | | 3,930 | |
| Expiration: January 2017, Exercise Price: $55.00 | | | 10 | | | | 5,000 | |
| Exxon Mobil Corporation | | | | | | | | |
| Expiration: January 2017, Exercise Price: $75.00 | | | 3 | | | | 1,583 | |
| Hess Corporation | | | | | | | | |
| Expiration: January 2016, Exercise Price: $55.00 | | | 4 | | | | 582 | |
| Expiration: January 2016, Exercise Price: $60.00 | | | 26 | | | | 6,630 | |
| Expiration: January 2017, Exercise Price: $65.00 | | | 3 | | | | 2,242 | |
The accompanying notes are an integral part of these financial statements.
| KINETICS PORTFOLIOS TRUST — MASTER INVESTMENT PORTFOLIOS |
| The Alternative Income Portfolio |
Portfolio of Options Written — June 30, 2015 (Unaudited) — (Continued) |
| | | Contractsd | | | Value | |
| Petroleum and Coal Products Manufacturing (Continued) | | | | | | |
| Marathon Petroleum Corporation | | | | | | |
| Expiration: January 2016, Exercise Price: $32.50 | | | 14 | | | $ | 315 | |
| Expiration: January 2016, Exercise Price: $33.75 | | | 16 | | | | 400 | |
| Expiration: January 2016, Exercise Price: $35.00 | | | 2 | | | | 70 | |
| Expiration: January 2017, Exercise Price: $32.50 | | | 18 | | | | 2,205 | |
| Phillips 66 | | | | | | | | |
| Expiration: January 2016, Exercise Price: $55.00 | | | 15 | | | | 712 | |
| Expiration: January 2016, Exercise Price: $57.50 | | | 4 | | | | 270 | |
| Expiration: January 2016, Exercise Price: $60.00 | | | 14 | | | | 1,190 | |
| Expiration: January 2016, Exercise Price: $62.50 | | | 3 | | | | 322 | |
| Expiration: January 2016, Exercise Price: $65.00 | | | 2 | | | | 270 | |
| Expiration: January 2017, Exercise Price: $55.00 | | | 14 | | | | 3,150 | |
| Expiration: January 2017, Exercise Price: $60.00 | | | 3 | | | | 968 | |
| Valero Energy Corporation | | | | | | | | |
| Expiration: January 2016, Exercise Price: $40.00 | | | 6 | | | | 189 | |
| | | | | | | | 31,973 | |
| Pharmaceutical and Biotechnology | | | | | | | | |
| AbbVie Inc. | | | | | | | | |
| Expiration: January 2016, Exercise Price: $42.50 | | | 6 | | | | 180 | |
| Expiration: January 2017, Exercise Price: $45.00 | | | 10 | | | | 1,600 | |
| Expiration: January 2017, Exercise Price: $47.50 | | | 8 | | | | 1,640 | |
| Amgen Inc. | | | | | | | | |
| Expiration: January 2017, Exercise Price: $95.00 | | | 1 | | | | 331 | |
| Expiration: January 2017, Exercise Price: $100.00 | | | 2 | | | | 800 | |
| Expiration: January 2017, Exercise Price: $105.00 | | | 1 | | | | 450 | |
| Expiration: January 2017, Exercise Price: $110.00 | | | 2 | | | | 1,155 | |
| Expiration: January 2017, Exercise Price: $115.00 | | | 2 | | | | 1,375 | |
| Expiration: January 2017, Exercise Price: $120.00 | | | 5 | | | | 4,087 | |
| Biogen Inc. | | | | | | | | |
| Expiration: January 2017, Exercise Price: $230.00 | | | 2 | | | | 1,410 | |
| Expiration: January 2017, Exercise Price: $240.00 | | | 3 | | | | 2,565 | |
| Bristol-Myers Squibb Company | | | | | | | | |
| Expiration: January 2016, Exercise Price: $35.00 | | | 18 | | | | 450 | |
| Expiration: January 2016, Exercise Price: $40.00 | | | 15 | | | | 487 | |
| Expiration: January 2016, Exercise Price: $43.00 | | | 6 | | | | 216 | |
| Expiration: January 2016, Exercise Price: $45.00 | | | 4 | | | | 194 | |
The accompanying notes are an integral part of these financial statements.
| KINETICS PORTFOLIOS TRUST — MASTER INVESTMENT PORTFOLIOS |
| The Alternative Income Portfolio |
Portfolio of Options Written — June 30, 2015 (Unaudited) — (Continued) |
| | | Contractsd | | | Value | |
| Pharmaceutical and Biotechnology (Continued) | | | | | | |
| Eli Lilly & Company | | | | | | |
| Expiration: January 2017, Exercise Price: $50.00 | | | 7 | | | $ | 858 | |
| Gilead Sciences, Inc. | | | | | | | | |
| Expiration: January 2017, Exercise Price: $75.00 | | | 1 | | | | 312 | |
| Expiration: January 2017, Exercise Price: $80.00 | | | 6 | | | | 2,430 | |
| Expiration: January 2017, Exercise Price: $85.00 | | | 2 | | | | 1,020 | |
| Merck & Co., Inc. | | | | | | | | |
| Expiration: January 2016, Exercise Price: $45.00 | | | 5 | | | | 290 | |
| Expiration: January 2016, Exercise Price: $47.00 | | | 5 | | | | 385 | |
| Expiration: January 2017, Exercise Price: $40.00 | | | 3 | | | | 387 | |
| Expiration: January 2017, Exercise Price: $42.50 | | | 15 | | | | 2,520 | |
| Expiration: January 2017, Exercise Price: $45.00 | | | 17 | | | | 3,672 | |
| Expiration: January 2017, Exercise Price: $47.50 | | | 3 | | | | 837 | |
| | | | | | | | 29,651 | |
| Pipeline Transportation | | | | | | | | |
| The Williams Companies, Inc. | | | | | | | | |
| Expiration: January 2016, Exercise Price: $40.00 | | | 7 | | | | 525 | |
| Expiration: January 2016, Exercise Price: $42.00 | | | 13 | | | | 1,189 | |
| Expiration: January 2017, Exercise Price: $35.00 | | | 3 | | | | 417 | |
| Expiration: January 2017, Exercise Price: $38.00 | | | 7 | | | | 1,358 | |
| Expiration: January 2017, Exercise Price: $40.00 | | | 20 | | | | 4,430 | |
| Expiration: January 2017, Exercise Price: $43.00 | | | 5 | | | | 1,573 | |
| | | | | | | | 9,492 | |
| Primary Metal Manufacturing | | | | | | | | |
| Nucor Corporation | | | | | | | | |
| Expiration: January 2017, Exercise Price: $40.00 | | | 5 | | | | 2,088 | |
| Professional, Scientific, and Technical Services | | | | | | | | |
| Cerner Corporation | | | | | | | | |
| Expiration: January 2016, Exercise Price: $45.00 | | | 13 | | | | 390 | |
| Computer Sciences Corporation | | | | | | | | |
| Expiration: January 2016, Exercise Price: $50.00 | | | 5 | | | | 462 | |
| Fluor Corporation | | | | | | | | |
| Expiration: January 2016, Exercise Price: $50.00 | | | 9 | | | | 2,340 | |
| Expiration: January 2016, Exercise Price: $55.00 | | | 3 | | | | 1,500 | |
| Expiration: January 2017, Exercise Price: $47.50 | | | 9 | | | | 4,095 | |
| Expiration: January 2017, Exercise Price: $50.00 | | | 11 | | | | 6,160 | |
The accompanying notes are an integral part of these financial statements.
| KINETICS PORTFOLIOS TRUST — MASTER INVESTMENT PORTFOLIOS |
| The Alternative Income Portfolio |
Portfolio of Options Written — June 30, 2015 (Unaudited) — (Continued) |
| | | Contractsd | | | Value | |
| Professional, Scientific, and Technical Services (Continued) | | | | | | |
| Leidos Holdings Inc. | | | | | | |
| Expiration: January 2016, Exercise Price: $35.00 | | | 8 | | | $ | 1,100 | |
| | | | | | | | 16,047 | |
| Publishing Industries (except Internet) | | | | | | | | |
| Autodesk, Inc. | | | | | | | | |
| Expiration: January 2016, Exercise Price: $37.00 | | | 4 | | | | 242 | |
| Expiration: January 2016, Exercise Price: $40.00 | | | 5 | | | | 497 | |
| Expiration: January 2017, Exercise Price: $40.00 | | | 17 | | | | 5,440 | |
| Expiration: January 2017, Exercise Price: $42.50 | | | 4 | | | | 1,620 | |
| Nuance Communications, Inc. | | | | | | | | |
| Expiration: January 2016, Exercise Price: $10.00 | | | 8 | | | | 80 | |
| | | | | | | | 7,879 | |
| Rail Transportation | | | | | | | | |
| CSX Corporation | | | | | | | | |
| Expiration: January 2016, Exercise Price: $20.00 | | | 15 | | | | 255 | |
| Norfolk Southern Corporation | | | | | | | | |
| Expiration: January 2016, Exercise Price: $75.00 | | | 1 | | | | 192 | |
| | | | | | | | 447 | |
| Satellite Telecommunications | | | | | | | | |
| DISH Network Corp. — Class A | | | | | | | | |
| Expiration: January 2016, Exercise Price: $47.00 | | | 15 | | | | 638 | |
| Securities, Commodity Contracts, and Other Financial Investments and | | | | | | | | |
| Related Activities | | | | | | | | |
| The Charles Schwab Corporation | | | | | | | | |
| Expiration: January 2016, Exercise Price: $20.00 | | | 46 | | | | 690 | |
| Expiration: January 2016, Exercise Price: $22.00 | | | 17 | | | | 425 | |
| CME Group Inc. | | | | | | | | |
| Expiration: January 2016, Exercise Price: $55.00 | | | 10 | | | | 375 | |
| Morgan Stanley | | | | | | | | |
| Expiration: January 2017, Exercise Price: $25.00 | | | 20 | | | | 1,950 | |
| | | | | | | | 3,440 | |
| Software | | | | | | | | |
| Adobe Systems, Inc. | | | | | | | | |
| Expiration: January 2017, Exercise Price: $45.00 | | | 3 | | | | 309 | |
| Expiration: January 2017, Exercise Price: $50.00 | | | 4 | | | | 594 | |
| Expiration: January 2017, Exercise Price: $55.00 | | | 5 | | | | 1,062 | |
| | | | | | | | 1,965 | |
The accompanying notes are an integral part of these financial statements.
| KINETICS PORTFOLIOS TRUST — MASTER INVESTMENT PORTFOLIOS |
| The Alternative Income Portfolio |
Portfolio of Options Written — June 30, 2015 (Unaudited) — (Continued) |
| | | | Contractsd | | Value | |
| Software Publishers | | | | | | | |
| Citrix Systems, Inc. | | | | | | | |
| Expiration: January 2016, Exercise Price: $47.50 | | | 11 | | $ | 385 | |
| Expiration: January 2016, Exercise Price: $50.00 | | | 5 | | | 237 | |
| Microsoft Corporation | | | | | | | |
| Expiration: January 2016, Exercise Price: $35.00 | | | 5 | | | 265 | |
| Expiration: January 2017, Exercise Price: $33.00 | | | 23 | | | 3,599 | |
| Expiration: January 2017, Exercise Price: $35.00 | | | 11 | | | 2,239 | |
| Oracle Corporation | | | | | | | |
| Expiration: January 2016, Exercise Price: $30.00 | | | 28 | | | 868 | |
| Expiration: January 2016, Exercise Price: $32.00 | | | 12 | | | 552 | |
| | | | | | | 8,145 | |
| Support Activities for Mining | | | | | | | |
| Halliburton Company | | | | | | | |
| Expiration: January 2016, Exercise Price: $33.00 | | | 6 | | | 423 | |
| Expiration: January 2016, Exercise Price: $35.00 | | | 10 | | | 1,010 | |
| Expiration: January 2016, Exercise Price: $38.00 | | | 22 | | | 3,795 | |
| Expiration: January 2016, Exercise Price: $40.00 | | | 6 | | | 1,434 | |
| Expiration: January 2017, Exercise Price: $35.00 | | | 2 | | | 540 | |
| Expiration: January 2017, Exercise Price: $37.50 | | | 3 | | | 1,080 | |
| Expiration: January 2017, Exercise Price: $40.00 | | | 20 | | | 9,200 | |
| Expiration: January 2017, Exercise Price: $42.50 | | | 8 | | | 4,660 | |
| Helmerich & Payne, Inc. | | | | | | | |
| Expiration: January 2016, Exercise Price: $55.00 | | | 22 | | | 4,125 | |
| Expiration: January 2016, Exercise Price: $60.00 | | | 5 | | | 1,475 | |
| Schlumberger Limited | | | | | | | |
| Expiration: January 2016, Exercise Price: $65.00 | | | 9 | | | 734 | |
| Expiration: January 2016, Exercise Price: $70.00 | | | 12 | | | 1,518 | |
| Expiration: January 2017, Exercise Price: $65.00 | | | 2 | | | 645 | |
| Expiration: January 2017, Exercise Price: $70.00 | | | 12 | | | 5,400 | |
| Expiration: January 2017, Exercise Price: $75.00 | | | 2 | | | 1,215 | |
| Transocean Limited | | | | | | | |
| Expiration: January 2016, Exercise Price: $15.00 | | | 64 | | | 14,208 | |
| | | | | | | 51,462 | |
| Support Activities for Transportation | | | | | | | |
| Expeditors International of Washington, Inc. | | | | | | | |
| Expiration: January 2016, Exercise Price: $35.00 | | | 1 | | | 35 | |
The accompanying notes are an integral part of these financial statements.
| KINETICS PORTFOLIOS TRUST — MASTER INVESTMENT PORTFOLIOS |
| The Alternative Income Portfolio |
Portfolio of Options Written — June 30, 2015 (Unaudited) — (Continued) |
| | | | Contractsd | | Value | |
| Transportation Equipment Manufacturing | | | | | | | |
| The Boeing Company | | | | | | | |
| Expiration: January 2016, Exercise Price: $105.00 | | | 2 | | $ | 230 | |
| Expiration: January 2017, Exercise Price: $90.00 | | | 13 | | | 3,549 | |
| Expiration: January 2017, Exercise Price: $95.00 | | | 2 | | | 655 | |
| Harley-Davidson, Inc. | | | | | | | |
| Expiration: January 2016, Exercise Price: $42.50 | | | 3 | | | 184 | |
| Expiration: January 2016, Exercise Price: $45.00 | | | 3 | | | 264 | |
| Expiration: January 2017, Exercise Price: $50.00 | | | 4 | | | 1,850 | |
| Johnson Controls, Inc. | | | | | | | |
| Expiration: January 2016, Exercise Price: $35.00 | | | 35 | | | 1,050 | |
| Expiration: January 2016, Exercise Price: $38.00 | | | 22 | | | 1,045 | |
| Expiration: January 2017, Exercise Price: $30.00 | | | 13 | | | 878 | |
| Expiration: January 2017, Exercise Price: $33.00 | | | 6 | | | 615 | |
| Textron Inc. | | | | | | | |
| Expiration: January 2016, Exercise Price: $27.00 | | | 12 | | | 978 | |
| Expiration: January 2016, Exercise Price: $30.00 | | | 8 | | | 384 | |
| United Technologies Corporation | | | | | | | |
| Expiration: January 2017, Exercise Price: $75.00 | | | 4 | | | 902 | |
| | | | | | | 12,584 | |
| TOTAL PUT OPTIONS WRITTEN | | | | | | | |
| (premiums received $1,269,341) | | | | | $ | 798,045 | |
| | |
d — 100 Shares Per Contract Unless Otherwise Noted. |
e — 10 Shares Per Contract. |
| ADR — American Depository Receipt. |
| ETF — Exchange Traded Fund. |
The accompanying notes are an integral part of these financial statements.
| KINETICS PORTFOLIOS TRUST — MASTER INVESTMENT PORTFOLIOS |
| The Multi-Disciplinary Income Portfolio |
Portfolio of Options Written — June 30, 2015 (Unaudited) — (Continued) |
| PUT OPTIONS WRITTEN | | Contractsd | | Value | |
| Accommodation | | | | | | | |
| Marriott International Inc. — Class A | | | | | | | |
| Expiration: January 2016, Exercise Price: $40.00 | | | 76 | | $ | 1,140 | |
| Expiration: January 2016, Exercise Price: $42.00 | | | 32 | | | 640 | |
| | | | | | | 1,780 | |
| Administrative and Support Services | | | | | | | |
| Expedia, Inc. | | | | | | | |
| Expiration: January 2016, Exercise Price: $50.00 | | | 102 | | | 1,275 | |
| Expiration: January 2016, Exercise Price: $55.00 | | | 12 | | | 270 | |
| | | | | | | 1,545 | |
| Ambulatory Health Care Services | | | | | | | |
| DaVita HealthCare Partners Inc. | | | | | | | |
| Expiration: January 2016, Exercise Price: $50.00 | | | 50 | | | 1,250 | |
| Asset Management | | | | | | | |
| Apollo Global Management LLC — Class A | | | | | | | |
| Expiration: January 2016, Exercise Price: $25.00 | | | 28 | | | 11,480 | |
| The Blackstone Group LP | | | | | | | |
| Expiration: January 2016, Exercise Price: $25.00 | | | 21 | | | 378 | |
| Franklin Resources, Inc. | | | | | | | |
| Expiration: January 2016, Exercise Price: $49.50 | | | 56 | | | 17,920 | |
| | | | | | | 29,778 | |
| Broadcasting (except Internet) | | | | | | | |
| Comcast Corporation — Class A | | | | | | | |
| Expiration: January 2017, Exercise Price: $35.00 | | | 44 | | | 3,168 | |
| Sirius XM Holdings Inc. | | | | | | | |
| Expiration: January 2016, Exercise Price: $3.00 | | | 336 | | | 1,680 | |
| Expiration: January 2016, Exercise Price: $3.50 | | | 192 | | | 2,688 | |
| Twenty-First Century Fox, Inc. — Class A | | | | | | | |
| Expiration: January 2016, Exercise Price: $30.00 | | | 14 | | | 1,645 | |
| | | | | | | 9,181 | |
| Cable Distributor | | | | | | | |
| Liberty Global plc — Class A | | | | | | | |
| Expiration: January 2016, Exercise Price: $75.00 | | | 6 | | | 750 | |
The accompanying notes are an integral part of these financial statements.
| KINETICS PORTFOLIOS TRUST — MASTER INVESTMENT PORTFOLIOS |
| The Multi-Disciplinary Income Portfolio |
Portfolio of Options Written — June 30, 2015 (Unaudited) — (Continued) |
| | | | Contractsd | | Value | |
| Chemical Manufacturing | | | | | | | |
| Celgene Corporation | | | | | | | |
| Expiration: January 2016, Exercise Price: $70.00 | | | 84 | | $ | 5,376 | |
| OPKO Health, Inc. | | | | | | | |
| Expiration: January 2016, Exercise Price: $5.00 | | | 180 | | | 4,950 | |
| Expiration: January 2017, Exercise Price: $5.00 | | | 26 | | | 715 | |
| | | | | | | 11,041 | |
| Clothing and Clothing Accessories Stores | | | | | | | |
| Tiffany & Co. | | | | | | | |
| Expiration: January 2016, Exercise Price: $67.50 | | | 14 | | | 1,113 | |
| Expiration: January 2016, Exercise Price: $70.00 | | | 34 | | | 3,400 | |
| Expiration: January 2016, Exercise Price: $75.00 | | | 14 | | | 2,254 | |
| | | | | | | 6,767 | |
| Computer and Electronic Product Manufacturing | | | | | | | |
| Apple, Inc. | | | | | | | |
| Expiration: January 2016, Exercise Price: $64.29 | | | 77 | | | 770 | |
| Expiration: January 2016, Exercise Price: $68.57 | | | 84 | | | 1,218 | |
| Expiration: January 2016, Exercise Price: $71.43 | | | 14 | | | 252 | |
| Expiration: January 2017, Exercise Price: $75.00 | | | 90 | | | 15,615 | |
| Sony Corporation | | | | | | | |
| Expiration: January 2016, Exercise Price: $15.00 | | | 240 | | | 3,000 | |
| | | | | | | 20,855 | |
| Construction of Buildings | | | | | | | |
| Lennar Corporation — Class A | | | | | | | |
| Expiration: January 2016, Exercise Price: $25.00 | | | 56 | | | 560 | |
| Expiration: January 2016, Exercise Price: $30.00 | | | 73 | | | 1,132 | |
| Expiration: January 2017, Exercise Price: $35.00 | | | 116 | | | 17,400 | |
| TRI Pointe Homes, Inc. | | | | | | | |
| Expiration: January 2017, Exercise Price: $12.00 | | | 232 | | | 18,560 | |
| | | | | | | 37,652 | |
| Couriers and Messengers | | | | | | | |
| FedEx Corp. | | | | | | | |
| Expiration: January 2017, Exercise Price: $120.00 | | | 54 | | | 17,955 | |
The accompanying notes are an integral part of these financial statements.
| KINETICS PORTFOLIOS TRUST — MASTER INVESTMENT PORTFOLIOS |
| The Multi-Disciplinary Income Portfolio |
Portfolio of Options Written — June 30, 2015 (Unaudited) — (Continued) |
| | | | Contractsd | | | Value | |
| Credit Intermediation and Related Activities | | | | | | | |
| American Express Company | | | | | | | |
| Expiration: January 2017, Exercise Price: $70.00 | | | 108 | | $ | 56,700 | |
| Bank of America Corporation | | | | | | | |
| Expiration: January 2016, Exercise Price: $15.00 | | | 128 | | | 6,272 | |
| Wells Fargo & Company | | | | | | | |
| Expiration: January 2016, Exercise Price: $40.00 | | | 16 | | | 576 | |
| Expiration: January 2017, Exercise Price: $45.00 | | | 144 | | | 34,560 | |
| | | | | | | 98,108 | |
| Data Processor | | | | | | | |
| MasterCard, Inc. — Class A | | | | | | | |
| Expiration: January 2017, Exercise Price: $65.00 | | | 108 | | | 24,246 | |
| E-Commerce | | | | | | | |
| eBay, Inc. | | | | | | | |
| Expiration: January 2017, Exercise Price: $40.00 | | | 72 | | | 7,380 | |
| Expiration: January 2017, Exercise Price: $45.00 | | | 144 | | | 25,560 | |
| | | | | | | 32,940 | |
| Fabricated Metal Product Manufacturing | | | | | | | |
| Danaher Corporation | | | | | | | |
| Expiration: January 2017, Exercise Price: $60.00 | | | 28 | | | 5,880 | |
| Food Services and Drinking Places | | | | | | | |
| Starbucks Corporation | | | | | | | |
| Expiration: January 2016, Exercise Price: $33.75 | | | 48 | | | 408 | |
| Expiration: January 2016, Exercise Price: $35.00 | | | 56 | | | 616 | |
| | | | | | | 1,024 | |
| Funds, Trusts, and Other Financial Vehicles | | | | | | | |
| iShares iBoxx $High Yield Corporate Bond ETF | | | | | | | |
| Expiration: January 2016, Exercise Price: $88.00 | | | 222 | | | 94,350 | |
| Expiration: January 2016, Exercise Price: $90.00 | | | 18 | | | 10,170 | |
| | | | | | | 104,520 | |
| Gaming | | | | | | | |
| Las Vegas Sands Corp. | | | | | | | |
| Expiration: January 2016, Exercise Price: $55.00 | | | 74 | | | 47,545 | |
| Expiration: January 2016, Exercise Price: $60.00 | | | 26 | | | 25,805 | |
| Wynn Resorts Limited | | | | | | | |
| Expiration: January 2016, Exercise Price: $150.00 | | | 12 | | | 62,670 | |
| | | | | | | 136,020 | |
The accompanying notes are an integral part of these financial statements.
| KINETICS PORTFOLIOS TRUST — MASTER INVESTMENT PORTFOLIOS |
| The Multi-Disciplinary Income Portfolio |
Portfolio of Options Written — June 30, 2015 (Unaudited) — (Continued) |
| | | | Contractsd | | Value | |
| Health Care Equipment and Services | | | | | | | |
| Hologic, Inc. | | | | | | | |
| Expiration: January 2016, Exercise Price: $18.00 | | | 45 | | $ | 225 | |
| Heavy and Civil Engineering Construction | | | | | | | |
| Chicago Bridge & Iron Company N.V. | | | | | | | |
| Expiration: January 2017, Exercise Price: $30.00 | | | 8 | | | 1,820 | |
| Insurance Carriers and Related Activities | | | | | | | |
| American International Group, Inc. | | | | | | | |
| Expiration: January 2016, Exercise Price: $45.00 | | | 102 | | | 4,233 | |
| AmTrust Financial Services, Inc. | | | | | | | |
| Expiration: January 2016, Exercise Price: $30.00 | | | 76 | | | 2,280 | |
| Expiration: January 2016, Exercise Price: $40.00 | | | 38 | | | 1,330 | |
| | | | | | | 7,843 | |
| Leather and Allied Product Manufacturing | | | | | | | |
| Coach, Inc. | | | | | | | |
| Expiration: January 2016, Exercise Price: $40.00 | | | 124 | | | 84,320 | |
| Machinery Manufacturing | | | | | | | |
| The Manitowoc Company, Inc. | | | | | | | |
| Expiration: January 2017, Exercise Price: $15.00 | | | 40 | | | 5,000 | |
| Media | | | | | | | |
| Viacom Inc. — Class B | | | | | | | |
| Expiration: January 2017, Exercise Price: $55.00 | | | 56 | | | 22,960 | |
| Mining (except Oil and Gas) | | | | | | | |
| Barrick Gold Corporation | | | | | | | |
| Expiration: January 2016, Exercise Price: $13.00 | | | 134 | | | 37,520 | |
| Expiration: January 2017, Exercise Price: $10.00 | | | 32 | | | 5,312 | |
| Franco-Nevada Corporation | | | | | | | |
| Expiration: July 2015, Exercise Price: $40.00 | | | 6 | | | 45 | |
| Expiration: July 2015, Exercise Price: $45.00 | | | 10 | | | 400 | |
| Expiration: October 2015, Exercise Price: $40.00 | | | 2 | | | 170 | |
| Freeport-McMoRan Copper & Gold Inc. | | | | | | | |
| Expiration: January 2016, Exercise Price: $30.00 | | | 4 | | | 4,650 | |
| Expiration: January 2016, Exercise Price: $32.00 | | | 20 | | | 27,350 | |
| Royal Gold, Inc. | | | | | | | |
| Expiration: January 2017, Exercise Price: $42.50 | | | 4 | | | 1,040 | |
The accompanying notes are an integral part of these financial statements.
| KINETICS PORTFOLIOS TRUST — MASTER INVESTMENT PORTFOLIOS |
| The Multi-Disciplinary Income Portfolio |
Portfolio of Options Written — June 30, 2015 (Unaudited) — (Continued) |
| | | | Contractsd | | Value | |
| Mining (except Oil and Gas)(Continued) | | | | | | | |
| Silver Wheaton Corporation | | | | | | | |
| Expiration: January 2016, Exercise Price: $13.00 | | | 32 | | $ | 944 | |
| Expiration: January 2016, Exercise Price: $15.00 | | | 52 | | | 3,822 | |
| Expiration: January 2016, Exercise Price: $18.00 | | | 52 | | | 10,816 | |
| Expiration: January 2017, Exercise Price: $13.00 | | | 100 | | | 11,650 | |
| | | | | | | 103,719 | |
| Oil and Gas Extraction | | | | | | | |
| Chesapeake Energy Corporation | | | | | | | |
| Expiration: January 2016, Exercise Price: $20.00 | | | 128 | | | 124,800 | |
| Expiration: January 2016, Exercise Price: $23.00 | | | 46 | | | 57,960 | |
| Expiration: January 2016, Exercise Price: $25.00 | | | 14 | | | 20,300 | |
| Continental Resources, Inc. | | | | | | | |
| Expiration: January 2016, Exercise Price: $30.00 | | | 10 | | | 1,125 | |
| Expiration: January 2016, Exercise Price: $35.00 | | | 4 | | | 860 | |
| Expiration: January 2017, Exercise Price: $35.00 | | | 20 | | | 9,800 | |
| | | | | | | 214,845 | |
| Other Exchanges | | | | | | | |
| CBOE Holdings Inc. | | | | | | | |
| Expiration: January 2016, Exercise Price: $44.50 | | | 50 | | | 2,250 | |
| Other Information Services | | | | | | | |
| Google Inc. — Class A | | | | | | | |
| Expiration: January 2016, Exercise Price: $950.00 | | | 7 | | | 17,430 | |
| Expiration: January 2017, Exercise Price: $360.00 | | | 18 | | | 16,470 | |
| | | | | | | 33,900 | |
| Performing Arts, Spectator Sports, and Related Industries | | | | | | | |
| Live Nation Entertainment, Inc. | | | | | | | |
| Expiration: January 2016, Exercise Price: $15.00 | | | 180 | | | 2,700 | |
| Expiration: January 2016, Exercise Price: $17.00 | | | 116 | | | 2,030 | |
| | | | | | | 4,730 | |
| Petroleum and Coal Products Manufacturing | | | | | | | |
| ConocoPhillips | | | | | | | |
| Expiration: January 2017, Exercise Price: $55.00 | | | 108 | | | 54,000 | |
| Exxon Mobil Corporation | | | | | | | |
| Expiration: January 2017, Exercise Price: $75.00 | | | 90 | | | 47,475 | |
| | | | | | | 101,475 | |
The accompanying notes are an integral part of these financial statements.
| KINETICS PORTFOLIOS TRUST — MASTER INVESTMENT PORTFOLIOS |
| The Multi-Disciplinary Income Portfolio |
Portfolio of Options Written — June 30, 2015 (Unaudited) — (Continued) |
| | | | Contractsd | | Value | |
| Pharmaceutical and Biotechnology | | | | | | | |
| AbbVie Inc. | | | | | | | |
| Expiration: January 2016, Exercise Price: $40.00 | | | 76 | | $ | 1,330 | |
| Amgen Inc. | | | | | | | |
| Expiration: January 2016, Exercise Price: $85.00 | | | 76 | | | 4,028 | |
| Gilead Sciences, Inc. | | | | | | | |
| Expiration: January 2016, Exercise Price: $50.00 | | | 76 | | | 570 | |
| | | | | | | 5,928 | |
| Pipeline Transportation | | | | | | | |
| The Williams Companies, Inc. | | | | | | | |
| Expiration: January 2016, Exercise Price: $30.00 | | | 144 | | | 2,376 | |
| Publishing Industries (except Internet) | | | | | | | |
| TEGNA Inc. | | | | | | | |
| Expiration: January 2017, Exercise Price: $25.00 | | | 28 | | | 2,870 | |
| Rail Transportation | | | | | | | |
| CSX Corporation | | | | | | | |
| Expiration: January 2017, Exercise Price: $27.00 | | | 216 | | | 40,392 | |
| Union Pacific Corporation | | | | | | | |
| Expiration: January 2017, Exercise Price: $85.00 | | | 84 | | | 61,950 | |
| | | | | | | 102,342 | |
| Rental and Leasing Services | | | | | | | |
| Hertz Global Holdings, Inc. | | | | | | | |
| Expiration: January 2017, Exercise Price: $15.00 | | | 48 | | | 9,360 | |
| Restaurants | | | | | | | |
| The Wendy’s Company | | | | | | | |
| Expiration: January 2016, Exercise Price: $7.00 | | | 1,080 | | | 8,100 | |
| Satellite Telecommunications | | | | | | | |
| DISH Network Corp. — Class A | | | | | | | |
| Expiration: January 2016, Exercise Price: $45.00 | | | 2 | | | 65 | |
| Expiration: January 2016, Exercise Price: $47.00 | | | 48 | | | 2,040 | |
| Expiration: January 2017, Exercise Price: $47.50 | | | 4 | | | 950 | |
| Expiration: January 2017, Exercise Price: $50.00 | | | 32 | | | 9,600 | |
| | | | | | | 12,655 | |
The accompanying notes are an integral part of these financial statements.
| KINETICS PORTFOLIOS TRUST — MASTER INVESTMENT PORTFOLIOS |
| The Multi-Disciplinary Income Portfolio |
| Portfolio of Options Written — June 30, 2015 (Unaudited) — (Continued) |
| | | | Contractsd | | Value | |
| Securities, Commodity Contracts, and Other Financial Investments | | | | | | | |
| and Related Activities | | | | | | | |
| CME Group Inc. | | | | | | | |
| Expiration: January 2016, Exercise Price: $65.00 | | | 10 | | $ | 675 | |
| Expiration: January 2016, Exercise Price: $70.00 | | | 32 | | | 3,120 | |
| Expiration: January 2016, Exercise Price: $75.00 | | | 90 | | | 12,375 | |
| Intercontinental Exchange, Inc. | | | | | | | |
| Expiration: January 2016, Exercise Price: $190.00 | | | 30 | | | 13,050 | |
| | | | | | | 29,220 | |
| Software and Services | | | | | | | |
| Nuance Communications, Inc. | | | | | | | |
| Expiration: January 2016, Exercise Price: $13.00 | | | 210 | | | 5,250 | |
| Expiration: January 2016, Exercise Price: $15.00 | | | 8 | | | 500 | |
| | | | | | | 5,750 | |
| Support Activities for Mining | | | | | | | |
| Transocean Limited | | | | | | | |
| Expiration: January 2016, Exercise Price: $40.00 | | | 120 | | | 295,800 | |
| Expiration: January 2017, Exercise Price: $10.00 | | | 20 | | | 3,970 | |
| Expiration: January 2017, Exercise Price: $20.00 | | | 2 | | | 1,530 | |
| | | | | | | 301,300 | |
| Telecommunications | | | | | | | |
| Level 3 Communications, Inc. | | | | | | | |
| Expiration: January 2017, Exercise Price: $33.00 | | | 12 | | | 1,170 | |
| TOTAL PUT OPTIONS WRITTEN | | | | | | | |
| (premiums received $2,481,085) | | | | | $ | 1,605,450 | |
| | |
d — 100 Shares Per Contract. |
| ETF — Exchange Traded Fund. |
The accompanying notes are an integral part of these financial statements.
| KINETICS PORTFOLIOS TRUST — MASTER INVESTMENT PORTFOLIOS |
| Statements of Assets & Liabilities |
| June 30, 2015 (Unaudited) |
| | | | The Internet | | | The Global | |
| | | | Portfolio | | | Portfolio | |
| ASSETS: | | | | | | | |
Investments, at value (1)(2) | | $ | 148,156,097 | | $ | 9,196,893 | |
| Cash | | | — | | | 9,677 | |
| Receivable for contributed capital | | | 28,513 | | | 14,215 | |
| Receivable for investments sold | | | 2,627,260 | | | — | |
| Dividends and interest receivable | | | 24,873 | | | 9,457 | |
| Other accounts receivable | | | 99,877 | | | — | |
| Prepaid expenses and other assets | | | 9,772 | | | 2,399 | |
| Total Assets | | | 150,946,392 | | | 9,232,641 | |
| LIABILITIES: | | | | | | | |
| Payable to Adviser | | | 154,046 | | | 9,248 | |
| Payable to Custodian | | | 138,774 | | | — | |
| Payable to Trustees | | | 2,326 | | | 137 | |
| Payable to Chief Compliance Officer | | | 172 | | | 6 | |
| Payable for collateral received for securities loaned | | | 5,262,475 | | | 463,370 | |
| Payable for withdrawn capital | | | 54,053 | | | — | |
| Accrued expenses and other liabilities | | | 27,415 | | | 11,323 | |
| Total Liabilities | | | 5,639,261 | | | 484,084 | |
| Net Assets | | $ | 145,307,131 | | $ | 8,748,557 | |
(1) Cost of investments | | $ | 73,263,472 | | $ | 7,857,141 | |
(2) Includes loaned securities with a market value of | | $ | 5,086,658 | | $ | 436,732 | |
The accompanying notes are an integral part of these financial statements.
| KINETICS PORTFOLIOS TRUST — MASTER INVESTMENT PORTFOLIOS |
Statements of Assets & Liabilities — (Continued) |
| June 30, 2015 (Unaudited) |
| | | | The Paradigm | | | The Medical | |
| | | | Portfolio | | | Portfolio | |
| ASSETS: | | | | | | | |
Investments, at value (1)(2)(3) | | | | | | | |
| Unaffiliated issuers | | $ | 1,075,006,123 | | $ | 33,038,265 | |
| Affiliated issuers | | | 89,365,176 | | | — | |
| Cash | | | 1,590,901 | | | — | |
| Receivable for contributed capital | | | 769,413 | | | 31,371 | |
| Receivable for investments sold | | | 2,739,593 | | | — | |
| Dividends and interest receivable | | | 123,886 | | | 26,556 | |
| Prepaid expenses and other assets | | | 190,344 | | | 2,509 | |
| Total Assets | | | 1,169,785,436 | | | 33,098,701 | |
| LIABILITIES: | | | | | | | |
| Payable to Adviser | | | 1,148,385 | | | 30,978 | |
| Payable to Trustees | | | 17,573 | | | 449 | |
| Payable to Chief Compliance Officer | | | 1,295 | | | 31 | |
| Payable for collateral received for securities loaned | | | 80,187,483 | | | 3,148,825 | |
| Payable for withdrawn capital | | | 1,168,660 | | | 2,469 | |
| Accrued expenses and other liabilities | | | 170,969 | | | 12,205 | |
| Total Liabilities | | | 82,694,365 | | | 3,194,957 | |
| Net Assets | | $ | 1,087,091,071 | | $ | 29,903,744 | |
(1) Unaffiliated issuers cost | | $ | 715,614,230 | | $ | 20,765,807 | |
(2) Affiliated issuers cost | | $ | 52,347,066 | | $ | — | |
(3) Includes loaned securities with a market value of | | $ | 76,631,535 | | $ | 3,077,519 | |
The accompanying notes are an integral part of these financial statements.
| KINETICS PORTFOLIOS TRUST — MASTER INVESTMENT PORTFOLIOS |
| Statements of Assets & Liabilities — (Continued) |
| June 30, 2015 (Unaudited) |
| | | | The Small Cap | | | The Market | |
| | | | Opportunities | | | Opportunities | |
| | | | Portfolio | | | Portfolio | |
| ASSETS: | | | | | | | |
Investments, at value (1)(2) | | $ | 369,070,446 | | $ | 51,192,305 | |
| Cash | | | 504,441 | | | 2,417,636 | |
| Receivable for contributed capital | | | 411,045 | | | 50,556 | |
| Receivable for investments sold | | | 1,138,341 | | | 93,637 | |
| Dividends and interest receivable | | | 112,976 | | | 15,634 | |
| Other accounts receivable | | | 20,977 | | | — | |
| Prepaid expenses and other assets | | | 68,049 | | | 3,136 | |
| Total Assets | | | 371,326,275 | | | 53,772,904 | |
| LIABILITIES: | | | | | | | |
| Payable to Adviser | | | 344,877 | | | 53,601 | |
| Payable to Trustees | | | 5,211 | | | 815 | |
| Payable to Chief Compliance Officer | | | 380 | | | 61 | |
| Payable for collateral received for securities loaned | | | 44,329,175 | | | 2,451,116 | |
| Payable for withdrawn capital | | | 441,528 | | | 3,669 | |
| Accrued expenses and other liabilities | | | 52,747 | | | 17,122 | |
| Total Liabilities | | | 45,173,918 | | | 2,526,384 | |
| Net Assets | | $ | 326,152,357 | | $ | 51,246,520 | |
(1) Cost of investments | | $ | 331,414,872 | | $ | 39,523,271 | |
(2) Includes loaned securities with a market value of | | $ | 42,780,293 | | $ | 2,360,131 | |
The accompanying notes are an integral part of these financial statements.
| KINETICS PORTFOLIOS TRUST — MASTER INVESTMENT PORTFOLIOS |
Statements of Assets & Liabilities — (Continued) |
| June 30, 2015 (Unaudited) |
| | | | The | | | The Multi- | |
| | | | Alternative | | | Disciplinary | |
| | | | Income | | | Income | |
| | | | Portfolio | | | Portfolio | |
| ASSETS: | | | | | | | |
Investments, at value (1)(2) | | $ | 35,373,135 | | $ | 142,091,680 | |
| Cash | | | 252,195 | | | 4,347,601 | |
| Receivable for contributed capital | | | 85,385 | | | 1,160,806 | |
| Dividends and interest receivable | | | 101,458 | | | 1,559,077 | |
| Prepaid expenses and other assets | | | 1,033 | | | 6,016 | |
| Total Assets | | | 35,813,206 | | | 149,165,180 | |
| LIABILITIES: | | | | | | | |
Written options, at value (3) | | | 798,045 | | | 1,605,450 | |
| Payable to Adviser | | | 25,738 | | | 146,449 | |
| Payable to Trustees | | | 558 | | | 2,165 | |
| Payable to Chief Compliance Officer | | | 43 | | | 150 | |
| Payable for securities purchased | | | — | | | 6,842 | |
| Payable for collateral received for securities loaned | | | — | | | 4,404,520 | |
| Payable for withdrawn capital | | | 1,037 | | | 396,262 | |
| Accrued expenses and other liabilities | | | 22,463 | | | 29,833 | |
| Total Liabilities | | | 847,884 | | | 6,591,671 | |
| Net Assets | | $ | 34,965,322 | | $ | 142,573,509 | |
(1) Cost of investments | | $ | 35,387,748 | | $ | 145,254,285 | |
(2) Includes loaned securities with a market value of | | $ | — | | $ | 4,285,844 | |
(3) Premiums received | | $ | 1,269,341 | | $ | 2,481,085 | |
The accompanying notes are an integral part of these financial statements.
| KINETICS PORTFOLIOS TRUST — MASTER INVESTMENT PORTFOLIOS |
| Statements of Operations |
| For the Six Months Ended June 30, 2015 (Unaudited) |
| | | | | | | | |
| | | | The Internet | | | The Global | |
| | | | Portfolio | | | Portfolio | |
| INVESTMENT INCOME: | | | | | | | |
| Dividends† | | $ | 283,338 | | $ | 27,575 | |
| Interest | | | 196 | | | 1,597 | |
| Income from securities lending | | | 26,823 | | | 12,196 | |
| Total investment income | | | 310,357 | | | 41,368 | |
| EXPENSES: | | | | | | | |
| Investment advisory fees | | | 943,181 | | | 55,561 | |
| Administration fees | | | 33,723 | | | 2,811 | |
| Professional fees | | | 8,352 | | | 4,193 | |
| Fund accounting fees | | | 13,458 | | | 3,509 | |
| Trustees’ fees | | | 6,134 | | | 355 | |
| Chief Compliance Officer fees | | | 1,015 | | | 53 | |
| Custodian fees and expenses | | | 7,673 | | | 6,192 | |
| Other expenses | | | 3,206 | | | 214 | |
| Total expenses | | | 1,016,742 | | | 72,888 | |
| Net investment loss | | | (706,385 | ) | | (31,520 | ) |
| REALIZED AND UNREALIZED GAIN (LOSS) ON INVESTMENTS: | | | | | | | |
| Net realized gain on: | | | | | | | |
| Investments and foreign currency | | | 8,569,225 | | | 247,593 | |
| Net change in unrealized appreciation (depreciation) of: | | | | | | | |
| Investments and foreign currency | | | (6,494,607 | ) | | 18,001 | |
| Net realized and unrealized gain on investments | | | 2,074,618 | | | 265,594 | |
| Net increase in net assets resulting from operations | | $ | 1,368,233 | | $ | 234,074 | |
| † Net of foreign taxes withheld of: | | $ | 979 | | $ | 2,870 | |
The accompanying notes are an integral part of these financial statements.
| KINETICS PORTFOLIOS TRUST — MASTER INVESTMENT PORTFOLIOS |
Statements of Operations — (Continued) |
| For the Six Months Ended June 30, 2015 (Unaudited) |
| | | | The Paradigm | | | The Medical | |
| | | | Portfolio | | | Portfolio | |
| INVESTMENT INCOME: | | | | | | | |
| Dividends† | | $ | 2,210,361 | | $ | 278,131 | |
| Interest | | | 51,299 | | | 40 | |
| Income from securities lending | | | 1,002,435 | | | 8,271 | |
| Dividends from affiliated issuer | | | 168,896 | | | — | |
| Total investment income | | | 3,432,991 | | | 286,442 | |
| EXPENSES: | | | | | | | |
| Investment advisory fees | | | 7,126,154 | | | 182,134 | |
| Administration fees | | | 251,835 | | | 6,666 | |
| Professional fees | | | 37,376 | | | 4,791 | |
| Fund accounting fees | | | 91,274 | | | 3,292 | |
| Trustees’ fees | | | 46,163 | | | 1,174 | |
| Chief Compliance Officer fees | | | 7,757 | | | 196 | |
| Custodian fees and expenses | | | 98,280 | | | 5,048 | |
| Other expenses | | | 24,160 | | | 519 | |
| Total expenses | | | 7,682,999 | | | 203,820 | |
| Net investment income (loss) | | | (4,250,008 | ) | | 82,622 | |
| REALIZED AND UNREALIZED GAIN (LOSS) ON INVESTMENTS: | | | | | | | |
| Net realized gain on: | | | | | | | |
| Investments and foreign currency | | | 62,579,947 | | | 1,329,082 | |
| Affiliated issuer | | | 26,857 | | | — | |
| Net change in unrealized appreciation (depreciation) of: | | | | | | | |
| Investments and foreign currency | | | (18,843,346 | ) | | 1,704,513 | |
| Net realized and unrealized gain on investments | | | 43,763,458 | | | 3,033,595 | |
| Net increase in net assets resulting from operations | | $ | 39,513,450 | | $ | 3,116,217 | |
| † Net of foreign taxes withheld of: | | $ | 98,632 | | $ | 15,373 | |
The accompanying notes are an integral part of these financial statements.
| KINETICS PORTFOLIOS TRUST — MASTER INVESTMENT PORTFOLIOS |
Statements of Operations — (Continued) |
| For the Six Months Ended June 30, 2015 (Unaudited) |
| | | | The Small Cap | | | The Market | |
| | | | Opportunities | | | Opportunities | |
| | | | Portfolio | | | Portfolio | |
| INVESTMENT INCOME: | | | | | | | |
| Dividends† | | $ | 797,163 | | $ | 181,251 | |
| Interest | | | 6,062 | | | 603 | |
| Income from securities lending | | | 413,292 | | | 14,173 | |
| Total investment income | | | 1,216,517 | | | 196,027 | |
| EXPENSES: | | | | | | | |
| Investment advisory fees | | | 2,099,667 | | | 327,369 | |
| Administration fees | | | 74,662 | | | 12,215 | |
| Professional fees | | | 13,642 | | | 5,435 | |
| Fund accounting fees | | | 27,301 | | | 6,245 | |
| Trustees’ fees | | | 13,408 | | | 2,086 | |
| Chief Compliance Officer fees | | | 2,256 | | | 352 | |
| Custodian fees and expenses | | | 18,893 | | | 8,736 | |
| Other expenses | | | 6,934 | | | 1,191 | |
| Total expenses | | | 2,256,763 | | | 363,629 | |
| Net investment loss | | | (1,040,246 | ) | | (167,602 | ) |
| REALIZED AND UNREALIZED GAIN (LOSS) ON INVESTMENTS: | | | | | | | |
| Net realized gain on: | | | | | | | |
| Investments and foreign currency | | | 16,646,473 | | | 2,540,479 | |
| Net change in unrealized appreciation (depreciation) of: | | | | | | | |
| Investments and foreign currency | | | 992,784 | | | (1,106,307 | ) |
| Net realized and unrealized gain on investments | | | 17,639,257 | | | 1,434,172 | |
| Net increase in net assets resulting from operations | | $ | 16,599,011 | | $ | 1,266,570 | |
| † Net of foreign taxes withheld of: | | $ | 18,727 | | $ | 11,658 | |
The accompanying notes are an integral part of these financial statements.
| KINETICS PORTFOLIOS TRUST — MASTER INVESTMENT PORTFOLIOS |
Statements of Operations — (Continued) |
| For the Six Months Ended June 30, 2015 (Unaudited) |
| | | | The | | | The Multi- | |
| | | | Alternative | | | Disciplinary | |
| | | | Income | | | Income | |
| | | | Portfolio | | | Portfolio | |
| INVESTMENT INCOME: | | | | | | | |
| Dividends† | | $ | 41,320 | | $ | 395,029 | |
| Interest | | | 123,009 | | | 2,788,976 | |
| Income from securities lending | | | — | | | 12,099 | |
| Total investment income | | | 164,329 | | | 3,196,104 | |
| EXPENSES: | | | | | | | |
| Investment advisory fees | | | 163,213 | | | 874,161 | |
| Administration fees | | | 12,921 | | | 33,281 | |
| Professional fees | | | 5,104 | | | 8,309 | |
| Fund accounting fees | | | 27,325 | | | 23,011 | |
| Trustees’ fees | | | 1,513 | | | 5,716 | |
| Chief Compliance Officer fees | | | 277 | | | 994 | |
| Custodian fees and expenses | | | 5,113 | | | 7,035 | |
| Other expenses | | | 560 | | | 2,095 | |
| Total expenses | | | 216,026 | | | 954,602 | |
| Net investment income (loss) | | | (51,697 | ) | | 2,241,502 | |
| REALIZED AND UNREALIZED GAIN (LOSS) ON INVESTMENTS: | | | | | | | |
| Net realized gain (loss) on: | | | | | | | |
| Investments and foreign currency | | | (2,965 | ) | | (671,495 | ) |
| Written option contracts expired or closed | | | 925,395 | | | 492,125 | |
| Net change in unrealized appreciation (depreciation) of: | | | | | | | |
| Investments and foreign currency | | | 78,720 | | | 466,215 | |
| Written option contracts | | | (62,190 | ) | | (129,051 | ) |
| Net realized and unrealized gain on investments | | | 938,960 | | | 157,794 | |
| Net increase in net assets resulting from operations | | $ | 887,263 | | $ | 2,399,296 | |
The accompanying notes are an integral part of these financial statements.
| KINETICS PORTFOLIOS TRUST — MASTER INVESTMENT PORTFOLIOS |
| Statements of Changes in Net Assets |
| | | | The Internet Portfolio | | The Global Portfolio | |
| | | | For the Six | | | For the | | | For the Six | | | For the | |
| | | | Months Ended | | | Year Ended | | | Months Ended | | | Year Ended | |
| | | | June 30, 2015 | | | December 31, | | | June 30, 2015 | | | December 31, | |
| | | | (Unaudited) | | | 2014 | | | (Unaudited) | | | 2014 | |
| OPERATIONS: | | | | | | | | | | | | | |
| Net investment loss | | $ | (706,385 | ) | $ | (1,481,267 | ) | $ | (31,520 | ) | $ | (56,057 | ) |
| Net realized gain on sale of investments and foreign currency | | | 8,569,225 | | | 10,596,602 | | | 247,593 | | | 318,326 | |
| Net change in unrealized appreciation (depreciation) of investments and foreign currency | | | (6,494,607 | ) | | (9,485,968 | ) | | 18,001 | | | (1,489,533 | ) |
| Net increase (decrease) in net assets resulting from operations | | | 1,368,233 | | | (370,633 | ) | | 234,074 | | | (1,227,264 | ) |
| NET INCREASE (DECREASE) IN NET ASSETS RESULTING FROM BENEFICIAL INTEREST TRANSACTIONS: | | | | | | | | | | | | | |
| Contributions | | | 48,008 | | | 4,258,113 | | | 380,474 | | | 1,321,420 | |
| Withdrawals | | | (13,655,172 | ) | | (25,200,462 | ) | | (745,379 | ) | | (3,431,883 | ) |
| Net (decrease) in net assets resulting from beneficial interest transactions | | | (13,607,164 | ) | | (20,942,349 | ) | | (364,905 | ) | | (2,110,463 | ) |
| Total decrease in net assets | | | (12,238,931 | ) | | (21,312,982 | ) | | (130,831 | ) | | (3,337,727 | ) |
| NET ASSETS: | | | | | | | | | | | | | |
| Beginning of period | | | 157,546,062 | | | 178,859,044 | | | 8,879,388 | | | 12,217,115 | |
| End of period | | $ | 145,307,131 | | $ | 157,546,062 | | $ | 8,748,557 | | $ | 8,879,388 | |
The accompanying notes are an integral part of these financial statements.
| KINETICS PORTFOLIOS TRUST — MASTER INVESTMENT PORTFOLIOS |
Statements of Changes in Net Assets — (Continued) |
| | | | The Paradigm Portfolio | | The Medical Portfolio | |
| | | | For the Six | | | For the | | | For the Six | | | For the | |
| | | | Months Ended | | | Year Ended | | | Months Ended | | | Year Ended | |
| | | | June 30, 2015 | | | December 31, | | | June 30, 2015 | | | December 31, | |
| | | | (Unaudited) | | | 2014 | | | (Unaudited) | | | 2014 | |
| OPERATIONS: | | | | | | | | | | | | | |
| Net investment income (loss) | | $ | (4,250,008 | ) | $ | (9,322,981 | ) | $ | 82,622 | | $ | 116,887 | |
| Net realized gain on sale of investments and foreign currency | | | 62,606,804 | | | 37,768,737 | | | 1,329,082 | | | 724,347 | |
| Net change in unrealized appreciation (depreciation) of investments and foreign currency | | | (18,843,346 | ) | | (31,751,718 | ) | | 1,704,513 | | | 3,052,140 | |
| Net increase (decrease) in net assets resulting from operations | | | 39,513,450 | | | (3,305,962 | ) | | 3,116,217 | | | 3,893,374 | |
| NET INCREASE (DECREASE) IN NET ASSETS RESULTING FROM BENEFICIAL INTEREST TRANSACTIONS: | | | | | | | | | | | | | |
| Contributions | | | 689,704 | | | 41,918,037 | | | 953,517 | | | 2,943,930 | |
| Withdrawals | | | (145,442,363 | ) | | (174,025,392 | ) | | (1,282,617 | ) | | (4,510,015 | ) |
| Net (decrease) in net assets resulting from beneficial interest transactions | | | (144,752,659 | ) | | (132,107,355 | ) | | (329,100 | ) | | (1,566,085 | ) |
| Total increase (decrease) in net assets | | | (105,239,209 | ) | | (135,413,317 | ) | | 2,787,117 | | | 2,327,289 | |
| NET ASSETS: | | | | | | | | | | | | | |
| Beginning of period | | | 1,192,330,280 | | | 1,327,743,597 | | | 27,116,627 | | | 24,789,338 | |
| End of period | | $ | 1,087,091,071 | | $ | 1,192,330,280 | | $ | 29,903,744 | | $ | 27,116,627 | |
The accompanying notes are an integral part of these financial statements.
| KINETICS PORTFOLIOS TRUST — MASTER INVESTMENT PORTFOLIOS |
Statements of Changes in Net Assets — (Continued) |
| | | The Small Cap Opportunities Portfolio | | The Market Opportunities Portfolio | |
| | | | For the Six | | | For the | | | For the Six | | | For the | |
| | | | Months Ended | | | Year Ended | | | Months Ended | | | Year Ended | |
| | | | June 30, 2015 | | | December 31, | | | June 30, 2015 | | | December 31, | |
| | | | (Unaudited) | | | 2014 | | | (Unaudited) | | | 2014 | |
| OPERATIONS: | | | | | | | | | | | | | |
| Net investment loss | | $ | (1,040,246 | ) | $ | (2,371,492 | ) | $ | (167,602 | ) | $ | (188,939 | ) |
| Net realized gain on sale of investments and foreign currency | | | 16,646,473 | | | 22,546,457 | | | 2,540,479 | | | 4,070,775 | |
| Net change in unrealized appreciation (depreciation) of investments and foreign currency | | | 992,784 | | | (47,310,333 | ) | | (1,106,307 | ) | | (7,187,539 | ) |
| Net increase (decrease) in net assets resulting from operations | | | 16,599,011 | | | (27,135,368 | ) | | 1,266,570 | | | (3,305,703 | ) |
| NET INCREASE (DECREASE) IN NET ASSETS RESULTING FROM BENEFICIAL INTEREST TRANSACTIONS: | | | | | | | | | | | | | |
| Contributions | | | 2,661,730 | | | 137,470,247 | | | 385,805 | | | 7,541,435 | |
| Withdrawals | | | (46,265,680 | ) | | (105,175,818 | ) | | (4,781,746 | ) | | (16,421,154 | ) |
| Net increase (decrease) in net assets resulting from beneficial interest transactions | | | (43,603,950 | ) | | 32,294,429 | | | (4,395,941 | ) | | (8,879,719 | ) |
| Total increase (decrease) in net assets | | | (27,004,939 | ) | | 5,159,061 | | | (3,129,371 | ) | | (12,185,422 | ) |
| NET ASSETS: | | | | | | | | | | | | | |
| Beginning of period | | | 353,157,296 | | | 347,998,235 | | | 54,375,891 | | | 66,561,313 | |
| End of period | | $ | 326,152,357 | | $ | 353,157,296 | | $ | 51,246,520 | | $ | 54,375,891 | |
The accompanying notes are an integral part of these financial statements.
| KINETICS PORTFOLIOS TRUST — MASTER INVESTMENT PORTFOLIOS |
Statements of Changes in Net Assets — (Continued) |
| | | The Alternative | | The Multi-Disciplinary | |
| | | | Income Portfolio | | Income Portfolio | |
| | | | For the Six | | | For the | | | For the Six | | | For the | |
| | | | Months Ended | | | Year Ended | | | Months Ended | | | Year Ended | |
| | | | June 30, 2015 | | | December 31, | | | June 30, 2015 | | | December 31, | |
| | | | (Unaudited) | | | 2013 | | | (Unaudited) | | | 2013 | |
| OPERATIONS: | | | | | | | | | | | | | |
| Net investment income (loss) | | $ | (51,697 | ) | $ | (125,267 | ) | $ | 2,241,502 | | $ | 3,503,350 | |
| Net realized gain (loss) on sale of investments, foreign currency and written options | | | 922,430 | | | 473,583 | | | (179,370 | ) | | 1,923,890 | |
| Net change in unrealized appreciation (depreciation) of investments | | | 16,530 | | | (109,204 | ) | | 337,164 | | | (3,230,822 | ) |
| Net increase in net assets resulting from operations | | | 887,263 | | | 239,112 | | | 2,399,296 | | | 2,196,418 | |
| NET INCREASE (DECREASE) IN NET ASSETS RESULTING FROM BENEFICIAL INTEREST TRANSACTIONS: | | | | | | | | | | | | | |
| Contributions | | | 2,087,007 | | | 21,281,441 | | | 9,873,452 | | | 67,848,185 | |
| Withdrawals | | | (6,239,140 | ) | | (6,843,392 | ) | | (5,234,089 | ) | | (24,821,261 | ) |
| Net increase (decrease) in net assets resulting from beneficial interest transactions | | | (4,152,133 | ) | | 14,438,049 | | | 4,639,363 | | | 43,026,924 | |
| Total increase (decrease) in net assets | | | (3,264,870 | ) | | 14,677,161 | | | 7,038,659 | | | 45,223,342 | |
| NET ASSETS: | | | | | | | | | | | | | |
| Beginning of period | | | 38,230,192 | | | 23,553,031 | | | 135,534,850 | | | 90,311,508 | |
| End of period | | $ | 34,965,322 | | $ | 38,230,192 | | $ | 142,573,509 | | $ | 135,534,850 | |
The accompanying notes are an integral part of these financial statements.
| KINETICS PORTFOLIOS TRUST — MASTER INVESTMENT PORTFOLIOS |
| Notes to Financial Statements |
| June 30, 2015 (Unaudited) |
1. Organization
The Kinetics Portfolios Trust (the “Trust”) was organized as a Delaware Statutory Trust on March 14, 2000 and is registered under the Investment Company Act of 1940, as amended (the “1940 Act”), as an open-end management investment company issuing its beneficial interests in series, each series representing a distinct portfolio with its own investment objective and policies. The series currently authorized are: The Internet Portfolio, The Global Portfolio, The Paradigm Portfolio, The Medical Portfolio, The Small Cap Opportunities Portfolio, The Market Opportunities Portfolio, The Alternative Income Portfolio and The Multi-Disciplinary Income Portfolio (collectively, the “Master Portfolios”). Pursuant to the 1940 Act, the Master Portfolios, are “non-diversified” series of the Trust, except The Global Portfolio and The Multi-Disciplinary Income Portfolio. The Market Opportunities Portfolio commenced operations on January 31, 2006, The Alternative Income Portfolio commenced operations on June 29, 2007 and The Multi-Disciplinary Income Portfolio commenced operations on February 11, 2008. Each of the remaining Master Portfolios commenced operations on April 28, 2000.
Each Master Portfolio is a Master Investment Portfolio in a master-feeder fund structure. Each Master Portfolio has multiple feeder funds invested in the Master Portfolio. By contributing assets to the Master Portfolio, the feeder funds receive a beneficial interest in the Master Portfolio. The Master Portfolio then invests the contributed assets in portfolio securities and allocates income, gains (losses) and expenses to the feeder funds based on the feeder funds’ proportionate interests in the Master Portfolio.
Each of the Master Portfolios, except for The Alternative Income Portfolio and The Multi-Disciplinary Income Portfolio, seeks to provide investors with long-term capital growth. The Alternative Income Portfolio seeks to provide current income and gains. The Multi-Disciplinary Income Portfolio seeks to provide investors with total return. The Internet Portfolio invests primarily in the equity securities of U.S. and foreign companies engaged in the Internet and Internet-related activities. The Global Portfolio generally invests in the equity securities of foreign companies that have the ability to facilitate an increase in the growth of their traditional business lines and in U.S. companies benefiting from international economic growth. The Paradigm Portfolio invests primarily in the equity securities of U.S. and foreign companies that the investment adviser believes are undervalued and that have high returns on equity and are well positioned to reduce their costs, extend the reach of their distribution channels
| KINETICS PORTFOLIOS TRUST — MASTER INVESTMENT PORTFOLIOS |
Notes to Financial Statements — (Continued) |
| June 30, 2015 (Unaudited) |
and experience significant growth in their assets or revenues. The Medical Portfolio invests primarily in the equity securities of U.S. and foreign companies engaged in medical research, pharmaceutical treatments and related medical technology industries and related technology industries, generally, with a focus on companies engaged in cancer research and drug development. The Small Cap Opportunities Portfolio invests primarily in the equity securities of U.S. and foreign small capitalized companies that provide attractive valuation opportunities due to special situations such as lack of institutional ownership, lack of significant analyst coverage or companies with sound fundamentals that have experienced a short-term earnings shortfall. The Market Opportunities Portfolio invests primarily in the equity securities of U.S. and foreign companies engaged in capital markets or related to capital markets, as well as companies involved in the gaming industry. The Alternative Income and Multi-Disciplinary Income Portfolios utilizes a two-part investment strategy, which includes fixed income and derivatives components.
2. Significant Accounting Policies
Security Valuation
Master Portfolio securities that are listed on a U.S. securities exchange for which market quotations are readily available are valued at the last quoted sale price on the day the valuation is made. Price information on listed securities is taken from the exchange where the security is primarily traded. All equity securities that are traded using the National Association of Securities Dealers’ Automated Quotation System (“NASDAQ”) are valued using the NASDAQ Official Closing Price (“NOCP”). Foreign securities are valued by an independent pricing service. In the event market quotations are not readily available or if events occur that may materially affect the value of a particular security between the time trading ends on a particular security and the close of regular trading on the New York Stock Exchange (“NYSE”), “fair value” will be determined. Unlisted U.S. securities and listed U.S. securities not traded on the valuation date for which market quotations are readily available are valued at the last bid price. Exchange traded options are valued at the composite price, using the National Best Bid and Offer quotes (“NBBO”). NBBO consists of the highest bid price and lowest ask price across any of the exchanges on which an option is quoted thus providing a view across the entire U.S. options marketplace. Composite option pricing calculates the mean of the highest bid price and the lowest asked price across the exchanges where the option is traded. If the composite option price is not available, the mean between the
| KINETICS PORTFOLIOS TRUST — MASTER INVESTMENT PORTFOLIOS |
Notes to Financial Statements — (Continued) |
| June 30, 2015 (Unaudited) |
highest bid and the lowest asked quotations at the close of the exchanges will be used. If none of the above are available, exchange traded options are valued at the last quoted sales price. Non-exchange traded options for which over-the-counter quotations are not readily available are valued at the mean of the current bid and asked prices. Debt obligations (including convertible securities) that are either investment grade or non-investment grade and irrespective of days to maturity will be valued as follows: Debt securities are valued at evaluated mean by one of the authorized third party pricing agents which rely on various valuation methodologies such as matrix pricing and other analytical pricing models as well as market transactions and dealer quotations. Investments in registered open-end investment companies other than exchange-traded funds are valued at their reported net asset value (“NAV”). Certain instruments such as repurchase agreements and demand notes, are traded at cost and there are no market values available for those instruments from third parties. Those instruments are priced at cost.
Other assets and securities for which no quotations are readily available (including restricted securities) will be valued in good faith at fair value using methods determined by the Board of Trustees of the Master Portfolios. In determining the fair value of a security, the Board of Trustees shall take into account the relevant factors and surrounding circumstances, which may include: (i) the nature and pricing history (if any) of the security; (ii) whether any dealer quotations for the security are available; (iii) possible valuation methodologies that could be used to determine the fair value of the security; (iv) the recommendation of the portfolio manager of the Portfolios with respect to the valuation of the security; (v) whether the same or similar securities are held by other funds managed by the Adviser or other funds and the method used to price the security in those funds; (vi) the extent to which the fair value to be determined for the security will result from the use of data or formula produced by third parties independent of the Adviser; (vii) the liquidity or illiquidity of the market for the security; and (viii) the value of a foreign security traded on other foreign markets. At June 30, 2015, 0.00%, 0.00% and 0.00% of the net assets of The Internet Portfolio, The Paradigm Portfolio and The Market Opportunities Portfolio, respectively, were fair valued securities. The other Master Portfolios did not hold any fair valued securities at June 30, 2015.
| KINETICS PORTFOLIOS TRUST — MASTER INVESTMENT PORTFOLIOS |
Notes to Financial Statements — (Continued) |
| June 30, 2015 (Unaudited) |
Repurchase Agreements
Each Master Portfolio may enter into repurchase agreements with banks that are members of the Federal Reserve System or securities dealers who are members of a national securities exchange or are primary dealers in U.S. Government Securities. In connection with transactions in repurchase agreements, it is the Trust’s policy that the Master Portfolio receive, as collateral, securities whose market value, including accrued interest, at all times will be at least equal to 102% of the amount invested by the Master Portfolio in each repurchase agreement. If the seller defaults, and the value of the collateral declines, realization of the collateral by the Master Portfolio may be delayed or limited.
Written Options
The Master Portfolios may write (sell) call or put options for trading or hedging purposes. When a Master Portfolio writes an option, an amount equal to the premium received by the Master Portfolio is included in the Statement of Assets and Liabilities as an asset and an equivalent liability. The amount of the liability is subsequently marked-to-market to reflect the current value of the option written. By writing the option, the Master Portfolio may become obligated during the term of the option to deliver or purchase the securities underlying the option at the exercise price if the option is exercised. When an option expires on its stipulated expiration date or the Master Portfolio enters into a closing purchase transaction, the Master Portfolio realizes a gain or loss if the cost of the closing transaction differs from the premium received when the option was sold, without regard to any unrealized gain or loss on the underlying security, and the liability related to such option is eliminated. When an option is exercised, the premium originally received decreases the cost basis of the underlying security (or increases the proceeds on the security sold short) and the Master Portfolio realizes a gain or loss from the sale of the security (or closing of the short sale). As collateral for uncovered written options, the Master Portfolio is required under the 1940 Act to maintain assets consisting of cash, cash equivalents or liquid securities. This collateral is required to be adjusted daily to reflect the exercise price of the purchase obligation for put options or the market value of the instrument underlying the contract for call options.
Foreign Currency Translations
The books and records of the Master Portfolios are maintained in U.S. dollars. For the Master Portfolios, foreign currency transactions are translated into U.S. dollars on the following basis: (i) market values of investment securities and other assets and liabilities are translated at the exchange rate of such currencies
| KINETICS PORTFOLIOS TRUST — MASTER INVESTMENT PORTFOLIOS |
Notes to Financial Statements — (Continued) |
| June 30, 2015 (Unaudited) |
against the U.S. dollar, as provided by an approved pricing service, and (ii) purchases and sales of investment securities, dividend and interest income and certain expenses at the rates of exchange prevailing on the respective dates of such transactions. The Master Portfolios do not isolate and treat as ordinary income that portion of the results of operations arising as a result of changes in the exchange rate from the fluctuations arising from changes in the market prices of securities held during the period. Such fluctuations are included with the net realized and unrealized gain or loss from investments. However, for federal income tax purposes, the Master Portfolios do isolate and treat as ordinary income the effect of changes in foreign exchange rates arising from actual foreign currency transactions and the effect of changes in foreign exchange rates arising between trade date and settlement date.
Restricted and Illiquid Securities
The Master Portfolios may invest in restricted securities. These securities are valued by the Master Portfolios after giving due consideration to pertinent factors including recent private sales, market conditions and the issuer’s financial performance. The Master Portfolios have no right to require registration of unregistered securities. At June 30, 2015 the following Master Portfolios held securities restricted to institutional investors (144A Securities):
| | | | | | | | | | Percentage of |
| | | | | | | Market Value | | | Net Assets |
| The Alternative Income Portfolio | | | | | $ | 653,891 | | | 1.87 | % |
| The Multi-Disciplinary Income Portfolio | | | | | | 28,025,286 | | | 19.66 | % |
An illiquid asset is any asset which may not be sold or disposed of in the ordinary course of business within seven days at approximately the value at which the Master Portfolio has valued the investment. At June 30, 2015, the following Master Portfolios held illiquid securities:
| | | | | Percentage of |
| | | Market Value | | Net Assets |
| The Internet Portfolio | | $ | — | * | | 0.00 | % |
| The Paradigm Portfolio | | | — | * | | 0.00 | % |
| The Market Opportunities Portfolio | | | — | * | | 0.00 | % |
| The Multi-Disciplinary Income Portfolio | | | 332,500 | | | 0.23 | % |
| | |
| * Amount is less than $0.50. |
| KINETICS PORTFOLIOS TRUST — MASTER INVESTMENT PORTFOLIOS |
Notes to Financial Statements — (Continued) |
| June 30, 2015 (Unaudited) |
When-Issued Securities
The Master Portfolios may purchase securities on a when-issued or delayed delivery basis. Although the purchase amounts of these securities are established at the time the purchaser enters into the agreement, these securities may be delivered and paid for at a future date. The Master Portfolios record purchases of when-issued securities and reflect the values of such securities in determining net asset value in the same manner as other portfolio securities. The Master Portfolios maintain at all times cash or other liquid assets in an amount at least equal to the amount of outstanding commitments for when-issued securities.
Securities Lending
Each Master Portfolio may lend its portfolio securities to broker-dealers by entering directly into lending arrangements with such broker dealers or indirectly through repurchase agreements with respect to no more than 33 1/3% of the total assets of each Master Portfolio (including any collateral posted) or 50% of the total assets of each Master Portfolio (excluding any collateral posted). Securities lending and repurchase transactions will be fully collateralized at all times with cash and/or short-term debt obligations. The Master Portfolios receive interest on the collateral received as well as a fee for the securities loaned.
Short-Term Investments
The Portfolios may invest in money market funds and short-term high quality debt securities such as commercial paper, repurchase agreements and certificates of deposit. Money market funds typically invest in short-term instruments and attempt to maintain a stable net asset value. While the risk is low, these funds may lose value. At June 30, 2015, The Internet Portfolio, The Global Portfolio, The Paradigm Portfolio, The Medical Portfolio, The Small Cap Opportunities Portfolio, The Market Opportunities Portfolio, and The Multi-Disciplinary Income Portfolio invested approximately 4%, 5%, 7%, 11%, 14%, 5%, and 3%, respectively, of net assets in the Mount Vernon Securities Lending Trust-Prime Portfolio which normally invests in short-term instruments with an objective of maximizing current income to the extent consistent with the preservation of capital and liquidity. Mount Vernon Securities Lending Trust-Prime Portfolio’s financial statements are available on the SEC website www.sec.gov.
| KINETICS PORTFOLIOS TRUST — MASTER INVESTMENT PORTFOLIOS |
Notes to Financial Statements — (Continued) |
| June 30, 2015 (Unaudited) |
Expense Allocation
Common expenses incurred by the Master Portfolios are allocated among the Master Portfolios (i) based upon relative average net assets, (ii) as incurred on a specific identification basis, or (iii) equally among the Master Portfolios, depending on the nature of the expenditure. All expenses incurred by the Master Portfolios are allocated to the feeder funds daily based on their proportionate interests in the respective Master Portfolios.
Federal Income Taxes
Each Master Portfolio will be treated as a partnership for federal income tax purposes. As such, each investor in a Master Portfolio will be subject to taxation on its share of the Master Portfolio’s ordinary income and capital gains. It is intended that each Master Portfolio’s assets will be managed so an investor in the Master Portfolio can satisfy the requirements of subchapter M of the Internal Revenue Code.
There is no tax liability resulting from unrecognized tax benefits relating to uncertain income tax positions taken or expected to be taken in future tax returns. As of June 30, 2015, open tax years include the tax years ended December 31, 2011 through 2014. The Master Portfolios are also not aware of any tax positions for which it is reasonably possible that the total amounts of unrecognized tax benefits will significantly change in the next six months.
Use of Estimates
The preparation of financial statements in conformity with U.S. generally accepted accounting principles (“GAAP”) requires management to make estimates and assumptions that affect the reported amounts in the financial statements. Actual results could differ from those estimates.
Other
Realized gains and losses on the sale of investments are calculated on the identified cost basis. Dividend income is recorded on the ex-dividend date. Interest income is accounted for on the accrual basis and includes amortization of premiums and discounts on the interest method. Other noncash dividends are recognized as investment income at the fair value of the property received. Withholding taxes on foreign dividends have been provided for in accordance with the Trust’s understanding of the applicable country’s tax rules and rates.
| KINETICS PORTFOLIOS TRUST — MASTER INVESTMENT PORTFOLIOS |
Notes to Financial Statements — (Continued) |
| June 30, 2015 (Unaudited) |
3. Investment Adviser
The Trust has entered into Investment Advisory Agreements (the “Agreements”) with Kinetics Asset Management LLC (the “Adviser”), with whom certain officers and trustees of the Trust are affiliated, to furnish investment advisory services to the Master Portfolios. The Adviser is a wholly-owned subsidiary of Horizon Kinetics LLC. Under the terms of the Agreements, the Master Portfolios, except the Alternative Income Portfolio, compensate the Adviser for its management services at the annual rate of 1.25% of each Master Portfolio’s average daily net assets. The Alternative Income Portfolio compensates the Adviser for its management services at the annual rate of 0.90% of the Master Portfolio’s average daily net assets.
For the six months ended June 30, 2015, The Internet Portfolio, The Global Portfolio, The Paradigm Portfolio, The Medical Portfolio, The Small Cap Opportunities Portfolio, The Market Opportunities Portfolio, The Alternative Income Portfolio and The Multi-Disciplinary Income Portfolio incurred expenses of $943,181, $55,561, $7,126,154, $182,134, $2,099,667, $327,369, $163,213 and $874,161, respectively, pursuant to the Agreements.
For the six months ended June 30, 2015, the Trust was allocated $13,000 for the services of the Chief Compliance Officer employed by the Adviser.
4. Approval of Investment Advisory Contracts by Trustees of Kinetics Portfolios Trust
At a meeting of the Board of Trustees of the Trust held on March 27, 2015, the Board, including all of the Trustees who are not interested persons under the 1940 Act (the “Independent Trustees”), approved the Agreements with respect to each Master Portfolio. In reaching a decision to renew the Advisory Agreements, the Board of Trustees, including all of the Independent Trustees, considered, among others (1) the nature, extent, and quality of the services to be provided by the Adviser, including, but not limited to, a review of the complexity of the services provided, whether the services are provided in a satisfactory and efficient manner; (2) the experience and qualifications of the personnel providing such services; (3) the investment performance of the Trust and the Adviser as compared with industry competitors; (4) an evaluation of the fee structure, any fee waivers, and the Trust’s expense ratios, and a comparison of them in relation to those of other investment companies having comparable investment policies and limitations; (5) possible alternative fee structures or bases for determining fees; (6) the extent to which economies of scale would be
| KINETICS PORTFOLIOS TRUST — MASTER INVESTMENT PORTFOLIOS |
Notes to Financial Statements — (Continued) |
| June 30, 2015 (Unaudited) |
realized as the Trust grows and whether fee levels reflect these economies of scale for the benefit of the Trust’s investors; (7) the direct and indirect costs of the services to be provided (and the basis of determining and allocating these costs) and profits to be realized by the Adviser and its affiliates from their relationship with the Trust; (8) other compensation or possible benefits to the Adviser and its affiliates arising from their advisory and other relationships with the Trust, including, if applicable, any benefits derived or to be derived by the Adviser from its relationship with the Trust such as soft dollar arrangements by which brokers provide research to the Trust or the Adviser in return for allocating the Trust’s brokerage; (9) the entrepreneurial risks borne by the Adviser, if any (e.g., because a fund is in a start-up mode or for other reasons, its revenues may be less or its expenses greater than anticipated); and (10) a comparison of the fees charged by the Adviser with fees charged by the Adviser to similar clients; The Lipper peer group information was provided by U.S. Bancorp Fund Services, LLC, the Trust’s administrator. The Independent Trustees also discussed the continuing viability of the Master Portfolios.
The Board of Trustees, including a majority of the Independent Trustees, concluded that: they were satisfied with the quality of services provided by the Adviser in advising the Master Portfolios, the profits earned by the Adviser were reasonable in light of the nature, extent and quality of the services provided to each Master Portfolio; and that each Master Portfolio was not large enough to attain significant economies of scale. Based on the factors considered, the Board of Trustees, including a majority of the Independent Trustees, concluded that it was appropriate to renew the Agreements.
5. Securities Transactions
Purchases and sales of investment securities, other than short-term investments, for the six months ended June 30, 2015 were as follows:
| | | Purchases | | Sales | |
| | | | U.S. | | | | | | U.S. | | | | |
| | | | Government | | | Other | | | Government | | | Other | |
| The Internet Portfolio | | $ | — | | $ | 690,156 | | $ | — | | $ | 14,194,024 | |
| The Global Portfolio | | | — | | | 346,822 | | | — | | | 686,154 | |
| The Paradigm Portfolio | | | — | | | 12,400,014 | | | — | | | 141,689,945 | |
| The Medical Portfolio | | | — | | | 2,340,886 | | | — | | | 1,938,000 | |
| The Small Cap Opportunities Portfolio | | | — | | | 4,163,589 | | | — | | | 45,024,070 | |
| The Market Opportunities Portfolio | | | — | | | 604,277 | | | — | | | 5,822,371 | |
| The Alternative Income Portfolio | | | 499,219 | | | 393,314 | | | — | | | 2,913,449 | |
| The Multi-Disciplinary Income Portfolio | | | — | | | 8,339,842 | | | — | | | 3,035,468 | |
| KINETICS PORTFOLIOS TRUST — MASTER INVESTMENT PORTFOLIOS |
Notes to Financial Statements — (Continued) |
| June 30, 2015 (Unaudited) |
As of December 31, 2014, the cost of investments and unrealized appreciation (depreciation) on investment securities for federal income tax purposes was as follows:
| | | The | | | The | | | The | | | The | |
| | | Internet | | | Global | | | Paradigm | | | Medical | |
| | | Portfolio | | | Portfolio | | | Portfolio | | | Portfolio | |
| Tax cost of investments | | $ | 80,772,154 | | | $ | 8,022,574 | | | $ | 882,649,455 | | | $ | 19,583,297 | |
| Unrealized Appreciation | | | 81,985,567 | | | | 2,261,245 | | | | 477,423,655 | | | | 12,423,761 | |
| Unrealized Depreciation | | | (568,128 | ) | | | (956,775 | ) | | | (83,152,865 | ) | | | (1,922,627 | ) |
| Net unrealized appreciation (depreciation) | | $ | 81,417,439 | | | $ | 1,304,470 | | | $ | 394,270,790 | | | $ | 10,501,134 | |
| | | | | | | | | | | | | | | | | |
| | | | | | | | | | | | | | | The | |
| | | | | | | The | | | The | | | Multi- | |
| | | The | | | Market | | | Alternative | | | Disciplinary | |
| | | Small Cap | | | Opportunities | | | Income | | | Income | |
| | | Portfolio | | | Portfolio | | | Portfolio | | | Portfolio | |
| Tax cost of investments | | $ | 356,139,953 | | | $ | 44,192,156 | | | $ | 38,610,756 | | | $ | 139,260,571 | |
| Unrealized Appreciation | | | 75,314,796 | | | | 16,693,253 | | | | 264,579 | | | | 2,480,685 | |
| Unrealized Depreciation | | | (41,943,876 | ) | | | (4,395,637 | ) | | | (357,911 | ) | | | (6,271,594 | ) |
| Net unrealized appreciation (depreciation) | | $ | 33,370,920 | | | $ | 12,297,616 | | | $ | (93,332 | ) | | $ | (3,790,909 | ) |
For the six months ended June 30, 2015, the Master Portfolios wrote the following options:
| | | Number | | | Premium | |
| | | of Contracts | | | Amount | |
| The Alternative Income Portfolio | | | | | | |
| Outstanding at the Beginning of the Year | | | 8,473 | | | $ | 2,087,842 | |
| Options Written | | | 463 | | | | 583,006 | |
| Options Exercised | | | (1 | ) | | | (1,379 | ) |
| Options Expired | | | (762 | ) | | | (92,454 | ) |
| Options Closed | | | (3,865 | ) | | | (1,307,674 | ) |
| Outstanding at June 30, 2015 | | | 4,308 | | | $ | 1,269,341 | |
| | | | | | | | | |
| The Multi-Disciplinary Income Portfolio | | | | | | | | |
| Outstanding at the Beginning of the Year | | | 10,772 | | | $ | 3,234,528 | |
| Options Written | | | 288 | | | | 39,016 | |
| Options Exercised | | | (166 | ) | | | (28,514 | ) |
| Options Expired | | | (2,459 | ) | | | (604,634 | ) |
| Options Closed | | | (698 | ) | | | (159,311 | ) |
| Outstanding at June 30, 2015 | | | 7,737 | | | $ | 2,481,085 | |
| KINETICS PORTFOLIOS TRUST — MASTER INVESTMENT PORTFOLIOS |
Notes to Financial Statements — (Continued) |
| June 30, 2015 (Unaudited) |
6. Portfolio Securities Loaned
As of June 30, 2015, the Master Portfolios had loaned securities that were collateralized by cash. The cash collateral is invested by the custodian in a money market pooled account approved by the Adviser. Although risk is mitigated by the collateral, a Master Portfolio could experience a delay in recovering its securities and possible loss of income or value if the borrower fails to return them. The Master Portfolio receives interest on the collateral received as well as a fee for the securities loaned. The Master Portfolios will continue to receive dividends and interest on all securities loaned. Gain or loss in the fair value of the securities loaned that may occur during the term of the loan will be accounted for by the Master Portfolios. The value of the securities on loan and the value of the related collateral at June 30, 2015, were as follows:
| | | Securities | | | Collateral | |
| The Internet Portfolio | | $ | 5,086,658 | | | $ | 5,262,475 | |
| The Global Portfolio | | | 436,732 | | | | 463,370 | |
| The Paradigm Portfolio | | | 76,631,535 | | | | 80,187,483 | |
| The Medical Portfolio | | | 3,077,519 | | | | 3,148,825 | |
| The Small Cap Opportunities Portfolio | | | 42,780,293 | | | | 44,329,175 | |
| The Market Opportunities Portfolio | | | 2,360,131 | | | | 2,451,116 | |
| The Alternative Income Portfolio | | | — | | | | — | |
| The Multi-Disciplinary Income Portfolio | | | 4,285,844 | | | | 4,404,520 | |
7. Selected Financial Highlights
Financial highlights for the Master Portfolios were as follows:
| | | The Internet Portfolio |
| | | For the Six | | | For the Year | | | For the Year | | | For the Year | | | For the Year | | | For the Year | |
| | | Months Ended | | | Ended | | | Ended | | | Ended | | | Ended | | | Ended | |
| | | June 30, 2015 | | | December 31, | | | December 31, | | | December 31, | | | December 31, | | | December 31, | |
| | | (Unaudited) | | | 2014 | | | 2013 | | | 2012 | | | 2011 | | | 2010 | |
| Total Return* | | | 1.08 | %(2) | | 0.28 | % | | 44.75 | % | | 23.76 | % | | (1.47 | )% | | 21.70 | % |
| Ratio of expenses to average net assets: | | | 1.35 | %(1) | | 1.34 | % | | 1.37 | % | | 1.37 | % | | 1.38 | % | | 1.37 | % |
| Ratio of net investment income (loss) to average net assets: | | | (0.94 | )%(1) | | (0.90 | )% | | (0.84 | )% | | 0.16 | % | | (0.43 | )% | | (0.33 | )% |
| Portfolio turnover rate | | | 0 | % | | 1 | % | | 8 | % | | 9 | % | | 32 | % | | 12 | % |
| KINETICS PORTFOLIOS TRUST — MASTER INVESTMENT PORTFOLIOS |
Notes to Financial Statements — (Continued) |
| June 30, 2015 (Unaudited) |
| | | The Global Portfolio |
| | | | For the Six | | | For the Year | | | For the Year | | | For the Year | | | For the Year | | | For the Year | |
| | | | Months Ended | | | Ended | | | Ended | | | Ended | | | Ended | | | Ended | |
| | | | June 30, 2015 | | | December 31, | | | December 31, | | | December 31, | | | December 31, | | | December 31, | |
| | | | (Unaudited) | | | 2014 | | | 2013 | | | 2012 | | | 2011 | | | 2010 | |
| Total Return* | | | 2.56 | %(2) | | (12.10 | )% | | 28.25 | % | | 22.78 | % | | (16.25 | )% | | 19.26 | % |
| Ratio of expenses to average net assets: | | | 1.64 | %(1) | | 1.60 | % | | 1.73 | % | | 1.77 | % | | 2.23 | % | | 2.43 | % |
| Ratio of net investment income (loss) to average net assets: | | | (0.71 | )%(1) | | (0.52 | )% | | (0.12 | )% | | 0.40 | % | | 0.61 | % | | (0.51 | )% |
| Portfolio turnover rate | | | 4 | % | | 14 | % | | 15 | % | | 23 | % | | 135 | % | | 122 | % |
| | | | | | | | | | | | | | | | | | | | |
| | | The Paradigm Portfolio |
| | | | For the Six | | | For the Year | | | For the Year | | | For the Year | | | For the Year | | | For the Year | |
| | | | Months Ended | | | Ended | | | Ended | | | Ended | | | Ended | | | Ended | |
| | | | June 30, 2015 | | | December 31, | | | December 31, | | | December 31, | | | December 31, | | | December 31, | |
| | | | (Unaudited) | | | 2014 | | | 2013 | | | 2012 | | | 2011 | | | 2010 | |
| Total Return* | | | 3.52 | %(2) | | (0.48 | )% | | 44.36 | % | | 22.06 | % | | (14.00 | )% | | 17.65 | % |
| Ratio of expenses to average net assets: | | | 1.35 | %(1) | | 1.33 | % | | 1.35 | % | | 1.36 | % | | 1.37 | % | | 1.36 | % |
| Ratio of net investment income (loss) to average net assets: | | | (0.75 | )%(1) | | (0.72 | )% | | (0.23 | )% | | 0.50 | % | | 0.37 | % | | 0.83 | % |
| Portfolio turnover rate | | | 1 | % | | 7 | % | | 4 | % | | 6 | % | | 58 | % | | 7 | % |
| | | | | | | | | | | | | | | | | | | | |
| | | The Medical Portfolio |
| | | | For the Six | | | For the Year | | | For the Year | | | For the Year | | | For the Year | | | For the Year | |
| | | | Months Ended | | | Ended | | | Ended | | | Ended | | | Ended | | | Ended | |
| | | | June 30, 2015 | | | December 31, | | | December 31, | | | December 31, | | | December 31, | | | December 31, | |
| | | | (Unaudited) | | | 2014 | | | 2013 | | | 2012 | | | 2011 | | | 2010 | |
| Total Return* | | | 11.53 | %(2) | | 16.42 | % | | 49.23 | % | | 8.81 | % | | 5.10 | % | | 4.30 | % |
| Ratio of expenses to average net assets: | | | 1.40 | %(1) | | 1.41 | % | | 1.41 | % | | 1.44 | % | | 1.40 | % | | 1.39 | % |
| Ratio of net investment income (loss) to average net assets: | | | 0.57 | %(1) | | 0.44 | % | | (0.02 | )% | | 1.62 | % | | 0.86 | % | | 0.55 | % |
| Portfolio turnover rate | | | 7 | % | | 3 | % | | 12 | % | | 0 | % | | 5 | % | | 3 | % |
| KINETICS PORTFOLIOS TRUST — MASTER INVESTMENT PORTFOLIOS |
Notes to Financial Statements — (Continued) |
| June 30, 2015 (Unaudited) |
| | | The Small Cap Opportunities Portfolio |
| | | | For the Six | | | For the Year | | | For the Year | | | For the Year | | | For the Year | | | For the Year | |
| | | | Months Ended | | | Ended | | | Ended | | | Ended | | | Ended | | | Ended | |
| | | | June 30, 2015 | | | December 31, | | | December 31, | | | December 31, | | | December 31, | | | December 31, | |
| | | | (Unaudited) | | | 2014 | | | 2013 | | | 2012 | | | 2011 | | | 2010 | |
| Total Return* | | | 5.19 | %(2) | | (6.98 | )% | | 59.69 | % | | 26.94 | % | | (13.44 | )% | | 14.08 | % |
| Ratio of expenses to average net assets: | | | 1.34 | %(1) | | 1.34 | % | | 1.35 | % | | 1.44 | % | | 1.43 | % | | 1.42 | % |
| Ratio of net investment income (loss) to average net assets: | | | (0.62 | )%(1) | | (0.59 | )% | | 0.01 | % | | 0.27 | % | | 0.03 | % | | 0.02 | % |
| Portfolio turnover rate | | | 1 | % | | 19 | % | | 6 | % | | 22 | % | | 47 | % | | 4 | % |
| | | | | | | | | | | | | | | | | | | | |
| | | The Market Opportunities Portfolio |
| | | | For the Six | | | For the Year | | | For the Year | | | For the Year | | | For the Year | | | For the Year | |
| | | | Months Ended | | | Ended | | | Ended | | | Ended | | | Ended | | | Ended | |
| | | | June 30, 2015 | | | December 31, | | | December 31, | | | December 31, | | | December 31, | | | December 31, | |
| | | | (Unaudited) | | | 2014 | | | 2013 | | | 2012 | | | 2011 | | | 2010 | |
| Total Return* | | | 2.59 | %(2) | | (5.30 | )% | | 46.98 | % | | 17.73 | % | | (7.63 | )% | | 11.53 | % |
| Ratio of expenses to average net assets: | | | 1.39 | %(1) | | 1.39 | % | | 1.40 | % | | 1.43 | % | | 1.42 | % | | 1.42 | % |
| Ratio of net investment income (loss) to average net assets: | | | (0.64 | )%(1) | | (0.30 | )% | | 0.27 | % | | 0.44 | % | | 0.30 | % | | 0.56 | % |
| Portfolio turnover rate | | | 1 | % | | 18 | % | | 21 | % | | 26 | % | | 14 | % | | 12 | % |
| | | | | | | | | | | | | | | | | | | | |
| | | The Alternative Income Portfolio |
| | | | For the Six | | | For the Year | | | For the Year | | | For the Year | | | For the Year | | | For the Year | |
| | | | Months Ended | | | Ended | | | Ended | | | Ended | | | Ended | | | Ended | |
| | | | June 30, 2015 | | | December 31, | | | December 31, | | | December 31, | | | December 31, | | | December 31, | |
| | | | (Unaudited) | | | 2014 | | | 2013 | | | 2012 | | | 2011 | | | 2010 | |
| Total Return* | | | 2.34 | %(2) | | 1.23 | % | | 4.92 | % | | 10.05 | % | | (4.66 | )% | | (4.43 | )% |
| Ratio of expenses to average net assets: | | | 1.19 | %(1) | | 1.22 | % | | 1.25 | % | | 1.49 | % | | 1.42 | % | | 1.47 | % |
| Ratio of net investment income (loss) to average net assets: | | | (0.29 | )%(1) | | (0.40 | )% | | (0.54 | )% | | 1.99 | % | | 1.47 | % | | 1.04 | % |
| Portfolio turnover rate | | | 3 | % | | 17 | % | | 19 | % | | 56 | % | | 69 | % | | 111 | % |
| KINETICS PORTFOLIOS TRUST — MASTER INVESTMENT PORTFOLIOS |
Notes to Financial Statements — (Continued) |
| June 30, 2015 (Unaudited) |
| | | The Multi-Disciplinary Income Portfolio |
| | | | For the Six | | | For the Year | | | For the Year | | | For the Year | | | For the Year | | | For the Year | |
| | | | Months Ended | | | Ended | | | Ended | | | Ended | | | Ended | | | Ended | |
| | | | June 30, 2015 | | | December 31, | | | December 31, | | | December 31, | | | December 31, | | | December 31, | |
| | | | (Unaudited) | | | 2014 | | | 2013 | | | 2012 | | | 2011 | | | 2010 | |
| Total Return* | | | 1.76 | %(2) | | 2.58 | % | | 4.39 | % | | 15.42 | % | | 0.19 | % | | 12.12 | % |
| Ratio of expenses to average net assets: | | | 1.37 | %(1) | | 1.37 | % | | 1.39 | % | | 1.45 | % | | 1.54 | % | | 2.41 | % |
| Ratio of net investment income (loss) to average net assets: | | | 3.21 | %(1) | | 3.06 | % | | 1.87 | % | | 3.23 | % | | 8.00 | % | | 2.58 | % |
| Portfolio turnover rate | | | 2 | % | | 35 | % | | 54 | % | | 41 | % | | 74 | % | | 38 | % |
| | | |
| * | The returns are calculated by adjusting the corresponding No-Load Feeder returns by Feeder expenses and reimbursements. |
| (1) | Annualized |
| (2) | Not annualized. |
8. Summary of Fair Value Exposure
Various inputs are used in determining the value of a Master Portfolio’s investments. These inputs are summarized in the three broad levels listed below:
Level 1 — Unadjusted quoted prices in active markets for identical assets or liabilities that a Master Portfolio has the ability to access.
Level 2 — Observable inputs other than quoted prices included in Level 1 that are observable for the asset or liability, either directly or indirectly. These inputs may include quoted prices for the identical instrument on an inactive market, prices for similar instruments, interest rates, prepayment speeds, credit risk, yield curves, default rates and similar data.
Level 3 — Unobservable inputs for the asset or liability, to the extent relevant observable inputs are not available, representing a Master Portfolio’s own assumptions about the assumptions a market participant would use in valuing the asset or liability, and would be based on the best information available.
| KINETICS PORTFOLIOS TRUST — MASTER INVESTMENT PORTFOLIOS |
Notes to Financial Statements — (Continued) |
| June 30, 2015 (Unaudited) |
The availability of observable inputs can vary from security to security and is affected by a wide variety of factors, including, for example, the type of security, whether the security is new and not yet established in the marketplace, the liquidity of markets, and other characteristics particular to the security. To the extent that valuation is based on models or inputs that are less observable or unobservable in the market, the determination of fair value requires more judgment. Accordingly, the degree of judgment exercised in determining fair value is greatest for instruments categorized in Level 3.
The inputs used to measure fair value may fall into different levels of the fair value hierarchy. In such cases, for disclosure purposes, the level in the fair value hierarchy within which the fair value measurement falls in its entirety, is determined based on the lowest level input that is significant to the fair value measurement in its entirety.
The Internet Portfolio
The following is a summary of the inputs used to value The Internet Portfolio’s net assets as of June 30, 2015:
| | | | | | | | | | | | | | |
| Assets^ | | | Level 1 | | | Level 2 | | | Level 3 | | | Total | |
| Common Stocks | | $ | 142,773,372 | | $ | 5,050 | (1) | $ | — | | $ | 142,778,422 | |
| Escrow Notes | | | — | | | — | | | — | * | | — | * |
| Rights | | | 115,200 | | | — | | | — | | | 115,200 | |
| Investments Purchased with the Cash Proceeds from Securities Lending | | | 5,262,475 | | | — | | | — | | | 5,262,475 | |
| Total Investments in Securities | | $ | 148,151,047 | | $ | 5,050 | | | — | * | $ | 148,156,097 | |
| | | |
| (1) | The Common Stocks Level 2 balance consists of the market value of the associated Level 2 investments in the following industries: |
| Administrative and Support Services | | $ | 2,070 | |
| Telecommunications | | | 2,980 | |
| | | $ | 5,050 | |
| | | | | |
| Transfers out of Level 1 into Level 2 | | $ | 5,050 | |
| Transfers out of Level 2 into Level 1 | | $ | 23,562 | |
Transfers were made out of Level 1 into Level 2 due to a decrease in market activity.
Transfers were made out of Level 2 into Level 1 due to an increase in market activity.
Transfers between levels are recognized at the end of the reporting period.
| KINETICS PORTFOLIOS TRUST — MASTER INVESTMENT PORTFOLIOS |
Notes to Financial Statements — (Continued) |
| June 30, 2015 (Unaudited) |
Following is a reconciliation of Level 3 assets for which significant unobservable inputs were used to determine fair value:
| Description | Investments in Securities | |
| Balance as of December 31, 2014 | | $ | — | * |
| Accrued discounts/premiums | | | — | |
| Realized gain (loss) | | | — | |
| Change in unrealized appreciation (depreciation) | | | — | |
| Net purchases | | | — | |
| Net sales | | | — | * |
| Transfer in and/or out of Level 3 | | | — | |
| Balance as of June 30, 2015 | | $ | — | * |
| | | | | | | | | |
| | | Fair Value at | | Valuation | | Unobservable | | |
| Description | | 6/30/2015 | | Techniques | | Input | | Range |
| Escrow Notes | | —* | | Conservative Value | | No active | | $0.00-$0.00 |
| | | | | Assigned Pending | | market | | |
| | | | | Bankruptcy Litigation | | | | |
| | | | | Proceedings/Market | | | | |
| | | | | Comparables | | | | |
There is no active market for the Level 3 securities, so a conservative value is being assigned until such time as a market exists.
| | | |
| ^ | See Portfolio of Investments for breakout of investments by industry classification. |
| * | Amount is less than $0.50. |
The Global Portfolio
The following is a summary of the inputs used to value The Global Portfolio’s net assets as of June 30, 2015:
| Assets^ | | | Level 1 | | | Level 2 | | | Level 3 | | | Total | |
| Common Stocks | | $ | 7,932,244 | | $ | 479,325(1 | ) | $ | — | | $ | 8,411,569 | |
| Corporate Bonds | | | — | | | 35,155 | | | — | | | 35,155 | |
| Mutual Funds | | | 60,300 | | | — | �� | | — | | | 60,300 | |
| Warrants | | | 20,864 | | | — | | | — | | | 20,864 | |
| Short-Term Investments | | | 635 | | | 205,000† | | | — | | | 205,635 | |
| Investments Purchased with the Cash Proceeds from Securities Lending | | | 463,370 | | | — | | | — | | | 463,370 | |
| Total Investments in Securities | | $ | 8,477,413 | | $ | 719,480 | | $ | — | | $ | 9,196,893 | |
| KINETICS PORTFOLIOS TRUST — MASTER INVESTMENT PORTFOLIOS |
Notes to Financial Statements — (Continued) |
| June 30, 2015 (Unaudited) |
| | | |
| (1) | The Common Stocks Level 2 balance consists of the market value of the associated Level 2 investments in the following industries: |
| Asset Management | | $ | 35,068 | |
| Oil and Gas Extraction | | | 442,200 | |
| Publishing Industries (except Internet) | | | 2,057 | |
| | | $ | 479,325 | |
| | | | | |
| Transfers out of Level 1 into Level 2 | | $ | 444,257 | |
| Transfers out of Level 2 into Level 1 | | $ | 512,853 | |
Transfers were made out of Level 1 into Level 2 due to a decrease in market activity.
Transfers were made out of Level 2 into Level 1 due to an increase in market activity.
Transfers between levels are recognized at the end of the reporting period.
| | | |
| ^ | See Portfolio of Investments for breakout of investments by industry classification. |
| † | Priced at amortized cost. |
The Paradigm Portfolio
The following is a summary of the inputs used to value The Paradigm Portfolio’s net assets as of June 30, 2015:
| Assets^ | | | Level 1 | | | Level 2 | | | Level 3 | | | Total | |
| Common Stocks | | $ | 1,040,200,756 | | $ | 2,013,279 | (1) | $ | — | | $ | 1,042,214,035 | |
| Escrow Notes | | | — | | | — | | | — | * | | — | * |
| Warrants | | | 1,420,411 | | | — | | | — | | | 1,420,411 | |
| Short-Term Investments | | | 370 | | | 40,549,000 | † | | — | | | 40,549,370 | |
| Investments Purchased with the Cash Proceeds from Securities Lending | | | 80,187,483 | | | — | | | — | | | 80,187,483 | |
| Total Investments in Securities | | $ | 1,121,809,020 | | $ | 42,562,279 | | $ | — | * | $ | 1,164,371,299 | |
| | | |
| (1) | The Common Stocks Level 2 balance consists of the market value of the associated Level 2 investments in the following industries: |
| Asset Management | | $ | 23,379 | |
| Oil and Gas Extraction | | | 1,989,900 | |
| | | $ | 2,013,279 | |
| | | | | |
| Transfers out of Level 1 into Level 2 | | $ | 1,989,900 | |
| Transfers out of Level 2 into Level 1 | | $ | 13,955,499 | |
Transfers were made out of Level 1 into Level 2 due to a decrease in market activity.
Transfers were made out of Level 2 into Level 1 due to an increase in market activity.
Transfers between levels are recognized at the end of the reporting period.
| KINETICS PORTFOLIOS TRUST — MASTER INVESTMENT PORTFOLIOS |
Notes to Financial Statements — (Continued) |
| June 30, 2015 (Unaudited) |
Following is a reconciliation of Level 3 assets for which significant unobservable inputs were used to determine fair value:
| Description | Investments in Securities | |
| Balance as of December 31, 2014 | | $ | — | * |
| Accrued discounts/premiums | | | — | |
| Realized gain (loss) | | | — | |
| Change in unrealized appreciation (depreciation) | | | — | |
| Net purchases | | | — | |
| Net sales and/or write-offs | | | — | * |
| Transfer in and/or out of Level 3 | | | — | |
| Balance as of June 30, 2015 | | $ | — | * |
| | | Fair Value | | Valuation | | Unobservable | |
| Description | | at 6/30/15 | | Techniques | | Input | Range |
| Escrow Notes | | —* | | Conservative Value | | No active | $0.00-$0.00 |
| | | | | Assigned Pending | | market | |
| | | | | Bankruptcy Litigation | | | |
| | | | | Proceedings/Market | | | |
| | | | | Comparables | | | |
| There is no active market for the Level 3 securities, so a conservative value is being assigned until such time as a market exists. |
| | | |
| ^ | See Portfolio of Investments for breakout of investments by industry classification. |
| * | Amount is less than $0.50. |
| † | Priced at amortized cost. |
The Medical Portfolio
The following is a summary of the inputs used to value The Medical Portfolio’s net assets as of June 30, 2015:
| Assets^ | | | Level 1 | | | Level 2 | | | Level 3 | | | Total | |
| Common Stocks | | $ | 29,818,921 | | $ | — | | $ | — | | $ | 29,818,921 | |
| Rights | | | 12,681 | | | 8,228 | | | — | | | 20,909 | |
| Short-Term Investments | | | 610 | | | 49,000† | | | — | | | 49,610 | |
| Investments Purchased with the Cash Proceeds from Securities Lending | | | 3,148,825 | | | — | | | — | | | 3,148,825 | |
| Total Investments in Securities | | $ | 32,981,037 | | $ | 57,228 | | $ | — | | $ | 33,038,265 | |
| | | | | | | | | | | | | | |
| Transfers out of Level 1 into Level 2 | | | | | | | | | | | $ | 8,228 | |
| | | |
Transfers were made out of Level 1 into level 2 due to a decrease in market activity. Transfers between levels are recognized at the end of the reporting period. |
| | | |
| ^ | See Portfolio of Investments for breakout of investments by industry classification. |
| † | Priced at amortized cost. |
| KINETICS PORTFOLIOS TRUST — MASTER INVESTMENT PORTFOLIOS |
Notes to Financial Statements — (Continued) |
| June 30, 2015 (Unaudited) |
| The Small Cap Opportunities Portfolio |
| The following is a summary of the inputs used to value The Small Cap |
| Opportunities Portfolio’s net assets as of June 30, 2015: |
| Assets^ | | | Level 1 | | | Level 2 | | | Level 3 | | | Total | |
| Common Stocks | | $ | 307,713,093 | | $ | 16,392,893 | (1) | $ | — | | $ | 324,105,986 | |
| Rights | | | 360,628 | | | — | | | — | | | 360,628 | |
| Warrants | | | 143,961 | | | — | | | — | | | 143,961 | |
| Short-Term Investments | | | 696 | | | 130,000 | † | | — | | | 130,696 | |
| Investments Purchased with the Cash Proceeds from Securities Lending | | | 44,329,175 | | | — | | | — | | | 44,329,175 | |
| Total Investments in Securities | | $ | 352,547,553 | | $ | 16,522,893 | | $ | — | | $ | 369,070,446 | |
| | | |
| (1) | The Common Stocks Level 2 balance consists of the market value of the associated Level 2 investments in the following industries: |
| Asset Management | | $ | 15,834,734 | |
| Publishing Industries (except Internet) | | | 553,999 | |
| Telecommunications | | | 4,160 | |
| | | $ | 16,392,893 | |
| | | | | |
| Transfers out of Level 1 into Level 2 | | $ | 558,159 | |
| Transfers out of Level 2 into Level 1 | | $ | 17,363,910 | |
Transfers were made out of Level 1 into Level 2 due to a decrease in market activity.
Transfers were made out of Level 2 into Level 1 due to an increase in market activity.
Transfers between levels are recognized at the end of the reporting period.
| | | |
| ^ | See Portfolio of Investments for breakout of investments by industry classification. |
| † | Priced at amortized cost. |
| KINETICS PORTFOLIOS TRUST — MASTER INVESTMENT PORTFOLIOS |
Notes to Financial Statements — (Continued) |
| June 30, 2015 (Unaudited) |
| The Market Opportunities Portfolio |
| The following is a summary of the inputs used to value The Market |
| Opportunities Portfolio’s net assets as of June 30, 2015: |
| Assets^ | | Level 1 | | | Level 2 | | | Level 3 | | | Total | |
| Common Stocks | | $ | 42,612,469 | | | $ | 1,262,918 | (1) | | $ | — | | | $ | 43,875,387 | |
| Corporate Bonds | | | — | | | | 4,895 | | | | — | | | | 4,895 | |
| Mutual Funds | | | 2,010 | | | | — | | | | — | | | | 2,010 | |
| Rights | | | — | | | | — | | | | — | * | | | — | * |
| Warrants | | | 2,897 | | | | — | | | | — | | | | 2,897 | |
| Short-Term Investments | | | 2,426,000 | | | | 2,430,000 | † | | | — | | | | 4,856,000 | |
Investments Purchased with the Cash Proceeds from Securities Lending | | | 2,451,116 | | | | — | | | | — | | | | 2,451,116 | |
| Total Investments in Securities | | $ | 47,494,492 | | | $ | 3,697,813 | | | $ | — | * | | $ | 51,192,305 | |
| | | |
| (1) | The Common Stocks Level 2 balance consists of the market value of the associated Level 2 investments in the following industry: |
| | | | | |
| Asset Management | | $ | 1,262,918 | |
| | | | | |
| Transfers out of Level 2 into Level 1 | | $ | 2,094,716 | |
Transfers were made out of Level 2 into Level 1 due to an increase in market activity. Transfers between levels are recognized at the end of the reporting period. |
| |
| Following is a reconciliation of Level 3 assets for which significant unobservable inputs were used to determine fair value: |
| Description | Investments in Securities | |
| | | | |
| Balance as of December 31, 2014 | | $ | — | * |
| Accrued discounts/premiums | | | — | |
| Realized gain (loss) | | | — | |
| Change in unrealized appreciation (depreciation) | | | — | |
| Net purchases | | | — | |
| Net sales | | | — | |
| Transfer in and/or out of Level 3. | | | — | |
| Balance as of June 30, 2015. | | $ | — | * |
| | | | | | | | | |
| | | Fair Value | | Valuation | | Unobservable | | |
| Description | | at 6/30/15 | | Techniques | | Input | | Range |
| Rights | | $— | | Market | | No active | | $0.00-$0.00 |
| | | | | Comparables | | market | | |
There is no active market for the Level 3 securities, so a conservative value is being assigned until such time as a market exists.
| | | |
| ^ | See Portfolio of Investments for breakout of investments by industry classification. |
| * | Amount is less than $0.50. |
| † | Priced at amortized cost. |
| KINETICS PORTFOLIOS TRUST — MASTER INVESTMENT PORTFOLIOS |
Notes to Financial Statements — (Continued) |
| June 30, 2015 (Unaudited) |
| The Alternative Income Portfolio |
| The following is a summary of the inputs used to value The Alternative Income Portfolio’s net assets as of June 30, 2015: |
| Assets^ | | Level 1 | | | Level 2 | | | Level 3 | | | Total | |
| Corporate Bonds | | $ | — | | | $ | 21,778,093 | | | $ | — | | | $ | 21,778,093 | |
| U.S. Government Agency Issues | | | — | | | | 1,229,130 | | | | — | | | | 1,229,130 | |
| U.S. Treasury Obligations | | | — | | | | 2,604,607 | | | | — | | | | 2,604,607 | |
| Exchange Traded Funds | | | 7,276,496 | | | | — | | | | — | | | | 7,276,496 | |
| Purchased Put Options | | | — | | | | 83,422 | | | | — | | | | 83,422 | |
| Short-Term Investments | | | 1,019,387 | | | | 1,382,000 | † | | | — | | | | 2,401,387 | |
| Total Investments in Securities | | $ | 8,295,883 | | | $ | 27,077,252 | | | $ | — | | | $ | 35,373,135 | |
| | | | | | | | | | | | | | | | | |
| Liabilities | | | | | | | | | | | | | | | | |
| Written Options | | $ | — | | | $ | 798,045 | | | $ | — | | | $ | 798,045 | |
For the period ended June 30, 2015, there were no transfers into or out of Level 1 or Level 2, or investments in Level 3 securities.
| | | |
| ^ | See Portfolio of Investments for breakout of investments by industry classification. |
| † | Priced at amortized cost. |
The Multi-Disciplinary Income Portfolio
The following is a summary of the inputs used to value The Multi-Disciplinary Income Portfolio’s net assets as of June 30, 2015:
| Assets^ | | Level 1 | | | Level 2 | | | Level 3 | | | Total | |
| Convertible Bonds | | $ | — | | | $ | 15,280,219 | | | $ | — | | | $ | 15,280,219 | |
| Corporate Bonds | | | — | | | | 97,500,062 | | | | — | | | | 97,500,062 | |
| Municipal Bonds | | | — | | | | 332,500 | | | | — | | | | 332,500 | |
| Escrow Notes | | | — | | | | 57,500 | | | | — | | | | 57,500 | |
| Exchange Traded Notes | | | 4,647 | | | | — | | | | — | | | | 4,647 | |
| Mutual Funds | | | 9,988,928 | | | | — | | | | — | | | | 9,988,928 | |
| Purchased Put Options | | | — | | | | 2,168,304 | | | | — | | | | 2,168,304 | |
| Short-Term Investments | | | 6,162,000 | | | | 6,193,000 | † | | | — | | | | 12,355,000 | |
Investments Purchased with the Cash Proceeds from Securities Lending | | | 4,404,520 | | | | — | | | | — | | | | 4,404,520 | |
| Total Investments in Securities | | $ | 20,560,095 | | | $ | 121,531,585 | | | $ | — | | | $ | 142,091,680 | |
| | | | | | | | | | | | | | | | | |
| Liabilities | | | | | | | | | | | | | | | | |
| Written Options | | $ | — | | | $ | 1,605,450 | | | $ | — | | | $ | 1,605,450 | |
For the period ended June 30, 2015, there were no transfers into or out of Level 1 or Level 2, or investments in Level 3 securities.
| | | |
| ^ | See Portfolio of Investments for breakout of investments by industry classification. |
| † | Priced at amortized cost. |
| KINETICS PORTFOLIOS TRUST — MASTER INVESTMENT PORTFOLIOS |
Notes to Financial Statements — (Continued) |
| June 30, 2015 (Unaudited) |
9. Disclosures about Derivative Instruments and Hedging Activities
The Master Portfolios have adopted enhanced disclosure regarding derivatives and hedging activity intended to improve financial reporting of derivative instruments by enabling investors to understand how and why a Master Portfolio uses derivatives, how derivatives are accounted for by the Master Portfolios, and how derivative instruments affect a Master Portfolio’s results of operations and financial position. The Master Portfolios utilized options to implement or to gain further exposure to their respective investment strategies.
The Alternative Income Portfolio
Statement of Assets and Liabilities
Fair Values of derivative instruments as of June 30, 2015:
| | Assets | | Liabilities | |
| Equity Contracts | Description | | Fair Value | | Description | | Fair Value | |
| | Investments, at | | | | | | | |
| Purchased Put Options | value | | $ | 83,422 | | | | $ | — | |
| Total | | | $ | 83,422 | | | | | | |
| | | | | | | Written put option | | | | |
| Written Put Options | | | $ | — | | contracts, at value | | $ | 798,045 | |
| Total | | | $ | — | | | | $ | 798,045 | |
Statement of Operations
The effect of derivative instruments on the Statement of Operations for the period ended June 30, 2015:
Amount of Realized Gain (Loss) on Equity Contracts
| | | | | |
| Equity Contracts | | | | |
| Purchased Put Options | | $ | (5,197 | ) |
| Written Put Options | | | 925,395 | |
| Total | | $ | 920,198 | |
| | | | | |
| Change in Unrealized Appreciation (Depreciation) on Equity Contracts | | | | |
| | | | | |
| Equity Contracts | | | | |
| Purchased Put Options | | $ | 31,425 | |
| Written Options | | | (62,190 | ) |
| Total | | $ | (30,765 | ) |
| KINETICS PORTFOLIOS TRUST — MASTER INVESTMENT PORTFOLIOS |
Notes to Financial Statements — (Continued) |
| June 30, 2015 (Unaudited) |
The Alternative Income Portfolio has adopted authoritative standards regarding disclosure about derivatives and hedging activities and how they affect the Portfolio’s Statement of Assets and Liabilities and Statement of Operations. For the six months ended June 30, 2015: 463 written option contracts were opened and $583,006 premiums were received during the period. There were no purchased option contracts opened during the period.
Average quarterly market value of:
| | | | | |
| Options Written | | $ | 945,183 | |
| Purchased Options | | $ | 70,408 | |
The Multi-Disciplinary Income Portfolio
Statement of Assets and Liabilities
Fair Values of derivative instruments as of June 30, 2015:
| | Assets | | Liabilities | |
| Equity Contracts | Description | | Fair Value | | Description | | Fair Value | |
| | Investments | | | | | | | |
| Purchased Options | | | $ | 2,168,304 | | | | $ | — | |
| Total | | | $ | 2,168,304 | | | | | — | |
| | | | | | | Written put option | | | | |
| Written Put Options | | | $ | — | | contracts, at value | | $ | 1,605,450 | |
| Total | | | $ | — | | | | $ | 1,605,450 | |
Statement of Operations
The effect of derivative instruments on the Statement of Operations for the period ended June 30, 2015:
| Amount of Realized Gain (Loss) on Equity Contracts |
| Equity Contracts | | | | |
| Purchased Options | | $ | 10,754 | |
| Written Options | | | 492,125 | |
| Total | | $ | 502,879 | |
| | | | | |
| Change in Unrealized Appreciation (Depreciation) on Equity Contracts |
| | | | | |
| Equity Contracts | | | | |
| Purchased Options | | $ | 509,472 | |
| Written Options | | | (129,051 | ) |
| Total | | $ | 380,421 | |
| KINETICS PORTFOLIOS TRUST — MASTER INVESTMENT PORTFOLIOS |
Notes to Financial Statements — (Continued) |
| June 30, 2015 (Unaudited) |
The Multi-Disciplinary Income Portfolio has adopted authoritative standards regarding disclosure about derivatives and hedging activities and how they affect the Portfolio’s Statement of Assets and Liabilities and Statement of Operations. For the six months ended June 30, 2015: 288 written option contracts were opened and $39,015 premiums were received during the period, 802 purchased option contracts were opened and $173,177 premiums were paid during the period.
Average quarterly market value of:
| Options Written | | $ | 1,699,178 | |
| Purchased Options | | $ | 1,854,453 | |
10. Offsetting Assets and Liabilities
The Master Portfolios are subject to various Master Netting Arrangements, which govern the terms of certain transactions with select counterparties. The Master Netting Arrangements allow a Portfolio to close out and net its total exposure to a counterparty in the event of a default with respect to all the transactions governed under a single agreement with a counterparty. The Master Netting Arrangements also specify collateral posting arrangements at pre-arranged exposure levels. Under the Master Netting Arrangements, collateral is routinely transferred if the total net exposure to certain transactions (net of existing collateral already in place) governed under the relevant Master Netting Arrangement with a counterparty in a given account exceeds a specific threshold depending on the counterparty and the type of Master Netting Arrangement.
The Internet Portfolio
The following is a summary of the Assets and Liabilities subject to offsetting in the Internet Portfolio as of June 30, 2015:
| | | Gross Amounts of Recognized Liabilities | | Gross Amounts Offset in the Statement of Financial Position | | Net Amounts Presented in the Statement of Financial Position | | Gross Amounts not offset in the statement of financial position | | | |
| Liabilities: | | | | | Financial Instruments | | Collateral Pledged (Received) | | Net Amount | |
| Description | | | | | | | | | | | | | | | | | | | |
| Securities | | | | | | | | | | | | | | | | | | | |
| Lending | | $ | 5,262,475 | | $ | — | | $ | 5,262,475 | | $ | 5,262,475 | | $ | — | | $ | — | |
| | | $ | 5,262,475 | | $ | — | | $ | 5,262,475 | | $ | 5,262,475 | | $ | — | | $ | — | |
| KINETICS PORTFOLIOS TRUST — MASTER INVESTMENT PORTFOLIOS |
Notes to Financial Statements — (Continued) |
| June 30, 2015 (Unaudited) |
The Global Portfolio
The following is a summary of the Assets and Liabilities subject to offsetting in the Global Portfolio as of June 30, 2015:
| | | Gross Amounts of Recognized Liabilities | | Gross Amounts Offset in the Statement of Financial Position | | Net Amounts Presented in the Statement of Financial Position | | Gross Amounts not offset in the statement of financial position | | | |
| Liabilities: | | | | | Financial Instruments | | Collateral Pledged (Received) | | Net Amount | |
| Description | | | | | | | | | | | | | | | | | | | |
| Securities | | | | | | | | | | | | | | | | | | | |
| Lending | | $ | 463,370 | | $ | — | | $ | 463,370 | | $ | 463,370 | | $ | — | | $ | — | |
| | | $ | 463,370 | | $ | — | | $ | 463,370 | | $ | 463,370 | | $ | — | | $ | — | |
The Paradigm Portfolio
The following is a summary of the Assets and Liabilities subject to offsetting in the Paradigm Portfolio as of June 30, 2015:
| | | Gross Amounts of Recognized Liabilities | | Gross Amounts Offset in the Statement of Financial Position | | Net Amounts Presented in the Statement of Financial Position | | Gross Amounts not offset in the statement of financial position | | | |
| Liabilities: | | | | | Financial Instruments | | Collateral Pledged (Received) | | Net Amount | |
| Description | | | | | | | | | | | | | | | | | | | |
| Securities | | | | | | | | | | | | | | | | | | | |
| Lending | | $ | 80,187,483 | | $ | — | | $ | 80,187,483 | | $ | 80,187,483 | | $ | — | | $ | — | |
| | | $ | 80,187,483 | | $ | — | | $ | 80,187,483 | | $ | 80,187,483 | | $ | — | | $ | — | |
| KINETICS PORTFOLIOS TRUST — MASTER INVESTMENT PORTFOLIOS |
Notes to Financial Statements — (Continued) |
| June 30, 2015 (Unaudited) |
The Medical Portfolio
The following is a summary of the Assets and Liabilities subject to offsetting in the Medical Portfolio as of June 30, 2015:
| | | Gross Amounts of Recognized Liabilities | | Gross Amounts Offset in the Statement of Financial Position | | Net Amounts Presented in the Statement of Financial Position | | Gross Amounts not offset in the statement of financial position | | | |
| Liabilities: | | | | | Financial Instruments | | Collateral Pledged (Received) | | Net Amount | |
| Description | | | | | | | | | | | | | | | | | | | |
| Securities | | | | | | | | | | | | | | | | | | | |
| Lending | | $ | 3,148,825 | | $ | — | | $ | 3,148,825 | | $ | 3,148,825 | | $ | — | | $ | — | |
| | | $ | 3,148,825 | | $ | — | | $ | 3,148,825 | | $ | 3,148,825 | | $ | — | | $ | — | |
The Small Cap Opportunities Portfolio
The following is a summary of the Assets and Liabilities subject to offsetting in the Small Cap Opportunities Portfolio as of June 30, 2015:
| | | Gross Amounts of Recognized Liabilities | | Gross Amounts Offset in the Statement of Financial Position | | Net Amounts Presented in the Statement of Financial Position | | Gross Amounts not offset in the statement of financial position | | | |
| Liabilities: | | | | | Financial Instruments | | Collateral Pledged (Received) | | Net Amount | |
| Description | | | | | | | | | | | | | | | | | | | |
| Securities | | | | | | | | | | | | | | | | | | | |
| Lending | | $ | 44,329,175 | | $ | — | | $ | 44,329,175 | | $ | 44,329,175 | | $ | — | | $ | — | |
| | | $ | 44,329,175 | | $ | — | | $ | 44,329,175 | | $ | 44,329,175 | | $ | — | | $ | — | |
| KINETICS PORTFOLIOS TRUST — MASTER INVESTMENT PORTFOLIOS |
Notes to Financial Statements — (Continued) |
| June 30, 2015 (Unaudited) |
The Market Opportunities Portfolio
The following is a summary of the Assets and Liabilities subject to offsetting in the Market Opportunities Portfolio as of June 30, 2015:
| | | Gross Amounts of Recognized Liabilities | | Gross Amounts Offset in the Statement of Financial Position | | Net Amounts Presented in the Statement of Financial Position | | Gross Amounts not offset in the statement of financial position | | | |
| Liabilities: | | | | | Financial Instruments | | Collateral Pledged (Received) | | Net Amount | |
| Description | | | | | | | | | | | | | | | | | | | |
| Securities | | | | | | | | | | | | | | | | | | | |
| Lending | | $ | 2,451,116 | | $ | — | | $ | 2,451,116 | | $ | 2,451,116 | | $ | — | | $ | — | |
| | | $ | 2,451,116 | | $ | — | | $ | 2,451,116 | | $ | 2,451,116 | | $ | — | | $ | — | |
The Alternative Income Portfolio
The following is a summary of the Assets and Liabilities subject to offsetting in the Alternative Income Portfolio as of June 30, 2015:
| | | Gross Amounts of Recognized Liabilities | | Gross Amounts Offset in the Statement of Financial Position | | Net Amounts Presented in the Statement of Financial Position | | Gross Amounts not offset in the statement of financial position | | | |
| Liabilities: | | | | | Financial Instruments | | Collateral Pledged (Received) | | Net Amount | |
| Description | | | | | | | | | | | | | | | | | | | |
| Written | | | | | | | | | | | | | | | | | | | |
| Options | | $ | 798,045 | | $ | — | | $ | 798,045 | | $ | — | | $ | 798,045 | | $ | — | |
| | | $ | 798,045 | | $ | — | | $ | 798,045 | | $ | — | | $ | 798,045 | | $ | — | |
| KINETICS PORTFOLIOS TRUST — MASTER INVESTMENT PORTFOLIOS |
Notes to Financial Statements — (Continued) |
| June 30, 2015 (Unaudited) |
The Multi-Disciplinary Income Portfolio
The following is a summary of the Assets and Liabilities subject to offsetting in the Multi-Disciplinary Income Portfolio as of June 30, 2015:
| | | Gross Amounts
of Recognized
Liabilities | | | Gross
Amounts
Offset
in the
Statement of
Financial
Position | | | Net
Amounts
Presented
in the
Statement of
FinancialPosition | | | Gross Amounts not
offset in the statement
of financial position | | | Net Amount | |
| Liabilities: | |
| |
| |
| |
| Financial Instruments | | | Collateral
Pledged(Received) | | | |
| |
| |
| Description | | | | | | | | | | | | | | | | | | |
| Written | | | | | | | | | | | | | | | | | | |
| Options | | $ | 1,605,450 | | | $ | — | | | $ | 1,605,450 | | | $ | — | | | $ | 1,605,450 | | | $ | — | |
| Securities | | | | | | | | | | | | | | | | | | | | | | | | |
| Lending | | | 4,404,520 | | | | — | | | | 4,404,520 | | | | 4,404,520 | | | | — | | | | — | |
| | | $ | 6,009,970 | | | $ | — | | | $ | 6,009,970 | | | $ | 4,404,520 | | | $ | 1,605,450 | | | $ | — | |
11. Affiliated Issuers
Under section 2(a)(3) of the 1940 Act, an investment company is defined as being an affiliated person of a company if it owns five percent or more of a company’s outstanding voting stock.
Investments in affiliated companies for the Paradigm Portfolio as of June 30, 2015, are shown below:
| | | Number of | | | | | | | | | Number of | |
| | | shares held at | | | | | | | | | shares held at | |
| | | December 31, | | | Gross | | | Gross | | | June 30, | |
| Name of issuer | | 2014 | | | additions | | | reductions | | | 2015 | |
| Texas Pacific Land Trust | | | 490,480 | | | | 103,550 | | | | (202 | ) | | | 593,828 | |
| | | | | | | | | | | | | | | | | |
| | | Fair value at | | | | | | Realized | |
| | | June 30, | | | Dividend | | | capital | |
| Name of issuer (continued) | | 2015 | | | income | | | gain/loss | |
| Texas Pacific Land Trust | | $ | 89,365,176 | | | $ | 168,896 | | | $ | 26,857 | |
12. Information about Proxy Voting
Information regarding how the Master Portfolios votes proxies relating to portfolio securities is available without charge upon request by calling toll-free at 1-800-930-3828 or by accessing the Funds’ website at www.kineticsfunds.com and by accessing the SEC’s website at www.sec.gov.
| KINETICS PORTFOLIOS TRUST — MASTER INVESTMENT PORTFOLIOS |
Notes to Financial Statements — (Continued) |
| June 30, 2015 (Unaudited) |
Information regarding how the Master Portfolios voted proxies relating to portfolio securities during the most recent twelve month period ended June 30, is available without charge, upon request, by calling toll-free at 1-800-930-3828 or by accessing the SEC’s website at www.sec.gov.
13. Information about the Portfolio Holdings
The Kinetics Portfolios Trust files its complete schedules of portfolio holdings for its first and third fiscal quarters with the SEC on Form N-Q. The Master Portfolios’ Form N-Q is available without charge, upon request, by calling toll-free at 1-800-930-3828. Furthermore, you can obtain the Form N-Q on the SEC’s website at www.sec.gov. Finally, the Form N-Q may be reviewed and copied at the SEC’s Public Reference Room in Washington, D.C. Information on the operation of the Public Reference Room may be obtained by calling 1-800-SEC-0330.
14. Subsequent Events
In preparing these financial statements, management has evaluated Portfolio related events and transactions for potential recognition or disclosure through the date the financial statements were issued. There were no events or translations that occurred during the period that materially impacted the amounts or disclosures in the Master Portfolios’ financial statements.
15. Recent Accounting Pronouncements
In June 2014, the Financial Accounting Standard Board issued ASU No. 2014-11 “Repurchase-to-Maturity Transactions, Repurchase Financings, and Disclosures.” ASU No. 2014-11 makes limited changes to the accounting for repurchase agreements, clarifies when repurchase agreements and securities lending transactions should be accounted for as secured borrowings, and requires additional disclosures regarding these types of transactions. The guidance is effective for fiscal years beginning after December 15, 2014, and for interim periods within those fiscal years. Management is currently evaluating the impact these disclosures will have on the Master Portfolios’ financial statement disclosures.
[THIS PAGE INTENTIONALLY LEFT BLANK]
[THIS PAGE INTENTIONALLY LEFT BLANK]
[THIS PAGE INTENTIONALLY LEFT BLANK]
[THIS PAGE INTENTIONALLY LEFT BLANK]
[THIS PAGE INTENTIONALLY LEFT BLANK]
Kinetics Mutual
Funds, Inc.
615 East Michigan Street
Milwaukee, WI 53202
INVESTMENT ADVISER AND
SHAREHOLDER SERVICING AGENT
Kinetics Asset Management LLC
470 Park Avenue South
New York, NY 10016
INDEPENDENT REGISTERED
PUBLIC ACCOUNTING FIRM
Tait, Weller & Baker LLP
1818 Market Street
Suite 2400
Philadelphia, PA 19103
DISTRIBUTOR
Kinetics Funds Distributor LLC
470 Park Avenue South
New York, NY 10016
ADMINISTRATOR
FUND ACCOUNTANT AND
TRANSFER AGENT
U.S. Bancorp Fund Services, LLC
615 East Michigan Street
Milwaukee, WI 53202
CUSTODIAN
U.S. Bank, N.A.
Custody Operations
1555 River Center Drive, Suite 302
Milwaukee, WI 53212
THIS MATERIAL MUST BE PRECEDED OR
ACCOMPANIED BY A PROSPECTUS
Item 2. Code of Ethics.
Not applicable for semi-annual reports.
Item 3. Audit Committee Financial Expert.
Not applicable for semi-annual reports.
Item 4. Principal Accountant Fees and Services.
Not applicable for semi-annual reports.
Item 5. Audit Committee of Listed Registrants.
Not applicable to registrants who are not listed issuers (as defined in Rule 10A-3 under the Securities Exchange Act of 1934).
Item 6. Schedule of Investments.
The Schedule of Investments is included as part of the report to shareholders filed under Item 1 of this Form.
Item 7. Disclosure of Proxy Voting Policies and Procedures for Closed-End Management Investment Companies.
Not applicable to open-end investment companies.
Item 8. Portfolio Managers of Closed-End Management Investment Companies.
Not applicable to open-end investment companies.
Item 9. Purchases of Equity Securities by Closed-End Management Investment Company and Affiliated Purchasers.
Not applicable to open-end investment companies.
Item 10. Submission of Matters to a Vote of Security Holders.
There have been no material changes to the procedures by which shareholders may recommend nominees to the registrant’s board of trustees.
Item 11. Controls and Procedures.
| (a) | The Registrant’s President/Chief Executive Officer and Treasurer/Chief Financial Officer have concluded that the Registrant's disclosure controls and procedures (as defined in |
| | Rule 30a-3(c) under the Investment Company Act of 1940, as amended (the “1940 Act”)) are effective as of a date within 90 days of the filing date of this report, that includes the disclosure required by this paragraph, based on the evaluation of these controls and procedures required by Rule 30a-3(b) under the 1940 Act and Rule 15d-15(b) under the Securities Exchange Act of 1934, as amended. |
| (b) | There were no changes in the Registrant's internal control over financial reporting (as defined in Rule 30a-3(d) under the Act) that occurred during the second fiscal quarter of the period covered by this report that has materially affected, or is reasonably likely to materially affect, the Registrant's internal control over financial reporting. |
Item 12. Exhibits.
(2) Certifications pursuant to Section 302 of the Sarbanes-Oxley Act of 2002. Filed herewith.
(3) Not applicable to open-end investment companies.
| (b) | Certification pursuant to Section 906 of the Sarbanes-Oxley Act of 2002. Furnished herewith. |
SIGNATURES
Pursuant to the requirements of the Securities Exchange Act of 1934 and the Investment Company Act of 1940, the registrant has duly caused this report to be signed on its behalf by the undersigned, thereunto duly authorized.
(Registrant) Kinetics Mutual Funds, Inc. & Kinetics Portfolios Trust
| | By (Signature and Title)* | /s/ Peter B. Doyle Peter B. Doyle, President |
| | Date 8/25/2015 | |
Pursuant to the requirements of the Securities Exchange Act of 1934 and the Investment Company Act of 1940, this report has been signed below by the following persons on behalf of the registrant and in the capacities and on the dates indicated.
| | By (Signature and Title)* | /s/ Peter B. Doyle Peter B. Doyle, President |
| | Date 8/25/2015 | |
| | By (Signature and Title)* | /s/ Leonid Polyakov Leonid Polyakov, Treasurer |
| | Date 8/25/2015 | |
* Print the name and title of each signing officer under his or her signature.